UNITED STATES
SECURITIES AND EXCHANGE COMMISSION
Washington, D.C. 20549
FORM N-CSR
CERTIFIED SHAREHOLDER REPORT OF REGISTERED MANAGEMENT
INVESTMENT COMPANIES
Investment Company Act file number 811-21910
Claymore Exchange-Traded Fund Trust 2
(Exact name of registrant as specified in charter)
227 West Monroe Street, Chicago, 60606
(Address of principal executive offices) (Zip code)
Amy J. Lee
227 West Monroe Street, Chicago, 60606
(Name and address of agent for service)
Registrant's telephone number, including area code: (312) 827-0100
Date of fiscal year end: May 31
Date of reporting period: June 1, 2013 - May 31, 2014
Item 1. Reports to Stockholders.
The registrant's annual report transmitted to shareholders pursuant to Rule 30e-1 under the Investment Company Act of 1940, as amended (the “Investment Company Act”), is as follows:
GUGGENHEIMINVESTMENTS.COM
... YOUR ROAD TO THE LATEST, MOST UP - TO - DATE INFORMATION
The shareholder report you are reading right now is just the beginning of the story. Online at guggenheiminvestments.com, you will find:
| • | Daily and historical fund pricing, fund returns, portfolio holdings and characteristics, and distribution history. |
| | |
| • | Investor guides and fund fact sheets. |
| | |
| • | Regulatory documents including a prospectus and copies of shareholder reports. |
Guggenheim Funds Distributors, LLC is constantly updating and expanding shareholder information services on each Fund’s website, in an ongoing effort to provide you with the most current information about how your Fund’s assets are managed, and the results of our efforts. It is just one more small way we are working to keep you better informed about your investment.
| Contents | |
| | |
| Dear Shareholder | 3 |
| | |
| Economic and Market Overview | 4 |
| | |
| Management Discussion of Fund Performance | 6 |
| | |
| Risks and Other Considerations | 13 |
| | |
| Fund Summary & Performance | 14 |
| | |
| Overview of Fund Expenses | 28 |
| | |
| Portfolio of Investments | 30 |
| | |
| Statement of Assets and Liabilities | 46 |
| | |
| Statement of Operations | 48 |
| | |
| Statements of Changes in Net Assets | 50 |
| | |
| Financial Highlights | 54 |
| | |
| Notes to Financial Statements | 61 |
| | |
Report of Independent Registered Public Accounting Firm | 69 |
| | |
| Supplemental Information | 70 |
| | |
Report of the Contracts Review Committee Regarding Claymore Exchange-Traded Fund Trust 2 | 73 |
| | |
| Trust Information | 79 |
| | |
| About the Trust Adviser | Back Cover |
DEAR SHAREHOLDER
Guggenheim Funds Investment Advisors, LLC (the “Investment Adviser”) is pleased to present the annual shareholder report for seven of our exchange-traded funds (“ETFs” or “Funds”). This report covers performance for the 12 months ended May 31, 2014.
The Investment Adviser is part of Guggenheim Investments, which represents the investment management businesses of Guggenheim Partners, LLC (“Guggenheim”), a global diversified financial services firm.
Guggenheim Funds Distributors, LLC, the distributor of the Funds, is committed to providing investors with innovative investment solutions; as of the date of this report we offer ETFs with a wide range of domestic and global themes, as well as closed-end funds and unit investment trusts. We have built on the investment management strengths of Guggenheim Investments and worked with a diverse group of index providers to create some of the most distinctive ETFs available.
To learn more about economic and market conditions over the last year and the objective and performance of each ETF, we encourage you to read the Economic and Market Overview section of the report, which follows this letter, and the Management Discussion of Fund Performance for each ETF, which begins on page 6.
Sincerely,
Donald Cacciapaglia
Chief Executive Officer
Claymore Exchange-Traded Fund Trust 2
June 30, 2014
| CLAYMORE EXCHANGE-TRADED FUND TRUST 2 ANNUAL REPORT | 3 |
| ECONOMIC AND MARKET OVERVIEW | May 31, 2014 |
A year ago, speculation about when quantitative easing would end increased interest rate volatility and drove investors to shorter-duration assets, which moderated after the Fed refrained from easing in September 2013. That, along with resolution of issues related to a government shutdown in October and eventual agreement on raising the debt ceiling, set the stage for an equity rally on the back of stronger economic growth that lasted into 2014. Tapering finally began in January 2014, continuing even after it became clear that the economy had slowed during the winter months. By May, the Fed was buying only $45 billion a month, down from $85 billion in December 2013.
Still, the world is afloat in a sea of liquidity, as every major central bank, with the exception of the European Central Bank, has been printing money. This has helped reduce the potential of a regional hotspot developing into a crisis, whether it’s deflation in Europe, failure of Japan’s Abenomics, overheated China real estate, or conflict between Russia and Ukraine. Even Europe was poised late in the period to initiate negative interest rates to combat low inflation and anemic credit growth, and did so after the period end.
With all the liquidity around the world, there is very little pressure on credit, as almost every major country is putting a ceiling on or depreciating its currency, while also increasing monetary accommodation, thereby driving demand for U.S. financial assets. This was a key reason why, at period-end, many U.S. equity indices were at all-time highs and U.S. Treasury yields approached the lows of 2013. The U.S. fixed-income market is also combating structural issues, as corporate debt issuance has been light, feeding a supply-demand imbalance which is pushing up prices of everything from investment grade corporate bonds to Treasuries.
In spite of this and poor first-quarter GDP, the U.S. economy continues to bode well and the investment environment remains positive for bonds, equities, and credit. The -2.9% GDP reading for the first quarter reflected the effect of the severe winter soft patch. Consumer spending, which accounts for 70% of U.S. economic activity, grew by 1% and may be a better indicator of the underlying strength of the American economy. Mortgage rates are heading lower, making housing more affordable, thereby boosting consumption, a harbinger for better growth in the quarters ahead. The level of growth should be strong enough to continue driving labor market and earnings growth, but not so strong that the Fed would consider prematurely hiking rates.
All this supports the view that the global economy is in the midst of a synchronous expansion. In addition to the better U.S. economic picture, the European economy is improving, and Japan is on the verge of making some radical changes to its pension laws, which should permit more foreign investment. This could cause the yen to depreciate, helping Japan’s economic situation, while also boosting demand for U.S. investments. China has also launched a mini stimulus to spur the economy and carefully manage its currency. All these factors are positive for the global economy.
For the 12-month period ended May 31, 2014, the Standard & Poor’s 500 Index (the “S&P 500”) returned 20.45% (this and all other returns cited in this section are total return). Morgan Stanley Capital International (“MSCI”) Europe-Australasia-Far East (“EAFE”) Index returned 18.04% and the MSCI Emerging Market Index returned 4.27%.
In the bond market, the Barclays U.S. Aggregate Bond Index (the “Barclays Aggregate”) returned 2.71% for the period, while the Barclays U.S. Corporate High Yield Index returned 7.90%. The return of the Barclays 1-3 Month U.S. Treasury Bill Index was 0.03% for the same period.
The Bank of America Merrill Lynch ABS AA-BBB Securities Master Index returned 3.22% for the period, while the Credit Suisse Leveraged Loan Index returned 4.90%.
| 4 | CLAYMORE EXCHANGE-TRADED FUND TRUST 2 ANNUAL REPORT |
Index Definitions
All indices described below are unmanaged and reflect no expenses. It is not possible to invest directly in any index.
The BofA/ML ABS Master AA-BBB Index is a subset of The BofA Merrill Lynch U.S. Fixed Rate Asset Backed Securities Index including all securities rated AA1 through BBB3, inclusive.
The Barclays U.S. Aggregate Bond Index is a broad-based benchmark that measures the investment grade, U.S. dollar denominated, fixed-rate taxable bond market, including Treasuries, government-related and corporate securities, mortgage-backed securities or “MBS” (agency fixed-rate and hybrid adjustable-rate mortgage, or “ARM”, pass-throughs), asset-backed securities (“ABS”), and commercial mortgage-backed securities (“CMBS”).
The Barclays U.S. Corporate High Yield Index measures the market of U.S. dollar denominated, non-investment grade, fixed-rate, taxable corporate bonds.
The Barclays 1-3 Month U.S. Treasury Bill Index tracks the performance of U.S. Treasury Bills with a remaining maturity of one to three months. U.S. Treasury Bills, which are short-term loans to the U.S. government, are full-faith-and-credit obligations of the U.S. Treasury and are generally regarded as being free of any risk of default.
The MSCI China Index is a capitalization weighted index that monitors the performance of stocks from the country of China.
The MSCI EAFE Index is a capitalization weighted measure of stock markets in Europe, Australasia and the Far East.
The MSCI Emerging Markets Index is a free float-adjusted market capitalization weighted index that is designed to measure equity market performance in the global emerging markets.
The MSCI World Index is a free float-adjusted market capitalization weighted index that is designed to measure the equity market performance of developed markets.
The MSCI World Index (Net) is calculated with net dividends reinvested. It is an unmanaged free float-adjusted market capitalization index that is designed to measure global developed market equity performance.
The Standard & Poor’s (“S&P 500”) Index is a capitalization-weighted index of 500 stocks designed to measure the performance of the broad economy, representing all major industries and is considered a representation of U.S. stock market.
The S&P/TSX Composite Index is a capitalization weighted index. The index is designed to measure performance of the broad Canadian economy through changes in the aggregate market value of stocks representing all major industries.
The S&P Global Timber & Forestry Index is comprised of 25 of the largest publicly traded companies engaged in the ownership, management or the upstream supply chain of forests and timberlands. These may be forest products companies, timber REITs, paper products companies, paper packaging companies, or agricultural product companies that are engaged in the ownership, management or the upstream supply chain of forests and timberlands.
Industry Sectors
Comments about industry sectors in these fund commentaries are based on Bloomberg industry classifications.
| CLAYMORE EXCHANGE-TRADED FUND TRUST 2 ANNUAL REPORT | 5 |
| MANAGEMENT DISCUSSION OF FUND PERFORMANCE (Unaudited) | May 31, 2014 |
ENY Guggenheim Canadian Energy Income ETF
Fund Overview
The Guggenheim Canadian Energy Income ETF, NYSE Arca ticker: ENY (the “Fund”) seeks investment results that correspond generally to the performance, before the Fund’s fees and expenses, of an equity index called the S&P/TSX High Income Energy Index (the “Index”). The Index was changed effective August 1, 2013. The previous benchmark was the Sustainable Canadian Energy Income Index.
The Index includes the constituent stocks of the S&P/TSX Composite Index that are classified as energy companies, according to the Global Industry Classification Standard (GICS), and that also meet specific yield requirements.
The Fund will invest at least 80% of its total assets in securities that comprise the Index. The Fund generally will invest in all of the stocks comprising the Index in proportion to their weightings in the Index.
Fund Performance
All Fund returns cited – whether based on net asset value (“NAV”) or market price – assume the reinvestment of all distributions. This report discusses the annual fiscal period ended May 31, 2014.
On a market price basis, the Fund generated a total return of 17.52%, which included an increase in market price over the period to $16.44 on May 31, 2014, from $14.43 as of May 31, 2013. On an NAV basis, the Fund generated a total return of 16.30%, which included an increase in NAV over the period to $16.36 on May 31, 2014, from $14.51 as of May 31, 2013. At the end of the period the Fund’s shares were trading at a market price premium to NAV, which is to be expected from time to time. NAV performance data reflects fees and expenses of the Fund.
For underlying index and broad Canadian equity market comparison purposes, the combined underlying index returned 14.48%, which includes both the returns of the Fund’s previous underlying index, Sustainable Canadian Energy Income Index (July 3, 2007 through July 31, 2013), and the current underlying index, S&P/TSX High Income Energy Index (August 1, 2013 through May 31, 2014). The S&P/TSX Composite Index (“S&P/TSX”) returned 13.56% for the 12-month period.
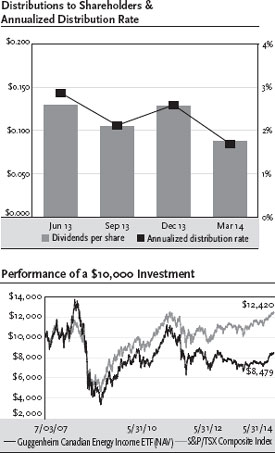
The Fund made quarterly distributions per share of $0.129 on June 28, 2013; $0.104 on September 30, 2013; $0.128 on December 31, 2013; and $0.087 on March 31, 2014, for a total distribution over the 12 months of $0.448.
Performance Attribution
Since more than 80% of the Fund’s portfolio is invested in the energy sector, the return of this sector was the main determinant of the Fund’s return, and it was the major source of the Fund’s positive return for the 12-month period ended May 31, 2014. The Fund also has positions in the utilities sector, and it also contributed to the Fund’s return.
Positions that contributed the most to return included Canadian Natural Resources Ltd., which acquires, explores for, develops, and produces natural gas, crude oil, and related products; Suncor Energy, Inc., an integrated energy company; and Pembina Pipeline Corp., which transports, stores and markets petroleum products (5.1%, 5.3% and 5.0%, respectively, of the Fund’s long-term investments at period end).
Positions that detracted the most included Southern Pacific Resource Corp., a producer of in-situ thermal heavy oil and bitumen (not held in the Fund’s portfolio at period end); BlackPearl Resources, Inc., an oil and gas exploration company (not held in the Fund’s portfolio at period end); and Talisman Energy, Inc., an independent oil and gas producer (4.7% of the Fund’s long-term investments at period end).
| 6 | CLAYMORE EXCHANGE-TRADED FUND TRUST 2 ANNUAL REPORT |
| MANAGEMENT DISCUSSION OF FUND PERFORMANCE (Unaudited) continued | May 31, 2014 |
TAO Guggenheim China Real Estate ETF
Fund Overview
The Guggenheim China Real Estate ETF, NYSE Arca ticker: TAO (the “Fund”) seeks investment results that correspond generally to the performance, before the Fund’s fees and expenses, of an equity index called the AlphaShares China Real Estate Index (the “Index”).
The Index is designed to measure and monitor the performance of the investable universe of publicly-traded companies and real estate investment trusts (“REITs”) which are open to foreign ownership and derive a majority of their revenues from real estate development, management and/or ownership of property in China or the Special Administrative Regions of China, such as Hong Kong and Macau. The Index was created by AlphaShares, LLC and is maintained by Standard & Poor’s.
The Fund will invest at least 90% of its total assets in common stock, American Depositary Receipts (“ADRs”), American Depositary Shares (“ADSs”), Global Depositary Receipts (“GDRs”) and International Depositary Receipts (“IDRs”) that comprise the Index and depositary receipts representing common stocks included in the Index (or underlying securities representing the ADRs, ADSs, GDRs and IDRs included in the Index). The Fund generally will invest in all of the securities comprising the Index in proportion to their weightings in the Index.
Fund Performance
All Fund returns cited—whether based on net asset value (“NAV”) or market price—assume the reinvestment of all distributions. This report discusses the annual fiscal period ended May 31, 2014.
On a market price basis, the Fund generated a total return of -2.61%, which included a decrease in market price over the period to $20.43 on May 31, 2014, from $21.66 as of May 31, 2013. On an NAV basis, the Fund generated a total return of -3.82%, which included a decrease in NAV over the period to $20.52 on May 31, 2014, from $22.03 as of May 31, 2013. At the end of the period the Fund’s shares were trading at a market price discount to NAV, which is to be expected from time to time. NAV performance data reflects fees and expenses of the Fund.
For underlying index and market comparison purposes, the Index returned -3.28% and the MSCI China Index, which measures performance of the Chinese equity market, returned 4.27% for the 12-month period ended May 31, 2014.
Performance Attribution
Nearly all of the Fund’s investments are in the real estate holding and development businesses and are classified in the financial and diversified sectors. For the 12-month period ended May 31, 2014, both sectors detracted from the Fund’s return.
Positions that contributed the most to the Fund’s return included Cheung Kong Holdings Ltd., an investment holding company based in Hong Kong; New World China Land Ltd., which, through its subsidiaries, develops and invests in properties in China; and Hongkong Land Holdings Ltd., which invests in and develops commercial properties (5.9%, 1.8% and 6.1%, respectively, of the Fund’s long-term investments at period end).
Positions that detracted the most from the Fund’s return included China Resources Land Ltd., which, through its subsidiaries, develops and invests in properties; Wharf Holdings Ltd., an investment holding company based in Hong Kong; and Wheelock & Co. Ltd., which, through its subsidiaries, develops and invests in properties (2.8%, 4.5% and 2.4%, respectively, of the Fund’s long-term investments at period end).
| CLAYMORE EXCHANGE-TRADED FUND TRUST 2 ANNUAL REPORT | 7 |
| MANAGEMENT DISCUSSION OF FUND PERFORMANCE (Unaudited) continued | May 31, 2014 |
HAO Guggenheim China Small Cap ETF
Fund Overview
The Guggenheim China Small Cap ETF, NYSE Arca ticker: HAO (the “Fund”) seeks investment results that correspond generally to the performance, before the Fund’s fees and expenses, of an equity index called the AlphaShares China Small Cap Index (the “Index”).
The Index is designed to measure and monitor the performance of publicly traded mainland China-based small capitalization companies. The Index was created by AlphaShares, LLC (“AlphaShares”) and is maintained by Standard & Poor’s. For inclusion in the Index, AlphaShares defines small capitalization companies as those companies with a maximum $1.5 billion float-adjusted market capitalization.
The Fund will invest at least 90% of its total assets in common stock, American Depositary Receipts (“ADRs”), American Depositary Shares (“ADSs”), Global Depositary Receipts (“GDRs”) and International Depositary receipts (“IDRs”) that comprise the Index and depositary receipts representing common stocks included in the Index (or underlying securities representing the ADRs, ADSs, GDRs and IDRs included in the Index). The Fund generally will invest in all of the securities comprising the Index in proportion to their weightings in the Index.
Fund Performance
All Fund returns cited—whether based on net asset value (“NAV”) or market price—assume the reinvestment of all distributions. This report discusses the annual fiscal period ended May 31, 2014.
On a market price basis, the Fund generated a total return of 3.69%, which included an increase in market price over the period to $24.70 on May 31, 2014, from $24.31 as of May 31, 2013. On an NAV basis, the Fund generated a total return of 2.24%, which included an increase in NAV over the period to $24.72 on May 31, 2014, from $24.68 as of May 31, 2013. At the end of the period the Fund’s shares were trading at a market price discount to NAV, which is to be expected from time to time. NAV performance data reflects fees and expenses of the Fund.
For underlying index and broad market comparison purposes, the Index returned 2.72% and the MSCI China Index, which measures performance of the broad Chinese equity market, returned 4.27% for the 12-month period ended May 31, 2014.
Performance Attribution
For the 12-month period ended May 31, 2014, the communications sector contributed most to return, followed by the consumer, non-cyclical sector. The financial sector detracted most from return, followed by the basic materials sector.
Positions that contributed most to the Fund’s return included Sihuan Pharmaceutical Holdings Group Ltd., which researches and develops cardiocerebral vascular drugs in China (1.7% of the Fund’s long-term investments at period end); Vipshop Holdings Ltd., ADR, which retails branded products at a discount over the Internet (1.6% of the Fund’s long-term investments at period end); and Youku Tudou, Inc., ADR, an Internet television company in China (not held in the Fund’s portfolio at period end).
Positions that detracted the most from the Fund’s return included China Overseas Grand Oceans Group Ltd., a property development and sales company; Hopson Development Holdings Ltd., which, through its subsidiaries, develops, manages and invests in properties in China; and Wumart Stores, Inc., which operates supermarkets and convenience stores in China (0.3%, 0.5% and 0.3%, respectively, of the Fund’s long-term investments at period end).
| 8 | CLAYMORE EXCHANGE-TRADED FUND TRUST 2 ANNUAL REPORT |
| MANAGEMENT DISCUSSION OF FUND PERFORMANCE (Unaudited) continued | May 31, 2014 |
FRN Guggenheim Frontier Markets ETF
Fund Overview
The Guggenheim Frontier Markets ETF, NYSE Arca ticker: FRN (the “Fund”) seeks investment results that correspond generally to the performance, before the Fund’s fees and expenses, of an equity index called the BNY Mellon New Frontier DR Index (the “Index”).
The Index is composed of and tracks the performance of all liquid, as defined by BNY Mellon, the Fund’s index provider (the “Index Provider”), American Depositary Receipts (“ADRs”) and Global Depositary Receipts (“GDRs”) that trade on the London Stock Exchange (“LSE”), New York Stock Exchange (“NYSE”), NYSE Arca, Inc. (“NYSE Arca”), NYSE MKT (formerly, NYSE AMEX) and Nasdaq Stock Market (“NASDAQ”) of Frontier Market countries, as defined by the Index Provider. The Index Provider defines Frontier Market countries based upon an evaluation of gross domestic product growth, per capita income growth, experienced and expected inflation rates, privatization of infrastructure and social inequalities. The countries currently are: Argentina, Bahrain, Jordan, Kuwait, Lebanon, Oman, Qatar, United Arab Emirates, Egypt, Ghana, Kenya, Malawi, Mauritius, Morocco, Nigeria, Tunisia, Zimbabwe, Bulgaria, Croatia, Czech Republic, Estonia, Georgia, Kazakhstan, Latvia, Lithuania, Poland, Romania, Slovak Republic, Slovenia, Ukraine, Bangladesh, Pakistan, Papua New Guinea, Sri Lanka, Vietnam, Peru, Chile, Colombia, Ecuador, Jamaica, Panama, and Trinidad & Tobago. An ADR or GDR is determined to be liquid based upon an assessment of trading volume and market capitalization. The Fund will invest at least 80% of its total assets in ADRs and GDRs that comprise the Index or in the stocks underlying such ADRs and GDRs. The Fund also will invest at least 80% of its total assets in securities of issuers from Frontier Market countries (whether directly or through ADRs or GDRs), as defined by the Index Provider. The Fund generally will invest in all of the stocks comprising the Index in proportion to their weightings in the Index.
Fund Performance
All Fund returns cited—whether based on net asset value (“NAV”) or market price—assume the reinvestment of all distributions. This report discusses the annual fiscal period ended May 31, 2014.
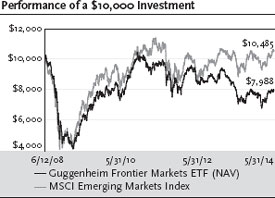
On a market price basis, the Fund generated a total return of 2.11%, which included a decrease in market price over the period to $16.86 on May 31, 2014, from $17.17 as of May 31, 2013. On an NAV basis, the Fund generated a total return of 0.24%, which included a decrease in NAV over the period to $16.79 on May 31, 2014, from $17.41 as of May 31, 2013. At the end of the period the Fund’s shares were trading at a market price premium to NAV, which is to be expected from time to time. NAV performance data reflects fees and expenses of the Fund.
For underlying index and broad emerging market comparison purposes, the Index returned 0.70% and the Morgan Stanley Capital International (“MSCI”) Emerging Markets Index returned 4.27% for the 12-month period ended May 31, 2014.
Performance Attribution
For the 12-month period ended May 31, 2014, the financial sector contributed most to the Fund’s return, followed by the energy sector. The basic materials sector detracted most from the Fund’s return, followed by the consumer, non-cyclical sector.
Positions that contributed the most to the Fund’s return included YPF SA, ADR, an Argentine oil and gas exploration and production company; Commercial International Bank Egypt SAE, GDR, which offers financial services to institutions, households and high net worth individuals; and Grupo Financiero Galicia SA, ADR, a financial services holding company in Argentina (6.9%, 5.2% and 1.7%, respectively, of the Fund’s long-term investments at period end).
Positions that detracted the most from the Fund’s return included Cencosud SA, ADR, a multi-brand retailer in South America; Cia de Minas Buenaventura SAA, ADR, which explores for, mines and processes gold, silver, zinc and other metals; and LATAM Airlines Group SA, ADR, an air carrier of passengers and cargo based in Chile (4.8%, 2.5% and 5.7%, respectively, of the Fund’s long-term investments at period end).
| CLAYMORE EXCHANGE-TRADED FUND TRUST 2 ANNUAL REPORT | 9 |
| MANAGEMENT DISCUSSION OF FUND PERFORMANCE (Unaudited) continued | May 31, 2014 |
HGI Guggenheim International Multi-Asset Income ETF
Fund Overview
The Guggenheim International Multi-Asset Income ETF, NYSE Arca ticker: HGI (the “Fund”) seeks investment results that correspond generally to the performance, before the Fund’s fees and expenses, of an index called the Zacks International Multi-Asset Income Index (the “Index”).
The Index is comprised of approximately 150 securities selected, based on investment and other criteria, from a universe of international companies, global real estate investment trusts (“REITs”), master limited partnerships (“MLPs”), Canadian royalty trusts and American Depositary Receipts (“ADRs”) of emerging market companies and U.S. listed closed-end funds that invest in international companies, and at all times is comprised of at least 40% non-U.S. securities. The companies in the universe are selected using a proprietary strategy developed by Zacks Investment Research, Inc.
The Fund will invest at least 90% of its total assets in securities that comprise the Index and underlying securities representing the ADRs included in the Index. The Fund generally will invest in all of the securities comprising the Index in proportion to their weightings in the Index.
Fund Performance
All Fund returns cited—whether based on net asset value (“NAV”) or market price—assume the reinvestment of all distributions. This report discusses the annual fiscal period ended May 31, 2014.
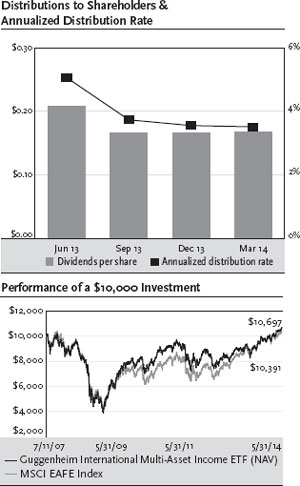
On a market price basis, the Fund generated a total return of 19.50%, which included an increase in market price over the period to $19.74 on May 31, 2014, from $17.19 as of May 31, 2013. On an NAV basis, the Fund generated a total return of 18.23%, which included an increase in NAV over the period to $19.61 on May 31, 2014, from $17.26 as of May 31, 2013. At the end of the period the Fund’s shares were trading at a market price premium to NAV, which is to be expected from time to time. NAV performance data reflects fees and expenses of the Fund.
For underlying index and broad market comparison purposes, the Index returned 18.62% and the Morgan Stanley Capital International Europe, Australasia, and Far East (MSCI EAFE) Index, an index designed to reflect the movements of stock markets in developed countries of Europe and the Pacific Basin, returned 18.04% for the 12-month period ended May 31, 2014.
The Fund made quarterly distributions per share of $0.208 on June 28, 2013; $0.166 on September 30, 2013; $0.166 on December 31, 2013; and $0.168 on March 31, 2014, for a total distribution over the 12 months of $0.708.
Performance Attribution
For the 12-month period ended May 31, 2014, the communications sector contributed most to the Fund’s return, followed by the financial sector. The basic materials sector was the only detractor from the Fund’s return.
Positions that contributed the most to the Fund’s return included SouFun Holdings Ltd. Class A, ADR, which operates a real estate Internet portal in China (not held in the Fund’s portfolio at period end); Comstock Resources, Inc., an independent exploration and production company (1.5% of the Fund’s long-term investments at period end); and Royal KPN NV, a Dutch landline and mobile telecommunications company (not held in the Fund’s portfolio at period end).
Positions that detracted the most from the Fund’s return included IRSA Inversiones y Representaciones SA, ADR, a leading real estate development firm in Argentina; CPFL Energia SA, ADR, a Brazilian electric utility company; and preferred stock of Telefonica Brasil SA, ADR, a Brazilian telecommunications group subsidiary of Spanish Telefonica (none held at period end).
| 10 | CLAYMORE EXCHANGE-TRADED FUND TRUST 2 ANNUAL REPORT |
| MANAGEMENT DISCUSSION OF FUND PERFORMANCE (Unaudited) continued | May 31, 2014 |
SEA Guggenheim Shipping ETF
Fund Overview
The Guggenheim Shipping ETF, NYSE Arca ticker: SEA (the “Fund”) seeks investment results that correspond generally to the performance, before the Fund’s fees and expenses, of an equity index called the Dow Jones Global Shipping IndexSM (the “Index”).
The Index is designed to measure the performance of high-dividend paying companies in the global shipping industry. CME Group Index Services, LLC (the “Index Provider”) uses a rules-based methodology to rank companies by yield that are involved in the shipping industry globally that primarily transport goods and materials. The Index Provider considers a company to be in the shipping industry if its revenues are derived primarily from shipping activities (excluding companies solely involved in transporting passengers). The Index Provider determines whether a company is “high-dividend paying” by ranking it relative to other companies in the shipping industry based upon indicated annual yield (most recent distribution annualized and divided by the current share price). The companies in the Index may be located in any country, including those classified as emerging markets.
The Fund will at all times invest at least 90% of its total assets in common stock, American Depositary Receipts (“ADRs”), Global Depositary Receipts (“GDRs”) and master limited partnerships (“MLPs”) that comprise the Index and the underlying stocks in respect of the ADRs and GDRs in the Index. The Fund generally will invest in all of the securities comprising the Index in proportion to their weightings in the Index.
Fund Performance
All Fund returns cited—whether based on net asset value (“NAV”) or market price—assume the reinvestment of all distributions. This report discusses the annual fiscal period ended May 31, 2014.
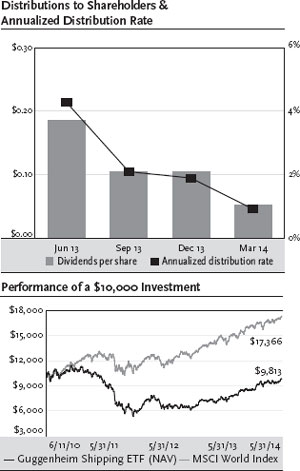
On a market price basis, the Fund generated a total return of 33.23%, which included an increase in market price over the period to $22.69 on May 31, 2014, from $17.43 as of May 31, 2013. On an NAV basis, the Fund generated a total return of 32.57%, which included an increase in NAV over the period to $22.68 on May 31, 2014, from $17.51 as of May 31, 2013. At the end of the period the Fund’s shares were trading at a market price premium to NAV, which is to be expected from time to time. NAV performance data reflects fees and expenses of the Fund.
For underlying index and broad market comparison purposes, the Index returned 32.62% and the MSCI World Index, an index designed to measure the equity market performance of developed markets, returned 18.87% for the 12-month period ended May 31, 2014.
The Fund made quarterly distributions per share of $0.186 on June 28, 2013; $0.105 on September 30, 2013; $0.104 on December 31, 2013; and $0.052 on March 31, 2014, for a total distribution over the 12 months of $0.447.
Performance Attribution
Most of the Fund’s portfolio is invested in the industrial sector, and it was the largest contributor to return. The Financial sector was a detractor from return.
Positions that contributed most to the Fund’s return included AP Moller-Maersk A/S, a conglomerate with diversified holdings, including a shipping fleet, industrial and supermarket businesses, and oil and gas exploration and distribution businesses; Teekay Corp., which provides transportation services for oil and petroleum products to major oil companies and other clients; and GasLog Ltd., an owner and operator of liquefied natural gas carriers (20.9%, 4.2% and 2.8%, respectively, of the Fund’s long-term investments at period end).
Positions that detracted the most from the Fund’s return included Orient Overseas International Ltd., a holding company involved in international transportation and logistics and property investment and property development; COSCO Pacific Ltd., which, through its subsidiaries, provides shipping container leasing services worldwide; and SembCorp Marine Ltd., which operates a concern for ship building, ship owning, ship repair and conversion (3.1%, 4.1% and 4.7%, respectively, of the Fund’s long-term investments at period end).
| CLAYMORE EXCHANGE-TRADED FUND TRUST 2 ANNUAL REPORT | 11 |
| MANAGEMENT DISCUSSION OF FUND PERFORMANCE (Unaudited) continued | May 31, 2014 |
CUT Guggenheim Timber ETF
Fund Overview
The Guggenheim Timber ETF, NYSE Arca ticker: CUT (the “Fund”) seeks investment results that correspond generally to the performance, before the Fund’s fees and expenses, of an equity index called the Beacon Global Timber Index (the “Index”).
All securities in the Index are selected from the universe of global timber companies. Beacon Indexes, LLC (“Beacon” or the “Index Provider”) defines global timber companies as firms who own or lease forested land and harvest the timber from such forested land for commercial use and sale of wood-based products, including lumber, pulp or other processed or finished goods such as paper and packaging.
The Fund will invest at least 90% of its total assets in common stock, American Depositary Receipts (“ADRs”) and Global Depositary Receipts (“GDRs”) that comprise the Index and depositary receipts representing common stocks included in the Index (or underlying securities representing the ADRs and GDRs included in the Index). The Fund generally will invest in all of the securities comprising the Index in proportion to their weightings in the Index.
Fund Performance
All Fund returns cited—whether based on net asset value (“NAV”) or market price—assume the reinvestment of all distributions. This report discusses the annual fiscal period ended May 31, 2014.
On a market price basis, the Fund generated a total return of 16.21%, which included an increase in market price over the period to $25.33 on May 31, 2014, from $22.10 as of May 31, 2013. On an NAV basis, the Fund generated a total return of 15.93%, which included an increase in NAV over the period to $25.37 on May 31, 2014, from $22.19 as of May 31, 2013. At the end of the period the Fund’s shares were trading at a market price discount to NAV, which is to be expected from time to time. NAV performance data reflects fees and expenses of the Fund.
For underlying index and broad world market comparison purposes, the Index returned 16.94%; the S&P Global Timber and Forestry Index returned 13.49%; and the MSCI World Index, an index designed to measure the equity market performance of developed markets, returned 18.87% for the 12-month period ended May 31, 2014. The STOXX® Europe TMI (Total Market Index) Forestry & Paper index returned 50.26%. It is a market-capitalization weighted index of all companies in the Forestry & Paper sector of the STOXX Europe TMI index.
Performance Attribution
Approximately 75% of the Fund’s portfolio is invested in the basic materials sector, and it was the major contributor to the Fund’s positive return for the 12-month period ended May 31, 2014. The Fund also has positions in the financial, energy and industrial sectors, but all of those sectors detracted from return for the period.
Positions that contributed the most to the Fund’s return included Smurfit Kappa Group PLC, an integrated manufacturer of paper-based packaging products; Portucel SA, a Portuguese operator of pulp and paper mills and forest manager; and UPM-Kymmene OYJ, a Finnish pulp, paper and timber manufacturer (8.4%, 6.0% and 4.5%, respectively, of the Fund’s long-term investments at period end).
Positions detracting the most from the Fund’s return included Duratex SA, a publicly listed private Brazilian company involved in manufacturing wood products (2.9% of the Fund’s long-term investments at period end); Morgan Stanley BV certificates linked to the performance of Duratex SA (not held at period end); and Fibria Celulose SA, ADR, which, through its subsidiaries, engages in the production, sale, and export of short fiber pulp (3.7% of the Fund’s long-term investments at period end).
| 12 | CLAYMORE EXCHANGE-TRADED FUND TRUST 2 ANNUAL REPORT |
Risks and Other Considerations
The views expressed in this report reflect those of the portfolio managers and Guggenheim Investments only through the report period as stated on the cover. These views are subject to change at any time, based on market and other conditions and should not be construed as a recommendation of any kind. The material may also contain forward-looking statements that involve risk and uncertainty, and there is no guarantee they will come to pass.
This information does not represent an offer to sell securities of the Funds and it is not soliciting an offer to buy securities of the Funds. An investment in the various Guggenheim Investments ETFs is subject to certain risks and other considerations. Below are some general risks and considerations associated with investing in the Funds, which may cause you to lose money, including the entire principal that you invest. Please refer to the individual ETF prospectus for a more detailed discussion of the Fund-specific risks and considerations.
Equity Risk: The value of the equity securities held by the Funds may fall due to general market and economic conditions, perceptions regarding the industries in which the issuers of securities held by the Funds participate, or factors relating to specific companies in which the Funds invest.
Foreign Investment Risk: Investing in non-U.S. issuers may involve unique risks such as currency, political, and economic risk, as well as less market liquidity, generally greater market volatility and less complete financial information than for U.S. issuers.
Small and Medium-Sized Company Risk: Investing in securities of these companies involves greater risk as their stocks may be more volatile and less liquid than investing in more established companies. These stocks may have returns that vary, sometimes significantly, from the overall stock market.
Non-Correlation Risk: The Funds’ return may not match the return of the Index including, but not limited to, operating expenses and costs in buying and selling securities to reflect changes in the Index. The Funds may not be fully invested at times. If the Funds utilize a sampling approach or futures or other derivative positions, their return may not correlate with the Index return, as would be the case if they purchased all of the stocks with the same weightings as the Index.
Passive Management Risk: The Funds are not “actively” managed. Therefore, they would not necessarily sell a stock because the stock’s issuer was in financial trouble unless that stock is removed from the Index.
Issuer-Specific Changes: The value of an individual security or particular type of security can be more volatile than the market as a whole and can perform differently from the value of the market as a whole. The value of securities of smaller issuers can be more volatile than that of larger issuers.
Industry Risk: If its Index is comprised of issuers in a particular industry or sector, a Fund would therefore be focused in that industry or sector. Accordingly, that Fund may be subject to more risks than if it were broadly diversified over numerous industries and sectors of the economy.
Non-Diversified Fund Risk (excluding HAO and HGI): Certain Funds are considered non-diversified and can invest a greater portion of assets in securities of individual issuers than a diversified fund. As a result, changes in the market value of a single investment could cause greater fluctuations in share price than would occur in a diversified fund.
Emerging Markets Risk (excluding CUT, FRN, HGI, TAO, HAO and SEA): Investment in securities of issuers based in developing or “emerging market” countries entails all of the risks of investing in securities of non-U.S. issuers, as previously described, but to a heightened degree.
Canadian Risk (ENY and HGI): Investing in Canadian royalty trusts and stocks listed on the TSX are subject to: Commodity Exposure Risk, Reliance on Exports Risk, U.S. Economic Risk and Structural Risk (Political Risk).
Master Limited Partnership (MLP) Risk (FRN, SEA and HGI): Investments in securities of MLPs involve risks that differ from an investment in common stock. Holders of the units of MLPs have more limited control and limited rights to vote on matters affecting the partnership. There are also certain tax risks associated with an investment in units of MLPs.
China Investment Risk (HAO and TAO): Investing in securities of Chinese companies involves additional risks, including, but not limited to: the economy of China differs, often unfavorably, from the U.S. economy in such respects as structure, general development, government involvement, wealth distribution, rate of inflation, growth rate, allocation of resources and capital reinvestment, among others; the central government has historically exercised substantial control over virtually every sector of the Chinese economy through administrative regulation and/or state ownership; and actions of the Chinese central and local government authorities continue to have a substantial effect on economic conditions in China.
REIT Risk (HGI and TAO): Investments in securities of real estate companies involve risks. These risks include, among others, adverse changes in national, state or local real estate conditions; obsolescence of properties; changes in the availability, cost and terms of mortgage funds; and the impact of changes in environmental laws.
Risks of Investing In Other Investment Companies (HGI): Investments in securities of other investment companies involve risks, including, among others, the fact that shares of other investment companies are subject to the management fees and other expenses of those companies, and the purchase of shares of some investment companies (in the case of closed-end investment companies) may sometimes require the payment of substantial premiums above the value of such companies’ portfolio securities or net asset values.
Risks of Investing in Frontier Securities (FRN): Investment in securities in emerging market countries involves risks not associated with investments in securities in developed countries, including risks associated with expropriation and/or nationalization, political or social instability, armed conflict, the impact on the economy as a result of civil war, religious or ethnic unrest and the withdrawal or non-renewal of any license enabling the Fund to trade in securities of a particular country, confiscatory taxation, restrictions on transfers of assets, lack of uniform accounting, auditing and financial reporting standards, less publicly available financial and other information, diplomatic development which could affect U.S. investments in those countries and potential difficulties in enforcing contractual obligations. Frontier countries generally have smaller economies or less developed capital markets than traditional emerging markets, and, as a result, the risk of investing in emerging market countries are magnified in frontier countries. As of the date of this report, a significant percentage of the BNY Mellon New Frontier DR Index is comprised of securities of companies from Chile, Columbia and Argentina. To the extent that the Index is focused on securities of any one country, including Chile, Columbia or Argentina, the value of the Index will be especially affected by adverse developments in such country, including the risks described above.
Securities Lending Risk: Although each Fund will receive collateral in connection with all loans of its securities holdings, the Funds would be exposed to a risk of loss should a borrower default on its obligation to return the borrowed securities (e.g., the loaned securities may have appreciated beyond the value of the collateral held by the Fund). In addition, the Funds will bear the risk of loss of any cash collateral that they invest.
In addition to the risks described, there are certain other risks related to investing in the Funds. These risks are described further in the Prospectus and Statement of Additional Information and at guggenheiminvestments.com/etf.
| CLAYMORE EXCHANGE-TRADED FUND TRUST 2 ANNUAL REPORT | 13 |
| FUND SUMMARY & PERFORMANCE (Unaudited) | May 31, 2014 |
ENY Guggenheim Canadian Energy Income ETF
| Fund Statistics | | | |
| Share Price | | $ | 16.44 |
| Net Asset Value | | $ | 16.36 |
| Premium/Discount to NAV | | | 0.49% |
| Net Assets ($000) | | $ | 46,127 |
| Total Returns | | | | | | | | | | | | |
| | | | | | | Three | | | Five | | | Since |
| (Inception | | | One | | | Year | | | Year | | | Inception |
| 7/3/07) | | | Year | | | (Annualized) | | | (Annualized) | | | (Annualized) |
| Guggenheim Canadian | | | | | | | | | | | | |
| Energy Income ETF | | | | | | | | | | | | |
| NAV | | | 16.30% | | | -6.64% | | | 6.34% | | | -2.36% |
| Market | | | 17.52% | | | -6.52% | | | 6.02% | | | -2.30% |
| Sustainable Canadian | | | | | | | | | | | | |
| Energy Income | | | | | | | | | | | | |
| Index/S&P/TSX | | | | | | | | | | | | |
| Canadian High | | | | | | | | | | | | |
| Income Energy | | | | | | | | | | | | |
Index1 | | | 14.48% | | | -6.66% | | | 6.95% | | | -1.55% |
| S&P/TSX Composite | | | | | | | | | | | | |
| Index | | | 13.56% | | | 1.09% | | | 10.34% | | | 3.19% |
Performance data quoted represents past performance, which is no guarantee of future results, and current performance may be lower or higher than the figures shown. NAV performance data reflects fees and expenses of the Fund. The deduction of taxes that a shareholder would pay on Fund distributions or the redemption of Fund shares is not reflected in the total returns. For the most recent month-end performance figures, please visit guggenheiminvestments.com. The investment return and principal value of an investment will fluctuate with changes in market conditions and other factors so that an investor’s shares, when redeemed, may be worth more or less than their original cost.
Since inception returns assume a purchase of the Fund at the initial share price of $25.05 per share for share price returns or initial net asset value (NAV) of $25.05 per share for NAV returns. Returns for periods of less than one year are not annualized.
The S&P/TSX Composite is the headline index for the Canadian equity market. It is the broadest in the S&P/TSX family and is the basis for multiple sub-indices. The referenced indices are unmanaged and not available for direct investment. Index performance does not reflect transaction costs, fees or expenses.
| 1 | Benchmark returns reflect the blended return of the Sustainable Canadian Energy Income Index from 7/3/07-7/31/13 and the return of the S&P/TSX Canadian High Income Energy Index, net of foreign withholding taxes, from 8/1/13-5/31/14. |
Per the most recent prospectus, the Fund’s annualized gross operating expense ratio, gross of any fee waivers or expense reimbursements, was 0.83%. In the Financial Highlights section of this Annual Report, the Fund’s annualized net operating expense ratio was 0.71% while the Fund’s annualized gross operating expense ratio, gross of any fee waivers or expense reimbursements, was 0.80%. There is a contractual fee waiver currently in place for this Fund through December 31, 2016 to the extent necessary in keeping the Fund’s operating expense ratio from exceeding 0.65% of average net assets per year. Some expenses fall outside of this expense cap and actual expenses may be higher than 0.65%. Without this expense cap, actual returns would be lower.
| | | | | |
| Portfolio Breakdown | % of Net Assets |
| Energy | | | 96.2 | % |
| Utilities | | | 3.2 | % |
| Total Long-Term Investments | | | 99.4 | % |
| Investments of Collateral for Securities Loaned | | | 40.6 | % |
| Total Investments | | | 140.0 | % |
| Liabilities in excess of Other Assets | | | -40.0 | % |
| Net Assets | | | 100.0 | % |
| | % of Long-Term |
| Top Ten Holdings | | | Investments |
| Suncor Energy, Inc. | | | 5.2 | % |
| Canadian Natural Resources Ltd. | | | 5.1 | % |
| Cenovus Energy, Inc. | | | 5.0 | % |
| Crescent Point Energy Corp. | | | 5.0 | % |
| Pembina Pipeline Corp. | | | 5.0 | % |
| Husky Energy, Inc. | | | 4.9 | % |
| Canadian Oil Sands Ltd. | | | 4.8 | % |
| Enbridge, Inc. | | | 4.8 | % |
| TransCanada Corp. | | | 4.7 | % |
| Talisman Energy, Inc. | | | 4.7 | % |
Portfolio breakdown is shown as a percentage of net assets. Holdings is shown as a percentage of long-term investments. Both are subject to change daily. For more current Fund information, please visit guggenheiminvestments.com. The above summaries are provided for informational purposes only, and should not be viewed as recommendations.
| 14 | CLAYMORE EXCHANGE-TRADED FUND TRUST 2 ANNUAL REPORT |
| FUND SUMMARY & PERFORMANCE (Unaudited) continued | May 31, 2014 |
ENY Guggenheim Canadian Energy Income ETF
This graph compares a hypothetical $10,000 investment in the Fund, made at its inception, with a similar investment in the Standard and Poor’s Toronto Stock Exchange Composite Index (S&P/TSX Composite Index). Results include the reinvestment of all dividends and capital gains. Past performance is no guarantee of future results. The S&P/TSX Composite Index is a capitalization-weighted index. The index is designed to measure performance of the broad Canadian economy through changes in the aggregate market value of stocks representing all major industries. It is not possible to invest directly in the S&P/TSX Composite Index. Investment return and principal value will fluctuate with changes in market conditions and other factors and Fund shares, when redeemed, may be worth more or less than their original investment.
| CLAYMORE EXCHANGE-TRADED FUND TRUST 2 ANNUAL REPORT | 15 |
| FUND SUMMARY & PERFORMANCE (Unaudited) continued | May 31, 2014 |
TAO Guggenheim China Real Estate ETF
| Fund Statistics | | | |
| Share Price | | $ | 20.43 |
| Net Asset Value | | $ | 20.52 |
| Premium/Discount to NAV | | | -0.44% |
| Net Assets ($000) | | $ | 22,778 |
| Total Returns | | | | | | | | | | | | |
| | | | | | | Three | | | Five | | | Since |
| (Inception | | | One | | | Year | | | Year | | | Inception |
| 12/18/07) | | | Year | | | (Annualized) | | | (Annualized) | | | (Annualized) |
| Guggenheim China | | | | | | | | | | | | |
| Real Estate ETF | | | | | | | | | | | | |
| NAV | | | -3.82% | | | 2.73% | | | 6.10% | | | 0.01% |
| Market | | | -2.61% | | | 2.69% | | | 5.51% | | | -0.08% |
| AlphaShares China | | | | | | | | | | | | |
| Real Estate Index | | | -3.28% | | | 3.31% | | | 6.83% | | | 0.82% |
| MSCI China Index | | | 4.27% | | | -1.59% | | | 5.15% | | | -1.91% |
Performance data quoted represents past performance, which is no guarantee of future results, and current performance may be lower or higher than the figures shown. NAV performance data reflects fees and expenses of the Fund. The deduction of taxes that a shareholder would pay on Fund distributions or the redemption of Fund shares is not reflected in the total returns. For the most recent month-end performance figures, please visit guggenheiminvestments.com. The investment return and principal value of an investment will fluctuate with changes in market conditions and other factors so that an investor’s shares, when redeemed, may be worth more or less than their original cost.
Since inception returns assume a purchase of the Fund at the initial share price of $23.50 per share for share price returns or initial net asset value (NAV) of $23.50 per share for NAV returns. Returns for periods of less than one year are not annualized.
The MSCI China Index is a capitalization-weighted index that measures the performance of large- and mid-cap securities in the Chinese equity markets and includes representation across China H shares, B shares, Red chips and P chips. The referenced index is unmanaged and not available for direct investment. Index performance does not reflect transaction costs, fees or expenses.
Per the most recent prospectus, the Fund’s annualized gross operating expense ratio, gross of any fee waivers or expense reimbursements, was 0.93%. In the Financial Highlights section of the Annual Report, the Fund’s annualized net operating expense ratio was 0.71%, while the Fund’s annualized gross operating expense ratio, gross of any fee waivers or expense reimbursements, was 0.95%. There is a contractual fee waiver currently in place for this Fund through December 31, 2016 to the extent necessary in keeping the Fund’s operating expense ratio from exceeding 0.65% of average net assets per year. Some expenses fall outside of this expense cap and actual expenses will be higher than 0.65%. Without this expense cap, actual returns would be lower.
| Portfolio Breakdown | % of Net Assets |
| Financial | | | 86.9 | % |
| Diversified | | | 11.4 | % |
| Total Common Stocks | | | 98.3 | % |
| Investments of Collateral for Securities Loaned | | | 4.0 | % |
| Total Investments | | | 102.3 | % |
| Liabilities in excess of Other Assets | | | -2.3 | % |
| Net Assets | | | 100.0 | % |
| | % of Long-Term |
| Top Ten Holdings | | | Investments |
| Hongkong Land Holdings Ltd. | | | 6.1 | % |
| Cheung Kong Holdings Ltd. | | | 5.8 | % |
| Henderson Land Development Co. Ltd. | | | 5.5 | % |
| Swire Pacific Ltd., Class A | | | 5.0 | % |
| Sun Hung Kai Properties Ltd. | | | 5.0 | % |
| Link Real Estate Investment Trust, REIT | | | 4.9 | % |
| Hang Lung Properties Ltd. | | | 4.9 | % |
| Wharf Holdings Ltd. | | | 4.5 | % |
| China Overseas Land & Investment Ltd. | | | 4.4 | % |
| New World Development Co. Ltd. | | | 4.1 | % |
Portfolio breakdown is shown as a percentage of net assets. Holdings are shown as a percentage of long-term investments. Both are subject to change daily. For more current Fund information, please visit guggenheiminvestments.com. The above summaries are provided for informational purposes only, and should not be viewed as recommendations.
| 16 | CLAYMORE EXCHANGE-TRADED FUND TRUST 2 ANNUAL REPORT |
| FUND SUMMARY & PERFORMANCE (Unaudited) continued | May 31, 2014 |
TAO Guggenheim China Real Estate ETF (continued)
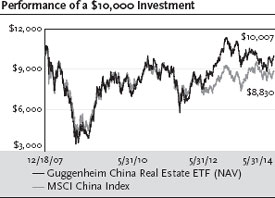
This graph compares a hypothetical $10,000 investment in the Fund, made at its inception, with a similar investment in the MSCI China Index. Results include the reinvestment of all dividends and capital gains. Past performance is no guarantee of future results. The MSCI China Index, a representative sample for the entire Chinese investment universe, combining A, B, H, Red Chip and P Chip share classes as well as US and Singapore-listed Chinese securities. The referenced index is unmanaged. It is not possible to invest directly in the MSCI China Index. Investment return and principal value will fluctuate with changes in market conditions and other factors and Fund shares, when redeemed, may be worth more or less than their original investment.
| CLAYMORE EXCHANGE-TRADED FUND TRUST 2 ANNUAL REPORT | 17 |
| FUND SUMMARY & PERFORMANCE (Unaudited) continued | May 31, 2014 |
HAO Guggenheim China Small Cap ETF
| Fund Statistics | | | | |
| Share Price | | $ | 24.70 | |
| Net Asset Value | | $ | 24.72 | |
| Premium/Discount to NAV | | | -0.08% | |
| Net Assets ($000) | | $ | 206,421 | |
| Total Returns | | | | | | | | | | | | |
| | | | | | | Three | | | Five | | | Since |
| (Inception | | | One | | | Year | | | Year | | | Inception |
| 1/30/08) | | | Year | | | (Annualized) | | | (Annualized) | | | (Annualized) |
| Guggenheim China | | | | | | | | | | | | |
| Small Cap ETF | | | | | | | | | | | | |
| NAV | | | 2.24% | | | -3.36% | | | 5.30% | | | 1.65% |
| Market | | | 3.69% | | | -3.30% | | | 4.76% | | | 1.63% |
| AlphaShares China | | | | | | | | | | | | |
| Small Cap Index | | | 2.72% | | | -2.65% | | | 6.17% | | | 2.65% |
| MSCI China Index | | | 4.27% | | | -1.59% | | | 5.15% | | | 0.21% |
Performance data quoted represents past performance, which is no guarantee of future results and current performance may be lower or higher than the figures shown. NAV performance data reflects fees and expenses of the Fund. The deduction of taxes that a shareholder would pay on Fund distributions or the redemption of Fund shares is not reflected in the total returns. For the most recent month-end performance figures, please visit guggenheiminvestments.com. The investment return and principal value of an investment will fluctuate with changes in market conditions and other factors so that an investor’s shares, when redeemed, may be worth more or less than their original cost.
Since inception returns assume a purchase of the Fund at the initial share price of $24.34 per share for share price returns or initial net asset value (NAV) of $24.34 per share for NAV returns. Returns for periods of less than one year are not annualized.
The MSCI China Index, a representative sample for the entire Chinese investment universe, combining A, B, H Red Chip and P Chip share classes as well as U.S. and Singapore-listed Chinese securities. The referenced indices are unmanaged and not available for direct investment. Index performance does not reflect transaction costs, fees or expenses.
Per the most recent prospectus, the Fund’s annualized gross operating expense ratio, gross of any fee waivers or expense reimbursements, was 0.84%. In the Financial Highlights section of this Annual Report, the Fund’s annualized net operating expense ratio was 0.76% while the Fund’s annualized gross operating expense ratio, gross of any fee waivers or expense reimbursements, was 0.84%. There is a contractual fee waiver currently in place for this Fund through December 31, 2016 to the extent necessary in keeping the Fund’s operating expense ratio from exceeding 0.70% of average net assets per year. Some expenses fall outside of this expense cap and actual expenses may be higher than 0.70%. Without this expense cap, actual returns would be lower.
| Portfolio Breakdown | % of Net Assets |
| Industrial | | | 18.0 | % |
| Consumer, Non-cyclical | | | 15.8 | % |
| Consumer, Cyclical | | | 15.6 | % |
| Financial | | | 15.3 | % |
| Basic Materials | | | 9.5 | % |
| Communications | | | 9.1 | % |
| Technology | | | 7.2 | % |
| Energy | | | 4.9 | % |
| Utilities | | | 3.5 | % |
| Diversified | | | 0.5 | % |
| Total Common Stocks | | | 99.4 | % |
| Right | | | 0.0 | %* |
| Total Long-Term Investments | | | 99.4 | % |
| Investments of Collateral for Securities Loaned | | | 16.5 | % |
| Total Investments | | | 115.9 | % |
| Liabilities in excess of Other Assets | | | -15.9 | % |
| Net Assets | | | 100.0 | % |
| * Less than 0.1% | | | | |
| | % of Long-Term |
| Top Ten Holdings | | | Investments |
| Sihuan Pharmaceutical Holdings Group Ltd. | | | 1.7 | % |
| Vipshop Holdings Ltd., ADR | | | 1.6 | % |
| China Taiping Insurance Holdings Co. Ltd. | | | 1.3 | % |
| Kingsoft Corp. Ltd. | | | 1.3 | % |
| Hanergy Solar Group Ltd. | | | 1.2 | % |
| Semiconductor Manufacturing International Corp. | | | 1.1 | % |
| GOME Electrical Appliances Holding Ltd. | | | 1.0 | % |
| Shenzhou International Group Holdings Ltd. | | | 0.9 | % |
| Jiangsu Expressway Co. Ltd. | | | 0.9 | % |
| Zhuzhou CSR Times Electric Co. Ltd. | | | 0.8 | % |
Portfolio breakdown is shown as a percentage of net assets. Holdings are shown as a percentage of long-term investments. Both are subject to change daily. For more current Fund information, please visit guggenheiminvestments.com. The above summaries are provided for informational purposes only, and should not be viewed as recommendations.
| 18 | CLAYMORE EXCHANGE-TRADED FUND TRUST 2 ANNUAL REPORT |
| FUND SUMMARY & PERFORMANCE (Unaudited) continued | May 31, 2014 |
HAO Guggenheim China Small Cap ETF (continued)
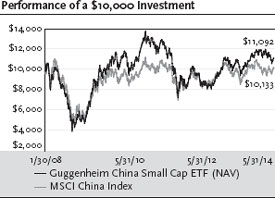
This graph compares a hypothetical $10,000 investment in the Fund, made at its inception, with a similar investment in the MSCI China Index. Results include the reinvestment of all dividends and capital gains. Past performance is no guarantee of future results. The MSCI China Index is a capitalization-weighted index that monitors the performance of stocks from the country of China. The index is unmanaged. It is not possible to invest directly in the MSCI China Index. Investment return and principal value will fluctuate with changes in market conditions and other factors and Fund shares, when redeemed, may be worth more or less than their original investment.
| CLAYMORE EXCHANGE-TRADED FUND TRUST 2 ANNUAL REPORT | 19 |
| FUND SUMMARY & PERFORMANCE (Unaudited) continued | May 31, 2014 |
FRN Guggenheim Frontier Markets ETF
| Fund Statistics | | | |
| Share Price | | $ | 16.86 |
| Net Asset Value | | $ | 16.79 |
| Premium/Discount to NAV | | | 0.42% |
| Net Assets ($000) | | $ | 87,970 |
| Total Returns | | | | | | | | | | | | |
| | | | | | | | | | | | | Since |
| (Inception | | | One | | | Year | | | Year | | | Inception |
| 6/12/08) | | | Year | | | (Annualized) | | | (Annualized) | | | (Annualized) |
| Guggenheim Frontier | | | | | | | | | | | | |
| Markets ETF | | | | | | | | | | | | |
| NAV | | | 0.24% | | | -6.80% | | | 5.90% | | | -3.69% |
| Market | | | 2.11% | | | -6.28% | | | 6.01% | | | -3.63% |
| BNY Mellon New | | | | | | | | | | | | |
| Frontier DR Index | | | 0.70% | | | -5.98% | | | 6.80% | | | -2.98% |
| MSCI Emerging | | | | | | | | | | | | |
| Markets Index | | | 4.27% | | | -1.77% | | | 8.36% | | | 0.80% |
Performance data quoted represents past performance, which is no guarantee of future results, and current performance may be lower or higher than the figures shown. NAV performance data reflects fees and expenses of the Fund. The deduction of taxes that a shareholder would pay on Fund distributions or the redemption of Fund shares is not reflected in the total returns. For the most recent month-end performance figures, please visit guggenheiminvestments.com. The investment return and principal value of an investment will fluctuate with changes in market conditions and other factors so that an investor’s shares, when redeemed, may be worth more or less than their original cost.
Since inception returns assume a purchase of the Fund at the initial share price of $24.34 per share for share price returns or initial net asset value (NAV) of $24.34 per share for NAV returns. Returns for periods of less than one year are not annualized.
The MSCI Emerging Markets Index is a free float-adjusted market capitalization index that is designed to measure equity market performance in the global emerging markets. The referenced indices are unmanaged and not available for direct investment. Index performance does not reflect transaction costs, fees or expenses.
Per the most recent prospectus, the Fund’s annualized gross operating expense ratio, gross of any fee waivers or expense reimbursements, was 0.75%. In the Financial Highlights section of this Annual Report, the Fund’s annualized net operating expense ratio was 0.71% while the Fund’s annualized gross operating expense ratio, gross of any fee waivers or expense reimbursements, was 0.81%. There is a contractual fee waiver currently in place for this Fund through December 31, 2016 to the extent necessary in keeping the Fund’s operating expense ratio from exceeding 0.65% of average net assets per year. Some expenses fall outside of this expense cap and actual expenses may be higher than 0.65%. Without this expense cap, actual returns would be lower.
| Portfolio Breakdown | % of Net Assets |
| Financial | | | 36.2 | % |
| Energy | | | 21.5 | % |
| Utilities | | | 11.9 | % |
| Consumer, Non-cyclical | | | 10.4 | % |
| Consumer, Cyclical | | | 6.0 | % |
| Basic Materials | | | 5.9 | % |
| Communications | | | 4.6 | % |
| Diversified | | | 2.0 | % |
| Industrial | | | 0.6 | % |
| Total Common Stocks and Preferred Stocks | | | 99.1 | % |
| Investments of Collateral for Securities Loaned | | | 22.3 | % |
| Total Investments | | | 121.4 | % |
| Liabilities in excess of Other Assets | | | -21.4 | % |
| Net Assets | | | 100.0 | % |
| | % of Long-Term |
| Top Ten Holdings | | | Investments |
| Ecopetrol SA, ADR | | | 9.3 | % |
| Bancolombia SA, ADR | | | 7.6 | % |
| Enersis SA, ADR | | | 7.5 | % |
| YPF SA, ADR | | | 6.9 | % |
| Latam Airlines Group SA, ADR | | | 5.7 | % |
| Commercial International Bank Egypt SAE, GDR | | | 5.2 | % |
| Guaranty Trust Bank PLC, GDR | | | 4.9 | % |
| Banco Santander Chile, ADR | | | 4.8 | % |
| Cencosud SA, ADR | | | 4.8 | % |
| Empresa Nacional de Electricidad SA, ADR | | | 4.6 | % |
Portfolio breakdown is shown as a percentage of net assets. Holdings is shown as a percentage of long-term investments. Both are subject to change daily. For more current Fund information, please visit guggenheiminvestments.com. The above summaries are provided for informational purposes only, and should not be viewed as recommendations.
| 20 | CLAYMORE EXCHANGE-TRADED FUND TRUST 2 ANNUAL REPORT |
| FUND SUMMARY & PERFORMANCE (Unaudited) continued | May 31, 2014 |
FRN Guggenheim Frontier Markets ETF (continued)
This graph compares a hypothetical $10,000 investment in the Fund, made at its inception, with a similar investment in the MSCI Emerging Markets Index. Results include the reinvestment of all dividends and capital gains. Past performance is no guarantee of future results. The MSCI Emerging Markets Index is a free float-adjusted market capitalization index that is designed to measure equity market performance in the global emerging markets. It is not possible to invest directly in the MSCI Emerging Market Index. Investment return and principal value will fluctuate with changes in market conditions and other factors and Fund shares, when redeemed, may be worth more or less than their original investment.
| CLAYMORE EXCHANGE-TRADED FUND TRUST 2 ANNUAL REPORT | 21 |
| FUND SUMMARY & PERFORMANCE (Unaudited) continued | May 31, 2014 |
HGI Guggenheim International Multi-Asset Income ETF
| Fund Statistics | | | |
| Share Price | | $ | 19.74 |
| Net Asset Value | | $ | 19.61 |
| Premium/Discount to NAV | | | 0.66% |
| Net Assets ($000) | | $ | 33,344 |
| Total Returns | | | | | | | | | | | | |
| | | | | | | Three | | | Five | | | Since |
| (Inception | | | One | | | Year | | | Year | | | Inception |
| 7/11/07) | | | Year | | | (Annualized) | | | (Annualized) | | | (Annualized) |
| Guggenheim International | | | | | | | | | | | | |
| Multi-Asset Income ETF | | | | | | | | | | | | |
| NAV | | | 18.23% | | | 3.94% | | | 11.21% | | | 0.98% |
| Market | | | 19.50% | | | 4.10% | | | 11.16% | | | 1.07% |
| Zacks International | | | | | | | | | | | | |
| Multi-Asset | | | | | | | | | | | | |
| Income Index | | | 18.62% | | | 4.46% | | | 11.75% | | | 1.47% |
| MSCI EAFE Index | | | 18.04% | | | 7.30% | | | 11.41% | | | 0.56% |
Performance data quoted represents past performance, which is no guarantee of future results and current performance may be lower or higher than the figures shown. NAV performance data reflects fees and expenses of the Fund. The deduction of taxes that a shareholder would pay on Fund distributions or the redemption of Fund shares is not reflected in the total returns. For the most recent month-end performance figures, please visit guggenheiminvestments.com. The investment return and principal value of an investment will fluctuate with changes in the market conditions and other factors so that an investor’s shares, when redeemed, may be worth more or less than their original cost.
Since inception returns assume a purchase of the Fund at the initial share price of $24.98 per share for share price returns or initial net asset value (NAV) of $24.98 per share for NAV returns. Returns for periods of less than one year are not annualized.
The Morgan Stanley Capital International (MSCI) EAFE Index measures the performance for a diverse range of global stock markets within Europe, Australasia and the Far East. The referenced indices are unmanaged and not available for direct investment. Index performance does not reflect transaction costs, fees or expenses.
Per the most recent prospectus, the Fund’s annualized gross operating expense ratio, gross of any fee waivers or expense reimbursements, was 0.94%. In the Financial Highlights section of this Annual Report, the Fund’s annualized net operating expense ratio was 0.70%, while the Fund’s annualized gross operating expense ratio, gross of any fee waivers or expense reimbursements, was 0.84%. There is a contractual fee waiver currently in place for this Fund through December 31, 2016 to the extent necessary in keeping the Fund’s operating expense ratio from exceeding 0.65% of average net assets per year. Some expenses fall outside of this expense cap and actual expenses will be higher than 0.65%. Without this expense cap, actual returns would be lower.
| Portfolio Breakdown | % of Net Assets |
| Financial | | | 18.4 | % |
| Energy | | | 15.6 | % |
| Communications | | | 14.2 | % |
| Consumer, Non-cyclical | | | 10.3 | % |
| Industrial | | | 9.3 | % |
| Consumer, Cyclical | | | 7.3 | % |
| Utilities | | | 5.8 | % |
| Basic Materials | | | 5.1 | % |
| Technology | | | 3.0 | % |
| Diversified | | | 0.8 | % |
| Total Common Stocks, Preferred Stocks and Royalty Trusts | | | 89.8 | % |
| Closed End Funds | | | 9.6 | % |
| Exchange-Traded Fund | | | 0.2 | % |
| Total Long-Term Investments | | | 99.6 | % |
| Investments of Collateral for Securities Loaned | | | 10.8 | % |
| Total Investments | | | 110.4 | % |
| Liabilities in excess of Other Assets | | | -10.4 | % |
| Net Assets | | | 100.0 | % |
| | % of Long-Term |
| Top Ten Holdings | | | Investments |
| Ecopetrol SA, ADR | | | 1.8 | % |
| Grupo Aeroportuario del Sureste SAB de CV, ADR | | | 1.6 | % |
| CNOOC Ltd. | | | 1.5 | % |
| Comstock Resources, Inc. | | | 1.5 | % |
| Mobile Telesystems OJSC, ADR | | | 1.3 | % |
| Giant Interactive Group, Inc., ADR | | | 1.3 | % |
| Hang Lung Properties Ltd. | | | 1.3 | % |
| Baytex Energy Corp. | | | 1.2 | % |
| Enerplus Corp. | | | 1.2 | % |
| Cresud SACIF y A, ADR | | | 1.2 | % |
Portfolio breakdown is shown as a percentage of net assets. Holdings are shown as a percentage of long-term investments. Both are subject to change daily. For more current Fund information, please visit guggenheiminvestments.com. The above summaries are provided for informational purposes only, and should not be viewed as recommendations.
| 22 | CLAYMORE EXCHANGE-TRADED FUND TRUST 2 ANNUAL REPORT |
| FUND SUMMARY & PERFORMANCE (Unaudited) continued | May 31, 2014 |
HGI Guggenheim International Multi-Asset Income ETF (continued)
This graph compares a hypothetical $10,000 investment in the Fund, made at its inception, with a similar investment in the MSCI EAFE Index. Results include the reinvestment of all dividends and capital gains. Past performance is no guarantee of future results. The MSCI EAFE Index is a capitalization weighted measure the stock markets in Europe, Australasia and the Far East. It is not possible to invest directly in the MSCI EAFE Index. Investment return and principal value will fluctuate with changes in market conditions and other factors and Fund shares, when redeemed, may be worth more or less than their original investment.
| CLAYMORE EXCHANGE-TRADED FUND TRUST 2 ANNUAL REPORT | 23 |
| FUND SUMMARY & PERFORMANCE (Unaudited) continued | May 31, 2014 |
SEA Guggenheim Shipping ETF
| Fund Statistics | | | |
| Share Price | | $ | 22.69 |
| Net Asset Value | | $ | 22.68 |
| Premium/Discount to NAV | | | 0.04% |
| Net Assets ($000) | | $ | 117,953 |
| Total Returns | | | | | | | | | |
| | | | | | | Three | | | Since |
| | | | One | | | Year | | | Inception |
| (Inception 6/11/10) | | | Year | | | (Annualized) | | | (Annualized) |
| Guggenheim Shipping ETF | | | | | | | | | |
| NAV | | | 32.57% | | | 0.46% | | | -0.47% |
| Market | | | 33.23% | | | 0.50% | | | -0.47% |
| Dow Jones Global | | | | | | | | | |
Shipping IndexSM | | | 32.62% | | | 2.52% | | | 4.01% |
| Delta Global Shipping | | | | | | | | | |
| Index/Dow Jones | | | | | | | | | |
| Global Shipping | | | | | | | | | |
IndexSM | | | 32.62% | | | 1.00%1 | | | -0.01%2 |
| MSCI World Index | | | 18.87% | | | 10.56% | | | 14.91% |
Performance data quoted represents past performance, which is no guarantee of future results and current performance may be lower or higher than the figures shown. NAV performance data reflects fees and expenses of the Fund. The deduction of taxes that a shareholder would pay on Fund distributions or the redemption of Fund shares is not reflected in the total returns. For the most recent month-end performance figures, please visit guggenheiminvestments.com. The investment return and principal value of an investment will fluctuate with changes in market conditions and other factors so that an investor’s shares, when redeemed, may be worth more or less than their original cost.
Since inception returns assume a purchase of the Fund at the initial share price of $25.96 per share for share price returns or initial net asset value (NAV) of $25.96 per share for NAV returns. Returns for periods of less than one year are not annualized.
The Morgan Stanley Capital International World Index (MSCI) measures performance from a diverse range of global stock markets, including the U.S., Canada, Europe, Australia, New Zealand, and the Far East. The referenced indices are unmanaged and not available for direct investment. Index performance does not reflect transaction costs, fees or expenses.
The Fund’s annual operating ratio of 0.65% is expressed as a unitary fee and covers all expenses of the Fund, except distributions fees, if any, brokerage expenses, taxes, interest, litigation expenses and other extraordinary expenses.
| Portfolio Breakdown | % of Net Assets |
| Industrials | | | 95.4 | % |
| Financial | | | 4.1 | % |
| Total Common Stock and Master Limited Partnerships | | | 99.5 | % |
| Investments of Collateral for Securities Loaned | | | 12.5 | % |
| Total Investments | | | 112.0 | % |
| Liabilities in excess of Other Assets | | | -12.0 | % |
| Net Assets | | | 100.0 | % |
| | % of Long-Term |
| Top Ten Holdings | | | Investments |
| AP Moller - Maersk A/S, Class B | | | 20.9 | % |
| Nippon Yusen KK | | | 7.0 | % |
| SembCorp Marine Ltd. | | | 4.7 | % |
| Teekay Offshore Partners, LP | | | 4.2 | % |
| Teekay Corp. | | | 4.2 | % |
| Teekay LNG Partners, LP | | | 4.1 | % |
| COSCO Pacific Ltd. | | | 4.1 | % |
| Kawasaki Kisen Kaisha Ltd. | | | 3.8 | % |
| Navios Maritime Partners, LP | | | 3.4 | % |
| Golar LNG Partners, LP | | | 3.4 | % |
Portfolio breakdown is shown as a percentage of net assets. Holdings are shown as a percentage of long-term investments. Both are subject to change daily. For more current Fund information, please visit guggenheiminvestments.com. The above summaries are provided for informational purposes only, and should not be viewed as recommendations.
1 The benchmark return reflects the blended return of the Delta Global Shipping Index from 5/31/11 - 7/26/11 and the return of the Dow Jones Global Shipping IndexSM from 7/27/11 - 5/31/14.
2 The benchmark return reflects the blended return of the Delta Global Shipping Index from 6/11/10 - 7/26/11 and the return of the Dow Jones Global Shipping IndexSM from 7/27/11 - 5/31/14.
| 24 | CLAYMORE EXCHANGE-TRADED FUND TRUST 2 ANNUAL REPORT |
| FUND SUMMARY & PERFORMANCE (Unaudited) continued | May 31, 2014 |
SEA Guggenheim Shipping ETF (continued)
This graph compares a hypothetical $10,000 investment in the Fund, made at its inception, with a similar investment in the MSCI World Index. Results include the reinvestment of all dividends and capital gains. Past performance is no guarantee of future results. The MSCI World Index measures performance from a diverse range of global stock markets, including the U.S., Canada, Europe, Australia, New Zealand, and the Far East. The referenced index is unmanaged. It is not possible to invest directly in the MSCI World Index. Investment return and principal value will fluctuate with changes in market conditions and other factors and Fund shares, when redeemed, may be worth more or less than their original investment.
| CLAYMORE EXCHANGE-TRADED FUND TRUST 2 ANNUAL REPORT | 25 |
| FUND SUMMARY & PERFORMANCE (Unaudited) continued | May 31, 2014 |
CUT Guggenheim Timber ETF
| Fund Statistics | | | |
| Share Price | | $ | 25.33 |
| Net Asset Value | | $ | 25.37 |
| Premium/Discount to NAV | | | -0.16% |
| Net Assets ($000) | | $ | 253,668 |
| Total Returns | | | | | | | | | | | | |
| | | | | | | Three | | | Five | | | Since |
| (Inception | | | One | | | Year | | | Year | | | Inception |
| 11/9/07) | | | Year | | | (Annualized) | | | (Annualized) | | | (Annualized) |
| Guggenheim Timber ETF | | | | | | | | | | | | |
| NAV | | | 15.93% | | | 5.98% | | | 13.61% | | | 2.10% |
| Market | | | 16.21% | | | 5.94% | | | 13.32% | | | 2.06% |
| Beacon Global | | | | | | | | | | | | |
| Timber Index | | | 16.94% | | | 6.99% | | | 14.82% | | | 3.28% |
| MSCI World Index | | | 18.87% | | | 10.56% | | | 14.46% | | | 3.11% |
| S&P Global | | | | | | | | | | | | |
| Timber and | | | | | | | | | | | | |
| Forest Index | | | 13.49% | | | 5.16% | | | 13.62% | | | -0.14% |
| STOXX Europe Total | | | | | | | | | | | | |
| Market Forestry | | | | | | | | | | | | |
| & Paper Index | | | 50.26% | | | 7.22% | | | 21.39% | | | 1.97% |
Performance data quoted represents past performance, which is no guarantee of future results and current performance may be lower or higher than the figures shown. NAV performance data reflects fees and expenses of the Fund. The deduction of taxes that a shareholder would pay on Fund distributions or the redemption of Fund shares is not reflected in the total returns. For the most recent month-end performance figures, please visit guggenheiminvestments.com. The investment return and principal value of an investment will fluctuate with changes in market conditions and other factors so that an investor’s shares, when redeemed, may be worth more or less than their original cost.
Since inception returns assume a purchase of the Fund at the initial share price of $24.91 per share for share price returns or initial net asset value (NAV) of $24.91 per share for NAV returns. Returns for periods of less than one year are not annualized.
The Morgan Stanley Capital International (MSCI) World Index measures performance from a diverse range of global stock markets, including the U.S., Canada, Europe, Australia, New Zealand, and the Far East.
The S&P Global Timber & Forestry Index is comprised of 25 of the largest publicly traded companies engaged in the ownership, management or the upstream supply chain of forests and timberlands. These may be forest products companies, timber REITs, paper products companies, paper packaging companies, or agricultural product companies that are engaged in the ownership, management or the upstream supply chain of forests and timberlands.
The STOXX® Europe TMI Forestry & Paper is a market capitalization weighted index of all companies in the Forestry & Paper sector of the STOXX Europe TMI index. Using the market standard ICB (Industry Classification Benchmark), companies with primary revenue sources from the Forestry & Paper sector are selected from the STOXX Europe TMI universe, which covers 95 percent of the free float market capitalization across 18 Western European countries (Austria, Belgium, Denmark, Finland, France, Germany, Greece, Iceland, Ireland, Italy, Luxembourg, the Netherlands, Norway, Portugal, Spain, Sweden, Switzerland and the United Kingdom).
The referenced indices are unmanaged and not available for direct investment. Index performance does not reflect transaction costs, fees or expenses.
Per the most recent prospectus, the Fund’s annualized gross operating expense ratio, gross of any fee waivers or expense reimbursements, was 0.76%. In the Financial Highlights section of this Annual Report, the Fund’s annualized net operating expense ratio was determined to be 0.71% while the Fund’s annualized gross operating expense ratio, gross of any fee waivers or expense reimbursements, was determined to be 0.75%. There is a contractual fee waiver currently in place for this Fund through December 31, 2016 to the extent necessary in keeping the Fund’s operating expense ratio from exceeding 0.65% of average net assets per year. Some expenses fall outside of this expense cap and actual expenses will be higher than 0.65%. Without this expense cap, actual returns would be lower.
| Portfolio Breakdown | % of Net Assets |
| Basic Materials | | | 74.6 | % |
| Financial | | | 14.9 | % |
| Industrial | | | 6.6 | % |
| Energy | | | 1.3 | % |
| Total Common Stocks | | | 97.4 | % |
| Preferred Stock | | | 2.3 | % |
| Investments of Collateral for Securities Loaned | | | 11.7 | % |
| Total Investments | | | 111.4 | % |
| Liabilities in excess of Other Assets | | | -11.4 | % |
| Net Assets | | | 100.0 | % |
| 26 | CLAYMORE EXCHANGE-TRADED FUND TRUST 2 ANNUAL REPORT |
| FUND SUMMARY & PERFORMANCE (Unaudited) continued | May 31, 2014 |
CUT Guggenheim Timber ETF (continued)
| | % of Long-Term |
| Top Ten Holdings | | | Investments |
| Smurfit Kappa Group PLC | | | 8.4 | % |
| West Fraser Timber Co. Ltd. | | | 6.2 | % |
| Portucel SA | | | 6.0 | % |
| Svenska Cellulosa AB SCA, B Shares | | | 5.4 | % |
| Weyerhaeuser Co., REIT | | | 5.0 | % |
| Canfor Corp. | | | 4.9 | % |
| Stora ENSO OYJ, R Shares | | | 4.8 | % |
| International Paper Co. | | | 4.6 | % |
| MeadWestvaco Corp. | | | 4.5 | % |
| UPM-Kymmene OYJ | | | 4.5 | % |
Portfolio breakdown is shown as a percentage of net assets. Holdings is shown as a percentage of long-term investments. Both are subject to change daily. For more current Fund information, please visit guggenheiminvestments.com. The above summaries are provided for informational purposes only, and should not be viewed as recommendations.
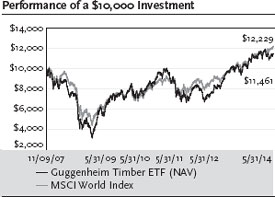
This graph compares a hypothetical $10,000 investment in the Fund, made at its inception, with a similar investment in the MSCI World Index. Results include the reinvestment of all dividends and capital gains. Past performance is no guarantee of future results. The MSCI World Index measures performance from a diverse range of global stock markets, including the U.S., Canada, Europe, Australia, New Zealand and the Far East. It is not possible to invest directly in the MSCI World Index. Investment return and principal value will fluctuate with changes in market conditions and other factors and Fund shares, when redeemed, may be worth more or less than their original investment.
| CLAYMORE EXCHANGE-TRADED FUND TRUST 2 ANNUAL REPORT | 27 |
| OVERVIEW OF FUND EXPENSES (Unaudited) | May 31, 2014 |
As a shareholder of Guggenheim Canadian Energy Income ETF; Guggenheim China Real Estate ETF; Guggenheim China Small Cap ETF; Guggenheim Frontier Markets ETF; Guggenheim International Multi-Asset Income ETF; Guggenheim Shipping ETF; and Guggenheim Timber ETF, you incur advisory fees and other Fund expenses. The expense examples below are intended to help you understand your ongoing costs (in dollars) of investing in the Funds and to compare these costs with the ongoing costs of investing in other funds.
The example is based on an investment of $1,000 invested at the beginning of the period and held for the entire six month period ended May 31, 2014.
Actual Expense
The first line of the table below provides information about actual account values and actual expenses. You may use the information in this line, together with the amount you invested, to estimate the expenses that you paid over the period. Simply divide your account value by $1,000 (for example, an $8,600 account value divided by $1,000 = 8.6), then multiply the result by the number in the first line under the heading entitled “Expenses Paid During Period” to estimate the expenses you paid on your account during this period.
Hypothetical Example for Comparison Purposes
The second line of the table below provides information about hypothetical account values and hypothetical expenses based on the Fund’s actual expense ratio and an assumed rate of return of 5% per year before expenses, which is not the Fund’s actual return. The hypothetical account values and expenses may not be used to estimate the actual ending account balance or expenses you paid for the period. You may use this information to compare the ongoing cost of investing in the Fund and other funds. To do so, compare this 5% hypothetical example with the 5% hypothetical examples that appear in the shareholder reports of the other funds.
Please note that the expenses shown in the table are meant to highlight your ongoing costs only and do not reflect any transactional costs, such as sales charges (loads) or contingent deferred sales charges. Therefore, the second line of the table is useful in comparing ongoing costs only, and will not help you determine the relative total costs of owning different funds. In addition, if these transactional costs were included, your costs would have been higher.
| | | | | | | | | | Annualized | | | | |
| | | | | | | | | | Expense | | | Expenses | |
| | | | Beginning | | | Ending | | | Ratio for the | | | Paid | |
| | | | Account | | | Account | | | Six Months | | | During | |
| | | | Value | | | Value | | | Ended | | | Period1 | |
| | | | 12/1/13 | | | 05/31/14 | | | 5/31/14 | | 12/1/13-5/31/14 | |
Guggenheim Canadian Energy Income ETF2 | | | | | | | | | | | | | |
| Actual | | $ | 1,000.00 | | $ | 1,139.02 | | | 0.73% | | $ | 3.89 | |
| Hypothetical | | | 1,000.00 | | | 1,021.29 | | | 0.73% | | | 3.68 | |
| (5% annual return before expenses) | | | | | | | | | | | | | |
| | | | | | | | | | | | | | |
Guggenheim China Real Estate ETF2 | | | | | | | | | | | | | |
| Actual | | | 1,000.00 | | | 983.69 | | | 0.73% | | | 3.61 | |
| Hypothetical | | | 1,000.00 | | | 1,021.29 | | | 0.73% | | | 3.68 | |
| (5% annual return before expenses) | | | | | | | | | | | | | |
| | | | | | | | | | | | | | |
Guggenheim China Small Cap ETF2 | | | | | | | | | | | | | |
| Actual | | | 1,000.00 | | | 939.06 | | | 0.76% | | | 3.67 | |
| Hypothetical | | | 1,000.00 | | | 1,021.14 | | | 0.76% | | | 3.83 | |
| (5% annual return before expenses) | | | | | | | | | | | | | |
| | | | | | | | | | | | | | |
Guggenheim Frontier Markets ETF2 | | | | | | | | | | | | | |
| Actual | | | 1,000.00 | | | 1,023.62 | | | 0.73% | | | 3.68 | |
| Hypothetical | | | 1,000.00 | | | 1,021.29 | | | 0.73% | | | 3.68 | |
| (5% annual return before expenses) | | | | | | | | | | | | | |
| | | | | | | | | | | | | | |
Guggenheim International Multi-Asset Income ETF2 | | | | | | | | | | | | | |
| Actual | | | 1,000.00 | | | 1,086.65 | | | 0.72% | | | 3.75 | |
| Hypothetical | | | 1,000.00 | | | 1,021.34 | | | 0.72% | | | 3.63 | |
| (5% annual return before expenses) | | | | | | | | | | | | | |
| 28 | CLAYMORE EXCHANGE-TRADED FUND TRUST 2 ANNUAL REPORT |
| OVERVIEW OF FUND EXPENSES (Unaudited) continued | May 31, 2014 |
| | | | | | | | | | Annualized | | | | |
| | | | | | | | | | Expense | | | Expenses | |
| | | | Beginning | | | Ending | | | Ratio for the | | | Paid | |
| | | | Account | | | Account | | | Six Months | | | During | |
| | | | Value | | | Value | | | Ended | | | Period1 | |
| | | | 12/1/13 | | | 05/31/14 | | | 5/31/14 | | 12/1/13-5/31/14 | |
| Guggenheim Shipping ETF | | | | | | | | | | | | | |
| Actual | | $ | 1,000.00 | | $ | 1,133.73 | | | 0.66% | | $ | 3.51 | |
| Hypothetical | | | 1,000.00 | | | 1,021.64 | | | 0.66% | | | 3.33 | |
| (5% annual return before expenses) | | | | | | | | | | | | | |
| | | | | | | | | | | | | | |
Guggenheim Timber ETF2 | | | | | | | | | | | | | |
| Actual | | | 1,000.00 | | | 1,019.21 | | | 0.72% | | | 3.62 | |
| Hypothetical | | | 1,000.00 | | | 1,021.34 | | | 0.72% | | | 3.63 | |
| (5% annual return before expenses) | | | | | | | | | | | | | |
| 1 | Actual and hypothetical expenses are calculated using the annualized expense ratio. This represents the ongoing expenses of the Fund as a percentage of average net assets for the six months ended May 31, 2014. Expenses are calculated by multiplying the Fund’s annualized expense ratio by the average account value over the period; then multiplying that result by 182/365. |
| 2 | The expense ratios reflect an expense waiver. Please see the Notes to Financial Statements for more information. |
Assumes all dividends and distributions were reinvested.
Premium/Discount Information
Information about the differences between the daily market price on secondary markets for Shares and the NAV of each Fund can be found at gugggenheiminvestments.com.
| CLAYMORE EXCHANGE-TRADED FUND TRUST 2 ANNUAL REPORT | 29 |
| PORTFOLIO OF INVESTMENTS | May 31, 2014 |
ENY Guggenheim Canadian Energy Income ETF
| Number | | | | | | |
| of Shares | | Description | | | Value | |
| | | Long-Term Investments - 99.4% | | | | |
| | | Common Stocks - 99.4% | | | | |
| | | Canada - 99.4% | | | | |
| 27,805 | | AltaGas Ltd.(a) | | $ | 1,233,985 | |
| 71,365 | | ARC Resources Ltd.(a) | | | 2,053,835 | |
| 28,588 | | Baytex Energy Corp.(a) | | | 1,192,384 | |
| 39,184 | | Bonavista Energy Corp.(a) | | | 583,872 | |
| 6,144 | | Bonterra Energy Corp.(a) | | | 326,198 | |
| 7,960 | | Calfrac Well Services Ltd. | | | 272,114 | |
| 11,924 | | Canadian Energy Services & Technology Corp.(a) | | | 342,835 | |
| 57,552 | | Canadian Natural Resources Ltd. | | | 2,338,969 | |
| 105,736 | | Canadian Oil Sands Ltd. | | | 2,221,152 | |
| 77,732 | | Cenovus Energy, Inc. | | | 2,310,090 | |
| 56,345 | | Crescent Point Energy Corp.(a) | | | 2,306,521 | |
| 10,134 | | Enbridge Income Fund Holdings, Inc. | | | 256,652 | |
| 46,475 | | Enbridge, Inc. | | | 2,205,513 | |
| 17,765 | | Enerflex Ltd. | | | 267,166 | |
| 46,132 | | Enerplus Corp.(a) | | | 1,048,522 | |
| 29,617 | | Ensign Energy Services, Inc. | | | 442,680 | |
| 11,258 | | Freehold Royalties Ltd.(a) | | | 271,017 | |
| 27,844 | | Gibson Energy, Inc. | | | 803,639 | |
| 66,972 | | Husky Energy, Inc. | | | 2,255,529 | |
| 69,939 | | Inter Pipeline Ltd.(a) | | | 2,046,288 | |
| 18,015 | | Keyera Corp. | | | 1,218,254 | |
| 45,376 | | Lightstream Resources Ltd.(a) | | | 320,935 | |
| 20,563 | | Mullen Group Ltd. | | | 551,074 | |
| 72,962 | | Pacific Rubiales Energy Corp. | | | 1,423,829 | |
| 16,619 | | Parkland Fuel Corp. | | | 327,528 | |
| 14,886 | | Pason Systems, Inc. | | | 405,103 | |
| 57,805 | | Pembina Pipeline Corp.(a) | | | 2,278,982 | |
| 118,709 | | Pengrowth Energy Corp.(a) | | | 748,866 | |
| 111,375 | | Penn West Petroleum Ltd.(a) | | | 1,032,874 | |
| 33,131 | | Peyto Exploration & Development Corp.(a) | | | 1,174,086 | |
| 66,263 | | Precision Drilling Corp. | | | 858,609 | |
| 20,089 | | Savanna Energy Services Corp. | | | 151,706 | |
| 62,621 | | Suncor Energy, Inc. | | | 2,406,570 | |
| 40,733 | | Surge Energy, Inc.(a) | | | 253,210 | |
| 207,633 | | Talisman Energy, Inc. | | | 2,141,631 | |
| 46,149 | | TransCanada Corp. | | | 2,145,417 | |
| 33,808 | | Trican Well Service Ltd. | | | 517,465 | |
| 31,313 | | Trinidad Drilling Ltd. | | | 331,629 | |
| 45,751 | | Veresen, Inc.(a) | | | 716,696 | |
| 21,582 | | Vermilion Energy, Inc.(a) | | | 1,455,297 | |
| 45,386 | | Whitecap Resources, Inc.(a) | | | 621,531 | |
| | | (Cost $41,331,238) | | | 45,860,253 | |
| | | Investments of Collateral for | | | | |
| | | Securities Loaned - 40.6% | | | | |
| 18,725,793 | | BNY Mellon Securities Lending Overnight | | | | |
| | | Fund, 0.1251%(b) (c) | | | | |
| | | (Cost $18,725,793) | | | 18,725,793 | |
| | | | | | | |
| | | Total Investments - 140.0% | | | | |
| | | (Cost $60,057,031) | | | 64,586,046 | |
| | | Liabilities in excess of Other Assets - (40.0%) | | | (18,458,864 | ) |
| | | Net Assets - 100.0% | | $ | 46,127,182 | |
| (a) | Security, or portion thereof, was on loan at May 31, 2014. |
| | |
| (b) | At May 31, 2014, the total market value of the Fund’s securities on loan was $17,818,154 and the total market value of the collateral held by the Fund was $18,725,793. |
| | |
| (c) | Interest rate shown reflects yield as of May 31, 2014. |
| | % of Long-Term |
| Country Breakdown | | | Investments |
| Canada | | | 100.0% |
| | % of Long-Term |
| Currency Denomination | | | Investments |
| Canadian Dollar | | | 100.0% |
| | | | |
| Subject to change daily. | | | |
| See notes to financial statements. |
| 30 | CLAYMORE EXCHANGE-TRADED FUND TRUST 2 ANNUAL REPORT |
| PORTFOLIO OF INVESTMENTS continued | May 31, 2014 |
TAO Guggenheim China Real Estate ETF
| Number | | | | | | |
| of Shares | | Description | | | Value | |
| | | Common Stocks - 98.3% | | | | |
| | | Diversified - 11.4% | | | | |
| 208,000 | | Goldin Properties Holdings Ltd.(a) | | $ | 119,387 | |
| 94,484 | | Swire Pacific Ltd., Class A | | | 1,123,018 | |
| 157,468 | | Swire Pacific Ltd., Class B | | | 355,031 | |
| 140,962 | | Wharf Holdings Ltd. | | | 998,177 | |
| | | | | | 2,595,613 | |
| | | | | | | |
| | | Financial - 86.9% | | | | |
| 211,962 | | Agile Property Holdings Ltd. | | | 164,037 | |
| 433,898 | | Champion Real Estate Investment Trust, REIT | | | 205,953 | |
| 73,284 | | Cheung Kong Holdings Ltd. | | | 1,309,158 | |
| 130,974 | | China Overseas Grand Oceans Group Ltd.(b) | | | 83,285 | |
| 378,163 | | China Overseas Land & Investment Ltd. | | | 985,289 | |
| 308,188 | | China Resources Land Ltd. | | | 624,092 | |
| 426,000 | | China South City Holdings Ltd.(b) | | | 207,699 | |
| 78,484 | | Chinese Estates Holdings Ltd.(b) | | | 201,855 | |
| 1,124,302 | | Country Garden Holdings Co. Ltd. | | | 472,752 | |
| 10,884 | | E-House China Holdings Ltd., ADR | | | 102,527 | |
| 921,194 | | Evergrande Real Estate Group Ltd.(b) | | | 407,548 | |
| 211,958 | | Fortune Real Estate Investment Trust, REIT (Singapore) | | | 186,725 | |
| 433,888 | | Franshion Properties China Ltd. | | | 129,837 | |
| 410,900 | | Glorious Property Holdings Ltd.(a) | | | 60,949 | |
| 50,990 | | Great Eagle Holdings Ltd. | | | 181,850 | |
| 70,974 | | Greentown China Holdings Ltd.(b) | | | 69,391 | |
| 166,362 | | Guangzhou R&F Properties Co. Ltd. | | | 228,741 | |
| 139,972 | | Hang Lung Group Ltd. | | | 788,058 | |
| 342,942 | | Hang Lung Properties Ltd. | | | 1,088,150 | |
| 190,659 | | Henderson Land Development Co. Ltd. | | | 1,241,886 | |
| 194,000 | | Hongkong Land Holdings Ltd. | | | 1,361,880 | |
| 102,976 | | Hopewell Holdings Ltd. | | | 357,954 | |
| 135,984 | | Hopson Development Holdings Ltd.(a) | | | 126,812 | |
| 115,976 | | Hysan Development Co. Ltd. | | | 567,692 | |
| 183,958 | | K Wah International Holdings Ltd. | | | 127,891 | |
| 306,930 | | Kaisa Group Holdings Ltd.(b) | | | 95,409 | |
| 120,972 | | Kerry Properties Ltd. | | | 397,885 | |
| 208,456 | | KWG Property Holding Ltd. | | | 131,748 | |
| 207,956 | | Link Real Estate Investment Trust, REIT | | | 1,107,783 | |
| 195,956 | | Longfor Properties Co. Ltd. | | | 247,948 | |
| 483,514 | | New World China Land Ltd. | | | 402,255 | |
| 805,882 | | New World Development Co. Ltd. | | | 925,112 | |
| 322,932 | | Poly Property Group Co. Ltd. | | | 147,034 | |
| 1,759,620 | | Renhe Commercial Holdings Co. Ltd.(a) (b) | | | 91,919 | |
| 357,930 | | Shenzhen Investment Ltd. | | | 117,264 | |
| 204,958 | | Shimao Property Holdings Ltd. | | | 412,932 | |
| 608,172 | | Shui On Land Ltd. | | | 158,457 | |
| 559,304 | | Sino Land Co. Ltd. | | | 867,132 | |
| 648,374 | | Sino-Ocean Land Holdings Ltd. | | | 341,208 | |
| 277,936 | | SOHO China Ltd. | | | 218,321 | |
| 81,984 | | Sun Hung Kai Properties Ltd. | | | 1,120,903 | |
| 288,731 | | Sunac China Holdings Ltd. | | | 148,966 | |
| 173,419 | | Swire Properties Ltd. | | | 541,309 | |
| 115,968 | | Tian An China Investment Co. Ltd. | | | 90,795 | |
| 133,972 | | Wheelock & Co. Ltd. | | | 541,732 | |
| 94,000 | | Yanlord Land Group Ltd. (Singapore) | | | 87,728 | |
| 841,832 | | Yuexiu Property Co. Ltd. | | | 167,217 | |
| 297,942 | | Yuexiu Real Estate Investment Trust, REIT | | | 142,189 | |
| | | | | | 19,785,257 | |
| | | | | | | |
| | | Total Common Stocks - 98.3% | | | | |
| | | (Cost $25,991,412) | | | 22,380,870 | |
| | | | | | | |
| | | Investments of Collateral for | | | | |
| | | Securities Loaned - 4.0% | | | | |
| 921,690 | | BNY Mellon Securities Lending Overnight | | | | |
| | | Fund, 0.1251%(c) (d) | | | | |
| | | (Cost $921,690) | | | 921,690 | |
| | | | | | | |
| | | Total Investments - 102.3% | | | | |
| | | (Cost $26,913,102) | | | 23,302,560 | |
| | | Liabilities in excess of Other Assets - (2.3%) | | | (524,230 | ) |
| | | Net Assets - 100.0% | | $ | 22,778,330 | |
ADR - American Depositary Receipt
REIT - Real Estate Investment Trust
| (a) | Non-income producing security. |
| | |
| (b) | Security, or portion thereof, was on loan at May 31, 2014. |
| | |
| (c) | At May 31, 2014, the total market value of the Fund’s securities on loan was $830,116 and the total market value of the collateral held by the Fund was $921,690. |
| | |
| (d) | Interest rate shown reflects yield as of May 31, 2014. |
| | |
| | Securities are classified by sectors that represent broad groupings of related industries. |
| See notes to financial statements. |
| CLAYMORE EXCHANGE-TRADED FUND TRUST 2 ANNUAL REPORT | 31 |
| PORTFOLIO OF INVESTMENTS continued | May 31, 2014 |
TAO Guggenheim China Real Estate ETF continued
| | % of Long-Term |
| Country Breakdown | | Investments |
| China | | 98.8 | % |
| Singapore | | 1.2 | % |
| | % of Long-Term |
| Currency Denomination | | Investments |
| Hong Kong Dollar | | 93.1 | % |
| United States Dollar | | 6.5 | % |
| Singapore Dollar | | 0.4 | % |
| | | | |
| Subject to change daily. | | | |
| See notes to financial statements. |
| 32 | CLAYMORE EXCHANGE-TRADED FUND TRUST 2 ANNUAL REPORT |
| PORTFOLIO OF INVESTMENTS continued | May 31, 2014 |
HAO Guggenheim China Small Cap ETF
| Number | | | | | | |
| of Shares | | Description | | | Value | |
| | | Long-Term Investments - 99.4% | | | | |
| | | Common Stocks - 99.4% | | | | |
| | | Basic Materials - 9.5% | | | | |
| 4,704,000 | | Aluminum Corp. of China Ltd.(a) (b) | | $ | 1,680,661 | |
| 1,289,965 | | Angang Steel Co. Ltd.(a) | | | 712,122 | |
| 493,508 | | Billion Industrial Holdings Ltd. | | | 204,330 | |
| 2,121,965 | | China BlueChemical Ltd. | | | 1,135,846 | |
| 1,052,016 | | China Hongqiao Group Ltd. | | | 742,237 | |
| 4,811,917 | | China Lumena New Materials Corp.(a) (c) (d) | | | 583,417 | |
| 1,574,965 | | China Molybdenum Co. Ltd. | | | 733,350 | |
| 4,515,936 | | China Precious Metal Resources Holdings Co. Ltd.(b) | | | 483,458 | |
| 611,000 | | China Sanjiang Fine Chemicals Co. Ltd. | | | 258,493 | |
| 1,243,965 | | Dongyue Group Ltd.(a) | | | 516,651 | |
| 1,083,968 | | Fufeng Group Ltd. | | | 404,061 | |
| 2,368,962 | | Huabao International Holdings Ltd. | | | 1,103,058 | |
| 1,939,965 | | Hunan Nonferrous Metal Corp. Ltd.(a) (b) | | | 575,512 | |
| 2,579,965 | | Lee & Man Paper Manufacturing Ltd. | | | 1,284,500 | |
| 2,083,962 | | Maanshan Iron & Steel Co. Ltd.(b) | | | 427,386 | |
| 1,771,965 | | MMG Ltd. (Australia)(a) | | | 447,965 | |
| 1,991,965 | | Nine Dragons Paper Holdings Ltd. | | | 1,294,927 | |
| 10,199,586 | | North Mining Shares Co. Ltd.(a) (b) | | | 473,607 | |
| 5,109,905 | | Shougang Concord International Enterprises Co. Ltd.(b) | | | 220,796 | |
| 2,119,965 | | Sinofert Holdings Ltd. | | | 257,033 | |
| 4,177,914 | | Sinopec Shanghai Petrochemical Co. Ltd. | | | 1,029,262 | |
| 2,509,947 | | Sinopec Yizheng Chemical Fibre Co. Ltd.(a) (b) (c) (d) | | | 573,021 | |
| 1,454,000 | | Tiangong International Co. Ltd.(a) | | | 262,558 | |
| 1,084,895 | | Xingda International Holdings Ltd. | | | 429,595 | |
| 1,243,965 | | Yingde Gases Group Co. Ltd. | | | 1,360,621 | |
| 344,000 | | Yip’s Chemical Holdings Ltd. | | | 244,480 | |
| 1,045,468 | | Zhaojin Mining Industry Co. Ltd.(a) | | | 566,361 | |
| 7,104,000 | | Zijin Mining Group Co. Ltd.(a) | | | 1,640,170 | |
| | | | | | 19,645,478 | |
| | | | | | | |
| | | Communications - 9.1% | | | | |
| 60,504 | | 21Vianet Group, Inc., ADR(a) (b) | | | 1,631,188 | |
| 125,000 | | Asia Satellite Telecommunications Holdings Ltd. | | | 504,647 | |
| 21,733 | | Bitauto Holdings Ltd., ADR(b) | | | 904,962 | |
| 715,500 | | BYD Electronic International Co. Ltd. | | | 468,820 | |
| 892,000 | | China All Access Holdings Ltd.(a) | | | 375,073 | |
| 2,835,937 | | China Communications Services Corp. Ltd. | | | 1,346,100 | |
| 1,587,000 | | CITIC Telecom International Holdings Ltd. | | | 552,680 | |
| 970,868 | | Comba Telecom Systems Holdings Ltd.(a) (b) | | | 270,487 | |
| 3,063,930 | | Coolpad Group Ltd. | | | 750,871 | |
| 64,235 | | E-Commerce China Dangdang, Inc., ADR(a) (b) | | | 643,635 | |
| 128,348 | | Giant Interactive Group, Inc., ADR | | | 1,509,372 | |
| 40,255 | | Perfect World Co. Ltd., ADR | | | 745,523 | |
| 39,210 | | Phoenix New Media Ltd., ADR(a) (b) | | | 387,787 | |
| 145,239 | | Renren, Inc., ADR(a) (b) | | | 490,908 | |
| 98,885 | | SouFun Holdings Ltd., ADR | | | 1,183,653 | |
| 703,000 | | TCL Communication Technology Holdings Ltd. | | | 790,687 | |
| 20,380 | | Vipshop Holdings Ltd., ADR(a) (b) | | | 3,315,011 | |
| 3,499,336 | | VODone Ltd.(a) (b) | | | 365,598 | |
| 16,332 | | YY, Inc., ADR(a) (b) | | | 1,063,377 | |
| 751,702 | | ZTE Corp. | | | 1,450,475 | |
| | | | | | 18,750,854 | |
| | | | | | | |
| | | Consumer, Cyclical - 15.6% | | | | |
| 724,005 | | 361 Degrees International Ltd.(a) | | | 161,555 | |
| 2,457,940 | | Air China Ltd. | | | 1,404,456 | |
| 665,005 | | Ajisen China Holdings Ltd. | | | 531,801 | |
| 917,972 | | Anta Sports Products Ltd. | | | 1,349,793 | |
| 879,932 | | Baoxin Auto Group Ltd. | | | 732,052 | |
| 3,455,933 | | Bosideng International Holdings Ltd. | | | 575,027 | |
| 3,963,936 | | China Dongxiang Group Co. | | | 700,455 | |
| 2,235,965 | | China Eastern Airlines Corp. Ltd.(b) | | | 677,744 | |
| 645,000 | | China Lilang Ltd. | | | 415,139 | |
| 22,499 | | China Lodging Group Ltd., ADR(b) | | | 564,725 | |
| 2,073,965 | | China Southern Airlines Co. Ltd. | | | 596,540 | |
| 2,875,937 | | China Travel International Investment Hong Kong Ltd. | | | 578,678 | |
| 495,460 | | China Yongda Automobiles Services Holdings Ltd. | | | 446,703 | |
| 1,000,968 | | China ZhengTong Auto Services Holdings Ltd. | | | 517,723 | |
| 6,320,000 | | ChinaVision Media Group Ltd.(b) | | | 1,491,768 | |
| 955,968 | | Dah Chong Hong Holdings Ltd. | | | 610,354 | |
| 1,112,008 | | Digital China Holdings Ltd.(c) (d) | | | 988,522 | |
| 627,983 | | Golden Eagle Retail Group Ltd. | | | 767,063 | |
| 12,672,727 | | GOME Electrical Appliances Holding Ltd. | | | 2,124,939 | |
| 2,453,543 | | Hengdeli Holdings Ltd.(a) | | | 455,711 | |
| 518,000 | | Hisense Kelon Electrical Holdings Co. Ltd.(b) | | | 587,957 | |
| 26,213 | | Home Inns & Hotels Management, Inc., ADR(a) (b) | | | 825,972 | |
| 1,198,465 | | Intime Retail Group Co. Ltd. | | | 1,164,001 | |
| 1,094,968 | | LI Ning Co. Ltd.(a) (b) | | | 771,129 | |
| 1,189,965 | | Maoye International Holdings Ltd. | | | 167,299 | |
| 793,968 | | Minth Group Ltd. | | | 1,378,418 | |
| 1,163,895 | | Newocean Energy Holdings Ltd.(a) | | | 776,135 | |
| 1,613,965 | | Parkson Retail Group Ltd. | | | 476,719 | |
| 379,000 | | Ports Design Ltd. | | | 170,607 | |
| 1,493,965 | | Qingling Motors Co. Ltd. | | | 462,471 | |
| 8,649,845 | | REXLot Holdings Ltd.(a) | | | 948,332 | |
| 766,872 | | Shanghai Pharmaceuticals Holding Co. Ltd. | | | 1,442,160 | |
| 537,038 | | Shenzhou International Group Holdings Ltd. | | | 1,873,723 | |
| 792,476 | | Sinotruk Hong Kong Ltd. | | | 408,864 | |
| 2,289,945 | | Skyworth Digital Holdings Ltd.(a) | | | 1,092,848 | |
| 1,255,019 | | Springland International Holdings Ltd. | | | 524,479 | |
| 606,000 | | TCL Multimedia Technology Holdings Ltd.(b) | | | 202,444 | |
| 494,500 | | Weiqiao Textile Co. | | | 278,728 | |
| See notes to financial statements. |
| CLAYMORE EXCHANGE-TRADED FUND TRUST 2 ANNUAL REPORT | 33 |
| PORTFOLIO OF INVESTMENTS continued | May 31, 2014 |
HAO Guggenheim China Small Cap ETF continued
| Number | | | | | | |
| of Shares | | Description | | | Value | |
| | | Consumer, Cyclical continued | | | | |
| 1,060,000 | | Welling Holding Ltd. | | $ | 354,110 | |
| 947,000 | | Xinchen China Power Holdings Ltd.(b) | | | 526,454 | |
| 534,000 | | Xinhua Winshare Publishing and Media Co. Ltd. | | | 343,696 | |
| 781,500 | | XTEP International Holdings Ltd. | | | 332,641 | |
| 1,063,000 | | Ying LI International Real Estate Ltd. (Singapore)(b) | | | 258,617 | |
| 874,500 | | Zhongsheng Group Holdings Ltd.(a) | | | 1,096,375 | |
| | | | | | 32,154,927 | |
| | | | | | | |
| | | Consumer, Non-cyclical - 15.8% | | | | |
| 11,456 | | 51job, Inc., ADR(a) (b) | | | 714,052 | |
| 580,000 | | Anhui Expressway Co. Ltd. | | | 332,906 | |
| 2,891,938 | | Anxin-China Holdings Ltd.(a) | | | 395,392 | |
| 1,078,972 | | Asian Citrus Holdings Ltd. | | | 246,329 | |
| 183,551 | | Biostime International Holdings Ltd. | | | 1,238,202 | |
| 335,000 | | Changshouhua Food Co. Ltd. | | | 349,564 | |
| 2,633,938 | | China Agri-Industries Holdings Ltd. | | | 1,087,148 | |
| 852,000 | | China Foods Ltd.(b) | | | 305,504 | |
| 1,212,968 | | China Huiyuan Juice Group Ltd.(b) | | | 674,310 | |
| 1,260,003 | | China Medical System Holdings Ltd.(a) | | | 1,482,175 | |
| 430,000 | | China Minzhong Food Corp. Ltd.(a) | | | 303,554 | |
| 4,030,024 | | China Modern Dairy Holdings Ltd.(a) (b) | | | 1,663,377 | |
| 1,663,976 | | China Pharmaceutical Group Ltd. | | | 1,311,358 | |
| 368,000 | | China Shineway Pharmaceutical Group Ltd. | | | 674,014 | |
| 1,600,965 | | China Yurun Food Group Ltd.(a) (b) | | | 726,871 | |
| 8,875,856 | | CP Pokphand Co. Ltd. | | | 950,214 | |
| 1,153,968 | | Dalian Port PDA Co. Ltd. | | | 258,986 | |
| 2,697,953 | | Global Bio-Chem Technology Group Co. Ltd.(b) | | | 97,437 | |
| 882,899 | | Goodbaby International Holdings Ltd. | | | 454,378 | |
| 256,000 | | Guangzhou Baiyunshan Pharmaceutical Holdings Co. Ltd. | | | 790,822 | |
| 1,681,014 | | Hua Han Bio-Pharmaceutical Holdings Ltd.(a) | | | 325,234 | |
| 1,469,965 | | Jiangsu Expressway Co. Ltd. | | | 1,765,183 | |
| 528,000 | | Labixiaoxin Snacks Group Ltd.(b) (c) (d) | | | 153,232 | |
| 1,283,889 | | Lijun International Pharmaceutical Holding Co. Ltd. | | | 518,328 | |
| 429,029 | | Microport Scientific Corp. | | | 293,842 | |
| 624,000 | | Prince Frog International Holdings Ltd. | | | 161,776 | |
| 961,972 | | Real Nutriceutical Group Ltd. | | | 207,211 | |
| 392,000 | | Shanghai Fosun Pharmaceutical Group Co. Ltd. | | | 1,456,168 | |
| 1,397,965 | | Shenguan Holdings Group Ltd.(a) | | | 604,052 | |
| 875,976 | | Shenzhen Expressway Co. Ltd. | | | 420,308 | |
| 1,029,731 | | Shenzhen International Holdings Ltd. | | | 1,224,582 | |
| 1,069,968 | | Sichuan Expressway Co. Ltd. | | | 332,599 | |
| 2,909,988 | | Sihuan Pharmaceutical Holdings Group Ltd. | | | 3,468,137 | |
| 40,712 | | TAL Education Group, ADR(a) (b) | | | 935,969 | |
| 782,937 | | Tenfu Cayman Holdings Co. Ltd. | | | 343,351 | |
| 1,469,006 | | Tibet 5100 Water Resources Holdings Ltd.(a) | | | 557,062 | |
| 345,000 | | Tong Ren Tang Technologies Co. Ltd. | | | 978,982 | |
| 1,543,968 | | Uni-President China Holdings Ltd. | | | 1,198,858 | |
| 743,993 | | United Laboratories International Holdings Ltd.(a) (b) | | | 460,620 | |
| 318,000 | | Vinda International Holdings Ltd.(a) | | | 492,200 | |
| 637,483 | | Wumart Stores, Inc.(a) | | | 569,816 | |
| 844,000 | | Yuexiu Transport Infrastructure Ltd. | | | 458,308 | |
| 1,713,965 | | Zhejiang Expressway Co. Ltd. | | | 1,697,838 | |
| | | | | | 32,680,249 | |
| | | | | | | |
| | | Diversified - 0.5% | | | | |
| 1,518,965 | | C C Land Holdings Ltd. | | | 289,963 | |
| 3,845,936 | | CITIC Resources Holdings Ltd.(b) | | | 649,840 | |
| | | | | | 939,803 | |
| | | | | | | |
| | | Energy - 4.9% | | | | |
| 1,215,890 | | Anton Oilfield Services Group(a) | | | 925,293 | |
| 2,061,918 | | Beijing Jingneng Clean Energy Co. Ltd. | | | 928,175 | |
| 1,621,029 | | China Suntien Green Energy Corp. Ltd. | | | 551,986 | |
| 678,000 | | CIMC Enric Holdings Ltd. | | | 967,203 | |
| 1,133,965 | | Hidili Industry International Development Ltd.(b) | | | 131,636 | |
| 760,000 | | Hilong Holding Ltd. | | | 450,925 | |
| 156,558 | | Inner Mongolia Yitai Coal Co. Ltd. | | | 210,011 | |
| 36,414 | | JA Solar Holdings Co. Ltd., ADR(a) (b) | | | 362,319 | |
| 23,505 | | JinkoSolar Holding Co. Ltd., ADR(a) (b) | | | 658,845 | |
| 1,226,027 | | MIE Holdings Corp. | | | 221,392 | |
| 88,165 | | ReneSola Ltd., ADR(a) (b) | | | 223,939 | |
| 3,907,770 | | Shougang Fushan Resources Group Ltd.(a) | | | 962,710 | |
| 1,169,900 | | Sinopec Kantons Holdings Ltd.(a) | | | 979,324 | |
| 1,123,895 | | SPT Energy Group, Inc.(a) | | | 684,228 | |
| 88,472 | | Trina Solar Ltd., ADR(a) (b) | | | 1,209,412 | |
| 4,515,905 | | United Energy Group Ltd.(b) | | | 675,672 | |
| | | | | | 10,143,070 | |
| | | | | | | |
| | | Financial - 15.3% | | | | |
| 1,521,965 | | Agile Property Holdings Ltd. | | | 1,177,847 | |
| 1,209,968 | | Beijing Capital Land Ltd. | | | 401,088 | |
| 1,858,000 | | China Aoyuan Property Group Ltd. | | | 282,788 | |
| 1,027,968 | | China Everbright Ltd. | | | 1,455,844 | |
| 424,500 | | China Galaxy Securities Co. Ltd. | | | 273,219 | |
| 946,968 | | China Overseas Grand Oceans Group Ltd.(a) | | | 602,165 | |
| 1,740,358 | | China SCE Property Holdings Ltd. | | | 374,876 | |
| 3,127,950 | | China South City Holdings Ltd.(a) | | | 1,525,052 | |
| 1,553,368 | | China Taiping Insurance Holdings Co. Ltd.(b) | | | 2,708,844 | |
| 2,995,023 | | Chongqing Rural Commercial Bank | | | 1,382,981 | |
| 2,464,000 | | CIFI Holdings Group Co. Ltd. | | | 460,831 | |
| 78,835 | | E-House China Holdings Ltd., ADR(a) | | | 742,626 | |
| 2,668,445 | | Fantasia Holdings Group Co. Ltd. | | | 299,441 | |
| 1,801,965 | | Far East Horizon Ltd. | | | 1,224,870 | |
| 3,179,916 | | Franshion Properties China Ltd. | | | 951,561 | |
| See notes to financial statements. |
| 34 | CLAYMORE EXCHANGE-TRADED FUND TRUST 2 ANNUAL REPORT |
| PORTFOLIO OF INVESTMENTS continued | May 31, 2014 |
HAO Guggenheim China Small Cap ETF continued
| Number | | | | | | |
| of Shares | | Description | | | Value | |
| | | Financial continued | | | | |
| 2,971,933 | | Glorious Property Holdings Ltd.(b) | | $ | 440,829 | |
| 517,483 | | Greentown China Holdings Ltd.(a) | | | 505,939 | |
| 1,212,365 | | Guangzhou R&F Properties Co. Ltd. | | | 1,666,954 | |
| 989,968 | | Hopson Development Holdings Ltd.(b) | | | 923,193 | |
| 2,244,965 | | Kaisa Group Holdings Ltd.(a) | | | 697,846 | |
| 1,531,465 | | KWG Property Holding Ltd. | | | 967,913 | |
| 1,896,968 | | Mingfa Group International Co. Ltd.(b) | | | 526,055 | |
| 20,941 | | Noah Holdings Ltd., ADR(a) (b) | | | 286,054 | |
| 2,327,948 | | Poly Property Group Co. Ltd. | | | 1,059,939 | |
| 1,210,965 | | Powerlong Real Estate Holdings Ltd.(b) | | | 168,690 | |
| 12,865,745 | | Renhe Commercial Holdings Co. Ltd.(a) (b) | | | 672,083 | |
| 560,998 | | Shanghai Industrial Holdings Ltd. | | | 1,733,005 | |
| 1,727,965 | | Shanghai Industrial Urban Development Group Ltd.(a) (b) | | | 334,318 | |
| 2,581,945 | | Shenzhen Investment Ltd. | | | 845,890 | |
| 4,413,412 | | Shui On Land Ltd. | | | 1,149,897 | |
| 2,014,965 | | SOHO China Ltd. | | | 1,582,770 | |
| 2,095,003 | | Sunac China Holdings Ltd.(a) | | | 1,080,880 | |
| 1,147,976 | | Wanda Commercial Properties Group Co. Ltd.(b) | | | 392,384 | |
| 68,377 | | Xinyuan Real Estate Co. Ltd., ADR(a) | | | 264,619 | |
| 675,000 | | Yanlord Land Group Ltd. (Singapore) | | | 629,961 | |
| 6,121,882 | | Yuexiu Property Co. Ltd. | | | 1,216,014 | |
| 2,564,000 | | Yuzhou Properties Co. Ltd. | | | 621,740 | |
| | | | | | 31,631,006 | |
| | | | | | | |
| | | Industrial - 18.0% | | | | |
| 518,000 | | Asia Cement China Holdings Corp. | | | 349,433 | |
| 2,891,928 | | AviChina Industry & Technology Co. Ltd. | | | 1,562,912 | |
| 1,391,965 | | BBMG Corp. | | | 938,994 | |
| 1,763,965 | | Beijing Capital International Airport Co. Ltd. | | | 1,210,416 | |
| 715,000 | | Chaowei Power Holdings Ltd. | | | 419,614 | |
| 2,253,951 | | China Aerospace International Holdings Ltd.(a) | | | 209,320 | |
| 3,074,937 | | China COSCO Holdings Co. Ltd.(a) (b) | | | 1,197,778 | |
| 821,000 | | China High Precision Automation Group Ltd.(b) (c) (d) | | | 54,430 | |
| 1,478,965 | | China High Speed Transmission Equipment Group Co. Ltd.(b) | | | 1,003,406 | |
| 716,500 | | China International Marine Containers Group Co. Ltd. | | | 1,273,498 | |
| 1,134,968 | | China Lesso Group Holdings Ltd. | | | 626,557 | |
| 890,000 | | China Machinery Engineering Corp. | | | 572,827 | |
| 1,403,965 | | China National Materials Co. Ltd. | | | 271,632 | |
| 2,083,965 | | China Resources Cement Holdings Ltd. | | | 1,314,414 | |
| 4,172,919 | | China Rongsheng Heavy Industries Group Holdings Ltd.(a) (b) | | | 877,325 | |
| 2,056,948 | | China Shanshui Cement Group Ltd. | | | 748,179 | |
| 4,466,912 | | China Shipping Container Lines Co. Ltd.(a) (b) | | | 1,077,412 | |
| 1,531,965 | | China Shipping Development Co. Ltd.(b) | | | 845,718 | |
| 513,946 | | China Singyes Solar Technologies Holdings Ltd. | | | 710,633 | |
| 950,000 | | China Water Affairs Group Ltd. | | | 310,011 | |
| 1,675,165 | | China Zhongwang Holdings Ltd. | | | 507,760 | |
| 687,988 | | Cosco International Holdings Ltd. | | | 283,077 | |
| 469,940 | | CPMC Holdings Ltd. | | | 378,840 | |
| 2,197,962 | | CSR Corp. Ltd. | | | 1,627,290 | |
| 406,200 | | Dongfang Electric Corp. Ltd. | | | 635,003 | |
| 494,000 | | First Tractor Co. Ltd. | | | 298,199 | |
| 673,042 | | Greatview Aseptic Packaging Co. Ltd. | | | 533,020 | |
| 1,713,965 | | Guangshen Railway Co. Ltd. | | | 647,743 | |
| 510,200 | | Guangzhou Shipyard International Co. Ltd.(c) (d) | | | 813,377 | |
| 753,988 | | Haitian International Holdings Ltd. | | | 1,653,280 | |
| 819,972 | | Harbin Electric Co. Ltd. | | | 488,623 | |
| 2,166,000 | | Hi Sun Technology China Ltd.(b) | | | 676,094 | |
| 1,238,968 | | Honghua Group Ltd.(a) | | | 292,445 | |
| 1,292,968 | | Kingboard Laminates Holdings Ltd. | | | 476,965 | |
| 2,253,923 | | Lonking Holdings Ltd. | | | 398,284 | |
| 3,259,933 | | Metallurgical Corp. of China Ltd.(b) | | | 613,896 | |
| 2,267,945 | | NVC Lighting Holdings Ltd. | | | 532,399 | |
| 935,968 | | Sany Heavy Equipment International Holdings Co. Ltd. | | | 211,267 | |
| 3,369,933 | | Shanghai Electric Group Co. Ltd. | | | 1,217,061 | |
| 1,726,965 | | Sinotrans Ltd. | | | 971,187 | |
| 1,524,465 | | Sinotrans Shipping Ltd.(b) | | | 420,789 | |
| 1,396,882 | | SITC International Holdings Co. Ltd. | | | 610,791 | |
| 313,960 | | SOCAM Development Ltd. | | | 361,625 | |
| 752,946 | | Sunny Optical Technology Group Co. Ltd. | | | 903,191 | |
| 1,120,000 | | Tech Pro Technology Development Ltd.(b) | | | 557,620 | |
| 1,843,965 | | Tianjin Port Development Holdings Ltd. | | | 287,787 | |
| 830,005 | | Tianneng Power International Ltd. | | | 292,265 | |
| 519,978 | | Wasion Group Holdings Ltd. | | | 368,206 | |
| 2,978,010 | | West China Cement Ltd. | | | 295,767 | |
| 507,229 | | Xinjiang Goldwind Science & Technology Co. Ltd. | | | 571,806 | |
| 148,223 | | Yingli Green Energy Holding Co. Ltd., ADR(a) (b) | | | 500,994 | |
| 2,585,996 | | Yuanda China Holdings Ltd. | | | 230,149 | |
| 590,024 | | Zhuzhou CSR Times Electric Co. Ltd. | | | 1,735,152 | |
| 1,704,800 | | Zoomlion Heavy Industry Science and Technology Co. Ltd. | | | 1,134,635 | |
| | | | | | 37,101,096 | |
| | | | | | | |
| | | Technology - 7.2% | | | | |
| 31,325 | | AutoNavi Holdings Ltd., ADR(b) | | | 652,500 | |
| 12,805 | | Changyou.com Ltd., ADR(a) (b) | | | 345,735 | |
| 445 | | Cheetah Mobile, Inc., ADR(b) | | | 7,907 | |
| 1,250,000 | | China ITS Holdings Co. Ltd. | | | 233,782 | |
| 1,346,021 | | Chinasoft International Ltd.(b) | | | 420,146 | |
| 17,395,726 | | Hanergy Solar Group Ltd.(a) | | | 2,535,444 | |
| 1,047,968 | | Ju Teng International Holdings Ltd. | | | 798,856 | |
| 1,733,965 | | Kingdee International Software Group Co. Ltd.(a) (b) | | | 568,077 | |
| 893,972 | | Kingsoft Corp. Ltd.(a) | | | 2,703,957 | |
| 306,460 | | NetDragon Websoft, Inc.(a) | | | 551,813 | |
| 37,061 | | NQ Mobile, Inc., ADR(a) (b) | | | 281,293 | |
| 29,892 | | RDA Microelectronics, Inc., ADR(a) | | | 506,072 | |
| See notes to financial statements. |
| CLAYMORE EXCHANGE-TRADED FUND TRUST 2 ANNUAL REPORT | 35 |
| PORTFOLIO OF INVESTMENTS continued | May 31, 2014 |
HAO Guggenheim China Small Cap ETF continued
| Number | | | | | | |
| of Shares | | Description | | | Value | |
| | | Technology continued | | | | |
| 26,848,455 | | Semiconductor Manufacturing International Corp.(a) (b) | $ | | 2,285,579 | |
| 78,599 | | Shanda Games Ltd., ADR(b) | | | 524,255 | |
| 962,000 | | Shunfeng Photovoltaic International Ltd.(b) | | | 1,312,785 | |
| 1,079,968 | | TPV Technology Ltd. | | | 197,803 | |
| 1,106,468 | | Travelsky Technology Ltd. | | | 941,924 | |
| | | | | | 14,867,928 | |
| | | | | | | |
| | | Utilities - 3.5% | | | | |
| 2,976,027 | | China Datang Corp. Renewable Power Co. Ltd. | | | 418,404 | |
| 4,799,877 | | China Oil & Gas Group Ltd. | | | 804,834 | |
| 2,923,945 | | China Power International Development Ltd.(a) | | | 1,033,363 | |
| 5,039,640 | | China Power New Energy Development Co. Ltd.(b) | | | 312,014 | |
| 7,520,000 | | China WindPower Group Ltd.(b) | | | 562,573 | |
| 3,945,919 | | Datang International Power Generation Co. Ltd. | | | 1,531,961 | |
| 1,709,965 | | Huadian Power International Corp. Ltd. | | | 961,627 | |
| 3,706,023 | | Huaneng Renewables Corp. Ltd. | | | 1,218,937 | |
| 500,000 | | Tianjin Development Holdings Ltd. | | | 406,297 | |
| | | | | | 7,250,010 | |
| | | | | | | |
| | | Total Common Stocks - 99.4% | | | | |
| | | (Cost $241,437,367) | | | 205,164,421 | |
| | | | | | | |
| | | Right - 0.0%* | | | | |
| | | Consumer, Non-cyclical - 0.0%* | | | | |
| 256,393 | | Uni-President China Holdings Ltd. (b) (c) (d) | | | | |
| | | (Cost $0) | | | 48,283 | |
| | | | | | | |
| | | Total Long-Term Investments - 99.4% | | | | |
| | | (Cost $241,437,367) | | | 205,212,704 | |
| | | | | | | |
| | | Investments of Collateral for | | | | |
| | | Securities Loaned - 16.5% | | | | |
| 34,081,191 | | BNY Mellon Securities Lending Overnight | | | | |
| | | Fund, 0.1251%(e) (f) | | | | |
| | | (Cost $34,081,191) | | | 34,081,191 | |
| | | | | | | |
| | | Total Investments - 115.9% | | | | |
| | | (Cost $275,518,558) | | | 239,293,895 | |
| | | Liabilities in excess of Other Assets - (15.9%) | | | (32,872,476 | ) |
| | | Net Assets - 100.0% | | | $ 206,421,419 | |
ADR - American Depositary Receipt
| * | Less than 0.1% |
| | |
| (a) | Security, or portion thereof, was on loan at May 31, 2014. |
| | |
| (b) | Non-income producing security. |
| | |
| (c) | Security is valued in accordance with Fair Valuation procedures established in good faith by management and approved by the Board of Trustees. The total market value of such securities is $3,214,282 which represents 1.6% of net assets. |
| | |
| (d) | Illiquid security. |
| | |
| (e) | At May 31, 2014, the total market value of the Fund’s securities on loan was $30,709,904 and the total market value of the collateral held by the Fund was $34,081,191. |
| | |
| (f) | Interest rate shown reflects yield as of May 31, 2014. |
| | % of Long-Term |
| Country Breakdown | | Investments |
| China | | 99.4 | % |
| Singapore | | 0.4 | % |
| Australia | | 0.2 | % |
| | % of Long-Term |
| Currency Denomination | | Investments |
| Hong Kong Dollar | | 94.9 | % |
| United States Dollar | | 4.5 | % |
| Singapore Dollar | | 0.6 | % |
| | | | |
| Subject to change daily. | | | |
| See notes to financial statements. |
| 36 | CLAYMORE EXCHANGE-TRADED FUND TRUST 2 ANNUAL REPORT |
| PORTFOLIO OF INVESTMENTS continued | May 31, 2014 |
FRN Guggenheim Frontier Markets ETF
| Number | | | | | | |
| of Shares | | Description | | | Value | |
| | | Long-Term Investments - 99.1% | | | | |
| | | Common Stocks - 86.6% | | | | |
| | | Argentina - 13.6% | | | | |
| 41,241 | | Banco Macro SA, ADR(a) | | $ | 1,304,453 | |
| 61,996 | | BBVA Banco Frances SA, ADR(a) | | | 595,162 | |
| 43,531 | | Cresud SACIF y A, ADR | | | 546,749 | |
| 110,706 | | Grupo Financiero Galicia SA, ADR | | | 1,503,387 | |
| 30,231 | | IRSA Inversiones y Representaciones SA, ADR | | | 473,115 | |
| 91,591 | | Petrobras Argentina SA, ADR(a) | | | 517,489 | |
| 46,643 | | Telecom Argentina SA, ADR | | | 1,008,888 | |
| 201,903 | | YPF SA, ADR | | | 6,032,862 | |
| | | | | | 11,982,105 | |
| | | | | | | |
| | | Chile - 36.6% | | | | |
| 42,223 | | Banco de Chile, ADR(b) | | | 3,391,351 | |
| 167,024 | | Banco Santander Chile, ADR | | | 4,192,302 | |
| 395,836 | | Cencosud SA, ADR(b) | | | 4,183,986 | |
| 70,569 | | Cia Cervecerias Unidas SA, ADR | | | 1,662,606 | |
| 127,006 | | Corpbanca SA, ADR(b) | | | 2,288,648 | |
| 90,321 | | Empresa Nacional de Electricidad SA, ADR(b) | | | 3,982,253 | |
| 401,203 | | Enersis SA, ADR | | | 6,499,489 | |
| 344,233 | | Latam Airlines Group SA, ADR(a) (b) | | | 4,970,725 | |
| 24,731 | | Vina Concha y Toro SA, ADR(b) | | | 1,005,562 | |
| | | | | | 32,176,922 | |
| | | | | | | |
| | | Colombia - 9.2% | | | | |
| 221,976 | | Ecopetrol SA, ADR(b) | | | 8,104,344 | |
| | | | | | | |
| | | Egypt - 7.5% | | | | |
| 939,377 | | Commercial International Bank Egypt SAE, GDR | | | 4,509,009 | |
| 559,916 | | Global Telecom Holding, GDR(a) | | | 2,054,892 | |
| | | | | | 6,563,901 | |
| | | | | | | |
| | | Kazakhstan - 5.2% | | | | |
| 105,588 | | Halyk Savings Bank of Kazakhstan JSC, GDR | | | 1,125,568 | |
| 179,637 | | KazMunaiGas Exploration Production JSC, GDR | | | 2,527,493 | |
| 60,031 | | KCell JSC, GDR | | | 935,883 | |
| | | | | | 4,588,944 | |
| | | | | | | |
| | | Lebanon - 1.8% | | | | |
| 118,470 | | Solidere, GDR(a) | | | 1,599,345 | |
| | | | | | | |
| | | Netherlands - 1.1% | | | | |
| 72,443 | | Nostrum Oil & Gas, LP, GDR(b) | | | 933,790 | |
| | | | | | | |
| | | Nigeria - 4.8% | | | | |
| 469,942 | | Guaranty Trust Bank PLC, GDR | | | 4,271,773 | |
| | | | | | | |
| | | Peru - 5.1% | | | | |
| 60,194 | | Cementos Pacasmayo SAA, ADR(b) | | | 546,562 | |
| 200,958 | | Cia de Minas Buenaventura SAA, ADR | | | 2,148,241 | |
| 106,043 | | Grana y Montero SA, ADR(b) | | | 1,770,918 | |
| | | | | | 4,465,721 | |
| | | | | | | |
| | | Romania - 0.9% | | | | |
| 70,743 | | Societatea Nationala de Gaze Naturale ROMGAZ SA, GDR(b) | | | 760,487 | |
| | | | | | | |
| | | Ukraine - 0.8% | | | | |
| 27,320 | | Avangardco Investments Public Ltd., GDR(a) | | | 245,880 | |
| 32,449 | | MHP SA, GDR | | | 478,623 | |
| | | | | | 724,503 | |
| | | | | | | |
| | | Total Common Stocks - 86.6% | | | | |
| | | (Cost $88,302,092) | | | 76,171,835 | |
| | | | | | | |
| | | Preferred Stocks - 12.5% | | | | |
| | | Chile - 4.6% | | | | |
| 38,924 | | Embotelladora Andina SA, Class B, ADR(b) | | | 982,053 | |
| 101,456 | | Sociedad Quimica y Minera de Chile SA, ADR | | | 3,068,029 | |
| | | | | | 4,050,082 | |
| | | | | | | |
| | | Colombia - 7.5% | | | | |
| 118,572 | | Bancolombia SA, ADR(b) | | | 6,608,018 | |
| | | | | | | |
| | | Panama - 0.4% | | | | |
| 19,708 | | Avianca Holdings SA, ADR | | | 313,357 | |
| | | | | | | |
| | | Total Preferred Stocks - 12.5% | | | | |
| | | (Cost $13,460,710) | | | 10,971,457 | |
| | | | | | | |
| | | Total Long-Term Investments - 99.1% | | | | |
| | | (Cost $101,762,802) | | | 87,143,292 | |
| | | | | | | |
| | | Investments of Collateral for | | | | |
| | | Securities Loaned - 22.3% | | | | |
| 19,668,349 | | BNY Mellon Securities Lending Overnight Fund, | | | | |
| | | 0.1251%(c) (d) | | | | |
| | | (Cost $19,668,349) | | | 19,668,349 | |
| | | | | | | |
| | | Total Investments - 121.4% | | | | |
| | | (Cost $121,431,151) | | | 106,811,641 | |
| | | Liabilities in excess of Other Assets - (21.4%) | | | (18,841,517 | ) |
| | | Net Assets - 100.0% | | $ | 87,970,124 | |
| ADR - American Depositary Receipt |
| |
| GDR - Global Depositary Receipt |
| |
| JSC - Joint Stock Company |
| |
| LP - Limited Partnership |
| |
| PLC - Public Limited Company |
| |
| SA - Corporation |
| |
| SAA - Open Corporation |
| (a) | Non-income producing security. |
| | |
| (b) | Security, or portion thereof, was on loan at May 31, 2014. |
| | |
| (c) | At May 31, 2014, the total market value of the Fund’s securities on loan was $19,161,008 and the total market value of the collateral held by the Fund was $19,668,349. |
| | |
| (d) | Interest rate shown reflects yield as of May 31, 2014. |
| See notes to financial statements. |
| CLAYMORE EXCHANGE-TRADED FUND TRUST 2 ANNUAL REPORT | 37 |
| PORTFOLIO OF INVESTMENTS continued | May 31, 2014 |
FRN Guggenheim Frontier Markets ETF continued
| | % of Long-Term |
| Country Breakdown | | Investments |
| Chile | | 41.6 | % |
| Colombia | | 16.9 | % |
| Argentina | | 13.7 | % |
| Egypt | | 7.5 | % |
| Kazakhstan | | 5.3 | % |
| Peru | | 5.1 | % |
| Nigeria | | 4.9 | % |
| Lebanon | | 1.8 | % |
| Netherlands | | 1.1 | % |
| Romania | | 0.9 | % |
| Ukraine | | 0.8 | % |
| Panama | | 0.4 | % |
| | % of Long-Term |
| Currency Denomination | | Investments |
| United States Dollar | | 100.0 | % |
| | | | |
| Subject to change daily. | | | |
| See notes to financial statements. |
| 38 | CLAYMORE EXCHANGE-TRADED FUND TRUST 2 ANNUAL REPORT |
| PORTFOLIO OF INVESTMENTS continued | May 31, 2014 |
HGI Guggenheim International Multi-Asset Income ETF
| Number | | | | | | |
| of Shares | | Description | | | Value | |
| | | Long-Term Investments - 99.6% | | | | |
| | | Common Stocks - 84.7% | | | | |
| | | Argentina - 1.2% | | | | |
| 31,864 | | Cresud SACIF y A, ADR | | $ | 400,212 | |
| | | | | | | |
| | | Australia - 4.4% | | | | |
| 9,630 | | Australia & New Zealand Banking Group Ltd. | | | 300,159 | |
| 17,993 | | Coca-Cola Amatil Ltd. | | | 158,418 | |
| 2,717 | | CSL Ltd. | | | 178,502 | |
| 6,160 | | National Australia Bank Ltd. | | | 192,002 | |
| 44,500 | | Telstra Corp. Ltd. | | | 221,162 | |
| 6,500 | | Westpac Banking Corp. | | | 208,225 | |
| 13,581 | | WorleyParsons Ltd. | | | 202,996 | |
| | | | | | 1,461,464 | |
| | | | | | | |
| | | Austria - 0.8% | | | | |
| 8,127 | | Raiffeisen Bank International AG(a) | | | 272,474 | |
| | | | | | | |
| | | Belgium - 0.6% | | | | |
| 4,449 | | Ageas | | | 187,226 | |
| | | | | | | |
| | | Bermuda - 2.7% | | | | |
| 15,433 | | Cosan Ltd., Class A Shares | | | 192,912 | |
| 333,000 | | K Wah International Holdings Ltd. | | | 231,508 | |
| 31,000 | | Orient Overseas International Ltd. | | | 158,740 | |
| 567 | | Signet Jewelers Ltd. | | | 60,153 | |
| 221,000 | | SmarTone Telecommunications Holdings Ltd. | | | 253,412 | |
| | | | | | 896,725 | |
| | | | | | | |
| | | Brazil - 0.7% | | | | |
| 9,412 | | Ultrapar Participacoes SA, ADR | | | 227,206 | |
| | | | | | | |
| | | Canada - 3.5% | | | | |
| 9,756 | | Baytex Energy Corp.(a) | | | 407,605 | |
| 17,874 | | Enerplus Corp. | | | 405,561 | |
| 34,362 | | Talisman Energy, Inc. | | | 354,616 | |
| | | | | | 1,167,782 | |
| | | | | | | |
| | | Cayman Islands - 5.0% | | | | |
| 208,000 | | Agile Property Holdings Ltd. | | | 160,971 | |
| 80,000 | | China State Construction International Holdings Ltd. | | | 138,476 | |
| 12,000 | | Enn Energy Holdings Ltd. | | | 84,897 | |
| 345,000 | | Geely Automobile Holdings Ltd. | | | 129,048 | |
| 37,075 | | Giant Interactive Group, Inc., ADR | | | 436,002 | |
| 9,246 | | Himax Technologies, Inc., ADR | | | 61,301 | |
| 676,500 | | Hopewell Highway Infrastructure Ltd. | | | 335,067 | |
| 598,000 | | Hutchison Telecommunications Hong Kong Holdings Ltd.(a) | | | 222,140 | |
| 2,832 | | Mindray Medical International Ltd., ADR(a) | | | 87,877 | |
| | | | | | 1,655,779 | |
| | | | | | | |
| | | Chile - 2.2% | | | | |
| 4,192 | | Banco de Chile, ADR | | | 336,701 | |
| 6,818 | | Cia Cervecerias Unidas SA, ADR | | | 160,632 | |
| 15,420 | | Enersis SA, ADR | | | 249,804 | |
| | | | | | 747,137 | |
| | | | | | | |
| | | China - 2.9% | | | | |
| 3,496 | | China Petroleum & Chemical Corp., ADR(a) | | | 315,689 | |
| 3,616 | | China Telecom Corp. Ltd., ADR | | | 183,331 | |
| 6,811 | | Huaneng Power International, Inc., ADR(a) | | | 288,855 | |
| 191,000 | | Travelsky Technology Ltd. | | | 162,596 | |
| | | | | | 950,471 | |
| | | | | | | |
| | | Colombia - 1.8% | | | | |
| 16,512 | | Ecopetrol SA, ADR(a) | | | 602,853 | |
| | | | | | | |
| | | Denmark - 0.3% | | | | |
| 2,476 | | NOVO Nordisk A/S | | | 104,937 | |
| | | | | | | |
| | | Finland - 0.8% | | | | |
| 7,157 | | Metso OYJ(a) | | | 278,529 | |
| | | | | | | |
| | | France - 6.1% | | | | |
| 1,575 | | Air Liquide SA | | | 229,638 | |
| 1,899 | | Arkema SA | | | 194,372 | |
| 2,370 | | BNP Paribas SA | | | 166,130 | |
| 1,871 | | CIE Generale des Etablissements Michelin | | | 230,798 | |
| 637 | | Dassault Systemes SA | | | 80,872 | |
| 7,679 | | GDF Suez | | | 214,650 | |
| 1,654 | | Lafarge SA | | | 143,024 | |
| 941 | | L’Oreal SA | | | 164,357 | |
| 2,283 | | Publicis Groupe SA(b) | | | 197,134 | |
| 2,536 | | Safran SA(a) | | | 172,281 | |
| 9,225 | | Vivendi SA(b) | | | 242,193 | |
| | | | | | 2,035,449 | |
| | | | | | | |
| | | Germany - 5.4% | | | | |
| 1,040 | | Adidas AG | | | 111,743 | |
| 1,055 | | Bayer AG | | | 152,742 | |
| 432 | | Continental AG | | | 102,246 | |
| 11,277 | | Deutsche Telekom AG | | | 189,658 | |
| 10,200 | | E.ON AG | | | 198,825 | |
| 4,006 | | Hannover Rueckversicherung AG | | | 356,627 | |
| 946 | | Henkel AG & Co. KGaA | | | 96,027 | |
| 1,895 | | MTU Aero Engines AG | | | 176,819 | |
| 4,221 | | RWE AG | | | 169,625 | |
| 1,422 | | SAP AG | | | 108,972 | |
| 561 | | Volkswagen AG(a) | | | 147,935 | |
| | | | | | 1,811,219 | |
| | | | | | | |
| | | Hong Kong - 8.3% | | | | |
| 128,000 | | China Resources Power Holdings Co. Ltd. | | | 335,975 | |
| 110,000 | | China Unicom Hong Kong Ltd. | | | 164,582 | |
| 285,000 | | CNOOC Ltd. | | | 488,911 | |
| 131,000 | | Hang Lung Properties Ltd. | | | 415,661 | |
| 41,000 | | Henderson Land Development Co. Ltd. | | | 267,060 | |
| 20,000 | | Hutchison Whampoa Ltd. | | | 268,285 | |
| 230,000 | | Lenovo Group Ltd. | | | 284,795 | |
| 360,000 | | PCCW Ltd. | | | 196,880 | |
| See notes to financial statements. |
| CLAYMORE EXCHANGE-TRADED FUND TRUST 2 ANNUAL REPORT | 39 |
| PORTFOLIO OF INVESTMENTS continued | May 31, 2014 |
HGI Guggenheim International Multi-Asset Income ETF continued
| Number | | | | | | |
| of Shares | | Description | | | Value | |
| | | Hong Kong continued | | | | |
| 320,000 | | Shun Tak Holdings Ltd. | | $ | 152,716 | |
| 28,900 | | Television Broadcasts Ltd. | | | 182,094 | |
| | | | | | 2,756,959 | |
| | | | | | | |
| | | India - 1.0% | | | | |
| 1,704 | | HDFC Bank Ltd., ADR | | | 76,731 | |
| 4,115 | | ICICI Bank Ltd., ADR | | | 204,392 | |
| 5,320 | | Wipro Ltd., ADR(a) | | | 59,265 | |
| | | | | | 340,388 | |
| | | | | | | |
| | | Indonesia - 0.8% | | | | |
| 6,075 | | Telekomunikasi Indonesia Persero TBK PT, ADR | | | 265,356 | |
| | | | | | | |
| | | Israel - 1.3% | | | | |
| 4,947 | | Delta-Galil Industries Ltd. | | | 150,134 | |
| 5,905 | | Teva Pharmaceutical Industries Ltd. | | | 296,015 | |
| | | | | | 446,149 | |
| | | | | | | |
| | | Italy - 0.6% | | | | |
| 7,139 | | ENI SpA(a) | | | 182,069 | |
| | | | | | | |
| | | Japan - 6.5% | | | | |
| 2,100 | | Bridgestone Corp. | | | 75,872 | |
| 25,100 | | Casio Computer Co. Ltd. | | | 334,272 | |
| 2,900 | | Denso Corp. | | | 132,908 | |
| 6,300 | | Honda Motor Co. Ltd. | | | 220,619 | |
| 31,000 | | Isuzu Motors Ltd. | | | 189,208 | |
| 5,800 | | Kyocera Corp. | | | 258,063 | |
| 31,600 | | Nomura Holdings, Inc. | | | 207,778 | |
| 11,700 | | Sekisui House Ltd. | | | 153,976 | |
| 9,300 | | Sumitomo Mitsui Financial Group, Inc. | | | 375,218 | |
| 4,100 | | Toyota Motor Corp. | | | 232,150 | |
| | | | | | 2,180,064 | |
| | | | | | | |
| | | Jersey - 1.0% | | | | |
| 80,459 | | Polyus Gold International Ltd.(a) (b) | | | 250,685 | |
| 565 | | Randgold Resources Ltd., ADR | | | 41,770 | |
| 687 | | Shire PLC | | | 39,341 | |
| | | | | | 331,796 | |
| | | | | | | |
| | | Mexico - 3.9% | | | | |
| 6,097 | | America Movil SAB de CV, Series L, ADR | | | 117,855 | |
| 1,646 | | Coca-Cola Femsa SAB de CV, ADR | | | 189,833 | |
| 2,971 | | Fomento Economico Mexicano SAB de CV, ADR | | | 282,275 | |
| 4,025 | | Grupo Aeroportuario del Sureste SAB de CV, ADR | | | 517,695 | |
| 2,170 | | Grupo Televisa SA, ADR | | | 73,346 | |
| 2,206 | | Industrias Bachoco SAB de CV, ADR | | | 113,808 | |
| | | | | | 1,294,812 | |
| | | | | | | |
| | | Netherlands - 0.6% | | | | |
| 2,608 | | AKZO Nobel NV | | | 195,660 | |
| | | | | | | |
| | | Russia - 1.3% | | | | |
| 23,940 | | Mobile Telesystems OJSC, ADR | | | 442,651 | |
| | | | | | | |
| | | Singapore - 1.4% | | | | |
| 110,000 | | CapitaLand Ltd. | | | 279,903 | |
| 23,000 | | City Developments Ltd. | | | 190,069 | |
| | | | | | 469,972 | |
| | | | | | | |
| | | South Africa - 0.8% | | | | |
| 4,794 | | Sasol Ltd., ADR | | | 269,854 | |
| | | | | | | |
| | | Spain - 1.3% | | | | |
| 27,928 | | Banco Santander SA | | | 286,733 | |
| 16,134 | | Bankinter SA | | | 127,999 | |
| | | | | | 414,732 | |
| | | | | | | |
| | | Sweden - 2.4% | | | | |
| 2,630 | | ASSA Abloy AB | | | 133,042 | |
| 8,706 | | Atlas Copco AB, Class A | | | 255,718 | |
| 5,873 | | Swedbank AB, Class A | | | 156,503 | |
| 21,510 | | Telefonaktiebolaget LM Ericsson | | | 257,455 | |
| | | | | | 802,718 | |
| | | | | | | |
| | | Switzerland - 1.7% | | | | |
| 753 | | Syngenta AG | | | 290,182 | |
| 4,171 | | UBS AG(b) | | | 83,891 | |
| 675 | | Zurich Insurance Group AG(b) | | | 202,889 | |
| | | | | | 576,962 | |
| | | | | | | |
| | | Taiwan - 0.6% | | | | |
| 9,185 | | Taiwan Semiconductor Manufacturing Co. Ltd., ADR | | | 188,844 | |
| | | | | | | |
| | | United Kingdom - 9.3% | | | | |
| 3,016 | | ARM Holdings PLC | | | 46,542 | |
| 2,160 | | Associated British Foods PLC | | | 109,344 | |
| 23,307 | | British Sky Broadcasting Group PLC | | | 345,005 | |
| 38,433 | | BT Group PLC | | | 255,929 | |
| 31,645 | | Centrica PLC | | | 178,136 | |
| 45,627 | | Home Retail Group PLC | | | 144,187 | |
| 4,064 | | Imperial Tobacco Group PLC | | | 183,507 | |
| 59,344 | | Ladbrokes PLC | | | 151,899 | |
| 207,561 | | Man Group PLC | | | 349,197 | |
| 10,782 | | Prudential PLC | | | 250,570 | |
| 4,255 | | Royal Dutch Shell PLC | | | 173,789 | |
| 11,810 | | Smith & Nephew PLC | | | 207,208 | |
| 8,520 | | SSE PLC | | | 222,368 | |
| 66,185 | | TalkTalk Telecom Group PLC | | | 356,138 | |
| 11,553 | | Telecity Group PLC | | | 137,781 | |
| | | | | | 3,111,600 | |
| | | | | | | |
| | | United States - 3.5% | | | | |
| 17,929 | | Comstock Resources, Inc. | | | 487,489 | |
| 11,619 | | LinnCo, LLC | | | 323,241 | |
| 23,509 | | W&T Offshore, Inc. | | | 344,877 | |
| | | | | | 1,155,607 | |
| See notes to financial statements. |
| 40 | CLAYMORE EXCHANGE-TRADED FUND TRUST 2 ANNUAL REPORT |
| PORTFOLIO OF INVESTMENTS continued | May 31, 2014 |
HGI Guggenheim International Multi-Asset Income ETF continued
| Number | | | | | | |
| of Shares | | Description | | | Value | |
| | | Total Common Stocks - 84.7% | | | | |
| | | (Cost $26,220,956) | | $ | 28,225,656 | |
| | | | | | | |
| | | Preferred Stocks - 1.8% | | | | |
| | | Chile - 1.0% | | | | |
| 12,855 | | Embotelladora Andina SA, Class B, ADR(a) | | | 324,332 | |
| | | | | | | |
| | | Colombia - 0.8% | | | | |
| 4,911 | | BanColombia SA, ADR(a) | | | 273,690 | |
| | | | | | | |
| | | Total Preferred Stocks - 1.8% | | | | |
| | | (Cost $621,697) | | | 598,022 | |
| | | | | | | |
| | | Royalty Trusts - 3.3% | | | | |
| | | United States - 3.3% | | | | |
| 4,400 | | BP Prudhoe Bay Royalty Trust(a) | | | 399,300 | |
| 14,882 | | Enduro Royalty Trust(a) | | | 188,109 | |
| 18,788 | | Pacific Coast Oil Trust(a) | | | 250,068 | |
| 22,897 | | SandRidge Permian Trust(a) | | | 278,885 | |
| | | (Cost $1,135,217) | | | 1,116,362 | |
| | | | | | | |
| | | Exchange Traded Fund - 0.2% | | | | |
| 800 | | iShares MSCI EAFE Index Fund | | | | |
| | | (Cost $55,188) | | | 55,528 | |
| | | | | | | |
| | | Closed End Funds - 9.6% | | | | |
| 15,391 | | AllianceBernstein Global High Income Fund, Inc. | | | 223,323 | |
| 17,497 | | BlackRock Corporate High Yield Fund, Inc. | | | 215,038 | |
| 10,997 | | BlackRock Limited Duration Income Trust(a) | | | 191,128 | |
| 7,800 | | Cohen & Steers Select Preferred and Income Fund, Inc. (a) | | | 200,850 | |
| 11,827 | | Eaton Vance Senior Floating-Rate Trust | | | 174,448 | |
| 36,435 | | Invesco Senior Income Trust(a) | | | 181,811 | |
| 16,710 | | Morgan Stanley Emerging Markets Domestic Debt Fund, Inc. | | | 225,251 | |
| 14,622 | | Nuveen Floating Rate Income Fund | | | 172,247 | |
| 15,232 | | Nuveen Floating Rate Income Opportunity Fund | | | 187,810 | |
| 14,509 | | Pioneer Floating Rate Trust(a) | | | 179,186 | |
| 16,877 | | Templeton Emerging Markets Income Fund | | | 237,797 | |
| 27,638 | | Templeton Global Income Fund | | | 221,380 | |
| 33,740 | | Wells Fargo Advantage Global Dividend Opportunity Fund | | | 286,453 | |
| 18,993 | | Western Asset Global High Income Fund, Inc. | | | 245,200 | |
| 27,912 | | Western Asset High Income Fund II, Inc. | | | 262,094 | |
| | | (Cost $3,193,070) | | | 3,204,016 | |
| | | | | | | |
| | | Total Long-Term Investments - 99.6% | | | | |
| | | (Cost $31,226,128) | | | 33,199,584 | |
| | | | | | | |
| | | Investments of Collateral for | | | | |
| | | Securities Loaned - 10.8% | | | | |
| 3,613,765 | | BNY Mellon Securities Lending Overnight Fund, | | | | |
| | | 0.1251%(c) (d) | | | | |
| | | (Cost $3,613,765) | | | 3,613,765 | |
| | | | | | | |
| | | Total Investments - 110.4% | | | | |
| | | (Cost $34,839,893) | | | 36,813,349 | |
| | | Liabilities in excess of Other Assets - (10.4%) | | | (3,469,625 | ) |
| | | Net Assets - 100.0% | | $ | 33,343,724 | |
| AB - Stock Company |
| |
| ADR - American Depositary Receipt |
| |
| AG - Stock Corporation |
| |
| A/S - Limited Liability Stock Company or Stock Company |
| |
| KGaA - Limited Partnership |
| |
| LLC - Limited Liability Company |
| |
| NV - Publicly Traded Company |
| |
| OJSC - Open Joint Stock Company |
| |
| OYJ - Public Traded Company |
| |
| PLC - Public Limited Company |
| |
| PT - Limited Liability Company |
| |
| SA - Corporation |
| |
| SpA - Limited Share Company |
| |
| SAB de CV - Publicly Traded Company |
| (a) | Security, or portion thereof, was on loan at May 31, 2014. |
| | |
| (b) | Non-income producing security. |
| | |
| (c) | At May 31, 2014, the total market value of the Fund’s securities on loan was $3,486,643 and the total market value of the collateral held by the Fund was $3,615,418, consisting of cash collateral of $3,613,765 and U.S. Government and Agency securities valued at $1,653. |
| | |
| (d) | Interest rate shown reflects yield as of May 31, 2014. |
| See notes to financial statements. |
| CLAYMORE EXCHANGE-TRADED FUND TRUST 2 ANNUAL REPORT | 41 |
| PORTFOLIO OF INVESTMENTS continued | May 31, 2014 |
HGI Guggenheim International Multi-Asset Income ETF continued
| | % of Long-Term |
| Country Breakdown | | Investments |
| United States | | 16.7 | % |
| United Kingdom | | 9.4 | % |
| Hong Kong | | 8.3 | % |
| Japan | | 6.6 | % |
| France | | 6.1 | % |
| Germany | | 5.5 | % |
| Cayman Islands | | 5.0 | % |
| Australia | | 4.4 | % |
| Mexico | | 3.9 | % |
| Canada | | 3.5 | % |
| Chile | | 3.2 | % |
| China | | 2.9 | % |
| Bermuda | | 2.7 | % |
| Colombia | | 2.6 | % |
| Sweden | | 2.4 | % |
| Switzerland | | 1.7 | % |
| Singapore | | 1.4 | % |
| Israel | | 1.3 | % |
| Russia | | 1.3 | % |
| Spain | | 1.3 | % |
| Argentina | | 1.2 | % |
| India | | 1.0 | % |
| Jersey | | 1.0 | % |
| Finland | | 0.8 | % |
| Austria | | 0.8 | % |
| South Africa | | 0.8 | % |
| Indonesia | | 0.8 | % |
| Brazil | | 0.7 | % |
| Netherlands | | 0.6 | % |
| Taiwan | | 0.6 | % |
| Belgium | | 0.6 | % |
| Italy | | 0.6 | % |
| Denmark | | 0.3 | % |
| | % of Long-Term |
| Currency Denomination | | Investments |
| United States Dollar | | 41.4 | % |
| Euro | | 16.2 | % |
| Hong Kong Dollar | | 14.0 | % |
| Pound Sterling | | 10.3 | % |
| Japanese Yen | | 6.6 | % |
| Australian Dollar | | 4.4 | % |
| Swedish Krona | | 2.4 | % |
| All Other Currencies | | 4.7 | % |
| | | | |
| Subject to change daily. | | | |
| See notes to financial statements. |
| 42 | CLAYMORE EXCHANGE-TRADED FUND TRUST 2 ANNUAL REPORT |
| PORTFOLIO OF INVESTMENTS continued | May 31, 2014 |
SEA Guggenheim Shipping ETF
| Number | | | | | | |
| of Shares | | Description | | | Value | |
| | | Long-Term Investments - 99.5% | | | | |
| | | Common Stocks - 81.8% | | | | |
| | | Bermuda - 25.9% | | | | |
| 3,676,410 | | COSCO Pacific Ltd. | | $ | 4,855,757 | |
| 138,371 | | GasLog Ltd. | | | 3,230,963 | |
| 205,953 | | Knightsbridge Tankers Ltd. | | | 2,726,818 | |
| 350,044 | | Nordic American Tankers Ltd.(a) | | | 2,863,360 | |
| 703,060 | | Orient Overseas International Ltd. | | | 3,600,111 | |
| 5,598,541 | | Pacific Basin Shipping Ltd. | | | 3,487,828 | |
| 193,837 | | Ship Finance International Ltd. | | | 3,589,861 | |
| 108,805 | | Stolt-Nielsen Ltd. | | | 2,996,304 | |
| 454,336 | | Tsakos Energy Navigation Ltd. | | | 3,262,132 | |
| | | | | | 30,613,134 | |
| | | | | | | |
| | | Denmark - 23.6% | | | | |
| 9,428 | | AP Moller - Maersk A/S, Class B | | | 24,581,217 | |
| 80,605 | | D/S Norden A/S | | | 3,220,162 | |
| | | | | | 27,801,379 | |
| | | | | | | |
| | | Japan - 10.8% | | | | |
| 2,157,000 | | Kawasaki Kisen Kaisha Ltd. | | | 4,515,613 | |
| 2,806,000 | | Nippon Yusen KK | | | 8,273,625 | |
| | | | | | 12,789,238 | |
| | | | | | | |
| | | Marshall Islands - 13.9% | | | | |
| 150,074 | | Costamare, Inc.(a) | | | 3,267,111 | |
| 303,291 | | Navios Maritime Holdings, Inc.(a) | | | 2,744,783 | |
| 142,222 | | Seaspan Corp.(a) | | | 3,242,661 | |
| 85,748 | | Teekay Corp. | | | 4,960,522 | |
| 597,064 | | Teekay Tankers Ltd., Class A(a) | | | 2,161,372 | |
| | | | | | 16,376,449 | |
| | | | | | | |
| | | Singapore - 4.7% | | | | |
| 1,694,000 | | SembCorp Marine Ltd. | | | 5,567,168 | |
| | | | | | | |
| | | United States - 2.9% | | | | |
| 139,361 | | Matson, Inc. | | | 3,424,100 | |
| | | | | | | |
| | | Total Common Stocks - 81.8% | | | | |
| | | (Cost $88,915,086) | | | 96,571,468 | |
| | | | | | | |
| | | Master Limited Partnerships - 17.7% | | | | |
| | | Marshall Islands - 17.7% | | | | |
| 286,600 | | Capital Product Partners, LP(a) | | | 3,072,352 | |
| 120,051 | | Golar LNG Partners, LP | | | 3,955,680 | |
| 216,357 | | Navios Maritime Partners, LP | | | 3,991,787 | |
| 109,802 | | Teekay LNG Partners, LP | | | 4,864,229 | |
| 139,851 | | Teekay Offshore Partners, LP(a) | | | 4,988,485 | |
| | | (Cost $18,301,193) | | | 20,872,533 | |
| | | | | | | |
| | | Total Long-Term Investments - 99.5% | | | | |
| | | (Cost $107,216,279) | | | 117,444,001 | |
| | | | | | | |
| | | Investments of Collateral for | | | | |
| | | Securities Loaned - 12.5% | | | | |
| 14,721,456 | | BNY Mellon Securities Lending Overnight Fund, | | | | |
| | | 0.1251%(b) (c) | | | | |
| | | (Cost $14,721,456) | | | 14,721,456 | |
| | | | | | | |
| | | Total Investments - 112.0% | | | | |
| | | (Cost $121,937,735) | | | 132,165,457 | |
| | | Liabilities in excess of Other Assets - (12.0%) | | | (14,212,399 | ) |
| | | Net Assets - 100.0% | | $ | 117,953,058 | |
A/S - Limited Liability Stock Company or Stock Company
KK - Joint Stock Company
LP - Limited Partnership
| (a) | Security, or portion thereof, was on loan at May 31, 2014. |
| | |
| (b) | At May 31, 2014, the total market value of the Fund’s securities on loan was $14,195,388 and the total market value of the collateral held by the Fund was $14,721,456. |
| | |
| (c) | Interest rate shown reflects yield as of May 31, 2014. |
| | % of Long-Term |
| Country Breakdown | | Investments |
| Marshall Islands | | 31.7 | % |
| Bermuda | | 26.1 | % |
| Denmark | | 23.7 | % |
| Japan | | 10.9 | % |
| Singapore | | 4.7 | % |
| United States | | 2.9 | % |
| | % of Long-Term |
| Currency Denomination | | Investments |
| United States Dollar | | 48.0 | % |
| Danish Krone | | 23.7 | % |
| Japanese Yen | | 10.9 | % |
| Hong Kong Dollar | | 10.2 | % |
| Singapore Dollar | | 4.7 | % |
| Norwegian Krone | | 2.5 | % |
| | | | |
| Subject to change daily. | | | |
| See notes to financial statements. |
| CLAYMORE EXCHANGE-TRADED FUND TRUST 2 ANNUAL REPORT | 43 |
| PORTFOLIO OF INVESTMENTS continued | May 31, 2014 |
CUT Guggenheim Timber ETF
| Number | | | | | | |
| of Shares | | Description | | | Value | |
| | | Long-Term Investments - 99.7% | | | | |
| | | Common Stocks - 97.4% | | | | |
| | | Brazil - 6.6% | | | | |
| 1,784,970 | | Duratex SA | | $ | 7,337,074 | |
| 1,001,864 | | Fibria Celulose SA, ADR(a) (b) | | | 9,447,577 | |
| | | | | | 16,784,651 | |
| | | | | | | |
| | | Canada - 11.1% | | | | |
| 567,047 | | Canfor Corp.(a) | | | 12,496,601 | |
| 340,612 | | West Fraser Timber Co. Ltd. | | | 15,621,382 | |
| | | | | | 28,117,983 | |
| | | | | | | |
| | | Finland - 9.2% | | | | |
| 1,186,609 | | Stora ENSO OYJ, R Shares(b) | | | 12,168,198 | |
| 639,288 | | UPM-Kymmene OYJ | | | 11,261,920 | |
| | | | | | 23,430,118 | |
| | | | | | | |
| | | Ireland - 8.4% | | | | |
| 881,315 | | Smurfit Kappa Group PLC | | | 21,286,001 | |
| | | | | | | |
| | | Japan - 10.8% | | | | |
| 831,200 | | Hokuetsu Kishu Paper Co. Ltd.(b) | | | 4,052,044 | |
| 406,000 | | Nippon Paper Industries Co. Ltd.(b) | | | 8,315,927 | |
| 1,771,000 | | OJI Holdings Corp. | | | 7,467,286 | |
| 704,700 | | Sumitomo Forestry Co. Ltd.(b) | | | 7,591,048 | |
| | | | | | 27,426,305 | |
| | | | | | | |
| | | Portugal - 6.0% | | | | |
| 3,048,768 | | Portucel SA | | | 15,080,719 | |
| | | | | | | |
| | | South Africa - 3.3% | | | | |
| 472,652 | | Mondi Ltd. | | | 8,411,386 | |
| | | | | | | |
| | | Spain - 1.3% | | | | |
| 1,136,824 | | Ence Energia y Celulosa SA | | | 3,280,902 | |
| | | | | | | |
| | | Sweden - 9.0% | | | | |
| 246,814 | | Holmen AB, B Shares | | | 9,000,987 | |
| 491,586 | | Svenska Cellulosa AB SCA, B Shares | | | 13,703,207 | |
| | | | | | 22,704,194 | |
| | | | | | | |
| | | United States - 31.7% | | | | |
| 89,004 | | Domtar Corp. | | | 8,088,684 | |
| 171,036 | | Greif, Inc., Class A | | | 9,341,986 | |
| 244,324 | | International Paper Co. | | | 11,637,152 | |
| 281,119 | | MeadWestvaco Corp. | | | 11,407,809 | |
| 214,685 | | Plum Creek Timber Co., Inc., REIT | | | 9,682,294 | |
| 159,696 | | Potlatch Corp., REIT | | | 6,413,391 | |
| 192,750 | | Rayonier, Inc., REIT | | | 9,174,900 | |
| 195,821 | | Wausau Paper Corp. | | | 2,083,535 | |
| 401,744 | | Weyerhaeuser Co., REIT | | | 12,622,797 | |
| | | | | | 80,452,548 | |
| | | | | | | |
| | | Total Common Stocks - 97.4% | | | | |
| | | (Cost $202,669,010) | | | 246,974,807 | |
| | | | | | | |
| | | Preferred Stock - 2.3% | | | | |
| | | Brazil - 2.3% | | | | |
| 1,624,300 | | Suzano Papel E Celulose SA | | | | |
| | | (Cost $5,714,245) | | | 5,843,874 | |
| | | | | | | |
| | | Total Long-Term Investments - 99.7% | | | | |
| | | (Cost $208,383,255) | | | 252,818,681 | |
| | | | | | | |
| | | Investments of Collateral for | | | | |
| | | Securities Loaned - 11.7% | | | | |
| 29,610,480 | | BNY Mellon Securities Lending Overnight | | | | |
| | | Fund, 0.1251%(c) (d) | | | | |
| | | (Cost $29,610,480) | | | 29,610,480 | |
| | | | | | | |
| | | Total Investments - 111.4% | | | | |
| | | (Cost $237,993,735) | | | 282,429,161 | |
| | | Liabilities in excess of Other Assets - (11.4%) | | | (28,760,885) | |
| | | Net Assets - 100.0% | | $ | 253,668,276 | |
| AB - Stock Company |
| |
| ADR - American Depositary Receipt |
| |
| OYJ - Public Traded Company |
| |
| PLC - Public Limited Company |
| |
| REIT - Real Estate Investment Trust |
| |
| SA - Corporation |
| |
| SCA - Limited Partnership |
| (a) | Non-income producing security. |
| | |
| (b) | Security, or portion thereof, was on loan at May 31, 2014. |
| | |
| (c) | At May 31, 2014, the total market value of the Fund’s securities on loan was $28,302,452 and the total market value of the collateral held by the Fund was $29,610,480. |
| | |
| (d) | Interest rate shown reflects yield as of May 31, 2014. |
| | % of Long-Term |
| Country Breakdown | | Investments |
| United States | | 31.8 | % |
| Canada | | 11.1 | % |
| Japan | | 10.8 | % |
| Finland | | 9.3 | % |
| Sweden | | 9.0 | % |
| Brazil | | 9.0 | % |
| Ireland | | 8.4 | % |
| Portugal | | 6.0 | % |
| South Africa | | 3.3 | % |
| Spain | | 1.3 | % |
| See notes to financial statements. |
| 44 | CLAYMORE EXCHANGE-TRADED FUND TRUST 2 ANNUAL REPORT |
| PORTFOLIO OF INVESTMENTS continued | May 31, 2014 |
CUT Guggenheim Timber ETF continued
| | % of Long-Term |
| Currency Denomination | | Investments |
| United States Dollar | | 35.6 | % |
| Euro | | 24.9 | % |
| Canadian Dollar | | 11.1 | % |
| Japanese Yen | | 10.8 | % |
| Swedish Krona | | 9.0 | % |
| All other currencies | | 8.6 | % |
| | | | |
| Subject to change daily. | | | |
| See notes to financial statements. |
| CLAYMORE EXCHANGE-TRADED FUND TRUST 2 ANNUAL REPORT | 45 |
STATEMENT OF ASSETS AND LIABILITIES | May 31, 2014 |
| | | | Guggenheim Canadian Energy Income ETF | | | Guggenheim China Real Estate ETF | | | Guggenheim China Small Cap ETF | | | Guggenheim Frontier Markets ETF | |
| | | | (ENY | ) | | (TAO | ) | | (HAO | ) | | (FRN | ) |
| Assets | | | | | | | | | | | | | |
| Investments in securities, at value (including securities on loan) | | $ | 64,586,046 | | $ | 23,302,560 | | $ | 239,293,895 | | $ | 106,811,641 | |
| Foreign currency, at value | | | 30,859 | | | 13,618 | | | 163,612 | | | — | |
| Cash | | | 208,188 | | | 37,411 | | | — | | | 221,002 | |
| Receivables: | | | | | | | | | | | | | |
| Fund shares sold | | | — | | | — | | | — | | | — | |
| Investments sold | | | — | | | 216,388 | | | — | | | — | |
| Dividends | | | 79,561 | | | 135,075 | | | 1,232,118 | | | 682,565 | |
| Securities lending income | | | 14,026 | | | 1,954 | | | 100,381 | | | 12,651 | |
| Tax reclaims | | | — | | | — | | | — | | | — | |
| Due from Adviser | | | — | | | 74,535 | | | — | | | — | |
| Other assets | | | 114 | | | 4 | | | 227 | | | 167 | |
| Total assets | | | 64,918,794 | | | 23,781,545 | | | 240,790,233 | | | 107,728,026 | |
| Liabilities | | | | | | | | | | | | | |
| Custodian bank | | | — | | | — | | | 30,725 | | | — | |
| Payables: | | | | | | | | | | | | | |
| Investments purchased | | | — | | | — | | | — | | | — | |
| Administration fee payable | | | 1,077 | | | — | | | 4,866 | | | 2,019 | |
| Collateral for securities on loan | | | 18,725,793 | | | 921,690 | | | 34,081,191 | | | 19,668,349 | |
| Accrued advisory fees | | | 25,424 | | | — | | | 107,691 | | | 27,977 | |
| Accrued expenses | | | 39,318 | | | 81,525 | | | 144,341 | | | 59,557 | |
| Total liabilities | | | 18,791,612 | | | 1,003,215 | | | 34,368,814 | | | 19,757,902 | |
| Net Assets | | $ | 46,127,182 | | $ | 22,778,330 | | $ | 206,421,419 | | $ | 87,970,124 | |
| Composition of Net Assets | | | | | | | | | | | | | |
| Paid-in capital | | $ | 125,610,899 | | $ | 39,955,996 | | $ | 286,306,963 | | $ | 139,768,900 | |
| Accumulated undistributed net investment income (loss) | | | (12,566 | ) | | 170,059 | | | 1,663,923 | | | 1,808,749 | |
| Accumulated net realized gain (loss) on investments and currency transactions | | | (84,000,371 | ) | | (13,737,194 | ) | | (45,324,637 | ) | | (38,988,015 | ) |
| Net unrealized appreciation (depreciation) on investments and currency translation | | | 4,529,220 | | | (3,610,531 | ) | | (36,224,830 | ) | | (14,619,510 | ) |
| Net Assets | | $ | 46,127,182 | | $ | 22,778,330 | | $ | 206,421,419 | | $ | 87,970,124 | |
| Shares outstanding ($0.01 par value with unlimited amount authorized) | | | 2,820,000 | | | 1,110,000 | | | 8,350,000 | | | 5,240,000 | |
| Net Asset Value Per Share | | $ | 16.36 | | $ | 20.52 | | $ | 24.72 | | $ | 16.79 | |
| Investments in securities, at cost | | $ | 60,057,031 | | $ | 26,913,102 | | $ | 275,518,558 | | $ | 121,431,151 | |
| Foreign currency, at cost | | $ | 30,881 | | $ | 13,616 | | $ | 163,618 | | $ | — | |
| Securities on loan, at value | | $ | 17,818,154 | | $ | 830,116 | | $ | 30,709,904 | | $ | 19,161,008 | |
| See notes to financial statements. |
| 46 | CLAYMORE EXCHANGE-TRADED FUND TRUST 2 ANNUAL REPORT |
| | | | | | | | | | |
| | | Guggenheim International Multi-Asset Income ETF (HGI | ) | | Guggenheim Shipping ETF (SEA | ) | | Guggenheim Timber ETF (CUT | ) |
| | | | | | | | | | |
| | $ | 36,813,349 | | $ | 132,165,457 | | $ | 282,429,161 | |
| | | 7,016 | | | — | | | — | |
| | | 92,621 | | | 110,606 | | | 487,658 | |
| | | | | | | | | | |
| | | 25,841 | | | — | | | — | |
| | | — | | | — | | | — | |
| | | 95,718 | | | 335,854 | | | 445,777 | |
| | | 8,384 | | | 44,402 | | | 44,569 | |
| | | 49,541 | | | 83,291 | | | 116,204 | |
| | | — | | | — | | | — | |
| | | 107 | | | — | | | 245 | |
| | | 37,092,577 | | | 132,739,610 | | | 283,523,614 | |
| | | | | | | | | | |
| | | — | | | — | | | — | |
| | | 55,188 | | | — | | | — | |
| | | 721 | | | — | | | 5,548 | |
| | | 3,613,765 | | | 14,721,456 | | | 29,610,480 | |
| | | 13,117 | | | 65,096 | | | 106,845 | |
| | | 66,062 | | | — | | | 132,465 | |
| | | 3,748,853 | | | 14,786,552 | | | 29,855,338 | |
| | $ | 33,343,724 | | $ | 117,953,058 | | $ | 253,668,276 | |
| | | | | | | | | | |
| | $ | 66,763,786 | | $ | 114,445,645 | | $ | 252,362,786 | |
| | | (74,797 | ) | | 1,199,418 | | | 2,761,706 | |
| | | | | | | | | | |
| | | (35,320,553 | ) | | (7,920,158 | ) | | (45,894,018 | ) |
| | | | | | | | | | |
| | | 1,975,288 | | | 10,228,153 | | | 44,437,802 | |
| | $ | 33,343,724 | | $ | 117,953,058 | | $ | 253,668,276 | |
| | | | | | | | | | |
| | | 1,700,000 | | | 5,200,000 | | | 10,000,000 | |
| | $ | 19.61 | | $ | 22.68 | | $ | 25.37 | |
| | $ | 34,839,893 | | $ | 121,937,735 | | $ | 237,993,735 | |
| | $ | 7,016 | | $ | — | | $ | — | |
| | $ | 3,486,643 | | $ | 14,195,388 | | $ | 28,302,452 | |
| See notes to financial statements. |
| CLAYMORE EXCHANGE-TRADED FUND TRUST 2 ANNUAL REPORT | 47 |
STATEMENT OF OPERATIONS For the year ended May 31, 2014 | May 31, 2014 |
| | | | Guggenheim Canadian Energy Income ETF (ENY | ) | | Guggenheim China Real Estate ETF (TAO | ) | | Guggenheim China Small Cap ETF (HAO | ) | | Guggenheim Frontier Markets ETF (FRN | ) |
| Investment Income | | | | | | | | | | | | | |
| Dividend income | | $ | 1,978,919 | | $ | 1,303,309 | | $ | 5,761,584 | | $ | 2,788,274 | |
| Less return of capital distributions received | | | — | | | — | | | — | | | — | |
| Foreign taxes withheld | | | (297,680 | ) | | (3,096 | ) | | (154,347 | ) | | (400,278 | ) |
| Net dividend income | | | 1,681,239 | | | 1,300,213 | | | 5,607,237 | | | 2,387,996 | |
| Net securities lending income | | | 111,164 | | | 16,338 | | | 1,109,738 | | | 267,868 | |
| Total income | | | 1,792,403 | | | 1,316,551 | | | 6,716,975 | | | 2,655,864 | |
| Expenses | | | | | | | | | | | | | |
| Advisory fee <Note 3> | | | 250,167 | | | 163,233 | | | 1,235,846 | | | 443,331 | |
| Administration fee | | | 13,759 | | | 8,978 | | | 59,675 | | | 24,383 | |
| Custodian fee | | | 22,002 | | | 25,996 | | | 156,408 | | | 76,020 | |
| Licensing | | | 29,790 | | | 32,651 | | | 312,690 | | | 88,666 | |
| Listing fee and expenses | | | 5,000 | | | 5,000 | | | 5,000 | | | 5,000 | |
| Printing expenses | | | 18,712 | | | 16,466 | | | 30,949 | | | 12,225 | |
| Professional fees | | | 33,732 | | | 28,849 | | | 34,906 | | | 32,183 | |
| Registration & filings | | | — | | | 720 | | | 1,424 | | | — | |
| Trustees’ fees and expenses | | | 4,570 | | | 4,281 | | | 7,562 | | | 5,424 | |
| Miscellaneous | | | 25,009 | | | 24,135 | | | 39,824 | | | 30,162 | |
| Total expenses | | | 402,741 | | | 310,309 | | | 1,884,284 | | | 717,394 | |
| Advisory fees waived | | | (46,496 | ) | | (77,861 | ) | | (182,054 | ) | | (85,915 | ) |
| Net expenses | | | 356,245 | | | 232,448 | | | 1,702,230 | | | 631,479 | |
| Net Investment Income | | | 1,436,158 | | | 1,084,103 | | | 5,014,745 | | | 2,024,385 | |
| Realized and Unrealized Gain (Loss) | | | | | | | | | | | | | |
| Net realized gain (loss) on | | | | | | | | | | | | | |
| Investments | | | (7,646,045 | ) | | (643,015 | ) | | 3,273,645 | | | (9,940,988 | ) |
| In-kind transactions | | | 876,892 | | | (1,572,440 | ) | | 4,607,592 | | | (1,375,887 | ) |
| Foreign currency transactions | | | (43,158 | ) | | (401 | ) | | (3,265 | ) | | — | |
| Net realized gain (loss) | | | (6,812,311 | ) | | (2,215,856 | ) | | 7,877,972 | | | (11,316,875 | ) |
| Net change in unrealized appreciation (depreciation) on | | | | | | | | | | | | |
| Investments | | | 12,264,533 | | | (1,753,046 | ) | | (15,622,207 | ) | | 8,306,991 | |
| Foreign currency translation | | | 817 | | | 16 | | | (41 | ) | | — | |
| Net unrealized appreciation (depreciation) | | | 12,265,350 | | | (1,753,030 | ) | | (15,622,248 | ) | | 8,306,991 | |
| Net realized and unrealized gain (loss) | | | 5,453,039 | | | (3,968,886 | ) | | (7,744,276 | ) | | (3,009,884 | ) |
| Net Increase (Decrease) in Net Assets Resulting from Operations | | $ | 6,889,197 | | $ | (2,884,783 | ) | $ | (2,729,531 | ) | $ | (985,499 | ) |
| See notes to financial statements. |
| 48 | CLAYMORE EXCHANGE-TRADED FUND TRUST 2 ANNUAL REPORT |
| | | Guggenheim International Multi-Asset Income ETF (HGI | ) | | Guggenheim Shipping ETF (SEA | ) | | Guggenheim Timber ETF (CUT | ) |
| | | | | | | | | | |
| | $ | 3,028,898 | | $ | 3,596,184 | | $ | 7,535,954 | |
| | | (76,898 | ) | | (1,041,511 | ) | | — | |
| | | (135,488 | ) | | (113,706 | ) | | (578,692 | ) |
| | | 2,816,512 | | | 2,440,967 | | | 6,957,262 | |
| | | 92,776 | | | 327,188 | | | 428,103 | |
| | | 2,909,288 | | | 2,768,155 | | | 7,385,365 | |
| | | | | | | | | | |
| | | 330,287 | | | 532,267 | | | 1,277,795 | |
| | | 18,166 | | | — | | | 66,112 | |
| | | 45,346 | | | — | | | 86,075 | |
| | | 79,639 | | | — | | | 358,339 | |
| | | 5,000 | | | — | | | 5,000 | |
| | | 8,585 | | | — | | | 36,158 | |
| | | 33,340 | | | — | | | 33,728 | |
| | | — | | | — | | | — | |
| | | 4,928 | | | — | | | 7,984 | |
| | | 30,405 | | | 7,491 | | | 45,624 | |
| | | 555,696 | | | 539,758 | | | 1,916,815 | |
| | | (90,781 | ) | | — | | | (106,372 | ) |
| | | 464,915 | | | 539,758 | | | 1,810,443 | |
| | | 2,444,373 | | | 2,228,397 | | | 5,574,922 | |
| | | | | | | | | | |
| | | (5,481,280 | ) | | (2,218,522 | ) | | (4,058,694 | ) |
| | | 14,183,344 | | | 11,115,985 | | | 12,341,841 | |
| | | (48,177 | ) | | (7,301 | ) | | (170,030 | ) |
| | | 8,653,887 | | | 8,890,162 | | | 8,113,117 | |
| | | | | | | | | | |
| | | 1,114,128 | | | 9,215,404 | | | 21,926,263 | |
| | | 11,599 | | | 891 | | | 25,892 | |
| | | 1,125,727 | | | 9,216,295 | | | 21,952,155 | |
| | | 9,779,614 | | | 18,106,457 | | | 30,065,272 | |
| | $ | 12,223,987 | | $ | 20,334,854 | | $ | 35,640,194 | |
| See notes to financial statements. |
| CLAYMORE EXCHANGE-TRADED FUND TRUST 2 ANNUAL REPORT | 49 |
| STATEMENTS OF CHANGES IN NET ASSETS | May 31, 2014 |
| | | | Guggenheim Canadian Energy Income ETF (ENY) | |
| | | | For the Year Ended May 31, 2014 | | | For the Year Ended May 31, 2013 | |
| Increase (Decrease) in Net Assets Resulting from Operations | | | | | | | |
| Net investment income | | $ | 1,436,158 | | $ | 2,329,537 | |
| Net realized gain (loss) | | | (6,812,311 | ) | | (16,193,281 | ) |
| Net unrealized appreciation (depreciation) | | | 12,265,350 | | | 16,106,222 | |
| Net increase (decrease) in net assets resulting from operations | | | 6,889,197 | | | 2,242,478 | |
| Distribution to Shareholders | | | | | | | |
| From and in excess of net investment income | | | (1,376,379 | ) | | (2,182,941 | ) |
| Return of capital | | | (189,681 | ) | | (125,469 | ) |
| Total distributions | | | (1,566,060 | ) | | (2,308,410 | ) |
| Capital Share Transactions | | | | | | | |
| Proceeds from sale of shares | | | 3,711,805 | | | 26,490,915 | |
| Cost of shares redeemed | | | (23,425,500 | ) | | (55,922,241 | ) |
| Net increase (decrease) from capital share transactions | | | (19,713,695 | ) | | (29,431,326 | ) |
| Total increase (decrease) in net assets | | | (14,390,558 | ) | | (29,497,258 | ) |
| Net Assets | | | | | | | |
| Beginning of period | | | 60,517,740 | | | 90,014,998 | |
| End of period | | $ | 46,127,182 | | $ | 60,517,740 | |
| Accumulated undistributed net investment income (loss) at end of period | | $ | (12,566 | ) | $ | 20,178 | |
| Changes in Shares Outstanding | | | | | | | |
| Shares sold | | | 250,000 | | | 1,650,000 | |
| Shares redeemed | | | (1,600,000 | ) | | (3,550,000 | ) |
| Shares outstanding, beginning of period | | | 4,170,000 | | | 6,070,000 | |
| Shares outstanding, end of period | | | 2,820,000 | | | 4,170,000 | |
| See notes to financial statements. |
| 50 | CLAYMORE EXCHANGE-TRADED FUND TRUST 2 ANNUAL REPORT |
| | | Guggenheim China Real Estate ETF (TAO) | | | Guggenheim China Small Cap ETF (HAO) | | | Guggenheim Frontier Markets ETF (FRN) | | | Guggenheim International Multi-Asset Income ETF (HGI) | |
| | | For the Year Ended May 31, 2014 | | | For the Year Ended May 31, 2013 | | | For the Year Ended May 31, 2014 | | | For the Year Ended May 31, 2013 | | | For the Year Ended May 31, 2014 | | | For the Year Ended May 31, 2013 | | | For the Year Ended May 31, 2014 | | | For the Year Ended May 31, 2013 | |
| | | | | | | | | | | | | | | | | | | | | | | | | |
| | $ | 1,084,103 | | $ | 931,974 | | $ | 5,014,745 | | $ | 4,328,590 | | $ | 2,024,385 | | $ | 5,511,917 | | $ | 2,444,373 | | $ | 5,166,076 | |
| | | (2,215,856 | ) | | 3,634,068 | | | 7,877,972 | | | 12,240,747 | | | (11,316,875 | ) | | (19,768,603 | ) | | 8,653,887 | | | (1,472,131 | ) |
| | | (1,753,030 | ) | | 3,566,003 | | | (15,622,248 | ) | | 30,267,843 | | | 8,306,991 | | | 4,913,185 | | | 1,125,727 | | | 16,975,910 | |
| | | (2,884,783 | ) | | 8,132,045 | | | (2,729,531 | ) | | 46,837,180 | | | (985,499 | ) | | (9,343,501 | ) | | 12,223,987 | | | 20,669,855 | |
| | | | | | | | | | | | | | | | | | | | | | | | | |
| | | (1,049,720 | ) | | (1,381,280 | ) | | (5,497,350 | ) | | (4,003,500 | ) | | (3,454,980 | ) | | (4,819,580 | ) | | (2,871,907 | ) | | (5,238,200 | ) |
| | | — | | | — | | | — | | | — | | | — | | | — | | | (135,093 | ) | | — | |
| | | (1,049,720 | ) | | (1,381,280 | ) | | (5,497,350 | ) | | (4,003,500 | ) | | (3,454,980 | ) | | (4,819,580 | ) | | (3,007,000 | ) | | (5,238,200 | ) |
| | | | | | | | | | | | | | | | | | | | | | | | | |
| | | — | | | 68,500,827 | | | 69,252,097 | | | 205,297,879 | | | 3,213,471 | | | 27,827,850 | | | 31,098,394 | | | 57,379,737 | |
| | | (24,168,495 | ) | | (42,928,680 | ) | | (91,526,540 | ) | | (175,981,373 | ) | | (22,901,072 | ) | | (34,963,094 | ) | | (126,087,518 | ) | | (56,001,977 | ) |
| | | (24,168,495 | ) | | 25,572,147 | | | (22,274,443 | ) | | 29,316,506 | | | (19,687,601 | ) | | (7,135,244 | ) | | (94,989,124 | ) | | 1,377,760 | |
| | | (28,102,998 | ) | | 32,322,912 | | | (30,501,324 | ) | | 72,150,186 | | | (24,128,080 | ) | | (21,298,325 | ) | | (85,772,137 | ) | | 16,809,415 | |
| | | | | | | | | | | | | | | | | | | | | | | | | |
| | | 50,881,328 | | | 18,558,416 | | | 236,922,743 | | | 164,772,557 | | | 112,098,204 | | | 133,396,529 | | | 119,115,861 | | | 102,306,446 | |
| | $ | 22,778,330 | | $ | 50,881,328 | | $ | 206,421,419 | | $ | 236,922,743 | | $ | 87,970,124 | | $ | 112,098,204 | | $ | 33,343,724 | | $ | 119,115,861 | |
| | $ | 170,059 | | $ | 130,072 | | $ | 1,663,923 | | $ | 1,644,566 | | $ | 1,808,749 | | $ | 3,239,344 | | $ | (74,797 | ) | $ | (49,013 | ) |
| | | | | | | | | | | | | | | | | | | | | | | | | |
| | | — | | | 3,150,000 | | | 2,650,000 | | | 8,850,000 | | | 200,000 | | | 1,400,000 | | | 1,800,000 | | | 3,400,000 | |
| | | (1,200,000 | ) | | (1,950,000 | ) | | (3,900,000 | ) | | (7,500,000 | ) | | (1,400,000 | ) | | (1,950,000 | ) | | (7,000,000 | ) | | (3,300,000 | ) |
| | | 2,310,000 | | | 1,110,000 | | | 9,600,000 | | | 8,250,000 | | | 6,440,000 | | | 6,990,000 | | | 6,900,000 | | | 6,800,000 | |
| | | 1,110,000 | | | 2,310,000 | | | 8,350,000 | | | 9,600,000 | | | 5,240,000 | | | 6,440,000 | | | 1,700,000 | | | 6,900,000 | |
| See notes to financial statements. |
| CLAYMORE EXCHANGE-TRADED FUND TRUST 2 ANNUAL REPORT | 51 |
| STATEMENTS OF CHANGES IN NET ASSETS continued | May 31, 2014 |
| Increase (Decrease) in Net Assets Resulting from Operations | |
| Net investment income | |
| Net realized gain (loss) | |
| Net unrealized appreciation (depreciation) | |
| Net increase (decrease) in net assets resulting from operations | |
| Distribution to Shareholders | |
| From and in excess of net investment income | |
| Return of capital | |
| Total distributions | |
| Capital Share Transactions | |
| Proceeds from sale of shares | |
| Cost of shares redeemed | |
| Net increase (decrease) from capital share transactions | |
| Total increase (decrease) in net assets | |
| Net Assets | |
| Beginning of period | |
| End of period | |
| Accumulated undistributed net investment income (loss) at end of period | |
| Changes in Shares Outstanding | |
| Shares sold | |
| Shares redeemed | |
| Shares outstanding, beginning of period | |
| Shares outstanding, end of period | |
| See notes to financial statements. |
| 52 | CLAYMORE EXCHANGE-TRADED FUND TRUST 2 ANNUAL REPORT |
| | | Guggenheim Shipping ETF (SEA) | | | Guggenheim Timber ETF (CUT) | |
| | | For the Year Ended May 31, 2014 | | | For the Year Ended May 31, 2013 | | | For the Year Ended May 31, 2014 | | | For the Year Ended May 31, 2013 | |
| | | | | | | | | | | | | |
| | $ | 2,228,397 | | $ | 825,544 | | $ | 5,574,922 | | $ | 4,058,530 | |
| | | 8,890,162 | | | (3,294,236 | ) | | 8,113,117 | | | 5,194,337 | |
| | | 9,216,295 | | | 5,706,782 | | | 21,952,155 | | | 48,363,714 | |
| | | 20,334,854 | | | 3,238,090 | | | 35,640,194 | | | 57,616,581 | |
| | | | | | | | | | | | | |
| | | (1,425,100 | ) | | (852,200 | ) | | (3,906,000 | ) | | (2,441,450 | ) |
| | | — | | | — | | | — | | | — | |
| | | (1,425,100 | ) | | (852,200 | ) | | (3,906,000 | ) | | (2,441,450 | ) |
| | | | | | | | | | | | | |
| | | 100,561,516 | | | 5,261,486 | | | 35,610,397 | | | 85,141,458 | |
| | | (36,528,978 | ) | | (3,089,060 | ) | | (36,710,831 | ) | | (23,336,000 | ) |
| | | 64,032,538 | | | 2,172,426 | | | (1,100,434 | ) | | 61,805,458 | |
| | | 82,942,292 | | | 4,558,316 | | | 30,633,760 | | | 116,980,589 | |
| | | | | | | | | | | | | |
| | | 35,010,766 | | | 30,452,450 | | | 223,034,516 | | | 106,053,927 | |
| | $ | 117,953,058 | | $ | 35,010,766 | | $ | 253,668,276 | | $ | 223,034,516 | |
| | $ | 1,199,418 | | $ | 176,536 | | $ | 2,761,706 | | $ | 2,333,866 | |
| | | | | | | | | | | | | |
| | | 4,900,000 | | | 300,000 | | | 1,450,000 | | | 4,350,000 | |
| | | (1,700,000 | ) | | (200,000 | ) | | (1,500,000 | ) | | (1,050,000 | ) |
| | | 2,000,000 | | | 1,900,000 | | | 10,050,000 | | | 6,750,000 | |
| | | 5,200,000 | | | 2,000,000 | | | 10,000,000 | | | 10,050,000 | |
| See notes to financial statements. |
| CLAYMORE EXCHANGE-TRADED FUND TRUST 2 ANNUAL REPORT | 53 |
| FINANCIAL HIGHLIGHTS | May 31, 2014 |
ENY Guggenheim Canadian Energy Income ETF
Per share operating performance for a share outstanding throughout the period | | | For the Year Ended May 31, 2014 | | | For the Year Ended May 31, 2013 | | | For the Year Ended May 31, 2012 | | | For the Year Ended May 31, 2011 | | | For the Year Ended May 31, 2010 | |
| Net asset value, beginning of period | | $ | 14.51 | | $ | 14.83 | | $ | 22.03 | | $ | 16.52 | | $ | 14.10 | |
| Income from investment operations | | | | | | | | | | | | | | | | |
Net investment income (a) | | | 0.42 | | | 0.45 | | | 0.46 | | | 0.52 | | | 0.47 | |
| Net realized and unrealized gain (loss) | | | 1.88 | | | (0.33 | ) | | (7.10 | ) | | 5.51 | | | 2.55 | |
| Total from investment operations | | | 2.30 | | | 0.12 | | | (6.64 | ) | | 6.03 | | | 3.02 | |
| Distributions to shareholders | | | | | | | | | | | | | | | | |
| From and in excess of net investment income | | | (0.39 | ) | | (0.42 | ) | | (0.54 | ) | | (0.52 | ) | | (0.60 | ) |
| Return of capital | | | (0.06 | ) | | (0.02 | ) | | (0.02 | ) | | — | | | — | |
| Total distributions to shareholders | | | (0.45 | ) | | (0.44 | ) | | (0.56 | ) | | (0.52 | ) | | (0.60 | ) |
| Net asset value, end of period | | $ | 16.36 | | $ | 14.51 | | $ | 14.83 | | $ | 22.03 | | $ | 16.52 | |
| Market value, end of period | | $ | 16.44 | | $ | 14.43 | | $ | 14.73 | | $ | 22.06 | | $ | 16.50 | |
Total return*(b) | | | | | | | | | | | | | | | | |
| Net asset value | | | 16.30 | % | | 0.61 | % | | -30.45 | % | | 37.22 | % | | 21.75 | % |
| Ratios and supplemental data | | | | | | | | | | | | | | | | |
| Net assets, end of period (thousands) | | $ | 46,127 | | $ | 60,518 | | $ | 90,015 | | $ | 229,570 | | $ | 74,649 | |
| Ratio of net expenses to average net assets* | | | 0.71 | % | | 0.70 | % | | 0.70 | % | | 0.70 | % | | 0.70 | % |
| Ratio of net investment income to average net assets* | | | 2.87 | % | | 2.89 | % | | 2.62 | % | | 2.59 | % | | 2.89 | % |
Portfolio turnover rate (c) | | | 80 | % | | 130 | % | | 81 | % | | 34 | % | | 58 | % |
| * If certain expenses had not been waived or reimbursed by the Investment Adviser, total return would have been lower and the ratios would have been as follows: | | | | | | | | | | | | | | | | |
| Ratio of total expenses to average net assets | | | 0.80 | % | | 0.83 | % | | 0.79 | % | | 0.84 | % | | 0.89 | % |
| Ratio of net investment income to average net assets | | | 2.78 | % | | 2.76 | % | | 2.53 | % | | 2.45 | % | | 2.70 | % |
| (a) | Based on average shares outstanding during the period. |
| | |
| (b) | Total investment return is calculated assuming a purchase of a share at the beginning of the period and a sale on the last day of the period reported at net asset value (“NAV”). Dividends and distributions are assumed to be reinvested at NAV. Total investment return does not reflect brokerage commissions. A return calculated for a period of less than one year is not annualized. |
| | |
| (c) | Portfolio turnover is not annualized for periods of less than one year and does not include securities received or delivered from processing creations or redemptions. |
| See notes to financial statements. |
| 54 | CLAYMORE EXCHANGE-TRADED FUND TRUST 2 ANNUAL REPORT |
| FINANCIAL HIGHLIGHTS continued | May 31, 2014 |
TAO Guggenheim China Real Estate ETF
| | | | | | | | | | | | | | | | | |
Per share operating performance for a share outstanding throughout the period | | | For the Year Ended May 31, 2014 | | | For the Year Ended May 31, 2013 | | | For the Year Ended May 31, 2012 | | | For the Year Ended May 31, 2011 | | | For the Year Ended May 31, 2010 | |
| Net asset value, beginning of period | | $ | 22.03 | | $ | 16.72 | | $ | 20.14 | | $ | 16.02 | | $ | 16.87 | |
| Income from investment operations | | | | | | | | | | | | | | | | |
Net investment income (a) | | | 0.68 | | | 0.41 | | | 0.47 | | | 0.35 | | | 0.29 | |
| Net realized and unrealized gain (loss) | | | (1.54 | ) | | 5.29 | | | (3.70 | ) | | 3.92 | | | (0.57 | ) |
| Total from investment operations | | | (0.86 | ) | | 5.70 | | | (3.23 | ) | | 4.27 | | | (0.28 | ) |
| Distributions to shareholders | | | | | | | | | | | | | | | | |
| From and in excess of net investment income | | | (0.65 | ) | | (0.39 | ) | | (0.19 | ) | | (0.15 | ) | | (0.57 | ) |
| Net asset value, end of period | | $ | 20.52 | | $ | 22.03 | | $ | 16.72 | | $ | 20.14 | | $ | 16.02 | |
| Market value, end of period | | $ | 20.43 | | $ | 21.66 | | $ | 16.74 | | $ | 20.07 | | $ | 15.89 | |
Total return*(b) | | | | | | | | | | | | | | | | |
| Net asset value | | | -3.82 | % | | 34.05 | % | | -15.90 | % | | 26.68 | % | | -2.10 | % |
| Ratios and supplemental data | | | | | | | | | | | | | | | | |
| Net assets, end of period (thousands) | | $ | 22,778 | | $ | 50,881 | | $ | 18,558 | | $ | 27,397 | | $ | 45,484 | |
| Ratio of net expenses to average net assets* | | | 0.71 | % | | 0.70 | % | | 0.70 | % | | 0.70 | % | | 0.70 | % |
| Ratio of net investment income to average net assets* | | | 3.32 | % | | 1.88 | % | | 2.76 | % | | 1.83 | % | | 1.64 | % |
Portfolio turnover rate (c) | | | 9 | % | | 20 | % | | 14 | % | | 17 | % | | 15 | % |
| * If certain expenses had not been waived or reimbursed by the Investment Adviser, total return would have been lower and the ratios would have been as follows: | | | | | | | | | | | | | | | | |
| Ratio of total expenses to average net assets | | | 0.95 | % | | 0.93 | % | | 1.35 | % | | 1.02 | % | | 0.92 | % |
| Ratio of net investment income to average net assets | | | 3.08 | % | | 1.65 | % | | 2.11 | % | | 1.51 | % | | 1.42 | % |
| (a) | Based on average shares outstanding during the period. |
| | |
| (b) | Total investment return is calculated assuming a purchase of a common share at the beginning of the period and a sale on the last day of the period reported at net asset value (“NAV”). Dividends and distributions are assumed to be reinvested at NAV. Total investment return does not reflect brokerage commissions. A return calculated for a period of less than one year is not annualized. |
| | |
| (c) | Portfolio turnover is not annualized for periods of less than one year and does not include securities received or delivered from processing creations or redemptions. |
| See notes to financial statements. |
| CLAYMORE EXCHANGE-TRADED FUND TRUST 2 ANNUAL REPORT | 55 |
| FINANCIAL HIGHLIGHTS continued | May 31, 2014 |
HAO Guggenheim China Small Cap ETF
Per share operating performance for a share outstanding throughout the period | | | For the Year Ended May 31, 2014 | | | For the Year Ended May 31, 2013 | | | For the Year Ended May 31, 2012 | | | For the Year Ended May 31, 2011 | | | For the Year Ended May 31, 2010 | |
| Net asset value, beginning of period | | $ | 24.68 | | $ | 19.97 | | $ | 29.23 | | $ | 24.44 | | $ | 20.70 | |
| Income from investment operations | | | | | | | | | | | | | | | | |
Net investment income (a) | | | 0.56 | | | 0.41 | | | 0.50 | | | 0.39 | | | 0.25 | |
| Net realized and unrealized gain (loss) | | | 0.03 | | | 4.61 | | | (9.14 | ) | | 4.84 | | | 3.52 | |
| Total from investment operations | | | 0.59 | | | 5.02 | | | (8.64 | ) | | 5.23 | | | 3.77 | |
| Distributions to shareholders | | | | | | | | | | | | | | | | |
| From and in excess of net investment income | | | (0.55 | ) | | (0.31 | ) | | (0.62 | ) | | (0.44 | ) | | (0.03 | ) |
| Net asset value, end of period | | $ | 24.72 | | $ | 24.68 | | $ | 19.97 | | $ | 29.23 | | $ | 24.44 | |
| Market value, end of period | | $ | 24.70 | | $ | 24.31 | | $ | 20.01 | | $ | 29.15 | | $ | 24.30 | |
Total return *(b) | | | | | | | | | | | | | | | | |
| Net asset value | | | 2.24 | % | | 25.24 | % | | -29.50 | % | | 21.36 | % | | 18.20 | % |
| Ratios and supplemental data | | | | | | | | | | | | | | | | |
| Net assets, end of period (thousands) | | $ | 206,421 | | $ | 236,923 | | $ | 164,773 | | $ | 327,373 | | $ | 291,284 | |
| Ratio of net expenses to average net assets* | | | 0.76 | % | | 0.75 | % | | 0.75 | % | | 0.75 | % | | 0.75 | % |
| Ratio of net investment income to average net assets* | | | 2.23 | % | | 1.81 | % | | 2.17 | % | | 1.33 | % | | 1.00 | % |
Portfolio turnover rate (c) | | | 29 | % | | 31 | % | | 35 | % | | 11 | % | | 46 | % |
| * If certain expenses had not been waived or reimbursed by the Investment Adviser, total return would have been lower and the ratios would have been as follows: | | | | | | | | | | | | | | | | |
| Ratio of total expenses to average net assets | | | 0.84 | % | | 0.84 | % | | 0.92 | % | | 0.89 | % | | 0.91 | % |
| Ratio of net investment income to average net assets | | | 2.15 | % | | 1.72 | % | | 2.00 | % | | 1.19 | % | | 0.84 | % |
| (a) | Based on average shares outstanding during the period. |
| | |
| (b) | Total investment return is calculated assuming a purchase of a share at the beginning of the period and a sale on the last day of the period reported at net asset value (“NAV”). Dividends and distributions are assumed to be reinvested at NAV. Total investment return does not reflect brokerage commissions. A return calculated for a period of less than one year is not annualized. |
| | |
| (c) | Portfolio turnover is not annualized for periods of less than one year and does not include securities received or delivered from processing creations or redemptions. |
| See notes to financial statements. |
| 56 | CLAYMORE EXCHANGE-TRADED FUND TRUST 2 ANNUAL REPORT |
| FINANCIAL HIGHLIGHTS continued | May 31, 2014 |
FRN Guggenheim Frontier Markets ETF
Per share operating performance for a share outstanding throughout the period | | | For the Year Ended May 31, 2014 | | | For the Year Ended May 31, 2013 | | | For the Year Ended May 31, 2012 | | | For the Year Ended May 31, 2011 | | | For the Year Ended May 31, 2010 | |
| Net asset value, beginning of period | | $ | 17.41 | | $ | 19.08 | | $ | 23.23 | | $ | 18.12 | | $ | 14.49 | |
| Income from investment operations | | | | | | | | | | | | | | | | |
Net investment income (a) | | | 0.38 | | | 0.71 | | | 0.59 | | | 0.64 | | | 0.55 | |
| Net realized and unrealized gain (loss) | | | (0.35 | ) | | (1.77 | ) | | (3.92 | ) | | 4.60 | | | 3.46 | |
| Total from investment operations | | | 0.03 | | | (1.06 | ) | | (3.33 | ) | | 5.24 | | | 4.01 | |
| Distributions to Shareholders | | | | | | | | | | | | | | | | |
| From and in excess of net investment income | | | (0.65 | ) | | (0.61 | ) | | (0.82 | ) | | (0.13 | ) | | (0.38 | ) |
| Net asset value, end of period | | $ | 16.79 | | $ | 17.41 | | $ | 19.08 | | $ | 23.23 | | $ | 18.12 | |
| Market value, end of period | | $ | 16.86 | | $ | 17.17 | | $ | 19.26 | | $ | 22.95 | | $ | 18.67 | |
Total return*(b) | | | | | | | | | | | | | | | | |
| Net asset value | | | 0.24 | % | | -5.94 | % | | -14.16 | % | | 28.87 | % | | 27.69 | % |
| Ratios and supplemental data | | | | | | | | | | | | | | | | |
| Net assets, end of period (thousands) | | $ | 87,970 | | $ | 112,098 | | $ | 133,397 | | $ | 183,324 | | $ | 31,888 | |
| Ratio of net expenses to average net assets* | | | 0.71 | % | | 0.70 | % | | 0.70 | % | | 0.70 | % | | 0.70 | % |
| Ratio of net investment income to average net assets* | | | 2.28 | % | | 3.66 | % | | 2.91 | % | | 2.84 | % | | 3.09 | % |
Portfolio turnover rate (c) | | | 24 | % | | 46 | % | | 30 | % | | 9 | % | | 25 | % |
| * If certain expenses had not been waived or reimbursed by the Investment Adviser, total return would have been lower and the ratios would have been as follows: | | | | | | | | | | | | | | | | |
| Ratio of total expenses to average net assets | | | 0.81 | % | | 0.75 | % | | 0.81 | % | | 0.80 | % | | 1.11 | % |
| Ratio of net investment income to average net assets | | | 2.18 | % | | 3.61 | % | | 2.80 | % | | 2.74 | % | | 2.68 | % |
| (a) | Based on average shares outstanding during the period. |
| | |
| (b) | Total investment return is calculated assuming a purchase of a share at the beginning of the period and a sale on the last day of the period reported at net asset value (“NAV”). Dividends and distributions are assumed to be reinvested at NAV. Total investment return does not reflect brokerage commissions. A return calculated for a period of less than one year is not annualized. |
| | |
| (c) | Portfolio turnover is not annualized for periods of less than one year and does not include securities received or delivered from processing creations or redemptions. |
| See notes to financial statements. |
| CLAYMORE EXCHANGE-TRADED FUND TRUST 2 ANNUAL REPORT | 57 |
| FINANCIAL HIGHLIGHTS continued | May 31, 2014 |
HGI Guggenheim International Multi-Asset Income ETF
Per share operating performance for a share outstanding throughout the period | | | For the Year Ended May 31, 2014 | | | For the Year Ended May 31, 2013 | | | For the Year Ended May 31, 2012 | | | For the Year Ended May 31, 2011 | | | For the Year Ended May 31, 2010 | |
| Net asset value, beginning of period | | $ | 17.26 | | $ | 15.05 | | $ | 19.98 | | $ | 16.10 | | $ | 14.31 | |
| Income from investment operations | | | | | | | | | | | | | | | | |
Net investment income (a) | | | 0.65 | | | 0.74 | | | 0.86 | | | 0.88 | | | 0.68 | |
| Net realized and unrealized gain (loss) | | | 2.41 | | | 2.22 | | | (4.94 | ) | | 3.80 | | | 1.74 | |
| Total from investment operations | | | 3.06 | | | 2.96 | | | (4.08 | ) | | 4.68 | | | 2.42 | |
| Distributions to shareholders | | | | | | | | | | | | | | | | |
| From and in excess of net investment income | | | (0.68 | ) | | (0.75 | ) | | (0.84 | )(e) | | (0.80 | ) | | (0.63 | ) |
| Return of capital | | | (0.03 | ) | | — | | | (0.01 | )(e) | | — | | | — | |
| Total distribution to shareholders | | | (0.71 | ) | | (0.75 | ) | | (0.85 | ) | | (0.80 | ) | | (0.63 | ) |
| Net asset value, end of period | | $ | 19.61 | | $ | 17.26 | | $ | 15.05 | | $ | 19.98 | | $ | 16.10 | |
| Market value, end of period | | $ | 19.74 | | $ | 17.19 | | $ | 15.09 | | $ | 20.02 | | $ | 16.09 | |
Total return*(b) | | | | | | | | | | | | | | | | |
| Net asset value | | | 18.23 | % | | 20.03 | % | | -20.86 | % | | 29.68 | % | | 16.81 | % |
| Ratios and supplemental data | | | | | | | | | | | | | | | | |
| Net assets, end of period (thousands) | | $ | 33,344 | | $ | 119,116 | | $ | 102,306 | | $ | 101,895 | | $ | 54,736 | |
Ratio of net expenses to average net assets*(c) | | | 0.70 | % | | 0.70 | % | | 0.70 | % | | 0.70 | % | | 0.70 | % |
| Ratio of net investment income to average net assets* | | | 3.70 | % | | 4.45 | % | | 5.04 | % | | 4.71 | % | | 4.01 | % |
Portfolio turnover rate (d) | | | 85 | % | | 60 | % | | 73 | % | | 44 | % | | 42 | % |
| * If certain expenses had not been waived or reimbursed by the Investment Adviser, total return would have been lower and the ratios would have been as follows: | | | | | | | | | | | | | | | | |
Ratio of total expenses to average net assets (c) | | | 0.84 | % | | 0.81 | % | | 0.92 | % | | 0.94 | % | | 1.04 | % |
| Ratio of net investment income to average net assets | | | 3.56 | % | | 4.34 | % | | 4.82 | % | | 4.47 | % | | 3.67 | % |
| (a) | Based on average shares outstanding during the period. |
| | |
| (b) | Total investment return is calculated assuming a purchase of a common share at the beginning of the period and a sale on the last day of the period reported at net asset value (“NAV”). Dividends and distributions are assumed to be reinvested at NAV. Total investment return does not reflect brokerage commissions. A return calculated for a period of less than one year is not annualized. |
| | |
| (c) | Expense ratio does not reflect fees and expenses incurred indirectly by the Fund as a result of its investments in shares of other investment companies. If these fees were included in the expense ratio, the net impact to the expense ratio would be approximately 0.11%, 0.13%, 0.14%, 0.15% and 0.19% for the years ended May 31, 2014, 2013, 2012, 2011 and 2010, respectively. |
| | |
| (d) | Portfolio turnover is not annualized for periods of less than one year and does not include securities received or delivered from processing creations or redemptions. |
| | |
| (e) | Subsequent to May 31, 2012, a reclassification was required that resulted in the recharacterization of the distribution for the May 31, 2012 financial reporting period. This resulted in a less than a $0.01 reclassification between distributions paid to shareholders from net investment income and distributions paid to shareholders from capital. |
| See notes to financial statements. |
| 58 | CLAYMORE EXCHANGE-TRADED FUND TRUST 2 ANNUAL REPORT |
| FINANCIAL HIGHLIGHTS continued | May 31, 2014 |
SEA Guggenheim Shipping ETF
| | | | | | | | | | | | | | |
| | | | | | | | | | | | | For the Period | |
| | | | For the | | | For the | | | For the | | | June 11, 2010* | |
| Per share operating performance | | | Year Ended | | | Year Ended | | | Year Ended | | | through | |
| for a share outstanding throughout the period | | | May 31, 2014 | | | May 31, 2013 | | | May 31, 2012 | | | May 31, 2011 | |
| Net asset value, beginning of period | | $ | 17.51 | | $ | 16.03 | | $ | 24.69 | | $ | 25.96 | |
| Income from investment operations | | | | | | | | | | | | | |
Net investment income (a) | | | 0.56 | | | 0.45 | | | 0.56 | | | 1.10 | |
| Net realized and unrealized gain (loss) | | | 5.06 | | | 1.49 | | | (8.26 | ) | | (1.89 | ) |
| Total from investment operations | | | 5.62 | | | 1.94 | | | (7.70 | ) | | (0.79 | ) |
| Distributions to shareholders | | | | | | | | | | | | | |
| From and in excess of net investment income | | | (0.45 | ) | | (0.46 | ) | | (0.96 | ) | | (0.48 | ) |
| Net asset value, end of period | | $ | 22.68 | | $ | 17.51 | | $ | 16.03 | | $ | 24.69 | |
| Market value, end of period | | $ | 22.69 | | $ | 17.43 | | $ | 15.99 | | $ | 24.67 | |
Total return (b) | | | | | | | | | | | | | |
| Net asset value | | | 32.57 | % | | 12.44 | % | | -31.98 | % | | -3.21 | % |
| Ratios and supplemental data | | | | | | | | | | | | | |
| Net assets, end of period (thousands) | | $ | 117,953 | | $ | 35,011 | | $ | 30,452 | | $ | 12,343 | |
| Ratio of net expenses to average net assets | | | 0.66 | % | | 0.65 | % | | 0.65 | % | | 0.65 | %(c) |
| Ratio of net investment income to average net assets | | | 2.72 | % | | 2.76 | % | | 3.35 | % | | 4.14 | %(c) |
Portfolio turnover rate (d) | | | 18 | % | | 42 | % | | 43 | % | | 28 | % |
| * | Commencement of investment operations. |
| | |
| (a) | Based on average shares outstanding during the period. |
| | |
| (b) | Total investment return is calculated assuming a purchase of a common share at the beginning of the period and a sale on the last day of the period reported at net asset value (“NAV”). Dividends and distributions are assumed to be reinvested at NAV. Total investment return does not reflect brokerage commissions. A return calculated for a period of less than one year is not annualized. |
| | |
| (c) | Annualized. |
| | |
| (d) | Portfolio turnover is not annualized for periods of less than one year and does not include securities received or delivered from processing creations or redemptions. |
| See notes to financial statements. |
| CLAYMORE EXCHANGE-TRADED FUND TRUST 2 ANNUAL REPORT | 59 |
| FINANCIAL HIGHLIGHTS continued | May 31, 2014 |
CUT Guggenheim Timber Index ETF
| | | | | | | | | | | | | | | | | |
| | | | For the | | | For the | | | For the | | | For the | | | For the | |
| Per share operating performance | | | Year Ended | | | Year Ended | | | Year Ended | | | Year Ended | | | Year Ended | |
| for a share outstanding throughout the period | | May 31, 2014 | | | May 31, 2013 | | | May 31, 2012 | | | May 31, 2011 | | | May 31, 2010 | |
| Net asset value, beginning of period | | $ | 22.19 | | $ | 15.71 | | $ | 22.39 | | $ | 17.70 | | $ | 14.53 | |
| Income from investment operations | | | | | | | | | | | | | | | | |
Net investment income (a) | | | 0.53 | | | 0.46 | | | 0.42 | | | 0.94 | | | 0.25 | |
| Net realized and unrealized gain (loss) | | | 3.01 | | | 6.27 | | | (6.71 | ) | | 4.34 | | | 2.97 | |
| Total from investment operations | | | 3.54 | | | 6.73 | | | (6.29 | ) | | 5.28 | | | 3.22 | |
| Distributions to shareholders | | | | | | | | | | | | | | | | |
| From net investment income | | | (0.36 | ) | | (0.25 | ) | | (0.39 | ) | | (0.59 | ) | | (0.05 | ) |
| Net asset value, end of period | | $ | 25.37 | | $ | 22.19 | | $ | 15.71 | | $ | 22.39 | | $ | 17.70 | |
| Market value, end of period | | $ | 25.33 | | $ | 22.10 | | $ | 15.75 | | $ | 22.38 | | $ | 17.65 | |
Total return* (b) | | | | | | | | | | | | | | | | |
| Net asset value | | | 15.93 | % | | 43.01 | % | | -28.20 | % | | 30.15 | % | | 22.15 | % |
| Ratios and supplemental data | | | | | | | | | | | | | | | | |
| Net assets, end of period (thousands) | | $ | 253,668 | | $ | 223,035 | | $ | 106,054 | | $ | 228,386 | | $ | 112,541 | |
| Ratio of net expenses to average net assets* | | | 0.71 | % | | 0.70 | % | | 0.70 | % | | 0.70 | % | | 0.70 | % |
| Ratio of net investment income to average net assets* | | | 2.18 | % | | 2.28 | % | | 2.29 | % | | 4.52 | % | | 1.46 | % |
Portfolio turnover rate (c) | | | 5 | % | | 2 | % | | 56 | % | | 29 | % | | 39 | % |
| * If certain expenses had not been waived or reimbursed by the Investment Adviser, total return would have been lower and the ratios would have been as follows: | | | | | | | | | | | | | | | | |
| Ratio of total expenses to average net assets | | | 0.75 | % | | 0.76 | % | | 0.82 | % | | 0.82 | % | | 0.86 | % |
| Ratio of net investment income to average net assets | | | 2.14 | % | | 2.22 | % | | 2.17 | % | | 4.40 | % | | 1.30 | % |
| (a) | Based on average shares outstanding during the period. |
| | |
| (b) | Total investment return is calculated assuming a purchase of a common share at the beginning of the period and a sale on the last day of the period reported at net asset value (“NAV”). Dividends and distributions are assumed to be reinvested at NAV. Total investment return does not reflect brokerage commissions. A return calculated for a period of less than one year is not annualized. |
| | |
| (c) | Portfolio turnover is not annualized for periods of less than one year and does not include securities received or delivered from processing creations or redemptions. |
| See notes to financial statements. |
| 60 | CLAYMORE EXCHANGE-TRADED FUND TRUST 2 ANNUAL REPORT |
| NOTES TO FINANCIAL STATEMENTS | May 31, 2014 |
Note 1 – Organization:
Claymore Exchange-Traded Fund Trust 2 (the “Trust”), which is registered under the Investment Company Act of 1940, as amended (the “1940 Act”), is an open-end, management investment company that was organized as a Delaware statutory trust on June 8, 2006.
The following seven portfolios have an annual reporting period ended on May 31, 2014:
Guggenheim Canadian Energy Income ETF
Guggenheim China Real Estate ETF
Guggenheim China Small Cap ETF
Guggenheim Frontier Markets ETF
Guggenheim International Multi-Asset Income ETF
Guggenheim Shipping ETF
Guggenheim Timber ETF
Each portfolio represents a separate series of the Trust (each a “Fund” or collectively the “Funds”). Each Fund’s shares are listed and traded on the NYSE Arca, Inc. (“NYSE Arca”). The Funds’ market prices may differ to some degree from the net asset value (“NAV”) of the shares of each Fund. Unlike conventional mutual funds, each Fund issues and redeems shares on a continuous basis, at NAV, only in a large specified number of shares; each called a “Creation Unit.” Creation Units are issued and redeemed principally in-kind for securities included in the relevant index. Except when aggregated in Creation Units, shares are not individually redeemable securities of the Funds. The investment objective of each of the Funds is to correspond generally to the performance, before fees and expenses, of the following market indices:
| | |
| Fund | Index |
| Guggenheim Canadian Energy Income ETF | S&P/TSX Canadian High Income Energy Index |
| Guggenheim China Real Estate ETF | AlphaShares China Real Estate Index |
| Guggenheim China Small Cap ETF | AlphaShares China Small Cap Index |
| Guggenheim Frontier Markets ETF | BNY Mellon New Frontier DR Index |
| Guggenheim International Multi-Asset | Zacks International Multi-Asset |
| Income ETF | Income Index |
| Guggenheim Shipping ETF | Dow Jones Global Shipping Index |
| Guggenheim Timber ETF | Beacon Global Timber Index |
Note 2 – Accounting Policies:
The preparation of the financial statements in accordance with U.S. generally accepted accounting principles (“GAAP”) requires management to make estimates and assumptions that affect the reported amounts and disclosures in the financial statements. Actual results could differ from these estimates.
The following is a summary of the significant accounting policies followed by the Funds.
(a) Valuation of Investments
The Board of Trustees of the Funds (the “Board”) has adopted policies and procedures for the valuation of the Funds’ investments (the “Valuation Procedures”). Pursuant to the Valuation Procedures, the Board has delegated to a valuation committee, consisting of representatives from Guggenheim’s investment management, fund administration, legal and compliance departments (the “Valuation Committee”), the day-to-day responsibility for implementing the Valuation Procedures, including, under most circumstances, the responsibility for determining the fair value of the Funds’ securities or other assets.
Valuations of the Funds’ securities are supplied primarily by pricing services appointed pursuant to the processes set forth in the Valuation Procedures. The Valuation Committee convenes monthly, or more frequently as needed and will review the valuation of all assets which have been fair valued for reasonableness. The Funds’ officers, through the Valuation Committee and consistent with the monitoring and review responsibilities set forth in the Valuation Procedures, regularly review procedures used by, and valuations provided by, the pricing services.
Equity securities listed on an exchange (New York Stock Exchange (“NYSE”) or American Stock Exchange) are valued at the last quoted sales price as of the close of U.S. business on the NYSE, usually 4:00 p.m. on the valuation date. Equity securities listed on the NASDAQ market system are valued at the NASDAQ Official Closing Price on the valuation date, which may not necessarily represent the last sale price. If there has been no sale on such exchange or NASDAQ on such day, the security is valued at the mean of the most recent bid and ask prices on such day.
Open-end investment companies (“Mutual Funds”) are valued at their NAV as of the close of business on the valuation date. Exchange Traded Funds (“ETFs”) and closed-end investment companies are valued at the last quoted sales price.
Debt securities with a maturity of greater than 60 days at acquisition are valued at prices that reflect broker/dealer supplied valuations or are obtained from independent pricing services, which may consider the trade activity, treasury spreads, yields or price of bonds of comparable quality, coupon, maturity, and type, as well as prices quoted by dealers who make markets in such securities. Short-term debt securities with a maturity of 60 days or less at acquisition and repurchase agreements are valued at amortized cost, which approximates market value. Money market funds are valued at net asset value.
Generally, trading in foreign securities markets is substantially completed each day at various times prior to the close of the NYSE. The values of foreign securities are determined as of the close of such foreign markets or the close of the NYSE, if earlier. All investments quoted in foreign currency are valued in U.S. dollars on the basis of the foreign currency exchange
| CLAYMORE EXCHANGE-TRADED FUND TRUST 2 ANNUAL REPORT | 61 |
| NOTES TO FINANCIAL STATEMENTS continued | May 31, 2014 |
rates prevailing at the close of U.S. business at 4:00 p.m. Investments in foreign securities may involve risks not present in domestic investments. The Valuation Committee will determine the current value of such foreign securities by taking into consideration certain factors which may include those discussed above, as well as the following factors, among others: the value of the securities traded on other foreign markets, ADR trading, closed-end fund trading, foreign currency exchange activity, and the trading prices of financial products that are tied to foreign securities such as World Equity Benchmark Securities. In addition, under the Valuation Procedures, the Valuation Committee and Guggenheim Funds Investment Advisors, LLC (“GFIA” or the “Investment Adviser”) are authorized to use prices and other information supplied by a third party pricing vendor in valuing foreign securities.
Investments for which market quotations are not readily available are fair valued as determined in good faith by the Investment Adviser, subject to review by the Valuation Committee, pursuant to methods established or ratified by the Board. Valuations in accordance with these methods are intended to reflect each security’s (or asset’s) “fair value.” Each such determination is based on a consideration of all relevant factors, which are likely to vary from one pricing context to another. Examples of such factors may include, but are not limited to: (i) the type of security, (ii) the initial cost of the security, (iii) the existence of any contractual restrictions on the security’s disposition, (iv) the price and extent of public trading in similar securities of the issuer or of comparable companies, (v) quotations or evaluated prices from broker-dealers and/or pricing services, (vi) information obtained from the issuer, analysts, and/or the appropriate stock exchange (for exchange traded securities), (vii) an analysis of the company’s financial statements, and (viii) an evaluation of the forces that influence the issuer and the market(s) in which the security is purchased and sold (e.g. the existence of pending merger activity, public offerings or tender offers that might affect the value of the security).
(b) Investment Transactions and Investment Income
Investment transactions are accounted for on the trade date for financial reporting purposes. Realized gains and losses on investments are determined on the identified cost basis. Dividend income is recorded net of applicable withholding taxes on the ex-dividend date. Interest income, including the amortization of premiums and accretion of discount, is accrued daily.
The Funds record the character of dividends received from master limited partnerships (“MLPs”) based on estimates made at the time such distributions are received. These estimates are based upon a historical review of information available from each MLP and other industry sources. The characterization of the estimates may subsequently be revised based on information received from MLPs after their tax reporting periods conclude.
Real Estate Investment Trust (“REIT”) distributions received by a Fund are generally comprised of ordinary income, long-term and short-term capital gains and return of capital. The actual character of amounts received during the year is not known until after the REITs’ fiscal year end. A Fund records the character of distributions received from REITs during the year based on historical information available. A Fund’s characterization may be subsequently revised based on information received from REITs after their tax reporting periods conclude.
(c) Currency Translation
Assets and liabilities denominated in foreign currencies are translated into U.S. dollars at the mean of the bid and ask price of respective exchange rates on the last day of the period. Purchases and sales of investments denominated in foreign currencies are translated at the mean of the bid and ask price of respective exchange rates on the date of the transaction.
The Funds do not isolate that portion of the results of operations resulting from changes in foreign exchange rates on investments from the fluctuations arising from changes in market prices of securities held. Such fluctuations are included with the net realized and unrealized gain or loss from investments.
Foreign exchange gain or loss resulting from holding of a foreign currency, expiration of a currency exchange contract, difference in exchange rates between the trade date and settlement date of an investment purchased or sold, and the difference between dividends actually received compared to the amount shown in a Fund’s accounting records on the date of receipt, if any, are included as net realized gains or losses on foreign currency transactions in the Fund’s Statement of Operations.
Foreign exchange gain or loss on assets and liabilities, other than investments, if any, are included in the net change in unrealized appreciation (depreciation) on foreign currency translations in the Funds’ Statement of Operations.
(d) Distributions
The Funds intend to pay substantially all of their net investment income to shareholders. Distribution frequency is as follows:
| Fund | Frequency |
| Guggenheim Canadian Energy Income ETF | Quarterly |
| Guggenheim China Real Estate ETF | Annual |
| Guggenheim China Small Cap ETF | Annual |
| Guggenheim Frontier Markets ETF | Annual |
| Guggenheim International Multi-Asset Income ETF | Quarterly |
| Guggenheim Shipping ETF | Quarterly |
| Guggenheim Timber ETF | Annual |
In addition, the Funds intend to distribute any capital gains to shareholders as capital gain dividends at least annually. The amount and timing of distributions are determined in accordance with federal income tax regulations, which may differ from GAAP.
| 62 | CLAYMORE EXCHANGE-TRADED FUND TRUST 2 ANNUAL REPORT |
| NOTES TO FINANCIAL STATEMENTS continued | May 31, 2014 |
(e) Securities Lending
Each Fund may lend portfolio securities to certain creditworthy borrowers, including the Funds’ securities lending agent. The loans are collateralized at all times by cash and/or high grade debt obligations in an amount at least equal to 102% of the market value of domestic securities loaned and 105% of foreign securities loaned as determined at the close of business on the preceding business day. The cash collateral received is invested with the securities lending agent in an overnight securities lending fund. The overnight securities lending fund is comprised of short-term investments valued at amortized cost, which approximates market value. Each Fund receives compensation for lending securities from interest or dividends earned on the cash, cash equivalents or U.S. government securities held as collateral, net of fee rebates paid to the borrower plus reasonable administrative and custody fees paid to the lending agent. Such compensation is accrued daily and payable to the Fund monthly. The dividend and interest income earned on the securities loaned is accounted for in the same manner as other dividend and interest income. The borrower pays to the Funds an amount equal to any dividends or interest received on loaned securities. These payments from the borrower are not eligible for reduced tax rates as “qualified dividend income” under the Jobs and Growth Tax Reconciliation Act of 2003. The Funds retain all or a portion of the interest received on investments of cash collateral or receive a fee from the borrower. Lending portfolio securities could result in a loss or delay in recovering each Fund’s securities if the borrower defaults. The securities lending income earned by the Funds is disclosed on the Statement of Operations.
(f) Offsetting Assets and Liabilities
In December 2011, the Financial Accounting Standards Board (“FASB”) issued an Accounting Standards Update (“ASU”) No. 2011-11: Disclosures about Offsetting Assets and Liabilities (“netting”) on the Statements of Assets and Liabilities that are subject to master netting arrangements or similar agreements. ASU 2011-11, was amended by ASU No. 2013-01, which clarified which investments and transactions are subject to the netting disclosure. The scope of the disclosure requirements is limited to derivative instruments, repurchase agreements and reverse repurchase agreements, and securities borrowing and securities lending transactions to the extent they are subject to an enforceable master netting arrangement or similar agreement. This information will enable users of the Funds’ financial statements to evaluate the effect or potential effect of netting arrangements on the Funds’ financial position. The ASU is effective for financial statements with fiscal years beginning on or after January 1, 2013, and interim periods within those fiscal years. The Funds adopted the disclosure requirement on netting for the current reporting period. For financial reporting purposes, the Funds do not offset financial assets and financial liabilities across derivative types that are subject to master netting arrangements or similar agreements on the Statement of Assets and Liabilities. Therefore, all qualifying transactions are presented on a gross basis in the Statement of Assets and Liabilities. As of May 31, 2014, the impact of netting of assets and liabilities and the offsetting of collateral pledged or received based on contractual netting/offsetting provisions are detailed in the following table. Collateral is disclosed up to 100% of the market value of the respective instrument. In general, collateral received exceeds the market value of the financial instrument. Refer to the Schedule of Investments for collateral received as of May 31, 2014.
| | | | | | | | | | | | | | | | | | | |
| Fund | | Description | | Gross Amounts of Recognized Assets | | Gross Amounts Offset in the Statements of Assets and Liabilities | | Net Amounts of Assets Presented in the Statements of Assets and Liabilities | | Financial Instruments and Cash Collateral Received | | Net Amount | |
| Guggenheim Canadian Energy Income ETF | | Securities Lending | | $ | 17,818,154 | | $ | — | | $ | 17,818,154 | | $ | (17,818,154 | ) | $ | — | |
| Guggenheim China Real Estate ETF | | Securities Lending | | | 830,116 | | | — | | | 830,116 | | | (830,116 | ) | | — | |
| Guggenheim China Small Cap ETF | | Securities Lending | | | 30,709,904 | | | — | | | 30,709,904 | | | (30,709,904 | ) | | — | |
| Guggenheim Frontier Markets ETF | | Securities Lending | | | 19,161,008 | | | — | | | 19,161,008 | | | (19,161,008 | ) | | — | |
| Guggenheim International Multi-Asset Income ETF | | Securities Lending | | | 3,486,643 | | | — | | | 3,486,643 | | | (3,486,643 | ) | | — | |
| Guggenheim Shipping ETF | | Securities Lending | | | 14,195,388 | | | — | | | 14,195,388 | | | (14,195,388 | ) | | — | |
| Guggenheim Timber ETF | | Securities Lending | | | 28,302,452 | | | — | | | 28,302,452 | | | (28,302,452 | ) | | — | |
Note 3 – Investment Advisory Agreement, Sub-Advisory Agreement and Other Agreements:
Pursuant to an Investment Advisory Agreement (the “Agreement”) between the Trust, on behalf of each Fund, and GFIA, the Investment Adviser manages the investment and reinvestment of each Fund’s assets and administers the affairs of each Fund to the extent requested by the Board of Trustees.
Pursuant to the Agreement, each Fund listed in the following table pays the Investment Adviser an advisory fee. The advisory fee is payable on a monthly basis at the annual rate set forth below based on each Fund’s average daily net assets:
| | | | |
| Fund | | Rate |
| Guggenheim Canadian Energy Income ETF | | 0.50 | % |
| Guggenheim China Real Estate ETF | | 0.50 | % |
| Guggenheim China Small Cap ETF | | 0.55 | % |
| Guggenheim Frontier Markets ETF | | 0.50 | % |
| Guggenheim International Multi-Asset Income ETF | | 0.50 | % |
| Guggenheim Timber ETF | | 0.50 | % |
Pursuant to the Agreement, each Fund listed in the following table pays the Investment Adviser a unitary management fee for the services and
| CLAYMORE EXCHANGE-TRADED FUND TRUST 2 ANNUAL REPORT | 63 |
| NOTES TO FINANCIAL STATEMENTS continued | May 31, 2014 |
facilities it provides. The unitary management fee is payable on a monthly basis at the annual rate set forth below based on each Fund’s average daily net assets:
| | | | |
| Fund | | Rate |
| Guggenheim Shipping ETF | | 0.65 | % |
Out of the unitary management fee, the Investment Adviser pays substantially all the expenses of each Fund, including the cost of transfer agency, custody, fund administration, legal, audit and other services, except for the fee payments under the Agreement, distribution fees, if any, brokerage expenses, taxes, interest, litigation expenses and other extraordinary expenses.
Rydex Fund Services, LLC (“RFS”), an affiliate of the Adviser, provides fund administration services to the Funds. As compensation for these services RFS receives a fund administration fee payable monthly at the annual rate set forth below as a percentage of the average daily net assets of each Fund:
| | | | |
| Net Assets | | Rate |
| First $200,000,000 | | 0.0275 | % |
| Next $300,000,000 | | 0.0200 | % |
| Next $500,000,000 | | 0.0150 | % |
| Over $1,000,000,000 | | 0.0100 | % |
For the year ended May 31, 2014, the following Funds recognized Fund Administration expenses as follows:
| | | | |
| | Fund Administration |
| | | | Expense |
| Guggenheim Canadian Energy Income ETF | | $ | 13,759 |
| Guggenheim China Real Estate ETF | | | 8,978 |
| Guggenheim China Small Cap ETF | | | 59,675 |
| Guggenheim Frontier Markets ETF | | | 24,383 |
| Guggenheim International Multi-Asset Income ETF | | | 18,166 |
| Guggenheim Timber ETF | | | 66,112 |
Due to its unitary management fee structure, the Guggenheim Shipping ETF does not pay a separate Fund Administration fee.
The Bank of New York Mellon Corp. (“BNY”) acts as the Funds’ custodian, accounting agent, transfer agent and securities lending agent. As custodian, BNY is responsible for the custody of the Funds’ assets. As accounting agent, BNY is responsible for maintaining the books and records of the Funds. As transfer agent, BNY is responsible for performing transfer agency services for the Funds. As securities lending agent, BNY is responsible for executing the lending of portfolio securities to creditworthy borrowers.
The Investment Adviser has contractually agreed to waive fees and/or pay Fund expenses to the extent necessary to prevent the operating expenses of each Fund, not including the Guggenheim Shipping ETF, (excluding interest expense, a portion of the Fund’s licensing fees, offering costs, brokerage commissions and other trading expenses, taxes and extraordinary expenses such as litigation and other expenses not incurred in the ordinary course of the Fund’s business), from exceeding the following percentages of average net assets per year, at least until December 31, 2016.
| | | | |
| Fund | | Rate |
| Guggenheim Canadian Energy Income ETF | | 0.65 | % |
| Guggenheim China Real Estate ETF | | 0.65 | % |
| Guggenheim China Small Cap ETF | | 0.70 | % |
| Guggenheim Frontier Markets ETF | | 0.65 | % |
| Guggenheim International Multi-Asset Income ETF | | 0.65 | % |
| Guggenheim Timber ETF | | 0.65 | % |
For the year ended May 31, 2014, the Investment Adviser waived Advisory Fees as follows:
| | | | |
| | | | Advisory |
| | | | Fees |
| | | | Waived |
| Guggenheim Canadian Energy Income ETF | | $ | 46,496 |
| Guggenheim China Real Estate ETF | | | 77,861 |
| Guggenheim China Small Cap ETF | | | 182,054 |
| Guggenheim Frontier Markets ETF | | | 85,915 |
| Guggenheim International Multi-Asset Income ETF | | | 90,781 |
| Guggenheim Timber ETF | | | 106,372 |
Amounts owed to each Fund from the Investment Adviser are shown in the Statement of Assets and Liabilities. This receivable is settled on a quarterly basis.
Certain officers and trustees of the Trust may also be officers, directors and/or employees of the Investment Adviser. The Trust does not compensate its officers or trustees who are officers, directors and/or employees of the Investment Adviser.
Licensing Fee Agreements:
The Investment Adviser has entered into licensing agreements on behalf of each Fund with the following Licensors:
| | |
| Fund | Licensor |
| Guggenheim Canadian Energy Income ETF | Standard & Poor’s |
| Guggenheim China Real Estate ETF | AlphaShares LLC |
| Guggenheim China Small Cap ETF | AlphaShares LLC |
| Guggenheim Frontier Markets ETF | The Bank of New York Mellon Corp. |
| Guggenheim International Multi-Asset Income ETF | Zacks Investment Research, Inc. |
| Guggenheim Shipping ETF | CME Group Index Services LLC |
| Guggenheim Timber ETF | Beacon Indexes LLC |
The Funds are not sponsored, endorsed, sold or promoted by the Licensors and the Licensors make no representation regarding the advisability of investing in shares of the Funds. Up to 5 basis points of licensing fees are excluded from the expense cap for the Funds without a unitary management fee.
Note 4 – Fair Value Measurement:
In accordance with U.S. GAAP, fair value is defined as the price that the Funds would receive to sell an investment or pay to transfer a liability in an orderly transaction with an independent buyer in the principal market, or
| 64 | CLAYMORE EXCHANGE-TRADED FUND TRUST 2 ANNUAL REPORT |
| NOTES TO FINANCIAL STATEMENTS continued | May 31, 2014 |
in the absence of a principal market, the most advantageous market for the investment or liability. U.S GAAP establishes a three-tier fair value hierarchy based on the types of inputs used to value assets and liabilities and requires corresponding disclosure. The hierarchy and the corresponding inputs are summarized below:
Level 1 — quoted prices in active markets for identical assets or liabilities.
Level 2 — significant other observable inputs (for example quoted prices for securities that are similar based on characteristics such as interest rates, prepayment speeds, credit risk, etc.).
Level 3 — significant unobservable inputs based on the best information available under the circumstances, to the extent observable inputs are not available, which may include assumptions.
The types of inputs available depend on a variety of factors, such as the type of security and the characteristics of the markets in which it trades, if any. Fair valuation determinations that rely on fewer or no observable inputs require greater judgment. Accordingly, fair value determinations for Level 3 securities require the greatest amount of judgment.
The following tables summarize the inputs used to value the Funds’ investments at May 31, 2014:
| | | | | | | | | | | | | | |
| Guggenheim China Small Cap ETF | | | | | | | | | | | | | |
| | | | | | | | | | | | | | |
| Description | | | Level 1 | | | Level 2 | | | Level 3 | | | Total | |
| (value in $000s) | | | | | | | | | | | | | |
| Assets: | | | | | | | | | | | | | |
| Common Stocks | | $ | 201,999 | | $ | 1,562 | | $ | 1,604 | | $ | 205,165 | |
| Right | | | — | | | 48 | | | — | | | 48 | |
| Investments of Collateral for Securities Loaned | | | 34,081 | | | — | | | — | | | 34,081 | |
| Total | | $ | 236,080 | | $ | 1,610 | | $ | 1,604 | | $ | 239,294 | |
All securities held by Guggenheim Canadian Energy Income ETF, Guggenheim China Real Estate ETF, Guggenheim Frontier Markets ETF, Guggenheim International Multi-Asset Income ETF, Guggenheim Shipping ETF and Guggenheim Timber ETF were valued using quoted prices in active markets (Level 1).
Independent pricing services are used to value a majority of the Funds’ investments. When values are not available from a pricing service, they will be determined under the valuation policies that have been reviewed and approved by the Board of Trustees. In any event, values are determined using a variety of sources and techniques, including: market prices; broker quotes; and models which derive prices based on inputs such as prices of securities with comparable maturities and characteristics or based on inputs. The inputs or methodologies used for valuing securities are not necessarily an indication of the risk associated with investing in those securities. The suitability of the techniques and sources employed to determine fair valuation are regularly monitored and subject to change.
The following is a summary of significant unobservable inputs used in the fair valuation of assets and liabilities categorized within Level 3 of the fair value hierarchy:
| Guggenheim China Small Cap ETF | | | | | |
| | | | | | |
| Ending Balance | | | |
| Category | | at 5/31/14 | | Valuation Technique | Unobservable Inputs |
| Common Stocks | $ | 1,604,456 | | Last Trade with Adjustment | 10%-58% Discount |
Transfers between investment levels may occur as the markets fluctuate and/or the availability of data used in an investment’s valuation changes. Transfers between valuation levels, if any, are in comparison to the valuation levels at the end of the previous fiscal year, and are effective using the fair value as of the end of the current fiscal period.
There were no transfers between levels for Guggenheim Canadian Energy Income ETF, Guggenheim International Multi-Asset Income ETF, Guggenheim Shipping ETF, Guggenheim Frontier Markets ETF and Guggenheim Timber ETF for the year ended May 31, 2014.
The transfers in and out of the valuation levels as of May 31, 2014 compared to the valuation levels at the end of the previous fiscal year are detailed below:
| | | | |
| Guggenheim China Small Cap ETF | | | |
| Transfer from Level 1 to Level 2 (in $000s) | $ | 1,562 | |
| Transfer from Level 1 to Level 3 (in $000s) | $ | 584 | |
| Transfer from Level 2 to Level 3 (in $000s) | $ | 813 | |
Summary of Fair Value Level 3 Activity
Following is a reconciliation of Level 3 assets for which significant unobservable inputs were used to determine fair value for the period ended May 31, 2014:
| | | | |
| LEVEL 3- Fair Value measurement | | | |
| using significant unobservable inputs (in $000s) | | | |
| Beginning Balance at 5/31/13 | $ | 1,304 | |
| Net Realized Gain/Loss | | (5,008 | ) |
| Change in Unrealized Gain/Loss | | 3,864 | |
| Purchases | | 153 | |
| Sales | | (106 | ) |
| Transfers In | | 1,397 | |
| Transfers Out | | — | |
| | | | |
| Ending Balance at 5/31/14 | $ | 1,604 | |
Note 5 – Federal Income Taxes:
The Funds intend to comply with the requirements of Subchapter M of the Internal Revenue Code of 1986, as amended (the “Internal Revenue Code”), applicable to regulated investment companies. Accordingly, no provision for U.S. federal income taxes is required. In addition, by distributing substantially all of its ordinary income and long-term capital gains, if any, during each calendar year, each Fund intends not to be subject to U.S. federal excise tax.
| CLAYMORE EXCHANGE-TRADED FUND TRUST 2 ANNUAL REPORT | 65 |
| NOTES TO FINANCIAL STATEMENTS continued | May 31, 2014 |
At May 31, 2014, the cost of investments, accumulated unrealized appreciation/depreciation on investments, excluding foreign currency, for federal income tax purposes were as follows:
| | | Cost of Investments for Tax Purposes | | Gross Tax Unrealized Appreciation | | Gross Tax Unrealized Depreciation | | Net Tax Unrealized Appreciation (Depreciation) on Investments | |
| Guggenheim Canadian Energy Income ETF | | $ | 60,151,087 | | $ | 5,546,117 | | $ | (1,111,158 | ) | $ | 4,434,959 | |
| Guggenheim China Real Estate ETF | | | 27,195,245 | | | 557,198 | | | (4,449,883 | ) | | (3,892,685 | ) |
| Guggenheim China Small Cap ETF | | | 278,132,342 | | | 19,125,823 | | | (57,964,270 | ) | | (38,838,447 | ) |
| Guggenheim Frontier Markets ETF | | | 123,809,176 | | | 7,616,993 | | | (24,614,528 | ) | | (16,997,535 | ) |
| Guggenheim International Multi-Asset Income ETF | | | 34,951,535 | | | 2,685,127 | | | (823,313 | ) | | 1,861,814 | |
| Guggenheim Shipping ETF | | | 123,297,688 | | | 12,608,579 | | | (3,740,810 | ) | | 8,867,769 | |
| Guggenheim Timber ETF | | | 239,360,805 | | | 51,710,170 | | | (8,641,814 | ) | | 43,068,356 | |
Tax components of accumulated earnings as of May 31, 2014, were as follows:
| | | | | | | | | | | |
| | | Undistributed Ordinary Income | | Undistributed Long-Term Gains (Accumulated Capital & Other Losses) | | Unrealized Appreciation (Depreciation) | |
| Guggenheim Canadian Energy | | | | | | | | | | |
| Income ETF | | $ | — | | $ | (83,918,881 | ) | $ | 4,435,164 | |
| Guggenheim China Real Estate ETF | | | 218,801 | | | (13,503,793 | ) | | (3,892,674 | ) |
| Guggenheim China Small Cap ETF | | | 1,800,365 | | | (42,847,295 | ) | | (38,838,614 | ) |
| Guggenheim Frontier Markets ETF | | | 1,809,486 | | | (36,610,727 | ) | | (16,997,535 | ) |
| Guggenheim International | | | | | | | | | | |
| Multi-Asset Income ETF | | | — | | | (35,283,708 | ) | | 1,863,646 | |
| Guggenheim Shipping ETF | | | 1,367,665 | | | (6,728,452 | ) | | 8,868,200 | |
| Guggenheim Timber ETF | | | 2,761,706 | | | (44,526,948 | ) | | 43,070,732 | |
At May 31, 2014 the following reclassifications were made to the capital accounts of the Funds, to reflect permanent book/tax differences and income and gains available for distributions under income tax regulations, which are primarily due to the inherent differences between book and tax treatment of investment in real estate investment trusts, investments in partnerships, wash sales from redemption in-kind transactions, return of capital, and net investment losses. Net investment income, net realized gains and net assets were not affected by these changes.
| | | | | | | | | | | |
| | | | Undistributed | | | Accumulated | | | | |
| | | | Net Investment | | | Net Realized | | | Paid In | |
| Fund | | | Income/(Loss) | | | Gain/(Loss) | | | Capital | |
| Guggenheim Canadian | | | | | | | | | | |
| Energy Income ETF | | $ | (92,523 | ) | $ | (490,747 | ) | $ | 583,270 | |
| Guggenheim China Real | | | | | | | | | | |
| Estate ETF | | | 5,604 | | | 2,171,808 | | | (2,177,412 | ) |
| Guggenheim China | | | | | | | | | | |
| Small Cap ETF | | | 501,962 | | | (3,313,280 | ) | | 2,811,318 | |
| Guggenheim Frontier | | | | | | | | | | |
| Markets ETF | | | — | | | 2,704,917 | | | (2,704,917 | ) |
| Guggenheim International | | | | | | | | | | |
| Multi-Asset Income ETF | | | 401,750 | | | (14,102,929 | ) | | 13,701,179 | |
| Guggenheim Shipping ETF | | | 219,585 | | | (10,371,043 | ) | | 10,151,458 | |
| Guggenheim Timber ETF | | | (1,241,082 | ) | | (10,793,374 | ) | | 12,034,456 | |
Distributions to Shareholders:
The tax character of distributions paid during the year ended May 31, 2014 was as follows:
| | Distributions paid from Ordinary Income |
| Guggenheim Canadian Energy Income ETF | $ | 1,376,379 |
| Guggenheim China Real Estate ETF | | 1,049,720 |
| Guggenheim China Small Cap ETF | | 5,497,350 |
| Guggenheim Frontier Markets ETF | | 3,454,980 |
| Guggenheim International Multi-Asset Income ETF | | 2,871,907 |
| Guggenheim Shipping ETF | | 1,425,100 |
| Guggenheim Timber ETF | | 3,906,000 |
| | | |
| | Distributions paid from Return of Capital |
| Guggenheim Canadian Energy Income ETF | $ | 189,681 |
| Guggenheim International Multi-Asset Income ETF | | 135,093 |
The tax character of distributions paid during the year ended May 31, 2013 was as follows:
| | Distributions paid from Ordinary Income |
| Guggenheim Canadian Energy Income ETF | $ | 2,182,941 |
| Guggenheim China Real Estate ETF | | 1,381,280 |
| Guggenheim China Small Cap ETF | | 4,003,500 |
| Guggenheim Frontier Markets ETF | | 4,819,580 |
| Guggenheim International Multi-Asset Income ETF | | 5,238,200 |
| Guggenheim Shipping ETF | | 852,200 |
| Guggenheim Timber ETF | | 2,441,450 |
| | |
| | Distributions paid from Return of Capital |
| Guggenheim Canadian Energy Income ETF | $ | 125,469 |
| 66 | CLAYMORE EXCHANGE-TRADED FUND TRUST 2 ANNUAL REPORT |
| NOTES TO FINANCIAL STATEMENTS continued | May 31, 2014 |
At May 31, 2014, for federal income tax purposes, the Funds have capital loss carryforwards available as shown in the table below, to the extent provided by the regulations, to offset future capital gains through the years indicated. To the extent that these loss carryforwards are used to offset future capital gains, it is probable that the capital gains so offset will not be distributed to shareholders. Per the Regulated Investment Company Modernization Act of 2010, capital loss carryforwards generated in taxable years beginning after December 22, 2010 must be fully used before capital loss carryforwards generated in taxable years prior to December 22, 2010 are used; therefore, under certain circumstances, capital loss carryforwards available as of the report date, if any, may expire unused.
| | | | Expires | | | Expires | | | Expires | | | Expires | | | Expires | | | Unlimited | | | Unlimited | | | Capital Loss | |
| | | | in 2015 | | | in 2016 | | | in 2017 | | | in 2018 | | | in 2019 | | Short-Term | | | Long-Term | | | Carryforward | |
| Guggenheim | | | | | | | | | | | | | | | | | | | | | | | | | |
| Canadian Energy | | | | | | | | | | | | | | | | | | | | | | | | | |
| Income ETF | | $ | — | | $ | — | | $ | 3,622,034 | | $ | 12,656,635 | | $ | 713,500 | | $ | 47,327,656 | | $ | 19,599,056 | | $ | 83,918,881 | |
| | | | | | | | | | | | | | | | | | | | | | | | | | |
| Guggenheim | | | | | | | | | | | | | | | | | | | | | | | | | |
| China Real | | | | | | | | | | | | | | | | | | | | | | | | | |
| Estate ETF | | | — | | | — | | | — | | | 4,375,466 | | | 6,818,237 | | | 678,844 | | | 1,631,246 | | | 13,503,793 | |
| | | | | | | | | | | | | | | | | | | | | | | | | | |
| Guggenheim | | | | | | | | | | | | | | | | | | | | | | | | | |
| China Small | | | | | | | | | | | | | | | | | | | | | | | | | |
| Cap ETF | | | — | | | — | | | — | | | 5,907,224 | | | — | | | 1,463,904 | | | 35,476,167 | | | 42,847,295 | |
| | | | | | | | | | | | | | | | | | | | | | | | | | |
| Guggenheim | | | | | | | | | | | | | | | | | | | | | | | | | |
| Frontier Markets ETF | | | — | | | — | | | 241,589 | | | 3,686,218 | | | 364,152 | | | 5,944,054 | | | 26,374,714 | | | 36,610,727 | |
| | | | | | | | | | | | | | | | | | | | | | | | | | |
| Guggenheim | | | | | | | | | | | | | | | | | | | | | | | | | |
| International | | | | | | | | | | | | | | | | | | | | | | | | | |
| Multi–Asset | | | | | | | | | | | | | | | | | | | | | | | | | |
| Income ETF | | | — | | | 434,730 | | | 2,191,498 | | | 3,876,528 | | | 2,491,614 | | | 16,389,044 | | | 9,900,294 | | | 35,283,708 | |
| | | | | | | | | | | | | | | | | | | | | | | | | | |
| Guggenheim | | | | | | | | | | | | | | | | | | | | | | | | | |
| Shipping ETF | | | — | | | — | | | — | | | — | | | — | | | 1,678,109 | | | 5,050,343 | | | 6,728,452 | |
| | | | | | | | | | | | | | | | | | | | | | | | | | |
| Guggenheim | | | | | | | | | | | | | | | | | | | | | | | | | |
| Timber ETF | | | — | | | — | | | 3,822,255 | | | 17,944,749 | | | 1,561,810 | | | 12,923,951 | | | 8,274,183 | | | 44,526,948 | |
Tax basis capital losses in excess of capital gains are carried forward to offset future net capital gains. For the year ended May 31, 2014, the following capital loss carryforward amounts were expired or used:
| | | | | |
| Fund | | | Amount Utilized | |
| Guggenheim China Small Cap ETF | | $ | 4,435,793 | |
Capital and foreign currency losses incurred after October 31 (“post-October losses”) within the taxable year are deemed to arise on the first business day of each Fund’s next taxable year. During the year ended May 31, 2014, none of the Funds incurred nor will elect to defer any current year post-October losses.
For all open tax years and all major jurisdictions, management of the Trust has concluded that there are no significant uncertain tax positions that would require recognition in the financial statements. Uncertain tax positions are tax positions taken or expected to be taken in the course of preparing each Fund’s tax returns that would not meet a more-likely-than not threshold of being sustained by the applicable tax authority and would be recorded as a tax expense in the current year. Open tax years are those that are open for examination by taxing authorities (i.e. generally the last four tax year ends and the interim tax period since then). Furthermore, management of the Trust is also not aware of any tax positions for which it is reasonably possible that the total amounts of unrecognized tax benefits will significantly change in the next twelve months.
Note 6 – Investment Transactions:
For the year ended May 31, 2014, the cost of investments purchased and proceeds from sales of investments, excluding short-term investments and in-kind transactions, were as follows:
| | | | | | | | |
| | | | Purchases | | | Sales | |
| Guggenheim Canadian Energy Income ETF | | $ | 39,859,287 | | $ | 40,295,548 | |
| Guggenheim China Real Estate ETF | | | 2,932,048 | | | 3,332,098 | |
| Guggenheim China Small Cap ETF | | | 63,988,175 | | | 65,175,692 | |
| Guggenheim Frontier Markets ETF | | | 21,462,092 | | | 22,778,196 | |
| Guggenheim International Multi-Asset Income ETF | | | 53,348,010 | | | 54,794,228 | |
| Guggenheim Shipping ETF | | | 16,497,088 | | | 15,021,595 | |
| Guggenheim Timber ETF | | | 13,672,231 | | | 12,294,732 | |
For the year ended May 31, 2014, in-kind transactions were as follows:
| | | | | | | | |
| | | | Purchases | | | Sales | |
| Guggenheim Canadian Energy Income ETF | | $ | 3,706,585 | | $ | 23,379,262 | |
| Guggenheim China Real Estate ETF | | | 228,934 | | | 24,062,595 | |
| Guggenheim China Small Cap ETF | | | 69,557,632 | | | 90,910,901 | |
| Guggenheim Frontier Markets ETF | | | 3,195,491 | | | 22,896,433 | |
| Guggenheim International Multi-Asset Income ETF | | | 31,706,923 | | | 125,461,272 | |
| Guggenheim Shipping ETF | | | 100,515,972 | | | 36,465,809 | |
| Guggenheim Timber ETF | | | 33,311,394 | | | 34,405,152 | |
| CLAYMORE EXCHANGE-TRADED FUND TRUST 2 ANNUAL REPORT | 67 |
| NOTES TO FINANCIAL STATEMENTS continued | May 31, 2014 |
Note 7 – Capital:
Shares are issued and redeemed by the Funds only in creation unit size aggregations of 50,000 to 100,000 shares. Transactions are permitted on an in-kind basis, with a separate cash payment, which is balancing each component to equate the transaction to the net asset value per share of the Fund on the transaction date. Transaction fees ranging from $500 to $4,000 are charged to those persons creating or redeeming creation units. An additional charge on the transaction may be imposed with respect to transactions effected outside of the clearing process or to the extent that cash is used in lieu of securities to purchase creation units or redeem for cash.
Note 8 – Distribution and Service Plan:
The Board of Trustees has adopted a distribution and service plan (the “Plan”) pursuant to Rule 12b-1 under the 1940 Act. Under the Plan, each Fund is authorized to pay distribution fees in connection with the sale and distribution of its shares and pay service fees in connection with the provision of ongoing services to shareholders and the maintenance of shareholder accounts in an amount up to 0.25% of its average daily net assets each year. No 12b-1 fees are currently paid by the Funds, and there are no current plans to impose these fees. No such fee may be paid in the future without further approval by the Board of Trustees.
Note 9 – Indemnifications:
In the normal course of business, the Funds enter into contracts that contain a variety of representations, which provide general indemnifications. Each Fund’s maximum exposure under these arrangements is unknown, as this would require future claims that may be made against a Fund that have not yet occurred. However, the Funds expect the risk of loss to be remote.
Note 10 – Subsequent Event:
The Funds evaluated subsequent events through the date the financial statements were available for issue and determined there were no additional material events that would require disclosure in the Funds’ financial statements, except as noted below.
Subsequent to May 31, 2014, the Board of Trustees declared the following distributions payable on June 30, 2014 to shareholders of record on June 26, 2014. The distribution rates per share were as follows:
| | | | | |
| | | | Income | |
| Fund | | | Distribution | |
| Guggenheim Canadian Energy Income ETF | | $ | 0.101 | |
| Guggenheim International Multi-Asset Income ETF | | | 0.165 | |
| Guggenheim Shipping ETF | | | 0.258 | |
| 68 | CLAYMORE EXCHANGE-TRADED FUND TRUST 2 ANNUAL REPORT |
| REPORT OF INDEPENDENT REGISTERED PUBLIC ACCOUNTING FIRM | May 31, 2014 |
The Board of Trustees and Shareholders of Claymore Exchange-Traded Fund Trust 2
We have audited the accompanying statements of assets and liabilities, including the portfolios of investments, of Guggenheim Canadian Energy Income ETF, Guggenheim China Real Estate ETF, Guggenheim China Small Cap ETF, Guggenheim Frontier Markets ETF, Guggenheim International Multi-Asset Income ETF, Guggenheim Shipping ETF, and Guggenheim Timber ETF (seven of the portfolios constituting the Claymore Exchange-Traded Fund Trust 2 (the Trust)) as of May 31, 2014, and the related statements of operations for the year then ended, the statements of changes in net assets for each of the two years in the period then ended, and the financials highlights for the periods indicated therein. These financial statements and financial highlights are the responsibility of the Trust’s management. Our responsibility is to express an opinion on these financial statements and financial highlights based on our audits.
We conducted our audits in accordance with the standards of the Public Company Accounting Oversight Board (United States). Those standards require that we plan and perform the audit to obtain reasonable assurance about whether the financial statements and financial highlights are free of material misstatement. We were not engaged to perform an audit of the Trust’s internal control over financial reporting. Our audits included consideration of internal control over financial reporting as a basis for designing audit procedures that are appropriate in the circumstances, but not for the purpose of expressing an opinion on the effectiveness of the Trust’s internal control over financial reporting. Accordingly, we express no such opinion. An audit also includes examining, on a test basis, evidence supporting the amounts and disclosures in the financial statements and financial highlights, assessing the accounting principles used and significant estimates made by management, and evaluating the overall financial statement presentation. Our procedures included confirmation of securities owned as of May 31, 2014, by correspondence with the custodian and brokers or by other appropriate auditing procedures where replies from brokers were not received. We believe that our audits provide a reasonable basis for our opinion.
In our opinion, the financial statements and financial highlights referred to above present fairly, in all material respects, the financial position of each of the respective seven portfolios constituting the Claymore Exchange-Traded Fund Trust 2 at May 31, 2014, the results of their operations for the year then ended, the changes in their net assets for each of the two years in the period then ended, and the financial highlights for the periods indicated therein, in conformity with U.S. generally accepted accounting principles.
Chicago, Illinois
July 28, 2014
| CLAYMORE EXCHANGE-TRADED FUND TRUST 2 ANNUAL REPORT | 69 |
| SUPPLEMENTAL INFORMATION (Unaudited) | May 31, 2014 |
Federal Income Tax Information
In January 2015, shareholders will be advised on IRS Form 1099 DIV or substitute 1099DIV as to the federal tax status of the distributions received by shareholders in the calendar year 2014.
The Trust’s investment income(dividend income plus short-term gains, if any) qualifies as follows:
Guggenheim Canadian Energy Income ETF intends to designate $256,770 of foreign withholding on foreign source income of $1,706,213.
Guggenheim China Small Cap ETF intends to designate $122,293 of foreign withholding on foreign source income of $4,307,107.
Guggenheim Frontier Markets ETF intends to designate $377,339 of foreign withholding on foreign source income of $2,387,996.
Guggenheim International Multi-Asset Income ETF intends to designate $93,223 of foreign withholding on foreign source income of $1,829,281.
Guggenheim Shipping ETF intends to designate $113,706 of foreign withholding on foreign source income of $2,015,250.
Guggenheim Timber ETF intends to designate $207,533 of foreign withholding on foreign source income of $4,842,588.
The Trust’s investment income (dividend income plus short-term gain, if any) qualifies as follows:
| | | | | | | | |
| | | | Qualified | | | Dividend | |
| Fund | | | dividend income | | | received deduction | |
| Guggenheim Canadian Energy Income ETF | | | 100.00 | % | | 0.00 | % |
| Guggenheim China Real Estate ETF | | | 0.00 | % | | 0.00 | % |
| Guggenheim China Small Cap ETF | | | 9.90 | % | | 0.00 | % |
| Guggenheim Frontier Markets ETF | | | 63.05 | % | | 0.00 | % |
| Guggenheim International Multi-Asset Income ETF | | | 19.14 | % | | 0.00 | % |
| Guggenheim Shipping ETF | | | 62.90 | % | | 3.45 | % |
| Guggenheim Timber ETF | | | 74.50 | % | | 31.09 | % |
Trustees(a)
The Trustees of the Trust and their principal business occupations during the past five years:
Name, Address* and Year of Birth | | Position(s) Held with Trust | | Term of Office and Length of Time Served** | | Principal Occupation(s) During Past Five Years | | Number of Portfolios in Fund Complex Overseen | | Other Directorships Held by Trustees |
| Independent Trustees: | | | | | | | | |
| Randall C. Barnes (1951) | | Trustee | | Since 2006 | | Current: Private Investor (2001-present). Former: Senior Vice President and Treasurer, PepsiCo, Inc. (1993-1997); President, Pizza Hut International (1991-1993); Senior Vice President, Strategic Planning and New Business Development, PepsiCo, Inc. (1987-1990). | | 86 | | None. |
| Donald A. Chubb, Jr. (1946 ) | | Trustee and Vice Chairman of the Board | | Since 2014 | | Current: Business broker and manager of commercial real estate, Griffith & Blair, Inc. (1997-present). | | 82 | | None. |
| Jerry B. Farley (1946) | | Trustee and Vice Chairman of the Audit Committee | | Since 2014 | | Current: President, Washburn University (1997-present). | | 82 | | Current: Westar Energy, Inc. (2004- present); CoreFirst Bank & Trust (2000-present). |
| Roman Friedrich III (1946) | | Trustee and Chairman of the Contracts Review Committee | | Since 2010 | | Current: Founder and President, Roman Friedrich & Company (1998-present). Former: Senior Managing Director, MLV & Co. LLC (2010-2011). | | 82 | | Current: Mercator Minerals Ltd. (2013-present); Zincore Metals, Inc. (2009-present). Former: First Americas Gold Corp. (2012-2014); Blue Sky Uranium Corp. (2011-2012); Axiom Gold and Silver Corp. (2011-2012); Stratagold Corp. (2003-2009); GFM Resources Ltd. (2005-2010). |
| 70 | CLAYMORE EXCHANGE-TRADED FUND TRUST 2 ANNUAL REPORT |
| SUPPLEMENTAL INFORMATION (Unaudited) continued | May 31, 2014 |
Name, Address* and Year of Birth | | Position(s) Held with Trust | | Term of Office and Length of Time Served** | | Principal Occupation(s) During Past Five Years | | Number of Portfolios in Fund Complex Overseen | | Other Directorships Held by Trustees |
| Independent Trustees continued: | | | | | | | |
| Robert B. Karn III (1942) | | Trustee and Chairman of the Audit Committee | | Since 2010 | | Current: Consultant (1998-present). Former: Arthur Andersen (1965-1997) and Managing Partner, Financial and Economic Consulting, St. Louis office (1987-1997). | | 82 | | Current: Peabody Energy Company (2003-present); GP Natural Resource Partners, LLC (2002- present). |
| Ronald A. Nyberg (1953) | | Trustee and Chairman of the Nominating and Governance Committee | | Since 2006 | | Current: Partner, Nyberg & Cassioppi, LLC (2000-present). Former: Executive Vice President, General Counsel, and Corporate Secretary, Van Kampen Investments (1982-1999). | | 88 | | Current: Director, Edward-Elmhurst Healthcare System (2012-present). |
| Maynard F. Oliverius (1943) | | Trustee and Vice Chairman of the Contracts Review Committee | | Since 2014 | | Retired. Former: President and CEO, Stormont-Vail HealthCare (1996-2012). | | 82 | | None. |
| Ronald E. Toupin, Jr. (1958) | | Trustee and Chairman of the Board | | Since 2006 | | Current: Portfolio Consultant (2010-present). Former: Vice President, Manager and Portfolio Manager, Nuveen Asset Management (1998-1999); Vice President, Nuveen Investment Advisory Corp. (1992-1999); Vice President and Manager, Nuveen Unit Investment Trusts (1991-1999); and Assistant Vice President and Portfolio Manager, Nuveen Unit Investment Trusts (1988-1999), each of John Nuveen & Co., Inc. (1982-1999). | | 85 | | Former: Bennett Group of Funds (2011-2013). |
Name, Address* and Year of Birth | | Position(s) Held with Trust | | Term of Office and Length of Time Served** | | Principal Occupation(s) During Past Five Years | | Number of Portfolios in Fund Complex Overseen | | Other Directorships Held by Trustees |
| Interested Trustee: | | | | | | | | | | |
| Donald C. Cacciapaglia*** (1951) | | President, Chief Executive Officer and Trustee | | Since 2012 | | Current: President and CEO, certain other funds in the Fund Complex (2012-present); Vice Chairman, Guggenheim Investments (2010-present). Former: Chairman and CEO, Channel Capital Group, Inc. (2002-2010). | | 214 | | Current: Delaware Life (2013- present); Guggenheim Life and Annuity Company (2011-present); Paragon Life Insurance Company of Indiana (2011-present). |
| * | The business address of each Trustee is c/o Guggenheim Investments, 227 West Monroe Street, Chicago, IL 60606 |
| | |
| ** | Each Trustee serves an indefinite term, until his successor is elected and qualified. Time served includes time served in the respective position for the Predecessor Corporation. |
| | |
| *** | This Trustee is deemed to be an “interested person” of the Funds under the 1940 Act by reason of his position with the Funds’ Investment Manager and/or the parent of the Investment Manager. |
| | |
| (a) | As of April 3, 2014. At a special meeting of the shareholders held in April 2014, shareholders of the Trust elected the following individuals to serve as Trustees: Donald A. Chubb, Jerry B. Farley and Maynard F. Oliverius. |
Officers
The Officers of the Trust, who are not trustees, and their principal occupations during the past five years:
| | | | | | | |
Name, Address* and Year of Birth | | Position(s) held with the Trust | | Term of Office and Length of Time Served** | | Principal Occupations During Past Five Years |
| Officers | | | | | | |
Joseph M. Arruda (1966) | | Assistant Treasurer | | Since 2014 | | Current: Assistant Treasurer, certain other funds in the Fund Complex (2006-present); Vice President, Security Investors, LLC (2010-present); CFO and Manager, Guggenheim Specialized Products, LLC (2009-present). Former: Vice President, Security Global Investors, LLC (2010-2011); Vice President, Rydex Advisors, LLC (2010); Vice President, Rydex Advisors II, LLC (2010). |
William H. Belden, III (1965) | | Vice President | | Since 2006 | | Current: Vice President, certain other funds in the Fund Complex (2006-present); Managing Director, Guggenheim Funds Investment Advisors, LLC (2005-present). Former: Vice President of Management, Northern Trust Global Investments (1999-2005). |
| CLAYMORE EXCHANGE-TRADED FUND TRUST 2 ANNUAL REPORT | 71 |
| SUPPLEMENTAL INFORMATION (Unaudited) continued | May 31, 2014 |
| | | | | | | |
Name, Address* and Year of Birth | | Position(s) held with the Trust | | Term of Office and Length of Time Served** | | Principal Occupations During Past Five Years |
| Officers continued | | | | | | |
Joanna M. Catalucci (1966) | | Chief Compliance Officer | | Since 2012 | | Current: Managing Director of Compliance and Fund Board Relations, Guggenheim Investments (2012-present). Former: Secretary of certain funds in the Fund Complex. |
Mark J. Furjanic (1959) | | Assistant Treasurer | | Since 2008 | | Current: Vice President, Guggenheim Investments (2005-present); Assistant Treasurer, certain other funds in the Fund Complex (2008-present). Former: Senior Manager, Ernst & Young LLP (1999-2005). |
James M. Howley (1972) | | Assistant Treasurer | | Since 2006 | | Current: Director, Guggenheim Investments (2004-present); Assistant Treasurer, certain other funds in the Fund Complex (2006-present). Former: Manager, Mutual Fund Administration, Van Kampen Investments, Inc. (1996-2004). |
Amy J. Lee (1961) | | Chief Legal Officer | | Since 2013 | | Current: Chief Legal Officer, certain other funds in the Fund Complex (2013-present); Senior Managing Director, Guggenheim Investments (2012-present). Former: Vice President, Associate General Counsel and Assistant Secretary, Security Benefit Life Insurance Company and Security Benefit Corporation (2004-2012). |
Derek D. Maltbie (1972) | | Assistant Treasurer | | Since 2011 | | Current: Vice President, Guggenheim Investments (2012-present); Assistant Treasurer, certain other funds in the Fund Complex (2011-present). Former: Assistant Vice President, Guggenheim Funds Investment Advisors, LLC (2005-2011); Supervisor, Mutual Fund Administration, Van Kampen Investments, Inc. (1995-2005). |
Mark E. Mathiasen (1978) | | Secretary | | Since 2011 | | Current: Secretary, certain other funds in the Fund Complex (2007-present); Managing Director and Associate General Counsel, Guggenheim Funds Services, LLC, and affiliates (2007-present). |
Michael P. Megaris (1984) | | Assistant Secretary | | Since 2014 | | Current: Assistant Secretary, certain other funds in the Fund Complex (April 2014-present); Associate, Guggenheim Investments (2012-present). Former: J.D., University of Kansas School of Law (2009-2012). |
Kimberly J. Scott (1974) | | Assistant Treasurer | | Since 2012 | | Current: Vice President, Guggenheim Investments (2012-present); Assistant Treasurer, certain other funds in the Fund Complex (2012-present). Former: Financial Reporting Manager, Invesco, Ltd. (2010-2011); Vice President/Assistant Treasurer, Mutual Fund Administration, Van Kampen Investments, Inc./Morgan Stanley Investment Management (2009-2010); Manager of Mutual Fund Administration, Van Kampen Investments, Inc./Morgan Stanley Investment Management (2005-2009). |
Bryan Stone (1979) | | Vice President | | Since 2014 | | Current: Vice President, certain other funds in the Fund Complex (April 2014-present); Director, Guggenheim Investments (2013-present). Former: Senior Vice President, Neuberger Berman Group LLC (2009-2013); Vice President, Morgan Stanley (2002-2009). |
John L. Sullivan (1955) | | Chief Financial Officer, Chief Accounting Officer and Treasurer | | Since 2010 | | Current: CFO, Chief Accounting Officer and Treasurer, certain other funds in the Fund Complex (2010-present); Senior Managing Director, Guggenheim Investments (2010-present). Former: Managing Director and CCO, each of the funds in the Van Kampen Investments fund complex (2004-2010); Managing Director and Head of Fund Accounting and Administration, Morgan Stanley Investment Management (2002- 2004); CFO and Treasurer, Van Kampen Funds (1996-2004). |
| * | The business address of each officer is c/o Guggenheim Investments, 227 West Monroe Street, Chicago, IL 60606. |
| | |
| ** | Each officer serves an indefinite term, until his or her successor is duly elected and qualified. The date reflects the commencement date upon which the officer held any officer position with the Trust. |
| 72 | CLAYMORE EXCHANGE-TRADED FUND TRUST 2 ANNUAL REPORT |
| REPORT OF THE CONTRACTS REVIEW COMMITTEE REGARDING | |
| CLAYMORE EXCHANGE-TRADED FUND TRUST 2 | May 31, 2014 |
Claymore Exchange-Traded Fund Trust 2 (the “Trust”) was organized as a Delaware statutory trust on June 8, 2006, and is authorized to establish multiple portfolios representing separate series of the Trust (each, a “Fund” and collectively, the “Funds”). The Trust is an open-end management investment company registered under the Investment Company Act of 1940, as amended (the “1940 Act”). Guggenheim Funds Investment Advisors, LLC (“GFIA” or the “Adviser”), a subsidiary of Guggenheim Funds Services, LLC (“GFS”), an indirect subsidiary of Guggenheim Partners, LLC, a global diversified financial services firm (“Guggenheim Partners”), serves as each Fund’s investment adviser and provides certain administrative and other services pursuant to an investment advisory agreement between the Trust, with respect to the Funds, and GFIA (the “Advisory Agreement”). (Guggenheim Partners, GFIA, GFS and their affiliates may be referred to herein collectively as “Guggenheim.”) Under the supervision of the Board of Trustees of the Trust (the “Board” and the members of the Board individually, the “Trustees”), GFIA is responsible for the overall management and administration of the Funds and provides certain facilities and personnel in connection with such services.
At meetings held in person on April 17, 2014 (the “April Meeting”) and on May 12, 2014 (the “May Meeting”), the Contracts Review Committee of the Board (the “Committee”), consisting solely of those Trustees who are not “interested persons,” as defined by the 1940 Act, of the Trust (the “Independent Trustees”), met separately from Guggenheim to consider the renewal of the Advisory Agreement. As part of its review process, the Committee was represented by independent legal counsel to the Independent Trustees (“Independent Legal Counsel”). Independent Legal Counsel reviewed and discussed with the Committee various key aspects of the Trustees’ legal responsibilities relating to the proposed renewal of the Advisory Agreement and other principal contracts. In this connection, Independent Legal Counsel advised the Committee of: (i) the responsibilities of board members under applicable law; (ii) the standards for determining what constitutes an excessive fee as delineated by the courts and the factors the Trustees should consider in determining whether to approve the fee arrangements; and (iii) the disclosure requirements pertaining to these approvals, as required by the Securities and Exchange Commission. The Committee took into account various materials received from Guggenheim and Independent Legal Counsel. Recognizing that the evaluation process with respect to the services provided by GFIA is an ongoing one, the Committee also considered the variety of written materials, reports and oral presentations it received (and received by the full Board) throughout the year regarding performance and operating results of the Funds.
In connection with the contract review process, FUSE Research Network LLC (“FUSE”), an independent, third-party research provider, was engaged to prepare advisory contract renewal reports designed specifically to help boards of directors/trustees fulfill their advisory contract renewal responsibilities. The objective of the reports is to present the subject funds’ relative position regarding fees, expenses and total return performance, with peer group and universe comparisons. Guggenheim prepared a comprehensive presentation in response to a formal request for information sent by Independent Legal Counsel on behalf of the Committee. In addition, Guggenheim made a detailed presentation at the April Meeting, which addressed areas identified for discussion by the Committee Chair and Vice Chair and Independent Legal Counsel. Throughout the process, the Committee asked questions of management and requested certain additional information which Guggenheim provided following the April Meeting (collectively with the foregoing reports and materials, the “Contract Materials”).
Among other things, Guggenheim provided: (i) organizational charts and presentations, staffing reports and biographies of those key personnel of Guggenheim providing services to the Funds and other registered investment companies for which GFIA or an affiliate serves as investment adviser (“Guggenheim Funds”); (ii) descriptions of various functions performed by Guggenheim for the Guggenheim Funds, including the Funds, such as portfolio trading practices, brokerage matters, trade allocation and best execution; (iii) information regarding compliance and regulatory history for GFIA, including its Form ADV; and (iv) information concerning the parent company and overall Guggenheim organization and strategic plans and goals, all to assist the Committee in assessing the nature, extent and quality of services provided by GFIA. In addition, Guggenheim’s response included information comparing the investment performance, tracking error, advisory fee and total net expense ratio (and/or unitary fee, as applicable) of each Fund to other funds (including such information presented in the FUSE reports as well as supplemental information prepared by Guggenheim), charts showing revenues for Guggenheim by product line and with respect to each Fund, including a break-out of various expenses, a description of the expense allocation methodology and information about the profitability of the Funds to Guggenheim Investments (the investment management business of Guggenheim Partners), financial information for Guggenheim Investments (unaudited), the audited financial statements of GFIA, and information about Guggenheim’s compliance and risk management programs.
In analyzing and discussing the data presented in the FUSE reports, the Committee took into account the challenges that exist in developing appropriate peer groups for the Funds as exchange-traded funds (“ETFs”), and management’s view that the ETF industry is immature in terms of depth of product coverage in many asset categories. In this regard, the Committee noted management’s observation that, in many cases, an ETF may dominate a niche space, but appear rather average in comparison to a larger peer group with which it shares only a small handful of characteristics; alternatively, a very small comparison set can be used, providing a narrower view of performance and expense metrics. In light of the foregoing, the Committee assessed the data provided in the FUSE reports as well as commentary and supporting data presented by Guggenheim, including, among other things, a summary of notable
| CLAYMORE EXCHANGE-TRADED FUND TRUST 2 ANNUAL REPORT | 73 |
| REPORT OF THE CONTRACTS REVIEW COMMITTEE REGARDING | |
| CLAYMORE EXCHANGE-TRADED FUND TRUST 2 continued | May 31, 2014 |
distinctions between certain Funds and the applicable peer group identified in the FUSE reports, including with respect to Guggenheim S&P Global Water Index ETF (CGW), Guggenheim China Technology ETF (CQQQ), Guggenheim Timber ETF (CUT), Guggenheim Canadian Energy Income ETF (ENY), Guggenheim Frontier Markets ETF (FRN), Guggenheim China Small Cap ETF (HAO), Guggenheim International Multi-Asset Income ETF (HGI), Guggenheim Shipping ETF (SEA), Guggenheim Solar ETF (TAN) and Guggenheim China Real Estate ETF (TAO).
Following an analysis and discussion of the factors identified below and in the exercise of its business judgment, the Committee concluded that it was in the best interests of each Fund to recommend that the Board approve the renewal of the Advisory Agreement for an additional 12-month term.
Nature, Extent and Quality of Services Provided by the Adviser: With respect to the nature, extent and quality of services currently provided by the Adviser, the Committee considered the information provided by Guggenheim concerning the education, experience, professional affiliations, area of responsibility and duties of all key personnel performing services for the Funds, including those personnel providing compliance oversight. In this connection, the Committee considered Guggenheim’s resources and related efforts to retain, attract and motivate capable personnel to serve the Funds and noted Guggenheim’s report on recent additions and departures in personnel who work on matters relating to the Funds or are significant to the operations of the Adviser. The Committee noted that on a regular basis the Board receives and reviews information from the Trust’s Chief Compliance Officer regarding compliance policies and procedures established pursuant to Rule 38a-1 under the 1940 Act. In addition, the Committee took into account the various compliance and risk management initiatives undertaken by Guggenheim, including, among other things, the hiring of a new Chief Risk Officer, Portfolio Management, responsible for implementing various initiatives related to the risks associated with the investment process, the organization’s risk management infrastructure and critical activities. The Committee also considered Guggenheim’s other initiatives intended to achieve greater enhancements and efficiencies in the organization’s ability to provide services to all Guggenheim Funds, including the Funds, such as efforts to streamline and simplify the organizational structure of Guggenheim’s advisory business, as reflected by the internal restructuring that consolidated the investment advisers, broker/dealers and other entities that comprise “Guggenheim Investments” under a new, single holding company, Guggenheim Partners Investment Management Holdings, LLC (“GPIMH”). In this regard, the Committee considered that although the restructuring neither impacted the services rendered on a day-to-day basis to the Funds nor changed the ultimate ownership of the various Guggenheim entities involved, which, through GPIMH, continue to be indirect subsidiaries of Guggenheim Capital, LLC, Guggenheim stated that the restructuring will allow the financial statements of the various entities to be consolidated and audited, thus providing a clearer view of Guggenheim Investments’ business within the broader Guggenheim organization. In addition, in connection with the Committee’s evaluation of the overall package of services provided by the Adviser, the Committee considered the Adviser’s administrative capabilities, including its role in monitoring and coordinating compliance responsibilities with the accounting agent, administrator, custodian, distributor, securities lending agent, transfer agent and other service providers to the Funds.
The Committee also noted the distinctive nature of the Funds, as ETFs, each of which generally is constructed to track the performance of a defined index of securities, before fund fees and expenses. In this connection, the Committee considered the experience and expertise appropriate in an adviser to ETFs. The Committee also considered the Adviser’s monitoring of the ETFs participation in the securities lending program and the secondary market support services provided by the Adviser to the Funds, including the Adviser’s efforts to educate investment professionals about the Funds and other Guggenheim Funds.
With respect to Guggenheim’s resources and the Adviser’s ability to carry out its responsibilities under the Advisory Agreement, the Chief Financial Officer of Guggenheim Investments reviewed with the Committee certain unaudited financial information concerning GPIMH and the audited financial statements of GFIA. (The Committee received the audited financial statements of GPIMH once available following the May Meeting.)
The Committee also considered the acceptability of the terms of the Advisory Agreement. Based on the foregoing, and based on other information received (both oral and written) at the April Meeting and at the May Meeting, as well as other considerations, including the Committee’s knowledge of the Adviser’s quality of performance of its duties through Board meetings, discussions, and reports throughout the year, the Committee concluded that the Adviser and its personnel were qualified to serve the Funds in such capacity and may reasonably be expected to continue to provide a high quality of services under the Advisory Agreement with respect to the Funds.
Investment Performance: The Committee noted that, in view of the distinctive investment objective of the Funds, the investment performance of the Funds in absolute terms was not of the importance that normally attaches to the performance of actively managed funds. Of more importance to the Committee was the extent to which each Fund achieved its objective to provide investment results that, before fund fees and expenses, correspond generally to the price and yield performance of securities of companies in its applicable index. Thus, the Committee focused its attention primarily on investment returns of each Fund and its applicable benchmark and the tracking error data provided in the FUSE reports for each Fund, which was provided for the five-year, three-year, one-year, three-month and since-inception periods as of December 31, 2013, as applicable. In this regard, the Committee took into account Guggenheim’s belief that tracking error is the appropriate measure of performance for index-benchmarked Funds. Further to this point, the Committee noted Guggenheim’s statement that it examines the tracking error on a monthly and quarterly basis for purposes of: (i) determining whether the tracking error is stable or trending; (ii) evaluating factors underlying any trending in tracking error, particularly where the trend is toward greater tracking error;
| 74 | CLAYMORE EXCHANGE-TRADED FUND TRUST 2 ANNUAL REPORT |
| REPORT OF THE CONTRACTS REVIEW COMMITTEE REGARDING | |
| CLAYMORE EXCHANGE-TRADED FUND TRUST 2 continued | May 31, 2014 |
and (iii) assessing whether there are any tools or strategies at Guggenheim’s disposal to mitigate any trend toward greater tracking error. The Committee also took into account Guggenheim’s explanation that it places greater emphasis on tracking error trends than it does on absolute tracking error because certain index-benchmarked ETFs may be more disposed to higher levels of tracking error, such as, for instance, with respect to a new ETF or an ETF that has yet to reach critical asset mass and consequently, may be unable to deploy its assets in a manner that fully replicates all the constituent holdings of an index in the same proportion that the index holds them. The Committee noted other factors identified by Guggenheim that may impact tracking error, including pricing of halted or less liquid securities, time zone pricing-related issues and currency conversion sources.
In the course of its review of performance, excess returns and tracking error data, the Committee considered management’s views and explanation of the performance, tracking error and tracking error trends for certain Funds, including the following:
Guggenheim Canadian Energy Income ETF (ENY): The Fund’s tracking error for the five-year, three-year and one-year periods is higher than the peer group median. Until more recently, the Fund tracked an index that shifted its focus between Canadian energy income stocks and oil sands stocks. Guggenheim anticipates that the Fund’s new index should be more practical for replication purposes.
Guggenheim China Small Cap ETF (HAO): The Fund’s peer group contains only one other fund. The Fund’s tracking error is lower than that of its peer for the three- and one-year periods ended December 31, 2013, the only periods with comparable data.
Guggenheim China Real Estate ETF (TAO): The Fund’s tracking error was within range of the median for its peer group for the one-year period ended December 31, 2013, and equal to or less than the median for the five- and three-year periods ended December 31, 2013.
Guggenheim China Technology ETF (CQQQ): The Fund’s peer group contains only one other fund. The Fund outperformed its peer for the one-year and three-month periods ended December 31, 2013 and slightly underperformed its peer for the three-year period ended December 31, 2013.
Guggenheim Frontier Markets ETF (FRN): Aspects of the Fund’s benchmark index methodology and construction preclude the Index ETF from geographic allocations that have more recently favored the performance of its peers.
Guggenheim International Multi-Asset Income ETF (HGI): The Fund’s investment mandate is broader than the peer group and extends to REITs, MLPs, Royalty Trusts and closed-end investment companies. The Fund’s holdings in preferred shares and closed-end funds may also have an impact on tracking error, particularly during rebalance periods. The Fund’s tracking error is less than the peer group median for the one-year period and is equal to the median for the five- and three-year periods ended December 31, 2013.
Guggenheim S&P Global Water Index ETF (CGW): The Fund’s tracking error is less than that of its peers for the one-year period ended December 31, 2013, the only comparable period available in the report.
Guggenheim Shipping ETF (SEA): The Fund’s exposure is purely Global Shipping, while its peer group consists of competitors that are more broadly domestic Transportation or Industrials focused. The Fund’s tracking error is lower than the peer group average and median for the three- and one-year periods ended December 31, 2013.
Guggenheim Solar ETF (TAN): The Fund’s peer group contains only one other fund. The Fund’s tracking error is lower than that of its peer for the five-, three- and one-year periods ended December 31, 2013. The Committee also noted Guggenheim’s statement that the most impactful variable in the Fund’s tracking error has been securities lending revenues earned, which has caused notable upside performance relative to the underlying index.
Guggenheim Timber ETF (CUT): The Fund’s peer group contains only one other fund. The Fund’s tracking error is lower than that of its peer for the five-, three- and one-year periods ended December 31, 2013.
After reviewing the foregoing and related factors, the Committee concluded, within the context of its overall conclusions regarding the Advisory Agreement, that: (i) the Funds had in fact tracked their indexes within an acceptable range; or (ii) it was satisfied with Guggenheim’s efforts and explanation for the tracking error data presented in the FUSE reports.
Comparative Fees, Costs of Services Provided and the Profits Realized by the Adviser from its Relationship with the Funds: The Committee reviewed and discussed the information provided by the Adviser on each Fund’s contractual advisory fee and total net expense ratio, as compared to those of the peer group funds presented in the FUSE report. The Committee reviewed the advisory fee and expense ratio for each Fund and noted that either: (i) the Adviser has contractually agreed to waive a portion of the advisory fee and/or reimburse expenses to absorb annual operating expenses of certain Funds (excluding interest expenses, a portion of each Fund’s licensing fees, brokerage commissions and other trading expenses, taxes and extraordinary expenses such as litigation and other expenses not incurred in the ordinary course of a Fund’s business) over a particular amount; or (ii) the advisory fee is a unitary fee pursuant to which the Adviser assumes all expenses of the Fund (including the cost of transfer agency, custody, fund administration, legal, audit and other services) other than the fee payments under the Advisory Agreement, distribution fees, if any, brokerage expenses, taxes, interest, litigation expenses and other extraordinary expenses. The Committee noted that the advisory fees, after giving effect to the contractual waivers where applicable, were generally within the range of the peer group of funds in the FUSE report and noted the unique nature of certain Funds (as identified earlier), making “peer” comparisons less relevant.
With respect to the costs of services provided and profits realized by Guggenheim from its relationship with the Funds, the Committee reviewed a profit and loss statement for each Fund setting forth the
| CLAYMORE EXCHANGE-TRADED FUND TRUST 2 ANNUAL REPORT | 75 |
| REPORT OF THE CONTRACTS REVIEW COMMITTEE REGARDING | |
| CLAYMORE EXCHANGE-TRADED FUND TRUST 2 continued | May 31, 2014 |
revenues received by Guggenheim Investments from gross advisory fees, the expenses incurred in providing services to the Funds, the pre-tax operating margin and profitability rate and each Fund’s average assets for the twelve months ended, and ending assets under management as of, December 31, 2012 and December 31, 2013, respectively, and information with respect to Guggenheim’s allocation methodologies used in preparing the profitability data.
The Committee considered other benefits available to the Adviser because of its relationship with the Funds and noted that the administrative service fees received by the Adviser’s affiliate, Rydex Fund Services, LLC, from serving as administrator provide Guggenheim with additional revenue for the Funds without a unitary fee structure. The Committee also noted Guggenheim’s statement that it may benefit from marketing synergies arising from offering a broad spectrum of products, including the Funds. Based on all of the information provided and its review, the Committee determined that Guggenheim Investments’ profitability from its relationship with the Funds was not unreasonable.
Economies of Scale to be Realized: The Committee considered the extent to which economies of scale could be realized with respect to the management of the Funds as the Funds grow and whether fee levels reflected a reasonable sharing of such economies of scale for the benefit of Fund investors. The Committee considered each Fund’s asset size, advisory fee structure, net expense ratio giving effect to any applicable expense waiver and/or reimbursement agreement or unitary fee agreement with the Adviser and whether the investment process produced economies of scale. The Committee considered the Adviser’s statement that the generally lower total expenses of ETFs provide fewer opportunities for the Adviser to achieve economies of scale beyond what is provided to shareholders through the relatively low expenses of the ETFs. The Committee was also of the view that economies of scale were being shared with the Funds subject to a unitary fee arrangement by virtue of an advisory fee, set at a relatively low level since the inception of each applicable Fund, that subsumed economies of scale in the fee itself.
Overall Conclusions
Based on the foregoing, the Committee determined at the May Meeting that the investment advisory fees are fair and reasonable in light of the extent and quality of the services provided and other benefits received and that the continuation of the Advisory Agreement is in the best interests of each Fund. In reaching this conclusion, no single factor was determinative and each Committee member, in the exercise of his business judgment, may attribute different weights to different factors. At the May Meeting, the Committee, constituting all of the Independent Trustees, recommended the renewal of the Advisory Agreement for an additional 12-month term.
| 76 | CLAYMORE EXCHANGE-TRADED FUND TRUST 2 ANNUAL REPORT |
This Page Intentionally Left Blank.
This Page Intentionally Left Blank.
| TRUST INFORMATION | May 31, 2014 |
| Board of Trustees | | Principal Executive Officers | Investment Adviser | Legal Counsel |
Randall C. Barnes Donald C. Cacciapaglia* Donald A. Chubb Jerry B. Farley Roman Friedrich III Robert B. Karn III Ronald A. Nyberg Maynard F. Oliverius Ronald E. Toupin, Jr., Chairperson * Trustee is an “interested person” (as defined in section 2(a)(19) of the 1940 Act) (“Interested Trustee”) of the Trust because of his position as the President and CEO of the Investment Adviser and Distributor. | | Donald C. Cacciapaglia Chief Executive Officer Joanna M. Catalucci Chief Compliance Officer Amy J. Lee Chief Legal Officer Mark E. Mathiasen Secretary John L. Sullivan Chief Financial Officer, Chief Accounting Officer and Treasurer | Guggenheim Funds Investment Advisors, LLC Chicago, IL Distributor Guggenheim Funds Distributors, LLC Chicago, IL Administrator Rydex Fund Services, LLC Rockville, MD Accounting Agent, Custodian and Transfer Agent The Bank of New York Mellon New York, NY | Dechert LLP New York, NY Independent Registered Public Accounting Firm Ernst & Young LLP Chicago, IL |
Privacy Principles of the Trust for Shareholders
The Funds are committed to maintaining the privacy of their shareholders and to safeguarding the non-public personal information. The following information is provided to help you understand what personal information the Funds collect, how we protect that information and why, in certain cases, we may share information with select other parties.
Generally, the Funds do not receive any non-public personal information relating to their shareholders, although certain non-public personal information of their shareholders may become available to the Funds. The Funds do not disclose any non-public personal information about their shareholders or former shareholders to anyone, except as permitted by law or as is necessary in order to service shareholder accounts (for example, to a transfer agent or third party administrator).
The Funds restrict access to non-public personal information about the shareholders to Guggenheim Funds Investment Advisors, LLC employees with a legitimate business need for the information. The Funds maintain physical, electronic and procedural safeguards designed to protect the non-public personal information of their shareholders.
Questions concerning your shares of the Trust?
| • | If your shares are held in a Brokerage Account, contact your Broker. |
This report is sent to shareholders of the Funds for their information. It is not a Prospectus, circular or representation intended for use in the purchase or sale of shares of the Funds or of any securities mentioned in this report.
A description of the Funds’ proxy voting policies and procedures related to portfolio securities is available without charge, upon request, by calling the Funds at (800) 345-7999.
Information regarding how the Funds voted proxies for portfolio securities, if applicable, during the most recent 12-month period ended June 30, is also available, without charge and upon request by calling (800) 345-7999, visiting Guggenheim Investments website at guggenheiminvestments.com or by accessing the Funds’ Form N-PX on the U.S. Securities and Exchange Commission’s (“SEC”) website at www.sec.gov.
The Funds file their complete schedule of portfolio holdings with the SEC for the first and third quarters of each fiscal year on Form N-Q. The Funds’ Form N-Q is available on the SEC website at www.sec.gov or by visiting Guggenheim Investments website at guggenheiminvestments.com. The Funds’ Form N-Q may also be viewed and copied at the SEC’s Public Reference Room in Washington, DC; information on the operation of the Public Reference Room may be obtained by calling (800) SEC-0330.
| CLAYMORE EXCHANGE-TRADED FUND TRUST 2 ANNUAL REPORT | 79 |
Guggenheim Funds Investment Advisors, LLC
Guggenheim Funds Investment Advisors, LLC (the “Investment Adviser”) serves as the investment adviser for each of the Funds and administers the affairs of each Fund to the extent requested by the Board of Trustees. The Investment Adviser also acts as investment adviser to closed-end and open-end management investment companies. The Investment Adviser and its affiliates provide supervision, management or servicing of assets with a commitment to consistently delivering exceptional service. The Investment Adviser is a subsidiary of Guggenheim Partners, LLC, a global, diversified financial services firm with more than $160 billion in assets under supervision. Guggenheim Partners, LLC, through its affiliates, provides investment management, investment advisory, insurance, investment banking, and capital markets services. The firm is headquartered in Chicago and New York with a global network of offices throughout the United States, Europe, and Asia.
Portfolio Management
The portfolio managers who are currently responsible for the day-to-day management of each Fund’s portfolio, except the Guggenheim Shipping ETF and Guggenheim China Real Estate ETF, are Michael P. Byrum, CFA, and James R. King, CFA. Messrs. Byrum and King have managed those Funds’ portfolios since December 2013. The portfolio managers who are currently responsible for the day-to-day management of the Guggenheim Shipping ETF and Guggenheim China Real Estate ETF’s portfolios are Michael P. Byrum, CFA, James R. King, CFA, and Cindy Gao. Messrs. Byrum and King have managed those Funds’ portfolios since December 2013. Ms. Gao has managed those Funds’ portfolios since January 2014.
Mr. Byrum is a Senior Vice President of Guggenheim Investments and joined Guggenheim Investments in 1993. He has ultimate responsibility for the management of the Funds and reviews the activities of the portfolio managers of the Funds. He holds a degree in finance from Miami University of Ohio and is a member of the CFA Institute and the Washington Society of Investment Analysts. Mr. King is a Portfolio Manager of Guggenheim Investments and rejoined Guggenheim Investments in 2011 as the lead portfolio manager for exchange-traded products. Mr. King holds a bachelor’s degree in finance from the University of Maryland, and has earned the Chartered Financial Analyst designation. Ms. Gao is an ETF Analyst, ETF Portfolio Management of Guggenheim Investments, and joined Guggenheim Investments in December 2010. Ms. Gao received a M.S. in Accounting from the University of Illinois at Chicago.
Claymore Exchange-Traded Fund Trust 2 Overview
The Claymore Exchange-Traded Fund Trust 2 is an investment company consisting of 11 separate exchange-traded “index funds” as of May 31, 2014. The investment objective of each of the funds is to replicate as closely as possible, before fees and expenses, the performance of a specified market index.
This material must be preceded or accompanied by a prospectus for the fund being offered. The prospectus contains information about the fund including a discussion of investment objectives, risks, ongoing expenses and sales charges. If a prospectus did not accompany this report, you can obtain one from your financial adviser, from our website at http://guggenheiminvestments.com or by calling (800)345-7999. Please read the prospectus carefully before investing. The Statement of Additional Information that includes additional information about the Trustees is also available, without charge, upon request via our website at http://guggenheiminvestments.com or by calling (800)345-7999. All funds are subject to market risk and shares when sold may be worth more or less than their original cost. You can lose money investing in the funds.
Guggenheim Funds Distributors, LLC
227 West Monroe Street
Chicago, IL 60606
Member FINRA/SIPC
(07/14)
NOT FDIC-INSURED | NOT BANK-GUARANTEED | MAY LOSE VALUE
ETF-002-AR-0514
Item 2. Code of Ethics.
(a) The registrant has adopted a code of ethics that applies to its principal executive officer, principal financial officer, principal accounting officer or controller, or persons performing similar functions (the "Code of Ethics").
(b) No information need be disclosed pursuant to this paragraph.
(c) The registrant has not amended its Code of Ethics during the period covered by the report presented in Item 1 hereto.
(d) The registrant has not granted a waiver or an implicit waiver to its principal executive officer, principal financial officer, principal accounting officer or controller, or persons performing similar functions from a provision of its Code of Ethics during the period covered by this report.
(e) Not applicable.
(f) (1) The registrant's Code of Ethics is attached hereto as Exhibit (a)(1).
(2) Not applicable.
(3) Not applicable.
Item 3. Audit Committee Financial Expert.
The registrant's Board of Trustees has determined that it has at least one audit committee financial expert serving on its audit committee (the "Audit Committee"), Robert B. Karn III. Mr. Karn is an "independent" Trustee as defined in this Item 3 of Form N-CSR. Mr. Karn qualifies as an audit committee financial expert by virtue of his experience obtained as a managing partner in a public accounting Firm, which included an understanding of generally accepted accounting principles ("GAAP") in connection with the accounting for estimates, accruals and reserves and also the review, audit and evaluation of financial statements using GAAP.
(Under applicable securities laws, a person who is determined to be an audit committee financial expert will not be deemed an "expert" for any purpose, including without limitation for the purposes of Section 11 of the Securities Act of 1933, as amended, as a result of being designated or identified as an audit committee financial expert. The designation or identification of a person as an audit committee financial expert does not impose on such person any duties, obligations, or liabilities that are greater than the duties, obligations, and liabilities imposed on such person as a member of the Audit Committee and Board of Trustees in the absence of such designation or identification. The designation or identification of a person as an audit committee financial expert does not affect the duties, obligations or liability of any other member of the Audit Committee or Board of Trustees.)
Item 4. Principal Accountant Fees and Services.
(a) Audit Fees: the aggregate fees billed for professional services rendered by the principal accountant for the audit of the registrant's annual financial statements or services that are normally provided by the accountant in connection with statutory and regulatory filings or engagements were $66,780 and $66,261 for the fiscal years ending May 31, 2014, and May 31, 2013, respectively.
(b) Audit-Related Fees: the aggregate fees billed for assurance and related services by the principal accountant that are reasonably related to the performance of the audit of the registrant’s financial statements and are not reported under paragraph 4(a) of this Item, including agreed upon procedures reports performed for rating agencies and the issuance of comfort letters, were $0 and $0 for the fiscal years ending May 31, 2014, and May 31, 2013, respectively.
Ernst & Young did not bill fees for non-audit services that required preapproval by the Audit Committee pursuant to paragraph (c)(7)(ii) of Rule 2-01 of Regulation S-X during the Registrant’s last two fiscal years.
(c) Tax Fees: the aggregate fees billed for professional services rendered by the principal accountant for tax compliance, tax advice and tax planning, including federal, state and local income tax return preparation and related advice and determination of taxable income and miscellaneous tax advice were $58,092 and $61,900 for the fiscal years ending May 31, 2014, and May 31, 2013 respectively.
Ernst & Young did not bill fees for tax services that required preapproval by the Audit Committee pursuant to paragraph (c)(7)(ii) of Rule 2-01 of Regulation S-X during the Registrant’s last two fiscal years.
(d) All Other Fees: the aggregate fees billed for products and services provided by the principal accountant, other than the services reported in paragraphs (a) through (c) of this Item 4 were $0 and $0 for the fiscal years ending May 31, 2014, and May 31, 2013, respectively.
Ernst & Young did not bill fees for services not included in Items 4(a), (b) or (c) above that required preapproval by the Audit Committee pursuant to paragraph (c)(7)(ii) of Rule 2-01 of Regulation S-X during the Registrant’s last two fiscal years.
(e) Audit Committee Pre-Approval Policies and Procedures.
(i) The Audit Committee reviews, and in its sole discretion, pre-approves, pursuant to written pre-approval procedures (A) all engagements for audit and non-audit services to be provided by the principal accountant to the registrant and (B) all engagements for non-audit services to be provided by the principal accountant (1) to the registrant’s investment adviser (not including a sub-adviser whose role is primarily portfolio management and is sub-contracted or overseen by another investment adviser) and (2) to any entity controlling, controlled by or under common control with the registrant’s investment adviser that provides ongoing services to the registrant; but in the case of the services described in subsection (B)(1) or (2), only if the engagement relates directly to the operations and financial reporting of the registrant; provided that such pre-approval need not be obtained in circumstances in which the pre-approval requirement is waived under rules promulgated by the Securities and Exchange Commission or New York Stock Exchange listing standards. Sections V.B.2 and V.B.3 of the Audit Committee’s revised Audit Committee Charter contain the Audit Committee’s Pre-Approval Policies and Procedures and such sections are included below.
Section V.B.2: Pre-approve any engagement of the independent auditors to provide any services, other than “prohibited non-audit services,” to the Trust, including the fees and other compensation to be paid to the independent auditors (unless an exception is available under Rule 2-01 of Regulation S-X).
| (a) | The categories of services to be reviewed and considered for pre-approval include the following: |
Audit Services
| | · | Annual financial statement audits |
| | · | Seed audits (related to new product filings, as required) |
| | · | SEC and regulatory filings and consents |
Audit-Related Services
| | · | Accounting consultations |
| | · | Fund merger/reorganization support services |
| | · | Other accounting related matters |
| | · | Agreed upon procedures reports |
| | · | Other internal control reports |
Tax Services
| | · | Tax compliance services related to the filing of amendments: |
| | · | Federal, state and local income tax compliance |
| | · | Sales and use tax compliance |
| | · | Timely RIC qualification reviews |
| | · | Tax distribution analysis and planning |
| | · | Tax authority examination services |
| | · | Tax appeals support services |
| | · | Accounting methods studies |
| | · | Fund merger support services |
| | · | Tax compliance, planning and advice services and related projects |
| (b) | The Committee has pre-approved those services, which fall into one of the categories of services listed under 2(a) above and for which the estimated fees are less than $25,000. |
| (c) | For services with estimated fees of $25,000 or more, but less than $50,000, the Chair is hereby authorized to pre-approve such services on behalf of the Committee. |
| (d) | For services with estimated fees of $50,000 or more, such services require pre-approval by the Committee. |
| (e) | The independent auditors or the Chief Accounting Officer of the Trust (or an officer of the Trust who reports to the Chief Accounting Officer) shall report to the Committee at each of its regular scheduled meetings all audit, audit-related and permissible non-audit services initiated since the last such report (unless the services were contained in the initial audit plan, as previously presented to, and approved by, the Committee). The report shall include a general description of the services and projected fees, and the means by which such services were approved by the Committee (including the particular category listed above under which pre-approval was obtained). |
Section V.B.3: Pre-approve any engagement of the independent auditors, including the fees and other compensation to be paid to the independent auditors, to provide any non-audit services to the Adviser (or any “control affiliate” of the Adviser providing ongoing services to the Trust), if the engagement relates directly to the operations and financial reporting of the Trust (unless an exception is available under Rule 2-01 of Regulation S-X).
| (a) | The Chair or any member of the Committee may grant the pre-approval for non-audit services to the Adviser (or any “control affiliate” of the Adviser providing ongoing services to the Trust) relating directly to the operations and financial reporting of the Trust for which the estimated fees are less than $25,000. All such delegated pre-approvals shall be presented to the Committee no later than the next Committee meeting. |
| (b) | For non-audit services to the Adviser (or any “control affiliate” of the Adviser providing ongoing services to the Trust) relating directly to the operations and financial reporting of the Trust for which the estimated fees are $25,000 or more, such services require pre-approval by the Committee. |
(ii) None of the services described in each of Items 4(b) through (d) were approved by the Audit Committee pursuant to paragraph (c)(7)(i)(C) of Rule 2-01 of Regulation S-X.
(f) Not applicable.
(g) The aggregate non-audit fees billed by the registrant's accountant for services rendered to the registrant, the registrant’s investment adviser (not including a sub-adviser whose role is primarily portfolio management and is sub-contracted with or overseen by another investment adviser) and/or any entity controlling, controlled by, or under common control with the adviser that provides ongoing services to the registrant that directly related to the operations and financial reporting of the registrant were $58,092 and $61,900 for the fiscal years ending May 31, 2014, and May 31, 2013, respectively.
(h) Not applicable.
Item 5. Audit Committee of Listed Registrants.
(a) The Audit Committee was established as a separately designated standing audit committee in accordance with Section 3(a)(58)(A) of the Securities Exchange Act of 1934, as amended. The Audit Committee of the Registrant is comprised of: Randall C. Barnes, Donald A. Chubb, Jerry B. Farley, Maynard F. Oliverius, Roman Friedrich III, Robert B. Karn III, Ronald A. Nyberg and Ronald E. Toupin, Jr.
(b) Not applicable.
Item 6. Schedule of Investments.
The Schedule of Investments is included as part of Item 1.
Item 7. Disclosure of Proxy Voting Policies and Procedures for Closed-End Management Investment Companies.
Not Applicable.
Item 8. Portfolio Managers of Closed-End Management Investment Companies.
Not Applicable.
Item 9. Purchases of Equity Securities by Closed-End Management Investment Company and Affiliated Purchasers.
Not Applicable.
Item 10. Submission of Matters to a Vote of Security Holders.
Registrant has not made any material changes to the procedures by which shareholders may recommend nominees to the registrant’s Board of Trustees.
Item 11. Controls and Procedures.
(a) The registrant's principal executive officer and principal financial officer have evaluated the registrant's disclosure controls and procedures (as defined in Rule 30a-3(c) under the Investment Company Act) as of a date within 90 days of this filing and have concluded that based on such evaluation, as required by Rule 30a-3(b) under the Investment Company Act, that the registrant's disclosure controls and procedures were effective as of that date in ensuring that information required to be disclosed by the registrant in this Form N-CSR was recorded, processed, summarized, and reported within the time periods specified in the Securities and Exchange Commission’s rules and forms.
(b) There were no changes in the registrant’s internal control over financial reporting (as defined in Rule 30a-3(d) under the Investment Company Act) that occurred during the registrant’s second fiscal quarter of the period covered by this report that have materially affected, or are reasonably likely to materially affect, the registrant’s internal control over financial reporting.
Item 12. Exhibits.
(a)(1) Code of Ethics for Chief Executive and Senior Financial Officer.
(a)(2) Certifications of principal executive officer and principal financial officer pursuant to Rule 30a-2(a) of the Investment Company Act.
(b) Certifications of principal executive officer and principal financial officer pursuant to Rule 30a-2(b) of the Investment Company Act and Section 906 of the Sarbanes-Oxley Act of 2002.
SIGNATURES
Pursuant to the requirements of the Securities Exchange Act of 1934 and the Investment Company Act of 1940, the registrant has duly caused this report to be signed on its behalf by the undersigned, thereunto duly authorized.
(Registrant) Claymore Exchange-Traded Fund Trust 2
By: /s/ Donald C. Cacciapaglia
Name: Donald C. Cacciapaglia
Title: Chief Executive Officer
Date: August 8, 2014
Pursuant to the requirements of the Securities Exchange Act of 1934 and the Investment Company Act of 1940, this report has been signed by the following persons on behalf of the registrant and in the capacities and on the dates indicated.
By: /s/ Donald C. Cacciapaglia
Name: Donald C. Cacciapaglia
Title: Chief Executive Officer
Date: August 8, 2014
By: /s/ John L. Sullivan
Name: John L. Sullivan
Title: Chief Financial Officer, Chief Accounting Officer and Treasurer
Date: August 8, 2014