UNITED STATES
SECURITIES AND EXCHANGE COMMISSION
Washington, D.C. 20549
FORM N-CSR
CERTIFIED SHAREHOLDER REPORT OF REGISTERED MANAGEMENT INVESTMENT COMPANIES
Investment Company Act file number 811-21910
Claymore Exchange-Traded Fund Trust 2
(Exact name of registrant as specified in charter)
2455 Corporate West Drive, Lisle, IL 60532
(Address of principal executive offices) (Zip code)
Amy J. Lee
2455 Corporate West Drive, Lisle, IL 60532
(Name and address of agent for service)
Registrant's telephone number, including area code: (630) 505-3700
Date of fiscal year end: May 31
Date of reporting period: June 1, 2012 - May 31, 2013
Item 1. Reports to Stockholders.
The registrant's annual report transmitted to shareholders pursuant to Rule 30e-1 under the Investment Company Act of 1940, as amended (the “Investment Company Act”), is as follows:
GUGGENHEIMINVESTMENTS.COM
. . . YOUR ROAD TO THE LATEST, MOSTUP-TO-DATE INFORMATION
The shareholder report you are reading right now is just the beginning of the story. Online at guggenheiminvestments.com, you will find:
| • | Daily and historical fund pricing, fund returns, portfolio holdings and characteristics, and distribution history. |
| | |
| • | Investor guides and fund fact sheets. |
| | |
| • | Regulatory documents including a prospectus and copies of shareholder reports. |
Guggenheim Funds Distributors, LLC is constantly updating and expanding shareholder information services on each Fund’s website, in an ongoing effort to provide you with the most current information about how your Fund’s assets are managed, and the results of our efforts. It is just one more small way we are working to keep you better informed about your investment.
| Contents | |
| Dear Shareholder | 3 |
| Economic and Market Overview | 4 |
| Management Discussion of Fund Performance | 6 |
| Risks and Other Considerations | 13 |
| Fund Summary & Performance | 14 |
| Overview of Fund Expenses | 28 |
| Portfolio of Investments | 30 |
| Statement of Assets and Liabilities | 46 |
| Statement of Operations | 48 |
| Statement of Changes in Net Assets | 50 |
| Financial Highlights | 54 |
| Notes to Financial Statements | 61 |
Report of Independent Registered Public Accounting Firm | 69 |
| Supplemental Information | 70 |
Considerations Regarding Investment Advisory Agreements and Investment Sub-advisory Agreement Contract Re-Approval | 72 |
| Trust Information | 79 |
| About the Trust Adviser | Back Cover |
DEAR SHAREHOLDER
Guggenheim Funds Investment Advisors, LLC (the “Investment Adviser”) is pleased to present the annual shareholder report for seven of our exchange-traded funds (“ETFs” or “Funds”).
The Investment Adviser is part of Guggenheim Investments, which represents the investment management businesses of Guggenheim Partners, LLC (“Guggenheim”), a global diversified financial services firm.
This report covers performance of the following seven Funds for the annual fiscal period ended May 31, 2013, with the name of each Fund followed by its NYSE Arca ticker symbol:
| - | Guggenheim Canadian Energy Income ETF (ENY) |
| | |
| - | Guggenheim China Real Estate ETF (TAO) |
| | |
| - | Guggenheim China Small Cap ETF (HAO) |
| | |
| - | Guggenheim Frontier Markets ETF (FRN) |
| | |
| - | Guggenheim International Multi-Asset Income ETF (HGI) |
| | |
| - | Guggenheim Shipping ETF (SEA) |
| | |
| - | Guggenheim Timber ETF (CUT) |
Guggenheim Funds Distributors, LLC, the distributor of the Funds, is committed to providing investors with innovative investment solutions; as of the date of this report we offer 37 ETFs with a wide range of domestic and global themes, as well as closed-end funds and unit investment trusts. We have built on the investment management strengths of Guggenheim Investments and worked with a diverse group of index providers to create some of the most distinctive ETFs available.
To learn more about economic and market conditions over the last year and the objective and performance of each ETF, we encourage you to read the Economic and Market Overview section of the report, which follows this letter, and the Management Discussion of Fund Performance for each ETF, which begins on page 6.
Sincerely,
Donald Cacciapaglia
Chief Executive Officer
Claymore Exchange-Traded Fund Trust 2
June 28, 2013
| CLAYMORE EXCHANGE-TRADED FUND TRUST 2 ANNUAL REPORT | 3 |
| ECONOMIC AND MARKET OVERVIEW | May 31, 2013 |
Despite weakening global economic conditions experienced as the period came to a close, the overall U.S. economy for the past 12 months was powered by monetary accommodation from central banks around the world and continuing improvement in the U.S. housing sector and labor market. Equity markets rallied more than 27 percent over the period, with the S&P 500 reaching an all-time high. Credit spreads continued to tighten, as abundant liquidity and the continuation of open-ended quantitative easing resulted in a benign credit environment with low default rates.
Improvement in the unemployment rate has been slow, and recent declines may be overstated by reduced labor force participation – the lowest since 1978. In the private sector, the U.S. economy is currently adding jobs at a rate that is over 20 percent higher than that of the prior expansion. As for housing, January and February 2013 marked the best two-month period of new home sales since 2008 which has been driving increased consumption through the wealth effect.
Conflicting economic data about the health of the U.S. economy late in the period stirred concerns about possible market consolidation or even a correction; following the Fiscal Cliff and sequester, there was also rising uncertainty around U.S. fiscal policy issues, as well as anemic growth trends in Europe, slower growth in China and a tumble in commodity prices, notably that of gold. Markets were also startled by the size of accommodation by the Bank of Japan which ultimately weakened the value of the yen. Nonetheless, multi-year lows in the CBOE Volatility Index suggested there was also considerable complacency on the part of investors.
A number of global central banks implemented interest rate cuts during the period, owing to sluggish global economic growth and continuing weakness in commodity prices. The world is still in a deflationary environment, which has given policymakers a great deal of leeway to extend and expand accommodative monetary policies aimed at stimulating output.
Following the end of the Funds’ fiscal year ended May 31, 2013, U.S. and global markets experienced significant volatility. Both fixed income and equity markets sold off sharply due to rising monetary policy uncertainty in the U.S. and growing fundamental risk in Japan and China. The rise in volatility has in large part been a result of shifting market sentiment, but fundamentally, economic growth in the U.S. has not changed materially, although the impact of rising interest rates has yet to be seen. With ongoing weakness in growth and inflation, global central banks are expected to maintain accommodative monetary policies for the foreseeable future.
For the 12-month period ended May 31, 2013, the S&P 500 rose 27.28% (this and all other returns cited in this section are total return). Morgan Stanley Capital International (“MSCI”) Europe-Australasia-Far East (“EAFE”) Index rose 31.62% and the MSCI Emerging Market Index rose 14.10%.
In the bond market, the Barclays U.S. Aggregate Bond Index (the “Barclays Aggregate”) returned 0.91% for the period, while the Barclays U.S. Corporate High Yield Index returned 14.82%. Reflecting the Federal Reserve’s continuing accommodative monetary policy, interest rates on short-term securities remained at their lowest levels in many years; the return of the Barclays 1-3 Month U.S. Treasury Bill Index was 0.08% for the same period.
| 4 | CLAYMORE EXCHANGE-TRADED FUND TRUST 2 ANNUAL REPORT |
Index Definitions
All indices described below are unmanaged and reflect no expenses. It is not possible to invest directly in any index.
The Barclays U.S. Aggregate Bond Index is a broad-based benchmark that measures the investment grade, U.S. dollar denominated, fixed-rate taxable bond market, including Treasuries, government-related and corporate securities, mortgage-backed securities or “MBS” (agency fixed-rate and hybrid adjustable-rate mortgage, or “ARM”, pass-throughs), asset-backed securities (“ABS”), and commercial mortgage-backed securities (“CMBS”).
The Barclays U.S. Corporate High Yield Index measures the market of U.S. dollar denominated, non-investment grade, fixed-rate, taxable corporate bonds.
The Barclays 1-3 Month U.S. Treasury Bill Index tracks the performance of U.S. Treasury Bills with a remaining maturity of one to three months. U.S. Treasury Bills, which are short-term loans to the U.S. government, are full-faith-and-credit obligations of the U.S. Treasury and are generally regarded as being free of any risk of default.
The Chicago Board Options Exchange Market Volatility Index (the “VIX”) is a key measure of market expectations of near-term volatility conveyed by the S&P 500 stock index option prices.
The Dow Jones Global Forestry & Paper Index is a float-adjusted market capitalization weighted index that provides a broad measure of the world forestry and paper markets. According to Dow Jones, the index consists of owners and operators of timber tracts, forest tree nurseries and sawmills excluding providers of finished wood products such as wooden beams, which are classified under Building Materials & Fixtures.
The MSCI China Index is a capitalization weighted index that monitors the performance of stocks from the country of China.
The MSCI EAFE Index is a capitalization weighted measure of stock markets in Europe, Australasia and the Far East. The MSCI Emerging Markets Index is a free float-adjusted market capitalization weighted index that is designed to measure equity market performance in the global emerging markets.
The MSCI World Index is a free float-adjusted market capitalization weighted index that is designed to measure the equity market performance of developed markets.
The Standard & Poor’s (“S&P”) 500 Index is a capitalization-weighted index of 500 stocks designed to measure the performance of the broad economy, representing all major industries and is considered a representation of U.S. stock market.
The S&P/TSX Composite Index is a capitalization weighted index. The index is designed to measure performance of the broad Canadian economy through changes in the aggregate market value of stocks representing all major industries.
The STOXX Europe Total Market Forestry & Paper Index represents the European forestry and paper industry as defined by the market standards of ICB (Industry Classification Benchmark).
Industry Sectors
Comments about industry sectors in these fund commentaries are based on Bloomberg industry classifications.
| CLAYMORE EXCHANGE-TRADED FUND TRUST 2 ANNUAL REPORT | 5 |
| MANAGEMENT DISCUSSION OF FUND PERFORMANCE (Unaudited) | May 31, 2013 |
ENY Guggenheim Canadian Energy Income ETF
Fund Overview
The Guggenheim Canadian Energy Income ETF, NYSE Arca ticker: ENY (the “Fund”) seeks investment results that correspond generally to the performance, before the Fund’s fees and expenses, of an equity index called the Sustainable Canadian Energy Income Index (the “Index”).
The Index is comprised of approximately 30 stocks selected, based on investment and other criteria, from a universe of companies listed on the Toronto Stock Exchange (the “TSX”), NYSE MKT (formerly, NYSE AMEX), Nasdaq Stock Market or New York Stock Exchange. The universe of companies includes approximately 200 TSX-listed oil and gas sector securities including royalty trusts, as defined by TSX, and approximately 25 oil sands resource producers that are classified as oil and gas producers. The companies in the universe are selected using criteria as identified by Sustainable Wealth Management Ltd. (the “Index Provider”).
The Fund will invest at least 90% of its total assets in securities that comprise the Index. The Fund generally will invest in all of the stocks comprising the Index in proportion to their weightings in the Index.
Fund Performance
All Fund returns cited – whether based on net asset value (“NAV”) or market price – assume the reinvestment of all distributions. This report discusses the annual fiscal period ended May 31, 2013.
On a market price basis, the Fund generated a total return of 0.74%, which included a decrease in market price over the period to $14.43 as of May 31, 2013, from $14.73 as of May 31, 2012. On an NAV basis, the Fund generated a total return of 0.61%, which included a decrease in NAV over the period to $14.51 as of May 31, 2013, from $14.83 as of May 31, 2012. At the end of the period the Fund’s shares were trading at a market price discount to NAV, which is to be expected from time to time.
For underlying index and broad Canadian equity market comparison purposes, the Index returned 0.62% and the S&P/TSX Composite Index (“S&P/TSX”) returned 13.06% for the 12-month period ending May 31, 2013.
The Fund made quarterly distributions per share of $0.102 on June 29, 2012; $0.123 on September 28, 2012; $0.126 on December 31, 2012; and $0.087 on March 28, 2013.
Performance Attribution
Since more than 90% of the Fund’s portfolio is invested in the energy sector, the return of this sector was the main determinant of the Fund’s return, and it was the major source of the Fund’s positive return for the 12-month period ended May 31, 2013. The Fund also has positions in the utilities and industrial sectors, which also contributed to the Fund’s return. Positions that contributed most significantly to the Fund’s return included Progress Energy Resources Corp., a Canadian exploration and production company focused on natural gas development that was acquired by PETRONAS Carigali Canada Ltd. in 2012; Nexen, Inc., a Canadian oil and gas company which was acquired by China-based Cnooc Ltd. in 2013; and Peyto Exploration & Development Corp., an oil and gas exploration and production company based in Canada (none of the positions were held in the Fund’s portfolio at period end). Positions that detracted most significantly included Southern Pacific Resource Corp., which is engaged in the exploration, development and production of in-situ thermal heavy oil and bitumen production in the Athabasca oil sands of Alberta and in Senlac, Saskatchewan (3.1% of the Fund’s long-term investments at period end); BlackPearl Resources, Inc., an oil and gas exploration company (4.7% of the Fund’s long-term investments at period end); and Athabasca Oil Corp., which develops oil sands in Alberta, Canada (4.6% of the Fund’s long-term investments at period end).
| 6 | CLAYMORE EXCHANGE-TRADED FUND TRUST 2 ANNUAL REPORT |
| MANAGEMENT DISCUSSION OF FUND PERFORMANCE (Unaudited) continued | May 31, 2013 |
TAO Guggenheim China Real Estate ETF
Fund Overview
The Guggenheim China Real Estate ETF, NYSE Arca ticker: TAO (the “Fund”) seeks investment results that correspond generally to the performance, before the Fund’s fees and expenses, of an equity index called the AlphaShares China Real Estate Index (the “Index”).
The Index is designed to measure and monitor the performance of the investable universe of publicly-traded companies and real estate investment trusts (“REITs”) which are open to foreign ownership and derive a majority of their revenues from real estate development, management and/or ownership of property in China or the Special Administrative Regions of China, such as Hong Kong and Macau. The Index was created by AlphaShares, LLC and is maintained by Standard & Poor’s.
The Fund will invest at least 90% of its total assets in common stock, American Depositary Receipts (“ADRs”), American Depositary Shares (“ADSs”), Global Depositary Receipts (“GDRs”) and International Depositary Receipts (“IDRs”) that comprise the Index and depositary receipts representing common stocks included in the Index (or underlying securities representing the ADRs, ADSs, GDRs and IDRs included in the Index). The Fund generally will invest in all of the securities comprising the Index in proportion to their weightings in the Index.
Fund Performance
All Fund returns cited—whether based on net asset value (“NAV”) or market price—assume the reinvestment of all distributions. This report discusses the annual fiscal period ended May 31, 2013.
On a market price basis, the Fund generated a total return of 31.59%, which included an increase in market price over the period to $21.66 as of May 31, 2013, from $16.74 as of May 31, 2012. On an NAV basis, the Fund generated a total return of 34.05%, which included an increase in NAV over the period to $22.03 as of May 31, 2013, from $16.72 as of May 31, 2012. At the end of the period the Fund’s shares were trading at a market price discount to NAV, which is to be expected from time to time.
For underlying index and market comparison purposes, the Index returned 34.95% and the MSCI China Index, which measures performance of the Chinese equity market, returned 15.39% for the 12-month period ending May 31, 2013.
The Fund made an annual distribution on December 31, 2012, of $0.388 per share, which was characterized as ordinary income.
Performance Attribution
Nearly all of the Fund’s investments are in the real estate holding and development businesses and are classified in the financial and diversified sectors. For the 12-month period ended May 31, 2013, both sectors contributed to the Fund’s return.
Positions that contributed most significantly to the Fund’s return included Wharf Holdings Ltd., an investment holding company based in Hong Kong; China Overseas Land & Investment Ltd., which through its subsidiaries develops and invests in properties, constructs buildings and invests in treasury securities and infrastructure projects; and Henderson Land Development Co. Ltd., a leading property developer with businesses in Hong Kong and throughout mainland China (6.0%, 5.0% and 4.8%, respectively, of the Fund’s long-term investments at period end). Positions that detracted most significantly from the Fund’s return included Evergrande Real Estate Group Ltd., an integrated residential property developer; Swire Properties Ltd., which develops and manages commercial, retail and residential properties; and E-House (China) Holdings Ltd., which offers real estate services (1.5%, 2.3% and 0.3%, respectively, of the Fund’s long-term investments at period end).
| CLAYMORE EXCHANGE-TRADED FUND TRUST 2 ANNUAL REPORT | 7 |
| MANAGEMENT DISCUSSION OF FUND PERFORMANCE (Unaudited) continued | May 31, 2013 |
HAO Guggenheim China Small Cap ETF
Fund Overview
The Guggenheim China Small Cap ETF, NYSE Arca ticker: HAO (the “Fund”) seeks investment results that correspond generally to the performance, before the Fund’s fees and expenses, of an equity index called the AlphaShares China Small Cap Index (the “Index”).
The Index is designed to measure and monitor the performance of publicly-traded mainland China-based small capitalization companies. The Index was created by AlphaShares, LLC (“AlphaShares”) and is maintained by Standard & Poor’s. For inclusion in the Index, AlphaShares defines small-capitalization companies as those companies with a maximum $1.5 billion float-adjusted market capitalization.
The Fund will invest at least 90% of its total assets in common stock, American Depositary Receipts (“ADRs”), American Depositary Shares (“ADSs”), Global Depositary Receipts (“GDRs”) and International Depositary receipts (“IDRs”) that comprise the Index and depositary receipts representing common stocks included in the Index (or underlying securities representing the ADRs, ADSs, GDRs and IDRs included in the Index). The Fund generally will invest in all of the securities comprising the Index in proportion to their weightings in the Index.
Fund Performance
All Fund returns cited—whether based on net asset value (“NAV”) or market price—assume the reinvestment of all distributions. This report discusses the annual fiscal period ended May 31, 2013.
On a market price basis, the Fund generated a total return of 23.08%, which included an increase in market price over the period to $24.31 as of May 31, 2013, from $20.01 as of May 31, 2012. On an NAV basis, the Fund generated a total return of 25.24%, which included an increase in NAV over the period to $24.68 as of May 31, 2013, from $19.97 as of May 31, 2012. At the end of the period the Fund’s shares were trading at a market price discount to NAV, which is to be expected from time to time.
For underlying index and broad market comparison purposes, the Index returned 25.74% and the MSCI China Index, which measures performance of the broad Chinese equity market, returned 15.39% for the 12-month period ending May 31, 2013.
The Fund made an annual distribution of $0.314 per share on December 31, 2012, which was characterized as ordinary income.
Performance Attribution
For the 12-month period ended May 31, 2013, the financial sector contributed most significantly to return, followed by the consumer, noncyclical sector. The diversified sector was the only sector to detract from return. Positions that contributed most significantly to the Fund’s return included Sino-Ocean Land Holdings Ltd., a real estate holding company that develops residential, office and commercial real estate in the northern People’s Republic of China (not held in the Fund’s portfolio at period end); Sino Biopharmaceutical Ltd., which researches, develops, produces and sells biopharmaceutical products for the medical treatment of ophthalmia, as well as modernized Chinese medicine and chemical medicine for the treatment of hepatitis (1.2% of the Fund’s long-term investments at period end); and Semiconductor Manufacturing International Corp., which manufactures, trades, packages, tests and provides computer-aided design integrated circuits (1.1% of the Fund’s long-term investments at period end). Positions that detracted most significantly from the Fund’s return included Parkson Retail Group Ltd., which operates a national network of department stores in China; China Shanshui Cement Group Ltd., a cement and clinker producer; and China Rongsheng Heavy Industries Group Holdings Ltd., which is involved in the ship-making industry and petrochemical engineering (0.3%, 0.6% and 0.3%, respectively, of the Fund’s long-term investments at period end).
| 8 | CLAYMORE EXCHANGE-TRADED FUND TRUST 2 ANNUAL REPORT |
| MANAGEMENT DISCUSSION OF FUND PERFORMANCE (Unaudited) continued | May 31, 2013 |
FRN Guggenheim Frontier Markets ETF
Fund Overview
The Guggenheim Frontier Markets ETF, NYSE Arca ticker: FRN (the “Fund”) seeks investment results that correspond generally to the performance, before the Fund’s fees and expenses, of an equity index called the BNY Mellon New Frontier DR Index (the “Index”).
The Index is composed of and tracks the performance of all liquid, as defined by BNY Mellon, the Fund’s index provider (the “Index Provider”), American Depositary Receipts (“ADRs”) and Global Depositary Receipts (“GDRs”) that trade on the London Stock Exchange (“LSE”), New York Stock Exchange (“NYSE”), NYSE Arca, Inc. (“NYSE Arca”), NYSE MKT (formerly, NYSE AMEX) and Nasdaq Stock Market (“NASDAQ”) of Frontier Market countries, as defined by the Index Provider. The Index Provider defines Frontier Market countries based upon an evaluation of gross domestic product growth, per capita income growth, experienced and expected inflation rates, privatization of infrastructure and social inequalities. The countries currently are: Argentina, Bahrain, Jordan, Kuwait, Lebanon, Oman, Qatar, United Arab Emirates, Egypt, Ghana, Kenya, Malawi, Mauritius, Morocco, Nigeria, Tunisia, Zimbabwe, Bulgaria, Croatia, Czech Republic, Estonia, Georgia, Kazakhstan, Latvia, Lithuania, Poland, Romania, Slovak Republic, Slovenia, Ukraine, Bangladesh, Pakistan, Papua New Guinea, Sri Lanka, Vietnam, Peru, Chile, Colombia, Ecuador, Jamaica, Panama, and Trinidad & Tobago. An ADR or GDR is determined to be liquid based upon an assessment of trading volume and market capitalization.
The Fund will invest at least 80% of its total assets in ADRs and GDRs that comprise the Index or in the stocks underlying such ADRs and GDRs. The Fund also will invest at least 80% of its total assets in securities of issuers from Frontier Market countries (whether directly or through ADRs or GDRs), as defined by the Index Provider. The Fund generally will invest in all of the stocks comprising the Index in proportion to their weightings in the Index.
Fund Performance
All Fund returns cited—whether based on net asset value (“NAV”) or market price—assume the reinvestment of all distributions. This report discusses the annual fiscal period ended May 31, 2013.
On a market price basis, the Fund generated a total return of -8.11%, which included a decrease in market price over the period to $17.17 as of May 31, 2013, from $19.26 as of May 31, 2012. On an NAV basis, the Fund generated a total return of -5.94%, which included a decrease in NAV over the period to $17.41 as of May 31, 2013, from $19.08 as of May 31, 2012. At the end of the period the Fund’s shares were trading at a market price discount to NAV, which is to be expected from time to time.
For underlying index and broad emerging market comparison purposes, the Index returned -5.57% and the Morgan Stanley Capital International (“MSCI”) Emerging Markets Index returned 14.10% for the 12-month period ending May 31, 2013.
The Fund made an annual distribution of $0.607 per share on December 31, 2012, which was characterized as ordinary income.
Performance Attribution
For the 12-month period ending May 31, 2013, the financial sector contributed most significantly to the Fund’s return, followed by the communications sector. The basic materials sector detracted most significantly from the Fund’s return, followed by the consumer, cyclical sector. Positions that contributed most significantly to the Fund’s return included Guaranty Trust Bank PLC, a Nigerian commercial bank; Commercial International Bank Egypt SAE, an Egyptian bank; and Orascom Telecom Holding SAE, an international telecommunications company operating a global system for mobile communications (GSM) networks in the Middle East, Africa and Asia (5.7%, 4.2% and 2.6%, respectively, of the Fund’s long-term investments at period end). Positions that detracted most significantly from the Fund’s return included Latam Airlines Group SA, a Chile-based airline that provides domestic and international passenger and cargo air services; Cia de Minas Buenaventura SA, which explores for, mines and processes gold, silver, zinc and other metals; and Ecopetrol SA, a Colombian integrated oil company (7.0%, 3.6% and 8.7%, respectively, of the Fund’s long-term investments at period end).
| CLAYMORE EXCHANGE-TRADED FUND TRUST 2 ANNUAL REPORT | 9 |
| MANAGEMENT DISCUSSION OF FUND PERFORMANCE (Unaudited) continued | May 31, 2013 |
HGI Guggenheim International Multi-Asset Income ETF
Fund Overview
The Guggenheim International Multi-Asset Income ETF, NYSE Arca ticker: HGI (the “Fund”) seeks investment results that correspond generally to the performance, before the Fund’s fees and expenses, of an index called the Zacks International Multi-Asset Income Index (the “Index”).
The Index is comprised of approximately 150 securities selected, based on investment and other criteria, from a universe of international companies, global real estate investment trusts (“REITs”), master limited partnerships (“MLPs”), Canadian royalty trusts and American Depositary Receipts (“ADRs”) of emerging market companies and U.S. listed closed-end funds that invest in international companies, and at all times is comprised of at least 40% non-U.S. securities. The companies in the universe are selected using a proprietary strategy developed by Zacks Investment Research, Inc.
The Fund will invest at least 90% of its total assets in securities that comprise the Index and underlying securities representing the ADRs included in the Index. The Fund generally will invest in all of the securities comprising the Index in proportion to their weightings in the Index.
Fund Performance
All Fund returns cited—whether based on net asset value (“NAV”) or market price—assume the reinvestment of all distributions. This report discusses the annual fiscal period ended May 31, 2013.
On a market price basis, the Fund generated a total return of 19.21%, which included an increase in market price over the period to $17.19 as of May 31, 2013, from $15.09 as of May 31, 2012. On an NAV basis, the Fund generated a total return of 20.03%, which included an increase in NAV over the period to $17.26 as of May 31, 2013, from $15.05 as of May 31, 2012. At the end of the period the Fund’s shares were trading at a market price discount to NAV, which is to be expected from time to time.
For underlying index and broad market comparison purposes, the Index returned 19.95% and the Morgan Stanley Capital International Europe, Australasia, and Far East (MSCI EAFE) Index, an index designed to reflect the movements of stock markets in developed countries of Europe and the Pacific Basin, returned 31.62% for the 12-month period ending May 31, 2013.
The Fund made quarterly distributions per share of $0.231 on June 29, 2012, $0.175 on September 28, 2012, $0.131 on December 31, 2012 and $0.213 on March 28, 2013. All of the distributions were characterized as ordinary income.
Performance Attribution
For the 12-month period ended May 31, 2013, the financial sector was the most significant contributor to the Fund’s return, followed by the consumer, non-cyclical sector. The energy sector detracted most significantly from the Fund’s return, followed by the basic materials sector. Positions that contributed most significantly to the Fund’s return included Hong Kong Television Network Ltd., which provides international telecommunications services and fixed telecommunication network services; Barclays PLC, which is a global financial services provider engaged in retail banking, credit cards, wholesale banking, investment banking, wealth management and investment management services; and STMicroelectronics NV, which designs, develops, manufactures and markets semiconductor integrated circuits and discrete devices (1.2%, 0.6% and 0.7%, respectively, of the Fund’s long-term investments at period end). Positions that detracted most significantly from the Fund’s return included SandRidge Permian Trust, which owns royalty interests in producing and developing oil wells in the Mississippian formation in Oklahoma; Gold Fields Ltd., a South African company that produces precious metals; and Yanzhou Coal Mining Co. Ltd., which operates underground mining and coal preparation and operation businesses (0.9%, 0.6% and 0.6%, respectively, of the Fund’s long-term investments at period end).
| 10 | CLAYMORE EXCHANGE-TRADED FUND TRUST 2 ANNUAL REPORT |
| MANAGEMENT DISCUSSION OF FUND PERFORMANCE (Unaudited) continued | May 31, 2013 |
SEA Guggenheim Shipping ETF
Fund Overview
The Guggenheim Shipping ETF, NYSE Arca ticker: SEA (the “Fund”) seeks investment results that correspond generally to the performance, before the Fund’s fees and expenses, of an equity index called the Dow Jones Global Shipping IndexSM (the “Index”).
The Index is designed to measure the performance of high-dividend paying companies in the global shipping industry. CME Group Index Services, LLC (the “Index Provider”) uses a rules-based methodology to rank companies by yield that are involved in the shipping industry globally that primarily transport goods and materials. The Index Provider considers a company to be in the shipping industry if its revenues are derived primarily from shipping activities (excluding companies solely involved in transporting passengers). The Index Provider determines whether a company is “high-dividend paying” by ranking it relative to other companies in the shipping industry based upon indicated annual yield (most recent distribution annualized and divided by the current share price). The companies in the Index may be located in any country, including those classified as emerging markets.
The Fund will at all times invest at least 90% of its total assets in common stock, American Depositary Receipts (“ADRs”), Global Depositary Receipts (“GDRs”) and master limited partnerships (“MLPs”) that comprise the Index and the underlying stocks in respect of the ADRs and GDRs in the Index. The Fund generally will invest in all of the securities comprising the Index in proportion to their weightings in the Index.
Fund Performance
All Fund returns cited—whether based on net asset value (“NAV”) or market price—assume the reinvestment of all distributions. This report discusses the annual fiscal period ended May 31, 2013.
On a market price basis, the Fund generated a total return of 12.20%, which included an increase in market price over the period to $17.43 as of May 31, 2013, from $15.99 as of May 31, 2012. On an NAV basis, the Fund generated a total return of 12.44%, which included an increase in NAV over the period to $17.51 as of May 31, 2013, from $16.03 as of May 31, 2012. At the end of the period the Fund’s shares were trading at a market price discount to NAV, which is to be expected from time to time.
For underlying index and broad market comparison purposes, the Index returned 12.24% and the MSCI World Index, an index designed to measure the equity market performance of developed markets, returned 27.77% for the 12-month period ending May 31, 2013.
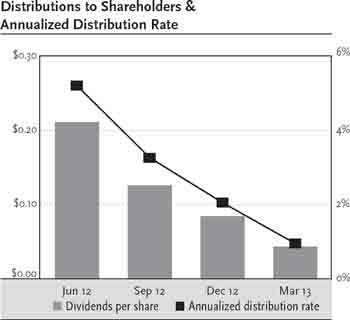
The Fund made quarterly distributions per share of $0.211 on June 29, 2012, $0.126 on September 28, 2012, $0.084 on December 31, 2012 and $0.043 on March 28, 2013. All of the distributions were characterized as ordinary income.
Performance Attribution
Most of the Fund’s portfolio is invested in the industrial sector, and it was the largest contributor to return. Positions that contributed most to the Fund’s return included AP Moeller-Maersk A/S, a conglomerate with diversified holdings, including a shipping fleet, industrial and supermarket businesses, and oil and gas exploration and distribution businesses; Teekay Corp., which provides international crude oil and petroleum product transportation services to major oil companies, oil traders and government agencies; and Navios Maritime Holdings, Inc., a provider of maritime freight transportation services (15.6%, 3.9% and 2.7%, respectively, of the Fund’s long-term investments at period end). Positions that detracted most significantly from the Fund’s return included Frontline Ltd., which owns a fleet of very large crude carriers; Nordic American Tankers Ltd., a shipping company that owns and charters oil tankers; and Teekay Tankers Ltd., which owns and operates a fleet of crude oil tankers (1.6%, 2.6% and 1.9%, respectively, of the Fund’s long-term investments at period end).
| CLAYMORE EXCHANGE-TRADED FUND TRUST 2 ANNUAL REPORT | 11 |
| MANAGEMENT DISCUSSION OF FUND PERFORMANCE (Unaudited) continued | May 31, 2013 |
CUT Guggenheim Timber ETF
Fund Overview
The Guggenheim Timber ETF, NYSE Arca ticker: CUT (the “Fund”) seeks investment results that correspond generally to the performance, before the Fund’s fees and expenses, of an equity index called the Beacon Global Timber Index (the “Index”).
All securities in the Index are selected from the universe of global timber companies. Beacon Indexes, LLC (“Beacon” or the “Index Provider”) defines global timber companies as firms who own or lease forested land and harvest the timber from such forested land for commercial use and sale of wood-based products, including lumber, pulp or other processed or finished goods such as paper and packaging.
The Fund will invest at least 90% of its total assets in common stock, American Depositary Receipts (“ADRs”) and Global Depositary Receipts (“GDRs”) that comprise the Index and depositary receipts representing common stocks included in the Index (or underlying securities representing the ADRs and GDRs included in the Index). The Fund generally will invest in all of the securities comprising the Index in proportion to their weightings in the Index.
Fund Performance
All Fund returns cited—whether based on net asset value (“NAV”) or market price—assume the reinvestment of all distributions. This report discusses the annual fiscal period ended May 31, 2013.
On a market price basis, the Fund generated a total return of 42.05%, which included an increase in market price over the period to $22.10 as of May 31, 2013, from $15.75 as of May 31, 2012. On an NAV basis, the Fund generated a total return of 43.01%, which included an increase in NAV over the period to $22.19 as of May 31, 2013, from $15.71 as of May 31, 2012. At the end of the period the Fund’s shares were trading at a market price discount to NAV, which is to be expected from time to time.
For underlying index and broad world market comparison purposes, the Index returned 44.19%; the Dow Jones Global Forestry & Paper Index returned 29.22%; and the MSCI World Index, an index designed to measure the equity market performance of developed markets, returned 27.77% for the 12-month period ending May 31, 2013.
The Fund made an annual distribution of $0.253 per share on December 31, 2012, which was characterized as ordinary income.
Performance Attribution
Since approximately 70% of the Fund’s portfolio is invested in the basic materials sector, the return of this sector is the main determinant of the Fund’s return, and it was the major contributor to the Fund’s positive return for the 12-month period ended May 31, 2013. The Fund also has positions in the financial, energy and industrial sectors, all of which contributed to the Fund’s return. Positions that contributed most significantly to the Fund’s return included Smurfit Kappa Group PLC, one of the world’s largest integrated manufacturers of paper-based packaging products, with operations in Europe and Latin America; West Fraser Timber Co. Ltd., which produces dimension lumber and related wood products and has operations in Canada and the U.S.; and Svenska Cellulosa AB, a global hygiene and forest company that develops and produces personal care products, tissue and forest products, and is based in Sweden (6.6%, 5.7% and 5.5%, respectively, of the Fund’s long-term investments at period end). Positions that detracted most significantly from the Fund’s return included Oji Holdings Corp., which manufactures paper, pulp and processed paper goods and has forests in Japan and overseas (2.8% of the Fund’s long-term investments at period end); Nippon Paper Industries Co., Ltd., a Japan-based company that manufactures and sells paper and pulp products (2.3% of the Fund’s long-term investments at period end); and Nippon Paper Group, Inc., a company established jointly by Nippon Paper Industries Co., Ltd. and Daishowa Paper Manufacturing Co., Ltd. to manage and control subsidiaries which manufacture, process, sell and buy paper and pulp products (not held in the Fund’s portfolio at period end).
| 12 | CLAYMORE EXCHANGE-TRADED FUND TRUST 2 ANNUAL REPORT |
Risks and Other Considerations
The views expressed in this report reflect those of the portfolio managers and Guggenheim Investments only through the report period as stated on the cover. These views are subject to change at any time, based on market and other conditions and should not be construed as a recommendation of any kind. The material may also contain forward-looking statements that involve risk and uncertainty, and there is no guarantee they will come to pass.
This information does not represent an offer to sell securities of the Funds and it is not soliciting an offer to buy securities of the Funds. An investment in the various Guggenheim Investments ETFs is subject to certain risks and other considerations. Below are some general risks and considerations associated with investing in the Funds, which may cause you to lose money, including the entire principal that you invest. Please refer to the individual ETF prospectus for a more detailed discussion of the Fund-specific risks and considerations.
Equity Risk: The value of the equity securities held by the Funds may fall due to general market and economic conditions, perceptions regarding the industries in which the issuers of securities held by the Funds participate, or factors relating to specific companies in which the Funds invest.
Foreign Investment Risk: Investing in non-U.S. issuers may involve unique risks such as currency, political, and economic risk, as well as less market liquidity, generally greater market volatility and less complete financial information than for U.S. issuers.
Small and Medium-Sized Company Risk: Investing in securities of these companies involves greater risk as their stocks may be more volatile and less liquid than investing in more established companies. These stocks may have returns that vary, sometimes significantly, from the overall stock market.
Non-Correlation Risk: The Funds’ return may not match the return of the Index including, but not limited to, operating expenses and costs in buying and selling securities to reflect changes in the Index. The Funds may not be fully invested at times. If the Funds utilize a sampling approach or futures or other derivative positions, their return may not correlate with the Index return, as would be the case if they purchased all of the stocks with the same weightings as the Index.
Passive Management Risk: The Funds are not “actively” managed. Therefore, they would not necessarily sell a stock because the stock’s issuer was in financial trouble unless that stock is removed from the Index.
Issuer-Specific Changes: The value of an individual security or particular type of security can be more volatile than the market as a whole and can perform differently from the value of the market as a whole. The value of securities of smaller issuers can be more volatile than that of larger issuers.
Industry Risk: If its Index is comprised of issuers in a particular industry or sector, a Fund would therefore be focused in that industry or sector. Accordingly, that Fund may be subject to more risks than if it were broadly diversified over numerous industries and sectors of the economy.
Non-Diversified Fund Risk (excluding HAO and HGI): The Funds can invest a greater portion of assets in securities of individual issuers than a diversified fund. Changes in the market value of a single investment could cause greater fluctuations in share price than would occur in a diversified fund.
Emerging Markets Risk (CUT, FRN, HGI, TAO, HAO and SEA): Investment in securities of issuers based in developing or “emerging market” countries entails all of the risks of investing in securities of non-U.S. issuers, as previously described, but to a heightened degree.
Canadian Risk (ENY and HGI): Investing in Canadian royalty trusts and stocks listed on the TSX are subject to: Commodity Exposure Risk, Reliance on Exports Risk, U.S. Economic Risk and Structural Risk (Political Risk).
Master Limited Partnership (MLP) Risk (FRN, SEA and HGI): Investments in securities of MLPs involve risks that differ from an investment in common stock. Holders of the units of MLPs have more limited control and limited rights to vote on matters affecting the partnership. There are also certain tax risks associated with an investment in units of MLPs.
China Investment Risk (HAO and TAO): Investing in securities of Chinese companies involves additional risks, including, but not limited to: the economy of China differs, often unfavorably, from the U.S. economy in such respects as structure, general development, government involvement, wealth distribution, rate of inflation, growth rate, allocation of resources and capital reinvestment, among others; the central government has historically exercised substantial control over virtually every sector of the Chinese economy through administrative regulation and/or state ownership; and actions of the Chinese central and local government authorities continue to have a substantial effect on economic conditions in China.
REIT Risk (HGI and TAO): Investments in securities of real estate companies involve risks. These risks include, among others, adverse changes in national, state or local real estate conditions; obsolescence of properties; changes in the availability, cost and terms of mortgage funds; and the impact of changes in environmental laws.
Risks of Investing In Other Investment Companies (HGI): Investments in securities of other investment companies involve risks, including, among others, the fact that shares of other investment companies are subject to the management fees and other expenses of those companies, and the purchase of shares of some investment companies (in the case of closed-end investment companies) may sometimes require the payment of substantial premiums above the value of such companies’ portfolio securities or net asset values.
Risks of Investing in Frontier Securities (FRN): Investment in securities in emerging market countries involves risks not associated with investments in securities in developed countries, including risks associated with expropriation and/or nationalization, political or social instability, armed conflict, the impact on the economy as a result of civil war, religious or ethnic unrest and the withdrawal or non-renewal of any license enabling the Fund to trade in securities of a particular country, confiscatory taxation, restrictions on transfers of assets, lack of uniform accounting, auditing and financial reporting standards, less publicly available financial and other information, diplomatic development which could affect U.S. investments in those countries and potential difficulties in enforcing contractual obligations. Frontier countries generally have smaller economies or less developed capital markets than traditional emerging markets, and, as a result, the risk of investing in emerging market countries are magnified in frontier countries. As of the date of this report, a significant percentage of the BNY Mellon New Frontier DR Index is comprised of securities of companies from Chile, Columbia and Argentina. To the extent that the Index is focused on securities of any one country, including Chile, Columbia or Argentina, the value of the Index will be especially affected by adverse developments in such country, including the risks described above.
Securities Lending Risk: Although each Fund will receive collateral in connection with all loans of its securities holdings, the Funds would be exposed to a risk of loss should a borrower default on its obligation to return the borrowed securities (e.g., the loaned securities may have appreciated beyond the value of the collateral held by the Fund). In addition, the Funds will bear the risk of loss of any cash collateral that they invest.
In addition to the risks described, there are certain other risks related to investing in the Funds. These risks are described further in the Prospectus and Statement of Additional Information and at guggenheiminvestments.com/etf.
| CLAYMORE EXCHANGE-TRADED FUND TRUST 2 ANNUAL REPORT | 13 |
| FUND SUMMARY & PERFORMANCE (Unaudited) | May 31, 2013 |
ENY Guggenheim Canadian Energy Income ETF
| | | | |
| Fund Statistics | | | |
| Share Price | | $ | 14.43 |
| Net Asset Value | | $ | 14.51 |
| Premium/Discount to NAV | | | -0.55% |
| Net Assets ($000) | | $ | 60,518 |
| Total Returns | | | | |
| | | Three | Five | Since |
| (Inception | One | Year | Year | Inception |
| 7/3/07) | Year | (Annualized) | (Annualized) | (Annualized) |
| Guggenheim Canadian | | | | |
| Energy Income ETF | | | | |
| NAV | 0.61% | -1.34% | -10.87% | -5.20% |
| Market | 0.74% | -1.48% | -11.06% | -5.30% |
| Sustainable Canadian | | | | |
| Energy Income Index | 0.62% | -0.93% | -9.72% | -3.80% |
| S&P/TSX Composite | | | | |
| Index | 13.06% | 5.81% | -0.84% | 1.73% |
Performance data quoted represents past performance, which is no guarantee of future results, and current performance may be lower or higher than the figures shown. The deduction of taxes that a shareholder would pay on Fund distributions or the redemption of Fund shares is not reflected in the total returns. For the most recent month-end performance figures, please visit guggenheiminvestments.com. The investment return and principal value of an investment will fluctuate with changes in market conditions and other factors so that an investor’s shares, when redeemed, may be worth more or less than their original cost.
Since inception returns assume a purchase of the Fund at the initial share price of $25.05 per share for share price returns or initial net asset value (NAV) of $25.05 per share for NAV returns. Returns for periods of less than one year are not annualized.
The S&P/TSX composite is the headline index for the Canadian equity market. It is the broadest in the S&P/TSX family and is the basis for multiple sub-indices. The referenced indices are unmanaged and not available for direct investment. Index performance does not reflect transaction costs, fees or expenses.
Per the most recent prospectus, the Fund’s annualized gross operating expense ratio, gross of any fee waivers or expense reimbursements, was 0.79%. In the Financial Highlights section of this Annual Report, the Fund’s annualized net operating expense ratio was 0.70% while the Fund’s annualized gross operating expense ratio, gross of any fee waivers or expense reimbursements, was 0.83%. There is a contractual fee waiver currently in place for this Fund through December 31, 2015 to the extent necessary in keeping the Fund’s operating expense ratio from exceeding 0.65% of average net assets per year. Some expenses fall outside of this expense cap and actual expenses may be higher than 0.65%. Without this expense cap, actual returns would be lower.
| Portfolio Breakdown | % of Net Assets |
| Energy | 96.5% |
| Utilities | 2.3% |
| Industrial | 1.2% |
| Total Long-Term Investments | 100.0% |
| Investments of Collateral for Securities Loaned | 17.1% |
| Total Investments | 117.1% |
| Liabilities in excess of Other Assets | -17.1% |
| Net Assets | 100.0% |
| | |
| | % of Long-Term |
| Top Ten Holdings | Investments |
| Suncor Energy, Inc. | 8.3% |
| Canadian Oil Sands Ltd. | 7.8% |
| Cenovus Energy, Inc. | 7.8% |
| Imperial Oil Ltd. | 7.0% |
| Canadian Natural Resources Ltd. | 6.7% |
| MEG Energy Corp. | 5.9% |
| Baytex Energy Corp. | 4.9% |
| BlackPearl Resources, Inc. | 4.7% |
| Athabasca Oil Corp. | 4.6% |
| Husky Energy, Inc. | 4.6% |
Portfolio breakdown is shown as a percentage of net assets. Holdings is shown as a percentage of long-term investments. All are subject to change daily. For more current Fund information, please visit guggenheiminvestments.com. The above summaries are provided for informational purposes only, and should not be viewed as recommendations.
| 14 | CLAYMORE EXCHANGE-TRADED FUND TRUST 2 ANNUAL REPORT |
| FUND SUMMARY & PERFORMANCE (Unaudited) continued | May 31, 2013 |
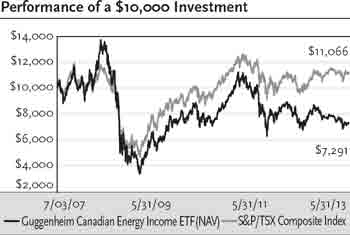
ENY Guggenheim Canadian Energy Income ETF (continued)
This graph compares a hypothetical $10,000 investment in the Fund, made at its inception, with a similar investment in the Standard and Poor’s Toronto Stock Exchange Composite Index (S&P/TSX Composite Index). Results include the reinvestment of all dividends and capital gains. Past performance is no guarantee of future results. The S&P/TSX Composite Index is a capitalization-weighted index. The index is designed to measure performance of the broad Canadian economy through changes in the aggregate market value of stocks representing all major industries. It is not possible to invest directly in the S&P/TSX Composite Index. Investment return and principal value will fluctuate with changes in market conditions and other factors and Fund shares, when redeemed, may be worth more or less than their original investment.
| CLAYMORE EXCHANGE-TRADED FUND TRUST 2 ANNUAL REPORT | 15 |
| FUND SUMMARY & PERFORMANCE (Unaudited) continued | May 31, 2013 |
TAO Guggenheim China Real Estate ETF
| Fund Statistics | | | |
| Share Price | | $ | 21.66 |
| Net Asset Value | | $ | 22.03 |
| Premium/Discount to NAV | | | -1.68% |
| Net Assets ($000) | | $ | 50,881 |
| Total Returns | | | | |
| | | Three | Five | Since |
| (Inception | One | Year | Year | Inception |
| 12/18/07) | Year | (Annualized) | (Annualized) | (Annualized) |
| Guggenheim China | | | | |
| Real Estate ETF | | | | |
| NAV | 34.05% | 12.61% | 3.41% | 0.73% |
| Market | 31.59% | 12.28% | 2.80% | 0.39% |
| AlphaShares China | | | | |
| Real Estate Index | 34.95% | 13.29% | 4.27% | 1.59% |
| MSCI China Index | 15.39% | 2.64% | -0.93% | -3.00% |
Performance data quoted represents past performance, which is no guarantee of future results and current performance may be lower or higher than the figures shown. The deduction of taxes that a shareholder would pay on Fund distributions or the redemption of Fund shares is not reflected in the total returns. For the most recent month-end performance figures, please visit guggenheiminvestments.com. The investment return and principal value of an investment will fluctuate with changes in market conditions and other factors so that an investor’s shares, when redeemed, may be worth more or less than their original cost.
Since inception returns assume a purchase of the Fund at the initial share price of $23.50 per share for share price returns or initial net asset value (NAV) of $23.50 per share for NAV returns. Returns for periods of less than one year are not annualized.
The MSCI China Index, a representative sample for the entire Chinese investment universe, combining A, B, H Red Chip and P Chip share classes as well as US and Singapore-listed Chinese securities. The referenced indices are unmanaged and not available for direct investment. Index performance does not reflect transaction costs, fees or expenses.
Per the most recent prospectus, the Fund’s annualized gross operating expense ratio, gross of any fee waivers or expense reimbursements, was 1.35%. In the Financial Highlights section of the Annual Report, the Fund’s annualized net operating expense ratio was 0.70%, while the Fund’s annualized gross operating expense ratio, gross of any fee waivers or expense reimbursements, was 0.93%. There is a contractual fee waiver currently in place for this Fund through December 31, 2015 to the extent necessary in keeping the Fund’s operating expense ratio from exceeding 0.65% of average net assets per year. Some expenses fall outside of this expense cap and actual expenses will be higher than 0.65%. Without this expense cap, actual returns would be lower.
| Portfolio Breakdown | % of Net Assets |
| Financials/Real Estate | 86.6% |
| Diversified | 12.8% |
| Total Common Stocks and Rights | 99.4% |
| Investments of Collateral for Securities Loaned | 4.3% |
| Total Investments | 103.7% |
| Liabilities in excess of Other Assets | -3.7% |
| Net Assets | 100.0% |
| | |
| | % of Long-Term |
| Top Ten Holdings | Investments |
| Wharf Holdings Ltd. | 6.0% |
| Swire Pacific Ltd., Class A | 5.3% |
| Link Real Estate Investment Trust, REIT | 5.1% |
| China Overseas Land & Investment Ltd. | 5.0% |
| Hongkong Land Holdings Ltd. | 5.0% |
| Henderson Land Development Co. Ltd. | 4.8% |
| Cheung Kong Holdings Ltd. | 4.6% |
| Hang Lung Properties Ltd. | 4.6% |
| Sun Hung Kai Properties Ltd. | 4.5% |
| New World Development Co. Ltd. | 4.1% |
Portfolio breakdown is shown as a percentage of net assets. Holdings are shown as a percentage of long-term investments. All are subject to change daily. For more current Fund information, please visit guggenheiminvestments.com. The above summaries are provided for informational purposes only, and should not be viewed as recommendations.
| 16 | CLAYMORE EXCHANGE-TRADED FUND TRUST 2 ANNUAL REPORT |
| FUND SUMMARY & PERFORMANCE (Unaudited) continued | May 31, 2013 |
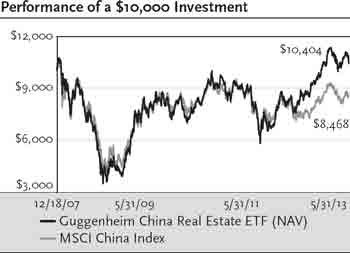
TAO Guggenheim China Real Estate ETF (continued)
This graph compares a hypothetical $10,000 investment in the Fund, made at its inception, with a similar investment in the MSCI China Index. Results include the reinvestment of all dividends and capital gains. Past performance is no guarantee of future results. The MSCI China Index is a capitalization-weighted index that monitors the performance of stocks from the country of China. The index is unmanaged. It is not possible to invest directly in the MSCI China Index. Investment return and principal value will fluctuate with changes in market conditions and other factors and Fund shares, when redeemed, may be worth more or less than their original investment.
| CLAYMORE EXCHANGE-TRADED FUND TRUST 2 ANNUAL REPORT | 17 |
| FUND SUMMARY & PERFORMANCE (Unaudited) continued | May 31, 2013 |
HAO Guggenheim China Small Cap ETF
| Fund Statistics | | | |
| Share Price | | $ | 24.31 |
| Net Asset Value | | $ | 24.68 |
| Premium/Discount to NAV | | | -1.50% |
| Net Assets ($000) | | $ | 236,923 |
| Total Returns | | | | |
| | | Three | Five | Since |
| (Inception | One | Year | Year | Inception |
| 1/30/08) | Year | (Annualized) | (Annualized) | (Annualized) |
| Guggenheim China | | | | |
| Small Cap ETF | | | | |
| NAV | 25.24% | 2.33% | 1.89% | 1.54% |
| Market | 23.08% | 2.01% | 1.29% | 1.25% |
| AlphaShares China | | | | |
| Small Cap Index | 25.74% | 3.14% | 2.99% | 2.63% |
| MSCI China Index | 15.39% | 2.64% | -0.93% | -0.54% |
Performance data quoted represents past performance, which is no guarantee of future results and current performance may be lower or higher than the figures shown. The deduction of taxes that a shareholder would pay on Fund distributions or the redemption of Fund shares is not reflected in the total returns. For the most recent month-end performance figures, please visit guggenheiminvestments.com. The investment return and principal value of an investment will fluctuate with changes in market conditions and other factors so that an investor’s shares, when redeemed, may be worth more or less than their original cost.
Since inception returns assume a purchase of the Fund at the initial share price of $24.34 per share for share price returns or initial net asset value (NAV) of $24.34 per share for NAV returns. Returns for periods of less than one year are not annualized.
The MSCI China Index, a representative sample for the entire Chinese investment universe, combining A, B, H Red Chip and P Chip share classes as well as U.S. and Singapore-listed Chinese securities. The referenced indices are unmanaged and not available for direct investment. Index performance does not reflect transaction costs, fees or expense.
Per the most recent prospectus, the Fund’s annualized gross operating expense ratio, gross of any fee waivers or expense reimbursements, was 0.92%. In the Financial Highlights section of this Annual Report, the Fund’s annualized net operating expense ratio was 0.75% while the Fund’s annualized gross operating expense ratio, gross of any fee waivers or expense reimbursements, was 0.84%. There is a contractual fee waiver currently in place for this Fund through December 31, 2015 to the extent necessary in keeping the Fund’s operating expense ratio from exceeding 0.70% of average net assets per year. Some expenses fall outside of this expense cap and actual expenses may be higher than 0.70%. Without this expense cap, actual returns would be lower.
| Portfolio Breakdown | % of Net Assets |
| Consumer, Cyclical | 19.2% |
| Industrial | 18.2% |
| Consumer, Non-cyclical | 17.1% |
| Financial | 16.2% |
| Basic Materials | 9.0% |
| Communications | 6.0% |
| Energy | 5.2% |
| Technology | 4.0% |
| Utilities | 4.0% |
| Diversified | 0.5% |
| Total Common Stocks and Convertible Securities | 99.4% |
| Investments of Collateral for Securities Loaned | 17.8% |
| Total Investments | 117.2% |
| Liabilities in excess of Other Assets | -17.2% |
| Net Assets | 100.0% |
| | |
| | % of Long-Term |
| Top Ten Holdings | Investments |
| Youku Tudou, Inc., ADR | 1.5% |
| Byd Co. Ltd. | 1.3% |
| Sino Biopharmaceutical | 1.2% |
| Tsingtao Brewery Co. Ltd. | 1.1% |
| Sohu.com, Inc. | 1.1% |
| Xinyi Glass Holdings Ltd. | 1.1% |
| Semiconductor Manufacturing International Corp. | 1.1% |
| Guangzhou R&F Properties Co. Ltd. | 1.1% |
| China Resources Gas Group Ltd. | 1.1% |
| China Everbright International Ltd. | 1.0% |
Portfolio breakdown is shown as a percentage of net assets. Holdings is shown as a percentage of long-term investments. All are subject to change daily. For more current Fund information, please visit guggenheiminvestments.com. The above summaries are provided for informational purposes only, and should not be viewed as recommendations.
| 18 | CLAYMORE EXCHANGE-TRADED FUND TRUST 2 ANNUAL REPORT |
| FUND SUMMARY & PERFORMANCE (Unaudited) continued | May 31, 2013 |
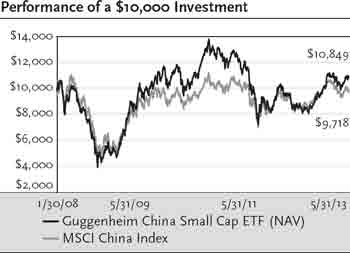
HAO Guggenheim China Small Cap ETF (continued)
This graph compares a hypothetical $10,000 investment in the Fund, made at its inception, with a similar investment in the MSCI China Index. Results include the reinvestment of all dividends and capital gains. Past performance is no guarantee of future results. The MSCI China Index is a capitalization-weighted index that monitors the performance of stocks from the country of China. The index is unmanaged. It is not possible to invest directly in the MSCI China Index. Investment return and principal value will fluctuate with changes in market conditions and other factors and Fund shares, when redeemed, may be worth more or less than their original investment.
| CLAYMORE EXCHANGE-TRADED FUND TRUST 2 ANNUAL REPORT | 19 |
| FUND SUMMARY & PERFORMANCE (Unaudited) continued | May 31, 2013 |
FRN Guggenheim Frontier Markets ETF
| Fund Statistics | | | |
| Share Price | | $ | 17.17 |
| Net Asset Value | | $ | 17.41 |
| Premium/Discount to NAV | | | -1.38% |
| Net Assets ($000) | | $ | 112,098 |
| Total Returns | | | |
| | | Three | Since |
| | One | Year | Inception |
| (Inception 6/12/08) | Year | (Annualized) | (Annualized) |
| Guggenheim Frontier | | | |
| Markets ETF | | | |
| NAV | -5.94% | 1.34% | -4.47% |
| Market | -8.11% | -0.13% | -4.74% |
| BNY Mellon New Frontier | | | |
| DR Index | -5.57% | 1.78% | -3.70% |
| MSCI Emerging Markets Index | 14.10% | 5.41% | 0.11% |
Performance data quoted represents past performance, which is no guarantee of future results, and current performance may be lower or higher than the figures shown. The deduction of taxes that a shareholder would pay on Fund distributions or the redemption of Fund shares is not reflected in the total returns. For the most recent month-end performance figures, please visit guggenheiminvestments.com. The investment return and principal value of an investment will fluctuate with changes in market conditions and other factors so that an investor’s shares, when redeemed, may be worth more or less than their original cost.
Since inception returns assume a purchase of the Fund at the initial share price of $24.34 per share for share price returns or initial net asset value (NAV) of $24.34 per share for NAV returns. Returns for periods of less than one year are not annualized.
The MSCI Emerging Markets Index is a free float-adjusted market capitalization index that is designed to measure equity market performance in the global emerging markets. The referenced indices are unmanaged and not available for direct investment. Index performance does not reflect transaction costs, fees or expenses.
Per the most recent prospectus, the Fund’s annualized gross operating expense ratio, gross of any fee waivers or expense reimbursements, was 0.81%. In the Financial Highlights section of this Annual Report, the Fund’s annualized net operating expense ratio was 0.70% while the Fund’s annualized gross operating expense ratio, gross of any fee waivers or expense reimbursements, was 0.75%. There is a contractual fee waiver currently in place for this Fund through December 31, 2015 to the extent necessary in keeping the Fund’s operating expense ratio from exceeding 0.65% of average net assets per year. Some expenses fall outside of this expense cap and actual expenses may be higher than 0.65%. Without this expense cap, actual returns would be lower.
| Portfolio Breakdown | % of Net Assets |
| Financial | 30.7% |
| Energy | 18.0% |
| Utilities | 15.4% |
| Consumer, Non-cyclical | 14.7% |
| Basic Materials | 7.8% |
| Consumer, Cyclical | 7.0% |
| Communications | 3.7% |
| Industrial | 1.1% |
| Total Common Stocks and Preferred Stocks | 98.4% |
| Exchange Traded Fund | 0.8% |
| Investments of Collateral for Securities Loaned | 25.5% |
| Total Investments | 124.7% |
| Liabilities in excess of Other Assets | -24.7% |
| Net Assets | 100.0% |
| | |
| | % of Long-Term |
| Top Ten Holdings | Investments |
| Ecopetrol SA, ADR | 8.7% |
| Enersis SA, ADR | 8.2% |
| Cencosud SA, ADR | 7.1% |
| Latam Airlines Group SA, ADR | 7.0% |
| Empresa Nacional de Electricidad SA, ADR | 6.7% |
| Guaranty Trust Bank PLC, GDR | 5.7% |
| BanColombia SA, ADR | 4.6% |
| Sociedad Quimica y Minera de Chile SA, ADR | 4.3% |
| Banco Santander Chile, ADR | 4.2% |
| Commercial International Bank Egypt SAE, GDR | 4.2% |
Portfolio breakdown is shown as a percentage of net assets. Holdings is shown as a percentage of long-term investments. All are subject to change daily. For more current Fund information, please visit guggenheiminvestments.com. The above summaries are provided for informational purposes only, and should not be viewed as recommendations.
| 20 | CLAYMORE EXCHANGE-TRADED FUND TRUST 2 ANNUAL REPORT |
| FUND SUMMARY & PERFORMANCE (Unaudited) continued | May 31, 2013 |
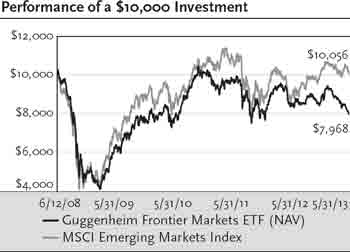
FRN Guggenheim Frontier Markets ETF (continued)
This graph compares a hypothetical $10,000 investment in the Fund, made at its inception, with a similar investment in the MSCI Emerging Markets Index. Results include the reinvestment of all dividends and capital gains. Past performance is no guarantee of future results. The MSCI Emerging Markets Index is a free float-adjusted market capitalization index that is designed to measure equity market performance in the global emerging markets. It is not possible to invest directly in the MSCI Emerging Market Index. Investment return and principal value will fluctuate with changes in market conditions and other factors and Fund shares, when redeemed, may be worth more or less than their original investment.
| CLAYMORE EXCHANGE-TRADED FUND TRUST 2 ANNUAL REPORT | 21 |
| FUND SUMMARY & PERFORMANCE (Unaudited) continued | May 31, 2013 |
HGI Guggenheim International Multi-Asset Income ETF
| Fund Statistics | | | |
| Share Price | | $ | 17.19 |
| Net Asset Value | | $ | 17.26 |
| Premium/Discount to NAV | | | -0.41% |
| Net Assets ($000) | | $ | 119,116 |
| Total Returns | | | | |
| | | Three | Five | Since |
| (Inception | One | Year | Year | Inception |
| 7/11/07) | Year | (Annualized) | (Annualized) | (Annualized) |
| Guggenheim International | | | | |
| Multi-Asset Income ETF | | | | |
| NAV | 20.03% | 7.20% | -0.97% | -1.68% |
| Market | 19.21% | 7.07% | -1.83% | -1.76% |
| Zacks International | | | | |
| Multi-Asset | | | | |
| Income Index | 19.95% | 7.54% | -0.62% | -1.18% |
| MSCI EAFE Index | 31.62% | 10.99% | -1.60% | -2.14% |
Performance data quoted represents past performance, which is no guarantee of future results and current performance may be lower or higher than the figures shown. The deduction of taxes that a shareholder would pay on Fund distributions or the redemption of Fund shares is not reflected in the total returns. For the most recent month-end performance figures, please visit guggenheiminvestments.com. The investment return and principal value of an investment will fluctuate with changes in the market conditions and other factors so that an investor’s shares, when redeemed, may be worth more or less than their original cost.
Since inception returns assume a purchase of the Fund at the initial share price of $24.98 per share for share price returns or initial net asset value (NAV) of $24.98 per share for NAV returns. Returns for periods of less than one year are not annualized.
The Morgan Stanley Capital International (MSCI) EAFE Index measures the performance for a diverse range of global stock markets within Europe, Australasia and the Far East. The referenced indices are unmanaged and not available for direct investment. Index performance does not reflect transaction costs, fees or expenses.
Per the most recent prospectus, the Fund’s annualized gross operating expense ratio, gross of any fee waivers or expense reimbursements, was 1.06%. In the Financial Highlights section of this Annual Report, the Fund’s annualized net operating expense ratio was 0.70%, while the Fund’s annualized gross operating expense ratio, gross of any fee waivers or expense reimbursements, was 0.81%. There is a contractual fee waiver currently in place for this Fund through December 31, 2015 to the extent necessary in keeping the Fund’s operating expense ratio from exceeding 0.65% of average net assets per year. Some expenses fall outside of this expense cap and actual expenses will be higher than 0.65%. Without this expense cap, actual returns would be lower.
| Portfolio Breakdown | % of Net Assets |
| Communications | 18.4% |
| Financial | 14.0% |
| Energy | 12.8% |
| Consumer, Non-cyclical | 11.1% |
| Industrial | 8.7% |
| Utilities | 7.3% |
| Basic Materials | 6.5% |
| Consumer, Cyclical | 6.4% |
| Technology | 4.8% |
| Total Common Stocks, Preferred Stocks, Master | |
| Limited Partnerships and Royalty Trusts | 90.0% |
| Closed End Funds | 9.6% |
| Total Long-Term Investments | 99.6% |
| Investments of Collateral for Securities Loaned | 8.7% |
| Total Investments | 108.3% |
| Liabilities in excess of Other Assets | -8.3% |
| Net Assets | 100.0% |
| | |
| | % of Long-Term |
| Top Ten Holdings | Investments |
| IRSA Inversiones y Representaciones SA, ADR | 2.5% |
| CPFL Energia SA, ADR | 2.0% |
| Koninklijke KPN NV | 1.5% |
| France Telecom SA | 1.3% |
| Deutsche Boerse AG | 1.3% |
| Siliconware Precision Industries Co., ADR | 1.3% |
| Enerplus Corp. | 1.3% |
| BP Prudhoe Bay Royalty Trust | 1.2% |
| Nippon Telegraph & Telephone Corp. | 1.2% |
| Amcor Ltd. | 1.2% |
Portfolio breakdown is shown as a percentage of net assets. Holdings are shown as a percentage of long-term investments. All are subject to change daily. For more current Fund information, please visit guggenheiminvestments.com. The above summaries are provided for informational purposes only, and should not be viewed as recommendations.
| 22 | CLAYMORE EXCHANGE-TRADED FUND TRUST 2 ANNUAL REPORT |
| FUND SUMMARY & PERFORMANCE (Unaudited) continued | May 31, 2013 |
HGI Guggenheim International Multi-Asset Income ETF (continued)
This graph compares a hypothetical $10,000 investment in the Fund, made at its inception, with a similar investment in the MSCI EAFE Index. Results include the reinvestment of all dividends and capital gains. Past performance is no guarantee of future results. The MSCI EAFE Index is a capitalization weighted measure the stock markets in Europe, Australasia and the Far East. It is not possible to invest directly in the MSCI EAFE Index. Investment return and principal value will fluctuate with changes in market conditions and other factors and Fund shares, when redeemed, may be worth more or less than their original investment.
| CLAYMORE EXCHANGE-TRADED FUND TRUST 2 ANNUAL REPORT | 23 |
| FUND SUMMARY & PERFORMANCE (Unaudited) continued | May 31, 2013 |
SEA Guggenheim Shipping ETF
| Fund Statistics | | | |
| Share Price | | $ | 17.43 |
| Net Asset Value | | $ | 17.51 |
| Premium/Discount to NAV | | | -0.46% |
| Net Assets ($000) | | $ | 35,011 |
| Total Returns | | |
| | | Since |
| | One | Inception |
| (Inception 6/11/10) | Year | (Annualized) |
| Guggenheim Shipping ETF | | |
| NAV | 12.44% | -9.63% |
| Market | 12.20% | -9.78% |
Dow Jones Global Shipping IndexSM | 12.24% | -4.15% |
| Delta Global Shipping Index/Dow Jones | | |
Global Shipping IndexSM | 12.24% | -9.07%1 |
| MSCI World Index | 27.77% | 13.59% |
Performance data quoted represents past performance, which is no guarantee of future results and current performance may be lower or higher than the figures shown. The deduction of taxes that a shareholder would pay on Fund distributions or the redemption of Fund shares is not reflected in the total returns. For the most recent month-end performance figures, please visit guggenheiminvestments.com. The investment return and principal value of an investment will fluctuate with changes in market conditions and other factors so that an investor’s shares, when redeemed, may be worth more or less than their original cost.
Since inception returns assume a purchase of the Fund at the initial share price of $25.96 per share for share price returns or initial net asset value (NAV) of $25.96 per share for NAV returns. Returns for periods of less than one year are not annualized.
The Morgan Stanley Capital International (MSCI) World Index measures performance from a diverse range of global stock markets, including the U.S., Canada, Europe, Australia, New Zealand, and the Far East. The referenced indices are unmanaged and not available for direct investment. Index performance does not reflect transaction costs, fees or expenses.
The Fund’s annual operating ratio of 0.65% is expressed as a unitary fee and covers all expenses of the Fund, except distributions fees, if any, brokerage expenses, taxes, interest, litigation expenses and other extraordinary expenses.
| Portfolio Breakdown | % of Net Assets |
| Industrials | 94.6% |
| Financial | 4.9% |
| Total Common Stock and Master Limited Partnerships | 99.5% |
| Investments of Collateral for Securities Loaned | 16.7% |
| Total Investments | 116.2% |
| Liabilities in excess of Other Assets | -16.2% |
| Net Assets | 100.0% |
| | |
| | % of Long-Term |
| Top Ten Holdings | Investments |
| AP Moller - Maersk A/S, Class B | 15.6% |
| Nippon Yusen KK | 8.3% |
| Mitsui OSK Lines Ltd. | 8.3% |
| SembCorp Marine Ltd. | 5.6% |
| COSCO Pacific Ltd. | 5.0% |
| Teekay LNG Partners, LP | 4.5% |
| Teekay Offshore Partners, LP | 4.4% |
| Teekay Corp. | 3.9% |
| Golar LNG Partners, LP | 3.5% |
| Orient Overseas International Ltd. | 3.3% |
Portfolio breakdown is shown as a percentage of net assets. Holdings are shown as a percentage of long-term investments. All are subject to change daily. For more current Fund information, please visit guggenheiminvestments.com. The above summaries are provided for informational purposes only, and should not be viewed as recommendations.
| 1 | The benchmark return reflects the blended return of the Delta Global Shipping Index from 6/11/10 - 7/26/11 and the return of the Dow Jones Global Shipping IndexSM from 7/27/11 - 5/31/13. |
| 24 | CLAYMORE EXCHANGE-TRADED FUND TRUST 2 ANNUAL REPORT |
| FUND SUMMARY & PERFORMANCE (Unaudited) continued | May 31, 2013 |
SEA Guggenheim Shipping ETF (continued)
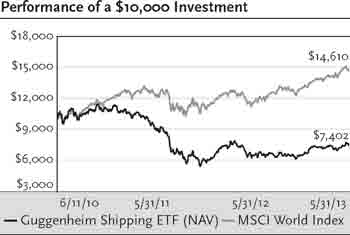
This graph compares a hypothetical $10,000 investment in the Fund, made at its inception, with a similar investment in the MSCI World Index. Results include the reinvestment of all dividends and capital gains. Past performance is no guarantee of future results. The MSCI World Index is a free float-adjusted market capitalization index that is designed to measure equity market performance of the developed markets. It is not possible to invest directly in the MSCI World Index. Investment return and principal value will fluctuate with changes in market conditions and other factors and Fund shares, when redeemed, may be worth more or less than their original investment.
| CLAYMORE EXCHANGE-TRADED FUND TRUST 2 ANNUAL REPORT | 25 |
| FUND SUMMARY & PERFORMANCE (Unaudited) continued | May 31, 2013 |
CUT Guggenheim Timber ETF
| Fund Statistics | | | |
| Share Price | | $ | 22.10 |
| Net Asset Value | | $ | 22.19 |
| Premium/Discount to NAV | | | -0.41% |
| Net Assets ($000) | | $ | 223,035 |
| Total Returns | | | | |
| | | Three | Five | Since |
| (Inception | One | Year | Year | Inception |
| 11/9/07) | Year | (Annualized) | (Annualized) | (Annualized) |
| Guggenheim Timber ETF | | | | |
| NAV | 43.01% | 10.15% | 2.18% | -0.21% |
| Market | 42.05% | 10.10% | 1.88% | -0.29% |
| Beacon Global | | | | |
| Timber Index | 44.19% | 11.24% | 3.40% | 1.00% |
| MSCI World Index | 27.77% | 13.33% | 1.51% | 0.51% |
| Dow Jones Global | | | | |
| Forestry & Paper | 29.22% | 3.26% | -3.69% | -5.60% |
| Index | | | | |
| STOXX Europe Total | | | | |
| Market Forestry | | | | |
| & Paper Index | 33.63% | 8.78% | -2.04% | -4.89% |
Performance data quoted represents past performance, which is no guarantee of future results, and current performance may be lower or higher than the figures shown. The deduction of taxes that a shareholder would pay on Fund distributions or the redemption of Fund shares is not reflected in the total returns. For the most recent month-end performance figures, please visit guggenheiminvestments.com. The investment return and principal value of an investment will fluctuate with changes in market conditions and other factors so that an investor’s shares, when redeemed, may be worth more or less than their original cost.
Since inception returns assume a purchase of the Fund at the initial share price of $24.91 per share for share price returns or initial net asset value (NAV) of $24.91 per share for NAV returns. Returns for periods of less than one year are not annualized.
The Morgan Stanley Capital International (MSCI) World Index measures performance from a diverse range of global stock markets, including the U.S., Canada, Europe, Australia, New Zealand, and the Far East.
The Dow Jones Global Forestry & Paper Index is a subset of the Dow Jones Global Index, which targets 95% coverage of markets that are open to foreign investors. The Index represents the forest and paper industry as defined by Dow Jones Indexes’ classification system. It is a float-adjusted market capitalization weighted index quoted in USD with dividends reinvested.
The STOXX® Europe TMI Forestry & Paper is a market capitalization weighted index of all companies in the Forestry & Paper sector of the STOXX Europe TMI index. Using the market standard ICB (Industry Classification Benchmark), companies with primary revenue sources from the Forestry & Paper sector are selected from the STOXX Europe TMI universe, which covers 95 percent of the free float market capitalization across 18 Western European countries (Austria, Belgium, Denmark, Finland, France, Germany, Greece, Iceland, Ireland, Italy, Luxembourg, the Netherlands, Norway, Portugal, Spain, Sweden, Switzerland and the United Kingdom).
The referenced indices are unmanaged and not available for direct investment. Index performance does not reflect transaction costs, fees or expenses.
Per the most recent prospectus, the Fund’s annualized gross operating expense ratio, gross of any fee waivers or expense reimbursements, was 0.82%. In the Financial Highlights section of this Semiannual Report, the Fund’s annualized net operating expense ratio was determined to be 0.70% while the Fund’s annualized gross operating expense ratio, gross of any fee waivers or expense reimbursements, was determined to be 0.76%. There is a contractual fee waiver currently in place for this Fund through December 31, 2015 to the extent necessary in keeping the Fund’s operating expense ratio from exceeding 0.65% of average net assets per year. Some expenses fall outside of this expense cap and actual expenses will be higher than 0.65%. Without this expense cap, actual returns would be lower.
| Portfolio Breakdown | % of Net Assets |
| Basic Materials | 68.4% |
| Financial | 18.0% |
| Industrial | 6.0% |
| Energy | 1.6% |
| Total Common Stocks | 94.0% |
| Preferred Stock | 1.1% |
| Participation Notes | 4.6% |
| Investments of Collateral for Securities Loaned | 11.2% |
| Total Investments | 110.9% |
| Liabilities in excess of Other Assets | -10.9% |
| Net Assets | 100.0% |
| 26 | CLAYMORE EXCHANGE-TRADED FUND TRUST 2 ANNUAL REPORT |
| FUND SUMMARY & PERFORMANCE (Unaudited) continued | May 31, 2013 |
CUT Guggenheim Timber ETF (continued)
| | % of Long-Term |
| Top Ten Holdings | Investments |
| Smurfit Kappa Group PLC | 6.6% |
| West Fraser Timber Co. Ltd. | 5.7% |
| Svenska Cellulosa AB, B Shares | 5.5% |
| Weyerhaeuser Co., REIT | 5.4% |
| International Paper Co. | 5.1% |
| Fibria Celulose SA, ADR | 4.9% |
| Portucel SA | 4.8% |
| Rayonier, Inc., REIT | 4.8% |
| Plum Creek Timber Co. Inc. | 4.6% |
| MeadWestvaco Corp. | 4.4% |
Portfolio breakdown is shown as a percentage of net assets. Holdings are shown as a percentage of long-term investments. All are subject to change daily. For more current Fund information, please visit guggenheiminvestments.com. The above summaries are provided for informational purposes only, and should not be viewed as recommendations.
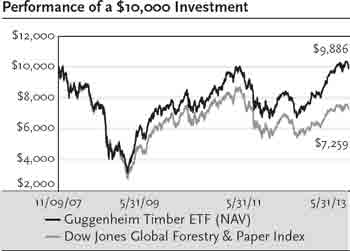
This graph compares a hypothetical $10,000 investment in the Fund, made at its inception, with a similar investment in the Dow Jones Global Forestry & Paper Index. Results include the reinvestment of all dividends and capital gains. Past performance is no guarantee of future results. The Dow Jones Global Forestry & Paper Index is a float-adjusted market capitalization weighted index that provides a broad measure of the world forestry and paper markets. It is not possible to invest directly in the Dow Jones Global Forestry & Paper Index. Investment return and principal value will fluctuate with changes in market conditions and other factors and Fund shares, when redeemed, may be worth more or less than their original investment.
| CLAYMORE EXCHANGE-TRADED FUND TRUST 2 ANNUAL REPORT | 27 |
| OVERVIEW OF FUND EXPENSES (Unaudited) | May 31, 2013 |
As a shareholder of Guggenheim Canadian Energy Income ETF; Guggenheim China Real Estate ETF; Guggenheim China Small Cap ETF; Guggenheim Frontier Markets ETF; Guggenheim International Multi-Asset Income ETF; Guggenheim Shipping ETF; and Guggenheim Timber ETF, you incur advisory fees and other Fund expenses. The expense examples below are intended to help you understand your ongoing costs (in dollars) of investing in the Funds and to compare these costs with the ongoing costs of investing in other funds.
The example is based on an investment of $1,000 invested at the beginning of the period and held for the entire six month period ended May 31, 2013.
Actual Expense
The first line of the table below provides information about actual account values and actual expenses. You may use the information in this line, together with the amount you invested, to estimate the expenses that you paid over the period. Simply divide your account value by $1,000 (for example, an $8,600 account value divided by $1,000 = 8.6), then multiply the result by the number in the first line under the heading entitled “Expenses Paid During Period” to estimate the expenses you paid on your account during this period.
Hypothetical Example for Comparison Purposes
The second line of the table below provides information about hypothetical account values and hypothetical expenses based on the Fund’s actual expense ratio and an assumed rate of return of 5% per year before expenses, which is not the Fund’s actual return. The hypothetical account values and expenses may not be used to estimate the actual ending account balance or expenses you paid for the period. You may use this information to compare the ongoing cost of investing in the Fund and other funds. To do so, compare this 5% hypothetical example with the 5% hypothetical examples that appear in the shareholder reports of the other funds.
Please note that the expenses shown in the table are meant to highlight your ongoing costs only and do not reflect any transactional costs, such as sales charges (loads) or contingent deferred sales charges. Therefore, the second line of the table is useful in comparing ongoing costs only, and will not help you determine the relative total costs of owning different funds. In addition, if these transactional costs were included, your costs would have been higher.
| | | | | | Annualized | | |
| | | | | | Expense | | Expenses |
| | | Beginning | | Ending | Ratio for the | | Paid |
| | | Account | | Account | Six Months | | During |
| | | Value | | Value | Ended | | Period1 |
| | | 12/01/12 | | 05/31/13 | 05/31/13 | 12/01/12-05/31/13 |
Guggenheim Canadian Energy Income ETF2 | | | | | | | |
| Actual | $ | 1,000.00 | $ | 932.25 | 0.70% | $ | 3.37 |
| Hypothetical | | 1,000.00 | | 1,021.44 | 0.70% | | 3.53 |
| (5% annual return before expenses) | | | | | | | |
| | | | | | | | |
Guggenheim China Real Estate ETF2 | | | | | | | |
| Actual | | 1,000.00 | | 1,006.37 | 0.70% | | 3.50 |
| Hypothetical | | 1,000.00 | | 1,021.44 | 0.70% | | 3.53 |
| (5% annual return before expenses) | | | | | | | |
| | | | | | | | |
Guggenheim China Small Cap ETF2 | | | | | | | |
| Actual | | 1,000.00 | | 1,115.56 | 0.75% | | 3.96 |
| Hypothetical | | 1,000.00 | | 1,021.19 | 0.75% | | 3.78 |
| (5% annual return before expenses) | | | | | | | |
| | | | | | | | |
Guggenheim Frontier Markets ETF2 | | | | | | | |
| Actual | | 1,000.00 | | 937.70 | 0.70% | | 3.38 |
| Hypothetical | | 1,000.00 | | 1,021.44 | 0.70% | | 3.53 |
| (5% annual return before expenses) | | | | | | | |
| | | | | | | | |
Guggenheim International Multi-Asset Income ETF2 | | | | | | | |
| Actual | | 1,000.00 | | 1,077.84 | 0.70% | | 3.63 |
| Hypothetical | | 1,000.00 | | 1,021.44 | 0.70% | | 3.53 |
| (5% annual return before expenses) | | | | | | | |
| 28 | CLAYMORE EXCHANGE-TRADED FUND TRUST 2 ANNUAL REPORT |
| OVERVIEW OF FUND EXPENSES (Unaudited) continued | May 31, 2013 |
| | | | | | Annualized | | |
| | | | | | Expense | | Expenses |
| | | Beginning | | Ending | Ratio for the | | Paid |
| | | Account | | Account | Six Months | | During |
| | | Value | | Value | Ended | | Period1 |
| | | 12/01/12 | | 05/31/13 | 05/31/13 | 12/01/12-05/31/13 |
| Guggenheim Shipping ETF | | | | | | | |
| Actual | $ | 1,000.00 | $ | 1,138.41 | 0.65% | $ | 3.47 |
| Hypothetical | | 1,000.00 | | 1,021.69 | 0.65% | | 3.28 |
| (5% annual return before expenses) | | | | | | | |
| | | | | | | | |
Guggenheim Timber ETF2 | | | | | | | |
| Actual | | 1,000.00 | | 1,158.70 | 0.70% | | 3.77 |
| Hypothetical | | 1,000.00 | | 1,021.44 | 0.70% | | 3.53 |
| (5% annual return before expenses) | | | | | | | |
| 1 | Actual and hypothetical expenses are calculated using the annualized expense ratio. This represents the ongoing expenses of the Fund as a percentage of average net assets for the six months ended May 31, 2013. Expenses are calculated by multiplying the Fund’s annualized expense ratio by the average account value over the period; then multiplying that result by 182/365. |
| | |
| 2 | The expense ratios reflect an expense waiver. Please see the Notes to Financial Statements for more information. |
Assumes all dividends and distributions were reinvested.
Premium/Discount Information
Information about the differences between the daily market price on secondary markets for Shares and the NAV of each Fund can be found at www.gugggenheiminvestments.com.
| CLAYMORE EXCHANGE-TRADED FUND TRUST 2 ANNUAL REPORT | 29 |
| PORTFOLIO OF INVESTMENTS | May 31, 2013 |
ENY Guggenheim Canadian Energy Income ETF
| Number | | | | | |
| of Shares | | Description | | Value | |
| | | Common Stocks - 100.0% | | | |
| | | Canada - 100.0% | | | |
| 18,641 | | AltaGas Ltd. | $ | 695,644 | |
| 24,778 | | ARC Resources Ltd.(a) | | 688,045 | |
| 393,056 | | Athabasca Oil Corp.(b) | | 2,791,380 | |
| 77,031 | | Baytex Energy Corp.(a) | | 2,933,521 | |
| 1,386,877 | | BlackPearl Resources, Inc.(b) | | 2,858,157 | |
| 45,884 | | Bonavista Energy Corp.(a) | | 724,075 | |
| 13,249 | | Bonterra Energy Corp. | | 660,046 | |
| 25,104 | | Calfrac Well Services Ltd. | | 675,237 | |
| 56,297 | | Canadian Energy Services & Technology Corp. | | 832,839 | |
| 136,164 | | Canadian Natural Resources Ltd. | | 4,070,889 | |
| 244,388 | | Canadian Oil Sands Ltd.(a) | | 4,745,651 | |
| 61,364 | | Canyon Services Group, Inc. | | 692,872 | |
| 157,781 | | Cenovus Energy, Inc. | | 4,738,544 | |
| 16,968 | | Crescent Point Energy Corp.(a) | | 616,302 | |
| 26,220 | | Enbridge Income Fund Holdings, Inc. | | 641,579 | |
| 32,262 | | EnCana Corp. | | 617,115 | |
| 43,605 | | Enerplus Corp. | | 682,205 | |
| 28,823 | | Freehold Royalties Ltd. | | 664,556 | |
| 25,708 | | Gibson Energy, Inc. | | 625,817 | |
| 109,989 | | Horizon North Logistics, Inc. | | 716,198 | |
| 98,229 | | Husky Energy, Inc.(a) | | 2,783,733 | |
| 108,643 | | Imperial Oil Ltd. | | 4,256,161 | |
| 12,319 | | Keyera Corp. | | 713,955 | |
| 69,034 | | Lightstream Resources Ltd. | | 597,798 | |
| 125,890 | | MEG Energy Corp.(b) | | 3,578,587 | |
| 47,231 | | Paramount Resources Ltd.(b) | | 1,759,367 | |
| 21,803 | | Pembina Pipeline Corp.(a) | | 683,908 | |
| 459,812 | | Pengrowth Energy Corp.(a) | | 2,353,447 | |
| 56,251 | | Penn West Petroleum Ltd.(a) | | 576,905 | |
| 108,038 | | Petrominerales Ltd. | | 639,730 | |
| 96,370 | | Savanna Energy Services Corp.(a) | | 670,408 | |
| 3,745,077 | | Southern Pacific Resource Corp.(b) | | 1,847,989 | |
| 165,544 | | Suncor Energy, Inc. | | 5,037,355 | |
| 13,668 | | TransCanada Corp. | | 628,949 | |
| 278,649 | | Twin Butte Energy Ltd. | | 606,609 | |
| 51,276 | | Veresen, Inc.(a) | | 673,725 | |
| 12,831 | | Vermilion Energy, Inc.(a) | | 648,533 | |
| 70,476 | | Whitecap Resources, Inc. | | 745,980 | |
| | | (Cost $68,209,329) | | 60,473,811 | |
| | | | | | |
| | | Investments of Collateral for | | | |
| | | Securities Loaned - 17.1% | | | |
| 10,365,063 | | BNY Mellon Securities Lending Overnight | | | |
| | | Fund, 0.0730%(c) (d) | | | |
| | | (Cost $10,365,063) | $ | 10,365,063 | |
| | | | | | |
| | | Total Investments - 117.1% | | | |
| | | (Cost $78,574,392) | | 70,838,874 | |
| | | Liabilities in excess of Other Assets - (17.1%) | | (10,321,134 | ) |
| | | Net Assets - 100.0% | $ | 60,517,740 | |
| (a) | Security, or portion thereof, was on loan at May 31, 2013. |
| | |
| (b) | Non-income producing security. |
| | |
| (c) | At May 31, 2013, the total market value of the Fund’s securities on loan was $9,856,303 and the total market value of the collateral held by the Fund was $10,382,694, consisting of cash collateral of $10,365,063 and U.S. Government and Agency securities valued at $17,631. |
| | |
| (d) | Interest rate shown reflects yield as of May 31, 2013. |
| | % of Long-Term |
| Country Breakdown | Investments |
| Canada | 100.0% |
| | |
| | |
| | % of Long-Term |
| Currency Denomination | Investments |
| Canadian Dollar | 100.0% |
Country breakdown and currency denomination are shown as a percentage of long-term investments.
| See notes to financial statements. |
| 30 | CLAYMORE EXCHANGE-TRADED FUND TRUST 2 ANNUAL REPORT |
| PORTFOLIO OF INVESTMENTS continued | May 31, 2013 |
TAO Guggenheim China Real Estate ETF
| Number | | | | | |
| of Shares | | Description | | Value | |
| | | Long-Term Investments - 99.4% | | | |
| | | Common Stocks - 99.4% | | | |
| | | Diversified - 12.8% | | | |
| 210,000 | | Swire Pacific Ltd., Class A | $ | 2,670,041 | |
| 340,000 | | Swire Pacific Ltd., Class B | | 827,794 | |
| 339,000 | | Wharf Holdings Ltd. | | 3,017,584 | |
| | | | | 6,515,419 | |
| | | | | | |
| | | Financial - 86.6% | | | |
| 454,000 | | Agile Property Holdings Ltd. | | 549,750 | |
| 1,073,000 | | Champion Real Estate Investment Trust, REIT(a) | | 508,662 | |
| 166,000 | | Cheung Kong Holdings Ltd.(a) | | 2,347,967 | |
| 251,000 | | China Overseas Grand Oceans Group Ltd. | | 367,311 | |
| 852,243 | | China Overseas Land & Investment Ltd. | | 2,541,535 | |
| 666,246 | | China Resources Land Ltd. | | 2,046,938 | |
| 172,000 | | Chinese Estates Holdings Ltd. | | 300,005 | |
| 2,408,524 | | Country Garden Holdings Co. Ltd. | | 1,383,781 | |
| 25,229 | | E-House China Holdings Ltd., ADR | | 125,136 | |
| 1,832,364 | | Evergrande Real Estate Group Ltd.(a) | | 736,458 | |
| 420,000 | | Fortune Real Estate Investment Trust, REIT (Singapore) | | 395,502 | |
| 1,214,000 | | Franshion Properties China Ltd. | | 447,266 | |
| 940,000 | | Glorious Property Holdings Ltd.(b) | | 142,887 | |
| 95,000 | | Great Eagle Holdings Ltd. | | 376,926 | |
| 208,500 | | Greentown China Holdings Ltd. | | 371,190 | |
| 363,200 | | Guangzhou R&F Properties Co. Ltd. | | 676,544 | |
| 263,000 | | Hang Lung Group Ltd. | | 1,441,574 | |
| 654,000 | | Hang Lung Properties Ltd. | | 2,299,969 | |
| 345,000 | | Henderson Land Development Co. Ltd. | | 2,431,017 | |
| 361,000 | | Hongkong Land Holdings Ltd. | | 2,508,950 | |
| 228,000 | | Hopewell Holdings Ltd. | | 823,852 | |
| 228,000 | | Hopson Development Holdings Ltd.(a) (b) | | 394,744 | |
| 220,000 | | Hysan Development Co. Ltd. | | 980,574 | |
| 376,000 | | K Wah International Holdings Ltd. | | 192,291 | |
| 667,000 | | Kaisa Group Holdings Ltd.(a) (b) | | 189,889 | |
| 273,500 | | Kerry Properties Ltd. | | 1,109,812 | |
| 455,000 | | KWG Property Holding Ltd. | | 301,270 | |
| 493,500 | | Link Real Estate Investment Trust, REIT | | 2,552,433 | |
| 470,000 | | Longfor Properties Co. Ltd.(a) | | 799,196 | |
| 963,600 | | New World China Land Ltd. | | 394,735 | |
| 1,297,000 | | New World Development Co. Ltd. | | 2,071,778 | |
| 693,000 | | Poly Property Group Co. Ltd.(b) | | 469,570 | |
| 3,832,000 | | Renhe Commercial Holdings Co. Ltd.(b) | | 244,350 | |
| 778,000 | | Shenzhen Investment Ltd. | | 329,729 | |
| 446,500 | | Shimao Property Holdings Ltd. | | 970,902 | |
| 1,317,800 | | Shui On Land Ltd. | | 465,138 | |
| 1,037,400 | | Sino Land Co. Ltd. | | 1,547,520 | |
| 1,318,500 | | Sino-Ocean Land Holdings Ltd. | | 806,780 | |
| 643,500 | | SOHO China Ltd. | | 545,451 | |
| 172,000 | | Sun Hung Kai Properties Ltd. | | 2,286,598 | |
| 569,785 | | Sunac China Holdings Ltd. | | 410,303 | |
| 376,257 | | Swire Properties Ltd. | | 1,177,802 | |
| 325,000 | | Tian An China Investment | | 238,638 | |
| 295,000 | | Wheelock & Co. Ltd. | | 1,653,076 | |
| 205,000 | | Yanlord Land Group Ltd. (Singapore) | | 230,993 | |
| 1,816,000 | | Yuexiu Property Co. Ltd. | | 540,393 | |
| 609,000 | | Yuexiu Real Estate Investment Trust, REIT | | 340,478 | |
| | | | | 44,067,663 | |
| | | | | | |
| | | Total Common Stocks - 99.4% | | | |
| | | (Cost $52,440,578) | | 50,583,082 | |
| | | | | | |
| | | Rights - 0.0%* | | | |
| 9,120 | | Hopewell Holdings Ltd., 10/15/2013(b) | | | |
| | | (Cost $0) | | – | |
| | | | | | |
| | | Total Long-Term Investments - 99.4% | | | |
| | | (Cost $52,440,578) | | 50,583,082 | |
| | | | | | |
| | | Investments of Collateral for | | | |
| | | Securities Loaned - 4.3% | | | |
| 2,177,941 | | BNY Mellon Securities Lending Overnight | | | |
| | | Fund, 0.0730%(c) (d) | | | |
| | | (Cost $2,177,941) | | 2,177,941 | |
| | | | | | |
| | | Total Investments - 103.7% | | | |
| | | (Cost $54,618,519) | | 52,761,023 | |
| | | Liabilities in excess of Other Assets - (3.7%) | | (1,879,695 | ) |
| | | Net Assets - 100.0% | $ | 50,881,328 | |
ADR - American Depositary Receipt
REIT - Real Estate Investment Trust
| * | Less than 0.1%. |
| | |
| (a) | Security, or portion thereof, was on loan at May 31, 2013. |
| | |
| (b) | Non-income producing security. |
| | |
| (c) | At May 31, 2013, the total market value of the Fund’s securities on loan was $2,028,124 and the total market value of the collateral held by the Fund was $2,177,941. |
| | |
| (d) | Interest rate shown reflects yield as of May 31, 2013. |
| | |
| | Securities are classified by sectors that represent broad groupings of related industries. |
| See notes to financial statements. | |
| | CLAYMORE EXCHANGE-TRADED FUND TRUST 2 ANNUAL REPORT | 31 |
| PORTFOLIO OF INVESTMENTS continued | May 31, 2013 |
TAO Guggenheim China Real Estate ETF continued
| | % of Long-Term |
| Country Breakdown | Investments |
| China | 98.8% |
| Singapore | 1.2% |
| | |
| | % of Long-Term |
| Currency Denomination | Investments |
| Hong Kong Dollar | 94.3% |
| United States Dollar | 5.2% |
| Singapore Dollar | 0.5% |
Country breakdown and currency denomination are shown as a percentage of long-term investments.
| See notes to financial statements. |
| 32 | CLAYMORE EXCHANGE-TRADED FUND TRUST 2 ANNUAL REPORT |
| PORTFOLIO OF INVESTMENTS continued | May 31, 2013 |
HAO Guggenheim China Small Cap ETF
| Number | | | | | |
| of Shares | | Description | | Value | |
| | | Common Stocks - 99.2% | | | |
| | | Basic Materials - 9.0% | | | |
| 1,481,989 | | Angang Steel Co. Ltd.(a) | $ | 805,636 | |
| 767,513 | | Billion Industrial Holdings Ltd.(b) | | 498,308 | |
| 2,441,989 | | China BlueChemical Ltd. | | 1,516,255 | |
| 4,058,000 | | China Forestry Holdings Co. Ltd.(a) (c) (d) | | – | |
| 1,221,537 | | China Hongqiao Group Ltd. | | 744,302 | |
| 5,071,968 | | China Lumena New Materials Corp.(b) | | 1,091,125 | |
| 1,806,989 | | China Molybdenum Co. Ltd.(b) | | 719,276 | |
| 4,303,975 | | China Precious Metal Resources Holdings Co. Ltd.(a) (b) | | 754,033 | |
| 1,208,989 | | China Vanadium Titano - Magnetite Mining Co. Ltd.(a) | | 235,169 | |
| 1,495,989 | | Dongyue Group(b) | | 738,089 | |
| 1,240,989 | | Fufeng Group Ltd.(a) (b) | | 479,591 | |
| 2,668,986 | | Huabao International Holdings Ltd.(b) | | 1,172,417 | |
| 2,265,989 | | Hunan Nonferrous Metal Corp. Ltd.(a) (b) | | 735,597 | |
| 2,179,989 | | Lee & Man Paper Manufacturing Ltd. | | 1,468,715 | |
| 2,383,986 | | Maanshan Iron & Steel(a) (b) | | 571,213 | |
| 2,035,989 | | MMG Ltd. (Australia)(a) (b) | | 561,269 | |
| 2,289,989 | | Nine Dragons Paper Holdings Ltd. | | 1,761,122 | |
| 10,429,682 | | North Mining Shares Co. Ltd.(a) | | 503,830 | |
| 5,879,964 | | Shougang Concord International Enterprises Co. Ltd.(a) (b) | | 302,982 | |
| 2,419,989 | | Sinofert Holdings Ltd. | | 554,900 | |
| 3,209,979 | | Sinopec Shanghai Petrochemical Co. Ltd. | | 1,178,497 | |
| 1,919,989 | | Sinopec Yizheng Chemical Fibre Co. Ltd. | | 521,871 | |
| 1,285,916 | | Xingda International Holdings Ltd. | | 563,214 | |
| 1,047,989 | | Xinjiang Xinxin Mining Industry Co. Ltd.(a) | | 186,302 | |
| 1,824,489 | | Yingde Gases Group Co. Ltd. | | 1,974,250 | |
| 386,000 | | Yip’s Chemical Holdings Ltd. | | 391,828 | |
| 1,204,989 | | Zhaojin Mining Industry Co. Ltd. | | 1,195,241 | |
| | | | | 21,225,032 | |
| | | | | | |
| | | Communications - 6.0% | | | |
| 68,848 | | AsiaInfo-Linkage, Inc.(a) (b) | | 797,948 | |
| 3,259,975 | | China Communications Services Corp. Ltd. | | 2,141,737 | |
| 1,771,989 | | China Wireless Technologies Ltd. | | 810,347 | |
| 1,152,889 | | Comba Telecom Systems Holdings Ltd.(a) (b) | | 417,326 | |
| 136,062 | | Giant Interactive Group, Inc., ADR(b) | | 1,151,085 | |
| 184,861 | | Renren, Inc., ADR(a) (b) | | 584,161 | |
| 40,636 | | Sohu.com, Inc.(a) | | 2,608,018 | |
| 809,000 | | TCL Communication Technology Holdings Ltd. | | 437,703 | |
| 3,807,375 | | VODone Ltd.(a) (b) | | 299,183 | |
| 173,832 | | Youku Tudou, Inc., ADR(a) (b) | | 3,554,864 | |
| 865,719 | | ZTE Corp.(a) | | 1,402,940 | |
| | | | | 14,205,312 | |
| | | | | | |
| | | Consumer, Cyclical - 19.0% | | | |
| 824,000 | | 361 Degrees International Ltd.(b) | | 206,987 | |
| 2,829,986 | | Air China Ltd. | | 2,340,458 | |
| 832,000 | | Ajisen China Holdings Ltd.(b) | | 629,134 | |
| 1,068,989 | | Anta Sports Products Ltd.(b) | | 991,488 | |
| 741,932 | | Baoxin Auto Group Ltd. | | 571,540 | |
| 1,727,002 | | Boshiwa International Holding Ltd.(a) (b) (c) (d) | | – | |
| 3,967,975 | | Bosideng International Holdings Ltd.(b) | | 1,063,197 | |
| 702,500 | | Byd Co. Ltd.(a) (b) | | 3,090,428 | |
| 1,051,916 | | C.banner International Holdings Ltd. | | 422,783 | |
| 905,017 | | Cecep Costin New Materials GRP Ltd. | | 380,063 | |
| 3,814,975 | | China Dongxiang Group Co.(b) | | 722,422 | |
| 2,169,989 | | China Eastern Airlines Corp. Ltd.(a) | | 712,819 | |
| 5,373,000 | | China Hongxing Sports Ltd.(a) (c) (d) | | – | |
| 754,000 | | China Lilang Ltd. | | 402,118 | |
| 2,195,873 | | China Outfitters Holdings Ltd. | | 319,645 | |
| 2,381,989 | | China Southern Airlines Co. Ltd. | | 1,098,511 | |
| 3,669,975 | | China Travel International Investments | | 718,602 | |
| 552,460 | | China Yongda Automobiles Services Holdings Ltd. | | 524,505 | |
| 1,151,989 | | China ZhengTong Auto Services Holdings Ltd.(a) (b) | | 645,534 | |
| 1,098,989 | | Dah Chong Hong Holdings Ltd. | | 992,414 | |
| 1,044,029 | | Digital China Holdings Ltd. | | 1,460,575 | |
| 828,000 | | Golden Eagle Retail Group Ltd.(b) | | 1,318,349 | |
| 15,722,910 | | GOME Electrical Appliances Holding Ltd.(a) (b) | | 1,620,334 | |
| 1,217,989 | | Haier Electronics Group Co. Ltd. | | 2,165,230 | |
| 3,313,579 | | Hengdeli Holdings Ltd.(b) | | 909,198 | |
| 14,298 | | Home Inns & Hotels Management, Inc., ADR(a) | | 414,499 | |
| 1,575,989 | | Intime Department Store Group Co. Ltd. | | 1,642,417 | |
| 755,489 | | LI Ning Co. Ltd.(a) | | 514,832 | |
| 1,547,989 | | Maoye International Holdings Ltd.(b) | | 299,117 | |
| 839,989 | | Minth Group Ltd. | | 1,445,645 | |
| 1,131,916 | | Newocean Energy Holdings Ltd. | | 794,680 | |
| 1,637,989 | | Parkson Retail Group Ltd. | | 749,068 | |
| 3,611,975 | | PCD Stores Group Ltd. | | 544,393 | |
| 453,500 | | Ports Design Ltd.(b) | | 373,302 | |
| 1,715,989 | | Qingling Motors Co. Ltd. | | 504,001 | |
| 9,874,946 | | REXLot Holdings Ltd. | | 763,251 | |
| 1,913,989 | | Shanghai Jin Jiang International Hotels Group Co. Ltd. | | 340,252 | |
| 882,389 | | Shanghai Pharmaceuticals Holding Co. Ltd. | | 1,720,947 | |
| 518,038 | | Shenzhou International Group Holdings Ltd. | | 1,765,098 | |
| 913,993 | | Sinotruk Hong Kong Ltd.(b) | | 514,524 | |
| 2,691,986 | | Skyworth Digital Holdings Ltd. | | 1,820,597 | |
| 1,544,043 | | Springland International Holdings Ltd. | | 783,677 | |
| 680,000 | | TCL Multimedia Technology Holdings Ltd. | | 571,134 | |
| 731,500 | | Wumart Stores, Inc. | | 1,492,626 | |
| 609,000 | | Xinhua Winshare Publishing and Media Co. Ltd. | | 309,882 | |
| 3,009,979 | | Xinyi Glass Holdings Ltd. | | 2,601,762 | |
| 721,500 | | XTEP International Holdings | | 315,078 | |
| 1,257,000 | | Ying LI International Real Estate Ltd. (Singapore)(a) (b) | | 477,096 | |
| See notes to financial statements. | |
| | CLAYMORE EXCHANGE-TRADED FUND TRUST 2 ANNUAL REPORT | 33 |
| PORTFOLIO OF INVESTMENTS continued | May 31, 2013 |
HAO Guggenheim China Small Cap ETF continued
| Number | | | | | |
| of Shares | | Description | | Value | |
| | | Consumer, Cyclical continued | | | |
| 755,500 | | Zhongsheng Group Holdings Ltd. | $ | 951,820 | |
| | | | | 45,016,032 | |
| | | | | | |
| | | Consumer, Non-cyclical - 17.1% | | | |
| 12,241 | | 51job, Inc., ADR(a) | | 734,460 | |
| 666,000 | | Anhui Expressway Co. | | 348,323 | |
| 3,191,979 | | Anxin-China Holdings Ltd. | | 781,259 | |
| 1,069,989 | | Asian Citrus Holdings Ltd. | | 458,992 | |
| 210,551 | | Biostime International Holdings Ltd. | | 1,174,429 | |
| 3,050,979 | | China Agri-Industries Holdings Ltd. | | 1,501,358 | |
| 1,010,000 | | China Foods Ltd.(b) | | 507,420 | |
| 1,042,489 | | China Huiyuan Juice Group Ltd.(a) | | 427,051 | |
| 1,466,027 | | China Medical System Holdings Ltd. | | 1,473,052 | |
| 575,000 | | China Minzhong Food Corp. Ltd.(a) | | 468,311 | |
| 4,088,063 | | China Modern Dairy Holdings Ltd.(a) | | 1,390,283 | |
| 1,024,000 | | China Pharmaceutical Group Ltd. | | 532,921 | |
| 533,000 | | China Shineway Pharmaceutical Group Ltd. | | 1,024,419 | |
| 1,888,989 | | China Yurun Food Group Ltd.(a) | | 1,301,862 | |
| 8,643,953 | | CP Pokphand Co. Ltd. | | 924,213 | |
| 1,323,989 | | Dalian Port PDA Co. Ltd. | | 300,178 | |
| 2,679,989 | | Global Bio-Chem Technology Group Co. Ltd.(a) | | 248,569 | |
| 1,022,916 | | Goodbaby International Holdings Ltd. | | 560,029 | |
| 292,000 | | Guangzhou Pharmaceutical Co. Ltd.(a) | | 1,164,193 | |
| 1,854,869 | | Hua Han Bio-Pharmaceutical Holdings Ltd. | | 542,401 | |
| 1,647,989 | | Jiangsu Expressway Co. Ltd. | | 2,006,170 | |
| 521,000 | | Lianhua Supermarket Holdings Co. Ltd. | | 317,454 | |
| 2,019,913 | | Lijun International Pharmaceutical Holding Ltd. | | 650,510 | |
| 897,029 | | Microport Scientific Corp. | | 718,751 | |
| 842,000 | | People’s Food Holdings Ltd.(b) | | 805,614 | |
| 1,005,989 | | Real Nutriceutical Group Ltd.(b) | | 323,978 | |
| 1,651,989 | | Shenguan Holdings Group Ltd.(b) | | 857,618 | |
| 1,045,993 | | Shenzhen Expressway Co. Ltd. | | 406,928 | |
| 11,607,435 | | Shenzhen International Holdings Ltd. | | 1,584,980 | |
| 1,235,989 | | Sichuan Expressway Co. Ltd. | | 391,680 | |
| 2,640,002 | | Sihuan Pharmaceutical Holdings Group Ltd.(b) | | 1,611,997 | |
| 3,939,975 | | Sino Biopharmaceutical | | 2,761,048 | |
| 917,932 | | Tenfu Cayman Holdings Co. Ltd.(b) | | 470,625 | |
| 1,409,030 | | Tibet 5100 Water Resources Holdings Ltd.(b) | | 524,565 | |
| 158,000 | | Tong Ren Tang Technologies Co. Ltd. | | 498,660 | |
| 378,000 | | Tsingtao Brewery Co. Ltd. | | 2,631,898 | |
| 1,304,989 | | Uni-President China Holdings Ltd. | | 1,449,091 | |
| 925,993 | | United Laboratories International Holdings Ltd.(a) | | 350,701 | |
| 706,000 | | Vinda International Holdings Ltd.(b) | | 913,104 | |
| 95,894 | | WuXi PharmaTech Cayman, Inc., ADR(a) | | 1,962,950 | |
| 2,333,014 | | Yashili International Holdings Ltd. | | 1,136,033 | |
| 868,000 | | Yuexiu Transport Infrastructure Ltd. | | 457,325 | |
| 1,971,989 | | Zhejiang Expressway Co. Ltd. | | 1,747,731 | |
| | | | | 40,443,134 | |
| | | | | | |
| | | Diversified - 0.5% | | | |
| 1,564,989 | | C C Land Holdings Ltd. | | 475,779 | |
| 4,445,975 | | CITIC Resources Holdings Ltd.(a) | | 578,455 | |
| | | | | 1,054,234 | |
| | | | | | |
| | | Energy - 5.2% | | | |
| 1,237,911 | | Anton Oilfield Services Group | | 1,068,430 | |
| 2,245,942 | | Beijing Jingneng Clean Energy Co. Ltd. | | 922,934 | |
| 5,039,957 | | China Oil & Gas Group Ltd.(b) | | 941,405 | |
| 1,885,053 | | China Suntien Green Energy Corp. Ltd. | | 689,642 | |
| 528,000 | | CIMC Enric Holdings Ltd. | | 718,256 | |
| 9,976,723 | | GCL-Poly Energy Holdings Ltd.(a) (b) | | 2,339,058 | |
| 1,342,989 | | Hidili Industry International Development Ltd.(b) | | 290,645 | |
| 90,479 | | Inner Mongolia Yitai Coal Co. Ltd. | | 460,391 | |
| 1,360,048 | | MIE Holdings Corp.(b) | | 322,369 | |
| 4,741,826 | | Shougang Fushan Resources Group Ltd.(b) | | 1,911,928 | |
| 929,921 | | Sinopec Kantons Holdings Ltd. | | 966,721 | |
| 1,079,916 | | SPT Energy Group, Inc. | | 705,309 | |
| 5,719,964 | | United Energy Group Ltd.(a) | | 876,843 | |
| 2,639,058 | | Winsway Coking Coal Holdings Ltd.(b) | | 207,377 | |
| | | | | 12,421,308 | |
| | | | | | |
| | | Financial - 16.2% | | | |
| 1,729,989 | | Agile Property Holdings Ltd. | | 2,094,849 | |
| 1,419,989 | | Beijing Capital Land Ltd. | | 631,082 | |
| 1,183,989 | | China Everbright Ltd. | | 1,915,662 | |
| 953,989 | | China Overseas Grand Oceans Group Ltd.(b) | | 1,396,057 | |
| 1,677,989 | | China SCE Property Holdings Ltd.(a) | | 404,215 | |
| 2,925,986 | | China South City Holdings Ltd.(b) | | 663,386 | |
| 1,193,589 | | China Taiping Insurance Holdings Co. Ltd.(a) | | 2,121,854 | |
| 3,447,059 | | Chongqing Rural Commercial Bank | | 1,753,991 | |
| 97,103 | | E-House China Holdings Ltd., ADR | | 481,631 | |
| 2,807,986 | | Fantasia Holdings Group Co. Ltd. | | 477,475 | |
| 1,764,989 | | Far East Horizon Ltd. | | 1,200,487 | |
| 4,671,975 | | Franshion Properties China Ltd. | | 1,721,267 | |
| 3,642,975 | | Glorious Property Holdings Ltd.(a) | | 553,758 | |
| 800,500 | | Greentown China Holdings Ltd.(b) | | 1,425,119 | |
| 1,393,989 | | Guangzhou R&F Properties Co. Ltd. | | 2,596,625 | |
| 849,989 | | Hopson Development Holdings Ltd.(a) (b) | | 1,471,615 | |
| 2,565,989 | | Kaisa Group Holdings Ltd.(a) (b) | | 730,514 | |
| 1,759,489 | | KWG Property Holding Ltd. | | 1,165,014 | |
| See notes to financial statements. |
| 34 | CLAYMORE EXCHANGE-TRADED FUND TRUST 2 ANNUAL REPORT |
| PORTFOLIO OF INVESTMENTS continued | May 31, 2013 |
HAO Guggenheim China Small Cap ETF continued
| Number | | | | | |
| of Shares | | Description | | Value | |
| | | Financial continued | | | |
| 1,341,989 | | Mingfa Group International Co. Ltd.(a) | $ | 411,441 | |
| 2,663,989 | | Poly Property Group Co. Ltd. | | 1,805,094 | |
| 1,454,989 | | Powerlong Real Estate Holdings Ltd. | | 311,135 | |
| 14,797,920 | | Renhe Commercial Holdings Co. Ltd.(a) (b) | | 943,599 | |
| 654,993 | | Shanghai Industrial Holdings Ltd. | | 2,012,365 | |
| 1,915,989 | | Shanghai Industrial Urban Development Group Ltd.(a) | | 449,206 | |
| 2,981,986 | | Shenzhen Investment Ltd. | | 1,263,814 | |
| 5,087,468 | | Shui On Land Ltd. | | 1,795,700 | |
| 2,484,989 | | SOHO China Ltd.(b) | | 2,106,357 | |
| 2,200,027 | | Sunac China Holdings Ltd. | | 1,584,242 | |
| 776,000 | | Yanlord Land Group Ltd. (Singapore) | | 874,392 | |
| 7,027,957 | | Yuexiu Property Co. Ltd. | | 2,091,331 | |
| | | | | 38,453,277 | |
| | | | | | |
| | | Industrial - 18.2% | | | |
| 593,000 | | Asia Cement China Holdings Corp. | | 311,671 | |
| 3,239,975 | | AviChina Industry & Technology Co. Ltd. | | 1,740,441 | |
| 1,611,989 | | BBMG Corp. | | 1,171,178 | |
| 2,029,989 | | Beijing Capital International Airport Co. Ltd. | | 1,385,961 | |
| 5,315,968 | | Beijing Enterprises Water Group Ltd. | | 2,013,313 | |
| 2,671,989 | | China Aerospace International Holdings Ltd. | | 378,625 | |
| 3,538,475 | | China COSCO Holdings Co. Ltd.(a) (b) | | 1,527,012 | |
| 3,003,979 | | China Everbright International Ltd. | | 2,430,178 | |
| 821,000 | | China High Precision Automation Group Ltd.(c) (d) | | 96,771 | |
| 1,487,989 | | China High Speed Transmission Equipment Group | | | |
| | | Co. Ltd.(a) | | 766,728 | |
| 1,259,989 | | China Liansu Group Holdings Ltd. | | 730,400 | |
| 1,324,800 | | China Metal Recycling Holdings Ltd.(b) (c) (d) | | 1,207,079 | |
| 1,603,989 | | China National Materials Co. Ltd. | | 367,793 | |
| 2,393,989 | | China Resources Cement Holdings Ltd.(b) | | 1,264,409 | |
| 4,449,475 | | China Rongsheng Heavy Industries Group Holdings | | | |
| | | Ltd.(a) (b) | | 779,524 | |
| 2,669,989 | | China Shanshui Cement Group Ltd. | | 1,386,105 | |
| 5,142,968 | | China Shipping Container Lines Co. Ltd.(a) (b) | | 1,318,404 | |
| 1,797,989 | | China Shipping Development Co. Ltd.(a) (b) | | 764,333 | |
| 544,946 | | China Singyes Solar Technologies Holdings Ltd. | | 603,717 | |
| 1,919,189 | | China Zhongwang Holdings Ltd.(a) (b) | | 669,991 | |
| 1,535,989 | | Chongqing Machinery & Electric Co. Ltd. | | 207,759 | |
| 837,993 | | Cosco International Holdings Ltd. | | 347,599 | |
| 556,940 | | CPMC Holdings Ltd. | | 430,468 | |
| 2,529,986 | | CSR Corp. Ltd. | | 1,831,623 | |
| 467,000 | | Dongfang Electric Corp. Ltd. | | 724,311 | |
| 554,000 | | First Tractor Co. Ltd.(a) (b) | | 396,081 | |
| 1,616,000 | | Fook Woo Group Holdings Ltd.(a) (c) (d) | | – | |
| 685,042 | | Greatview Aseptic Packaging Co. Ltd. | | 430,644 | |
| 1,967,989 | | Guangshen Railway Co. Ltd. | | 884,769 | |
| 296,200 | | Guangzhou Shipyard International Co. Ltd.(c) (d) | | 278,160 | |
| 1,803,942 | | Guodian Technology & Environment Group Co. Ltd. | | 636,729 | |
| 766,993 | | Haitian International Holdings Ltd. | | 1,337,801 | |
| 907,989 | | Harbin Electric Co. Ltd. | | 755,605 | |
| 1,518,989 | | Honghua Group Ltd. | | 753,350 | |
| 1,282,489 | | Kingboard Laminates Holdings Ltd. | | 541,887 | |
| 3,769,975 | | Lonking Holdings Ltd.(a) (b) | | 859,594 | |
| 3,751,975 | | Metallurgical Corp. of China Ltd.(a) (b) | | 744,324 | |
| 2,752,986 | | NVC Lighting Holdings Ltd. | | 897,235 | |
| 1,182,989 | | Sany Heavy Equipment International Holdings | | | |
| | | Co. Ltd.(b) | | 466,320 | |
| 3,877,975 | | Shanghai Electric Group Co. Ltd. | | 1,443,725 | |
| 1,988,989 | | Sinotrans Ltd. | | 402,266 | |
| 1,748,489 | | Sinotrans Shipping Ltd. | | 441,469 | |
| 1,601,906 | | SITC International Holdings Co. Ltd. | | 617,007 | |
| 347,960 | | SOCAM Development Ltd. | | 461,688 | |
| 974,000 | | Sound Global Ltd.(a) (b) | | 485,209 | |
| 622,946 | | Sunny Optical Technology Group Co. Ltd. | | 892,353 | |
| 1,250,021 | | Tech Pro Technology Development Ltd.(a) | | 468,589 | |
| 2,133,989 | | Tianjin Port Development Holdings Ltd. | | 310,636 | |
| 970,000 | | Tianneng Power International Ltd. | | 562,297 | |
| 608,000 | | Wasion Group Holdings Ltd. | | 411,192 | |
| 3,844,052 | | West China Cement Ltd. | | 628,890 | |
| 584,429 | | Xinjiang Goldwind Science & Technology Co. Ltd. | | 440,422 | |
| 2,754,032 | | Yuanda China Holdings Ltd. | | 287,366 | |
| 609,024 | | Zhuzhou CSR Times Electric Co. Ltd. | | 1,914,282 | |
| | | | | 43,205,283 | |
| | | | | | |
| | | Technology - 4.0% | | | |
| 38,367 | | AutoNavi Holdings Ltd., ADR(a) | | 459,637 | |
| 1,700,045 | | Chinasoft International Ltd.(a) | | 481,798 | |
| 14,555,892 | | Hanergy Solar Group Ltd.(a) (b) | | 956,292 | |
| 1,169,989 | | Ju Teng International Holdings Ltd.(b) | | 768,659 | |
| 2,431,989 | | Kingdee International Software Group Co. Ltd.(a) | | 535,722 | |
| 1,018,989 | | Kingsoft Corp. Ltd. | | 1,714,329 | |
| 336,460 | | NetDragon Websoft, Inc. | | 780,167 | |
| 32,018,823 | | Semiconductor Manufacturing International Corp.(a) | | 2,598,529 | |
| 1,229,989 | | TPV Technology Ltd. | | 318,477 | |
| 1,289,489 | | Travelsky Technology Ltd. | | 930,223 | |
| | | | | 9,543,833 | |
| | | | | | |
| | | Utilities - 4.0% | | | |
| 3,430,065 | | China Datang Corp. Renewable Power Co. Ltd. | | 857,207 | |
| 2,746,986 | | China Power International Development Ltd.(b) | | 1,061,596 | |
| 8,419,720 | | China Power New Energy Development Co. Ltd.(a) | | 498,927 | |
| 955,989 | | China Resources Gas Group Ltd. | | 2,499,946 | |
| 4,539,975 | | Datang International Power Generation Co. Ltd. | | 1,871,479 | |
| See notes to financial statements. | |
| | CLAYMORE EXCHANGE-TRADED FUND TRUST 2 ANNUAL REPORT | 35 |
| PORTFOLIO OF INVESTMENTS continued | May 31, 2013 |
HAO Guggenheim China Small Cap ETF continued
| Number | | | | | |
| of Shares | | Description | | Value | |
| | | Utilities continued | | | |
| 1,967,989 | | Huadian Power International Co. | $ | 907,585 | |
| 4,012,062 | | Huaneng Renewables Corp. Ltd. | | 1,467,802 | |
| 570,000 | | Tianjin Development Holdings Ltd.(a) | | 349,513 | |
| | | | | 9,514,055 | |
| | | | | | |
| | | Total Common Stocks - 99.2% | | | |
| | | (Cost $255,825,979) | 235,081,500 | |
| | | | | | |
| | | Convertible Securities - 0.2% | | | |
| 616,000 | | LI Ning Co. Ltd.(a) (c) | | | |
| | | (Cost $277,753) | | 419,776 | |
| | | | | | |
| | | Total Long-Term Investments - 99.4% | | | |
| | | (Cost $256,103,732) | 235,501,276 | |
| | | | | | |
| | | Investments of Collateral for | | | |
| | | Securities Loaned - 17.8% | | | |
| 42,198,946 | | BNY Mellon Securities Lending Overnight | | | |
| | | Fund, 0.0730%(e) (f) | | | |
| | | (Cost $42,198,946) | | 42,198,946 | |
| | | | | | |
| | | Total Investments - 117.2% | | | |
| | | (Cost $298,302,678) | 277,700,222 | |
| | | Liabilities in excess of Other Assets - (17.2%) | | (40,777,479 | ) |
| | | Net Assets - 100.0% | $ | 236,922,743 | |
ADR - American Depositary Receipt
| (a) | Non-income producing security. |
| | |
| (b) | Security, or portion thereof, was on loan at May 31, 2013. |
| | |
| (c) | Security is valued in accordance with Fair Valuation procedures established in good faith by management and approved by the Board of Trustees. The total market value of such securities is $2,001,786 which represents 0.8% of net assets. |
| | |
| (d) | Illiquid security. |
| | |
| (e) | At May 31, 2013, the total market value of the Fund’s securities on loan was $37,863,991 and the total market value of the collateral held by the Fund was $42,513,946, consisting of cash collateral of $42,198,946 and U.S. Government and Agency Securities value at $315,000. |
| | |
| (f) | Interest rate shown reflects yield as of May 31, 2013. |
| | % of Long-Term |
| Country Breakdown | Investments |
| China | 99.2% |
| Singapore | 0.6% |
| Australia | 0.2% |
| | |
| | % of Long-Term |
| Currency Denomination | Investments |
| Hong Kong Dollar | 97.8% |
| United States Dollar | 1.4% |
| Singapore Dollar | 0.8% |
Country breakdown and currency denomination are shown as a percentage of long-term investments.
| See notes to financial statements. |
| 36 | CLAYMORE EXCHANGE-TRADED FUND TRUST 2 ANNUAL REPORT |
| PORTFOLIO OF INVESTMENTS continued | May 31, 2013 |
FRN Guggenheim Frontier Markets ETF
| Number | | | | | |
| of Shares | | Description | | Value | |
| | | Long-Term Investments - 99.2% | | | |
| | | Common Stocks - 87.7% | | | |
| | | Argentina - 10.0% | | | |
| 79,622 | | Banco Macro SA, ADR(a) (b) | $ | 1,203,088 | |
| 166,487 | | BBVA Banco Frances SA, ADR(b) | | 677,602 | |
| 95,564 | | Cresud SACIF y A, ADR | | 773,113 | |
| 196,089 | | Grupo Financiero Galicia SA, ADR(a) | | 1,084,372 | |
| 81,565 | | IRSA Inversiones y Representaciones SA, ADR | | 769,974 | |
| 195,920 | | Pampa Energia SA, ADR(b) | | 640,658 | |
| 193,112 | | Petrobras Argentina SA, ADR(a) | | 814,933 | |
| 58,796 | | Telecom Argentina SA, ADR(b) | | 891,347 | |
| 299,145 | | YPF SA, ADR | | 4,307,688 | |
| | | | | 11,162,775 | |
| | | | | | |
| | | Chile - 42.1% | | | |
| 38,347 | | Banco de Chile, ADR(a) | | 3,412,883 | |
| 191,659 | | Banco Santander Chile, ADR(a) | | 4,666,897 | |
| 502,733 | | Cencosud SA, ADR(a) | | 7,882,853 | |
| 89,828 | | Cia Cervecerias Unidas SA, ADR(a) | | 2,395,713 | |
| 166,708 | | Corpbanca SA, ADR(a) | | 2,969,069 | |
| 155,305 | | Empresa Nacional de Electricidad SA, ADR(a) | | 7,453,087 | |
| 546,279 | | Enersis SA, ADR | | 9,155,636 | |
| 436,838 | | Latam Airlines Group SA, ADR(a) | | 7,793,190 | |
| 37,493 | | Vina Concha y Toro SA, ADR(a) | | 1,490,347 | |
| | | | | 47,219,675 | |
| | | | | | |
| | | Colombia - 8.7% | | | |
| 223,932 | | Ecopetrol SA, ADR(a) | | 9,707,452 | |
| | | | | | |
| | | Egypt - 7.1% | | | |
| 928,460 | | Commercial International Bank Egypt SAE, GDR(a) | | 4,642,300 | |
| 879,884 | | Orascom Telecom Holding SAE, GDR(a) (b) | | 2,868,422 | |
| 1,403,792 | | Orascom Telecom Media And Technology Holding | | | |
| | | SAE, GDR(a) (c) | | 393,062 | |
| | | | | 7,903,784 | |
| | | | | | |
| | | Isle of Man - 1.3% | | | |
| 127,321 | | Zhaikmunai, LP, GDR | | 1,485,836 | |
| | | | | | |
| | | Kazakhstan - 4.7% | | | |
| 183,801 | | Halyk Savings Bank of Kazakhstan JSC, GDR | | 1,340,828 | |
| 251,993 | | KazMunaiGas Exploration Production JSC, GDR | | 3,918,491 | |
| | | | | 5,259,319 | |
| | | | | | |
| | | Lebanon - 2.0% | | | |
| 184,601 | | Solidere, GDR(a) | | 2,242,902 | |
| | | | | | |
| | | Nigeria - 5.6% | | | |
| 710,004 | | Guaranty Trust Bank PLC, GDR | | 6,319,036 | |
| | | | | | |
| | | Peru - 4.7% | | | |
| 98,918 | | Cementos Pacasmayo SAA, ADR | | 1,261,205 | |
| 223,738 | | Cia de Minas Buenaventura SA, ADR | | 4,016,097 | |
| | | | | 5,277,302 | |
| | | | | | |
| | | Ukraine - 1.5% | | | |
| 69,205 | | Avangardco Investments Public Ltd., GDR(b) | | 667,828 | |
| 56,819 | | MHP SA, GDR | | 1,056,834 | |
| | | | | 1,724,662 | |
| | | | | | |
| | | Total Common Stocks - 87.7% | | | |
| | | (Cost $120,272,954) | | 98,302,743 | |
| | | | | | |
| | | Preferred Stocks - 10.7% | | | |
| | | Chile - 6.2% | | | |
| 56,697 | | Embotelladora Andina SA, Class B, ADR | | 2,168,660 | |
| 102,721 | | Sociedad Quimica y Minera de Chile SA, ADR | | 4,769,336 | |
| | | | | 6,937,996 | |
| | | | | | |
| | | Colombia - 4.5% | | | |
| 87,986 | | BanColombia SA, ADR | | 5,094,389 | |
| | | | | | |
| | | Total Preferred Stocks - 10.7% | | | |
| | | (Cost $12,949,035) | | 12,032,385 | |
| | | | | | |
| | | Exchange Traded Fund - 0.8% | | | |
| 20,500 | | Vanguard FTSE Emerging Markets ETF | | | |
| | | (Cost $890,800) | | 851,160 | |
| | | | | | |
| | | Total Long-Term Investments - 99.2% | | | |
| | | (Cost $134,112,789) | 111,186,288 | |
| | | | | | |
| | | | | | |
| | | Investments of Collateral for | | | |
| | | Securities Loaned - 25.5% | | | |
| 28,626,707 | | BNY Mellon Securities Lending Overnight | | | |
| | | Fund, 0.0730%(d) (e) | | | |
| | | (Cost $28,626,707) | | 28,626,707 | |
| | | | | | |
| | | Total Investments - 124.7% | | | |
| | | (Cost $162,739,496) | 139,812,995 | |
| | | Liabilities in excess of Other Assets - (24.7%) | | (27,714,791 | ) |
| | | Net Assets - 100.0% | $ | 112,098,204 | |
ADR - American Depositary Receipt
GDR - Global Depositary Receipt
JSC - Joint Stock Company
LP - Limited Partnership
PLC - Public Limited Company
SA - Corporation
SAE - Corporation
| (a) | Security, or portion thereof, was on loan at May 31, 2013. |
| | |
| (b) | Non-income producing security. |
| | |
| (c) | Security is valued in accordance with Fair Valuation procedures established in good faith by management and approved by the Board of Trustees. The total market value of such securities is $393,062 which represents 0.4% of net assets. |
| | |
| (d) | At May 31, 2013, the total market value of the Fund’s securities on loan was $28,353,112 and the total market value of the collateral held by the Fund was $29,143,345, consisting of cash collateral of $28,626,707 and U.S. Government and Agency securities valued at $516,638. |
| | |
| (e) | Interest rate shown reflects yield as of May 31, 2013. |
| See notes to financial statements. | |
| | CLAYMORE EXCHANGE-TRADED FUND TRUST 2 ANNUAL REPORT | 37 |
| PORTFOLIO OF INVESTMENTS continued | May 31, 2013 |
FRN Guggenheim Frontier Markets ETF continued
| | % of Long-Term |
| Country Breakdown | Investments |
| Chile | 48.7% |
| Colombia | 13.3% |
| Argentina | 10.0% |
| Egypt | 7.1% |
| Nigeria | 5.7% |
| Peru | 4.8% |
| Kazakhstan | 4.7% |
| Lebanon | 2.0% |
| Ukraine | 1.6% |
| Isle of Man | 1.3% |
| Other | 0.8% |
| | |
| | % of Long-Term |
| Currency Denomination | Investments |
| United States | 100.0% |
| Country breakdown and currency denomination are shown as a percentage of long-term investments. |
| See notes to financial statements. |
| 38 | CLAYMORE EXCHANGE-TRADED FUND TRUST 2 ANNUAL REPORT |
| PORTFOLIO OF INVESTMENTS continued | May 31, 2013 |
HGI Guggenheim International Multi-Asset Income ETF
| Number | | | | | |
| of Shares | | Description | | Value | |
| | | Long-Term Investments - 99.6% | | | |
| | | Common Stocks - 82.4% | | | |
| | | Argentina - 3.5% | | | |
| 139,962 | | Cresud SACIF y A, ADR | $ | 1,132,293 | |
| 318,802 | | IRSA Inversiones y Representaciones SA, ADR | | 3,009,491 | |
| | | | | 4,141,784 | |
| | | | | | |
| | | Australia - 3.9% | | | |
| 152,799 | | Amcor Ltd. | | 1,453,240 | |
| 19,282 | | Australia & New Zealand Banking Group Ltd. | | 509,121 | |
| 26,355 | | BHP Billiton Ltd. | | 881,343 | |
| 21,513 | | National Australia Bank Ltd. | | 598,142 | |
| 136,294 | | Telstra Corp. Ltd. | | 619,385 | |
| 19,941 | | Westpac Banking Corp. | | 543,728 | |
| | | | | 4,604,959 | |
| | | | | | |
| | | Belgium - 0.4% | | | |
| 5,184 | | Anheuser-Busch InBev NV | | 477,884 | |
| | | | | | |
| | | Brazil - 2.3% | | | |
| 110,436 | | CPFL Energia SA, ADR | | 2,351,182 | |
| 17,752 | | Ultrapar Participacoes SA, ADR | | 447,883 | |
| | | | | 2,799,065 | |
| | | | | | |
| | | Canada - 4.6% | | | |
| 31,006 | | Baytex Energy Corp. | | 1,172,337 | |
| 71,774 | | EnCana Corp. | | 1,365,859 | |
| 98,230 | | Enerplus Corp. | | 1,530,423 | |
| 135,029 | | Penn West Petroleum Ltd.(a) | | 1,375,946 | |
| | | | | 5,444,565 | |
| | | | | | |
| | | Cayman Islands - 1.1% | | | |
| 161,688 | | Giant Interactive Group, Inc., ADR(a) | | 1,367,881 | |
| | | | | | |
| | | Chile - 0.4% | | | |
| 21,481 | | Banco Santander Chile, ADR | | 523,062 | |
| | | | | | |
| | | China - 2.5% | | | |
| 7,109 | | China Petroleum & Chemical Corp., ADR | | 723,767 | |
| 7,817 | | China Telecom Corp. Ltd., ADR(a) | | 363,100 | |
| 30,915 | | Guangshen Railway Co. Ltd., ADR(a) | | 678,584 | |
| 4,998 | | PetroChina Co. Ltd., ADR | | 578,169 | |
| 68,464 | | Yanzhou Coal Mining Co. Ltd., ADR | | 688,748 | |
| | | | | 3,032,368 | |
| | | | | | |
| | | Colombia - 0.6% | | | |
| 17,857 | | Ecopetrol SA, ADR(a) | | 774,101 | |
| | | | | | |
| | | Denmark - 0.5% | | | |
| 2,111 | | Novo Nordisk A/S, Class B | | 339,232 | |
| 6,347 | | Novozymes A/S | | 219,435 | |
| | | | | 558,667 | |
| | | | | | |
| | | France - 4.3% | | | |
| 1,651 | | Dassault Systemes SA(a) | | 207,551 | |
| 30,881 | | Electricite de France SA(a) | | 703,983 | |
| 155,769 | | France Telecom SA(a) | | 1,583,318 | |
| 38,377 | | GDF Suez | | 783,351 | |
| 3,194 | | L’Oreal SA | | 539,574 | |
| 7,351 | | Sodexo | | 625,536 | |
| 54,579 | | Veolia Environnement SA | | 679,616 | |
| | | | | 5,122,929 | |
| | | | | | |
| | | Germany - 5.1% | | | |
| 3,690 | | Adidas AG | | 402,138 | |
| 9,286 | | BASF SE | | 905,367 | |
| 24,238 | | Deutsche Boerse AG | | 1,564,026 | |
| 78,013 | | Deutsche Telekom AG | | 893,565 | |
| 35,954 | | E.ON AG | | 608,549 | |
| 2,409 | | Linde AG(a) | | 462,221 | |
| 15,796 | | RWE AG | | 541,577 | |
| 3,832 | | SAP AG(a) | | 288,193 | |
| 2,180 | | Volkswagen AG | | 466,312 | |
| | | | | 6,131,948 | |
| | | | | | |
| | | Hong Kong - 5.3% | | | |
| 112,500 | | China Mobile Ltd. | | 1,194,881 | |
| 234,000 | | China Unicom Hong Kong Ltd. | | 321,332 | |
| 4,121,000 | | Hong Kong Television Network | | 1,417,410 | |
| 464,000 | | Lenovo Group Ltd. | | 477,580 | |
| 111,000 | | Power Assets Holdings Ltd. | | 977,334 | |
| 568,000 | | Sino Land Co. Ltd. | | 847,303 | |
| 107,500 | | Wing Hang Bank Ltd. | | 1,032,376 | |
| | | | | 6,268,216 | |
| | | | | | |
| | | India - 0.2% | | | |
| 4,723 | | Infosys Ltd., ADR | | 197,185 | |
| | | | | | |
| | | Israel - 1.2% | | | |
| 42,338 | | Delta-Galil Industries Ltd. | | 642,650 | |
| 19,105 | | Teva Pharmaceutical Industries Ltd. | | 732,490 | |
| | | | | 1,375,140 | |
| | | | | | |
| | | Italy - 1.5% | | | |
| 10,353 | | Luxottica Group SpA | | 537,505 | |
| 1,634,014 | | Telecom Italia SpA | | 1,268,491 | |
| | | | | 1,805,996 | |
| | | | | | |
| | | Japan - 9.1% | | | |
| 37,500 | | Advantest Corp. | | 585,665 | |
| 336,000 | | ANA Holdings, Inc.(a) | | 708,770 | |
| 139,000 | | Asahi Kasei Corp. | | 952,592 | |
| 34,500 | | FUJIFILM Holdings Corp. | | 733,221 | |
| See notes to financial statements. | |
| | CLAYMORE EXCHANGE-TRADED FUND TRUST 2 ANNUAL REPORT | 39 |
| PORTFOLIO OF INVESTMENTS continued | | May 31, 2013 |
HGI Guggenheim International Multi-Asset Income ETF continued
| Number | | | | | |
| of Shares | | Description | | Value | |
| | | Japan continued | | | |
| 8,400 | | Internet Initiative Japan, Inc. | $ | 284,922 | |
| 66,000 | | Isuzu Motors Ltd. | | 506,561 | |
| 25,900 | | Komatsu Ltd. | | 669,719 | |
| 48,800 | | Konami Corp. | | 1,201,454 | |
| 44,000 | | Kubota Corp. | | 653,627 | |
| 13,800 | | Makita Corp. | | 753,038 | |
| 29,100 | | Nippon Telegraph & Telephone Corp. | | 1,455,360 | |
| 81,200 | | Nissan Motor Co. Ltd. | | 896,638 | |
| 30,200 | | ORIX Corp. | | 412,437 | |
| 29,100 | | Seven & I Holdings Co. Ltd. | | 1,010,106 | |
| | | | | 10,824,110 | |
| | | | | | |
| | | Luxembourg - 0.5% | | | |
| 30,846 | | Tenaris SA | | 654,414 | |
| | | | | | |
| | | Mexico - 1.7% | | | |
| 13,509 | | America Movil SAB de CV, Series L, ADR | | 268,964 | |
| 1,543 | | Coca-Cola Femsa SAB de CV, ADR | | 225,803 | |
| 2,377 | | Fomento Economico Mexicano SAB de CV, ADR | | 258,118 | |
| 15,174 | | Grupo Aeroportuario del Pacifico SAB de CV, ADR | | 797,697 | |
| 3,469 | | Grupo Aeroportuario del Sureste SAB de CV, ADR | | 415,760 | |
| | | | | 1,966,342 | |
| | | | | | |
| | | Netherlands - 3.5% | | | |
| 11,777 | | ASM International NV | | 420,953 | |
| 72,620 | | Koninklijke Ahold NV | | 1,178,797 | |
| 908,292 | | Koninklijke KPN NV | | 1,753,948 | |
| 82,130 | | STMicroelectronics NV | | 778,612 | |
| | | | | 4,132,310 | |
| | | | | | |
| | | New Zealand - 0.6% | | | |
| 394,369 | | Telecom Corp. of New Zealand Ltd. | | 726,425 | |
| | | | | | |
| | | Norway - 0.5% | | | |
| 13,238 | | Yara International ASA | | 592,009 | |
| | | | | | |
| | | Peru - 0.3% | | | |
| 17,423 | | Cia de Minas Buenaventura SA, ADR | | 312,743 | |
| | | | | | |
| | | Portugal - 1.0% | | | |
| 192,614 | | EDP - Energias de Portugal SA | | 618,827 | |
| 135,439 | | Portugal Telecom SGPS SA | | 575,735 | |
| | | | | 1,194,562 | |
| | | | | | |
| | | Russia - 0.3% | | | |
| 120,531 | | Mechel, ADR(a) | | 361,593 | |
| | | | | | |
| | | South Africa - 0.8% | | | |
| 16,175 | | AngloGold Ashanti Ltd., ADR | | 293,415 | |
| 107,062 | | Gold Fields Ltd., ADR | | 649,866 | |
| | | | | 943,281 | |
| | | | | | |
| | | Spain - 0.8% | | | |
| 127,427 | | Banco Santander SA | | 914,905 | |
| | | | | | |
| | | Sweden - 1.9% | | | |
| 20,380 | | Atlas Copco AB, Class A | | 542,077 | |
| 39,167 | | Swedbank AB, Class A | | 938,075 | |
| 55,340 | | Volvo AB, Class B | | 815,072 | |
| | | | | 2,295,224 | |
| | | | | | |
| | | Switzerland - 1.8% | | | |
| 15,611 | | Novartis AG | | 1,122,508 | |
| 4,142 | | Roche Holding AG | | 1,028,594 | |
| | | | | 2,151,102 | |
| | | | | | |
| | | Taiwan - 2.5% | | | |
| 31,292 | | Chunghwa Telecom Co. Ltd., ADR(a) | | 981,317 | |
| 267,957 | | Siliconware Precision Industries Co., ADR | | 1,540,753 | |
| 25,047 | | Taiwan Semiconductor Manufacturing Co. Ltd., ADR | | 467,377 | |
| | | | | 2,989,447 | |
| | | | | | |
| | | United Kingdom - 19.7% | | | |
| 25,906 | | Anglo American PLC | | 599,550 | |
| 8,435 | | ARM Holdings PLC | | 126,348 | |
| 17,335 | | Associated British Foods PLC | | 476,223 | |
| 14,729 | | AstraZeneca PLC | | 756,562 | |
| 148,898 | | Aviva PLC | | 753,534 | |
| 115,258 | | BAE Systems PLC | | 707,883 | |
| 143,666 | | Barclays PLC | | 697,979 | |
| 27,311 | | BG Group PLC | | 502,257 | |
| 82,117 | | BP PLC | | 589,434 | |
| 85,301 | | British Sky Broadcasting Group PLC | | 1,009,381 | |
| 265,401 | | BT Group PLC | | 1,215,573 | |
| 41,789 | | Bunzl PLC | | 813,495 | |
| 114,214 | | HSBC Holdings PLC | | 1,256,968 | |
| 134,772 | | ICAP PLC | | 750,905 | |
| 24,164 | | InterContinental Hotels Group PLC | | 698,630 | |
| 71,120 | | Invensys PLC | | 428,928 | |
| 258,676 | | Kingfisher PLC | | 1,355,370 | |
| 348,887 | | Ladbrokes PLC | | 1,093,864 | |
| 611,900 | | Man Group PLC | | 1,071,495 | |
| 59,534 | | National Grid PLC | | 708,086 | |
| 74,917 | | Pearson PLC | | 1,395,919 | |
| 155,253 | | Rexam PLC | | 1,247,509 | |
| 18,524 | | Rio Tinto PLC | | 802,367 | |
| 16,533 | | Royal Dutch Shell PLC | | 571,623 | |
| 12,828 | | SABMiller PLC | | 647,636 | |
| 60,036 | | Smith & Nephew PLC | | 702,224 | |
| 149,479 | | Spirent Communications PLC | | 303,904 | |
| 27,910 | | SSE PLC | | 657,565 | |
| See notes to financial statements. |
| 40 | CLAYMORE EXCHANGE-TRADED FUND TRUST 2 ANNUAL REPORT |
| PORTFOLIO OF INVESTMENTS continued | May 31, 2013 |
HGI Guggenheim International Multi-Asset Income ETF continued
| Number | | | | | |
| of Shares | | Description | | Value | |
| | | United Kingdom continued | | | |
| 235,474 | | TalkTalk Telecom Group PLC | $ | 815,750 | |
| 251,322 | | Vodafone Group PLC | | 731,386 | |
| | | | | 23,488,348 | |
| | | | | | |
| | | Total Common Stocks - 82.4% | | | |
| | | (Cost $96,140,712) | | 98,172,565 | |
| | | | | | |
| | | Preferred Stocks - 2.3% | | | |
| | | Brazil - 1.7% | | | |
| 10,651 | | Cia de Bebidas das Americas, ADR | | 405,483 | |
| 32,562 | | Gerdau SA, ADR | | 198,954 | |
| 56,204 | | Telefonica Brasil SA, ADR | | 1,388,801 | |
| | | | | 1,993,238 | |
| | | | | | |
| | | Chile - 0.3% | | | |
| 6,910 | | Sociedad Quimica y Minera de Chile SA, ADR | | 320,831 | |
| | | | | | |
| | | Colombia - 0.3% | | | |
| 7,573 | | BanColombia SA, ADR | | 438,477 | |
| | | | | | |
| | | Total Preferred Stocks - 2.3% | | | |
| | | (Cost $3,041,371) | | 2,752,546 | |
| | | | | | |
| | | Royalty Trusts - 2.8% | | | |
| | | United States - 2.8% | | | |
| 16,526 | | BP Prudhoe Bay Royalty Trust | | 1,471,971 | |
| 83,004 | | SandRidge Permian Trust | | 1,178,657 | |
| 49,343 | | Whiting USA Trust II(a) | | 643,433 | |
| | | (Cost $3,311,796) | | 3,294,061 | |
| | | | | | |
| | | Closed End Funds - 9.6% | | | |
| 319,256 | | Alpine Total Dynamic Dividend Fund | | 1,321,720 | |
| 55,192 | | CBRE Clarion Global Real Estate Income Fund | | 506,111 | |
| 67,756 | | Clough Global Opportunities Fund | | 885,571 | |
| 55,706 | | Eaton Vance Tax-Advantaged Global Dividend Income Fund | | 884,611 | |
| 29,815 | | Eaton Vance Tax-Advantaged Global Dividend | | | |
| | | Opportunities Fund(a) | | 700,652 | |
| 65,948 | | MFS Charter Income Trust(a) | | 641,015 | |
| 95,050 | | MFS Multimarket Income Trust | | 675,805 | |
| 37,286 | | Morgan Stanley Emerging Markets Domestic Debt | | | |
| | | Fund, Inc.(a) | | 586,509 | |
| 82,044 | | NexPoint Credit Strategies Fund | | 649,788 | |
| 162,265 | | Wells Fargo Advantage Global Dividend Opportunity Fund | | 1,278,648 | |
| 46,615 | | Wells Fargo Advantage Multi-Sector Income Fund | | 731,856 | |
| 25,946 | | Western Asset Emerging Markets Debt Fund, Inc.(a) | | 530,855 | |
| 36,427 | | Western Asset Emerging Markets Income Fund, Inc.(a) | | 515,078 | |
| 34,620 | | Western Asset Global Corporate Defined Opportunity | | | |
| | | Fund, Inc. | | 661,242 | |
| 50,602 | | Western Asset High Yield Defined Opportunity Fund, Inc. | | 930,065 | |
| | | (Cost $11,458,461) | | 11,499,526 | |
| | | | | | |
| | | Master Limited Partnerships - 2.5% | | | |
| | | United States - 2.5% | | | |
| 54,688 | | Chesapeake Granite Wash Trust(a) | | 815,945 | |
| 73,789 | | SandRidge Mississippian Trust I(a) | | 1,005,006 | |
| 88,633 | | SandRidge Mississippian Trust II(a) | | 1,121,208 | |
| | | (Cost $3,849,189) | | 2,942,159 | |
| | | | | | |
| | | Total Long-Term Investments - 99.6% | | | |
| | | (Cost $117,801,529) | 118,660,857 | |
| | | | | | |
| | | Investments of Collateral for | | | |
| | | Securities Loaned - 8.7% | | | |
| 10,399,128 | | BNY Mellon Securities Lending Overnight | | | |
| | | Fund, 0.0730%(b) (c) | | | |
| | | (Cost $10,399,128) | | 10,399,128 | |
| | | | | | |
| | | Total Investments - 108.3% | | | |
| | | (Cost $128,200,657) | 129,059,985 | |
| | | Liabilities in excess of Other Assets - (8.3%) | | (9,944,124 | ) |
| | | Net Assets - 100.0% | $ | 119,115,861 | |
AB - Stock Company
ADR - American Depositary Receipt
AG - Stock Corporation
ASA - Stock Company
A/S - Limited Liability Stock Company or Stock Company
NV - Publicly Traded Company
PLC - Public Limited Company
SA - Corporation
SpA - Limited Share Company
SE - Stock Corporation
SGPS - Holding Enterprise
SAB de CV - Publicly Traded Company
| (a) | Security, or portion thereof, was on loan at May 31, 2013. |
| | |
| (b) | At May 31, 2013, the total market value of the Fund’s securities on loan was $10,000,434 and the total market value of the collateral held by the Fund was $10,399,128. |
| | |
| (c) | Interest rate shown reflects yield as of May 31, 2013. |
| See notes to financial statements. | |
| | CLAYMORE EXCHANGE-TRADED FUND TRUST 2 ANNUAL REPORT | 41 |
| PORTFOLIO OF INVESTMENTS continued | May 31, 2013 |
HGI Guggenheim International Multi-Asset Income ETF continued
| | % of Long-Term |
| Country Breakdown | Investments |
| United Kingdom | 19.8% |
| United States | 14.9% |
| Japan | 9.1% |
| Hong Kong | 5.3% |
| Germany | 5.2% |
| Canada | 4.6% |
| France | 4.3% |
| Brazil | 4.0% |
| Australia | 3.9% |
| Argentina | 3.5% |
| Netherlands | 3.5% |
| China | 2.6% |
| Taiwan | 2.5% |
| Sweden | 1.9% |
| Switzerland | 1.8% |
| Mexico | 1.7% |
| Italy | 1.5% |
| Israel | 1.2% |
| Cayman Islands | 1.1% |
| Colombia | 1.0% |
| Portugal | 1.0% |
| South Africa | 0.8% |
| Spain | 0.8% |
| Chile | 0.7% |
| New Zealand | 0.6% |
| Luxembourg | 0.5% |
| Norway | 0.5% |
| Denmark | 0.5% |
| Belgium | 0.4% |
| Russia | 0.3% |
| Peru | 0.3% |
| India | 0.2% |
| | |
| | % of Long-Term |
| Currency Denomination | Investments |
| United States Dollar | 38.2% |
| Pound Sterling | 19.8% |
| Euro | 17.2% |
| Japanese Yen | 9.1% |
| Hong Kong Dollar | 5.3% |
| Australian Dollar | 3.9% |
| All Other Currencies | 6.5% |
| Country breakdown and currency denomination are shown as a percentage of long-term investments. |
| See notes to financial statements. |
| 42 | CLAYMORE EXCHANGE-TRADED FUND TRUST 2 ANNUAL REPORT |
| PORTFOLIO OF INVESTMENTS continued | May 31, 2013 |
SEA Guggenheim Shipping ETF
| Number | | | | | |
| of Shares | | Description | | Value | |
| | | Long-Term Investments - 99.5% | | | |
| | | Common Stocks - 81.8% | | | |
| | | Bermuda - 22.2% | | | |
| 1,178,041 | | COSCO Pacific Ltd. | $ | 1,730,003 | |
| 305,133 | | Frontline Ltd.(a) | | 549,560 | |
| 92,488 | | Knightsbridge Tankers Ltd.(b) | | 651,116 | |
| 106,620 | | Nordic American Tankers Ltd.(b) | | 893,476 | |
| 180,002 | | Orient Overseas International Ltd. | | 1,135,041 | |
| 1,782,016 | | Pacific Basin Shipping Ltd. | | 1,023,830 | |
| 58,120 | | Ship Finance International Ltd. | | 986,878 | |
| 165,036 | | Tsakos Energy Navigation Ltd. | | 802,075 | |
| | | | | 7,771,979 | |
| | | | | | |
| | | China - 2.0% | | | |
| 1,620,014 | | China Shipping Development Co. Ltd. | | 688,675 | |
| | | | | | |
| | | Denmark - 18.4% | | | |
| 759 | | AP Moller - Maersk A/S, Class B | | 5,440,794 | |
| 31,203 | | D/S Norden A/S | | 1,005,560 | |
| | | | | 6,446,354 | |
| | | | | | |
| | | Japan - 16.5% | | | |
| 790,000 | | Mitsui OSK Lines Ltd. | | 2,886,952 | |
| 1,100,000 | | Nippon Yusen KK | | 2,897,747 | |
| | | | | 5,784,699 | |
| | | | | | |
| | | Marshall Islands - 14.0% | | | |
| 52,776 | | Costamare, Inc.(b) | | 887,164 | |
| 172,956 | | Navios Maritime Holdings, Inc.(b) | | 935,692 | |
| 44,591 | | Seaspan Corp.(b) | | 1,022,026 | |
| 35,466 | | Teekay Corp. | | 1,370,406 | |
| 240,021 | | Teekay Tankers Ltd., Class A(b) | | 674,459 | |
| | | | | 4,889,747 | |
| | | | | | |
| | | Singapore - 5.6% | | | |
| 573,000 | | SembCorp Marine Ltd. | | 1,966,410 | |
| | | | | | |
| | | United States - 3.1% | | | |
| 43,586 | | Matson, Inc. | | 1,097,059 | |
| | | | | | |
| | | Total Common Stocks - 81.8% | | | |
| | | (Cost $28,970,624) | | 28,644,923 | |
| | | | | | |
| | | Master Limited Partnerships - 17.7% | | | |
| | | Marshall Islands - 17.7% | | | |
| 94,212 | | Capital Product Partners, LP(b) | | 864,866 | |
| 36,765 | | Golar LNG Partners, LP | | 1,225,010 | |
| 73,632 | | Navios Maritime Partners, LP(b) | | 1,019,067 | |
| 36,235 | | Teekay LNG Partners, LP | | 1,554,482 | |
| 47,445 | | Teekay Offshore Partners, LP(b) | | 1,538,641 | |
| | | (Cost $4,864,047) | | 6,202,066 | |
| | | | | | |
| | | Total Long-Term Investments - 99.5% | | | |
| | | (Cost $33,834,671) | | 34,846,989 | |
| | | | | | |
| | | Investments of Collateral for | | | |
| | | Securities Loaned - 16.7% | | | |
| 5,845,063 | | BNY Mellon Securities Lending Overnight | | | |
| | | Fund, 0.0730%(c) (d) | | | |
| | | (Cost $5,845,063) | | 5,845,063 | |
| | | | | | |
| | | Total Investments - 116.2% | | | |
| | | (Cost $39,679,734) | | 40,692,052 | |
| | | Liabilities in excess of Other Assets - (16.2%) | | (5,681,286 | ) |
| | | Net Assets - 100.0% | $ | 35,010,766 | |
A/S - Limited Liability Stock Company or Stock Company
KK - Joint Stock Company
LP - Limited Partnership
| (a) | Non-income producing security. |
| | |
| (b) | Security, or portion thereof, was on loan at May 31, 2013. |
| | |
| (c) | At May 31, 2013, the total market value of the Fund’s securities on loan was $5,659,057 and the total market value of the collateral held by the Fund was $5,845,063. |
| | |
| (d) | Interest rate shown reflects yield as of May 31, 2013. |
| | % of Long-Term |
| Country Breakdown | Investments |
| Marshall Islands | 31.8% |
| Bermuda | 22.3% |
| Denmark | 18.5% |
| Japan | 16.6% |
| Singapore | 5.6% |
| United States | 3.2% |
| China | 2.0% |
| | |
| | % of Long-Term |
| Currency Denomination | Investments |
| United States Dollar | 44.5% |
| Danish Krone | 18.5% |
| Japanese Yen | 16.6% |
| Hong Kong Dollar | 13.2% |
| Singapore Dollar | 5.6% |
| Norwegian Krone | 1.6% |
| Country breakdown and currency denomination are shown as a percentage of long-term investments. |
| See notes to financial statements. | |
| | CLAYMORE EXCHANGE-TRADED FUND TRUST 2 ANNUAL REPORT | 43 |
| PORTFOLIO OF INVESTMENTS continued | May 31, 2013 |
CUT Guggenheim Timber ETF
| Number | | | | | |
| of Shares | | Description | | Value | |
| | | Long-Term Investments - 99.7% | | | |
| | | Common Stocks - 94.0% | | | |
| | | Brazil - 6.9% | | | |
| 646,930 | | Duratex SA | $ | 4,489,726 | |
| 1,000,138 | | Fibria Celulose SA, ADR(a) | | 10,981,515 | |
| | | | | 15,471,241 | |
| | | | | | |
| | | Canada - 9.9% | | | |
| 566,071 | | Canfor Corp.(b) | | 9,518,953 | |
| 170,013 | | West Fraser Timber Co. Ltd. | | 12,667,700 | |
| | | | | 22,186,653 | |
| | | | | | |
| | | Finland - 7.0% | | | |
| 1,184,565 | | Stora ENSO OYJ, R Shares | | 8,658,506 | |
| 638,187 | | UPM-Kymmene OYJ | | 6,881,391 | |
| | | | | 15,539,897 | |
| | | | | | |
| | | Ireland - 6.6% | | | |
| 879,797 | | Smurfit Kappa Group PLC | | 14,708,797 | |
| | | | | | |
| | | Japan - 10.5% | | | |
| 829,500 | | Hokuetsu Kishu Paper Co. Ltd. | | 3,688,492 | |
| 405,300 | | Nippon Paper Industries Co. Ltd.(a) | | 5,061,483 | |
| 1,768,000 | | OJI Holdings Corp. | | 6,268,324 | |
| 703,500 | | Sumitomo Forestry Co. Ltd. | | 8,311,716 | |
| | | | | 23,330,015 | |
| | | | | | |
| | | Portugal - 4.8% | | | |
| 3,043,517 | | Portucel SA(a) | | 10,768,206 | |
| | | | | | |
| | | South Africa - 2.8% | | | |
| 471,838 | | Mondi Ltd. | | 6,285,076 | |
| | | | | | |
| | | Spain - 1.7% | | | |
| 1,134,866 | | Ence Energia y Celulosa SA | | 3,713,735 | |
| | | | | | |
| | | Sweden - 8.5% | | | |
| 246,389 | | Holmen AB, B Shares | | 6,683,306 | |
| 490,739 | | Svenska Cellulosa AB, B Shares | | 12,218,641 | |
| | | | | 18,901,947 | |
| | | | | | |
| | | United States - 35.3% | | | |
| 88,850 | | Domtar Corp. | | 6,438,960 | |
| 170,742 | | Greif, Inc., Class A | | 8,895,658 | |
| 243,903 | | International Paper Co. | | 11,256,123 | |
| 280,635 | | MeadWestvaco Corp. | | 9,822,225 | |
| 214,316 | | Plum Creek Timber Co., Inc., REIT | | 10,222,873 | |
| 159,421 | | Potlatch Corp., REIT | | 7,242,496 | |
| 192,418 | | Rayonier, Inc., REIT | | 10,659,957 | |
| 195,484 | | Wausau Paper Corp. | | 2,283,253 | |
| 401,053 | | Weyerhaeuser Co., REIT | | 11,959,401 | |
| | | | | 78,780,946 | |
| | | | | | |
| | | Total Common Stocks - 94.0% | | | |
| | | (Cost $185,515,607) | 209,686,513 | |
| | | Preferred Stock - 1.1% | | | |
| | | Brazil - 1.1% | | | |
| 647,500 | | Suzano Papel E Celulose SA | | | |
| | | (Cost $2,058,789) | | 2,350,074 | |
| | | | | | |
| | | Participation Notes (c) - 4.6% | | | |
| | | Brazil - 4.6% | | | |
| 974,000 | | Barclays Bank PLC certificates linked to the | | | |
| | | performance of Suzano Papel E Celulose SA, | | | |
| | | Series 0002(d) | | 3,535,094 | |
| 973,170 | | Morgan Stanley BV certificates linked to the | | | |
| | | performance of Duratex SA, Series 0002 | | 6,753,849 | |
| | | (Cost $12,241,971) | | 10,288,943 | |
| | | | | | |
| | | Total Long-Term Investments - 99.7% | | | |
| | | (Cost $199,816,367) | | 222,325,530 | |
| | | | | | |
| | | Investments of Collateral for | | | |
| | | Securities Loaned - 11.2% | | | |
| 25,010,231 | | BNY Mellon Securities Lending Overnight | | | |
| | | Fund, 0.0730%(e) (f) | | | |
| | | (Cost $25,010,231) | | 25,010,231 | |
| | | | | | |
| | | Total Investments - 110.9% | | | |
| | | (Cost $224,826,598) | | 247,335,761 | |
| | | Liabilities in excess of Other Assets - (10.9%) | | (24,301,245 | ) |
| | | Net Assets - 100.0% | $ | 223,034,516 | |
AB - Stock Company
ADR - American Depositary Receipt
BV - Limited Liability Company
OYJ - Public Traded Company
PLC - Public Limited Company
REIT - Real Estate Investment Trust
SA - Corporation
| (a) | Security, or portion thereof, was on loan at May 31, 2013 |
| | |
| (b) | Non-income producing security. |
| | |
| (c) | Participation notes are issued by banks or broker-dealers and are promissory notes that are designed to offer a return linked to the performance of a particular underlying equity security or market. The return on a participation note that is linked to a particular underlying security generally is increased to the extent of any dividends paid in connection with the underlying security. |
| | |
| (d) | Securities are exempt from registration under Rule 144A of the Securities Act of 1933. These securities may be resold in transactions exempt from registration, normally to qualified institutional buyers. At May 31, 2013, these securities amounted to $3,535,094, which represents 1.6% of net assets. |
| | |
| (e) | At May 31, 2013, the total market value of the Fund’s securities on loan was $24,037,699 and the total market value of the collateral held by the Fund was $25,010,231. |
| | |
| (f) | Interest rate shown reflects yield as of May 31, 2013. |
| See notes to financial statements. |
| 44 | CLAYMORE EXCHANGE-TRADED FUND TRUST 2 ANNUAL REPORT |
| PORTFOLIO OF INVESTMENTS continued | May 31, 2013 |
CUT Guggenheim Timber ETF continued
| | % of Long-Term | |
| Country Breakdown | Investments | |
| United States | 35.4% | |
| Brazil | 12.6% | |
| Japan | 10.5% | |
| Canada | 10.0% | |
| Sweden | 8.5% | |
| Finland | 7.0% | |
| Ireland | 6.6% | |
| Portugal | 4.9% | |
| South Africa | 2.8% | |
| Spain | 1.7% | |
| | | |
| | % of Long-Term | |
| Currency Denomination | Investments | |
| United States Dollar | 45.0% | |
| Euro | 20.1% | |
| Japanese Yen | 10.5% | |
| Canadian Dollar | 10.0% | |
| Swedish Krona | 8.5% | |
| All other currencies | 5.9% | |
Country breakdown and currency denomination are shown as a percentage of long-term investments. | |
| See notes to financial statements. | |
| | CLAYMORE EXCHANGE-TRADED FUND TRUST 2 ANNUAL REPORT | 45 |
| STATEMENT OF ASSETS AND LIABILITIES | May 31, 2013 |
| | | Guggenheim | | Guggenheim | | Guggenheim | | Guggenheim | |
| | | Canadian Energy | | China Real Estate | | China Small Cap | | Frontier | |
| | | Income ETF | | ETF | | ETF | | Markets ETF | |
| | | | (ENY | ) | | (TAO | ) | | (HAO | ) | | (FRN | ) |
| Assets | | | | | | | | | | | | | |
| Investments in securities, at value (including securities on loan) | | $ | 70,838,874 | | $ | 52,761,023 | | $ | 277,700,222 | | $ | 139,812,995 | |
| Cash | | | 124,478 | | | 38,609 | | | 173,266 | | | 122,327 | |
| Foreign currency, at value | | | 74,068 | | | — | | | 115,198 | | | — | |
| Receivables: | | | | | | | | | | | | | |
| Dividends | | | 134,108 | | | 271,979 | | | 1,341,694 | | | 934,007 | |
| Securities lending income | | | 12,926 | | | 806 | | | 154,053 | | | 40,550 | |
| Tax reclaims | | | — | | | — | | | — | | | — | |
| Due from Adviser | | | — | | | 111,566 | | | — | | | — | |
| Other assets | | | 2,802 | | | 3,070 | | | 5,890 | | | 4,248 | |
| Total assets | | | 71,187,256 | | | 53,187,053 | | | 279,490,323 | | | 140,914,127 | |
| Liabilities | | | | | | | | | | | | | |
| Payables: | | | | | | | | | | | | | |
| Fund shares redeemed | | | 302 | | | — | | | 27,570 | | | — | |
| Investments purchased | | | 173,452 | | | — | | | — | | | — | |
| Administration fee payable | | | 1,445 | | | — | | | 5,557 | | | 3,346 | |
| Collateral for securities on loan | | | 10,365,063 | | | 2,177,941 | | | 42,198,946 | | | 28,626,707 | |
| Accrued advisory fees | | | 26,268 | | | — | | | 94,932 | | | 29,389 | |
| Accrued expenses | | | 102,986 | | | 127,784 | | | 240,575 | | | 156,481 | |
| Total liabilities | | | 10,669,516 | | | 2,305,725 | | | 42,567,580 | | | 28,815,923 | |
| Net Assets | | $ | 60,517,740 | | $ | 50,881,328 | | $ | 236,922,743 | | $ | 112,098,204 | |
| Composition of Net Assets | | | | | | | | | | | | | |
| Paid-in capital | | $ | 144,931,005 | | $ | 66,301,903 | | $ | 305,770,088 | | $ | 162,161,418 | |
| Accumulated undistributed net investment income (loss) | | | 20,178 | | | 130,072 | | | 1,644,566 | | | 3,239,344 | |
| Accumulated net realized gain (loss) on investments and currency transactions | | | (76,697,313 | ) | | (13,693,146 | ) | | (49,889,329 | ) | | (30,376,057 | ) |
| Net unrealized appreciation (depreciation) on investments and currency translation | | | (7,736,130 | ) | | (1,857,501 | ) | | (20,602,582 | ) | | (22,926,501 | ) |
| Net Assets | | $ | 60,517,740 | | $ | 50,881,328 | | $ | 236,922,743 | | $ | 112,098,204 | |
| Shares outstanding ($0.01 par value with unlimited amount authorized) | | | 4,170,000 | | | 2,310,000 | | | 9,600,000 | | | 6,440,000 | |
| Net Asset Value Per Share | | $ | 14.51 | | $ | 22.03 | | $ | 24.68 | | $ | 17.41 | |
| Investments in securities, at cost | | $ | 78,574,392 | | $ | 54,618,519 | | $ | 298,302,678 | | $ | 162,739,496 | |
| Foreign currency, at cost | | $ | 74,991 | | $ | — | | $ | 115,186 | | $ | — | |
| Securities on loan, at value | | $ | 9,856,303 | | $ | 2,028,124 | | $ | 37,863,991 | | $ | 28,353,112 | |
| See notes to financial statements. |
| 46 | CLAYMORE EXCHANGE-TRADED FUND TRUST 2 ANNUAL REPORT |
| | | | Guggenheim | | | | | | | |
| | | | International Multi-Asset | | | Guggenheim | | | Guggenheim | |
| | | | Income ETF | | | Shipping ETF | | | Timber ETF | |
| �� | | | (HGI | ) | | (SEA | ) | | (CUT | ) |
| | | | | | | | | | | |
| | | $ | 129,059,985 | | $ | 40,692,052 | | $ | 247,335,761 | |
| | | | 352,599 | | | 55,307 | | | 359,673 | |
| | | | 31,242 | | | — | | | — | |
| | | | | | | | | | | |
| | | | 559,572 | | | 88,969 | | | 507,491 | |
| | | | 42,440 | | | 18,080 | | | 38,256 | |
| | | | 54,634 | | | 19,960 | | | 56,651 | |
| | | | — | | | — | | | — | |
| | | | 3,757 | | | — | | | 5,471 | |
| | | | 130,104,229 | | | 40,874,368 | | | 248,303,303 | |
| | | | | | | | | | | |
| | | | | | | | | | | |
| | | | — | | | — | | | — | |
| | | | 412,175 | | | — | | | — | |
| | | | 2,843 | | | — | | | 5,185 | |
| | | | 10,399,128 | | | 5,845,063 | | | 25,010,231 | |
| | | | 60,575 | | | 18,539 | | | 83,479 | |
| | | | 113,647 | | | — | | | 169,892 | |
| | | | 10,988,368 | | | 5,863,602 | | | 25,268,787 | |
| | | $ | 119,115,861 | | $ | 35,010,766 | | $ | 223,034,516 | |
| | | | | | | | | | | |
| | | $ | 148,186,824 | | $ | 40,261,649 | | $ | 241,428,764 | |
| | | | (49,013 | ) | | 176,536 | | | 2,333,866 | |
| | | | (29,871,511 | ) | | (6,439,277 | ) | | (43,213,761 | ) |
| | | | 849,561 | | | 1,011,858 | | | 22,485,647 | |
| | | $ | 119,115,861 | | $ | 35,010,766 | | $ | 223,034,516 | |
| | | | 6,900,000 | | | 2,000,000 | | | 10,050,000 | |
| | | $ | 17.26 | | $ | 17.51 | | $ | 22.19 | |
| | | $ | 128,200,657 | | $ | 39,679,734 | | $ | 224,826,598 | |
| | | $ | 32,850 | | $ | — | | $ | — | |
| | | $ | 10,000,434 | | $ | 5,659,057 | | $ | 24,037,699 | |
| See notes to financial statements. |
| CLAYMORE EXCHANGE-TRADED FUND TRUST 2 ANNUAL REPORT | 47 |
STATEMENT OF OPERATIONS For the year ended May 31, 2013 | May 31, 2013 |
| . | | | | | | | | | | | | | |
| | | Guggenheim | | Guggenheim | | Guggenheim | | Guggenheim | |
| | | Canadian Energy | | China Real Estate | | China Small Cap | | Frontier Markets | |
| | | Income ETF | | | ETF | | | ETF | | | ETF | |
| | | | (ENY | ) | | (TAO | ) | | (HAO | ) | | (FRN | ) |
| Investment Income | | | | | | | | | | | | | |
| Dividend income | | $ | 3,083,301 | | $ | 1,214,376 | | $ | 4,606,252 | | $ | 6,599,737 | |
| Less return of capital distributions received | | | — | | | — | | | — | | | — | |
| Foreign taxes withheld | | | (462,447 | ) | | (295 | ) | | (147,962 | ) | | (557,237 | ) |
| Net dividend income | | | 2,620,854 | | | 1,214,081 | | | 4,458,290 | | | 6,042,500 | |
| Net securities lending income | | | 272,535 | | | 64,293 | | | 1,658,185 | | | 523,795 | |
| Total income | | | 2,893,389 | | | 1,278,374 | | | 6,116,475 | | | 6,566,295 | |
| Expenses | | | | | | | | | | | | | |
| Advisory fee <Note 3> | | | 402,751 | | | 247,429 | | | 1,311,116 | | | 753,127 | |
| Administration fee | | | 22,151 | | | 13,609 | | | 61,422 | | | 41,422 | |
| Custodian fee | | | 62,002 | | | 66,108 | | | 173,017 | | | 89,802 | |
| Licensing | | | 80,550 | | | 54,965 | | | 338,238 | | | 150,626 | |
| Listing fee and expenses | | | 5,000 | | | 5,000 | | | 5,000 | | | 5,000 | |
| Printing expenses | | | 36,546 | | | 14,800 | | | 40,149 | | | 25,152 | |
| Professional fees | | | 31,748 | | | 29,206 | | | 37,722 | | | 36,919 | |
| Registration & filings | | | — | | | 3,839 | | | 6,402 | | | 2,965 | |
| Trustees’ fees and expenses | | | 5,531 | | | 4,367 | | | 9,642 | | | 7,345 | |
| Miscellaneous | | | 20,808 | | | 20,865 | | | 25,989 | | | 20,980 | |
| Total expenses | | | 667,087 | | | 460,188 | | | 2,008,697 | | | 1,133,338 | |
| Advisory fees waived | | | (103,235 | ) | | (113,788 | ) | | (220,812 | ) | | (78,960 | ) |
| Net expenses | | | 563,852 | | | 346,400 | | | 1,787,885 | | | 1,054,378 | |
| Net Investment Income (Loss) | | | 2,329,537 | | | 931,974 | | | 4,328,590 | | | 5,511,917 | |
| Realized and Unrealized Gain (Loss) | | | | | | | | | | | | | |
| Net realized gain (loss) on | | | | | | | | | | | | | |
| Investments | | | (20,616,431 | ) | | (1,450,574 | ) | | (13,739,860 | ) | | (20,729,794 | ) |
| In-kind transactions | | | 4,475,574 | | | 5,084,883 | | | 25,981,932 | | | 961,191 | |
| Foreign currency transactions | | | (52,424 | ) | | (241 | ) | | (1,325 | ) | | — | |
| Net realized gain (loss) | | | (16,193,281 | ) | | 3,634,068 | | | 12,240,747 | | | (19,768,603 | ) |
| Net change in unrealized appreciation (depreciation) on | | | | | | | | | | | | | |
| Investments | | | 16,097,481 | | | 3,565,998 | | | 30,267,852 | | | 4,913,185 | |
| Foreign currency translation | | | 8,741 | | | 5 | | | (9 | ) | | — | |
| Net unrealized appreciation (depreciation) | | | 16,106,222 | | | 3,566,003 | | | 30,267,843 | | | 4,913,185 | |
| Net realized and unrealized gain (loss) | | | (87,059 | ) | | 7,200,071 | | | 42,508,590 | | | (14,855,418 | ) |
| Net Increase (Decrease) in Net Assets Resulting from Operations | | $ | 2,242,478 | | $ | 8,132,045 | | $ | 46,837,180 | | $ | (9,343,501 | ) |
| See notes to financial statements. |
| 48 | CLAYMORE EXCHANGE-TRADED FUND TRUST 2 ANNUAL REPORT |
| | | | | | | | | | | |
| | | | Guggenheim | | | | | | | |
| | | | International Multi-Asset | | | Guggenheim | | | Guggenheim | |
| | | | Income ETF | | | Shipping ETF | | | Timber ETF | |
| | | | (HGI | ) | | (SEA | ) | | (CUT | ) |
| | | | | | | | | | | |
| | | $ | 6,073,536 | | $ | 1,284,664 | | $ | 5,164,864 | |
| | | | (65,873 | ) | | (438,715 | ) | | — | |
| | | | (366,070 | ) | | (28,430 | ) | | (352,073 | ) |
| | | | 5,641,593 | | | 817,519 | | | 4,812,791 | |
| | | | 337,293 | | | 202,425 | | | 493,309 | |
| | | | 5,978,886 | | | 1,019,944 | | | 5,306,100 | |
| | | | | | | | | | | |
| | | | 580,579 | | | 194,400 | | | 891,121 | |
| | | | 31,932 | | | — | | | 47,991 | |
| | | | 87,217 | | | — | | | 67,339 | |
| | | | 149,174 | | | — | | | 242,336 | |
| | | | 5,000 | | | — | | | 5,000 | |
| | | | 15,107 | | | — | | | 26,475 | |
| | | | 37,502 | | | — | | | 39,880 | |
| | | | 645 | | | — | | | 7,840 | |
| | | | 6,326 | | | — | | | 7,555 | |
| | | | 20,948 | | | — | | | 25,099 | |
| | | | 934,430 | | | 194,400 | | | 1,360,636 | |
| | | | (121,620 | ) | | — | | | (113,066 | ) |
| | | | 812,810 | | | 194,400 | | | 1,247,570 | |
| | | | 5,166,076 | | | 825,544 | | | 4,058,530 | |
| | | | | | | | | | | |
| | | | | | | | | | | |
| | | | (10,789,990 | ) | | (3,408,191 | ) | | (1,942,329 | ) |
| | | | 9,424,370 | | | 134,690 | | | 7,181,181 | |
| | | | (106,511 | ) | | (20,735 | ) | | (44,515 | ) |
| | | | (1,472,131 | ) | | (3,294,236 | ) | | 5,194,337 | |
| | | | | | | | | | | |
| | | | 16,977,761 | | | 5,709,480 | | | 48,393,487 | |
| | | | (1,851 | ) | | (2,698 | ) | | (29,773 | ) |
| | | | 16,975,910 | | | 5,706,782 | | | 48,363,714 | |
| | | | 15,503,779 | | | 2,412,546 | | | 53,558,051 | |
| | | $ | 20,669,855 | | $ | 3,238,090 | | $ | 57,616,581 | |
| See notes to financial statements. |
| CLAYMORE EXCHANGE-TRADED FUND TRUST 2 ANNUAL REPORT | 49 |
| STATEMENTS OF CHANGES IN NET ASSETS | May 31, 2013 |
| | | Guggenheim Canadian | |
| | | Energy Income ETF | |
| | | (ENY) | |
| | | | For the Year | | | For the Year | |
| | | | Ended | | | Ended | |
| | | | May 31, 2013 | | | May 31, 2012 | |
| Increase (Decrease) in Net Assets Resulting from Operations | | | | | | | |
| Net investment income (loss) | | $ | 2,329,537 | | $ | 3,594,127 | |
| Net realized gain (loss) | | | (16,193,281 | ) | | (38,792,896 | ) |
| Net unrealized appreciation (depreciation) | | | 16,106,222 | | | (26,151,529 | ) |
| Net increase (decrease) in net assets resulting from operations | | | 2,242,478 | | | (61,350,298 | ) |
| Distribution to Shareholders | | | | | | | |
| From and in excess of net investment income | | | (2,182,941 | ) | | (4,070,916 | ) |
| Return of capital | | | (125,469 | ) | | (172,854 | ) |
| Total distributions | | | (2,308,410 | ) | | (4,243,770 | ) |
| Capital Share Transactions | | | | | | | |
| Proceeds from sale of shares | | | 26,490,915 | | | 16,593,797 | |
| Cost of shares redeemed | | | (55,922,241 | ) | | (90,554,537 | ) |
| Net increase (decrease) from capital share transactions | | | (29,431,326 | ) | | (73,960,740 | ) |
| Total increase (decrease) in net assets | | | (29,497,258 | ) | | (139,554,808 | ) |
| | | | | | | | |
| Net Assets | | | | | | | |
| Beginning of period | | | 90,014,998 | | | 229,569,806 | |
| End of period | | $ | 60,517,740 | | $ | 90,014,998 | |
| Accumulated undistributed net investment income (loss) at end of period | | $ | 20,178 | | $ | 8,346 | |
| Changes in Shares Outstanding | | | | | | | |
| Shares sold | | | 1,650,000 | | | 900,000 | |
| Shares redeemed | | | (3,550,000 | ) | | (5,250,000 | ) |
| Shares outstanding, beginning of period | | | 6,070,000 | | | 10,420,000 | |
| Shares outstanding, end of period | | | 4,170,000 | | | 6,070,000 | |
| * | Subsequent to May 31, 2012, a reclassification was required that resulted in a recharacterization of the distributions for the May 31, 2012 financial reporting period. Please refer to Note 4 – Federal Income Taxes. |
| See notes to financial statements. |
| 50 | CLAYMORE EXCHANGE-TRADED FUND TRUST 2 ANNUAL REPORT |
| | | Guggenheim China | | Guggenheim China | | Guggenheim | | Guggenheim International | |
| | | Real Estate ETF | | Small Cap ETF | | Frontier Markets ETF | | Multi-Asset Income ETF | |
| | | (TAO) | | (HAO) | | (FRN) | | (HGI) | |
| | | For the Year | | For the Year | | For the Year | | For the Year | | For the Year | | For the Year | | For the Year | | For the Year | |
| | | | Ended | | | Ended | | | Ended | | | Ended | | | Ended | | | Ended | | | Ended | | | Ended | |
| | | May 31, 2013 | | May 31, 2012 | | May 31, 2013 | | May 31, 2012 | | May 31, 2013 | | May 31, 2012 | | May 31, 2013 | | May 31, 2012 | |
| | | | | | | | | | | | | | | | | | | | | | | | | | |
| | | $ | 931,974 | | $ | 624,269 | | $ | 4,328,590 | | $ | 4,145,673 | | $ | 5,511,917 | | $ | 4,259,682 | | $ | 5,166,076 | | $ | 4,766,436 | |
| | | | 3,634,068 | | | (1,761,892 | ) | | 12,240,747 | | | (50,765,896 | ) | | (19,768,603 | ) | | (5,471,134 | ) | | (1,472,131 | ) | | (5,929,236 | ) |
| | | | 3,566,003 | | | (5,122,573 | ) | | 30,267,843 | | | (37,770,210 | ) | | 4,913,185 | | | (28,138,249 | ) | | 16,975,910 | | | (23,239,412 | ) |
| | | | 8,132,045 | | | (6,260,196 | ) | | 46,837,180 | | | (84,390,433 | ) | | (9,343,501 | ) | | (29,349,701 | ) | | 20,669,855 | | | (24,402,212 | ) |
| | | | | | | | | | | | | | | | | | | | | | | | | | |
| | | | (1,381,280 | ) | | (233,530 | ) | | (4,003,500 | ) | | (4,836,000 | ) | | (4,819,580 | ) | | (5,553,760 | ) | | (5,238,200 | ) | | (4,505,697 | )* |
| | | | — | | | — | | | — | | | — | | | — | | | — | | | — | | | (69,703 | )* |
| | | | (1,381,280 | ) | | (233,530 | ) | | (4,003,500 | ) | | (4,836,000 | ) | | (4,819,580 | ) | | (5,553,760 | ) | | (5,238,200 | ) | | (4,575,400 | ) |
| | | | | | | | | | | | | | | | | | | | | | | | | | |
| | | | 68,500,827 | | | 10,283,066 | | | 205,297,879 | | | 34,114,502 | | | 27,827,850 | | | 36,836,204 | | | 57,379,737 | | | 64,159,072 | |
| | | | (42,928,680 | ) | | (12,627,475 | ) | | (175,981,373 | ) | | (107,488,523 | ) | | (34,963,094 | ) | | (51,859,839 | ) | | (56,001,977 | ) | | (34,770,261 | ) |
| | | | 25,572,147 | | | (2,344,409 | ) | | 29,316,506 | | | (73,374,021 | ) | | (7,135,244 | ) | | (15,023,635 | ) | | 1,377,760 | | | 29,388,811 | |
| | | | 32,322,912 | | | (8,838,135 | ) | | 72,150,186 | | | (162,600,454 | ) | | (21,298,325 | ) | | (49,927,096 | ) | | 16,809,415 | | | 411,199 | |
| | | | | | | | | | | | | | | | | | | | | | | | | | |
| | | | | | | | | | | | | | | | | | | | | | | | | | |
| | | | 18,558,416 | | | 27,396,551 | | | 164,772,557 | | | 327,373,011 | | | 133,396,529 | | | 183,323,625 | | | 102,306,446 | | | 101,895,247 | |
| | | $ | 50,881,328 | | $ | 18,558,416 | | $ | 236,922,743 | | $ | 164,772,557 | | $ | 112,098,204 | | $ | 133,396,529 | | $ | 119,115,861 | | $ | 102,306,446 | |
| | | $ | 130,072 | | $ | 366,628 | | $ | 1,644,566 | | $ | 1,107,514 | | $ | 3,239,344 | | $ | 2,536,338 | | $ | (49,013 | ) | $ | 99,612 | |
| | | | | | | | | | | | | | | | | | | | | | | | | | |
| | | | 3,150,000 | | | 550,000 | | | 8,850,000 | | | 1,550,000 | | | 1,400,000 | | | 1,650,000 | | | 3,400,000 | | | 3,700,000 | |
| | | | (1,950,000 | ) | | (800,000 | ) | | (7,500,000 | ) | | (4,500,000 | ) | | (1,950,000 | ) | | (2,550,000 | ) | | (3,300,000 | ) | | (2,000,000 | ) |
| | | | 1,110,000 | | | 1,360,000 | | | 8,250,000 | | | 11,200,000 | | | 6,990,000 | | | 7,890,000 | | | 6,800,000 | | | 5,100,000 | |
| | | | 2,310,000 | | | 1,110,000 | | | 9,600,000 | | | 8,250,000 | | | 6,440,000 | | | 6,990,000 | | | 6,900,000 | | | 6,800,000 | |
| See notes to financial statements. |
| CLAYMORE EXCHANGE-TRADED FUND TRUST 2 ANNUAL REPORT | 51 |
| STATEMENTS OF CHANGES IN NET ASSETS continued | May 31, 2013 |
| |
| Increase (Decrease) in Net Assets Resulting from Operations |
| Net investment income (loss) |
| Net realized gain (loss) |
| Net unrealized appreciation (depreciation) |
| Net increase (decrease) in net assets resulting from operations |
| Distribution to Shareholders |
| From and in excess of net investment income |
| Return of capital |
| Total distributions |
| Capital Share Transactions |
| Proceeds from sale of shares |
| Cost of shares redeemed |
| Net increase (decrease) from capital share transactions |
| Total increase (decrease) in net assets |
| |
| Net Assets |
| Beginning of period |
| End of period |
| Accumulated undistributed net investment income (loss) at end of period |
| Changes in Shares Outstanding |
| Shares sold |
| Shares redeemed |
| Shares outstanding, beginning of period |
| Shares outstanding, end of period |
| See notes to financial statements. |
| 52 | CLAYMORE EXCHANGE-TRADED FUND TRUST 2 ANNUAL REPORT |
| | | | | | | | | | | | | May 31, 2013 |
| | | | | | | | | | | | | | |
| | | | Guggenheim | | | Guggenheim | |
| | | | Shipping ETF | | | Timber ETF | |
| | | | (SEA) | | | (CUT) | |
| | | | For the Year | | | For the Year | | | For the Year | | | For the Year | |
| | | | Ended | | | Ended | | | Ended | | | Ended | |
| | | | May 31, 2013 | | | May 31, 2012 | | | May 31, 2013 | | | May 31, 2012 | |
| | | | | | | | | | | | | | |
| | | $ | 825,544 | | $ | 927,351 | | $ | 4,058,530 | | $ | 3,030,836 | |
| | | | (3,294,236 | ) | | (585,326 | ) | | 5,194,337 | | | (12,142,462 | ) |
| | | | 5,706,782 | | | (3,024,028 | ) | | 48,363,714 | | | (48,346,562 | ) |
| | | | 3,238,090 | | | (2,682,003 | ) | | 57,616,581 | | | (57,458,188 | ) |
| | | | | | | | | | | | | | |
| | | | (852,200 | ) | | (869,900 | ) | | (2,441,450 | ) | | (2,496,150 | ) |
| | | | — | | | — | | | — | | | — | |
| | | | (852,200 | ) | | (869,900 | ) | | (2,441,450 | ) | | (2,496,150 | ) |
| | | | | | | | | | | | | | |
| | | | 5,261,486 | | | 41,081,606 | | | 85,141,458 | | | 13,031,462 | |
| | | | (3,089,060 | ) | | (19,420,751 | ) | | (23,336,000 | ) | | (75,409,500 | ) |
| | | | 2,172,426 | | | 21,660,855 | | | 61,805,458 | | | (62,378,038 | ) |
| | | | 4,558,316 | | | 18,108,952 | | | 116,980,589 | | | (122,332,376 | ) |
| | | | | | | | | | | | | | |
| | | | | | | | | | | | | | |
| | | | 30,452,450 | | | 12,343,498 | | | 106,053,927 | | | 228,386,303 | |
| | | $ | 35,010,766 | | $ | 30,452,450 | | $ | 223,034,516 | | $ | 106,053,927 | |
| | | $ | 176,536 | | $ | 158,860 | | $ | 2,333,866 | | $ | 1,803,075 | |
| | | | | | | | | | | | | | |
| | | | 300,000 | | | 2,500,000 | | | 4,350,000 | | | 700,000 | |
| | | | (200,000 | ) | | (1,100,000 | ) | | (1,050,000 | ) | | (4,150,000 | ) |
| | | | 1,900,000 | | | 500,000 | | | 6,750,000 | | | 10,200,000 | |
| | | | 2,000,000 | | | 1,900,000 | | | 10,050,000 | | | 6,750,000 | |
| See notes to financial statements. |
| CLAYMORE EXCHANGE-TRADED FUND TRUST 2 ANNUAL REPORT | 53 |
| FINANCIAL HIGHLIGHTS | May 31, 2013 |
ENY Guggenheim Canadian Energy Income ETF
| | | | | | | | | | | | | | | | | |
| | | | For the | | | For the | | | For the | | | For the | | | For the | |
| Per share operating performance | | | Year Ended | | | Year Ended | | | Year Ended | | | Year Ended | | | Year Ended | |
| for a share outstanding throughout the period | | May 31, 2013 | | May 31, 2012 | | May 31, 2011 | | May 31, 2010 | | May 31, 2009 | |
| Net asset value, beginning of period | | $ | 14.83 | | $ | 22.03 | | $ | 16.52 | | $ | 14.10 | | $ | 31.58 | |
| Income from investment operations | | | | | | | | | | | | | | | | |
Net investment income (a) | | | 0.45 | | | 0.46 | | | 0.52 | | | 0.47 | | | 1.08 | |
| Net realized and unrealized gain (loss) | | | (0.33 | ) | | (7.10 | ) | | 5.51 | | | 2.55 | | | (17.49 | ) |
| Total from investment operations | | | 0.12 | | | (6.64 | ) | | 6.03 | | | 3.02 | | | (16.41 | ) |
| Distributions to shareholders | | | | | | | | | | | | | | | | |
| From and in excess of net investment income | | | (0.42 | ) | | (0.54 | ) | | (0.52 | ) | | (0.60 | ) | | (1.07 | ) |
| Return of capital | | | (0.02 | ) | | (0.02 | ) | | — | | | — | | | — | |
| Total distributions to shareholders | | | (0.44 | ) | | (0.56 | ) | | (0.52 | ) | | (0.60 | ) | | (1.07 | ) |
| Net asset value, end of period | | $ | 14.51 | | $ | 14.83 | | $ | 22.03 | | $ | 16.52 | | $ | 14.10 | |
| Market value, end of period | | $ | 14.43 | | $ | 14.73 | | $ | 22.06 | | $ | 16.50 | | $ | 14.38 | |
Total return*(b) | | | | | | | | | | | | | | | | |
| Net asset value | | | 0.61 | % | | -30.45 | % | | 37.22 | % | | 21.75 | % | | -51.89 | % |
| | | | | | | | | | | | | | | | | |
| Ratios and supplemental data | | | | | | | | | | | | | | | | |
| Net assets, end of period (thousands) | | $ | 60,518 | | $ | 90,015 | | $ | 229,570 | | $ | 74,649 | | $ | 37,791 | |
| Ratio of net expenses to average net assets* | | | 0.70 | % | | 0.70 | % | | 0.70 | % | | 0.70 | % | | 0.71 | % |
| Ratio of net investment income to average net assets* | | | 2.89 | % | | 2.62 | % | | 2.59 | % | | 2.89 | % | | 7.03 | % |
Portfolio turnover rate (c) | | | 130 | % | | 81 | % | | 34 | % | | 58 | % | | 68 | % |
* If certain expenses had not been waived or reimbursed by the Adviser, total return would have been lower and the ratios would have been as follows: | | | | | | | | | | | | | | | | |
| Ratio of total expenses to average net assets | | | 0.83 | % | | 0.79 | % | | 0.84 | % | | 0.89 | % | | 1.23 | % |
| Ratio of net investment income to average net assets | | | 2.76 | % | | 2.53 | % | | 2.45 | % | | 2.70 | % | | 6.51 | % |
| (a) | Based on average shares outstanding during the period. |
| | |
| (b) | Total investment return is calculated assuming a purchase of a share at the beginning of the period and a sale on the last day of the period reported at net asset value (“NAV”). Dividends and distributions are assumed to be reinvested at NAV. Total investment return does not reflect brokerage commissions. A return calculated for a period of less than one year is not annualized. |
| | |
| (c) | Portfolio turnover is not annualized for periods of less than one year and does not include securities received or delivered from processing creations or redemptions. |
| See notes to financial statements. |
| 54 | CLAYMORE EXCHANGE-TRADED FUND TRUST 2 ANNUAL REPORT |
| FINANCIAL HIGHLIGHTS continued | May 31, 2013 |
TAO Guggenheim China Real Estate ETF
| | | | | | | | | | | | | | | | | |
| | | | For the | | | For the | | | For the | | | For the | | | For the | |
| Per share operating performance | | | Year Ended | | | Year Ended | | | Year Ended | | | Year Ended | | | Year Ended | |
| for a share outstanding throughout the period | | | May 31, 2013 | | | May 31, 2012 | | | May 31, 2011 | | | May 31, 2010 | | | May 31, 2009 | |
| Net asset value, beginning of period | | $ | 16.72 | | $ | 20.14 | | $ | 16.02 | | $ | 16.87 | | $ | 20.68 | |
| Income from investment operations | | | | | | | | | | | | | | | | |
Net investment income (a) | | | 0.41 | | | 0.47 | | | 0.35 | | | 0.29 | | | 0.39 | |
| Net realized and unrealized gain (loss) | | | 5.29 | | | (3.70 | ) | | 3.92 | | | (0.57 | ) | | (3.82 | ) |
| Total from investment operations | | | 5.70 | | | (3.23 | ) | | 4.27 | | | (0.28 | ) | | (3.43 | ) |
| Distributions to shareholders | | | | | | | | | | | | | | | | |
| From and in excess of net investment income | | | (0.39 | ) | | (0.19 | ) | | (0.15 | ) | | (0.57 | ) | | (0.38 | ) |
| Net asset value, end of period | | $ | 22.03 | | $ | 16.72 | | $ | 20.14 | | $ | 16.02 | | $ | 16.87 | |
| Market value, end of period | | $ | 21.66 | | $ | 16.74 | | $ | 20.07 | | $ | 15.89 | | $ | 17.27 | |
Total return*(b) | | | | | | | | | | | | | | | | |
| Net asset value | | | 34.05 | % | | -15.90 | % | | 26.68 | % | | -2.10 | % | | -15.44 | % |
| | | | | | | | | | | | | | | | | |
| Ratios and supplemental data | | | | | | | | | | | | | | | | |
| Net assets, end of period (thousands) | | $ | 50,881 | | $ | 18,558 | | $ | 27,397 | | $ | 45,484 | | $ | 39,802 | |
| Ratio of net expenses to average net assets* | | | 0.70 | % | | 0.70 | % | | 0.70 | % | | 0.70 | % | | 0.78 | % |
| Ratio of net investment income to average net assets* | | | 1.88 | % | | 2.76 | % | | 1.83 | % | | 1.64 | % | | 3.00 | % |
Portfolio turnover rate (c) | | | 20 | % | | 14 | % | | 17 | % | | 15 | % | | 47 | % |
* If certain expenses had not been waived or reimbursed by the Adviser, total return would have been lower and the ratios would have been as follows: | | | | | | | | | | | | | | | | |
| Ratio of total expenses to average net assets | | | 0.93 | % | | 1.35 | % | | 1.02 | % | | 0.92 | % | | 1.74 | % |
| Ratio of net investment income to average net assets | | | 1.65 | % | | 2.11 | % | | 1.51 | % | | 1.42 | % | | 2.04 | % |
| (a) | Based on average shares outstanding during the period. |
| | |
| (b) | Total investment return is calculated assuming a purchase of a share at the beginning of the period and a sale on the last day of the period reported at net asset value (“NAV”). Dividends and distributions are assumed to be reinvested at NAV. Total investment return does not reflect brokerage commissions. A return calculated for a period of less than one year is not annualized. |
| | |
| (c) | Portfolio turnover is not annualized for periods of less than one year and does not include securities received or delivered from processing creations or redemptions. |
| See notes to financial statements. |
| CLAYMORE EXCHANGE-TRADED FUND TRUST 2 ANNUAL REPORT | 55 |
| FINANCIAL HIGHLIGHTS continued | May 31, 2013 |
HAO Guggenheim China Small Cap ETF
| | | | | | | | | | | | | | | | | |
| | | | For the | | | For the | | | For the | | | For the | | | For the | |
| Per share operating performance | | | Year Ended | | | Year Ended | | | Year Ended | | | Year Ended | | | Year Ended | |
| for a share outstanding throughout the period | | | May 31, 2013 | | | May 31, 2012 | | | May 31, 2011 | | | May 31, 2010 | | | May 31, 2009 | |
| Net asset value, beginning of period | | $ | 19.97 | | $ | 29.23 | | $ | 24.44 | | $ | 20.70 | | $ | 24.04 | |
| Income from investment operations | | | | | | | | | | | | | | | | |
Net investment income (a) | | | 0.41 | | | 0.50 | | | 0.39 | | | 0.25 | | | 0.27 | |
| Net realized and unrealized gain (loss) | | | 4.61 | | | (9.14 | ) | | 4.84 | | | 3.52 | | | (3.51 | ) |
| Total from investment operations | | | 5.02 | | | (8.64 | ) | | 5.23 | | | 3.77 | | | (3.24 | ) |
| Distributions to shareholders | | | | | | | | | | | | | | | | |
| From and in excess of net investment income | | | (0.31 | ) | | (0.62 | ) | | (0.44 | ) | | (0.03 | ) | | (0.10 | ) |
| Net asset value, end of period | | $ | 24.68 | | $ | 19.97 | | $ | 29.23 | | $ | 24.44 | | $ | 20.70 | |
| Market value, end of period | | $ | 24.31 | | $ | 20.01 | | $ | 29.15 | | $ | 24.30 | | $ | 21.22 | |
Total return *(b) | | | | | | | | | | | | | | | | |
| Net asset value | | | 25.24 | % | | -29.50 | % | | 21.36 | % | | 18.20 | % | | -13.27 | % |
| Ratios and supplemental data | | | | | | | | | | | | | | | | |
| Net assets, end of period (thousands) | | $ | 236,923 | | $ | 164,773 | | $ | 327,373 | | $ | 291,284 | | $ | 62,938 | |
| Ratio of net expenses to average net assets* | | | 0.75 | % | | 0.75 | % | | 0.75 | % | | 0.75 | % | | 0.88 | % |
| Ratio of net investment income (loss) to average net assets* | | | 1.81 | % | | 2.17 | % | | 1.33 | % | | 1.00 | % | | 1.86 | % |
Portfolio turnover rate (c) | | | 31 | % | | 35 | % | | 11 | % | | 46 | % | | 65 | % |
* If certain expenses had not been waived or reimbursed by the Adviser, total return would have been lower and the ratios would have been as follows: | | | | | | | | | | | | | | | | |
| Ratio of total expenses to average net assets | | | 0.84 | % | | 0.92 | % | | 0.89 | % | | 0.91 | % | | 1.64 | % |
| Ratio of net investment income (loss) to average net assets | | | 1.72 | % | | 2.00 | % | | 1.19 | % | | 0.84 | % | | 1.10 | % |
| (a) | Based on average shares outstanding during the period. |
| | |
| (b) | Total investment return is calculated assuming a purchase of a share at the beginning of the period and a sale on the last day of the period reported at net asset value (“NAV”). Dividends and distributions are assumed to be reinvested at NAV. Total investment return does not reflect brokerage commissions. A return calculated for a period of less than one year is not annualized. |
| | |
| (c) | Portfolio turnover is not annualized for periods of less than one year and does not include securities received or delivered from processing creations or redemptions. |
| See notes to financial statements. |
| 56 | CLAYMORE EXCHANGE-TRADED FUND TRUST 2 ANNUAL REPORT |
| FINANCIAL HIGHLIGHTS continued | May 31, 2013 |
FRN Guggenheim Frontier Markets ETF
| | | | | | | | | | | | | | | | | |
| | | | | | | | | | | | | | | | For the period | |
| | | | For the | | | For the | | | For the | | | For the | | | June 12, 2008** | |
| Per share operating performance | | | Year Ended | | | Year Ended | | | Year Ended | | | Year Ended | | | through | |
| for a share outstanding throughout the period | | | May 31, 2013 | | | May 31, 2012 | | | May 31, 2011 | | | May 31, 2010 | | | May 31, 2009 | |
| Net asset value, beginning of period | | $ | 19.08 | | $ | 23.23 | | $ | 18.12 | | $ | 14.49 | | $ | 24.34 | |
| Income from investment operations | | | | | | | | | | | | | | | | |
Net investment income (a) | | | 0.71 | | | 0.59 | | | 0.64 | | | 0.55 | | | 0.36 | |
| Net realized and unrealized gain (loss) | | | (1.77 | ) | | (3.92 | ) | | 4.60 | | | 3.46 | | | (10.12 | ) |
| Total from investment operations | | | (1.06 | ) | | (3.33 | ) | | 5.24 | | | 4.01 | | | (9.76 | ) |
| Distributions to Shareholders | | | | | | | | | | | | | | | | |
| From and in excess of net investment income | | | (0.61 | ) | | (0.82 | ) | | (0.13 | ) | | (0.38 | ) | | (0.09 | ) |
| Net asset value, end of period | | $ | 17.41 | | $ | 19.08 | | $ | 23.23 | | $ | 18.12 | | $ | 14.49 | |
| Market value, end of period | | $ | 17.17 | | $ | 19.26 | | $ | 22.95 | | $ | 18.67 | | $ | 14.48 | |
Total return*(b) | | | | | | | | | | | | | | | | |
| Net asset value | | | -5.94 | % | | -14.16 | % | | 28.87 | % | | 27.69 | % | | -40.03 | % |
| | | | | | | | | | | | | | | | | |
| Ratios and supplemental data | | | | | | | | | | | | | | | | |
| Net assets, end of period (thousands) | | $ | 112,098 | | $ | 133,397 | | $ | 183,324 | | $ | 31,888 | | $ | 15,066 | |
| Ratio of net expenses to average net assets* | | | 0.70 | % | | 0.70 | % | | 0.70 | % | | 0.70 | % | | 0.95 | %(c) |
| Ratio of net investment income to average net assets* | | | 3.66 | % | | 2.91 | % | | 2.84 | % | | 3.09 | % | | 2.65 | %(c) |
Portfolio turnover rate (d) | | | 46 | % | | 30 | % | | 9 | % | | 25 | % | | 29 | % |
* If certain expenses had not been waived or reimbursed by the Adviser, total return would have been lower and the ratios would have been as follows: | | | | | | | | | | | | | | | | |
| Ratio of expenses to average net assets | | | 0.75 | % | | 0.81 | % | | 0.80 | % | | 1.11 | % | | 2.22 | %(c) |
| Ratio of net investment income to average net assets | | | 3.61 | % | | 2.80 | % | | 2.74 | % | | 2.68 | % | | 1.38 | %(c) |
| ** | Commencement of investment operations. |
| | |
| (a) | Based on average shares outstanding during the period. |
| | |
| (b) | Total investment return is calculated assuming a purchase of a share at the beginning of the period and a sale on the last day of the period reported at net asset value (“NAV”). Dividends and distributions are assumed to be reinvested at NAV. Total investment return does not reflect brokerage commissions. A return calculated for a period of less than one year is not annualized. |
| | |
| (c) | Annualized. |
| | |
| (d) | Portfolio turnover is not annualized for periods of less than one year and does not include securities received or delivered from processing creations or redemptions. |
| See notes to financial statements. |
| CLAYMORE EXCHANGE-TRADED FUND TRUST 2 ANNUAL REPORT | 57 |
| FINANCIAL HIGHLIGHTS continued | May 31, 2013 |
HGI Guggenheim International Multi-Asset Income ETF
| | | | | | | | | | | | | | | | | |
| | | | For the | | | For the | | | For the | | | For the | | | For the | |
| Per share operating performance | | | Year Ended | | | Year Ended | | | Year Ended | | | Year Ended | | | Year Ended | |
| for a share outstanding throughout the period | | | May 31, 2013 | | | May 31, 2012 | | | May 31, 2011 | | | May 31, 2010 | | | May 31, 2009 | |
| Net asset value, beginning of period | | $ | 15.05 | | $ | 19.98 | | $ | 16.10 | | $ | 14.31 | | $ | 23.09 | |
| Income from investment operations | | | | | | | | | | | | | | | | |
Net investment income (a) | | | 0.74 | | | 0.86 | | | 0.88 | | | 0.68 | | | 0.78 | |
| Net realized and unrealized gain (loss) | | | 2.22 | | | (4.94 | ) | | 3.80 | | | 1.74 | | | (8.61 | ) |
| Total from investment operations | | | 2.96 | | | (4.08 | ) | | 4.68 | | | 2.42 | | | (7.83 | ) |
| Distributions to shareholders | | | | | | | | | | | | | | | | |
| From and in excess of net investment income | | | (0.75 | ) | | (0.84 | (e) | | (0.80 | ) | | (0.63 | ) | | (0.86 | ) |
| Return of capital | | | — | | | (0.01 | (e) | | — | | | — | | | (0.09 | ) |
| Total distribution to shareholders | | | (0.75 | ) | | (0.85 | ) | | (0.80 | ) | | (0.63 | ) | | (0.95 | ) |
| Net asset value, end of period | | $ | 17.26 | | $ | 15.05 | | $ | 19.98 | | $ | 16.10 | | $ | 14.31 | |
| Market value, end of period | | $ | 17.19 | | $ | 15.09 | | $ | 20.02 | | $ | 16.09 | | $ | 14.44 | |
Total return*(b) | | | | | | | | | | | | | | | | |
| Net asset value | | | 20.03 | % | | -20.86 | % | | 29.68 | % | | 16.81 | % | | -33.80 | % |
| | | | | | | | | | | | | | | | | |
| Ratios and supplemental data | | | | | | | | | | | | | | | | |
| Net assets, end of period (thousands) | | $ | 119,116 | | $ | 102,306 | | $ | 101,895 | | $ | 54,736 | | $ | 14,311 | |
Ratio of net expenses to average net assets*(c) | | | 0.70 | % | | 0.70 | % | | 0.70 | % | | 0.70 | % | | 0.70 | % |
| Ratio of net investment income to average net assets* | | | 4.45 | % | | 5.04 | % | | 4.71 | % | | 4.01 | % | | 5.56 | % |
Portfolio turnover rate (d) | | | 60 | % | | 73 | % | | 44 | % | | 42 | % | | 114 | % |
* If certain expenses had not been waived or reimbursed by the Adviser, total return would have been lower and the ratios would have been as follows: | | | | | | | | | | | | | | | | |
Ratio of total expenses to average net assets (c) | | | 0.81 | % | | 0.92 | % | | 0.94 | % | | 1.04 | % | | 1.98 | % |
| Ratio of net investment income to average net assets | | | 4.34 | % | | 4.82 | % | | 4.47 | % | | 3.67 | % | | 4.28 | % |
| (a) | Based on average shares outstanding during the period. |
| | |
| (b) | Total investment return is calculated assuming a purchase of a share at the beginning of the period and a sale on the last day of the period reported at net asset value (“NAV”). Dividends and distributions are assumed to be reinvested at NAV. Total investment return does not reflect brokerage commissions. A return calculated for a period of less than one year is not annualized. |
| | |
| (c) | Expense ratio does not reflect fees and expenses incurred indirectly by the Fund as a result of its investments in shares of other investment companies. If these fees were included in the expense ratio, the net impact to the expense ratio would be approximately 0.13% for the year ended May 31, 2013, 0.14% for the year ended May 31, 2012, 0.15% for the year ended May 31, 2011, 0.19% for the year ended May 31, 2010, and 0.16% for the year ended May 31, 2009. |
| | |
| (d) | Portfolio turnover is not annualized for periods of less than one year and does not include securities received or delivered from processing creations or redemptions. |
| | |
| (e) | Subsequent to May 31, 2012, a reclassification was required that resulted in the recharacterization of the distribution for the May 31, 2012 financial reporting period. This resulted in a less than a $0.01 reclassification between distributions paid to shareholders from net investment income and distributions paid to shareholders from capital. |
| See notes to financial statements. |
| 58 | CLAYMORE EXCHANGE-TRADED FUND TRUST 2 ANNUAL REPORT |
| FINANCIAL HIGHLIGHTS continued | May 31, 2013 |
SEA Guggenheim Shipping ETF
| | | | | | | | | | | |
| | | | | | | | | | For the Period | |
| | | | For the Year | | | For the Year | | | June 11, 2010* | |
| Per share operating performance | | | Ended | | | Ended | | | through | |
| for a share outstanding throughout the period | | | May 31, 2013 | | | May 31, 2012 | | | May 31, 2011 | |
| Net asset value, beginning of period | | $ | 16.03 | | $ | 24.69 | | $ | 25.96 | |
| Income from investment operations | | | | | | | | | | |
Net investment income (a) | | | 0.45 | | | 0.56 | | | 1.10 | |
| Net realized and unrealized gain (loss) | | | 1.49 | | | (8.26 | ) | | (1.89 | ) |
| Total from investment operations | | | 1.94 | | | (7.70 | ) | | (0.79 | ) |
| Distributions to shareholders | | | | | | | | | | |
| From and in excess of net investment income | | | (0.46 | ) | | (0.96 | ) | | (0.48 | ) |
| Net asset value, end of period | | $ | 17.51 | | $ | 16.03 | | $ | 24.69 | |
| Market value, end of period | | $ | 17.43 | | $ | 15.99 | | $ | 24.67 | |
Total return (b) | | | | | | | | | | |
| Net asset value | | | 12.44 | % | | -31.98 | % | | -3.21 | % |
| | | | | | | | | | | |
| Ratios and supplemental data | | | | | | | | | | |
| Net assets, end of period (thousands) | | $ | 35,011 | | $ | 30,452 | | $ | 12,343 | |
| Ratio of net expenses to average net assets | | | 0.65 | % | | 0.65 | % | | 0.65 | %(c) |
| Ratio of net investment income to average net assets | | | 2.76 | % | | 3.35 | % | | 4.14 | %(c) |
Portfolio turnover rate (d) | | | 42 | % | | 43 | % | | 28 | % |
| * | Commencement of investment operations. |
| | |
| (a) | Based on average shares outstanding during the period. |
| | |
| (b) | Total investment return is calculated assuming a purchase of a share at the beginning of the period and a sale on the last day of the period reported at net asset value (“NAV”). Dividends and distributions are assumed to be reinvested at NAV. Total investment return does not reflect brokerage commissions. A return calculated for a period of less than one year is not annualized. |
| | |
| (c) | Annualized. |
| | |
| (d) | Portfolio turnover is not annualized for periods of less than one year and does not include securities received or delivered from processing creations or redemptions. |
| See notes to financial statements. |
| CLAYMORE EXCHANGE-TRADED FUND TRUST 2 ANNUAL REPORT | 59 |
| FINANCIAL HIGHLIGHTS continued | May 31, 2013 |
CUT Guggenheim Timber Index ETF
| | | | | | | | | | | | | | | | | |
| | | | For the | | | For the | | | For the | | | For the | | | For the | |
| Per share operating performance | | | Year Ended | | | Year Ended | | | Year Ended | | | Year Ended | | | Year Ended | |
| for a share outstanding throughout the period | | | May 31, 2013 | | | May 31, 2012 | | | May 31, 2011 | | | May 31, 2010 | | | May 31, 2009 | |
| Net asset value, beginning of period | | $ | 15.71 | | $ | 22.39 | | $ | 17.70 | | $ | 14.53 | | $ | 22.03 | |
| Income from investment operations | | | | | | | | | | | | | | | | |
Net investment income (loss) (a) | | | 0.46 | | | 0.42 | | | 0.94 | | | 0.25 | | | 0.47 | |
| Net realized and unrealized gain (loss) | | | 6.27 | | | (6.71 | ) | | 4.34 | | | 2.97 | | | (7.56 | ) |
| Total from investment operations | | | 6.73 | | | (6.29 | ) | | 5.28 | | | 3.22 | | | (7.09 | ) |
| Distributions to shareholders | | | | | | | | | | | | | | | | |
| From net investment income | | | (0.25 | ) | | (0.39 | ) | | (0.59 | ) | | (0.05 | ) | | (0.41 | ) |
| Net asset value, end of period | | $ | 22.19 | | $ | 15.71 | | $ | 22.39 | | $ | 17.70 | | $ | 14.53 | |
| Market value, end of period | | $ | 22.10 | | $ | 15.75 | | $ | 22.38 | | $ | 17.65 | | $ | 14.69 | |
Total return* (b) | | | | | | | | | | | | | | | | |
| Net asset value | | | 43.01 | % | | -28.20 | % | | 30.15 | % | | 22.15 | % | | -31.77 | % |
| | | | | | | | | | | | | | | | | |
| Ratios and supplemental data | | | | | | | | | | | | | | | | |
| Net assets, end of period (thousands) | | $ | 223,035 | | $ | 106,054 | | $ | 228,386 | | $ | 112,541 | | $ | 45,915 | |
| Ratio of net expenses to average net assets* | | | 0.70 | % | | 0.70 | % | | 0.70 | % | | 0.70 | % | | 0.71 | % |
| Ratio of net investment income to average net assets* | | | 2.28 | % | | 2.29 | % | | 4.52 | % | | 1.46 | % | | 3.36 | % |
Portfolio turnover rate (c) | | | 2 | % | | 56 | % | | 29 | % | | 39 | % | | 58 | % |
* If certain expenses had not been waived or reimbursed by the Adviser, total return would have been lower and the ratios would have been as follows: | | | | | | | | | | | | | | | | |
| Ratio of total expenses to average net assets | | | 0.76 | % | | 0.82 | % | | 0.82 | % | | 0.86 | % | | 1.08 | % |
| Ratio of net investment income (loss) to average net assets | | | 2.22 | % | | 2.17 | % | | 4.40 | % | | 1.30 | % | | 2.99 | % |
| (a) | Based on average shares outstanding during the period. |
| | |
| (b) | Total investment return is calculated assuming a purchase of a share at the beginning of the period and a sale on the last day of the period reported at net asset value (“NAV”). Dividends and distributions are assumed to be reinvested at NAV. Total investment return does not reflect brokerage commissions. A return calculated for a period of less than one year is not annualized. |
| | |
| (c) | Portfolio turnover is not annualized for periods of less than one year and does not include securities received or delivered from processing creations or redemptions. |
| See notes to financial statements. |
| 60 | CLAYMORE EXCHANGE-TRADED FUND TRUST 2 ANNUAL REPORT |
| NOTES TO FINANCIAL STATEMENTS | May 31, 2013 |
Note 1 – Organization:
Claymore Exchange-Traded Fund Trust 2 (the “Trust”), which is registered under the Investment Company Act of 1940, as amended (the “1940 Act”), is an open-end, management investment company that was organized as a Delaware statutory trust on June 8, 2006.
The following seven portfolios have an annual reporting period ended on May 31, 2013:
Guggenheim Canadian Energy Income ETF
Guggenheim China Real Estate ETF
Guggenheim China Small Cap ETF
Guggenheim Frontier Markets ETF
Guggenheim International Multi-Asset Income ETF
Guggenheim Shipping ETF
Guggenheim Timber ETF
Each portfolio represents a separate series of the Trust (each a “Fund” or collectively the “Funds”). Each Fund’s shares are listed and traded on the NYSE Arca, Inc. (“NYSE Arca”). The Funds’ market prices may differ to some degree from the net asset value (“NAV”) of the shares of each Fund. Unlike conventional mutual funds, each Fund issues and redeems shares on a continuous basis, at NAV, only in a large specified number of shares; each called a “Creation Unit.” Creation Units are issued and redeemed principally in-kind for securities included in the relevant index. Except when aggregated in Creation Units, shares are not individually redeemable securities of the Funds. The investment objective of each of the Funds is to correspond generally to the performance, before fees and expenses, of the following market indices:
| Fund | Index |
| Guggenheim Canadian Energy Income ETF | Sustainable Canadian Energy Income Index |
| Guggenheim China Real Estate ETF | AlphaShares China Real Estate Index |
| Guggenheim China Small Cap ETF | AlphaShares China Small Cap Index |
| Guggenheim Frontier Markets ETF | BNY Mellon New Frontier DR Index |
| Guggenheim International Multi-Asset | Zacks International Multi-Asset |
| Income ETF | Income Index |
| Guggenheim Shipping ETF | Dow Jones Global Shipping Index |
| Guggenheim Timber ETF | Beacon GlobalTimber Index |
Note 2 –Accounting Policies:
The preparation of the financial statements in accordance with U.S. generally accepted accounting principles (“GAAP”) requires management to make estimates and assumptions that affect the reported amounts and disclosures in the financial statements. Actual results could differ from these estimates.
The following is a summary of the significant accounting policies followed by the Funds.
(a) Valuation of Investments
Securities listed on an exchange are valued at the last reported sale price on the principal exchange or on the principal over-the-counter market on which such securities are traded, as of the close of regular trading on the New York Stock Exchange (“NYSE”) on the day the securities are being valued or, if there are no sales, at the mean of the most recent bid and ask prices. Equity securities that are traded primarily on the NASDAQ Stock Market are valued at the NASDAQ Official Closing Price. Participation notes are valued as of the close of regular trading on the local exchange on which they are traded. Debt securities are valued at the mean of the last available bid and ask prices for such securities or, if such prices are not available, at prices for securities of comparable maturity, quality and type. If sufficient market activity is limited or does not exist, the pricing providers or broker-dealers may utilize proprietary valuation models which consider market characteristics such as benchmark yield curves, option-adjusted spreads, credit spreads, estimated default rates, coupon rates, anticipated timing of principal repayments, underlying collateral, or other unique security features in order to estimate relevant cash flows, which are then discounted to calculate a security’s fair value. Short-term securities with maturities of 60 days or less at time of purchase are valued at amortized cost, which approximates market value. Money market funds are valued at net asset value.
For those securities where quotations or prices are not available, the valuations are determined in accordance with procedures established in good faith by management and approved by the Board of Trustees of the Trust (“Board of Trustees”). A valuation committee consisting of representatives from investments, fund administration, legal and compliance is responsible for the oversight of the valuation process of the Funds and convenes monthly, or more frequently as needed. The valuation committee reviews monthly Level 3 fair valued securities methodology, price overrides, broker quoted securities, price source changes, illiquid securities, unchanged priced securities, halted securities, price challenges, fair valued securities sold and back testing trade prices in relation to prior day closing prices. On a quarterly basis, the valuations and methodologies of all Level 3 fair valued securities are presented to the Trust’s Board of Trustees.
Valuations in accordance with these procedures are intended to reflect each security’s (or asset’s) “fair value.” Fair value is defined as the price that the Fund would receive to sell an investment or pay to transfer a liability in an orderly transaction with an independent buyer in the principal market, or in the absence of a principal market, the most advantageous market for the investment or liability. Each such determination is based on a consideration of all relevant factors, which are likely to vary from one pricing context to another. Examples of such factors may include, but are not limited to: (i) the type of security, (ii) the initial cost of the security, (iii) the existence of any contractual restrictions on the security’s disposition, (iv) the price and extent of public trading in similar securities of the issuer or of comparable companies, (v) quotations or evaluated prices from broker-dealers and/or pricing services, (vi) information obtained from the issuer, analysts, and/or the appropriate stock exchange (for exchange-traded securities), (vii) an analysis of the company’s financial statements, and (viii) an evaluation of the forces that influence the issuer and the market(s) in which the security is purchased and sold (e.g. the existence of pending merger activity, public offerings or tender offers that might affect the value of the security).
| CLAYMORE EXCHANGE-TRADED FUND TRUST 2 ANNUAL REPORT | 61 |
| NOTES TO FINANCIAL STATEMENTS continued | May 31, 2013 |
There are three different categories for valuations. Level 1 valuations are those based upon quoted prices in active markets. Level 2 valuations are those based upon quoted prices in inactive markets or based upon significant observable inputs (e.g. yield curves; benchmark interest rates; indices). Level 3 valuations are those based upon unobservable inputs (e.g. discounted cash flow analysis; non-market based methods used to determine fair valuation).
The Funds value Level 1 securities using readily available market quotations in active markets. The Funds value Level 2 fixed income securities using independent pricing providers who employ matrix pricing models utilizing market prices, broker quotes and prices of securities with comparable maturities and qualities. The Funds value Level 2 equity securities using various observable market inputs as described above. The fair value estimates for the Level 3 securities were determined in accordance with the Trust’s valuation procedures.
The valuation process involved for Level 3 measurements for the Funds is completed on a daily basis and is designed to subject the Level 3 valuations to an appropriate level of oversight and review. For Level 3 securities, the Funds utilize a pricing committee (the “Pricing Committee”) which is comprised of employees of Guggenheim Funds Investment Advisors, LLC (“GFIA” or the “Investment Adviser”) or its affiliates responsible for implementing the valuation procedures established by the Funds. Investment professionals prepare preliminary valuations based on their evaluation of financial data, company specific developments, market valuations of comparable companies, market information and other factors. These preliminary valuations are reviewed by the Pricing Committee with subsequent deliberations until an appropriate price is determined for the Level 3 security.
Transfers between valuation levels, if any, are in comparison to the valuation levels at the end of the previous fiscal year, and are effective as of the beginning of the period.
The following tables represent the Funds’ investments carried on the Statement of Assets and Liabilities by caption and by level within the fair value hierarchy at May 31, 2013:
Guggenheim China Real Estate ETF
| Description | | Level 1 | | | Level 2 | | | Level 3 | | | Total | |
| (value in $000s) | | | | | | | | | | | | |
| Assets: | | | | | | | | | | | | |
| Common Stocks | | $ | 50,583 | | | $ | – | | | $ | – | | | $ | 50,583 | |
| Rights | | | – | | | | – | * | | | – | | | | – | * |
| Investments of Collateral for Securities Loaned | | | 2,178 | | | | – | | | | – | | | | 2,178 | |
| Total | | $ | 52,761 | | | $ | – | * | | $ | – | | | $ | 52,761 | |
* Market value is less than the minimum amount disclosed.
Guggenheim China Small Cap ETF
| Description | | Level 1 | | | Level 2 | | | Level 3 | | | Total | |
| (value in $000s) | | | | | | | | | | | | |
| Assets: | | | | | | | | | | | | |
| Common Stocks: | | | | | | | | | | | | |
| Basic Materials | | $ | 21,225 | | | $ | – | | | $ | – | * | | $ | 21,225 | |
| Communications | | | 14,205 | | | | – | | | | – | | | | 14,205 | |
| Consumer, Cyclical | | | 45,016 | | | | – | | | | – | * | | | 45,016 | |
| Consumer, Non-cyclical | | | 40,443 | | | | – | | | | – | | | | 40,443 | |
| Diversified | | | 1,054 | | | | – | | | | – | | | | 1,054 | |
| Energy | | | 12,421 | | | | – | | | | – | | | | 12,421 | |
| Financial | | | 38,453 | | | | – | | | | – | | | | 38,453 | |
| Industrial | | | 41,624 | | | | 278 | | | | 1,304 | | | | 43,206 | |
| Technology | | | 9,544 | | | | – | | | | – | | | | 9,544 | |
| Utilities | | | 9,514 | | | | – | | | | – | | | | 9,514 | |
| Convertible Securities | | | – | | | | 420 | | | | – | | | | 420 | |
| Investments of Collateral for Securities Loaned | | | 42,199 | | | | – | | | | – | | | | 42,199 | |
| Total | | $ | 275,698 | | | $ | 698 | | | $ | 1,304 | | | $ | 277,700 | |
*Market value is less than the minimum amount disclosed.
The transfers in and out of the valuation levels for the Fund as of the report date when compared to the valuation levels at the end of the previous fiscal year are detailed below:
| | | | $(000s) | |
| Transfers from Level 1 to Level 2: | | $ | 278 | |
| Transfers from Level 1 to Level 3: | | $ | 1,207 | |
| Transfers from Level 2 to Level 3: | | $ | 97 | |
The transfer from Level 1 to Level 2 is a result of Guangzhou Shipyard International Co. Ltd. being halted on the principal exchange on which it trades.
The transfer from Level 1 to Level 3 is a result of China Metal Recycling being halted on the principal exchange on which it trades, and negative public information on the company.
The transfers from Level 2 to Level 3 are a result of Boshiwa International Holding Ltd. and China High Precision Automation Group Ltd. being halted on the principal exchange on which each trades and negative public information on each company.
Trading in the shares of China Forestry Holdings Co., Ltd. (“China Forestry”) was halted on the Hong Kong stock exchange on January 26, 2011, pending the publication of an announcement in relation to price sensitive information. China Forestry continues to be halted. Following the release of negative news stories, the Pricing Committee met and, after reviewing the most recently available annual financial results of China Forestry and considering the extended period of time trading has been halted, valued China Forestry at $0.00 per share. If trading of China Forestry resumes on a primary exchange, the value of China Forestry could increase.
Trading in the shares of Boshiwa International Holding Ltd. (“Boshiwa”) was halted on the Hong Kong stock exchange on March 15, 2012, following the resignation of external auditors. At that time, the Pricing Committee used the movement of a correlated index to value Boshiwa. Boshiwa continues to be halted. Following the release of several negative announcements concerning Boshiwa and considering the extended period of time trading has been halted, the Pricing Committee valued Boshiwa at a discount of the last movement of a correlating index price, and
| 62 | CLAYMORE EXCHANGE-TRADED FUND TRUST 2 ANNUAL REPORT |
| NOTES TO FINANCIAL STATEMENTS continued | May 31, 2013 |
eventually moved the price to $0.00 per share. If trading of Boshiwa resumes on a primary exchange, the value of Boshiwa could increase.
Trading in the shares of China Hongxing Sports Ltd. (“China Hongxing”) was halted on the Singapore stock exchange on February 22, 2011, pending the release of an announcement in relation to the clarification of news which was price sensitive in nature. China Hongxing continues to be halted. Following the release of several negative announcements concerning China Hongxing, and considering the extended period of time China Hongxing has been halted, the Pricing Committee valued China Hongxing at $0.00 per share. If trading of China Hongxing resumes on a primary exchange, the value of China Hongxing could increase.
Trading in the shares of China High Precision Automation Group Ltd. (“China High Precision”) was halted on the Hong Kong stock exchange on August 22, 2012, pending the publication of an announcement in relation to price sensitive information. On January 31, 2013, China High Precision issued a profit warning citing a decrease in the demand and selling price of their products. Considering the lack of available information and the extended period of time China High Precision has been halted, the Pricing Committee valued China High Precision at $0.12 per share, which is a discount to the last exchange-traded price. If trading of China High Precision resumes on a primary exchange, the value of China High Precision could increase or decrease.
Trading in the shares of China Metal Recycling Holdings Ltd. (“China Metal Recycling”) was halted on the Hong Kong stock exchange on January 28, 2013, following an accusation that China Metal Recycling falsified its financial statements. Considering the lack of available information, the lack of progress toward resumption of trading and the period of time China Metal Recycling has been halted, the Pricing Committee valued China Metal Recycling at $0.91 per share, which is a discount to the last exchange-traded price. If trading of China Metal Recycling resumes on a primary exchange, the value of China High Precision could increase or decrease.
Trading in the shares of Fook Woo Group Holdings, Ltd. (“Fook Woo”) was halted on the Hong Kong stock exchange on November 28, 2011, pending the publication of interim results. Fook Woo continues to be halted. Following the release of several negative announcements concerning Fook Woo and considering the extended period of time trading has been halted, the Pricing Committee valued Fook Woo at $0.00 per share. If trading of Fook Woo resumes on a primary exchange, the value of Fook Woo could increase.
The following table presents the activity of the Fund’s investments measured at fair value using significant unobservable inputs (Level 3 valuations) for the period ended May 31, 2013.
| Level 3 Holdings | | Securities | |
| Beginning Balance at 5/31/12 | | $ | – | * |
| Net Realized Gain/Loss | | | – | |
| Change in Unrealized Gain/Loss | | | – | |
| Purchases | | | – | |
| Sales | | | – | |
| Transfers In | | | 1,304 | |
| Transfers Out | | | – | |
| Ending Balance at 5/31/13 | | $ | 1,304 | |
Guggenheim Frontier Markets ETF
| Description | | Level 1 | | | Level 2 | | | Level 3 | | | Total | |
| (value in $000s) | | | | | | | | | | | | |
| Assets: | | | | | | | | | | | | |
| Common Stocks | | $ | 97,910 | | | $ | 393 | | | $ | – | | | $ | 98,303 | |
| Preferred Stock | | | 12,032 | | | | | | | | | | | | 12,032 | |
| Exchange Traded Fund | | | 851 | | | | – | | | | – | | | | 851 | |
| Investments of Collateral for Securities Loaned | | | 28,627 | | | | – | | | | – | | | | 28,627 | |
| Total | | $ | 139,420 | | | $ | 393 | | | $ | – | | | $ | 139,813 | |
The transfers in and out of the valuation levels for the Fund as of the report date when compared to the valuation levels at the end of the previous fiscal year are detailed below:
| | | | $(000s) | |
| Transfers from Level 1 to Level 2: | | $ | 393 | |
The transfer from Level 1 to Level 2 is a result of Orascom Telecom Media and Technology Holding SAE, GDR not trading on the primary exchange on May 31, 2013.
Guggenheim Timber ETF
| Description | | Level 1 | | | Level 2 | | | Level 3 | | | Total | |
| (value in $000s) | | | | | | | | | | | | |
| Assets: | | | | | | | | | | | | |
| Common Stocks | | $ | 209,687 | | | $ | – | | | $ | – | | | $ | 209,687 | |
| Preferred Stock | | | 2,350 | | | | – | | | | – | | | | 2,350 | |
| Participation Notes | | | – | | | | 10,289 | | | | – | | | | 10,289 | |
| Investments of Collateral for Securities Loaned | | | 25,010 | | | | – | | | | – | | | | 25,010 | |
| Total | | $ | 237,047 | | | $ | 10,289 | | | $ | – | | | $ | 247,336 | |
There were no transfers between levels for Guggenheim Timber ETF for the year ended May 31, 2013.
All securities held by Guggenheim Canadian Energy Income ETF, Guggenheim International Multi-Asset Income ETF and Guggenheim Shipping ETF were valued using quoted prices in active markets (Level 1). There were no transfers between levels for these funds for the year ended May 31, 2013.
(b) Investment Transactions and Investment Income
Investment transactions are accounted for on the trade date. Realized gains and losses on investments are determined on the identified cost basis. Dividend income is recorded net of applicable withholding taxes on the ex-dividend date and interest income is recorded on an accrual basis. Discounts on debt securities purchased are accreted to interest income over the lives of the respective securities using the effective interest method. Premiums on debt securities purchased are amortized to interest income up to the next call date of the respective securities using the effective interest method.
The Funds record the character of dividends received from master limited partnerships (“MLPs”) based on estimates made at the time such distributions are received. These estimates are based upon a historical review of information available from each MLP and other industry sources.
| |
| CLAYMORE EXCHANGE-TRADED FUND TRUST 2 ANNUAL REPORT | 63 |
| NOTES TO FINANCIAL STATEMENTS continued | May 31, 2013 |
The characterization of the estimates may subsequently be revised based on information received from MLPs after their tax reporting periods conclude.
Real Estate Investment Trust (“REIT”) distributions received by the Funds are generally comprised of ordinary income, long-term and short-term capital gains and return of capital. The actual character of amounts received during the year is not known until after the fiscal year end. A Fund records the character of distributions received from REITs during the year based on historical information available. A Fund’s characterization may be subsequently revised based on information received from REITs after their tax reporting periods conclude.
(c) Currency Translation
Assets and liabilities denominated in foreign currencies are translated into U.S. dollars at the mean of the bid and asked price of respective exchange rates on the last day of the period. Purchases and sales of investments denominated in foreign currencies are translated at the mean of the bid and asked price of respective exchange rates on the date of the transaction.
The Funds do not isolate that portion of the results of operations resulting from changes in foreign exchange rates on investments from the fluctuations arising from changes in market prices of securities held. Such fluctuations are included with the net realized and unrealized gain or loss from investments.
Foreign exchange gain or loss resulting from holding of a foreign currency, expiration of a currency exchange contract, difference in exchange rates between the trade date and settlement date of an investment purchased or sold, and the difference between dividends actually received compared to the amount shown in a Fund’s accounting records on the date of receipt are included as net realized gains or losses on foreign currency transactions in the Fund’s Statement of Operations.
Foreign exchange gain or loss on assets and liabilities, other than investments, are included in unrealized appreciation (depreciation) on foreign currency translations.
(d) Distributions
The Funds intend to distribute substantially all of their net investment income to shareholders. Distribution frequency is as follows:
| Fund | Frequency |
| Guggenheim Canadian Energy Income ETF | Quarterly |
| Guggenheim China Real Estate ETF | Annually |
| Guggenheim China Small Cap ETF | Annually |
| Guggenheim Frontier Markets ETF | Annually |
| Guggenheim International Multi-Asset Income ETF | Quarterly |
| Guggenheim Shipping ETF | Quarterly |
| Guggenheim Timber ETF | Annually |
In addition, the Funds intend to distribute any capital gains to shareholders as capital gain dividends at least annually. The amount and timing of distributions are determined in accordance with federal income tax regulations, which may differ from GAAP.
(e) Securities Lending
Each Fund may lend portfolio securities to certain creditworthy borrowers, including the Funds’ securities lending agent. The loans are collateralized at all times by cash and/or high grade debt obligations in an amount at least equal to 102% of the market value of domestic securities loaned and 105% of foreign securities loaned as determined at the close of business on the preceding business day. The cash collateral received is invested with the securities lending agent in an overnight securities lending fund. The overnight securities lending fund is comprised of short-term investments valued at amortized cost, which approximates market value. Each Fund receives compensation for lending securities from interest or dividends earned on the cash, cash equivalents or U.S. government securities held as collateral, net of fee rebates paid to the borrower plus reasonable administrative and custody fees paid to the lending agent. Such compensation is accrued daily and payable to the Fund monthly. The dividend and interest income earned on the securities loaned is accounted for in the same manner as other dividend and interest income. The borrower pays to the Funds an amount equal to any dividends or interest received on loaned securities. These payments from the borrower are not eligible for reduced tax rates as “qualified dividend income” under the Jobs and Growth Tax Reconciliation Act of 2003. The Funds retain all or a portion of the interest received on investment of cash collateral or receives a fee from the borrower. Lending portfolio securities could result in a loss or delay in recovering each Fund’s securities if the borrower defaults. The securities lending income earned by the Funds is disclosed on the Statement of Operations.
Note 3 – Investment Advisory Agreement, Sub-Advisory Agreement and Other Agreements:
Pursuant to an Investment Advisory Agreement (the “Agreement”) between the Trust, on behalf of each Fund, and the Investment Adviser, the Investment Adviser manages the investment and reinvestment of each Fund’s assets and administers the affairs of each Fund to the extent requested by the Board of Trustees.
Pursuant to the Agreement, each Fund listed in the below table pays the Investment Adviser an advisory fee. The advisory fee is payable on a monthly basis at the annual rate set forth below based on each Fund’s average daily net assets:
| Fund | Rate |
| Guggenheim Canadian Energy Income ETF | 0.50% |
| Guggenheim China Real Estate ETF | 0.50% |
| Guggenheim China Small Cap ETF | 0.55% |
| Guggenheim Frontier Markets ETF | 0.50% |
| Guggenheim International Multi-Asset Income ETF | 0.50% |
| Guggenheim Timber ETF | 0.50% |
Pursuant to the Agreement, each Fund listed in the following table pays the Investment Adviser a unitary management fee for the services and facilities it provides. The unitary management fee is payable on a monthly basis at the annual rate set forth below based on each Fund’s average daily net assets:
| Fund | Rate |
| Guggenheim Shipping ETF | 0.65% |
| 64 | CLAYMORE EXCHANGE-TRADED FUND TRUST 2 ANNUAL REPORT |
| NOTES TO FINANCIAL STATEMENTS continued | May 31, 2013 |
Out of the unitary management fee, the Investment Adviser pays substantially all the expenses of each Fund, including the cost of transfer agency, custody, fund administration, legal, audit and other services, except for the fee payments under the Agreement, distribution fees, if any, brokerage expenses, taxes, interest, litigation expenses and other extraordinary expenses.
Effective May 14, 2013, the Board of Trustees approved Rydex Fund Services, LLC (“RFS”) as the Administrator of the Fund. Both RFS and GFIA are affiliates of Guggenheim Partners, LLC, a global diversified financial services firm.
| Net Assets | Rate |
| First $200,000,000 | 0.0275% |
| Next $300,000,000 | 0.0200% |
| Next $500,000,000 | 0.0150% |
| Over $1,000,000,000 | 0.0100% |
Due to its unitary management fee structure, Guggenheim Shipping ETF does not pay a separate Fund Administration fee.
For the year ended May 31, 2013, the following Funds recognized Fund Administration expenses and waived Fund Administration expenses as follows:
| | | Fund Administration | | | Fund Administration | |
| | | Expense | | | Expense Waived | |
| Guggenheim Canadian Energy Income ETF | | $ | 22,151 | | | $ | – | |
| Guggenheim China Real Estate ETF | | | 13,609 | | | | – | |
| Guggenheim China Small Cap ETF | | | 61,422 | | | | – | |
| Guggenheim Frontier Markets ETF | | | 41,422 | | | | – | |
| Guggenheim International Multi-Asset Income ETF | | | 31,932 | | | | – | |
| Guggenheim Timber ETF | | | 47,991 | | | | – | |
The Bank of New York Mellon Corp. (“BNY”) acts as the Funds’ custodian, accounting agent, transfer agent and securities lending agent. As custodian, BNY is responsible for the custody of the Funds’ assets. As accounting agent, BNY is responsible for maintaining the books and records of the Funds. As transfer agent, BNY is responsible for performing transfer agency services for the Funds. As securities lending agent, BNY is responsible for executing the lending of portfolio securities to creditworthy borrowers.
The Investment Adviser has contractually agreed to waive fees and/or pay Fund expenses to the extent necessary to prevent the operating expenses of each Fund, not including Guggenheim Shipping ETF, (excluding interest expense, a portion of the Fund’s licensing fees, offering costs, brokerage commissions and other trading expenses, taxes and extraordinary expenses such as litigation and other expenses not incurred in the ordinary course of the Fund’s business) from exceeding the following percentages of average net assets per year, at least until December 31, 2015:
| Fund | Rate |
| Guggenheim Canadian Energy Income ETF | 0.65% |
| Guggenheim China Real Estate ETF | 0.65% |
| Guggenheim China Small Cap ETF | 0.70% |
| Guggenheim Frontier Markets ETF | 0.65% |
| Guggenheim International Multi-Asset Income ETF | 0.65% |
| Guggenheim Timber ETF | 0.65% |
Amounts owed to each Fund from the Investment Adviser are shown in the Statement of Assets and Liabilities.
For the year ended May 31, 2013, the Investment Adviser waived fees and assumed the following fees and expenses:
| | | Advisory | | | | |
| | | Fees | | | Expenses | |
| | | Waived | | | Reimbursed | |
Guggenheim Canadian Energy Income ETF | | $ | 103,235 | | | $ | – | |
| Guggenheim China Real Estate ETF | | | 113,788 | | | | – | |
| Guggenheim China Small Cap ETF | | | 220,812 | | | | – | |
| Guggenheim Frontier Markets ETF | | | 78,960 | | | | – | |
Guggenheim International Multi-Asset Income ETF | | | 121,620 | | | | – | |
| Guggenheim Timber ETF | | | 113,066 | | | | – | |
Certain officers and trustees of the Trust may also be officers, directors and/or employees of the Investment Adviser. The Trust does not compensate its officers or trustees who are officers, directors and/or employees of the Investment Adviser.
Licensing Fee Agreements:
The Investment Adviser has entered into licensing agreements on behalf of each Fund with the following Licensors:
| Fund | Licensor |
| Guggenheim Canadian Energy Income ETF | Sustainable Wealth Management, Ltd. |
| Guggenheim China Real Estate ETF | AlphaShares LLC |
| Guggenheim China Small Cap ETF | AlphaShares LLC |
| Guggenheim Frontier Markets ETF | The Bank of New York Mellon Corp. |
| Guggenheim International Multi-Asset Income ETF | Zacks Investment Research, Inc. |
| Guggenheim Shipping ETF | CME Group Index Services LLC |
| Guggenheim Timber ETF | Beacon Indexes LLC |
The Funds are not sponsored, endorsed, sold or promoted by the Licensors and the Licensors make no representation regarding the advisability of investing in shares of the Funds. Up to 5 basis points of licensing fees are excluded from the expense cap for the Funds without a unitary management fee.
Note 4 – Federal Income Taxes:
The Funds intend to comply with the requirements of Subchapter M of the Internal Revenue Code of 1986, as amended, applicable to regulated investment companies. Accordingly, no provision for U.S. federal income taxes is required. In addition, by distributing substantially all of its ordinary income and long-term capital gains, if any, during each calendar year, the Funds intend not to be subject to U.S. federal excise tax.
| CLAYMORE EXCHANGE-TRADED FUND TRUST 2 ANNUAL REPORT | 65 |
| NOTES TO FINANCIAL STATEMENTS continued | May 31, 2013 |
At May 31, 2013, the cost of investments, accumulated unrealized appreciation/depreciation on investments, excluding foreign currency, for federal income tax purposes were as follows:
| | | | | | | | | | | | | | | Net Tax | |
| | | | | | | | | | | | | | | Unrealized | |
| | | | | | | | | | | | Net Tax | | | Appreciation | |
| | | Cost of | | | Gross Tax | | | Gross Tax | | | Unrealized | | | (Depreciation) | |
| | | Investments for | | | Unrealized | | | Unrealized | | | Appreciation | | | on Foreign | |
| | | Tax Purposes | | | Appreciation | | | Depreciation | | | (Depreciation) | | | Currency | |
| Guggenheim Canadian Energy Income ETF | | $ | 78,666,455 | | | $ | 1,575,558 | | | $ | (9,403,139 | ) | | $ | (7,827,581 | ) | | $ | (612 | ) |
| Guggenheim China Real Estate ETF | | | 55,546,962 | | | | 1,740,893 | | | | (4,526,832 | ) | | | (2,785,939 | ) | | | (5 | ) |
| Guggenheim China Small Cap ETF | | | 301,576,663 | | | | 23,682,552 | | | | (47,558,993 | ) | | | (23,876,441 | ) | | | (126 | ) |
| Guggenheim Frontier Markets ETF | | | 165,585,150 | | | | 4,073,234 | | | | (29,845,389 | ) | | | (25,772,155 | ) | | | – | |
| Guggenheim International Multi-Asset Income ETF | | | 129,444,665 | | | | 8,168,243 | | | | (8,552,923 | ) | | | (384,680 | ) | | | (9,767 | ) |
| Guggenheim Shipping ETF | | | 40,700,607 | | | | 3,567,192 | | | | (3,575,747 | ) | | | (8,555 | ) | | | (460 | ) |
| Guggenheim Timber ETF | | | 227,091,690 | | | | 36,763,545 | | | | (16,519,474 | ) | | | 20,244,071 | | | | (23,516 | ) |
Tax components of the following balances as of May 31, 2013 were as follows:
| | | Undistributed | | | Undistributed | |
| | | Ordinary Income | | | Long-Term Gains | |
| Guggenheim Canadian Energy Income ETF | | $ | – | | | $ | (76,585,072 | ) |
| Guggenheim China Real Estate ETF | | | 299,815 | | | | (12,934,446 | ) |
| Guggenheim China Small Cap ETF | | | 2,312,310 | | | | (47,283,088 | ) |
| Guggenheim Frontier Markets ETF | | | 3,239,344 | | | | (27,530,403 | ) |
| Guggenheim International Multi-Asset Income ETF | | | 496,529 | | | | (29,173,045 | ) |
| Guggenheim Shipping ETF | | | 366,865 | | | | (5,608,733 | ) |
| Guggenheim Timber ETF | | | 2,333,866 | | | | (40,948,669 | ) |
At May 31, 2013 the following reclassifications were made to the capital accounts of the Funds, to reflect permanent book/tax differences and income and gains available for distributions under income tax regulations, which are primarily due to the inherent differences between book and tax treatment of investment in real estate investment trusts, investments in partnerships, wash sales from redemption in-kind transactions, return of capital, and net investment losses. Net investment income, net realized gains and net assets were not affected by these changes.
| | | Undistributed Net | | | Accumulated | | | | |
| | | Investment | | | Net Realized | | | | |
| | | Income/(Loss) | | | Gain/(Loss) | | | Paid in Capital | |
| Guggenheim Canadian Energy | | | | | | | | | |
| Income ETF | | $ | (134,764 | ) | | $ | (1,542,237 | ) | | $ | 1,677,001 | |
| Guggenheim China Real | | | | | | | | | | | | |
| Estate ETF | | | 212,750 | | | | (898,306 | ) | | | 685,556 | |
| Guggenheim China Small | | | | | | | | | | | | |
| Cap ETF | | | 211,962 | | | | (7,167,463 | ) | | | 6,955,501 | |
| Guggenheim Frontier | | | | | | | | | | | | |
| Markets ETF | | | 10,669 | | | | 1,341,339 | | | | (1,352,008 | ) |
| Guggenheim International | | | | | | | | | | | | |
| Multi-Asset Income ETF | | | (76,501 | ) | | | (8,115,972 | ) | | | 8,192,473 | |
| Guggenheim Shipping ETF | | | 44,332 | | | | 928,466 | | | | (972,798 | ) |
| Guggenheim Timber ETF | | | (1,086,289 | ) | | | (4,878,362 | ) | | | 5,964,651 | |
Distributions to Shareholders:
The tax character of distributions paid during the year ended May 31, 2013 was as follows:
| | Distributions paid from Ordinary Income | |
| Guggenheim Canadian Energy Income ETF | | $ | 2,182,941 | |
| Guggenheim China Real Estate ETF | | | 1,381,280 | |
| Guggenheim China Small Cap ETF | | | 4,003,500 | |
| Guggenheim Frontier Markets ETF | | | 4,819,580 | |
| Guggenheim International Multi-Asset Income ETF | | | 5,238,200 | |
| Guggenheim Shipping ETF | | | 852,200 | |
| Guggenheim Timber ETF | | | 2,441,450 | |
| Distributions paid from Return of Capital | |
| Guggenheim Canadian Energy Income ETF | | $ | 125,469 | |
In Guggenheim International Multi-Asset Income ETF, subsequent to the May 31, 2012 reporting period, it was determined that a reclassification of $1,809 was required between return of capital and ordinary income. This resulted in a recharacterization of $1,809 between distributions paid from capital and distributions paid from ordinary income. The below numbers reflect the revised tax character of distributions paid during the year ended May 31, 2012 following this reclassification.
The tax character of distributions paid during the year ended May 31, 2012 was as follows:
| | Distributions paid from Ordinary Income | |
| Guggenheim Canadian Energy Income ETF | | $ | 4,070,916 | |
| Guggenheim China Real Estate ETF | | | 233,530 | |
| Guggenheim China Small Cap ETF | | | 4,836,000 | |
| Guggenheim Frontier Markets ETF | | | 5,553,760 | |
| Guggenheim International Multi-Asset Income ETF | | | 4,505,697 | |
| Guggenheim Shipping ETF | | | 869,900 | |
| Guggenheim Timber ETF | | | 2,496,150 | |
| | | | | |
| | | Distributions paid from Return of Capital | |
| Guggenheim Canadian Energy Income ETF | | $ | 172,854 | |
| Guggenheim International Multi-Asset Income ETF | | | 69,703 | |
| 66 | CLAYMORE EXCHANGE-TRADED FUND TRUST 2 ANNUAL REPORT |
| NOTES TO FINANCIAL STATEMENTS continued | May 31, 2013 |
At May 31, 2013, for federal income tax purposes, the Funds have capital loss carryforwards available as shown in the table below, to the extent provided by the regulations, to offset future capital gains through the years indicated. To the extent that these loss carryforwards are used to offset future capital gains, it is probable that the capital gains so offset will not be distributed to shareholders. Per the Regulated Investment Company Modernization Act of 2010, capital loss carryforwards generated in taxable years beginning after December 22, 2010 must be fully used before capital loss carryforwards generated in taxable years prior to December 22, 2010 are used; therefore, under certain circumstances, capital loss carryforwards available as of the report date may expire unused.
| | | | | | | | | | | | | | | Unlimited | | | Unlimited | | | | |
| | | Capital Loss | | | Capital Loss | | | Capital Loss | | | Capital Loss | | | Short-Term | | | Long-Term | | | | |
| Fund | | Expiring in 2016 | | | Expiring in 2017 | | | Expiring in 2018 | | | Expiring in 2019 | | | Capital Loss | | | Capital Loss | | | Total | |
| | | | | | | | | | | | | | | | | | | | | | |
| Guggenheim Canadian Energy Income ETF | | $ | – | | | $ | 3,622,034 | | | $ | 12,656,635 | | | $ | 713,500 | | | $ | 41,646,881 | | | $ | 17,946,022 | | | $ | 76,585,072 | |
| Guggenheim China Real Estate ETF | | | – | | | | – | | | | 4,375,466 | | | | 6,818,237 | | | | 457,456 | | | | 1,259,391 | | | | 12,910,550 | |
| Guggenheim China Small Cap ETF | | | – | | | | – | | | | 5,907,224 | | | | – | | | | 10,131,704 | | | | 31,244,160 | | | | 47,283,088 | |
| Guggenheim Frontier Markets ETF | | | – | | | | 241,589 | | | | 3,686,218 | | | | 364,152 | | | | 3,668,438 | | | | 11,746,232 | | | | 19,706,629 | |
| Guggenheim International Multi-Asset | | | | | | | | | | | | | | | | | | | | | | | | | | | | |
| Income ETF | | | 434,730 | | | | 2,191,498 | | | | 3,876,528 | | | | 2,491,614 | | | | 12,748,029 | | | | 5,307,998 | | | | 27,050,397 | |
| Guggenheim Shipping ETF | | | – | | | | – | | | | – | | | | – | | | | 1,641,915 | | | | 3,966,818 | | | | 5,608,733 | |
| Guggenheim Timber ETF | | | – | | | | 3,822,255 | | | | 17,944,749 | | | | 1,561,810 | | | | 12,970,069 | | | | 4,649,786 | | | | 40,948,669 | |
Capital and foreign currency losses incurred after October 31 (“post-October losses”) within the taxable year are deemed to arise on the first business day of each Fund’s next taxable year. During the year ended May 31, 2013, the following Funds incurred and will elect to defer the following current year post-October losses as though the losses were incurred on the first day of the next fiscal year.
| | | Post-October | |
| | | Capital Losses | |
| Guggenheim Canadian Energy Income ETF | | $ | – | |
| Guggenheim China Real Estate ETF | | | 23,896 | |
| Guggenheim China Small Cap ETF | | | – | |
| Guggenheim Frontier Markets ETF | | | 7,823,774 | |
| Guggenheim International Multi-Asset Income ETF | | | 2,122,648 | |
| Guggenheim Shipping ETF | | | – | |
| Guggenheim Timber ETF | | | – | |
For all open tax years and all major jurisdictions, management of the Trust has concluded that there are no significant uncertain tax positions that would require recognition in the financial statements. Uncertain tax positions are tax positions taken or expected to be taken in the course of preparing each Fund’s tax returns that would not meet a more-likely-than not threshold of being sustained by the applicable tax authority and would be recorded as a tax expense in the current year. Open tax years are those that are open for examination by taxing authorities (i.e. generally the last four tax year ends and the interim tax period since then). Furthermore, management of the Trust is also not aware of any tax positions for which it is reasonably possible that the total amounts of unrecognized tax benefits will significantly change in the next twelve months.
Note 5 – Investment Transactions:
For the year ended May 31, 2013, the cost of investments purchased and proceeds from sales of investments, excluding short-term investments and in-kind transactions, were as follows:
| | | Purchases | | | Sales | |
| Guggenheim Canadian Energy Income ETF | | $ | 130,145,460 | | | $ | 103,602,378 | |
| Guggenheim China Real Estate ETF | | | 9,560,161 | | | | 10,181,882 | |
| Guggenheim China Small Cap ETF | | | 73,424,256 | | | | 73,934,189 | |
| Guggenheim Frontier Markets ETF | | | 67,190,843 | | | | 66,646,620 | |
| Guggenheim International Multi-Asset Income ETF | | | 68,795,597 | | | | 68,728,728 | |
| Guggenheim Shipping ETF | | | 13,089,248 | | | | 12,624,930 | |
| Guggenheim Timber ETF | | | 9,392,200 | | | | 3,611,837 | |
For the year ended May 31, 2013, in-kind transactions were as follows:
| | | Purchases | | | Sales | |
| Guggenheim Canadian Energy Income ETF | | $ | – | | | $ | 55,972,215 | |
| Guggenheim China Real Estate ETF | | | 68,495,320 | | | | 42,928,325 | |
| Guggenheim China Small Cap ETF | | | 204,763,302 | | | | 174,741,764 | |
| Guggenheim Frontier Markets ETF | | | 27,826,541 | | | | 34,950,903 | |
| Guggenheim International Multi-Asset Income ETF | | | 57,375,471 | | | | 56,112,005 | |
| Guggenheim Shipping ETF | | | 5,260,925 | | | | 3,088,790 | |
| Guggenheim Timber ETF | | | 78,664,705 | | | | 21,517,162 | |
| CLAYMORE EXCHANGE-TRADED FUND TRUST 2 ANNUAL REPORT | 67 |
| NOTES TO FINANCIAL STATEMENTS continued | May 31, 2013 |
Note 6 – Capital:
Shares are issued and redeemed by the Funds only in creation unit size aggregations of 50,000 to 100,000 shares. Such transactions are only permitted on an in-kind basis, with separate cash payment, which is balancing each component to equate the transaction to the net asset value per share of the Fund on the transaction date. Transaction fees ranging from $500 to $4,000 are charged to those persons creating or redeeming creation units. An additional charge of up to four times the transaction fee may be imposed with respect to transactions effected outside of the clearing process or to the extent that cash is used in lieu of securities to purchase creation units or redeem for cash.
Note 7 – Distribution and Service Plan:
The Board of Trustees has adopted a distribution and service plan (the “Plan”) pursuant to Rule 12b-1 under the 1940 Act. Under the Plan, each Fund is authorized to pay distribution fees in connection with the sale and distribution of its shares and pay service fees in connection with the provision of ongoing services to shareholders of each Fund and the maintenance of shareholder accounts in an amount up to 0.25% of its average daily net assets each year. No 12b-1 fees are currently paid by the Funds, and there are no current plans to impose these fees. No such fee may be paid in the future without further approval by the Board of Trustees.
Note 8 – Indemnifications:
In the normal course of business, the Funds enter into contracts that contain a variety of representations, which provide general indemnifications. Each Fund’s maximum exposure under these arrangements is unknown, as this would require future claims that may be made against a Fund that have not yet occurred. However, the Funds expect the risk of loss to be remote.
Note 9 – Subsequent Events:
The Funds evaluated subsequent events through the date the financial statements were available for issue and determined there were no additional material events that would require disclosure in the Fund’s financial statements, except as noted below.
Subsequent to May 31, 2013, the Board of Trustees declared the following dividends payable on June 28, 2013, to shareholders of record on June 26, 2013. The dividend rates per share were as follows:
| | | Income | |
| Fund | | Distribution | |
| Guggenheim Canadian Energy Income ETF | | $ | 0.129 | |
| Guggenheim International Multi-Asset Income ETF | | | 0.208 | |
| Guggenheim Shipping ETF | | | 0.186 | |
Subsequent to May 31, 2013, Guggenheim Canadian Energy Income ETF changed its underlying index from Sustainable Canadian Energy Income Index to the S&P/TSX Canadian High Income Energy Index effective August 1, 2013.
Effective on or about July 31, 2013, Guggenheim Canadian Energy Income ETF will change its current policy of seeking investment results that correspond generally to the performance, before the Fund’s fees and expenses, of an equity index called the Sustainable Canadian Energy Income Index. Instead, Guggenheim Canadian Energy Income ETF will seek investment results that correspond generally to the performance, before the Fund’s fees and expenses, of an equity index called the S&P Canadian High Income Energy Index.
| 68 | CLAYMORE EXCHANGE-TRADED FUND TRUST 2 ANNUAL REPORT |
| REPORT OF INDEPENDENT REGISTERED PUBLIC ACCOUNTING FIRM | May 31, 2013 |
The Board of Trustees and Shareholders of
Claymore Exchange-Traded Fund Trust 2
We have audited the accompanying statements of assets and liabilities, including the portfolios of investments, of Guggenheim Canadian Energy Income ETF, Guggenheim China Real Estate ETF, Guggenheim China Small Cap ETF, Guggenheim Frontier Markets ETF, Guggenheim International Multi-Asset Income ETF, Guggenheim Shipping ETF, and Guggenheim Timber ETF (seven of the portfolios constituting the Claymore Exchange-Traded Fund Trust 2 (the Trust)) as of May 31, 2013, and the related statements of operations for the year then ended, the statements of changes in net assets for each of the two years in the period then ended, and the financials highlights for the periods indicated therein. These financial statements and financial highlights are the responsibility of the Trust’s management. Our responsibility is to express an opinion on these financial statements and financial highlights based on our audits.
We conducted our audits in accordance with the standards of the Public Company Accounting Oversight Board (United States). Those standards require that we plan and perform the audit to obtain reasonable assurance about whether the financial statements and financial highlights are free of material misstatement. We were not engaged to perform an audit of the Trust’s internal control over financial reporting. Our audits included consideration of internal control over financial reporting as a basis for designing audit procedures that are appropriate in the circumstances, but not for the purpose of expressing an opinion on the effectiveness of the Trust’s internal control over financial reporting. Accordingly, we express no such opinion. An audit also includes examining, on a test basis, evidence supporting the amounts and disclosures in the financial statements and financial highlights, assessing the accounting principles used and significant estimates made by management, and evaluating the overall financial statement presentation. Our procedures included confirmation of securities owned as of May 31, 2013, by correspondence with the custodian and brokers or by other appropriate auditing procedures where replies from brokers were not received. We believe that our audits provide a reasonable basis for our opinion.
In our opinion, the financial statements and financial highlights referred to above present fairly, in all material respects, the financial position of each of the respective seven portfolios constituting the Claymore Exchange-Traded Fund Trust 2 at May 31, 2013, the results of their operations for the year then ended, the changes in their net assets for each of the two years in the period then ended, and the financial highlights for the periods indicated therein, in conformity with U.S. generally accepted accounting principles.
Chicago, Illinois
July 25, 2013
| CLAYMORE EXCHANGE-TRADED FUND TRUST 2 ANNUAL REPORT | 69 |
| SUPPLEMENTAL INFORMATION (Unaudited) | May 31, 2013 |
Federal Income Tax Information
In January 2014, shareholders will be advised on IRS Form 1099 DIV or substitute 1099DIV as to the federal tax status of the distributions received by shareholders in the calendar year 2013.
The Trust’s investment income (dividend income plus short-term gains, if any) qualifies as follows:
Guggenheim Canadian Energy Income ETF intends to designate $181,299 of foreign tax withholding on foreign source income of $1,208,615.
Guggenheim China Small Cap ETF intends to designate $116,200 of foreign tax withholding on foreign source income of $3,911,557.
Guggenheim Frontier Markets ETF intends to designate $485,042 of foreign tax withholding on foreign source income of $6,156,813.
Guggenheim International Multi-Asset Income ETF intends to designate $196,881 of foreign tax withholding on foreign source income of $3,327,962
Guggenheim Shipping ETF intends to designate $28,430 of foreign tax withholding on foreign source income of $554,705.
Guggenheim Timber ETF intends to designate $81,559 of foreign tax withholding on foreign source income of $1,268,576.
The Trust’s investment income (dividend income plus short-term gain, if any) qualifies as follows:
| | Qualif ied | Dividend |
| Fund | dividend income | received deduction |
| Guggenheim Canadian Energy Income ETF | 49.51% | 0.00% |
| Guggenheim China Real Estate ETF | 0.00% | 0.00% |
| Guggenheim China Small Cap ETF | 8.79% | 0.00% |
| Guggenheim Frontier Markets ETF | 68.60% | 0.00% |
| Guggenheim International Multi-Asset Income ETF | 43.67% | 0.23% |
| Guggenheim Shipping ETF | 42.42% | 4.65% |
| Guggenheim Timber ETF | 54.16% | 31.75% |
Trustees
The Trustees of the Trust and their principal business occupations during the past five years:
| | | | | | | Number of Funds | | |
| Name, Address*, Year | | Term of Office** | | | | in the Fund | | Other Directorships Held |
| of Birth and Position(s) | | and Length | | Principal Occupations during the Past Five Years | | Complex*** | | by Trustee during the |
| held with Registrant | | of Time Served | | and Other Affiliations | | Overseen by Trustee | | Past Five Years |
| Independent Trustees: | | | | | | | | |
Randall C. Barnes Year of Birth: 1951 Trustee | | Since 2006 | | Private Investor (2001-present). Formerly, Senior Vice President and Treasurer, PepsiCo, Inc. (1993-1997), President, Pizza Hut International (1991-1993) and Senior Vice President, Strategic Planning and New Business Development of PepsiCo, Inc. (1987-1990). | | 48 | | None |
Roman Friedrich III Year of birth: 1946 Trustee | | Since 2010 | | Founder and President of Roman Friedrich & Company, a U.S. and Canadian-based business, which provides investment banking to the mining industry (1998-present). Formerly, Senior Managing Director of MLV & Co., LLC, an investment bank and institutional broker-dealer specializing in capital intensive industries such as energy, metals and mining (2010-2011). | | 44 | | Director of First Americas Gold Corp. (2012-present), Zincore Metals, Inc. (2009-present). Previously, Director of Blue Sky Uranium Corp. (formerly Windstorm Resources Inc.) (April 2011 – July 2012); Director of Aziom Gold and Silver Corp. (2011-2012), Stratagold Corp. (2003-2009); Gateway Gold Corp. (2004-2008) and GFM Resources Ltd. (2005-2010). |
Robert B. Karn III Year of Birth: 1942 Trustee | | Since 2010 | | Consultant (1998-present). Formerly, Arthur Andersen (1965-1997) and Managing Partner, Financial and Economic Consulting, St. Louis office (1987-1997). | | 44 | | Director of Peabody Energy Company (2003-present), GP Natural Resource Partners LLC (2002-present). |
Ronald A. Nyberg Year of Birth: 1953 Trustee | | Since 2006 | | Partner of Nyberg & Cassioppi, LLC, a law firm specializing in corporate law, estate planning and business transactions (2000-present). Formerly, Executive Vice President, General Counsel and Corporate Secretary of Van Kampen Investments (1982-1999). | | 50 | | None |
Ronald E. Toupin, Jr. Year of Birth: 1958 Trustee | | Since 2006 | | Portfolio Consultant (2010-present). Formerly, Vice President, Manager and Portfolio Manager of Nuveen Asset Management (1998-1999), Vice President of Nuveen Investment Advisory Corp. (1992-1999), Vice President and Manager of Nuveen Unit Investment Trusts (1991-1999), and Assistant Vice President and Portfolio Manager of Nuveen Unit Investment Trusts (1988-1999), each of John Nuveen & Co., Inc. (1982-1999). | | 47 | | Trustee, Bennett Group of Funds (2011-present). |
| 70 | CLAYMORE EXCHANGE-TRADED FUND TRUST 2 ANNUAL REPORT |
| SUPPLEMENTAL INFORMATION (Unaudited) continued | May 31, 2013 |
| Interested Trustee: | | | | | | | | |
Donald C. Cacciapaglia† Year of Birth: 1951 Trustee, Chief Executive Officer | | Since 2012 | | Senior Managing Director of Guggenheim Investments (2010-present); Chief Executive Officer of Guggenheim Funds Services, LLC (2012-present); Chief Executive Officer (2012-present) and President (2010- present), Guggenheim Funds Distributors, LLC and Guggenheim Funds Investment Advisors, LLC; Chief Executive Officer of certain funds of Guggenheim Funds Fund Complex (2012-present); President and Director of SBL Fund, Security Equity Fund, Security Income Fund, Security Large Cap Value Fund, and Security Mid Cap Growth Fund (2012-present); President, CEO and Trustee of Rydex Dynamic Funds, Rydex ETF Trust, Rydex Series Funds and Rydex Variable Trust , (2012-present). Formerly, Chairman and CEO of Channel Capital Group Inc. and Channel Capital Group LLC. (2002-2010). | | 212 | | Trustee, Rydex Dynamic Funds, Rydex ETF Trust, Rydex Series Funds and Rydex Variable Trust (2012- present); Independent Board Member, Equitrust Life Insurance Company, Guggenheim Life and Annuity Company, and Paragon Life Insurance Company of Indiana. (2011-present). |
| * | Address for all Trustees: 2455 Corporate West Drive, Lisle, IL 60532 |
| | |
| ** | This is the period for which the Trustee began serving the Trust. Each Trustee is expected to serve an indefinite term, until his successor is elected. |
| | |
| *** | As of period end. The Guggenheim Investments Fund Complex consists of U.S. registered investment companies advised or serviced by Guggenheim Funds Investment Advisors, LLC and/or Guggenheim Funds Distributors, LLC and/or affiliates of such entities. The Guggenheim Investments Fund Complex is overseen by multiple Boards of Trustees. |
| | |
| † | Mr. Donald C. Cacciapaglia is an “interested person” (as defined in section 2(a)(19) of the 1940 Act) (“Interested Trustee”) of the Trust because of his position as the President and CEO of the Investment Adviser and Distributor. |
Officers
The Officers of the Trust and their principal occupations during the past five years:
| Name, Address*, Year of Birth and | | Term of Office** and | | Principal Occupations During the Past Five Years and |
| Position(s) held with Registrant | | Length of Time Served | | Other Affiliations |
| Officers: | | | | |
Amy J. Lee Year of Birth: 1961 Chief Legal Officer | | Since 2013*** | | Managing Director, Guggenheim Investments (2012-present); Senior Vice President & Secretary, Security Investors, LLC (2010 - present); Secretary & Chief Compliance Officer, Security Distributors, Inc. (1987 - 2012); Vice President, Associate General Counsel & Assistant Secretary, Security Benefit Life Insurance Company and Security Benefit Corporation (1987- 2012); Vice President & Secretary, Rydex Series Funds, Rydex ETF Trust, Rydex Dynamic Funds, and Rydex Variable Trust (2008-present); Chief Legal Officer (2012) of certain funds in the Guggenheim Funds Complex (2012-present). |
John L. Sullivan Year of Birth: 1955 Chief Financial Officer, Chief Accounting Officer and Treasurer | | Since 2010 | | Senior Managing Director – Fund Administration, Guggenheim Investments (2010-present). Chief Financial Officer, Chief Accounting Officer and Treasurer of certain funds in the Fund Complex. Formerly, Chief Compliance Officer, Van Kampen Funds (2004-2010). |
Joanna M. Catalucci Year of Birth: 1966 Chief Compliance Officer | | Since 2012 | | Chief Compliance Officer of certain funds in the Fund Complex; and Managing Director of Compliance and Fund Board Relations, Guggenheim Investments (2012-present). Formerly, Chief Compliance Officer & Secretary, SBL Fund; Security Equity Fund; Security Income Fund; Security Large Cap Value Fund & Security Mid Cap Growth Fund; Vice President, Rydex Holdings, LLC; Vice President, Security Benefit Asset Management Holdings, LLC; and Senior Vice President & Chief Compliance Officer, Security Investors, LLC (2010-2012); Security Global Investors, LLC, Senior Vice President (2010-2011); Rydex Advisors, LLC and Rydex Advisors II, LLC,. Chief Compliance Officer and Senior Vice President (2010- 2011); Rydex Capital Partners I, LLC & Rydex Capital Partners II, LLC, Chief Compliance Officer (2006-2007); and Rydex Fund Services, LLC, Vice President (2001-2006). |
Mark E. Mathiasen Formerly, Vice President; Year of Birth: 1978 Secretary | | Since 2011 | | Director; Associate General Counsel of Guggenheim Funds Services, LLC (2012-present). Secretary of certain other funds in the Fund Complex. Formerly, Vice President, Assistant General Counsel of Guggenheim Fund Services, LLC (2007-2012). |
Stevens T. Kelly Year of Birth: 1982 Assistant Secretary | | Since 2012 | | Assistant General Counsel of Guggenheim Funds Services, LLC (2011-present). Assistant Secretary of certain other funds in the Fund Complex. Formerly, Associate at K&L Gates LLP (2008-2011), J.D., University of Wisconsin Law School (2005-2008). |
William H. Belden, III Year of Birth: 1965 Vice President | | Since 2006 | | Managing Director of Guggenheim Funds Investment Advisors, LLC (2005-present). Formerly, Vice President of Product Management at Northern Trust Global Investments (1999-2005). |
| * | Address for all Officers: 2455 Corporate West Drive, Lisle, IL 60532 |
| | |
| ** | Officers serve at the pleasure of the Board of Trustees and until his or her successor is appointed and qualified or until his or her earlier resignation or removal. |
| | |
| *** | Effective February 13, 2013. |
| CLAYMORE EXCHANGE-TRADED FUND TRUST 2 ANNUAL REPORT | 71 |
| CONSIDERATIONS REGARDING INVESTMENT ADVISORY AGREEMENTS | |
| AND INVESTMENT SUB-ADVISORY AGREEMENT CONTRACT RE-APPROVAL | May 31, 2013 |
Claymore Exchange-Traded Fund Trust (“ETF Trust 1” or a “Trust”) and Claymore Exchange-Traded Fund Trust 2 (“ETF Trust 2” or a “Trust”) each was organized as a Delaware business trust on May 24, 2006 and June 8, 2006, respectively, and is authorized to establish multiple portfolios representing separate series of the Trust (each, a “Fund” and collectively, the “Funds”). Each Trust is an open-end management investment company registered under the Investment Company Act of 1940, as amended (the “1940 Act”). Guggenheim Funds Investment Advisors, LLC (“GFIA” or the “Adviser”), an affiliate of Guggenheim Partners, LLC (“Guggenheim Partners” and referred to herein collectively with its subsidiaries and affiliates as “Guggenheim”), a diversified financial services firm, serves as each Fund’s investment adviser and provides certain administrative and other services pursuant to an investment advisory agreement between each Trust, with respect to its respective Funds, and GFIA (each, an “Investment Advisory Agreement” and together, the “Investment Advisory Agreements”). Under the terms of the Investment Advisory Agreement for ETF Trust 1, GFIA also is responsible for overseeing the activities of Guggenheim Partners Investment Management, LLC (“GPIM” or the “Sub-Adviser”), an indirect subsidiary of Guggenheim Partners, which performs portfolio management and related services for Wilshire US REIT ETF (the “Sub-Advised Fund”), pursuant to an investment sub-advisory agreement by and among ETF Trust 1 on behalf of the Sub-Advised Fund, the Adviser and GPIM (the “Sub-Advisory Agreement” and together with the Investment Advisory Agreements, the “Advisory Agreements”). Under the supervision the Boards of Trustees of ETF Trust 1 and ETF Trust 2 (together, the “Board,” and the members of the Board individually, the “Trustees”), GFIA, and with respect to the Sub-Advised Fund, GPIM, provides a continuous investment program for each Fund’s portfolio, provides investment research, makes and executes recommendations for the purchase and sale of securities and provides certain facilities and personnel for the Funds.
At meetings held in person on April 18, 2013 (the “April Meeting”) and on May 14, 2013 (the “May Meeting”), the Contracts Review Committee of the Board (the “Committee”), consisting solely of those Trustees who are not “interested persons,” as defined by the 1940 Act, of the Trusts (the “Independent Trustees”), met independently of Fund management to consider the renewal of the Advisory Agreements. As part of its review process, the Committee was represented by independent legal counsel to the Independent Trustees (“Independent Legal Counsel”). Independent Legal Counsel reviewed with the Committee various factors relevant to the consideration of advisory agreements and the legal responsibilities of the Trustees related to such consideration. The Committee took into account various materials received from the Adviser, the Sub-Adviser and Independent Legal Counsel. The Committee also considered the variety of written materials, reports and oral presentations it received (and received by the full Board) throughout the year regarding performance and operating results of each Fund.
In connection with the contract review process, Guggenheim engaged FUSE Research Network LLC (“FUSE”), an independent, third party research provider, to prepare advisory contract renewal reports for various boards of directors/trustees in the Guggenheim fund complex, designed specifically to help the boards of directors/trustees fulfill their advisory contract renewal responsibilities. The objective of the reports is to present the subject funds’ relative position regarding fees, expenses and total return performance, with peer group and universe comparisons. Guggenheim management determined to engage FUSE for this purpose in connection with other initiatives designed to improve efficiencies and implement a uniform, streamlined and enhanced 15(c) reporting process across its various product lines. Further to this end, Guggenheim management had multiple discussions with, and sought input from, Independent Legal Counsel, the Committee Chair and the Board Chair, in preparing a comprehensive presentation and delivery of information in connection with the contract review process. In addition, the Adviser, on behalf of itself and the Sub-Adviser, provided information in response to requests for certain additional information following the April Meeting.
Among other things, the Adviser and Sub-Adviser provided organizational presentations, staffing reports and biographies of those key personnel of the Adviser and Sub-Adviser providing services to the Funds to assist the Committee in assessing the nature and quality of services provided by the Adviser and Sub-Adviser, information comparing the investment performance, advisory fees and total expenses of the Funds to other funds (including such information presented in the FUSE reports as well as supplemental information prepared by management), information about the profitability of the Adviser in connection with the Advisory Agreements and information about the compliance and risk management programs of the Adviser and the Sub-Adviser.
In analyzing and discussing the data presented in the FUSE reports, the Committee took into account the challenges that exist in developing appropriate peer groups for the Funds, as exchange-traded funds (“ETFs”) and management’s view that the ETF industry is immature in terms of depth of product coverage in many asset categories. In this regard, the Committee noted management’s observation that, in many cases, an ETF may dominate a niche space, but appear rather average in comparison to a larger peer group with which it shares only a small handful of characteristics; alternatively, a very small comparison set can be used, providing a narrower view of performance and expense metrics. In light of the foregoing, the Committee assessed the data provided in the FUSE reports as well as commentary and supporting data presented by Guggenheim, including, among other things, a summary of notable distinctions between the Funds and the applicable peer group identified in the FUSE reports.
Following an analysis and discussion of the factors identified below, the Committee concluded that it was in the best interests of each Fund to recommend that the Board approve the renewal of each of the Advisory Agreements for an additional 12-month term.
Investment Advisory Agreements
Nature, Extent and Quality of Services Provided by the Adviser: With respect to the nature, extent and quality of services provided by the Adviser, the Committee reviewed information concerning the functions
| 72 | CLAYMORE EXCHANGE-TRADED FUND TRUST 2 ANNUAL REPORT |
| CONSIDERATIONS REGARDING INVESTMENT ADVISORY AGREEMENTS | |
| AND INVESTMENT SUB-ADVISORY AGREEMENT CONTRACT RE-APPROVAL continued | May 31, 2013 |
performed by the Adviser for the Funds, information describing the Adviser’s organization and the background and experience of the persons responsible for the day-to-day management of the Funds. With respect to the Sub-Advised Fund, the Committee noted that the Adviser had delegated responsibility for the investment and reinvestment of the Sub-Advised Fund’s assets to the Sub-Adviser. The Committee considered the Adviser’s responsibility to oversee the Sub-Adviser and that the Adviser has similar oversight responsibilities for other registered investment companies for which GFIA serves as investment adviser (collectively, “Guggenheim Funds”). In this connection, the Committee took into account information provided by management describing the Adviser’s processes and activities for providing oversight of the Sub-Adviser’s investment strategies and compliance with investment restrictions, as well as information regarding the Adviser’s Sub-Advisory Oversight Committee. The Committee also noted the distinctive nature of the Funds, as ETFs, each of which (with the exception of the two actively-managed ETFs) generally is constructed to track the performance of a defined index of securities, before fund fees and expenses. In this connection, the Committee considered the experience and expertise appropriate in an adviser to ETFs. The Committee also considered the Adviser’s monitoring of the ETFs participation in the securities lending program and the secondary market support services provided by the Adviser to the Funds, including the Adviser’s efforts to educate investment professionals about the Funds and other Guggenheim Funds. In addition, the Committee noted its various discussions with management concerning the experience and qualifications of the Adviser’s personnel, including those personnel providing compliance oversight. The Independent Trustees also took into account the various legal, compliance and risk management oversight and staffing initiatives undertaken by management, including, among other things, enhancements to risk management processes and restructuring of the legal and compliance departments in 2012, which management stated was designed to create a cohesive legal and compliance program with increased collaboration among compliance and legal professionals and with other departments across the Guggenheim organization. The Committee also considered management’s other initiatives intended to achieve greater enhancements and efficiencies in Guggenheim’s ability to provide services to the Guggenheim Funds (including the Funds), such as efforts to streamline and simplify the organizational structure of Guggenheim’s advisory business, as reflected by internal reorganizations of various management entities. Moreover, in connection with the Committee’s evaluation of the overall package of services provided by GFIA, the Committee considered the quality of the administrative services provided by GFIA.
Further with respect to the Adviser’s resources and its ability to carry out its responsibilities under the Investment Advisory Agreement, the Committee considered its review of financial information concerning the Adviser, as well as its discussions with the Chief Financial Officer of GFIA.
The Committee also considered the acceptability of the terms of the Investment Advisory Agreements. Based on the foregoing, and based on other information received (both oral and written) at the April Meeting and at the May Meeting, as well as other considerations, the Committee concluded that the Adviser and its personnel were qualified to serve the Funds in such capacity.
Investment Performance: The Committee noted that, in view of the distinctive investment objective of the Funds, the investment performance of the Funds (excluding the two actively-managed ETFs) in absolute terms was not of the importance that normally attaches to the performance of actively managed funds. Of more importance to the Committee was the extent to which each Fund achieved its objective to provide investment results that, before fund fees and expenses, correspond generally to the price and yield performance of securities of companies in its applicable index. In this connection, the Committee evaluated information on the correlation and tracking error between the underlying index and each Fund’s returns for the three-month, one-year, three-year and five-year periods, as applicable.
In the course of its review of correlation and tracking error data, the Committee considered management’s views and explanation of the tracking error for certain Funds, including the following:
Guggenheim BulletShares High Yield Corporate Bond ETFs: A significant source of tracking error for these Funds is attributable to the use of different pricing sources for the Funds and indices as well as different price points (mid versus bid pricing).
Guggenheim Mid-Cap Core ETF (CZA): The tracking error calculation is based on a comparison of a total return fund versus a price-only index in the FUSE report. In this regard, the Committee reviewed supplemental data provided by management regarding a price return fund comparison for the particular index, as well as several others published by the New York Stock Exchange and management’s notation that total return index values are not currently available.
Wilshire Micro-Cap ETF (WMCR): The Fund follows a strategy of holding a subset of index constituents, frequently referred to as sampling, in attempting to deliver benchmark returns due to the broad nature of the index as well as a relatively modest Fund asset size. The strategy is executed using quantitative analysis via portfolio optimization software. In general, full replication will yield smaller amounts of tracking error versus a sampling strategy as full replication seeks to hold all index constituents at similar relative weighting. The peers presented in the FUSE report pursue a full replication strategy.
Guggenheim Multi-Asset Income ETF (CVY): The Fund follows a multi-asset strategy while the peer funds are equity funds. Holdings in preferred and closed-end funds may also have an impact during rebalance periods. In addition, the Fund has used an index sampling strategy from time to time to maintain compliance with limits on investment in registered investment companies as well as avoiding issues regarding U.S. royalty trust securities, which may have an impact on qualified income minimum levels and create tax filing complications.
Guggenheim International Multi-Asset Income ETF (HGI): As with Multi-Asset Income, the Fund employed periodically an index sampling strategy in light of issues with U.S. royalty trust securities in the relevant index. Since
| CLAYMORE EXCHANGE-TRADED FUND TRUST 2 ANNUAL REPORT | 73 |
| CONSIDERATIONS REGARDING INVESTMENT ADVISORY AGREEMENTS | |
| AND INVESTMENT SUB-ADVISORY AGREEMENT CONTRACT RE-APPROVAL continued | May 31, 2013 |
a more complete replication of the Fund’s index has been sought after the resolution of tax concerns, the Fund experienced a significant decline in tracking error when comparing the recent three-month data versus historical periods.
In light of all of the foregoing, the Committee determined that the Funds had in fact tracked their indexes within an acceptable range.
Guggenheim Enhanced Core Bond ETF (GIY) and Guggenheim Enhanced Short Duration Bond ETF (GSY): For the two actively-managed ETFs, the Committee reviewed information comparing each Fund’s total return for the three-month, one-year and three-year periods ended December 31, 2012, compared to the performance of similar funds and relevant market indices, and noted that the three-month and one-year periods reflected solely the active management of the portfolios. The Committee determined that the performance was acceptable.
Comparative Fees, Costs of Services Provided and the Profits Realized by the Adviser from its Relationship with the Funds: The Committee reviewed and discussed the information provided by the Adviser on each Fund’s advisory fee and expense ratio, as compared to those of the peer group funds presented in the FUSE report. The Committee reviewed the advisory fees for each Fund and noted that the Adviser had either contractually agreed to waive a portion of the fee and/or reimburse expenses to absorb annual operating expenses of certain Funds (excluding interest expenses, a portion of each Fund’s licensing fees, brokerage commissions and other trading expenses, taxes and extraordinary expenses such as litigation and other expenses not incurred in the ordinary course of a Fund’s business) over a particular amount or, for other Funds, the Committee noted that the advisory fee was a unitary fee pursuant to which the Adviser assumes all expenses of the Fund (including the cost of transfer agency, custody, fund administration, legal, audit and other services) other than the fee payments under the respective Advisory Agreement, distribution fees, if any, brokerage expenses, taxes, interest, litigation expenses and other extraordinary expenses. The Committee noted that the advisory fees were generally within the range of the peer group of funds in the FUSE report and noted the unique nature of certain Funds, making “peer” comparisons less relevant.
In conjunction with its review of fees, the Committee also considered information provided by the Adviser on the revenues received by the Adviser under the Investment Advisory Agreements (without any deduction for sub-advisory fees paid), as well as the fees waived, for certain Funds and the estimated allocated direct and indirect costs the Adviser incurred in providing the services to the Funds.
The Committee considered other benefits available to the Adviser because of its relationship with the Funds and noted that the administrative service fees received by the Adviser from serving as administrator provide it with additional revenue for the Funds without a unitary fee structure. The Committee also noted the Adviser’s statement that it benefits from its association with the Funds by being able to offer investors a range of investment products. Based on all of the information provided, the Committee determined that the Adviser’s profitability from its relationship with the Funds was not unreasonable.
Economies of Scale to be Realized: The Committee considered the extent to which economies of scale could be realized with respect to the management of the Funds as the Funds grow and whether fee levels reflected a reasonable sharing of such economies of scale for the benefit of Fund investors. The Committee considered each Fund’s asset size, advisory fee structure, net expense ratio giving effect to any applicable expense waiver and/or reimbursement agreement or unitary fee agreement with the Adviser and whether the investment process produced economies of scale. The Committee considered the Adviser’s statement that the generally lower total expenses of ETFs provide fewer opportunities for the Adviser to achieve economies of scale beyond what is provided to shareholders through the relatively low expenses of the ETFs. The Committee was also of the view that economies of scale were being shared with the Funds subject to a unitary fee arrangement by virtue of an advisory fee, set at a relatively low level since the inception of each applicable Fund, that subsumed economies of scale in the fee itself.
Sub-Advisory Agreement
Nature, Extent and Quality of Services Provided by the Sub-Adviser: With respect to the nature, extent and quality of the services provided by the Sub-Adviser, the Committee considered the qualifications, experience, reputation and skills of the Sub-Adviser’s personnel providing portfolio management services to the Sub-Advised Fund and other key personnel. The Committee also considered the Sub-Adviser’s resources and its ability to carry out its responsibilities under the Sub-Advisory Agreement, and the Committee reviewed the financial statements of the Sub-Adviser. The Committee also noted the distinctive nature of the Sub-Advised Fund, as an ETF, which is constructed to seek investment results that correspond generally to the performance, before the Fund’s fees and expenses, of the Wilshire US Real Estate Investment Trust Index, an equity index (the “Wilshire US REIT Index”). In this connection, the Committee considered the experience and expertise appropriate in an adviser to ETFs. The Committee concluded that the Sub-Adviser had personnel qualified to provide the services under the Sub-Advisory Agreement. The Committee also considered the acceptability of the terms of the Sub-Advisory Agreement.
Investment Performance: The Committee noted that, in view of the distinctive investment objective of the Sub-Advised Fund, the investment performance of the Sub-Advised Fund in absolute terms was not of the importance that normally attaches to the performance of actively managed funds. Of more importance to the Committee was the extent to which the Sub-Advised Fund achieved its objective to provide investment results that, before fund fees and expenses, correspond generally to the price and yield performance of securities of companies in its index. In this connection, the Committee evaluated information on the correlation and tracking error between the Wilshire US REIT Index and the Sub-Advised Fund’s returns for the three-month and one-year periods ended December 31, 2012, noting the Fund’s relatively brief period of operations since its
| 74 | CLAYMORE EXCHANGE-TRADED FUND TRUST 2 ANNUAL REPORT |
| CONSIDERATIONS REGARDING INVESTMENT ADVISORY AGREEMENTS | |
| AND INVESTMENT SUB-ADVISORY AGREEMENT CONTRACT RE-APPROVAL continued | May 31, 2013 |
inception. The Committee determined that the Sub-Advised Fund had in fact tracked its index within an acceptable range.
Comparative Fees, Costs of Services Provided and the Profits Realized by the Sub-Adviser from its Relationship with the Sub-Advised Fund: The Committee considered that the Sub-Advisory Agreement is with an affiliate of the Adviser, that the Adviser compensates the Sub-Adviser from its own fees so that the sub-advisory fee rate does not impact the fees paid by the Sub-Advised Fund and that the Sub-Adviser’s revenues were included in the calculation of the Adviser’s profitability. Given its determination of the reasonableness of the advisory fee, the Committee concluded that the sub-advisory fee rate for the Sub-Advised Fund was reasonable.
Economies of Scale to be Realized: The Committee recognized that, because the Sub-Adviser’s fees would be paid by the Adviser and not the Sub-Advised Fund, the analysis of economies of scale was more appropriate in the context of the Committee’s consideration of the Investment Advisory Agreements, which was separately considered. (See “Investment Advisory Agreements – Economies of Scale to be Realized” above.)
Overall Conclusions
Based on the foregoing, the Committee determined at the May Meeting that the investment advisory fees are fair and reasonable in light of the extent and quality of the services provided and other benefits received and that the continuation of each Advisory Agreement is in the best interests of each Fund. In reaching this conclusion, no single factor was determinative. At the May Meeting, the Committee, constituting all of the Independent Trustees, recommended the renewal of each Advisory Agreement for an additional annual term. Further, at its May 14, 2013 meeting, upon recommendation of the Committee, the Board, including all of the Independent Trustees, approved the renewal of each Advisory Agreement for an additional annual term.
| CLAYMORE EXCHANGE-TRADED FUND TRUST 2 ANNUAL REPORT | 75 |
This Page Intentionally Left Blank.
This Page Intentionally Left Blank.
This Page Intentionally Left Blank.
| TRUST INFORMATION | May 31, 2013 |
| Board of Trustees | Officers | Investment Adviser | Legal Counsel |
Randall C. Barnes Donald C. Cacciapaglia* Roman Friedrich III Robert B. Karn III Ronald A. Nyberg Ronald E. Toupin, Jr. Chairman *Trustee is an “interested person” (as defined in section 2(a)(19) of the 1940 Act) (“Interested Trustee”) of the Trust because of his position as the President and CEO of the Investment Adviser and Distributor. | Donald C. Cacciapaglia Chief Executive Officer Amy J. Lee Chief Legal Officer John L. Sullivan Chief Financial Officer, Chief Accounting Officer and Treasurer Joanna M. Catalucci Chief Compliance Officer Mark E. Mathiasen Secretary Stevens T. Kelly Assistant Secretary William H. Belden III Vice President | Guggenheim Funds Investment Advisors, LLC Lisle, Illinois Distributor Guggenheim Funds Distributors, LLC Lisle, IL Administrator Rydex Fund Services, LLC Rockville, MD Accounting Agent, Custodian and Transfer Agent The Bank of New York Mellon Corp. New York, NY | Dechert LLP New York, NY Independent Registered Public Accounting Firm Ernst & Young LLP Chicago, IL |
Privacy Principles of the Trust for Shareholders
The Funds are committed to maintaining the privacy of their shareholders and to safeguarding the non-public personal information. The following information is provided to help you understand what personal information the Funds collect, how we protect that information and why, in certain cases, we may share information with select other parties.
Generally, the Funds do not receive any non-public personal information relating to their shareholders, although certain non-public personal information of their shareholders may become available to the Funds. The Funds do not disclose any non-public personal information about their shareholders or former shareholders to anyone, except as permitted by law or as is necessary in order to service shareholder accounts (for example, to a transfer agent or third party administrator).
The Funds restrict access to non-public personal information about the shareholders to Guggenheim Funds Investment Advisors, LLC employees with a legitimate business need for the information. The Funds maintain physical, electronic and procedural safeguards designed to protect the non-public personal information of their shareholders.
Questions concerning your shares of the Trust?
• If your shares are held in a Brokerage Account, contact your Broker.
This report is sent to shareholders of the Funds for their information. It is not a Prospectus, circular or representation intended for use in the purchase or sale of shares of the Funds or of any securities mentioned in this report.
A description of the Funds’ proxy voting policies and procedures related to portfolio securities is available without charge, upon request, by calling the Funds at (800) 345-7999.
Information regarding how the Funds voted proxies for portfolio securities, if applicable, during the most recent 12-month period ended June 30, is also available, without charge and upon request by calling (800) 345-7999, visiting Guggenheim Investments website at guggenheiminvestments.com or by accessing the Funds’ Form N-PX on the SEC’s website at www.sec.gov.
The Funds file their complete schedule of portfolio holdings with the SEC for the first and third quarters of each fiscal year on Form N-Q. The Funds’ Form N-Q is available on the SEC website at www.sec.gov or by visiting Guggenheim Investments website at guggenheiminvestments.com. The Funds’ Form N-Q may also be viewed and copied at the SEC’s Public Reference Room in Washington, DC; information on the operation of the Public Reference Room may be obtained by calling (800) SEC-0330.
| CLAYMORE EXCHANGE-TRADED FUND TRUST 2 ANNUAL REPORT | 79 |
Guggenheim Funds Investment Advisors, LLC
Guggenheim Funds Investment Advisors, LLC (the “Investment Adviser”) serves as the investment adviser for each of the Funds and administers the affairs of each Fund to the extent requested by the Board of Trustees. The Investment Adviser also acts as investment adviser to closed-end and open-end management investment companies. The Investment Adviser and its affiliates provide supervision, management or servicing of assets with a commitment to consistently delivering exceptional service. The Investment Adviser is a subsidiary of Guggenheim Partners, LLC, a global, diversified financial services firm with more than $160 billion in assets under supervision. Guggenheim Partners, LLC, through its affiliates, provides investment management, investment advisory, insurance, investment banking, and capital markets services. The firm is headquartered in Chicago and New York with a global network of offices throughout the United States, Europe, and Asia.
Portfolio Management
The portfolio manager who is currently responsible for the day-to-day management of each Fund’s portfolio is Saroj Kanuri, CFA. Mr. Kanuri is a Director, ETF Portfolio Management, of the Investment Adviser and Guggenheim Funds Distributors, LLC and joined Guggenheim Funds Distributors, LLC in October of 2006. Prior to joining Guggenheim, Mr. Kanuri served as an analyst at Northern Trust Corporation from 2001- 2006. Mr. Kanuri received a B.S. in Finance from the University of Illinois at Chicago.
Claymore Exchange-Traded Fund Trust 2 Overview
The Claymore Exchange-Traded Fund Trust 2 is an investment company consisting of 11 separate exchange-traded “index funds” as of May 31,2013. The investment objective of each of the funds is to replicate as closely as possible, before fees and expenses, the performance of a specified market index.
This material must be preceded or accompanied by a prospectus for the fund being offered. The prospectus contains information about the fund including a discussion of investment objectives, risks, ongoing expenses and sales charges. If a prospectus did not accompany this report, you can obtain one from your financial adviser, from our website at http://guggenheiminvestments.com or by calling (800)345-7999. Please read the prospectus carefully before investing. The Statement of Additional Information that includes additional information about the Trustees is also available, without charge, upon request via our website at http://guggenheiminvestments.com or by calling (800)345-7999. All funds are subject to market risk and shares when sold may be worth more or less than their original cost. You can lose money investing in the funds.
Guggenheim Funds Distributors, LLC
2455 Corporate West Drive
Lisle, IL 60532
Member FINRA/SIPC
(07/13)
NOT FDIC-INSURED l NOT BANK-GUARANTEED l MAY LOSE VALUE
ETF-002-AR-0513
RMB| Guggenheim Yuan Bond ETF
Fund Overview
The Guggenheim Yuan Bond ETF, NYSE Arca ticker: RMB (the “Fund”) seeks to replicate, before the Fund’s fees and expenses, the performance of the AlphaShares China Yuan Bond Index (the “Index”). The Index is a rules-based index comprised of, as of May 31, 2013, approximately 70 bonds. The securities in the Index are bonds that are eligible for investment by U.S. and other foreign investors and denominated in Chinese Yuan, whether issued by Chinese or non-Chinese issuers and traded in the secondary market, a market commonly referred to as the “Dim Sum” bond market. The Fund will not invest in securities traded in mainland China. The Index includes bonds issued by mainland Chinese entities with a minimum of Yuan 1 billion outstanding par value, as well as bonds issued by non-mainland Chinese entities (which have no minimum outstanding par value requirement). All of the bond issues or issuers must have an investment grade rating by Moody’s Investors Service (Moody’s), Standard & Poor’s Ratings Services (S&P) and/or Fitch Ratings. Bonds must have a minimum of one year maturity for inclusion in the Index. Only bonds that pay a fixed periodic coupon, that delay coupon payments until maturity, zero coupon bonds or floating rate bonds are eligible for inclusion in the Index. The interest rates of the floating rate bonds in the Index typically adjust based upon the then-current Shanghai Interbank Offered Rate on a quarterly basis. The Chinese Yuan-denominated debt securities in which the Fund invests are currently not listed on a stock exchange or a primary securities market where trading is conducted on a regular basis. The Index was created by AlphaShares, LLC and is maintained by Interactive Data Corporation.
On May 14, 2013, the Board of Trustees of the Claymore Exchange-Traded Fund Trust 2 approved the closing and subsequent liquidation of the Fund. The last day of trading of Fund shares on the NYSE Arca, Inc. was June 14, 2013.
The Fund invested at least 80% of its total assets in fixed income securities that comprise the Index. The Fund used a sampling approach in seeking to achieve its investment objective. Sampling means that Guggenheim Funds Investment Advisors, LLC (the “Investment Adviser”), J.P. Morgan Investment Management, Inc. (“JPMIM”) and JF International Management Inc. (“JFIMI,” together with JPMIM, the “Investment Sub-Advisers”) used quantitative analysis to select securities from the Index universe to obtain a representative sample of securities that resemble the Index in terms of key risk factors, performance attributes and other characteristics. These characteristics include maturity, credit quality, duration and other financial characteristics of fixed income securities.
Fund Performance
All Fund returns cited—whether based on net asset value (“NAV”) or market price—assume the reinvestment of all distributions. This report discusses the annual fiscal period ended May 31, 2013.
On a market price basis, the Fund generated a total return of 5.61%, which included an increase in market price over the period to $26.00 on May 31, 2013, from $25.16 as of May 31, 2012. On an NAV basis, the Fund generated a total return of 7.41%, which included an increase in NAV over the period to $26.02 on May 31, 2012, from $24.76 as of May 31, 2012. At the end of the
period the Fund’s shares were trading at a market price discount to NAV, which is to be expected from time to time.
For underlying index and Chinese bond market comparison purposes, the Index returned 8.12% and the Bank of China Hong Kong Offshore RMB Bond Index, which also measures the performance of the Dim Sum bond market, but includes both investment grade and below investment grade rated securities, returned 7.05% for the 12-month period ending May 31, 2013.
The Fund made the following monthly distributions per share during the period ended May 31, 2013:
| Month | Distribution per Share |
| June | $0.030 |
| July | 0.030 |
| August | 0.037 |
| September | 0.039 |
| October | 0.035 |
| November | 0.044 |
| December | 0.040 |
| January | 0.037 |
| February | 0.056 |
| March | 0.045 |
| April | 0.045 |
| May | 0.064 |
| Total | $0.502 |
All of the above distributions were characterized as ordinary income. In January 2013, the Fund made a short-term capital gain distribution of $0.05 per share.
| RMB | Guggenheim Yuan Bond ETF | | | | | | | |
| Fund Summary | | | | | | | |
| May 31, 2013 (unaudited) | | | | | | | |
| | | | | | | | |
| Fund Statistics | | | | | | | |
| Share Price | | | $ 26.00 | | | | |
| Net Asset Value | | | $ 26.02 | | | | |
| Premium/Discount to NAV | | | -0.08% | | | | |
| Net Assets ($000) | | | $ 2,602 | | | | |
| | | | | | | | |
| Total Returns | | | | | | | |
(Inception 9/22/11) | One Year | Since Inception (annualized) | | | | | |
| Guggenheim Yuan Bond ETF | | | | | | | |
| NAV | 7.41% | 4.13% | | | | | |
| Market | 5.61% | 4.07% | | | | | |
| AlphaShares China Yuan Bond Index | 8.12% | 4.83% | | | | | |
| Bank of China Hong Kong Offshore RMB Bond Index | 7.05% | 3.97% | | | | | |
| | | | | | | | |
| Performance data quoted represents past performance, which is no guarantee of future | | | |
| results, and current performance may be lower or higher than the figures shown. The | | | |
| deduction of taxes that a shareholder would pay on Fund distributions or the redemption | | | |
| of Fund shares is not reflected in the total returns. For the most recent month-end | | | | |
| performance figures, please visit guggenheiminvestments.com. The investment return and | | | |
| principal value of an investment will fluctuate with changes in market conditions and | | | | |
| other factors so that an investor's shares, when redeemed, may be worth more or less | | | |
| than their original cost. | | | | | | | |
| | | | | | | | |
| Since inception returns assume a purchase of the Fund at the initial share price of $25.00 per share for share price |
| returns or initial net asset value (NAV) of $25.00 per share for NAV returns. Returns for periods of less | | |
| than one year are not annualized. | | | | | | | |
| | | | | | | | |
| The Fund's annual operating expense ratio of 0.65% is expressed as a unitary fee and covers | | | |
| all expenses of the Fund, except for distribution fees, if any, brokerage expenses, taxes, interest, | | |
| litigation expenses and other extraordinary expenses. | | | | | |
| | | | | | | | |
| | | | | | | | |
| Portfolio Breakdown | | | % of Net Assets | | | | |
| Banks | | | 44.9% | | | | |
| Sovereign | | | 24.6% | | | | |
| Retail | | | 6.4% | | | | |
| Telecommunications | | | 6.3% | | | | |
| Oil & Gas | | | 6.2% | | | | |
| Gas | | | 6.0% | | | | |
| Real Estate | | | 3.2% | | | | |
| Total Investments | | | 97.6% | | | | |
| Other Assets in excess of Liabilities | | | 2.4% | | | | |
| Net Assets | | | 100.0% | | | | |
| | | | | | | | |
| | | | | | | | |
| Credit Quality | | | % of Total Investments | | | | |
| AA | | | 44.9% | | | | |
| A | | | 32.5% | | | | |
| BBB | | | 16.3% | | | | |
| NR | | | 6.3% | | | | |
| | | | | | | | |
| Represents Standard & Poor's rating as a percentage of total investments. Securities classified as NR | |
| are not rated. For securities not rated by Standard & Poor's Rating Group, the rating by Moody's | | |
| Investor Services, Inc. or Fitch Ratings is provided. Credit quality, as rated by Standard & Poor's, | | |
| Moody's or Fitch, is an assessment of the credit worthiness of an issuer of a security. Credit | | | |
| ratings shown are ordered from highest to lowest, are related to the underlying bonds and not | | | |
| the Fund or its value, and are subject to change. Bonds rated BBB and above are considered | | | |
| investment grade and those rated below BBB are considered non-investment grade. | | | | |
| | | | | | | | |
| Portfolio breakdown is shown as a percentage of net assets. Credit quality is shown as a percentage of total investments. Both are subject to change daily. For more current Fund information, please visit guggenheiminvestments.com. The above summaries are provided for informational purposes only, and should not be viewed as recommendations. |
| | | | | | | | |
| | | | | | | |
| | | | | | | |
| | | | | | | |
| | | | | | | |
| Distributions to Shareholders & Annualized Distribution Rate | Annualized distribution rate | | | |
| June 2012 | $ 0.030 | | 1.44% | | | |
| July 2012 | 0.030 | | 1.43% | | | |
| August 2012 | 0.037 | | 1.77% | | | |
| September 2012 | 0.039 | | 1.86% | | | |
| October 2012 | 0.035 | | 1.66% | | | |
| November 2012 | 0.044 | | 2.07% | | | |
| December 2012 | 0.040 | | 1.87% | | | |
| January 2013* | 0.087 | | 4.18% | | | |
| February 2013 | 0.056 | | 2.66% | | | |
| March 2013 | 0.045 | | 2.12% | | | |
| April 2013 | 0.045 | | 2.10% | | | |
| May 2013 | 0.064 | | 3.02% | | | |
| * Includes short-term capital gain distribution of $0.05 per share. | | | |
| | | | | | | |
| RMB | Guggenheim Yuan Bond ETF | | | | | | | | | | | | | |
| Fund Performance As of May 31, 2013 (unaudited) | | | | | | | | | | | | |
| | | | | | | | | | | | | | | |
| Performance of a $10,000 Investment | | | | | | | | |
| | | | | | | | | |
| | | | | | | | | |
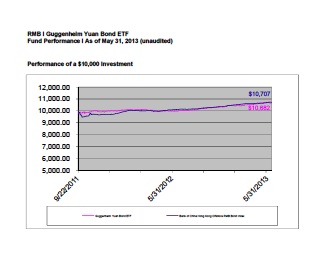 | | | | | | | | |
| This graph compares a hypothetical $10,000 investment in the Fund, made at its | | | | | | | | | |
| inception, with a similar investment in the Bank of China Hong Kong Offshore | | | | | | | | | |
| RMB Bond Index. Results include the reinvestment of all dividends and capital | | | | | | | | | |
| gains. Past performance is no guarantee of future results. The Bank of China Hong | | | | | | | | | |
| Kong Offshore RMB Bond Index tracks the total return performance of offshore | | | | | | | | | |
| RMB denominated bonds which are issued outside the Mainland of China and | | | | | | | | | |
| fulfill a set of pre-specified and transparent criteria for eligibility. Investment return | | | | | | | | | |
| and principal value will fluctuate with changes in market conditions and other | | | | | | | | | |
| factors and Fund shares, when redeemed, may be worth more or less than their | | | | | | | | | |
| original investment. | | | | | | | | | | | | | | | |
| Overview of Fund Expenses | | | | | | | | | | |
| As of May 31, 2013 (unaudited) | | | | | | | | | | |
| | | | | | | | | | | |
| As a shareholder of Guggenheim Yuan Bond ETF, you incur advisory fees and other Fund expenses. The expense example below is intended to help you understand your ongoing costs (in dollars) of investing in the Fund and to compare these costs with the ongoing costs of investing in other funds. |
| | | | | | | | | | | |
| The example is based on an investment of $1,000 invested at the beginning of the period and held for the entire six month period ended May 31, 2013. | |
| | | | | | | | | | | |
| Actual Expense | | | | | | | | | | |
| The first line of the table below provides information about actual account values and actual expenses. You may use the information in this line, together with the amount you invested, to estimate the expenses that you paid over the period. Simply divide your account value by $1,000 (for example, an $8,600 account value divided by $1,000 = 8.6), then multiply the result by the number in the first line under the heading entitled "Expenses Paid During Period" to estimate the expenses you paid on your account during this period. |
| | | | | | | | | | | |
| Hypothetical Example for Comparison Purposes | | | | | | | | | | |
| The second line of the table below provides information about hypothetical account values and hypothetical expenses based on the Fund's actual expense ratio and an assumed rate of return of 5% per year before expenses, which is not the Fund's actual return. The hypothetical account values and expenses may not be used to estimate the actual ending account balance or expenses you paid for the period. You may use this information to compare the ongoing cost of investing in the Fund and other funds. To do so, compare this 5% hypothetical example with the 5% hypothetical examples that appear in the shareholder reports of the other funds. |
| | | | | | | | | | | |
| Please note that the expenses shown in the table are meant to highlight your ongoing costs only and do not reflect any transactional costs, such as sales charges (loads) or contingent deferred sales charges. Therefore, the second line of the table is useful in comparing ongoing costs only, and will not help you determine the relative total costs of owning different funds. In addition, if these transactional costs were included, your costs would have been higher. |
| | | | | | | | | | | |
| | | | | | | | | Annualized Expense | | | | |
| | | Beginning | | | Ending | | | Ratio for the | | | Expenses Paid | |
| | | Account Value | | | Account Value | | | Six Months Ended | | | During Period1 | |
| | | | | | | | | | | | | |
| | | 12/01/12 | | | 05/31/13 | | | 05/31/13 | | | 12/01/12-05/31/13 | |
| | | | | | | | | | | | | |
| Guggenheim Yuan Bond ETF | | | | | | | | | | | | |
| Actual | | | 1,000.00 | | | | 1,039.24 | | | | 0.65 | % | | | 3.31 | |
| Hypothetical (5% annual return before expenses) | | | 1,000.00 | | | | 1,021.69 | | | | 0.65 | % | | | 3.28 | |
1 Actual and hypothetical expenses are calculated using the annualized expense ratio. This represents the ongoing expenses of the Fund as a percentage of average net assets for the six months ended May 31, 2013. Expenses are calculated by multiplying the Fund's annualized expense ratio by the average account value over the period; then multiplying that result by 182/365. |
| | | | | | | | | | | |
| Assumes all dividends and distributions were reinvested. | | | | | | | | | | |
| | | | | | | | | | | |
| Premium/Discount Information | | | | | | | | | | |
| Information about the differences between the daily market price on secondary markets for Shares and the NAV of each Fund can be found at gugggenheiminvestments.com. |
| | | | | | | | | | | |
| | | | | | | | | | | |
| RMB Guggenheim Yuan Bond ETF | | | | | |
| Portfolio of Investments | | | | | | |
| May 31, 2013 | | | | | | | |
| | | | | | | | | |
| | Principal | | | | | | Optional Call | |
| | Amount | | Description | Rating (unaudited)* | Coupon | Maturity | Provisions** | Value |
| | | | Corporate Bonds - 97.6% | | | | | |
| | | | Banks - 44.9% | | | | | |
| | CNY 500000 | | Agricultural Development Bank of China (China) | AA- | 2.980% | 06/22/2014 | N/A | $81,654 |
| | 1,000,000 | | Bank of Communications Co. Ltd., Series FXCD (China) | NR | 1.350% | 04/01/2014 | N/A | 160,418 |
| | 1,000,000 | | China Development Bank Corp. (China) | AA- | 4.200% | 01/19/2027 | N/A | 170,199 |
| | 1,000,000 | | Export-Import Bank of China (China) | AA- | 3.350% | 06/18/2017 | N/A | 165,782 |
| | 1,000,000 | | Export-Import Bank of Korea, Series EMTN (South Korea) | A+ | 3.250% | 07/27/2015 | N/A | 164,724 |
| | 500,000 | | HSBC Bank PLC, Series EMTN (United Kingdom) | AA- | 2.875% | 04/30/2015 | N/A | 82,713 |
| | 1,000,000 | | Industrial & Commercial Bank of China Asia Ltd., Series EMTN
(Hong Kong) | A- | 6.000% | 11/04/2021 | 11/05/16 @ 100 | 177,409 |
| | 1,000,000 | | Korea Development Bank (South Korea) | A | 3.300% | 06/21/2015 | N/A | 164,771 |
| | | | | | | | | 1,167,670 |
| | | | | | | | | |
| | | | Gas - 6.0% | | | | | |
| | 1,000,000 | | HKCG Finance Ltd., Series EMTN (Hong Kong) | A+ | 1.400% | 04/11/2016 | N/A | 156,572 |
| | | | | | | | | |
| | | | Oil & Gas - 6.2% | | | | | |
| | 1,000,000 | | BP Capital Markets PLC, Series EMTN (United Kingdom) | A | 1.700% | 09/15/2014 | N/A | 161,787 |
| | | | | | | | | |
| | | | Real Estate - 3.2% | | | | | |
| | 500,000 | | Global Logistic Properties Ltd., Series REGS (Singapore) | Baa2 | 3.375% | 05/11/2016 | N/A | 82,193 |
| | | | | | | | | |
| | | | Retail - 6.4% | | | | | |
| | 1,000,000 | | Lotte Shopping Business Management Hong Kong Ltd.
(Hong Kong) | Baa1 | 4.000% | 02/09/2015 | N/A | 166,082 |
| | | | | | | | | |
| | | | Sovereign - 24.6% | | | | | |
| | 1,000,000 | | China Government Bond, Series REGS (China) | AA- | 0.600% | 08/18/2014 | N/A | 160,776 |
| | 500,000 | | China Government Bond (China) | AA- | 1.800% | 12/01/2015 | N/A | 81,092 |
| | 1,500,000 | | China Government Bond, Series REGS (China) | AA- | 1.400% | 08/18/2016 | N/A | 239,401 |
| | 1,000,000 | | China Government Bond, Series REGS (China) | AA- | 1.940% | 08/18/2018 | N/A | 160,506 |
| | | | | | | | | 641,775 |
| | | | | | | | | |
| | | | Telecommunications - 6.3% | | | | | |
| | 1,000,000 | | Axiata SPV2 BHD, Series EMTN (Malaysia) | BBB- | 3.750% | 09/18/2014 | N/A | 164,687 |
| | | | | | | | | |
| | | | Total Corporate Bonds - 97.6% | | | | | |
| | | | (Cost $2,445,567) | | | | | 2,540,766 |
| | | | | | | | | |
| | | | Total Investments - 97.6% | | | | | |
| | | | (Cost $2,445,567) | | | | | 2,540,766 |
| | | | Other Assets in excess of Liabilities - 2.4% | | | | | 61,665 |
| | | | Net Assets - 100.0% | | | | | $2,602,431 |
| | | | | | | | | |
| N/A- Not Applicable | | | | | | | |
| PLC - Public Limited Company | | | | | |
| | | | | | | | | |
| * Ratings shown are per Standard & Poor's Rating Group, Moody's Investor Services, Inc. or Fitch Ratings. Securities classified as NR are not rated. (For securities not |
| rated by Standard & Poor's Rating Group, the rating by Moody's Investor Services, Inc. is provided. Likewise, for securities not rated by Standard & Poor's Rating Group |
| and Moody's Investor Services, Inc., the rating by Fitch Ratings is provided.) The ratings apply to the credit worthiness of the issuers of the | |
| underlying securities and not to the Fund or its shares. | | | | | |
| ** Date and price of the earliest optional call or put provision. There may be other call provisions at varying prices at later dates. | | |
| | | | | | | | | |
| See notes to financial statements. | | | | | |
| | | | | | | | | |
| | | | | | | | | |
| | | | | | | | | |
| | | | Country Breakdown | | % of Total Investments | | |
| | | | China | | 48.0% | | |
| | | | Hong Kong | | 19.7% | | |
| | | | South Korea | | 13.0% | | |
| | | | United Kingdom | | 9.6% | | |
| | | | Malaysia | | 6.5% | | |
| | | | Singapore | | 3.2% | | |
| | | | | | | | | |
| | | | | | | | | |
| | | | Currency Denomination | | % of Total Investments | | |
| | | | Chinese Renminbi | | 100.0% | | |
| | | | | | | | | |
| | | | Country breakdown and currency denomination are shown as a percentage of total investments. Both are subject to change daily. For more current Fund information, please visit guggenheiminvestments.com. The above summaries are provided for informational purposes only, and should not be viewed as recommendations. |
| | | | | | | | | |
| Statement of Assets and Liabilities | | | |
| May 31, 2013 | | | |
| | | | |
| | | | |
| | | Guggenheim | |
| | | Yuan Bond ETF | |
| | | (RMB) | |
| Assets | | | |
| Investments in securities, at value | | $ | 2,540,766 | |
| Cash | | | 6,141 | |
| Foreign currency, at value | | | 38,451 | |
| Receivables: | | | | |
| Interest | | | 18,511 | |
| Total assets | | | 2,603,869 | |
| | | | | |
| Liabilities | | | | |
| Accrued advisory fees | | | 1,438 | |
| Total liabilities | | | 1,438 | |
| Net Assets | | $ | 2,602,431 | |
| | | | | |
| Composition of Net Assets | | | | |
| Paid-in capital | | $ | 2,422,406 | |
| Accumulated undistributed net investment income | | | 82,191 | |
| Accumulated net realized gain on investments and currency transactions | | | 2,341 | |
| Net unrealized appreciation on investments and currency translation | | | 95,493 | |
| Net Assets | | $ | 2,602,431 | |
| | | | | |
| Shares outstanding ($0.01 par value with unlimited amount authorized) | | | 100,000 | |
| Net Asset Value Per Share | | $ | 26.02 | |
| | | | | |
| Investments in securities, at cost | | $ | 2,445,567 | |
| Foreign currency, at cost | | $ | 38,260 | |
| | | | | |
| | | | | |
| See notes to financial statements. | | | | |
| Statement of Operations | | | |
| For the year ended May 31, 2013 | | | |
| | | | |
| | | | |
| | | Guggenheim | |
| | | Yuan Bond ETF | |
| | | (RMB) | |
| | | | |
| Investment Income | | | |
| Interest | | $ | 115,289 | |
| Total income | | | 115,289 | |
| | | | | |
| Expenses | | | | |
| Advisory fee <Note 3> | | | 28,594 | |
| Net expenses | | | 28,594 | |
| Net Investment Income | | | 86,695 | |
| | | | | |
| Realized and Unrealized Gain | | | | |
| Net realized gain on | | | | |
| Investments | | | 101,049 | |
| Foreign currency transactions | | | 1,820 | |
| Net realized gain | | | 102,869 | |
| Net change in unrealized appreciation on | | | | |
| Investments | | | 123,538 | |
| Foreign currency translation | | | 823 | |
| Net unrealized appreciation | | | 124,361 | |
| Net realized and unrealized gain | | | 227,230 | |
| | | | | |
| Net Increase in Net Assets Resulting from Operations | | $ | 313,925 | |
| | | | | |
| | | | | |
| | | | | |
| See notes to financial statements. | | | | |
| Statement of Changes in Net Assets | | | | |
| | | | | |
| | | | | |
| | Guggenheim Yuan Bond ETF (RMB) | |
| | | | | |
| | For the Year | | For the Period | |
| | Ended | | Ended1 | |
| | May 31, 2013 | | May 31, 2012 | |
| | | | | |
| Increase (Decrease) in Net Assets Resulting from Operations | | | | |
| Net investment income | $ | 86,695 | | $ | 39,816 | |
| Net realized gain | | 102,869 | | | (25,169 | ) |
| Net unrealized appreciation | | 124,361 | | | (28,868 | ) |
| Net increase in net assets resulting from operations | | 313,925 | | | (14,221 | ) |
| | | | | | | |
| Distribution to Shareholders | | | | | | |
| From and in excess of net investment income | | (86,700 | ) | | (22,979 | ) |
| From realized gain | | (10,000 | ) | | - | |
| Return of capital | | - | | | (9,821 | ) |
| Total distributions | | (96,700 | ) | | (32,800 | ) |
| | | | | | | |
| Capital Share Transactions | | | | | | |
| Proceeds from sale of shares | | - | | | 5,000,000 | |
| Cost of shares redeemed | | (2,567,773 | ) | | - | |
| Net increase (decrease) from capital share transactions | | (2,567,773 | ) | | 5,000,000 | |
| Total increase (decrease) in net assets | | (2,350,548 | ) | | 4,952,979 | |
| | | | | | | |
| Net Assets | | | | | | |
| Beginning of period | | 4,952,979 | | | - | |
| | | | | | | |
| End of period | $ | 2,602,431 | | $ | 4,952,979 | |
| | | | | | | |
| Accumulated undistributed net investment income at end of period | $ | 82,191 | | $ | 1,579 | |
| | | | | | | |
| Changes in Shares Outstanding | | | | | | |
| Shares sold | | - | | | 200,000 | |
| Shares redeemed | | (100,000 | ) | | - | |
| Shares outstanding, beginning of period | | 200,000 | | | - | |
| Shares outstanding, end of period | | 100,000 | | | 200,000 | |
| | | | | | | |
| | | | | | | |
1 Commencement of investment operations - September 22, 2011 | | | | | | |
| | | | | | | |
| See notes to financial statements. | | | | | | |
| Financial Highlights | | | | | | |
| RMB | Guggenheim Yuan Bond ETF | | | | | | |
| | | | | | | For the Period | | |
| | | | For the | | | September 22, 2011* | | |
| | | | Year Ended | | | through | | |
| | | | May 31, 2013 | | | May 31, 2012 | | |
| | | | | | | | | |
| Per share operating performance | | | | | | |
| for a share outstanding throughout the period | | | | | | |
| Net asset value, beginning of period | $ | 24.76 | | | $ | 25.00 | | |
| Income from investment operations | | | | | | | | |
| | | Net investment income (a) | | 0.50 | | | | 0.20 | | |
| | | Net realized and unrealized gain/(loss) | | 1.31 | | | | (0.28 | ) | |
| | | Total from investment operations | | 1.81 | | | | (0.08 | ) | |
| Distributions to shareholders | | | | | | | | |
| | | From net investment income | | (0.50 | ) | | | (0.10 | ) | |
| | | From realized gains | | (0.05 | ) | | | - | | |
| | | Return of capital | | - | | | | (0.06 | ) | |
| | | Total distributions to shareholders | | (0.55 | ) | | | (0.16 | ) | |
| | | | | | | | | | | |
| Net asset value, end of period | $ | 26.02 | | | $ | 24.76 | | |
| Market value, end of period | $ | 26.00 | | | $ | 25.16 | | |
| | | | | | | | | | | |
Total return (b) | | | | | | | | |
| | | Net asset value | | 7.41 | % | | | -0.31 | % | |
| | | | | | | | | | | |
| Ratios and supplemental data | | | | | | | | |
| Net assets, end of period (thousands) | $ | 2,602 | | | $ | 4,953 | | |
| Ratio of net expenses to average net assets | | 0.65 | % | | | 0.65 | % (c) | |
| Ratio of net investment income to average net assets | | 1.97 | % | | | 1.15 | % (c) | |
Portfolio turnover rate (d) | | 52 | % | | | 54 | % | |
| | | | | | | | | | | |
| | | | | | | | | | | |
| | * | | Commencement of investment operations. | | | | | | | | |
| (a) | | Based on average shares outstanding during the period. | | | | | | | | |
| (b) | | Total investment return is calculated assuming a purchase of a share at the beginning of | | | | | | | | |
| | | | the period and a sale on the last day of the period reported at net asset value ("NAV"). Dividends | | | | | | |
| | | | and distributions are assumed to be reinvested at NAV. Total investment return does not reflect | | | | | | |
| | | | brokerage commissions. A return calculated for a period of less than one year is not annualized. | | | | | | |
| (c) | | Annualized. | | | | | | | | |
| (d) | | Portfolio turnover is not annualized for periods of less than one year and does not include securities | | | | | | |
| | | | received or delivered from processing creations or redemptions. | | | | | | | | |
| | | | | | | | | | | | |
| | | | See notes to financial statements. | | | | | | | | |
Claymore Exchange-Traded Fund Trust 2
Notes to Financial Statements
Note 1 – Organization:
Claymore Exchange-Traded Fund Trust 2 (the “Trust”), which is registered under the Investment Company Act of 1940, as amended (the “1940 Act”), is an open-end, management investment company that was organized as a Delaware statutory trust on June 8, 2006. At a meeting on May 14, 2013, the Board of Trustees approved the termination of the Guggenheim Yuan Bond ETF (the “Fund”). The Fund will cease operations with liquidation proceeds distributed to shareholders of record as of June 14, 2013. The Fund has an annual reporting period ended on May 31, 2013 and liquidated June 20, 2013. The Fund ceased trading on the NYSE Arca on June 14, 2013. All shareholders remaining on June 14, 2013 received a liquidation distribution of $25.91 per share on June 20, 2013.
The Fund is a separate series of the Trust. The Fund’s shares are listed and traded on the NYSE Arca, Inc. (“NYSE Arca”). The Fund’s market prices may differ to some degree from the net asset value (“NAV”) of the shares of the Fund. Unlike conventional mutual funds, the Fund issues and redeems shares on a continuous basis, at NAV, only in a large specified number of shares; each called a “Creation Unit.” Creation Units are issued and redeemed principally in-kind for securities included in the relevant index. Except when aggregated in Creation Units, shares are not individually redeemable securities of the Fund. The investment objective of the Fund is to correspond generally to the performance, before fees and expenses, of the following market index:
| Fund | Index |
| Guggenheim Yuan Bond ETF | AlphaShares China Yuan Bond Index |
Note 2 –Accounting Policies:
The preparation of the financial statements in accordance with U.S. generally accepted accounting principles (“GAAP”) requires management to make estimates and assumptions that affect the reported amounts and disclosures in the financial statements. Actual results could differ from these estimates.
The following is a summary of the significant accounting policies followed by the Funds.
(a) Valuation of Investments
Securities listed on an exchange are valued at the last reported sale price on the principal exchange or on the principal over-the-counter market on which such securities are traded, as of the close of regular trading on the New York Stock Exchange (“NYSE”) on the day the securities are being valued or, if there are no sales, at the mean of the most recent bid and ask prices. Equity securities that are traded primarily on the NASDAQ Stock Market are valued at the NASDAQ Official Closing Price. Debt securities are valued at the mean of the last available bid and ask prices for such securities or, if such prices are not available, at prices for securities of comparable maturity, quality and type. If sufficient market activity is limited or does not exist, the pricing providers or broker-dealers may utilize proprietary valuation models which consider market characteristics such as benchmark yield curves, option-adjusted spreads, credit spreads, estimated default rates, coupon rates, anticipated timing of principal repayments, underlying collateral, or other unique security features in order to estimate relevant cash flows, which are then discounted to calculate a security’s fair value. Short-term securities with maturities of 60 days or less at time of purchase are valued at amortized cost, which approximates market value. Money market funds are valued at net asset value.
For those securities where quotations or prices are not available, the valuations are determined in accordance with procedures established in good faith by management and approved by the Board of Trustees of the Trust (“Board of Trustees”). A valuation committee consisting of representatives from investment management team, fund administration, legal and compliance is responsible for the oversight of the valuation process of the Funds and convenes monthly, or more frequently as needed. The valuation committee reviews monthly Level 3 fair valued securities methodology, price overrides, broker quoted securities, price source changes, illiquid
securities, unchanged priced securities, halted securities, price challenges, fair valued securities sold and back testing trade prices in relation to prior day closing prices. On a quarterly basis, the valuations and methodologies of all Level 3 fair valued securities are presented to the Trust’s Board of Trustees.
Valuations in accordance with these procedures are intended to reflect each security’s (or asset’s) “fair value.” Fair value is defined as the price that the Fund would receive to sell an investment or pay to transfer a liability in an orderly transaction with an independent buyer in the principal market, or in the absence of a principal market, the most advantageous market for the investment or liability. Each such determination is based on a consideration of all relevant factors, which are likely to vary from one pricing context to another. Examples of such factors may include, but are not limited to: (i) the type of security, (ii) the initial cost of the security, (iii) the existence of any contractual restrictions on the security’s disposition, (iv) the price and extent of public trading in similar securities of the issuer or of comparable companies, (v) quotations or evaluated prices from broker-dealers and/or pricing services, (vi) information obtained from the issuer, analysts, and/or the appropriate stock exchange (for exchange-traded securities), (vii) an analysis of the company’s financial statements, and (viii) an evaluation of the forces that influence the issuer and the market(s) in which the security is purchased and sold (e.g. the existence of pending merger activity, public offerings or tender offers that might affect the value of the security).
There are three different categories for valuations. Level 1 valuations are those based upon quoted prices in active markets. Level 2 valuations are those based upon quoted prices in inactive markets or based upon significant observable inputs (e.g. yield curves; benchmark interest rates; indices). Level 3 valuations are those based upon unobservable inputs (e.g. discounted cash flow analysis; non-market based methods used to determine fair valuation).
The Fund values Level 1 securities using readily available market quotations in active markets. The Fund values Level 2 fixed income securities using independent pricing providers who employ matrix pricing models utilizing market prices, broker quotes and prices of securities with comparable maturities and qualities. The Fund values Level 2 equity securities using various observable market inputs as described above. The Fund did not have any Level 3 securities during the period ended May 31, 2013.
The valuation process involved for Level 3 measurements for the Fund is completed on a daily basis and is designed to subject the Level 3 valuations to an appropriate level of oversight and review. For Level 3 securities, the Fund utilizes a pricing committee (the “Pricing Committee”) which is comprised of employees of the Investment Adviser or its affiliates responsible for implementing the valuation procedures established by the Fund. Investment professionals prepare preliminary valuations based on their evaluation of financial data, company specific developments, market valuations of comparable companies, market information and other factors. These preliminary valuations are reviewed by the Pricing Committee with subsequent deliberations until an appropriate price is determined for the Level 3 security.
Transfers between valuation levels, if any, are in comparison to the valuation levels at the end of the previous fiscal year, and are effective as of the beginning of the period.
The following tables represent the Fund’s investments carried on the Statement of Assets and Liabilities by caption and by level within the fair value hierarchy at May 31, 2013:
| Guggenheim Yuan Bond ETF | | | | | | | | |
| Description | | Level 1 | | Level 2 | | Level 3 | | Total |
| (value in $000s) | | | | | | | | |
| Assets: | | | | | | | | |
| Corporate Bonds | | $ - | | $2,541 | | $ - | | $2,541 |
| Total | | $ - | | $2,541 | | $ - | | $2,541 |
There were no transfers between Levels for the period ended May 31, 2013.
(b) Investment Transactions and Investment Income
Investment transactions are accounted for on the trade date. Realized gains and losses on investments are determined on the identified cost basis. Dividend income is recorded net of applicable withholding taxes on the ex-dividend date and interest income is recorded on an accrual basis. Discounts on debt securities purchased are accreted to interest income over the lives of the respective securities using the effective interest method. Premiums on debt securities purchased are amortized to interest income up to the next call date of the respective securities using the effective interest method.
(c) Currency Translation
Assets and liabilities denominated in foreign currencies are translated into U.S. dollars at the mean of the bid and asked price of respective exchange rates on the last day of the period. Purchases and sales of investments denominated in foreign currencies are translated at the mean of the bid and asked price of respective exchange rates on the date of the transaction.
The Fund does not isolate that portion of the results of operations resulting from changes in foreign exchange rates on investments from the fluctuations arising from changes in market prices of securities held. Such fluctuations are included with the net realized and unrealized gain or loss from investments.
Foreign exchange gain or loss resulting from holding of a foreign currency, expiration of a currency exchange contract, difference in exchange rates between the trade date and settlement date of an investment purchased or sold, and the difference between dividends actually received compared to the amount shown in the Fund’s accounting records on the date of receipt are included as net realized gains or losses on foreign currency transactions in the Fund’s Statement of Operations.
Foreign exchange gain or loss on assets and liabilities, other than investments, are included in unrealized appreciation (depreciation) on foreign currency translations.
(d) Distributions
The Fund intends to distribute substantially all of its net investment income to shareholders through monthly distributions. In addition, the Fund intends to distribute any capital gains to shareholders as capital gain dividends at least annually. The amount and timing of distributions are determined in accordance with federal income tax regulations, which may differ from GAAP.
(e) Recent Accounting Pronouncement
In April 2013, the Financial Accounting Standards Board (“FASB”) issued Accounting Standards Update No. 2013-07, Presentation of Financial Statements (Topic 205): Liquidation Basis of Accounting ("ASU 2013-07"). In addition to providing clarification on the application of the liquidation basis of accounting, ASU 2013-07 also excludes investment companies that are regulated under the Investment Company Act of 1940 from being subject to the liquidation basis of accounting. ASU 2013-07 is effective for annual reporting periods beginning after December 15, 2013, and early adoption is permitted. The Fund has early adopted ASU 2013-07, and, as a result, the Fund has not presented its financial statements on the liquidation basis of accounting.
Note 3 – Investment Advisory Agreement, Sub-Advisory Agreement and Other Agreements:
Pursuant to an Investment Advisory Agreement (the “Agreement”) between the Trust, on behalf of the Fund, and Guggenheim Funds Investment Advisors, LLC (the “Investment Adviser”), the Investment Adviser manages the investment and reinvestment of the Fund’s assets and administers the affairs of the Fund to the extent requested by the Board of Trustees.
Pursuant to the Agreement, the Fund pays the Investment Adviser a unitary management fee for the services and facilities it provides. The unitary management fee is payable on a monthly basis at the annual rate of 0.65% based on the Fund’s average daily net assets.
Out of the unitary management fee, the Investment Adviser pays substantially all the expenses of the Fund, including the cost of transfer agency, custody, fund administration, legal, audit and other services, except for the fee payments under the Agreement, distribution fees, if any, brokerage expenses, taxes, interest, litigation expenses and other extraordinary expenses.
The Bank of New York Mellon Corp. (“BNY”) acts as the Fund’s custodian, accounting agent and transfer agent. As custodian, BNY is responsible for the custody of the Fund’s assets. As accounting agent, BNY is responsible for maintaining the books and records of the Fund. As transfer agent, BNY is responsible for performing transfer agency services for the Fund.
J.P. Morgan Investment Management, Inc. (“JPMIM”) and JF International Management Inc. (“JFIMI”), and with JPMIM, (the “Investment Sub-Advisers”) act as the sub-advisers for the Fund, pursuant to the sub-advisory agreement with the Investment Adviser. In this capacity, the Investment Sub-Advisers supervise and manage the investment portfolio for the Fund, and direct the purchases and sales of the Fund’s investment securities.
Certain officers and trustees of the Fund may also be officers, directors and/or employees of the Investment Adviser. The Fund does not compensate its officers or trustees who are officers, directors and/or employees of the Investment Adviser.
Licensing Fee Agreements:
The Investment Adviser has entered into licensing agreements on behalf of the Fund with AlphaShares LLC (the “Licensor”). The Fund is not sponsored, endorsed, sold or promoted by the Licensor and the Licensor makes no representation regarding the advisability of investing in shares of the Fund.
Note 4 – Federal Income Taxes:
The Fund intends to comply with the requirements of Subchapter M of the Internal Revenue Code of 1986, as amended, applicable to regulated investment companies. Accordingly, no provision for U.S. federal income taxes is required. In addition, by distributing substantially all of its ordinary income and long-term capital gains, if any, during each calendar year, the Fund intends not to be subject to U.S. federal excise tax.
At May 31, 2013, the cost of investments, and accumulated unrealized appreciation/depreciation on investments, excluding foreign currency, for federal income tax purposes were as follows:
| Cost of Investments for Tax Purposes | Gross Tax Unrealized Appreciation | Gross Tax Unrealized Depreciation | Net Tax Unrealized Appreciation (Depreciation) | Net Tax Unrealized Appreciation (Depreciation) on Foreign Currency |
| Guggenheim Yuan Bond ETF | $2,445,567 | $95,199 | - | $95,199 | $294 |
Tax components of the following balances as of May 31, 2013 were as follows:
| | Undistributed Ordinary Income/(Accumulated Ordinary Loss) | Undistributed Long-Term Gains/(Accumulated Capital & Other Loss) |
| Guggenheim Yuan Bond ETF | $82,191 | $2,341 |
At May 31, 2013 the following reclassifications were made to the capital accounts of the Fund, to reflect permanent book/tax differences and income and gains available for distributions under income tax regulations, which are primarily due to the inherent differences between book and tax treatment of foreign currency and return of capital. Net investment income, net realized gains and net assets were not affected by these changes.
| | Undistributed Net Investment Income/(Loss) | Accumulated Net Realized Gain/(Loss) | Paid in Capital |
| Guggenheim Yuan Bond ETF | $80,617 | $(82,196) | $1,579 |
Distributions to Shareholders:
The tax character of distributions paid during the year ended May 31, 2013 was as follows:
| | Distributions paid from Ordinary Income |
| Guggenheim Yuan Bond ETF | $91,008 |
| | Distributions paid from Capital Gains |
| Guggenheim Yuan Bond ETF | $5,692 |
Subsequent to the May 31, 2012 reporting period, it was determined that a reclassification of $1,579 was required between return of capital and ordinary income. This resulted in a recharacterization of $1,579 between distributions paid from capital and distributions paid from ordinary income. The below numbers reflect the revised tax character of distributions paid during the year ended May 31, 2012 following this reclassification.
| | Distributions paid from Ordinary Income |
| Guggenheim Yuan Bond ETF | $22,979 |
| | Distributions paid from Return of Capital |
| Guggenheim Yuan Bond ETF | $9,821 |
At May 31, 2013, for federal income tax purposes, the Fund did not have capital loss carryforwards.
Capital and foreign currency losses incurred after October 31 (“post-October losses”) within the taxable year are deemed to arise on the first business day of each Fund’s next taxable year. During the year ended May 31, 2013, the Fund did not have any current year post-October losses.
For all open tax years and all major jurisdictions, management of the Fund has concluded that there are no significant uncertain tax positions that would require recognition in the financial statements. Uncertain tax positions are tax positions taken or expected to be taken in the course of preparing the Fund’s tax returns that would not meet a more-likely-than not threshold of being sustained by the applicable tax authority and would be recorded as a tax expense in the current year. Open tax years are those that are open for examination by taxing authorities (i.e. generally the last four tax year ends and the interim tax period since then). Furthermore, management of the Fund is also not aware of any tax positions for which it is reasonably possible that the total amounts of unrecognized tax benefits will significantly change in the next twelve months.
Note 5 - Investment Transactions:
For the year ended May 31, 2013, the cost of investments purchased and proceeds from sales of investments, excluding short-term investments and in-kind transactions, were as follows:
| | Purchases | Sales |
| Guggenheim Yuan Bond ETF | $2,237,637 | $4,829,387 |
Note 6 – Capital:
Shares are issued and redeemed by the Fund only in creation unit size aggregations of 50,000 shares. Such transactions are only permitted on an in-kind basis, with separate cash payment, which is balancing each component to equate the transaction to the net asset value per share of the Fund on the transaction date. Transaction fees of $500 are charged to those persons creating or redeeming creation units. A variable charge in addition to the transaction fee may be imposed with respect to transactions effected outside of the clearing process or to the extent that cash is used in lieu of securities to purchase creation units or redeem for cash.
Note 7 – Distribution and Service Plan:
The Board of Trustees has adopted a distribution and service plan (the “Plan”) pursuant to Rule 12b-1 under the 1940 Act. Under the Plan, the Fund is authorized to pay distribution fees in connection with the sale and distribution of its shares and pay service fees in connection with the provision of ongoing services to shareholders of the Fund and the maintenance of shareholder accounts in an amount up to 0.25% of its average daily net assets each year. No 12b-1 fees are currently paid by the Funds, and there are no current plans to impose these fees. No such fee may be paid in the future without further approval by the Board of Trustees.
Note 8 – Indemnifications:
In the normal course of business, the Fund enters into contracts that contain a variety of representations, which provide general indemnifications. The Fund’s maximum exposure under these arrangements is unknown, as this would require future claims that may be made against the Fund that have not yet occurred. However, the Fund expects the risk of loss to be remote.
Note 9 – Subsequent Events:
The Fund evaluated subsequent events through the date the financial statements were available for issue and determined there were no additional material events that would require disclosure in the Fund’s financial statements.
Supplemental Information | (Unaudited)
Federal Income Tax Information
In January 2014, shareholders will be advised on IRS Form 1099 DIV or substitute 1099DIV as to the federal tax status of the distributions received by shareholders in the calendar year 2013.
Trustees
The Trustees of the Trust and their principal business occupations during the past five years:
| Name, Address*, Year of Birth and Position(s) held with Registrant | Term of Office** and Length of Time Served | Principal Occupations during the Past Five Years and Other Affiliations | Number of Funds in the Fund Complex*** Overseen by Trustee | Other Directorships Held by Trustee during the Past Five Years |
| Independent Trustees: | | | | |
Randall C. Barnes Year of Birth: 1951 Trustee | Since 2006 | Private Investor (2001-present). Formerly, Senior Vice President and
Treasurer, PepsiCo, Inc. (1993-1997), President, Pizza Hut International
(1991-1993) and Senior Vice President, Strategic Planning and New
Business Development of PepsiCo, Inc. (1987-1990). | 48 | None |
Roman Friedrich III Year of birth: 1946 Trustee | Since 2010 | Founder and President of Roman Friedrich & Company, a U.S. and Canadian-based business, which provides investment banking to the mining industry (1998-present). Formerly, Senior Managing Director of MLV & Co., LLC, an investment bank and institutional broker-dealer specializing in capital intensive industries such as energy, metals and mining (2010-2011). | 44 | Director of First Americas Gold Corp. (2012-present), Zincore Metals, Inc. (2009-present). Previously, Director of Blue Sky Uranium Corp. (formerly Windstorm Resources Inc.) (April 2011 – July 2012); Director of Aziom Gold and Silver Corp. (2011-2012), Stratagold Corp. (2003-2009); Gateway Gold Corp. (2004-2008) and GFM Resources Ltd. (2005-2010). |
Robert B. Karn III Year of Birth: 1942 Trustee | Since 2010 | Consultant (1998-present). Formerly, Managing Partner, Financial and Economic Consulting, St. Louis office of Arthur Andersen (1977-1997) | 44 | Director of Peabody Energy Company (2003-present), GP Natural Resource Partners LLC (2002-present). |
| Name, Address*, Year of Birth and Position(s) held with Registrant | Term of Office** and Length of Time Served | Principal Occupations during the Past Five Years and Other Affiliations | Number of Funds in the Fund Complex*** Overseen by Trustee | Other Directorships Held by Trustee during the Past Five Years |
Ronald A. Nyberg Year of Birth: 1953 Trustee | Since 2006 | Partner of Nyberg & Cassioppi, LLC, a law firm specializing in
corporate law, estate planning and business transactions (2000-
present). Formerly, Executive Vice President, General Counsel and
Corporate Secretary of Van Kampen Investments (1982-1999). | 50 | None. |
Ronald E. Toupin, Jr. Year of Birth: 1958 Trustee | Since 2006 | Portfolio Consultant (2010-present). Formerly, Vice President,
Manager and Portfolio Manager of Nuveen Asset Management
(1998-1999), Vice President of Nuveen Investment Advisory Corp. (1992-1999), Vice President and Manager of Nuveen Unit Investment
Trusts (1991-1999), and Assistant Vice President and Portfolio
Manager of Nuveen Unit Investment Trusts (1988-1999), each of
John Nuveen & Co., Inc. (1982-1999). | 47 | Trustee, Bennett Group of Funds (2011-present). |
| Interested Trustee: | | | | |
Donald C. Cacciapaglia† Year of Birth: 1951 Trustee, Chief Executive Officer | Since 2012 | Senior Managing Director of Guggenheim Investments (2010-present);
Chief Executive Officer of Guggenheim Funds Services, LLC
(2012-present); Chief Executive Officer (2012-present) and President
(2010- present), Guggenheim Funds Distributors, LLC and Guggenheim
Funds Investment Advisors, LLC; Chief Executive Officer of certain
funds of Guggenheim Funds Fund Complex (2012-present); President
and Director of SBL Fund, Security Equity Fund, Security Income
Fund, Security Large Cap Value Fund, and Security Mid Cap Growth
Fund (2012-present); President, CEO and Trustee of Rydex Dynamic
Funds, Rydex ETF Trust, Rydex Series Funds and Rydex Variable
Trust, (2012-present). Formerly; Chairman and CEO of Channel
Capital Group Inc. and Channel Capital Group LLC. (2002-2010). | 212 | Trustee, Rydex Dynamic Funds, Rydex ETF Trust,
Rydex Series Funds and Rydex Variable Trust
(2012- present); Independent Board Member,
Equitrust Life Insurance Company, Guggenheim
Life and Annuity Company, and Paragon Life
Insurance Company of Indiana. (2011-present). |
| * | Address for all Trustees: 2455 Corporate West Drive, Lisle, IL 60532 |
| ** | This is the period for which the Trustee began serving the Trust. Each Trustee is expected to serve an indefinite term, until his successor is elected. |
| *** | As of period end. The Guggenheim Funds Fund Complex consists of U.S. registered investment companies advised or serviced by Guggenheim Funds Investment Advisors, LLC and/or Guggenheim Funds Distributors, LLC. The Guggenheim Funds Fund Complex is overseen by multiple Boards of Trustees. |
| † | Mr. Donald C. Cacciapaglia is an “interested person” (as defined in section 2(a)(19) of the 1940 Act) (“Interested Trustee”) of the Trust because of his position as the President and CEO of the Investment Adviser and Distributor. |
| The Officers of the Trust and their principal occupations during the past five years: |
| | | |
Name, Address*, Year of Birth and Position(s) held with Registrant | Term of Office** and Length of Time Served | Principal Occupations During the Past Five Years and |
| | | |
| Officers: | | |
Amy J. Lee Year of Birth: 1961 Chief Legal Officer | Since 2013*** | Managing Director, Guggenheim Investments (2012-present); Senior Vice President & Secretary, Security Investors, LLC (2010 - present); Secretary & Chief Compliance Officer, Security Distributors, Inc. (1987 - 2012); Vice President, Associate General Counsel & Assistant Secretary, Security Benefit Life Insurance Company and Security Benefit Corporation (1987-2012); Vice President & Secretary, Rydex Series Funds, Rydex ETF Trust, Rydex Dynamic Funds, and Rydex Variable Trust (2008-present); Officer of certain funds in the Guggenheim Funds Complex (2012-present). |
John L. Sullivan Year of Birth: 1955 Chief Financial Officer, Chief Accounting Officer and Treasurer | Since 2010 | Senior Managing Director Fund Administration, Guggenheim Investments (2010-present). Chief Financial Officer, Chief Accounting Officer and Treasurer of certain funds in the Fund Complex. Formerly, Chief Compliance Officer, Van Kampen Funds (2004-2010). Head of Fund Accounting, Morgan Stanley Investment Management (2002-2004). Chief Financial Officer, Treasurer, Van Kampen Funds (1996-2004). |
Joanna M. Catalucci Year of Birth: 1966 Chief Compliance Officer | Since 2012 | Managing Director of Compliance and Fund Board Relations, Guggenheim Investments (2012-present). Formerly, Chief Compliance Officer & Secretary, SBL Fund; Security Equity Fund; Security Income Fund; Security Large Cap Value Fund & Security Mid Cap Growth Fund; Vice President, Rydex Holdings, LLC; Vice President, Security Benefit Asset Management Holdings, LLC; and Senior Vice President & Chief Compliance Officer, Security Investors, LLC (2010-2012); Security Global Investors, LLC, Senior Vice President (2010-2011); Rydex Advisors, LLC and Rydex Advisors II, LLC,. Chief Compliance Officer and Senior Vice President (2010- 2011); Rydex Capital Partners I, LLC & Rydex Capital Partners II, LLC, Chief Compliance Officer (2006-2007); and Rydex Fund Services, LLC, Vice President (2001-2006). Chief Compliance Officer of certain funds in the Fund Complex. |
Mark E. Mathiasen Formerly, Vice President; Year of Birth: 1978 Secretary | Since 2011 | Director, Associate General Counsel of Guggenheim Funds Services, LLC (2007-present). Secretary of certain funds in the Fund Complex. |
Stevens T. Kelly Year of Birth: 1982 Assistant Secretary | Since 2012 | Assistant General Counsel of Guggenheim Funds Services, LLC (2011-present). Assistant Secretary of certain other funds in the Fund Complex. Formerly, Associate at K&L Gates LLP (2008-2011), J.D., University of Wisconsin Law School (2005-2008). |
William H. Belden, III Year of Birth: 1965 Vice President | Since 2006 | Managing Director of Guggenheim Funds Investment Advisors, LLC (2005-present). Formerly, Vice President of Product Management at Northern Trust Global Investments (1999-2005). |
* Address for all Officers: 2455 Corporate West Drive, Lisle, IL 60532
** Officers serve at the pleasure of the Board of Trustees and until his or her successor is appointed and qualified or until his or her earlier resignation or removal.
*** Effective February 12, 2013.
| Trust Information | | |
| | | |
| Board of Trustees | | Investment Adviser |
| Randall C. Barnes | | Guggenheim Funds Investment Advisors, |
| Donald C. Cacciapaglia* | | LLC |
| Roman Friedrich III | | Lisle, IL |
| Robert B. Karn III | | |
| Ronald A. Nyberg | | |
| Ronald E. Toupin, Jr. | | Investment Sub-Advisers (RMB) |
| | | J.P. Morgan Investment Management, Inc. |
| | | New York, NY JP International Management Inc. Hong Kong |
*Trustee is an “interested person” (as defined in section 2(a)(19) of the 1940 Act) (“Interested Trustee”) of the Trust because of his position as the President and CEO of the Investment Adviser and Distributor. | | Distributor |
| Officers | | Guggenheim Funds Distributors, LLC |
| Donald C. Cacciapaglia | | Lisle, IL |
| Chief Executive Officer | | |
| | | Administrator |
| Amy J. Lee | | Rydex Fund Services, LLC |
| Chief Legal Officer | | Rockville, MD |
| | | |
| John L. Sullivan | | |
| Chief Financial Officer, | | Accounting Agent, Custodian |
| Chief Accounting Officer and | | and Transfer Agent |
| Treasurer | | The Bank of New York Mellon Corp. |
| | | New York, NY |
| Joanna M. Catalucci | | |
| Chief Compliance Officer | | Legal Counsel |
| | | Dechert LLP |
| Mark E. Mathiasen | | New York, NY |
| Secretary | | |
| | | Independent Registered Public |
| Stevens T. Kelly | | Accounting Firm |
| Assistant Secretary | | Ernst & Young LLP |
| | | Chicago, IL |
| William H. Belden III | | |
| Vice President | | |
| | | |
Privacy Principles of the Trust for Shareholders
The Funds are committed to maintaining the privacy of their shareholders and to safeguarding the non-public personal information. The following information is provided to help you understand what personal information the Funds collect, how we protect that information and why, in certain cases, we may share information with select other parties.
Generally, the Funds do not receive any non-public personal information relating to their shareholders, although certain non-public personal information of their shareholders may become available to the Funds. The Funds do not disclose any non-public personal information about their shareholders or former shareholders to anyone, except as permitted by law or as is necessary in order to service shareholder accounts (for example, to a transfer agent or third party administrator).
The Funds restrict access to non-public personal information about the shareholders to Guggenheim Funds Investment Advisors, LLC employees with a legitimate business need for the information. The Funds maintain physical, electronic and procedural safeguards designed to protect the non-public personal information of their shareholders.
Questions concerning your shares of the Trust?
| · | If your shares are held in a Brokerage Account, contact your Broker. |
This report is sent to shareholders of the Funds for their information. It is not a Prospectus, circular or representation intended for use in the purchase or sale of shares of the Funds or of any securities mentioned in this report.
A description of the Funds’ proxy voting policies and procedures related to portfolio securities is available without charge, upon request, by calling the Funds at (800) 345-7999.
Information regarding how the Funds voted proxies for portfolio securities, if applicable, during the most recent 12-month period ended June 30, is also available, without charge and upon request by calling (800) 345-7999, visiting Guggenheim Fund’s website at guggenheiminvestments.com or by accessing the Funds’ Form N-PX on the SEC’s website at www.sec.gov.
The Funds file their complete schedule of portfolio holdings with the SEC for the first and third quarters of each fiscal year on Form N-Q. The Funds’ Form N-Q is available on the SEC website at www.sec.gov or by visiting Guggenheim Fund’s website at www.guggenheiminvestments.com. The Funds’ Form N-Q may also be viewed and copied at the SEC’s Public Reference Room in Washington, DC; information on the operation of the Public Reference Room may be obtained by calling (800) SEC-0330.
Report of Independent Registered Public Accounting Firm
The Board of Trustees and Shareholders of
Claymore Exchange-Traded Fund Trust 2
We have audited the accompanying statement of assets and liabilities, including the portfolio of investments, of Guggenheim Yuan Bond ETF (one of the portfolios constituting the Claymore Exchange-Traded Fund Trust 2 (the Trust)) as of May 31, 2013, and the related statement of operations for the year then ended, and the statements of changes in net assets and financial highlights for the year then ended and for the period from September 22, 2011 (commencement of investment operations) through May 31, 2012. These financial statements and financial highlights are the responsibility of the Trust’s management. Our responsibility is to express an opinion on these financial statements and financial highlights based on our audits.
We conducted our audits in accordance with the standards of the Public Company Accounting Oversight Board (United States). Those standards require that we plan and perform the audit to obtain reasonable assurance about whether the financial statements and financial highlights are free of material misstatement. We were not engaged to perform an audit of the Trust’s internal control over financial reporting. Our audits included consideration of internal control over financial reporting as a basis for designing audit procedures that are appropriate in the circumstances, but not for the purpose of expressing an opinion on the effectiveness of the Trust’s internal control over financial reporting. Accordingly, we express no such opinion. An audit also includes examining, on a test basis, evidence supporting the amounts and disclosures in the financial statements and financial highlights, assessing the accounting principles used and significant estimates made by management, and evaluating the overall financial statement presentation. Our procedures included confirmation of securities owned as of May 31, 2013, by correspondence with the custodian. We believe that our audits provide a reasonable basis for our opinion.
In our opinion, the financial statements and financial highlights referred to above present fairly, in all material respects, the financial position of Guggenheim Yuan Bond ETF (one of the portfolios constituting the Claymore Exchange-Traded Fund Trust 2) at May 31, 2013, the results of its operations for the year then ended, the changes in its net assets and the financial highlights for the year then ended and for the period from September 22, 2011 (commencement of investment operations) through May 31, 2012, in conformity with U.S. generally accepted accounting principles.
Ernst & Young LLP
Chicago, Illinois
July 25, 2013
Item 2. Code of Ethics.
(a) The registrant has adopted a code of ethics that applies to its principal executive officer, principal financial officer, principal accounting officer or controller, or persons performing similar functions (the "Code of Ethics").
(b) No information need be disclosed pursuant to this paragraph.
(c) The registrant has not amended its Code of Ethics during the period covered by the report presented in Item 1 hereto.
(d) The registrant has not granted a waiver or an implicit waiver to its principal executive officer, principal financial officer, principal accounting officer or controller, or persons performing similar functions from a provision of its Code of Ethics during the period covered by this report.
(e) Not applicable.
(f) (1) The registrant's Code of Ethics is attached hereto as an exhibit.
(2) Not applicable.
(3) Not applicable.
Item 3. Audit Committee Financial Expert.
The registrant's Board of Trustees has determined that it has at least one audit committee financial expert serving on its audit committee (the “Audit Committee”), Randall C. Barnes. Mr. Barnes is an independent Trustee for purposes of this Item 3 of Form N-CSR. Mr. Barnes qualifies as an audit committee financial expert by virtue of his experience obtained as a former Senior Vice President, Treasurer of PepsiCo, Inc.
(Under applicable securities laws, a person who is determined to be an audit committee financial expert will not be deemed an "expert" for any purpose, including without limitation for the purposes of Section 11 of the Securities Act of 1933, as amended, as a result of being designated or identified as an audit committee financial expert. The designation or identification of a person as an audit committee financial expert does not impose on such person any duties, obligations, or liabilities that are greater than the duties, obligations, and liabilities imposed on such person as a member of the audit committee and Board of Trustees in the absence of such designation or identification. The designation or identification of a person as an audit committee financial expert does not affect the duties, obligations or liability of any other member of the audit committee or Board of Trustees.)
Item 4. Principal Accountant Fees and Services.
(a) Audit Fees: the aggregate fees billed for professional services rendered by the principal accountant for the audit of the registrant's annual financial statements or services that are normally provided by the accountant in connection with statutory and regulatory filings or engagements were $66,261 and $87,171 for the fiscal years ending May 31, 2013, and May 31, 2012, respectively.
(b) Audit-Related Fees: the aggregate fees billed for assurance and related services by the principal accountant that are reasonably related to the performance of the audit of the registrant’s financial statements and are not reported under paragraph 4(a), including agreed upon procedures reports performed for rating agencies and the issuance of comfort letters, were $0 and $2,800 for the fiscal years ending May 31, 2013, and May 31, 2012, respectively.
Ernst & Young did not bill fees for non-audit services that required preapproval by the Audit Committee pursuant to paragraph (c)(7)(ii) of Rule 2-01 of Regulation S-X during the Registrant’s last two fiscal years.
(c) Tax Fees: the aggregate fees billed for professional services rendered by the principal accountant for tax compliance, tax advice and tax planning, including federal, state and local income tax return preparation and related advice and determination of taxable income and miscellaneous tax advice were $61,900 and $26,000 for the fiscal years ending May 31, 2013, and May 31, 2012 respectively.
Ernst & Young did not bill fees for tax services that required preapproval by the Audit Committee pursuant to paragraph (c)(7)(ii) of Rule 2-01 of Regulation S-X during the Registrant’s last two fiscal years.
(d) All Other Fees: the aggregate fees billed for products and services provided by the principal accountant, other than the services reported in paragraphs (a) through (c) of this Item were $0 and $0 for the fiscal years ending May 31, 2013, and May 31, 2012, respectively.
Ernst & Young did not bill fees for services not included in Items 4(a), (b) or (c) above that required preapproval by the Audit Committee pursuant to paragraph (c)(7)(ii) of Rule 2-01 of Regulation S-X during the Registrant’s last two fiscal years.
(e). Audit Committee Pre-Approval Policies and Procedures.
(i) The Audit Committee reviews, and in its sole discretion, pre-approves, pursuant to written pre-approval procedures (A) all engagements for audit and non-audit services to be provided by the principal accountant to the registrant and (B) all engagements for non-audit services to be provided by the principal accountant (1) to the registrant’s investment adviser (not including a sub-adviser whose role is primarily portfolio management and is sub-contracted or overseen by another investment adviser) and (2) to any entity controlling, controlled by or under common control with the registrant’s investment adviser that provides ongoing services to the registrant; but in the case of the services described in subsection (B)(1) or (2), only if the engagement relates directly to the operations and financial reporting of the registrant; provided that such pre-approval need not be obtained in circumstances in which the pre-approval requirement is waived under rules promulgated by the Securities and Exchange Commission or New York Stock Exchange listing standards. Sections IV.C.2 and IV.C.3 of the Audit Committee’s revised Audit Committee Charter contain the Audit Committee’s Pre-Approval Policies and Procedures and such sections are included below.
| | IV.C.2 | Pre-approve any engagement of the independent auditors to provide any non-prohibited services to the Fund, including the fees and other compensation to be paid to the independent auditors (unless an exception is available under Rule 2-01 of Regulation S-X). |
| (a) | The categories of services to be reviewed and considered for pre-approval include the following: |
Audit Services
| · | Annual financial statement audits |
| · | Seed audits (related to new product filings, as required) |
| · | SEC and regulatory filings and consents |
Audit-Related Services
| · | Accounting consultations |
| · | Fund merger/reorganization support services |
| · | Other accounting related matters |
| · | Agreed upon procedures reports |
| · | Other internal control reports |
Tax Services
| · | Tax compliance services related to the filing of amendments: |
| o | Federal, state and local income tax compliance |
| o | Sales and use tax compliance |
| · | Timely RIC qualification reviews |
| · | Tax distribution analysis and planning |
| · | Tax authority examination services |
| · | Tax appeals support services |
| · | Accounting methods studies |
| · | Fund merger support services |
| · | Tax compliance, planning and advice services and related projects |
| (b) | The Audit Committee has pre-approved those services, which fall into one of the categories of services listed under 2(a) above and for which the estimated fees are less than $25,000. |
| (c) | For services with estimated fees of $25,000 or more, but less than $50,000, the Chairman is hereby authorized to pre-approve such services on behalf of the Audit Committee. |
| (d) | For services with estimated fees of $50,000 or more, such services require pre-approval by the Audit Committee. |
| (e) | The independent auditors or the Chief Accounting Officer of the Trust (or an officer of the Trust who reports to the Chief Accounting Officer) shall report to the Audit Committee at each of its regular quarterly meetings all audit, audit-related and permissible non-audit services initiated since the last such report (unless the services were contained in the initial audit plan, as previously presented to, and approved by, the Audit Committee). The report shall include a general description of the services and projected fees, and the means by which such services were approved by the Audit Committee (including the particular category listed above under which pre-approval was obtained). |
| | IV.C.3 | Pre-approve any engagement of the independent auditors, including the fees and other compensation to be paid to the independent auditors, to provide any non-audit services to the Adviser (or any “control affiliate” of the Adviser providing ongoing services to the Fund), if the engagement relates directly to the operations and financial reporting of the Fund (unless an exception is available under Rule 2-01 of Regulation S-X). |
| (a) | The Chairman or any member of the Audit Committee may grant the pre-approval for non-audit services to the Adviser (or any “control affiliate” of the Adviser providing ongoing services to the Trust) relating directly to the operations and financial reporting of the Trust for which the estimated fees are less than $25,000. All such delegated pre-approvals shall be presented to the Audit Committee no later than the next Audit Committee meeting. |
| (b) | For non-audit services to the Adviser (or any “control affiliate” of the Adviser providing ongoing services to the Trust) relating directly to the operations and financial reporting of the Trust for which the estimated fees are $25,000 or more, such services require pre-approval by the Audit Committee |
(2) None of the services described in each of Items 4 (b) through (d) were approved by the Audit Committee pursuant to paragraph (c)(7)(i)(C) of Rule 2-01 of Regulation S-X.
The registrant’s principal accountant did not bill fees for non-audit services that required approval by the Audit Committee pursuant to paragraph (c)(7)(ii) of Rule 2-01 of Regulation S-X during the registrant’s last two fiscal years.
(f) Not applicable.
(g) The aggregate non-audit fees billed by the registrant's accountant for services rendered to the registrant, the registrant’s investment adviser (not including a sub-adviser whose role is primarily portfolio management and is sub-contracted with or overseen by another investment adviser) and/or any entity controlling, controlled by, or under common control with the adviser that provides ongoing services to the registrant that directly related to the operations and financial reporting of the registrant were $61,900 and $28,800 for the fiscal years ending May 31, 2013, and May 31, 2012, respectively.
(h) Not applicable.
Item 5. Audit Committee of Listed Registrants.
(a)The Audit Committee was established in accordance with Section 3(a)(58)(A) of the Securities Exchange Act of 1934, as amended. The Audit Committee of the Registrant is comprised of: Randall C. Barnes, Roman Friedrich III, Robert B. Karn III, Ronald A. Nyberg and Ronald E. Toupin, Jr.
(b) Not applicable.
Item 6. Schedule of Investments.
The Schedule of Investments is included as part of Item 1.
Item 7. Disclosure of Proxy Voting Policies and Procedures for Closed-End Management Investment Companies.
Not Applicable.
Item 8. Portfolio Managers of Closed-End Management Investment Companies.
Not Applicable.
Item 9. Purchases of Equity Securities by Closed-End Management Investment Company and Affiliated Purchasers.
Not Applicable.
Item 10. Submission of Matters to a Vote of Security Holders.
Registrant has not made any material changes to the procedures by which shareholders may recommend nominees to the registrant’s Board of Trustees.
Item 11. Controls and Procedures.
(a) The registrant's principal executive officer and principal financial officer have evaluated the registrant's disclosure controls and procedures (as defined in Rule 30a-3(c) under the Investment Company Act) as of a date within 90 days of this filing and have concluded that based on such evaluation, as required by Rule 30a-3(b) under the Investment Company Act, that the registrant's disclosure controls and procedures were effective as of that date in ensuring that information required to be disclosed by the registrant in this Form N-CSR was recorded, processed, summarized, and reported within the time periods specified in the Securities and Exchange Commission’s rules and forms.
(b) There were no changes in the registrant’s internal control over financial reporting (as defined in Rule 30a-3(d) under the Investment Company Act) that occurred during the registrant’s second fiscal quarter of the period covered by this report that have materially affected, or are reasonably likely to materially affect, the registrant’s internal control over financial reporting.
Item 12. Exhibits.
(a)(1) Code of Ethics for Chief Executive and Senior Financial Officer.
(a)(2) Certifications of principal executive officer and principal financial officer pursuant to Rule 30a-2(a) of the Investment Company Act.
(b) Certifications of principal executive officer and principal financial officer pursuant to Rule 30a-2(b) of the Investment Company Act and Section 906 of the Sarbanes-Oxley Act of 2002.
SIGNATURES
Pursuant to the requirements of the Securities Exchange Act of 1934 and the Investment Company Act of 1940, the registrant has duly caused this report to be signed on its behalf by the undersigned, thereunto duly authorized.
(Registrant) Claymore Exchange-Traded Fund Trust 2
By: /s/ Donald C. Cacciapaglia
Name: Donald C. Cacciapaglia
Title: Chief Executive Officer
Date: August 8, 2013
Pursuant to the requirements of the Securities Exchange Act of 1934 and the Investment Company Act of 1940, this report has been signed by the following persons on behalf of the registrant and in the capacities and on the dates indicated.
By: /s/ Donald C. Cacciapaglia
Name: Donald C. Cacciapaglia
Title: Chief Executive Officer
Date: August 8, 2013
Name: John L. Sullivan
Title: Chief Financial Officer, Chief Accounting Officer and Treasurer
Date: August 8, 2013