... your road to the LATEST,
Guggenheim Funds Distributors, Inc. is constantly updating and expanding shareholder information services on each Fund’s website, in an ongoing effort to provide you with the most current information about how your Fund’s assets are managed, and the results of our efforts. It is just one more small way we are working to keep you better informed about your investment.
Guggenheim Funds Investment Advisors, LLC (the “Investment Adviser”) is pleased to present the annual shareholder report for seven of our exchange-traded funds (“ETFs” or “Funds”) including the Guggenheim ABC High Dividend ETF, a new fund introduced in June 2011.
Guggenheim Partners, LLC, a global diversified financial services firm, is the parent company of the Investment Adviser and of Guggenheim Funds Distributors, Inc., the distributor (the “Distributor”) of the Funds. In September 2011, Guggenheim Partners announced future plans to combine its various asset management capabilities, including the Investment Adviser and the Distributor, under the single name “Guggenheim Investments.” The new business group will bring together several of Guggenheim’s investment management businesses and, will have combined assets under management of approximately $119 billion. With the integration of these entities, Guggenheim Investments is projected to be among the ten largest ETF providers globally, offering investors a suite of more than 100 ETFs and ETPs (exchange-traded products) totaling over $20 billion in assets.
Guggenheim Investments will offer a broad spectrum of alternative and equity investment offerings alongside a leading credit research and fixed-income platform. These expanded capabilities will be delivered through a diverse array of solutions including separately managed accounts, open-ended mutual funds, offshore mutual funds, variable insurance trusts, unit investment trusts, closed-end funds and exchange-traded funds.
This report covers performance of the following funds for the fiscal year ended August 31, 2011. Symbols in parentheses following the name of each fund are their NYSE Arca tickers.
To learn more about economic and market conditions over the last year and the objective and performance of each ETF, we encourage you to read the Economic and Market Overview section of the report, which follows this letter, and the Management Discussion of Fund Performance for each ETF, which begins on page 6.
Kevin M. Robinson
Chief Executive Officer
Claymore Exchange-Traded Fund Trust 2
September 30, 2011
Annual Report | August 31, 2011 | 3
Economic and Market Overview |
Returns for most equity and bond indices were strongly positive for the 12-month period ending August 31, 2011. However, there was a pronounced slump in the equity market at the end of the period, accompanied by a significant increase in volatility. The recent market weakness was driven largely by disappointing reports on key economic measures in the U.S. and concerns about sovereign debt in several European nations. However, the fundamentals, at least in the U.S., remain healthier than the market’s recent slump implies.
Expectations of renewed recession in the U.S. appear overblown. The index of leading economic indicators published by the Conference Board suggests moderate expansion in economic activity through the end of 2011. No recession has ever occurred without at least four consecutive negative months of trends in leading economic indicators, nor has a recession ever been preceded by accommodative actions on the part of the Federal Reserve, which has been aggressively accommodative and has pledged to remain so. The Wall Street Journal reported recently that one-third of a group of economists surveyed believe that the U.S. will slip into recession over the next 12 months, which means, of course, that two-thirds of those surveyed believe that no recession will occur. The consensus forecast now anticipates real growth of 1.5% in gross domestic product (GDP) for the full year 2011, and an acceleration in growth to 2.4% in 2012.
Conditions in world markets are more troubling. Economic growth in Europe slowed in the second quarter to the lowest rate since the 2009 recession. As Japan struggles to recover from the March 2011 earthquake, there is talk of austerity and a reduction in government spending, which could slow the recovery. Weak economies in Japan and Europe have negative implications for emerging market economies, with the potential to stifle formerly robust export growth. The upside for the rest of the world would be a reduction in a major source of global inflationary pressure.
The troubles in Europe and Asia at a time the world’s central banks are injecting liquidity into their economies are driving investors toward dollar-denominated assets. Rates on U.S. treasury bonds have plunged to nearly unprecedented levels, as liquidity seeks safe havens. Once the turmoil subsides, other riskier U.S. dollar assets, such as high yield, and then ultimately equities, are likely to benefit. The Standard & Poor’s 500 Index (the “S&P”), which is generally regarded as an indicator of the broad U.S. stock market is selling at the lowest multiple of earnings since the early 1980s; this is a signal that the considerable uncertainty in the economy has already been discounted in the equity market.
For the 12-month period ended August 31, 2011, the S&P returned 18.50%. However, all of the growth in the index occurred in the first half of the 12-month period, when the S&P returned 27.73%; for the six-month period ended August 31, 2011, the return of the S&P was -7.23%. The pattern was similar for most international markets, with positive returns for the 12-month period, but weakness in the last few months. The Morgan Stanley Capital International
4 | Annual Report | August 31, 2011
Economic and Market Overview continued
(“MSCI”) Europe-Australasia-Far East (“EAFE”) Index, which is composed of approximately 1,100 companies in 20 developed countries in Europe and the Pacific Basin, returned 10.01%. The return of the MSCI Emerging Market Index, which measures market performance in global emerging markets, was 9.07%.
In the bond market, lower quality issues performed better than the highest-rated securities, reflecting investors’ increased appetite for risk and search for yield. The return of the Barclays Capital U.S. Corporate High Yield Index for the 12-month period ended August 31, 2011, was 8.39%, while the Barclays Capital U.S. Aggregate Bond Index, which is a proxy for the U.S. investment grade bond market, returned 4.16%. The Barclays U.S. Treasury Composite Index, which measures performance of U.S. Treasury notes with a variety of maturities, returned 4.18% for the 12-month period ended August 31, 2011. Reflecting the Federal Reserve’s continuing accommodative monetary policy, interest rates on short-term securities remained at their lowest levels in many years; the return of the Barclays Capital 1–3 Month U.S. Treasury Bill Index was 0.23% for the same period.
Index Definitions
All indices described below are unmanaged and reflect no expenses. It is not possible to invest directly in any index.
The Barclays Capital U.S. Aggregate Bond Index is a broad-based benchmark that measures the investment grade, U.S. dollar denominated, fixed-rate taxable bond market, including Treasuries, government-related and corporate securities, MBS (agency fixed-rate and hybrid ARM pass-throughs), ABS, and CMBS
The Barclays Capital U.S. Corporate High Yield Index: measures the market of USD-denominated, non-investment grade, fixed-rate, taxable corporate bonds.
The Barclays Capital US Treasury Bill Index: 1-3 Month tracks the performance of U.S. Treasury bills with a remaining maturity of one to three months. U.S. Treasury bills, which are short-term loans to the U.S. government, are full-faith-and-credit obligations of the U.S. Treasury and are generally regarded as being free of any risk of default.
The Barclays Capital U.S. Treasury Composite Index: The U.S. Treasury Index includes public obligations of the U.S. Treasury. Treasury bills are excluded by the maturity constraint but are part of a separate Short Treasury Index. In addition, certain special issues, such as state and local government series bonds (SLGs), as well as U.S. Treasury TIPS, are excluded. STRIPS are excluded from the index because their inclusion would result in double-counting. Securities in the index roll up to the U.S. Aggregate, U.S. Universal, and Global Aggregate Indices.
The Dow Jones World Utilities Index consists of companies that provide electrical, water and natural gas utilities. The index is quoted in U.S. dollars.
The MSCI All-Country World Ex-US Index is a free float-adjusted market capitalization weighted index that is designed to measure the equity market performance of developed and emerging market countries, excluding the United States. This index is unmanaged and it is not possible to invest directly in this index.
The MSCI China index is a capitalization-weighted index that monitors the performance of stocks from the country of China.
The MSCI EAFE Index is a capitalization weighted measure of stock markets in Europe, Australasia and the Far East.
The MSCI Emerging Markets Index is a free float-adjusted market capitalization weighted index that is designed to measure equity market performance in the global emerging markets
The MSCI World Index is a free float-adjusted market capitalization weighted index that measures global developed market equity performance of the developed market country indices of Europe, Australasia, the Far East, the U.S. and Canada.
The Standard & Poor’s (S&P) 500 Index is a capitalization-weighted index of 500 stocks designed to measure the performance of the broad economy, representing all major industries.
Annual Report | August 31, 2011 | 5
Management Discussion of Fund Performance |
ABCS | Guggenheim ABC High Dividend ETF
Fund Overview
The Guggenheim ABC High Dividend ETF, NYSE Arca ticker: ABCS
(the “Fund”) seeks investment results that correspond generally to the performance, before the Fund’s fees and expenses, of an equity index called the BNY Mellon ABC Index (the “Index”).
The Index is a rules-based index comprised of approximately 30 securities, including common stocks and U.S. exchange-listed American depositary receipts (“ADRs”) of companies from Australia and Brazil and locally-listed companies in Australia and Canada, as defined by BNY Mellon (“BNY Mellon” or the “Index Provider”). The depositary receipts included in the Index are sponsored. The Index constituent selection process selects the top 10 stocks or ADRs with the highest yield from each country.
The Fund will invest at least 80% of its total assets in common stocks and ADRs that comprise the Index and depositary receipts representing common stocks included in the Index (or underlying securities representing ADRs included in the Index). The Investment Adviser seeks a correlation over time of 0.95 or better between the Fund’s performance and the performance of the Index. A figure of 1.00 would represent perfect correlation. The Fund generally will invest in all of the stocks comprising the Index in proportion to their weightings in the Index.
Fund Performance
All Fund returns cited—whether based on net asset value (“NAV”) or market price—assume the reinvestment of all distributions. This report discusses the abbreviated annual fiscal period from the Fund’s inception date of June 8, 2011, through August 31, 2011.
On a market price basis, the Fund generated a total return of -9.16%, which included a change in market price to $22.72 on August 31, 2011, from $25.01 at inception. On an NAV basis, the Fund generated a total return of -9.24%, which included a change in NAV to $22.70 on August 31, 2011, from $25.01 at inception. At the end of the period the Fund’s shares were trading at a market price premium to NAV, which is to be expected from time to time.
For underlying index and international market comparison purposes, the Index returned -9.10% and the MSCI All Country World Ex-US Index returned -9.64% for the period from the Fund’s inception date through August 31, 2011.
Performance Attribution
For the period from the Fund’s inception date of June 8, 2011, through August 31, 2011, the consumer non-cyclical sector was the only sector in which the Fund was invested with a positive return, contributing to the Fund’s return. The communications sector was the greatest detractor from return, followed by the basic materials sector.
Positions that contributed most significantly to return included Cia de Bebidas das Americas SA, a Brazilian beverage company; Telecomunicacoes de Sao Paulo SA, which provides fixed-line telecommunications services in the State of Sao Paulo, Brazil; and Ultrapar Participacoes SA, a Brazilian provider of distribution and storage services for natural gas and chemicals (11.0%, 7.0% and 6.7%, respectively, of total investments at period end). Positions that detracted most significantly from return included Yellow Media Inc., a Canadian producer of yellow pages and other marketing services; Cia Siderúrgica Nacional SA, a Brazilian steel company; and Armtec Infrastructure, Inc., a Canadian manufacturer and marketer of high density polyethylene, corrugated steel pipe and other infrastructure products (0.7%, 5.4% and 0.5%, respectively, of total investments at period end).
6 | Annual Report | August 31, 2011
Management Discussion of Fund Performance continued
FAA | Guggenheim Airline ETF
Fund Overview
The Guggenheim Airline ETF, NYSE Arca ticker: FAA (the “Fund”) seeks investment results that correspond generally to the performance, before the Fund’s fees and expenses, of an equity index called the NYSE Arca Global Airline Index (the “Index”).
The Index is a modified equal-dollar weighted index designed to measure the performance of highly capitalized and liquid U.S. and international passenger airline companies identified as being in the airline industry and listed on developed and emerging global market exchanges. Archipelago Holdings Inc. (“Arca” or the “Index Provider”), an affiliate of NYSE Euronext, Inc., defines “developed markets” as countries with western-style legal systems, transparent financial rules for financial reporting and sophisticated, liquid and accessible stock exchanges with readily-exchangeable currencies. The Fund will invest at least 80% of its total assets in common stock, American depositary receipts (“ADRs”) and global depositary receipts (“GDRs”) that comprise the Index and depositary receipts representing common stocks included in the Index (or underlying securities representing ADRs included in the Index). The Investment Adviser seeks a correlation over time of 0.95 or better between the Fund’s performance and the performance of the Index. A figure of 1.00 would represent perfect correlation. The Fund generally will invest in all of the securities comprising the Index in proportion to their weightings in the Index.
Fund Performance
All Fund returns cited—whether based on net asset value (“NAV”) or market price—assume the reinvestment of all distributions. This report discusses the annual fiscal period ended August 31, 2011.
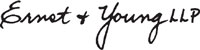
On a market price basis, the Fund generated a total return of -12.80%, which included a change in market price to $28.53 on August 31, 2011, from $32.74 on August 31, 2010. On an NAV basis, the Fund generated a total return of -13.26%, which included a change in NAV to $28.50 on August 31, 2011, from $32.88 on August 31, 2010. At the end of the period the Fund’s shares were trading at a market price premium to NAV, which is to be expected from time to time.
For underlying index and broad international market comparison purposes, the Index returned -12.25% and the MSCI World Index returned 14.46% for the same period.
The Fund made an annual distribution of $0.0280 per share on December 31, 2010, to shareholders of record on December 29, 2010.
All of the Fund’s holdings are classified in the consumer cyclical sector, which had a negative return, detracting from the Fund’s return for the 12-month period ended August 31, 2011. Positions that contributed most significantly to return included AirTran Holdings, Inc., parent of AirTran Airways, Inc., which operates scheduled airline service in the United States and to selected international locations (not held in the portfolio at period end); Alaska Air Group, Inc., which operates Alaska Airlines, Inc. and Horizon Air Industries, Inc. providing passenger, freight and mail air service, primarily to and within the state of Alaska and on the West Coast (4.1% of long-term investments at period end); and Deutsche Lufthansa AG, a European aviation company with global operations and a total of more than 400 subsidiaries and associated companies (4.7% of long-term investments at period end). Positions that detracted most significantly from return included Delta Air Lines, Inc., which provides scheduled air transportation for passengers and cargo throughout the United States and around the world; Southwest Airlines Co., a passenger airline that provides scheduled air transportation in the United States; and AMR Corp., parent of American Airlines, which provides airline service in North America, the Caribbean, Latin America, Europe and Asia (15.0%, 14.9% and 4.4%, respectively, of long-term investments at period end).
Annual Report | August 31, 2011 | 7
Management Discussion of Fund Performance continued
YAO | Guggenheim China All-Cap ETF
Fund Overview
The Guggenheim China All-Cap ETF, NYSE Arca ticker: YAO (the “Fund”) seeks investment results that correspond generally to the performance, before the Fund’s fees and expenses, of an equity index called the AlphaShares China All-Cap Index (the “Index”).
The Index is designed to measure and monitor the performance of the investable universe of publicly-traded companies based in mainland China. The Index was created by AlphaShares, LLC (“AlphaShares”) and is maintained by Standard & Poor’s. The Index includes equity securities of companies of all capitalizations, as defined by AlphaShares, subject to certain minimum capitalization requirements. The Fund will invest at least 80% of its total assets in common stock, American depositary receipts (“ADRs”), American depositary shares (“ADSs”), global depositary receipts (“GDRs”) and international depositary receipts (“IDRs”) that comprise the Index and depositary receipts or shares representing common stocks included in the Index (or underlying securities representing ADRs, ADSs, GDRs and IDRs included in the Index). The Investment Adviser seeks a correlation over time of 0.95 or better between the Fund’s performance and the performance of the Index. A figure of 1.00 would represent perfect correlation. The Fund generally will invest in all of the securities comprising the Index in proportion to their weightings in the Index.
Fund Performance
All Fund returns cited—whether based on net asset value (“NAV”) or market price—assume the reinvestment of all distributions. This report discusses the annual fiscal period ended August 31, 2011.
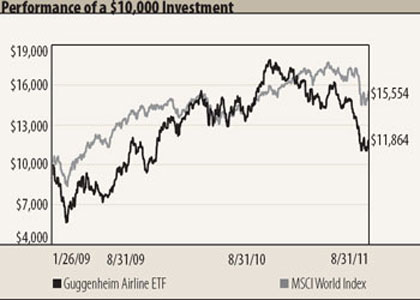
On a market price basis, the Fund generated a total return of 3.18%, which included a change in market price to $25.07 on August 31, 2011, from $24.55 on August 31, 2010. On an NAV basis, the Fund generated a total return of 3.01%, which included a change in NAV to $25.04 on August 31, 2011, from $24.56 on August 31, 2010. At the end of the period the Fund’s shares were trading at a market price premium to NAV, which is to be expected from time to time.
For underlying index and broad market comparison purposes, the Index returned 3.82% and the MSCI China Index returned -0.32% for the same period.
The Fund made an annual distribution of $0.2820 per share on December 31, 2010, to shareholders of record on December 29, 2010.
Performance Attribution
For the 12-month period ended August 31, 2011, the communications sector made the strongest contribution to the Fund’s return, followed by the energy sector. The financial sector detracted most significantly from the Fund’s return.
Positions that contributed most significantly to the Fund’s performance included Baidu, Inc., a Chinese-language Internet search provider; CNOOC Ltd., an investment holding company engaged in the exploration, development, production and sale of crude oil and natural gas and other petroleum products from offshore fields in Asia; and PetroChina Co. Ltd., which produces and sells oil and gas in the People’s Republic of China (6.8%, 4.8% and 4.4%, respectively, of long-term investments at period end). Positions that detracted most significantly from the Fund’s performance included China Life Insurance Co. Ltd., an insurance company based in Beijing; Bank of China Ltd., a Chinese commercial bank; and BYD Co. Ltd., which manufactures rechargeable batteries, handsets, automobile components and related products (3.0%, 4.0% and 0.2%, respectively, of long-term investments at period end).
8 | Annual Report | August 31, 2011
Management Discussion of Fund Performance continued
CQQQ | Guggenheim China Technology ETF
The Guggenheim China Technology ETF, NYSE Arca ticker: CQQQ
(the “Fund”) seeks investment results that correspond generally to the performance, before the Fund’s fees and expenses, of an equity index called the AlphaShares China Technology Index (the “Index”).
The Index is designed to measure and monitor the performance of the universe of publicly-traded companies which are based in mainland China, Hong Kong or Macau, are in the Information Technology Sector, as defined by Standard & Poor’s Global Industry Classification Standard, and are open to foreign investment. The Index was created by AlphaShares, LLC (“AlphaShares”) and is maintained by Standard & Poor’s. The Index includes equity securities of companies of all categories of market capitalizations, as defined by AlphaShares (subject to certain minimum float-adjusted capitalization requirements.)
The Index may include Hong Kong listed securities, including China H-shares and Red Chips. China H-shares are issued by companies incorporated in mainland China and listed on the Hong Kong Stock Exchange. Red Chip shares are issued by companies with controlling Chinese shareholders that are incorporated outside mainland China and listed on the Hong Kong Stock Exchange. The Index may also include N-Shares, which are issued by companies based in mainland China and listed on the NYSE Arca, Inc. or NASDAQ Stock Market. The Index will not include China A-Shares (which are subject to substantial restrictions on foreign investment) or China B-Shares (which offer a generally smaller market and limited liquidity), each of which trade on the Shanghai Stock Exchange and the Shenzhen Stock Exchange.
The Fund will invest at least 80% of its total assets in common stock, American depositary receipts (“ADRs”), American depositary shares (“ADSs”), global depositary receipts (“GDRs”) and international depositary receipts (“IDRs”) that comprise the Index and depositary receipts representing common stocks included in the Index (or underlying securities representing ADRs, ADSs, GDRs and IDRs included in the Index).
The Investment Adviser seeks a correlation over time of 0.95 or better between the Fund’s performance and the performance of the Index. A figure of 1.00 would represent perfect correlation. The Fund generally will invest in all of the securities comprising the Index in proportion to their weightings in the Index.
All Fund returns cited—whether based on net asset value (“NAV”) or market price—assume the reinvestment of all distributions. This report discusses the annual fiscal period ended August 31, 2011.
On a market price basis, the Fund generated a total return of 5.30%, which included a change in market price to $25.57 on August 31, 2011, from $24.40 on August 31, 2010. On an NAV basis, the Fund generated a total return of 4.94%, which included a change in NAV to $25.44 on August 31, 2011, from $24.36 on August 31, 2010. At the end of the period the Fund’s shares were trading at a market price premium to NAV, which is to be expected from time to time.
For underlying index and broad Chinese market comparison purposes, the Index returned 5.07% and the MSCI China Index returned -0.32% for the same period.
The Fund made an annual distribution of $0.1330 per share on December 31, 2010, to shareholders of record on December 29, 2010.
Performance Attribution
For the 12-month period ended August 31, 2011, the communications sector was the only sector in which the Fund was invested with a positive return, contributing to the Fund’s return. The consumer cyclicals sector was the greatest detractor from return, followed by the technology sector.
Positions that contributed most significantly to the Fund’s return included Baidu, Inc., a Chinese-language Internet search provider; SINA Corp., an online media company; and Tencent Holdings Ltd., which provides internet and telecommunication services in China (12.4%, 10.0% and 8.8%, respectively, of long-term investments at period end). Positions that detracted most significantly from the Fund’s return included BYD Co. Ltd., a Chinese manufacturer of rechargeable batteries, automobiles and related products, handset components, liquid crystal displays and other electronic products; Alibaba.com Ltd., a provider of software, technology and other services to the online business-to-business marketplace; and China Wireless Technologies Ltd., which produces mobile telephones and invests in real estate (2.6%, 3.1% and 0.6%, respectively, of long-term investments at period end).
Annual Report | August 31, 2011 | 9
Management Discussion of Fund Performance continued
EEN | Guggenheim EW Euro-Pacific LDRs ETF
Fund Overview
The Guggenheim EW (“Equal-Weighted”) Euro-Pacific LDRs (“Leaders”) ETF, NYSE Arca ticker: EEN (the “Fund”) seeks investment results that correspond generally to the performance, before the Fund’s fees and expenses, of an equity index called the BNY Mellon Euro-Pacific Select ADR Index (the “Index”).
The Index is comprised of American depositary receipts (“ADRs”), global depositary receipts (“GDRs”), New York Shares and Global Registered Shares traded on the New York Stock Exchange (“NYSE”), Nasdaq Stock Market (“NASDAQ”) and the NYSE Alternext US Exchange. Index constituents are selected, based on liquidity, from a universe of all U.S.-listed ADRs, GDRs, New York Shares and Global Registered Shares of developed countries in Europe and Asia-Pacific, as determined by BNY Mellon (the “Index Provider”). BNY Mellon generally follows the World Bank’s classification as low-income, middle-income, or high-income in determining which markets qualify as developed markets. Developed markets are those markets classified as high-income, with some high income countries excluded due to the nature of their stock market. As of August 31, 2011, the Euro-Pacific Index consisted of 107 securities ranging in capitalization from $1.28 billion to $263 billion, which includes small-, mid-, and large-capitalization stocks as defined by the Index Provider. The Index is weighted based on an equal-weighted methodology whereby each constituent receives an equal weight at each rebalance. The Fund will invest at least 80% of its total assets in ADRs, GDRs, New York Shares and Global Registered Shares that comprise the Index. The Fund will also invest at least 80% of its total assets in securities of issuers from Europe and Asia-Pacific countries.
The Fund may invest directly in one or more underlying stocks represented by the ADRs, GDRs, New York Shares or Global Registered Shares comprising the Index under the following limited circumstances: (a) when market conditions result in the underlying stock providing more liquidity than the ADR, GDR, New York Share or Global Registered Share; (b) when an ADR, GDR, New York Share or Global Registered Share is trading at a significantly different price than its underlying stock; or (c) the timing of trade execution is improved due to the local market in which an underlying stock is traded being open at different times than the market in which the stock’s corresponding ADR, GDR, New York Share or Global Registered Share is traded.
The Investment Adviser seeks a correlation over time of 0.95 or better between the Fund’s performance and the performance of the Index. A figure of 1.00 would represent perfect correlation. The Fund generally will invest in all of the securities comprising the Index in proportion to their weightings in the Index.
Fund Performance
All Fund returns cited—whether based on net asset value (“NAV”) or market price—assume the reinvestment of all distributions. This report discusses the annual fiscal period ended August 31, 2011.
On a market price basis, the Fund generated a total return of 8.87%, which included a change in market price to $17.78 on August 31, 2011, from $16.98 on August 31, 2010. On an NAV basis, the Fund generated a total return of 8.84%, which included a change in NAV to $17.59 on August 31, 2011, from $16.80 on August 31, 2010. At the end of the period the Fund’s shares were trading at a market price premium to NAV, which is to be expected from time to time.
For underlying index broad international market comparison purposes, the Index returned 8.51%, and the MSCI EAFE Index returned 10.01% for the same period.
The Fund made an annual distribution of $0.7700 per share on December 31, 2010, to shareholders of record on December 29, 2010.
Performance Attribution
For the 12-month period ended August 31, 2011, eight of the nine industry sectors in which the Fund was invested had positive returns, contributing to the Fund’s return. The consumer noncyclical sector contributed most significantly to the Fund’s return, followed by the energy sector. The financial sector was the only sector with a negative return, detracting from the Fund’s return.
Positions that contributed most significantly to return included Melco Crown Entertainment Ltd., which owns and operates casino gaming and entertainment resort facilities in Macau (1.3% of long-term investments at period end); Elan Corp. PLC, a neuroscience-based biotechnology company headquartered in Ireland (1.1% of long-term investments at period end); and Crucell NV, a biopharmaceutical company headquartered in the Netherlands (not held in the portfolio at period end). Positions that detracted most significantly from return included National Bank of Greece SA, a Greek bank (0.7% of long-term investments at period end); The Governor & Co. of the Bank of Ireland, an Irish bank (1.0% of long-term investments at period end); and Promotora de Informaciones SA, a Spanish media company involved in the publication of textbooks, newspapers and magazines and in radio and television services (The Fund holds two issues of Promotora de Informaciones SA, representing a total of 1.4% of long-term investments at period end).
10 | Annual Report | August 31, 2011
Management Discussion of Fund Performance continued
TAN | Guggenheim Solar ETF
Fund Overview
The Guggenheim Solar ETF, NYSE Arca ticker: TAN (the “Fund”) seeks investment results that correspond generally to the performance, before the Fund’s fees and expenses, of an equity index called the MAC Global Solar Energy Index (the “Index”).
The Index is comprised of approximately 30 securities selected based on the relative importance of solar power within the company’s business model, as determined by MAC Indexing LLC (the “Index Provider”). As of August 31, 2011, the market capitalization of securities included in the Index ranged from approximately $40 million to $8.6 billion. The Index is designed to track companies within the following business segments of the solar energy industry: companies that produce solar power equipment and products for end-users; companies that produce fabrication products (such as the equipment used by solar cell and module producers to manufacture solar power equipment) or services (such as companies specializing in the solar cell manufacturing or the provision of consulting services to solar cell and module producers) for solar power equipment producers; companies that supply raw materials or components to solar power equipment producers or integrators; companies that derive a significant portion of their business (as defined in the Fund prospectus under “Index Methodology”) from solar power system sales, distribution, installation, integration or financing; and companies that specialize in selling electricity derived from solar power. The Index is generally comprised of equity securities, including American depositary receipts (“ADRs”) and global depositary receipts (“GDRs”), traded in developed markets, as defined by the Index Provider. While the equity securities comprising the Index are traded in developed markets, the issuers of such securities may be located in emerging markets. Emerging market countries are countries that major international financial institutions, such as the World Bank, generally consider to be less economically mature than developed nations. The Fund will invest at least 90% of its total assets in common stock, ADRs and GDRs that comprise the Index and depositary receipts representing common stocks included in the Index (or underlying securities representing ADRs and GDRs included in the Index).
The Investment Adviser seeks a correlation over time of 0.95 or better between the Fund’s performance and the performance of the Index. A figure of 1.00 would represent perfect correlation. The Fund generally will invest in all of the securities comprising the Index in proportion to their weightings in the Index.
Fund Performance
All Fund returns cited—whether based on net asset value (“NAV”) or market price—assume the reinvestment of all distributions. This report discusses the annual fiscal period ended August 31, 2011.
On a market price basis, the Fund generated a total return of -24.81%, which included a change in market price to $5.46 on August 31, 2011, from $7.29 on August 31, 2010. On an NAV basis, the Fund generated a total return of -24.81%, which included a change in NAV to $5.49 on August 31, 2011, from $7.33 on August 31, 2010. At the end of the period the Fund’s shares were trading at a market price discount to NAV, which is to be expected from time to time.
For underlying index and broad international market comparison purposes, the Index returned -26.29% and the MSCI World Index returned 14.46% for the same period.
The Fund made an annual distribution of $0.0290 per share on December 31, 2010, to shareholders of record on December 29, 2010.
Performance Attribution
The Fund’s holdings are in the energy, industrial, technology and basic materials sectors, all of which had negative returns for the 12-month period ended August 31, 2011, detracting from the Fund’s return. The energy sector detracted most and the basic materials sector detracted least.
Positions that contributed most significantly to the Fund’s return included Meyer Burger Technology AG, a Swiss company that provides systems and production lines for photovoltaics in the solar industry; GT Advanced Technologies, Inc., a global provider of polysilicon production technology and multicrystalline ingot growth systems and related photovoltaic manufacturing services for the solar industry; and SunPower Corp., a vertically integrated solar products and services company (7.0%, 6.7% and 3.5%, respectively, of long-term investments at period end). Positions that detracted most significantly from return included First Solar, Inc., a U.S.-based producer of solar modules and photovoltaic solar power systems; GCL-Poly Energy Holdings Ltd., a Hong Kong company that manufactures polysilicon and wafers for the solar industry and operates power plants; and Trina Solar Ltd., an integrated solar-power products manufacturer based in China (19.3%, 12.7% and 4.8%, respectively, of long-term investments at period end).
Annual Report | August 31, 2011 | 11
Management Discussion of Fund Performance continued
CGW | Guggenheim S&P Global Water Index ETF
Fund Overview
The Guggenheim S&P Global Water Index ETF, NYSE Arca ticker: CGW
(the “Fund”), seeks investment results that correspond generally to the performance, before the Fund’s fees and expenses, of an equity index called the S&P Global Water Index (the “Index”).
The Index is comprised of approximately 50 equity securities selected, based on investment and other criteria, from a universe of companies listed on global developed market exchanges. Standard & Poor’s (“S&P”), a division of The McGraw-Hill Companies, Inc. generally defines “developed markets” as the capital markets of those countries with high levels of per capita income and strict market regulation resulting in greater transparency. The universe of companies includes all companies classified by S&P’s Global Industry Classifications as being associated (in a manner representing a major component of such companies’ business) with the global demand for water, including water utilities, infrastructure, equipment, instruments and materials. Capitalizations of securities in the Index must be at least $250 million at the time of each reconstitution, which includes small-, mid-, and large-capitalization securities as defined by S&P. The companies in the universe are selected using criteria as identified by S&P.
The Fund will invest at least 90% of its total assets in common stock and American depositary receipts (“ADRs”) that comprise the Index and depositary receipts representing common stocks included in the Index (or underlying securities representing ADRs included in the Index). The Investment Adviser seeks a correlation over time of 0.95 or better between the Fund’s performance and the performance of the Index. A figure of 1.00 would represent perfect correlation. The Fund generally will invest in all of the securities comprising the Index in proportion to their weightings in the Index.
Fund Performance
All Fund returns cited—whether based on net asset value (“NAV”) or market price—assume the reinvestment of all distributions. This report discusses the annual fiscal period ended August 31, 2011.
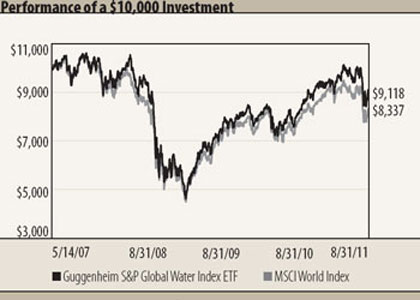
On a market price basis, the Fund generated a total return of 20.02%, which included a change in market price to $19.99 on August 31, 2011, from $16.99 on August 31, 2010. On an NAV basis, the Fund generated a total return of 19.60%, which included a change in NAV to $20.06 on August 31, 2011, from $17.11 on August 31, 2010. At the end of the period the Fund’s shares were trading at a market price discount to NAV, which is to be expected from time to time.
For underlying index broad international market, and international utilities market comparison purposes, the Index returned 19.82%, the MSCI World Index returned 14.46%, and the Dow Jones World Utilities Index returned -0.23% for the same period.
The Fund made an annual distribution of $0.4170 per share on December 31, 2010, to shareholders of record on December 29, 2010.
Performance Attribution
For the 12-month period ended August 31, 2011, all four sectors in which the Fund was invested had positive returns, contributing to the Fund’s return. The industrial sector contributed most significantly to the Fund’s return, and the diversified sector contributed least to the Fund’s return.
Positions that contributed most significantly to return included Geberit AG, a Swiss provider of solutions for sanitary technology applications; Nalco Holding Co., a provider of water, energy, air and process technologies and services; and American Water Works Co., Inc., a water and wastewater utility company that provides services to 16 million people in 35 states and two Canadian provinces (9.6%, 6.4% and 5.9%, respectively, of long-term investments at period end). Positions that detracted most significantly from return included Veolia Environnement SA, a French provider of environmental management services (2.7% of long-term investments at period end); Duoyuan Global Water Inc., a Chinese producer of domestic water treatment equipment (not held in the portfolio at period end); and Itron, Inc., a provider of metering systems to electric, natural gas and water utilities (1.0% of long-term investments at period end).
12 | Annual Report | August 31, 2011
Management Discussion of Fund Performance continued
Risks and Other Considerations
The views expressed in this report reflect those of the portfolio managers and Guggenheim Funds Investment Advisors only through the report period as stated on the cover. These views are subject to change at any time, based on market and other conditions and should not be construed as a recommendation of any kind. The material may also contain forward looking statements that involve risk and uncertainty, and there is no guarantee they will come to pass.
This information does not represent an offer to sell securities of the funds and it is not soliciting an offer to buy securities of the Funds. There can be no assurance that the funds will achieve their investment objectives. Below are some general risks and considerations associated with investing in an ETF and may not apply to each of the ETFs listed in the report. Please refer to the individual ETF prospectus for a more detailed discussion of the fund-specific risks and considerations.
Investment Risk. An investment in the Fund is subject to investment risk, including the possible loss of the entire principal amount that you invest.
Equity Risk.This includes the risk that the value of the securities held by the funds will fall due to general market and economic conditions, perceptions regarding the industries in which the issuers of securities held by the funds participate, or factors relating to specific companies in which the funds invest.
Foreign Investment Risk.The funds’ investments in non-U.S. issuers may involve unique risks compared to investing in securities of U.S. issuers, including, among others, less market liquidity, generally greater market volatility than U.S. securities and less complete financial information than for U.S. issuers. In addition, adverse political, economic or social developments could undermine the value of the funds’ investments or prevent the funds from realizing the full value of its investments. Financial reporting standards for companies based in foreign markets differ from those in the United States. Finally, the value of the currency of the country in which the funds have invested could decline relative to the value of the U.S. dollar, which may affect the value of the investment to U.S. investors. In addition, the underlying issuers of certain depositary receipts, particularly unsponsored or unregistered depositary receipts, are under no obligation to distribute shareholder communications to the holders of such receipts, or to pass through to them any voting rights with respect to the deposited securities.
Emerging Markets Risk: Investment in securities of issuers based in developing or “emerging market” countries entails all of the risks of investing in securities of non-U.S. issuers, as previously described, but to a heightened degree.
Industry Risk. To the extent that any funds focus their investments in a particular industry or group of related industries, the NAV of the funds will be more susceptible to factors affecting that industry or sector.
Micro-, Small and Medium-Sized Company Risk: Investing in securities of these companies involves greater risk as their stocks may be more volatile and less liquid than investing in more established companies. These stocks may have returns that vary, sometimes significantly, from the overall stock market. Micro-cap companies may be newly formed, less developed and there may be less available information about the company.
Replication Management Risk. Unlike many investment companies, these funds are not “actively” managed. Therefore, they won’t necessarily sell a security because the security’s issuer was in financial trouble unless that stock is removed from the index.
Non-Correlation Risk: The funds’ return may not match the return of the index for a number of reasons. For example, the fund incurs a number of operating expenses not applicable to the Index, and incurs costs in buying and selling securities, especially when rebalancing the funds’ securities holdings to reflect changes in the composition of the Index. The funds may not be fully invested at times, either as a result of cash flows into the funds or reserves of cash held by the funds to meet redemptions and expenses. If the funds utilizes a sampling approach or futures or other derivative positions, its return may not correlate as well with the return on the Index, as would be the case if it purchased all of the securities in the index with the same weightings as the index.
Issuer-Specific Changes:The value of an individual security or particular type of security can be more volatile than the market as a whole and can perform differently from the value of the market as a whole. The value of securities of smaller issuers can be more volatile than that of larger issuers.
Non-Diversified Fund Risk.The funds are considered non-diversified and can invest a greater portion of assets in securities of individual issuers than a diversified fund. As a result, changes in the market value of a single investment could cause greater fluctuations in share price than would occur in a diversified fund.
The Guggenheim ABC High Dividend ETF is also subject to risks of investing in each Australia and Canada include commodity exposure risk, geographic risk and trading partners risk. Commodity exposure risk is exposure related to any negative changes in the agricultural or mining industries which could therefore have an adverse impact on the Australian or Canadian economy, as applicable. Geographic risk is the risk that a natural disaster could occur in Australia or Canada, as applicable. Trading partners risk is due to the Australian or Canadian economy, as applicable, being heavily dependent upon trading with its key partners. Any reduction in this trading may cause an adverse impact on the economy in which the Fund invests. Brazil has experienced substantial economic instability resulting from, among other things, periods of very high inflation, persistent structural public sector deficits and significant devaluations of the currency of Brazil, and leading also to a high degree of price volatility in both the Brazilian equity and foreign currency markets. Brazilian companies may also be adversely affected by high interest and unemployment rates, and are particularly sensitive to fluctuations in commodity prices.
There is no assurance that the requirements of the NYSE Arca necessary to maintain the listing of the funds will continue to be met or will remain unchanged.
In addition to the risks described above, there are certain other risks related to investing in the funds. These risks are described further in the Prospectus and Statement of Additional Information.
Annual Report | August 31, 2011 | 13
Fund Summary & Performance | As of August 31, 2011 (unaudited)
ABCS | Guggenheim ABC High Dividend ETF
| Fund Statistics | | | | |
| Share Price | | $ | 22.72 | |
| Net Asset Value | | $ | 22.70 | |
| Premium/Discount to NAV | | | 0.09 | % |
| Net Assets ($000) | | $ | 6,811 | |
| | | | Since |
| (Inception 6/8/11) | | | Inception |
| Guggenheim ABC High Dividend ETF | | | | |
| NAV | | | -9.24 | % |
| Market | | | -9.16 | % |
| The BNY Mellon ABC Index | | | -9.10 | % |
| MSCI All Country World Ex-US Index | | | -9.64 | % |
Performance data quoted represents past performance, which is no guarantee of future results, and current performance may be lower or higher than the figures shown. The deduction of taxes that a shareholder would pay on Fund distributions or the redemption of Fund shares is not reflected in the total returns. For the most recent month-end performance figures, please visit www.guggenheimfunds.com. The investment return and principal value of an investment will fluctuate with changes in market conditions and other factors so that an investor’s shares, when redeemed, may be worth more or less than their original cost.
Since inception returns assume a purchase of the Fund at the initial share price of $25.01 per share for share price returns or initial net asset value (NAV) of $25.01 per share for NAV returns. Returns for periods of less than one year are not annualized.
The Fund’s annual operating expense ratio of 0.65% is expressed as a unitary fee and covers all expenses of the Fund, except for distribution fees, if any, brokerage expenses, taxes, interest, litigation expenses and other extraordinary expenses.
| Portfolio Breakdown | | | % of Net Assets |
| Communications | | | 24.7 | % |
| Utilities | | | 17.5 | % |
| Basic Materials | | | 16.7 | % |
| Consumer, Cyclical | | | 15.3 | % |
| Consumer, Non-cyclical | | | 14.5 | % |
| Financial | | | 4.8 | % |
| Energy | | | 1.9 | % |
| Industrial | | | 1.8 | % |
| Total Common and Preferred Stocks | | | 97.2 | % |
| Income Trusts | | | 1.8 | % |
| Total Investments | | | 99.0 | % |
| Other Assets in excess of Liabilities | | | 1.0 | % |
| Net Assets | | | 100.0 | % |
| | | | % of Total |
| Country Breakdown | | | Investments |
| Brazil | | | 53.5 | % |
| Australia | | | 30.1 | % |
| Canada | | | 16.4 | % |
| | | | | |
| | | | % of Total | |
| Currency Denomination | | | Investments | |
| United States Dollar | | | 53.5 | % |
| Australian Dollar | | | 30.1 | % |
| Canadian Dollar | | | 16.4 | % |
| | | | % of Total |
| Top Ten Holdings | | | Investments |
| Cia de Bebidas das Americas SA | | | 11.0 | % |
| Telstra Corp. Ltd. | | | 8.0 | % |
| Telecomunicacoes de Sao Paulo SA | | | 7.0 | % |
| Ultrapar Participacoes SA | | | 6.7 | % |
| Cia Energetica de Minas Gerais SA | | | 5.9 | % |
| Cia Siderurgica Nacional SA | | | 5.4 | % |
| Banco Santander Brasil SA | | | 4.9 | % |
| Tatts Group Ltd. | | | 4.3 | % |
| Tele Norte Leste Participacoes SA | | | 3.7 | % |
| TABCORP Holdings Ltd. | | | 3.1 | % |
Portfolio breakdown is shown as a percentage of net assets. Country breakdown, currency denomination and holdings are shown as a percentage of total investments. All are subject to change daily. For more current Fund information, please visit www.guggenheim-funds.com. The above summaries are provided for informational purposes only, and should not be viewed as recommendations.

This graph compares a hypothetical $10,000 investment in the Fund, made at its inception, with a similar investment in the MSCI All Country World Ex-US Index. Results include the reinvestment of all dividends and capital gains. Past performance is no guarantee of future results. The MSCI All Country World Ex-US Index is a free float-adjusted market capitalization weighted index that is designed to measure the equity market performance of developed and emerging market countries excluding the United States. It is not possible to invest directly in the MSCI All Country World Ex-US Index. Investment return and principal value will fluctuate with changes in market conditions and other factors and Fund shares, when redeemed, may be worth more or less than their original investment.
14 | Annual Report | August 31, 2011
Fund Summary & Performance (unaudited) continued
FAA | Guggenheim Airline ETF
| | | | | |
| Fund Statistics | | | | |
| Share Price | | $ | 28.53 | |
| Net Asset Value | | $ | 28.50 | |
| Premium/Discount to NAV | | | 0.11 | % |
| Net Assets ($000) | | $ | 18,526 | |
| | | | | |
| Total Returns | | | | |
| | | | | | Since Inception |
| (Inception 1/26/09) | | | One Year | | (Annualized) |
| Guggenheim Airline ETF | | | | | | | |
| NAV | | | -13.26 | % | | 6.81 | % |
| Market | | | -12.80 | % | | 6.85 | % |
| NYSE Arca Global Airline Index | | | -12.25 | % | | 7.45 | % |
| MSCI World Index | | | 14.46 | % | | 18.54 | % |
Performance data quoted represents past performance, which is no guarantee of future results and current performance may be lower or higher than the figures shown. The deduction of taxes that a shareholder would pay on Fund distributions or the redemption of Fund shares is not reflected in the total returns. For the most recent month-end performance figures, please visit www.guggenheimfunds.com. The investment return and principal value of an investment will fluctuate with changes in market conditions and other factors so that an investor’s shares, when redeemed, may be worth more or less than their original cost.
Since inception returns assume a purchase of the Fund at the initial share price of $24.04 per share for share price returns or initial net asset value (NAV) of $24.04 per share for NAV returns. Returns for periods of less than one year are not annualized.
Per the most recent prospectus, the Fund’s annualized gross operating expense ratio, gross of any fee waivers or expense reimbursements, was 1.13%. In the Financial Highlights section of this Annual Report, the Fund’s annualized net operating expense ratio was determined to be 0.70% while the Fund’s annualized gross operating expense ratio, gross of any fee waivers or expense reimbursements, was 0.99%. There is a contractual fee waiver currently in place for this Fund through December 31, 2014 to the extent necessary in keeping the Fund’s operating expense ratio from exceeding 0.65% of average net assets per year. Some expenses fall outside of this expense cap and actual expenses will be higher than 0.65%. Without this expense cap, actual returns would be lower.
| | % of Long-Term |
| Country Breakdown | | | Investments |
| United States | | | 70.0 | % |
| Germany | | | 4.7 | % |
| Singapore | | | 4.5 | % |
| Japan | | | 4.4 | % |
| Sweden | | | 1.8 | % |
| France | | | 1.7 | % |
| Spain | | | 1.7 | % |
| United Kingdom | | | 1.6 | % |
| Canada | | | 1.6 | % |
| South Korea | | | 1.6 | % |
| Hong Kong | | | 1.6 | % |
| Ireland | | | 1.6 | % |
| Brazil | | | 1.6 | % |
| Australia | | | 1.6 | % |
| | | | | |
| | % of Long-Term |
| Currency Denomination | | | Investments |
| United States Dollar | | | 73.2 | % |
| Euro | | | 6.4 | % |
| All other currencies | | | 20.4 | % |
| Portfolio Breakdown | | % of Net Assets |
| Consumer, Cyclical | | | 100.2 | % |
| Total Common Stocks | | | 100.2 | % |
| Investments of Collateral for Securities Loaned | | | 12.0 | % |
| Total Investments | | | 112.2 | % |
| Liabilities in excess of Other Assets | | | -12.2 | % |
| Net Assets | | | 100.0 | % |
| | | | | |
| | % of Long-Term |
| Top Ten Holdings | | | Investments |
| Delta Air Lines, Inc. | | | 15.0 | % |
| Southwest Airlines Co. | | | 14.9 | % |
| United Continental Holdings, Inc. | | | 14.7 | % |
| Deutsche Lufthansa AG | | | 4.7 | % |
| Singapore Airlines Ltd. | | | 4.5 | % |
| All Nippon Airways Co. Ltd. | | | 4.4 | % |
| AMR Corp. | | | 4.4 | % |
| JetBlue Airways Corp. | | | 4.2 | % |
| US Airways Group, Inc. | | | 4.2 | % |
| Skywest, Inc. | | | 4.2 | % |
Portfolio breakdown is shown as a percentage of net assets. Country breakdown, currency denomination and holdings are shown as a percentage of long-term investments. All are subject to change daily. For more current Fund information, please visit www.guggen-heimfunds.com. The above summaries are provided for informational purposes only, and should not be viewed as recommendations.
This graph compares a hypothetical $10,000 investment in the Fund, made at its inception, with a similar investment in the MSCI World Index. Results include the reinvestment of all dividends and capital gains. Past performance is no guarantee of future results. The MSCI World Index is a free float-adjusted market capitalization index that measures global developed market equity performance of the developed market country indices of Europe, Australasia, the Far East, the U.S. and Canada. It is not possible to invest directly in the MSCI World Index. Investment return and principal value will fluctuate with changes in market conditions and other factors and Fund shares, when redeemed, may be worth more or less than their original investment.
Annual Report | August 31, 2011 | 15
Fund Summary & Performance (unaudited) continued
YAO | Guggenheim China All-Cap ETF
| Fund Statistics | | | | |
| Share Price | | $ | 25.07 | |
| Net Asset Value | | $ | 25.04 | |
| Premium/Discount to NAV | | | 0.12 | % |
| Net Assets ($000) | | $ | 72,607 | |
| | | | | |
| Total Returns | | | | |
| | | | | | | Since |
| | | | | | | Inception |
| (Inception 10/19/09) | | | One Year | | (Annualized) |
| Guggenheim China All-Cap ETF | | | | | | | |
| NAV | | | 3.01 | % | | 1.03 | % |
| Market | | | 3.18 | % | | 1.10 | % |
| AlphaShares China All-Cap Index | | | 3.82 | % | | 1.85 | % |
| MSCI China Index | | | -0.32 | % | | -1.43 | % |
Performance data quoted represents past performance, which is no guarantee of future results and current performance may be lower or higher than the figures shown. The deduction of taxes that a shareholder would pay on Fund distributions or the redemption of Fund shares is not reflected in the total returns. For the most recent month-end performance figures, please visit www.guggenheimfunds.com. The investment return and principal value of an investment will fluctuate with changes in market conditions and other factors so that an investor’s shares, when redeemed, may be worth more or less than their original cost.
Since inception returns assume a purchase of the Fund at the initial share price of $24.82 per share for share price returns or initial net asset value (NAV) of $24.82 per share for NAV returns. Returns for periods of less than one year are not annualized.
The Fund’s annual operating expense ratio of 0.70% is expressed as a unitary fee and covers all expenses of the Fund, except for distribution fees, if any, brokerage expenses, taxes, interest, litigation expenses and other extraordinary expenses.
| Portfolio Breakdown | | % of Net Assets |
| Financial | | | 30.4 | % |
| Communications | | | 23.4 | % |
| Energy | | | 17.7 | % |
| Industrial | | | 7.0 | % |
| Consumer, Non-cyclical | | | 6.9 | % |
| Consumer, Cyclical | | | 5.9 | % |
| Basic Materials | | | 4.5 | % |
| Diversified | | | 1.7 | % |
| Utilities | | | 1.3 | % |
| Technology | | | 1.0 | % |
| Total Common Stocks | | | 99.8 | % |
| Investments of Collateral for Securities Loaned | | | 7.8 | % |
| Total Investments | | | 107.6 | % |
| Liabilities in excess of Other Assets | | | -7.6 | % |
| Net Assets | | | 100.0 | % |
| | % of Long-Term |
| Country Breakdown | | | Investments |
| China | | | 99.9 | % |
| Singapore | | | 0.1 | % |
| | | |
| | % of Long-Term |
| Currency Denomination | | | Investments |
| Hong Kong Dollar | | | 87.5 | % |
| United States Dollar | | | 12.0 | % |
| Singapore Dollar | | | 0.5 | % |
| | | |
| | % of Long-Term |
| Top Ten Holdings | | | Investments |
| Baidu, Inc., ADR | | | 6.8 | % |
| China Mobile Ltd. | | | 5.7 | % |
| Industrial & Commercial Bank of China | | | 4.8 | % |
| CNOOC Ltd. | | | 4.8 | % |
| China Construction Bank Corp. | | | 4.5 | % |
| PetroChina Co. Ltd. | | | 4.4 | % |
| Bank of China Ltd. | | | 4.0 | % |
| Tencent Holdings Ltd. | | | 3.1 | % |
| China Life Insurance Co. Ltd. | | | 3.0 | % |
| China Petroleum & Chemical Corp. | | | 2.7 | % |
Portfolio breakdown is shown as a percentage of net assets. Country breakdown, currency denomination and holdings are shown as a percentage of long-term investments. All are subject to change daily. For more current Fund information, please visit www.guggen-heimfunds.com. The above summaries are provided for informational purposes only, and should not be viewed as recommendations.
This graph compares a hypothetical $10,000 investment in the Fund,made at its inception, with a similar investment in the MSCI China Index.Results include the reinvestment of all dividends and capital gains.Past performance is no guarantee of future results.The MSCI China Index is a capitalization-weighted index that monitors the performance of stocks from the country of China.The index is unmanaged.It is not possible to invest directly in the MSCI China Index.Investment return and principal value will fluctuate with changes in market conditions and other factors and Fund shares,when redeemed,may be worth more or less than their original investment.
16 | Annual Report | August 31, 2011
Fund Summary & Performance (unaudited) continued
CQQQ | Guggenheim China Technology ETF
| Fund Statistics | | | | |
| Share Price | | $ | 25.57 | |
| Net Asset Value | | $ | 25.44 | |
| Premium/Discount to NAV | | | 0.51 | % |
| Net Assets ($000) | | $ | 31,805 | |
| | | | | |
| Total Returns | | | | |
| | | | | | | Since |
| | | | | | | Inception |
| (Inception 12/8/09) | | | One Year | | (Annualized) |
| Guggenheim China Technology ETF | | | | | | | |
| NAV | | | 4.94 | % | | 1.16 | % |
| Market | | | 5.30 | % | | 1.45 | % |
| AlphaShares China Technology Index | | | 5.07 | % | | 1.42 | % |
| MSCI China Index | | | -0.32 | % | | -4.39 | % |
Performance data quoted represents past performance, which is no guarantee of future results, and current performance may be lower or higher than the figures shown. The deduction of taxes that a shareholder would pay on Fund distributions or the redemption of Fund shares is not reflected in the total returns. For the most recent month-end performance figures, please visit www.guggenheimfunds.com. The investment return and principal value of an investment will fluctuate with changes in market conditions and other factors so that an investor’s shares, when redeemed, may be worth more or less than their original cost.
Since inception returns assume a purchase of the Fund at the initial share price of $25.06 per share for share price returns or initial net asset value (NAV) of $25.06 per share for NAV returns. Returns for periods of less than one year are not annualized.
The Fund’s total annual operating expense ratio of 0.70% is expressed as a unitary fee and covers all expenses of the Fund, except for distribution fees, if any, brokerage expenses, taxes, interest, litigation expenses and other extraordinary expenses.
| Portfolio Breakdown | | | % of Net Assets |
| Communications | | | 59.2 | % |
| Technology | | | 18.8 | % |
| Industrial | | | 8.9 | % |
| Basic Materials | | | 5.9 | % |
| Consumer, Cyclical | | | 5.8 | % |
| Consumer, Non-cyclical | | | 1.3 | % |
| Total Common Stocks | | | 99.9 | % |
| Investments of Collateral for Securities Loaned | | | 22.4 | % |
| Total Investments | | | 122.3 | % |
| Liabilities in excess of Other Assets | | | -22.3 | % |
| Net Assets | | | 100.0 | % |
| | | | | |
| | % of Long-Term |
| Country Breakdown | | | Investments |
| China | | | 100.0 | % |
| | | | | |
| | % of Long-Term |
| Currency Denomination | | | Investments |
| Hong Kong Dollar | | | 56.9 | % |
| United States Dollar | | | 43.1 | % |
| | | | | |
| | % of Long-Term |
| Top Ten Holdings | | | Investments |
| Baidu, Inc., ADR | | | 12.4 | % |
| SINA Corp. | | | 10.0 | % |
| Lenovo Group Ltd. | | | 9.0 | % |
| Tencent Holdings Ltd. | | | 8.8 | % |
| NetEase.com, Inc., ADR | | | 7.6 | % |
| Sohu.com, Inc. | | | 4.8 | % |
| Kingboard Chemical Holdings Ltd. | | | 3.4 | % |
| ZTE Corp. | | | 3.3 | % |
| AAC Technologies Holdings, Inc. | | | 3.3 | % |
| Alibaba.com Ltd. | | | 3.1 | % |
Portfolio breakdown is shown as a percentage of net assets. Country breakdown, currency denomination and holdings are shown as a percentage of long-term investments. All are subject to change daily. For more current Fund information, please visit www.guggen-heimfunds.com. The above summaries are provided for informational purposes only, and should not be viewed as recommendations.
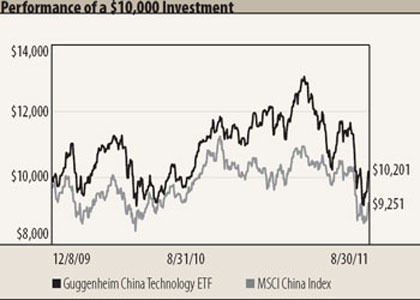
This graph compares a hypothetical $10,000 investment in the Fund, made at its inception, with a similar investment in the MSCI China Index. Results include the reinvestment of all dividends and capital gains. Past performance is no guarantee of future results. The MSCI China Index is a capitalization-weighted index that monitors the performance of stocks from the country of China. The index is unmanaged. It is not possible to invest directly in the MSCI China Index. Investment return and principal value will fluctuate with changes in market conditions and other factors and Fund shares, when redeemed, may be worth more or less than their original investment.
Annual Report | August 31, 2011 | 17
Fund Summary & Performance (unaudited) continued
EEN | Guggenheim EW Euro-Pacific LDRs ETF
| Fund Statistics | | | | |
| Share Price | | $ | 17.78 | |
| Net Asset Value | | $ | 17.59 | |
| Premium/Discount to NAV | | | 1.08 | % |
| Net Assets ($000) | | $ | 2,674 | |
| | | | | |
| Total Returns | | | | |
| | | | | | | | | | Since |
| | | | | | | Three Year | | Inception |
| (Inception 3/1/07) | | | One Year | | (Annualized) | | (Annualized) |
| Guggenheim EW Euro-Pacific LDRs ETF | | | | | | | | | | |
| NAV | | | 8.84 | % | | -2.05 | % | | -4.15 | % |
| Market | | | 8.87 | % | | -1.35 | % | | -3.92 | % |
| Robeco Developed International Equity | | | | | | | | | | |
| Index/The Bank of New York Mellon | | | | | | | | | | |
| Euro-Pacific Select ADR Index | | | 8.51 | % | | -1.63 | %1 | | -3.53 | %2 |
| MSCI EAFE Index | | | 10.01 | % | | -2.96 | % | | -4.11 | % |
Performance data quoted represents past performance, which is no guarantee of future results, and current performance may be lower or higher than the figures shown. The deduction of taxes that a shareholder would pay on Fund distributions or the redemption of Fund shares is not reflected in the total returns. For the most recent month-end performance figures, please visit www.guggenheimfunds.com. The investment return and principal value of an investment will fluctuate with changes in market conditions and other factors so that an investor’s shares, when redeemed, may be worth more or less than their original cost.
Since inception returns assume a purchase of the Fund at the initial share price of $24.15 per share for share price returns or initial net asset value (NAV) of $24.15 per share for NAV returns. Returns for periods of less than one year are not annualized.
The Fund’s annual operating expense ratio of 0.35% is expressed as a unitary fee and covers all expenses of the Fund, except for distribution fees, if any, brokerage expenses, taxes, interest, litigation expenses and other extraordinary expenses.
| | % of Long-Term |
| Country Breakdown | | | Investments |
| United Kingdom | | | 24.7 | % |
| Japan | | | 16.8 | % |
| Netherlands | | | 7.7 | % |
| Switzerland | | | 5.5 | % |
| Germany | | | 5.2 | % |
| France | | | 4.9 | % |
| Ireland | | | 4.9 | % |
| Spain | | | 4.1 | % |
| Australia | | | 3.9 | % |
| Channel Islands | | | 3.4 | % |
| Italy | | | 2.9 | % |
| Israel | | | 2.6 | % |
| Cayman Islands | | | 2.0 | % |
| Belgium | | | 1.9 | % |
| Greece | | | 1.6 | % |
| Luxembourg | | | 1.5 | % |
| New Zealand | | | 1.2 | % |
| Finland | | | 1.1 | % |
| Norway | | | 1.0 | % |
| Denmark | | | 0.9 | % |
| Portugal | | | 0.9 | % |
| Sweden | | | 0.8 | % |
| United States | | | 0.5 | % |
| | | | | |
| Portfolio Breakdown | | % of Net Assets |
| Consumer, Non-cyclical | | | 19.0 | % |
| Communications | | | 18.5 | % |
| Financial | | | 17.0 | % |
| Industrial | | | 12.9 | % |
| Consumer, Cyclical | | | 7.8 | % |
| Technology | | | 7.7 | % |
| Energy | | | 7.5 | % |
| Basic Materials | | | 6.8 | % |
| Utilities | | | 1.7 | % |
| Total Common Stocks | | | 98.9 | % |
| Exchange-Traded Fund | | | 0.5 | % |
| Total Long-Term Investments | | | 99.4 | % |
| Investments of Collateral for Securities Loaned | | | 18.6 | % |
| Total Investments | | | 118.0 | % |
| Liabilities in excess of Other Assets | | | -18.0 | % |
| Net Assets | | | 100.0 | % |
| 1 | The above benchmark return reflects the blended return of the Robeco Developed International Equity Index from 8/31/2008 - 3/30/2009 and the return of The BNY Mellon Euro-Pacific Select ADR Index from 3/31/2009 - 8/31/2011. |
| 2 | The above benchmark return reflects the blended return of the Robeco Developed International Equity Index from 3/1/2007 - 3/30/2009 and the return of The BNY Mellon Euro-Pacific Select ADR Index from 3/31/2009 - 8/31/2011. |
18 | Annual Report | August 31, 2011
Fund Summary & Performance (unaudited) continued
EEN | Guggenheim EW Euro-Pacific LDRs ETF (continued)
| | % of Long-Term |
| Currency Denomination | | | Investments |
| United States Dollar | | | 100.0 | % |
| | | | | |
| % of Long-Term |
| Top Ten Holdings | | | Investments |
| Randgold Resources Ltd. | | | 1.4 | % |
| Melco Crown Entertainment Ltd. | | | 1.3 | % |
| Telecom Corp. of New Zealand Ltd. | | | 1.2 | % |
| Shire PLC | | | 1.1 | % |
| Unilever NV | | | 1.1 | % |
| Unilever PLC | | | 1.1 | % |
| Elster Group SE | | | 1.1 | % |
| Elan Corp. PLC | | | 1.1 | % |
| Sumitomo Mitsui Financial Group, Inc. | | | 1.1 | % |
| National Grid PLC | | | 1.1 | % |
Portfolio breakdown is shown as a percentage of net assets. Country breakdown, currency denomination and holdings are shown as a percentage of long-term investments. All are subject to change daily. For more current Fund information, please visit www.guggen-heimfunds.com. The above summaries are provided for informational purposes only, and should not be viewed as recommendations.

This graph compares a hypothetical $10,000 investment in the Fund,made at its inception, with a similar investment in the MSCI EAFE Index.Results include the reinvestment of all dividends and capital gains.Past performance is no guarantee of future results.The MSCI EAFE Index is a free float-adjusted market capitalization index that is designed to measure the equity market performance of developed markets,excluding the US & Canada.It is not possible to invest directly in the MSCI EAFE Index.Investment return and principal value will fluctuate with changes in market conditions and other factors and Fund shares, when redeemed,may be worth more or less than their original investment.
Annual Report | August 31, 2011 | 19
Fund Summary & Performance (unaudited) continued
TAN | Guggenheim Solar ETF
| Fund Statistics | | | | |
| Share Price | | $ | 5.46 | |
| Net Asset Value | | $ | 5.49 | |
| Premium/Discount to NAV | | | -0.55 | % |
| Net Assets ($000) | | $ | 116,473 | |
| | | | | |
| Total Returns | | | | |
| | | | | | | | | | Since |
| | | | | | | Three Year | | Inception |
| (Inception 4/15/08) | | | One Year | | (Annualized) | | (Annualized) |
| Guggenheim Solar ETF | | | | | | | | | | |
| NAV | | | -24.81 | % | | -40.51 | % | | -36.15 | % |
| Market | | | -24.81 | % | | -40.67 | % | | -36.26 | % |
| MAC Global Solar Energy Index | | | -26.29 | % | | -40.04 | % | | -35.71 | % |
| MSCI World Index | | | 14.46 | % | | -1.28 | % | | -3.05 | % |
Performance data quoted represents past performance, which is no guarantee of future results, and current performance may be lower or higher than the figures shown. The deduction of taxes that a shareholder would pay on Fund distributions or the redemption of Fund shares is not reflected in the total returns. For the most recent month-end performance figures, please visit www.guggenheimfunds.com. The investment return and principal value of an investment will fluctuate with changes in market conditions and other factors so that an investor’s shares, when redeemed, may be worth more or less than their original cost.
Since inception returns assume a purchase of the Fund at the initial share price of $25.13 per share for share price returns or initial net asset value (NAV) of $25.13 per share for NAV returns. Returns for periods of less than one year are not annualized.
Per the most recent prospectus, the Fund’s annualized gross operating expense ratio, gross of any fee waivers or expense reimbursements, was 0.88%. In the Financial Highlights section of this Annual Report, the Fund’s annualized net operating expense ratio was 0.70% while the Fund’s annualized gross operating expense ratio, gross of any fee waivers or expense reimbursements, was 0.88%. There is a contractual fee waiver currently in place for this Fund through December 31, 2014 to the extent necessary in keeping the Fund’s operating expense ratio from exceeding 0.65% of average net assets per year. Some expenses fall outside of this expense cap and actual expenses may be higher than 0.65%. Without this expense cap, actual returns would be lower.
| | % of Long-Term |
| Country Breakdown | | | Investments |
| United States | | | 38.4 | % |
| Cayman Islands | | | 32.5 | % |
| Germany | | | 14.7 | % |
| Switzerland | | | 7.0 | % |
| Norway | | | 4.2 | % |
| British Virgin Islands | | | 1.2 | % |
| Canada | | | 1.1 | % |
| Spain | | | 0.5 | % |
| United Kingdom | | | 0.4 | % |
| | % of Long-Term |
| Currency Denomination | | | Investments |
| United States Dollar | | | 58.9 | % |
| Euro | | | 15.2 | % |
| Hong Kong Dollar | | | 14.2 | % |
| Swiss Franc | | | 7.1 | % |
| Norwegian Krone | | | 4.2 | % |
| Pound Sterling | | | 0.4 | % |
| | | | | |
| Portfolio Breakdown | | % of Net Assets |
| Energy | | | 44.0 | % |
| Industrial | | | 31.6 | % |
| Technology | | | 23.5 | % |
| Basic Materials | | | 0.5 | % |
| Total Common Stocks | | | 99.6 | % |
| Investments of Collateral for Securities Loaned | | | 51.1 | % |
| Total Investments | | | 150.7 | % |
| Liabilities in excess of Other Assets | | | -50.7 | % |
| Net Assets | | | 100.0 | % |
| | | | | |
| | % of Long-Term |
| Top Ten Holdings | | | Investments |
| First Solar, Inc. | | | 19.3 | % |
| GCL-Poly Energy Holdings Ltd. | | | 12.7 | % |
| Meyer Burger Technology AG | | | 7.0 | % |
| GT Advanced Technologies, Inc. | | | 6.7 | % |
| Trina Solar Ltd., ADR | | | 4.8 | % |
| SMA Solar Technology AG | | | 4.3 | % |
| Renewable Energy Corp. ASA | | | 4.2 | % |
| MEMC Electronic Materials, Inc. | | | 3.7 | % |
| SunPower Corp., Class A | | | 3.5 | % |
| Solarworld AG | | | 3.2 | % |
Portfolio breakdown is shown as a percentage of net assets. Country breakdown, currency denomination and holdings are shown as a percentage of long-term investments. All are subject to change daily. For more current Fund information, please visit www.guggen-heimfunds.com. The above summaries are provided for informational purposes only, and should not be viewed as recommendations.
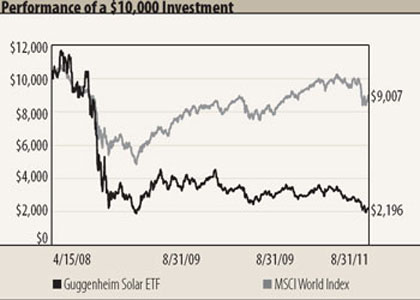
This graph compares a hypothetical $10,000 investment in the Fund, made at its inception, with a similar investment in the MSCI World Index. Results include the reinvestment of all dividends and capital gains. Past performance is no guarantee of future results. The MSCI World Index is a free float-adjusted market capitalization index that is designed to measure global developed market equity performance of the 23 developed market country indices of Europe, Australasia, the Far East, the United States and Canada. It is not possible to invest directly in the MSCI World Index.Investment return and principal value will fluctuate with changes in market conditions and other factors and Fund shares, when redeemed, may be worth more or less than their original investment.
20 | Annual Report | August 31, 2011
Fund Summary & Performance (unaudited) continued
CGW | Guggenheim S&P Global Water Index ETF
| Fund Statistics | | | | |
| Share Price | | $ | 19.99 | |
| Net Asset Value | | $ | 20.06 | |
| Premium/Discount to NAV | | | -0.35 | % |
| Net Assets ($000) | | $ | 214,190 | |
| | | | | |
| Total Returns | | | | |
| | | | | | | | | | Since |
| | | | | | | Three Year | | Inception |
| (Inception 5/14/07) | | | One Year | | (Annualized) | | (Annualized) |
| Guggenheim S&P Global | | | | | | | | | | |
| Water Index ETF | | | | | | | | | | |
| NAV | | | 19.60 | % | | -1.05 | % | | -2.13 | % |
| Market | | | 20.02 | % | | -1.46 | % | | -2.21 | % |
| S&P Global Water Index | | | 19.82 | % | | -0.48 | % | | -1.50 | % |
| MSCI World Index | | | 14.46 | % | | -1.28 | % | | -4.14 | % |
Performance data quoted represents past performance, which is no guarantee of future results and current performance may be lower or higher than the figures shown. The deduction of taxes that a shareholder would pay on Fund distributions or the redemption of Fund shares is not reflected in the total returns. For the most recent month-end performance figures, please visit www.guggenheimfunds.com. The investment return and principal value of an investment will fluctuate with changes in market conditions and other factors so that an investor’s shares, when redeemed, may be worth more or less than their original cost.
Since inception returns assume a purchase of the Fund at the initial share price of $24.78 per share for share price returns or initial net asset value (NAV) of $24.78 per share for NAV returns. Returns for periods of less than one year are not annualized.
Per the most recent prospectus, the Fund’s annualized gross operating expense ratio, gross of any fee waivers or expense reimbursements, was 0.77%. In the Financial Highlights section of this Annual Report, the Fund’s annualized net operating expense ratio was 0.70% while the Fund’s annualized gross operating expense ratio, gross of any fee waivers or expense reimbursements, was 0.78%. There is a contractual fee waiver currently in place for this Fund through December 31, 2014 to the extent necessary in keeping the Fund’s operating expense ratio from exceeding 0.65% of average net assets per year. Some expenses fall outside of this expense cap and actual expenses may be higher than 0.65%. Without this expense cap, actual returns would be lower.
| | % of Long-Term |
| Country Breakdown | | | Investments |
| United States | | | 39.8 | % |
| United Kingdom | | | 22.4 | % |
| Switzerland | | | 9.7 | % |
| France | | | 5.3 | % |
| Japan | | | 4.7 | % |
| Sweden | | | 4.2 | % |
| Brazil | | | 3.6 | % |
| Austria | | | 2.4 | % |
| China | | | 2.0 | % |
| Finland | | | 1.5 | % |
| Singapore | | | 1.3 | % |
| Italy | | | 1.2 | % |
| Spain | | | 0.9 | % |
| Netherlands | | | 0.6 | % |
| Bermuda | | | 0.4 | % |
| | % of Long-Term |
| Currency Denomination | | | Investments |
| United States Dollar | | | 43.4 | % |
| Pound Sterling | | | 22.4 | % |
| Euro | | | 11.8 | % |
| Swiss Franc | | | 9.6 | % |
| Japanese Yen | | | 4.7 | % |
| All other currencies | | | 8.1 | % |
| | | | | |
| | | |
| Portfolio Breakdown | | % of Net Assets |
| Industrials | | | 53.9 | % |
| Utilities | | | 41.7 | % |
| Basic Materials | | | 2.0 | % |
| Diversified | | | 1.7 | % |
| Total Long-Term Investments | | | 99.3 | % |
| Investments of Collateral for Securities Loaned | | | 6.2 | % |
| Total Investments | | | 105.5 | % |
| Liabilities in excess of Other Assets | | | -5.5 | % |
| Net Assets | | | 100.0 | % |
| | | | | |
| | % of Long-Term |
| Top Ten Holdings | | | Investments |
| Geberit AG | | | 9.6 | % |
| United Utilities Group PLC | | | 7.3 | % |
| Nalco Holding Co. | | | 6.4 | % |
| Severn Trent PLC | | | 6.3 | % |
| American Water Works Co., Inc. | | | 5.9 | % |
| Danaher Corp. | | | 4.4 | % |
| ALFA Laval AB | | | 4.2 | % |
| Pennon Group PLC | | | 4.2 | % |
| ITT Corp. | | | 4.0 | % |
| Cia de Saneamento Basico do Estado de Sao Paulo | | | 3.6 | % |
Portfolio breakdown is shown as a percentage of net assets. Country breakdown, currency denomination and holdings are shown as a percentage of long-term investments. All are subject to change daily. For more current Fund information, please visit www.guggen-heimfunds.com. The above summaries are provided for informational purposes only, and should not be viewed as recommendations.
Annual Report | August 31, 2011 | 21
Fund Summary & Performance (unaudited) continued
CGW | Guggenheim S&P Global Water Index ETF (continued)
This graph compares a hypothetical $10,000 investment in the Fund, made at its inception, with a similar investment in the MSCI World Index. Results include the reinvestment of all dividends and capital gains. Past performance is no guarantee of future results. The MSCI World Index is a free float-adjusted market capitalization index that measures global developed market equity performance of the developed market country indices of Europe, Australasia, the Far East, the U.S. and Canada. It is not possible to invest directly in the MSCI World Index. Investment return and principal value will fluctuate with changes in market conditions and other factors and Fund shares, when redeemed, may be worth more or less than their original investment.
22 | Annual Report | August 31, 2011
Overview of Fund Expenses | As of August 31, 2011 (unaudited)
As a shareholder of Guggenheim ABC High Dividend ETF; Guggenheim Airline ETF; Guggenheim China All-Cap ETF; Guggenheim China Technology ETF; Guggenheim EW Euro-Pacific LDRs ETF; Guggenheim Solar ETF; and Guggenheim S&P Global Water Index ETF, you incur advisory fees and other Fund expenses. The expense examples below are intended to help you understand your ongoing costs (in dollars) of investing in the Funds and to compare these costs with the ongoing costs of investing in other funds.
The example is based on an investment of $1,000 invested at the beginning of the period and held for the entire six month period ended August 31, 2011.
Actual Expense
The first line of the table below provides information about actual account values and actual expenses. You may use the information in this line, together with the amount you invested, to estimate the expenses that you paid over the period. Simply divide your account value by $1,000 (for example, an $8,600 account value divided by $1,000 = 8.6), then multiply the result by the number in the first line under the heading entitled “Expenses Paid During Period” to estimate the expenses you paid on your account during this period.
Hypothetical Example for Comparison Purposes
The second line of the table below provides information about hypothetical account values and hypothetical expenses based on the Fund’s actual expense ratio and an assumed rate of return of 5% per year before expenses, which is not the Fund’s actual return. The hypothetical account values and expenses may not be used to estimate the actual ending account balance or expenses you paid for the period. You may use this information to compare the ongoing cost of investing in the Fund and other funds. To do so, compare this 5% hypothetical example with the 5% hypothetical examples that appear in the shareholder reports of the other funds.
Please note that the expenses shown in the table are meant to highlight your ongoing costs only and do not reflect any transactional costs, such as sales charges (loads) or contingent deferred sales charges. Therefore, the second line of the table is useful in comparing ongoing costs only, and will not help you determine the relative total costs of owning different funds. In addition, if these transactional costs were included, your costs would have been higher.
| | | | Beginning Account Value | | | Ending Account Value | | | Annualized Expense Ratio for the Period Ended | | | Expenses Paid During Period1 | |
| | | | 3/1/11 | | | 8/31/11 | | | 8/31/11 | | | 3/1/11 - 8/31/11 | |
Guggenheim Airline ETF2 | | | | | | | | | | | | | |
| Actual | | $ | 1,000.00 | | $ | 770.90 | | | 0.70 | % | $ | 3.12 | |
| Hypothetical | | | 1,000.00 | | | 1,021.68 | | | 0.70 | % | | 3.57 | |
| (5% annual return before expenses) | | | | | | | | | | | | | |
| Guggenheim China All-Cap ETF | | | | | | | | | | | | | |
| Actual | | | 1,000.00 | | | 936.42 | | | 0.70 | % | | 3.42 | |
| Hypothetical | | | 1,000.00 | | | 1,021.68 | | | 0.70 | % | | 3.57 | |
| (5% annual return before expenses) | | | | | | | | | | | | | |
| Guggenheim China Technology ETF | | | | | | | | | | | | | |
| Actual | | | 1,000.00 | | | 877.86 | | | 0.70 | % | | 3.31 | |
| Hypothetical | | | 1,000.00 | | | 1,021.68 | | | 0.70 | % | | 3.57 | |
| (5% annual return before expenses) | | | | | | | | | | | | | |
| Guggenheim EW Euro-Pacific LDRs ETF | | | | | | | | | | | | | |
| Actual | | | 1,000.00 | | | 840.82 | | | 0.35 | % | | 1.62 | |
| Hypothetical | | | 1,000.00 | | | 1,023.44 | | | 0.35 | % | | 1.79 | |
| (5% annual return before expenses) | | | | | | | | | | | | | |
Guggenheim Solar ETF2 | | | | | | | | | | | | | |
| Actual | | | 1,000.00 | | | 667.89 | | | 0.70 | % | | 2.94 | |
| Hypothetical | | | 1,000.00 | | | 1,021.68 | | | 0.70 | % | | 3.57 | |
| (5% annual return before expenses) | | | | | | | | | | | | | |
Guggenheim S&P Global Water Index ETF2 | | | | | | | | | | | | | |
| Actual | | | 1,000.00 | | | 967.67 | | | 0.70 | % | | 3.47 | |
| Hypothetical | | | 1,000.00 | | | 1,021.68 | | | 0.70 | % | | 3.57 | |
| (5% annual return before expenses) | | | | | | | | | | | | | |
Annual Report | August 31, 2011 | 23
Overview of Fund Expenses (unaudited) continued
| | | | Beginning Account Value | | | Ending Account Value | | | Annualized Expense Ratio for the Period Ended | | | Expenses Paid During Period3 | |
| | | | 6/8/11 | | | 8/31/11 | | | 8/31/11 | | 6/8/11-8/31/11 | |
| Guggenheim ABC High Dividend ETF | | | | | | | | | | | | | |
| Actual | | $ | 1,000.00 | | $ | 907.64 | | | 0.65 | % | $ | 1.44 | |
Hypothetical (5% annual return before expenses)4 | | | 1,000.00 | | | 1,021.93 | | | 0.65 | % | | 3.31 | |
| 1 | Actual and hypothetical expenses are calculated using the annualized expense ratio. This represents the ongoing expenses of the Fund as a percentage of average net assets for the six months ended August 31, 2011. Expenses are calculated by multiplying the Fund’s annualized expense ratio by the average account value over the period; then multiplying that result by 184/365. |
| | |
| 2 | The expense ratios reflect an expense waiver. Please see the Notes to Financial Statements for more information. |
| | |
| 3 | Actual expenses are calculated using the annualized expense ratio. This represents the ongoing expenses of the Fund as a percentage of average net assets for the period June 8, 2011 to August 31, 2011. Expenses are calculated by multiplying the Fund’s annualized expense ratio by the average account value over the period; then multiplying that result by 85/365. |
| | |
| 4 | Hypothetical expenses reflect ongoing expenses for a full six month period as opposed to the shorter since inception period. |
| | |
| Assumes all dividends and distributions were reinvested. |
| |
| Premium/Discount Information |
| Information about the differences between the daily market price on secondary markets for Shares and the NAV of each Fund can be found at www.gugggenheimfunds.com. |
24 | Annual Report | August 31, 2011
Portfolio of Investments | August 31, 2011
ABCS | Guggenheim ABC High Dividend ETF
| | | | | | | | |
| | Number | | | | | | |
| | of Shares | | Description | | | Value | |
| | | | | | | | |
| | | | Long-Term Investments - 99.0% | | | | |
| | | | Common Stocks - 57.4% | | | | |
| | | | Australia - 29.8% | | | | |
| | 93,406 | | APN News & Media Ltd. | | $ | 86,529 | |
| | 183,250 | | Goodman Fielder Ltd. | | | 135,414 | |
| | 67,611 | | Hills Holdings Ltd. | | | 87,251 | |
| | 38,415 | | Seven West Media Ltd. | | | 150,163 | |
| | 106,083 | | Southern Cross Media Group Ltd. | | | 139,172 | |
| | 191,944 | | SP AusNet | | | 190,145 | |
| | 152,936 | | Spark Infrastructure Group | | | 205,553 | |
| | 69,536 | | TABCORP Holdings Ltd. | | | 209,260 | |
| | 117,339 | | Tatts Group Ltd. | | | 291,541 | |
| | 165,597 | | Telstra Corp. Ltd. | | | 537,359 | |
| | | | | | | 2,032,387 | |
| | | | | | | | |
| | | | Brazil - 13.1% | | | | |
| | 34,227 | | Banco Santander Brasil SA, ADR | | | 329,264 | |
| | 36,216 | | Cia Siderurgica Nacional SA, ADR | | | 363,971 | |
| | 7,654 | | CPFL Energia SA, ADR | | | 202,295 | |
| | | | | | | 895,530 | |
| | | | | | | | |
| | | | Canada - 14.5% | | | | |
| | 14,961 | | Armtec Infrastructure, Inc. | | | 34,425 | |
| | 7,676 | | Canfor Pulp Products, Inc. | | | 127,168 | |
| | 24,584 | | Chorus Aviation, Inc. | | | 109,866 | |
| | 14,941 | | EnerCare, Inc. | | | 114,290 | |
| | 15,505 | | Just Energy Group, Inc. | | | 202,008 | |
| | 90,620 | | New Flyer Industries, Inc. | | | 57,457 | |
| | 11,851 | | Parkland Fuel Corp. | | | 127,981 | |
| | 15,823 | | Superior Plus Corp. | | | 166,183 | |
| | 59,380 | | Yellow Media, Inc. | | | 49,187 | |
| | | | | | | 988,565 | |
| | | | Total Common Stocks - 57.4% | | | | |
| | | | (Cost $4,443,127) | | | 3,916,482 | |
| | | | | | | | |
| | | | Preferred Stocks - 39.8% | | | | |
| | | | Brazil - 39.8% | | | | |
| | 8,157 | | Braskem SA, ADR | | | 194,055 | |
| | 20,764 | | Cia de Bebidas das Americas SA, ADR | | | 740,029 | |
| | 20,863 | | Cia Energetica de Minas Gerais SA, ADR | | | 394,728 | |
| | 9,847 | | TAM SA, ADR | | | 206,196 | |
| | 18,916 | | Tele Norte Leste Participacoes SA, ADR | | | 247,800 | |
| | 14,871 | | Telecomunicacoes de Sao Paulo SA, ADR | | | 472,451 | |
| | 25,531 | | Ultrapar Participacoes SA, ADR | | | 452,920 | |
| | | | (Cost $2,648,052) | | | 2,708,179 | |
| | | | | | | | |
| | | | Income Trust - 1.8% | | | | |
| | | | Canada - 1.8% | | | | |
| | 8,171 | | Chemtrade Logistics Income Fund | | | 119,492 | |
| | | | (Cost $119,195) | | | | |
| | | | | | | | |
| | | | Total Investments - 99.0% | | | | |
| | | | (Cost $7,210,374) | | | 6,744,153 | |
| | | | Other Assets in excess of Liabilities - 1.0% | | | 66,940 | |
| | | | | | | | |
| | | | Net Assets - 100.0% | | $ | 6,811,093 | |
ADR - American Depositary Receipt
SA - Corporation
See notes to financial statements.
Annual Report | August 31, 2011 | 25
Portfolio of Investments continued
FAA | Guggenheim Airline ETF
| | | | | | | | |
| | Number | | | | | | |
| | of Shares | | Description | | | Value | |
| | | | | | | | |
| | | | Long-Term Investments - 100.2% | | | | |
| | | | Common Stocks - 100.2% | | | | |
| | | | Australia - 1.6% | | | | |
| | 174,277 | | Qantas Airways Ltd.(a) | | $ | 293,028 | |
| | | | | | | | |
| | | | Brazil - 1.6% | | | | |
| | 14,141 | | TAM SA, ADR | | | 296,113 | |
| | | | | | | | |
| | | | Canada - 1.6% | | | | |
| | 21,347 | | Westjet Airlines Ltd. | | | 305,409 | |
| | | | | | | | |
| | | | France - 1.7% | | | | |
| | 32,301 | | Air France-KLM | | | 318,666 | |
| | | | | | | | |
| | | | Germany - 4.7% | | | | |
| | 50,894 | | Deutsche Lufthansa AG | | | 864,304 | |
| | | | | | | | |
| | | | Hong Kong - 1.6% | | | | |
| | 150,000 | | Cathay Pacific Airways Ltd. | | | 301,939 | |
| | | | | | | | |
| | | | Ireland - 1.6% | | | | |
| | 11,389 | | Ryanair Holdings PLC, ADR | | | 300,897 | |
| | | | | | | | |
| | | | Japan - 4.4% | | | | |
| | 247,000 | | All Nippon Airways Co. Ltd.(b) | | | 817,196 | |
| | | | | | | | |
| | | | Singapore - 4.5% | | | | |
| | 90,000 | | Singapore Airlines Ltd. | | | 826,450 | |
| | | | | | | | |
| | | | South Korea - 1.6% | | | | |
| | 5,571 | | Korean Air Lines Co. Ltd. | | | 303,393 | |
| | | | | | | | |
| | | | Spain - 1.7% | | | | |
| | 108,554 | | International Consolidated Airlines Group SA(a) | | | 308,965 | |
| | | | | | | | |
| | | | Sweden - 1.8% | | | | |
| | 143,906 | | SAS AB(a) (b) | | | 331,090 | |
| | | | | | | | |
| | | | United Kingdom - 1.7% | | | | |
| | 54,696 | | easyJet PLC(a) | | | 305,828 | |
| | | | | | | | |
| | | | United States - 70.1% | | | | |
| | 13,093 | | Alaska Air Group, Inc.(a) | | | 755,859 | |
| | 224,868 | | AMR Corp.(a) (b) | | | 814,022 | |
| | 370,653 | | Delta Air Lines, Inc.(a) | | | 2,791,017 | |
| | 185,588 | | Hawaiian Holdings, Inc.(a) | | | 775,758 | |
| | 180,116 | | JetBlue Airways Corp.(a) (b) | | | 783,505 | |
| | 61,090 | | Skywest, Inc.(b) | | | 778,897 | |
| | 321,836 | | Southwest Airlines Co. | | | 2,774,226 | |
| | 147,269 | | United Continental Holdings, Inc.(a) | | | 2,737,731 | |
| | 139,367 | | US Airways Group, Inc.(a) | | | 779,062 | |
| | | | | | | 12,990,077 | |
| | | | | | | | |
| | | | Total Common Stocks - 100.2% | | | | |
| | | | (Cost $23,059,020) | | | 18,563,355 | |
| | | | | | | | |
| | | | Investments of Collateral for Securities Loaned - 12.0% | | | | |
| | 2,219,072 | | BNY Mellon Securities Lending Overnight Fund, 0.093%(c) (d) | | | 2,219,072 | |
| | | | (Cost $2,219,072) | | | | |
| | | | | | | | |
| | | | Total Investments - 112.2% | | | | |
| | | | (Cost $25,278,092) | | | 20,782,427 | |
| | | | Liabilities in excess of Other Assets - (12.2%) | | | (2,256,183 | ) |
| | | | | | | | |
| | | | Net Assets - 100.0% | | $ | 18,526,244 | |
AB - Stock Company
ADR - American Depositary Receipt
AG - Stock Corporation
PLC - Public Limited Company
SA - Corporation
| | |
| (a) | Non-income producing security. |
| | |
| (b) | Security, or portion thereof, was on loan at August 31, 2011. |
| | |
| (c) | At August 31, 2011, the total market value of the Fund’s securities on loan was $2,040,461 and the total market value of the collateral held by the Fund was $2,219,072. |
| | |
| (d) | Interest rate shown reflects yield as of August 31, 2011. |
See notes to financial statements.
26 | Annual Report | August 31, 2011
Portfolio of Investments continued
YAO | Guggenheim China All-Cap ETF
| | | | | | | | |
| | Number | | | | | | |
| | of Shares | | Description | | | Value | |
| | | | | | | | |
| | | | Long-Term Investments - 99.8% | | | | |
| | | | Common Stocks - 99.8% | | | | |
| | | | Basic Materials - 4.5% | | | | |
| | 460,000 | | Aluminum Corp. of China Ltd.(a) | | $ | 307,074 | |
| | 128,000 | | Angang Steel Co. Ltd. | | | 99,907 | |
| | 212,000 | | China BlueChemical Ltd. | | | 166,832 | |
| | 156,000 | | China Forestry Holdings Co. Ltd.(b) (c) | | | – | |
| | 155,000 | | China Molybdenum Co. Ltd.(a) | | | 90,139 | |
| | 138,000 | | Citic Pacific Ltd. | | | 278,847 | |
| | 86,000 | | Fufeng Group Ltd. | | | 42,615 | |
| | 190,000 | | Hunan Non-Ferrous Metal Corp. Ltd.(c) | | | 54,636 | |
| | 160,000 | | Jiangxi Copper Co. Ltd. | | | 458,044 | |
| | 68,000 | | Kingboard Chemical Holdings Ltd. | | | 263,632 | |
| | 203,000 | | Lee & Man Paper Manufacturing Ltd.(a) | | | 92,774 | |
| | 204,000 | | Maanshan Iron & Steel | | | 71,757 | |
| | 228,000 | | Minmetals Resources Ltd.(c) | | | 135,518 | |
| | 175,000 | | Nine Dragons Paper Holdings Ltd.(a) | | | 125,808 | |
| | 59,500 | | Real Gold Mining Ltd.(b) | | | 63,475 | |
| | 492,000 | | Shougang Concord International Enterprises Co. Ltd. | | | 36,002 | |
| | 210,000 | | Sinofert Holdings Ltd. | | | 65,240 | |
| | 276,000 | | Sinopec Shanghai Petrochemical Co. Ltd. | | | 111,964 | |
| | 170,000 | | Sinopec Yizheng Chemical Fibre Co. Ltd.(a) | | | 49,758 | |
| | 158,000 | | Yingde Gases | | | 157,196 | |
| | 101,500 | | Zhaojin Mining Industry Co. Ltd.(a) | | | 237,148 | |
| | 702,000 | | Zijin Mining Group Co. Ltd. | | | 326,233 | |
| | | | | | | 3,234,599 | |
| | | | | | | | |
| | | | Communications - 23.4% | | | | |
| | 161,500 | | Alibaba.com Ltd.(a) | | | 171,044 | |
| | 5,943 | | AsiaInfo-Linkage, Inc.(a) (c) | | | 67,988 | |
| | 33,870 | | Baidu, Inc., ADR(c) | | | 4,937,569 | |
| | 230,000 | | China Communications Services Corp. Ltd. | | | 114,858 | |
| | 406,500 | | China Mobile Ltd. | | | 4,122,586 | |
| | 1,626,000 | | China Telecom Corp. Ltd. | | | 1,062,479 | |
| | 534,000 | | China Unicom Hong Kong Ltd. | | | 1,131,116 | |
| | 164,000 | | China Wireless Technologies Ltd. | | | 31,159 | |
| | 87,545 | | Comba Telecom Systems Holdings Ltd. | | | 74,737 | |
| | 16,800 | | Ctrip.com International Ltd., ADR(c) | | | 700,896 | |
| | 13,206 | | Focus Media Holding Ltd., ADR(a) (c) | | | 414,140 | |
| | 9,901 | | Giant Interactive Group, Inc., ADR(a) | | | 80,792 | |
| | 8,334 | | NetEase.com, Inc., ADR(c) | | | 421,367 | |
| | 3,969 | | Shanda Interactive Entertainment Ltd., ADR(c) | | | 135,502 | |
| | 6,441 | | SINA Corp.(a) (c) | | | 691,828 | |
| | 3,496 | | Sohu.com, Inc.(c) | | | 285,798 | |
| | 68,000 | | TCL Communication Technology Holdings Ltd. | | | 41,116 | |
| | 96,100 | | Tencent Holdings Ltd. | | | 2,282,323 | |
| | 266,000 | | VODone Ltd.(a) | | | 36,197 | |
| | 74,440 | | ZTE Corp. | | | 206,415 | |
| | | | | | | 17,009,910 | |
| | | | | | | | |
| | | | Consumer, Cyclical - 5.9% | | | | |
| | 250,000 | | Air China Ltd. | | | 252,579 | |
| | 90,000 | | Anta Sports Products Ltd. | | | 122,701 | |
| | 252,000 | | Bosideng International Holdings Ltd. | | | 62,437 | |
| | 314,000 | | Brilliance China Automotive Holdings Ltd.(a) (c) | | | 380,929 | |
| | 60,500 | | Byd Co. Ltd.(a) (c) | | | 126,287 | |
| | 374,000 | | China Dongxiang Group Co. | | | 84,022 | |
| | 182,000 | | China Eastern Airlines Corp. Ltd.(a) (c) | | | 87,149 | |
| | 63,000 | | China Lilang Ltd. | | | 85,567 | |
| | 230,000 | | China Southern Airlines Co. Ltd.(c) | | | 151,765 | |
| | 314,000 | | China Travel International Investments | | | 58,852 | |
| | 83,000 | | Digital China Holdings Ltd. | | | 141,287 | |
| | 332,000 | | Dongfeng Motor Group Co. Ltd. | | | 529,349 | |
| | 74,000 | | Golden Eagle Retail Group Ltd.(a) | | | 185,626 | |
| | 121,500 | | Great Wall Motor Co. Ltd. | | | 174,693 | |
| | 264,000 | | Guangzhou Automobile Group Co. Ltd. | | | 285,702 | |
| | 85,000 | | Haier Electronics Group Co. Ltd.(c) | | | 95,807 | |
| | 196,000 | | Hengdeli Holdings Ltd.(a) | | | 94,356 | |
| | 2,360 | | Home Inns & Hotels Management, Inc., ADR(c) | | | 90,246 | |
| | 79,000 | | Intime Department Store Group Co. Ltd. | | | 124,742 | |
| | 86,500 | | LI Ning Co. Ltd.(a) | | | 118,818 | |
| | 72,000 | | Minth Group Ltd. | | | 79,860 | |
| | 159,500 | | Parkson Retail Group Ltd. | | | 214,178 | |
| | 306,000 | | PCD Stores Group Ltd. | | | 60,496 | |
| | 96,000 | | Peak Sport Products Co. Ltd. | | | 37,342 | |
| | 41,000 | | Ports Design Ltd. | | | 67,371 | |
| | 77,000 | | Sinotruk Hong Kong Ltd. | | | 52,687 | |
| | 46,000 | | Weichai Power Co. Ltd.(a) | | | 229,125 | |
| | 63,000 | | Wumart Stores, Inc. | | | 157,547 | |
| | 70,000 | | Zhongsheng Group Holdings Ltd. | | | 118,439 | |
| | | | | | | 4,269,959 | |
| | | | | | | | |
| | | | Consumer, Non-cyclical - 6.9% | | | | |
| | 71,000 | | Asian Citrus Holdings Ltd. | | | 51,498 | |
| | 312,000 | | Chaoda Modern Agriculture Holdings Ltd. | | | 101,334 | |
| | 189,000 | | China Agri-Industries Holdings Ltd. | | | 176,392 | |
| | 88,000 | | China Foods Ltd.(a) | | | 73,205 | |
| | 153,000 | | China Mengniu Dairy Co. Ltd. | | | 546,032 | |
| | 27,000 | | China Shineway Pharmaceutical Group Ltd. | | | 38,543 | |
| | 139,000 | | China Yurun Food Group Ltd.(a) | | | 315,842 | |
| | 184,000 | | COSCO Pacific Ltd. | | | 251,801 | |
| | 37,000 | | Hsu Fu Chi International Ltd. | | | 128,027 | |
| | 146,000 | | Jiangsu Expressway Co. Ltd. | | | 122,016 | |
| | 46,200 | | Lianhua Supermarket Holdings Co. Ltd. | | | 79,000 | |
| | 8,076 | | Mindray Medical International Ltd., ADR(a) | | | 210,380 | |
| | 14,528 | | New Oriental Education & Technology Group, ADR(c) | | | 443,104 | |
| | 204,000 | | Shandong Weigao Group Medical Polymer Co. Ltd. | | | 256,910 | |
| | 136,000 | | Shenguan Holdings Group Ltd. | | | 78,217 | |
| | 1,252,500 | | Shenzhen International Holdings Ltd. | | | 90,043 | |
See notes to financial statements.
Annual Report | August 31, 2011 | 27
Portfolio of Investments continued
YAO | Guggenheim China All-Cap ETF (continued)
| | | | | | | | |
| | Number | | | | | | |
| | of Shares | | Description | | | Value | |
| | | | | | | | |
| | | | Consumer, Non-cyclical (continued) | | | | |
| | 110,000 | | Sichuan Expressway Co. Ltd. | | $ | 47,871 | |
| | 280,000 | | Sino Biopharmaceutical | | | 80,158 | |
| | 79,600 | | Sinopharm Group Co. Ltd. | | | 191,702 | |
| | 218,000 | | Tingyi Cayman Islands Holding Corp. | | | 614,289 | |
| | 30,000 | | Tsingtao Brewery Co. Ltd. | | | 177,158 | |
| | 114,000 | | Uni-President China Holdings Ltd. | | | 64,540 | |
| | 46,000 | | United Laboratories International Holdings Ltd.(a) | | | 43,817 | |
| | 795,000 | | Want Want China Holdings Ltd. | | | 658,277 | |
| | 6,382 | | WuXi PharmaTech Cayman, Inc., ADR(c) | | | 87,497 | |
| | 164,000 | | Zhejiang Expressway Co. Ltd. | | | 102,320 | |
| | | | | | | 5,029,973 | |
| | | | | | | | |
| | | | Diversified - 1.7% | | | | |
| | 120,000 | | China Merchants Holdings International Co. Ltd. | | | 358,938 | |
| | 130,000 | | China Resources Enterprise Ltd. | | | 527,366 | |
| | 288,000 | | Guangdong Investment Ltd.(a) | | | 174,139 | |
| | 61,000 | | Shanghai Industrial Holdings Ltd. | | | 199,688 | |
| | | | | | | 1,260,131 | |
| | | | | | | | |
| | | | Energy - 17.7% | | | | |
| | 484,000 | | China Coal Energy Co. Ltd. | | | 648,676 | |
| | 322,000 | | China Longyuan Power Group Corp. | | | 292,252 | |
| | 182,000 | | China Oilfield Services Ltd. | | | 285,512 | |
| | 1,964,000 | | China Petroleum & Chemical Corp. | | | 1,938,875 | |
| | 399,500 | | China Shenhua Energy Co. Ltd. | | | 1,851,425 | |
| | 1,700,000 | | CNOOC Ltd. | | | 3,469,989 | |
| | 117,000 | | Hidili Industry International Development Ltd.(a) | | | 61,732 | |
| | 248,000 | | Kunlun Energy Co. Ltd. | | | 382,046 | |
| | 2,466,000 | | PetroChina Co. Ltd. | | | 3,178,402 | |
| | 442,000 | | United Energy Group Ltd.(c) | | | 41,989 | |
| | 230,000 | | Yanzhou Coal Mining Co. Ltd. | | | 668,772 | |
| | | | | | | 12,819,670 | |
| | | | | | | | |
| | | | Financial - 30.4% | | | | |
| | 154,000 | | Agile Property Holdings Ltd.(a) | | | 208,374 | |
| | 2,049,000 | | Agricultural Bank of China Ltd. | | | 986,405 | |
| | 7,064,000 | | Bank of China Ltd. | | | 2,920,039 | |
| | 534,000 | | Bank of Communications Co. Ltd.(a) | | | 397,605 | |
| | 1,128,000 | | China Citic Bank Corp. Ltd. | | | 605,296 | |
| | 4,435,000 | | China Construction Bank Corp. | | | 3,290,815 | |
| | 88,000 | | China Everbright Ltd. | | | 128,334 | |
| | 872,000 | | China Life Insurance Co. Ltd. | | | 2,189,613 | |
| | 459,500 | | China Merchants Bank Co. Ltd. | | | 980,389 | |
| | 482,000 | | China Minsheng Banking Corp. Ltd. | | | 400,344 | |
| | 446,000 | | China Overseas Land & Investment Ltd. | | | 947,005 | |
| | 115,600 | | China Pacific Insurance Group Co. Ltd. | | | 451,884 | |
| | 234,000 | | China Resources Land Ltd. | | | 381,506 | |
| | 93,000 | | China Taiping Insurance Holdings Co. Ltd.(c) | | | 208,454 | |
| | 680,000 | | Country Garden Holdings Co. | | | 300,296 | |
| | 5,583 | | E-House China Holdings Ltd., ADR | | | 37,909 | |
| | 551,000 | | Evergrande Real Estate Group Ltd.(a) | | | 340,942 | |
| | 402,000 | | Franshion Properties China Ltd. | | | 90,312 | |
| | 321,000 | | Glorious Property Holdings Ltd.(a) (c) | | | 61,813 | |
| | 70,500 | | Greentown China Holdings Ltd. | | | 52,945 | |
| | 118,000 | | Guangzhou R&F Properties Co. Ltd.(a) | | | 142,243 | |
| | 5,315,000 | | Industrial & Commercial Bank of China | | | 3,493,456 | |
| | 235,000 | | Kaisa Group Holdings Ltd.(a) (c) | | | 78,437 | |
| | 137,500 | | KWG Property Holding Ltd. | | | 81,021 | |
| | 145,500 | | Longfor Properties Co. Ltd. | | | 210,695 | |
| | 272,000 | | PICC Property & Casualty Co. Ltd. | | | 477,680 | |
| | 189,500 | | Ping An Insurance Group Co. of China Ltd. | | | 1,516,798 | |
| | 198,000 | | Poly Hong Kong Investments Ltd.(a) | | | 116,670 | |
| | 924,000 | | Renhe Commercial Holdings Co. Ltd. | | | 181,487 | |
| | 232,000 | | Shenzhen Investment Ltd. | | | 60,758 | |
| | 172,500 | | Shimao Property Holdings Ltd. | | | 181,366 | |
| | 479,000 | | Sino-Ocean Land Holdings Ltd.(a) | | | 227,520 | |
| | 217,500 | | Soho China Ltd. | | | 192,101 | |
| | 81,000 | | Yanlord Land Group Ltd. (Singapore) | | | 60,973 | |
| | 570,000 | | Yuexiu Property Co. Ltd.(a) (c) | | | 100,248 | |
| | | | | | | 22,101,733 | |
| | | | | | | | |
| | | | Industrial - 7.0% | | | | |
| | 67,988 | | AAC Technologies Holdings, Inc. | | | 142,266 | |
| | 151,000 | | Anhui Conch Cement Co. Ltd. | | | 631,941 | |
| | 236,000 | | AviChina Industry & Technology Co. Ltd. | | | 113,309 | |
| | 138,000 | | BBMG Corp. | | | 154,836 | |
| | 224,000 | | Beijing Capital International Airport Co. Ltd. | | | 106,973 | |
| | 522,000 | | China Communications Construction Co. Ltd. | | | 377,948 | |
| | 304,000 | | China COSCO Holdings Co. Ltd. | | | 170,935 | |
| | 224,000 | | China Everbright International Ltd. | | | 77,354 | |
| | 126,000 | | China High Speed Transmission Equipment Group Co. Ltd. | | | 73,921 | |
| | 310,000 | | China National Building Material Co. Ltd. | | | 521,333 | |
| | 138,000 | | China National Materials Co. Ltd. | | | 83,442 | |
| | 221,500 | | China Railway Construction Corp. Ltd. | | | 117,722 | |
| | 450,000 | | China Railway Group Ltd. | | | 129,402 | |
| | 231,000 | | China Shanshui Cement Group Ltd. | | | 229,231 | |
| | 434,000 | | China Shipping Container Lines Co. Ltd.(c) | | | 100,287 | |
| | 158,000 | | China Shipping Development Co. Ltd. | | | 112,978 | |
| | 152,000 | | China State Construction International Holdings Ltd.(a) | | | 120,981 | |
| | 163,200 | | China Zhongwang Holdings Ltd.(a) | | | 71,652 | |
| | 198,000 | | CSR Corp. Ltd. | | | 114,891 | |
| | 40,400 | | Dongfang Electric Corp. Ltd.(a) | | | 137,439 | |
| | 174,000 | | Guangshen Railway Co. Ltd.(a) | | | 63,438 | |
| | 58,000 | | Haitian International Holdings Ltd. | | | 53,907 | |
| | 84,000 | | Harbin Electric Co. Ltd. | | | 106,757 | |
| | 100,000 | | Kingboard Laminates Holdings Ltd. | | | 60,978 | |
| | 352,000 | | Lonking Holdings Ltd. | | | 142,795 | |
| | 334,000 | | Metallurgical Corp. of China Ltd. | | | 94,759 | |
| | 239,000 | | NVC Lighting Holdings Ltd. | | | 108,000 | |
See notes to financial statements.
28 | Annual Report | August 31, 2011
Portfolio of Investments continued
YAO | Guggenheim China All-Cap ETF (continued)
| | | | | | | | |
| | Number | | | | | | |
| | of Shares | | Description | | | Value | |
| | | | | | | | |
| | | | Industrial (continued) | | | | |
| | 102,000 | | Sany Heavy Equipment International Holdings Co. Ltd. | | $ | 101,219 | |
| | 344,000 | | Shanghai Electric Group Co. Ltd. | | | 157,655 | |
| | 210,000 | | Sinotrans Ltd. | | | 40,977 | |
| | 146,000 | | Sinotrans Shipping Ltd.(a) | | | 38,048 | |
| | 14,755 | | Suntech Power Holdings Co. Ltd., ADR(a) (c) | | | 77,464 | |
| | 568,000 | | Tianjin Port Development Holdings Ltd. | | | 95,522 | |
| | 210,000 | | Yangzijiang Shipbuilding Holdings Ltd. | | | 202,620 | |
| | 53,000 | | Zhuzhou CSR Times Electric Co. Ltd. | | | 126,280 | |
| | | | | | | 5,059,260 | |
| | | | | | | | |
| | | | Technology - 1.0% | | | | |
| | 2,900 | | Camelot Information Systems, Inc., ADR(a) (c) | | | 17,139 | |
| | 668,000 | | Lenovo Group Ltd. | | | 447,640 | |
| | 2,329,000 | | Semiconductor Manufacturing International Corp.(c) | | | 125,574 | |
| | 166,000 | | TPV Technology Ltd. | | | 74,373 | |
| | 111,000 | | Travelsky Technology Ltd. | | | 59,849 | |
| | | | | | | 724,575 | |
| | | | | | | | |
| | | | Utilities - 1.3% | | | | |
| | 53,500 | | Beijing Enterprises Holdings Ltd. | | | 258,240 | |
| | 54,000 | | China Resources Gas Group Ltd.(a) | | | 83,049 | |
| | 190,000 | | China Resources Power Holdings Co. Ltd. | | | 320,990 | |
| | 390,000 | | Datang International Power Generation Co. Ltd. | | | 108,644 | |
| | 418,000 | | Huaneng Power International, Inc. | | | 204,985 | |
| | | | | | | 975,908 | |
| | | | | | | | |
| | | | Total Common Stocks - 99.8% | | | | |
| | | | (Cost $78,437,259) | | | 72,485,718 | |
| | | | | | | | |
| | | | Investments of Collateral for Securities Loaned - 7.8% | | | | |
| | 5,651,302 | | BNY Mellon Securities Lending Overnight Fund, 0.093%(d) (e) | | | | |
| | | | (Cost $5,651,302) | | | 5,651,302 | |
| | | | | | | | |
| | | | Total Investments - 107.6% | | | | |
| | | | (Cost $84,088,561) | | | 78,137,020 | |
| | | | Liabilities in excess of Other Assets - (7.6%) | | | (5,530,189 | ) |
| | | | | | | | |
| | | | Net Assets - 100.0% | | $ | 72,606,831 | |
ADR - American Depositary Receipt
| | |
| (a) | Security, or portion thereof, was on loan at August 31, 2011. |
| | |
| (b) | Security is valued in accordance with Fair Valuation procedures established in good faith by the Board of Trustees. The total market value of such securities is $63,475 which represents 0.1% of net assets applicable to common shares. |
| | |
| (c) | Non-income producing security. |
| | |
| (d) | At August 31, 2011, the total market value of the Fund’s securities on loan was $5,310,931 and the total market value of the collateral held by the Fund was $5,662,498, consisting of cash collateral of $5,651,302 and U.S. Government and Agency securities valued at $11,196. |
| | |
| (e) | Interest rate shown reflects yield as of August 31, 2011. |
Securities are classified by sectors that represent broad groupings of related industries.
See notes to financial statements.
Annual Report | August 31, 2011 | 29
Portfolio of Investments continued
CQQQ | Guggenheim China Technology ETF
| | | | | | | | |
| | Number | | | | | | |
| | of Shares | | Description | | | Value | |
| | | | | | | | |
| | | | Long-Term Investments - 99.9% | | | | |
| | | | Common Stocks - 99.9% | | | | |
| | | | Basic Materials - 5.9% | | | | |
| | 10,764,000 | | G-Resources Group Ltd.(a) | | $ | 801,463 | |
| | 279,000 | | Kingboard Chemical Holdings Ltd. | | | 1,081,666 | |
| | | | | | | 1,883,129 | |
| | | | | | | | |
| | | | Communications - 59.2% | | | | |
| | 931,000 | | Alibaba.com Ltd.(b) | | | 986,020 | |
| | 39,398 | | AsiaInfo-Linkage, Inc.(a) (b) | | | 450,713 | |
| | 27,029 | | Baidu, Inc., ADR(a) | | | 3,940,288 | |
| | 462,000 | | BYD Electronic International Co. Ltd.(a) | | | 138,784 | |
| | 1,044,000 | | China Wireless Technologies Ltd. | | | 198,355 | |
| | 561,870 | | Comba Telecom Systems Holdings Ltd. | | | 479,667 | |
| | 65,782 | | Giant Interactive Group, Inc., ADR(b) | | | 536,781 | |
| | 47,485 | | NetEase.com, Inc., ADR(a) | | | 2,400,842 | |
| | 26,414 | | Shanda Interactive Entertainment Ltd., ADR(a) | | | 901,774 | |
| | 29,462 | | SINA Corp.(a) (b) | | | 3,164,513 | |
| | 18,769 | | Sohu.com, Inc.(a) | | | 1,534,366 | |
| | 446,000 | | TCL Communication Technology Holdings Ltd. | | | 269,673 | |
| | 117,400 | | Tencent Holdings Ltd. | | | 2,788,187 | |
| | 378,200 | | ZTE Corp. | | | 1,048,715 | |
| | | | | | | 18,838,678 | |
| | | | | | | | |
| | | | Consumer, Cyclical - 5.8% | | | | |
| | 393,500 | | Byd Co. Ltd.(a) (b) | | | 821,386 | |
| | 553,000 | | Digital China Holdings Ltd. | | | 941,349 | |
| | 1,880,000 | | Inspur International Ltd. | | | 63,957 | |
| | | | | | | 1,826,692 | |
| | | | | | | | |
| | | | Consumer, Non-cyclical - 1.3% | | | | |
| | 1,386,000 | | Hi Sun Technology China Ltd.(a) | | | 403,897 | |
| | | | | | | | |
| | | | Industrial - 8.9% | | | | |
| | 499,992 | | AAC Technologies Holdings, Inc. | | | 1,046,243 | |
| | 1,496,000 | | China Aerospace International Holdings Ltd. | | | 122,912 | |
| | 25,442 | | China Digital TV Holding Co. Ltd., ADR | | | 130,009 | |
| | 459,000 | | China High Precision Automation Group Ltd.(b) | | | 244,536 | |
| | 666,000 | | Kingboard Laminates Holdings Ltd. | | | 406,116 | |
| | 6,060,000 | | Sino-Tech International Holdings Ltd.(a) | | | 94,133 | |
| | 96,493 | | Suntech Power Holdings Co. Ltd., ADR(a) (b) | | | 506,588 | |
| | 921,000 | | Truly International Holdings | | | 130,057 | |
| | 356,000 | | Wasion Group Holdings Ltd. | | | 139,847 | |
| | | | | | | 2,820,441 | |
| | | | | | | | |
| | | | Technology - 18.8% | | | | |
| | 6,994,000 | | Apollo Solar Energy Technology Holdings Ltd.(a) | | | 168,797 | |
| | 19,271 | | Camelot Information Systems, Inc., ADR(a) (b) | | | 113,892 | |
| | 540,000 | | China ITS Holdings Co. Ltd.(a) | | | 112,996 | |
| | 348,000 | | Great Wall Technology Co. Ltd. | | | 91,583 | |
| | 656,000 | | Ju Teng International Holdings Ltd. | | | 136,427 | |
| | 1,328,000 | | Kingdee International Software Group Co. Ltd.(b) | | | 538,725 | |
| | 502,000 | | Kingsoft Corp. Ltd. | | | 261,000 | |
| | 4,286,000 | | Lenovo Group Ltd. | | | 2,872,134 | |
| | 15,473,000 | | Semiconductor Manufacturing International Corp.(a) (b) | | | 834,269 | |
| | 1,042,000 | | TPV Technology Ltd. | | | 466,848 | |
| | 714,500 | | Travelsky Technology Ltd. | | | 385,242 | |
| | | | | | | 5,981,913 | |
| | | | | | | | |
| | | | Total Common Stocks - 99.9% | | | | |
| | | | (Cost $35,877,046) | | | 31,754,750 | |
| | | | | | | | |
| | | | Investments of Collateral for Securities Loaned - 22.4% | | | | |
| | 7,129,666 | | BNY Mellon Securities Lending Overnight Fund, 0.093%(c) (d) | | | | |
| | | | (Cost $7,129,666) | | | 7,129,666 | |
| | | | | | | | |
| | | | Total Investments - 122.3% | | | | |
| | | | (Cost $43,006,712) | | | 38,884,416 | |
| | | | Liabilities in excess of Other Assets - (22.3%) | | | (7,079,365 | ) |
| | | | Net Assets - 100.0% | | $ | 31,805,051 | |
ADR - American Depositary Receipt
| | |
| (a) | Non-income producing security. |
| | |
| (b) | Security, or portion thereof, was on loan at August 31, 2011. |
| | |
| (c) | At August 31, 2011, the total market value of the Fund’s securities on loan was $6,761,424 and the total market value of the collateral held by the Fund was $7,132,726, consisting of cash collateral of $7,129,666 and U.S. Government and Agency securities valued at $3,060. |
| | |
| (d) | Interest rate shown reflects yield as of August 31, 2011. |
Securities are classified by sectors that represent broad groupings of related industries.
See notes to financial statements.
30 | Annual Report | August 31, 2011
Portfolio of Investments continued
EEN | Guggenheim EW Euro-Pacific LDRs ETF
| | | | | | | | |
| | Number | | | | | | |
| | of Shares | | Description | | | Value | |
| | | | | | | | |
| | | | Long-Term Investments - 99.4% | | | | |
| | | | Common Stocks - 98.9% | | | | |
| | | | Australia - 3.9% | | | | |
| | 3,024 | | Alumina Ltd., ADR(a) | | $ | 23,134 | |
| | 307 | | BHP Billiton Ltd., ADR(a) | | | 26,147 | |
| | 1,623 | | Sims Metal Management Ltd., ADR(a) | | | 26,828 | |
| | 243 | | Westpac Banking Corp., ADR(a) | | | 26,975 | |
| | | | | | | 103,084 | |
| | | | | | | | |
| | | | Belgium - 1.9% | | | | |
| | 482 | | Anheuser-Busch InBev NV, ADR | | | 26,636 | |
| | 355 | | Delhaize Group SA, ADR | | | 23,838 | |
| | | | | | | 50,474 | |
| | | | | | | | |
| | | | Cayman Islands - 2.0% | | | | |
| | 2,599 | | Melco Crown Entertainment Ltd., ADR(b) | | | 33,787 | |
| | 7,005 | | Semiconductor Manufacturing International Corp., ADR(b) | | | 18,633 | |
| | | | | | | 52,420 | |
| | | | | | | | |
| | | | Channel Islands - 3.4% | | | | |
| | 354 | | Randgold Resources Ltd., ADR(a) | | | 37,365 | |
| | 307 | | Shire PLC, ADR | | | 29,810 | |
| | 468 | | WPP PLC, ADR | | | 24,509 | |
| | | | | | | 91,684 | |
| | | | | | | | |
| | | | Denmark - 0.9% | | | | |
| | 228 | | NOVO Nordisk A/S, ADR | | | 24,319 | |
| | | | | | | | |
| | | | Finland - 1.1% | | | | |
| | 4,500 | | Nokia OYJ, ADR(a) | | | 28,980 | |
| | | | | | | | |
| | | | France - 4.9% | | | | |
| | 5,280 | | Alcatel-Lucent, ADR(b) | | | 19,325 | |
| | 762 | | CIE Generale de Geophysique - Veritas, ADR(b) | | | 19,416 | |
| | 1,342 | | France Telecom SA, ADR | | | 24,545 | |
| | 745 | | Sanofi-Aventis SA, ADR | | | 27,245 | |
| | 505 | | Total SA, ADR | | | 24,765 | |
| | 962 | | Veolia Environnement SA, ADR(a) | | | 16,094 | |
| | | | | | | 131,390 | |
| | | | | | | | |
| | | | Germany - 5.2% | | | | |
| | 730 | | Aixtron SE, ADR(a) | | | 16,491 | |
| | 489 | | Deutsche Bank AG | | | 19,790 | |
| | 1,710 | | Elster Group SE, ADR(b) | | | 29,412 | |
| | 384 | | Fresenius Medical Care AG & Co. KGaA, ADR | | | 26,135 | |
| | 462 | | SAP AG, ADR(a) | | | 25,184 | |
| | 213 | | Siemens AG, ADR | | | 21,981 | |
| | | | | | | 138,993 | |
| | | | | | | | |
| | | | Greece - 1.6% | | | | |
| | 1,087 | | Coca-Cola Hellenic Bottling Co. SA, ADR(b) | | | 23,533 | |
| | 20,361 | | National Bank of Greece SA, ADR(a) (b) | | | 17,918 | |
| | | | | | | 41,451 | |
| | | | | | | | |
| | | | Ireland - 4.9% | | | | |
| | 1,320 | | CRH PLC, ADR(a) | | | 23,760 | |
| | 2,753 | | Elan Corp. PLC, ADR(b) | | | 29,374 | |
| | 22,285 | | Governor & Co. of the Bank of Ireland, ADR(a) (b) | | | 27,633 | |
| | 1,161 | | ICON PLC, ADR(b) | | | 24,741 | |
| | 937 | | Ryanair Holdings PLC, ADR | | | 24,756 | |
| | | | | | | 130,264 | |
| | | | | | | | |
| | | | Israel - 2.6% | | | | |
| | 844 | | NICE Systems Ltd., ADR(b) | | | 26,341 | |
| | 1,722 | | Partner Communications Co. Ltd., ADR | | | 18,804 | |
| | 572 | | Teva Pharmaceutical Industries Ltd., ADR | | | 23,658 | |
| | | | | | | 68,803 | |
| | | | | | | | |
| | | | Italy - 2.8% | | | | |
| | 599 | | ENI SpA, ADR | | | 24,122 | |
| | 912 | | Luxottica Group SpA, ADR | | | 27,159 | |
| | 2,046 | | Telecom Italia SpA, ADR | | | 24,879 | |
| | | | | | | 76,160 | |
| | | | | | | | |
| | | | Japan - 16.7% | | | | |
| | 1,556 | | Advantest Corp., ADR | | | 20,181 | |
| | 598 | | Canon, Inc., ADR | | | 28,250 | |
| | 485 | | Hitachi Ltd., ADR | | | 26,268 | |
| | 761 | | Honda Motor Co. Ltd., ADR | | | 24,710 | |
| | 653 | | Kubota Corp., ADR | | | 27,060 | |
| | 275 | | Kyocera Corp., ADR | | | 25,410 | |
| | 653 | | Makita Corp., ADR | | | 26,956 | |
| | 6,275 | | Mitsubishi UFJ Financial Group, Inc., ADR | | | 28,237 | |
| | 9,279 | | Mizuho Financial Group, Inc., ADR | | | 28,115 | |
| | 1,255 | | Nidec Corp., ADR | | | 27,572 | |
| | 1,188 | | Nippon Telegraph & Telephone Corp., ADR | | | 27,823 | |
| | 5,718 | | Nomura Holdings, Inc., ADR(a) | | | 23,958 | |
| | 1,551 | | NTT DoCoMo, Inc., ADR(a) | | | 28,337 | |
| | 2,478 | | Panasonic Corp., ADR | | | 26,341 | |
| | 1,105 | | Sony Corp., ADR | | | 24,255 | |
| | 4,965 | | Sumitomo Mitsui Financial Group, Inc., ADR | | | 29,145 | |
| | 345 | | Toyota Motor Corp., ADR | | | 24,785 | |
| | | | | | | 447,403 | |
| | | | | | | | |
| | | | Luxembourg - 1.5% | | | | |
| | 864 | | ArcelorMittal, NY Registered Shares(a) | | | 18,982 | |
| | 601 | | Tenaris SA, ADR | | | 19,953 | |
| | | | | | | 38,935 | |
| | | | | | | | |
| | | | Netherlands - 7.7% | | | | |
| | 4,295 | | Aegon NV, NY Registered Shares(b) | | | 19,456 | |
| | 714 | | ASM International NV, NY Registered Shares | | | 18,935 | |
| | 747 | | ASML Holding NV, NY Registered Shares | | | 26,347 | |
| | 722 | | CNH Global NV(b) | | | 23,913 | |
| | 2,396 | | ING Groep NV, ADR(b) | | | 20,869 | |
| | 1,079 | | Koninklijke Philips Electronics NV, NY Registered Shares | | | 22,843 | |
| | 1,064 | | Reed Elsevier NV, ADR | | | 25,185 | |
See notes to financial statements.
Annual Report | August 31, 2011 | 31
Portfolio of Investments continued
EEN | Guggenheim EW Euro-Pacific LDRs ETF (continued)
| | | | | | | | |
| | Number | | | | | | |
| | of Shares | | Description | | | Value | |
| | | | | | | | |
| | | | Netherlands (continued) | | | | |
| | 2,693 | | STMicroelectronics NV, NY Registered Shares(a) | | $ | 17,935 | |
| | 872 | | Unilever NV, NY Registered Shares | | | 29,648 | |
| | | | | | | 205,131 | |
| | | | | | | | |
| | | | New Zealand - 1.2% | | | | |
| | 2,964 | | Telecom Corp. of New Zealand Ltd., ADR | | | 32,337 | |
| | | | | | | | |
| | | | Norway - 1.0% | | | | |
| | 1,133 | | Statoil ASA, ADR(a) | | | 27,294 | |
| | | | | | | | |
| | | | Portugal - 0.9% | | | | |
| | 2,678 | | Portugal Telecom SGPS SA, ADR | | | 23,058 | |
| | | | | | | | |
| | | | Spain - 4.0% | | | | |
| | 2,516 | | Banco Bilbao Vizcaya Argentaria SA, ADR(a) | | | 22,870 | |
| | 2,478 | | Banco Santander SA, ADR | | | 22,996 | |
| | 3,141 | | Promotora de Informaciones SA, ADR(a) (b) | | | 19,066 | |
| | 2,775 | | Promotora de Informaciones SA, Class B, ADR(b) | | | 18,315 | |
| | 1,180 | | Telefonica SA, ADR | | | 24,603 | |
| | | | | | | 107,850 | |
| | | | | | | | |
| | | | Sweden - 0.8% | | | | |
| | 1,971 | | Telefonaktiebolaget LM Ericsson, ADR | | | 22,095 | |
| | | | | | | | |
| | | | Switzerland - 5.4% | | | | |
| | 1,088 | | ABB Ltd., ADR(b) | | | 23,142 | |
| | 688 | | Credit Suisse Group AG, ADR | | | 19,746 | |
| | 2,366 | | Logitech International SA(a) (b) | | | 27,422 | |
| | 459 | | Novartis AG, ADR | | | 26,833 | |
| | 414 | | Syngenta AG, ADR | | | 26,210 | |
| | 1,540 | | UBS AG(b) | | | 22,299 | |
| | | | | | | 145,652 | |
| | | | | | | | |
| | | | United Kingdom - 24.5% | | | | |
| | 1,012 | | ARM Holdings PLC, ADR | | | 27,911 | |
| | 545 | | AstraZeneca PLC, ADR | | | 25,844 | |
| | 1,976 | | Aviva PLC, ADR(a) | | | 21,894 | |
| | 1,648 | | Barclays Bank PLC, ADR | | | 18,408 | |
| | 371 | | BHP Billiton PLC, ADR | | | 25,273 | |
| | 640 | | BP PLC, ADR | | | 25,210 | |
| | 315 | | British American Tobacco PLC, ADR(a) | | | 28,227 | |
| | 870 | | BT Group PLC, ADR(a) | | | 24,325 | |
| | 748 | | Carnival PLC, ADR | | | 24,370 | |
| | 335 | | Diageo PLC, ADR | | | 26,887 | |
| | 518 | | Ensco PLC, ADR | | | 24,999 | |
| | 670 | | GlaxoSmithKline PLC, ADR | | | 28,696 | |
| | 556 | | HSBC Holdings PLC, ADR | | | 24,219 | |
| | 1,430 | | Intercontinental Hotels Group PLC, ADR | | | 24,424 | |
| | 9,130 | | Lloyds Banking Group PLC, ADR(b) | | | 19,903 | |
| | 573 | | National Grid PLC, ADR | | | 29,063 | |
| | 1,487 | | Pearson PLC, ADR | | | 26,870 | |
| | 1,200 | | Prudential PLC, ADR | | | 24,144 | |
| | 786 | | Reed Elsevier PLC, ADR | | | 25,852 | |
| | 410 | | Rio Tinto PLC, ADR | | | 25,076 | |
| | 2,095 | | Royal Bank of Scotland Group PLC, ADR(b) | | | 16,550 | |
| | 402 | | Royal Dutch Shell PLC, ADR | | | 26,954 | |
| | 398 | | Royal Dutch Shell PLC, Class B, ADR | | | 26,857 | |
| | 520 | | Smith & Nephew PLC, ADR(a) | | | 26,504 | |
| | 878 | | Unilever PLC, ADR | | | 29,624 | |
| | 1,067 | | Vodafone Group PLC, ADR | | | 28,105 | |
| | | | | | | 656,189 | |
| | | | | | | | |
| | | | Total Common Stocks - 98.9% | | | | |
| | | | (Cost $2,368,080) | | | 2,643,966 | |
| | | | | | | | |
| | | | Exchange Traded Fund - 0.5% | | | | |
| | 262 | | iShares MSCI EAFE Index Fund | | | | |
| | | | (Cost $14,788) | | | 14,040 | |
| | | | | | | | |
| | | | Total Long-Term Investments - 99.4% | | | | |
| | | | (Cost $2,382,868) | | | 2,658,006 | |
| | | | | | | | |
| | | | Investments of Collateral for Securities Loaned - 18.6% | | | | |
| | 497,346 | | BNY Mellon Securities Lending Overnight Fund, 0.093%(c) (d) | | | | |
| | | | (Cost $497,346) | | | 497,346 | |
| | | | | | | | |
| | | | Total Investments - 118.0% | | | | |
| | | | (Cost $2,880,214) | | | 3,155,352 | |
| | | | Liabilities in excess of Other Assets - (18.0%) | | | (481,774 | ) |
| | | | Net Assets - 100.0% | | $ | 2,673,578 | |
ADR - American Depositary Receipt
AG - Stock Corporation
ASA - Stock Company
A/S - Limited Liability Stock Company or Stock Company
KGaA - Limited Partnership
NV - Publicly Traded Company
OYJ - Public Traded Company
PLC - Public Limited Company
SA - Corporation
SpA - Limited Share Company
SE - Stock Corporation
SGPS - Holding Enterprise
| | |
| (a) | Security, or portion thereof, was on loan at August 31, 2011. |
| | |
| (b) | Non-income producing security. |
| | |
| (c) | At August 31, 2011, the total market value of the Fund’s securities on loan was $477,474 and the total market value of the collateral held by the Fund was $497,346. |
| | |
| (d) | Interest rate shown reflects yield as of August 31, 2011. |
See notes to financial statements.
32 | Annual Report | August 31, 2011
Portfolio of Investments continued
TAN | Guggenheim Solar ETF
| | | | | | | | |
| | Number | | | | | | |
| | of Shares | | Description | | | Value | |
| | | | | | | | |
| | | | Long-Term Investments - 99.6% | | | | |
| | | | Common Stocks - 99.6% | | | | |
| | | | British Virgin Islands - 1.2% | | | | |
| | 396,416 | | Renesola Ltd., ADR(a) (b) | | $ | 1,375,564 | |
| | | | | | | | |
| | | | Canada - 1.1% | | | | |
| | 189,739 | | Canadian Solar, Inc.(a) (b) | | | 1,278,841 | |
| | | | | | | | |
| | | | Cayman Islands - 32.3% | | | | |
| | 186,840 | | China Sunergy Co. Ltd., ADR(a) (b) | | | 227,945 | |
| | 97,887 | | Daqo New Energy Corp., ADR(a) (b) | | | 549,146 | |
| | 33,262,000 | | GCL-Poly Energy Holdings Ltd.(a) | | | 14,688,886 | |
| | 226,622 | | Hanwha SolarOne Co. Ltd., ADR(a) (b) | | | 888,358 | |
| | 749,375 | | JA Solar Holdings Co. Ltd., ADR(b) | | | 2,742,712 | |
| | 81,254 | | JinkoSolar Holding Co. Ltd., ADR(a) (b) | | | 1,333,378 | |
| | 443,239 | | LDK Solar Co. Ltd., ADR(a) (b) | | | 2,530,895 | |
| | 6,552,000 | | Solargiga Energy Holdings Ltd. | | | 916,817 | |
| | 678,648 | | Suntech Power Holdings Co. Ltd., ADR(a) (b) | | | 3,562,902 | |
| | 352,097 | | Trina Solar Ltd., ADR(a) (b) | | | 5,591,300 | |
| | 3,523,000 | | Trony Solar Holdings Co. Ltd.(b) | | | 895,488 | |
| | 581,928 | | Yingli Green Energy Holding Co. Ltd., ADR(a) (b) | | | 3,712,701 | |
| | | | | | | 37,640,528 | |
| | | | | | | | |
| | | | Germany - 14.6% | | | | |
| | 62,966 | | Centrotherm Photovoltaics AG | | | 2,098,743 | |
| | 403,797 | | Conergy AG(a) (b) | | | 299,414 | |
| | 18,008 | | Manz AG(a) (b) | | | 715,222 | |
| | 50,771 | | Phoenix Solar AG(a) | | | 932,026 | |
| | 701,504 | | Q-Cells SE(a) (b) | | | 932,253 | |
| | 90,670 | | Roth & Rau AG(b) | | | 2,880,512 | |
| | 48,153 | | SMA Solar Technology AG(a) | | | 5,026,474 | |
| | 79,575 | | Solar Millennium AG(a) (b) | | | 367,891 | |
| | 443,959 | | Solarworld AG(a) | | | 3,750,897 | |
| | | | | | | 17,003,432 | |
| | | | | | | | |
| | | | Norway - 4.2% | | | | |
| | 2,629,857 | | Renewable Energy Corp. ASA(a) (b) | | | 4,904,248 | |
| | | | | | | | |
| | | | Spain - 0.6% | | | | |
| | 278,560 | | Solaria Energia y Medio Ambiente SA | | | 631,686 | |
| | | | | | | | |
| | | | Switzerland - 7.0% | | | | |
| | 222,817 | | Meyer Burger Technology AG(a) (b) | | | 8,164,477 | |
| | | | | | | | |
| | | | United Kingdom - 0.4% | | | | |
| | 1,993,403 | | PV Crystalox Solar PLC | | | 494,978 | |
| | | | | | | | |
| | | | United States - 38.2% | | | | |
| | 59,135 | | Amtech Systems, Inc.(b) | | | 641,615 | |
| | 412,996 | | Energy Conversion Devices, Inc.(a) (b) | | | 309,830 | |
| | 223,849 | | First Solar, Inc.(a) (b) | | | 22,380,423 | |
| | 634,168 | | GT Advanced Technologies, Inc.(b) | | | 7,743,191 | |
| | 615,164 | | MEMC Electronic Materials, Inc.(b) | | | 4,293,845 | |
| | 337,907 | | Power-One, Inc.(a) (b) | | | 2,554,577 | |
| | 744,207 | | Satcon Technology Corp.(a) (b) | | | 989,795 | |
| | 131,323 | | STR Holdings, Inc.(b) | | | 1,489,203 | |
| | 291,351 | | SunPower Corp., Class A(a) (b) | | | 4,108,049 | |
| | | | | | | 44,510,528 | |
| | | | | | | | |
| | | | Total Common Stocks - 99.6% | | | | |
| | | | (Cost $187,770,464) | | | 116,004,282 | |
| | | | | | | | |
| | | | Investments of Collateral for Securities Loaned - 51.1% | | | | |
| | 59,573,545 | | BNY Mellon Securities Lending Overnight Fund, 0.093%(c) (d) | | | | |
| | | | (Cost $59,573,545) | | | 59,573,545 | |
| | | | | | | | |
| | | | Total Investments - 150.7% | | | | |
| | | | (Cost $247,344,009) | | | 175,577,827 | |
| | | | Liabilities in excess of Other Assets - (50.7%) | | | (59,104,412 | ) |
| | | | Net Assets - 100.0% | | $ | 116,473,415 | |
ADR - American Depositary Receipt
AG - Stock Corporation
ASA - Stock Company
PLC - Public Limited Company
SA - Corporation
SE - Stock Corporation
| | |
| (a) | Security, or portion thereof, was on loan at August 31, 2011. |
| | |
| (b) | Non-income producing security. |
| | |
| (c) | At August 31, 2011, the total market value of the Fund’s securities on loan was $56,475,098 and the total market value of the collateral held by the Fund was $59,573,545. |
| | |
| (d) | Interest rate shown reflects yield as of August 31, 2011. |
See notes to financial statements.
Annual Report | August 31, 2011 | 33
Portfolio of Investments continued
CGW | Guggenheim S&P Global Water Index ETF
| | | | | | | | |
| | Number | | | | | | |
| | of Shares | | Description | | | Value | |
| | | | | | | | |
| | | | Long-Term Investments - 99.3% | | | | |
| | | | Common Stocks - 99.3% | | | | |
| | | | Austria - 2.4% | | | | |
| | 49,268 | | Andritz AG | | $ | 4,583,888 | |
| | 23,377 | | BWT AG | | | 513,287 | |
| | | | | | | 5,097,175 | |
| | | | | | | | |
| | | | Bermuda - 0.4% | | | | |
| | 2,690,000 | | China Water Affairs Group Ltd.(a) | | | 908,218 | |
| | | | | | | | |
| | | | Brazil - 3.6% | | | | |
| | 134,159 | | Cia de Saneamento Basico do Estado de Sao Paulo, ADR | | | 7,735,608 | |
| | | | | | | | |
| | | | China - 2.0% | | | | |
| | 2,153,000 | | China Everbright International Ltd. | | | 743,496 | |
| | 5,950,000 | | Guangdong Investment Ltd.(a) | | | 3,597,658 | |
| | | | | | | 4,341,154 | |
| | | | | | | | |
| | | | Finland - 1.5% | | | | |
| | 170,645 | | Kemira OYJ | | | 2,363,583 | |
| | 73,951 | | Uponor OYJ | | | 823,581 | |
| | | | | | | 3,187,164 | |
| | | | | | | | |
| | | | France - 5.2% | | | | |
| | 327,700 | | Suez Environnement Co. | | | 5,508,527 | |
| | 342,583 | | Veolia Environnement SA | | | 5,714,312 | |
| | | | | | | 11,222,839 | |
| | | | | | | | |
| | | | Italy - 1.2% | | | | |
| | 65,951 | | ACEA SpA | | | 574,485 | |
| | 448,789 | | Hera SpA(a) | | | 831,616 | |
| | 192,554 | | Interpump Group SpA | | | 1,232,051 | |
| | | | | | | 2,638,152 | |
| | | | | | | | |
| | | | Japan - 4.7% | | | | |
| | 468,000 | | Ebara Corp. | | | 2,093,056 | |
| | 268,700 | | Kurita Water Industries Ltd.(a) | | | 7,125,979 | |
| | 60,000 | | Nihon Nohyaku Co. Ltd. | | | 281,679 | |
| | 67,000 | | Organo Corp. | | | 532,706 | |
| | | | | | | 10,033,420 | |
| | | | | | | | |
| | | | Netherlands - 0.6% | | | | |
| | 135,845 | | Wavin NV(b) | | | 1,236,713 | |
| | | | | | | | |
| | | | Singapore - 1.3% | | | | |
| | 1,392,000 | | Hyflux Ltd.(a) | | | 2,003,044 | |
| | 1,486,000 | | Sound Global Ltd. | | | 772,510 | |
| | | | | | | 2,775,554 | |
| | | | | | | | |
| | | | Spain - 0.8% | | | | |
| | 69,310 | | Fomento de Construcciones y Contratas SA(a) | | | 1,811,234 | |
| | | | | | | | |
| | | | Sweden - 4.2% | | | | |
| | 456,162 | | ALFA Laval AB | | | 8,980,348 | |
| | | | | | | | |
| | | | Switzerland - 9.6% | | | | |
| | 97,901 | | Geberit AG(b) | | | 20,504,035 | |
| | | | | | | | |
| | | | United Kingdom - 22.3% | | | | |
| | 501,096 | | Halma PLC | | | 2,838,551 | |
| | 919,983 | | Northumbrian Water Group PLC | | | 6,905,610 | |
| | 847,083 | | Pennon Group PLC | | | 8,923,835 | |
| | 564,177 | | Severn Trent PLC | | | 13,494,552 | |
| | 1,586,467 | | United Utilities Group PLC | | | 15,498,997 | |
| | | | | | | 47,661,545 | |
| | | | | | | | |
| | | | United States - 39.5% | | | | |
| | 45,443 | | American States Water Co. | | | 1,613,226 | |
| | 419,266 | | American Water Works Co., Inc. | | | 12,485,741 | |
| | 336,510 | | Aqua America, Inc. | | | 7,430,141 | |
| | 34,287 | | Arch Chemicals, Inc. | | | 1,609,089 | |
| | 20,597 | | Badger Meter, Inc. | | | 721,513 | |
| | 76,472 | | Calgon Carbon Corp.(b) | | | 1,209,787 | |
| | 101,205 | | California Water Service Group | | | 1,910,750 | |
| | 206,038 | | Danaher Corp. | | | 9,438,601 | |
| | 51,849 | | Franklin Electric Co., Inc. | | | 2,224,841 | |
| | 112,326 | | IDEX Corp. | | | 4,176,281 | |
| | 95,239 | | Insituform Technologies, Inc., Class A(b) | | | 1,574,301 | |
| | 54,965 | | Itron, Inc.(b) | | | 2,188,706 | |
| | 181,535 | | ITT Corp. | | | 8,593,867 | |
| | 50,094 | | Layne Christensen Co.(b) | | | 1,406,139 | |
| | 431,041 | | Mueller Water Products, Inc., Class A | | | 1,000,015 | |
| | 368,817 | | Nalco Holding Co. | | | 13,649,917 | |
| | 133,231 | | Pentair, Inc. | | | 4,572,488 | |
| | 31,620 | | SJW Corp. | | | 737,378 | |
| | 152,061 | | TETRA Tech, Inc.(b) | | | 3,027,534 | |
| | 29,117 | | Valmont Industries, Inc. | | | 2,694,196 | |
| | 79,940 | | Watts Water Technologies, Inc., Class A | | | 2,263,901 | |
| | | | | | | 84,528,412 | |
| | | | | | | | |
| | | | Total Common Stocks - 99.3% | | | | |
| | | | (Cost $205,973,557) | | | 212,661,571 | |
See notes to financial statements.
34 | Annual Report | August 31, 2011
Portfolio of Investments continued
CGW | Guggenheim S&P Global Water Index ETF (continued)
| | | | | | | | |
| | Number | | | | | | |
| | of Shares | | Description | | | Value | |
| | | | | | | | |
| | | | Investments of Collateral for Securities Loaned - 6.2% | | | | |
| | 13,413,077 | | BNY Mellon Securities Lending Overnight Fund, 0.093%(c) (d) | | $ | 13,413,077 | |
| | | | (Cost $13,413,077) | | | | |
| | | | | | | | |
| | | | Total Investments - 105.5% | | | | |
| | | | (Cost $219,386,634) | | | 226,074,648 | |
| | | | Liabilities in excess of Other Assets - (5.5%) | | | (11,884,379 | ) |
| | | | Net Assets - 100.0% | | $ | 214,190,269 | |
AB - Stock Company
ADR - American Depositary Receipt
AG - Stock Corporation
NV - Publicly Traded Company
OYJ - Public Traded Company
PLC - Public Limited Company
SA - Corporation
SpA - Limited Share Company
| | |
| (a) | Security, or portion thereof, was on loan at August 31, 2011. |
| | |
| (b) | Non-income producing security. |
| | |
| (c) | At August 31, 2011, the total market value of the Fund’s securities on loan was $12,643,233 and the total market value of the collateral held by the Fund was $13,413,077. |
| | |
| (d) | Interest rate shown reflects yield as of August 31, 2011. |
See notes to financial statements.
Annual Report | August 31, 2011 | 35
Statement of Assets and Liabilities | August 31, 2011
| | | | Guggenheim ABC High Dividend ETF (ABCS | ) | | Guggenheim Airline ETF (FAA | ) | | Guggenheim China All-Cap ETF (YAO | ) |
| Assets | | | | | | | | | | |
| Investments in securities, at value (including securities on loan) | | $ | 6,744,153 | | $ | 20,782,427 | | $ | 78,137,020 | |
| Foreign currency, at value | | | 2,185 | | | — | | | 11,286 | |
| Cash | | | 888 | | | 56,497 | | | 115,118 | |
| Receivables: | | | | | | | | | | |
| Investments sold | | | — | | | 2,063,066 | | | — | |
| Securities lending income | | | — | | | 1,539 | | | 9,733 | |
| Dividends | | | 67,127 | | | 1,180 | | | 31,245 | |
| Tax reclaims | | | — | | | 818 | | | — | |
| Due from Adviser | | | — | | | 50,230 | | | — | |
| Other assets | | | — | | | 1,199 | | | — | |
| Total assets | | | 6,814,353 | | | 22,956,956 | | | 78,304,402 | |
| | | | | | | | | | | |
| Liabilities | | | | | | | | | | |
| Custodian bank | | | — | | | 64 | | | — | |
| Payables: | | | | | | | | | | |
| Fund shares redeemed | | | — | | | — | | | — | |
| Investments purchased | | | — | | | 2,158,345 | | | — | |
| Administration fee payable | | | — | | | — | | | — | |
| Collateral for securities on loan | | | — | | | 2,219,072 | | | 5,651,302 | |
| Accrued advisory fees | | | 3,260 | | | — | | | 46,269 | |
| Accrued expenses | | | — | | | 53,231 | | | — | |
| Total liabilities | | | 3,260 | | | 4,430,712 | | | 5,697,571 | |
| Net Assets | | $ | 6,811,093 | | $ | 18,526,244 | | $ | 72,606,831 | |
| | | | | | | | | | | |
| Composition of Net Assets | | | | | | | | | | |
| Paid-in capital | | $ | 7,247,644 | | $ | 24,534,518 | | $ | 78,919,524 | |
| Accumulated undistributed net investment income (loss) | | | 77,151 | | | (14,285 | ) | | 1,068,398 | |
| Accumulated net realized gain (loss) on investments and currency transactions | | | (48,473 | ) | | (1,497,672 | ) | | (1,429,538 | ) |
| Net unrealized appreciation (depreciation) on investments and currency translation | | | (465,229 | ) | | (4,496,317 | ) | | (5,951,553 | ) |
| Net Assets | | $ | 6,811,093 | | $ | 18,526,244 | | $ | 72,606,831 | |
| | | | | | | | | | | |
| Shares outstanding ($0.01 par value with unlimited amount authorized) | | | 300,000 | | | 650,000 | | | 2,900,000 | |
| Net Asset Value Per Share | | $ | 22.70 | | $ | 28.50 | | $ | 25.04 | |
| Investments in securities, at cost | | $ | 7,210,374 | | $ | 25,278,092 | | $ | 84,088,561 | |
| Foreign currency, at cost | | $ | 2,185 | | $ | — | | $ | 11,286 | |
| Securities on loan, at value | | $ | — | | $ | 2,040,461 | | $ | 5,310,931 | |
See notes to financial statements.
36 | Annual Report | August 31, 2011
Statement of Assets and Liabilities continued
| | | | Guggenheim China Technology ETF (CQQQ | ) | | Guggenheim EW Euro-Pacific LDRs ETF (EEN | ) | | Guggenheim Solar ETF (TAN | ) | | Guggenheim S&P Global Water Index ETF (CGW | ) |
| | | | | | | | | | | | | | |
| | | $ | 38,884,416 | | $ | 3,155,352 | | $ | 175,577,827 | | $ | 226,074,648 | |
| | | | — | | | — | | | 72,306 | | | — | |
| | | | 22,036 | | | — | | | 45,625 | | | 338,260 | |
| | | | | | | | | | | | | | |
| | | | — | | | — | | | 2,192,204 | | | 133,726 | |
| | | | 24,212 | | | 534 | | | 471,143 | | | 8,520 | |
| | | | 23,629 | | | 8,976 | | | — | | | 647,018 | |
| | | | — | | | 7,199 | | | 62,959 | | | 626,458 | |
| | | | — | | | — | | | — | | | — | |
| | | | — | | | — | | | 3,414 | | | 3,869 | |
| | | | 38,954,293 | | | 3,172,061 | | | 178,425,478 | | | 227,832,499 | |
| | | | | | | | | | | | | | |
| | | | — | | | 356 | | | — | | | — | |
| | | | | | | | | | | | | | |
| | | | — | | | — | | | 1,757,610 | | | — | |
| | | | — | | | — | | | 442,543 | | | — | |
| | | | — | | | — | | | 2,848 | | | 4,975 | |
| | | | 7,129,666 | | | 497,346 | | | 59,573,545 | | | 13,413,077 | |
| | | | 19,576 | | | 781 | | | 13,865 | | | 70,860 | |
| | | | — | | | — | | | 161,652 | | | 153,318 | |
| | | | 7,149,242 | | | 498,483 | | | 61,952,063 | | | 13,642,230 | |
| | | $ | 31,805,051 | | $ | 2,673,578 | | $ | 116,473,415 | | $ | 214,190,269 | |
| | | | | | | | | | | | | | |
| | | $ | 38,039,937 | | $ | 4,494,578 | | $ | 376,410,905 | | $ | 296,426,033 | |
| | | | 308,406 | | | 58,316 | | | 3,381,107 | | | 3,395,528 | |
| | | | (2,421,001 | ) | | (2,155,068 | ) | | (191,558,459 | ) | | (92,459,690 | ) |
| | | | (4,122,291 | ) | | 275,752 | | | (71,760,138 | ) | | 6,828,398 | |
| | | $ | 31,805,051 | | $ | 2,673,578 | | $ | 116,473,415 | | $ | 214,190,269 | |
| | | | | | | | | | | | | | |
| | | | 1,250,000 | | | 152,000 | | | 21,200,000 | | | 10,680,000 | |
| | | $ | 25.44 | | $ | 17.59 | | $ | 5.49 | | $ | 20.06 | |
| | | $ | 43,006,712 | | $ | 2,880,214 | | $ | 247,344,009 | | $ | 219,386,634 | |
| | | $ | — | | $ | — | | $ | 70,901 | | $ | — | |
| | | $ | 6,761,424 | | $ | 477,474 | | $ | 56,475,098 | | $ | 12,643,233 | |
See notes to financial statements.
Annual Report | August 31, 2011 | 37
Statement of Operations | For the period ended August 31, 2011
| | | | Guggenheim ABC High Dividend ETF (ABCS | )1 | | Guggenheim Airline ETF (FAA | ) | | Guggenheim China All-Cap ETF (YAO | ) |
| Investment Income | | | | | | | | | | |
| Dividend income | | $ | 89,245 | | $ | 287,240 | | $ | 1,991,799 | |
| Less return of capital distributions received | | | — | | | — | | | — | |
| Foreign taxes withheld | | | (3,747 | ) | | (9,136 | ) | | (155,594 | ) |
| Net dividend income | | | 85,498 | | | 278,104 | | | 1,836,205 | |
| Net securities lending income | | | — | | | 24,701 | | | 77,562 | |
| Total investment income | | | 85,498 | | | 302,805 | | | 1,913,767 | |
| | | | | | | | | | | |
| Expenses | | | | | | | | | | |
| Advisory fee <Note 3> | | | 7,069 | | | 163,305 | | | 609,957 | |
| Administration fee | | | — | | | 8,982 | | | — | |
| Custodian fee | | | — | | | 55,851 | | | — | |
| Licensing | | | — | | | 19,597 | | | — | |
| Listing fee and expenses | | | — | | | 5,000 | | | — | |
| Printing expenses | | | — | | | 22,251 | | | — | |
| Professional fees | | | — | | | 29,675 | | | — | |
| Registration & filings | | | — | | | 552 | | | — | |
| Trustees’ fees and expenses | | | — | | | 3,517 | | | — | |
| Miscellaneous | | | — | | | 15,769 | | | — | |
| Total expenses | | | 7,069 | | | 324,499 | | | 609,957 | |
| Advisory fees waived | | | — | | | (95,872 | ) | | — | |
| Other expenses waived or reimbursed | | | — | | | — | | | — | |
| Net expenses | | | 7,069 | | | 228,627 | | | 609,957 | |
| Net Investment Income (Loss) | | | 78,429 | | | 74,178 | | | 1,303,810 | |
| | | | | | | | | | | |
| Realized and Unrealized Gain (Loss) | | | | | | | | | | |
| Net realized gain (loss) on: | | | | | | | | | | |
| Investments | | | (48,369 | ) | | (126,437 | ) | | (680,633 | ) |
| In-kind transactions | | | — | | | 6,337,240 | | | 939,724 | |
| Foreign currency transactions | | | (1,382 | ) | | (28,748 | ) | | (2,502 | ) |
| Net realized gain (loss) | | | (49,751 | ) | | 6,182,055 | | | 256,589 | |
| Net change in unrealized appreciation (depreciation) on | | | | | | | | | | |
| Investments | | | (466,221 | ) | | (5,433,276 | ) | | (2,733,156 | ) |
| Foreign currency translation | | | 992 | | | 4,785 | | | (11 | ) |
| Net unrealized appreciation (depreciation) | | | (465,229 | ) | | (5,428,491 | ) | | (2,733,167 | ) |
| Net realized and unrealized gain (loss) | | | (514,980 | ) | | 753,564 | | | (2,476,578 | ) |
| Net Increase (Decrease) in Net Assets Resulting from Operations | | $ | (436,551 | ) | $ | 827,742 | | $ | (1,172,768 | ) |
| 1 | Commencement of investments operations - June 8, 2011 |
See notes to financial statements.
38 | Annual Report | August 31, 2011
Statement of Operations continued
| | | | Guggenheim China Technology ETF (CQQQ | ) | | Guggenheim EW Euro-Pacific LDRs ETF (EEN | ) | | Guggenheim Solar ETF (TAN | ) | | Guggenheim S&P Global Water Index ETF (CGW | ) |
| | | $ | 454,237 | | $ | 98,275 | | $ | 874,925 | | $ | 6,599,535 | |
| | | | — | | | (3,179 | ) | | (21,718 | ) | | (697,381 | ) |
| | | | (4,807 | ) | | (10,576 | ) | | (74,385 | ) | | (326,754 | ) |
| | | | 449,430 | | | 84,520 | | | 778,822 | | | 5,575,400 | |
| | | | 231,198 | | | 6,693 | | | 4,464,810 | | | 204,761 | |
| | | | 680,628 | | | 91,213 | | | 5,243,632 | | | 5,780,161 | |
| | | | | | | | | | | | | | |
| | | | 266,482 | | | 11,274 | | | 844,556 | | | 1,134,062 | |
| | | | — | | | — | | | 46,274 | | | 60,358 | |
| | | | — | | | — | | | 135,092 | | | 146,530 | |
| | | | — | | | — | | | 228,367 | | | 239,570 | |
| | | | — | | | — | | | 5,000 | | | 5,000 | |
| | | | — | | | — | | | 128,902 | | | 99,234 | |
| | | | — | | | — | | | 70,471 | | | 48,325 | |
| | | | — | | | — | | | 1,691 | | | 888 | |
| | | | — | | | — | | | 7,852 | | | 10,074 | |
| | | | — | | | — | | | 20,463 | | | 22,164 | |
| | | | 266,482 | | | 11,274 | | | 1,488,668 | | | 1,766,205 | |
| | | | — | | | — | | | (306,289 | ) | | (178,518 | ) |
| | | | — | | | — | | | — | | | — | |
| | | | 266,482 | | | 11,274 | | | 1,182,379 | | | 1,587,687 | |
| | | | 414,146 | | | 79,939 | | | 4,061,253 | | | 4,192,474 | |
| | | | | | | | | | | | | | |
| | | | (2,353,633 | ) | | 95,221 | | | (54,236,011 | ) | | (6,667,934 | ) |
| | | | 2,209,544 | | | 287,454 | | | 18,560,657 | | | 3,373,311 | |
| | | | (843 | ) | | 579 | | | (80,887 | ) | | (14,178 | ) |
| | | | (144,932 | ) | | 383,254 | | | (35,756,241 | ) | | (3,308,801 | ) |
| | | | | | | | | | | | | | |
| | | | (2,056,566 | ) | | (120,432 | ) | | (17,343,779 | ) | | 34,446,574 | |
| | | | 5 | | | 567 | | | 8,366 | | | 132,260 | |
| | | | (2,056,561 | ) | | (119,865 | ) | | (17,335,413 | ) | | 34,578,834 | |
| | | | (2,201,493 | ) | | 263,389 | | | (53,091,654 | ) | | 31,270,033 | |
| | | $ | (1,787,347 | ) | $ | 343,328 | | $ | (49,030,401 | ) | $ | 35,462,507 | |
See notes to financial statements.
Annual Report | August 31, 2011 | 39
Statement of Changes in Net Assets |
| | | | Guggenheim ABC High Dividend ETF (ABCS) | | | Guggenheim Airline ETF (FAA) | |
| | | | For the Period Ended August 31, 20111 | | | For the Year Ended August 31, 2011 | | | For the Year Ended August 31, 2010 | |
| Increase (Decrease) in Net Assets Resulting from Operations | | | | | | | | | | |
| Net investment income (loss) | | $ | 78,429 | | $ | 74,178 | | $ | (120,983 | ) |
| Net realized gain (loss) | | | (49,751 | ) | | 6,182,055 | | | 1,406,670 | |
| Net change in unrealized appreciation (depreciation) | | | (465,229 | ) | | (5,428,491 | ) | | 352,844 | |
| Net increase (decrease) in net assets resulting from operations | | | (436,551 | ) | | 827,742 | | | 1,638,531 | |
| | | | | | | | | | | |
| Distributions to Shareholders | | | | | | | | | | |
| From and in excess of net investment income | | | — | | | (26,600 | ) | | — | |
| Return of capital | | | — | | | — | | | — | |
| Total distributions | | | — | | | (26,600 | ) | | — | |
| | | | | | | | | | | |
| Capital Share Transactions | | | | | | | | | | |
| Proceeds from sale of shares | | | 7,247,644 | | | 2,085,376 | | | 42,888,860 | |
| Cost of shares redeemed | | | — | | | (27,104,392 | ) | | (6,521,732 | ) |
| Net increase (decrease) from capital share transactions | | | 7,247,644 | | | (25,019,016 | ) | | 36,367,128 | |
| Total increase (decrease) in net assets | | | 6,811,093 | | | (24,217,874 | ) | | 38,005,659 | |
| | | | | | | | | | | |
| Net Assets | | | | | | | | | | |
| Beginning of period | | | — | | | 42,744,118 | | | 4,738,459 | |
| End of period | | $ | 6,811,093 | | $ | 18,526,244 | | $ | 42,744,118 | |
| Accumulated undistributed net investment income (loss) at end of period | | $ | 77,151 | | $ | (14,285 | ) | $ | (66,062 | ) |
| | | | | | | | | | | |
| Changes in Shares Outstanding | | | | | | | | | | |
| Shares sold | | | 300,000 | | | 50,000 | | | 1,300,000 | |
| Shares redeemed | | | — | | | (700,000 | ) | | (200,000 | ) |
| Shares outstanding, beginning of period | | | — | | | 1,300,000 | | | 200,000 | |
| Shares outstanding, end of period | | | 300,000 | | | 650,000 | | | 1,300,000 | |
| 1 | Commencement of investment operations - June 8, 2011 |
| | |
| 2 | Commencement of investment operations - October 19, 2009 |
| | |
| 3 | Commencement of investment operations - December 8, 2009 |
See notes to financial statements.
40 | Annual Report | August 31, 2011
Statement of Changes in Net Assets continued
| | Guggenheim China All-Cap ETF (YAO) | | Guggenheim China Technology ETF (CQQQ) | | Guggenheim EW Euro-Pacific LDRs ETF (EEN) | | Guggenheim Solar ETF (TAN) | |
| | For the Year Ended August 31, 2011 | | For the Period Ended August 31, 20102 | | For the Year Ended August 31, 2011 | | For the Period Ended August 31, 20103 | | For the Year Ended August 31, 2011 | | For the Year Ended August 31, 2010 | | For the Year Ended August 31, 2011 | | For the Year Ended August 31, 2010 | |
| | $ | 1,303,810 | | $ | 643,209 | | $ | 414,146 | | $ | 57,614 | | $ | 79,939 | | $ | 99,023 | | $ | 4,061,253 | | $ | (147,579 | ) |
| | | 256,589 | | | (567,229 | ) | | (144,932 | ) | | 29,100 | | | 383,254 | | | 403,041 | | | (35,756,241 | ) | | 5,760,440 | |
| | | (2,733,167 | ) | | (3,218,386 | ) | | (2,056,561 | ) | | (2,065,730 | ) | | (119,865 | ) | | (560,431 | ) | | (17,335,413 | ) | | (34,084,661 | ) |
| | | (1,172,768 | ) | | (3,142,406 | ) | | (1,787,347 | ) | | (1,979,016 | ) | | 343,328 | | | (58,367 | ) | | (49,030,401 | ) | | (28,471,800 | ) |
| | | | | | | | | | | | | | | | | | | | | | | | | |
| | | (874,200 | ) | | — | | | (179,550 | ) | | — | | | (117,040 | ) | | (50,400 | ) | | (575,360 | ) | | — | |
| | | — | | | — | | | — | | | — | | | — | | | — | | | — | | | — | |
| | | (874,200 | ) | | — | | | (179,550 | ) | | — | | | (117,040 | ) | | (50,400 | ) | | (575,360 | ) | | — | |
| | | | | | | | | | | | | | | | | | | | | | | | | |
| | | 30,466,522 | | | 90,898,901 | | | 24,571,116 | | | 27,450,682 | | | — | | | 916,573 | | | 114,552,232 | | | 67,748,275 | |
| | | (17,214,834 | ) | | (26,354,384 | ) | | (10,290,309 | ) | | (5,980,525 | ) | | (946,903 | ) | | (854,103 | ) | | (96,161,205 | ) | | (58,153,115 | ) |
| | | | | | | | | | | | | | | | | | | | | | | | | |
| | | 13,251,688 | | | 64,544,517 | | | 14,280,807 | | | 21,470,157 | | | (946,903 | ) | | 62,470 | | | 18,391,027 | | | 9,595,160 | |
| | | 11,204,720 | | | 61,402,111 | | | 12,313,910 | | | 19,491,141 | | | (720,615 | ) | | (46,297 | ) | | (31,214,734 | ) | | (18,876,640 | ) |
| | | | | | | | | | | | | | | | | | | | | | | | | |
| | | 61,402,111 | | | — | | | 19,491,141 | | | — | | | 3,394,193 | | | 3,440,490 | | | 147,688,149 | | | 166,564,789 | |
| | $ | 72,606,831 | | $ | 61,402,111 | | $ | 31,805,051 | | $ | 19,491,141 | | $ | 2,673,578 | | $ | 3,394,193 | | $ | 116,473,415 | | $ | 147,688,149 | |
| | $ | 1,068,398 | | $ | 641,014 | | $ | 308,406 | | $ | 56,701 | | $ | 58,316 | | $ | 88,345 | | $ | 3,381,107 | | $ | (251,641 | ) |
| | | | | | | | | | | | | | | | | | | | | | | | | |
| | | 1,100,000 | | | 3,600,000 | | | 850,000 | | | 1,050,000 | | | — | | | 50,000 | | | 13,840,000 | | | 7,600,000 | |
| | | (700,000 | ) | | (1,100,000 | ) | | (400,000 | ) | | (250,000 | ) | | (50,000 | ) | | (50,000 | ) | | (12,800,000 | ) | | (6,800,000 | ) |
| | | 2,500,000 | | | — | | | 800,000 | | | — | | | 202,000 | | | 202,000 | | | 20,160,000 | | | 19,360,000 | |
| | | 2,900,000 | | | 2,500,000 | | | 1,250,000 | | | 800,000 | | | 152,000 | | | 202,000 | | | 21,200,000 | | | 20,160,000 | |
See notes to financial statements.
Annual Report | August 31, 2011 | 41
Statement of Changes in Net Assets continued
| | | Guggenheim S&P Global Water Index ETF (CGW) | |
| | | For the Year Ended August 31, 2011 | | For the Year Ended August 31, 2010 | |
| Increase (Decrease) in Net Assets Resulting from Operations | | | | | | | |
| Net investment income (loss) | | $ | 4,192,474 | | $ | 4,507,936 | |
| Net realized gain (loss) | | | (3,308,801 | ) | | (16,508,525 | ) |
| Net change in unrealized appreciation (depreciation) | | | 34,578,834 | | | 14,722,804 | |
| Net increase (decrease) in net assets resulting from operations | | | 35,462,507 | | | 2,722,215 | |
| | | | | | | | |
| Distributions to Shareholders | | | | | | | |
| From and in excess of net investment income | | | (4,420,200 | ) | | (2,744,000 | ) |
| Return of capital | | | — | | | — | |
| Total distributions | | | (4,420,200 | ) | | (2,744,000 | ) |
| | | | | | | | |
| Capital Share Transactions | | | | | | | |
| Proceeds from sale of shares | | | 31,653,620 | | | 80,096,524 | |
| Cost of shares redeemed | | | (40,794,890 | ) | | (66,723,649 | ) |
| Net increase (decrease) from capital share transactions | | | (9,141,270 | ) | | 13,372,875 | |
| Total increase (decrease) in net assets | | | 21,901,037 | | | 13,351,090 | |
| | | | | | | | |
| Net Assets | | | | | | | |
| Beginning of period | | | 192,289,232 | | | 178,938,142 | |
| End of period | | $ | 214,190,269 | | $ | 192,289,232 | |
| Accumulated undistributed net investment income (loss) at end of period | | $ | 3,395,528 | | $ | 3,637,441 | |
| | | | | | | | |
| Changes in Shares Outstanding | | | | | | | |
| Shares sold | | | 1,520,000 | | | 4,400,000 | |
| Shares redeemed | | | (2,080,000 | ) | | (3,760,000 | ) |
| Shares outstanding, beginning of period | | | 11,240,000 | | | 10,600,000 | |
| Shares outstanding, end of period | | | 10,680,000 | | | 11,240,000 | |
See notes to financial statements.
42 | Annual Report | August 31, 2011
Financial Highlights |
ABCS | Guggenheim ABC High Dividend ETF
| | | | | |
Per share operating performance for a share outstanding throughout the period | | | For the Period June 8, 2011* through August 31, 2011 | |
| Net asset value, beginning of period | | $ | 25.01 | |
| Income from investment operations | | | | |
Net investment income (a) | | | 0.38 | |
| Net realized and unrealized loss | | | (2.69 | ) |
| Total from investment operations | | | (2.31 | ) |
| Net asset value, end of period | | $ | 22.70 | |
| Market value, end of period | | $ | 22.72 | |
Total return (b) | | | | |
| Net asset value | | | -9.24 | % |
| | | | | |
| Ratios and supplemental data | | | | |
| Net assets, end of period (thousands) | | $ | 6,811 | |
| Ratio of net expenses to average net assets | | | 0.65% | (c) |
| Ratio of net investment income (loss) to average net assets | | | 7.21% | (c) |
Portfolio turnover rate (d) | | | 19 | % |
| * | Commencement of investment operations. |
| | |
| (a) | Based on average shares outstanding during the period. |
| | |
| (b) | Total investment return is calculated assuming a purchase of a common share at the beginning of the period and a sale on the last day of the period reported at net asset value (“NAV”). Dividends and distributions are assumed to be reinvested at NAV. Total investment return does not reflect brokerage commissions. A return calculated for a period of less than one year is not annualized. |
| | |
| (c) | Annualized |
| | |
| (d) | Portfolio turnover is not annualized for periods of less than one year and does not include securities received or delivered from processing creations or redemptions. |
See notes to financial statements.
Annual Report | August 31, 2011 | 43
Financial Highlights (continued)
FAA | Guggenheim Airline ETF
Per share operating performance for a share outstanding throughout the period | | For the Year Ended August 31, 2011 | | For the Year Ended August 31, 2010 | | For the Period
January 26, 2009**
through
August 31, 2009 | |
| Net asset value, beginning of period | | $ | 32.88 | | $ | 23.69 | | $ | 24.04 | (e) |
| | | | | | | | | | | |
| Income from investment operations | | | | | | | | | | |
Net investment income (loss) (a) | | | 0.08 | | | (0.16 | ) | | (0.05 | ) |
| Net realized and unrealized gain (loss) | | | (4.43 | ) | | 9.35 | | | (0.30 | )(e) |
| Total from investment operations | | | (4.35 | ) | | 9.19 | | | (0.35 | ) |
| | | | | | | | | | | |
| Distributions to Shareholders | | | | | | | | | | |
| From and in excess of net investment income | | | (0.03 | ) | | — | | | — | |
| Net asset value, end of period | | $ | 28.50 | | $ | 32.88 | | $ | 23.69 | |
| Market value, end of period | | $ | 28.53 | | $ | 32.74 | | $ | 24.10 | |
Total return* (b) | | | | | | | | | | |
| Net asset value | | | -13.26 | % | | 38.79 | % | | -1.46 | %(e) |
| | | | | | | | | | | |
| Ratios and supplemental data | | | | | | | | | | |
| Net assets, end of period (thousands) | | $ | 18,526 | | $ | 42,744 | | $ | 4,738 | |
| Ratio of net expenses to average net assets* | | | 0.70 | % | | 0.75 | % | | 0.95 | %(c) |
| Ratio of net investment loss to average net assets* | | | 0.23 | % | | -0.50 | % | | -0.40 | %(c) |
Portfolio turnover rate (d) | | | 38 | % | | 65 | % | | 58 | % |
| * If certain expenses had not been waived or reimbursed by the Adviser, total return would have been lower and the ratios would have been as follows: | | | | | | | | | | |
| Ratio of total expenses to average net assets | | | 0.99 | % | | 1.13 | % | | 5.67 | %(c) |
| Ratio of net investment loss to average net assets | | | -0.06 | % | | -0.88 | % | | -5.12 | %(c) |
| ** | Commencement of investment operations. |
| | |
| (a) | Based on average shares outstanding during the period. |
| | |
| (b) | Total investment return is calculated assuming a purchase of a common share at the beginning of the period and a sale on the last day of the period reported at net asset value (“NAV”). Dividends and distributions are assumed to be reinvested at NAV. Total investment return does not reflect brokerage commissions. A return calculated for a period of less than one year is not annualized. |
| | |
| (c) | Annualized. |
| | |
| (d) | Portfolio turnover is not annualized for periods of less than one year and does not include securities received or delivered from processing creations or redemptions. |
| | |
| (e) | Subsequent to August 31, 2009, it was identified that the net asset value, for January 26, 2009 was listed incorrectly as $23.82, causing the total return at net asset value and the net realized and unrealized loss to be listed incorrectly. The above figures represent the corrected presentation. This issue had no impact on the ending net asset value. |
See notes to financial statements.
44 | Annual Report | August 31, 2011
Financial Highlights (continued)
YAO | Guggenheim China All-Cap ETF
Per share operating performance for a share outstanding throughout the period | | For the Year Ended August 31, 2011 | | For the Period
October 19, 2009* through
August 31, 2010 | |
| Net asset value, beginning of period | | $ | 24.56 | | $ | 24.82 | |
| | | | | | | | |
| Income from investment operations | | | | | | | |
Net investment income (a) | | | 0.41 | | | 0.22 | |
| Net realized and unrealized loss | | | 0.35 | | | (0.48 | ) |
| Total from investment operations | | | 0.76 | | | (0.26 | ) |
| | | | | | | | |
| Distributions to shareholders from | | | | | | | |
| Net investment income | | | (0.28 | ) | | — | |
| Net asset value, end of period | | $ | 25.04 | | $ | 24.56 | |
| Market value, end of period | | $ | 25.07 | | $ | 24.55 | |
Total return (b) | | | | | | | |
| Net asset value | | | 3.01 | % | | -1.05 | % |
| | | | | | | | |
| Ratios and supplemental data | | | | | | | |
| Net assets, end of period (thousands) | | $ | 72,607 | | $ | 61,402 | |
| Ratio of net expenses to average net assets | | | 0.70 | % | | 0.70% | (c) |
| Ratio of net investment income to average net assets | | | 1.50 | % | | 1.02% | (c) |
Portfolio turnover rate (d) | | | 16 | % | | 11 | % |
| * | Commencement of investment operations. |
| | |
| (a) | Based on average shares outstanding during the period. |
| | |
| (b) | Total investment return is calculated assuming a purchase of a common share at the beginning of the period and a sale on the last day of the period reported at net asset value (“NAV”). Dividends and distributions are assumed to be reinvested at NAV. Total investment return does not reflect brokerage commissions. A return calculated for a period of less than one year is not annualized. |
| | |
| (c) | Annualized. |
| | |
| (d) | Portfolio turnover is not annualized for periods less than one year and does not include securities received or delivered from processing creations or redemptions. |
See notes to financial statements.
Annual Report | August 31, 2011 | 45
Financial Highlights (continued)
CQQQ | Guggenheim China Technology ETF
| | | | | | | | |
Per share operating performance for a share outstanding throughout the period | | For the Year Ended August 31, 2011 | | For the Period
December 8, 2009* through
August 31, 2010 | |
| Net asset value, beginning of period | | $ | 24.36 | | $ | 25.06 | |
| | | | | | | | |
| Income from investment operations | | | | | | | |
Net investment income (a) | | | 0.31 | | | 0.08 | |
| Net realized and unrealized gain (loss) | | | 0.90 | | | (0.78 | ) |
| Total from investment operations | | | 1.21 | | | (0.70 | ) |
| | | | | | | | |
| Distributions to shareholders | | | | | | | |
| From and in excess of net investment income | | | (0.13 | ) | | — | |
| Net asset value, end of period | | $ | 25.44 | | $ | 24.36 | |
| Market value, end of period | | $ | 25.57 | | $ | 24.40 | |
Total return (b) | | | | | | | |
| Net asset value | | | 4.94 | % | | -2.79 | % |
| | | | | | | | |
| Ratios and supplemental data | | | | | | | |
| Net assets, end of period (thousands) | | $ | 31,805 | | $ | 19,491 | |
| Ratio of net expenses to average net assets | | | 0.70 | % | | 0.70% | (c) |
| Ratio of net investment income to average net assets | | | 1.09 | % | | 0.43% | (c) |
Portfolio turnover rate (d) | | | 28 | % | | 11 | % |
| * | Commencement of investment operations. |
| | |
| (a) | Based on average shares outstanding during the period. |
| | |
| (b) | Total investment return is calculated assuming a purchase of a common share at the beginning of the period and a sale on the last day of the period reported at net asset value (“NAV”). Dividends and distributions are assumed to be reinvested at NAV. Total investment return does not reflect brokerage commissions. A return calculated for a period of less than one year is not annualized. |
| | |
| (c) | Annualized. |
| | |
| (d) | Portfolio turnover is not annualized for periods less than one year and does not include securities received or delivered from processing creations or redemptions. |
See notes to financial statements.
46 | Annual Report | August 31, 2011
Financial Highlights (continued)
EEN | Guggenheim EW Euro-Pacific LDRs ETF
| | | | | | | | | | | | | | | | | |
Per share operating performance for a share outstanding throughout the period | | For the Year Ended August 31, 2011 | | For the Year Ended August 31, 2010 | | For the Year Ended August 31, 2009 | | For the Year Ended August 31, 2008 | | For the Period March 1, 2007** through August 31, 2007 | |
| Net asset value, beginning of period | | $ | 16.80 | | $ | 17.03 | | $ | 20.48 | | $ | 25.29 | | $ | 24.15 | |
| | | | | | | | | | | | | | | | | |
| Income from investment operations | | | | | | | | | | | | | | | | |
Net investment income (a) | | | 0.49 | | | 0.42 | | | 0.39 | | | 0.41 | | | 0.28 | |
| Net realized and unrealized gain (loss) | | | 1.07 | | | (0.45 | ) | | (3.29 | ) | | (4.30 | ) | | 0.86 | |
| Total from investment operations | | | 1.56 | | | (0.03 | ) | | (2.90 | ) | | (3.89 | ) | | 1.14 | |
| | | | | | | | | | | | | | | | | |
| Distributions to shareholders | | | | | | | | | | | | | | | | |
| From and in excess of net investment income | | | (0.77 | ) | | (0.20 | ) | | (0.55 | ) | | (0.92 | ) | | — | |
| Net asset value, end of period | | $ | 17.59 | | $ | 16.80 | | $ | 17.03 | | $ | 20.48 | | $ | 25.29 | |
| Market value, end of period | | $ | 17.78 | | $ | 16.98 | | $ | 17.08 | | $ | 20.25 | | $ | 25.35 | |
Total return(b) | | | | | | | | | | | | | | | | |
| Net asset value | | | 8.84 | % | | -0.25 | % | | -13.44 | %* | | -16.03 | %* | | 4.72 | %* |
| | | | | | | | | | | | | | | | | |
| Ratios and supplemental data | | | | | | | | | | | | | | | | |
| Net assets, end of period (thousands) | | $ | 2,674 | | $ | 3,394 | | $ | 3,440 | | $ | 4,138 | | $ | 5,108 | |
| Ratio of net expenses to average net assets | | | 0.35 | % | | 0.35 | % | | 0.55 | %(c) * | | 1.08 | %(d) * | | 1.32 | %(d)(e) * |
| Ratio of net investment income to average net assets | | | 2.48 | % | | 2.36 | % | | 2.75 | %(c) * | | 1.75 | %(d) * | | 2.21 | %(d)(e) * |
Portfolio turnover rate (f) | | | 36 | % | | 40 | % | | 150 | % | | 105 | % | | 55 | % |
| * If certain expenses had not been waived or reimbursed by the Adviser, total return would have been lower and the ratios would have been as follows: |
| Ratio of total expenses to average net assets | | | N/A | | | N/A | | | 3.83 | %(c) | | 4.86 | % | | 3.35 | %(e) |
| Ratio of net investment income (loss) to average net assets | | | N/A | | | N/A | | | -0.53 | %(c) | | -2.03 | % | | 0.18 | %(e) |
| ** Commencement of investment operations. | | | | | | | | | | | | |
| | |
| (a) | Based on average shares outstanding during the period. |
| | |
| (b) | Total investment return is calculated assuming a purchase of a common share at the beginning of the period and a sale on the last day of the period reported at net asset value (“NAV”). Dividends and distributions are assumed to be reinvested at NAV. Total investment return does not reflect brokerage commissions. A return calculated for a period of less than one year is not annualized. |
| | |
| (c) | The 0.65% expense cap ratio was replaced with a 0.35% unitary investment advisory fee on March 31, 2009. |
| | |
| (d) | Reflects an expense cap of 0.65% |
| | |
| (e) | Annualized. |
| | |
| (f) | Portfolio turnover is not annualized for periods of less than one year and does not include securities received or delivered from processing creations or redemptions. |
See notes to financial statements.
Annual Report | August 31, 2011 | 47
Financial Highlights (continued)
TAN | Guggenheim Solar ETF
| | | | | | | | | | | | | | |
Per share operating performance for a share outstanding throughout the period | | | For the Year Ended August 31, 2011 | | | For the Year Ended August 31, 2010 | | | For the Year Ended August 31, 2009 | | | For the Period April 15, 2008** through August 31, 2008 | |
| Net asset value, beginning of period | | $ | 7.33 | | $ | 8.60 | | $ | 26.21 | | $ | 25.13 | |
| | | | | | | | | | | | | | |
| Income from investment operations | | | | | | | | | | | | | |
Net investment income (loss) (a) | | | 0.18 | | | (0.01 | ) | | (0.05 | ) | | 0.02 | |
| Net realized and unrealized gain (loss) | | | (1.99 | ) | | (1.26 | ) | | (17.55 | ) | | 1.06 | |
| Total from investment operations | | | (1.81 | ) | | (1.27 | ) | | (17.60 | ) | | 1.08 | |
| | | | | | | | | | | | | | |
| Distributions to shareholders | | | | | | | | | | | | | |
| From and in excess net investment income | | | (0.03 | ) | | — | | | (0.01 | ) | | — | |
| Return of capital | | | — | | | — | | | (0.00 | )(b) | | — | |
| Total distributions | | | (0.03 | ) | | — | | | (0.01 | ) | | — | |
| Net asset value, end of period | | $ | 5.49 | | $ | 7.33 | | $ | 8.60 | | $ | 26.21 | |
| Market value, end of period | | $ | 5.46 | | $ | 7.29 | | $ | 8.52 | | $ | 26.28 | |
Total return*(c) | | | | | | | | | | | | | |
| Net asset value | | | -24.81 | % | | -14.77 | % | | -67.14 | % | | 4.30 | % |
| | | | | | | | | | | | | | |
| Ratios and supplemental data | | | | | | | | | | | | | |
| Net assets, end of period (thousands) | | $ | 116,473 | | $ | 147,688 | | $ | 166,565 | | $ | 186,583 | |
| Ratio of net expenses to average net assets* | | | 0.70 | % | | 0.66 | % | | 0.70 | % | | 0.79 | %(d) |
| Ratio of net investment income (loss) to average net assets* | | | 2.40 | % | | -0.09 | % | | -0.54 | % | | 0.16 | %(d) |
Portfolio turnover rate (e) | | | 38 | % | | 17 | % | | 86 | % | | 9 | % |
| * If certain expenses had not been waived or reimbursed by the Adviser, total return would have been lower and the ratios would have been as follows: |
| Ratio of total expenses to average net assets | | | 0.88 | % | | 0.88 | % | | 0.95 | % | | 0.93 | %(d) |
| Ratio of net investment income (loss) to average net assets | | | 2.22 | % | | -0.31 | % | | -0.79 | % | | 0.02 | %(d) |
| ** Commencement of investment operations. | | | | | | | | | | | | | |
| (a) | Based on average shares outstanding during the period. |
| | |
| (b) | Less than $0.01. |
| | |
| (c) | Total investment return is calculated assuming a purchase of a common share at the beginning of the period and a sale on the last day of the period reported at net asset value (“NAV”). Dividends and distributions are assumed to be reinvested at NAV. Total investment return does not reflect brokerage commissions. A return calculated for a period of less than one year is not annualized. |
| | |
| (d) | Annualized. |
| | |
| (e) | Portfolio turnover is not annualized for periods of less than one year and does not include securities received or delivered from processing creations or redemptions. |
See notes to financial statements.
48 | Annual Report | August 31, 2011
Financial Highlights (continued)
CGW | Guggenheim S&P Global Water Index ETF
| Per share operating performance | | For the Year Ended | | For the Year Ended | | For the Year Ended | | For the Year Ended | | | For the Period May 14, 2007** through | |
| for a share outstanding throughout the period | | | August 31, 2011 | | | August 31, 2010 | | | August 31, 2009 | | | August 31, 2008 | | | August 31, 2007 | |
| Net asset value, beginning of period | | $ | 17.11 | | $ | 16.88 | | $ | 23.22 | | $ | 24.86 | | $ | 24.78 | |
| | | | | | | | | | | | | | | | | |
| Income from investment operations | | | | | | | | | | | | | | | | |
Net investment income (a) | | | 0.38 | | | 0.36 | | | 0.35 | | | 0.90 | | | 0.10 | |
| Net realized and unrealized gain (loss) | | | 2.99 | | | 0.07 | | | (5.45 | ) | | (2.43 | ) | | (0.02 | ) |
| Total from investment operations | | | 3.37 | | | 0.43 | | | (5.10 | ) | | (1.53 | ) | | 0.08 | |
| | | | | | | | | | | | | | | | | |
| Distributions to shareholders | | | | | | | | | | | | | | | | |
| From and in excess of net investment income | | | (0.42 | ) | | (0.20 | ) | | (1.24 | ) | | (0.11 | ) | | — | |
| Net asset value, end of period | | $ | 20.06 | | $ | 17.11 | | $ | 16.88 | | $ | 23.22 | | $ | 24.86 | |
| Market value, end of period | | $ | 19.99 | | $ | 16.99 | | $ | 16.93 | | $ | 23.43 | | $ | 25.13 | |
Total return * (b) | | | | | | | | | | | | | | | | |
| Net asset value | | | 19.60 | % | | 2.46 | % | | -20.93 | % | | -6.20 | % | | 0.32 | % |
| | | | | | | | | | | | | | | | | |
| Ratios and supplemental data | | | | | | | | | | | | | | | | |
| Net assets, end of period (thousands) | | $ | 214,190 | | $ | 192,289 | | $ | 178,938 | | $ | 348,351 | | $ | 253,545 | |
| Ratio of net expenses to average net assets* | | | 0.70 | % | | 0.70 | % | | 0.70 | % | | 0.70 | % | | 0.72 | %(c) |
| Ratio of net investment income (loss) to average net assets* | | | 1.85 | % | | 2.02 | % | | 2.29 | % | | 3.73 | % | | 1.41 | %(c) |
Portfolio turnover rate (d) | | | 8 | % | | 17 | % | | 56 | % | | 38 | % | | 1 | % |
| * If certain expenses had not been waived or reimbursed by the Adviser, total return would have been lower and the ratios would have been as follows: |
| Ratio of total expenses to average net assets | | | 0.78 | % | | 0.77 | % | | 0.88 | % | | 0.73 | % | | 0.83 | %(c) |
| Ratio of net investment income (loss) to average net assets | | | 1.77 | % | | 1.95 | % | | 2.11 | % | | 3.70 | % | | 1.30 | %(c) |
| ** Commencement of investment operations. |
| | |
| (a) | Based on average shares outstanding during the period. |
| | |
| (b) | Total investment return is calculated assuming a purchase of a common share at the beginning of the period and a sale on the last day of the period reported at net asset value (“NAV”). |
| | |
| | Dividends and distributions are assumed to be reinvested at NAV. Total investment return does not reflect brokerage commissions. A return calculated for a period of less than one year is not annualized. |
| | |
| (c) | Annualized |
| | |
| (d) | Portfolio turnover is not annualized for periods of less than one year and does not include securities received or delivered from processing creations or redemptions. |
See notes to financial statements.
Annual Report | August 31, 2011 | 49
Notes to Financial Statements | August 31, 2011
Note 1 – Organization:
Claymore Exchange-Traded Fund Trust 2 (the “Trust”), which is registered under the Investment Company Act of 1940, as amended (the “1940 Act”), is organized as an open-end management investment company that was organized as a Delaware business trust on June 8, 2006.
The following seven portfolios have an annual reporting period ended on August 31, 2011:
Guggenheim ABC High Dividend ETF
Guggenheim Airline ETF
Guggenheim China All-Cap ETF
Guggenheim China Technology ETF
Guggenheim EW Euro-Pacific LDRs ETF
Guggenheim Solar ETF
Guggenheim S&P Global Water Index ETF
Each portfolio represents a separate series of the Trust (each a “Fund” or collectively the “Funds”). Each Fund’s shares are listed and traded on the NYSE Arca, Inc. (“NYSE Arca”). The Funds’ market prices may differ to some degree from the net asset value (“NAV”) of the shares of each Fund. Unlike conventional mutual funds, each Fund issues and redeems shares on a continuous basis, at NAV, only in a large specified number of shares; each called a “Creation Unit.” Creation Units are issued and redeemed principally in-kind for securities included in the relevant index. Except when aggregated in Creation Units, shares are not individually redeemable securities of the Funds. The investment objective of each of the Funds is to replicate as closely as possible, before fees and expenses, the performance of the following market indices:
| Fund | Index |
| Guggenheim ABC High Dividend ETF | The BNY Mellon ABC Index |
| Guggenheim Airline ETF | NYSE Arca Global Airline Index |
| Guggenheim China All-Cap ETF | AlphaShares China All-Cap Index |
| Guggenheim China Technology ETF | AlphaShares China Technology Index |
| Guggenheim EW Euro-Pacific LDRs ETF | The BNY Mellon Euro-Pacific Select ADR Index |
| Guggenheim Solar ETF | MAC Global Solar Energy Index |
| Guggenheim S&P Global Water Index ETF | S&P Global Water Index |
Note 2 – Accounting Policies:
The preparation of the financial statements in accordance with U.S. generally accepted accounting principles (“GAAP”) requires management to make estimates and assumptions that affect the reported amounts and disclosures in the financial statements. Actual results could differ from these estimates.
The following is a summary of the significant accounting policies followed by the Funds.
(a) Valuation of Investments
Securities listed on an exchange are valued at the last reported sale price on the principal exchange or on the principal over-the-counter market on which such securities are traded, as of the close of regular trading on the New York Stock Exchange (“NYSE”) on the day the securities are being valued or, if there are no sales, at the mean of the most recent bid and asked prices. Equity securities that are traded primarily on the NASDAQ Stock Market are valued at the NASDAQ Official Closing Price. Debt securities are valued at the mean of the last available bid and ask prices for such securities or, if such prices are not available, at prices for securities of comparable maturity, quality and type. Short-term securities with maturities of 60 days or less at time of purchase are valued at amortized cost, which approximates market value.
For those securities where quotations or prices are not available, the valuations are determined in accordance with procedures established in good faith by management and approved by the Board of Trustees. Valuations in accordance with these procedures are intended to reflect each security’s (or asset’s) “fair value.” Such “fair value” is the amount that the Fund might reasonably expect to receive for the security (or asset) upon its current sale. Each such determination should be based on a consideration of all relevant factors, which are likely to vary from one pricing context to another. Examples of such factors may include, but are not limited to: (i) the type of security, (ii) the initial cost of the security, (iii) the existence of any contractual restrictions on the security’s disposition, (iv) the price and extent of public trading in similar securities of the issuer or of comparable companies, (v) quotations or evaluated prices from broker-dealers and/or pricing services, (vi) information obtained from the issuer, analysts, and/or the appropriate stock exchange (for exchange traded securities), (vii) an analysis of the company’s financial statements, and (viii) an evaluation of the forces that influence the issuer and the market(s) in which the security is purchased and sold (e.g. the existence of pending merger activity, public offerings or tender offers that might affect the value of the security).
Fair value is defined as the price that the Fund would receive to sell an investment or pay to transfer a liability in an orderly transaction with an independent buyer in the principal market, or in the absence of a principal market the most advantageous market for the investment or liability. There are three different categories for valuations. Level 1 valuations are those based upon quoted prices in active markets. Level 2 valuations are those based upon quoted prices in inactive markets or based upon significant observable inputs (e.g. yield curves; benchmark interest rates; indices). Level 3 valuations are those based upon unobservable inputs (e.g. discounted cash flow analysis; non-market based methods used to determine fair valuation).
The Funds have adopted the Accounting Standards Update (“ASU”), Fair Value Measurements and Disclosures (Topic 820): Improving Disclosures about Fair Value Measurements which provides guidance on how investment assets and liabilities are to be valued and disclosed. Specifically, the amendment requires reporting entities to disclose i) the input and valuation techniques used to measure fair value for both recurring and nonrecurring fair value measurements, for Level 2 or Level 3 positions ii) transfers between all levels (including Level 1 and Level 2) on a gross basis (i.e. transfers out must be disclosed separately from transfers in) as well as the reason(s) for the transfer and iii) purchases, sales, issuances and settlements must be shown on a gross basis in the Level 3 rollforward rather than as one net number. The Funds have adopted the disclosures required by this amendment, which did not have a material impact on the financial statements.
The Funds value Level 1 securities using readily available market quotations in active markets. The Funds value Level 2 fixed income securities using independent pricing providers who employ matrix pricing models utilizing market prices, broker quotes and prices of securities with comparable maturities and qualities. The Funds value Level 2 equity securities using various observable market inputs in accordance with procedures established in good faith by management and approved by the Board of Trustees as described above. The fair value estimate for the Funds’Level 3 securities were determined in good faith by the Pricing Committee pursuant to the valuation procedures established in good faith by management and approved by the Board of Trustees.
50 | Annual Report | August 31, 2011
Notes to Financial Statements continued
The following table represents Guggenheim China All-Cap ETF’s investments carried on the Statement of Assets and Liabilities by caption and by level within the fair value hierarchy at August 31, 2011:
| Guggenheim China All-Cap ETF | | | | | | | | | | | | | |
| Description | | | Level 1 | | | Level 2 | | | Level 3 | | | Total | |
| (value in $000s) | | | | | | | | | | | | | |
| Assets: | | | | | | | | | | | | | |
| Common Stocks | | | | | | | | | | | | | |
| Basic Materials | | $ | 3,172 | | $ | 63 | | $ | –† | | $ | 3,235 | |
| Communications | | | 17,010 | | | — | | | — | | | 17,010 | |
| Consumer, Cyclical | | | 4,270 | | | — | | | — | | | 4,270 | |
| Consumer, Non–cyclical | | | 5,030 | | | — | | | — | | | 5,030 | |
| Diversified | | | 1,260 | | | — | | | — | | | 1,260 | |
| Energy | | | 12,820 | | | — | | | — | | | 12,820 | |
| Financial | | | 22,102 | | | — | | | — | | | 22,102 | |
| Industrial | | | 5,059 | | | — | | | — | | | 5,059 | |
| Technology | | | 724 | | | — | | | — | | | 724 | |
| Utilities | | | 976 | | | — | | | — | | | 976 | |
| Investments of Collateral for | | | | | | | | | | | | | |
| Securities Loaned | | | 5,651 | | | — | | | — | | | 5,651 | |
| Total | | $ | 78,074 | | $ | 63 | | $ | | † | $ | 78,137 | |
| |
| The transfers in and out of the valuation levels for the Fund at the report date when compared to the valuation levels at the end of the previous fiscal year are detailed below. |
| | | | | | | | | | | | $ | (000s | ) |
| Transfers from Level 1 to Level 2 | | | | | | | | | | | $ | 63 | |
| Transfers from Level 1 to Level 3 | | | | | | | | | | | | | † |
The transfer from Level 1 to Level 2 was the result of Real Gold Mining Ltd. being halted on the principal exchange pending the release of price sensitive news. The Fund values Level 2 equity securities using various observable market inputs.
The transfer from Level 1 to Level 3 was the result of China Forestry Holdings Co. Ltd. being halted on the principal exchange pending the release of price sensitive news regarding possible accounting irregularities.
The fair value estimate for China Forestry Holdings, Inc. was determined in good faith by the Pricing Committee pursuant to the Valuation Procedures established in good faith by management and approved by the Board of Trustees. There were various factors considered in reaching a fair value determination including, but not limited to, the following: the type of security, and public information obtained from the issuer and the primary stock exchange on which the issuer trades.
The following table presents the activity of the Fund’s investments measured at fair value using significant unobservable inputs (Level 3 valuations) for the year ended August 31, 2011.
| Level 3 Holdings | | | Securities | |
| (value in $000s) | | | | |
| Beginning Balance at 8/31/10 | | $ | — | |
| Net Realized Gain/Loss | | | — | |
| Change in Unrealized Gain/Loss | | | — | |
| Purchases | | | — | |
| Sales | | | — | |
| Transfers In | | | | † |
| Transfers Out | | | — | |
| Ending Balance at 8/31/11 | | $ | | † |
| † Market value is less than minimum figure disclosed. | | | | |
All securities held by Guggenheim ABC High Dividend ETF, Guggenheim Airline ETF, Guggenheim China Technology ETF, Guggenheim EW Euro-Pacific LDRs ETF, Guggenheim Solar ETF and Guggenheim S&P Global Water Index ETF were valued using quoted prices in active markets (Level 1). There were no transfers between levels for these Funds for the year ended August 31, 2011.
(b) Investment Transactions and Investment Income
Investment transactions are accounted for on the trade date. Realized gains and losses on investments are determined on the identified cost basis. Dividend income is recorded net of applicable withholding taxes on the ex-dividend date and interest income is recorded on an accrual basis. Discounts on debt securities purchased are accreted to interest income over the lives of the respective securities using the effective interest method. Premiums on debt securities purchased are amortized to interest income up to the next call date of the respective securities using the effective interest method.
The Funds record the character of dividends received from master limited partnerships (“MLPs”) based on estimates made at the time such distributions are received. These estimates are based upon a historical review of information available from each MLP and other industry sources. The characterization of the estimate may subsequently be revised based on information received from MLPs after their tax reporting periods conclude.
REIT distributions received by a Fund are generally comprised of ordinary income, long-term and short-term capital gains and return of capital. The actual character of amounts received during the year is not known until after the fiscal year end. A Fund records the character of distributions received from REITs during the year based on historical information available. A Fund’s characterization may be subsequently revised based on information received from REITs after their tax reporting periods conclude.
(c) Currency Translation
Assets and liabilities denominated in foreign currencies are translated into U.S. dollars at the mean of the bid and asked price of respective exchange rates on the last day of the period. Purchases and sales of investments denominated in foreign currencies are translated at the exchange rate on the date of the transaction.
Foreign exchange gain or loss resulting from holding of a foreign currency, expiration of a currency exchange contract, difference in exchange rates between the trade date and settlement date of an investment purchased or sold, and the difference between dividends actually received compared to the amount shown in a Fund’s accounting records on the date of receipt are included as net realized gains or losses on foreign currency transactions in the Fund’s Statement of Operations.
Foreign exchange gain or loss on assets and liabilities, other than investments, are included in unrealized appreciation/ (depreciation) on foreign currency translations.
(d) Distributions
The Funds intend to pay substantially all of their net investment income to shareholders through annual distributions, except for Guggenheim ABC High Dividend ETF which will pay a quarterly distribution. In addition, the Funds intend to distribute any capital gains to shareholders as capital gain dividends at least annually. The amount and timing of distributions are determined in accordance with federal income tax regulations, which may differ from GAAP.
(e) Security Lending
Each Fund may lend portfolio securities to certain creditworthy borrowers, including the Funds’ securities lending agent. The loans are collateralized at all times by cash and/or high grade debt obligations in an amount at least equal to 102% of the market value of domestic securities loaned and 105% of foreign securities loaned as determined at the close of business on the
Annual Report | August 31, 2011 | 51
Notes to Financial Statements continued
preceding business day. Each Fund receives compensation for lending securities from interest or dividends earned on the cash, cash equivalents or U.S. government securities held as collateral, net of fee rebates paid to the borrower plus reasonable administrative and custody fees. The dividend and interest income earned on the securities loaned is accounted for in the same manner as other dividend and interest income. The borrower pays to the Funds an amount equal to any dividends or interest received on loaned securities. These payments from the borrower are not eligible for reduced tax rates as “qualified dividend income” under the Jobs and Growth Tax Reconciliation Act of 2003. The Funds retain all or a portion of the interest received on investment of cash collateral or receives a fee from the borrower. Lending portfolio securities could result in a loss or delay in recovering each Fund’s securities if the borrower defaults. The securities lending income earned by the Funds is disclosed on the Statement of Operations.
(f) Recent Accounting Pronouncements
On May 12, 2011, the Financial Accounting Standards Board (“FASB”) issued ASU 2011-04, modifying Topic 820, Fair Value Measurements and Disclosures. At the same time, the International Accounting Standards Board (“IASB”) issued International Financial Reporting Standard (“IFRS”) 13, Fair Value Measurement. The objective by the FASB and IASB is convergence of their guidance on fair value measurements and disclosures. Specifically, the ASU requires reporting entities to disclose (i) the amounts of any transfers between Level 1 and Level 2, and the reasons for the transfers, (ii) for Level 3 fair value measurements, quantitative information about significant unobservable inputs used, (iii) a description of the valuation processes used by the reporting entity and, (iv) a narrative description of the sensitivity of the fair value measurement to changes in unobservable inputs if a change in those inputs might result in a significantly higher or lower fair value measurement. The effective date of the ASU is for interim and annual periods beginning after December 15, 2011, and is therefore not effective for the current fiscal year. Guggenheim Funds Investment Advisors, LLC (the “Adviser”) is in the process of assessing the impact of the updated standards on the Funds’ financial statements.
Note 3 – Investment Advisory Agreement and Other Agreements:
Pursuant to an Investment Advisory Agreement (the “Agreement”) between the Trust, on behalf of each Fund, and the Adviser, the Adviser manages the investment and reinvestment of each Fund’s assets and administers the affairs of each Fund to the extent requested by the Board of Trustees.
Pursuant to the Agreement, each Fund listed in the below table pays the Adviser an advisory fee. The advisory fee is payable on a monthly basis at the annual rate set forth below based on each Fund’s average daily net assets:
| Fund | | | Rate | |
| Guggenheim Airline ETF | | | 0.50 | % |
| Guggenheim Solar ETF | | | 0.50 | % |
| Guggenheim S&P Global Water Index ETF | | | 0.50 | % |
Pursuant to the Agreement, each Fund listed in the following table pays the Adviser a unitary management fee for the services and facilities it provides. The unitary management fee is payable on a monthly basis at the annual rate set forth below based on each Fund’s average daily net assets:
| Fund | | | Rate | |
| Guggenheim ABC High Dividend ETF | | | 0.65 | % |
| Guggenheim China All-Cap ETF | | | 0.70 | % |
| Guggenheim China Technology ETF | | | 0.70 | % |
| Guggenheim EW Euro-Pacific LDRs ETF | | | 0.35 | % |
Out of the unitary management fee, the Adviser pays substantially all the expenses of each Fund, including the cost of transfer agency, custody, fund administration, legal, audit and other services, except for the fee payments under the Agreement, distribution fees, if any, brokerage expenses, taxes, interest, litigation expenses and other extraordinary expenses.
Under a separate Fund Administration agreement, the Adviser provides Fund Administration services to the Funds. The Adviser receives a fund administration fee payable monthly at the annual rate set forth below as a percentage of the average daily net assets of each Fund:
| Net Assets | | | Rate | |
| First $200,000,000 | | | 0.0275 | % |
| Next $300,000,000 | | | 0.0200 | % |
| Next $500,000,000 | | | 0.0150 | % |
| Over $1,000,000,000 | | | 0.0100 | % |
Due to their unitary fee structure, Guggenheim ABC High Dividend ETF, Guggenheim China All-Cap ETF, Guggenheim China Technology ETF and Guggenheim EW Euro-Pacific LDRs ETF do not charge a separate Fund Administration fee.
For the year ended August 31, 2011, the below listed Funds recognized Fund Administration expenses and waived Fund Administration expenses as follows:
| | | | Fund Administration | | | Fund Administration | |
| | | | Expense | | | Expense Waived | |
| Guggenheim Airline ETF | | $ | 8,982 | | $ | — | |
| Guggenheim Solar ETF | | | 46,274 | | | — | |
| Guggenheim S&P Global Water Index ETF | | | 60,358 | | | — | |
The Bank of New York Mellon (“BNY”) acts as the Funds’ custodian, accounting agent, transfer agent and security lending agent. As custodian, BNY is responsible for the custody of the Funds’ assets. As accounting agent, BNY is responsible for maintaining the books and records of the Funds. As transfer agent, BNY is responsible for performing transfer agency services for the Funds. As security lending agent, BNY is responsible for executing the lending of the portfolio securities to creditworthy borrowers.
The Funds’ Adviser has contractually agreed to waive fees and/or pay Fund expenses to the extent necessary to prevent the operating expenses of each Fund, not including Guggenheim ABC High Dividend ETF, Guggenheim China All-Cap ETF, Guggenheim China Technology ETF and Guggenheim EW Euro-Pacific LDRs ETF, (excluding interest expense, a portion of the Fund’s licensing fees, offering costs, brokerage commissions and other trading expenses, taxes and extraordinary expenses such as litigation and other expenses not incurred in the ordinary course of the Fund’s business) from exceeding the following percentages of average net assets per year, at least until December 31, 2014:
| Fund | | | Rate | |
| Guggenheim Airline ETF | | | 0.65 | % |
| Guggenheim Solar ETF | | | 0.65 | % |
| Guggenheim S&P Global Water Index ETF | | | 0.65 | % |
Amounts owed to each Fund from the Adviser are shown in the Statement of Assets and Liabilities.
52 | Annual Report | August 31, 2011
Notes to Financial Statements continued
The Trust and the Adviser have entered into an Expense Reimbursement Agreement in which for a period of five years subsequent to each Fund’s commencement of operations (listed in the table below), the Adviser may recover from the Fund fees and expenses waived or reimbursed during the prior three years if the Fund’s expense ratio, including the recovered expenses, falls below the expense cap.
For the period ended August 31, 2011, the Adviser waived fees and assumed the following fees and expenses:
| | | Potentially Recoverable Expenses Expiring | |
| | | | Advisory | | | | | | | | | | |
| | | | Fees | | | | | | | | | | |
| | | | Waived | | | 2012 | | | 2013 | | | Total | |
| Guggenheim Airline ETF | | $ | 95,872 | | $ | 81,982 | | $ | 190,153 | * | $ | 272,135 | |
| Guggenheim Solar ETF | | | 306,289 | | | 903,564 | * | | — | | | 903,564 | |
| Guggenheim S&P Global | | | | | | | | | | | | | |
| Water Index ETF** | | | 178,518 | | | — | | | — | | | — | |
* Per the Expense Reimbursement Agreement discussed above, this year represents the last year the Fund will be eligible to recover fees and expenses.
** For Guggenheim S&P Global Water Index ETF, the year ended August 31, 2011 was the last year the Fund was eligible to recover fees and expenses.
Certain officers and trustees of the Trust may also be officers, directors and/or employees of the Adviser. The Trust does not compensate its officers or trustees who are officers, directors and/or employees of the Adviser.
Licensing Fee Agreements:
The Adviser has entered into licensing agreements on behalf of each Fund with the following Licensors:
| Fund | Licensor |
| Guggenheim ABC High Dividend ETF | The BNY Mellon |
| Guggenheim Airline ETF | Archipelago Holdings, Inc. |
| Guggenheim China All-Cap ETF | AlphaShares, LLC |
| Guggenheim China Technology ETF | AlphaShares, LLC |
| Guggenheim EW Euro-Pacific LDRs ETF | The BNY Mellon |
| Guggenheim Solar ETF | MAC Indexing LLC |
| Guggenheim S&P Global Water Index ETF | Standard & Poor’s, a division of The McGraw-Hill Companies, Inc. |
The above trademarks are trademarks owned by the respective Licensors. These trademarks have been licensed to the Adviser for use for certain purposes with the Funds. The Funds are not sponsored, endorsed, sold or promoted by the Licensors and the Licensors make no representation regarding the advisability of investing in shares of the Funds. Up to 5 basis points of licensing fees are excluded from the expense cap for the Funds without a unitary fee.
Note 4 – Federal Income Taxes:
The Funds intend to comply with the requirements of Subchapter M of the Internal Revenue Code of 1986, as amended, applicable to regulated investment companies. Accordingly, no provision for U.S. federal income taxes is required. In addition, by distributing substantially all of its ordinary income and long-term capital gains, if any, during each calendar year, the Funds intend not to be subject to U.S. federal excise tax.
At August 31, 2011, the cost of investments, accumulated unrealized appreciation/depreciation on investments and accumulated earnings/loss for federal income tax purposes were as follows:
| | | Cost of Investments for Tax Purposes | | Gross Tax Unrealized Appreciation | | Gross Tax Unrealized Depreciation | | Net Tax Unrealized Appreciation (Depreciation) | | Net Tax Unrealized Appreciation (Depreciation) on Foreign Currency | |
| Guggenheim ABC High Dividend ETF | | $ | 7,210,647 | | $ | 131,305 | | $ | (597,799 | ) | $ | (466,494 | ) | $ | 992 | |
| Guggenheim Airline ETF | | | 25,340,832 | | | 484,102 | | | (5,042,507 | ) | | (4,558,405 | ) | | (652 | ) |
| Guggenheim China All-Cap ETF | | | 84,111,483 | | | 7,685,654 | | | (13,660,117 | ) | | (5,974,463 | ) | | (12 | ) |
| Guggenheim China Technology ETF | | | 43,098,909 | | | 3,969,426 | | | (8,183,919 | ) | | (4,214,493 | ) | | 5 | |
| Guggenheim EW Euro-Pacific LDRs ETF | | | 2,894,158 | | | 510,098 | | | (248,904 | ) | | 261,194 | | | 614 | |
| Guggenheim Solar ETF | | | 251,997,538 | | | 5,893,482 | | | (82,313,193 | ) | | (76,419,711 | ) | | 6,044 | |
| Guggenheim S&P Global Water Index ETF | | | 221,994,090 | | | 27,143,468 | | | (23,062,910 | ) | | 4,080,558 | | | 140,384 | |
The differences between book basis and tax basis unrealized appreciation (depreciation) is attributable to the tax deferral of losses on wash sales, real estate investments trusts, partnerships and passive foreign investment companies.
Annual Report | August 31, 2011 | 53
Notes to Financial Statements continued
Tax components of the following balances at August 31, 2011, were as follows:
| | | | | | | | |
| | | Undistributed Ordinary Income/ (Accumulated Ordinary Loss) | | Undistributed Long-Term Gains/ (Accumulated Capital & Other Loss) | |
| Guggenheim ABC High Dividend ETF | | $ | 77,151 | | $ | (48,200 | ) |
| Guggenheim Airline ETF | | | (14,285 | ) | | (1,434,932 | ) |
| Guggenheim China All-Cap ETF | | | 1,069,344 | | | (1,407,562 | ) |
| Guggenheim China Technology ETF | | | 345,300 | | | (2,365,698 | ) |
| Guggenheim EW Euro-Pacific LDRs ETF | | | 61,083 | | | (2,143,891 | ) |
| Guggenheim Solar ETF | | | 3,381,107 | | | (186,904,930 | ) |
| Guggenheim S&P Global Water Index ETF | | | 3,395,528 | | | (89,852,234 | ) |
Distributions to Shareholders:
The tax character of distributions paid during the year ended August 31, 2011 was as follows:
| | | | | |
| | | Distributions paid from Ordinary Income | |
| Guggenheim ABC High Dividend ETF | | $ | — | |
| Guggenheim Airline ETF | | | 26,600 | |
| Guggenheim China All-Cap ETF | | | 874,200 | |
| Guggenheim China Technology ETF | | | 179,550 | |
| Guggenheim EW Euro-Pacific LDRs ETF | | | 117,040 | |
| Guggenheim Solar ETF | | | 575,360 | |
| Guggenheim S&P Global Water Index ETF | | | 4,420,200 | |
The tax character of distributions paid during the year ended August 31, 2010 was as follows:
| | | | | |
| | | Distributions paid from Ordinary Income | |
| Guggenheim EW Euro-Pacific LDRs ETF | | $ | 50,400 | |
| Guggenheim S&P Global Water ETF | | | 2,744,000 | |
At August 31, 2011, for federal income tax purposes, the Funds have capital loss carryforwards available as shown in the table below, to the extent provided by the regulations, to offset future capital gains through the years indicated. To the extent that these loss carryforwards are used to offset future capital gains, it is probable that the capital gains so offset will not be distributed to shareholders.
| | | | | | | | | | | | | | |
| | | Capital Loss expiring in 2017 | | Capital Loss expiring in 2018 | | Capital Loss expiring in 2019 | | Total | |
| Guggenheim ABC High Dividend ETF | | $ | — | | $ | — | | $ | — | | $ | — | |
| Guggenheim Airline ETF | | | — | | | 131,051 | | | 875,887 | | | 1,006,938 | |
| Guggenheim China All-Cap ETF | | | — | | | 29,627 | | | 853,049 | | | 882,676 | |
| Guggenheim China Technology ETF | | | — | | | — | | | 205,520 | | | 205,520 | |
| Guggenheim EW Euro-Pacific LDRs ETF | | | 526,501 | | | 1,617,390 | | | — | | | 2,143,891 | |
| Guggenheim Solar ETF | | | 6,030,482 | | | 118,970,762 | | | 21,774,342 | | | 146,775,586 | |
| Guggenheim S&P Global Water Index ETF | | | 32,128,972 | | | 39,507,902 | | | 16,653,160 | | | 88,290,034 | |
| | | | | |
| | | Capital Losses Utilized During Current Fiscal Year | |
| Guggenheim EW Euro-Pacific LDRs ETF | | $ | 100,955 | |
Capital and foreign currency losses incurred after October 31 (“post-October losses”) within the taxable year are deemed to arise on the first business day of each Fund’s next taxable year. During the period ended August 31, 2011, the following Funds incurred and will elect to defer net capital losses, currency losses and passive foreign investment company (PFIC) losses as follows:
| | | | | | | | |
| | | Post-October Capital Losses | | Post-October Foreign Currency and PFIC Losses | |
| Guggenheim ABC High Dividend ETF | | $ | 48,200 | | $ | 1,278 | |
| Guggenheim Airline ETF | | | 427,994 | | | 179,218 | |
| Guggenheim China All-Cap ETF | | | 524,886 | | | 3,458 | |
| Guggenheim China Technology ETF | | | 2,160,178 | | | — | |
| Guggenheim EW Euro-Pacific LDRs ETF | | | — | | | 24,912 | |
| Guggenheim Solar ETF | | | 40,129,344 | | | 64,999 | |
| Guggenheim S&P Global Water Index ETF | | | 1,562,200 | | | 5,960 | |
At August 31, 2011, the following reclassifications were made to the capital accounts of the Funds, to reflect permanent book/tax differences and income and gains available for distributions under income tax regulations, which are primarily due to the difference between investments in real estate investment trusts, investments in partnerships, wash sales from redemption in-kind transactions, and redemption of in-kind transactions. Net investment income, net realized gains and new assets were not affected by these changes.
| | | | | | | | | | | |
| | | Undistributed Net Investment Income/(Loss) | | Accumulated Net Realized Gain/(Loss) | | Paid In Capital | |
| Guggenheim ABC High Dividend ETF | | $ | (1,278 | ) | $ | 1,278 | | $ | — | |
| Guggenheim Airline ETF | | | 4,199 | | | (6,231,994 | ) | | 6,227,795 | |
| Guggenheim China All-Cap ETF | | | (2,226 | ) | | (937,231 | ) | | 939,457 | |
| Guggenheim China Technology ETF | | | 17,109 | | | (2,221,908 | ) | | 2,204,799 | |
| Guggenheim EW Euro-Pacific LDRs ETF | | | 7,072 | | | (290,340 | ) | | 283,268 | |
| Guggenheim Solar ETF | | | 146,855 | | | (18,478,229 | ) | | 18,331,374 | |
| Guggenheim S&P Global Water Index ETF | | | (14,187 | ) | | (3,359,124 | ) | | 3,373,311 | |
For all open tax years and all major jurisdictions, management of the Trust has concluded that there are no significant uncertain tax positions that would require recognition in the financial statements. Open tax years are those that are open for examination by taxing authorities (i.e. generally the last four tax year ends and the interim tax period since then). Furthermore, management of the Trust is also not aware of any tax positions for which it is reasonably possible that the total amounts of unrecognized tax benefits will significantly change in the next twelve months.
54 | Annual Report | August 31, 2011
Notes to Financial Statements continued
Note 5 - Investment Transactions:
For the period ended August 31, 2011, the cost of investments purchased and proceeds from sales of investments, excluding short-term investments and in-kind transactions, were as follows:
| | | | | | | | |
| | | | Purchases | | | Sales | |
| Guggenheim ABC High Dividend ETF | | $ | 1,066,858 | | $ | 1,055,872 | |
| Guggenheim Airline ETF | | | 12,478,463 | | | 12,882,345 | |
| Guggenheim China All-Cap ETF | | | 13,794,540 | | | 13,469,785 | |
| Guggenheim China Technology ETF | | | 10,406,061 | | | 10,215,579 | |
| Guggenheim EW Euro-Pacific LDRs ETF | | | 1,171,413 | | | 1,240,314 | |
| Guggenheim Solar ETF | | | 67,306,594 | | | 63,435,682 | |
| Guggenheim S&P Global Water Index ETF | | | 17,427,258 | | | 17,595,233 | |
For the period ended August 31, 2011, in-kind transactions were as follows:
| | | | | | | | |
| | | | Purchases | | | Sales | |
| Guggenheim ABC High Dividend ETF | | $ | 7,247,757 | | $ | — | |
| Guggenheim Airline ETF | | | 2,092,042 | | | 26,705,476 | |
| Guggenheim China All-Cap ETF | | | 30,493,791 | | | 17,227,486 | |
| Guggenheim China Technology ETF | | | 24,585,232 | | | 10,292,831 | |
| Guggenheim EW Euro-Pacific LDRs ETF | | | — | | | 904,727 | |
| Guggenheim Solar ETF | | | 113,237,818 | | | 95,465,718 | |
| Guggenheim S&P Global Water Index ETF | | | 31,948,817 | | | 40,907,413 | |
Note 6 – Capital:
Shares are issued and redeemed by the Funds only in Creation Unit size aggregations of 50,000 to 100,000 shares. Such transactions are only permitted on an in-kind basis, with separate cash payment, which is balancing each component to equate the transaction to the net asset value per share of the Fund on the transaction date. Transaction fees ranging from $500 to $6,000 are charged to those persons creating or redeeming Creation Units. An additional charge of up to four times the Creation or Redemption Transaction Fee may be imposed with respect to transactions effected outside of the Clearing Process or to the extent that cash is used in lieu of securities to purchase Creation Units or redeem for cash.
Note 7 - Distribution Agreement:
The Board of Trustees of the Trust has adopted a distribution and services plan (the “Plan”) pursuant to Rule 12b-1 under the 1940 Act. Under the Plan, each Fund is authorized to pay distribution fees in connection with the sale and distribution of its shares and pay service fees in connection with the provision of ongoing services to shareholders of each class and the maintenance of shareholder accounts in an amount up to 0.25% of its average daily net assets each year. No 12b-1 fees are currently paid by the Funds, and there are no current plans to impose these fees. No such fee may be paid in the future without further approval by the Board of Trustees.
Note 8 – Indemnifications:
In the normal course of business, the Funds enter into contracts that contain a variety of representations, which provide general indemnifications. Each Fund’s maximum exposure under these arrangements is unknown, as this would require future claims that may be made against a Fund that have not yet occurred. However, the Funds expect the risk of loss to be remote.
Note 9 – Subsequent Event:
The Funds evaluated subsequent events through the date the financial statements were available for issue and determined there were no additional material events that would require disclosure in the Fund’s financial statements, except as noted below.
Subsequent to August 31, 2011, the Board of Trustees declared the following dividends payable on September 30, 2011, to shareholders of record on September 28, 2011. The dividend rate per common share was as follows:
| | | | | |
| Fund | | | Rate | |
| Guggenheim ABC High Dividend ETF | | $ | 0.381 | |
Annual Report | August 31, 2011 | 55
Report of Independent Registered Public Accounting Firm |
The Board of Trustees and Shareholders of
Claymore Exchange-Traded Fund Trust 2
We have audited the accompanying statements of assets and liabilities of Guggenheim ABC High Dividend ETF, Guggenheim Airline ETF, Guggenheim China All-Cap ETF, Guggenheim China Technology ETF, Guggenheim EW Euro-Pacific LDRs ETF, Guggenheim Solar ETF, and Guggenheim S&P Global Water Index ETF, seven of the funds constituting the Claymore Exchange-Traded Fund Trust 2, collectively the Funds, including the portfolios of investments, as of August 31, 2011, and the related statements of operations, statements of changes in net assets and financials highlights for the periods indicated therein. These financial statements and financial highlights are the responsibility of the Funds’ management. Our responsibility is to express an opinion on these financial statements and financial highlights based on our audits.
We conducted our audits in accordance with the standards of the Public Company Accounting Oversight Board (United States). Those standards require that we plan and perform the audit to obtain reasonable assurance about whether the financial statements and financial highlights are free of material misstatement. We were not engaged to perform an audit of the Funds’ internal control over financial reporting. Our audits included consideration of internal control over financial reporting as a basis for designing audit procedures that are appropriate in the circumstances, but not for the purpose of expressing an opinion on the effectiveness of the Funds’ internal control over financial reporting. Accordingly, we express no such opinion. An audit also includes examining, on a test basis, evidence supporting the amounts and disclosures in the financial statements and financial highlights, assessing the accounting principles used and significant estimates made by management, and evaluating the overall financial statement presentation. Our procedures included confirmation of securities owned as of August 31, 2011, by correspondence with the custodian and brokers or by other appropriate auditing procedures where replies from brokers were not received. We believe that our audits provide a reasonable basis for our opinion.
In our opinion, the financial statements and financial highlights referred to above present fairly, in all material respects, the financial position of each of the Funds listed above constituting seven of the funds within the Claymore Exchange-Traded Fund Trust 2 at August 31, 2011, and the results of their operations, the changes in their net assets and the financial highlights for the periods indicated therein, in conformity with U.S. generally accepted accounting principles.
Chicago, Illinois
October 25, 2011
56 | Annual Report | August 31, 2011
Supplemental Information | (unaudited)
The Trust intends to designate the maximum amount of dividends that qualify for the reduced tax rate pursuant to the Jobs and Growth Tax Relief Reconciliation Act of 2003.
In January 2012, shareholders will be advised on IRS Form 1099DIV or substitute 1099DIV as to the federal tax status of the distributions received by shareholders in the calendar year 2011.
Guggenheim China All-Cap ETF intends to designate $155,594 of foreign tax withholding on foreign source income of $1,981,702.
Guggenheim EW Euro-Pacific LDRs ETF intends to designate $10,385 of foreign tax withholding on foreign source income of $72,753.
Guggenheim S&P Global Water Index ETF intends to designate $326,754 of foreign tax withholding on foreign source income of $2,443,002.
The Trust’s investment income (dividend income plus short-term gains, if any) qualifies as follows:
| | | | | | | | |
| | | Qualified dividend income | | Dividends-received deduction | |
| Guggenheim ABC High Dividend ETF | | | 0.00 | % | | 0.00 | % |
| Guggenheim Airline ETF | | | 73.87 | % | | 10.96 | % |
| Guggenheim China All-Cap ETF | | | 80.23 | % | | 0.00 | % |
| Guggenheim China Technology ETF | | | 33.56 | % | | 0.00 | % |
| Guggenheim EW Euro-Pacific LDRs ETF | | | 97.10 | % | | 0.00 | % |
| Guggenheim Solar ETF | | | 3.16 | % | | 0.00 | % |
| Guggenheim S&P Global Water Index ETF | | | 100.00 | % | | 29.14 | % |
Trustees
The Trustees of the Claymore Exchange-Traded Fund Trust 2 and their principal business occupations during the past five years:
| | | | | | | | | |
| Name, Address*, Year of Birth and Position(s) held with Registrant | | Term of Office** and Length of Time Served | | Principal Occupations during the Past Five Years and Other Affiliations | | Number of Funds in the Fund Complex*** Overseen by Trustee | | Other Directorships Held by Trustee during the Past Five Years |
| | | | | | | | | |
| Independent Trustees: | | | | | | |
Randall C. Barnes Year of Birth: 1951 Trustee | | Since 2006 | | Private Investor (2001-present). Formerly, Senior Vice President & Treasurer, PepsiCo, Inc. (1993-1997) President, Pizza Hut International (1991-1993) and Senior Vice President, Strategic Planning and New Business Development of PepsiCo, Inc. (1987-1990). | | 54 | | None |
| | | | | | | | | |
Roman Friedrich III Year of Birth: 1946 Trustee | | Since 2010† | | Founder and President of Roman Friedrich & Company, Ltd., a mining and metals investment bank (1998-present). Formerly, Advisory Board Member of McNicoll, Lewis & Vlak, an investment bank and institutional broker-dealer specializing in capital intensive industries such as energy, metals and mining (2010-2011). | | 48 | | Director, Axiom Gold and Silver Corp. (2011- present), Windstorm Resources, Inc. (2011- present), Zincore Metals, Inc. (2009 – present). |
| | | | | | | | | |
Robert B. Karn III Year of Birth: 1942 Trustee | | Since 2010† | | Consultant (1998-present). Previously, Managing Partner, Financial and Economic Consulting, St. Louis office of Arthur Andersen, LLP. | | 48 | | Director of Peabody Energy Company (2003- present), GP Natural Resource Partners LLC (2002-present), StrataGold Corporation (2003-2009), Gateway Gold Corp. (2004-2008), GFM Resources Ltd. (2005-2010). |
| | | | | | | | | |
Ronald A. Nyberg Year of Birth: 1953 Trustee | | Since 2006 | | Partner of Nyberg & Cassioppi, LLC, a law firm specializing in corporate law, estate planning and business transactions (2000-present). Formerly, Executive Vice President, General Counsel and Corporate Secretary of Van Kampen Investments (1982-1999). | | 56 | | None |
| | | | | | | | | |
Ronald E. Toupin, Jr. Year of Birth: 1958 Trustee | | Since 2006 | | Portfolio Consultant (2010-present). Formerly, Vice President, Manager and Portfolio Manager of Nuveen Asset Management (1998-1999), Vice President of Nuveen Investment Advisory Corp. (1992-1999), Vice President and Manager of Nuveen Unit Investment Trusts (1991-1999), and Assistant Vice President and Portfolio Manager of Nuveen Unit Investment Trusts (1988-1999), each of John Nuveen & Co., Inc. (1982-1999). | | 53 | | Trustee, Bennett Group of Funds (2011-present). |
| * | Address for all Trustees: 2455 Corporate West Drive, Lisle, IL 60532 |
| | |
| ** | This is the period for which the Trustee began serving the Trust. Each Trustee is expected to serve an indefinite term, until his successor is elected. |
| | |
| *** | The Guggenheim Funds Fund Complex consists of U.S. registered investment companies advised or serviced by Guggenheim Funds Investment Advisors, LLC and/or Guggenheim Funds Distributors, Inc. The Guggenheim Funds Fund Complex is overseen by multiple Boards of Trustees. |
| | |
| † | Messrs. Friedrich and Karn were elected by shareholders as Trustees of the Trust on September 23, 2010. |
Annual Report | August 31, 2011 | 57
Supplemental Information (unaudited) continued
Principal Executive Officers
The Officers of the Trust and their principal occupations during the past five years:
| | | | | |
| Name, Address*, Year of Birth and Position(s) held with Registrant | | Term of Office** and Length of Time Served | | Principal Occupations During the Past Five Years and Other Affiliations |
| Officers: | | | | |
Kevin M. Robinson Year of Birth: 1959 Chief Executive Officer Chief Legal Officer | | Since 2010 Since 2008 | | Senior Managing Director and General Counsel of Guggenheim Funds Investment Advisors, LLC, Guggenheim Funds Distributors, Inc., and Guggenheim Funds Services Group, Inc. (2007-present). Chief Legal Officer and Chief Executive Officer of certain other funds in the Fund Complex. Formerly, Associate General Counsel and Assistant Corporate Secretary of NYSE Euronext, Inc. (2000-2007). |
John Sullivan Year of Birth: 1955 Chief Financial Officer, Chief Accounting Officer and Treasurer | | Since 2010 | | Senior Managing Director of Guggenheim Funds Investment Advisors, LLC and Guggenheim Funds Distributors, Inc. Chief Accounting Officer, Chief Financial Officer and Treasurer of certain funds in the Fund Complex. Formerly, Chief Compliance Officer, Van Kampen Funds (2004-2010). |
Bruce Saxon Year of Birth: 1957 Chief Compliance Officer | | Since 2006 | | Vice President, Fund Compliance Officer of Guggenheim Funds Services Group, Inc. (2006-present). Chief Compliance Officer of certain other funds in the Fund Complex. Formerly, Chief Compliance Officer/Assistant Secretary of Harris Investment Management, Inc. (2003-2006). |
Mark E. Mathiasen Year of birth: 1978 Secretary | | Since 2011 | | Vice President; Assistant General Counsel of Guggenheim Funds Services Group, Inc. (2007-present). Secretary of certain funds in the Fund Complex. Formerly, Law Clerk, Idaho State Courts (2003-2006). |
| William H. Belden, III | | Since 2006 | | Managing Director of Guggenheim Funds Investment Advisors, LLC (2005-present). Formerly, Vice President of |
| Year of Birth: 1965 | | | | Product Management at Northern Trust Global Investments (1999-2005). |
| Vice President | | | | |
Chuck Craig Year of Birth: 1967 Vice President | | Since 2006 | | Managing Director (2006-present), Vice President (2003-2006) of Guggenheim Funds Investment Advisors, LLC. Formerly, Assistant Vice President, First Trust Portfolios, L.P. (1999-2003). |
David A. Botset Year of Birth: 1974 Vice President | | Since 2010 | | Senior Vice President, Guggenheim Funds Distributors, Inc. (2008-present). Formerly, Vice President, Guggenheim Funds Distributors, Inc. (2007-2008); Assistant Vice President, Investment Development and Oversight, Nuveen Investments (2004-2007); Assistant Vice President Internal Sales and Service, Nuveen Investments. |
| * | Address for all Officers: 2455 Corporate West Drive, Lisle, IL 60532 |
| | |
| ** | Officers serve at the pleasure of the Board of Trustees and until his or her successor is appointed and qualified or until his or her earlier resignation or removal. |
58 | Annual Report | August 31, 2011
Board Considerations Regarding Annual Review of the Investment Advisory Agreements and
Investment Sub-Advisory Agreement
Claymore Exchange-Traded Fund Trust and Claymore Exchange-Traded Fund Trust 2 (each a “Trust”)
On August 30, 2011, the Boards of Trustees (together, the “Board”) of Claymore Exchange-Traded Fund Trust and Claymore Exchange-Traded Fund Trust 2 (together the “Trusts,” with the separate series thereof referred to individually as a “Fund” and collectively as the “Funds”), including those trustees who are not “interested persons” as defined by the Investment Company Act of 1940, as amended (the “Independent Trustees”), on the recommendation of the Nominating & Governance Committees (referred to as the “Committee” and consisting solely of the Independent Trustees), considered the renewal of the investment advisory agreements (the “Advisory Agreements”) between the Trusts and Guggenheim Funds Investment Advisors, LLC (the “Adviser”) on behalf of the following Funds:
| | | |
| Claymore Exchange-Traded Fund Trust | | Claymore Exchange-Traded Fund Trust 2 |
| Guggenheim BRIC ETF | | Guggenheim Airline ETF |
| Guggenheim Defensive Equity ETF | | Guggenheim China All-Cap ETF |
| Guggenheim Insider Sentiment ETF | | Guggenheim China Technology ETF |
| Guggenheim International Small Cap LDRs ETF | | Guggenheim EW Euro-Pacific LDRs ETF |
| Guggenheim Mid-Cap Core ETF | | Guggenheim Solar ETF |
| Guggenheim Multi-Asset Income ETF | | Guggenheim S&P Global Water Index ETF |
| Guggenheim Ocean Tomo Growth Index ETF | | Guggenheim Canadian Energy Income ETF |
| Guggenheim Ocean Tomo Patent ETF | | Guggenheim China Real Estate ETF |
| Guggenheim Raymond James SB-1 Equity ETF | | Guggenheim China Small Cap ETF |
| Guggenheim Sector Rotation ETF | | Guggenheim Frontier Markets ETF |
| Guggenheim Spin-Off ETF | | Guggenheim International Multi-Asset Income ETF |
| Wilshire 4500 Completion ETF | | Guggenheim Shipping ETF |
| Wilshire 5000 Total Market ETF | | Guggenheim Timber ETF |
| Wilshire Micro-Cap ETF | | |
| Wilshire US Real Estate Investment Trust | | |
| Guggenheim Enhanced Core Bond ETF | | |
| Guggenheim Enhanced Ultra-Short Bond ETF | | |
| Guggenheim BulletShares 2011 Corporate Bond Fund ETF | | |
| Guggenheim BulletShares 2012 Corporate Bond Fund ETF | | |
| Guggenheim BulletShares 2013 Corporate Bond Fund ETF | | |
| Guggenheim BulletShares 2014 Corporate Bond Fund ETF | | |
| Guggenheim BulletShares 2015 Corporate Bond Fund ETF | | |
| Guggenheim BulletShares 2016 Corporate Bond Fund ETF | | |
| Guggenheim BulletShares 2017 Corporate Bond Fund ETF | | |
| Guggenheim/S&P Global Dividend Opportunities Index ETF | | |
The Board also considered the renewal of the Investment Subadvisory Agreement (“Subadvisory Agreement”) among Claymore Exchange-Traded Fund Trust, the Adviser and Guggenheim Partners Asset Management, LLC (the “Subadviser”) with respect to Wilshire 4500 Completion ETF, Wilshire 5000 Total Market ETF and Wilshire US Real Estate Investment Trust (the “Subadvised Funds”). As part of its review process, the Committee was represented by independent legal counsel. The Board and Committee reviewed materials received from the Adviser, the Subadviser and independent legal counsel. The Board and Committee also had previously received, throughout the year, Board meeting information regarding performance and operating results of the Funds.
The Committee met independently of the Funds’ management to consider the renewal of the investment advisory agreements. In preparation for its review, the Committee communicated with independent legal counsel regarding the nature of information to be provided, and independent legal counsel, on behalf of the Committee, sent a formal request for information to the Adviser and Subadviser and a supplemental request for information to the Adviser and Subadviser. The Adviser and Subadviser provided extensive information in response to the requests. Among other information, the Adviser and Subadviser provided general information to assist the Committee in assessing the nature and quality of services provided, information provided by the Adviser comparing the investment advisory fees and expense ratios of the Funds to other exchange-traded funds and to other funds in a peer group provided by the Adviser, information about the Adviser’s and Subadviser’s financial position, the profitability from the Advisory Agreements to the Adviser, the profitability of the Subadvisory Agreements to the Subadviser and the compliance program of the Adviser and Subadviser.
Based upon its review, the Board and the Committee concluded that it was in the best interests of the Funds to renew the Advisory Agreements and the Subadvised Funds to renew the Subadvisory Agreement. In reaching this conclusion for the Funds, no single factor was determinative in the Board’s analysis, but rather the Board considered a variety of factors.
Investment Advisory Agreements
In evaluating the nature, extent and quality of the Adviser’s services, the Board reviewed information concerning the functions performed by the Adviser for the Funds, information describing the Adviser’s organization, the background and experience of the persons responsible for the day-to-day management of the Funds, and the responsibility to oversee the Subadviser. The Board also considered the secondary market support provided by the Adviser to the Funds, including the Adviser’s efforts to educate investment professionals about the Funds and other funds sponsored by the Adviser. The Board reviewed financial information regarding the Adviser and its parent company and considered the parent company’s guaranty of the Adviser’s financial obligations under the Investment Advisory Agreements and considered the anticipated integration of the Adviser’s asset management business with that of Rydex/SGI entities. The Board reviewed information on the return of the Funds compared to the return of their benchmark indices and broad market indices. The Board also reviewed reports on the correlation and tracking error between the underlying index and each Fund’s return. The Board considered that each of the Funds was correlated to its underlying index, as applicable, and that the tracking error for each Fund was within a reasonable range noting the Adviser’s explanations for tracking error and that two of the Funds were actively managed as of June 1, 2011.
The Board reviewed and discussed the information provided by the Adviser on each Fund’s advisory fee and expense ratio, as compared to those of the peer group funds provided by the Adviser. The Board reviewed the advisory fees for the Funds and noted that the Adviser had either contractually agreed to waive the fee and/or reimburse expenses to absorb annual operating expenses of certain Funds (excluding interest expenses, a portion of each Fund’s licensing fees, brokerage commissions and other trading expenses, taxes and extraordinary expenses such as litigation and other expenses not incurred in the ordinary course of a Fund’s business) over a particular amount or, for certain other Funds, the Board noted that the advisory fee was a unitary fee pursuant to which the Adviser assumes all expenses of the Fund (including the cost of transfer agency, custody, fund administration, legal, audit and other services) other than the fee payments under the respective Advisory Agreement, distribution fees, if any, brokerage expenses, taxes, interest, litigation expenses and other extraordinary expenses. The Board noted that the advisory fees were generally within the range of the peer group funds provided by the Adviser and noted the unique nature of certain Funds making “peer” comparisons less relevant.
Annual Report | August 31, 2011 | 59
Considerations Regarding Annual Review of the Investment Advisory Agreements and Investment Sub-Advisory Agreement | (continued)
In conjunction with its review of fees, the Board also considered information provided by the Adviser on the revenues received by the Adviser under the Investment Advisory Agreements, as well as the fees waived, for certain Funds and the estimated allocated direct and indirect costs the Adviser incurred in providing the services to the Funds.
The Board considered the extent to which economies of scale could be realized with respect to the management of the Funds as the Funds grow and whether fee levels reflected a reasonable sharing of such economies of scale for the benefit of Fund investors. The Board considered each Fund’s asset size, advisory fee structure, net expense ratio giving effect to any applicable expense waiver and/or reimbursement agreement or unitary fee agreement with the Adviser and whether the investment process produced economies of scale. The Board considered the Adviser’s statement that, while it has experienced economies of scale as an organization through the introduction of new products, it is concurrently incurring new costs from increased staff and upgraded systems.
The Board considered other benefits available to the Adviser because of its relationship with the Funds and noted that the administrative service fees received by the Adviser from serving as administrator provide it with additional revenue for the Funds without a unitary fee structure. The Board also noted the Adviser’s statement that it benefits from its association with the Funds by being able to offer investors a range of investment products.
Subadvisory Agreement
With respect to the nature, extent and quality of the services provided by the Subadviser, the Board considered the qualifications, experience, reputation and skills of the Subadviser’s personnel providing services to the Subadvised Funds and other key personnel. The Board concluded that the Subadviser had personnel qualified to provide the services under the Subadvisory Agreement. The Board reviewed information on the performance of the Subadvised Funds and the performance of their benchmark indices noting that the Subadviser primarily provides optimization services. The Board also reviewed reports on the correlation and tracking error between the underlying index and each Subadvised Fund’s performance.
The Board considered the Subadviser’s statement that it had not received any subadvisory fees for its services and that the Subadvisory Agreement was negotiated at arm’s length between the Adviser and the Subadviser and that the Adviser compensates the Subadviser from its fees. On the basis of the information provided, the Board concluded that the subadvi-sory fee rate for the Subadvised Funds was reasonable.
The Board considered whether there were economies of scale with respect to the subadvisory services provided to the Subadvised Funds under the Subadvisory Agreement. The Board noted that the Subadvised Funds were relatively new and had not attracted significant assets and determined to address economies of scale when the Subadvised Funds had significant assets.
Overall Conclusions
Based upon all of the information considered and the conclusions reached, the Board determined that the terms of the Advisory Agreements and Subadvisory Agreement continue to be fair and reasonable and that the continuation of the Advisory Agreements and Subadvisory Agreement is in the best interests of the Funds, taking into consideration such factors as it deemed appropriate in its business judgment.
60 | Annual Report | August 31, 2011
Board Considerations Regarding Approval of
Advisory Agreement
CLAYMORE EXCHANGE TRADED FUND TRUST 2 (the “Trust”)
Guggenheim ABC High Dividend ETF
The Investment Advisory Agreement (“Advisory Agreement”) between Guggenheim Funds Investment Advisors, LLC (the “Adviser”) and the Trust, on behalf of the above-named series (the “Fund”), was approved by the Board of Trustees, including the trustees who are not parties to such agreement or interested persons of any such party, on May 25, 2011. The Board of Trustees, including a majority of the independent trustees, determined that approval of the Advisory Agreement was in the best interests of the Fund. The independent trustees, with the assistance of independent legal counsel, met separately from the officers and employees of the Investment Adviser to consider approval of the Advisory Agreement. The Board of Trustees, including the independent trustees, did not identify any single factor or group of factors as all important or controlling and considered all factors together. In evaluating whether to approve the Advisory Agreement for the Fund, the Board considered numerous factors, as described below.
With respect to the nature, extent and quality of the services to be provided by the Adviser under the Advisory Agreement, the Board considered and reviewed information concerning the services proposed to be provided under the Advisory Agreement, the proposed investment parameters of the index for the Fund, the Adviser’s Form ADV, financial information regarding the Adviser, information describing the Adviser’s organization, the Adviser’s acquisition by subsidiaries of Guggenheim Partners, LLC and integration within the Guggenheim organization, the background and experience of the persons who would be responsible for the management of the Fund, the anticipated financial support of the Fund and the nature and quality of services provided to other exchange-traded (“ETFs”) and closed-end funds by the Adviser. The Board also considered the services to be provided by the Adviser in its oversight of the Fund’s custodian, transfer agent and accounting agent, as well as the index licensor for the Fund, and noted the significant time and effort that would be devoted to this oversight function. Since the Fund is newly organized and has no investment performance, the Board did not consider investment performance of the Fund. Based upon its review, the Board concluded that the Adviser was qualified to manage the Fund and to oversee the services to be provided by other service providers and that the services to be provided by the Adviser to the Fund were expected to be satisfactory.
With respect to the costs of services to be provided and profits to be realized by the Adviser, the Board considered the resources involved in managing the Fund as well as the proposed unitary fee structure for the Fund. The Board noted that because the Fund was newly organized and had no assets, the Adviser did not provide profitability information. However, based upon the proposed unitary fee structure for the Fund, the Board concluded that profitability was not expected to be unreasonable.
The Board also reviewed information provided by the Adviser showing the proposed advisory fee for the Fund as compared to those of peer groups of ETFs provided by the Adviser. With respect to the Fund, the Board noted the services to be provided by the Adviser for annual advisory fees of 0.65% based on the Fund’s average daily net assets. The Board considered that the advisory fee was proposed to be a unitary fee, pursuant to which the Adviser would assume all expenses of the Fund (including the cost of transfer agency, custody, fund administration, legal, audit and other services) other than the fee payments under the Advisory Agreement, distribution fees, if any, brokerage expenses, taxes, interest, litigation expenses and other extraordinary expenses. The Board considered that the Fund’s proposed advisory fee was within range of those in its respective peer group of ETFs provided by the Adviser. The Board concluded that the Fund’s advisory fee was reasonable given the nature, extent and anticipated quality of the services to be provided under the Advisory Agreement.
The Board considered the extent to which economies of scale would be realized as the Fund grows and whether fee levels reflect a reasonable sharing of such economies of scale for the benefit of the Fund’s investors. Because the Fund was newly organized, the Board noted the Fund’s proposed unitary fees and determined to review economies of scale in the future when the Fund had attracted assets.
The Board considered benefits to be derived by the Adviser from its relationship with the Fund, including the benefits to the Adviser from its separate Administration Agreement with the Trust. The Board concluded that the advisory fee was reasonable, taking into account these benefits.
Overall Conclusions
Based upon all of the information considered and the conclusions reached, the Board determined that the terms of the Advisory Agreement are fair and reasonable and that approval of the Advisory Agreement is in the best interests of the Fund.
Annual Report | August 31, 2011 | 61
This Page Intentionally Left Blank.
Trust Information |
| | | | | |
| Board of Trustees | | Officers | | Investment Adviser |
| | | | | |
| Randall C. Barnes | | Kevin M. Robinson | | Guggenheim Funds Investment |
| | | Chief Executive Officer and | | Advisors, LLC |
| Roman Friedrich III | | Chief Legal Officer | | Lisle, IL |
| | | | | |
| Robert B. Karn III | | John Sullivan | | Distributor |
| | | Chief Financial Officer, Chief | | |
| Ronald A. Nyberg | | Accounting Officer and Treasurer | | Guggenheim Funds Distributors, Inc. |
| | | | | Lisle, IL |
| Ronald E. Toupin, Jr. | | Bruce Saxon | | |
| | | Chief Compliance Officer | | Administrator |
| | | | | |
| | | Mark E. Mathiasen | | Guggenheim Funds Investment |
| | | Secretary | | Advisors, LLC |
| | | | | Lisle, IL |
| | | William H. Belden III | | |
| | | Vice President | | Accounting Agent, Custodian |
| | | | | and Transfer Agent |
| | | Chuck Craig | | |
| | | Vice President | | The Bank of New York Mellon |
| | | | | NewYork, NY |
| | | David A. Botset | | |
| | | Vice President | | Legal Counsel |
| | | | | |
| | | | | Dechert LLP |
| | | | | NewYork, NY |
| | | | | |
| | | | | Independent Registered Public |
| | | | | Accounting Firm |
| | | | | |
| | | | | Ernst & Young LLP |
| | | | | Chicago, IL |
Privacy Principles of the Trust for Shareholders
The Funds are committed to maintaining the privacy of their shareholders and to safeguarding their non-public personal information. The following information is provided to help you understand what personal information the Funds collect, how we protect that information and why, in certain cases, we may share information with select other parties.
Generally, the Funds do not receive any non-public personal information relating to their shareholders, although certain non-public personal information of their shareholders may become available to the Funds. The Funds do not disclose any non-public personal information about their shareholders or former shareholders to anyone, except as permitted by law or as is necessary in order to service shareholder accounts (for example, to a transfer agent or third party administrator).
The Funds restrict access to non-public personal information about the shareholders to Guggenheim Funds Investment Advisors, LLC employees with a legitimate business need for the information. The Funds maintain physical, electronic and procedural safeguards designed to protect the non-public personal information of their shareholders.
Questions concerning your shares of the Trust?
| | • | If your shares are held in a Brokerage Account, contact your Broker. |
This report is sent to shareholders of the Funds for their information. It is not a Prospectus, circular or representation intended for use in the purchase or sale of shares of the Funds or of any securities mentioned in this report.
A description of the Funds’ proxy voting policies and procedures related to portfolio securities is available without charge, upon request, by calling the Funds at (800) 345-7999. Information regarding how the Funds voted proxies for portfolio securities, if applicable, during the most recent 12-month period ended June 30, is also available, without charge and upon request by calling (800) 345-7999, visiting the Guggenheim Funds website at www.guggenheimfunds.com or by accessing the Funds’ Form N-PX on the SEC’s website at www.sec.gov.
The Funds file their complete schedule of portfolio holdings with the SEC for the first and third quarters of each fiscal year on Form N-Q. The Funds’ Form N-Q is available on the SEC website at www.sec.gov or by visiting the Guggenheim Funds website at www.guggenheimfunds.com. The Funds’ Form N-Q may also be viewed and copied at the SEC’s Public Reference Room in Washington, DC; information on the operation of the Public Reference Room may be obtained by calling (800) SEC-0330.
Annual Report | August 31, 2011 | 63
About the Trust Adviser |
Guggenheim Funds Investment Advisors, LLC
Guggenheim Funds Investment Advisors, LLC (“Guggenheim Funds”) manages the investment and reinvestment of each Fund’s assets and administers the affairs of each Fund to the extent requested by the Board of Trustees. Guggenheim Funds also acts as investment adviser to closed-end and open-end management investment companies. Guggenheim Funds and its affiliates provide supervision, management or servicing of assets with a commitment to consistently delivering exceptional service. Guggenheim Funds is a subsidiary of Guggenheim Partners, LLC, a global, diversified financial services firm with more than $100 billion in assets under supervision. Guggenheim Partners, through its affiliates, provides investment management, investment advisory, insurance, investment banking, and capital markets services. The firm is headquartered in Chicago and New York with a global network of offices throughout the United States, Europe, and Asia.
Portfolio Management
The portfolio managers who are currently responsible for the day-to-day management of the Fund’s portfolio are Chuck Craig, CFA, and Saroj Kanuri, CFA. Mr. Craig has managed each Fund’s portfolio since its inception, and Mr. Kanuri has managed each Fund’s portfolio since May 2010. Mr. Craig is a Managing Director, Portfolio Management and Supervision, of Guggenheim Funds and Guggenheim Funds Distributors, Inc. and joined Guggenheim Funds Distributors, Inc. in May of 2003. Mr. Craig received a M.S. in Financial Markets from the Center for Law and Financial Markets at the Illinois Institute of Technology. He also earned a B.S. in Finance from Northern Illinois University.
Mr. Kanuri is a Vice President, ETF Portfolio Management, of Guggenheim Funds and Guggenheim Funds Distributors, Inc. and joined Guggenheim Funds Distributors, Inc. in October of 2006. Prior to joining Guggenheim, Mr. Kanuri served as an analyst at Northern Trust Corporation from 2001- 2006. Mr. Kanuri received a B.S. in Finance from the University of Illinois at Chicago.
Claymore Exchange-Traded Fund Trust 2 Overview
The Claymore Exchange-Traded Fund Trust 2 (the “Trust”) is an investment company complex consisting of 14 separate exchange-traded “index funds” as of August 31, 2011. The investment objective of each of the funds is to replicate as closely as possible, before fees and expenses, the performance of a specified market index.
This material must be preceded or accompanied by a prospectus for the fund being offered. The prospectus contains information about the fund including a discussion of investment objectives, risks, ongoing expenses and sales charges. If a prospectus did not accompany this report, you can obtain one from your financial adviser, from our website at http://www.guggenheimfunds.com or by calling (800)345-7999. Please read the prospectus carefully before investing. The Statement of Additional Information that includes additional information about the Trustees is also available, without charge, upon request via our website at http://www.guggenheimfunds.com or by calling (800)345-7999. All funds are subject to market risk and shares when sold may be worth more or less than their original cost. You can lose money investing in the funds.
Guggenheim Funds Distributors, Inc.
2455 Corporate West Drive
Lisle, IL 60532
Member FINRA/SIPC
(10/11)
NOT FDIC-INSURED | NOT BANK-GUARANTEED | MAY LOSE VALUE
ETF-002-AR-0811