UNITED STATES
SECURITIES AND EXCHANGE COMMISSION
Washington, D.C. 20549
FORM N-CSR
CERTIFIED SHAREHOLDER REPORT OF REGISTERED MANAGEMENT
INVESTMENT COMPANIES
Investment Company Act file number 811-21910
Claymore Exchange-Traded Fund Trust 2
(Exact name of registrant as specified in charter)
2455 Corporate West Drive, Lisle, IL 60532
(Address of principal executive offices) (Zip code)
Kevin M. Robinson
2455 Corporate West Drive, Lisle, IL 60532
(Name and address of agent for service)
Registrant's telephone number, including area code: (630) 505-3700
Date of fiscal year end: August 31
Date of reporting period: September 1, 2011 - August 31, 2012
Item 1. Reports to Stockholders.
The registrant's annual report transmitted to shareholders pursuant to Rule 30e-1 under the Investment Company Act of 1940, as amended (the “Investment Company Act”), is as follows:
August 31, 2012
GUGGENHEIM FUNDS
ANNUAL REPORT
| ABCS | Guggenheim ABC High Dividend ETF |
| FAA | Guggenheim Airline ETF |
| YAO | Guggenheim China All-Cap ETF |
| CQQQ | Guggenheim China Technology ETF |
| TAN | Guggenheim Solar ETF |
| CGW | Guggenheim S&P Global Water Index ETF |
WWW.GUGGENHEIMFUNDS.COM
... YOUR ROAD TO THE LATEST, MOST UP-TO-DATE INFORMATION
The shareholder report you are reading right now is just the beginning of the story. Online at www.guggenheimfunds.com, you will find:
| · | Daily and historical fund pricing, fund returns, portfolio holdings and characteristics, and distribution history. |
| · | Investor guides and fund fact sheets. |
| · | Regulatory documents including a prospectus and copies of shareholder reports. |
Guggenheim Funds Distributors, LLC is constantly updating and expanding shareholder information services on each Fund’s website, in an ongoing effort to provide you with the most current information about how your Fund’s assets are managed, and the results of our efforts. It is just one more small way we are working to keep you better informed about your investment.
| | |
| Contents | |
| Dear Shareholder | 3 |
| Economic and Market Overview | 4 |
| Management Discussion of Fund Performance | 6 |
| Fund Summary & Performance | 14 |
| Overview of Fund Expenses | 25 |
| Portfolio of Investments | 27 |
| Statement of Assets and Liabilities | 36 |
| Statement of Operations | 38 |
| Statement of Changes in Net Assets | 40 |
| Financial Highlights | 42 |
| Notes to Financial Statements | 48 |
| Report of Independent Registered Public | |
| Accounting Firm | 56 |
| Supplemental Information | 57 |
| Considerations Regarding Annual Review of the | |
| Investment Advisory Agreements and Investment | |
| Subadvisory Agreement | 59 |
| Trust Information | 63 |
| About the Trust Adviser | Back Cover |
August 31, 2012
DEAR SHAREHOLDER
Guggenheim Funds Investment Advisors, LLC (the “Investment Adviser”) is pleased to present the annual shareholder report for six of our exchange-traded funds (“ETFs” or “Funds”).
The Investment Adviser is now a part of Guggenheim Investments, which represents the investment management businesses of Guggenheim Partners, LLC (“Guggenheim”), a global diversified financial services firm.
This report covers performance of the following funds for the annual period ended August 31, 2012, with the name of each Fund followed by its NYSE Arca ticker symbol:
| · | Guggenheim ABC High Dividend ETF (ABCS) |
| · | Guggenheim Airline ETF (FAA) |
| · | Guggenheim China All-Cap ETF (YAO) |
| · | Guggenheim China Technology ETF (CQQQ) |
| · | Guggenheim Solar ETF (TAN) |
| · | Guggenheim S&P Global Water Index ETF (CGW) |
Guggenheim Funds Distributors, LLC, the distributor of the Funds, is committed to providing investors with innovative investment solutions; as of the date of this report we offer 44 ETFs with a wide range of domestic and global themes, as well as closed-end funds and unit investment trusts. We have built on the investment management strengths of Guggenheim Investments and worked with a diverse group of index providers to create some of the most distinctive ETFs available.
To learn more about economic and market conditions over the 12 months ending August 2012 and the objective and performance of each ETF, we encourage you to read the Economic and Market Overview section of the report, which follows this letter, and the Management Discussion of Fund Performance for each ETF, which begins on page 6.
Sincerely,
Donald C. Cacciapaglia
Trustee and Chief Executive Officer
Claymore Exchange-Traded Fund Trust 2
September 28, 2012
CLAYMORE EXCHANGE-TRADED FUND TRUST 2 ANNUAL REPORT l 3
| | |
| ECONOMIC AND MARKET OVERVIEW | August 31, 2012 |
A period of self-sustaining economic expansion, driven primarily by the aggressive monetary policy of the U.S. Federal Reserve (the “Fed”), and being reinforced by the European Central Bank (“ECB”), has helped the United States to become the economic locomotive of the global economy. Indeed, as the annual report period ended, the Fed was expected to embark on another round of quantitative easing to keep interest rates low and spur economic activity, responding to an unemployment rate stuck above 8% and U.S. Gross Domestic Product (“GDP”) growth that dropped to 1.3% in the second quarter of 2012 from a 2% rate in the first quarter due largely to anemic levels of consumer spending.
Among the headwinds faced by U.S. investors are a slowing global economy led by a European market in recession and slowing Chinese GDP, as well as uncertainty associated with the U.S. presidential election and approach of the “fiscal cliff” at the end of 2012. The “fiscal cliff” is when the Bush-era tax cuts will expire and $1.2 trillion in spending cuts take effect if Congress cannot agree on a budget. Such events have the potential to push the U.S. into recession. Nevertheless, corporate earnings continue to grow, despite expected third-quarter weakness; the housing market appears to be bottoming-out if not turning around, and private-sector job growth has been better than pre-recession levels. This has given ammunition to investors who disparage the continuing large-scale asset purchases by central banks, both in the U.S. and other major countries, which they contend have increased inflation risks.
Beginning in October 2011, the U.S. stock market moved up fairly consistently, except for a second-quarter pullback caused by lower earnings and slower GDP growth, with the Standard & Poor’s 500 Index (the “S&P 500”) closing on its highest level since early 2008 near the end of the period. (All returns cited are for the 12-month period ended August 31, 2012.) The S&P 500, which is generally regarded as an indicator of the broad U.S. stock market, returned 18.00%. Most foreign equity markets were considerably weaker than the U.S. equity market. The Morgan Stanley Capital International (“MSCI”) Europe-Australasia-Far East Index (“EAFE”), which is composed of approximately 1,100 companies in 20 developed countries in Europe and the Pacific Basin, returned -0.04%. The MSCI Emerging Market Index, which measures stock market performance in global emerging markets, returned -5.80%.
The search for yield also drove fixed-income investors to the U.S. bond markets, helping performance, with lower-rated bonds outperforming higher-quality issues. The return of the Barclays U.S. Aggregate Bond Index, which is a proxy for the U.S. investment grade bond market, returned 5.78%, while return of the Barclays U.S. Corporate High Yield Index was 14.59%. Reflecting the Fed’s continuing accommodative monetary policy, interest rates on short-term securities remained at their lowest levels in many years; the return of the Barclays 1–3 Month U.S. Treasury Bill Index was 0.05%.
4 l CLAYMORE EXCHANGE-TRADED FUND TRUST 2 ANNUAL REPORT
August 31, 2012
Index Definitions
All indices described below are unmanaged and reflect no expenses. It is not possible to invest directly in any index.
The Barclays U.S. Aggregate Bond Index is a broad-based benchmark that measures the investment grade, U.S. dollar denominated, fixed-rate taxable bond market, including U.S. Treasuries, government-related and corporate securities, MBS (agency fixed-rate and hybrid ARM pass-throughs), ABS, and CMBS.
The Barclays U.S. Corporate High Yield Bond Index measures the market of USD-denominated, non-investment grade, fixed-rate, taxable corporate bonds.
The Barclays 1-3 Month U.S. Treasury Bill Index tracks the performance of U.S. Treasury bills with a remaining maturity of one to three months. U.S. Treasury bills, which are short-term loans to the U.S. government, are full-faith-and-credit obligations of the U.S. Treasury and are generally regarded as being free of any risk of default.
The Dow Jones Global Utilities Index includes those companies in the Dow Jones Global Index associated with generating and distributing electricity through the burning of fossil fuels such as coal, petroleum and natural gas, and through nuclear energy; alternative electricity companies generating and distributing electricity from a renewable source; distributors of gas to end users; and multi-utility and water companies.
The MSCI All Country World Ex-US Index is a free float-adjusted market capitalization weighted index that is designed to measure the equity market performance of developed and emerging market countries excluding the United States.
The MSCI China Index is a capitalization weighted index that monitors the performance of stocks from the country of China.
The MSCI EAFE Index is a capitalization weighted measure of stock markets in Europe, Australasia and the Far East.
The MSCI Emerging Markets Index is a free float-adjusted market capitalization weighted index that is designed to measure equity market performance in the global emerging markets.
The MSCI World Index is a free float-adjusted market capitalization weighted index that is designed to measure the equity market performance of developed markets.
The Standard & Poor’s (“S&P”) 500 Index is a capitalization weighted index of 500 stocks designed to measure the performance of the broad economy, representing all major industries and is considered a representation of the U.S. stock market.
Industry Sectors
Comments about industry sectors in these fund commentaries are based on Bloomberg industry classifications.
CLAYMORE EXCHANGE-TRADED FUND TRUST 2 ANNUAL REPORT l 5
| | |
| MANAGEMENT DISCUSSION OF FUND PERFORMANCE | August 31, 2012 |
ABCS Guggenheim ABC High Dividend ETF
Fund Overview
The Guggenheim ABC High Dividend ETF, NYSE Arca ticker: ABCS (the “Fund”) seeks investment results that correspond generally to the performance, before the Fund’s fees and expenses, of an equity index called the BNY Mellon ABC Index (the “Index”).
The Index is a rules-based index comprised of, as of August 31, 2012, 30 securities, including common stocks and U.S. exchange-listed American depositary receipts (“ADRs”) of companies from Australia and Brazil and locally-listed companies in Australia and Canada, as defined by Bank of New York Mellon (the “Index Provider”). The depositary receipts included in the Index are sponsored. The Index constituent selection process selects the top ten stocks or ADRs with the highest yield from each country.
The Fund will invest at least 80% of its total assets in common stocks and ADRs that comprise the Index and depositary receipts representing common stocks included in the Index (or underlying securities representing ADRs included in the Index). The Investment Adviser seeks a correlation over time of 0.95 or better between the Fund’s performance and the performance of the Index. A figure of 1.00 would represent perfect correlation. The Fund generally will invest in all of the stocks comprising the Index in proportion to their weightings in the Index.
Fund Performance
All Fund returns cited—whether based on net asset value (“NAV”) or market price—assume the reinvestment of all distributions. This report discusses the annual fiscal period ended August 31, 2012.
On a market price basis, the Fund generated a total return of -12.40%, which included a decrease in market price over the period to $18.84 as of August 31, 2012, from $22.72 as of August 31, 2011. On an NAV basis, the Fund generated a total return of -12.10%, which included a decrease in NAV over the period to $18.89 as of August 31, 2012, from $22.70 as of August 31, 2011. At the end of the period, the Fund’s shares were trading at a market price discount to NAV, which is to be expected from time to time.
For underlying index and international market comparison purposes, the Index returned -11.82% and the MSCI All Country World Ex-US Index returned -1.92% for the 12-month period ended August 31, 2012.
The Fund pays distributions quarterly on the last business day of each calendar quarter to shareholders of record two business days earlier. The following distributions per share were paid during the 12-month period ended August 31, 2012:
| | |
| Payable Date | Amount |
| September 30, 2011 | $0.3810 |
| December 30, 2011 | $0.1900 |
| March 30, 2012 | $0.1820 |
| June 29, 2012 | $0.3180 |
Performance Attribution
For the 12-month period ended August 31, 2012, the utilities sector contributed most significantly to the Fund’s return, followed by the consumer, non-cyclical sector. The communications and basic materials sectors detracted most significantly from the Fund’s return.
Positions that contributed most significantly to the Fund’s return included Ultrapar Participacoes SA, ADR, a Brazilian holding company involved in fuel distribution, chemicals and logistics; Cia Energetica de Minas Gerais, ADR, a Brazilian holding company engaged in the generation, transmission and distribution of electricity; and Cia de Bebidas das Americas, ADR, a Brazilian beverage company (6.6%, 6.1% and 10.4%, respectively, of the Fund’s long-term investments at period end). Positions that detracted most significantly from the Fund’s return included Cia Siderugica Nacional SA, ADR, which primarily operates as an integrated steel producer in Brazil and Latin America; Telefonica Brasil SA, ADR, a telecommunications company which provides services for fixed and mobile telephony, data transmission and VAS, pay TV, among others, and is part of the Telefonica Group, a communication conglomerate with presence in multiple countries; and Vale SA, ADR, a Brazilian metals and mining company (3.6%, 5.1% and 10.1%, respectively, of the Fund’s long-term investments at period end).
6 l CLAYMORE EXCHANGE-TRADED FUND TRUST 2 ANNUAL REPORT
| | |
| MANAGEMENT DISCUSSION OF FUND PERFORMANCE continued | August 31, 2012 |
FAA Guggenheim Airline ETF
Fund Overview
The Guggenheim Airline ETF, NYSE Arca ticker: FAA (the “Fund”) seeks investment results that correspond generally to the performance, before the Fund’s fees and expenses, of an equity index called the NYSE Arca Global Airline Index (the “Index”).
The Index is a modified equal-dollar weighted index designed to measure the performance of highly capitalized and liquid U.S. and international passenger airline companies identified as being in the airline industry and listed on developed and emerging global market exchanges. Archipelago Holdings Inc. (“Arca” or the “Index Provider”), an affiliate of NYSE Euronext, Inc., defines “developed markets” as countries with western-style legal systems, transparent financial rules for financial reporting, and sophisticated, liquid and accessible stock exchanges with readily-exchangeable currencies. The Fund will invest at least 80% of its total assets in common stock, American depositary receipts (“ADRs”) and global depositary receipts (“GDRs”) that comprise the Index and depositary receipts representing common stocks included in the Index (or underlying securities representing ADRs and GDRs included in the Index). The Investment Adviser seeks a correlation over time of 0.95 or better between the Fund’s performance and the performance of the Index. A figure of 1.00 would represent perfect correlation. The Fund generally will invest in all of the securities comprising the Index in proportion to their weightings in the Index.
Fund Performance
All Fund returns cited—whether based on net asset value (“NAV”) or market price—assume the reinvestment of all distributions. This report discusses the annual fiscal period ended August 31, 2012.
On a market price basis, the Fund generated a total return of 0.13%, which included a decrease in market price over the period to $28.24 as of August 31, 2012, from $28.53 as of August 31, 2011. On an NAV basis, the Fund generated a total return of 0.20%, which included a decrease in NAV over the period to $28.23 as of August 31, 2012, from $28.50 as of August 31, 2011. At the end of the period the Fund’s shares were trading at a market price premium to NAV, which is to be expected from time to time.
For underlying index and broad global market comparison purposes, the Index returned 1.70% and the MSCI World Index returned 8.12% for the same period.
The Fund made an annual income distribution of $0.3050 per share on December 30, 2011, to shareholders of record on December 28, 2011.
Performance Attribution
All of the Fund’s holdings are classified in the consumer cyclical sector, which had a positive return, contributing to the Fund’s return for the 12-month period ended August 31, 2012. Positions that contributed most significantly to return included Delta Air Lines, Inc., which provides scheduled air transportation for passengers and cargo throughout the United States and around the world; US Airways Group, Inc., which provides airline service under names including US Airways, Piedmont and PSA Airlines from hubs in Charlotte, Philadelphia and Phoenix; and Hawaiian Holdings, Inc., which provides air transportation of passengers, cargo, and mail among the islands of Hawaii and between Hawaii and several West Coast gateway cities and destinations in the South Pacific (15.0%, 3.1% and 3.1%, respectively, of the Fund’s long-term investments at period end). Positions that detracted most significantly from the Fund’s return included AMR Corp., parent of American Airlines, which provides airline service in North America, the Caribbean, Latin America, Europe and Asia (not held in the portfolio at period end); All Nippon Airways Co., Ltd., which provides a variety of air transportation-related services, including air passenger and air courier services, the sale of aircraft parts, travel arrangements and reservation services, and hotel operations (4.5% of the Fund’s long-term investments at period end); and SAS AB, the flag airline carrier of Denmark, Norway and Sweden, and the largest airline in Scandinavia (not held in the portfolio at period end).
CLAYMORE EXCHANGE-TRADED FUND TRUST 2 ANNUAL REPORT l 7
| | |
| MANAGEMENT DISCUSSION OF FUND PERFORMANCE continued | August 31, 2012 |
YAO Guggenheim China All-Cap ETF
Fund Overview
The Guggenheim China All-Cap ETF, NYSE Arca ticker: YAO (the “Fund”) seeks investment results that correspond generally to the performance, before the Fund’s fees and expenses, of an equity index called the AlphaShares China All Cap Index (the “Index”).
The Index is designed to measure and monitor the performance of the investable universe of publicly-traded companies based in mainland China. The Index was created by AlphaShares, LLC (“AlphaShares”) and is maintained by Standard & Poor’s. The Index includes equity securities of companies of all capitalizations, as defined by AlphaShares, subject to certain minimum capitalization requirements. The Fund will invest at least 80% of its total assets in common stock, American depositary receipts (“ADRs”), American depositary shares (“ADSs”), global depositary receipts (“GDRs”) and international depositary receipts (“IDRs”) that comprise the Index and depositary receipts or shares representing common stocks included in the Index (or underlying securities representing ADRs, ADSs, GDRs and IDRs included in the Index). The Investment Adviser seeks a correlation over time of 0.95 or better between the Fund’s performance and the performance of the Index. A figure of 1.00 would represent perfect correlation. The Fund generally will invest in all of the securities comprising the Index in proportion to their weightings in the Index.
Fund Performance
All Fund returns cited—whether based on net asset value (“NAV”) or market price—assume the reinvestment of all distributions. This report discusses the annual fiscal period ended August 31, 2012.
On a market price basis, the Fund generated a total return of -10.84%, which included a decrease in market price over the period to $21.76 as of August 31, 2012, from $25.07 as of August 31, 2011. On an NAV basis, the Fund generated a total return of -11.17%, which included a decrease in NAV over the period to $21.66 as of August 31, 2012, from $25.04 as of August 31, 2011. At the end of the period, the Fund’s shares were trading at a market price premium to NAV, which is to be expected from time to time.
For underlying index and Chinese market comparison purposes, the Index returned -10.57% and the MSCI China Index returned -8.25% for the same period.
The Fund made an annual income distribution of $0.5800 per share on December 30, 2011, to shareholders of record on December 28, 2011.
Performance Attribution
For the 12-month period ended August 31, 2012, the utilities sector made the strongest contribution to the Fund’s return. The financial sector detracted most significantly from the Fund’s return.
Positions that contributed most significantly to the Fund’s return included Tencent Holdings, Ltd., which provides internet, mobile, and telecommunication value-added services in China; Want Want China Holdings, Ltd., which manufactures and trades rice crackers, snack food, beverages, and packing materials; and China Mobile Ltd., a provider of cellular telecommunications and related services in the People’s Republic of China and Hong Kong (5.7%, 1.5% and 5.7%, respectively, of the Fund’s long-term investments at period end). Positions that detracted most significantly from the Fund’s return included Baidu, Inc., ADR, a Chinese-language Internet search provider; Ctrip.com International Ltd., ADR, a travel service provider for hotel accommodations, airline tickets and packaged tours in China; and SINA Corp., an online media company that offers services in the People’s Republic of China and global Chinese communities (4.7%, 0.4% and 0.7%, respectively, of the Fund’s long-term investments at period end).
8 l CLAYMORE EXCHANGE-TRADED FUND TRUST 2 ANNUAL REPORT
| | |
| MANAGEMENT DISCUSSION OF FUND PERFORMANCE continued | August 31, 2012 |
CQQQ Guggenheim China Technology ETF
Fund Overview
The Guggenheim China Technology ETF, NYSE Arca ticker: CQQQ (the “Fund”) seeks investment results that correspond generally to the performance, before the Fund’s fees and expenses, of an equity index called the AlphaShares China Technology Index (the “Index”).
The Index is designed to measure and monitor the performance of the universe of publicly-traded companies which are based in mainland China, Hong Kong or Macau, are in the Information Technology Sector, as defined by Standard & Poor’s Global Industry Classification Standard, and are open to foreign investment. The Index was created by AlphaShares, LLC (“AlphaShares”) and is maintained by Standard & Poor’s. The Index includes equity securities of companies of all categories of market capitalizations, as defined by AlphaShares (subject to certain minimum capitalization requirements.)
The Index may include Hong Kong-listed securities, including China H-shares and Red Chips. China H-shares are issued by companies incorporated in mainland China and listed on the Hong Kong Stock Exchange. Red Chip shares are issued by companies with controlling Chinese shareholders that are incorporated outside mainland China and listed on the Hong Kong Stock Exchange. The Index may also include N-Shares, which are issued by companies based in mainland China and listed on the NYSE Arca, Inc. or NASDAQ Stock Market. The Index will not include China A-Shares (which are subject to substantial restrictions on foreign investment) or China B-Shares (which offer a generally smaller market and limited liquidity), each of which trade on the Shanghai Stock Exchange and the Shenzhen Stock Exchange.
The Fund will invest at least 80% of its total assets in common stock, American depositary receipts (“ADRs”), American depositary shares (“ADSs”), global depositary receipts (“GDRs”) and international depositary receipts (“IDRs”) that comprise the Index and depositary receipts or shares representing common stocks included in the Index (or underlying securities representing ADRs, ADSs, GDRs and IDRs included in the Index).
The Investment Adviser seeks a correlation over time of 0.95 or better between the Fund’s performance and the performance of the Index. A figure of 1.00 would represent perfect correlation. The Fund generally will invest in all of the securities comprising the Index in proportion to their weightings in the Index.
Fund Performance
All Fund returns cited—whether based on net asset value (“NAV”) or market price—assume the reinvestment of all distributions. This report discusses the annual fiscal period ended August 31, 2012.
On a market price basis, the Fund generated a total return of -19.78%, which included a decrease in market price over the period to $19.96 as of August 31, 2012, from $25.57 as of August 31, 2011. On an NAV basis, the Fund generated a total return of -19.10%, which included a decrease in NAV over the period to $20.03 as of August 31, 2012, from $25.44 as of August 31, 2011. At the end of the period, the Fund’s shares were trading at a market price discount to NAV, which is to be expected from time to time.
For underlying index and broad Chinese market comparison purposes, the Index returned -18.91% and the MSCI China Index returned -8.25% for the same period.
The Fund made an annual income distribution of $0.5650 per share on December 31, 2011, to shareholders of record on December 28, 2011.
Performance Attribution
For the 12-month period ended August 31, 2012, all sectors detracted from return; communications detracted most, while consumer cyclical detracted least. Positions that contributed most significantly to the Fund’s return included Tencent Holdings Ltd., which provides internet, mobile, and telecommunication value-added services in China (10.2% of the Fund’s long-term investments at period end); Alibaba.com Ltd., a provider of software, technology and other services to the online business-to-business marketplace (not held in the portfolio at period end); and AAC Technologies Holdings, Inc., which designs and manufactures miniature acoustic components (4.7% of the Fund’s long-term investments at period end). Positions that detracted most significantly from the Fund’s return included SINA Corp., an online media company; Sohu.com, Inc., a Chinese online media, search, gaming, community and mobile service group; and Baidu, Inc., ADR, a Chinese-language Internet search provider (6.9%, 3.8% and 10.1%, respectively, of the Fund’s long-term investments at period end).
CLAYMORE EXCHANGE-TRADED FUND TRUST 2 ANNUAL REPORT l 9
| | |
| MANAGEMENT DISCUSSION OF FUND PERFORMANCE continued | August 31, 2012 |
TAN Guggenheim Solar ETF
Fund Overview
The Guggenheim Solar ETF, NYSE Arca ticker: TAN (the “Fund”) seeks investment results that correspond generally to the performance, before the Fund’s fees and expenses, of an equity index called the MAC Global Solar Energy Index (the “Index”).
The Index is comprised of approximately 24 securities selected based on the relative importance of solar power within the company’s business model, as determined by MAC Indexing LLC (the “Index Provider”). As of August 31, 2012, the market capitalization of securities included in the Index ranged from approximately $71 million to $1.2 billion. The Index is designed to track companies within the following business segments of the solar energy industry: companies that produce solar power equipment and products for end-users; companies that produce fabrication products (such as the equipment used by solar cell and module producers to manufacture solar power equipment) or services (such as companies specializing in the solar cell manufacturing or the provision of consulting services to solar cell and module producers) for solar power equipment producers; companies that supply raw materials or components to solar power equipment producers or integrators; companies that derive a significant portion of their business (as defined in the Fund prospectus under “Index Methodology”) from solar power system sales, distribution, installation, integration or financing; and companies that specialize in selling electricity derived from solar power. The Index is generally comprised of equity securities, including American depositary receipts (“ADRs”) and global depositary receipts (“GDRs”), traded in developed markets, as defined by the Index Provider. While the equity securities comprising the Index are traded in developed markets, the issuers of such securities may be located in emerging markets. Emerging market countries are countries that major international financial institutions, such as the World Bank, generally consider to be less economically mature than developed nations. The Fund will invest at least 90% of its total assets in common stock, ADRs and GDRs that comprise the Index and depositary receipts representing common stocks included in the Index (or underlying securities representing ADRs and GDRs included in the Index).
The Investment Adviser seeks a correlation over time of 0.95 or better between the Fund’s performance and the performance of the Index. A figure of 1.00 would represent perfect correlation. The Fund generally will invest in all of the securities comprising the Index in proportion to their weightings in the Index.
Fund Performance
All Fund returns cited—whether based on net asset value (“NAV”) or market price—assume the reinvestment of all distributions. On February 15, 2012, the Fund executed a 1-for-10 reverse split of the shares with the number of shares outstanding declining by a factor of 10 and the market price of the Fund’s shares increasing by a factor of 10. The total market value of the positions held by shareholders was not affected by the reverse split. Share prices cited have been adjusted to reflect this split. This report discusses the annual fiscal period ended August 31, 2012.
On a market price basis, the Fund generated a total return of -66.78%, which included a decrease in market price over the period to $16.71 as of August 31, 2012, from $54.60 as of August 31, 2011. On an NAV basis, the Fund generated a total return of -66.93%, which included a decrease in NAV over the period to $16.74 as of August 31, 2012, from $54.90 as of August 31, 2011. At the end of the period, the Fund’s shares were trading at a market price discount to NAV, which is to be expected from time to time.
For underlying index and broad international market comparison purposes, the Index returned -69.06% and the MSCI World Index returned 8.12% for the same period.
The Fund made an annual income distribution of $2.110 per share on December 30, 2011, to shareholders of record on December 28, 2011. (The distribution amount has been adjusted to reflect the reverse stock split described above.)
Performance Attribution
The Fund’s holdings are in the basic materials, energy, industrial and technology sectors, all of which had negative returns for the 12-month period ended August 31, 2012, detracting from the Fund’s return. The technology sector detracted most and the basic materials sector detracted least.
Positions that contributed to the Fund’s return included Power-One, Inc., which designs and manufactures power conversion products including solar inverters (7.0% of the Fund’s long-term investments at period end); Conergy AG, a German manufacturer of products for solar power generation (2.7% of the Fund’s long-term investments at period end); and Roth & Rau AG, which manufactures equipment used to produce photovoltaics and to prepare surfaces in manufacturing processes (not held in the portfolio at period end). Positions that detracted most significantly from return included First Solar, Inc., a U.S.-based producer of solar modules and photovoltaic solar power systems; GCL-Poly Energy Holdings Ltd., a Hong Kong company that manufactures polysilicon and wafers for the solar industry and operates power plants; and Suntech Power Holdings Co. Ltd., ADR, which produces solar cells (11.5%, 7.4% and 2.2%, respectively, of the Fund’s long-term investments at period end).
10 l CLAYMORE EXCHANGE-TRADED FUND TRUST 2 ANNUAL REPORT
| | |
| MANAGEMENT DISCUSSION OF FUND PERFORMANCE continued | August 31, 2012 |
CGW Guggenheim S&P Global Water Index ETF
Fund Overview
The Guggenheim S&P Global Water Index ETF, NYSE Arca ticker: CGW (the “Fund”), seeks investment results that correspond generally to the performance, before the Fund’s fees and expenses, of an equity index called the S&P Global Water Index (the “Index”).
The Index is comprised of approximately 50 equity securities selected, based on investment and other criteria, from a universe of companies listed on global developed market exchanges. Standard & Poor’s Financial Services LLC, a division of The McGraw-Hill Companies (“S&P”), generally defines “developed markets” as the capital markets of those countries with high levels of per capita income and strict market regulation resulting in greater transparency. The universe of companies includes all companies classified by Standard & Poor’s Global Industry Classifications as being associated (in a manner representing a major component of such companies’ business) with the global demand for water, including water utilities, infrastructure, equipment, instruments and materials. Total market capitalization and float-adjusted market capitalization of securities in the Index must be at least $250 million and $100 million, respectively, at the time of each reconstitution, which includes small-, mid-, and large-capitalization securities as defined by S&P. The companies in the universe are selected using criteria as identified by S&P.
The Fund will invest at least 90% of its total assets in common stock and American depositary receipts (“ADRs”) that comprise the Index and depositary receipts representing common stocks included in the Index (or underlying securities representing ADRs included in the Index). The Investment Adviser seeks a correlation over time of 0.95 or better between the Fund’s performance and the performance of the Index. A figure of 1.00 would represent perfect correlation. The Fund generally will invest in all of the securities comprising the Index in proportion to their weightings in the Index.
Fund Performance
All Fund returns cited—whether based on net asset value (“NAV”) or market price—assume the reinvestment of all distributions. This report discusses the annual fiscal period ended August 31, 2012.
On a market price basis, the Fund generated a total return of 7.25%, which included an increase in market price over the period to $20.98 as of August 31, 2012, from $19.99 as of August 31, 2011. On an NAV basis, the Fund generated a total return of 7.23%, which included an increase in NAV over the period to $21.05 as of August 31, 2012, from $20.06 as of August 31, 2011. At the end of the period, the Fund’s shares were trading at a market price discount to NAV, which is to be expected from time to time.
For underlying index, broad global market and global utilities market comparison purposes, the Index returned 7.82%, the MSCI World Index returned 8.12%, and the Dow Jones Global Utilities Index returned -3.69% for the same period.
The Fund made an annual income distribution of $0.4110 per share on December 30, 2011, to shareholders of record on December 28, 2011.
Performance Attribution
For the 12-month period ended August 31, 2012, the utilities sector contributed most significantly to the Fund’s return, and the basic materials sector was the only sector that detracted from to the Fund’s return. Positions that contributed most significantly to the Fund’s return included Cia de Saneamento Basico do Estado de Sao Paulo, ADR, which provides water and sewage services to in the State of Sao Paulo, Brazil; American Water Works Co., Inc., a water and wastewater utility company that provides services to 16 million people in 35 states and two Canadian provinces; and Severn Trent PLC, which supplies water, waste, and utility services throughout the United Kingdom, Europe, and the United States (5.3%, 7.1% and 7.2%, respectively, of the Fund’s long-term investments at period end). Positions that detracted most significantly from the Fund’s return included Veolia Environnement SA, a French provider of environmental management services; Suez Environnement Co., a French provider of water and waste removal services; and Kurita Water Industries Ltd., which manufactures, sells, and maintains water treatment equipment and systems (3.1%, 1.8% and 2.3%, respectively, of the Fund’s long-term investments at period end).
CLAYMORE EXCHANGE-TRADED FUND TRUST 2 ANNUAL REPORT l 11
August 31, 2012
Risks and Other Considerations
The views expressed in this report reflect those of the portfolio managers and Guggenheim Funds Investment Advisors, LLC only through the report period as stated on the cover. These views are subject to change at any time, based on market and other conditions and should not be construed as a recommendation of any kind. The material may also contain forward looking statements that involve risk and uncertainty, and there is no guarantee they will come to pass.
This information does not represent an offer to sell securities of the Funds and it is not soliciting an offer to buy securities of the Funds. An investment in the various Guggenheim Funds ETFs is subject to certain risks and other considerations. Below are some general risks and considerations associated with investing in a Fund, which may cause you to lose money, including the entire principal that you invest. Please refer to the individual ETF prospectus for a more detailed discussion of Fund-specific risks and considerations.
Investment Risk: An investment in a Fund is subject to investment risk, including the possible loss of the entire principal amount that you invest.
Equity Risk: The value of the securities held by each Fund may fall due to general market and economic conditions, perceptions regarding the industries in which the issuers of securities held by each Fund participate, or factors relating to specific companies in which such Fund invests.
Foreign Investment Risk: A Fund’s investments in non-U.S. issuers, may involve unique risks compared to investing in securities of U.S. issuers, including, among others, greater market volatility than U.S. securities and less complete financial information than for U.S. issuers. In addition, adverse political, economic or social developments could undermine the value of such Fund’s investments or prevent such Fund from realizing the full value of its investments. Financial reporting standards for companies based in foreign markets differ from those in the U.S. Finally, the value of the currency of the country in which a Fund has invested could decline relative to the value of the U.S. dollar, which may affect the value of the investment to U.S. investors. In addition, the underlying issuers of certain depositary receipts, particularly unsponsored or unregistered depositary receipts, are under no obligation to distribute shareholder communications to the holders of such receipts, or to pass through to them any voting rights with respect to the deposited securities.
Emerging Markets Risk: Investment in securities of issuers based in developing or “emerging market” countries entails all of the risks of investing in securities of non-U.S. issuers, as previously described, but to a heightened degree.
Industry Risk: To the extent that Funds focus their investments in a particular industry of group of related industries, the NAV of the Funds will be more susceptible to factors affecting that industry or sector. Accordingly, the Fund may be subject to more risks than if it were broadly diversified over numerous industries and sectors of the economy.
Micro-, Small- and Medium-Sized Company Risk: Investing in securities of these companies involves greater risk as their stocks may be more volatile and less liquid than investing in more established companies. These stocks may have returns that vary, sometimes significantly, from the overall stock market. Micro-cap companies may be newly formed, less developed and there may be less available information about the company.
Replication Management Risk: The Funds are not “actively” managed. Therefore, a Fund would not necessarily sell a security because the security’s issuer was in financial trouble unless that stock is removed from such Fund’s Index.
Non-Correlation Risk: A Fund’s return may not match the return of such Fund’s index for a number of reasons. For example, the Fund incurs a number of operating expenses not applicable to the Index, and incurs costs in buying and selling securities, especially when rebalancing the Fund’s securities holdings to reflect changes in the composition of the Index. A Fund may not be fully invested at times, either as a result of cash flows into such Fund or reserves of cash held by a Fund to meet redemptions and expenses. If a Fund utilizes a sampling approach or futures or other derivative positions, its return may not correlate as well with the return on the Index, as would be the case if it purchased all of the securities in the Index with the same weightings as the Index.
Issuer-Specific Changes: The value of an individual security or particular type of security can be more volatile than the market as a whole and can perform differently from the value of the market as a whole. The value of securities of smaller issuers can be more volatile than that of larger issuers.
Non-Diversified Fund Risk: Non-diversified Funds can invest a greater portion of assets in securities of individual issuers than a diversified fund. Changes in the market value of a single investment could cause greater fluctuations in share price than would occur in a diversified fund.
Concentration Risk. If the Index concentrates in an industry or group of industries the Fund’s investments will be concentrated accordingly. In such event, the value of the Fund’s shares may rise and fall more than the value of shares of a fund that invests in securities of companies in a broader range of industries.
China Investment Risk (YAO and CQQQ): Investing in securities of Chinese companies involves additional risks, including, but not limited to: the economy of China differs, often unfavorably, from the U.S. economy in such respects as structure, general development, government involvement, wealth distribution, rate of inflation, growth rate, allocation of resources and capital reinvestment, among others; the central government has historically exercised substantial control over virtually every sector of the Chinese economy through administrative regulation and/or state ownership; and actions of the Chinese central and local government authorities continue to have a substantial effect on economic conditions in China.
The Guggenheim ABC High Dividend ETF is also subject to risks of investing in Australia and Canada including commodity exposure risk, geographic risk and trading partners risk. Commodity exposure risk is exposure related to any negative changes in the agricultural or mining industries which could therefore have an adverse impact on the Australian or Canadian economy, as applicable. Geographic risk is the risk that a natural disaster could occur in Australia or Canada, as applicable. Trading partners risk is due to the
12 l CLAYMORE EXCHANGE-TRADED FUND TRUST 2 ANNUAL REPORT
August 31, 2012
Australian or Canadian economy, as applicable, being heavily dependent upon trading with its key partners. Any reduction in this trading may cause an adverse impact on the economy in which the Fund invests. The Fund is also subject to certain risks of investing in Brazil. Brazil has experienced substantial economic instability resulting from, among other things, periods of very high inflation, persistent structural public sector deficits and significant devaluations of the currency of Brazil, and leading also to a high degree of price volatility in both the Brazilian equity and foreign currency markets. Brazilian companies may also be adversely affected by high interest and unemployment rates, and are particularly sensitive to fluctuations in commodity prices.
Recent Market Developments Risk. Global and domestic financial markets have experienced periods of unprecedented turmoil. Recently, markets have witnessed more stabilized economic activity as expectations for an economic recovery increased. However, risks to a robust resumption of growth persist. Continuing uncertainty as to the status of the euro and the European Monetary Union has created significant volatility in currency and financial markets generally. A return to unfavorable economic conditions or sustained economic slowdown could adversely impact the Funds’ portfolios. Financial market conditions, as well as various social and political tensions in the US and around the world, have contributed to increased market volatility and may have long-term effects on the US and worldwide financial markets and cause further economic uncertainties or deterioration in the US and worldwide. The Investment Adviser does not know how long the financial markets will continue to be affected by these events and cannot predict the effects of these or similar events in the future on the U.S. and global economies and securities markets.
There is no assurance that the requirements of the NYSE Arca necessary to maintain the listing of the Funds will continue to be met or will remain unchanged.
In addition to the risks described, there are certain other risks related to investing in the Funds. These risks are described further in the Prospectus and Statement of Additional Information.
CLAYMORE EXCHANGE-TRADED FUND TRUST 2 ANNUAL REPORT l 13
| | |
| FUND SUMMARY & PERFORMANCE (Unaudited) | August 31, 2012 |
ABCS Guggenheim ABC High Dividend ETF
| | | |
| Fund Statistics | | |
| Share Price | | $18.84 |
| Net Asset Value | | $18.89 |
| Premium/Discount to NAV | | -0.26% |
| Net Assets ($000) | | $10,389 |
| | | |
| Total Returns | | |
| | | Since Inception |
| (Inception 6/8/11) | One Year | (Annualized) |
| Guggenheim ABC High | | |
| Dividend ETF | | |
| NAV | -12.10% | -16.77% |
| Market | -12.40% | -16.95% |
| The BNY Mellon ABC Index | -11.82% | -16.39% |
| MSCI All Country World | | |
| Ex-US Index | -1.92% | -9.31% |
Performance data quoted represents past performance, which is no guarantee of future results and current performance may be lower or higher than the figures shown. The deduction of taxes that a shareholder would pay on Fund distributions or the redemption of Fund shares is not reflected in the total returns. For the most recent month-end performance figures, please visit www.guggenheimfunds.com. The investment return and principal value of an investment will fluctuate with changes in market conditions and other factors so that an investor’s shares, when redeemed, may be worth more or less than their original cost.
Since inception returns assume a purchase of the Fund at the initial share price of $25.01 per share for share price returns or initial net asset value (NAV) of $25.01 per share for NAV returns.
The Fund’s annual operating expense ratio of 0.65% is expressed as a unitary fee and covers all expenses of the Fund, except for distribution fees, if any, brokerage expenses, taxes, interest, litigation expenses and other extraordinary expenses.
| | |
| Portfolio Breakdown | % of Net Assets |
| Basic Materials | 23.5% |
| Energy | 15.1% |
| Consumer, Cyclical | 15.0% |
| Utilities | 13.8% |
| Consumer, Non-cyclical | 12.2% |
| Communications | 11.3% |
| Financial | 6.2% |
| Industrial | 1.6% |
| Total Common and Preferred Stocks | 98.7% |
| Investments of Collateral for Securities Loaned | 23.7% |
| Total Investments | 122.4% |
| Liabilities in excess of Other Assets | -22.4% |
| Net Assets | 100.0% |
| | |
| | % of Long-Term |
| Country Breakdown | Investments |
| Brazil | 54.9% |
| Canada | 24.8% |
| Australia | 20.3% |
| | |
| | % of Long-Term |
| Currency Denomination | Investments |
| United States Dollar | 54.9% |
| Canadian Dollar | 24.8% |
| Australian Dollar | 20.3% |
| | |
| | % of Long-Term |
| Top Ten Holdings | Investments |
| Cia de Bebidas das Americas, ADR | 10.4% |
| Vale SA, ADR | 10.1% |
| Ultrapar Participacoes SA, ADR | 6.6% |
| Cia Energetica de Minas Gerais, ADR | 6.1% |
| Telefonica Brasil SA, ADR | 5.1% |
| Banco Santander Brasil SA, ADR | 4.3% |
| Enerplus Corp. | 4.0% |
| Oi SA, ADR | 3.9% |
| Pengrowth Energy Corp. | 3.7% |
| Cia Siderurgica Nacional SA, ADR | 3.6% |
Portfolio breakdown is shown as a percentage of net assets. Country breakdown, currency denomination and holdings are shown as a percentage of long-term investments. All are subject to change daily. For more current Fund information, please visit www.guggenheimfunds.com. The above summaries are provided for informational purposes only, and should not be viewed as recommendations.
14 l CLAYMORE EXCHANGE-TRADED FUND TRUST 2 ANNUAL REPORT
| | |
| FUND SUMMARY & PERFORMANCE (Unaudited) continued | August 31, 2012 |
ABCS Guggenheim ABC High Dividend ETF continued
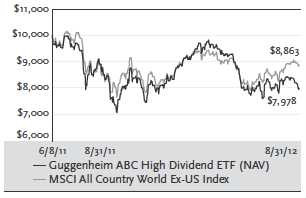
Performance of a $10,000 Investment
This graph compares a hypothetical $10,000 investment in the Fund, made at its inception, with a similar investment in the MSCI All Country World Ex-US Index. Results include the reinvestment of all dividends and capital gains. Past performance is no guarantee of future results. The MSCI All Country World Ex-US Index is a free float-adjusted market capitalization weighted index that is designed to measure the equity market performance of developed and emerging market countries excluding the United States. It is not possible to invest directly in the MSCI All Country World Ex-US Index. Investment return and principal value will fluctuate with changes in market conditions and other factors and Fund shares, when redeemed, may be worth more or less than their original investment.
Distributions to Shareholders &
Annualized Distribution Rate based on Market Price
CLAYMORE EXCHANGE-TRADED FUND TRUST 2 ANNUAL REPORT l 15
| | |
| FUND SUMMARY & PERFORMANCE (Unaudited) continued | August 31, 2012 |
| | | | |
| FAA Guggenheim Airline ETF | |
| | | |
| Fund Statistics | | | |
| Share Price | | | $28.24 |
| Net Asset Value | | | $28.23 |
| Premium/Discount to NAV | | | 0.04% |
| Net Assets ($000) | | | $15,524 |
| | | | |
| Total Returns | | | |
| | | | Since |
| | One | Three Year | Inception |
| (Inception 1/26/09) | Year | (Annualized) | (Annualized) |
| Guggenheim Airline ETF | | | |
| NAV | 0.20% | 6.45% | 4.93% |
| Market | 0.13% | 5.86% | 4.94% |
| NYSE Arca Global | | | |
| Airline Index | 1.70% | 8.10% | 5.82% |
| MSCI World Index | 8.12% | 7.90% | 15.51% |
Performance data quoted represents past performance, which is no guarantee of future results and current performance may be lower or higher than the figures shown. The deduction of taxes that a shareholder would pay on Fund distributions or the redemption of Fund shares is not reflected in the total returns. For the most recent month-end performance figures, please visit www.guggenheimfunds.com. The investment return and principal value of an investment will fluctuate with changes in market conditions and other factors so that an investor’s shares, when redeemed, may be worth more or less than their original cost.
Since inception returns assume a purchase of the Fund at the initial share price of $24.04 per share for share price returns or initial net asset value (NAV) of $24.04 per share for NAV returns.
Per the most recent prospectus, the Fund’s annualized gross operating expense ratio, gross of any fee waivers or expense reimbursements, was 0.99%. In the Financial Highlights section of this Annual Report, the Fund’s annualized net operating expense ratio was determined to be 0.70% while the Fund’s annualized gross operating expense ratio, gross of any fee waivers or expense reimbursements, was 1.29%. There is a contractual fee waiver currently in place for this Fund through December 31, 2015 to the extent necessary in keeping the Fund’s operating expense ratio from exceeding 0.65% of average net assets per year. Some expenses fall outside of this expense cap and actual expenses will be higher than 0.65%. Without this expense cap, actual returns would be lower.
| | |
| Portfolio Breakdown | % of Net Assets |
| Consumer, Cyclical | 99.4% |
| Total Common and Preferred Stocks | 99.4% |
| Investments of Collateral for Securities Loaned | 7.0% |
| Total Investments | 106.4% |
| Liabilities in excess of Other Assets | -6.4% |
| Net Assets | 100.0% |
| | |
| | % of Long-Term |
| Country Breakdown | Investments |
| United States | 70.2% |
| Germany | 4.5% |
| Japan | 4.5% |
| Chile | 4.4% |
| Canada | 1.5% |
| United Kingdom | 1.5% |
| Ireland | 1.5% |
| Panama | 1.5% |
| South Korea | 1.5% |
| Hong Kong | 1.5% |
| Singapore | 1.5% |
| Spain | 1.5% |
| Australia | 1.5% |
| France | 1.5% |
| Brazil | 1.4% |
| | |
| | % of Long-Term |
| Currency Denomination | Investments |
| United States Dollar | 79.1% |
| Euro | 6.0% |
| All other currencies | 14.9% |
| | |
| | % of Long-Term |
| Top Ten Holdings | Investments |
| United Continental Holdings, Inc. | 15.1% |
| Southwest Airlines Co. | 15.1% |
| Delta Air Lines, Inc. | 15.0% |
| Deutsche Lufthansa AG | 4.5% |
| All Nippon Airways Co. Ltd. | 4.5% |
| Latam Airlines Group SA, ADR | 4.4% |
| Spirit Airlines, Inc. | 3.2% |
| SkyWest, Inc. | 3.2% |
| JetBlue Airways Corp. | 3.2% |
| Allegiant Travel Co. | 3.2% |
Portfolio breakdown is shown as a percentage of net assets. Country breakdown, currency denomination and holdings are shown as a percentage of long-term investments. All are subject to change daily. For more current Fund information, please visit www.guggenheimfunds.com. The above summaries are provided for informational purposes only, and should not be viewed as recommendations.
16 l CLAYMORE EXCHANGE-TRADED FUND TRUST 2 ANNUAL REPORT
| | |
| FUND SUMMARY & PERFORMANCE (Unaudited) continued | August 31, 2012 |
FAA Guggenheim Airline ETF continued
Performance of a $10,000 Investment
This graph compares a hypothetical $10,000 investment in the Fund, made at its inception, with a similar investment in the MSCI World Index. Results include the reinvestment of all dividends and capital gains. Past performance is no guarantee of future results. The MSCI World Index is a free float-adjusted market capitalization index that measures global developed market equity performance of the developed market country indices of Europe, Australasia, the Far East, the U.S. and Canada. It is not possible to invest directly in the MSCI World Index. Investment return and principal value will fluctuate with changes in market conditions and other factors and Fund shares, when redeemed, may be worth more or less than their original investment.
CLAYMORE EXCHANGE-TRADED FUND TRUST 2 ANNUAL REPORT l 17
| | |
| FUND SUMMARY & PERFORMANCE (Unaudited) continued | August 31, 2012 |
| | | | |
| YAO Guggenheim China All-Cap ETF | |
| | |
| Fund Statistics | | |
| Share Price | | $21.76 |
| Net Asset Value | | $21.66 |
| Premium/Discount to NAV | | 0.46% |
| Net Assets ($000) | | $49,822 |
| | | |
| Total Returns | | |
| | | | Since |
| | | One | Inception |
| (Inception 10/19/09) | Year | (Annualized) |
| Guggenheim China All-Cap ETF | | |
| NAV | -11.17% | -3.40% |
| Market | -10.84% | -3.24% |
| AlphaShares China All-Cap Index | -10.57% | -2.65% |
| MSCI China Index | -8.25% | -3.86% |
Performance data quoted represents past performance, which is no guarantee of future results and current performance may be lower or higher than the figures shown. The deduction of taxes that a shareholder would pay on Fund distributions or the redemption of Fund shares is not reflected in the total returns. For the most recent month-end performance figures, please visit www.guggenheimfunds.com. The investment return and principal value of an investment will fluctuate with changes in market conditions and other factors so that an investor’s shares, when redeemed, may be worth more or less than their original cost.
Since inception returns assume a purchase of the Fund at the initial share price of $24.82 per share for share price returns or initial net asset value (NAV) of $24.82 per share for NAV returns.
The Fund’s annual operating expense ratio of 0.70% is expressed as a unitary fee and covers all expenses of the Fund, except for distribution fees, if any, brokerage expenses, taxes, interest, litigation expenses and other extraordinary expenses.
| Portfolio Breakdown | % of Net Assets |
| Financial | 33.0% |
| Communications | 21.7% |
| Energy | 17.9% |
| Consumer, Non-cyclical | 7.5% |
| Industrial | 6.6% |
| Consumer, Cyclical | 5.7% |
| Basic Materials | 3.4% |
| Utilities | 2.5% |
| Technology | 1.0% |
| Diversified | 0.6% |
| Total Common Stocks | 99.9% |
| Investments of Collateral for Securities Loaned | 6.7% |
| Total Investments | 106.6% |
| Liabilities in excess of Other Assets | -6.6% |
| Net Assets | 100.0% |
| | % of Long-Term |
| Country Breakdown | Investments |
| China | 99.5% |
| Singapore | 0.5% |
| | |
| | % of Long-Term |
| Currency Denomination | Investments |
| Hong Kong Dollar | 91.2% |
| United States Dollar | 8.3% |
| Singapore Dollar | 0.5% |
| | |
| | % of Long-Term |
| Top Ten Holdings | Investments |
| China Mobile Ltd. | 5.7% |
| Tencent Holdings Ltd. | 5.7% |
| CNOOC Ltd. | 5.1% |
| China Construction Bank Corp. | 4.7% |
| Baidu, Inc. | 4.7% |
| PetroChina Co. Ltd. | 4.6% |
| Industrial & Commercial Bank of China Ltd. | 4.6% |
| Bank of China Ltd. | 4.0% |
| China Life Insurance Co. Ltd. | 3.6% |
| China Petroleum & Chemical Corp. | 2.9% |
Portfolio breakdown is shown as a percentage of net assets. Country breakdown, currency denomination and holdings are shown as a percentage of long-term investments. All are subject to change daily. For more current Fund information, please visit www.guggenheimfunds.com. The above summaries are provided for informational purposes only, and should not be viewed as recommendations.
18 l CLAYMORE EXCHANGE-TRADED FUND TRUST 2 ANNUAL REPORT
| | |
| FUND SUMMARY & PERFORMANCE (Unaudited) continued | August 31, 2012 |
YAO Guggenheim China All-Cap ETF continued
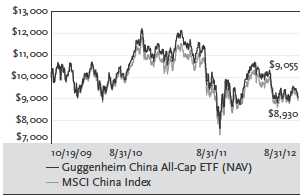
Performance of a $10,000 Investment
This graph compares a hypothetical $10,000 investment in the Fund, made at its inception, with a similar investment in the MSCI China Index. Results include the reinvestment of all dividends and capital gains. Past performance is no guarantee of future results. The MSCI China Index is a capitalization-weighted index that monitors the performance of stocks from the country of China. The index is unmanaged. It is not possible to invest directly in the MSCI China Index.Investment return and principal value will fluctuate with changes in market conditions and other factors and Fund shares, when redeemed, may be worth more or less than their original investment.
CLAYMORE EXCHANGE-TRADED FUND TRUST 2 ANNUAL REPORT l 19
| | |
| FUND SUMMARY & PERFORMANCE (Unaudited) continued | August 31, 2012 |
CQQQ Guggenheim China Technology ETF
| | | |
| Fund Statistics | | |
| Share Price | | $19.96 |
| Net Asset Value | | $20.03 |
| Premium/Discount to NAV | | -0.35% |
| Net Assets ($000) | | $17,029 |
| | | |
| Total Returns | | |
| | | Since |
| | One | Inception |
| (Inception 12/8/09) | Year | (Annualized) |
| Guggenheim China Technology ETF | | |
| NAV | -19.10% | -6.80% |
| Market | -19.78% | -6.91% |
| AlphaShares China | | |
| Technology Index | -18.91% | -6.55% |
| MSCI China Index | -8.25% | -5.82% |
Performance data quoted represents past performance, which is no guarantee of future results, and current performance may be lower or higher than the figures shown. The deduction of taxes that a shareholder would pay on Fund distributions or the redemption of Fund shares is not reflected in the total returns. For the most recent month-end performance figures, please visit www.guggenheimfunds.com. The investment return and principal value of an investment will fluctuate with changes in market conditions and other factors so that an investor’s shares, when redeemed, may be worth more or less than their original cost.
Since inception returns assume a purchase of the Fund at the initial share price of $25.06 per share for share price returns or initial net asset value (NAV) of $25.06 per share for NAV returns.
The Fund’s total annual operating expense ratio of 0.70% is expressed as a unitary fee and covers all expenses of the Fund, except for distribution fees, if any, brokerage expenses, taxes, interest, litigation expenses and other extraordinary expenses.
| | |
| Portfolio Breakdown | % of Net Assets |
| Communications | 53.2% |
| Technology | 21.6% |
| Industrial | 12.7% |
| Basic Materials | 4.4% |
| Consumer, Cyclical | 4.3% |
| Energy | 3.4% |
| Total Common Stocks | 99.6% |
| Investments of Collateral for Securities Loaned | 9.6% |
| Total Investments | 109.2% |
| Liabilities in excess of Other Assets | -9.2% |
| Net Assets | 100.0% |
| | % of Long-Term |
| Country Breakdown | Investments |
| China | 100.0% |
| | |
| | % of Long-Term |
| Currency Denomination | Investments |
| Hong Kong Dollar | 64.3% |
| United States Dollar | 35.7% |
| | |
| | % of Long-Term |
| Top Ten Holdings | Investments |
| Tencent Holdings Ltd. | 10.2% |
| Baidu, Inc. | 10.1% |
| Lenovo Group Ltd. | 7.6% |
| SINA Corp. | 6.9% |
| NetEase, Inc. | 6.4% |
| Semiconductor Manufacturing International Corp. | 4.7% |
| AAC Technologies Holdings, Inc. | 4.7% |
| Kingboard Chemical Holdings Ltd. | 4.4% |
| Digital China Holdings Ltd. | 4.3% |
| Sohu.com, Inc. | 3.8% |
Portfolio breakdown is shown as a percentage of net assets. Country breakdown, currency denomination and holdings are shown as a percentage of long-term investments. All are subject to change daily. For more current Fund information, please visit www.guggenheimfunds.com. The above summaries are provided for informational purposes only, and should not be viewed as recommendations.
Performance of a $10,000 Investment
This graph compares a hypothetical $10,000 investment in the Fund, made at its inception, with a similar investment in the MSCI China Index. Results include the reinvestment of all dividends and capital gains. Past performance is no guarantee of future results. The MSCI China Index is a capitalization-weighted index that monitors the performance of stocks from the country of China. The index is unmanaged. It is not possible to invest directly in the MSCI China Index. Investment return and principal value will fluctuate with changes in market conditions and other factors and Fund shares, when redeemed, may be worth more or less than their original investment.
20 l CLAYMORE EXCHANGE-TRADED FUND TRUST 2 ANNUAL REPORT
| | |
| FUND SUMMARY & PERFORMANCE (Unaudited) continued | August 31, 2012 |
| | | | |
| TAN Guggenheim Solar ETF | | |
| | | |
| Fund Statistics | | | |
| Share Price* | | | $16.71 |
| Net Asset Value* | | | $16.74 |
| Premium/Discount to NAV | | | -0.18% |
| Net Assets ($000) | | | $42,992 |
Total Returns | | | |
| | | | Since |
| | One | Three Year | Inception |
| (Inception 4/15/08) | Year | (Annualized) | (Annualized) |
| Guggenheim Solar ETF | | | |
| NAV | -66.93% | -40.37% | -45.06% |
| Market | -66.78% | -40.21% | -45.08% |
| MAC Global Solar | | | |
| Energy Index | -69.06% | -41.97% | -45.57% |
| MSCI World Index | 8.12% | 7.90% | -0.60% |
Performance data quoted represents past performance, which is no guarantee of future results, and current performance may be lower or higher than the figures shown. The deduction of taxes that a shareholder would pay on Fund distributions or the redemption of Fund shares is not reflected in the total returns. For the most recent month-end performance figures, please visit www.guggenheimfunds.com. The investment return and principal value of an investment will fluctuate with changes in market conditions and other factors so that an investor’s shares, when redeemed, may be worth more or less than their original cost.
Since inception returns assume a purchase of the Fund at the initial share price of $251.30* per share for share price returns or initial net asset value (NAV) of $251.30* per share for NAV returns.
Per the most recent prospectus, the Fund’s annualized gross operating expense ratio, gross of any fee waivers or expense reimbursements, was 0.88%. In the Financial Highlights section of this Annual Report, the Fund’s annualized net operating expense ratio was 0.70% while the Fund’s annualized gross operating expense ratio, gross of any fee waivers or expense reimbursements, was 1.01%. There is a contractual fee waiver currently in place for this Fund through December 31, 2015, to the extent necessary in keeping the Fund’s operating expense ratio from exceeding 0.65% of average net assets per year. Some expenses fall outside of this expense cap and actual expenses may be higher than 0.65%. Without this expense cap, actual returns would be lower.
| Portfolio Breakdown | % of Net Assets |
| Technology | 40.0% |
| Industrial | 37.3% |
| Energy | 22.3% |
| Total Common Stocks and Right | 99.6% |
| Investments of Collateral for Securities Loaned | 45.7% |
| Total Investments | 145.3% |
| Liabilities in excess of Other Assets | -45.3% |
| Net Assets | 100.0% |
| | % of Long-Term |
| Country Breakdown | Investments |
| United States | 39.5% |
| Cayman Islands | 30.4% |
| Germany | 13.4% |
| Switzerland | 7.0% |
| Norway | 3.7% |
| British Virgin Islands | 3.0% |
| Canada | 3.0% |
| % of Long-Term |
| Currency Denomination | Investments |
| United States Dollar | 64.9% |
| Euro | 13.4% |
| Hong Kong Dollar | 11.1% |
| Swiss Franc | 6.9% |
| Norwegian Krone | 3.7% |
| % of Long-Term |
| Top Ten Holdings | Investments |
| First Solar, Inc. | 11.5% |
| GT Advanced Technologies, Inc. | 8.3% |
| GCL-Poly Energy Holdings Ltd. | 7.4% |
| Power-One, Inc. | 7.0% |
| Meyer Burger Technology AG | 7.0% |
| MEMC Electronic Materials, Inc. | 6.3% |
| SMA Solar Technology AG | 4.5% |
| Trina Solar Ltd. | 4.4% |
| SunPower Corp. | 4.0% |
| Manz AG | 3.4% |
Portfolio breakdown is shown as a percentage of net assets. Country breakdown, currency denomination and holdings are shown as a percentage of long-term investments. All are subject to change daily. For more current Fund information, please visit www.guggenheimfunds.com. The above summaries are provided for informational purposes only, and should not be viewed as recommendations.
* Reflects 1 for 10 reverse stock split that occurred on February 15, 2012.
CLAYMORE EXCHANGE-TRADED FUND TRUST 2 ANNUAL REPORT l 21
| | |
| FUND SUMMARY & PERFORMANCE (Unaudited) continued | August 31, 2012 |
TAN Guggenheim Solar ETF continued
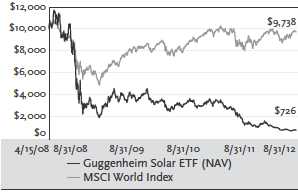
Performance of a $10,000 Investment
This graph compares a hypothetical $10,000 investment in the Fund, made at its inception, with a similar investment in the MSCI World Index. Results include the reinvestment of all dividends and capital gains. Past performance is no guarantee of future results. The MSCI World Index is a free float-adjusted market capitalization weighted index that is designed to measure the equity market performance of developed markets. It is not possible to invest directly in the MSCI World Index. Investment return and principal value will fluctuate with changes in market conditions and other factors and Fund shares, when redeemed, may be worth more or less than their original investment.
22 l CLAYMORE EXCHANGE-TRADED FUND TRUST 2 ANNUAL REPORT
| | |
| FUND SUMMARY & PERFORMANCE (Unaudited) continued | August 31, 2012 |
CGW Guggenheim S&P Global Water Index ETF
| Fund Statistics | | | | |
| Share Price | | | | $20.98 |
| Net Asset Value | | | | $21.05 |
| Premium/Discount to NAV | | | -0.33% |
| Net Assets ($000) | | | | $199,547 |
Total Returns | | | | |
| | | | Three | Five | Since |
| | | One | Year | Year | Inception |
| (Inception 5/14/07) | Year | (Annualized) | (Annualized) | (Annualized) |
| Guggenheim S&P | | | | |
| Global Water | | | | |
| Index ETF | | | | |
| NAV | 7.23% | 9.53% | -0.51% | -0.42% |
| Market | 7.25% | 9.30% | -0.80% | -0.49% |
| S&P Global | | | | |
| Water Index | 7.82% | 9.90% | 0.09% | 0.19% |
| MSCI World Index | 8.12% | 7.90% | -1.76% | -1.94% |
| Dow Jones Global | | | | |
| Utilities Index | -3.69% | -1.97% | -6.37% | -6.62% |
Performance data quoted represents past performance, which is no guarantee of future results and current performance may be lower or higher than the figures shown. The deduction of taxes that a shareholder would pay on Fund distributions or the redemption of Fund shares is not reflected in the total returns. For the most recent month-end performance figures, please visit www.guggenheimfunds.com. The investment return and principal value of an investment will fluctuate with changes in market conditions and other factors so that an investor’s shares, when redeemed, may be worth more or less than their original cost.
Since inception returns assume a purchase of the Fund at the initial share price of $24.78 per share for share price returns or initial net asset value (NAV) of $24.78 per share for NAV returns.
Per the most recent prospectus, the Fund’s annualized gross operating expense ratio, gross of any fee waivers or expense reimbursements, was 0.78%. In the Financial Highlights section of this Annual Report, the Fund’s annualized net operating expense ratio was 0.70% while the Fund’s annualized gross operating expense ratio, gross of any fee waivers or expense reimbursements, was 0.76%. There is a contractual fee waiver currently in place for this Fund through December 31, 2015 to the extent necessary in keeping the Fund’s operating expense ratio from exceeding 0.65% of average net assets per year. Some expenses fall outside of this expense cap and actual expenses may be higher than 0.65%. Without this expense cap, actual returns would be lower.
| Portfolio Breakdown | % of Net Assets |
| Industrial | 51.9% |
| Utilities | 44.6% |
| Basic Materials | 3.3% |
| Total Common Stocks | 99.8% |
| Investments of Collateral for Securities Loaned | 2.4% |
| Total Investments | 102.2% |
| Liabilities in excess of Other Assets | -2.2% |
| Net Assets | 100.0% |
| | % of Long-Term |
| Country Breakdown | Investments |
| United States | 35.3% |
| United Kingdom | 21.6% |
| Switzerland | 11.0% |
| Brazil | 5.3% |
| France | 5.0% |
| Austria | 4.2% |
| Japan | 3.5% |
| Sweden | 2.9% |
| Israel | 2.4% |
| Netherlands | 2.4% |
| Hong Kong | 1.7% |
| Italy | 1.7% |
| Finland | 1.2% |
| Singapore | 0.7% |
| Bermuda | 0.7% |
| Spain | 0.4% |
| | % of Long-Term |
| Currency Denomination | Investments |
| United States Dollar | 40.6% |
| Pound Sterling | 21.6% |
| Euro | 14.8% |
| Swiss Franc | 11.1% |
| Japanese Yen | 3.5% |
| All other currencies | 8.4% |
| % of Long-Term |
| Top Ten Holdings | Investments |
| Geberit AG | 9.4% |
| United Utilities Group PLC | 8.5% |
| Severn Trent PLC | 7.2% |
| American Water Works Co., Inc. | 7.1% |
| Cia de Saneamento Basico do Estado de Sao Paulo, ADR | 5.3% |
| Danaher Corp. | 4.9% |
| Xylem, Inc. | 4.8% |
| Pennon Group PLC | 4.7% |
| Andritz AG | 4.2% |
| Aqua America, Inc. | 3.8% |
Portfolio breakdown is shown as a percentage of net assets. Country breakdown, currency denomination and holdings are shown as a percentage of long-term investments. All are subject to change daily. For more current Fund information, please visit www.guggenheimfunds.com. The above summaries are provided for informational purposes only, and should not be viewed as recommendations.
CLAYMORE EXCHANGE-TRADED FUND TRUST 2 ANNUAL REPORT l 23
| | |
| FUND SUMMARY & PERFORMANCE (Unaudited) continued | August 31, 2012 |
CGW Guggenheim S&P Global Water Index ETF continued
Performance of a $10,000 Investment
This graph compares a hypothetical $10,000 investment in the Fund, made at its inception, with a similar investment in the MSCI World Index. Results include the reinvestment of all dividends and capital gains. Past performance is no guarantee of future results. The MSCI World Index is a free float-adjusted market capitalization index that measures global developed market equity performance of the developed market country indices of Europe, Australasia, the Far East, the U.S. and Canada. It is not possible to invest directly in the MSCI World Index. Investment return and principal value will fluctuate with changes in market conditions and other factors and Fund shares, when redeemed, may be worth more or less than their original investment.
24 l CLAYMORE EXCHANGE-TRADED FUND TRUST 2 ANNUAL REPORT
| | |
| OVERVIEW OF FUND EXPENSES (Unaudited) | August 31, 2012 |
As a shareholder of Guggenheim ABC High Dividend ETF; Guggenheim Airline ETF; Guggenheim China All-Cap ETF; Guggenheim China Technology ETF; Guggenheim Solar ETF; and Guggenheim S&P Global Water Index ETF, you incur advisory fees and other Fund expenses. The expense examples below are intended to help you understand your ongoing costs (in dollars) of investing in the Funds and to compare these costs with the ongoing costs of investing in other funds.
The example is based on an investment of $1,000 invested at the beginning of the six-month period and held for the entire six-month period ended August 31, 2012.
Actual Expense
The first line of the table below provides information about actual account values and actual expenses. You may use the information in this line, together with the amount you invested, to estimate the expenses that you paid over the period. Simply divide your account value by $1,000 (for example, an $8,600 account value divided by $1,000 = 8.6), then multiply the result by the number in the first line under the heading entitled “Expenses Paid During Period” to estimate the expenses you paid on your account during this period.
Hypothetical Example for Comparison Purposes
The second line of the table below provides information about hypothetical account values and hypothetical expenses based on the Fund’s actual expense ratio and an assumed rate of return of 5% per year before expenses, which is not the Fund’s actual return. The hypothetical account values and expenses may not be used to estimate the actual ending account balance or expenses you paid for the period. You may use this information to compare the ongoing cost of investing in the Fund and other funds. To do so, compare this 5% hypothetical example with the 5% hypothetical examples that appear in the shareholder reports of the other funds.
Please note that the expenses shown in the table are meant to highlight your ongoing costs only and do not reflect any transactional costs, such as sales charges (loads) or contingent deferred sales charges. Therefore, the second line of the table is useful in comparing ongoing costs only, and will not help you determine the relative total costs of owning different funds. In addition, if these transactional costs were included, your costs would have been higher.
| | | | Annualized | Expenses |
| | Beginning | Ending | Expense | Paid |
| | Account | Account | Ratio for the | During |
| | Value | Value | Six Months Ended | Period1 |
| | 3/1/12 | 8/31/12 | 8/31/12 | 3/1/12 - 8/31/12 |
| Guggenheim ABC High Dividend ETF | | | | |
| Actual | $ 1,000.00 | $ 832.05 | 0.65% | $ 2.99 |
| Hypothetical | 1,000.00 | 1,021.87 | 0.65% | 3.30 |
| (5% annual return before expenses) | | | | |
Guggenheim Airline ETF2 | | | | |
| Actual | 1,000.00 | 963.15 | 0.70% | 3.45 |
| Hypothetical | 1,000.00 | 1,021.62 | 0.70% | 3.56 |
| (5% annual return before expenses) | | | | |
| Guggenheim China All-Cap ETF | | | | |
| Actual | 1,000.00 | 847.75 | 0.70% | 3.25 |
| Hypothetical | 1,000.00 | 1,021.62 | 0.70% | 3.56 |
| (5% annual return before expenses) | | | | |
| Guggenheim China Technology ETF | | | | |
| Actual | 1,000.00 | 809.61 | 0.70% | 3.18 |
| Hypothetical | 1,000.00 | 1,021.62 | 0.70% | 3.56 |
| (5% annual return before expenses) | | | | |
Guggenheim Solar ETF2 | | | | |
| Actual | 1,000.00 | 573.88 | 0.70% | 2.77 |
| Hypothetical | 1,000.00 | 1,021.62 | 0.70% | 3.56 |
| (5% annual return before expenses) | | | | |
CLAYMORE EXCHANGE-TRADED FUND TRUST 2 ANNUAL REPORT l 25
| | |
| OVERVIEW OF FUND EXPENSES (Unaudited) continued | August 31, 2012 |
| | | | Annualized | Expenses |
| | Beginning | Ending | Expense | Paid |
| | Account | Account | Ratio for the | During |
| | Value | Value | Six Months Ended | Period1 |
| | 3/1/12 | 8/31/12 | 8/31/12 | 3/1/12 - 8/31/12 |
Guggenheim S&P Global Water Index ETF2 | | | | |
| Actual | $ 1,000.00 | $ 1,015.94 | 0.70% | $ 3.55 |
| Hypothetical | 1,000.00 | 1,021.62 | 0.70% | 3.56 |
| (5% annual return before expenses) | | | | |
| 1 | Actual and hypothetical expenses are calculated using the annualized expense ratio. This represents the ongoing expenses of the Fund as a percentage of average net assets for the six months ended August 31, 2012. Expenses are calculated by multiplying the Fund’s annualized expense ratio by the average account value over the period; then multiplying that result by 184/366. |
| 2 | The expense ratios reflect an expense waiver. Please see the Notes to Financial Statements for more information. |
Assumes all dividends and distributions were reinvested.
Premium/Discount Information
Information about the differences between the daily market price on secondary markets for Shares and the NAV of each Fund can be found at www.guggenheimfunds.com.
26 l CLAYMORE EXCHANGE-TRADED FUND TRUST 2 ANNUAL REPORT
| | |
| PORTFOLIO OF INVESTMENTS | August 31, 2012 |
ABCS Guggenheim ABC High Dividend ETF
| Number | | | |
| of Shares | | Description | Value |
| | | Long-Term Investments - 98.7% | |
| | | Common Stocks - 61.4% | |
| | | Australia - 20.0% | |
| 159,843 | | APN News & Media Ltd. | $ 47,079 |
| 129,197 | | Billabong International Ltd.(a) | 180,250 |
| 104,176 | | David Jones Ltd.(a) | 260,539 |
| 377,104 | | Goodman Fielder Ltd.(b) | 202,654 |
| 81,433 | | GWA Group Ltd.(a) | 162,423 |
| 117,922 | | Myer Holdings Ltd.(a) | 242,514 |
| 257,408 | | Pacific Brands Ltd. | 162,271 |
| 136,879 | | Seven West Media Ltd. | 207,235 |
| 267,546 | | SP AusNet | 291,703 |
| 107,456 | | TABCORP Holdings Ltd. | 324,267 |
| | | | 2,080,935 |
| | | Brazil - 16.9% | |
| 57,795 | | Banco Santander Brasil SA, ADR | 438,086 |
| 77,243 | | Cia Siderurgica Nacional SA, ADR | 372,311 |
| 12,395 | | CPFL Energia SA, ADR | 260,047 |
| 31,046 | | Ultrapar Participacoes SA, ADR | 679,287 |
| | | | 1,749,731 |
| | | Canada - 24.5% | |
| 17,608 | | AGF Management Ltd., Class B | 203,049 |
| 20,246 | | Bonavista Energy Corp.(a) | 339,126 |
| 12,686 | | Canfor Pulp Products, Inc. | 120,580 |
| 39,548 | | Chorus Aviation, Inc. | 148,278 |
| 25,797 | | Enerplus Corp.(a) | 406,227 |
| 10,993 | | Freehold Royalties Ltd. | 218,445 |
| 23,708 | | Just Energy Group, Inc.(a) | 262,341 |
| 56,054 | | Pengrowth Energy Corp.(a) | 378,294 |
| 17,136 | | PetroBakken Energy Ltd., Class A(a) | 225,737 |
| 27,005 | | Superior Plus Corp. | 242,726 |
| | | | 2,544,803 |
| | | Total Common Stocks - 61.4% | |
| | | (Cost $7,568,892) | 6,375,469 |
| | | Preferred Stocks - 37.3% | |
| | | Brazil - 37.3% | |
| 18,292 | | Braskem SA, ADR(a) | 229,931 |
| 28,455 | | Cia de Bebidas das Americas, ADR | 1,070,193 |
| 36,716 | | Cia Energetica de Minas Gerais, ADR | 624,172 |
| 106,899 | | Oi SA, ADR(a) | 397,664 |
| 24,311 | | Telefonica Brasil SA, ADR | 519,526 |
| 64,219 | | Vale SA, ADR | 1,035,210 |
| | | (Cost $4,347,044) | 3,876,696 |
| | | Total Long-Term Investments - 98.7% | |
| | | (Cost $11,915,936) | 10,252,165 |
| Number | | | |
| of Shares | | Description | Value |
| | | Investments of Collateral for | |
| | | Securities Loaned - 23.7% | |
| 2,464,224 | | BNY Mellon Securities Lending Overnight | |
| | | Fund, 0.1928%(c) (d) | |
| | | (Cost $2,464,224) | $ 2,464,224 |
| | | Total Investments - 122.4% | |
| | | (Cost $14,380,160) | 12,716,389 |
| | | Liabilities in excess of Other Assets - (22.4%) | (2,327,440) |
| | | Net Assets - 100.0% | $ 10,388,949 |
| ADR - American Depositary Receipt |
| SA - Corporation |
| (a) Security, or portion thereof, was on loan at August 31, 2012. |
| (b) Non-income producing security. |
(c) At August 31, 2012, the total market value of the Fund’s securities on loan was $2,340,385 and the total market value of the collateral held by the Fund was $2,464,224. |
| (d) Interest rate shown reflects yield as of August 31, 2012. |
See notes to financial statements.
CLAYMORE EXCHANGE-TRADED FUND TRUST 2 ANNUAL REPORT l 27
| | |
| PORTFOLIO OF INVESTMENTS continued | August 31, 2012 |
FAA Guggenheim Airline ETF
| Number | | | |
| of Shares | | Description | Value |
| | | Long-Term Investments - 99.4% | |
| | | Common Stocks - 98.0% | |
| | | Australia - 1.5% | |
| 188,905 | | Qantas Airways Ltd.(a) | $ 224,507 |
| | | Canada - 1.5% | |
| 13,576 | | Westjet Airlines Ltd. | 233,867 |
| | | Chile - 4.4% | |
| 29,041 | | Latam Airlines Group SA, ADR(b) | 685,077 |
| | | France - 1.5% | |
| 44,394 | | Air France-KLM(a) | 224,282 |
| | | Germany - 4.5% | |
| 56,614 | | Deutsche Lufthansa AG | 700,061 |
| | | Hong Kong - 1.5% | |
| 142,000 | | Cathay Pacific Airways Ltd. | 231,411 |
| | | Ireland - 1.5% | |
| 7,503 | | Ryanair Holdings PLC, ADR(a) | 232,893 |
| | | Japan - 4.4% | |
| 312,000 | | All Nippon Airways Co. Ltd.(b) | 689,349 |
| | | Panama - 1.5% | |
| 2,988 | | Copa Holdings SA, Class A | 231,959 |
| | | Singapore - 1.5% | |
| 27,000 | | Singapore Airlines Ltd. | 230,520 |
| | | South Korea - 1.5% | |
| 5,540 | | Korean Air Lines Co. Ltd. | 231,927 |
| | | Spain - 1.5% | |
| 101,753 | | International Consolidated Airlines Group SA(a) | 229,176 |
| | | United Kingdom - 1.5% | |
| 27,715 | | easyJet PLC | 233,752 |
| | | United States - 69.7% | |
| 14,473 | | Alaska Air Group, Inc.(a) | 485,569 |
| 7,345 | | Allegiant Travel Co.(a) | 486,533 |
| 268,154 | | Delta Air Lines, Inc.(a) | 2,319,532 |
| 80,669 | | Hawaiian Holdings, Inc.(a) | 478,367 |
| 99,393 | | JetBlue Airways Corp.(a) | 487,026 |
| 104,974 | | Republic Airways Holdings, Inc.(a) | 467,134 |
| 55,674 | | SkyWest, Inc. | 488,261 |
| 259,793 | | Southwest Airlines Co. | 2,322,549 |
| 24,976 | | Spirit Airlines, Inc.(a) | 488,281 |
| 125,969 | | United Continental Holdings, Inc.(a) | 2,324,128 |
| 44,962 | | US Airways Group, Inc.(a) | 479,295 |
| | | | 10,826,675 |
| | | Total Common Stocks - 98.0% | |
| | | (Cost $16,942,932) | 15,205,456 |
| Number | | | |
| of Shares | | Description | Value |
| | | Preferred Stock - 1.4% | |
| | | Brazil - 1.4% | |
| 46,566 | | GOL Linhas Aereas Inteligentes SA, ADR(a) | |
| | | (Cost $219,093) | $ 223,517 |
| | | Total Long-Term Investments - 99.4% | |
| | | (Cost $17,162,025) | 15,428,973 |
| | | Investments of Collateral for | |
| | | Securities Loaned - 7.0% | |
| 1,088,550 | | BNY Mellon Securities Lending | |
| | | Overnight Fund, 0.1928%(c) (d) | |
| | | (Cost $1,088,550) | 1,088,550 |
| | | Total Investments - 106.4% | |
| | | (Cost $18,250,575) | 16,517,523 |
| | | Liabilities in excess of Other Assets - (6.4%) | (993,456) |
| | | Net Assets - 100.0% | $ 15,524,067 |
| ADR - American Depositary Receipt |
| AG - Stock Corporation |
| PLC - Public Limited Company |
| SA - Corporation |
| (a) Non-income producing security. |
| (b) Security, or portion thereof, was on loan at August 31, 2012. |
(c) At August 31, 2012, the total market value of the Fund’s securities on loan was $1,045,300 and the total market value of the collateral held by the Fund was $1,088,550. |
| (d) Interest rate shown reflects yield as of August 31, 2012. |
See notes to financial statements.
28 l CLAYMORE EXCHANGE-TRADED FUND TRUST 2 ANNUAL REPORT
| | |
| PORTFOLIO OF INVESTMENTS continued | August 31, 2012 |
YAO Guggenheim China All-Cap ETF
| Number | | | |
| of Shares | | Description | Value |
| | | Common Stocks - 99.9% | |
| | | Basic Materials - 3.4% | |
| 354,000 | | Aluminum Corp. of China Ltd.(a) | $ 135,553 |
| 96,000 | | Angang Steel Co. Ltd.(a) | 46,909 |
| 158,000 | | China BlueChemical Ltd. | 91,057 |
| 156,000 | | China Forestry Holdings Co. Ltd.(a) (b) (c) | – |
| 328,000 | | China Lumena New Materials Corp. | 54,129 |
| 115,000 | | China Molybdenum Co. Ltd.(a) (d) | 41,812 |
| 139,000 | | Citic Pacific Ltd. | 170,071 |
| 95,000 | | Dongyue Group(d) | 45,318 |
| 144,000 | | Hunan Nonferrous Metal Corp. Ltd.(a) (d) | 42,515 |
| 125,000 | | Jiangxi Copper Co. Ltd. | 271,394 |
| 52,000 | | Kingboard Chemical Holdings Ltd. | 113,705 |
| 144,000 | | Lee & Man Paper Manufacturing Ltd. | 59,039 |
| 154,000 | | Maanshan Iron & Steel(a) (d) | 30,775 |
| 136,000 | | MMG Ltd.(a) | 50,674 |
| 148,000 | | Nine Dragons Paper Holdings Ltd. | 66,594 |
| 59,500 | | Real Gold Mining Ltd.(b) (c) (d) | – |
| 158,000 | | Sinofert Holdings Ltd. | 30,352 |
| 206,000 | | Sinopec Shanghai Petrochemical Co. Ltd. | 53,915 |
| 117,000 | | Yingde Gases Group Company Ltd. | 90,659 |
| 77,500 | | Zhaojin Mining Industry Co. Ltd. | 102,517 |
| 538,000 | | Zijin Mining Group Co. Ltd.(d) | 168,553 |
| | | | 1,665,541 |
| | | Communications - 21.7% | |
| 4,433 | | AsiaInfo-Linkage, Inc.(a) | 53,196 |
| 20,793 | | Baidu, Inc., ADR(a) | 2,317,172 |
| 216,000 | | China Communications Services Corp. Ltd. | 120,027 |
| 264,500 | | China Mobile Ltd. | 2,823,607 |
| 1,252,000 | | China Telecom Corp. Ltd. | 687,642 |
| 440,000 | | China Unicom Hong Kong Ltd. | 696,625 |
| 72,545 | | Comba Telecom Systems Holdings Ltd.(d) | 18,706 |
| 12,902 | | Ctrip.com International Ltd., ADR(a) | 208,109 |
| 8,236 | | Focus Media Holding Ltd., ADR | 198,076 |
| 6,462 | | NetEase, Inc., ADR(a) | 336,476 |
| 5,914 | | SINA Corp.(a) | 331,775 |
| 2,750 | | Sohu.com, Inc.(a) (d) | 107,718 |
| 92,100 | | Tencent Holdings Ltd. | 2,814,208 |
| 55,840 | | ZTE Corp.(d) | 73,865 |
| | | | 10,787,202 |
| Number | | | |
| of Shares | | Description | Value |
| | | Consumer, Cyclical - 5.7% | |
| 190,000 | | Air China Ltd. | $ 114,398 |
| 68,000 | | Anta Sports Products Ltd. | 40,241 |
| 230,000 | | Bosideng International Holdings Ltd. | 63,459 |
| 248,000 | | Brilliance China Automotive Holdings Ltd.(a) | 242,365 |
| 71,500 | | Byd Co. Ltd.(a) | 124,632 |
| 252,000 | | China Dongxiang Group Co. | 25,017 |
| 140,000 | | China Eastern Airlines Corp. Ltd.(a) (d) | 42,598 |
| 47,000 | | China Lilang Ltd. | 33,146 |
| 106,000 | | China Resources Enterprise Ltd. | 315,010 |
| 152,000 | | China Southern Airlines Co. Ltd. | 64,474 |
| 53,500 | | China ZhengTong Auto Services Holdings Ltd.(a) (d) | 32,005 |
| 68,000 | | Digital China Holdings Ltd. | 109,589 |
| 258,000 | | Dongfeng Motor Group Co. Ltd. | 333,966 |
| 55,000 | | Golden Eagle Retail Group Ltd.(d) | 100,835 |
| 35,000 | | Great Wall Motor Co. Ltd. | 79,059 |
| 200,000 | | Guangzhou Automobile Group Co. Ltd. | 139,500 |
| 72,000 | | Haier Electronics Group Co. Ltd.(a) | 84,752 |
| 148,000 | | Hengdeli Holdings Ltd.(d) | 38,926 |
| 2,633 | | Home Inns & Hotels Management, Inc., ADR(a) (d) | 60,717 |
| 98,000 | | Intime Department Store Group Co. Ltd.(d) | 100,701 |
| 64,500 | | Li Ning Co. Ltd.(d) | 30,935 |
| 58,000 | | Minth Group Ltd. | 64,609 |
| 107,500 | | Parkson Retail Group Ltd.(d) | 87,317 |
| 232,000 | | PCD Stores Group Ltd. | 15,853 |
| 30,000 | | Ports Design Ltd. | 23,633 |
| 69,000 | | Shanghai Pharmaceuticals Holding Co. Ltd. | 117,784 |
| 34,000 | | Shenzhou International Group Holdings Ltd. | 56,022 |
| 99,997 | | Springland International Holdings Ltd. | 46,928 |
| 44,400 | | Weichai Power Co. Ltd. | 117,351 |
| 48,000 | | Wumart Stores, Inc. | 80,946 |
| 48,000 | | Zhongsheng Group Holdings Ltd. | 60,338 |
| | | | 2,847,106 |
| | | Consumer, Non-cyclical - 7.5% | |
| 59,000 | | Asian Citrus Holdings Ltd. | 27,993 |
| 300,000 | | Chaoda Modern Agriculture Holdings Ltd.(a) (b) (c) (d) | 10,482 |
| 151,000 | | China Agri-Industries Holdings Ltd. | 74,758 |
| 64,000 | | China Foods Ltd. | 63,701 |
| 93,496 | | China Medical System Holdings Ltd. | 49,302 |
| 128,000 | | China Mengniu Dairy Co. Ltd. | 385,341 |
| 295,994 | | China Modern Dairy Holdings Ltd.(a) (d) | 76,706 |
| 35,000 | | China Shineway Pharmaceutical Group Ltd. | 52,706 |
| 120,000 | | China Yurun Food Group Ltd.(a) (d) | 73,334 |
| 424,000 | | CP Pokphand Co. Ltd. | 53,572 |
See notes to financial statements.
CLAYMORE EXCHANGE-TRADED FUND TRUST 2 ANNUAL REPORT l 29
| | |
| PORTFOLIO OF INVESTMENTS continued | August 31, 2012 |
YAO Guggenheim China All-Cap ETF continued
| Number | | | |
| of Shares | | Description | Value |
| | | Consumer, Non-cyclical - continued | |
| 110,000 | | Jiangsu Expressway Co. Ltd. | $ 90,624 |
| 33,200 | | Lianhua Supermarket Holdings Co. Ltd. | 28,893 |
| 7,508 | | Mindray Medical International Ltd., ADR | 262,930 |
| 11,382 | | New Oriental Education & Technology Group, ADR(d) | 158,210 |
| 172,000 | | Shandong Weigao Group Medical Polymer Co. Ltd. | 189,380 |
| 110,000 | | Shenguan Holdings Group Ltd. | 58,288 |
| 742,500 | | Shenzhen International Holdings Ltd. | 49,779 |
| 169,996 | | Sihuan Pharmaceutical Holdings Group Ltd. | 67,943 |
| 168,000 | | Sino Biopharmaceutical | 65,630 |
| 74,800 | | Sinopharm Group Co. Ltd. | 237,720 |
| 168,000 | | Tingyi Cayman Islands Holding Corp. | 497,096 |
| 28,000 | | Tsingtao Brewery Co. Ltd. | 150,176 |
| 84,000 | | Uni-President China Holdings Ltd.(d) | 86,640 |
| 612,000 | | Want Want China Holdings Ltd. | 757,479 |
| 5,406 | | WuXi PharmaTech Cayman, Inc., ADR(a) | 78,063 |
| 130,000 | | Zhejiang Expressway Co. Ltd. | 85,815 |
| | | | 3,732,561 |
| | | Diversified - 0.6% | |
| 102,000 | | China Merchants Holdings International Co. Ltd. | 292,603 |
| | | Energy - 17.9% | |
| 368,000 | | China Coal Energy Co. Ltd. | 306,499 |
| 243,000 | | China Longyuan Power Group Corp. | 157,588 |
| 138,000 | | China Oilfield Services Ltd. | 220,266 |
| 1,514,000 | | China Petroleum & Chemical Corp. | 1,424,941 |
| 306,500 | | China Shenhua Energy Co. Ltd. | 1,116,342 |
| 1,348,000 | | CNOOC Ltd. | 2,551,315 |
| 314,000 | | Kunlun Energy Co. Ltd. | 536,811 |
| 1,904,000 | | PetroChina Co. Ltd. | 2,295,233 |
| 360,000 | | United Energy Group Ltd.(a) | 52,912 |
| 172,996 | | Winsway Coking Coal Holding Ltd. | 21,635 |
| 178,000 | | Yanzhou Coal Mining Co. Ltd. | 253,818 |
| | | | 8,937,360 |
| | | Financial - 33.0% | |
| 116,000 | | Agile Property Holdings Ltd.(d) | 133,105 |
| 2,158,000 | | Agricultural Bank of China Ltd. | 795,730 |
| 5,448,000 | | Bank of China Ltd. | 1,980,772 |
| 588,000 | | Bank of Communications Co. Ltd. | 384,356 |
| 1,134,000 | | China Citic Bank Corp. Ltd. | 540,957 |
| 3,590,000 | | China Construction Bank Corp. | 2,360,548 |
| 78,000 | | China Everbright Ltd. | 94,832 |
| 672,000 | | China Life Insurance Co. Ltd. | 1,797,776 |
| 352,500 | | China Merchants Bank Co. Ltd. | 608,084 |
| 521,000 | | China Minsheng Banking Corp. Ltd.(d) | 424,525 |
| 346,000 | | China Overseas Land & Investment Ltd. | 781,553 |
| 108,000 | | China Pacific Insurance Group Co. Ltd. | 320,258 |
| 182,000 | | China Resources Land Ltd. | 351,505 |
| Number | | | |
| of Shares | | Description | Value |
| | | Financial - continued | |
| 77,800 | | China Taiping Insurance Holdings Co. Ltd.(a) | $ 103,717 |
| 221,996 | | Chongqing Rural Commercial Bank | 91,016 |
| 140,000 | | COSCO Pacific Ltd. | 172,738 |
| 537,880 | | Country Garden Holdings Co. Ltd.(a) | 188,626 |
| 432,000 | | Evergrande Real Estate Group Ltd.(d) | 164,863 |
| 159,000 | | Far East Horizon Ltd. | 110,288 |
| 302,000 | | Franshion Properties China Ltd. | 88,775 |
| 235,000 | | Glorious Property Holdings Ltd.(a) (d) | 33,328 |
| 90,000 | | Guangzhou R&F Properties Co. Ltd.(d) | 103,968 |
| 4,228,000 | | Industrial & Commercial Bank of China Ltd. | 2,289,457 |
| 112,500 | | KWG Property Holding Ltd.(d) | 57,873 |
| 112,000 | | Longfor Properties Co. Ltd.(d) | 161,439 |
| 234,000 | | PICC Property & Casualty Co. Ltd.(a) | 281,479 |
| 160,500 | | Ping An Insurance Group Co. | 1,158,807 |
| 171,000 | | Poly Property Group Co. Ltd.(a) | 84,659 |
| 732,000 | | Renhe Commercial Holdings Co. Ltd.(a) (d) | 29,728 |
| 44,000 | | Shanghai Industrial Holdings Ltd. | 120,831 |
| 123,500 | | Shimao Property Holdings Ltd.(d) | 186,295 |
| 320,500 | | Sino-Ocean Land Holdings Ltd.(d) | 143,799 |
| 168,000 | | Soho China Ltd. | 107,433 |
| 59,000 | | Yanlord Land Group Ltd. (Singapore)(a) (d) | 55,103 |
| 466,000 | | Yuexiu Property Co. Ltd. | 108,746 |
| | | | 16,416,969 |
| | | Industrial - 6.6% | |
| 61,981 | | AAC Technologies Holdings, Inc. | 210,566 |
| 116,500 | | Anhui Conch Cement Co. Ltd. | 290,790 |
| 192,000 | | AviChina Industry & Technology Co. Ltd. | 69,312 |
| 103,500 | | BBMG Corp. | 62,984 |
| 166,000 | | Beijing Capital International Airport Co. Ltd. | 113,431 |
| 397,000 | | China Communications Construction Co. Ltd. | 305,060 |
| 227,500 | | China COSCO Holdings Co. Ltd.(a) (d) | 86,234 |
| 162,000 | | China Everbright International Ltd.(d) | 79,368 |
| 102,000 | | China High Speed Transmission Equipment Group Co. Ltd.(a) | 31,299 |
| 49,200 | | China Metal Recycling Holdings Ltd.(d) | 39,265 |
| 258,000 | | China National Building Material Co. Ltd. | 241,493 |
| 103,000 | | China National Materials Co. Ltd. | 24,833 |
| 170,000 | | China Railway Construction Corp. Ltd.(d) | 128,438 |
| 343,000 | | China Railway Group Ltd. | 129,129 |
| 285,500 | | China Rongsheng Heavy Industries Group Holdings Ltd.(d) | 39,018 |
| 172,000 | | China Shanshui Cement Group Ltd. | 89,811 |
| 331,000 | | China Shipping Container Lines Co. Ltd.(a) | 63,159 |
| 116,000 | | China Shipping Development Co. Ltd.(d) | 43,521 |
| 124,000 | | China State Construction International Holdings Ltd.(d) | 132,054 |
| 124,000 | | China Zhongwang Holdings Ltd.(a) | 50,200 |
| 165,000 | | CSR Corp. Ltd.(d) | 111,897 |
| 30,000 | | Dongfang Electric Corp. Ltd. | 40,922 |
See notes to financial statements.
30 l CLAYMORE EXCHANGE-TRADED FUND TRUST 2 ANNUAL REPORT
| | |
| PORTFOLIO OF INVESTMENTS continued | August 31, 2012 |
YAO Guggenheim China All-Cap ETF continued
| Number | | | |
| of Shares | | Description | Value |
| | | Industrial - continued | |
| 128,000 | | Guangshen Railway Co. Ltd. | $ 37,131 |
| 49,000 | | Haitian International Holdings Ltd. | 49,466 |
| 60,000 | | Harbin Electric Co. Ltd. | 48,348 |
| 82,000 | | Kingboard Laminates Holdings Ltd. | 32,034 |
| 170,000 | | Lonking Holdings Ltd.(d) | 26,082 |
| 254,000 | | Metallurgical Corp. of China Ltd.(a) | 53,706 |
| 191,000 | | NVC Lighting Holdings Ltd. | 35,460 |
| 76,000 | | Sany Heavy Equipment International Holdings Co. Ltd. | 39,390 |
| 268,000 | | Shanghai Electric Group Co. Ltd. | 107,459 |
| 430,000 | | Tianjin Port Development Holdings Ltd. | 45,460 |
| 264,000 | | Yangzijiang Shipbuilding Holdings Ltd. (Singapore)(d) | 208,466 |
| 41,000 | | Zhuzhou CSR Times Electric Co. Ltd. | 98,955 |
| 128,200 | | Zoomlion Heavy Industry Science and Technology Co. Ltd.(d) | 137,187 |
| | | | 3,301,928 |
| | | Technology - 1.0% | |
| 474,000 | | Lenovo Group Ltd. | 385,005 |
| 2,061,000 | | Semiconductor Manufacturing International Corp.(a) | 78,388 |
| 83,000 | | Travelsky Technology Ltd. | 43,125 |
| | | | 506,518 |
| | | Utilities - 2.5% | |
| 42,000 | | Beijing Enterprises Holdings Ltd. | 277,789 |
| 220,996 | | China Datang Corp. Renewable Power Co. Ltd. | 20,515 |
| 60,000 | | China Resources Gas Group Ltd. | 118,047 |
| 156,000 | | China Resources Power Holdings Co. Ltd. | 333,470 |
| 298,000 | | Datang International Power Generation Co. Ltd. | 99,894 |
| 222,000 | | Guangdong Investment Ltd. | 164,004 |
| 317,998 | | Huaneng Power International, Inc. | 219,344 |
| 257,994 | | Huaneng Renewables Corp. Ltd.(a) | 28,939 |
| | | | 1,262,002 |
| | | Total Common Stocks - 99.9% | |
| | | (Cost $61,545,613) | 49,749,790 |
| Number | | | |
| of Shares | | Description | Value |
| | | Investments of Collateral for | |
| | | Securities Loaned - 6.7% | |
| 3,331,391 | | BNY Mellon Securities Lending | |
| | | Overnight Fund, 0.1928%(e) (f) | |
| | | (Cost $3,331,391) | $ 3,331,391 |
| | | Total Investments - 106.6% | |
| | | (Cost $64,877,004) | 53,081,181 |
| | | Liabilities in excess of Other Assets - (6.6%) | (3,258,861) |
| | | Net Assets - 100.0% | $ 49,822,320 |
| ADR - American Depositary Receipt |
| (a) Non-income producing security. |
(b) Security is valued based on observable and/or unobservable inputs in accordance with Fair Valuation procedures established in good faith by management and approved by the Board of Trustees. The total market value of such securities is $10,482 which represents less than 0.1% of net assets. |
| (c) Illiquid security. |
| (d) Security, or portion thereof, was on loan at August 31, 2012. |
(e) At August 31, 2012, the total market value of the Fund’s securities on loan was $3,166,582 and the total market value of the collateral held by the Fund was $3,436,076, consisting of cash collateral of $3,331,391 and U.S. Government and Agency securities valued at $104,685. |
| (f) Interest rate shown reflects yield as of August 31, 2012. |
Securities are classified by sectors that represent broad groupings of related industries.
See notes to financial statements.
CLAYMORE EXCHANGE-TRADED FUND TRUST 2 ANNUAL REPORT l 31
| | |
| PORTFOLIO OF INVESTMENTS continued | August 31, 2012 |
CQQQ Guggenheim China Technology ETF
| Number | | | |
| of Shares | | Description | Value |
| | | Common Stocks - 99.6% | |
| | | Basic Materials - 4.4% | |
| 344,500 | | Kingboard Chemical Holdings Ltd. | $ 753,292 |
| | | Communications - 53.2% | |
| 46,754 | | AsiaInfo-Linkage, Inc.(a) | 561,048 |
| 15,445 | | Baidu, Inc., ADR(a) | 1,721,191 |
| 556,000 | | BYD Electronic International Co. Ltd. | 112,544 |
| 1,232,000 | | China Wireless Technologies Ltd. | 219,199 |
| 753,500 | | Comba Telecom Systems Holdings Ltd.(b) | 194,295 |
| 3,671,896 | | ePro Ltd. | 317,185 |
| 82,749 | | Giant Interactive Group, Inc., ADR | 399,678 |
| 20,987 | | NetEase, Inc., ADR(a) | 1,092,793 |
| 76,399 | | Renren, Inc., ADR(a) (b) | 292,608 |
| 20,858 | | SINA Corp.(a) | 1,170,134 |
| 16,325 | | Sohu.com, Inc.(a) (b) | 639,450 |
| 537,000 | | TCL Communication Technology Holdings Ltd. | 116,314 |
| 56,400 | | Tencent Holdings Ltd. | 1,723,358 |
| 385,800 | | ZTE Corp.(b) | 510,338 |
| | | | 9,070,135 |
| | | Consumer, Cyclical - 4.3% | |
| 454,000 | | Digital China Holdings Ltd. | 731,668 |
| | | Energy - 3.4% | |
| 3,267,000 | | GCL-Poly Energy Holdings Ltd.(b) | 501,238 |
| 56,715 | | LDK Solar Co. Ltd., ADR(a) (b) | 74,297 |
| | | | 575,535 |
| | | Industrial - 12.7% | |
| 234,994 | | AAC Technologies Holdings, Inc. | 798,336 |
| 1,780,000 | | China Aerospace International Holdings Ltd. | 121,631 |
| 578,000 | | China High Precision Automation Group Ltd.(c) (d) | 92,405 |
| 1,641,000 | | Hi Sun Technology China Ltd.(a) (b) | 96,265 |
| 858,000 | | Kingboard Laminates Holdings Ltd. | 335,180 |
| 118,324 | | Suntech Power Holdings Co. Ltd., ADR(a) (b) | 104,196 |
| 791,974 | | Tech Pro Technology Development Ltd.(a) | 294,071 |
| 1,270,000 | | Truly International Holdings | 171,926 |
| 420,000 | | Wasion Group Holdings Ltd. | 149,995 |
| | | | 2,164,005 |
| Number | | | |
| of Shares | | Description | Value |
| | | Technology - 21.6% | |
| 9,660,000 | | Apollo Solar Energy Technology Holdings Ltd.(a) | $ 265,280 |
| 769,970 | | Chinasoft International Ltd.(a) | 173,724 |
| 1,616,000 | | Kingdee International Software Group Co. Ltd.(a) (b) | 241,684 |
| 657,000 | | Kingsoft Corp. Ltd. | 304,094 |
| 1,582,000 | | Lenovo Group Ltd. | 1,284,977 |
| 21,160,000 | | Semiconductor Manufacturing International Corp.(a) | 804,796 |
| 828,000 | | TPV Technology Ltd. | 156,926 |
| 860,000 | | Travelsky Technology Ltd. | 446,840 |
| | | | 3,678,321 |
| | | Total Common Stocks - 99.6% | |
| | | (Cost $23,872,346) | 16,972,956 |
| | | Investments of Collateral for | |
| | | Securities Loaned - 9.6% | |
| 1,630,316 | | BNY Mellon Securities Lending | |
| | | Overnight Fund, 0.1928%(e) (f) | |
| | | (Cost $1,630,316) | 1,630,316 |
| | | Total Investments - 109.2% | |
| | | (Cost $25,502,662) | 18,603,272 |
| | | Liabilities in excess of Other Assets - (9.2%) | (1,573,982) |
| | | Net Assets - 100.0% | $ 17,029,290 |
| ADR - American Depositary Receipt |
| (a) Non-income producing security. |
| (b) Security, or portion thereof, was on loan at August 31, 2012. |
(c) Security is valued based on observable inputs in accordance with Fair Valuation procedures established in good faith by management and approved by the Board of Trustees. The total market value of such securities is $92,405 which represents 0.5% of net assets. |
| (d) Illiquid security. |
(e) At August 31, 2012, the total market value of the Fund’s securities on loan was $2,076,178 and the total market value of the collateral held by the Fund was $2,251,856, consisting of cash collateral of $1,630,316 and U.S. Government and Agency securities valued at $621,540. |
| (f) Interest rate shown reflects yield as of August 31, 2012. |
Securities are classified by sectors that represent broad groupings of related industries.
See notes to financial statements.
32 l CLAYMORE EXCHANGE-TRADED FUND TRUST 2 ANNUAL REPORT
| | |
| PORTFOLIO OF INVESTMENTS continued | August 31, 2012 |
| Number | | | |
| of Shares | | Description | Value |
| | | Long-Term Investments - 99.6% | |
| | | Common Stocks - 99.3% | |
| | | British Virgin Islands - 3.0% | |
| 910,422 | | ReneSola Ltd., ADR(a) | $ 1,301,903 |
| | | Canada - 3.0% | |
| 458,392 | | Canadian Solar, Inc.(a) (b) | 1,278,914 |
| | | Cayman Islands - 30.3% | |
| 20,606,000 | | GCL-Poly Energy Holdings Ltd.(b) | 3,161,469 |
| 898,814 | | Hanwha SolarOne Co. Ltd., ADR(a) | 916,790 |
| 1,499,104 | | JA Solar Holdings Co. Ltd., ADR(a) (b) | 1,424,149 |
| 225,806 | | JinkoSolar Holding Co. Ltd., ADR(a) (b) | 724,837 |
| 818,088 | | LDK Solar Co. Ltd., ADR(a) (b) | 1,071,695 |
| 17,011,000 | | Solargiga Energy Holdings Ltd.(a) | 866,314 |
| 1,055,665 | | Suntech Power Holdings Co. Ltd., ADR(a) (b) | 929,619 |
| 418,525 | | Trina Solar Ltd., ADR(a) (b) | 1,887,548 |
| 11,795,000 | | Trony Solar Holdings Co. Ltd.(c) (d) | 714,733 |
| 783,044 | | Yingli Green Energy Holding Co. Ltd., ADR(a) (b) | 1,323,344 |
| | | | 13,020,498 |
| | | Germany - 13.3% | |
| 1,973,970 | | Conergy AG(a) (b) | 1,171,937 |
| 51,720 | | Manz AG(a) | 1,445,982 |
| 62,350 | | SMA Solar Technology AG(b) | 1,935,725 |
| 856,031 | | Solarworld AG(b) | 1,175,061 |
| | | | 5,728,705 |
| | | Norway - 3.4% | |
| 4,828,313 | | Renewable Energy Corp. ASA(a) (b) | 1,445,368 |
| | | Switzerland - 6.9% | |
| 204,622 | | Meyer Burger Technology AG(a) (b) | 2,975,031 |
| | | United States - 39.4% | |
| 247,015 | | First Solar, Inc.(a) (b) | 4,937,830 |
| 614,238 | | GT Advanced Technologies, Inc.(a) | 3,562,580 |
| 1,013,755 | | MEMC Electronic Materials, Inc.(a) | 2,716,863 |
| 488,896 | | Power-One, Inc.(a) | 3,001,822 |
| 314,815 | | STR Holdings, Inc.(a) | 1,004,260 |
| 378,116 | | SunPower Corp.(a) | 1,693,960 |
| | | | 16,917,315 |
| | | Total Common Stocks - 99.3% | |
| | | (Cost $131,014,875) | 42,667,734 |
| | | Right - 0.3% | |
| | | Norway - 0.3% | |
| 3,155,335 | | Renewable Energy Corp. ASA(a) (c) | |
| | | (Cost $0) | 127,466 |
| | | Total Long-Term Investments - 99.6% | |
| | | (Cost $131,014,875) | 42,795,200 |
| Number | | | |
| of Shares | | Description | Value |
| | | Investments of Collateral for | |
| | | Securities Loaned - 45.7% | |
| 19,660,013 | | BNY Mellon Securities Lending | |
| | | Overnight Fund, 0.1928%(e) (f) | |
| | | (Cost $19,660,013) | $ 19,660,013 |
| | | Total Investments - 145.3% | |
| | | (Cost $150,674,888) | 62,455,213 |
| | | Liabilities in excess of Other Assets - (45.3%) | (19,462,836) |
| | | Net Assets - 100.0% | $ 42,992,377 |
| ADR - American Depositary Receipt |
| AG - Stock Corporation |
| ASA - Stock Company |
| (a) Non-income producing security. |
| (b) Security, or portion thereof, was on loan at August 31, 2012. |
(c) Security is valued based on observable and/or unobservable inputs in accordance with Fair Valuation procedures established in good faith by management and approved by the Board of Trustees. The total market value of such securities is $842,199 which represents 2.0% of net assets. |
| (d) Illiquid security. |
(e) At August 31, 2012, the total market value of the Fund’s securities on loan was $18,475,310 and the total market value of the collateral held by the Fund was $20,023,314, consisting of cash collateral of $19,660,013 and U.S. Government and Agency securities valued at $363,301. |
| (f) Interest rate shown reflects yield as of August 31, 2012. |
See notes to financial statements.
CLAYMORE EXCHANGE-TRADED FUND TRUST 2 ANNUAL REPORT l 33
| | |
| PORTFOLIO OF INVESTMENTS continued | August 31, 2012 |
CGW Guggenheim S&P Global Water Index ETF
| Number | | | |
| of Shares | | Description | Value |
| | | Long-Term Investments - 99.8% | |
| | | Common Stocks - 99.8% | |
| | | Austria - 4.2% | |
| 160,355 | | Andritz AG | $ 8,290,258 |
| | | Bermuda - 0.7% | |
| 6,642,000 | | Beijing Enterprises Water Group Ltd.(a) | 1,327,330 |
| | | Brazil - 5.3% | |
| 124,828 | | Cia de Saneamento Basico do Estado de Sao Paulo, ADR | 10,624,111 |
| | | Finland - 1.2% | |
| 137,947 | | Kemira OYJ | 1,752,732 |
| 61,465 | | Uponor OYJ | 621,750 |
| | | | 2,374,482 |
| | | France - 5.0% | |
| 325,639 | | Suez Environnement Co. | 3,657,269 |
| 588,124 | | Veolia Environnement SA | 6,239,036 |
| | | | 9,896,305 |
| | | Hong Kong - 1.7% | |
| 2,130,000 | | China Everbright International Ltd.(a) | 1,043,545 |
| 2,620,000 | | Guangdong Investment Ltd. | 1,935,549 |
| 6,375,000 | | Interchina Holdings Co.(b) (c) (d) | 394,521 |
| | | | 3,373,615 |
| | | Israel - 2.4% | |
| 447,518 | | Israel Chemicals Ltd. | 4,827,667 |
| | | Italy - 1.7% | |
| 52,944 | | ACEA SpA | 294,305 |
| 488,342 | | Hera SpA | 721,430 |
| 317,511 | | Impregilo SpA(a) | 1,148,639 |
| 154,093 | | Interpump Group SpA | 1,145,011 |
| | | | 3,309,385 |
| | | Japan - 3.5% | |
| 41,100 | | Daiseki Co. Ltd.(a) | 670,828 |
| 400,000 | | Ebara Corp. | 1,604,087 |
| 216,400 | | Kurita Water Industries Ltd. | 4,632,010 |
| | | | 6,906,925 |
| | | Netherlands - 2.4% | |
| 202,387 | | Aalberts Industries NV | 3,473,306 |
| 63,713 | | Arcadis NV | 1,333,150 |
| | | | 4,806,456 |
| | | Singapore - 0.7% | |
| 1,276,000 | | Hyflux Ltd.(a) | 1,391,182 |
| | | Spain - 0.4% | |
| 67,268 | | Fomento de Construcciones y Contratas SA(a) | 847,828 |
| | | Sweden - 2.9% | |
| 340,275 | | ALFA Laval AB | 5,827,427 |
| Number | | | |
| of Shares | | Description | Value |
| | | Switzerland - 11.0% | |
| 88,197 | | Geberit AG | $ 18,637,473 |
| 24,980 | | Sulzer AG | 3,385,385 |
| | | | 22,022,858 |
| | | United Kingdom - 21.5% | |
| 400,432 | | Halma PLC | 2,585,447 |
| 793,107 | | Pennon Group PLC | 9,277,925 |
| 519,858 | | Severn Trent PLC | 14,293,156 |
| 1,495,688 | | United Utilities Group PLC | 16,843,547 |
| | | | 43,000,075 |
| | | United States - 35.2% | |
| 43,649 | | Aegion Corp.(c) | 852,028 |
| 40,805 | | American States Water Co. | 1,778,282 |
| 383,366 | | American Water Works Co., Inc. | 14,134,704 |
| 302,735 | | Aqua America, Inc. | 7,568,375 |
| 16,294 | | Badger Meter, Inc. | 552,530 |
| 61,068 | | Calgon Carbon Corp.(c) | 833,578 |
| 91,132 | | California Water Service Group | 1,666,804 |
| 183,161 | | Danaher Corp. | 9,811,935 |
| 39,870 | | Franklin Electric Co., Inc. | 2,162,150 |
| 32,925 | | Gorman-Rupp Co. | 906,755 |
| 304,211 | | Heckmann Corp.(a) (c) | 818,328 |
| 89,368 | | IDEX Corp. | 3,562,208 |
| 42,596 | | Itron, Inc.(c) | 1,846,963 |
| 43,917 | | Layne Christensen Co.(c) | 853,747 |
| 27,229 | | Lindsay Corp. | 1,779,687 |
| 333,109 | | Mueller Water Products, Inc., Class A | 1,275,807 |
| 104,027 | | Pentair, Inc. | 4,421,148 |
| 138,100 | | Tetra Tech, Inc.(c) | 3,582,314 |
| 63,005 | | Watts Water Technologies, Inc., Class A | 2,309,133 |
| 395,820 | | Xylem, Inc. | 9,614,468 |
| | | | 70,330,944 |
| | | Total Common Stocks - 99.8% | |
| | | (Cost $192,485,140) | 199,156,848 |
See notes to financial statements.
34 l CLAYMORE EXCHANGE-TRADED FUND TRUST 2 ANNUAL REPORT
| | |
| PORTFOLIO OF INVESTMENTS continued | August 31, 2012 |
CGW Guggenheim S&P Global Water Index ETF continued
| Number | | | |
| of Shares | | Description | Value |
| | | Investments of Collateral for | |
| | | Securities Loaned - 2.4% | |
| 4,733,995 | | BNY Mellon Securities Lending | |
| | | Overnight Fund, 0.1928%(e) (f) | |
| | | (Cost $4,733,995) | $ 4,733,995 |
| | | Total Investments - 102.2% | |
| | | (Cost $197,219,135) | 203,890,843 |
| | | Liabilities in excess of Other Assets - (2.2%) | (4,343,616) |
| | | Net Assets - 100.0% | $199,547,227 |
AB - Stock Company
ADR - American Depositary Receipt
AG - Stock Corporation
NV - Publicly Traded Company
OYJ - Public Traded Company
PLC - Public Limited Company
SA - Corporation
SpA - Limited Share Company
| (a) Security, or portion thereof, was on loan at August 31, 2012. |
(b) Security is valued based on observable inputs in accordance with Fair Valuation procedures established in good faith by the Board of Trustees. The total market value of such securities is $394,521 which represents 0.2% of net assets applicable to common shares. |
| (c) Non-income producing security. |
| (d) Illiquid security. |
(e) At August 31, 2012, the total market value of the Fund’s securities on loan was $4,453,803 and the total market value of the collateral held by the Fund was $4,733,995. |
| (f) Interest rate shown reflects yield as of August 31, 2012. |
See notes to financial statements.
CLAYMORE EXCHANGE-TRADED FUND TRUST 2 ANNUAL REPORT l 35
| | |
| STATEMENT OF ASSETS AND LIABILITIES | August 31, 2012 |
| | | Guggenheim | | | | |
| | | ABC High Dividend | | | Guggenheim | |
| | | ETF | | | Airline ETF | |
| | | (ABCS) | | | (FAA) | |
| Assets | | | | | | |
| Investments in securities, at value (including securities on loan) | | $ | 12,716,389 | | | $ | 16,517,523 | |
| Foreign currency, at value | | | 2,051 | | | | – | |
| Cash | | | 20,138 | | | | 47,767 | |
| Receivables: | | | | | | | | |
| Dividends | | | 117,585 | | | | 2,832 | |
| Investments sold | | | – | | | | 1,433,902 | |
| Securities lending income | | | 2,943 | | | | 6,332 | |
| Tax reclaims | | | – | | | | – | |
| Due from Adviser | | | – | | | | 37,966 | |
| Other assets | | | – | | | | 1,161 | |
| Total assets | | | 12,859,106 | | | | 18,047,483 | |
| Liabilities | | | | | | | | |
| Custodian bank | | | – | | | | 29,286 | |
| Payables: | | | | | | | | |
| Administration fee | | | – | | | | – | |
| Collateral for securities on loan | | | 2,464,224 | | | | 1,088,550 | |
| Investments purchased | | | – | | | | 1,364,985 | |
| Accrued advisory fees | | | 5,933 | | | | – | |
| Accrued expenses | | | – | | | | 40,595 | |
| Total liabilities | | | 2,470,157 | | | | 2,523,416 | |
| Net Assets | | $ | 10,388,949 | | | $ | 15,524,067 | |
| Composition of Net Assets | | | | | | | | |
| Paid-in capital | | $ | 13,245,059 | | | $ | 21,752,429 | |
| Accumulated undistributed net investment income (loss) | | | 106,505 | | | | – | |
| Accumulated net realized gain (loss) on investments and currency transactions | | | (1,298,630 | ) | | | (4,494,811 | ) |
| Net unrealized appreciation (depreciation) on investments and currency translation | | | (1,663,985 | ) | | | (1,733,551 | ) |
| Net Assets | | $ | 10,388,949 | | | $ | 15,524,067 | |
| Shares outstanding ($0.01 par value with unlimited amount authorized) | | | 550,000 | | | | 550,000 | |
| Net Asset Value Per Share | | $ | 18.89 | | | $ | 28.23 | |
| Investments in securities, at cost | | $ | 14,380,160 | | | $ | 18,250,575 | |
| Foreign currency, at cost | | $ | 2,051 | | | $ | – | |
| Securities on loan, at value | | $ | 2,340,385 | | | $ | 1,045,300 | |
| * Reflects 1 for 10 reverse stock split that occurred on February 15, 2012. | | | | | | | | |
See notes to financial statements.
36 l CLAYMORE EXCHANGE-TRADED FUND TRUST 2 ANNUAL REPORT
| Guggenheim | | | Guggenheim | | | | | | Guggenheim S&P | |
| China All-Cap | | | China Technology | | | Guggenheim | | | Global Water | |
| ETF | | | ETF | | | Solar ETF | | | Index ETF | |
| (YAO) | | | (CQQQ) | | | (TAN) | | | (CGW) | |
| $ | 53,081,181 | | | $ | 18,603,272 | | | $ | 62,455,213 | | | $ | 203,890,843 | |
| | 9,060 | | | | – | | | | – | | | | 7,127 | |
| | 49,574 | | | | 27,829 | | | | – | | | | 338,209 | |
| | 35,621 | | | | 25,729 | | | | – | | | | 514,171 | |
| | – | | | | – | | | | – | | | | 647,975 | |
| | 8,930 | | | | 13,715 | | | | 285,716 | | | | 10,049 | |
| | – | | | | – | | | | 62,952 | | | | 55,971 | |
| | – | | | | – | | | | – | | | | – | |
| | – | | | | – | | | | 2,115 | | | | 3,937 | |
| | 53,184,366 | | | | 18,670,545 | | | | 62,805,996 | | | | 205,468,282 | |
| | – | | | | – | | | | 16,053 | | | | – | |
| | – | | | | – | | | | 1,047 | | | | 4,649 | |
| | 3,331,391 | | | | 1,630,316 | | | | 19,660,013 | | | | 4,733,995 | |
| | – | | | | – | | | | – | | | | 982,434 | |
| | 30,655 | | | | 10,939 | | | | 19,035 | | | | 82,384 | |
| | – | | | | – | | | | 117,471 | | | | 117,593 | |
| | 3,362,046 | | | | 1,641,255 | | | | 19,813,619 | | | | 5,921,055 | |
| $ | 49,822,320 | | | $ | 17,029,290 | | | $ | 42,992,377 | | | $ | 199,547,227 | |
| $ | 64,718,162 | | | $ | 30,415,173 | | | $ | 374,010,118 | | | $ | 279,516,948 | |
| | 904,260 | | | | 293,655 | | | | 3,215,184 | | | | 3,574,246 | |
| | (4,004,282 | ) | | | (6,780,148 | ) | | | (246,010,277 | ) | | | (90,207,077 | ) |
| | (11,795,820 | ) | | | (6,899,390 | ) | | | (88,222,648 | ) | | | 6,663,110 | |
| $ | 49,822,320 | | | $ | 17,029,290 | | | $ | 42,992,377 | | | $ | 199,547,227 | |
| | 2,300,000 | | | | 850,000 | | | | 2,568,000 | * | | | 9,480,000 | |
| $ | 21.66 | | | $ | 20.03 | | | $ | 16.74 | | | $ | 21.05 | |
| $ | 64,877,004 | | | $ | 25,502,662 | | | $ | 150,674,888 | | | $ | 197,219,135 | |
| $ | 9,060 | | | $ | – | | | $ | – | | | $ | 7,127 | |
| $ | 3,166,582 | | | $ | 2,076,178 | | | $ | 18,475,310 | | | $ | 4,453,803 | |
See notes to financial statements.
CLAYMORE EXCHANGE-TRADED FUND TRUST 2 ANNUAL REPORT l 37
| | |
STATEMENT OF OPERATIONS For the Year ended August 31, 2012 | August 31, 2012 |
| | | Guggenheim | | | | |
| | | ABC High Dividend | | | Guggenheim | |
| | | ETF | | | Airline ETF | |
| | | (ABCS) | | | (FAA) | |
| Investment Income | | | | | | |
| Dividend income | | $ | 578,618 | | | $ | 96,632 | |
| Less return of capital distributions received | | | (2,073 | ) | | | – | |
| Foreign taxes withheld | | | (32,257 | ) | | | (3,743 | ) |
| Net dividend income | | | 544,288 | | | | 92,889 | |
| Net securities lending income | | | 17,538 | | | | 26,453 | |
| Total investment income | | | 561,826 | | | | 119,342 | |
| Expenses | | | | | | | | |
| Advisory fee <Note 3> | | | 57,774 | | | | 80,346 | |
| Administration fee | | | – | | | | 4,419 | |
| Custodian fee | | | – | | | | 52,950 | |
| Licensing | | | – | | | | 9,641 | |
| Listing fee and expenses | | | – | | | | 5,000 | |
| Printing expenses | | | – | | | | 9,811 | |
| Portfolio valuation | | | – | | | | 11,727 | |
| Professional fees | | | – | | | | 24,434 | |
| Registration & filings | | | – | | | | – | |
| Trustees’ fees and expenses | | | – | | | | 3,519 | |
| Miscellaneous | | | – | | | | 5,190 | |
| Total expenses | | | 57,774 | | | | 207,037 | |
| Advisory fees waived | | | – | | | | (80,346 | ) |
| Other expenses waived or reimbursed | | | – | | | | (14,208 | ) |
| Net expenses | | | 57,774 | | | | 112,483 | |
| Net Investment Income (Loss) | | | 504,052 | | | | 6,859 | |
| Realized and Unrealized Gain (Loss) | | | | | | | | |
| Net realized gain (loss) on: | | | | | | | | |
| Investments | | | (1,338,546 | ) | | | (3,127,185 | ) |
| In-kind transactions | | | 84,710 | | | | 89,587 | |
| Foreign currency transactions | | | (21,261 | ) | | | (14,069 | ) |
| Net realized gain (loss) | | | (1,275,097 | ) | | | (3,051,667 | ) |
| Net change in unrealized appreciation (depreciation) on | | | | | | | | |
| Investments | | | (1,197,550 | ) | | | 2,762,613 | |
| Foreign currency translation | | | (1,206 | ) | | | 153 | |
| Net change in unrealized appreciation (depreciation) | | | (1,198,756 | ) | | | 2,762,766 | |
| Net realized and unrealized gain (loss) | | | (2,473,853 | ) | | | (288,901 | ) |
Net Increase (Decrease) in Net Assets Resulting from Operations | | $ | (1,969,801 | ) | | $ | (282,042 | ) |
See notes to financial statements.
38 l CLAYMORE EXCHANGE-TRADED FUND TRUST 2 ANNUAL REPORT
| | | | Guggenheim | | | | | | Guggenheim S&P | |
| Guggenheim | | | China Technology | | | Guggenheim | | | Global Water | |
| China All-Cap ETF | | | ETF | | | Solar ETF | | | Index ETF | |
| (YAO) | | | (CQQQ) | | | (TAN) | | | (CGW) | |
| $ | 1,682,536 | | | $ | 469,042 | | | $ | 502,138 | | | $ | 6,332,045 | |
| | – | | | | – | | | | – | | | | (637,672 | ) |
| | (132,133 | ) | | | (2,554 | ) | | | (31,955 | ) | | | (317,045 | ) |
| | 1,550,403 | | | | 466,488 | | | | 470,183 | | | | 5,377,328 | |
| | 126,528 | | | | 267,222 | | | | 4,725,726 | | | | 220,742 | |
| | 1,676,931 | | | | 733,710 | | | | 5,195,909 | | | | 5,598,070 | |
| | 397,912 | | | | 166,625 | | | | 334,597 | | | | 958,373 | |
| | – | | | | – | | | | 18,403 | | | | 52,676 | |
| | – | | | | – | | | | 127,153 | | | | 104,330 | |
| | – | | | | – | | | | 75,793 | | | | 202,456 | |
| | – | | | | – | | | | 5,000 | | | | 5,000 | |
| | – | | | | – | | | | 51,499 | | | | 60,593 | |
| | – | | | | – | | | | 12,008 | | | | 15,006 | |
| | – | | | | – | | | | 25,783 | | | | 33,200 | |
| | – | | | | – | | | | 356 | | | | – | |
| | – | | | | – | | | | 5,856 | | | | 10,074 | |
| | – | | | | – | | | | 17,724 | | | | 10,773 | |
| | 397,912 | | | | 166,625 | | | | 674,172 | | | | 1,452,481 | |
| | – | | | | – | | | | (205,736 | ) | | | (112,691 | ) |
| | – | | | | – | | | | – | | | | – | |
| | 397,912 | | | | 166,625 | | | | 468,436 | | | | 1,339,790 | |
| | 1,279,019 | | | | 567,085 | | | | 4,727,473 | | | | 4,258,280 | |
| | (2,632,795 | ) | | | (4,709,416 | ) | | | (74,836,094 | ) | | | (1,130,203 | ) |
| | (1,452,313 | ) | | | 1,324,078 | | | | (13,761 | ) | | | 9,406,998 | |
| | 6,632 | | | | (204 | ) | | | (31,957 | ) | | | (84,642 | ) |
| | (4,078,476 | ) | | | (3,385,542 | ) | | | (74,881,812 | ) | | | 8,192,153 | |
| | (5,844,282 | ) | | | (2,777,094 | ) | | | (16,453,493 | ) | | | (16,306 | ) |
| | 15 | | | | (5 | ) | | | (9,017 | ) | | | (148,982 | ) |
| | (5,844,267 | ) | | | (2,777,099 | ) | | | (16,462,510 | ) | | | (165,288 | ) |
| | (9,922,743 | ) | | | (6,162,641 | ) | | | (91,344,322 | ) | | | 8,026,865 | |
| $ | (8,643,724 | ) | | $ | (5,595,556 | ) | | $ | (86,616,849 | ) | | $ | 12,285,145 | |
See notes to financial statements.
CLAYMORE EXCHANGE-TRADED FUND TRUST 2 ANNUAL REPORT l 39
| | |
| STATEMENTS OF CHANGES IN NET ASSETS | August 31, 2012 |
| | | Guggenheim ABC | | | | |
| | | High Dividend ETF | | | Guggenheim Airline ETF | |
| | | (ABCS) | | | (FAA) | |
| | | For the Year | | | For the Period | | | For the Year | | | For the Year | |
| | | Ended | | | Ended | | | Ended | | | Ended | |
| | | August 31, 2012 | | | August 31, 20111 | | | August 31, 2012 | | | August 31, 2011 | |
| Increase (Decrease) in Net Assets Resulting from Operations | | | | | | | | | | | | |
| Net investment income (loss) | | $ | 504,052 | | | $ | 78,429 | | | $ | 6,859 | | | $ | 74,178 | |
| Net realized gain (loss) | | | (1,275,097 | ) | | | (49,751 | ) | | | (3,051,667 | ) | | | 6,182,055 | |
| Net change in unrealized appreciation (depreciation) | | | (1,198,756 | ) | | | (465,229 | ) | | | 2,762,766 | | | | (5,428,491 | ) |
| Net increase (decrease) in net assets resulting from operations | | | (1,969,801 | ) | | | (436,551 | ) | | | (282,042 | ) | | | 827,742 | |
| Distributions to Shareholders | | | | | | | | | | | | | | | | |
| From and in excess of net investment income | | | (453,500 | ) | | | – | | | | (164,933 | ) | | | (26,600 | ) |
| Return of capital | | | – | | | | – | | | | (2,817 | ) | | | – | |
| Total distributions | | | (453,500 | ) | | | – | | | | (167,750 | ) | | | (26,600 | ) |
| Capital Share Transactions | | | | | | | | | | | | | | | | |
| Proceeds from sale of shares | | | 9,922,505 | | | | 7,247,644 | | | | 2,775,148 | | | | 2,085,376 | |
| Cost of shares redeemed | | | (3,921,348 | ) | | | – | | | | (5,327,533 | ) | | | (27,104,392 | ) |
| Net increase (decrease) from capital share transactions | | | 6,001,157 | | | | 7,247,644 | | | | (2,552,385 | ) | | | (25,019,016 | ) |
| Total increase (decrease) in net assets | | | 3,577,856 | | | | 6,811,093 | | | | (3,002,177 | ) | | | (24,217,874 | ) |
| Net Assets | | | | | | | | | | | | | | | | |
| Beginning of period | | | 6,811,093 | | | | – | | | | 18,526,244 | | | | 42,744,118 | |
| End of period | | $ | 10,388,949 | | | $ | 6,811,093 | | | $ | 15,524,067 | | | $ | 18,526,244 | |
| Accumulated undistributed net investment income (loss) at end of period | | $ | 106,505 | | | $ | 77,151 | | | $ | – | | | $ | (14,285 | ) |
| Changes in Shares Outstanding | | | | | | | | | | | | | | | | |
| Shares sold | | | 450,000 | | | | 300,000 | | | | 100,000 | | | | 50,000 | |
| Shares redeemed | | | (200,000 | ) | | | – | | | | (200,000 | ) | | | (700,000 | ) |
| Shares outstanding, beginning of period | | | 300,000 | | | | – | | | | 650,000 | | | | 1,300,000 | |
| Shares outstanding, end of period | | | 550,000 | | | | 300,000 | | | | 550,000 | | | | 650,000 | |
| 1 | Commencement of investment operations – June 8, 2011 |
| * | Restated to reflect 1 for 10 reverse stock split that occurred on February 15, 2012. |
| ** | Reflects 1 for 10 reverse stock split that occurred on February 15, 2012. |
See notes to financial statements.
40 l CLAYMORE EXCHANGE-TRADED FUND TRUST 2 ANNUAL REPORT
| Guggenheim China | | | Guggenheim China | | | | | | | | | Guggenheim S&P | |
| All-Cap ETF | | | Technology ETF | | | Guggenheim Solar ETF | | | Global Water Index ETF | |
| (YAO) | | | (CQQQ) | | | (TAN) | | | (CGW) | |
| For the Year | | | For the Year | | | For the Year | | | For the Year | | | For the Year | | | For the Year | | | For the Year | | | For the Year | |
| Ended | | | Ended | | | Ended | | | Ended | | | Ended | | | Ended | | | Ended | | | Ended | |
| August 31, 2012 | | | August 31, 2011 | | | August 31, 2012 | | | August 31, 2011 | | | August 31, 2012 | | | August 31, 2011 | | | August 31, 2012 | | | August 31, 2011 | |
| $ | 1,279,019 | | | $ | 1,303,810 | | | $ | 567,085 | | | $ | 414,146 | | | $ | 4,727,473 | | | $ | 4,061,253 | | | $ | 4,258,280 | | | $ | 4,192,474 | |
| | (4,078,476 | ) | | | 256,589 | | | | (3,385,542 | ) | | | (144,932 | ) | | | (74,881,812 | ) | | | (35,756,241 | ) | | | 8,192,153 | | | | (3,308,801 | ) |
| | (5,844,267 | ) | | | (2,733,167 | ) | | | (2,777,099 | ) | | | (2,056,561 | ) | | | (16,462,510 | ) | | | (17,335,413 | ) | | | (165,288 | ) | | | 34,578,834 | |
| | (8,643,724 | ) | | | (1,172,768 | ) | | | (5,595,556 | ) | | | (1,787,347 | ) | | | (86,616,849 | ) | | | (49,030,401 | ) | | | 12,285,145 | | | | 35,462,507 | |
| | (1,450,000 | ) | | | (874,200 | ) | | | (593,250 | ) | | | (179,550 | ) | | | (4,861,440 | ) | | | (575,360 | ) | | | (3,994,920 | ) | | | (4,420,200 | ) |
| | – | | | | – | | | | – | | | | – | | | | – | | | | – | | | | – | | | | – | |
| | (1,450,000 | ) | | | (874,200 | ) | | | (593,250 | ) | | | (179,550 | ) | | | (4,861,440 | ) | | | (575,360 | ) | | | (3,994,920 | ) | | | (4,420,200 | ) |
| | – | | | | 30,466,522 | | | | 4,474,181 | | | | 24,571,116 | | | | 44,820,908 | | | | 114,552,232 | | | | 23,060,591 | | | | 31,653,620 | |
| | (12,690,787 | ) | | | (17,214,834 | ) | | | (13,061,136 | ) | | | (10,290,309 | ) | | | (26,823,657 | ) | | | (96,161,205 | ) | | | (45,993,858 | ) | | | (40,794,890 | ) |
| | (12,690,787 | ) | | | 13,251,688 | | | | (8,586,955 | ) | | | 14,280,807 | | | | 17,997,251 | | | | 18,391,027 | | | | (22,933,267 | ) | | | (9,141,270 | ) |
| | (22,784,511 | ) | | | 11,204,720 | | | | (14,775,761 | ) | | | 12,313,910 | | | | (73,481,038 | ) | | | (31,214,734 | ) | | | (14,643,042 | ) | | | 21,901,037 | |
| | 72,606,831 | | | | 61,402,111 | | | | 31,805,051 | | | | 19,491,141 | | | | 116,473,415 | | | | 147,688,149 | | | | 214,190,269 | | | | 192,289,232 | |
| $ | 49,822,320 | | | $ | 72,606,831 | | | $ | 17,029,290 | | | $ | 31,805,051 | | | $ | 42,992,377 | | | $ | 116,473,415 | | | $ | 199,547,227 | | | $ | 214,190,269 | |
| $ | 904,260 | | | $ | 1,068,398 | | | $ | 293,655 | | | $ | 308,406 | | | $ | 3,215,184 | | | $ | 3,381,107 | | | $ | 3,574,246 | | | $ | 3,395,528 | |
| | – | | | | 1,100,000 | | | | 200,000 | | | | 850,000 | | | | 1,536,000 | ** | | | 1,384,000 | * | | | 1,120,000 | | | | 1,520,000 | |
| | (600,000 | ) | | | (700,000 | ) | | | (600,000 | ) | | | (400,000 | ) | | | (1,088,000 | )** | | | (1,280,000 | )* | | | (2,320,000 | ) | | | (2,080,000 | ) |
| | 2,900,000 | | | | 2,500,000 | | | | 1,250,000 | | | | 800,000 | | | | 2,120,000 | * | | | 2,016,000 | * | | | 10,680,000 | | | | 11,240,000 | |
| | 2,300,000 | | | | 2,900,000 | | | | 850,000 | | | | 1,250,000 | | | | 2,568,000 | ** | | | 2,120,000 | * | | | 9,480,000 | | | | 10,680,000 | |
See notes to financial statements.
CLAYMORE EXCHANGE-TRADED FUND TRUST 2 ANNUAL REPORT l 41
| | |
| FINANCIAL HIGHLIGHTS | August 31, 2012 |
ABCS Guggenheim ABC High Dividend ETF | | |
| | | | | For the Period | |
| | | | | June 8, 2011 | * |
| Per share operating performance | For the year ended | | | through | |
| for a share outstanding throughout the period | August 31, 2012 | | | August 31, 2011 | |
| Net asset value, beginning of period | $ | 22.70 | | | $ | 25.01 | |
| Income from investment operations | | | | | | | |
Net investment income(a) | | 1.16 | | | | 0.38 | |
| Net realized and unrealized gain (loss) | | (3.90 | ) | | | (2.69 | ) |
| Total from investment operations | | (2.74 | ) | | | (2.31 | ) |
| Distributions to shareholders | | | | | | | |
| From net investment income | | (1.07 | ) | | | – | |
| Net asset value, end of period | $ | 18.89 | | | $ | 22.70 | |
| Market value, end of period | $ | 18.84 | | | $ | 22.72 | |
Total return(b) | | | | | | | |
| Net asset value | | -12.10 | % | | | -9.24 | % |
| | | | | | |
| Net assets, end of period (thousands) | $ | 10,389 | | | $ | 6,811 | |
| Ratio of net expenses to average net assets | | 0.65 | % | | | 0.65 | %(c) |
| Ratio of net investment income (loss) to average net assets | | 5.67 | % | | | 7.21 | %(c) |
Portfolio turnover rate(d) | | 95 | % | | | 19 | % |
| * | Commencement of investment operations. |
| (a) | Based on average shares outstanding during the period. |
| (b) | Total investment return is calculated assuming a purchase of a common share at the beginning of the period and a sale on the last day of the period reported at net asset value (“NAV”). Dividends and distributions are assumed to be reinvested at NAV. Total investment return does not reflect brokerage commissions. A return calculated for a period of less than one year is not annualized. |
| (c) | Annualized. |
| (d) | Portfolio turnover is not annualized for periods of less than one year and does not include securities received or delivered from processing creations or redemptions. |
See notes to financial statements.
42 l CLAYMORE EXCHANGE-TRADED FUND TRUST 2 ANNUAL REPORT
| | |
| FINANCIAL HIGHLIGHTS continued | August 31, 2012 |
FAA Guggenheim Airline ETF
| | | | | | | | | | | For the Period | |
| | For the Year | | | For the Year | | | For the Year | | | January 26, 2009** | |
| Per share operating performance | Ended | | | Ended | | | Ended | | | through | |
| for a share outstanding throughout the period | August 31, 2012 | | | August 31, 2011 | | | August 31, 2010 | | | August 31, 2009 | |
| Net asset value, beginning of period | $ | 28.50 | | | $ | 32.88 | | | $ | 23.69 | | | $ | 24.04 | (e) |
| Income from investment operations | | | | | | | | | | | | | | | |
Net investment income (loss) (a) | | 0.01 | | | | 0.08 | | | | (0.16 | ) | | | (0.05 | ) |
| Net realized and unrealized gain (loss) | | 0.03 | | | | (4.43 | ) | | | 9.35 | | | | (0.30 | )(e) |
| Total from investment operations | | 0.04 | | | | (4.35 | ) | | | 9.19 | | | | (0.35 | ) |
| Distributions to shareholders | | | | | | | | | | | | | | | |
| From and in excess of net investment income | | (0.30 | ) | | | (0.03 | ) | | | – | | | | – | |
| Return of capital | | (0.01 | ) | | | – | | | | – | | | | – | |
| Total distributions | | (0.31 | ) | | | (0.03 | ) | | | – | | | | – | |
| Net asset value, end of period | $ | 28.23 | | | $ | 28.50 | | | $ | 32.88 | | | $ | 23.69 | |
| Market value, end of period | $ | 28.24 | | | $ | 28.53 | | | $ | 32.74 | | | $ | 24.10 | |
Total return* (b) | | | | | | | | | | | | | | | |
| Net asset value | | 0.20 | % | | | -13.26 | % | | | 38.79 | % | | | -1.46 | %(e) |
Ratios and supplemental data | | | | | | | | | | | | | | | |
| Net assets, end of period (thousands) | $ | 15,524 | | | $ | 18,526 | | | $ | 42,744 | | | $ | 4,738 | |
| Ratio of net expenses to average net assets* | | 0.70 | % | | | 0.70 | % | | | 0.75 | % | | | 0.95 | %(c) |
| Ratio of net investment income (loss) to average net assets* | | 0.04 | % | | | 0.23 | % | | | -0.50 | % | | | -0.40 | %(c) |
Portfolio turnover rate (d) | | 50 | % | | | 38 | % | | | 65 | % | | | 58 | % |
| * If certain expenses had not been waived or reimbursed by the Investment Adviser, | | | | | | | | | | | | | | | |
| total return would have been lower and the ratios would have been as follows: | | | | | | | | | | | | | | | |
| Ratio of total expenses to average net assets | | 1.29 | % | | | 0.99 | % | | | 1.13 | % | | | 5.67 | %(c) |
| Ratio of net investment income (loss) to average net assets | | -0.55 | % | | | -0.06 | % | | | -0.88 | % | | | -5.12 | %(c) |
| ** | Commencement of investment operations. |
| (a) | Based on average shares outstanding during the period. |
| (b) | Total investment return is calculated assuming a purchase of a common share at the beginning of the period and a sale on the last day of the period reported at net asset value ("NAV"). Dividends and distributions are assumed to be reinvested at NAV. Total investment return does not reflect brokerage commissions. A return calculated for a period of less than one year is not annualized. |
| (c) | Annualized. |
| (d) | Portfolio turnover is not annualized for periods of less than one year and does not include securities received or delivered from processing creations or redemptions. |
| (e) | Subsequent to August 31, 2009, it was identified that the net asset value, for January 26, 2009 was listed incorrectly as $23.82, causing the total return at net asset value and the net realized and unrealized loss to be listed incorrectly. The above figures represent the corrected presentation. This issue had no impact on the ending net asset value. |
See notes to financial statements.
CLAYMORE EXCHANGE-TRADED FUND TRUST 2 ANNUAL REPORT l 43
| | |
| FINANCIAL HIGHLIGHTS continued | August 31, 2012 |
| | | | | |
| YAO Guggenheim China All-Cap ETF | | | |
| | | | | | | | For the Period | |
| | For the | | | For the | | | October 19, 2009 | * |
| Per share operating performance | Year Ended | | | Year Ended | | | through | |
| for a share outstanding throughout the period | August 31, 2012 | | | August 31, 2011 | | | August 31, 2010 | |
| Net asset value, beginning of period | $ | 25.04 | | | $ | 24.56 | | | $ | 24.82 | |
| Income from investment operations | | | | | | | | | | | |
Net investment income (a) | | 0.52 | | | | 0.41 | | | | 0.22 | |
| Net realized and unrealized gain (loss) | | (3.32 | ) | | | 0.35 | | | | (0.48 | ) |
| Total from investment operations | | (2.80 | ) | | | 0.76 | | | | (0.26 | ) |
| Distributions to shareholders | | | | | | | | | | | |
| From and in excess of net investment income | | (0.58 | ) | | | (0.28 | ) | | | – | |
| Net asset value, end of period | $ | 21.66 | | | $ | 25.04 | | | $ | 24.56 | |
| Market value, end of period | $ | 21.76 | | | $ | 25.07 | | | $ | 24.55 | |
Total return (b) | | | | | | | | | | | |
| Net asset value | | -11.17 | % | | | 3.01 | % | | | -1.05 | % |
Ratios and supplemental data | | | | | | | | | | | |
| Net assets, end of period (thousands) | $ | 49,822 | | | $ | 72,607 | | | $ | 61,402 | |
| Ratio of net expenses to average net assets | | 0.70 | % | | | 0.70 | % | | | 0.70 | %(c) |
| Ratio of net investment income to average net assets | | 2.25 | % | | | 1.50 | % | | | 1.02 | %(c) |
Portfolio turnover rate (d) | | 12 | % | | | 16 | % | | | 11 | % |
| * | Commencement of investment operations. |
| (a) | Based on average shares outstanding during the period. |
| (b) | Total investment return is calculated assuming a purchase of a common share at the beginning of the period and a sale on the last day of the period reported at net asset value (“NAV”). Dividends and distributions are assumed to be reinvested at NAV. Total investment return does not reflect brokerage commissions. A return calculated for a period of less than one year is not annualized. |
| (c) | Annualized. |
| (d) | Portfolio turnover is not annualized for periods less than one year and does not include securities received or delivered from processing creations or redemptions. |
See notes to financial statements.
44 l CLAYMORE EXCHANGE-TRADED FUND TRUST 2 ANNUAL REPORT
| | |
| FINANCIAL HIGHLIGHTS continued | August 31, 2012 |
| | | | | | | | | | |
CQQQ Guggenheim China Technology ETF | | | | | | | | | |
| | | | | | | | | For the Period | |
| | | For the | | | | For the | | December 8, 2009* | |
| Per share operating performance | | Year Ended | | | Year Ended | | | through | |
| for a share outstanding throughout the period | | August 31, 2012 | | | August 31, 2011 | | | August 31, 2010 | |
| Net asset value, beginning of period | | $ | 25.44 | | | $ | 24.36 | | | $ | 25.06 | |
| Income from investment operations | | | | | | | | | | | | |
Net investment income (a) | | | 0.54 | | | | 0.31 | | | | 0.08 | |
| Net realized and unrealized gain (loss) | | | (5.38 | ) | | | 0.90 | | | | (0.78 | ) |
| Total from investment operations | | | (4.84 | ) | | | 1.21 | | | | (0.70 | ) |
| Distributions to shareholders | | | | | | | | | | | | |
| From and in excess of net investment income | | | (0.57 | ) | | | (0.13 | ) | | | – | |
| Net asset value, end of period | | $ | 20.03 | | | $ | 25.44 | | | $ | 24.36 | |
| Market value, end of period | | $ | 19.96 | | | $ | 25.57 | | | $ | 24.40 | |
Total return (b) | | | | | | | | | | | | |
| Net asset value | | | -19.10 | % | | | 4.94 | % | | | -2.79 | % |
Ratios and supplemental data | | | | | | | | | | | | |
| Net assets, end of period (thousands) | | $ | 17,029 | | | $ | 31,805 | | | $ | 19,491 | |
| Ratio of net expenses to average net assets | | | 0.70 | % | | | 0.70 | % | | | 0.70 | %(c) |
| Ratio of net investment income to average net assets | | | 2.38 | % | | | 1.09 | % | | | 0.43 | %(c) |
Portfolio turnover rate (d) | | | 43 | % | | | 28 | % | | | 11 | % |
| * | Commencement of investment operations. |
| (a) | Based on average shares outstanding during the period. |
| (b) | Total investment return is calculated assuming a purchase of a common share at the beginning of the period and a sale on the last day of the period reported at net asset value (“NAV”). Dividends and distributions are assumed to be reinvested at NAV. Total investment return does not reflect brokerage commissions. A return calculated for a period of less than one year is not annualized. |
| (c) | Annualized. |
| (d) | Portfolio turnover is not annualized for periods less than one year and does not include securities received or delivered from processing creations or redemptions. |
See notes to financial statements.
CLAYMORE EXCHANGE-TRADED FUND TRUST 2 ANNUAL REPORT l 45
| | |
| FINANCIAL HIGHLIGHTS continued | August 31, 2012 |
| | | | | | | | | | | | | | | | For the Period | |
| | | | For the | | | For the | | | For the | | | For the | | | April 15, 2008** | |
| Per share operating performance | | Year Ended | | | Year Ended | | | Year Ended | | | Year Ended | | | through | |
for a share outstanding throughout the period (a) | | August 31, 2012 | | | August 31, 2011 | | | August 31, 2010 | | | August 31, 2009 | | | August 31, 2008 | |
| Net asset value, beginning of period | | $ | 54.90 | | | $ | 73.30 | | | $ | 86.00 | | | $ | 262.10 | | | $ | 251.30 | |
| Income from investment operations | | | | | | | | | | | | | | | | | | | | |
Net investment income (loss) (b) | | | 1.84 | | | | 1.80 | | | | (0.10 | ) | | | (0.50 | ) | | | 0.20 | |
| Net realized and unrealized gain (loss) | | | (37.89 | ) | | | (19.90 | ) | | | (12.60 | ) | | | (175.50 | ) | | | 10.60 | |
| | Total from investment operations | | | (36.05 | ) | | | (18.10 | ) | | | (12.70 | ) | | | (176.00 | ) | | | 10.80 | |
| Distributions to shareholders | | | | | | | | | | | | | | | | | | | | |
| From and in excess net investment income | | | (2.11 | ) | | | (0.30 | ) | | | – | | | | (0.10 | ) | | | – | |
| Return of capital | | | – | | | | – | | | | – | | | | (0.00 | )(c) | | | – | |
| | Total distributions | | | (2.11 | ) | | | (0.30 | ) | | | – | | | | (0.10 | ) | | | – | |
| Net asset value, end of period | | $ | 16.74 | | | $ | 54.90 | | | $ | 73.30 | | | $ | 86.00 | | | $ | 262.10 | |
| Market value, end of period | | $ | 16.71 | | | $ | 54.60 | | | $ | 72.90 | | | $ | 85.20 | | | $ | 262.80 | |
Total return* (d) | | | | | | | | | | | | | | | | | | | | |
| Net asset value | | | -66.93 | % | | | -24.81 | % | | | -14.77 | % | | | -67.14 | % | | | 4.30 | % |
| | | | | | | | | | | | | | | | | | | | | |
| Ratios and supplemental data | | | | | | | | | | | | | | | | | | | | |
| Net assets, end of period (thousands) | | $ | 42,992 | | | $ | 116,473 | | | $ | 147,688 | | | $ | 166,565 | | | $ | 186,583 | |
| Ratio of net expenses to average net assets* | | | 0.70 | % | | | 0.70 | % | | | 0.66 | % | | | 0.70 | % | | | 0.79 | %(e) |
| Ratio of net investment income (loss) to average net assets* | | | 7.07 | % | | | 2.40 | % | | | -0.09 | % | | | -0.54 | % | | | 0.16 | %(e) |
Portfolio turnover rate (f) | | | 49 | % | | | 38 | % | | | 17 | % | | | 86 | % | | | 9 | % |
| * If certain expenses had not been waived or reimbursed by the Investment Adviser, | | | | | | | | | | | | | | | | | | | | |
| total return would have been lower and the ratios would have been as follows: | | | | | | | | | | | | | | | | | | | | |
| Ratio of total expenses to average net assets | | | 1.01 | % | | | 0.88 | % | | | 0.88 | % | | | 0.95 | % | | | 0.93 | %(e) |
| Ratio of net investment income (loss) to average net assets | | | 6.76 | % | | | 2.22 | % | | | -0.31 | % | | | -0.79 | % | | | 0.02 | %(e) |
| ** | Commencement of investment operations. |
| (a) | Reflects 1 for 10 reverse stock split that occurred on February 15, 2012. |
| (b) | Based on average shares outstanding during the period. |
| (c) | Less than $0.01. |
| (d) | Total investment return is calculated assuming a purchase of a common share at the beginning of the period and a sale on the last day of the period reported at net asset value (“NAV”). Dividends and distributions are assumed to be reinvested at NAV. Total investment return does not reflect brokerage commissions. A return calculated for a period of less than one year is not annualized. |
| (e) | Annualized. |
| (f) | Portfolio turnover is not annualized for periods of less than one year and does not include securities received or delivered from processing creations or redemptions. |
See notes to financial statements.
46 l CLAYMORE EXCHANGE-TRADED FUND TRUST 2 ANNUAL REPORT
| | |
| FINANCIAL HIGHLIGHTS continued | August 31, 2012 |
| | | | | | | | | | | | | | | | | |
| CGW Guggenheim S&P Global Water Index ETF | | | | | | | | | | | | | | | |
| | | | For the | | | For the | | | For the | | | For the | | | For the | |
| Per share operating performance | | Year Ended | | | Year Ended | | | Year Ended | | | Year Ended | | | Year Ended | |
| for a share outstanding throughout the period | | August 31, 2012 | | | August 31, 2011 | | | August 31, 2010 | | | August 31, 2009 | | | August 31, 2008 | |
| Net asset value, beginning of period | | $ | 20.06 | | | $ | 17.11 | | | $ | 16.88 | | | $ | 23.22 | | | $ | 24.86 | |
| Income from investment operations | | | | | | | | | | | | | | | | | | | | |
Net investment income (a) | | | 0.44 | | | | 0.38 | | | | 0.36 | | | | 0.35 | | | | 0.90 | |
| Net realized and unrealized gain (loss) | | | 0.96 | | | | 2.99 | | | | 0.07 | | | | (5.45 | ) | | | (2.43 | ) |
| | Total from investment operations | | | 1.40 | | | | 3.37 | | | | 0.43 | | | | (5.10 | ) | | | (1.53 | ) |
| Distributions to shareholders | | | | | | | | | | | | | | | | | | | | |
| From net investment income | | | (0.41 | ) | | | (0.42 | ) | | | (0.20 | ) | | | (1.24 | ) | | | (0.11 | ) |
| Net asset value, end of period | | $ | 21.05 | | | $ | 20.06 | | | $ | 17.11 | | | $ | 16.88 | | | $ | 23.22 | |
| Market value, end of period | | $ | 20.98 | | | $ | 19.99 | | | $ | 16.99 | | | $ | 16.93 | | | $ | 23.43 | |
Total return * (b) | | | | | | | | | | | | | | | | | | | | |
| Net asset value | | | 7.23 | % | | | 19.60 | % | | | 2.46 | % | | | -20.93 | % | | | -6.20 | % |
| | | | | | | | | | | | | | | | | | | | | |
| Ratios and supplemental data | | | | | | | | | | | | | | | | | | | | |
| Net assets, end of period (thousands) | | $ | 199,547 | | | $ | 214,190 | | | $ | 192,289 | | | $ | 178,938 | | | $ | 348,351 | |
| Ratio of net expenses to average net assets* | | | 0.70 | % | | | 0.70 | % | | | 0.70 | % | | | 0.70 | % | | | 0.70 | % |
| Ratio of net investment income (loss) to average net assets* | | | 2.22 | % | | | 1.85 | % | | | 2.02 | % | | | 2.29 | % | | | 3.73 | % |
Portfolio turnover rate (c) | | | 31 | % | | | 8 | % | | | 17 | % | | | 56 | % | | | 38 | % |
| * If certain expenses had not been waived or reimbursed by the Investment Adviser, | | | | | | | | | | | | | | | | | | | | |
| total return would have been lower and the ratios would have been as follows: | | | | | | | | | | | | | | | | | | | | |
| Ratio of total expenses to average net assets | | | 0.76 | % | | | 0.78 | % | | | 0.77 | % | | | 0.88 | % | | | 0.73 | % |
| Ratio of net investment income (loss) to average net assets | | | 2.16 | % | | | 1.77 | % | | | 1.95 | % | | | 2.11 | % | | | 3.70 | % |
| (a) | Based on average shares outstanding during the period. |
| (b) | Total investment return is calculated assuming a purchase of a common share at the beginning of the period and a sale on the last day of the period reported at net asset value (“NAV”). Dividends and distributions are assumed to be reinvested at NAV. Total investment return does not reflect brokerage commissions. A return calculated for a period of less than one year is not annualized. |
| (c) | Portfolio turnover is not annualized for periods of less than one year and does not include securities received or delivered from processing creations or redemptions. |
See notes to financial statements.
CLAYMORE EXCHANGE-TRADED FUND TRUST 2 ANNUAL REPORT l 47
| | |
| NOTES TO FINANCIAL STATEMENTS | August 31, 2012 |
Note 1 – Organization:
Claymore Exchange-Traded Fund Trust 2 (the “Trust”), which is registered under the Investment Company Act of 1940, as amended (the “1940 Act”), is an open-end, management investment company that was organized as a Delaware statutory trust on June 8, 2006.
The following six portfolios have an annual reporting period ended on August 31, 2012:
| | Guggenheim ABC High Dividend ETF |
| | Guggenheim Airline ETF |
| | Guggenheim China All-Cap ETF |
| | Guggenheim China Technology ETF |
| | Guggenheim Solar ETF |
| | Guggenheim S&P Global Water Index ETF |
Each portfolio represents a separate series of the Trust (each a “Fund” or collectively the “Funds”). Each Fund’s shares are listed and traded on the NYSE Arca, Inc. (“NYSE Arca”). The Funds’ market prices may differ to some degree from the net asset value (“NAV”) of the shares of each Fund. Unlike conventional mutual funds, each Fund issues and redeems shares on a continuous basis, at NAV, only in a large specified number of shares; each called a “Creation Unit.” Creation Units are issued and redeemed principally in-kind for securities included in the relevant index. Except when aggregated in Creation Units, shares are not individually redeemable securities of the Funds. The investment objective of each of the Funds is to correspond generally to the performance, before fees and expenses, the performance of the following market indices:
| Fund | Index |
| Guggenheim ABC High Dividend ETF | The BNY Mellon ABC Index |
| Guggenheim Airline ETF | NYSE Arca Global Airline Index |
| Guggenheim China All-Cap ETF | AlphaShares China All-Cap Index |
| Guggenheim China Technology ETF | AlphaShares China Technology Index |
| Guggenheim Solar ETF | MAC Global Solar Energy Index |
| Guggenheim S&P Global Water Index ETF | S&P Global Water Index |
Note 2 – Accounting Policies:
The preparation of the financial statements in accordance with U.S. generally accepted accounting principles (“GAAP”) requires management to make estimates and assumptions that affect the reported amounts and disclosures in the financial statements. Actual results could differ from these estimates.
The following is a summary of the significant accounting policies followed by the Funds.
(a) Valuation of Investments Securities listed on an exchange are valued at the last reported sale price on the principal exchange or on the principal over-the-counter market on which such securities are traded, as of the close of regular trading on the New York Stock Exchange (“NYSE”) on the day the securities are being valued or, if there are no sales, at the mean of the most recent bid and asked prices. Equity securities that are traded primarily on the NASDAQ Stock Market are valued at the NASDAQ Official Closing Price. Debt securities are valued at the mean of the last available bid and ask prices for such securities or, if such prices are not available, at prices for securities of comparable maturity, quality and type. If sufficient market activity is limited or does not exist, the pricing providers or broker-dealers may utilize proprietary valuation models which consider market characteristics such as benchmark yield curves, option-adjusted spreads, credit spreads, estimated default rates, coupon rates, anticipated timing of principal repayments, underlying collateral, or other unique security features in order to estimate relevant cash flows, which are then discounted to calculate a security’s fair value. Short-term securities with maturities of 60 days or less at time of purchase are valued at amortized cost, which approximates market value. Money market funds are valued at net asset value.
For those securities where quotations or prices are not available, the valuations are determined in accordance with procedures established in good faith by management and approved by the Board of Trustees of the Trust (the “Board of Trustees”). Valuations in accordance with these procedures are intended to reflect each security’s (or asset’s) “fair value.” Fair value is defined as the price that the Fund would receive to sell an investment or pay to transfer a liability in an orderly transaction with an independent buyer in the principal market, or in the absence of a principal market, the most advantageous market for the investment or liability. Each such determination is based on a consideration of all relevant factors, which are likely to vary from one pricing context to another. Examples of such factors may include, but are not limited to: (i) the type of security, (ii) the initial cost of the security, (iii) the existence of any contractual restrictions on the security’s disposition, (iv) the price and extent of public trading in similar securities of the issuer or of comparable companies, (v) quotations or evaluated prices from broker-dealers and/or pricing services, (vi) information obtained from the issuer, analysts, and/or the appropriate stock exchange (for exchange traded securities), (vii) an analysis of the company’s financial statements, and (viii) an evaluation of the forces that influence the issuer and the market(s) in which the security is purchased and sold (e.g. the existence of pending merger activity, public offerings or tender offers that might affect the value of the security).
There are three different categories for valuations. Level 1 valuations are those based upon quoted prices in active markets. Level 2 valuations are those based upon quoted prices in inactive markets or based upon significant observable inputs (e.g. yield curves; benchmark interest rates; indices). Level 3 valuations are those based upon unobservable inputs (e.g. discounted cash flow analysis; non-market based methods used to determine fair valuation).
The Funds value Level 1 securities using readily available market quotations in active markets. The Funds value Level 2 fixed income securities using independent pricing providers who employ matrix pricing models utilizing market prices, broker quotes and prices of securities with comparable maturities and qualities. The Funds value Level 2 equity securities using various observable market inputs as described above. The fair value estimates for the Level 3 securities are determined in accordance with the Trust’s valuation procedures.
48 l CLAYMORE EXCHANGE-TRADED FUND TRUST 2 ANNUAL REPORT
| | |
| NOTES TO FINANCIAL STATEMENTS continued | August 31, 2012 |
The valuation process involved for Level 3 measurements for the Funds is completed on a daily basis and is designed to subject the Level 3 valuations to an appropriate level of oversight and review. For Level 3 securities, the Funds utilize a Pricing Committee which is comprised of employees of the Investment Adviser or its affiliates responsible for implementing the valuation procedures established by the Funds. Investment professionals prepare preliminary valuations based on their evaluation of financial data, company specific developments, market valuations of comparable companies and other factors. These preliminary valuations are reviewed by the Pricing Committee with subsequent deliberations until an appropriate price is determined for the Level 3 security.
The following tables represent the Funds’ investments carried on the Statement of Assets and Liabilities by caption and by level within the fair value hierarchy at August 31, 2012:
| Guggenheim China All-Cap ETF | | | | | | | | | | | | |
| | | | | | | | | | | | | |
| Description | | Level 1 | | | Level 2 | | | Level 3 | | | Total | |
| (value in $000s) | | | | | | | | | | | | |
| Assets: | | | | | | | | | | | | |
| Common Stock: | | | | | | | | | | | | |
| Basic Materials | | $ | 1,666 | | | $ | – | | | $ | – | † | | $ | 1,666 | |
| Communications | | | 10,787 | | | | – | | | | – | | | | 10,787 | |
| Consumer, Cyclical | | | 2,847 | | | | – | | | | – | | | | 2,847 | |
| Consumer, Non-cyclical | | | 3,722 | | | | 10 | | | | – | | | | 3,732 | |
| Diversified | | | 293 | | | | – | | | | – | | | | 293 | |
| Energy | | | 8,937 | | | | – | | | | – | | | | 8,937 | |
| Financial | | | 16,417 | | | | – | | | | – | | | | 16,417 | |
| Industrial | | | 3,302 | | | | – | | | | – | | | | 3,302 | |
| Technology | | | 507 | | | | – | | | | – | | | | 507 | |
| Utilities | | | 1,262 | | | | – | | | | – | | | | 1,262 | |
Investments of Collateral for Securities Loaned | | | 3,331 | | | | – | | | | – | | | | 3,331 | |
| Total | | $ | 53,071 | | | $ | 10 | | | $ | – | † | | $ | 53,081 | |
The transfers in and out of the valuation levels for the Guggenheim China All-Cap ETF as of the report date when compared to the valuation levels at the end of the previous fiscal year are detailed below.
| | $(000s) |
| Transfers from Level 1 to Level 2 | $ 10 |
| Transfers from Level 2 to Level 3 | –† |
The transfer from Level 1 to Level 2 was the result of Chaoda Modern Agriculture Holdings Ltd. being halted on the principal exchange on which it trades as of August 31, 2012.
The transfer from Level 2 to Level 3 was the result of Real Gold Mining, Ltd. (“Real Gold”) being halted on the principal exchange on which it trades and negative public information on the company.
Trading in the shares of Real Gold was halted on the Hong Kong Stock Exchange on May 27, 2011, pending the release of an announcement in relation to the clarification of news which was price sensitive in nature. The security continues to be halted, and following the release of several negative announcements concerning Real Gold, the Pricing Committee decided to price Real Gold at $0.00 per share. If trading of Real Gold resumes on a primary exchange the value of Real Gold could significantly increase.
Trading in the shares of China Forestry Holdings Co., Ltd. (the “Company”) was halted on the Hong Kong Stock Exchange on January 26, 2011, pending the publication of an announcement in relation to price sensitive information of the Company. Trading on the Company’s shares continues to be halted. Following the release of negative news stories, the Pricing Committee met and, after reviewing the most recently available annual financial results of the Company, decided to price the Company at $0.00 per share. If trading of the Company resumes on a primary exchange, the value of the Company could significantly increase.
The following table presents the activity of the Fund’s investments measured at fair value using significant unobservable inputs (Level 3 valuations) for the year ended August 31, 2012.
| Level 3 Holdings | | Securities | |
| Beginning Balance at 8/31/11 | | $ | – | † |
| Net Realized Gain/Loss | | | – | |
| Change in Unrealized Gain/Loss | | | – | |
| Purchases | | | – | |
| Sales | | | – | |
| Transfers In | | | – | † |
| Transfers Out | | | – | |
| Ending Balance at 8/31/12 | | $ | – | † |
| † Market value is less than minimum amount disclosed. | | | | |
| Guggenheim China Technology ETF | | | | | | | | | | |
| | | | | | | | | | | |
| Description | | Level 1 | | | Level 2 | | | Level 3 | | | Total | |
| (value in $000s) | | | | | | | | | | | | |
| Assets: | | | | | | | | | | | | |
| Common Stock: | | | | | | | | | | | | |
| Basic Materials | | $ | 753 | | | $ | – | | | $ | – | | | $ | 753 | |
| Communications | | | 9,070 | | | | – | | | | – | | | | 9,070 | |
| Consumer, Cyclical | | | 732 | | | | – | | | | – | | | | 732 | |
| Energy | | | 576 | | | | – | | | | – | | | | 576 | |
| Industrial | | | 2,072 | | | | 92 | | | | – | | | | 2,164 | |
| Technology | | | 3,678 | | | | – | | | | – | | | | 3.678 | |
Investments of Collateral for Securities Loaned | | | 1,630 | | | | – | | | | – | | | | 1,630 | |
| Total | | $ | 18,511 | | | $ | 92 | | | $ | – | | | $ | 18,603 | |
The transfers in and out of the valuation levels for the Guggenheim China Technology ETF as of the report date when compared to the valuation levels at the end of the previous fiscal year are detailed below.
| | $(000s) |
| Transfers from Level 1 to Level 2 | $92 |
The transfer from Level 1 to Level 2 was the result of China High Precision Automation Group Ltd. being halted on the principal exchange on which it trades as of August 31, 2012.
CLAYMORE EXCHANGE-TRADED FUND TRUST 2 ANNUAL REPORT l 49
| | |
| NOTES TO FINANCIAL STATEMENTS continued | August 31, 2012 |
| Guggenheim Solar ETF | | | | | | | | | | | | |
| | | | | | | | | | | | | |
| Description | | Level 1 | | | Level 2 | | | Level 3 | | | Total | |
| (value in $000s) | | | | | | | | | | | | |
| Assets: | | | | | | | | | | | | |
| Common Stock: | | | | | | | | | | | | |
| Energy | | $ | 9,572 | | | $ | – | | | $ | – | | | $ | 9,572 | |
| Industrial | | | 15,314 | | | | – | | | | 715 | | | | 16,029 | |
| Technology | | | 17,067 | | | | – | | | | – | | | | 17,067 | |
| Right | | | – | | | | 127 | | | | – | | | | 127 | |
Investments of Collateral for Securities Loaned | | | 19,660 | | | | – | | | | – | | | | 19,660 | |
| Total | | $ | 61,613 | | | $ | 127 | | | $ | 715 | | | $ | 62,455 | |
The transfers in and out of the valuation levels for the Guggenheim Solar ETF as of the report date when compared to the valuation levels at the end of the previous fiscal year are detailed below.
| | $(000s) |
| Transfers from Level 1 to Level 3 | $715 |
The transfer from Level 1 to Level 3 is the result of Trony Solar Holdings Co. Ltd. being halted on the principal exchange on which it trades as of August 31, 2012, the security being priced at a discount of the last trade price and based on the resignation of the Chief Financial Officer of the company.
Trading for Trony Solar Holdings Co. Ltd. has been halted on the primary exchange on which it trades. Following the release of several negative announcements by Trony Solar Holdings Co. Ltd., the Pricing Committee met and priced Trony Solar Holdings Co. Ltd. at $0.06 per share which is at a discount of the last trade price. If trading resumes on the primary exchange on which Trony Solar Holdings Co. Ltd trades, the value of Trony Solar Holdings Co. Ltd. could significantly increase or decrease.
The following table presents the activity of the Fund’s investments measured at fair value using significant unobservable inputs (Level 3 valuations) for the year ended August 31, 2012.
| Level 3 Holdings | | Securities | |
| Beginning Balance at 8/31/11 | | $ | – | |
| Net Realized Gain/Loss | | | – | |
| Change in Unrealized Gain/Loss | | | – | |
| Purchases | | | – | |
| Sales | | | – | |
| Transfers In | | | 715 | |
| Transfers Out | | | – | |
| Ending Balance at 8/31/12 | | $ | 715 | |
| Guggenheim S&P Global Water Index ETF | | | | | | | | | | |
| | | | | | | | | | | |
| Description | | Level 1 | | | Level 2 | | | Level 3 | | | Total | |
| (value in $000s) | | | | | | | | | | | | |
| Assets: | | | | | | | | | | | | |
| Common Stock: | | | | | | | | | | | | |
| Basic Materials | | $ | 6,580 | | | $ | – | | | $ | – | | | $ | 6,580 | |
| Industrial | | | 103,147 | | | | 395 | | | | – | | | | 103,542 | |
| Utilities | | | 89,035 | | | | – | | | | – | | | | 89,035 | |
Investments of Collateral for Securities Loaned | | | 4,734 | | | | – | | | | – | | | | 4,734 | |
| Total | | $ | 203,496 | | | $ | 395 | | | $ | – | | | $ | 203,891 | |
There were no transfers between valuation levels as of the report date when compared to the valuation levels at the end of the previous fiscal year.
All securities held by Guggenheim ABC High Dividend ETF and Guggenheim Airline ETF were valued using quoted prices in active markets (Level 1). There were no transfers between levels for these Funds for the year ended August 31, 2012.
(b) Investment Transactions and Investment Income Investment transactions are accounted for on the trade date. Realized gains and losses on investments are determined on the identified cost basis. Dividend income is recorded net of applicable withholding taxes on the ex-dividend date and interest income is recorded on an accrual basis. Discounts on debt securities purchased are accreted to interest income over the lives of the respective securities using the effective interest method. Premiums on debt securities purchased are amortized to interest income up to the next call date of the respective securities using the effective interest method.
The Funds record the character of dividends received from master limited partnerships (“MLPs”) based on estimates made at the time such distributions are received. These estimates are based upon a historical review of information available from each MLP and other industry sources. The characterization of the estimates may subsequently be revised based on information received from MLPs after their tax reporting periods conclude.
Real Estate Investment Trust (“REIT”) distributions received by a Fund are generally comprised of ordinary income, long-term and short-term capital gains and return of capital. The actual character of amounts received during the year is not known until after the fiscal year end. A Fund records the character of distributions received from REITs during the year based on historical information available. A Fund’s characterization may be subsequently revised based on information received from REITs after their tax reporting periods conclude.
(c) Currency Translation Assets and liabilities denominated in foreign currencies are translated into U.S. dollars at the mean of the bid and asked price of respective exchange rates on the last day of the period. Purchases and sales of investments denominated in foreign currencies are translated at the mean of the bid and asked price of respective exchange rates on the date of the transaction.
50 l CLAYMORE EXCHANGE-TRADED FUND TRUST 2 ANNUAL REPORT
| | |
| NOTES TO FINANCIAL STATEMENTS continued | August 31, 2012 |
The Funds do not isolate that portion of the results of operations resulting from changes in foreign exchange rates on investments from the fluctuations arising from changes in market prices of securities held. Such fluctuations are included with the net realized and unrealized gain or loss from investments.
Foreign exchange gain or loss resulting from holding of a foreign currency, expiration of a currency exchange contract, difference in exchange rates between the trade date and settlement date of an investment purchased or sold, and the difference between dividends actually received compared to the amount shown in a Fund’s accounting records on the date of receipt are included as net realized gains or losses on foreign currency transactions in the Fund’s Statement of Operations.
Foreign exchange gain or loss on assets and liabilities, other than investments, are included in unrealized appreciation/(depreciation) on foreign currency translations.
(d) Distributions The Funds intend to pay substantially all of their net investment income to shareholders through annual distributions, except for Guggenheim ABC High Dividend ETF, which will pay a quarterly distribution. In addition, the Funds intend to distribute any capital gains to shareholders as capital gain dividends at least annually. The amount and timing of distributions are determined in accordance with federal income tax regulations, which may differ from GAAP.
(e) Security Lending Each Fund may lend portfolio securities to certain creditworthy borrowers, including the Funds’ securities lending agent. The loans are collateralized at all times by cash and/or high grade debt obligations in an amount at least equal to 102% of the market value of domestic securities loaned and 105% of foreign securities loaned as determined at the close of business on the preceding business day. The cash collateral received is invested with the securities lending agent in an overnight securities lending fund. The overnight securities lending fund is comprised of short-term investments valued at amortized cost, which approximates market value. Each Fund receives compensation for lending securities from interest or dividends earned on the cash, cash equivalents or U.S. government securities held as collateral, net of fee rebates paid to the borrower plus reasonable administrative and custody fees. Such compensation is accrued daily and payable to the Fund monthly. The dividend and interest income earned on the securities loaned is accounted for in the same manner as other dividend and interest income. The borrower pays to the Funds an amount equal to any dividends or interest received on loaned securities. These payments from the borrower are not eligible for reduced tax rates as “qualified dividend income” under the Jobs and Growth Tax Reconciliation Act of 2003. The Funds retain all or a portion of the interest received on investment of cash collateral or receives a fee from the borrower. Lending portfolio securities could result in a loss or delay in recovering each Fund’s securities if the borrower defaults. The securities lending income earned by the Funds is disclosed on the Statement of Operations.
Note 3 – Investment Advisory Agreement and Other Agreements:
Pursuant to an Investment Advisory Agreement (the “Agreement”) between the Trust, on behalf of each Fund, and Guggenheim Funds Investment Advisors, LLC (the “Investment Adviser”), the Investment Adviser manages the investment and reinvestment of each Fund’s assets and administers the affairs of each Fund to the extent requested by the Board of Trustees.
Pursuant to the Agreement, each Fund listed in the below table pays the Investment Adviser an advisory fee. The advisory fee is payable on a monthly basis at the annual rate set forth below based on each Fund’s average daily net assets:
| Fund | Rate |
| Guggenheim Airline ETF | 0.50% |
| Guggenheim Solar ETF | 0.50% |
| Guggenheim S&P Global Water Index ETF | 0.50% |
Pursuant to the Agreement, each Fund listed in the following table pays the Investment Adviser a unitary management fee for the services and facilities it provides. The unitary management fee is payable on a monthly basis at the annual rate set forth below based on each Fund’s average daily net assets:
| Fund | Rate |
| Guggenheim ABC High Dividend ETF | 0.65% |
| Guggenheim China All-Cap ETF | 0.70% |
| Guggenheim China Technology ETF | 0.70% |
Out of the unitary management fee, the Investment Adviser pays substantially all the expenses of each Fund, including the cost of transfer agency, custody, fund administration, legal, audit and other services, except for the fee payments under the Agreement, distribution fees, if any, brokerage expenses, taxes, interest, litigation expenses and other extraordinary expenses.
Under a separate Fund Administration Agreement, the Investment Adviser provides Fund Administration services to the Funds. The Investment Adviser receives a fund administration fee payable monthly at the annual rate set forth below as a percentage of the average daily net assets of each Fund:
| Net Assets | Rate |
| First $200,000,000 | 0.0275% |
| Next $300,000,000 | 0.0200% |
| Next $500,000,000 | 0.0150% |
| Over $1,000,000,000 | 0.0100% |
Due to their unitary fee structure, Guggenheim ABC High Dividend ETF, Guggenheim China All-Cap ETF and Guggenheim China Technology ETF do not pay a separate Fund Administration fee.
CLAYMORE EXCHANGE-TRADED FUND TRUST 2 ANNUAL REPORT l 51
| | |
| NOTES TO FINANCIAL STATEMENTS continued | August 31, 2012 |
For the year ended August 31, 2012, the following Funds recognized Fund Administration expenses and waived Fund Administration expenses as follows:
| | | Fund Administration | | | Fund Administration | |
| | | Expense | | | Expense Waived | |
| Guggenheim Airline ETF | | $ | 4,419 | | | $ | 4,419 | |
| Guggenheim Solar ETF | | | 18,403 | | | | – | |
| Guggenheim S&P Global Water Index ETF | | | 52,676 | | | | – | |
The Bank of New York Mellon Corp. (“BNY”) acts as the Funds’ custodian, accounting agent, transfer agent and security lending agent. As custodian, BNY is responsible for the custody of the Funds’ assets. As accounting agent, BNY is responsible for maintaining the books and records of the Funds. As transfer agent, BNY is responsible for performing transfer agency services for the Funds. As security lending agent, BNY is responsible for executing the lending of portfolio securities to creditworthy borrowers.
The Investment Adviser has contractually agreed to waive fees and/or pay Fund expenses to the extent necessary to prevent the operating expenses of each Fund, not including Guggenheim ABC High Dividend ETF, Guggenheim China All-Cap ETF and Guggenheim China Technology ETF (excluding interest expense, a portion of the Fund’s licensing fees, offering costs, brokerage commissions and other trading expenses, taxes and extraordinary expenses such as litigation and other expenses not incurred in the ordinary course of the Fund’s business) from exceeding the following percentages of average net assets per year, at least until December 31, 2015:
| | |
| Fund | Rate |
| Guggenheim Airline ETF | 0.65% |
| Guggenheim Solar ETF | 0.65% |
| Guggenheim S&P Global Water Index ETF | 0.65% |
Amounts owed to each Fund from the Investment Adviser are shown in the Statement of Assets and Liabilities.
The Trust and the Investment Adviser have entered into an Expense Reimbursement Agreement in which for a period of five years subsequent to each Fund’s commencement of operations, the Investment Adviser may recover from the Fund fees and expenses waived or reimbursed during the prior three years if the Fund’s expense ratio, including the recovered expenses, falls below the expense cap.
For the year ended August 31, 2012, the Investment Adviser waived fees and assumed the following fees and expenses:
| | | | | | Potentially | |
| | | | | | Recoverable | |
| | | | | | Expenses Expiring | |
| | | | | | 2013 | |
| Guggenheim Airline ETF | | $ | 80,346 | | | $ | 284,707 | * |
| Guggenheim Solar ETF | | | 205,736 | | | | * | * |
| Guggenheim S&P Global | | | | | | | | |
| Water Index ETF | | | 112,691 | | | | * | * |
* Per the Expense Reimbursement Agreement discussed above, this year represents the last year the Fund will be eligible to recover fees and expenses.
** The Expense Reimbursement Agreement for this Fund has expired.
Certain officers and trustees of the Trust may also be officers, directors and/or employees of the Investment Adviser. The Trust does not compensate its officers or trustees who are officers, directors and/or employees of the Investment Adviser.
Licensing Fee Agreements: The Investment Adviser has entered into licensing agreements on behalf of each Fund with the following Licensors:
| Fund | Licensor |
| Guggenheim ABC High Dividend ETF | The Bank of New York Mellon |
| Guggenheim Airline ETF | Archipelago Holdings, Inc. |
| Guggenheim China All-Cap ETF | AlphaShares, LLC |
| Guggenheim China Technology ETF | AlphaShares, LLC |
| Guggenheim Solar ETF | MAC Indexing LLC |
| Guggenheim S&P Global Water Index ETF | Standard & Poor’s, a division of |
| | The McGraw-Hill Companies, Inc. |
The Funds are not sponsored, endorsed, sold or promoted by the Licensors and the Licensors make no representation regarding the advisability of investing in shares of the Funds. Up to 5 basis points of licensing fees are excluded from the expense cap for the Funds without a unitary fee.
Note 4 – Federal Income Taxes:
The Funds intend to comply with the requirements of Subchapter M of the Internal Revenue Code of 1986, as amended, applicable to regulated investment companies. Accordingly, no provision for U.S. federal income taxes is required. In addition, by distributing substantially all of its ordinary income and long-term capital gains, if any, during each calendar year, each Fund intends not to be subject to U.S. federal excise tax.
52 l CLAYMORE EXCHANGE-TRADED FUND TRUST 2 ANNUAL REPORT
| | |
| NOTES TO FINANCIAL STATEMENTS continued | August 31, 2012 |
At August 31, 2012, the cost of investments, accumulated unrealized appreciation/depreciation on investments, excluding foreign currency, for federal income tax purposes were as follows:
| | | | | | | | | | | | | | | Net Tax | |
| | | | | | | | | | | | | | | Unrealized | |
| | | | | | | | | | | | Net Tax | | | Appreciation | |
| | | Cost of | | | Gross Tax | | | Gross Tax | | | Unrealized | | | (Depreciation | ) |
| | | Investments for | | | Unrealized | | | Unrealized | | | Appreciation | | | on Foreign | |
| | | Tax Purposes | | | Appreciation | | | Depreciation | | | (Depreciation | ) | | Currency | |
| Guggenheim ABC High Dividend ETF | | $ | 14,451,237 | | | $ | 278,636 | | | $ | (2,013,484 | ) | | $ | (1,734,848 | ) | | $ | (214 | ) |
| Guggenheim Airline ETF | | | 18,386,726 | | | | 660,174 | | | | (2,529,377 | ) | | | (1,869,203 | ) | | | (499 | ) |
| Guggenheim China All-Cap ETF | | | 64,953,488 | | | | 3,717,461 | | | | (15,589,768 | ) | | | (11,872,307 | ) | | | 214 | |
| Guggenheim China Technology ETF | | | 25,674,878 | | | | 1,173,118 | | | | (8,244,724 | ) | | | (7,071,606 | ) | | | – | |
| Guggenheim Solar ETF | | | 158,518,540 | | | | 127,469 | | | | (96,190,796 | ) | | | (96,063,327 | ) | | | (2,973 | ) |
| Guggenheim S&P Global Water Index ETF | | | 199,892,540 | | | | 27,295,145 | | | | (23,296,842 | ) | | | 3,998,303 | | | | (8,598 | ) |
Tax components of the following balances as of August 31, 2012 were as follows:
| | | | | | Undistributed | |
| | | Undistributed | | | Long-Term | |
| | | Ordinary | | | Gains/ | |
| | | Income/ | | | (Accumulated | |
| | | (Accumulated | | | Capital & | |
| | | Ordinary Loss) | | | Other Loss) | |
| Guggenheim ABC High Dividend ETF | | $ | 114,509 | | | $ | (1,235,557 | ) |
| Guggenheim Airline ETF | | | – | | | | (4,358,660 | ) |
| Guggenheim China All-Cap ETF | | | 904,260 | | | | (3,928,009 | ) |
| Guggenheim China Technology ETF | | | 308,458 | | | | (6,622,735 | ) |
| Guggenheim Solar ETF | | | 3,215,184 | | | | (238,166,625 | ) |
| Guggenheim S&P Global Water Index ETF | | | 3,574,246 | | | | (87,533,672 | ) |
At August 31, 2012, the following reclassifications were made to the capital accounts of the Funds, to reflect permanent book/tax differences and income and gains available for distributions under income tax regulations, which are primarily due to the inherent differences between book and tax treatment of investments in real estate investment trusts, investments in partnerships, redemption in-kind transactions, return of capital, and net investment loss. Net investment income, net realized gains and net assets were not affected by these changes.
| | | Undistributed | | | Accumulated | | | | |
| | | Net Investment | | | Net Realized | | | | |
| | | Income/(Loss) | | | Gain/(Loss) | | | Paid in Capital | |
| Guggenheim ABC | | | | | | | | | |
| High Dividend ETF | | $ | (21,198 | ) | | $ | 24,940 | | | $ | (3,742 | ) |
| Guggenheim Airline ETF | | | 172,359 | | | | 54,528 | | | | (226,887 | ) |
| Guggenheim China | | | | | | | | | | | | |
| All-Cap ETF | | | 6,843 | | | | 1,503,732 | | | | (1,510,575 | ) |
| Guggenheim China | | | | | | | | | | | | |
| Technology ETF | | | 11,414 | | | | (973,605 | ) | | | 962,191 | |
| Guggenheim Solar ETF | | | (31,956 | ) | | | 20,429,994 | | | | (20,398,038 | ) |
| Guggenheim S&P Global | | | | | | | | | | | | |
| Water Index ETF | | | (84,642 | ) | | | (5,939,540 | ) | | | 6,024,182 | |
Distributions to Shareholders: The tax character of distributions paid during the year ended August 31, 2012 was as follows:
| Distributions paid from Ordinary Income | |
| Guggenheim ABC High Dividend ETF | | $ | 453,500 | |
| Guggenheim Airline ETF | | | 164,933 | |
| Guggenheim China All-Cap ETF | | | 1,450,000 | |
| Guggenheim China Technology ETF | | | 593,250 | |
| Guggenheim Solar ETF | | | 4,861,440 | |
| Guggenheim S&P Global Water Index ETF | | | 3,994,920 | |
| Distributions paid from Return of Capital | |
| Guggenheim Airline ETF | | $ | 2,817 | |
The tax character of distributions paid during the year ended August 31, 2011 was as follows:
| Distributions paid from Ordinary Income | |
| Guggenheim ABC High Dividend ETF | | $ | – | |
| Guggenheim Airline ETF | | | 26,600 | |
| Guggenheim China All-Cap ETF | | | 874,200 | |
| Guggenheim China Technology ETF | | | 179,550 | |
| Guggenheim Solar ETF | | | 575,360 | |
| Guggenheim S&P Global Water Index ETF | | | 4,420,200 | |
At August 31, 2012, for federal income tax purposes, the Funds have capital loss carryforwards available as shown in the table below, to the extent provided by the regulations, to offset future capital gains through the years indicated. To the extent that these loss carryforwards are used to offset future capital gains, it is probable that the capital gains so offset will not be distributed to shareholders. Per the Regulated Investment Company Modernization Act of 2010 capital loss carryforwards generated in taxable years beginning after December 22, 2010 must be fully used before capital loss carryforwards generated in taxable years prior to December 22, 2010 are used; therefore, under certain circumstances, capital loss carryforwards available as of the report date, may expire unused.
CLAYMORE EXCHANGE-TRADED FUND TRUST 2 ANNUAL REPORT l 53
| | |
| NOTES TO FINANCIAL STATEMENTS continued | August 31, 2012 |
| | | | | | | | | | | | | | | | | | | |
| | | Capital Loss | | | Capital Loss | | | Capital Loss | | | Unlimited | | | Unlimited | | | | |
| | | Expiring in | | | Expiring in | | | Expiring in | | | Short-Term | | | Long-Term | | | | |
| | | 2017 | | | 2018 | | | 2019 | | | Capital Loss | | | Capital Loss | | | Total | |
| Guggenheim ABC High Dividend ETF | | $ | – | | | $ | – | | | $ | – | | | $ | 68,225 | | | $ | – | | | $ | 68,225 | |
| Guggenheim Airline ETF | | | – | | | | 53,969 | | | | 833,950 | | | | 414,007 | | | | 234,775 | | | | 1,536,701 | |
| Guggenheim China All-Cap ETF | | | – | | | | 29,627 | | | | 853,049 | | | | 415,427 | | | | 783,940 | | | | 2,082,043 | |
| Guggenheim China Technology ETF | | | – | | | | – | | | | 188,097 | | | | 2,199,381 | | | | 775,106 | | | | 3,162,584 | |
| Guggenheim Solar ETF | | | 6,030,482 | | | | 118,836,026 | | | | 21,764,929 | | | | 6,127,315 | | | | 39,400,192 | | | | 192,158,944 | |
| Guggenheim S&P Global Water Index ETF | | | 31,879,617 | | | | 38,476,281 | | | | 16,548,141 | | | | 629,633 | | | | – | | | | 87,533,672 | |
Capital and foreign currency losses incurred after October 31 (“post-October losses”) within the taxable year are deemed to arise on the first business day of each Fund’s next taxable year. During the year ended August 31, 2012, the following Funds incurred and will elect to defer the following current year post-October losses as though the losses were incurred on the first day of the next fiscal year.
| | | Post-October | |
| | | Capital Losses | |
| Guggenheim ABC High Dividend ETF | | $ | 1,167,332 | |
| Guggenheim Airline ETF | | | 2,821,959 | |
| Guggenheim China All-Cap ETF | | | 1,845,966 | |
| Guggenheim China Technology ETF | | | 3,460,151 | |
| Guggenheim Solar ETF | | | 46,007,681 | |
| Guggenheim S&P Global Water Index ETF | | | – | |
For all open tax years and all major jurisdictions, management of the Trust has concluded that there are no significant uncertain tax positions that would require recognition in the financial statements. Uncertain tax positions are tax positions taken or expected to be taken in the course of preparing each Fund’s tax returns that would not meet a more-likely-than-not threshold of being sustained by the applicable tax authority and would be recorded as a tax expense in the current year. Open tax years are those that are open for examination by taxing authorities (i.e. generally the last four tax year ends and the interim tax period since then). Furthermore, management of the Trust is also not aware of any tax positions for which it is reasonably possible that the total amounts of unrecognized tax benefits will significantly change in the next twelve months.
Note 5 - Investment Transactions:
For the year ended August 31, 2012, the cost of investments purchased and proceeds from sales of investments, excluding short-term investments and in-kind transactions, were as follows:
| | | Purchases | | | Sales | |
| Guggenheim ABC High Dividend ETF | | $ | 8,330,982 | | | $ | 8,354,870 | |
| Guggenheim Airline ETF | | | 8,018,091 | | | | 8,369,281 | |
| Guggenheim China All-Cap ETF | | | 7,010,648 | | | | 7,136,692 | |
| Guggenheim China Technology ETF | | | 10,320,516 | | | | 10,232,004 | |
| Guggenheim Solar ETF | | | 34,776,866 | | | | 32,897,200 | |
| Guggenheim S&P Global Water Index ETF | | | 60,974,168 | | | | 59,406,408 | |
| For the year ended August 31, 2012, in-kind transactions were as follows: | |
| | | Purchases | | | Sales | |
| Guggenheim ABC High Dividend ETF | | $ | 9,911,776 | | | $ | 3,926,417 | |
| Guggenheim Airline ETF | | | 2,732,243 | | | | 5,240,450 | |
| Guggenheim China All-Cap ETF | | | – | | | | 12,680,494 | |
| Guggenheim China Technology ETF | | | 4,308,894 | | | | 13,016,768 | |
| Guggenheim Solar ETF | | | 42,974,487 | | | | 26,759,887 | |
| Guggenheim S&P Global Water Index ETF | | | 23,214,506 | | | | 45,870,421 | |
Note 6 – Capital:
Shares are issued and redeemed by the Funds only in creation unit size aggregations of 50,000 to 100,000 shares. Transactions are permitted on an in-kind basis, with a separate cash payment, which is balancing each component to equate the transaction to the net asset value per share of the Fund on the transaction date. Transaction fees ranging from $500 to $3,000 are charged to those persons creating or redeeming creation units. An additional charge of up to four times the transaction fee may be imposed with respect to transactions effected outside of the clearing process or to the extent that cash is used in lieu of securities to purchase creation units or redeem for cash.
The Guggenheim Solar ETF completed a 1 for 10 reverse stock split prior to the opening of trading on the NYSE Arca on February 15, 2012. The effect of the reverse stock split was to decrease the number of shares outstanding and increase the net asset value. The reverse stock split did not impact the net assets of Guggenheim Solar ETF. The Guggenheim Solar ETF had 29,680,000 issued and outstanding prior to the reverse stock split and 2,968,000 shares issued and outstanding after the reverse stock split. As of August 31, 2012, the Guggenheim Solar ETF had 2,568,000 shares issued and outstanding.
Note 7 - Distribution and Service Plan:
The Board of Trustees has adopted a distribution and service plan (the “Plan”) pursuant to Rule 12b-1 under the 1940 Act. Under the Plan, each Fund is authorized to pay distribution fees in connection with the sale and distribution of its shares and pay service fees in connection with the provision of ongoing services to shareholders of each Fund and the maintenance of shareholder accounts in an amount up to 0.25% of its average daily net assets each year. No 12b-1 fees are currently paid by the Funds, and there are no current plans to impose these fees. No such fee may be paid in the future without further approval by the Board of Trustees.
54 l CLAYMORE EXCHANGE-TRADED FUND TRUST 2 ANNUAL REPORT
| | |
| NOTES TO FINANCIAL STATEMENTS continued | August 31, 2012 |
Note 8 – Indemnifications:
In the normal course of business, the Funds enter into contracts that contain a variety of representations, which provide general indemnifications. Each Fund’s maximum exposure under these arrangements is unknown, as this would require future claims that may be made against a Fund that have not yet occurred. However, the Funds expect the risk of loss to be remote.
Note 9 – Regulatory Matters:
The Investment Adviser has notified the Trust of the following: In 2009, the Securities and Exchange Commission (“SEC”) staff conducted an examination of the Investment Adviser and in 2010 reported to the Investment Adviser that the SEC staff believed certain deficiencies existed in connection with the management of a liquidated closed-end fund formerly advised by the Investment Adviser and a third-party sub-adviser. In April 2012, the Investment Adviser and a current and a former employee of the Investment Adviser each received separate letters from the SEC staff (commonly referred to as a Wells Notice) stating that the staff intends to recommend to the SEC that action be brought against the Investment Adviser and the current and former employee for allegedly failing to cause the fund to adequately disclose certain investments made by the fund and providing the recipients of the letters with an opportunity to respond to the potential allegations.
The Investment Adviser has replied to the Wells Notice and responded to the SEC staff’s allegations. Although there can be no assurance as to this outcome, the Investment Adviser has advised the Trust that it believes its disclosures were proper and that resolution of this matter will not materially and adversely affect its financial condition or its ability to act as Investment Adviser to the Trust.
Note 10 – Subsequent Event:
The Funds evaluated subsequent events through the date the financial statements were available for issue and determined there were no additional material events that would require disclosure in the Funds’ financial statements, except as noted below.
Subsequent to August 31, 2012, the Board of Trustees declared the following dividends payable on September 28, 2012, to shareholders of record on September 26, 2012. The dividend rate per share was as follows:
| Fund | Rate |
| Guggenheim ABC High Dividend ETF | $0.232 |
CLAYMORE EXCHANGE-TRADED FUND TRUST 2 ANNUAL REPORT l 55
| | |
| REPORT OF INDEPENDENT REGISTERED PUBLIC ACCOUNTING FIRM | August 31, 2012 |
The Board of Trustees and Shareholders of
Claymore Exchange-Traded Fund Trust 2
We have audited the accompanying statements of assets and liabilities of Guggenheim ABC High Dividend ETF, Guggenheim Airline ETF, Guggenheim China All-Cap ETF, Guggenheim China Technology ETF, Guggenheim Solar ETF, and Guggenheim S&P Global Water Index ETF (six of the funds constituting Claymore Exchange-Traded Fund Trust 2) (collectively, the Funds), including the portfolios of investments, as of August 31, 2012, and the related statements of operations, the statements of changes in net assets and financial highlights for the periods indicated therein. These financial statements and financial highlights are the responsibility of the Funds’ management. Our responsibility is to express an opinion on these financial statements and financial highlights based on our audits.
We conducted our audits in accordance with the standards of the Public Company Accounting Oversight Board (United States). Those standards require that we plan and perform the audits to obtain reasonable assurance about whether the financial statements and financial highlights are free of material misstatement. We were not engaged to perform an audit of the Funds’ internal control over financial reporting. Our audits included consideration of internal control over financial reporting as a basis for designing audit procedures that are appropriate in the circumstances, but not for the purpose of expressing an opinion on the effectiveness of the Funds’ internal control over financial reporting. Accordingly, we express no such opinion. An audit also includes examining, on a test basis, evidence supporting the amounts and disclosures in the financial statements and financial highlights, assessing the accounting principles used and significant estimates made by management, and evaluating the overall financial statement presentation. Our procedures included confirmation of securities owned as of August 31, 2012, by correspondence with the custodian and brokers. We believe that our audits provide a reasonable basis for our opinion.
In our opinion, the financial statements and financial highlights referred to above present fairly, in all material respects, the financial position of each of the respective six Funds constituting Claymore Exchange-Traded Fund Trust 2 at August 31, 2012, and the results of their operations, the changes in their net assets and financial highlights for the periods indicated therein, in conformity with U.S. generally accepted accounting principles.
Chicago, Illinois
October 29, 2012
56 l CLAYMORE EXCHANGE-TRADED FUND TRUST 2 ANNUAL REPORT
| | |
| SUPPLEMENTAL INFORMATION (Unaudited) | August 31, 2012 |
Federal Income Tax Information
The Trust intends to designate the maximum amount of dividends that qualify for the reduced tax rate pursuant to the Jobs and Growth Tax Relief Reconciliation Act of 2003.
In January 2013, shareholders will be advised on IRS Form 1099 DIV or substitute 1099DIV as to the federal tax status of the distributions received by shareholders in the calendar year 2012.
Guggenheim ABC High Dividend ETF intends to designate $28,614 of foreign tax withholding on foreign source income of $547,700.
Guggenheim China All-Cap ETF intends to designate $130,224 of foreign tax withholding on foreign source income of $1,660,868.
Guggenheim S&P Global Water Index ETF intends to designate $67,657 of foreign tax withholding on foreign source income of $2,441,616.
The Trust’s investment income (dividend income plus short-term gain, if any) qualifies as follows:
| | Qualified | Dividend |
| | dividend income | received deduction |
| Guggenheim ABC High Dividend ETF | 85.09% | 0.00% |
| Guggenheim Airline ETF | 73.87% | 10.96% |
| Guggenheim China All-Cap ETF | 84.69% | 0.00% |
| Guggenheim China Technology ETF | 11.52% | 0.00% |
| Guggenheim Solar ETF | 2.32% | 0.00% |
| Guggenheim S&P Global Water Index ETF | 100.00% | 31.68% |
Trustees
The Trustees of the Trust and their principal business occupations during the past five years:
| | | | Number of Funds | |
| Name, Address*, Year | Term of Office** | | in the Fund | |
| of Birth and Position(s) | and Length | Principal Occupation during the Past Five Years | Complex*** | Other Directorships Held |
| Held with Registrant | of Time Served | and Other Affiliations | Overseen by Trustee | by Trustee |
| Independent Trustees: | | | | |
| Randall C. Barnes | Since 2006 | Private Investor (2001-present). Formerly, Senior Vice President and | 55 | None |
| Year of Birth: 1951 | | Treasurer, PepsiCo, Inc. (1993-1997), President, Pizza Hut International | | |
| Trustee | | (1991-1993) and Senior Vice President, Strategic Planning and New | | |
| | | Business Development of PepsiCo, Inc. (1987-1990). | | |
| Roman Friedrich III | Since 2010 | Founder and President of Roman Friedrich & Company, a US and Canadian- | 50 | Director of First Americas Gold |
| Year of Birth: 1946 | | based business, which provides investment banking to the mining industry | | Corp. (2012-present), Zincore |
| Trustee | | (1998-present). Formerly, Senior Managing Director of MLV & Co., LLC, | | Metals, Inc. (2009 – present). |
| | | an investment bank and institutional broker-dealer specializing in capital | | Previously, Director of Blue Sky |
| | | intensive industries such as energy, metals and mining (2010-2011). | | Uranium Corp. (formerly |
| | | | | Windstorm Resources Inc.) (April |
| | | | | 2011 – July 2012); Director of |
| | | | | Axiom Gold and Silver Corp. (2011- |
| | | | | 2012), Stratagold Corp. |
| | | | | (2003-2009); Gateway Gold Corp. |
| | | | | (2004-2008) and GFM Resources |
| | | | | Ltd. (2005-2010). |
| Robert B. Karn III | Since 2010 | Consultant (1998-present). Previously, Managing Partner, Financial and | 50 | Director of Peabody Energy |
| Year of Birth: 1942 | | Economic Consulting, St. Louis office of Arthur Andersen, LLP (1965-1998). | | Company (2003-present), GP |
| Trustee | | | | Natural Resource Partners LLC |
| | | | | (2002-present). |
| Ronald A. Nyberg | Since 2006 | Partner of Nyberg & Cassioppi, LLC, a law firm specializing in corporate law, | 57 | None |
| Year of Birth: 1953 | | estate planning and business transactions (2000-present). Formerly, Executive | |
| Trustee | | Vice President, General Counsel and Corporate Secretary of Van Kampen | | |
| | | Investments (1982-1999). | | |
| Ronald E. Toupin, Jr. | Since 2006 | Portfolio Consultant (2010-present). Formerly, Vice President, Manager and | 54 | Trustee, Bennett Group of Funds |
| Year of Birth: 1958 | | Portfolio Manager of Nuveen Asset Management (1998-1999), Vice President | | (2011-present). |
| Trustee | | of Nuveen Investment Advisory Corp. (1992-1999), Vice President and Manager | |
| | | of Nuveen Unit Investment Trusts (1991-1999), and Assistant Vice President and | |
| | | Portfolio Manager of Nuveen Unit Investment Trusts (1988-1999), each of John | |
| | | Nuveen & Co., Inc. (1982-1999). | | |
CLAYMORE EXCHANGE-TRADED FUND TRUST 2 ANNUAL REPORT l 57
| | |
| SUPPLEMENTAL INFORMATION (Unaudited) continued | August 31, 2012 |
| | | | | |
| | | | Number of Funds | |
| Name, Address*, Year | Term of Office** | | in the Fund | |
| of Birth and Position(s) | and Length | Principal Occupation during the Past Five Years | Complex*** | Other Directorships Held |
| Held with Registrant | of Time Served | and Other Affiliations | Overseen by Trustee | by Trustee |
| Interested Trustee: | | | | |
| Donald C. Cacciapaglia† | Since 2012 | Senior Managing Director of Guggenheim Investments; President and | 50 | Trustee, Rydex Dynamic Funds, |
| Year of Birth: 1951 | | Chief Executive Officer of Guggenheim Funds Distributors, LLC and | | Rydex ETF Trust, Rydex Series |
| Trustee, Chief | | President and Chief Executive Officer of Guggenheim Funds Investment | | Funds and Rydex Variable Trust |
| Executive Officer | | Advisors, LLC (2010 – present); Chief Executive Officer of funds in the | | (2012-present); Independent |
| | | Fund Complex and President and Chief Executive Officer of funds in the | | Board Member, Equitrust Life |
| | | Rydex fund complex (2012-present). Formerly, Chief Operating Officer of | | Insurance Company, Guggenheim |
| | | Guggenheim Partners Asset Management, LLC (2010 – 2011); Chairman | | Life and Annuity Company, and |
| | | and CEO of Channel Capital Group Inc. and Channel Capital Group LLC | | Paragon Life Insurance Company |
| | | (2002-2010); Managing Director of PaineWebber (1996-2002). | | of Indiana. (2011-present). |
| * | Address for all Trustees: 2455 Corporate West Drive, Lisle, IL 60532 |
| ** | This is the period for which the Trustee began serving the Trust. Each Trustee is expected to serve an indefinite term, until his successor is elected. |
| *** As of period end. The Guggenheim Funds Fund Complex consists of U.S. registered investment companies advised or serviced by Guggenheim Funds Investment Advisors, LLC and/or |
| | Guggenheim Funds Distributors, LLC. The Guggenheim Funds Fund Complex is overseen by multiple Boards of Trustees. |
| † | Mr. Donald C. Cacciapaglia is an “interested person” (as defined in section 2(a)(19) of the 1940 Act) (“Interested Trustee”) of the Trust because of his position as the President and CEO of the Investment Adviser and the Distributor. |
Principal Executive Officers
The Principal Executive Officers of the Trust, who are not trustees, and their principal occupations during the past five years:
| | | |
| Name, Address*, Year of Birth and | Term of Office** and | Principal Occupations During the Past Five Years and |
| Position(s) held with Registrant | Length of Time Served | Other Affiliations |
| Officers: | | |
| Kevin M. Robinson | Since 2008 | Senior Managing Director and General Counsel of Guggenheim Funds Investment Advisors, LLC, Guggenheim Funds |
| Year of Birth: 1959 | | Distributors, LLC and Guggenheim Funds Services LLC (2007-present). Chief Legal Officer and /or Chief Executive |
| Chief Legal Officer | | Officer of certain other funds in the Fund Complex. Formerly, Associate General Counsel and Assistant Corporate |
| | | Secretary of NYSE Euronext, Inc. (2000-2007). |
| John Sullivan | Since 2010 | Senior Managing Director of Guggenheim Funds Investment Advisors, LLC and Guggenheim Funds Distributors, |
| Year of Birth: 1955 | | LLC (2010-present). Chief Financial Officer, Chief Accounting Officer and Treasurer of certain other funds in the |
| Chief Accounting Officer, | | Fund Complex. Formerly, Chief Compliance Officer, Van Kampen Funds (2004-2010). |
| Chief Financial Officer | | |
| and Treasurer | | |
| Joanna M. Catalucci | Since 2012*** | Interim Chief Compliance Officer of certain funds in the Fund Complex; and Managing Director of Compliance and Fund |
| Year of Birth: 1966 | | Board Relations, Guggenheim Investments (2012-present). Formerly, Chief Compliance Officer & Secretary, SBL Fund; |
| Interim Chief Compliance Officer | | Security Equity Fund; Security Income Fund; Security Large Cap Value Fund & Security Mid Cap Growth Fund; Vice |
| | | President, Rydex Holdings, LLC; Vice President, Security Benefit Asset Management Holdings, LLC; and Senior Vice |
| | | President & Chief Compliance Officer, Security Investors, LLC (2010-2012); Security Global Investors, LLC, Senior Vice |
| | | President (2010-2011); Rydex Advisors, LLC (f/k/a PADCO Advisors, Inc.) and Rydex Advisors II, LLC (f/k/a PADCO |
| | | Advisors II, Inc.), Chief Compliance Officer and Senior Vice President (2010-2011); Rydex Capital Partners I, LLC & Rydex |
| | | Capital Partners II, LLC, Chief Compliance Officer (2006-2007); and Rydex Fund Services, LLC (f/k/a Rydex Fund Services, |
| | | Inc.), Vice President (2001-2006). |
| Mark E. Mathiasen | Since 2011 | Director, Associate General Counsel of Guggenheim Funds Services, LLC (2012-present). Secretary of certain other funds |
| Year of Birth: 1978 | | in the Fund Complex.Formerly, Vice President; Assistant General Counsel of Guggenheim Funds Services LLC |
| Secretary | | (2007-2012). |
| Stevens T. Kelly | Since 2012 | Assistant General Counsel of Guggenheim Funds Services, LLC (2011 to present). Assistant Secretary of certain |
| Year of Birth: 1982 | | other funds in the Fund Complex. Formerly, Associate at K&L Gates LLP (2008-2011), J.D., University of Wisconsin |
| Assistant Secretary | | Law School (2005-2008). |
| William H. Belden, III | Since 2006 | Managing Director of Guggenheim Funds Investment Advisors, LLC (2005-present). Formerly, Vice President of Product |
| Year of Birth: 1965 | | Management at Northern Trust Global Investments (1999-2005). |
| Vice President | | |
| * | Address for all Officers: 2455 Corporate West Drive, Lisle, IL 60532 |
| ** | Officers serve at the pleasure of the Board of Trustees and until his or her successor is appointed and qualified or until his or her earlier resignation or removal. |
| *** | Effective September 26, 2012. |
58 l CLAYMORE EXCHANGE-TRADED FUND TRUST 2 ANNUAL REPORT
| | |
| CONSIDERATIONS REGARDING ANNUAL REVIEW OF THE INVESTMENT ADVISORY | |
| AGREEMENTS AND INVESTMENT SUBADVISORY AGREEMENT | August 31, 2012 |
On May 16, 2012 (the “May Meeting”), the Boards of Trustees (together, the “Board”) of Claymore Exchange-Traded Fund Trust and Claymore Exchange-Traded Fund Trust 2 (together the “Trusts,” with the separate series thereof referred to individually as a “Fund” and collectively as the “Funds”), including those trustees who are not “interested persons” as defined by the Investment Company Act of 1940, as amended (the “1940 Act”) (the “Independent Trustees”), on the recommendation of the Board’s Contracts Review Committee (referred to as the “Committee” and consisting solely of the Independent Trustees), considered the renewal of the investment advisory agreements (the “Investment Advisory Agreements”) between the Trusts and Guggenheim Funds Investment Advisors, LLC (the “Adviser” or “GFIA”) on behalf of the following Funds:
Claymore Exchange-Traded Fund Trust
Guggenheim BRIC ETF
Guggenheim Defensive Equity ETF
Guggenheim Insider Sentiment ETF
Guggenheim Mid-Cap Core ETF
Guggenheim Multi-Asset Income ETF
Guggenheim Raymond James SB-1 Equity ETF
Guggenheim Spin-Off ETF
Wilshire 4500 Completion ETF
Wilshire 5000 Total Market ETF
Wilshire Micro-Cap ETF
Wilshire US REIT ETF
Guggenheim Enhanced Core Bond ETF
Guggenheim Enhanced Short Duration Bond ETF
Guggenheim BulletShares 2012 Corporate Bond ETF
Guggenheim BulletShares 2013 Corporate Bond ETF
Guggenheim BulletShares 2014 Corporate Bond ETF
Guggenheim BulletShares 2015 Corporate Bond ETF
Guggenheim BulletShares 2016 Corporate Bond ETF
Guggenheim BulletShares 2017 Corporate Bond ETF
Guggenheim BulletShares 2018 Corporate Bond ETF
Guggenheim BulletShares 2019 Corporate Bond ETF
Guggenheim BulletShares 2020 Corporate Bond ETF
Guggenheim BulletShares 2021 Corporate Bond ETF
Guggenheim BulletShares 2012 High Yield Corporate Bond ETF
Guggenheim BulletShares 2013 High Yield Corporate Bond ETF
Guggenheim BulletShares 2014 High Yield Corporate Bond ETF
Guggenheim BulletShares 2015 High Yield Corporate Bond ETF
Guggenheim BulletShares 2016 High Yield Corporate Bond ETF
Guggenheim BulletShares 2017 High Yield Corporate Bond ETF
Guggenheim BulletShares 2018 High Yield Corporate Bond ETF
Guggenheim BulletShares 2019 High Yield Corporate Bond ETF
Guggenheim BulletShares 2020 High Yield Corporate Bond ETF
Guggenheim S&P Global Dividend Opportunities Index ETF
Claymore Exchange-Traded Fund Trust 2
Guggenheim ABC High Dividend ETF
Guggenheim Airline ETF
Guggenheim China All-Cap ETF
Guggenheim China Technology ETF
Guggenheim Solar ETF
Guggenheim S&P Global Water Index ETF
Guggenheim Canadian Energy Income ETF
Guggenheim China Real Estate ETF
Guggenheim China Small Cap ETF
Guggenheim Frontier Markets ETF
Guggenheim International Multi-Asset Income ETF
Guggenheim Shipping ETF
Guggenheim Timber ETF
The Board also considered the renewal of the Investment Subadvisory Agreement (“Subadvisory Agreement”) by and among Claymore Exchange-Traded Fund Trust, the Adviser and Guggenheim Partners Asset Management, LLC (n/k/a Guggenheim Partners Investment Management, LLC) (the “Subadviser”) with respect to Wilshire 4500 Completion ETF, Wilshire 5000 Total Market ETF and Wilshire US Real Estate Investment Trust (the “Subadvised Funds”). As part of its review process, the Committee was represented by independent legal counsel. Independent legal counsel reviewed with the Committee various factors relevant to the consideration of advisory agreements and the legal responsibilities of the Trustees related to such consideration. The Board and Committee took into account various materials received from the Adviser, the Subadviser and independent legal counsel. The Board and Committee also considered the variety of written materials, reports and oral presentations received throughout the year regarding performance and operating results of the Funds.
The Committee met independently of the Funds’ management to consider the renewal of the investment advisory agreements. In preparation for its review, the Committee worked with independent legal counsel to determine the nature of information to be requested, and independent legal counsel, on behalf of the Committee, sent a formal request for information to the Adviser and Subadviser. The Adviser and Subadviser provided extensive information in response to the initial request and to subsequent requests. Among other information, the Adviser and Subadviser provided information to assist the Committee in assessing the nature and quality of services provided, information provided by the Adviser comparing the investment advisory fees and expense ratios of the Funds to other exchange-traded funds and to other funds in a peer group provided by the Adviser, information about the Adviser’s and Subadviser’s financial position, the profitability from the Investment Advisory Agreements to the Adviser, the profitability of the Subadvisory Agreements to the Subadviser and the compliance programs of the Adviser and Subadviser.
CLAYMORE EXCHANGE-TRADED FUND TRUST 2 ANNUAL REPORT l 59
| | |
| CONSIDERATIONS REGARDING ANNUAL REVIEW OF THE INVESTMENT ADVISORY | |
| AGREEMENTS AND INVESTMENT SUBADVISORY AGREEMENT continued | August 31, 2012 |
Based upon its review, the Board and the Committee concluded that it was in the best interests of the Funds to renew the Investment Advisory Agreements and in addition, with respect to the Subadvised Funds, to renew the Subadvisory Agreement. In reaching this conclusion for the Funds, no single factor was determinative in the Board’s analysis, but rather the Board considered a variety of factors.
Investment Advisory Agreements
Nature, Extent and Quality of Services Provided by the Adviser: With respect to the nature, extent and quality of services provided by the Adviser, the Board reviewed information concerning the functions performed by the Adviser for the Funds, information describing the Adviser’s organization and the background and experience of the persons responsible for the day-to-day management of the Funds. With respect to the Subadvised Funds, the Board noted that the Adviser had delegated responsibility for the investment and reinvestment of each Subadvised Fund’s assets to the Subadviser. The Board considered the Adviser’s responsibility to oversee the Subadviser and that the Adviser has similar oversight responsibilities for other Guggenheim Funds. In this connection, the Board took into account information provided by management describing the Adviser’s processes and activities for providing oversight of the Subadviser’s investment strategies and compliance with investment restrictions, as well as information regarding the Adviser’s Subadvisory Oversight Committee. The Committee also noted the distinctive nature of the Funds, as exchange-traded funds (“ETFs”), each of which (with the exception of the two actively-managed ETFs) is generally constructed to track the performance of a defined index of securities, before fund fees and expenses. In this connection, the Board considered the experience and expertise appropriate in an adviser to ETFs. The Board also considered the secondary market support services provided by the Adviser to the Funds, including the Adviser’s efforts to educate investment professionals about the Funds and other Guggenheim Funds. In addition, the Board noted its various discussions with management concerning the experience and qualifications of the Adviser’s personnel, including those personnel providing compliance oversight. In this regard, the Board considered the information from, and presentations to the Independent Trustees by, representatives of Foreside Compliance Services, LLC (“Foreside”), a third party service provider which provides independent chief compliance officer (“CCO”) services for registered investment companies and investment advisers. The Independent Trustees took into account their review of the relevant experience, qualifications and reputation of Foreside and its personnel and, specifically, their evaluation of, and meeting with, the Trusts’ prospective interim CCO, a senior Foreside employee. Additionally, the Independent Trustees considered the proposed appointment by the Board of Mr. Donald C. Cacciapaglia, President and Chief Executive Officer of GFIA, as an “interested” Trustee for the Trusts, and his proposed election by the Board as the Trusts’ Chief Executive Officer, as well as various legal, compliance and risk management oversight and staffing initiatives undertaken and/or presented by management in connection with the Adviser’s organizational capabilities. The Board also considered updated information and representations regarding a regulatory investigation of the Adviser. Moreover, in connection with the Board’s evaluation of the overall package of services provided by GFIA, the Board considered the quality of the administrative services provided by GFIA.
Further with respect to the Adviser’s resources and its ability to carry out its responsibilities under the Advisory Agreements, the Board considered its review of financial information concerning each of the Adviser and its parent, Guggenheim Partners, LLC (“Guggenheim”), as well as its discussions with the Chief Financial Officer and Chief Accounting Officer of GFIA and Guggenheim, respectively. The Board also took into account the guaranty agreement between each Trust and a Guggenheim affiliate concerning the obligations of the Adviser under the Investment Advisory Agreements and a commitment letter from Guggenheim regarding its financial support of GFIA.
The Board also discussed the acceptability of the terms of the Investment Advisory Agreements. Based on the foregoing, and based on other information received (both oral and written) at the April 19, 2012 Committee meeting (the “April Meeting”) and at the May Meeting, as well as other considerations, the Board concluded that the Adviser and its personnel were qualified to serve the Funds in such capacity.
Investment Performance: The Board noted that, in view of the distinctive investment objective of the Funds, the investment performance of the Funds (excluding the two actively-managed ETFs) in absolute terms was not of the importance that normally attaches to the performance of actively managed funds. Of more importance to the Board was the extent to which each Fund achieved its objective to provide investment results that, before fund fees and expenses, correspond generally to the price and yield performance of securities of companies in its applicable index. In this connection, the Board evaluated information on the correlation and tracking error between the underlying index and each Fund’s returns for the one-year, three-year and since-inception periods, as applicable. The Board determined that the Funds had in fact tracked their indexes within an acceptable range.
For the two actively-managed ETFs, the Board reviewed information comparing each Fund’s total return since the Fund became actively managed, compared to the performance of similar funds and relevant market indices, and determined that the performance was acceptable.
Comparative Fees, Costs of Services Provided and the Profits Realized by the Adviser from its Relationship with the Funds: The Board reviewed and discussed the information provided by the Adviser on each Fund’s advisory fee and expense ratio, as compared to those of the peer group funds provided by the Adviser. The Board reviewed the advisory fees for each Fund and noted that the Adviser had either contractually agreed to waive a portion of the fee and/or reimburse expenses to absorb annual operating expenses of certain Funds (excluding interest expenses, a portion of each Fund’s licensing fees, brokerage commissions and other trading expenses, taxes and extraordinary expenses such as litigation and other expenses not incurred in the ordinary course of a Fund’s business) over a particular amount or, for other Funds, the Board noted that the advisory fee was a unitary fee pursuant to which the Adviser assumes all expenses of the Fund (including the cost of transfer agency, custody, fund administration,
60 l CLAYMORE EXCHANGE-TRADED FUND TRUST 2 ANNUAL REPORT
| | |
| CONSIDERATIONS REGARDING ANNUAL REVIEW OF THE INVESTMENT ADVISORY | |
| AGREEMENTS AND INVESTMENT SUBADVISORY AGREEMENT continued | August 31, 2012 |
legal, audit and other services) other than the fee payments under the respective Advisory Agreement, distribution fees, if any, brokerage expenses, taxes, interest, litigation expenses and other extraordinary expenses. The Board noted that the advisory fees were generally within the range of the peer group funds provided by the Adviser and noted the unique nature of certain Funds, making “peer” comparisons less relevant.
In conjunction with its review of fees, the Board also considered information provided by the Adviser on the revenues received by the Adviser under the Investment Advisory Agreements, as well as the fees waived, for certain Funds and the estimated allocated direct and indirect costs the Adviser incurred in providing the services to the Funds.
The Board considered other benefits available to the Adviser because of its relationship with the Funds and noted that the administrative service fees received by the Adviser from serving as administrator provide it with additional revenue for the Funds without a unitary fee structure. The Board also noted the Adviser’s statement that it benefits from its association with the Funds by being able to offer investors a range of investment products. Based on all of the information provided, the Board determined that the Adviser’s profitability from its relationship with the Funds was not unreasonable.
Economies of Scale to be Realized: The Board considered the extent to which economies of scale could be realized with respect to the management of the Funds as the Funds grow and whether fee levels reflected a reasonable sharing of such economies of scale for the benefit of Fund investors. The Board considered each Fund’s asset size, advisory fee structure, net expense ratio and any applicable expense waiver and/or reimbursement agreement or unitary fee agreement with the Adviser and whether the investment process produced economies of scale. The Board considered the Adviser’s statement that, while it has experienced economies of scale as an organization through the introduction of new products, it is concurrently incurring new costs from increased staff and upgraded systems. The Board was also of the view that economies of scale were being shared with the Funds subject to a unitary fee arrangement by virtue of an advisory fee, set at a relatively low level since the inception of each applicable Fund, that subsumed economies of scale in the fee itself.
Subadvisory Agreement
Nature, Extent and Quality of Services Provided by the Subadviser: With respect to the nature, extent and quality of the services provided by the Subadviser, the Board considered the qualifications, experience, reputation and skills of the Subadviser’s personnel providing services to the Subadvised Funds and other key personnel. The Board also noted the distinctive nature of the Subadvised Funds, as ETFs, each of which is generally constructed to track the performance of a defined index of securities, before fund fees and expenses. In this connection, the Board considered the experience and expertise appropriate in an adviser to ETFs. The Board concluded that the Subadviser had personnel qualified to provide the services under the Subadvisory Agreement.
Investment Performance: The Board noted that, in view of the distinctive investment objective of the Subadvised Funds, the investment performance of the Subadvised Funds in absolute terms was not of the importance that normally attaches to the performance of actively managed funds. Of more importance to the Board was the extent to which each Subadvised Fund achieved its objective to provide investment results that, before fund fees and expenses, correspond generally to the price and yield performance of securities of companies in its applicable index. In this connection, the Board evaluated information on the correlation and tracking error between the underlying index and each Subadvised Fund’s returns for the one-year and since-inception periods. The Board determined that the Subadvised Funds had in fact tracked their indexes within an acceptable range.
Comparative Fees, Costs of Services Provided and the Profits Realized by the Subadviser from its Relationship with the Subadvised Funds: The Board considered that the Subadvisory Agreement was negotiated at arm’s length between the Adviser and the Subadviser, with the Adviser compensating the Subadviser from its own fees. On the basis of the information provided, the Board concluded that the subadvisory fee rate for each of the Subadvised Funds was reasonable.
With respect to the costs of services provided and profits realized by the Subadviser from its relationship with the Subadvised Funds, the Board considered information provided by management concerning the revenues the Subadviser received under the Subadvisory Agreement as well as the estimated expenses incurred by the Subadviser in providing services to the Subadvised Funds and its pre-tax return on revenue. The Board considered management’s representation that the Subadviser’s operating margins were within the industry range and determined that profitability levels were not unreasonable.
Economies of Scale to be Realized: The Board considered whether there were economies of scale with respect to the subadvisory services provided to the Subadvised Funds under the Subadvisory Agreement. The Board noted that the Subadvised Funds were relatively new and had not attracted significant assets and determined to address economies of scale when the Subadvised Funds had significant assets.
Overall Conclusions
Based on the foregoing, the Board determined at the May Meeting that the investment advisory fees are fair and reasonable in light of the extent and quality of the services provided and other benefits received and that the continuation of each Advisory Agreement is in the best interests of each Fund. In reaching this conclusion, no single factor was determinative. At the May Meeting, the Board, constituting all of the Independent Trustees, approved the renewal of each Advisory Agreement for an additional annual term.
CLAYMORE EXCHANGE-TRADED FUND TRUST 2 ANNUAL REPORT l 61
This Page Intentionally Left Blank.
| | |
| TRUST INFORMATION | August 31, 2012 |
| | | | |
| Board of Trustees | Officers | Investment Adviser | Legal Counsel |
| Randall C. Barnes | Donald C. Cacciapaglia | Guggenheim Funds | Dechert LLP |
| | Chief Executive Officer | Investment Advisors, LLC | New York, NY |
| Donald C. Cacciapaglia* | | Lisle, IL | |
| | Kevin M. Robinson | | Independent |
| Roman Friedrich III | Chief Legal Officer | Distributor | Registered Public |
| | | Guggenheim Funds | Accounting Firm |
| Robert B. Karn III | John Sullivan | Distributors, LLC | Ernst & Young LLP |
| | Chief Accounting Officer, | Lisle, IL | Chicago, IL |
| Ronald A. Nyberg | Chief Financial Officer | | |
| | and Treasurer | Administrator | |
| Ronald E. Toupin, Jr., | | Guggenheim Funds | |
| Chairman | Joanna M. Catalucci | Investment Advisors, LLC | |
| | Interim Chief | Lisle, IL | |
| * Trustee is an “interested | Compliance Officer | | |
| person” (as defined in section | | Accounting Agent, Custodian | |
| 2(a)(19) of the 1940 Act) | Mark E. Mathiasen | and Transfer Agent | |
| (“Interested Trustee”) of the | Secretary | The Bank of New York | |
| Trust because of his position as | | Mellon Corp. | |
| the President and CEO of the | Stevens T. Kelly | New York, NY | |
| Investment Adviser and the | Assistant Secretary | | |
| Distributor. | | | |
| | William H. Belden III | | |
| | Vice President | | |
Privacy Principles of the Trust for Shareholders
The Funds are committed to maintaining the privacy of their shareholders and to safeguarding the non-public personal information. The following information is provided to help you understand what personal information the Funds collect, how we protect that information and why, in certain cases, we may share information with select other parties.
Generally, the Funds do not receive any non-public personal information relating to their shareholders, although certain non-public personal information of their shareholders may become available to the Funds. The Funds do not disclose any non-public personal information about their shareholders or former shareholders to anyone, except as permitted by law or as is necessary in order to service shareholder accounts (for example, to a transfer agent or third party administrator).
The Funds restrict access to non-public personal information about the shareholders to Guggenheim Funds Investment Advisors, LLC employees with a legitimate business need for the information. The Funds maintain physical, electronic and procedural safeguards designed to protect the non-public personal information of their shareholders.
Questions concerning your shares of the Trust?
• If your shares are held in a Brokerage Account, contact your Broker.
This report is sent to shareholders of the Funds for their information. It is not a Prospectus, circular or representation intended for use in the purchase or sale of shares of the Funds or of any securities mentioned in this report.
A description of the Funds’ proxy voting policies and procedures related to portfolio securities is available without charge, upon request, by calling the Funds as (800)345-7999.
Information regarding how the Funds voted proxies for portfolio securities, if applicable, during the most recent 12-month period ended June 30, is also available, without charge and upon request by calling (800) 345-7999, visiting Guggenheim Funds’s website at www.guggenheimfunds.com or by accessing the Funds’ Forms N-PX on the SEC’s website at www.sec.gov.
The Funds file their complete schedule of portfolio holdings with the SEC for the first and third quarters of each fiscal year on Form N-Q. The Funds’ Forms N-Q are available on the SEC website at www.sec.gov or by visiting Guggenheim Funds’s website at www.guggenheimfunds.com. The Funds’ Forms N-Q may also be viewed and copied at the SEC’s Public Reference Room in Washington, DC; information on the operation of the Public Reference Room may be obtained by calling (800) SEC-0330.
CLAYMORE EXCHANGE-TRADED FUND TRUST 2 ANNUAL REPORT l 63
Guggenheim Funds Investment Advisors, LLC
Guggenheim Funds Investment Advisors, LLC (the “Investment Adviser”) manages the investment and reinvestment of each Fund’s assets and administers the affairs of each Fund to the extent requested by the Board of Trustees. The Investment Adviser also acts as investment adviser to closed-end and open-end management investment companies. The Investment Adviser and its affiliates provide supervision, management or servicing of assets with a commitment to consistently delivering exceptional service. The Investment Adviser is a subsidiary of Guggenheim Partners, LLC, a global, diversified financial services firm with more than $160 billion in assets under supervision. Guggenheim Partners, LLC, through its affiliates, provides investment management, investment advisory, insurance, investment banking, and capital markets services. The firm is headquartered in Chicago and New York with a global network of offices throughout the United States, Europe, and Asia.
Portfolio Management
The portfolio manager who is currently responsible for the day-to-day management of each Fund’s portfolio is Saroj Kanuri, CFA. Mr. Kanuri is a Director, ETF Portfolio Management, of the Investment Adviser and Guggenheim Funds Distributors, LLC and joined Guggenheim Funds Distributors, LLC in October of 2006. Prior to joining Guggenheim, Mr. Kanuri served as an analyst at Northern Trust Corporation from 2001-2006. Mr. Kanuri received a B.S. in Finance from the University of Illinois at Chicago.
Claymore Exchange-Traded Fund Trust 2 Overview
The Claymore Exchange-Traded Fund Trust 2 (the “Trust”) is an investment company complex consisting of 14 separate exchange-traded “index funds” as of August 31, 2012. The investment objective of each of the index funds is to correspond generally to the performance, before fees and expenses, of a specified market index.
This material must be preceded or accompanied by a prospectus for the fund being offered. The prospectus contains information about the Fund including a discussion of investment objectives, risks, ongoing expenses and sales charges. If a prospectus did not accompany this report, you can obtain one from your financial adviser, from our website at http://www.guggenheimfunds.com or by calling (800)345-7999. Please read the prospectus carefully before investing. The Statement of Additional Information that includes additional information about the Trustees is also available, without charge, upon request via our website at http://www.guggenheimfunds.com or by calling (800)345-7999. All Funds are subject to market risk and shares when sold may be worth more or less than their original cost. You can lose money investing in the Funds.
| | |
Guggenheim Funds Distributors, LLC 2455 Corporate West Drive Lisle, IL 60532 Member FINRA/SIPC (10/12) | |
NOT FDIC-INSURED l NOT BANK-GUARANTEED l MAY LOSE VALUE
ETF-002-AR-0812
Item 2. Code of Ethics.
(a) The registrant has adopted a code of ethics that applies to its principal executive officer, principal financial officer, principal accounting officer or controller, or persons performing similar functions (the "Code of Ethics").
(b) No information need be disclosed pursuant to this paragraph.
(c) The registrant’s code of ethics that applies to the registrant’s principal executive officer, principal accounting officer or controller, or persons performing similar functions, was amended during the period to include: specific examples of conflict of interest situations requiring prior written approval; annual certification requirements for officers covered under the code of ethics; specific recordkeeping obligations by the Trusts; and a confidentiality provision.
(d) The registrant has not granted a waiver or an implicit waiver to its principal executive officer, principal financial officer, principal accounting officer or controller, or persons performing similar functions from a provision of its Code of Ethics during the period covered by this report.
(e) Not applicable.
(f) (1) The registrant's Code of Ethics is attached hereto as an exhibit.
(2) Not applicable.
(3) Not applicable.
Item 3. Audit Committee Financial Expert.
The registrant's Board of Trustees has determined that it has at least one audit committee financial expert serving on its audit committee (the “Audit Committee”), Randall C. Barnes. Mr. Barnes is an independent Trustee for purposes of this Item 3 of Form N-CSR. Mr. Barnes qualifies as an audit committee financial expert by virtue of his experience obtained as a former Senior Vice President, Treasurer of PepsiCo, Inc.
(Under applicable securities laws, a person who is determined to be an audit committee financial expert will not be deemed an "expert" for any purpose, including without limitation for purposes of Section 11 of the Securities Act of 1933, as amended, as a result of being designated or identified as an audit committee financial expert. The designation or identification of a person as an audit committee financial expert does not impose on such person any duties, obligations, or liabilities that are greater than the duties, obligations, and liabilities imposed on such person as a member of the Audit Committee and Board of Trustees in the absence of such designation or identification. The designation or identification of a person as an audit committee financial expert does not affect the duties, obligations or liability of any other member of the Audit Committee or Board of Trustees.)
Item 4. Principal Accountant Fees and Services.
(a) Audit Fees: the aggregate fees billed for professional services rendered by the principal accountant for the audit of the registrant's annual financial statements or services that are normally provided by the accountant in connection with statutory and regulatory filings or engagements were $59,190 and $98,880 for the fiscal years ending August 31, 2012 and August 31, 2011, respectively.
(b) Audit-Related Fees: the aggregate fees billed for assurance and related services by the principal accountant that are reasonably related to the performance of the audit of the registrant’s financial statements and are not reported under paragraph (a) of this Item, were $0 and $0 for the fiscal years ending August 31, 2012 and August 31, 2011, respectively.
The registrant’s principal accountant did not bill fees for non-audit services that required preapproval by the Audit Committee pursuant to paragraph (c)(7)(ii) of Rule 2-01 of Regulation S-X during the registrant’s last two fiscal years.
(c) Tax Fees: the aggregate fees billed for professional services rendered by the principal accountant for tax compliance, tax advice and tax planning, including federal, state and local income tax return preparation and related advice and determination of taxable income and miscellaneous tax advice were $19,500 and $28,000 for the fiscal years ending August 31, 2012 and August 31, 2011, respectively.
The registrant’s principal accountant did not bill fees for tax services that required preapproval by the Audit Committee pursuant to paragraph (c)(7)(ii) of Rule 2-01 of Regulation S-X during the registrant’s last two fiscal years.
(d) All Other Fees: the aggregate fees billed for products and services provided by the principal accountant, other than the services reported in paragraphs 4(a) through 4(c) of this Item were $0 and $0 for the fiscal years ending August 31, 2012 and August 31, 2011, respectively.
The registrant’s principal accountant did not bill fees for services not included in Items 4(a), (b) or (c) above that required preapproval by the Audit Committee pursuant to paragraph (c)(7)(ii) of Rule 2-01 of Regulation S-X during the registrant’s last two fiscal years.
(e) Audit Committee Pre-Approval Policies and Procedures.
(i) The Audit Committee reviews, and in its sole discretion, pre-approves, pursuant to written pre-approval procedures (A) all engagements for audit and non-audit services to be provided by the principal accountant to the registrant and (B) all engagements for non-audit services to be provided by the principal accountant (1) to the registrant’s investment adviser (not including a sub-adviser whose role is primarily portfolio management and is sub-contracted or overseen by another investment adviser) and (2) to any entity controlling, controlled by or under common control with the registrant’s investment adviser that provides ongoing services to the registrant; but in the case of the services described in subsection (B)(1) or (2), only if the engagement relates directly to the operations and financial reporting of the registrant; provided that such pre-approval need not be obtained in circumstances in which the pre-approval requirement is waived under rules promulgated by the Securities and Exchange Commission or New York Stock Exchange listing standards. Sections IV.C.2 and IV.C.3 of the Audit Committee’s revised Audit Committee Charter contain the Audit Committee’s Pre-Approval Policies and Procedures and such sections are included below.
IV.C.2. Pre-approve any engagement of the independent auditors to provide any non-prohibited services to the Fund, including the fees and other compensation to be paid to the independent auditors (unless an exception is available under Rule 2-01 of Regulation S-X).
| (a) | The categories of services to be reviewed and considered for pre-approval include the following: |
Audit Services
| · | Annual financial statement audits |
| · | Seed audits (related to new product filings, as required) |
| · | SEC and regulatory filings and consents |
Audit-Related Services
| · | Accounting consultations |
| · | Fund merger/reorganization support services |
| · | Other accounting related matters |
| · | Agreed upon procedures reports |
| · | Other internal control reports |
Tax Services
| · | Tax compliance services related to the filing of amendments: |
| o | Federal, state and local income tax compliance |
| o | Sales and use tax compliance |
| · | Timely RIC qualification reviews |
| · | Tax distribution analysis and planning |
| · | Tax authority examination services |
| · | Tax appeals support services |
| · | Accounting methods studies |
| · | Fund merger support services |
| · | Tax compliance, planning and advice services and related projects |
| (b) | The Audit Committee has pre-approved those services, which fall into one of the categories of services listed under 2(a) above and for which the estimated fees are less than $25,000. |
| (c) | For services with estimated fees of $25,000 or more, but less than $50,000, the Chairman is hereby authorized to pre-approve such services on behalf of the Audit Committee. |
| (d) | For services with estimated fees of $50,000 or more, such services require pre-approval by the Audit Committee. |
| (e) | The independent auditors or the Chief Accounting Officer of the Fund (or an officer of the Fund who reports to the Chief Accounting Officer) shall report to the Audit Committee at each of its regular quarterly meetings all audit, audit-related and permissible non-audit services initiated since the last such report (unless the services were contained in the initial audit plan, as previously presented to, and approved by, the Audit Committee). The report shall include a general description of the services and projected fees, and the means by which such services were approved by the Audit Committee (including the particular category listed above under which pre-approval was obtained). |
IV.C.3. Pre-approve any engagement of the independent auditors, including the fees and other compensation to be paid to the independent auditors, to provide any non-audit services to the Adviser (or any “control affiliate” of the Adviser providing ongoing services to the Fund), if the engagement relates directly to the operations and financial reporting of the Fund (unless an exception is available under Rule 2-01 of Regulation S-X).
| (a) | The Chairman or any member of the Audit Committee may grant the pre-approval for non-audit services to the Adviser (or any “control affiliate” of the Adviser providing ongoing services to the Fund) relating directly to the operations and financial reporting of the Fund for which the estimated fees are less than $25,000. All such delegated pre-approvals shall be presented to the Audit Committee no later than the next Audit Committee meeting. |
| (b) | For non-audit services to the Adviser (or any “control affiliate” of the Adviser providing ongoing services to the Fund) relating directly to the operations and financial reporting of the Fund for which the estimated fees are $25,000 or more, such services require pre-approval by the Audit Committee. |
(2) None of the services described in each of Items 4(b) through (d) were approved by the Audit Committee pursuant to paragraph (c)(7)(i)(C) of Rule 2-01 of Regulation S-X.
(f) Not applicable.
(g) The aggregate non-audit fees billed by the registrant's accountant for services rendered to the registrant, the registrant’s investment adviser (not including a sub-adviser whose role is primarily portfolio management and is sub-contracted with or overseen by another investment adviser) and/or any entity controlling, controlled by, or under common control with the adviser that provides ongoing services to the registrant that directly related to the operations and financial reporting of the registrant were $19,500 and $28,000 for the fiscal years ending August 31, 2012, and August 31, 2011, respectively.
(h) Not applicable.
Item 5. Audit Committee of Listed Registrants.
(a)The Audit Committee was established in accordance with Section 3(a)(58)(A) of the Securities Exchange Act of 1934, as amended. The Audit Committee of the registrant is composed of Ronald A. Nyberg; Ronald E. Toupin, Jr., Randall C. Barnes, Roman Friedrich III and Robert B. Karn III.
(b) Not applicable.
Item 6. Schedule of Investments.
The Schedule of Investments is included as part of Item 1.
Item 7. Disclosure of Proxy Voting Policies and Procedures for Closed-End Management Investment Companies.
Not Applicable.
Item 8. Portfolio Managers of Closed-End Management Investment Companies.
Not Applicable.
Item 9. Purchases of Equity Securities by Closed-End Management Investment Company and Affiliated Purchasers.
Not Applicable.
Item 10. Submission of Matters to a Vote of Security Holders.
The registrant has not made any material changes to the procedures by which shareholders may recommend nominees to the registrant’s Board of Trustees.
Item 11. Controls and Procedures.
(a) The registrant's principal executive officer and principal financial officer have evaluated the registrant's disclosure controls and procedures (as defined in Rule 30a-3(c) under the Investment Company Act) as of a date within 90 days of this filing and have concluded based on such evaluation as required by Rule 30a-3(b) under the Investment Company Act, that the registrant's disclosure controls and procedures were effective as of that date in ensuring that information required to be disclosed by the registrant in this Form N-CSR was recorded, processed, summarized, and reported within the time periods specified in the Securities and Exchange Commission’s rules and forms.
(b) There were no changes in the registrant’s internal control over financial reporting (as defined in Rule 30a-3(d) under the Investment Company Act) that occurred during the registrant’s second fiscal quarter of the period covered by this report that have materially affected, or are reasonably likely to materially affect, the registrant’s internal control over financial reporting.
Item 12. Exhibits.
(a)(1) Code of Ethics for Chief Executive and Senior Financial Officers.
(a)(2) Certifications of principal executive officer and principal financial officer pursuant to Rule 30a-2(a) under the Investment Company Act.
(a)(3) Not applicable.
(b) Certifications of principal executive officer and principal financial officer pursuant to Rule 30a-2(b) under the Investment Company Act and Section 906 of the Sarbanes-Oxley Act of 2002.
SIGNATURES
Pursuant to the requirements of the Securities Exchange Act of 1934 and the Investment Company Act of 1940, the registrant has duly caused this report to be signed on its behalf by the undersigned, thereunto duly authorized.
(Registrant) Claymore Exchange-Traded Fund Trust 2
By: /s/ Donald C. Cacciapaglia
Name: Donald C. Cacciapaglia
Title: Chief Executive Officer
Date: November 7, 2012
Pursuant to the requirements of the Securities Exchange Act of 1934 and the Investment Company Act of 1940, this report has been signed by the following persons on behalf of the registrant and in the capacities and on the dates indicated.
By: /s/ Donald C. Cacciapaglia
Name: Donald C. Cacciapaglia
Title: Chief Executive Officer
Date: November 7, 2012
By: /s/ John Sullivan
Name: John Sullivan
Title: Chief Financial Officer, Chief Accounting Officer and Treasurer
Date: November 7, 2012