Exhibit 99.02
Glu Mobile Q113 Earnings Call May 1, 2013
Safe-Harbor Statement This presentation contains "forward-looking" statements including those regarding: forecasted smartphone and feature phone unit sales growth and that we are early in the smartphone upgrade cycle globally; the potential growth opportunity in Glu’s addressable consumer base; forecasted smartphone and tablet unit sales growth in comparison to projected sales growth of computers; Glu has an opportunity to increase advertising ARPDAU as well as IAP ARPDAU; Glu being well positioned for where the mobile games market is going with respect to social gaming; our guidance for Q2 2013 and FY 2013; and our target non-GAAP operating model. These forward-looking statements are subject to material risks and uncertainties that could cause actual results to differ materially from those in the forward-looking statements. Investors should consider important risk factors, which include: the risk that consumer demand for smartphones, tablets and next-generation platforms does not grow as significantly as we anticipate or that we will be unable to capitalize on any such growth; the risk that we do not realize a sufficient return on our investment with respect to our efforts to develop freemium games for smartphones and tablets, the risk that we do not maintain our good relationships with Apple and Google; the risk that our development expenses for games for smartphones are greater than we anticipate; the risk that our recently and newly launched games are less popular than anticipated; the risk that our newly released games will be of a quality less than desired by reviewers and consumers; the risk that the mobile games market, particularly with respect to social, freemium gaming, is smaller than anticipated; and other risks detailed under the caption "Risk Factors" in our Form 10-K filed with the Securities and Exchange Commission on March 15, 2013 and our other SEC filings. You can locate these reports through our website at http://www.glu.com/investors. These "forward-looking" statements are based on estimates and information available to us on May 1, 2013 and we are under no obligation, and expressly disclaim any obligation, to update or alter our forward-looking statements whether as a result of new information, future events or otherwise.
Use of Non-GAAP Financial Measures Other Placeholder: © Glu Mobile Inc. – Proprietary Glu uses in this presentation certain non-GAAP measures of financial performance. The presentation of these non-GAAP financial measures is not intended to be considered in isolation from, as a substitute for, or superior to, the financial information prepared and presented in accordance with GAAP, and may be different from non-GAAP financial measures used by other companies. In addition, these non-GAAP measures have limitations in that they do not reflect all of the amounts associated with Glu's results of operations as determined in accordance with GAAP. The non-GAAP financial measures used by Glu include non-GAAP revenues, non-GAAP Smartphone revenues, non-GAAP freemium revenues, non-GAAP gross margins, non-GAAP operating expenses, non-GAAP operating margin, non-GAAP Profit/(Loss) and Adjusted EBITDA. These non-GAAP financial measures exclude the following items from Glu's unaudited consolidated statements of operations: Change in deferred revenues and royalties;Amortization of intangible assets; Stock-based compensation expense; Restructuring charges; Change in fair value of Blammo earnout; Transitional costs; Impairment of goodwill;Release of tax liabilities; andForeign currency exchange gains and losses primarily related to the revaluation of assets and liabilities. In addition, Glu has included in this presentation “Adjusted EBITDA” figures which are used to evaluate Glu’s operating performance and is defined as non-GAAP operating income/(loss) excluding depreciation.Glu believes that these non-GAAP financial measures, when taken together with the corresponding GAAP financial measures, provide meaningful supplemental information regarding Glu's performance by excluding certain items that may not be indicative of Glu's core business, operating results or future outlook. Glu's management uses, and believes that investors benefit from referring to, these non-GAAP financial measures in assessing Glu's operating results, as well as when planning, forecasting and analyzing future periods. These non-GAAP financial measures also facilitate comparisons of Glu's performance to prior periods. For a reconciliation of these non-GAAP financial measures to their most directly comparable GAAP financial measures, please refer to the tables attached to Glu’s earnings press release for the quarter ended March 31, 2013, which is available on our website at http://www.glu.com/investors.
Intersection of Two Rising Tides: Growth in gaming on mobile devicesGrowth in freemium gaming Other Placeholder: © Glu Mobile Inc. – Proprietary Leading Freemium SocialMobile Gaming Company
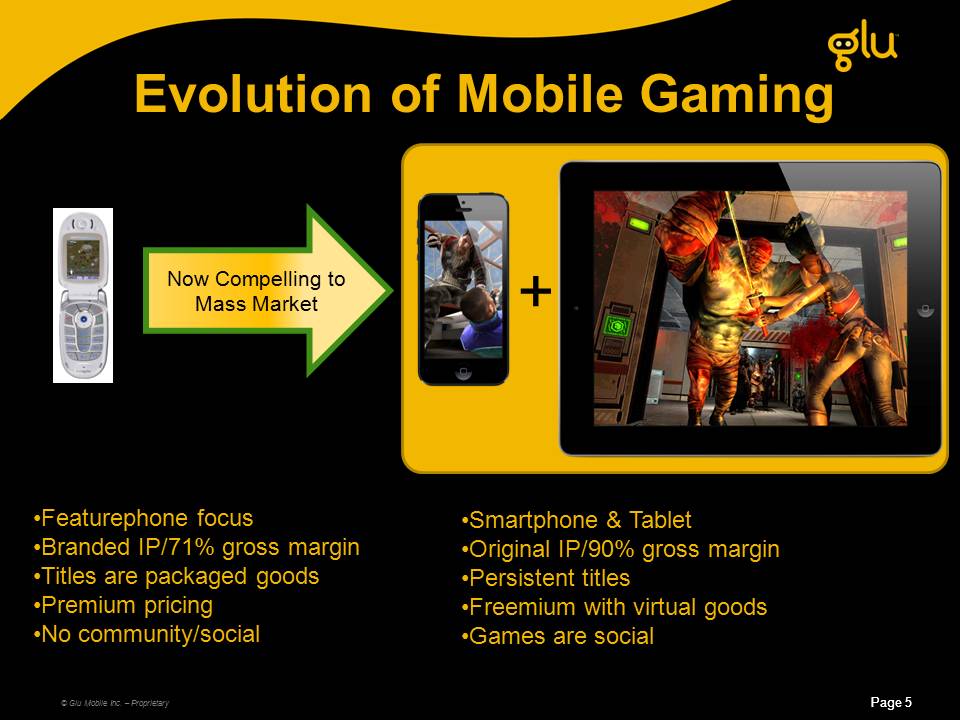
Featurephone focusBranded IP/71% gross marginTitles are packaged goodsPremium pricing No community/social Page 5 Evolution of Mobile Gaming Other Placeholder: © Glu Mobile Inc. – Proprietary Now Compelling to Mass Market + Smartphone & Tablet Original IP/90% gross margin Persistent titles Freemium with virtual goods Games are social
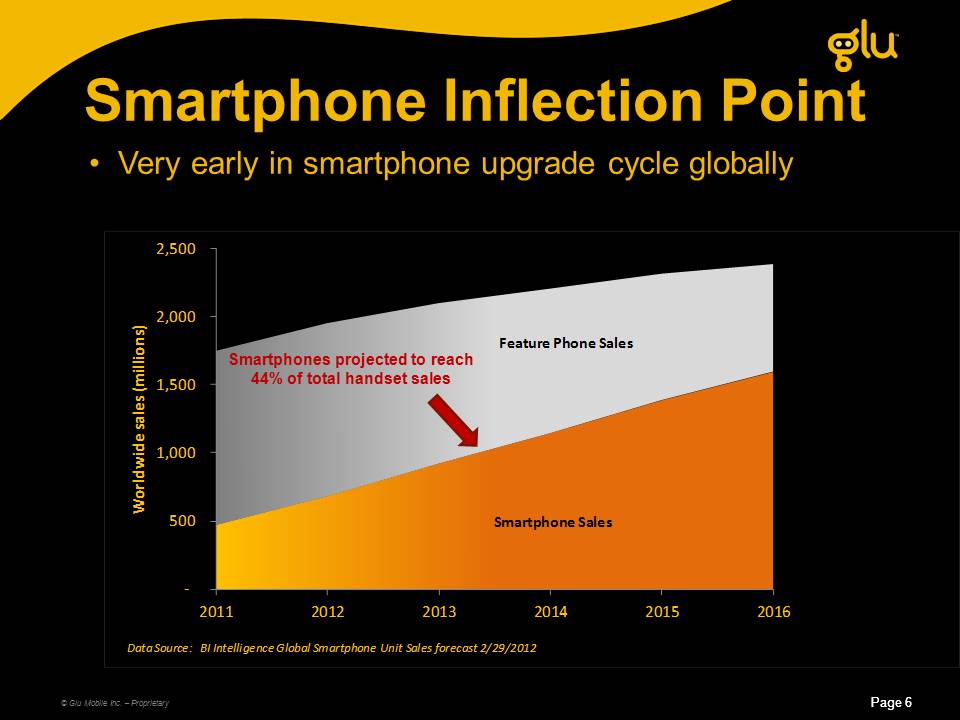
Smartphone Inflection Point Other Placeholder: © Glu Mobile Inc. – Proprietary Page 6 Very early in smartphone upgrade cycle globally Page 6 Smartphones projected to reach44% of total handset sales
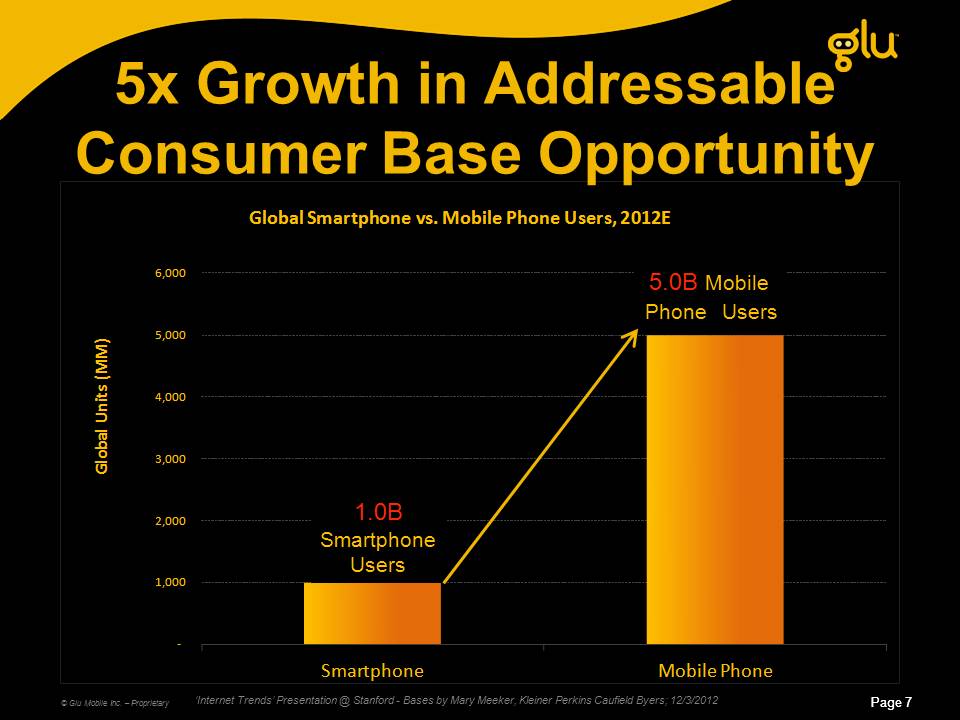
5x Growth in Addressable Consumer Base Opportunity Other Placeholder: © Glu Mobile Inc. – Proprietary Page 7 ‘Internet Trends’ Presentation @ Stanford - Bases by Mary Meeker, Kleiner Perkins Caufield Byers; 12/3/2012 1.0BSmartphoneUsers 5.0B Mobile Phone Users Other Placeholder: Page 7
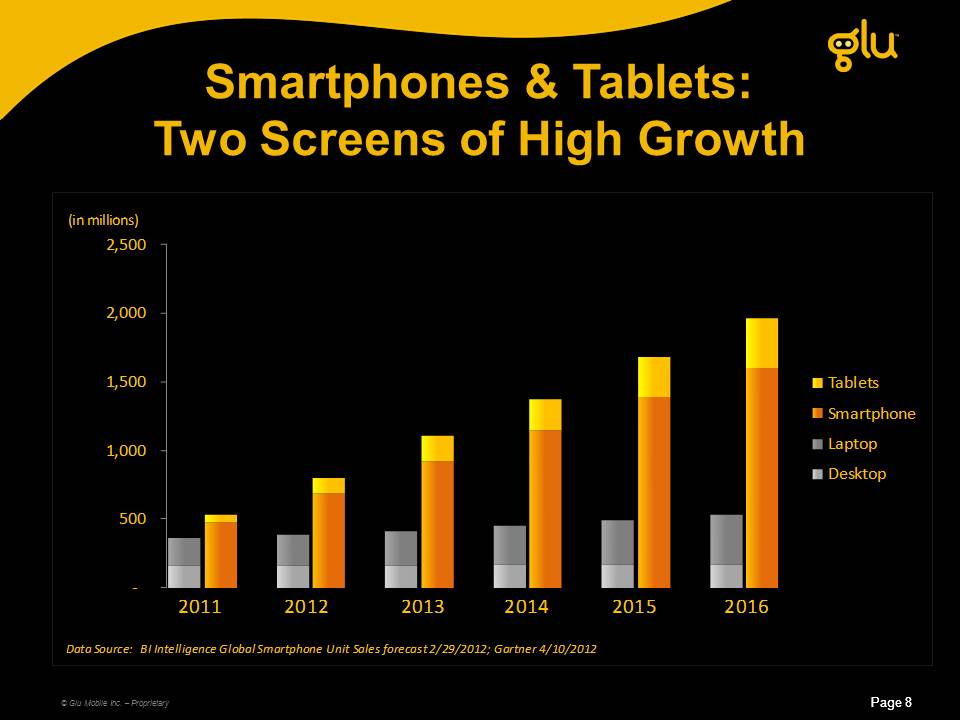
Smartphones & Tablets:
Two Screens of High Growth Other Placeholder: © Glu Mobile Inc. – Proprietary Page 8 Other Placeholder: Page 8

Corporate Overview © Glu Mobile Inc. – Proprietary
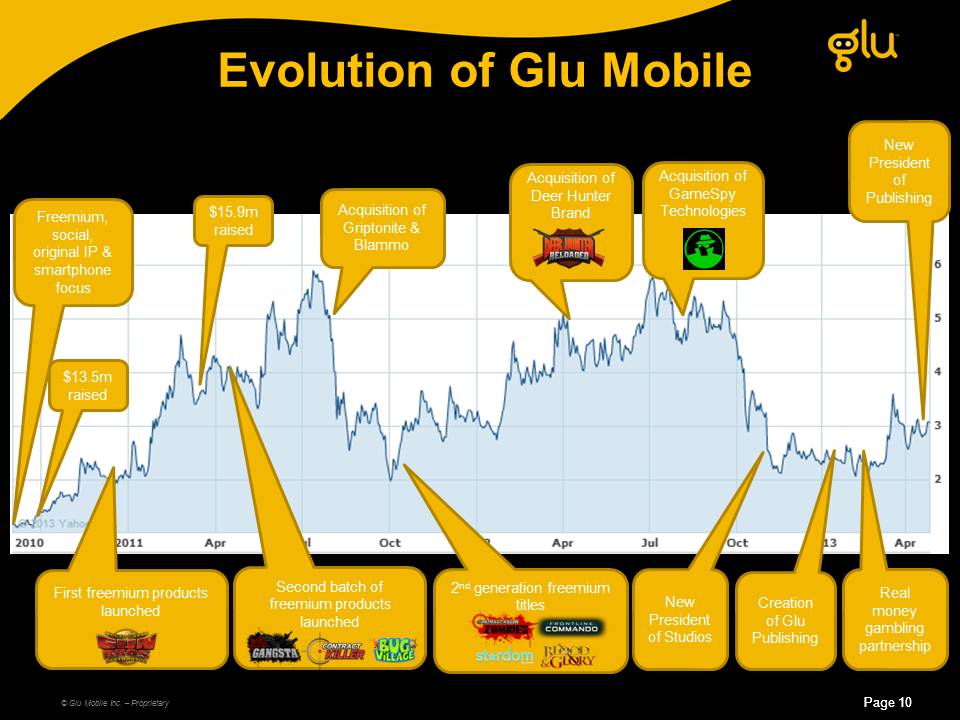
Evolution of Glu Mobile Other Placeholder: © Glu Mobile Inc. – Proprietary Page 10 Freemium, social, original IP & smartphone focus $13.5m raised $15.9m raised First freemium products launched Second batch of freemium products launched Acquisition of Griptonite & Blammo 2nd generation freemium titles Acquisition of Deer Hunter Brand Other Placeholder: Page 10 Acquisition of GameSpy Technologies New President of Studios Creation of Glu Publishing New President of Publishing Real money gambling partnership
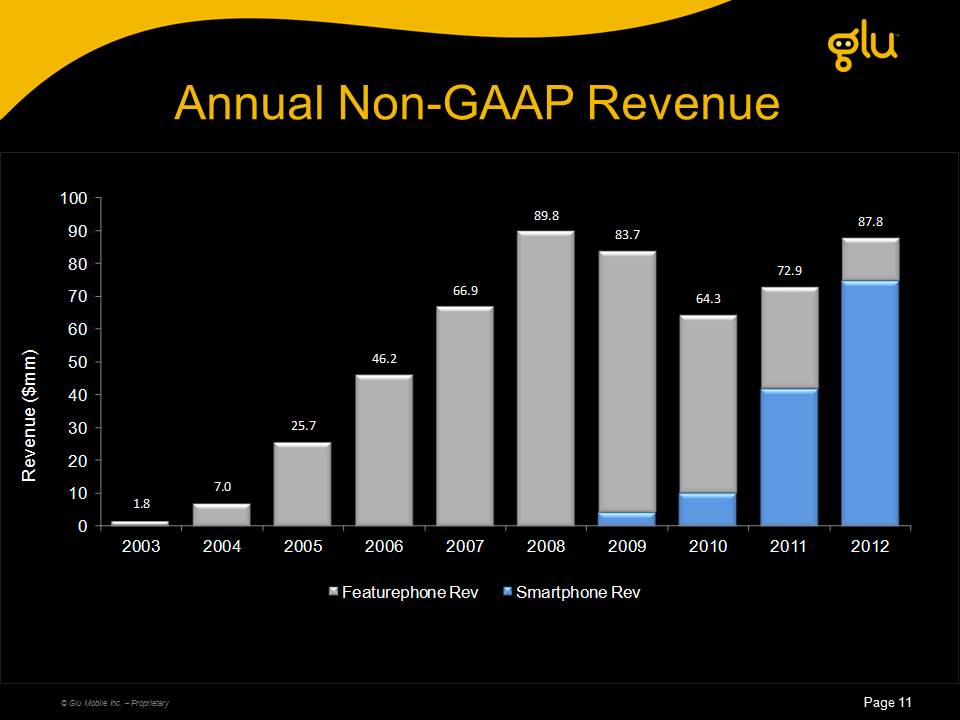
Annual Non-GAAP Revenue Page 11 © Glu Mobile Inc. – Proprietary
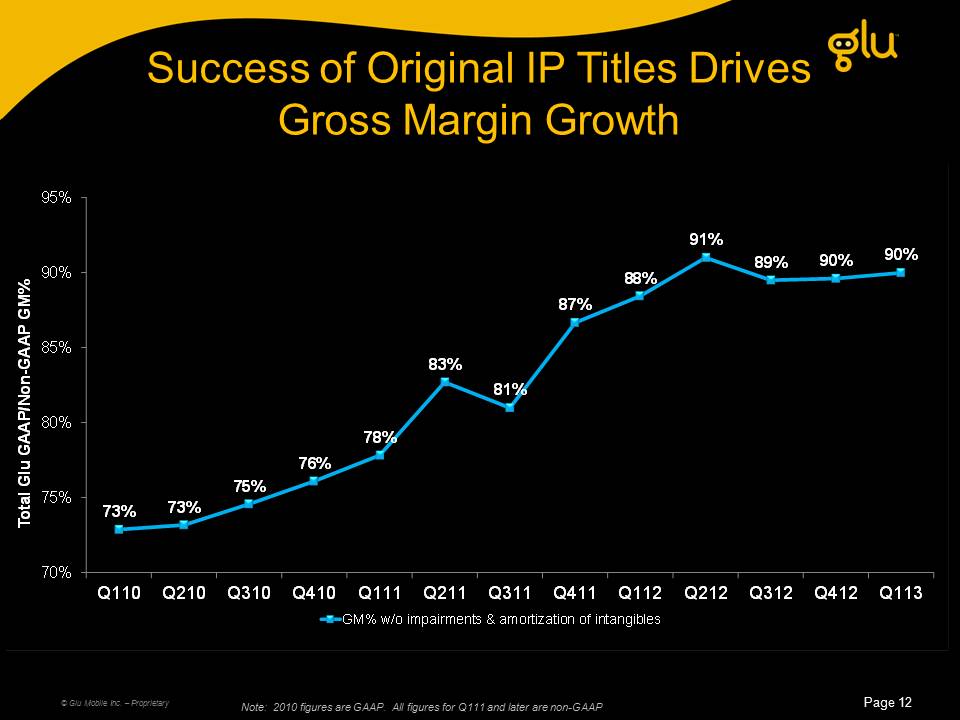
Success of Original IP Titles Drives Gross Margin Growth © Glu Mobile Inc. – Proprietary Page 12 Note: 2010 figures are GAAP. All figures for Q111 and later are non-GAAP
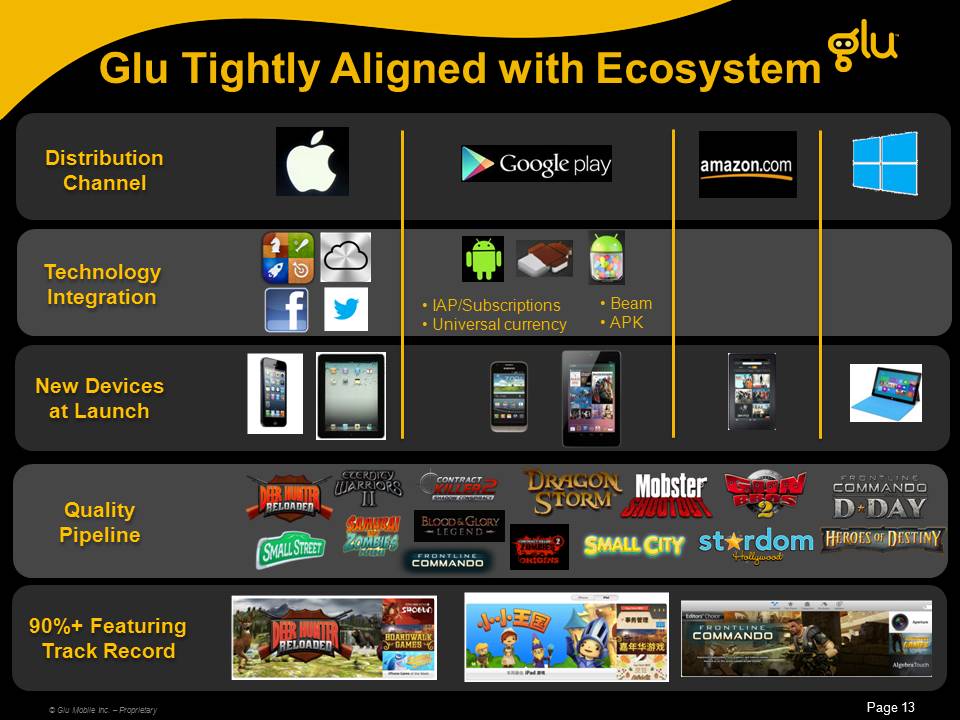
© Glu Mobile Inc. – Proprietary Technology Integration 90%+ Featuring Track Record New Devices at Launch Glu Tightly Aligned with Ecosystem IAP/Subscriptions Universal currency Beam APK DistributionChannel Quality Pipeline
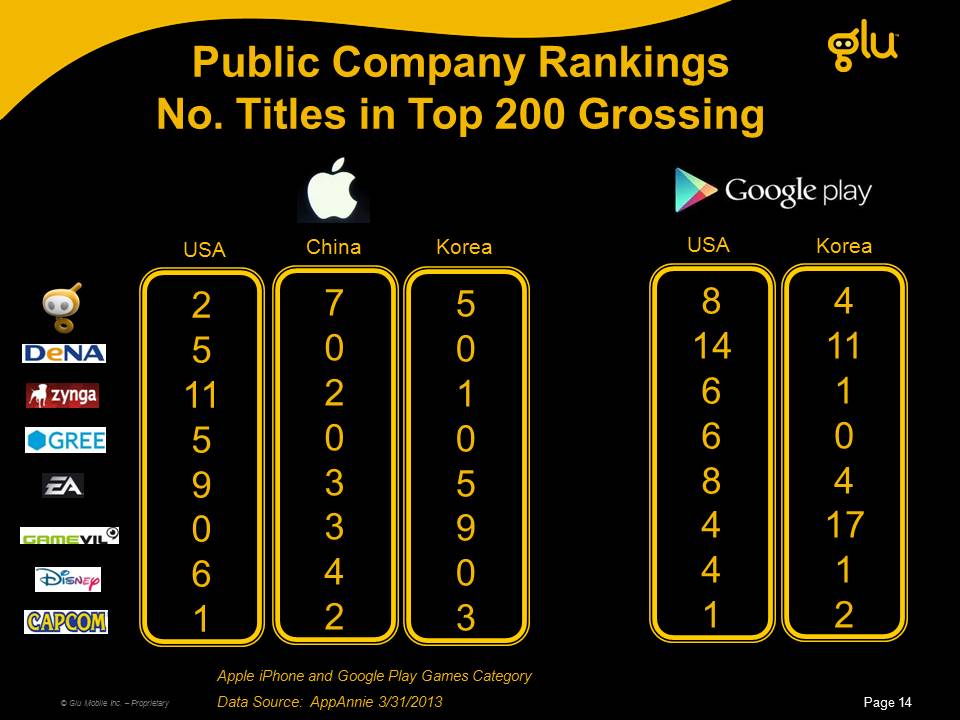
251159061 814668441 Apple iPhone and Google Play Games CategoryData Source: AppAnnie 3/31/2013 Public Company RankingsNo. Titles in Top 200 Grossing Page 14 70203342 China USA USA 50105903 Korea 4111041712 Korea © Glu Mobile Inc. – Proprietary
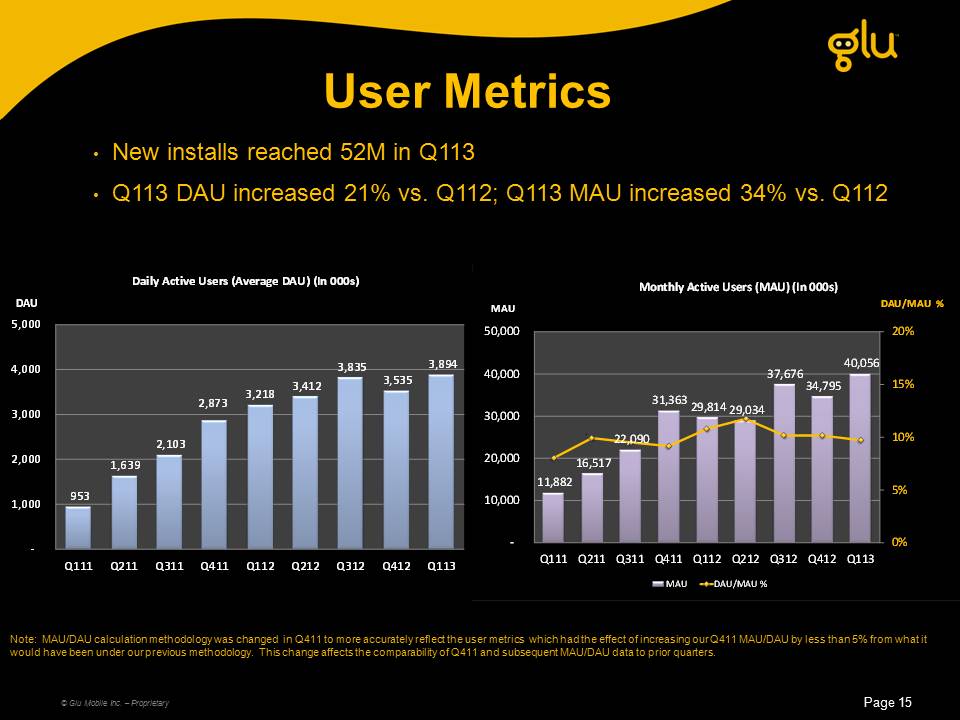
New installs reached 52M in Q113Q113 DAU increased 21% vs. Q112; Q113 MAU increased 34% vs. Q112 User Metrics Note: MAU/DAU calculation methodology was changed in Q411 to more accurately reflect the user metrics which had the effect of increasing our Q411 MAU/DAU by less than 5% from what it would have been under our previous methodology. This change affects the comparability of Q411 and subsequent MAU/DAU data to prior quarters. © Glu Mobile Inc. – Proprietary
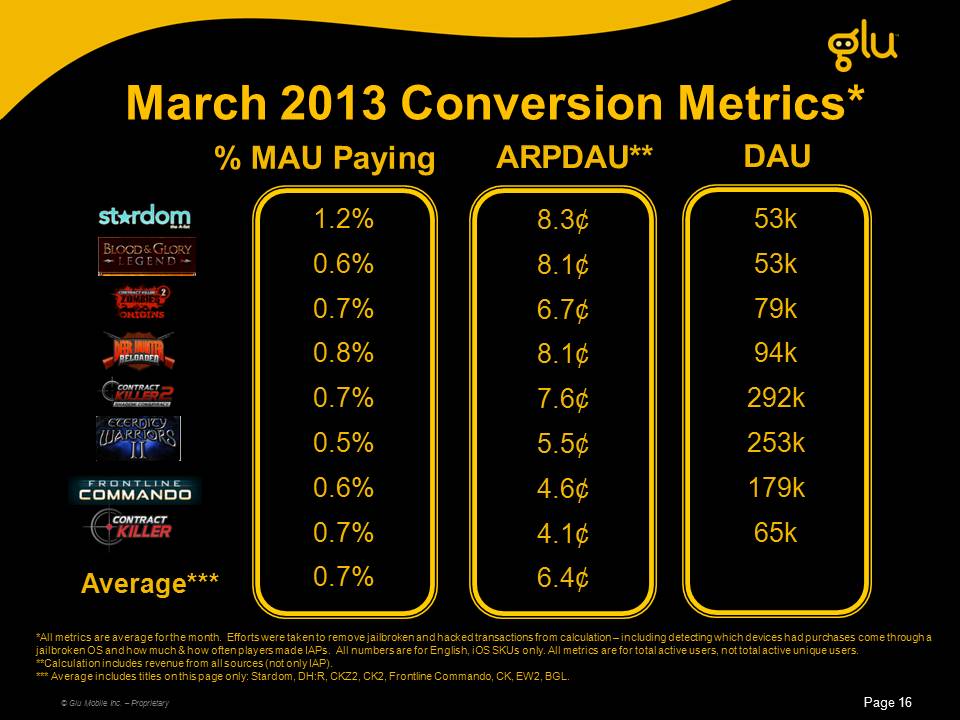
Page 16 March 2013 Conversion Metrics* © Glu Mobile Inc. – Proprietary 8.3¢8.1¢6.7¢8.1¢7.6¢5.5¢4.6¢4.1¢6.4¢ ARPDAU** Average*** *All metrics are average for the month. Efforts were taken to remove jailbroken and hacked transactions from calculation – including detecting which devices had purchases come through a jailbroken OS and how much & how often players made IAPs. All numbers are for English, iOS SKUs only. All metrics are for total active users, not total active unique users.**Calculation includes revenue from all sources (not only IAP).*** Average includes titles on this page only: Stardom, DH:R, CKZ2, CK2, Frontline Commando, CK, EW2, BGL. 1.2%0.6%0.7%0.8%0.7%0.5%0.6%0.7%0.7% % MAU Paying 53k53k79k94k292k253k179k65k DAU Slide: 17 Glu ARPDAU records – Deep PVE update success – Strong new hires – studio & publishingOpportunities to increase advertising ARPDAU as well as IAP ARPDAU
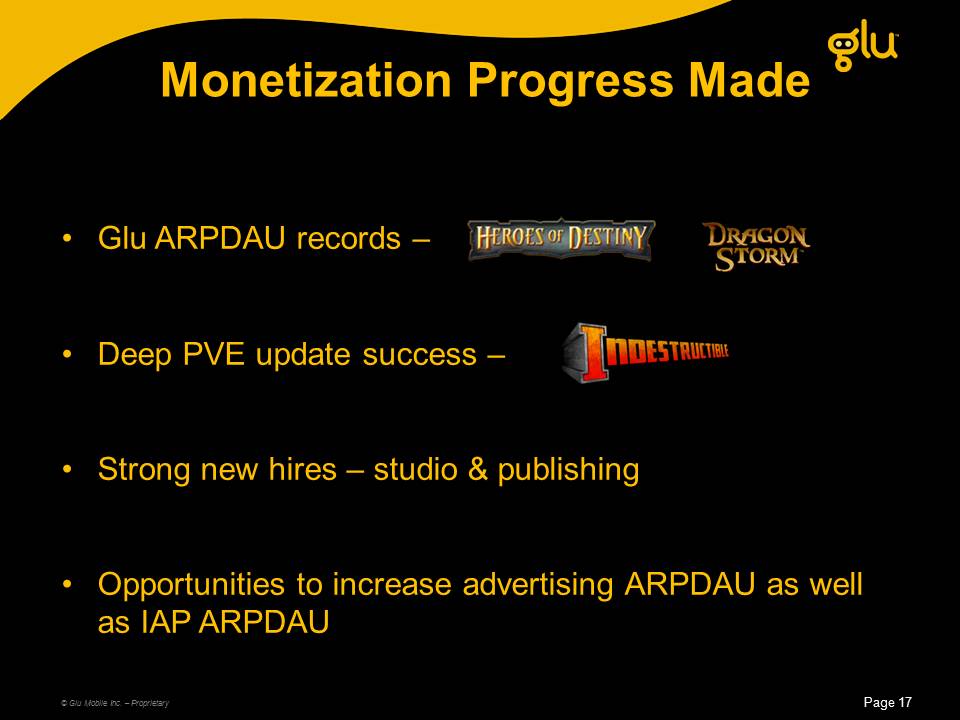
Monetization Progress Made © Glu Mobile Inc. – Proprietary

Future of Mobile Gaming © Glu Mobile Inc. – Proprietary

(Gp:) Resource mgmt and casual games broaden audience of gamers on mobile devices (Gp:) Audience evolves to want deeper, more immersive and realistic experiences (Gp:) Glu positioned well for where the market is going Success Pillars? Core gameplayProduction valuesReachMonetization
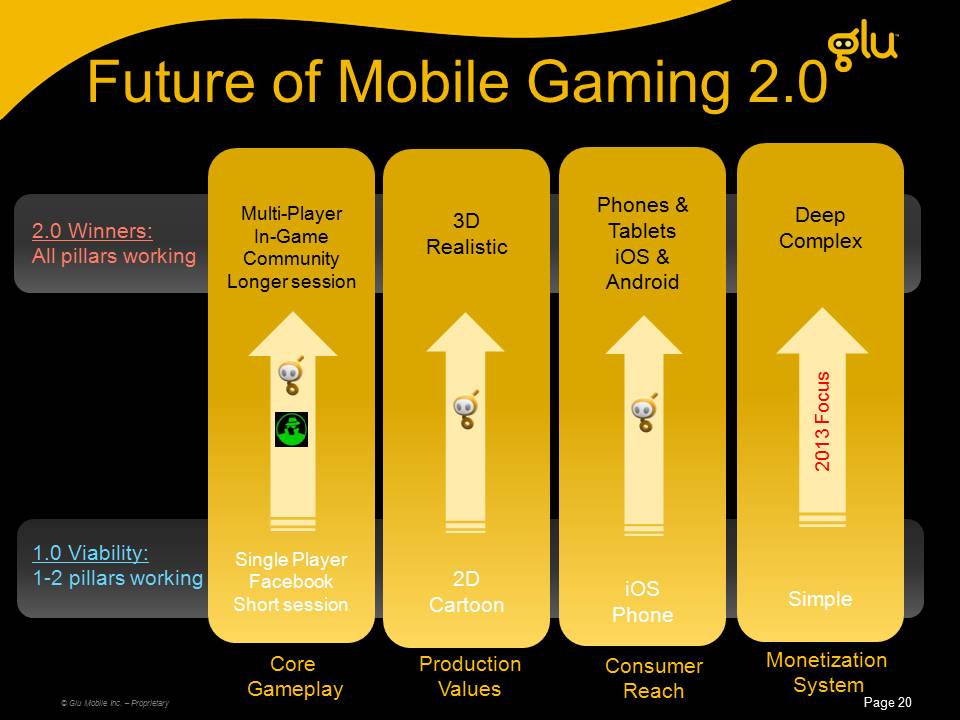
3DRealistic2DCartoon ProductionValues Multi-PlayerIn-Game CommunityLonger sessionSingle PlayerFacebookShort session Core Gameplay Phones & TabletsiOS & AndroidiOSPhone Consumer Reach 1.0 Viability:1-2 pillars working 2.0 Winners:All pillars working DeepComplexSimple Monetization System 2013 Focus

New Division: 3rd Party Publishing © Glu Mobile Inc. – Proprietary

What Glu Offers 3rd Party Developers © Glu Mobile Inc. – Proprietary Page 22 (Gp:) Technology (Gp:) Distribution (Gp:) Funding (Gp:) Reach Expertise FeaturingDirect marketingCross promo In-game communityLeaderboardsAutomated merchandisingAndroid subscriptions Android portingMacOS, W8 extensionTranslation Royalty advancesMarketing spendInvestment Western cultureMonetization
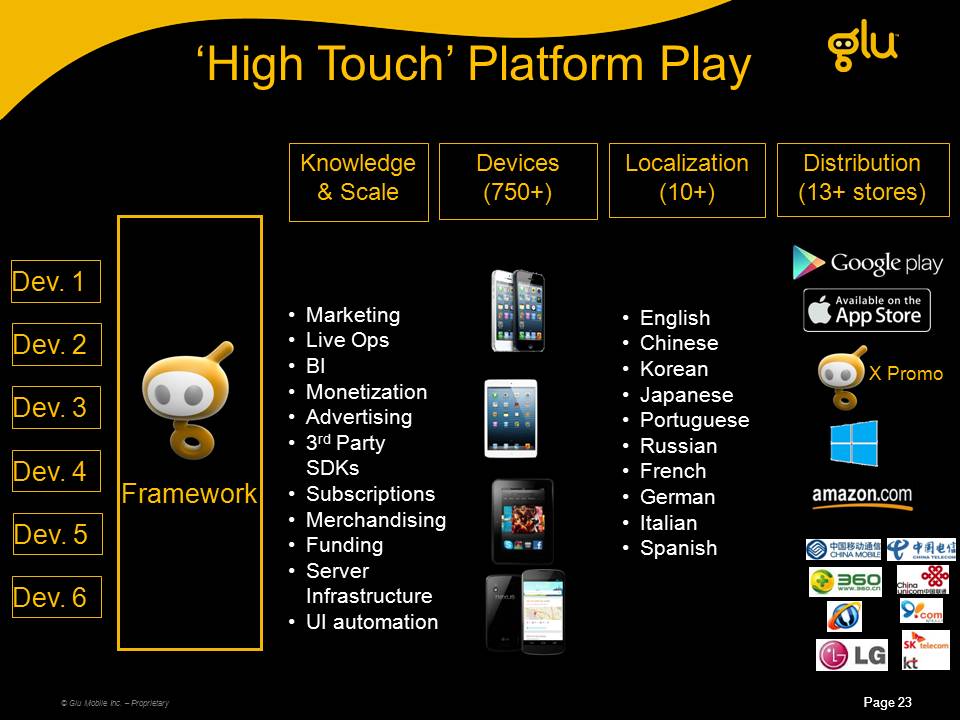
© Glu Mobile Inc. – Proprietary ‘High Touch’ Platform Play Dev. 1 Devices(750+) Localization(10+) Dev. 2 Dev. 3 Framework Distribution(13+ stores) EnglishChineseKoreanJapanesePortugueseRussianFrench German Italian Spanish X Promo Knowledge & Scale MarketingLive OpsBIMonetizationAdvertising3rd Party SDKsSubscriptionsMerchandisingFundingServer InfrastructureUI automation Dev. 4 Dev. 5 Dev. 6
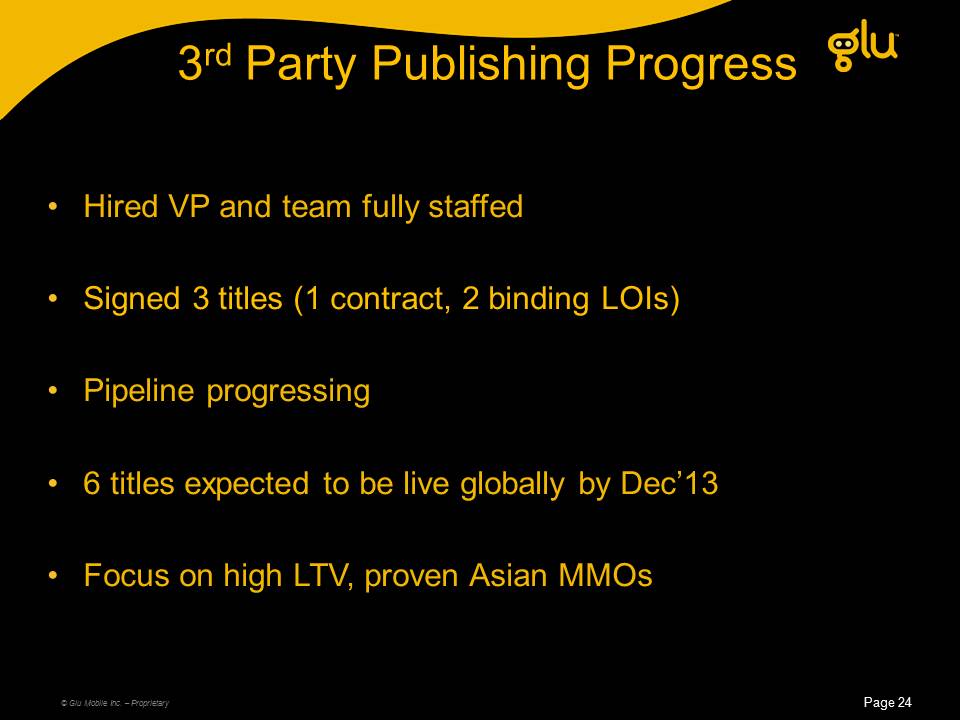
Hired VP and team fully staffedSigned 3 titles (1 contract, 2 binding LOIs) Pipeline progressing6 titles expected to be live globally by Dec’13Focus on high LTV, proven Asian MMOs © Glu Mobile Inc. – Proprietary

Quad Screen Future © Glu Mobile Inc. – Proprietary
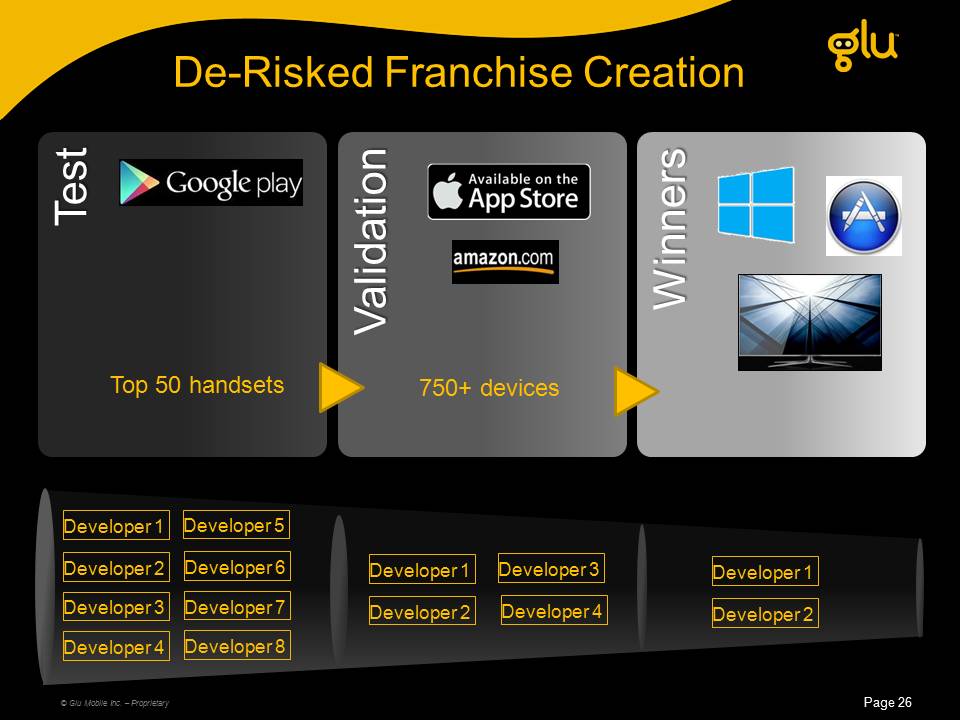
Page 26 De-Risked Franchise Creation © Glu Mobile Inc. – Proprietary 750+ devices Top 50 handsets Developer 1 Developer 2 Developer 3 Developer 5 Developer 6 Developer 7 Developer 4 Developer 8 Developer 1 Developer 2 Developer 3 Developer 4 Developer 1 Developer 2

Financials © Glu Mobile Inc. – Proprietary
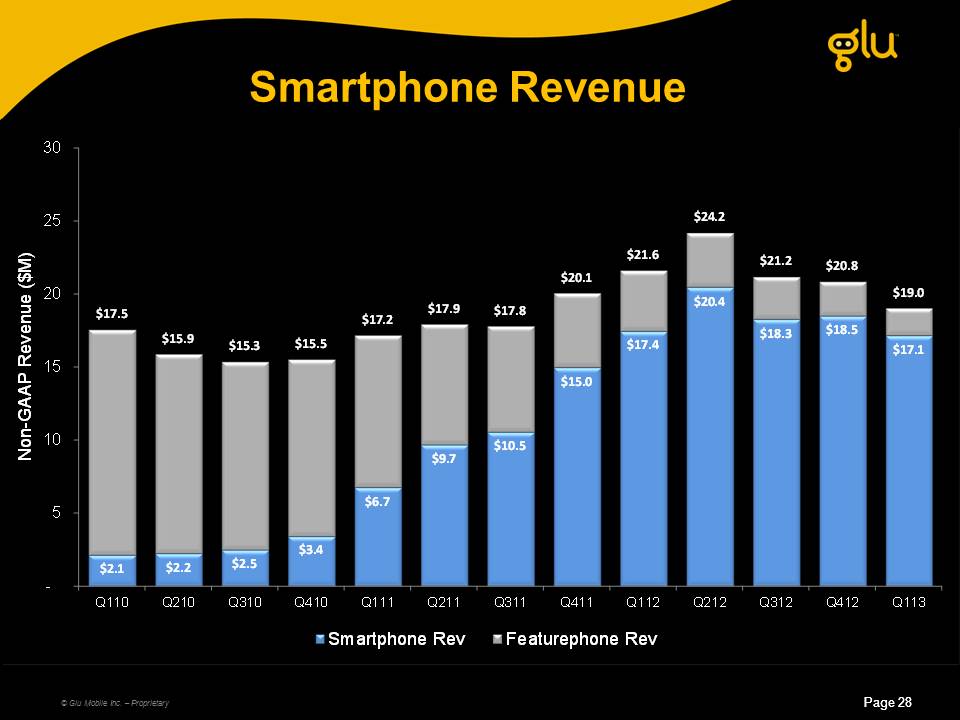
Page 28 Smartphone Revenue © Glu Mobile Inc. – Proprietary (in millions of dollars)
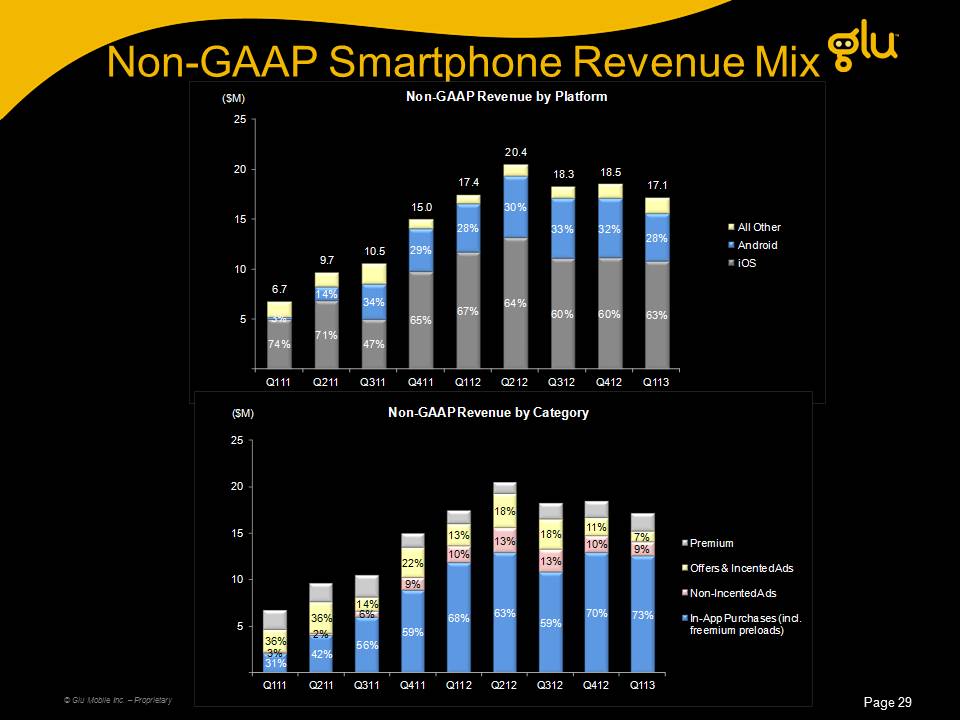
Non-GAAP Smartphone Revenue Mix Page 29 © Glu Mobile Inc. – Proprietary
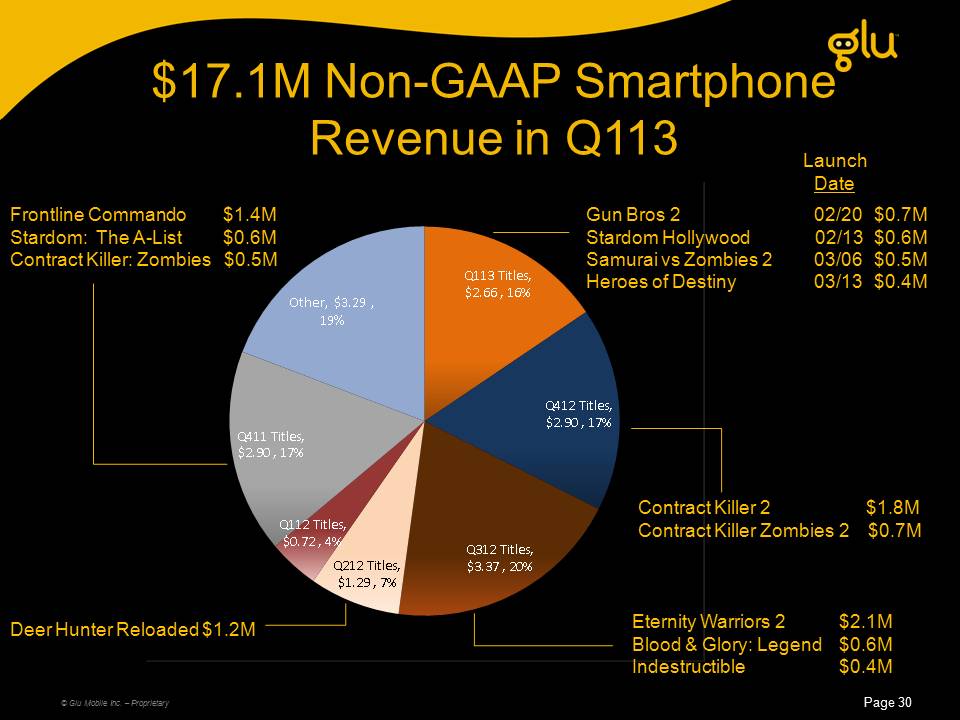
$17.1M Non-GAAP Smartphone Revenue in Q113 Frontline Commando$1.4MStardom: The A-List $0.6MContract Killer: Zombies $0.5M Eternity Warriors 2 $2.1MBlood & Glory: Legend $0.6MIndestructible $0.4M Deer Hunter Reloaded $1.2M Contract Killer 2 $1.8MContract Killer Zombies 2 $0.7M LaunchDate Gun Bros 2 02/20 $0.7MStardom Hollywood 02/13 $0.6MSamurai vs Zombies 2 03/06 $0.5MHeroes of Destiny 03/13 $0.4M
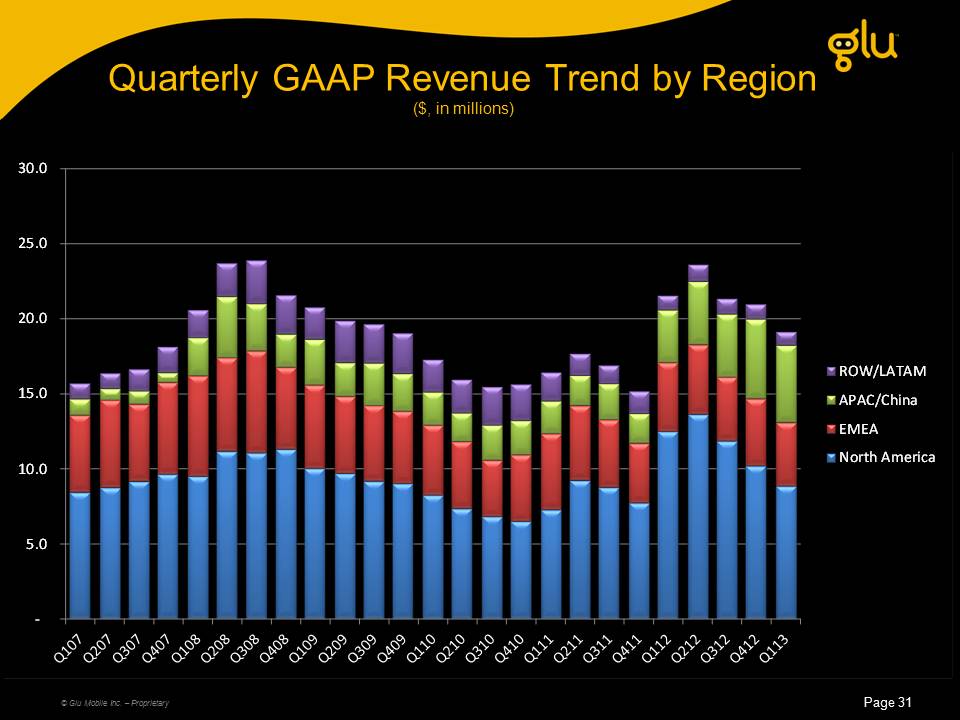
Quarterly GAAP Revenue Trend by Region ($, in millions) Page 31 © Glu Mobile Inc. – Proprietary
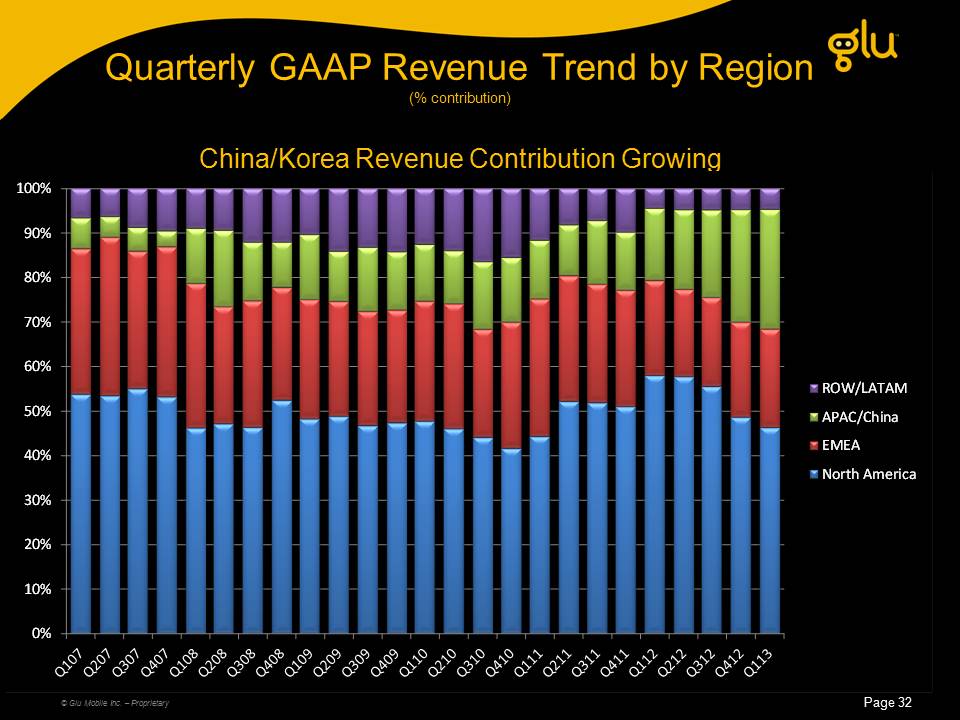
Quarterly GAAP Revenue Trend by Region (% contribution) China/Korea Revenue Contribution Growing Page 32 © Glu Mobile Inc. – Proprietary
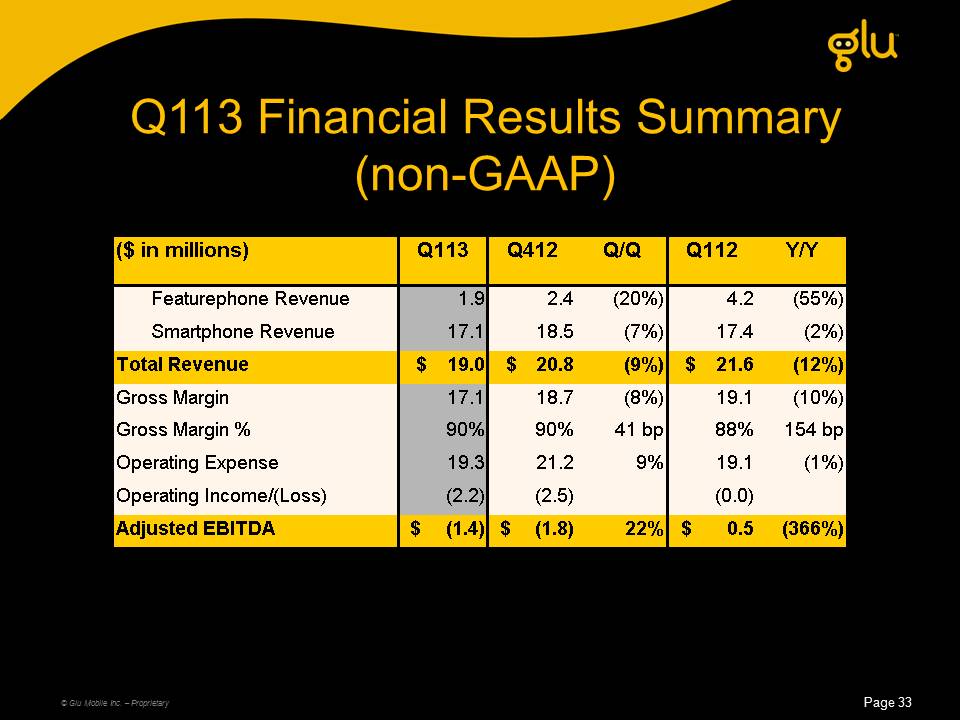
Q113 Financial Results Summary (non-GAAP) © Glu Mobile Inc. – Proprietary
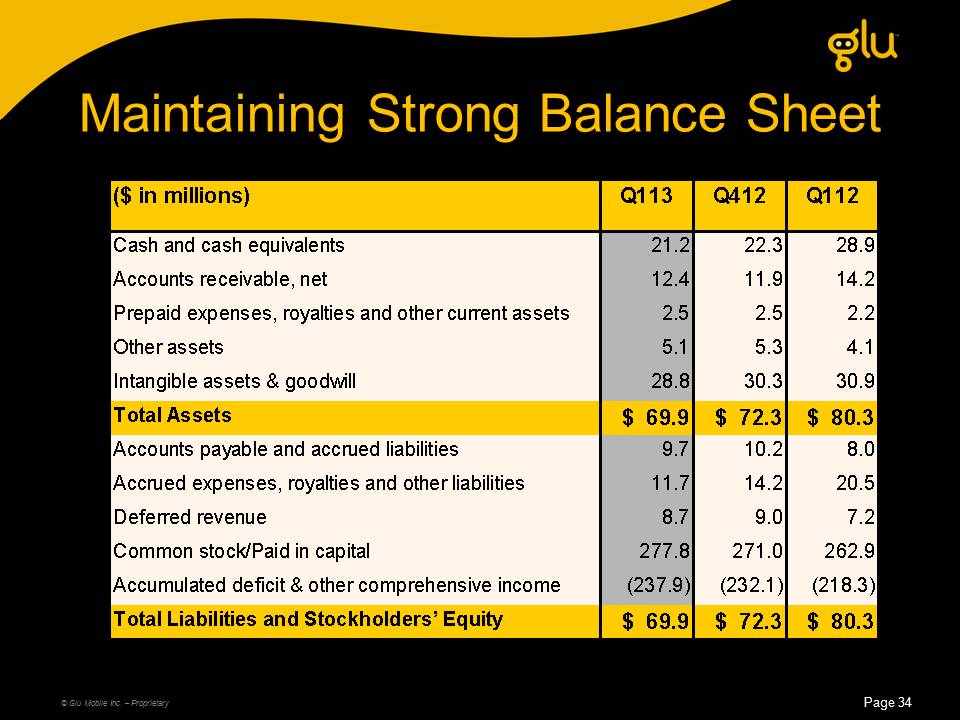
Maintaining Strong Balance Sheet © Glu Mobile Inc. – Proprietary Page 34

Q213 and Full Year 2013 Guidance and Long Term Model © Glu Mobile Inc. – Proprietary
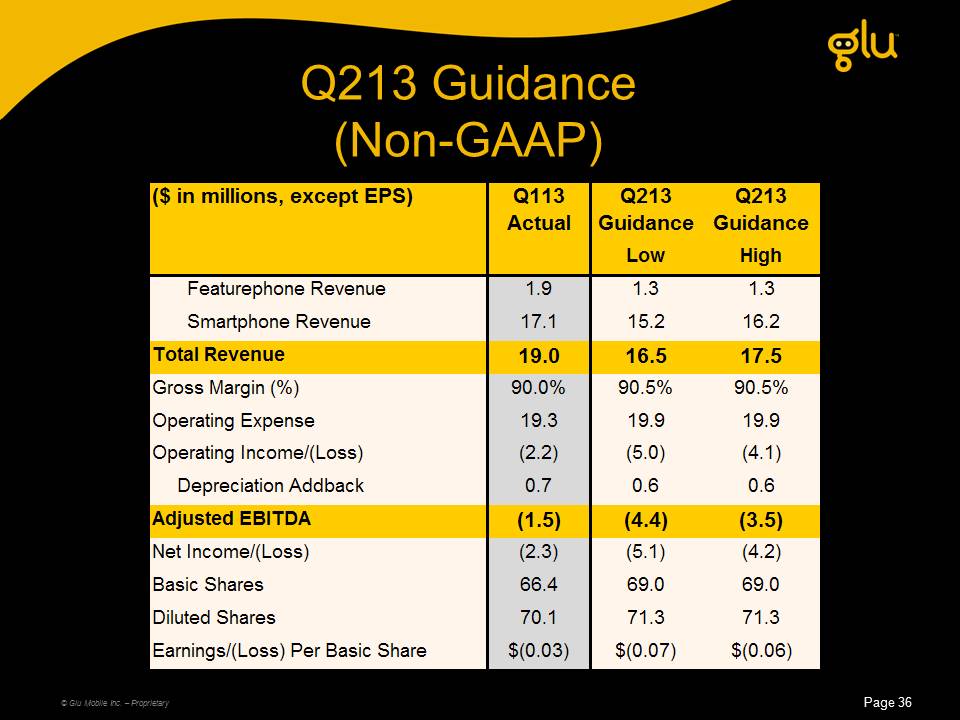
Q213 Guidance (Non-GAAP) © Glu Mobile Inc. – Proprietary
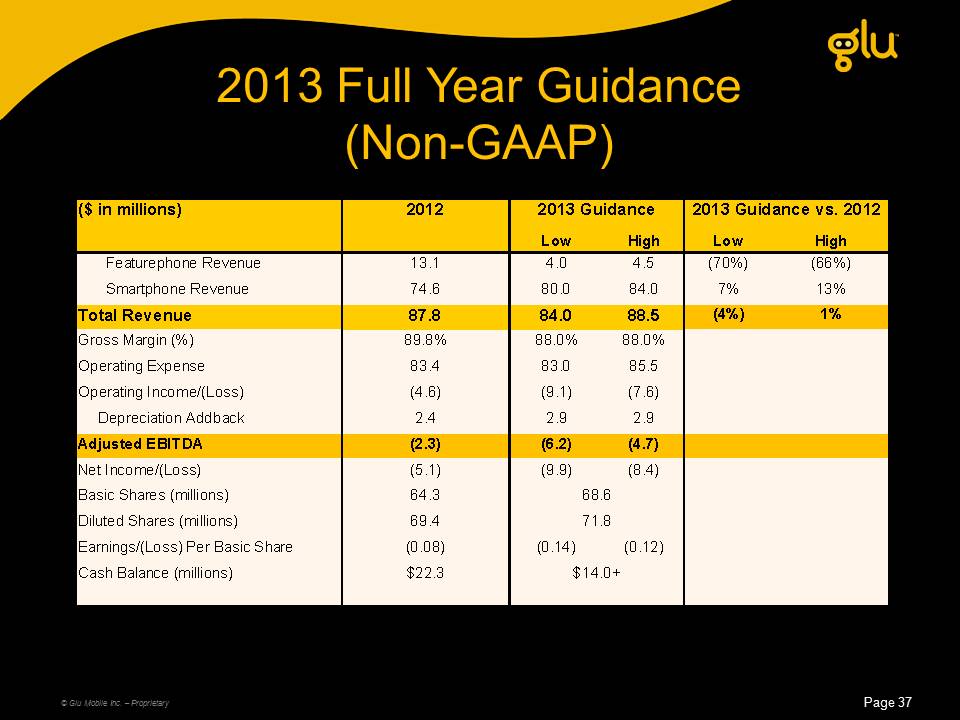
2013 Full Year Guidance (Non-GAAP) © Glu Mobile Inc. – Proprietary
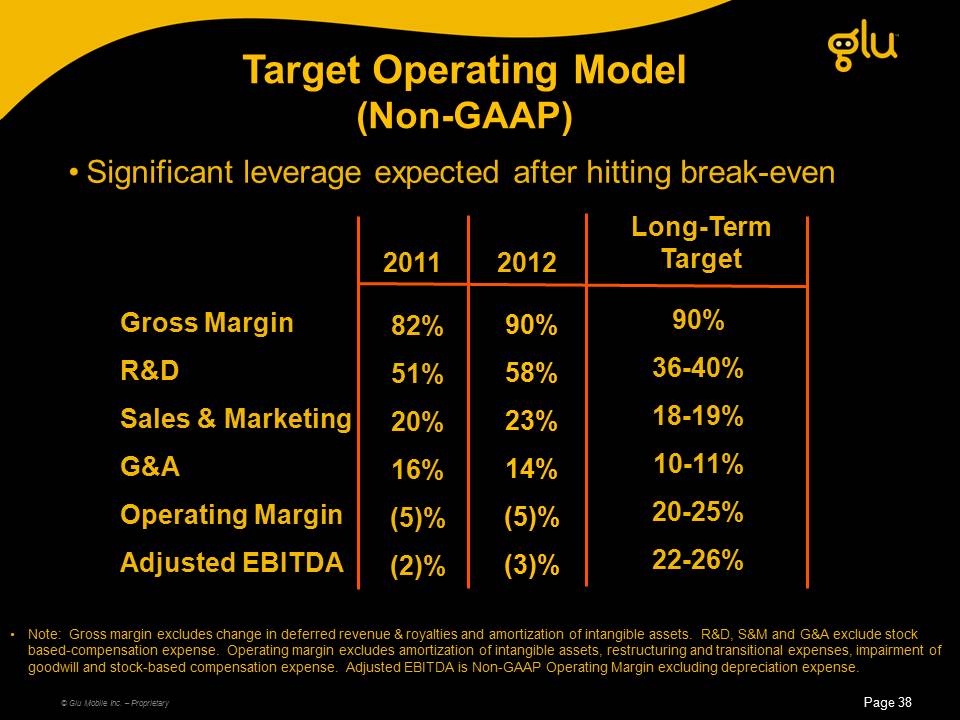
Target Operating Model(Non-GAAP) Gross MarginR&DSales & MarketingG&A Operating MarginAdjusted EBITDA Note: Gross margin excludes change in deferred revenue & royalties and amortization of intangible assets. R&D, S&M and G&A exclude stock based-compensation expense. Operating margin excludes amortization of intangible assets, restructuring and transitional expenses, impairment of goodwill and stock-based compensation expense. Adjusted EBITDA is Non-GAAP Operating Margin excluding depreciation expense. (Gp:) 82%51%20%16%(5)%(2)% (Gp:) 2011 (Gp:) 90%36-40%18-19%10-11%20-25%22-26% (Gp:) Long-TermTarget © Glu Mobile Inc. – Proprietary Page 38 (Gp:) 90%58%23%14%(5)%(3)% (Gp:) 2012 Significant leverage expected after hitting break-even
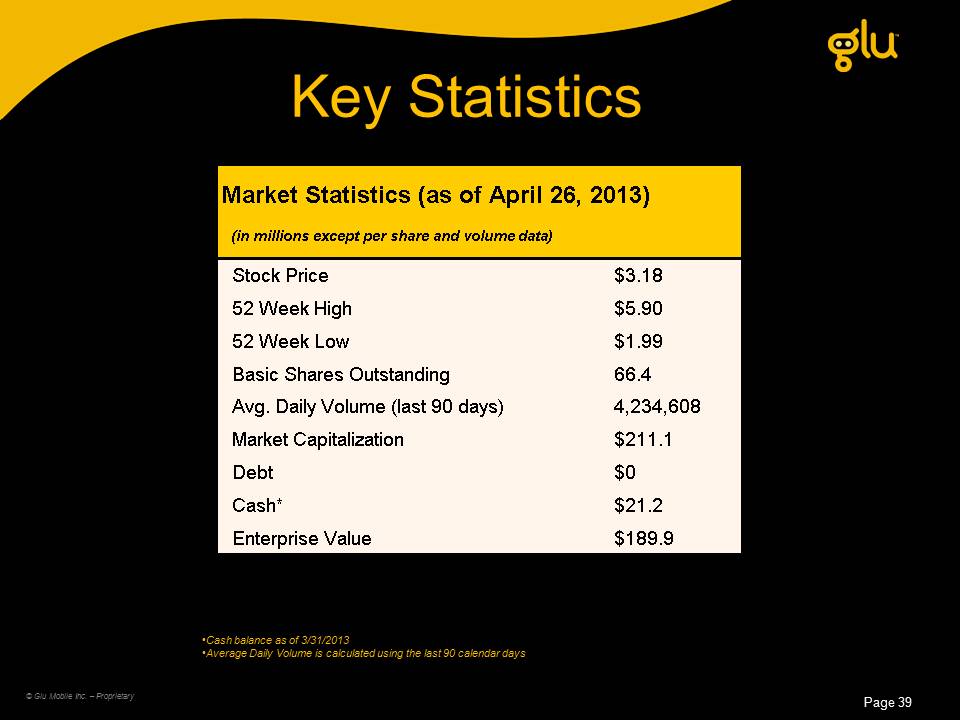
Key Statistics © Glu Mobile Inc. – Proprietary Page 39 Cash balance as of 3/31/2013Average Daily Volume is calculated using the last 90 calendar days
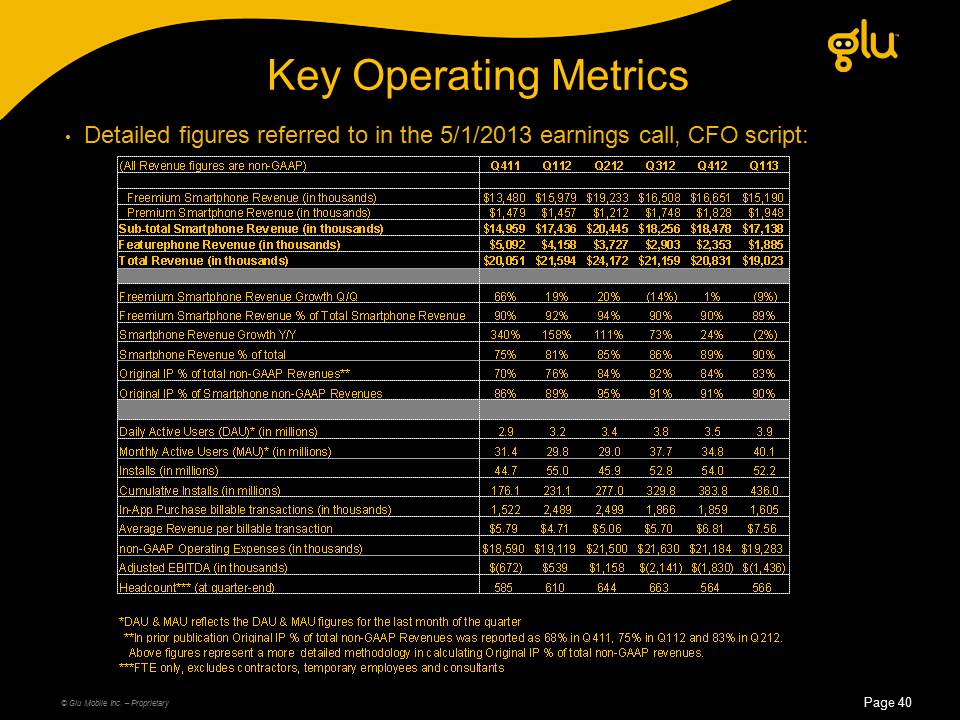
Key Operating Metrics Detailed figures referred to in the 5/1/2013 earnings call, CFO script: Page 40 © Glu Mobile Inc. – Proprietary
Glu Mobile: Investment Overview Strong secular global growth opportunity Original IP titles driving gross margin improvements Well positioned for Social Gaming 2.0 Page 41 © Glu Mobile Inc. – Proprietary