Exhibit 99.02

Glu Mobile Q213 Earnings Call August 6, 2013
Safe-Harbor Statement This presentation contains "forward-looking" statements including those regarding: estimated growth and expected trends in smartphone users and global mobile traffic; momentum in global tablet growth; the expected number of third party games Glu expects to publish in 2013 and 2014 and the expected gross margin Glu expects to generate from its 1st and 3rd party titles; our belief that we have the foundation in place for the long-term growth; our belief that there is a significant opportunity for increased mobile ad spending, particularly in the U.S.; expected trends in wearable computing; our guidance for Q3 2013 and FY 2013; and our expectations that we will begin launching 1st and 3rd party Games-as-a-Service titles in late Q3 2013. These forward-looking statements are subject to material risks and uncertainties that could cause actual results to differ materially from those in the forward-looking statements. Investors should consider important risk factors, which include: the risk that consumer demand for smartphones, tablets and next-generation platforms does not grow as significantly as we anticipate or that we will be unable to capitalize on any such growth; the risk that we do not realize a sufficient return on our investment with respect to our efforts to develop free-to-play games for smartphones and tablets, the risk that we do not maintain our good relationships with Apple and Google; the risk that our development expenses for games for smartphones are greater than we anticipate; the risk that our recently and newly launched games are less popular than anticipated; the risk that our newly released games will be of a quality less than desired by reviewers and consumers; the risk that the mobile games market, particularly with respect to social, free-to-play gaming, is smaller than anticipated; risks related to the restatement of certain of our historical financial statements and other risks detailed under the caption "Risk Factors" in our Form 10-Q filed with the Securities and Exchange Commission on May 10, 2013 and our other SEC filings. You can locate these reports through our website at http://www.glu.com/investors. These "forward-looking" statements are based on estimates and information available to us on August 6, 2013 and we are under no obligation, and expressly disclaim any obligation, to update or alter our forward-looking statements whether as a result of new information, future events or otherwise.
Title: Use of Non-GAAP Financial Measures Glu uses in this presentation certain non-GAAP measures of financial performance. The presentation of these non-GAAP financial measures is not intended to be considered in isolation from, as a substitute for, or superior to, the financial information prepared and presented in accordance with GAAP, and may be different from non-GAAP financial measures used by other companies. In addition, these non-GAAP measures have limitations in that they do not reflect all of the amounts associated with Glu's results of operations as determined in accordance with GAAP. The non-GAAP financial measures used by Glu include non-GAAP revenues, non-GAAP smartphone revenues, non-GAAP freemium revenues, non-GAAP cost of revenues, non-GAAP gross profit, non-GAAP gross margin, non-GAAP operating expenses, non-GAAP operating margin, non-GAAP net income/(loss), non-GAAP net income/(loss) per share and Adjusted EBITDA. These non-GAAP financial measures exclude the following items from Glu's unaudited consolidated statements of operations: Change in deferred revenues and deferred cost of revenues;Amortization of intangible assets; Stock-based compensation expense; Restructuring charges; Change in fair value of Blammo earnout; Transitional costs; Impairment of goodwill;Release of tax liabilities; andForeign currency exchange gains and losses primarily related to the revaluation of assets and liabilities. In addition, Glu has included in this presentation “Adjusted EBITDA” figures which are used to evaluate Glu’s operating performance and is defined as non-GAAP operating income/(loss) excluding depreciation.Glu believes that these non-GAAP financial measures, when taken together with the corresponding GAAP financial measures, provide meaningful supplemental information regarding Glu's performance by excluding certain items that may not be indicative of Glu's core business, operating results or future outlook. Glu's management uses, and believes that investors benefit from referring to, these non-GAAP financial measures in assessing Glu's operating results, as well as when planning, forecasting and analyzing future periods. These non-GAAP financial measures also facilitate comparisons of Glu's performance to prior periods. For a reconciliation of these non-GAAP financial measures to their most directly comparable GAAP financial measures, please refer to the tables attached to Glu’s earnings press release for the quarter ended June 30, 2013, which is available on our website at http://www.glu.com/investors. © Glu Mobile Inc. – Proprietary

Featurephone focusTitles are packaged goodsPremium pricingNo community/social Evolution of Mobile Gaming Now Compelling to Mass Market + Smartphone & TabletFree-to-play with virtual goodsGames are social & persistent services © Glu Mobile Inc. – Proprietary
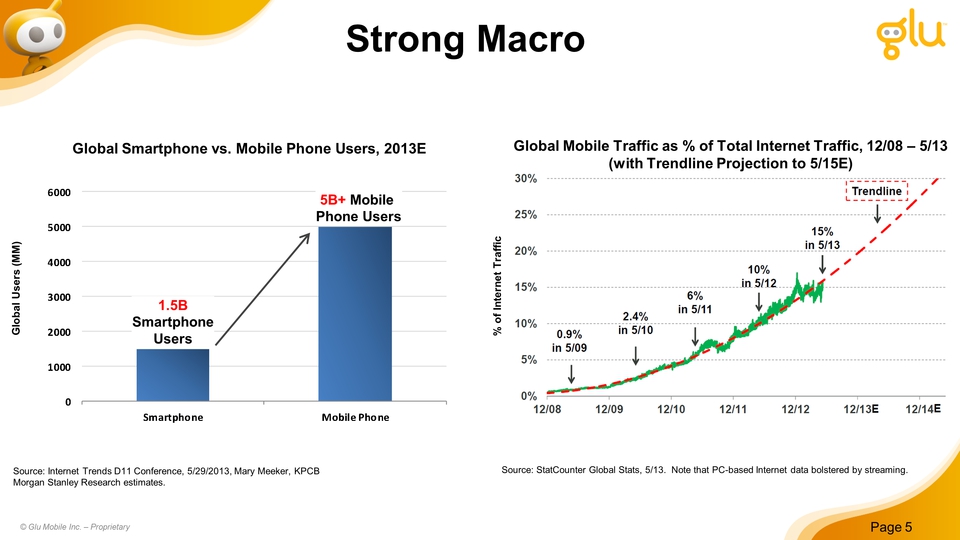
Strong Macro Other Placeholder: Page 5 Global Users (MM) Source: Internet Trends D11 Conference, 5/29/2013, Mary Meeker, KPCB Morgan Stanley Research estimates. Global Smartphone vs. Mobile Phone Users, 2013E 1.5BSmartphoneUsers 5B+ Mobile Phone Users % of Internet Traffic Global Mobile Traffic as % of Total Internet Traffic, 12/08 – 5/13(with Trendline Projection to 5/15E) © Glu Mobile Inc. – Proprietary Source: StatCounter Global Stats, 5/13. Note that PC-based Internet data bolstered by streaming
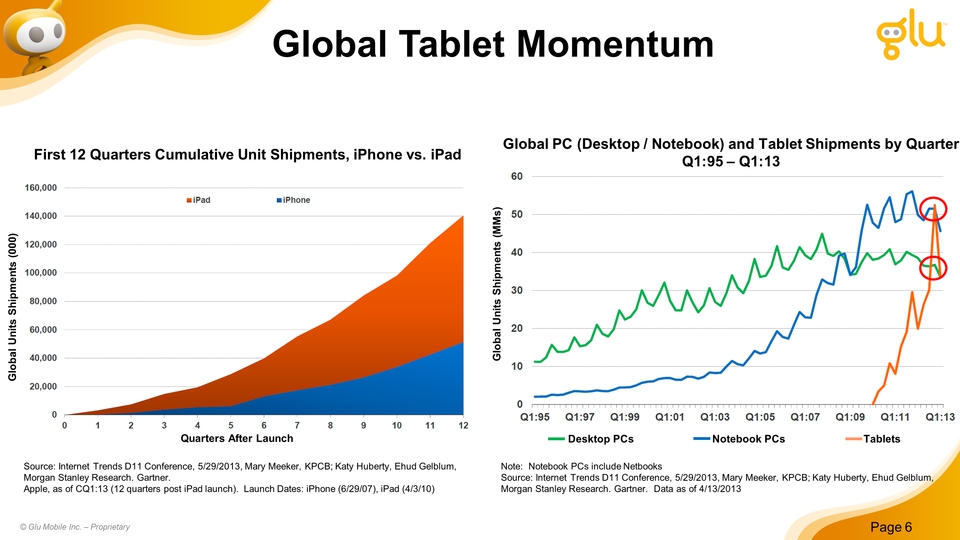
Title: Global Tablet Momentum Other Placeholder: Page 6 Source: Internet Trends D11 Conference, 5/29/2013, Mary Meeker, KPCB; Katy Huberty, Ehud Gelblum, Morgan Stanley Research. Gartner. Apple, as of CQ1:13 (12 quarters post iPad launch). Launch Dates: iPhone (6/29/07), iPad (4/3/10) Global Units Shipments (MMs) Notebook PCs Tablets Desktop PCs Global PC (Desktop / Notebook) and Tablet Shipments by QuarterQ1:95 – Q1:13 Quarters After Launch Global Units Shipments (000) First 12 Quarters Cumulative Unit Shipments, iPhone vs. iPad © Glu Mobile Inc. – Proprietary Note: Notebook PCs include NetbooksSource: Internet Trends D11 Conference, 5/29/2013, Mary Meeker, KPCB; Katy Huberty, Ehud Gelblum, Morgan Stanley Research. Gartner. Data as of 4/13/2013

Corporate Overview
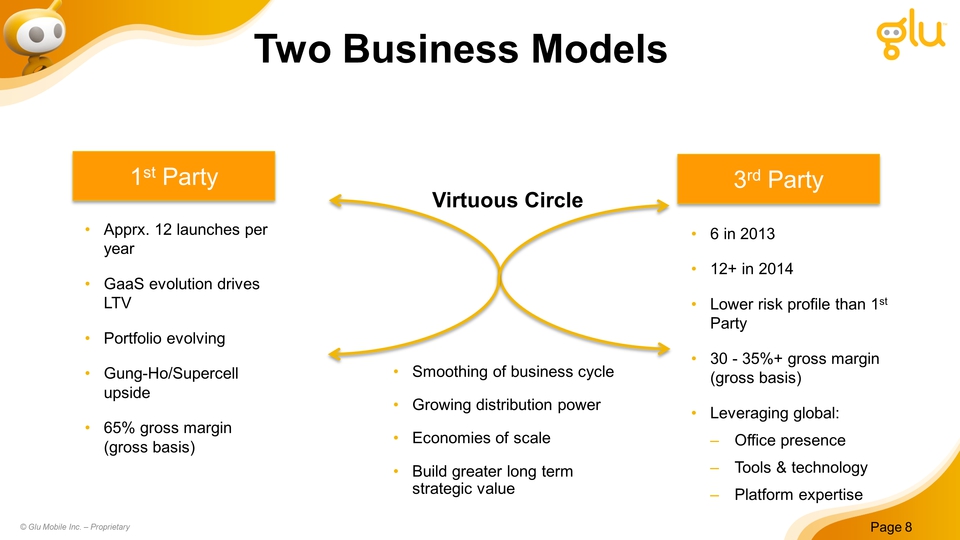
Title: Virtuous Circle Other Placeholder: Page 8 1st Party 3rd Party 6 in 201312+ in 2014Lower risk profile than 1st Party30 - 35%+ gross margin (gross basis)Leveraging global:Office presence Tools & technology Platform expertise Apprx. 12 launches per yearGaaS evolution drives LTVPortfolio evolvingGung-Ho/Supercell upside65% gross margin (gross basis) Smoothing of business cycleGrowing distribution powerEconomies of scaleBuild greater long term strategic value © Glu Mobile Inc. – Proprietary Two Business Models
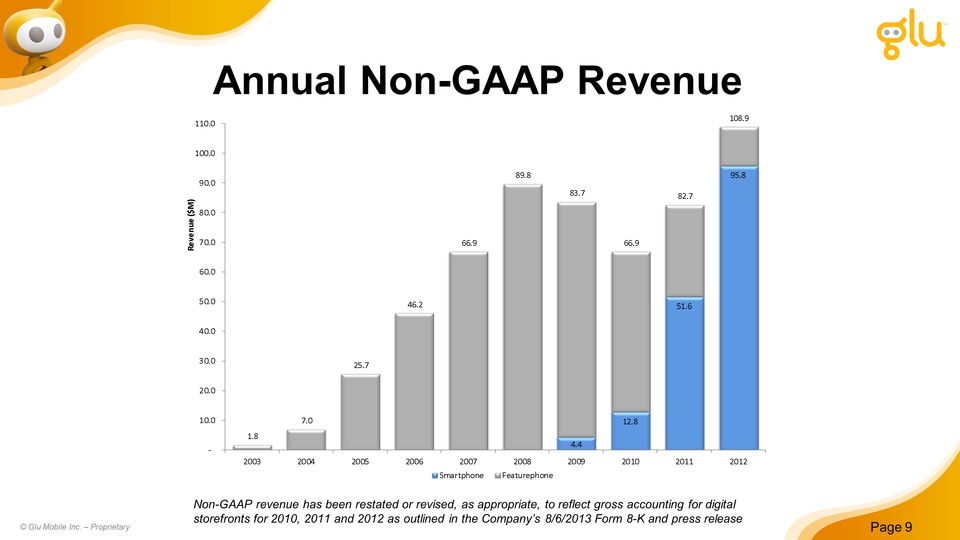
Title: Annual Non-GAAP Revenue Other Placeholder: Page 9 © Glu Mobile Inc. – Proprietary Non-GAAP revenue has been restated or revised, as appropriate, to reflect gross accounting for digital storefronts for 2010, 2011 and 2012 as outlined in the Company’s 8/6/2013 Form 8-K and press release
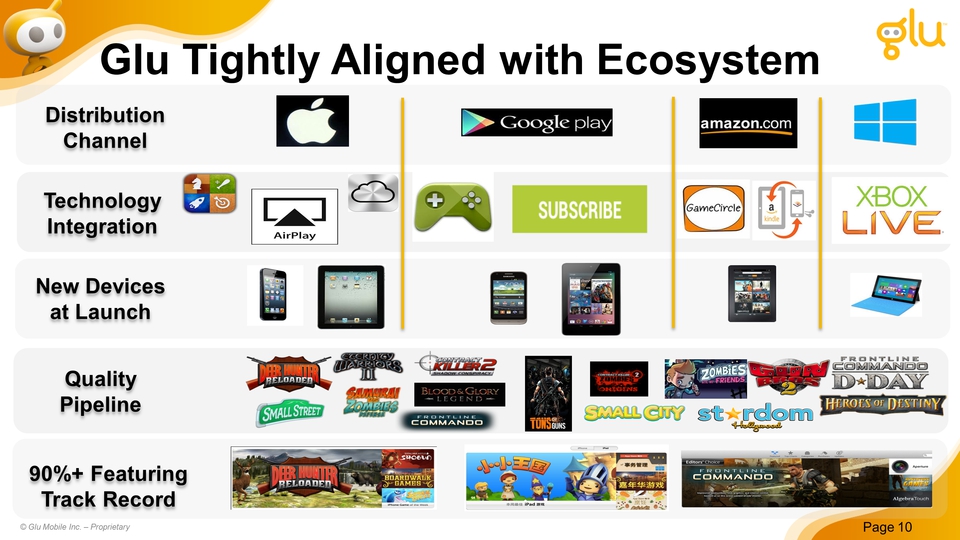
Technology Integration 90%+ Featuring Track Record New Devices at Launch Title: Glu Tightly Aligned with Ecosystem DistributionChannel Quality Pipeline Other Placeholder: Page 10 © Glu Mobile Inc. – Proprietary
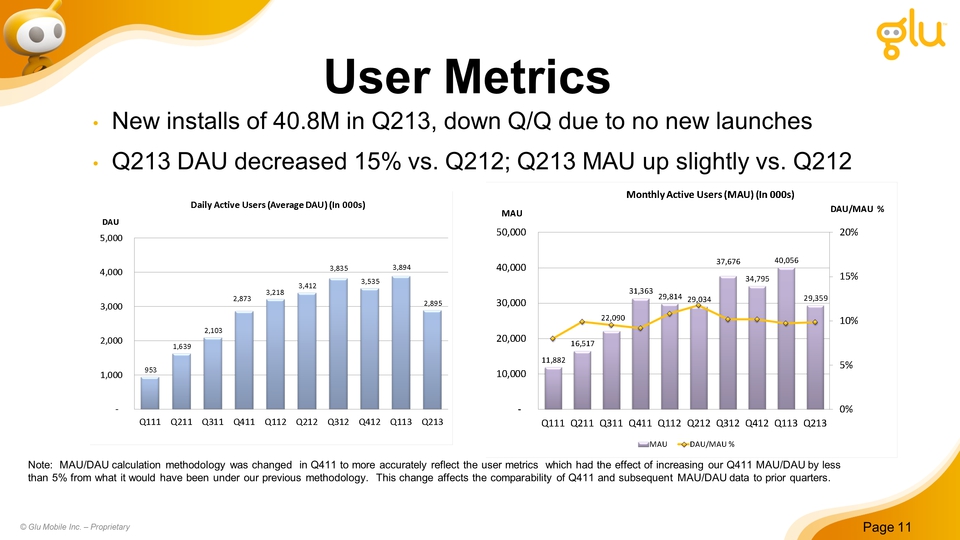
New installs of 40.8M in Q213, down Q/Q due to no new launchesQ213 DAU decreased 15% vs. Q212; Q213 MAU up slightly vs. Q212 User Metrics Note: MAU/DAU calculation methodology was changed in Q411 to more accurately reflect the user metrics which had the effect of increasing our Q411 MAU/DAU by less than 5% from what it would have been under our previous methodology. This change affects the comparability of Q411 and subsequent MAU/DAU data to prior quarters. Other Placeholder: Page 11 © Glu Mobile Inc. – Proprietary
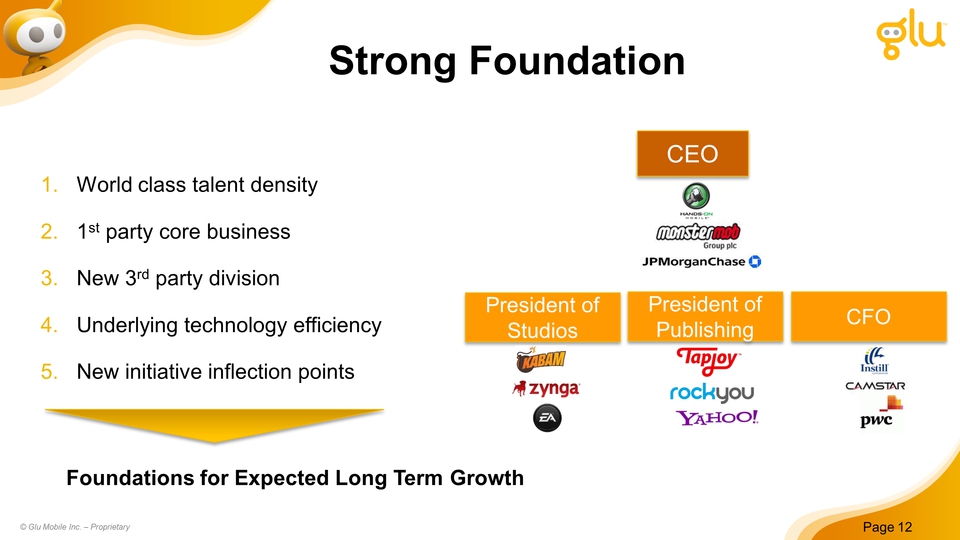
Title: Strong Foundation Other Placeholder: World class talent density1st party core businessNew 3rd party divisionUnderlying technology efficiencyNew initiative inflection points President of Studios President of Publishing CFO CEO Foundations for Expected Long Term Growth © Glu Mobile Inc. – Proprietary

Future of Mobile Gaming Other Placeholder: Page 13 © Glu Mobile Inc. – Proprietary
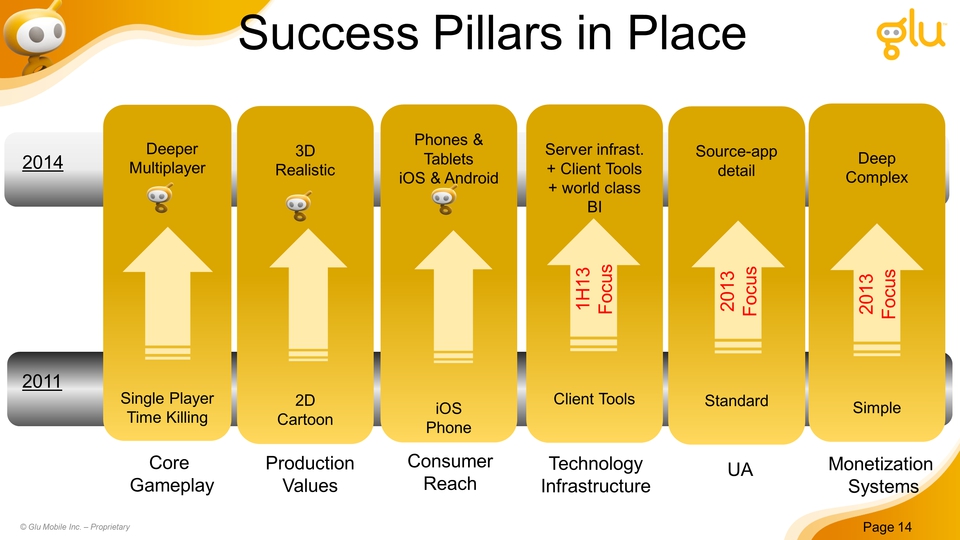
Title: Success Pillars in Place 3DRealistic2DCartoon ProductionValues DeeperMultiplayerSingle PlayerTime Killing Core Gameplay Phones & TabletsiOS & AndroidiOSPhone Consumer Reach 2011 2014 DeepComplexSimple TechnologyInfrastructure Other Placeholder: Page 14 Server infrast.+ Client Tools+ world class BIClient Tools UA Source-app detailStandard Monetization Systems 2013 Focus © Glu Mobile Inc. – Proprietary 1H13 Focus 2013 Focus

Quad Screen Future © Glu Mobile Inc. – Proprietary
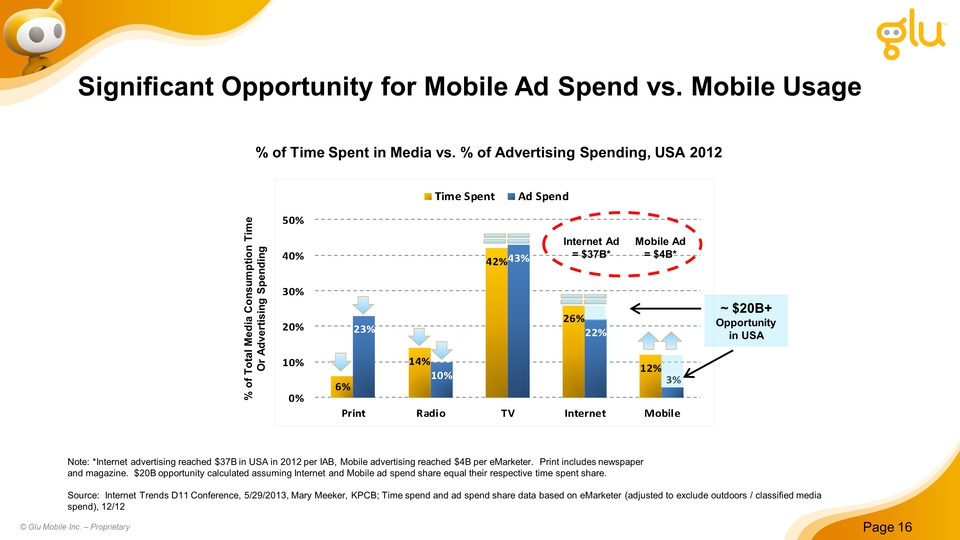
Title: Significant Opportunity for Mobile Ad Spend vs. Mobile Usage % of Time Spent in Media vs. % of Advertising Spending, USA 2012 Note: *Internet advertising reached $37B in USA in 2012 per IAB, Mobile advertising reached $4B per eMarketer. Print includes newspaperand magazine. $20B opportunity calculated assuming Internet and Mobile ad spend share equal their respective time spent share. Source: Internet Trends D11 Conference, 5/29/2013, Mary Meeker, KPCB; Time spend and ad spend share data based on eMarketer (adjusted to exclude outdoors / classified media spend), 12/12 % of Total Media Consumption TimeOr Advertising Spending ~ $20B+Opportunity in USA (Gp:) Internet Ad= $37B* (Gp:) Mobile Ad= $4B* © Glu Mobile Inc. – Proprietary
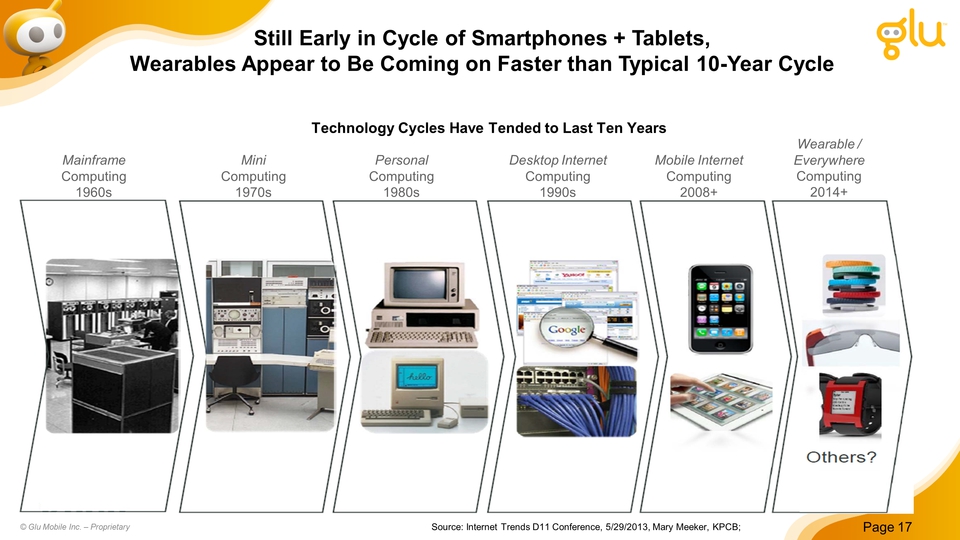
Title: Still Early in Cycle of Smartphones + Tablets, Wearables Appear to Be Coming on Faster than Typical 10-Year Cycle Other Placeholder: Page 17 Source: Internet Trends D11 Conference, 5/29/2013, Mary Meeker, KPCB; xxx MainframeComputing1960s Technology Cycles Have Tended to Last Ten Years MiniComputing1970s PersonalComputing1980s Desktop InternetComputing1990s Mobile InternetComputing2008+ Wearable / EverywhereComputing2014+ © Glu Mobile Inc. – Proprietary

Financials
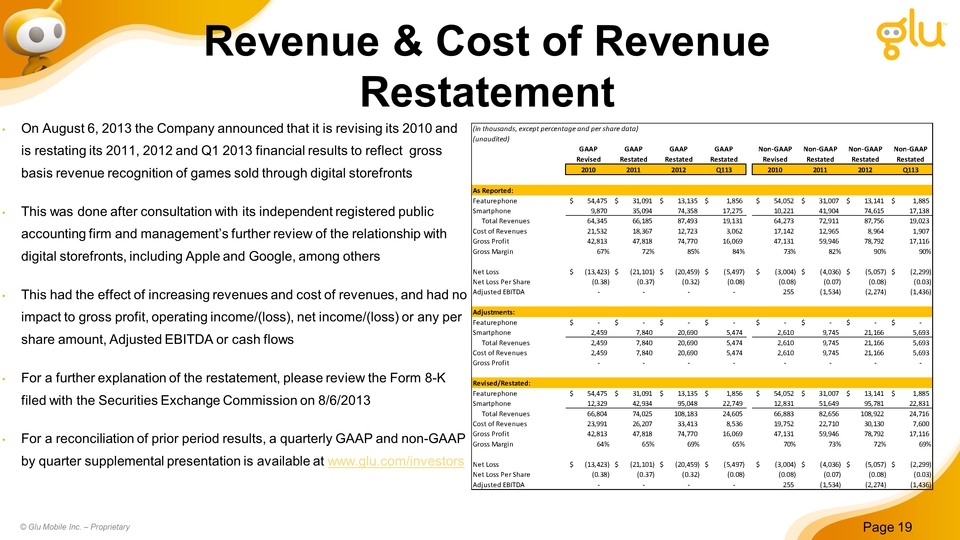
Revenue & Cost of Revenue Restatement On August 6, 2013 the Company announced that it is revising its 2010 and is restating its 2011, 2012 and Q1 2013 financial results to reflect gross basis revenue recognition of games sold through digital storefrontsThis was done after consultation with its independent registered public accounting firm and management’s further review of the relationship with digital storefronts, including Apple and Google, among othersThis had the effect of increasing revenues and cost of revenues, and had no impact to gross profit, operating income/(loss), net income/(loss) or any per share amount, Adjusted EBITDA or cash flowsFor a further explanation of the restatement, please review the Form 8-K filed with the Securities Exchange Commission on 8/6/2013For a reconciliation of prior period results, a quarterly GAAP and non-GAAP by quarter supplemental presentation is available at www.glu.com/investors Other Placeholder: Page 19 © Glu Mobile Inc. – Proprietary
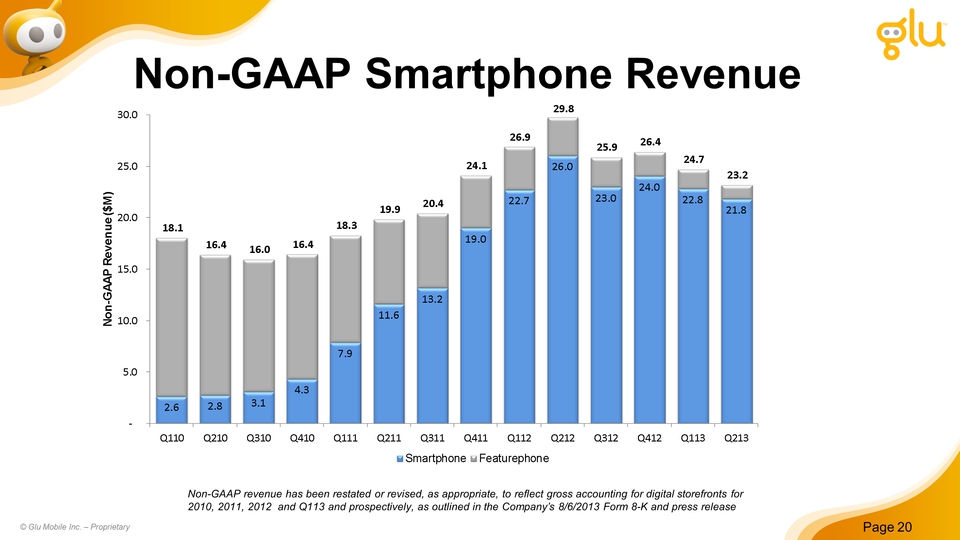
Page 20 Non-GAAP Smartphone Revenue © Glu Mobile Inc. – Proprietary Non-GAAP revenue has been restated or revised, as appropriate, to reflect gross accounting for digital storefronts for 2010, 2011, 2012 and Q113 and prospectively, as outlined in the Company’s 8/6/2013 Form 8-K and press release
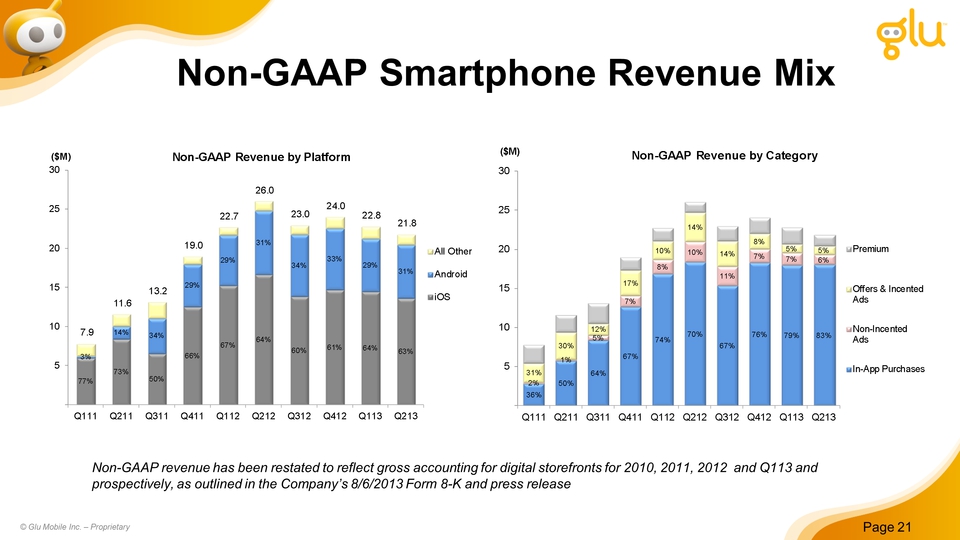
Title: Non-GAAP Smartphone Revenue Mix Other Placeholder: Page 21 © Glu Mobile Inc. – Proprietary Non-GAAP revenue has been restated to reflect gross accounting for digital storefronts for 2010, 2011, 2012 and Q113 and prospectively, as outlined in the Company’s 8/6/2013 Form 8-K and press release
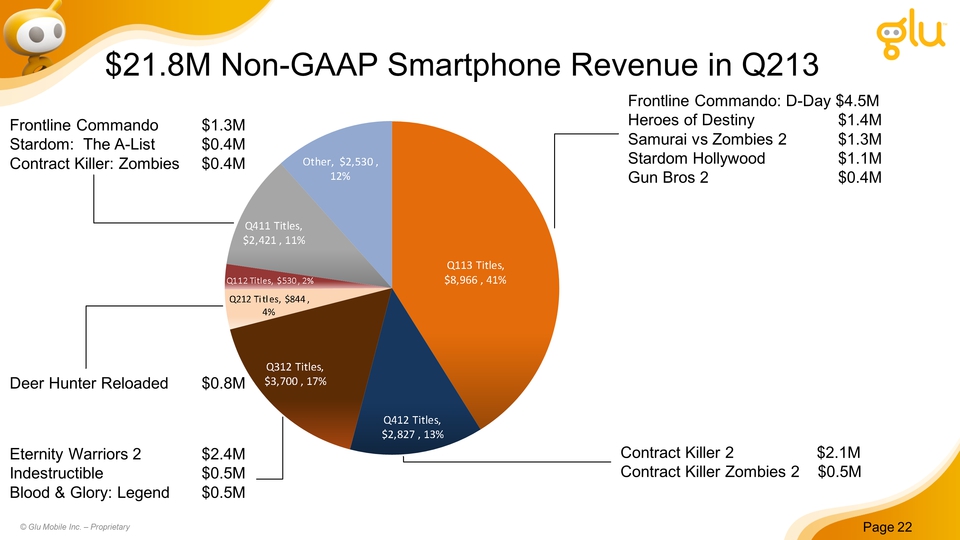
Title: $21.8M Non-GAAP Smartphone Revenue in Q213 Frontline Commando $1.3MStardom: The A-List $0.4MContract Killer: Zombies $0.4M Eternity Warriors 2 $2.4MIndestructible $0.5MBlood & Glory: Legend $0.5M Deer Hunter Reloaded $0.8M Contract Killer 2 $2.1MContract Killer Zombies 2 $0.5M Frontline Commando: D-Day $4.5MHeroes of Destiny $1.4MSamurai vs Zombies 2 $1.3MStardom Hollywood$1.1MGun Bros 2$0.4M © Glu Mobile Inc. – Proprietary
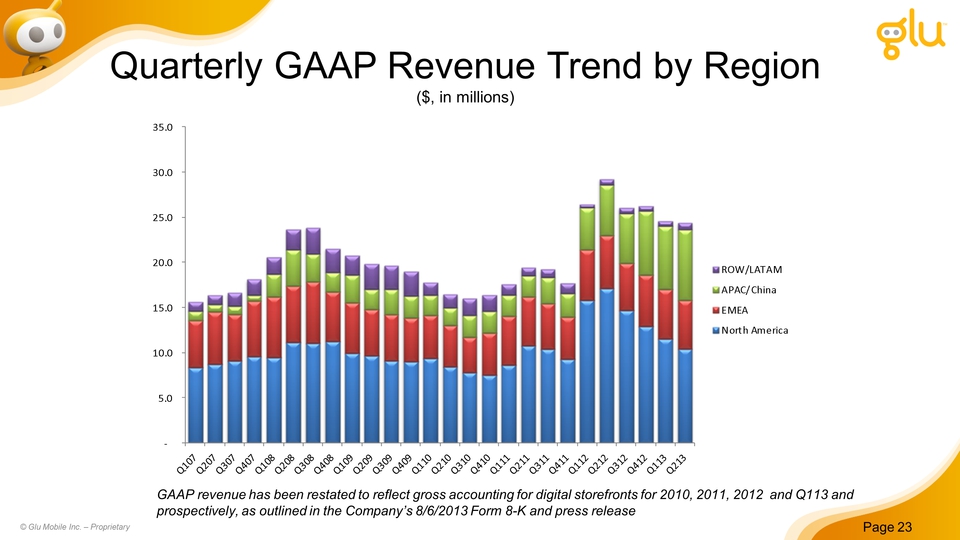
Title: Quarterly GAAP Revenue Trend by Region ($, in millions) Other Placeholder: Page 23 © Glu Mobile Inc. – Proprietary GAAP revenue has been restated to reflect gross accounting for digital storefronts for 2010, 2011, 2012 and Q113 and prospectively, as outlined in the Company’s 8/6/2013 Form 8-K and press release
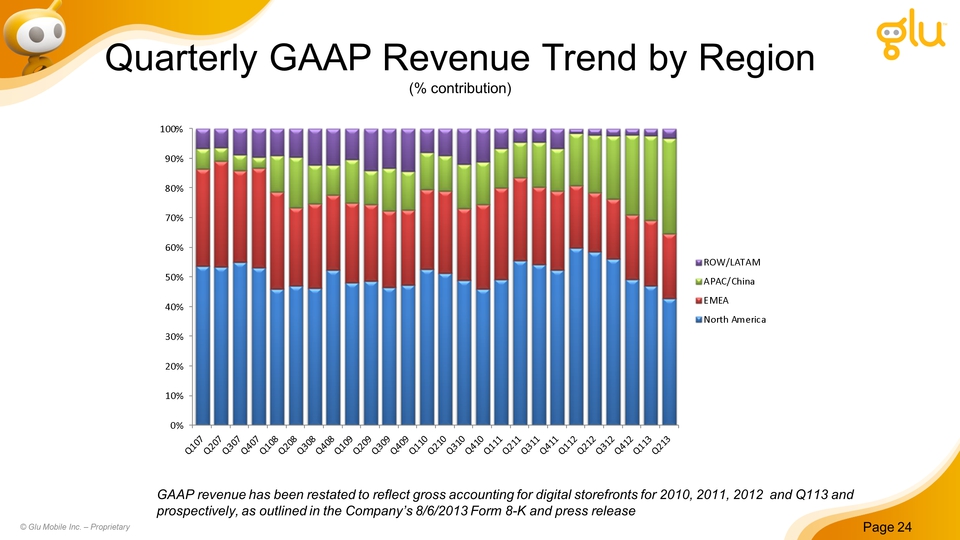
Title: Quarterly GAAP Revenue Trend by Region (% contribution) China/Korea Revenue Contribution Growing Other Placeholder: Page 24 © Glu Mobile Inc. – Proprietary GAAP revenue has been restated to reflect gross accounting for digital storefronts for 2010, 2011, 2012 and Q113 and prospectively, as outlined in the Company’s 8/6/2013 Form 8-K and press release
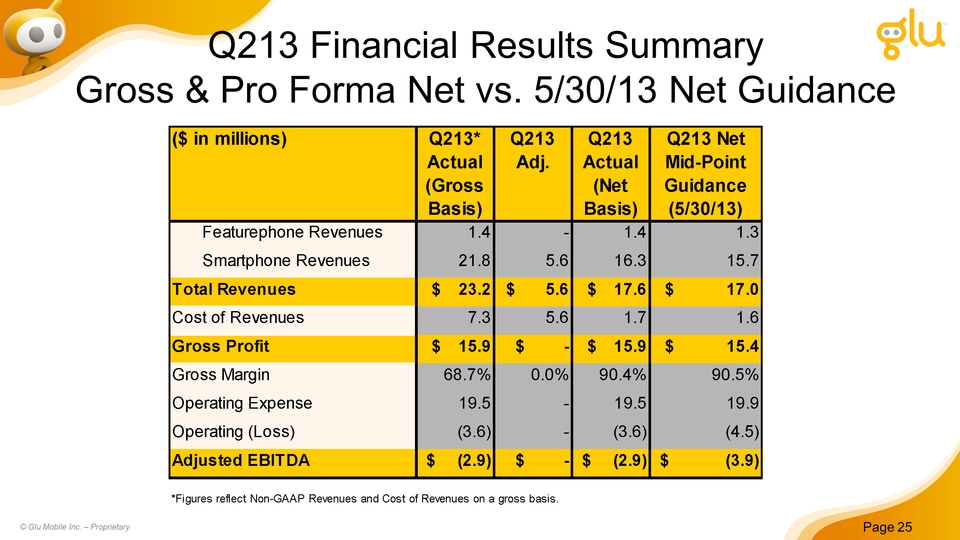
Title: Q213 Financial Results Summary Gross & Pro Forma Net vs. 5/30/13 Net Guidance Other Placeholder: Page 25 © Glu Mobile Inc. – Proprietary
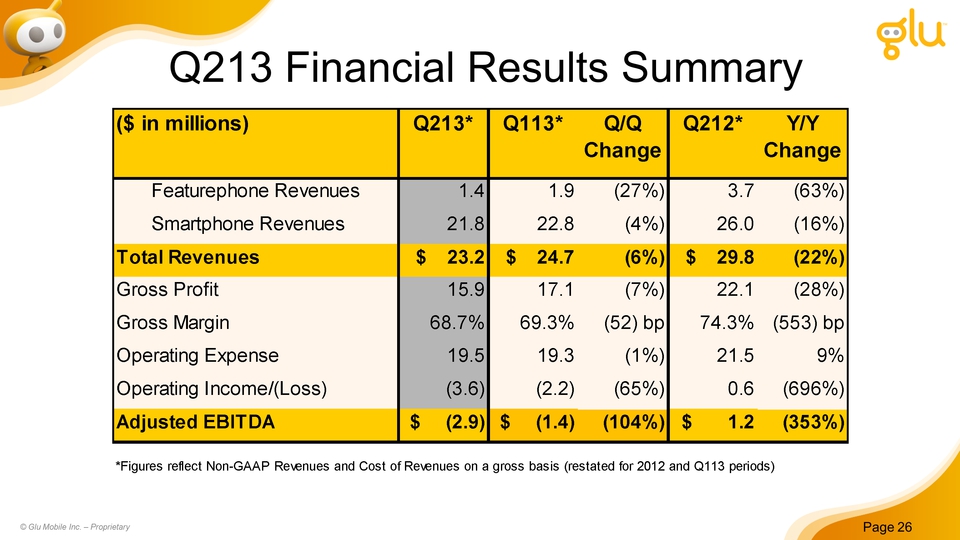
Title: Q213 Financial Results Summary Other Placeholder: Page 26 © Glu Mobile Inc. – Proprietary
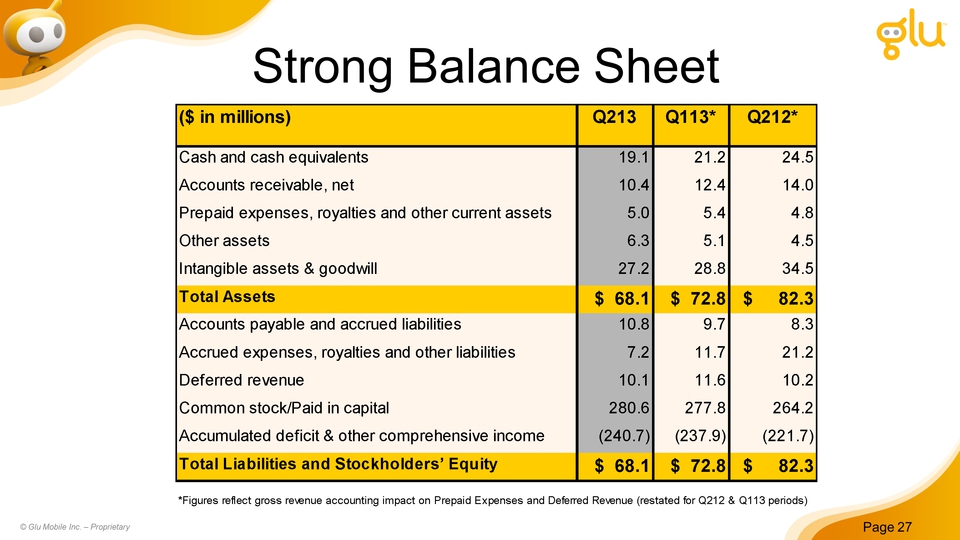
Title: Strong Balance Sheet Other Placeholder: Page 27 © Glu Mobile Inc. – Proprietary

Title: Q313 and Full Year 2013 Guidance Reconciliation with Prior Net Revenue Full Year Guidance Other Placeholder: Page 28 © Glu Mobile Inc. – Proprietary
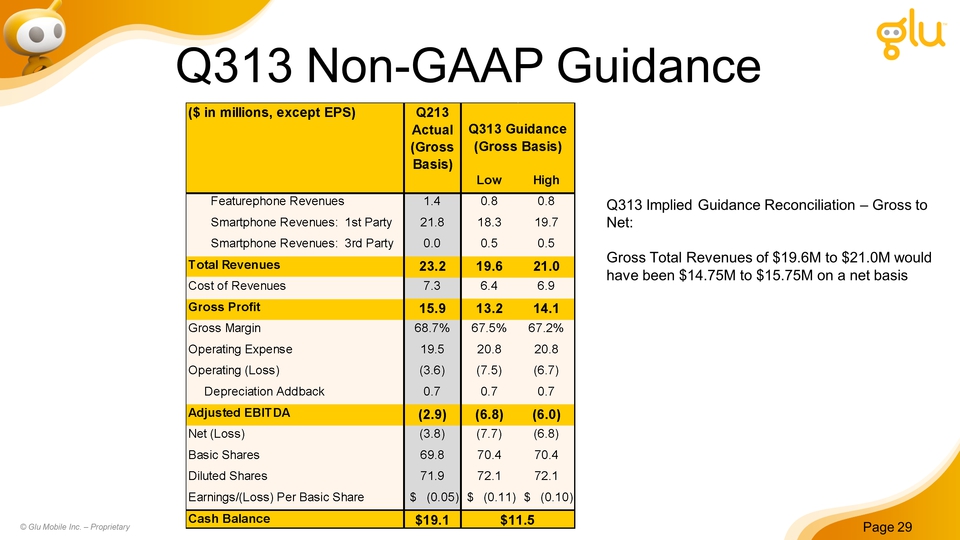
Title: Q313 Non-GAAP Guidance Other Placeholder: Page 29 © Glu Mobile Inc. – Proprietary Q313 Implied Guidance Reconciliation – Gross to Net:Gross Total Revenues of $19.6M to $21.0M would have been $14.75M to $15.75M on a net basis
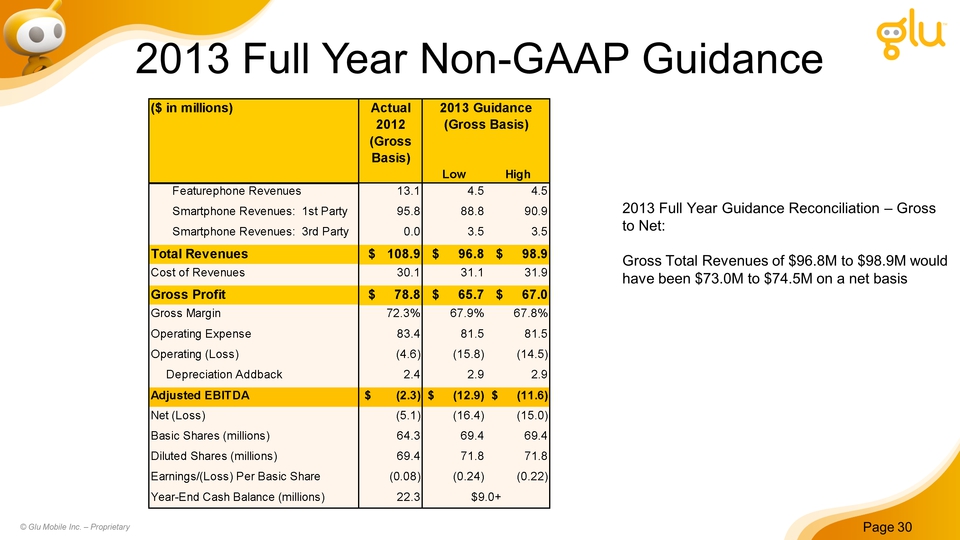
Title: 2013 Full Year Non-GAAP Guidance Other Placeholder: Page 30 © Glu Mobile Inc. – Proprietary 2013 Full Year Guidance Reconciliation – Gross to Net:Gross Total Revenues of $96.8M to $98.9M would have been $73.0M to $74.5M on a net basis
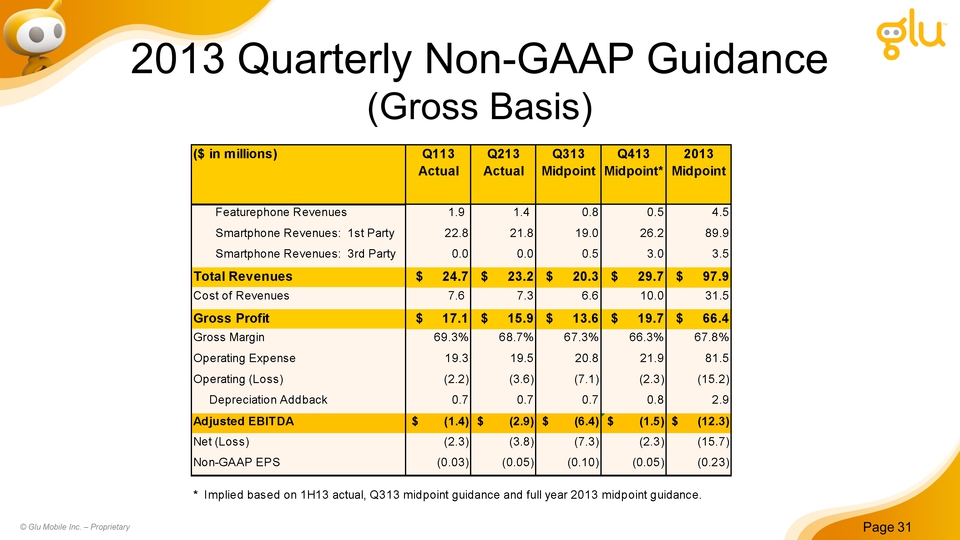
Slide: 31 Title: 2013 Quarterly Non-GAAP Guidance (Gross Basis) Other Placeholder: Page 31 © Glu Mobile Inc. – Proprietary
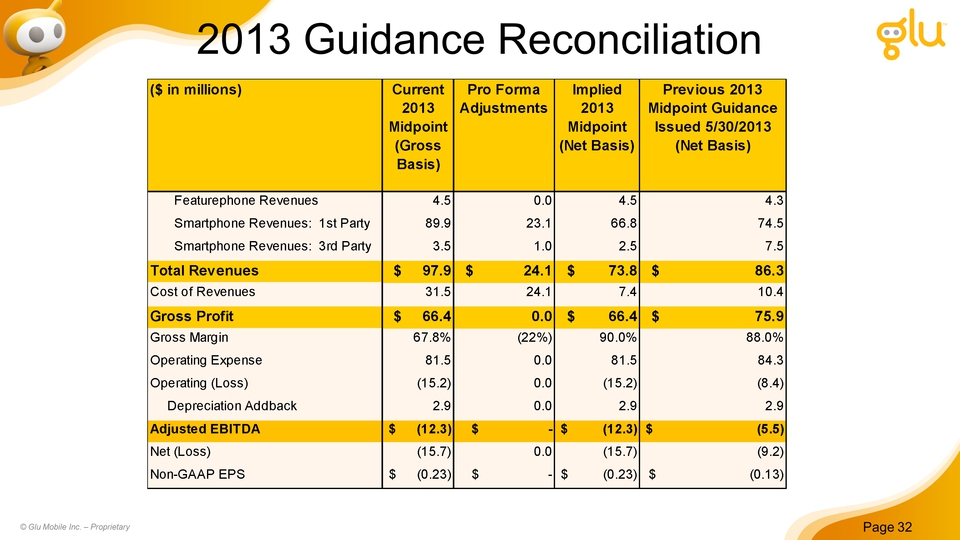
Title: 2013 Guidance Reconciliation Other Placeholder: Page 32 © Glu Mobile Inc. – Proprietary
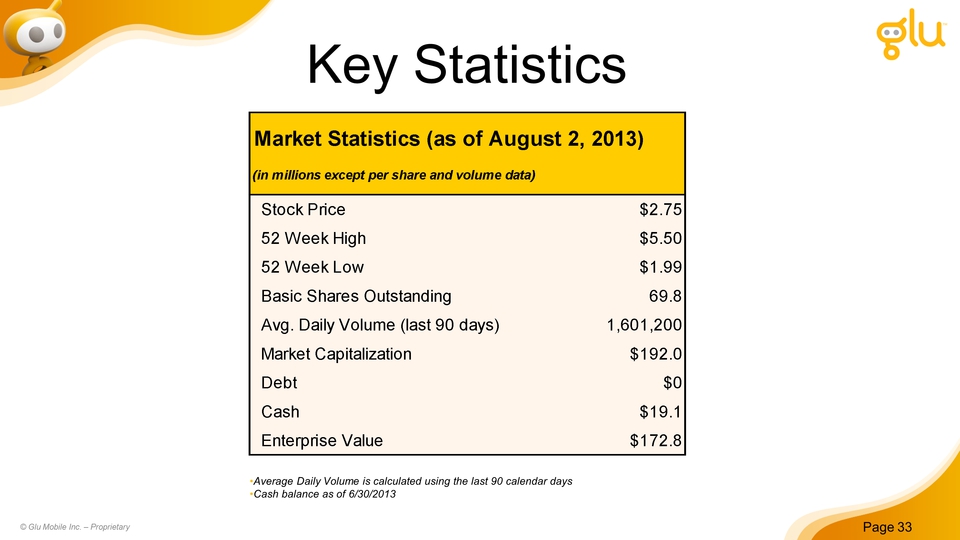
Title: Key Statistics Average Daily Volume is calculated using the last 90 calendar daysCash balance as of 6/30/2013 Page 33 © Glu Mobile Inc. – Proprietary
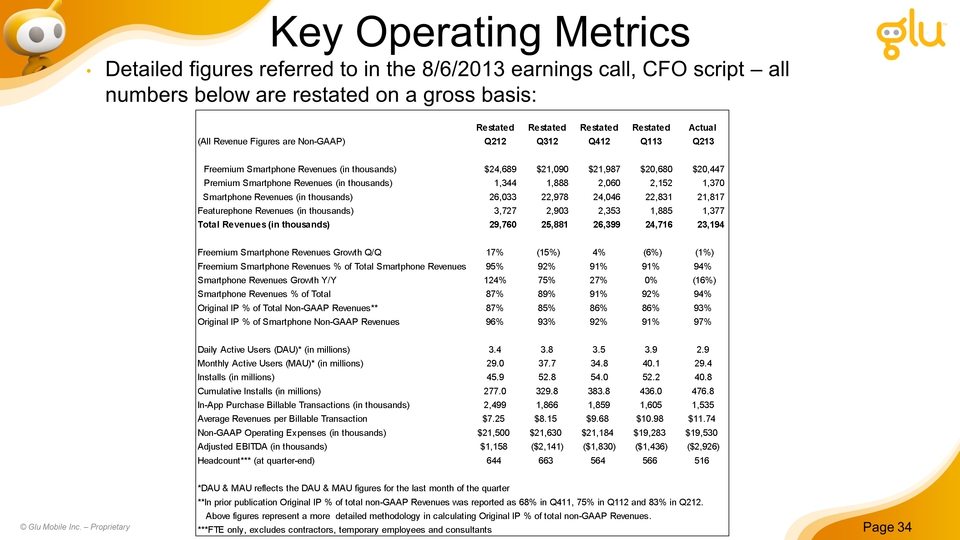
Title: Key Operating Metrics Page 34 © Glu Mobile Inc. – Proprietary Detailed figures referred to in the 8/6/2013 earnings call, CFO script – all numbers below are restated on a gross basis:
Glu Mobile: Investment Overview Strong secular global growth opportunityNew Monetization and User Acquisitions teams starting to show tangible resultsGames as a Service 1st and 3rd party titles launching starting Q313 onwards Other Placeholder: Page 35 © Glu Mobile Inc. – Proprietary
Title: Supplemental IR Slides Related to Restatement August 6, 2013 Other Placeholder: Page 36 © Glu Mobile Inc. – Proprietary
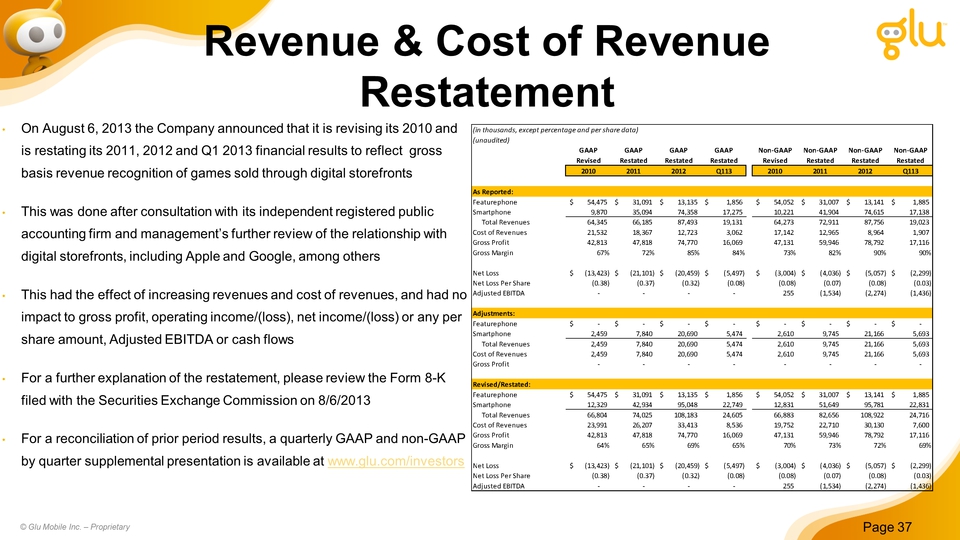
Revenue & Cost of Revenue Restatement On August 6, 2013 the Company announced that it is revising its 2010 and is restating its 2011, 2012 and Q1 2013 financial results to reflect gross basis revenue recognition of games sold through digital storefrontsThis was done after consultation with its independent registered public accounting firm and management’s further review of the relationship with digital storefronts, including Apple and Google, among othersThis had the effect of increasing revenues and cost of revenues, and had no impact to gross profit, operating income/(loss), net income/(loss) or any per share amount, Adjusted EBITDA or cash flowsFor a further explanation of the restatement, please review the Form 8-K filed with the Securities Exchange Commission on 8/6/2013For a reconciliation of prior period results, a quarterly GAAP and non-GAAP by quarter supplemental presentation is available at www.glu.com/investors Other Placeholder: Page 37 © Glu Mobile Inc. – Proprietary
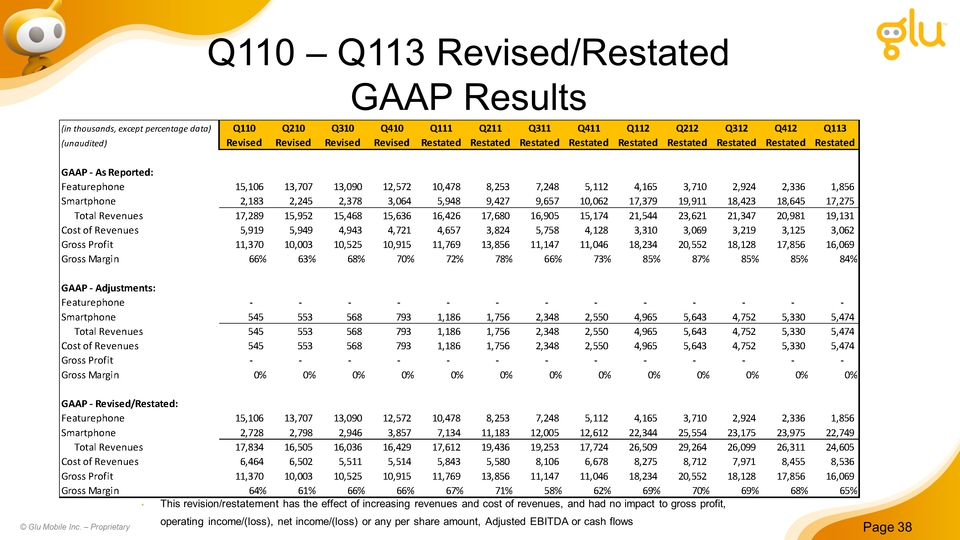
Title: Q110 – Q113 Revised/Restated GAAP Results Other Placeholder: Page 38 © Glu Mobile Inc. – Proprietary This revision/restatement has the effect of increasing revenues and cost of revenues, and had no impact to gross profit, operating income/(loss), net income/(loss) or any per share amount, Adjusted EBITDA or cash flows
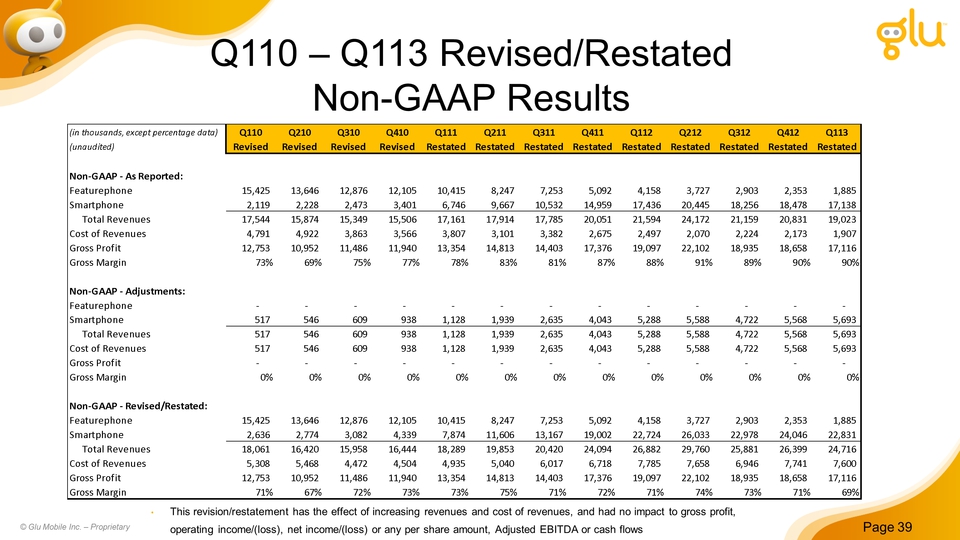
Title: Q110 – Q113 Revised/Restated Non-GAAP Results Other Placeholder: Page 39 © Glu Mobile Inc. – Proprietary This revision/restatement has the effect of increasing revenues and cost of revenues, and had no impact to gross profit, operating income/(loss), net income/(loss) or any per share amount, Adjusted EBITDA or cash flows
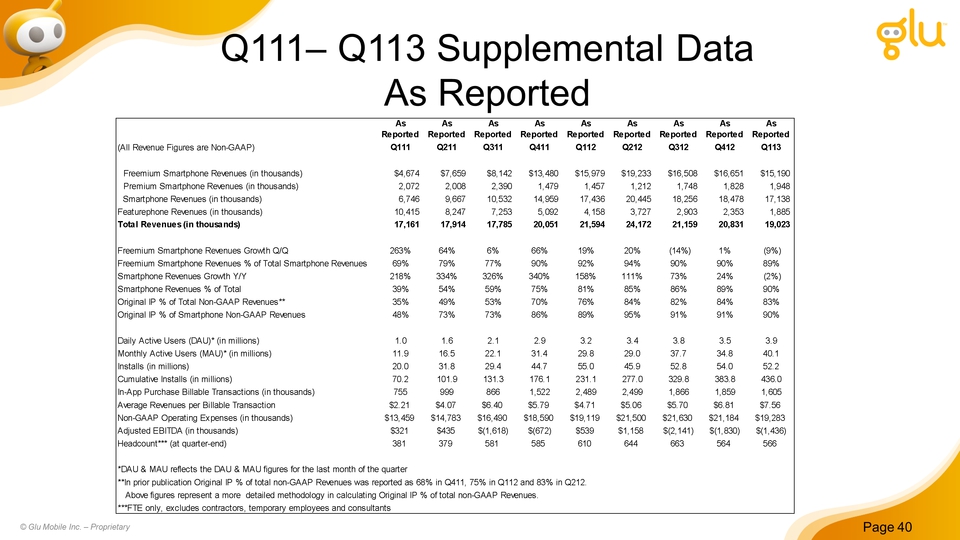
Title: Q111– Q113 Supplemental Data As Reported Other Placeholder: Page 40 © Glu Mobile Inc. – Proprietary
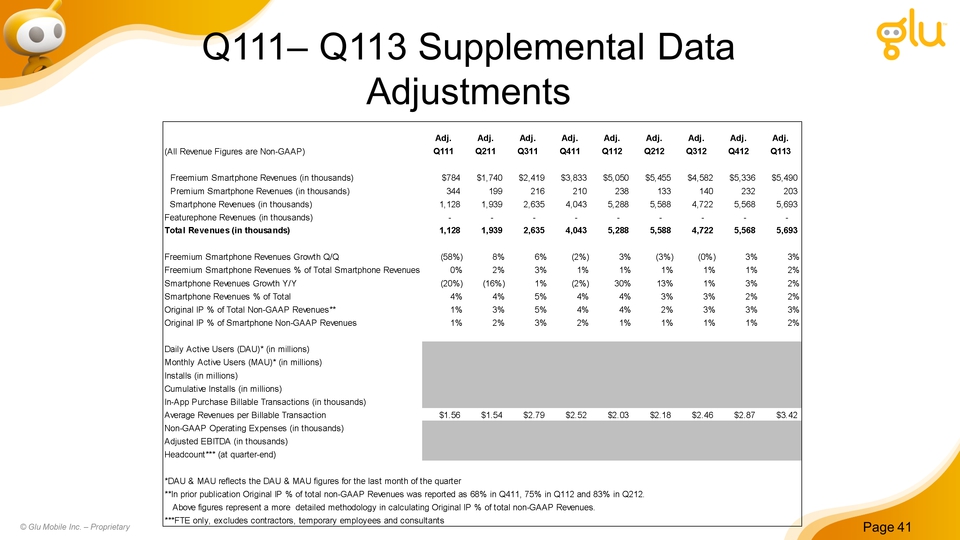
Title: Q111– Q113 Supplemental Data Adjustments Other Placeholder: Page 41 © Glu Mobile Inc. – Proprietary
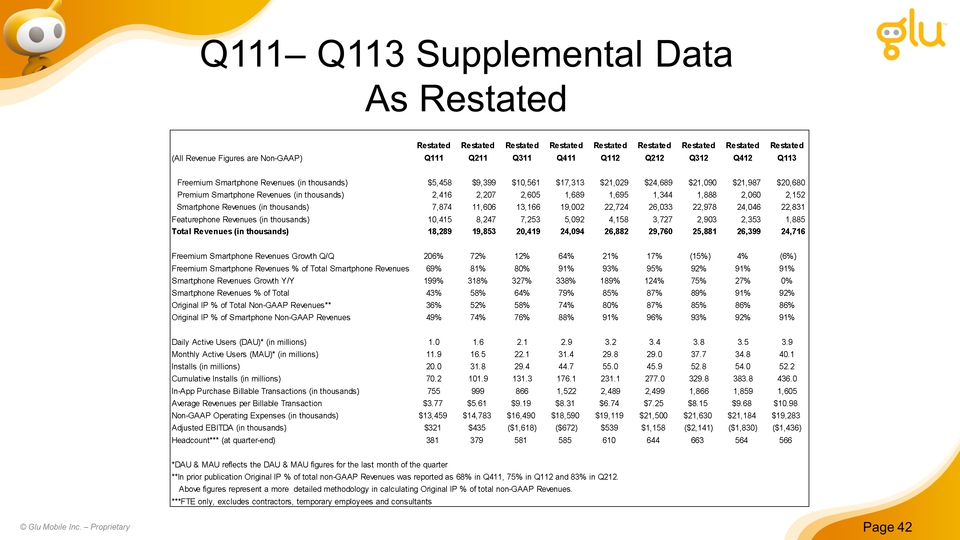
Title: Q111– Q113 Supplemental Data As Restated Other Placeholder: Page 42 © Glu Mobile Inc. – Proprietary
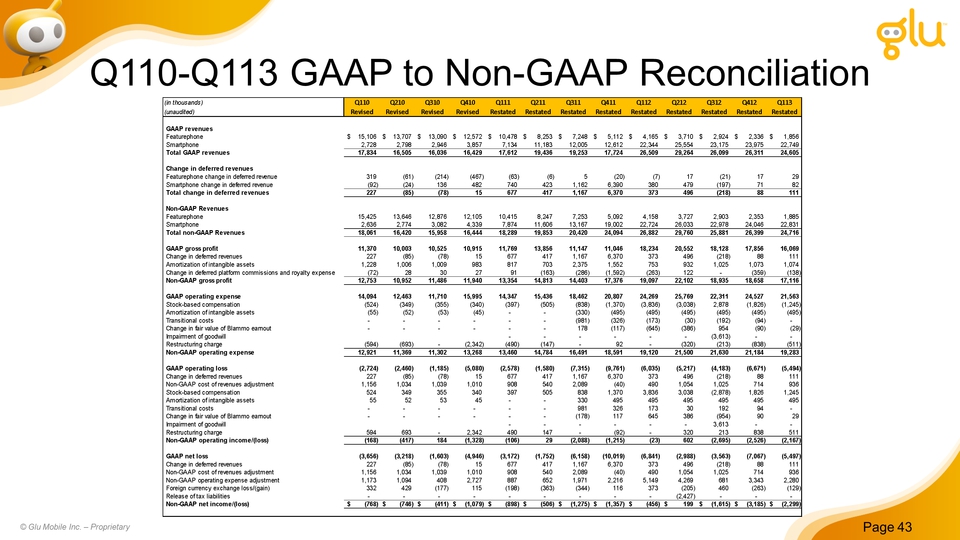
Title: Q110-Q113 GAAP to Non-GAAP Reconciliation Other Placeholder: Page 43 © Glu Mobile Inc. – Proprietary