PowerShares DB Multi-Sector Commodity Trust
Filed: 10 Dec 18, 4:04pm
Filed Pursuant to Rule 424(b)(3)
Registration Statement Nos. 333-227188
333-227188-01
PROSPECTUS SUPPLEMENT NO. 1
(to Prospectus dated October 10, 2018)
INVESCO DB MULTI-SECTOR COMMODITY TRUST
INVESCO DB AGRICULTURE FUND
99,372,875 Common Units of Beneficial Interest
This Prospectus Supplement No. 1 (“Supplement No. 1”) supplements and amends our Prospectus dated October 10, 2018 (the “Prospectus”). Supplement No. 1 is being filed to include the information contained in our Quarterly Report on Form10-Q, for the quarter ended September 30, 2018, filed with the Securities and Exchange Commission on November 7, 2018 (the “Form10-Q”). Accordingly, we have attached theForm 10-Q to this Supplement No. 1. Supplement No. 1 should be read together with the Prospectus.
Shares of the Invesco DB Agriculture Fund (the “Fund”) are listed on NYSE Arca, Inc. under the symbol “DBA.”
Investing in the Shares involves significant risks. See “RISK FACTORS” starting on page 15 of the Prospectus.
These securities have not been approved or disapproved by the Securities and Exchange Commission or any state securities commission nor has the Securities and Exchange Commission passed upon the adequacy or accuracy of the Prospectus or this Prospectus Supplement No. 1. Any representation to the contrary is a criminal offense.
The Fund is not a mutual fund or any other type of investment company within the meaning of the Investment Company Act of 1940, as amended, and is not subject to regulation thereunder.
THE COMMODITY FUTURES TRADING COMMISSION HAS NOT PASSED UPON THE MERITS OF PARTICIPATING IN THIS POOL NOR HAS THE COMMISSION PASSED ON THE ADEQUACY OR ACCURACY OF THIS DISCLOSURE DOCUMENT.
The date of this Prospectus Supplement No. 1 is December 10, 2018.
PLEASE RETAIN THIS SUPPLEMENT FOR FUTURE REFERENCE
P-DBA-PRO-1-SUP-1
UNITED STATES
SECURITIES AND EXCHANGE COMMISSION
Washington, D.C. 20549
FORM10-Q
(Mark One)
| ☒ | QUARTERLY REPORT PURSUANT TO SECTION 13 OR 15(d) OF THE SECURITIES EXCHANGE ACT OF 1934 |
For the quarterly period ended September 30, 2018
OR
| ☐ | TRANSITION REPORT PURSUANT TO SECTION 13 OR 15(d) OF THE SECURITIES EXCHANGE ACT OF 1934 |
For the transition period from to
Commission File Number: 001-33238
INVESCO DB AGRICULTURE FUND
(A Series of Invesco DB Multi-Sector Commodity Trust)
(Exact name of Registrant as specified in its charter)
| Delaware | 87-0778078 | |
(State or Other Jurisdiction of Incorporation or Organization) | (I.R.S. Employer Identification No.) | |
c/o Invesco Capital Management LLC 3500 Lacey Road, Suite 700 Downers Grove, Illinois | 60515 | |
| (Address of Principal Executive Offices) | (Zip Code) | |
Registrant’s telephone number, including area code:(800) 983-0903
Indicate by check mark whether the Registrant (1) has filed all reports required to be filed by Section 13 or 15(d) of the Securities Exchange Act of 1934 during the preceding 12 months (or for such shorter period that the Registrant was required to file such reports), and (2) has been subject to such filing requirements for the past 90 days. Yes ☒ No ☐
Indicate by check mark whether the Registrant has submitted electronically an Interactive Data File required to be submitted pursuant to Rule 405 of RegulationS-T (§232.405 of this chapter) during the preceding 12 months (or for such shorter period that the Registrant was required to submit such files). Yes ☒ No ☐
Indicate by check mark whether the registrant is a large accelerated filer, an accelerated filer, anon-accelerated filer, a smaller reporting company, or an emerging growth company. See the definitions of “large accelerated filer,” “accelerated filer,” “smaller reporting company,” and “emerging growth company” inRule 12b-2 of the Exchange Act. (Check one):
| Large Accelerated Filer | ☒ | Accelerated Filer | ☐ | |||
| Non-Accelerated Filer | ☐ | Smaller reporting company | ☐ | |||
| Emerging growth company | ☐ |
If an emerging growth company, indicate by check mark if the registrant has elected not to use the extended transition period for complying with any new or revised financial accounting standards provided pursuant to Section 13(a) of the Exchange Act. ☐
Indicate by check mark whether the registrant is a shell company (as defined in Rule12b-2 of the Exchange Act). Yes ☐ No ☒
Indicate the number of outstanding Shares as of September 30, 2018: 32,200,000 Shares.
(A SERIES OF INVESCO DB MULTI-SECTOR COMMODITY TRUST)
QUARTER ENDED SEPTEMBER 30, 2018
TABLE OF CONTENTS
| Page | ||||||
PART I. | FINANCIAL INFORMATION | 1 | ||||
ITEM 1. | Financial Statements | 1 | ||||
| Notes to Unaudited Financial Statements | 10 | |||||
ITEM 2. | Management’s Discussion and Analysis of Financial Condition and Results of Operations | 20 | ||||
ITEM 3. | Quantitative and Qualitative Disclosures About Market Risk | 29 | ||||
ITEM 4. | Controls and Procedures | 31 | ||||
PART II. | OTHER INFORMATION | 33 | ||||
Item 1. | Legal Proceedings | 33 | ||||
Item 1A. | Risk Factors | 33 | ||||
Item 2. | Unregistered Sales of Equity Securities and Use of Proceeds | 33 | ||||
Item 3. | Defaults Upon Senior Securities | 33 | ||||
Item 4. | Mine Safety Disclosures | 34 | ||||
Item 5. | Other Information | 34 | ||||
Item 6. | Exhibits | 34 | ||||
| 35 | ||||||
| ITEM 1. | FINANCIAL STATEMENTS. |
Invesco DB Agriculture Fund
Statements of Financial Condition
September 30, 2018 and December 31, 2017
(Unaudited)
| September 30, 2018 | December 31, 2017 | |||||||
Assets | ||||||||
United States Treasury Obligations, at value (cost $453,501,627 and $514,764,046, respectively) | $ | 453,409,077 | $ | 514,714,860 | ||||
Affiliated Investments, at value (cost $90,491,454 and $124,826,575, respectively) | 90,548,131 | 124,748,306 | ||||||
Other investments: | ||||||||
Variation margin receivable—Commodity Futures Contracts | 157,658 | 442,552 | ||||||
Cash held by custodian | — | 2,260,923 | ||||||
Receivable for: | ||||||||
Dividends from affiliates | 38,369 | 33,612 | ||||||
|
|
|
| |||||
Total assets | $ | 544,153,235 | $ | 642,200,253 | ||||
|
|
|
| |||||
Liabilities | ||||||||
Payable for: | ||||||||
Management fees | $ | 385,190 | $ | 444,415 | ||||
Brokerage commissions and fees | 3,633 | 4,091 | ||||||
|
|
|
| |||||
Total liabilities | 388,823 | 448,506 | ||||||
|
|
|
| |||||
Commitments and Contingencies (Note 10) | ||||||||
Equity | ||||||||
Shareholder’s equity—General Shares | 676 | 750 | ||||||
Shareholders’ equity—Shares | 543,763,736 | 641,750,997 | ||||||
|
|
|
| |||||
Total shareholders’ equity | 543,764,412 | 641,751,747 | ||||||
|
|
|
| |||||
Total liabilities and equity | $ | 544,153,235 | $ | 642,200,253 | ||||
|
|
|
| |||||
General Shares outstanding | 40 | 40 | ||||||
Shares outstanding | 32,200,000 | 34,200,000 | ||||||
Net asset value per share | $ | 16.89 | $ | 18.76 | ||||
Market value per share | $ | 16.91 | $ | 18.75 | ||||
See accompanying Notes to Unaudited Financial Statements which are an integral part of the financial statements.
1
Invesco DB Agriculture Fund
Schedule of Investments
September 30, 2018
(Unaudited)
Description | Percentage of Shareholders’ Equity | Value | Principal Value | |||||||||
United States Treasury Obligations(a) | ||||||||||||
U.S. Treasury Bills, 2.010% due November 8, 2018 | 26.61 | % | $ | 144,683,941 | $ | 145,000,000 | ||||||
U.S. Treasury Bills, 2.095% due December 6, 2018 | 3.11 | 16,933,849 | 17,000,000 | |||||||||
U.S. Treasury Bills, 2.175% due January 3, 2019(b) | 28.16 | 153,118,371 | 154,000,000 | |||||||||
U.S. Treasury Bills, 2.210% due February 28, 2019 | 25.50 | 138,672,916 | 140,000,000 | |||||||||
|
|
|
| |||||||||
Total United States Treasury Obligations (cost $453,501,627) | 83.38 | % | $ | 453,409,077 | ||||||||
|
|
|
| |||||||||
Affiliated Investments | Shares | |||||||||||
Exchange-Traded Fund | ||||||||||||
Invesco Treasury Collateral ETF (cost $78,999,188)(c) | 14.54 | % | $ | 79,055,865 | 749,700 | |||||||
Money Market Mutual Fund | ||||||||||||
Invesco Premier U.S. Government Money Portfolio—Institutional Class, 1.95% (cost $11,492,266)(d) | 2.12 | 11,492,266 | 11,492,266 | |||||||||
|
|
|
| |||||||||
Total Affiliated Investments (cost $90,491,454) | 16.66 | % | $ | 90,548,131 | ||||||||
|
|
|
| |||||||||
Total Investments in Securities (cost $543,993,081) | 100.04 | % | $ | 543,957,208 | ||||||||
|
|
|
| |||||||||
| (a) | Security may be traded on a discount basis. The interest rate shown represents the discount rate at the most recent auction date of the security prior to period end. |
| (b) | United States Treasury Obligations of $101,418,600 are on deposit with the Commodity Broker and held as maintenance margin for open futures contracts. |
| (c) | Affiliated company. The security and the Fund are affiliated by having the same investment adviser. See Note 8. |
| (d) | The security and the Fund are advised by wholly-owned subsidiaries of Invesco Ltd. and are therefore considered to be affiliated. The rate shown is the7-day SEC standardized yield as of September 30, 2018. |
Open Commodity Futures Contracts | Number of Contracts | Expiration Date | Notional Value | Value(e) | Unrealized Appreciation (Depreciation)(e) | |||||||||||||||
Long Futures Contracts | ||||||||||||||||||||
CBOT Corn | 3,703 | September -2019 | $ | 71,282,750 | $ | (4,268,467 | ) | $ | (4,268,467 | ) | ||||||||||
CBOT Soybean | 1,557 | November -2018 | 65,822,175 | (11,653,189 | ) | (11,653,189 | ) | |||||||||||||
CBOT Wheat | 1,466 | July - 2019 | 39,636,975 | (3,630,587 | ) | (3,630,587 | ) | |||||||||||||
CBOT Wheat KCB | 1,455 | July - 2019 | 40,012,500 | (4,349,082 | ) | (4,349,082 | ) | |||||||||||||
CME Feeder Cattle | 320 | November -2018 | 25,288,000 | 929,002 | 929,002 | |||||||||||||||
CME Lean Hogs | 1,931 | December -2018 | 44,741,270 | 1,723,808 | 1,723,808 | |||||||||||||||
CME Live Cattle | 1,517 | December -2018 | 72,118,180 | 2,905,900 | 2,905,900 | |||||||||||||||
NYB-ICE Cocoa | 2,951 | December -2018 | 60,702,070 | (2,526,129 | ) | (2,526,129 | ) | |||||||||||||
NYB-ICE Coffee | 1,325 | December -2018 | 50,904,844 | (4,457,752 | ) | (4,457,752 | ) | |||||||||||||
NYB-ICE Cotton | 506 | December -2018 | 19,321,610 | (3,743,746 | ) | (3,743,746 | ) | |||||||||||||
NYB-ICE Sugar | 4,098 | September -2019 | 53,883,782 | (2,827,004 | ) | (2,827,004 | ) | |||||||||||||
|
|
|
| |||||||||||||||||
Total Commodity Futures Contracts | $ | (31,897,246 | ) | $ | (31,897,246 | ) | ||||||||||||||
|
|
|
| |||||||||||||||||
| (e) | Unrealized Appreciation (Depreciation) and Value are presented above, net by contract. |
See accompanying Notes to Unaudited Financial Statements which are an integral part of the financial statements.
2
Invesco DB Agriculture Fund
Schedule of Investments
December 31, 2017
(Unaudited)
Description | Percentage of Shareholders’ Equity | Value | Principal Value | |||||||||
United States Treasury Obligations(a) | ||||||||||||
U.S. Treasury Bills, 1.180% due January 4, 2018 | 23.37 | % | $ | 149,990,594 | $ | 150,000,000 | ||||||
U.S. Treasury Bills, 1.245% due January 18, 2018 | 4.98 | 31,982,453 | 32,000,000 | |||||||||
U.S. Treasury Bills, 1.285% due February 22, 2018 | 7.47 | 47,914,320 | 48,000,000 | |||||||||
U.S. Treasury Bills, 1.285% due March 1, 2018(b) | 23.17 | 148,695,730 | 149,000,000 | |||||||||
U.S. Treasury Bills, 1.450% due June 7, 2018 | 21.21 | 136,131,763 | 137,000,000 | |||||||||
|
|
|
| |||||||||
Total United States Treasury Obligations (cost $514,764,046) | 80.20 | % | $ | 514,714,860 | ||||||||
|
|
|
| |||||||||
Affiliated Investments | Shares | |||||||||||
Exchange-Traded Fund | ||||||||||||
PowerShares Treasury Collateral Portfolio (cost $78,999,188)(c) | 12.30 | % | $ | 78,920,919 | 749,700 | |||||||
Money Market Mutual Fund | ||||||||||||
Invesco Premier U.S. Government Money Portfolio—Institutional Class, 1.15% (cost $45,827,387)(d) | 7.14 | 45,827,387 | 45,827,387 | |||||||||
|
|
|
| |||||||||
Total Affiliated Investments (cost $124,826,575) | 19.44 | % | $ | 124,748,306 | ||||||||
|
|
|
| |||||||||
Total Investments in Securities (cost $639,590,621) | 99.64 | % | $ | 639,463,166 | ||||||||
|
|
|
| |||||||||
| (a) | Security may be traded on a discount basis. The interest rate shown represents the discount rate at the most recent auction date of the security prior to period end. |
| (b) | United States Treasury Obligations of $99,790,000 are on deposit with the Commodity Broker and held as maintenance margin for open futures contracts. |
| (c) | Affiliated company. The security and the Fund are affiliated by having the same investment adviser. See Note 8. |
| (d) | The security and the Fund are advised by wholly-owned subsidiaries of Invesco Ltd. and are therefore considered to be affiliated. The rate shown is the7-day SEC standardized yield as of December 31, 2017. |
Open Commodity Futures Contracts | Number of Contracts | Expiration Date | Notional Value | Value(e) | Unrealized Appreciation (Depreciation)(e) | |||||||||||||||
Long Futures Contracts | ||||||||||||||||||||
CBOT Corn | 4,314 | September - 2018 | $ | 80,833,575 | $ | (6,550,383 | ) | $ | (6,550,383 | ) | ||||||||||
CBOT Soybean | 1,646 | November - 2018 | 80,304,225 | (893,025 | ) | (893,025 | ) | |||||||||||||
CBOT Wheat | 1,766 | July - 2018 | 40,021,975 | (5,174,053 | ) | (5,174,053 | ) | |||||||||||||
CBOT Wheat KCB | 1,749 | July - 2018 | 40,073,962 | (5,319,693 | ) | (5,319,693 | ) | |||||||||||||
CME Feeder Cattle | 357 | March - 2018 | 25,467,488 | (426,800 | ) | (426,800 | ) | |||||||||||||
CME Lean Hogs | 1,982 | February - 2018 | 56,903,220 | 32,068 | 32,068 | |||||||||||||||
CME Live Cattle | 1,613 | February - 2018 | 78,424,060 | (5,834,068 | ) | (5,834,068 | ) | |||||||||||||
NYB-ICE Cocoa | 3,370 | March - 2018 | 63,760,400 | (7,642,315 | ) | (7,642,315 | ) | |||||||||||||
NYB-ICE Coffee | 1,522 | March - 2018 | 72,028,650 | (1,419,248 | ) | (1,419,248 | ) | |||||||||||||
NYB-ICE Cotton | 536 | March - 2018 | 21,072,840 | 2,588,909 | 2,588,909 | |||||||||||||||
NYB-ICE Sugar | 4,864 | October - 2018 | 82,859,213 | (1,112,530 | ) | (1,112,530 | ) | |||||||||||||
|
|
|
| |||||||||||||||||
Total Commodity Futures Contracts | $ | (31,751,138 | ) | $ | (31,751,138 | ) | ||||||||||||||
|
|
|
| |||||||||||||||||
| (e) | Unrealized Appreciation (Depreciation) and Value are presented above, net by contract. |
See accompanying Notes to Unaudited Financial Statements which are an integral part of the financial statements.
3
Invesco DB Agriculture Fund
Statements of Income and Expenses
For the Three and Nine Months Ended September 30, 2018 and 2017
(Unaudited)
| Three Months Ended | Nine Months Ended | |||||||||||||||
| September 30, | September 30, | |||||||||||||||
| 2018 | 2017 | 2018 | 2017 | |||||||||||||
Income | ||||||||||||||||
Interest Income | $ | 2,559,948 | $ | 1,538,961 | $ | 7,226,157 | $ | 3,474,114 | ||||||||
Dividends from Affiliates | 1,009,036 | 78,766 | 1,260,269 | 187,326 | ||||||||||||
|
|
|
|
|
|
|
| |||||||||
Total Income | 3,568,984 | 1,617,727 | 8,486,426 | 3,661,440 | ||||||||||||
|
|
|
|
|
|
|
| |||||||||
Expenses | ||||||||||||||||
Management Fees | 1,304,946 | 1,526,750 | 4,302,163 | 4,663,915 | ||||||||||||
Brokerage Commissions and Fees | 164,324 | 182,461 | 425,619 | 472,355 | ||||||||||||
Interest Expense | 21,994 | 2,848 | 30,368 | 7,119 | ||||||||||||
|
|
|
|
|
|
|
| |||||||||
Total Expenses | 1,491,264 | 1,712,059 | 4,758,150 | 5,143,389 | ||||||||||||
|
|
|
|
|
|
|
| |||||||||
Less: Waivers | (32,840 | ) | (32,956 | ) | (90,844 | ) | (108,844 | ) | ||||||||
|
|
|
|
|
|
|
| |||||||||
Net Expenses | 1,458,424 | 1,679,103 | 4,667,306 | 5,034,545 | ||||||||||||
|
|
|
|
|
|
|
| |||||||||
Net Investment Income (Loss) | 2,110,560 | (61,376 | ) | 3,819,120 | (1,373,105 | ) | ||||||||||
|
|
|
|
|
|
|
| |||||||||
Net Realized and Net Change in Unrealized Gain (Loss) on United States Treasury Obligations, Affiliated Investments and Commodity Futures Contracts | ||||||||||||||||
Net Realized Gain (Loss) on | ||||||||||||||||
United States Treasury Obligations | (3,324 | ) | 853 | (9,420 | ) | (4,097 | ) | |||||||||
Commodity Futures Contracts | (55,762,347 | ) | (38,467,059 | ) | (76,464,718 | ) | (49,473,144 | ) | ||||||||
|
|
|
|
|
|
|
| |||||||||
Net Realized Gain (Loss) | (55,765,671 | ) | (38,466,206 | ) | (76,474,138 | ) | (49,477,241 | ) | ||||||||
|
|
|
|
|
|
|
| |||||||||
Net Change in Unrealized Gain (Loss) on | ||||||||||||||||
United States Treasury Obligations | (124,755 | ) | (968 | ) | (43,364 | ) | 62,199 | |||||||||
Affiliated Investments | (494,802 | ) | 187,425 | 134,946 | 356,557 | |||||||||||
Commodity Futures Contracts | 12,196,327 | 4,856,872 | (146,108 | ) | 9,469,795 | |||||||||||
|
|
|
|
|
|
|
| |||||||||
Net Change in Unrealized Gain (Loss) | 11,576,770 | 5,043,329 | (54,526 | ) | 9,888,551 | |||||||||||
|
|
|
|
|
|
|
| |||||||||
Net Realized and Net Change in Unrealized Gain (Loss) on United States Treasury Obligations, Affiliated Investments and Commodity Futures Contracts | (44,188,901 | ) | (33,422,877 | ) | (76,528,664 | ) | (39,588,690 | ) | ||||||||
|
|
|
|
|
|
|
| |||||||||
Net Income (Loss) | $ | (42,078,341 | ) | $ | (33,484,253 | ) | $ | (72,709,544 | ) | $ | (40,961,795 | ) | ||||
|
|
|
|
|
|
|
| |||||||||
See accompanying Notes to Unaudited Financial Statements which are an integral part of the financial statements.
4
Invesco DB Agriculture Fund
Statement of Changes in Shareholders’ Equity
For the Three Months Ended September 30, 2018
(Unaudited)
| General Shares | Shares | Total | ||||||||||||||||||
| Shares | Total Equity | Shares | Total Equity | Shareholders’ Equity | ||||||||||||||||
Balance at June 30, 2018 | 40 | $ | 721 | 38,800,000 | $ | 699,675,608 | $ | 699,676,329 | ||||||||||||
|
|
|
|
|
|
|
|
|
| |||||||||||
Purchases of Shares | — | — | — | |||||||||||||||||
Redemption of Shares | (6,600,000 | ) | (113,833,576 | ) | (113,833,576 | ) | ||||||||||||||
|
|
|
|
|
| |||||||||||||||
Net Increase (Decrease) due to Share Transactions | (6,600,000 | ) | (113,833,576 | ) | (113,833,576 | ) | ||||||||||||||
Net Income (Loss) | ||||||||||||||||||||
Net Investment Income (Loss) | 2 | 2,110,558 | 2,110,560 | |||||||||||||||||
Net Realized Gain (Loss) on United States Treasury Obligations, Affiliated Investments and Commodity Futures Contracts | (58 | ) | (55,765,613 | ) | (55,765,671 | ) | ||||||||||||||
Net Change in Unrealized Gain (Loss) on United States Treasury Obligations, Affiliated Investments and Commodity Futures Contracts | 11 | 11,576,759 | 11,576,770 | |||||||||||||||||
|
|
|
|
|
| |||||||||||||||
Net Income (Loss) | (45 | ) | (42,078,296 | ) | (42,078,341 | ) | ||||||||||||||
|
|
|
|
|
|
|
|
|
| |||||||||||
Net Change in Shareholders’ Equity | — | (45 | ) | (6,600,000 | ) | (155,911,872 | ) | (155,911,917 | ) | |||||||||||
|
|
|
|
|
|
|
|
|
| |||||||||||
Balance at September 30, 2018 | 40 | $ | 676 | 32,200,000 | $ | 543,763,736 | $ | 543,764,412 | ||||||||||||
|
|
|
|
|
|
|
|
|
| |||||||||||
See accompanying Notes to Unaudited Financial Statements which are an integral part of the financial statements.
5
Invesco DB Agriculture Fund
Statement of Changes in Shareholders’ Equity
For the Three Months Ended September 30, 2017
(Unaudited)
| General Shares | Shares | Total | ||||||||||||||||||
| Shares | Total Equity | Shares | Total Equity | Shareholders’ Equity | ||||||||||||||||
Balance at June 30, 2017 | 40 | $ | 794 | 35,000,000 | $ | 694,451,308 | $ | 694,452,102 | ||||||||||||
|
|
|
|
|
|
|
|
|
| |||||||||||
Purchases of Shares | 4,600,000 | 89,817,963 | 89,817,963 | |||||||||||||||||
Redemption of Shares | (2,000,000 | ) | (38,572,180 | ) | (38,572,180 | ) | ||||||||||||||
|
|
|
|
|
| |||||||||||||||
Net Increase (Decrease) due to Share Transactions | 2,600,000 | 51,245,783 | 51,245,783 | |||||||||||||||||
Net Income (Loss) | ||||||||||||||||||||
Net Investment Income (Loss) | — | (61,376 | ) | (61,376 | ) | |||||||||||||||
Net Realized Gain (Loss) on United States Treasury Obligations, Affiliated Investments and Commodity Futures Contracts | (43 | ) | (38,466,163 | ) | (38,466,206 | ) | ||||||||||||||
Net Change in Unrealized Gain (Loss) on United States Treasury Obligations, Affiliated Investments and Commodity Futures Contracts | 7 | 5,043,322 | 5,043,329 | |||||||||||||||||
|
|
|
|
|
| |||||||||||||||
Net Income (Loss) | (36 | ) | (33,484,217 | ) | (33,484,253 | ) | ||||||||||||||
|
|
|
|
|
|
|
|
|
| |||||||||||
Net Change in Shareholders’ Equity | — | (36 | ) | 2,600,000 | 17,761,566 | 17,761,530 | ||||||||||||||
|
|
|
|
|
|
|
|
|
| |||||||||||
Balance at September 30, 2017 | 40 | $ | 758 | 37,600,000 | $ | 712,212,874 | $ | 712,213,632 | ||||||||||||
|
|
|
|
|
|
|
|
|
| |||||||||||
See accompanying Notes to Unaudited Financial Statements which are an integral part of the financial statements.
6
Invesco DB Agriculture Fund
Statement of Changes in Shareholders’ Equity
For the Nine Months Ended September 30, 2018
(Unaudited)
| General Shares | Shares | Total | ||||||||||||||||||
| Shares | Total Equity | Shares | Total Equity | Shareholders’ Equity | ||||||||||||||||
Balance at December 31, 2017 | 40 | $ | 750 | 34,200,000 | $ | 641,750,997 | $ | 641,751,747 | ||||||||||||
|
|
|
|
|
|
|
|
|
| |||||||||||
Purchases of Shares | 8,000,000 | 152,173,097 | 152,173,097 | |||||||||||||||||
Redemption of Shares | (10,000,000 | ) | (177,450,888 | ) | (177,450,888 | ) | ||||||||||||||
|
|
|
|
|
| |||||||||||||||
Net Increase (Decrease) due to Share Transactions | (2,000,000 | ) | (25,277,791 | ) | (25,277,791 | ) | ||||||||||||||
Net Income (Loss) | ||||||||||||||||||||
Net Investment Income (Loss) | 4 | 3,819,116 | 3,819,120 | |||||||||||||||||
Net Realized Gain (Loss) on United States Treasury Obligations, Affiliated Investments and Commodity Futures Contracts | (78 | ) | (76,474,060 | ) | (76,474,138 | ) | ||||||||||||||
Net Change in Unrealized Gain (Loss) on United States Treasury Obligations, Affiliated Investments and Commodity Futures Contracts | — | (54,526 | ) | (54,526 | ) | |||||||||||||||
|
|
|
|
|
| |||||||||||||||
Net Income (Loss) | (74 | ) | (72,709,470 | ) | (72,709,544 | ) | ||||||||||||||
|
|
|
|
|
|
|
|
|
| |||||||||||
Net Change in Shareholders’ Equity | — | (74 | ) | (2,000,000 | ) | (97,987,261 | ) | (97,987,335 | ) | |||||||||||
|
|
|
|
|
|
|
|
|
| |||||||||||
Balance at September 30, 2018 | 40 | $ | 676 | 32,200,000 | $ | 543,763,736 | $ | 543,764,412 | ||||||||||||
|
|
|
|
|
|
|
|
|
| |||||||||||
See accompanying Notes to Unaudited Financial Statements which are an integral part of the financial statements.
7
Invesco DB Agriculture Fund
Statement of Changes in Shareholders’ Equity
For the Nine Months Ended September 30, 2017
(Unaudited)
| General Shares | Shares | Total | ||||||||||||||||||
| Shares | Total Equity | Shares | Total Equity | Shareholders’ Equity | ||||||||||||||||
Balance at December 31, 2016 | 40 | $ | 799 | 36,200,000 | $ | 723,228,771 | $ | 723,229,570 | ||||||||||||
|
|
|
|
|
|
|
|
|
| |||||||||||
Purchases of Shares | 10,400,000 | 208,918,746 | 208,918,746 | |||||||||||||||||
Redemption of Shares | (9,000,000 | ) | (178,972,889 | ) | (178,972,889 | ) | ||||||||||||||
|
|
|
|
|
| |||||||||||||||
Net Increase (Decrease) due to Share Transactions | 1,400,000 | 29,945,857 | 29,945,857 | |||||||||||||||||
Net Income (Loss) | ||||||||||||||||||||
Net Investment Income (Loss) | (1 | ) | (1,373,104 | ) | (1,373,105 | ) | ||||||||||||||
Net Realized Gain (Loss) on United States Treasury Obligations, Affiliated Investments and Commodity Futures Contracts | (50 | ) | (49,477,191 | ) | (49,477,241 | ) | ||||||||||||||
Net Change in Unrealized Gain (Loss) on United States Treasury Obligations, Affiliated Investments and Commodity Futures Contracts | 10 | 9,888,541 | 9,888,551 | |||||||||||||||||
|
|
|
|
|
| |||||||||||||||
Net Income (Loss) | (41 | ) | (40,961,754 | ) | (40,961,795 | ) | ||||||||||||||
|
|
|
|
|
|
|
|
|
| |||||||||||
Net Change in Shareholders’ Equity | — | (41 | ) | 1,400,000 | (11,015,897 | ) | (11,015,938 | ) | ||||||||||||
|
|
|
|
|
|
|
|
|
| |||||||||||
Balance at September 30, 2017 | 40 | $ | 758 | 37,600,000 | $ | 712,212,874 | $ | 712,213,632 | ||||||||||||
|
|
|
|
|
|
|
|
|
| |||||||||||
See accompanying Notes to Unaudited Financial Statements which are an integral part of the financial statements.
8
Invesco DB Agriculture Fund
Statements of Cash Flows
For the Nine Months Ended September 30, 2018 and 2017
(Unaudited)
| Nine Months Ended | ||||||||
| September 30, | ||||||||
| 2018 | 2017 | |||||||
Cash flows from operating activities: | ||||||||
Net Income (Loss) | $ | (72,709,544 | ) | $ | (40,961,795 | ) | ||
Adjustments to reconcile net income (loss) to net cash provided by (used for) operating activities: | ||||||||
Cost of securities purchased | (1,070,296,978 | ) | (1,824,584,633 | ) | ||||
Proceeds from securities sold and matured | 1,138,758,932 | 1,934,921,410 | ||||||
Cost of affiliated investments purchased | (476,854,810 | ) | (1,016,473,874 | ) | ||||
Proceeds from affiliated investments sold | 511,189,931 | 922,780,309 | ||||||
Net accretion of discount on United States Treasury Obligations | (7,208,955 | ) | (3,474,114 | ) | ||||
Net realized (gain) loss on United States Treasury Obligations and Affiliated Investments | 9,420 | 4,097 | ||||||
Net change in unrealized (gain) loss on United States Treasury Obligations and Affiliated Investments | (91,582 | ) | (418,756 | ) | ||||
Change in operating assets and liabilities: | ||||||||
Variation margin—Commodity Futures Contracts | 284,894 | (3,870,956 | ) | |||||
Dividends from affiliates | (4,757 | ) | (17,034 | ) | ||||
Management fees | (59,225 | ) | (32,637 | ) | ||||
Brokerage commissions and fees | (458 | ) | 890 | |||||
|
|
|
| |||||
Net cash provided by (used for) operating activities | 23,016,868 | (32,127,093 | ) | |||||
|
|
|
| |||||
Cash flows from financing activities: | ||||||||
Proceeds from purchases of Shares | 152,173,097 | 208,918,746 | ||||||
Redemption of Shares | (177,450,888 | ) | (178,972,889 | ) | ||||
|
|
|
| |||||
Net cash provided by (used for) financing activities | (25,277,791 | ) | 29,945,857 | |||||
|
|
|
| |||||
Net change in cash | (2,260,923 | ) | (2,181,236 | ) | ||||
Cash at beginning of period | 2,260,923 | 2,181,236 | ||||||
|
|
|
| |||||
Cash at end of period | $ | — | $ | — | ||||
|
|
|
| |||||
Supplemental disclosure of cash flow information | ||||||||
Cash paid for interest | $ | 30,368 | $ | 7,119 | ||||
See accompanying Notes to Unaudited Financial Statements which are an integral part of the financial statements.
9
Invesco DB Agriculture Fund
Notes to Unaudited Financial Statements
September 30, 2018
Note 1—Organization
Invesco DB Agriculture Fund (the “Fund”), a separate series of Invesco DB Multi-Sector Commodity Trust (the “Trust”), a Delaware statutory trust organized in seven separate series, was formed on August 3, 2006. The term of the Fund is perpetual (unless terminated earlier in certain circumstances) as provided for in the Fifth Amended and Restated Declaration of Trust and Trust Agreement of the Trust, as amended (the “Trust Agreement”). The Fund has an unlimited number of shares authorized for issuance.
Invesco Capital Management LLC (“Invesco”) has served as the managing owner (the “Managing Owner”), commodity pool operator and commodity trading advisor of the Trust and the Fund since February 23, 2015. The Managing Owner holds 40 general shares (the “General Shares”) of the Fund. The fiscal year end of the Fund is December 31st.
The Fund seeks to track changes, whether positive or negative, in the level of the DBIQ Diversified Agriculture Index Excess Return™ (the “Index”) over time, plus the excess, if any, of the sum of the Fund’s interest income from its holdings of United States Treasury Obligations (“Treasury Income”), dividends from its holdings in money market mutual funds (affiliated or otherwise) (“Money Market Income”) and dividends or distributions of capital gains from its holdings ofT-Bill ETFs (as defined below)(“T-Bill ETF Income”) over the expenses of the Fund. The commodities comprising the Index are Corn, Soybeans, Wheat, Kansas City Wheat, Sugar, Cocoa, Coffee, Cotton, Live Cattle, Feeder Cattle and Lean Hogs (each an “Index Commodity”, and collectively, the “Index Commodities”).
The Fund may invest directly in United States Treasury Obligations. The Fund may also gain exposure to United States Treasury Obligations through investments in exchange-traded funds (“ETFs”) (affiliated or otherwise) that track indexes that measure the performance of United States Treasury Obligations with a maximum remaining maturity of up to 12 months(“T-Bill ETFs”). The Fund invests in United States Treasury Obligations, money market mutual funds andT-Bill ETFs (affiliated or otherwise), if any, for margin and/or cash management purposes.
The Commodity Futures Trading Commission (the “CFTC”) and certain futures exchanges impose position limits on futures contracts that reference Index Commodities (the “Index Contracts”). As the Fund approaches or reaches position limits with respect to an Index Commodity, the Fund may commence investing in Index Contracts that reference other Index Commodities. In those circumstances, the Fund may also trade in futures contracts based on commodities other than Index Commodities that the Managing Owner reasonably believes tend to exhibit trading prices that correlate with an Index Contract. In addition, the Managing Owner may determine to invest in other futures contracts if at any time it is impractical or inefficient to gain full or partial exposure to an Index Commodity through the use of Index Contracts. These other futures contracts may or may not be based on an Index Commodity. When they are not, the Managing Owner may seek to select futures contracts that it reasonably believes tend to exhibit trading prices that correlate with an Index Contract.
The Fund offers common units of beneficial interest (the “Shares”) only to certain eligible financial institutions (the “Authorized Participants”) in one or more blocks of 200,000 Shares, called a Basket. The Fund commenced investment operations on January 3, 2007. The Fund commenced trading on the American Stock Exchange (which became the NYSE Alternext US LLC) on January 5, 2007 and, since November 25, 2008, has been listed on the NYSE Arca, Inc. (the “NYSE Arca”).
This Quarterly Report (the “Report”) covers the three and nine months ended September 30, 2018 and 2017. The accompanying unaudited financial statements were prepared in accordance with accounting principles generally accepted in the United States of America (“U.S. GAAP”) for interim financial information and with the instructions for Form10-Q and the rules and regulations of the U.S. Securities and Exchange Commission (the “SEC”). In the opinion of management, all material adjustments, consisting only of normal recurring adjustments, considered necessary for a fair statement of the interim period financial statements have been made. Interim period results are not necessarily indicative of results for a full-year period. These financial statements and the notes thereto should be read in conjunction with the Fund’s financial statements included in its Annual Report on Form10-K for the year ended December 31, 2017 as filed with the SEC on February 28, 2018.
Note 2—Summary of Significant Accounting Policies
A. Basis of Presentation
The financial statements of the Fund have been prepared using U.S. GAAP.
The Fund has determined that it meets the definition of an investment company and has prepared the financial statements in conformity with U.S. GAAP for investment companies in conformity with accounting and reporting guidance of the Financial Accounting Standards Board Accounting Standards Codification Topic 946,Financial Services—Investment Companies.
10
B. Accounting Estimates
The preparation of financial statements in conformity with U.S. GAAP requires management to make estimates and assumptions that affect the reported amounts of assets and liabilities at the date of the financial statements and the reported amounts of revenues and expenses during the reporting period. Actual results could differ from those estimates by a significant amount. In addition, the Fund monitors for material events or transactions that may occur or become known after theperiod-end date and before the date the financial statements are released to print.
C. Investment Valuations
Investments inopen-end andclosed-end registered investment companies that do not trade on an exchange are valued at theend-of-day net asset value (“NAV”) per share. Investments inopen-end andclosed-end registered investment companies that trade on an exchange are valued at the last sales price or official closing price as of the close of the customary trading session on the exchange where the security is principally traded.
United States Treasury Obligations are fair valued using an evaluated quote provided by an independent pricing service. Evaluated quotes provided by the pricing service may be determined without exclusive reliance on quoted prices, and may reflect appropriate factors such as developments related to specific securities, yield, quality, type of issue, coupon rate, maturity, individual trading characteristics and other market data. All debt obligations involve some risk of default with respect to interest and/or principal payments.
Futures contracts are valued at the final settlement price set by an exchange on which they are principally traded.
Securities for which market quotations are not readily available or became unreliable are valued at fair value as determined in good faith following procedures approved by the Managing Owner. Issuer-specific events, market trends, bid/asked quotes of brokers and information providers and other data may be reviewed in the course of making a good faith determination of a security’s fair value.
D. Investment Transactions and Investment Income
Investment transactions are accounted for on a trade date basis. Realized gains or losses from the sale or disposition of securities or derivatives are determined on a specific identification basis and recognized in the Statements of Income and Expenses in the period in which the contract is closed or the sale or disposition occurs, respectively. Interest income on United States Treasury Obligations is recognized on an accrual basis when earned. Premiums and discounts are amortized or accreted over the life of the United States Treasury Obligations. Dividend income (net of withholding tax, if any) is recorded on theex-dividend date.
E. Profit and Loss Allocations and Distributions
Pursuant to the Trust Agreement, income and expenses are allocatedpro rata to the Managing Owner as holder of the General Shares and to the Shareholders monthly based on their respective percentage interests as of the close of the last trading day of the preceding month. Distributions (other than redemption of units) may be made at the sole discretion of the Managing Owner on apro rata basis in accordance with the respective capital balances of the shareholders.
No distributions were paid for the three and nine months ended September 30, 2018 and 2017.
F. Routine Operational, Administrative and Other Ordinary Expenses
The Managing Owner is responsible for all routine operational, administrative and other ordinary expenses of the Fund, including, but not limited to, computer services, the fees and expenses of the Trustee, legal and accounting fees and expenses, tax preparation expenses, filing fees and printing, mailing and duplication costs. The Fund does not reimburse the Managing Owner for the routine operational, administrative and other ordinary expenses of the Fund. Accordingly, such expenses are not reflected in the Statements of Income and Expenses of the Fund.
G. Non-Recurring Fees and Expenses
The Fund pays allnon-recurring and unusual fees and expenses, if any, of itself, as determined by the Managing Owner.Non-recurring and unusual fees and expenses include fees and expenses, such as legal claims and liabilities, litigation costs, indemnification expenses or othernon-routine expenses.Non-recurring and unusual fees and expenses, by their nature, are unpredictable in terms of timing and amount. For the three and nine months ended September 30, 2018 and 2017, the Fund did not incur such expenses.
11
H. Brokerage Commissions and Fees
The Fund incurs all brokerage commissions, including applicable exchange fees, National Futures Association (“NFA”) fees,give-up fees, pit brokerage fees and other transaction related fees and expenses charged in connection with trading activities by the Commodity Broker (as defined below). These costs are recorded as Brokerage Commissions and Fees in the Statements of Income and Expenses. The Commodity Broker’s brokerage commissions and trading fees are determined on acontract-by-contract basis. On average, total charges paid to the Commodity Broker, as applicable, were less than $7.00 and $7.00 per round-turn trade during the three and nine months ended September 30, 2018 and 2017, respectively.
I. Income Taxes
The Fund is classified as a partnership for U.S. federal income tax purposes. Accordingly, the Fund will generally not incur U.S. federal income taxes. No provision for federal, state, and local income taxes has been made in the accompanying financial statements, as investors are individually liable for income taxes, if any, on their allocable share of the Fund’s income, gain, loss, deductions and other items.
The Managing Owner has reviewed all of the Fund’s open tax years and major jurisdictions and concluded that there is no tax liability resulting from unrecognized tax benefits relating to uncertain tax positions taken or expected to be taken in future tax returns. The Fund is also not aware of any tax positions for which it is reasonably possible that the total amounts of unrecognized tax benefits will significantly change in the next twelve months. The major tax jurisdiction for the Fund and the earliest tax year subject to examination: United States, 2015.
J. Commodity Futures Contracts
The Fund utilizes derivative instruments to achieve its investment objective. A commodity futures contract is an agreement between counterparties to purchase or sell a specified underlying commodity for a specified price, or to pay or receive a cash amount based on the value of an index or other reference instrument, at a future date. Initial margin deposits required upon entering into futures contracts are satisfied by the segregation of specific securities or cash as collateral with the Commodity Broker. During the period that the commodity futures contracts are open, changes in the value of the contracts are recognized as unrealized gains or losses by recalculating the value of the contracts on a daily basis. Subsequent or variation margin payments are received or made depending upon whether unrealized gains or losses are incurred. These amounts are reflected as a receivable or payable on the Statements of Financial Condition. When the contracts are closed or expire, the Fund recognizes a realized gain or loss equal to the difference between the proceeds from, or cost of, the closing transaction and the Fund’s basis in the contract. Realized gains (losses) and changes in unrealized appreciation (depreciation) on open positions are determined on a specific identification basis and recognized in the Statements of Income and Expenses in the period in which the contract is closed or the changes occur, respectively.
Note 3—Financial Instrument Risk
In the normal course of its business, the Fund is a party to financial instruments withoff-balance sheet risk. The term“off-balance sheet risk” refers to an unrecorded potential liability that, even though it does not appear on the balance sheet, may result in a future obligation or loss in excess of the amounts shown on the Statements of Financial Condition. The financial instruments used by the Fund are commodity futures contracts, the values of which are based upon an underlying asset and generally represent future commitments that have a reasonable possibility of being settled in cash or through physical delivery. The financial instruments are traded on an exchange and are standardized contracts.
Market risk is the potential for changes in the value of the financial instruments traded by the Fund due to market changes, including fluctuations in commodity prices. In entering into these futures contracts, there exists a market risk that such futures contracts may be significantly influenced by adverse market conditions, resulting in such futures contracts being less valuable. If the markets should move against all of the futures contracts at the same time, the Fund could experience substantial losses.
Credit risk is the possibility that a loss may occur due to the failure of the Commodity Broker and/or clearing house to perform according to the terms of a futures contract. Credit risk with respect to exchange-traded instruments is reduced to the extent that an exchange or clearing organization acts as a counterparty to the transactions. The Commodity Broker, when acting as the Fund’s futures commission merchant in accepting orders for the purchase or sale of domestic futures contracts, is required by CFTC regulations to separately account for and segregate as belonging to the Fund all assets of the Fund relating to domestic futures trading. The Commodity Broker is not allowed to commingle such assets with other assets of the Commodity Broker. In addition, CFTC regulations also require the Commodity Broker to hold in a secure account assets of the Fund related to foreign futures trading. The Fund’s risk of loss in the event of counterparty default is typically limited to the amounts recognized in the Statements of Financial Condition and not represented by the futures contract or notional amounts of the instruments.
The Fund has not utilized, nor does it expect to utilize in the future, special purpose entities to facilitateoff-balance sheet financing arrangements and has no loan guarantee arrangements oroff-balance sheet arrangements of any kind, other than agreements entered into in the normal course of business noted above.
12
Note 4—Service Providers and Related Party Agreements
The Trustee
Under the Trust Agreement, Wilmington Trust Company, the trustee of the Trust and the Fund (the “Trustee”), has the power and authority to execute and file certificates as required by the Delaware Statutory Trust Act and to accept service of process on the Fund in the State of Delaware. The Managing Owner has the exclusive management and control of all aspects of the business of the Trust and the Fund. The Trustee will serve in that capacity until such time as the Managing Owner removes the Trustee or the Trustee resigns and a successor is appointed by the Managing Owner. The Trustee will have no duty or liability to supervise or monitor the performance of the Managing Owner, nor will the Trustee have any liability for the acts or omissions of the Managing Owner.
The Managing Owner
The Managing Owner serves as the Fund’s commodity pool operator, commodity trading advisor and managing owner. The Fund pays the Managing Owner a management fee, monthly in arrears, in an amount equal to 0.85% per annum of the daily NAV of the Fund (the “Management Fee”). The Fund, for cash management purposes, invests in money market mutual funds and/orT-Bill ETFs that are managed by affiliates of the Managing Owner. The indirect portion of the management fee that the Fund incurs through such investments is in addition to the Management Fee paid to the Managing Owner. The Managing Owner has contractually agreed to waive indefinitely the fees that it receives in an amount equal to the indirect management fees that the Fund incurs through its investments in affiliated money market mutual funds and/or affiliatedT-Bill ETFs. The Managing Owner may terminate this fee waiver on 60 days notice.
The Managing Owner waived fees of $32,840 and $90,844 for the three and nine months ended September 30, 2018, respectively. The Managing Owner waived fees of $32,956 and $108,844 for the three and nine months ended September 30, 2017, respectively.
The Distributor
Invesco Distributors, Inc. (the “Distributor”) provides certain distribution services to the Fund. Pursuant to the Distribution Services Agreement among the Managing Owner, the Fund and the Distributor, the Distributor assists the Managing Owner and the Fund’s administrator, The Bank of New York Mellon, with certain functions and duties relating to distribution and marketing services to the Fund including reviewing and approving marketing materials.
The Managing Owner pays the Distributor a distribution fee out of the Management Fee.
The Commodity Broker
Morgan Stanley & Co. LLC, a Delaware limited liability company, serves as the Fund’s futures clearing broker (the “Commodity Broker”). The Commodity Broker is registered with the CFTC as a futures commission merchant and is a member of the NFA in such capacity.
A variety of executing brokers execute futures transactions on behalf of the Fund. Such executing brokersgive-up all such transactions to the Commodity Broker. In its capacity as clearing broker, the Commodity Broker may execute or receive transactions executed by others and clears all of the Fund’s futures transactions and performs certain administrative and custodial services for the Fund. The Commodity Broker is responsible, among other things, for providing periodic accountings of all dealings and actions taken by the Fund during the reporting period, together with an accounting of all securities, cash or other indebtedness or obligations held by it or its nominees for or on behalf of the Fund.
The Administrator, Custodian and Transfer Agent
The Bank of New York Mellon (the “Administrator”, “Custodian” and “Transfer Agent”) is the administrator, custodian and transfer agent of the Fund. The Fund and the Administrator have entered into separate administrative, custodian, transfer agency and service agreements (collectively referred to as the “Administration Agreement”).
Pursuant to the Administration Agreement, the Administrator performs or supervises the performance of services necessary for the operation and administration of the Fund (other than making investment decisions), including receiving and processing orders from Authorized Participants to create and redeem Baskets, NAV calculations, accounting and other fund administrative services. The Administrator maintains certain financial books and records, including: Basket creation and redemption records; fund accounting records; ledgers with respect to assets, liabilities, capital, income and expenses; the registrar, transfer journals and related details; and trading and related documents received from the Commodity Broker. The Managing Owner pays the Administrator fees for its services out of the Management Fee.
13
Index Sponsor
The Managing Owner, on behalf of the Fund, has appointed Deutsche Investment Management Americas Inc. to serve as the index sponsor (the “Index Sponsor”). The Index Sponsor calculates and publishes the daily index levels and the indicative intraday index levels. Additionally, the Index Sponsor also calculates the indicative value per Share of the Fund throughout each business day.
The Managing Owner pays the Index Sponsor a licensing fee and an index services fee out of the Management Fee for performing its duties.
Note 5—Deposits with Commodity Broker and Custodian
The Fund defines cash as cash held by the Custodian. There were no cash equivalents held by the Fund as of September 30, 2018 and December 31, 2017.
The Fund may deposit cash, United States Treasury Obligations,T-Bill ETFs and money market mutual funds with the Commodity Broker as margin, to the extent permissible under CFTC rules. The combination of the Fund’s deposits with its Commodity Broker of cash and United States Treasury Obligations and the unrealized profit or loss on open futures contracts represents the Fund’s overall equity in its broker trading account. To meet the Fund’s maintenance margin requirements, the Fund holds United States Treasury Obligations with the Commodity Broker. The Fund transfers cash to the Commodity Broker to satisfy variation margin requirements. The Fund earns interest on any excess cash deposited with the Commodity Broker and incurs interest expense on any deficit balance with the Commodity Broker.
The brokerage agreement with the Commodity Broker provides for the net settlement of all financial instruments covered by the agreement in the event of default or termination of any one contract. The Managing Owner will utilize any excess cash held at the Commodity Broker to offset any realized losses incurred in the commodity futures contracts, if available. To the extent that any excess cash held at the Commodity Broker is not adequate to cover any realized losses, a portion of the United States Treasury Obligations andT-Bill ETFs, if any, on deposit with the Commodity Broker will be sold to make additional cash available. For financial reporting purposes, the Fund offsets financial assets and financial liabilities that are subject to legally enforceable netting arrangements.
The Fund’s remaining cash, United States Treasury Obligations,T-Bill ETFs and money market mutual fund holdings are on deposit with the Custodian. The Fund is permitted to temporarily carry a negative or overdrawn balance in its account with the Custodian. Such balances, if any atperiod-end, are shown on the Statements of Financial Condition under the payable captionDue to custodian.
Note 6—Additional Valuation Information
U.S. GAAP defines fair value as the price that would be received to sell an asset or paid to transfer a liability in an orderly transaction between market participants at the measurement date, under current market conditions. U.S. GAAP establishes a hierarchy that prioritizes the inputs to valuation methods, giving the highest priority to readily available unadjusted quoted prices in an active market for identical assets (Level 1) and the lowest priority to significant unobservable inputs (Level 3), generally when market prices are not readily available or are unreliable. Based on the valuation inputs, the securities or other investments are tiered into one of three levels. Changes in valuation methods or market conditions may result in transfers in or out of an investment’s assigned level:
Level 1: Prices are determined using quoted prices in an active market for identical assets.
Level 2: Prices are determined using other significant observable inputs. Observable inputs are inputs that other market participants may use in pricing a security. These may include quoted prices for similar securities, interest rates, prepayment speeds, credit risk, yield curves, loss severities, default rates, discount rates, volatilities and others.
Level 3: Prices are determined using significant unobservable inputs. In situations where quoted prices or observable inputs are unavailable (for example, when there is little or no market activity for an investment at the end of the period), unobservable inputs may be used. Unobservable inputs reflect the Fund’s own assumptions about the factors market participants would use in determining fair value of the securities or instruments and would be based on the best available information.
The levels assigned to the securities valuations may not be an indication of the risk or liquidity associated with investing in those securities. Because of the inherent uncertainties of valuation, the values reflected in the financial statements may materially differ from the value received upon actual sale of those investments.
14
The Fund’s policy is to recognize transfers in and out of the valuation levels as of the end of the reporting period. During the nine months ended September 30, 2018 and the year ended December 31, 2017, there were no transfers between valuation levels.
The following is a summary of the tiered valuation input levels as of September 30, 2018:
| Level 1 | Level 2 | Level 3 | Total | |||||||||||||
Investments in Securities | ||||||||||||||||
United States Treasury Obligations | $ | — | $ | 453,409,077 | $ | — | $ | 453,409,077 | ||||||||
Exchange-Traded Fund | 79,055,865 | — | — | 79,055,865 | ||||||||||||
Money Market Mutual Fund | 11,492,266 | — | — | 11,492,266 | ||||||||||||
|
|
|
|
|
|
|
| |||||||||
Total Investments in Securities | 90,548,131 | 453,409,077 | — | 543,957,208 | ||||||||||||
|
|
|
|
|
|
|
| |||||||||
Other Investments—Assets(a) | ||||||||||||||||
Commodity Futures Contracts | 5,558,710 | — | — | 5,558,710 | ||||||||||||
|
|
|
|
|
|
|
| |||||||||
Other Investments—Liabilities(a) | ||||||||||||||||
Commodity Futures Contracts | (37,455,956 | ) | — | — | (37,455,956 | ) | ||||||||||
|
|
|
|
|
|
|
| |||||||||
Total Other Investments | (31,897,246 | ) | — | — | (31,897,246 | ) | ||||||||||
|
|
|
|
|
|
|
| |||||||||
Total Investments | $ | 58,650,885 | $ | 453,409,077 | $ | — | $ | 512,059,962 | ||||||||
|
|
|
|
|
|
|
| |||||||||
| (a) | Unrealized appreciation (depreciation). |
The following is a summary of the tiered valuation input levels as of December 31, 2017:
| Level 1 | Level 2 | Level 3 | Total | |||||||||||||
Investments in Securities | ||||||||||||||||
United States Treasury Obligations | $ | — | $ | 514,714,860 | $ | — | $ | 514,714,860 | ||||||||
Exchange-Traded Fund | 78,920,919 | — | — | 78,920,919 | ||||||||||||
Money Market Mutual Fund | 45,827,387 | — | — | 45,827,387 | ||||||||||||
|
|
|
|
|
|
|
| |||||||||
Total Investments in Securities | 124,748,306 | 514,714,860 | — | 639,463,166 | ||||||||||||
|
|
|
|
|
|
|
| |||||||||
Other Investments—Assets(a) | ||||||||||||||||
Commodity Futures Contracts | 2,620,977 | — | — | 2,620,977 | ||||||||||||
|
|
|
|
|
|
|
| |||||||||
Other Investments—Liabilities(a) | ||||||||||||||||
Commodity Futures Contracts | (34,372,115 | ) | — | — | (34,372,115 | ) | ||||||||||
|
|
|
|
|
|
|
| |||||||||
Total Other Investments | (31,751,138 | ) | — | — | (31,751,138 | ) | ||||||||||
|
|
|
|
|
|
|
| |||||||||
Total Investments | $ | 92,997,168 | $ | 514,714,860 | $ | — | $ | 607,712,028 | ||||||||
|
|
|
|
|
|
|
| |||||||||
| (a) | Unrealized appreciation (depreciation). |
Note 7—Derivative Instruments
The Fair Value of Derivative Instruments is as follows:
| September 30, 2018 | December 31, 2017 | |||||||||||||||
Risk Exposure/Derivative Type(a) | Assets | Liabilities | Assets | Liabilities | ||||||||||||
Commodity risk | ||||||||||||||||
Commodity Futures Contracts | $ | 5,558,710 | $ | (37,455,956 | ) | $ | 2,620,977 | $ | (34,372,115 | ) | ||||||
| (a) | Includes cumulative appreciation (depreciation) of commodity futures contracts. Only the current day’s variation margin receivable (payable) is reported in the September 30, 2018 and December 31, 2017 Statements of Financial Condition. |
15
The following table presents derivative instruments that are either subject to an enforceable netting agreement or offset by collateral arrangements as of September 30, 2018, net by contract:
| Financial Derivative Assets | Financial Derivative Liabilities | Collateral (Received)/Pledged(a) | ||||||||||||||||||||||
Counterparty | Futures Contracts | Futures Contracts | Net value of derivatives | Non-Cash | Cash | Net amount | ||||||||||||||||||
Morgan Stanley & Co. LLC | $ | 37,613,614 | $ | (37,455,956 | ) | $ | 157,658 | $ | — | $ | — | $ | 157,658 | |||||||||||
The following table presents derivative instruments that are either subject to an enforceable netting agreement or offset by collateral arrangements as of December 31, 2017, net by contract:
| Financial Derivative Assets | Financial Derivative Liabilities | Collateral (Received)/Pledged(a) | ||||||||||||||||||||||
Counterparty | Futures Contracts | Futures Contracts | Net value of derivatives | Non-Cash | Cash | Net amount | ||||||||||||||||||
Morgan Stanley & Co. LLC | $ | 34,814,667 | $ | (34,372,115 | ) | $ | 442,552 | $ | — | $ | — | $ | 442,552 | |||||||||||
| (a) | As of September 30, 2018 and December 31, 2017, a portion of the Fund’s U.S. Treasury Obligations were required to be deposited as maintenance margin in support of the Fund’s futures positions. |
The Effect of Derivative Instruments on the Statements of Income and Expenses is as follows:
| For the Three Months Ended | ||||||||||
| Location of Gain (Loss) on Derivatives | September 30, | |||||||||
Risk Exposure/Derivative Type | Recognized in Income | 2018 | 2017 | |||||||
Commodity risk | ||||||||||
Commodity Futures Contracts | Net Realized Gain (Loss) | $ | (55,762,347 | ) | $ | (38,467,059 | ) | |||
Net Change in Unrealized Gain (Loss) | 12,196,327 | 4,856,872 | ||||||||
|
|
|
| |||||||
Total | $ | (43,566,020 | ) | $ | (33,610,187 | ) | ||||
|
|
|
| |||||||
| For the Nine Months Ended | ||||||||||
| Location of Gain (Loss) on Derivatives | September 30, | |||||||||
Risk Exposure/Derivative Type | Recognized in Income | 2018 | 2017 | |||||||
Commodity risk | ||||||||||
Commodity Futures Contracts | Net Realized Gain (Loss) | $ | (76,464,718 | ) | $ | (49,473,144 | ) | |||
Net Change in Unrealized Gain (Loss) | (146,108 | ) | 9,469,795 | |||||||
|
|
|
| |||||||
Total | $ | (76,610,826 | ) | $ | (40,003,349 | ) | ||||
|
|
|
| |||||||
The table below summarizes the average monthly notional value of futures contracts outstanding during the period:
| For the Three Months Ended | For the Nine Months Ended | |||||||||||||||
| September 30, | September 30, | |||||||||||||||
| 2018 | 2017 | 2018 | 2017 | |||||||||||||
Average Notional Value | $ | 614,725,444 | $ | 707,355,960 | $ | 671,028,666 | $ | 729,453,181 | ||||||||
16
Note 8—Investments in Affiliates
The Invesco Treasury Collateral ETF is an investment company registered under the Investment Company Act of 1940, as amended, whose shares are primarily purchased and sold on a national securities exchange. In seeking its investment objective, the Invesco Treasury Collateral ETF primarily holds U.S. Treasury Obligations that: (i) are issued in U.S. Dollars; (ii) have a minimum remaining maturity of at least one month and a maximum remaining maturity of 12 months at the time of rebalance; and (iii) have a minimum amount outstanding of $300 million. Because it is advised by the Managing Owner, the Invesco Treasury Collateral ETF is an affiliate of the Fund.
The following is a summary of the transactions in, and earnings from, investments in affiliates (excluding affiliated money market funds) for the three and nine months ended September 30, 2018.
| Value 06/30/2018 | Purchases at Cost | Proceeds from Sales | Change in Unrealized Appreciation (Depreciation) | Realized Gain (Loss) | Value 09/30/2018 | Dividend Income | ||||||||||||||||||||||
Invesco Treasury Collateral ETF | $ | 79,550,667 | $ | — | $ | — | $ | (494,802 | ) | $ | — | $ | 79,055,865 | $ | 880,560 | |||||||||||||
| Value 12/31/2017 | Purchases at Cost | Proceeds from Sales | Change in Unrealized Appreciation (Depreciation) | Realized Gain (Loss) | Value 09/30/2018 | Dividend Income | ||||||||||||||||||||||
Invesco Treasury Collateral ETF | $ | 78,920,919 | $ | — | $ | — | $ | 134,946 | $ | — | $ | 79,055,865 | $ | 880,560 | ||||||||||||||
The following is a summary of the transactions in, and earnings from, investments in affiliates (excluding affiliated money market funds) for the three and nine months ended September 30, 2017.
| Value 06/30/2017 | Purchases at Cost | Proceeds from Sales | Change in Unrealized Appreciation (Depreciation) | Realized Gain (Loss) | Value 09/30/2017 | Dividend Income | ||||||||||||||||||||||
PowerShares Treasury Collateral Portfolio | $ | 79,168,320 | $ | — | $ | — | $ | 187,425 | $ | — | $ | 79,355,745 | $ | — | ||||||||||||||
| Value 12/31/2016 | Purchases at Cost | Proceeds from Sales | Change in Unrealized Appreciation (Depreciation) | Realized Gain (Loss) | Value 09/30/2017 | Dividend Income | ||||||||||||||||||||||
PowerShares Treasury Collateral Portfolio | $ | — | $ | 78,999,188 | $ | — | $ | 356,557 | $ | — | $ | 79,355,745 | $ | — | ||||||||||||||
Note 9—Share Purchases and Redemptions
(a) Purchases
On any business day, an Authorized Participant may place an order with the Transfer Agent to create one or more Baskets. Each Basket consists of a block of 200,000 Shares. For purposes of processing both creation and redemption orders, a “business day” means any day other than a day when banks in New York City are required or permitted to be closed. Creation orders must be placed by 10:00 a.m., Eastern Time. The day on which the Transfer Agent receives a valid creation order is the creation order date. The day on which a creation order is settled is the creation order settlement date. Cash settlement occurs at the creation order settlement date. As provided below, the creation order settlement date may occur up to two business days after the creation order date. By placing a creation order, and prior to delivery of such Baskets, an Authorized Participant’s Depository Trust Company (“DTC”) account is charged thenon-refundable transaction fee due for the creation order.
Unless otherwise agreed to by the Managing Owner and the Authorized Participant as provided in the next sentence, Baskets are issued on the creation order settlement date as of 2:45 p.m., Eastern Time, on the business day immediately following the creation order date at the applicable NAV per Share as of the closing time of the NYSE Arca or the last to close of the exchanges on which its futures contracts are traded, whichever is later, on the creation order date, but only if the required payment has been timely received. Upon submission of a creation order, the Authorized Participant may request the Managing Owner to agree to a creation order settlement date up to two business days after the creation order date.
17
(b) Redemptions
On any business day, an Authorized Participant may place an order with the Transfer Agent to redeem one or more Baskets. Redemption orders must be placed by 10:00 a.m., Eastern Time. The day on which the Managing Owner receives a valid redemption order is the redemption order date. The day on which a redemption order is settled is the redemption order settlement date. Cash settlement occurs at the redemption order settlement date. As provided below, the redemption order settlement date may occur up to two business days after the redemption order date. The redemption procedures allow Authorized Participants to redeem Baskets. Individual Shareholders may not redeem directly from the Fund. Instead, individual Shareholders may only redeem Shares in integral multiples of 200,000 and only through an Authorized Participant.
Unless otherwise agreed to by the Managing Owner and the Authorized Participant as provided in the next sentence, by placing a redemption order, an Authorized Participant agrees to deliver the Baskets to be redeemed through DTC’s book-entry system to the Fund no later than the redemption order settlement date as of 2:45 p.m., Eastern Time, on the business day immediately following the redemption order date. Upon submission of a redemption order, the Authorized Participant may request the Managing Owner to agree to a redemption order settlement date up to two business days after the redemption order date. By placing a redemption order, and prior to receipt of the redemption proceeds, an Authorized Participant’s DTC account is charged thenon-refundable transaction fee due for the redemption order.
The redemption proceeds from the Fund consist of the cash redemption amount. The cash redemption amount is equal to the NAV of the number of Basket(s) requested in the Authorized Participant’s redemption order as of the closing time of the NYSE Arca or the last to close of the exchanges on which the Fund’s futures contracts are traded, whichever is later, on the redemption order date. The Managing Owner will distribute the cash redemption amount at the redemption order settlement date as of 2:45 p.m., Eastern Time, on the redemption order settlement date through DTC to the account of the Authorized Participant as recorded on DTC’s book-entry system.
The redemption proceeds due from the Fund are delivered to the Authorized Participant at 2:45 p.m., Eastern Time, on the redemption order settlement date if, by such time, the Fund’s DTC account has been credited with the Baskets to be redeemed. If the Fund’s DTC account has not been credited with all of the Baskets to be redeemed by such time, the redemption distribution is delivered to the extent of whole Baskets received. Any remainder of the redemption distribution is delivered on the next business day to the extent of remaining whole Baskets received if the Transfer Agent receives the fee applicable to the extension of the redemption distribution date which the Managing Owner may, fromtime-to-time, determine and the remaining Baskets to be redeemed are credited to the Fund’s DTC account by 2:45 p.m., Eastern Time, on such next business day. Any further outstanding amount of the redemption order will be cancelled. The Managing Owner is also authorized to deliver the redemption distribution notwithstanding that the Baskets to be redeemed are not credited to the Fund’s DTC account by 2:45 p.m., Eastern Time, on the redemption order settlement date if the Authorized Participant has collateralized its obligation to deliver the Baskets through DTC’s book-entry system on such terms as the Managing Owner may determine fromtime-to-time.
Note 10—Commitments and Contingencies
The Managing Owner, either in its own capacity or in its capacity as the Managing Owner and on behalf of the Fund, has entered into various service agreements that contain a variety of representations, or provide indemnification provisions related to certain risks service providers undertake in performing services for the Fund. The Trust Agreement provides for the Fund to indemnify the Managing Owner and any affiliate of the Managing Owner that provides services to the Fund to the maximum extent permitted by applicable law, subject to certain exceptions for disqualifying conduct by the Managing Owner or such an affiliate. The Fund’s maximum exposure under these arrangements is unknown as this would involve future claims that may be made against the Fund that have not yet occurred. Further, the Fund has not had prior claims or losses pursuant to these contracts. Accordingly, the Managing Owner expects the risk of loss to be remote.
18
Note 11—Financial Highlights
The Fund is presenting the following NAV and financial highlights related to investment performance for a Share outstanding for the three and nine months ended September 30, 2018 and 2017. An individual investor’s return and ratios may vary based on the timing of capital transactions.
NAV per Share is the NAV of the Fund divided by the number of outstanding Shares at the date of each respective period presented.
| Three Months Ended | Nine Months Ended | |||||||||||||||
| September 30, | September 30, | |||||||||||||||
| 2018 | 2017 | 2018 | 2017 | |||||||||||||
Net Asset Value | ||||||||||||||||
Net asset value per Share, beginning of period | $ | 18.03 | $ | 19.84 | $ | 18.76 | $ | 19.98 | ||||||||
Net realized and change in unrealized gain (loss) on United States Treasury Obligations, Affiliated Investments and Commodity Futures Contracts | (1.20 | ) | (0.90 | ) | (1.97 | ) | (1.00 | ) | ||||||||
Net investment income (loss)(a) | 0.06 | (0.00 | ) | 0.10 | (0.04 | ) | ||||||||||
|
|
|
|
|
|
|
| |||||||||
Net income (loss) | (1.14 | ) | (0.90 | ) | (1.87 | ) | (1.04 | ) | ||||||||
|
|
|
|
|
|
|
| |||||||||
Net asset value per Share, end of period | $ | 16.89 | $ | 18.94 | $ | 16.89 | $ | 18.94 | ||||||||
|
|
|
|
|
|
|
| |||||||||
Market value per Share, beginning of period(b) | $ | 18.03 | $ | 19.85 | $ | 18.75 | $ | 19.98 | ||||||||
|
|
|
|
|
|
|
| |||||||||
Market value per Share, end of period(b) | $ | 16.91 | $ | 18.98 | $ | 16.91 | $ | 18.98 | ||||||||
|
|
|
|
|
|
|
| |||||||||
Ratio to average Net Assets(c) | ||||||||||||||||
Net investment income (loss) | 1.37 | % | (0.03 | )% | 0.75 | % | (0.25 | )% | ||||||||
|
|
|
|
|
|
|
| |||||||||
Expenses, after waivers | 0.95 | % | 0.93 | % | 0.92 | % | 0.92 | % | ||||||||
|
|
|
|
|
|
|
| |||||||||
Expenses, prior to waivers | 0.97 | % | 0.95 | % | 0.94 | % | 0.94 | % | ||||||||
|
|
|
|
|
|
|
| |||||||||
Total Return, at net asset value(d) | (6.32 | )% | (4.54 | )% | (9.97 | )% | (5.21 | )% | ||||||||
|
|
|
|
|
|
|
| |||||||||
Total Return, at market value(d) | (6.21 | )% | (4.38 | )% | (9.81 | )% | (5.01 | )% | ||||||||
|
|
|
|
|
|
|
| |||||||||
| (a) | Based on average shares outstanding. |
| (b) | The mean between the last bid and ask prices. |
| (c) | Annualized. |
| (d) | Total Return, at NAV is calculated assuming an initial investment made at the NAV at the beginning of the period, reinvestment of all dividends and distributions at NAV during the period, and redemption of Shares on the last day of the period. Total Return, at NAV includes adjustments in accordance with U.S. GAAP and as such, the NAV for financial reporting purposes and the returns based upon those NAVs may differ from the NAVs and returns for shareholder transactions. Total Return, at market value is calculated assuming an initial investment made at the market value at the beginning of the period, reinvestment of all dividends and distributions at market value during the period, and redemption of Shares at the market value on the last day of the period. Not annualized for periods less than one year, if applicable. |
19
| ITEM 2. | MANAGEMENT’S DISCUSSION AND ANALYSIS OF FINANCIAL CONDITION AND RESULTS OF OPERATIONS. |
This information should be read in conjunction with the financial statements and notes included in Item 1 of Part I of this Quarterly Report on Form10-Q (the “Report”). The discussion and analysis which follows may contain trend analysis and other forward-looking statements within the meaning of Section 27A of the Securities Act of 1933 (the “Securities Act”) and Section 21E of the Securities Exchange Act of 1934, as amended (the “Exchange Act”), which reflect the current views of Invesco DB Agriculture Fund (the “Fund”) with respect to future events and financial results. The matters discussed throughout this Report that are not historical facts are forward-looking statements. These forward-looking statements are based on the Fund’s current expectations, estimates and projections about its business and industry and its beliefs and assumptions about future events. Words such as “anticipate,” “expect,” “intend,” “plan,” “believe,” “seek,” “outlook” and “estimate,” as well as similar words and phrases, signify forward-looking statements. Because forward-looking statements relate to the future, they are subject to inherent uncertainties, risk and changes in circumstances that are difficult to predict and many of which are outside of the Fund’s control. The Fund’s forward-looking statements are not guarantees of future results and conditions and important factors, risks and uncertainties in the markets for financial instruments that the Fund trades, in the markets for related physical commodities, in the legal and regulatory regimes applicable to the Managing Owner, the Fund, and the Fund’s service providers, and in the broader economy may cause the Fund’s actual results to differ materially from those expressed in forward-looking statements.
You should not place undue reliance on any forward-looking statements. Any forward-looking statement in this report is based only on information currently available to the Fund and speaks only as of the date on which it is made. Except as expressly required by the Federal securities laws, the Fund undertakes no obligation to publicly update or revise any forward-looking statements or the risks, uncertainties or other factors described in this Report, as a result of new information, future events or changed circumstances or for any other reason after the date of this Report.
Overview/Introduction
Invesco Capital Management LLC (“Invesco”) has served as the managing owner (the “Managing Owner”), commodity pool operator and commodity trading advisor of the Trust and the Fund since February 23, 2015. The Managing Owner is registered with the Commodity Futures Trading Commission (the “CFTC”) as a commodity pool operator and a commodity trading advisor, and it is a member firm of the National Futures Association (“NFA”).
The Fund seeks to track changes, whether positive or negative, in the level of the DBIQ Diversified Agriculture Index Excess Return™ (the “Index”) over time, plus the excess, if any, of the sum of the Fund’s interest income from its holdings of United States Treasury Obligations (“Treasury Income”), dividends from its holdings in money market mutual funds (affiliated or otherwise) (“Money Market Income”) and dividends or distributions of capital gains from its holdings ofT-Bill ETFs (as defined below)(“T-Bill ETF Income”) over the expenses of the Fund.
The Index is intended to reflect the change in market value of the agricultural sector. The commodities comprising the Index are Corn, Soybeans, Wheat, Kansas City Wheat, Sugar, Cocoa, Coffee, Cotton, Live Cattle, Feeder Cattle and Lean Hogs (each an “Index Commodity”, and collectively, the “Index Commodities”).
The Fund may invest directly in United States Treasury Obligations. The Fund may also gain exposure to United States Treasury Obligations through investments in exchange-traded funds (“ETFs”) (affiliated or otherwise) that track indexes that measure the performance of United States Treasury Obligations with a maximum remaining maturity of up to 12 months(“T-Bill ETFs”). The Fund invests in United States Treasury Obligations, money market mutual funds andT-Bill ETFs (affiliated or otherwise), if any, for margin and/or cash management purposes.
The Fund pursues its investment objective by investing in a portfolio of exchange-traded commodity futures contracts that expire in a specific month and trade on a specific exchange (the “Index Contracts”) in the Index Commodities. The Fund also holds United States Treasury Obligations andT-Bill ETFs, if any, for deposit with Morgan Stanley & Co. LLC, the Fund’s commodity broker (the “Commodity Broker”) as margin, to the extent permissible under CFTC rules and United States Treasury Obligations, cash, money market mutual funds andT-Bill ETFs (affiliated or otherwise), if any, on deposit with The Bank of New York Mellon (the “Custodian”), for cash management purposes. The aggregate notional value of the commodity futures contracts owned by the Fund is expected to approximate the aggregate net asset value (“NAV”) of the Fund, as opposed to the aggregate Index value.
The CFTC and certain futures exchanges impose position limits on futures contracts, including on Index Contracts. As the Fund approaches or reaches position limits with respect to an Index Commodity, the Fund may commence investing in Index Contracts that reference other Index Commodities. In those circumstances, the Fund may also trade in futures contracts based on commodities other than Index Commodities that the Managing Owner reasonably believes tend to exhibit trading prices that correlate with an Index Contract. In addition, the Managing Owner may determine to invest in other futures contracts if at any time it is impractical or inefficient to gain full or partial exposure to an Index Commodity through the use of Index Contracts. These other futures contracts may or may not be based on an Index Commodity. When they are not, the Managing Owner may seek to select futures contracts that it reasonably believes tend to exhibit trading prices that correlate with an Index Contract.
20
The Shares are intended to provide investment results that generally correspond to the changes, positive or negative, in the levels of the Index over time. The value of the Shares is expected to fluctuate in relation to changes in the value of the Fund’s portfolio. The market price of the Shares may not be identical to the NAV per Share, but these two valuations are expected to be very close.
Index Description
The Managing Owner pays Deutsche Investment Management Americas Inc. (the “Index Sponsor”) a licensing fee and an index services fee for performing its duties.
These fees constitute a portion of the routine operational, administrative and other ordinary expenses which are paid out of the Management Fee and are not charged to or reimbursed by the Fund.
Neither the Managing Owner nor any affiliate of the Managing Owner has any rights to influence the selection of the futures contracts underlying the Index. The Managing Owner has entered into a license agreement with the Index Sponsor to use the Index.
The Fund is not sponsored or endorsed by Deutsche Bank AG, Deutsche Investment Management Americas Inc. or any subsidiary or affiliate of Deutsche Bank AG or Deutsche Investment Management Americas Inc. (collectively, “Deutsche Bank”). The DBIQ Diversified Agriculture Index Excess Return™ (the “Index”) is the exclusive property of Deutsche Investment Management Americas Inc. “DBIQ” is a service mark of Deutsche Bank AG and has been licensed for use for certain purposes by Deutsche Investment Management Americas Inc. Neither Deutsche Bank nor any other party involved in, or related to, making or compiling the Index makes any representation or warranty, express or implied, concerning the Index, the Fund or the advisability of investing in securities generally. Neither Deutsche Bank nor any other party involved in, or related to, making or compiling the Index has any obligation to take the needs of the Managing Owner, or its clients into consideration in determining, composing or calculating the Index. Neither Deutsche Bank nor any other party involved in, or related to, making or compiling the Index is responsible for or has participated in the determination of the timing of, prices at, quantities or valuation of the Fund. Neither Deutsche Bank nor any other party involved in, or related to, making or compiling the Index has any obligation or liability in connection with the administration or trading of the Fund.
NEITHER DEUTSCHE BANK NOR ANY OTHER PARTY INVOLVED IN, OR RELATED TO, MAKING OR COMPILING THE INDEX, WARRANTS OR GUARANTEES THE ACCURACY AND/OR THE COMPLETENESS OF THE INDEX OR ANY DATA INCLUDED THEREIN AND SHALL HAVE NO LIABILITY FOR ANY ERRORS, OMISSIONS, OR INTERRUPTIONS THEREIN. NEITHER DEUTSCHE BANK NOR ANY OTHER PARTY INVOLVED IN, OR RELATED TO, MAKING OR COMPILING THE INDEX, MAKES ANY WARRANTY, EXPRESS OR IMPLIED, AS TO RESULTS TO BE OBTAINED BY INVESCO CAPITAL MANAGEMENT LLC FROM THE USE OF THE INDEX OR ANY DATA INCLUDED THEREIN. NEITHER DEUTSCHE BANK NOR ANY OTHER PARTY INVOLVED IN, OR RELATED TO, MAKING OR COMPILING THE INDEX, MAKES ANY EXPRESS OR IMPLIED WARRANTIES, AND EXPRESSLY DISCLAIMS ALL WARRANTIES, OF MERCHANTABILITY OR FITNESS FOR A PARTICULAR PURPOSE OR USE WITH RESPECT TO THE INDEX OR ANY DATA INCLUDED THEREIN. WITHOUT LIMITING ANY OF THE FOREGOING, IN NO EVENT SHALL DEUTSCHE BANK OR ANY OTHER PARTY INVOLVED IN, OR RELATED TO, MAKING OR COMPILING THE INDEX HAVE ANY LIABILITY FOR DIRECT, INDIRECT, PUNITIVE, SPECIAL, CONSEQUENTIAL OR ANY OTHER DAMAGES OR LOSSES (INCLUDING LOST PROFITS), EVEN IF NOTIFIED OF THE POSSIBILITY THEREOF. EXCEPT AS EXPRESSLY PROVIDED TO THE CONTRARY, THERE ARE NO THIRD PARTY BENEFICIARIES OF ANY AGREEMENTS OR ARRANGEMENTS BETWEEN DEUTSCHE BANK AND INVESCO CAPITAL MANAGEMENT LLC.
No purchaser, seller or holder of the Shares of this Fund, or any other person or entity, should use or refer to any Deutsche Bank trade name, trademark or service mark to sponsor, endorse, market or promote this Fund without first contacting Deutsche Bank to determine whether Deutsche Bank’s permission is required. Under no circumstances may any person or entity claim any affiliation with Deutsche Bank without the written permission of Deutsche Bank.
The Index is composed of notional amounts of each of the underlying Index Commodities. The notional amount of each Index Commodity included in the Index is intended to reflect the changes in market value of each such Index Commodity within the Index. The closing level of the Index is calculated on each business day by the Index Sponsor based on the closing price of the futures contracts for each of the Index Commodities and the notional amount of such Index Commodity.
The Index is rebalanced annually in November to ensure that each of the Index Commodities is weighted in the same proportion that such Index Commodities were weighted on January 18, 1989 (the “Base Date”). The composition of the Index may be adjusted in the event that the Index Sponsor is not able to calculate the closing prices of the Index Commodities.
21
The following table reflects the Fund weights of each Index Commodity or related futures contracts, as applicable, as of September 30, 2018:
Index Commodity | Fund Weight (%) | |||
Corn | 13.11 | % | ||
Soybeans | 12.11 | |||
Wheat | 7.29 | |||
Kansas City Wheat | 7.36 | |||
Sugar | 9.92 | |||
Cocoa | 11.16 | |||
Coffee | 9.36 | |||
Cotton | 3.55 | |||
Live Cattle | 13.27 | |||
Feeder Cattle | 4.64 | |||
Lean Hogs | 8.23 | |||
|
| |||
Closing Level as of September 30, 2018: | 100.00 | % | ||
|
| |||
Please seehttp://www.invesco.com/ETFs with respect to the most recently available weighted composition of the Fund and the composition of the Index.
The CFTC and certain futures exchanges impose position limits on Index Contracts. The Managing Owner may determine to invest in other futures contracts if at any time it is impractical or inefficient to gain full or partial exposure to an Index Commodity through the use of Index Contracts. These other futures contracts may or may not be based on an Index Commodity. When they are not, the Managing Owner may seek to select futures contracts that it reasonably believes tend to exhibit trading prices that correlate with an Index Contract.
As the Fund approaches or reaches position limits with respect to an Index Commodity, the Fund may commence investing in Index Contracts that reference other Index Commodities. In those circumstances, the Fund may also trade in futures contracts based on commodities other than Index Commodities that the Managing Owner reasonably believes tend to exhibit trading prices that correlate with an Index Contract.
Market Risk
Trading in futures contracts involves the Fund entering into contractual commitments to purchase a particular commodity at a specified date and price. The market risk associated with the Fund’s commitments to purchase commodities is limited to the gross or face amount of the contracts held.
The Fund’s exposure to market risk is also influenced by a number of factors including the volatility of interest rates and foreign currency exchange rates, the liquidity of the markets in which the contracts are traded and the relationships among the contracts held. The inherent uncertainty of the Fund’s trading as well as the development of drastic market occurrences could ultimately lead to a loss of all or substantially all of the investors’ capital.
Credit Risk
When the Fund enters into futures contracts, the Fund is exposed to credit risk that the counterparty to the contract will not meet its obligations. The counterparty for futures contracts traded on United States and on most foreign futures exchanges is the clearing house associated with the particular exchange. In general, clearing houses are backed by their corporate members who may be required to share in the financial burden resulting from the nonperformance by one of their members and, as such, is designed to disperse and mitigate the credit risk posed by any one member. In cases where the clearing house is not backed by the clearing members (i.e., some foreign exchanges), it may be backed by a consortium of banks or other financial institutions. There can be no assurance that any counterparty, clearing member or clearinghouse will meet its obligations to the Fund.
The Commodity Broker, when acting as the Fund’s futures commission merchant in accepting orders for the purchase or sale of domestic futures contracts, is required by CFTC regulations to separately account for and segregate as belonging to the Fund all assets of the Fund relating to domestic futures trading. The Commodity Broker is not allowed to commingle such assets with other assets of the Commodity Broker. In addition, CFTC regulations also require the Commodity Broker to hold in a secure account assets of the Fund related to foreign futures trading. While these legal requirements are designed to protect the customers of futures commission merchants, a failure by the Commodity Broker to comply with those requirements would be likely to have a material adverse effect on the Fund in the event that the Commodity Broker became insolvent or suffered other financial distress.
Liquidity
The Fund’s entire source of capital is derived from the Fund’s offering of Shares to Authorized Participants. The Fund in turn allocates its net assets to commodities trading. A significant portion of the NAV is held in United States Treasury Obligations, which
22
may be used as margin for the Fund’s trading in commodity futures contracts and United States Treasury Obligations, money market mutual funds, cash andT-Bill ETFs, if any, which may be used for cash management purposes. The percentage that United States Treasury Obligations bear to the total net assets will vary from period to period as the market values of the Fund’s commodity interests change. A portion of the Fund’s United States Treasury Obligations is held for deposit with the Commodity Broker to meet margin requirements. All remaining cash, money market mutual funds,T-Bill ETFs, if any, and United States Treasury Obligations are on deposit with the Custodian. Interest earned on the Fund’s interest-bearing funds and dividends from the Fund’s holdings of money market mutual funds are paid to the Fund. Any dividends or distributions of capital gains received from the Fund’s holdings ofT-Bill ETFs, if any, are paid to the Fund.
The Fund’s commodity futures contracts may be subject to periods of illiquidity because of market conditions, regulatory considerations or for other reasons. For example, U.S. futures exchanges and some foreign exchanges have regulations that limit the amount of fluctuation in futures contract prices that may occur during a single business day. These limits are generally referred to as “daily price fluctuation limits” or “daily limits,” and the maximum or minimum price of a contract on any given day as a result of these limits is referred to as a “limit price.” Once a limit price has been reached in a particular contract, it is usually the case that no trades may be made at a different price than specified in the limit. The duration of limit prices generally varies. Limit prices may have the effect of precluding the Fund from trading in a particular contract or requiring the Fund to liquidate contracts at disadvantageous times or prices. Either of those outcomes could adversely affect the Fund’s ability to pursue its investment objective or achieve favorable performance.
Because the Fund trades futures contracts, its capital is at risk due to changes in the value of futures contracts (market risk) or the inability of counterparties (including the Commodity Broker and/or exchange clearinghouses) to perform under the terms of the contracts (credit risk).
On any business day, an Authorized Participant may place an order with the Transfer Agent to redeem one or more blocks of 200,000 Shares (“Baskets”). Redemption orders must be placed by 10:00 a.m., Eastern Time. The day on which the Managing Owner receives a valid redemption order is the redemption order date. The day on which a redemption order is settled is the redemption order settlement date. As provided below, the redemption order settlement date may occur up to two business days after the redemption order date. Redemption orders are irrevocable. The redemption procedures allow Authorized Participants to redeem Baskets. Individual Shareholders may not redeem directly from the Fund. Instead, individual Shareholders may only redeem Shares in integral multiples of 200,000 and only through an Authorized Participant.
Unless otherwise agreed to by the Managing Owner and the Authorized Participant as provided in the next sentence, by placing a redemption order, an Authorized Participant agrees to deliver the Baskets to be redeemed through DTC’s book-entry system to the Fund no later than the redemption order settlement date as of 2:45 p.m., Eastern Time, on the business day immediately following the redemption order date. Upon submission of a redemption order, the Authorized Participant may request the Managing Owner to agree to a redemption order settlement date up to two business days after the redemption order date. By placing a redemption order, and prior to receipt of the redemption proceeds, an Authorized Participant’s DTC account is charged thenon-refundable transaction fee due for the redemption order.
Redemption orders may be placed either (i) through the Continuous Net Settlement (“CNS”) clearing processes of the National Securities Clearing Corporation (the “NSCC”) (the “CNS Clearing Process”) or (ii) if outside the CNS Clearing Process, only through the facilities of The Depository Trust Company (“DTC” or the “Depository”) (the “DTC Process”), or a successor depository, and only in exchange for cash. By placing a redemption order, and prior to receipt of the redemption proceeds, an Authorized Participant’s DTC account is charged thenon-refundable transaction fee due for the redemption order and such fee is not borne by the Fund.
Capital Resources
The Fund does not have any material commitments for capital expenditures as of the end of the latest fiscal period.
The Fund is unaware of any (i) anticipated known demands, commitments or capital expenditures; (ii) material trends, favorable or unfavorable, in its capital resources; or (iii) trends or uncertainties that will have a material effect on its operations.
Cash Flows
A primary cash flow activity of the Fund is to raise capital from Authorized Participants through the issuance of Shares. This cash is used to invest in United States Treasury Obligations, money market mutual funds andT-Bill ETFs, if any, and to meet margin requirements as a result of the positions taken in futures contracts to match the fluctuations of the Index.
As of the date of this Report, each of Bank of America Merrill Lynch, BMO Capital Markets Corp., BNP Paribas Securities Corp, Cantor Fitzgerald & Co., Citadel Securities LLC, Citigroup Global Markets, Credit Suisse Securities (USA) LLC, Deutsche Investment Management Americas Inc., Goldman Sachs & Co., Goldman Sachs Execution & Clearing LP, Interactive Brokers LLC, Jefferies LLC, JP Morgan Securities Inc., Knight Clearing Services LLC, Merrill Lynch Professional Clearing Corp, Morgan Stanley & Co. LLC, Nomura Securities International Inc., RBC Capital Markets LLC, SG Americas Securities LLC, Timber Hill LLC, UBS Securities, Virtu Financial BD LLC and Virtu Financial Capital Markets LLC has executed a Participant Agreement and are the only Authorized Participants.
23
Operating Activities
Net cash flow provided by (used for) operating activities was $23.0 million and $(32.1) million for the nine months ended September 30, 2018 and 2017, respectively. These amounts primarily include net income (loss), net purchases and sales of money market mutual funds and net purchases and sales of United States Treasury Obligations and affiliated investments. The Fund invests in United States Treasury Obligations, money market mutual funds andT-Bill ETFs (affiliated or otherwise), if any, for margin and/or cash management purposes only.
During the nine months ended September 30, 2018, $1,070.3 million was paid to purchase United States Treasury Obligations and $1,138.8 million was received from sales and maturing United States Treasury Obligations. During the nine months ended September 30, 2017, $1,824.6 million was paid to purchase United States Treasury Obligations and $1,934.9 million was received from sales and maturing United States Treasury Obligations. $511.2 million was received from sales of affiliated investments and $476.9 million was paid to purchase affiliated investments during the nine months ended September 30, 2018. $922.8 million was received from the sales of affiliated investments and $1,016.5 million was paid to purchase affiliated investments during the nine months ended September 30, 2017. Unrealized appreciation/depreciation on United States Treasury Obligations and affiliated investments increased (decreased) net cash provided by (used for) operating activities by $(0.1) million and $(0.4) million during the nine months ended September 30, 2018 and 2017, respectively.
Financing Activities
The Fund’s net cash flow provided by (used for) financing activities was $(25.3) million and $29.9 million during the nine months ended September 30, 2018 and 2017, respectively. This included $152.2 million and $208.9 million from Shares purchased by Authorized Participants and $177.5 million and $179.0 million from Shares redeemed by Authorized Participants during the nine months ended September 30, 2018 and 2017, respectively.
Results of Operations
FOR THE THREE AND NINE MONTHS ENDED SEPTEMBER 30, 2018 AND 2017
The following graphs illustrate the percentage changes in (i) the market price of the Shares (as reflected by the line “Market”), (ii) the Fund’s NAV (as reflected by the line “NAV”), and (iii) the closing levels of the Index (as reflected by the line “DBIQ Diversified Agriculture Index ER”). Whenever the Treasury Income, Money Market Income andT-Bill ETF Income, if any, earned by the Fund exceeds Fund expenses, the price of the Shares generally exceeds the levels of the Index primarily because the Share price reflects Treasury Income, Money Market Income andT-Bill ETF Income, if any, from the Fund’s collateral holdings whereas the Index does not consider such income. There can be no assurances that the price of the Shares or the Fund’s NAV will exceed the Index levels.
No representation is being made that the Index will or is likely to achieve closing levels consistent with or similar to those set forth herein. Similarly, no representation is being made that the Fund will generate profits or losses similar to the Fund’s past performance or changes in the Index closing levels.
24
COMPARISON OF MARKET, NAV AND DBIQ DIVERSIFIED AGRICULTURE INDEX ERTM
FOR THE THREE AND NINE MONTHS ENDED SEPTEMBER 30, 2018 AND 2017
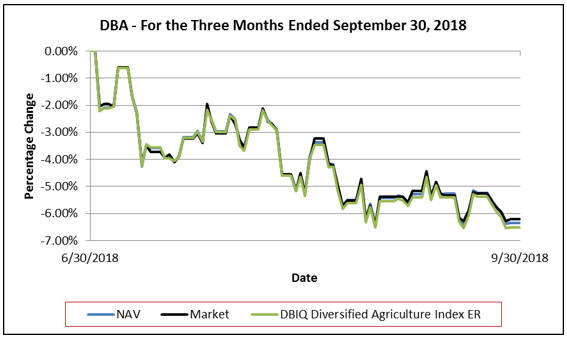
NEITHER THE PAST PERFORMANCE OF THE FUND NOR THE PRIOR INDEX LEVELS AND CHANGES, POSITIVE OR NEGATIVE, SHOULD BE TAKEN AS AN INDICATION OF THE FUND’S FUTURE PERFORMANCE.
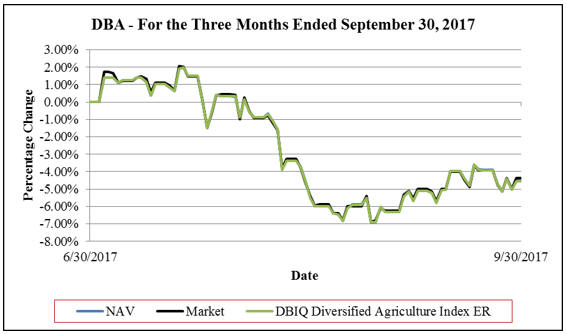
NEITHER THE PAST PERFORMANCE OF THE FUND NOR THE PRIOR INDEX LEVELS AND CHANGES, POSITIVE OR NEGATIVE, SHOULD BE TAKEN AS AN INDICATION OF THE FUND’S FUTURE PERFORMANCE.
25
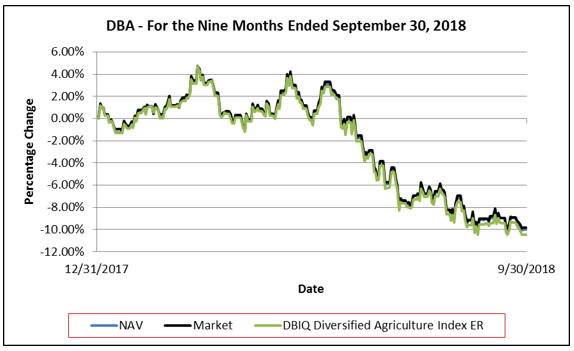
NEITHER THE PAST PERFORMANCE OF THE FUND NOR THE PRIOR INDEX LEVELS AND CHANGES, POSITIVE OR NEGATIVE, SHOULD BE TAKEN AS AN INDICATION OF THE FUND’S FUTURE PERFORMANCE.
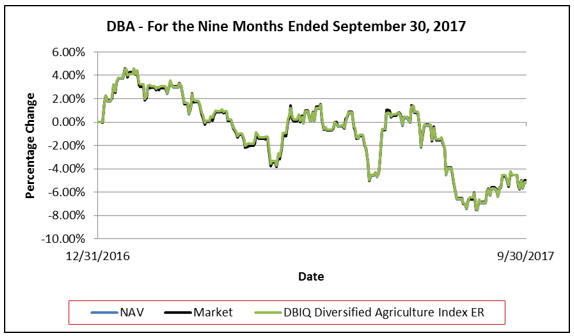
NEITHER THE PAST PERFORMANCE OF THE FUND NOR THE PRIOR INDEX LEVELS AND CHANGES, POSITIVE OR NEGATIVE, SHOULD BE TAKEN AS AN INDICATION OF THE FUND’S FUTURE PERFORMANCE.
Performance Summary
This Report covers the three and nine months ended September 30, 2018 and 2017. Past performance of the Fund is not necessarily indicative of future performance.
The Index is intended to reflect the change in market value of the Index Commodities. In turn, the Index is intended to reflect the agriculture sector. Past Index results are not necessarily indicative of future changes, positive or negative, in the Index closing levels. The DBIQ Diversified Agriculture Index Total Return™ (the “DBIQ Diversified Agriculture TR™”) consists of the Index plus3-month United States Treasury Obligations returns. Past results of the DBIQ Diversified Agriculture TR™ are not necessarily indicative of future changes, positive or negative, in the closing levels of the DBIQ Diversified Agriculture TR™.
26
The section “Summary of the DBIQ Diversified Agriculture TR™ and Underlying Index Commodity Returns for the Three and Nine Months Ended September 30, 2018 and 2017” below provides an overview of the changes in the closing levels of DBIQ Diversified Agriculture TR™ by disclosing the change in market value of each underlying component Index Commodity through a “surrogate” (and analogous) index that also reflects 3 month United States Treasury Obligations returns. Please note also that the Fund’s objective is to track the Index (not DBIQ Diversified Agriculture TR™) and the Fund does not attempt to outperform or underperform the Index. The Index employs the optimum yield roll method in trading certain Index Contracts with the objective of mitigating the negative effects of contango, the condition in which distant delivery prices for futures exceed spot prices, and maximizing the positive effects of backwardation, a condition opposite of contango.
Summary of the DBIQ Diversified Agriculture TR™ and Underlying Index
Commodity Returns for the Three and Nine Months Ended September 30, 2018 and 2017
| AGGREGATE RETURNS FOR INDICES IN THE DBIQ AGRICULTURE TR™ | ||||||||||||||||
| Three Months Ended | Nine Months Ended | |||||||||||||||
| September 30, | September 30, | |||||||||||||||
Underlying Index | 2018 | 2017 | 2018 | 2017 | ||||||||||||
DB Corn Indices | (2.34 | )% | (7.52 | )% | (5.52 | )% | (4.74 | )% | ||||||||
DB Soybean Indices | (3.43 | ) | 1.68 | (12.16 | ) | (1.50 | ) | |||||||||
DB Wheat Indices | (0.90 | ) | (13.70 | ) | 6.10 | (2.54 | ) | |||||||||
DB Kansas City Wheat Indices | 0.33 | (15.31 | ) | 6.92 | (5.04 | ) | ||||||||||
DB Sugar Indices | (14.16 | ) | (2.32 | ) | (30.27 | ) | (27.40 | ) | ||||||||
DB Cocoa Indices | (19.68 | ) | 4.54 | 1.97 | (5.95 | ) | ||||||||||
DB Coffee Indices | (13.15 | ) | (0.38 | ) | (24.30 | ) | (12.90 | ) | ||||||||
DB Cotton Indices | (8.53 | ) | 0.06 | (1.67 | ) | (1.41 | ) | |||||||||
DB Live Cattle Indices | 4.39 | (4.78 | ) | (1.44 | ) | 10.13 | ||||||||||
DB Feeder Cattle Indices | 4.70 | 4.90 | 6.07 | 23.15 | ||||||||||||
DB Lean Hogs Indices | (3.38 | ) | (11.05 | ) | (15.72 | ) | (7.08 | ) | ||||||||
|
|
|
|
|
|
|
| |||||||||
AGGREGATE RETURN | (6.04 | )% | (4.29 | )% | (9.23 | )% | (4.52 | )% | ||||||||
|
|
|
|
|
|
|
| |||||||||
If the Fund’s Treasury Income, Money Market Income andT-Bill ETF Income were to exceed the Fund’s fees and expenses, the aggregate return on an investment in the Fund would be expected to outperform the Index and underperform the DBIQ Diversified Agriculture TR™. The only difference between (i) the Index (the “Excess Return Index”) and (ii) the DBIQ Diversified Agriculture TR™ (the “Total Return Index”) is that the Excess Return Index does not include interest income from fixed income securities while the Total Return Index does include such a component. Thus, the difference between the Excess Return Index and the Total Return Index is attributable entirely to the interest income attributable to the fixed income securities reflected in the Total Return Index. The Total Return Index does not actually hold any fixed income securities. If the Fund’s Treasury Income, Money Market Income andT-Bill ETF Income, if any, exceeds the Fund’s fees and expenses, then the amount of such excess is expected to be distributed periodically. The market price of the Shares is expected to closely track the Index. The aggregate return on an investment in the Fund over any period is the sum of the capital appreciation or depreciation of the Shares over the period, plus the amount of any distributions during the period. Consequently, the Fund’s aggregate return is expected to outperform the Excess Return Index by the amount of the excess, if any, of the Fund’s Treasury Income, Money Market Income andT-Bill ETF Income over its fees and expenses. As a result of the Fund’s fees and expenses, however, the aggregate return on the Fund is expected to underperform the Total Return Index. If the Fund’s fees and expenses were to exceed the Fund’s Treasury Income, Money Market Income andT-Bill ETF Income, if any, the aggregate return on an investment in the Fund is expected to underperform the Excess Return Index.
FOR THE THREE MONTHS ENDED SEPTEMBER 30, 2018 COMPARED TO THE THREE MONTHS ENDED SEPTEMBER 30, 2017
Fund Share Price Performance
For the three months ended September 30, 2018, the NYSE Arca market value of each Share decreased 6.21% from $18.03 per Share to $16.91 per Share. The Share price low and high for the three months ended September 30, 2018 and related change from the Share price on June 30, 2018 was as follows: Shares traded at a low of $16.87 per Share(-6.44%) on August 30, 2018, and a high of $17.92 per Share(-0.61%) on July 6, 2018.
27
For the three months ended September 30, 2017, the NYSE Arca market value of each Share decreased 4.38% from $19.85 per Share to $18.98 per Share. The Share price low and high for the three months ended September 30, 2017 and related change from the Share price on June 30, 2017 was as follows: Shares traded at a low of $18.48 per Share(-6.90%) on August 29, 2017, and a high of $20.26 per Share (+2.07%) on July 19, 2017.
Fund Share Net Asset Performance
For the three months ended September 30, 2018, the NAV of each Share decreased 6.32% from $18.03 per Share to $16.89 per Share. Falling commodity futures contract prices for Corn, Soybeans, Wheat, Sugar, Cocoa, Coffee, Cotton and Lean Hogs were offset by rising commodity futures contract prices of Kansas City Wheat, Live Cattle and Feeder Cattle during the three months ended September 30, 2018, contributing to an overall 6.52% decrease in the level of the Index and to a 6.04% decrease in the level of the DBIQ Diversified Agriculture Index TR™.
Net income (loss) for the three months ended September 30, 2018 was $(42.1) million, primarily resulting from $3.6 million of income, net realized gain (loss) of $(55.8) million, net change in unrealized gain (loss) of $11.6 million and operating expenses of $1.5 million.
For the three months ended September 30, 2017, the NAV of each Share decreased 4.54% from $19.84 per Share to $18.94 per Share. Falling commodity futures contract prices for Corn, Wheat, Kansas City Wheat, Sugar, Coffee, Live Cattle and Lean Hogs were partially offset by rising commodity futures contract prices of Soybeans, Cocoa, Cotton and Feeder Cattle during the three months ended September 30, 2017, contributing to an overall 4.54% decrease in the level of the Index and to a 4.29% decrease in the level of the DBIQ Diversified Agriculture Index TR™.
Net income (loss) for the three months ended September 30, 2017 was $(33.5) million, primarily resulting from $1.6 million of income, net realized gain (loss) of $(38.4) million, net change in unrealized gain (loss) of $5.0 million and operating expenses of $1.7 million.
FOR THE NINE MONTHS ENDED SEPTEMBER 30, 2018 COMPARED TO THE NINE MONTHS ENDED SEPTEMBER 30, 2017
Fund Share Price Performance
For the nine months ended September 30, 2018, the NYSE Arca market value of each Share decreased 9.81% from $18.75 per Share to $16.91 per Share. The Share price low and high for the nine months ended September 30, 2018 and related change from the Share price on December 31, 2017 was as follows: Shares traded at a low of $16.87 per Share(-10.03%) on August 30, 2018, and a high of $19.63 per Share (+4.69%) on March 5, 2018.
For the nine months ended September 30, 2017, the NYSE Arca market value of each Share decreased 5.01% from $19.98 per Share to $18.98 per Share. The Share price low and high for the nine months ended September 30, 2017 and related change from the Share price on December 31, 2016 was as follows: Shares traded at a low of $18.48 per Share(-7.51%) on August 29, 2017, and a high of $20.90 per Share (+4.61%) on January 17, 2017.
Fund Share Net Asset Performance
For the nine months ended September 30, 2018, the NAV of each Share decreased 9.97% from $18.76 per Share to $16.89 per Share. Falling commodity futures contract prices for Corn, Soybeans, Sugar, Coffee, Cotton, Live Cattle and Lean Hogs were offset by rising commodity futures contract prices of Wheat, Kansas City Wheat, Cocoa, and Feeder Cattle during the nine months ended September 30, 2018, contributing to an overall 10.46% decrease in the level of the Index and to a 9.23% decrease in the level of the DBIQ Diversified Agriculture Index TR™.
Net income (loss) for the nine months ended September 30, 2018 was $(72.7) million, primarily resulting from $8.5 million of income, net realized gain (loss) of $(76.4) million, net change in unrealized gain (loss) of $(0.1) million and operating expenses of $4.7 million.
For the nine months ended September 30, 2017, the NAV of each Share decreased 5.21% from $19.98 per Share to $18.94 per Share. Falling commodity futures contract prices for Corn, Soybeans, Wheat, Kansas City Wheat, Sugar, Cocoa, Coffee, Cotton and Lean Hogs were offset by rising commodity futures contract prices of Live Cattle and Feeder Cattle during the nine months ended September 30, 2017, contributing to an overall 5.13% decrease in the level of the Index and to a 4.52% decrease in the level of the DBIQ Diversified Agriculture Index TR™.
Net income (loss) for the nine months ended September 30, 2017 was $(41.0) million, primarily resulting from $3.7 million of income, net realized gain (loss) of $(49.5) million, net change in unrealized gain (loss) of $9.9 million and operating expenses of $5.1 million.
28
Critical Accounting Policies
The financial statements and accompanying notes are prepared in accordance with U.S. GAAP. The preparation of these financial statements relies on estimates and assumptions that impact the Fund’s financial position and results of operations. These estimates and assumptions affect the Fund’s application of accounting policies. In addition, please refer to Note 2 to the financial statements of the Fund for further discussion of the Fund’s accounting policies and Item 7 – Management’s Discussions and Analysis of Financial Condition and Results of Operations – Critical Accounting Policies on Form10-K for the year ended December 31, 2017.
Off-Balance Sheet Arrangements and Contractual Obligations
In the normal course of its business, the Fund is a party to financial instruments withoff-balance sheet risk. The term“off-balance sheet risk” refers to an unrecorded potential liability that, even though it does not appear on the balance sheet, may result in a future obligation or loss. The financial instruments used by the Fund are commodity futures, the values of which are based upon an underlying asset and generally represent future commitments which have a reasonable possibility to be settled in cash or through physical delivery. The financial instruments are traded on an exchange and are standardized contracts.
The Fund has not utilized, nor does it expect to utilize in the future, special purpose entities to facilitateoff-balance sheet financing arrangements and has no loan guarantee arrangements oroff-balance sheet arrangements of any kind, other than agreements entered into in the normal course of business noted above, which may include indemnification provisions related to certain risks service providers undertake in providing services to the Fund. While the Fund’s exposure under such indemnification provisions cannot be estimated, these general business indemnifications are not expected to have a material impact on the Fund’s financial position. The Managing Owner expects the risk of loss relating to indemnification to be remote.
The Fund’s contractual obligations are with the Managing Owner and the Commodity Broker. Management Fee payments made to the Managing Owner are calculated as a fixed percentage of the Fund’s NAV. Commission payments to the Commodity Broker are on acontract-by-contract, or round-turn, basis. As such, the Managing Owner cannot anticipate the amount of payments that will be required under these arrangements for future periods as NAVs and trading activity will not be known until a future date. These agreements are effective forone-year terms, renewable automatically for additionalone-year terms unless terminated. Additionally, these agreements may be terminated by either party for various reasons. All Management Fees and commission payments are paid to the Managing Owner and the Commodity Broker, respectively.
| ITEM 3. | QUANTITATIVE AND QUALITATIVE DISCLOSURES ABOUT MARKET RISK. |
INTRODUCTION
The Fund is designed to track the performance of the Index. The market sensitive instruments held by it are subject to the risk of trading loss. Unlike an operating company, the risk of market sensitive instruments is integral, not incidental, to the Fund’s main line of business.
Market movements can produce frequent changes in the fair market value of the Fund’s open positions and, consequently, in its earnings and cash flow. The Fund’s market risk is primarily influenced by changes in the prices of commodities.
QUANTIFYING THE FUND’S TRADING VALUE AT RISK
Quantitative Forward-Looking Statements
The following quantitative disclosures regarding the Fund’s market risk exposures contain “forward-looking statements” within the meaning of the safe harbor from civil liability provided for such statements by the Private Securities Litigation Reform Act of 1995 (set forth in Section 27A of the Securities Act and Section 21E of the Exchange Act). All quantitative disclosures in this section are deemed to be forward-looking statements for purposes of the safe harbor, except for statements of historical fact (such as the dollar amount of maintenance margin required for market risk sensitive instruments held at the end of the reporting period).
Value at Risk (“VaR”) is a statistical measure of the value of losses that would not be expected to be exceeded over a given time horizon and at a given probability level arising from movement of underlying risk factors. Loss is measured as a decline in the fair value of the portfolio as a result of changes in any of the material variables by which fair values are determined. VaR is measured over a specified holding period (one day) and to a specified level of statistical confidence (99th percentile). However, the inherent uncertainty in the markets in which the Fund trades and the recurrence in the markets traded by the Fund of market movements far exceeding expectations could result in actual trading ornon-trading losses far beyond the indicated VaR or the Fund’s experience to date (i.e., “risk of ruin”). In light of these considerations, as well as the risks and uncertainties intrinsic to all future projections, the following VaR presentation does not constitute any assurance or representation that the Fund’s losses in any market sector will be limited to VaR.
29
THE FUND’S TRADING VALUE AT RISK
The Fund calculates VaR using the actual historical market movements of the Fund’s net assets.
The following table indicates the trading VaR associated with the Fund’s net assets as of September 30, 2018.
Description | Net Assets | Daily Volatility | VaR* (99 Percentile) | For the Nine Months Ended September 30, 2018 Number of times VaR Exceeded | ||||||||||||
Invesco DB Agriculture Fund | $ | 543,764,412 | 0.55 | % | $ | 7,030,038 | 15 | |||||||||
The following table indicates the trading VaR associated with the Fund’s net assets as of December 31, 2017.
Description | Net Assets | Daily Volatility | VaR* (99 Percentile) | For the Year Ended December 31, 2017 Number of times VaR Exceeded | ||||||||||||
Invesco DB Agriculture Fund | $ | 641,751,747 | 0.53 | % | $ | 7,924,599 | 18 | |||||||||
| * | The VaR represents the one day downside risk, under normal market conditions, with a 99% confidence level. It is calculated using historical market moves of the Fund’s net assets and uses a one year look-back. |
THE FUND’SNON-TRADING MARKET RISK
The Fund hasnon-trading market risk as a result of investing in short-term United States Treasury Obligations,T-Bill ETFs and money market mutual funds. The market risk represented by these investments is not expected to be material. Although the Fund purchases and sells shares ofT-Bill ETFs on an exchange, it does not establish or liquidate those positions for trading purposes.
QUALITATIVE DISCLOSURES REGARDING PRIMARY TRADING RISK EXPOSURES
The following qualitative disclosures regarding the Fund’s market risk exposures—except for those disclosures that are statements of historical fact—constitute forward-looking statements within the meaning of Section 27A of the Securities Act and Section 21E of the Exchange Act. The Fund’s primary market risk exposures are subject to numerous uncertainties, contingencies and risks. Government interventions, defaults and expropriations, illiquid markets, the emergence of dominant fundamental factors, political upheavals, changes in historical price relationships, an influx of new market participants, increased regulation and many other factors could result in material losses as well as in material changes to the risk exposures of the Fund. The Fund’s current market exposure may change materially. Investors may lose all or substantially all of their investment in the Fund.
The following were the primary trading risk exposures of the Fund as of September 30, 2018 by Index Commodity:
Corn
The price of corn is volatile. The price movement of corn may be influenced by three primary supply factors: farmer planting decisions, climate, and government agricultural policies and three major market demand factors: livestock feeding, shortages or surpluses of world grain supplies, and domestic and foreign government policies and trade agreements. Additionally, the price movement of corn may be influenced by a variety of other factors, including weather conditions, disease, transportation costs, political uncertainties and economic concerns.
Wheat and Kansas City Wheat
The price of wheat is volatile. The price movement of wheat may be influenced by three primary supply factors: farmer planting decisions, climate, and government agricultural policies and three major market demand factors: food, shortages or surpluses of world grain supplies, and domestic and foreign government policies and trade agreements. Additionally, the price movement of wheat may be influenced by a variety of other factors, including weather conditions, disease, transportation costs, political uncertainties and economic concerns.
Soybeans
The price of soybeans is volatile. The price movement of soybeans may be influenced by a variety of factors, including demand, weather conditions, disease, crop production, transportation costs, political uncertainties and economic concerns.
Sugar
The price of sugar is volatile. The price movement of sugar may be influenced by a variety of factors, including demand, weather conditions, disease, crop production, transportation costs, political uncertainties and economic concerns.
30
Cocoa
The price of cocoa is volatile. The price movement of cocoa may be influenced by a variety of factors, including demand, weather conditions, disease, crop production, transportation costs, political uncertainties and economic concerns.
Coffee
The price of coffee is volatile. The price movement of coffee may be influenced by a variety of factors, including demand, weather conditions, disease, crop production, transportation costs, political uncertainties and economic concerns.
Cotton
The price of cotton is volatile. The price movement of cotton may be influenced by a variety of factors, including demand, weather conditions, disease, crop production, transportation costs, political uncertainties and economic concerns.
Live Cattle
The price of live cattle is volatile. The price movement of live cattle may be influenced by a variety of factors, including demand, weather conditions, disease, agricultural feed prices (i.e. corn, milo, wheat, soybeans, hay and alfalfa), live cattle production, transportation costs, political uncertainties and economic concerns.
Feeder Cattle
The price of feeder cattle is volatile. The price movement of feeder cattle may be influenced by a variety of factors, including demand, weather conditions, disease, agricultural feed prices (i.e. corn, milo, wheat, soybeans, hay and alfalfa), feeder cattle production, transportation costs, political uncertainties and economic concerns.
Lean Hogs
The price of lean hogs is volatile. The price movement of lean hogs may be influenced by a variety of factors, including demand, weather conditions, disease, agricultural feed prices (i.e. corn), hog production, crop production, transportation costs, political uncertainties and economic concerns.
QUALITATIVE DISCLOSURES REGARDINGNON-TRADING MARKET RISK EXPOSURE
As noted above, the Fund hasnon-trading market risk as a result of investing in short-term United States Treasury Obligations,T-Bill ETFs and money market mutual funds. The market risk represented by these investments is not expected to be material.
QUALITATIVE DISCLOSURES REGARDING MEANS OF MANAGING RISK EXPOSURE
Under ordinary circumstances, the Managing Owner’s exercise of discretionary power is limited to determining whether the Fund will make a distribution. Under emergency or extraordinary circumstances, the Managing Owner’s use of its discretionary powers may increase. These special circumstances, for example, include the unavailability of the Index or certain natural orman-made disasters. The Managing Owner does not actively manage the Fund to avoid losses. The Fund only takes long positions in investments and does not employ “stop-loss” techniques.
| ITEM 4. | CONTROLS AND PROCEDURES. |
For purposes of this Item 4, all references to the “Fund” shall be read to specifically include the Fund and the Trust. Please note that the disclosure controls and procedures and internal control over financial reporting of the Trust are the aggregate disclosure controls and procedures and internal control over financial reporting of the Fund and that of Invesco DB Base Metals Fund, Invesco DB Energy Fund, Invesco DB Gold Fund, Invesco DB Oil Fund, Invesco DB Precious Metals Fund and Invesco DB Silver Fund, each a series of the Trust.
Evaluation of Disclosure Controls and Procedures
Under the supervision and with the participation of the management of the Managing Owner, including Daniel Draper, its Principal Executive Officer, and Kelli Gallegos, its Principal Financial and Accounting Officer, Investment Pools, the Fund carried out an evaluation of the effectiveness of the design and operation of its disclosure controls and procedures (as defined in Rule13a-15(e) or15d-15(e) of the Securities Exchange Act of 1934, as amended (the “Exchange Act”)) as of the end of the period covered by this Quarterly Report, and, based upon that evaluation, Daniel Draper, the Principal Executive Officer of the Managing Owner, and Kelli Gallegos, the Principal Financial and Accounting Officer, Investment Pools, of the Managing Owner, concluded that the Fund’s disclosure controls and procedures were effective to ensure that information the Fund is required to disclose in the reports that it files or submits with the Securities and Exchange Commission (the “SEC”) under the Exchange Act is recorded, processed, summarized and reported, within the time periods specified in the SEC’s rules and forms, and to ensure that information required to be disclosed by the Fund in the reports that it files or submits under the Exchange Act is accumulated and communicated to management of the Managing Owner, including its Principal Executive Officer and Principal Financial Officer, as appropriate to allow timely decisions regarding required disclosure.
31
Changes in Internal Control Over Financial Reporting
There has been no change in internal control over financial reporting (as defined in the Rules13a-15(f) and15d-15(f) of the Exchange Act) that occurred during the Fund’s quarter ended September 30, 2018 that has materially affected, or is reasonably likely to materially affect, the Fund’s internal control over financial reporting.
32
| Item 1. | Legal Proceedings. |
Not applicable.
| Item 1A. | Risk Factors. |
Current Discussions between the SEC and PricewaterhouseCoopers LLP regarding PricewaterhouseCoopers LLP’s Independence Could Have Potentially Adverse Consequences for the Fund.
PricewaterhouseCoopers LLP informed the Fund that it has identified an issue related to its independence underRule 2-01(c)(1)(ii)(A) of RegulationS-X (referred to as the Loan Rule). The Loan Rule prohibits accounting firms, such as PricewaterhouseCoopers LLP, from being deemed independent if they have certain financial relationships with their audit clients or certain affiliates of those clients. The Fund is required under various securities laws to have its financial statements audited by an independent accounting firm.
The Loan Rule specifically provides that an accounting firm would not be independent if it or certain affiliates and covered persons receive a loan from a lender that is a record or beneficial owner of more than ten percent of an audit client’s equity securities (referred to as a “more than ten percent owner”). For purposes of the Loan Rule, audit clients include the Fund as well as all registered investment companies advised by the Managing Owner and its affiliates, including other subsidiaries of the Managing Owner’s parent company, Invesco Ltd. (collectively, the “Invesco Fund Complex”). PricewaterhouseCoopers LLP informed the Fund it and certain affiliates and covered persons have relationships with lenders who hold, as record owner, more than ten percent of the shares of certain funds within the Invesco Fund Complex, which may implicate the Loan Rule.
On June 20, 2016, the SEC Staff issued a“no-action” letter to another mutual fund complex (see Fidelity Management & Research Company et al.,No-Action Letter) related to the audit independence issue described above. In that letter, the SEC confirmed that it would not recommend enforcement action against a fund that relied on audit services performed by an audit firm that was not in compliance with the Loan Rule in certain specified circumstances. On May 2, 2018, the SEC proposed amendments to the Loan Rule that, if adopted as proposed, would address many of the issues that led to issuance of theno-action letter. In connection with prior independence determinations, PricewaterhouseCoopers LLP communicated, as contemplated by theno-action letter, that it believes that it remains objective and impartial and that a reasonable investor possessing all the facts would conclude that PricewaterhouseCoopers LLP is able to exhibit the requisite objectivity and impartiality to report on the Fund’s financial statements as the independent registered public accounting firm. PricewaterhouseCoopers LLP also represented that it has complied with PCAOB Rule 3526(b)(1) and (2), which are conditions to the Funds relying on the no action letter, and affirmed that it is an independent accountant within the meaning of PCAOB Rule 3520. Therefore, the Managing Owner, the Fund and PricewaterhouseCoopers LLP concluded that PricewaterhouseCoopers LLP could continue as the Fund’s independent registered public accounting firm. The Invesco Fund Complex relied upon theno-action letter in reaching this conclusion.
If in the future the independence of PricewaterhouseCoopers LLP is called into question under the Loan Rule by circumstances that are not addressed in the SEC’sno-action letter, the Fund will need to take other action in order for the Fund’s filings with the SEC containing financial statements to be deemed compliant with applicable securities laws. Such additional actions could result in additional costs, impair the ability of the Fund to issue new shares or have other material adverse effects on the Fund. The SECno-action relief was initially set to expire eighteen (18) months from issuance but has been extended by the SEC without an expiration date, except that theno-action letter will be withdrawn upon the effectiveness of any amendments to the Loan Rule designed to address the concerns expressed in the letter.
| Item 2. | Unregistered Sales of Equity Securities and Use of Proceeds. |
(a) There have been no unregistered sales of Shares. No Shares are authorized for issuance by the Fund under equity compensation plans.
(b) Not applicable.
(c) The following table summarizes the redemptions by Authorized Participants during the three months ended September 30, 2018:
Period of Redemption | Total Number of Shares Redeemed | Average Price Paid per Share | ||||||
July 1, 2018 to July 31, 2018 | 3,200,000 | $ | 17.41 | |||||
August 1, 2018 to August 31, 2018 | 1,000,000 | $ | 17.27 | |||||
September 1, 2018 to September 30, 2018 | 2,400,000 | $ | 17.03 | |||||
|
|
|
| |||||
Total | 6,600,000 | $ | 17.25 | |||||
|
|
|
| |||||
| Item 3. | Defaults Upon Senior Securities. |
None.
33
| Item 4. | Mine Safety Disclosures. |
Not applicable.
| Item 5. | Other Information. |
None.
| Item 6. | Exhibits. |
| 31.1 | Certification required under Exchange Act Rules13a-14 and15d-14 (filed herewith) | |
| 31.2 | Certification required under Exchange Act Rules13a-14 and15d-14 (filed herewith) | |
| 32.1 | Certification of Chief Executive Officer pursuant to 18 U.S.C. Section 1350 as adopted pursuant to Section 906 of the Sarbanes-Oxley Act of 2002 (furnished herewith) | |
| 32.2 | Certification of Chief Financial Officer pursuant to 18 U.S.C. Section 1350 as adopted pursuant to Section 906 of the Sarbanes-Oxley Act of 2002 (furnished herewith) | |
| 101 | Interactive data file pursuant to Rule 405 of RegulationS-T: (i) the Statements of Financial Condition of Invesco DB Agriculture Fund—September 30, 2018 and December 31, 2017 (Unaudited), (ii) the Schedule of Investments of Invesco DB Agriculture Fund—September 30, 2018 (Unaudited), (iii) the Schedule of Investments of Invesco DB Agriculture Fund—December 31, 2017 (Unaudited), (iv) the Statements of Income and Expenses of Invesco DB Agriculture Fund—For the Three and Nine Months Ended September 30, 2018 and 2017 (Unaudited), (v) the Statement of Changes in Shareholders’ Equity of Invesco DB Agriculture Fund—For the Three Months Ended September 30, 2018 (Unaudited), (vi) the Statement of Changes in Shareholders’ Equity of Invesco DB Agriculture Fund—For the Three Months Ended September 30, 2017 (Unaudited), (vii) the Statement of Changes in Shareholders’ Equity of Invesco DB Agriculture Fund—For the Nine Months Ended September 30, 2018 (Unaudited), (viii) the Statement of Changes in Shareholders’ Equity of Invesco DB Agriculture Fund—For the Nine Months Ended September 30, 2017 (Unaudited), (ix) the Statements of Cash Flows of Invesco DB Agriculture Fund—For the Nine Months Ended September 30, 2018 and 2017 (Unaudited), and (x) Notes to Unaudited Financial Statements of Invesco DB Agriculture Fund—September 30, 2018. | |
34
Pursuant to the requirements of the Securities Exchange Act of 1934, the Registrant has duly caused this report to be signed on its behalf by the undersigned, thereunto duly authorized.
| Invesco DB Multi-Sector Commodity Trust on its own behalf and with respect to Invesco DB Agriculture Fund | ||||||||
| By: | Invesco Capital Management LLC, its Managing Owner | |||||||
| By: | /s/ DANIEL DRAPER | |||||||
| Name: | Daniel Draper | |||||||
| Title: | Principal Executive Officer | |||||||
| Dated: November 6, 2018 | By: | /s/ KELLI GALLEGOS | ||||||
| Name: | Kelli Gallegos | |||||||
| Title: | Principal Financial and Accounting Officer, Investment Pools | |||||||
35
Exhibit 31.1
CERTIFICATION
I, Daniel Draper, certify that:
| 1. | I have reviewed this Quarterly Report on Form10-Q of Invesco DB Agriculture Fund, a series of Invesco DB Multi-Sector Commodity Trust; |
| 2. | Based on my knowledge, this report does not contain any untrue statement of a material fact or omit to state a material fact necessary to make the statements made, in light of the circumstances under which such statements were made, not misleading with respect to the period covered by this report; |
| 3. | Based on my knowledge, the financial statements, and other financial information included in this report, fairly present in all material respects the financial condition, results of operations and cash flows of the registrant as of, and for, the periods presented in this report; |
| 4. | The registrant’s other certifying officer and I are responsible for establishing and maintaining disclosure controls and procedures (as defined in Exchange Act Rules13a-15(e) and15d-15(e)) and internal control over financial reporting (as defined in Exchange Act Rules13a-15(f) and15d-15(f)) for the registrant and have: |
| (a) | Designed such disclosure controls and procedures, or caused such disclosure controls and procedures to be designed under our supervision, to ensure that material information relating to the registrant, including its consolidated subsidiaries, is made known to us by others within those entities, particularly during the period in which this report is being prepared; |
| (b) | Designed such internal control over financial reporting, or caused such internal control over financial reporting to be designed under our supervision, to provide reasonable assurance regarding the reliability of financial reporting and the preparation of financial statements for external purposes in accordance with generally accepted accounting principles; |
| (c) | Evaluated the effectiveness of the registrant’s disclosure controls and procedures and presented in this report our conclusions about the effectiveness of the disclosure controls and procedures, as of the end of the period covered by this report based on such evaluation; and |
| (d) | Disclosed in this report any change in the registrant’s internal control over financial reporting that occurred during the registrant’s most recent fiscal quarter (the registrant’s fourth fiscal quarter in the case of an annual report) that has materially affected, or is reasonably likely to materially affect, the registrant’s internal control over financial reporting; and |
| 5. | The registrant’s other certifying officer and I have disclosed, based on our most recent evaluation of internal control over financial reporting, to the registrant’s auditors and the audit committee of the registrant’s board of directors (or persons performing the equivalent functions): |
| (a) | All significant deficiencies and material weaknesses in the design or operation of internal control over financial reporting which are reasonably likely to adversely affect the registrant’s ability to record, process, summarize and report financial information; and |
| (b) | Any fraud, whether or not material, that involves management or other employees who have a significant role in the registrant’s internal control over financial reporting. |
| Dated: November 6, 2018 | /s/ Daniel Draper | |||
| Daniel Draper | ||||
| Principal Executive Officer |
Exhibit 31.2
CERTIFICATION
I, Kelli Gallegos, certify that:
| 1. | I have reviewed this Quarterly Report on Form10-Q of Invesco DB Agriculture Fund, a series of Invesco DB Multi-Sector Commodity Trust; |
| 2. | Based on my knowledge, this report does not contain any untrue statement of a material fact or omit to state a material fact necessary to make the statements made, in light of the circumstances under which such statements were made, not misleading with respect to the period covered by this report; |
| 3. | Based on my knowledge, the financial statements, and other financial information included in this report, fairly present in all material respects the financial condition, results of operations and cash flows of the registrant as of, and for, the periods presented in this report; |
| 4. | The registrant’s other certifying officer and I are responsible for establishing and maintaining disclosure controls and procedures (as defined in Exchange Act Rules13a-15(e) and15d-15(e)) and internal control over financial reporting (as defined in Exchange Act Rules13a-15(f) and15d-15(f)) for the registrant and have: |
| (a) | Designed such disclosure controls and procedures, or caused such disclosure controls and procedures to be designed under our supervision, to ensure that material information relating to the registrant, including its consolidated subsidiaries, is made known to us by others within those entities, particularly during the period in which this report is being prepared; |
| (b) | Designed such internal control over financial reporting, or caused such internal control over financial reporting to be designed under our supervision, to provide reasonable assurance regarding the reliability of financial reporting and the preparation of financial statements for external purposes in accordance with generally accepted accounting principles; |
| (c) | Evaluated the effectiveness of the registrant’s disclosure controls and procedures and presented in this report our conclusions about the effectiveness of the disclosure controls and procedures, as of the end of the period covered by this report based on such evaluation; and |
| (d) | Disclosed in this report any change in the registrant’s internal control over financial reporting that occurred during the registrant’s most recent fiscal quarter (the registrant’s fourth fiscal quarter in the case of an annual report) that has materially affected, or is reasonably likely to materially affect, the registrant’s internal control over financial reporting; and |
| 5. | The registrant’s other certifying officer and I have disclosed, based on our most recent evaluation of internal control over financial reporting, to the registrant’s auditors and the audit committee of the registrant’s board of directors (or persons performing the equivalent functions): |
| (a) | All significant deficiencies and material weaknesses in the design or operation of internal control over financial reporting which are reasonably likely to adversely affect the registrant’s ability to record, process, summarize and report financial information; and |
| (b) | Any fraud, whether or not material, that involves management or other employees who have a significant role in the registrant’s internal control over financial reporting. |
| Dated: November 6, 2018 | /s/ Kelli Gallegos | |||
| Kelli Gallegos | ||||
| Principal Financial and Accounting Officer, Investment Pools |
Exhibit 32.1
CERTIFICATION PURSUANT TO
18 U.S.C. SECTION 1350
AS ADOPTED PURSUANT TO
SECTION 906 OF THE SARBANES-OXLEY ACT OF 2002
The undersigned, Daniel Draper, Principal Executive Officer of Invesco Capital Management LLC, the Managing Owner of Invesco DB Agriculture Fund (the “Fund”), a series of Invesco DB Multi-Sector Commodity Trust, hereby certifies pursuant to 18 U.S.C. Section 1350, as adopted pursuant to Section 906 of the Sarbanes-Oxley Act of 2002, that:
| (1) | The Fund’s Quarterly Report on Form10-Q for the period ended September 30, 2018, as filed with the Securities and Exchange Commission on the date hereof (the “Quarterly Report”), fully complies with the requirements of Section 13(a) or 15(d) of the Securities Exchange Act of 1934, as amended; |
| (2) | The information contained in the Quarterly Report fairly presents, in all material respects, the financial condition and results of operations of the Fund; |
| (3) | This certification accompanies the report to which it relates, is not deemed filed with the Securities and Exchange Commission and is not to be incorporated by reference into any filing of the Company under the Securities Act of 1933, as amended, or the Securities Exchange Act of 1934, as amended (whether made before or after the date of such report), irrespective of any general incorporation language contained in such filing. |
| Dated: November 6, 2018 | /s/ Daniel Draper | |||
| Daniel Draper | ||||
| Principal Executive Officer |
Exhibit 32.2
CERTIFICATION PURSUANT TO
18 U.S.C. SECTION 1350
AS ADOPTED PURSUANT TO
SECTION 906 OF THE SARBANES-OXLEY ACT OF 2002
The undersigned, Kelli Gallegos, Principal Financial and Accounting Officer, Investment Pools of Invesco Capital Management LLC, the Managing Owner of Invesco DB Agriculture Fund (the “Fund”), a series of Invesco DB Multi-Sector Commodity Trust, hereby certifies pursuant to 18 U.S.C. Section 1350, as adopted pursuant to Section 906 of the Sarbanes-Oxley Act of 2002, that:
| (1) | The Fund’s Quarterly Report on Form10-Q for the period ended September 30, 2018, as filed with the Securities and Exchange Commission on the date hereof (the “Quarterly Report”), fully complies with the requirements of Section 13(a) or 15(d) of the Securities Exchange Act of 1934, as amended; |
| (2) | The information contained in the Quarterly Report fairly presents, in all material respects, the financial condition and results of operations of the Fund; |
| (3) | This certification accompanies the report to which it relates, is not deemed filed with the Securities and Exchange Commission and is not to be incorporated by reference into any filing of the Company under the Securities Act of 1933, as amended, or the Securities Exchange Act of 1934, as amended (whether made before or after the date of such report), irrespective of any general incorporation language contained in such filing. |
| Dated: November 6, 2018 | /s/ Kelli Gallegos | |||
| Kelli Gallegos | ||||
| Principal Financial and Accounting Officer, Investment Pools |