PowerShares DB Multi-Sector Commodity Trust
Filed: 5 Mar 19, 10:28am
Filed Pursuant to Rule 424(b)(3)
Registration Statement Nos.333-228404
333-228404-01
333-228404-02
333-228404-03
333-228404-04
333-228404-05
PROSPECTUS SUPPLEMENT NO. 1
(to Prospectus dated December 13, 2018)
INVESCO DB MULTI-SECTOR COMMODITY TRUST
INVESCO DB ENERGY FUND
21,400,000 Common Units of Beneficial Interest
INVESCO DB OIL FUND
79,000,000 Common Units of Beneficial Interest
INVESCO DB PRECIOUS METALS FUND
21,600,000 Common Units of Beneficial Interest
INVESCO DB GOLD FUND
14,200,000 Common Units of Beneficial Interest
INVESCO DB BASE METALS FUND
24,800,000 Common Units of Beneficial Interest
This Prospectus Supplement No. 1 (“Supplement No. 1”) supplements and amends our Prospectus dated December 13, 2018 (the “Prospectus”). Supplement No. 1 is being filed to include the information contained in our Annual Report on Form10-K, for the year ended December 31, 2018, filed with the Securities and Exchange Commission on February 28, 2019 (the “Form10-K”). Accordingly, we have attached the Form10-K to this Supplement No. 1. Supplement No. 1 should be read together with the Prospectus.
Shares of the Invesco DB Energy Fund, Invesco DB Oil Fund, Invesco DB Precious Metals Fund, Invesco DB Gold Fund and Invesco DB Base Metals Fund (together, the “Funds”) are listed on NYSE Arca, Inc. under the symbols “DBE,” “DBO,” “DBP,” “DGL” and “DBB,” respectively.
Investing in the Shares involves significant risks. See“RISK FACTORS” starting on page 15 of the Prospectus.
These securities have not been approved or disapproved by the Securities and Exchange Commission or any state securities commission nor has the Securities and Exchange Commission passed upon the adequacy or accuracy of the Prospectus or this Prospectus Supplement No. 1. Any representation to the contrary is a criminal offense.
The Funds are not mutual funds or any other type of investment company within the meaning of the Investment Company Act of 1940, as amended, and are not subject to regulation thereunder.
THE COMMODITY FUTURES TRADING COMMISSION HAS NOT PASSED UPON THE MERITS OF PARTICIPATING IN THESE POOLS NOR HAS THE COMMISSION PASSED ON THE ADEQUACY OR ACCURACY OF THIS DISCLOSURE DOCUMENT.
The date of this Prospectus Supplement No. 1 is March 5, 2019.
PLEASE RETAIN THIS SUPPLEMENT FOR FUTURE REFERENCE
P-DBMSC-PRO-1-SUP-1
UNITED STATES
SECURITIES AND EXCHANGE COMMISSION
WASHINGTON, D.C. 20549
FORM10-K
| ☒ | ANNUAL REPORT PURSUANT TO SECTION 13 OR 15(d) OF THE SECURITIES EXCHANGE ACT OF 1934 |
For the fiscal year ended December 31, 2018
OR
| ☐ | TRANSITION REPORT PURSUANT TO SECTION 13 OR 15(d) OF THE SECURITIES EXCHANGE ACT OF 1934 |
For the transition period from to
Commission File Number:001-33240
INVESCO DB ENERGY FUND
(A Series of Invesco DB Multi-Sector Commodity Trust)
(Exact name of Registrant as specified in its charter)
| Delaware | 87-0778060 | |
(State or Other Jurisdiction of Incorporation or Organization) | (I.R.S. Employer Identification No.) | |
c/o Invesco Capital Management LLC 3500 Lacey Road, Suite 700 Downers Grove, Illinois | 60515 | |
| (Address of Principal Executive Offices) | (Zip Code) | |
Registrant’s telephone number, including area code:(800) 983-0903
Securities registered pursuant to Section 12(b) of the Act:
Title of Each Class | Name of Each Exchange on Which Registered | |
| Common Units of Beneficial Interest | NYSE Arca, Inc. |
Securities registered pursuant to Section 12(g) of the Act: None
Indicate by check mark if the Registrant is a well-known seasoned issuer, as defined in Rule 405 of the Securities Act. Yes ☐ No ☒
Indicate by check mark if the Registrant is not required to file reports pursuant to Section 13 or Section 15(d) of the Act. Yes ☐ No ☒
Indicate by check mark whether the Registrant: (1) has filed all reports required to be filed by Section 13 or 15(d) of the Securities Exchange Act of 1934 during the preceding 12 months (or for such shorter period that the Registrant was required to file such reports), and (2) has been subject to such filing requirements for the past 90 days. Yes ☒ No ☐
Indicate by check mark whether the Registrant has submitted electronically every Interactive Data File required to be submitted pursuant to Rule 405 of RegulationS-T (§232.405 of this chapter) during the preceding 12 months (or for such shorter period that the Registrant was required to submit such files). Yes ☒ No ☐
Indicate by check mark if disclosure of delinquent filers pursuant to Item 405 of RegulationS-K (§229.405 of this chapter) is not contained herein, and will not be contained, to the best of Registrant’s knowledge, in definitive proxy or information statements incorporated by reference in Part III of this Form10-K or any amendment to this Form10-K. ☒
Indicate by check mark whether the Registrant is a large accelerated filer, an accelerated filer, anon-accelerated filer, a smaller reporting company, or an emerging growth company. See the definitions of “large accelerated filer,” “accelerated filer,” “smaller reporting company,” and “emerging growth company” in Rule12b-2 of the Exchange Act.
| Large Accelerated Filer | ☐ | Accelerated Filer | ☒ | |||
| Non-Accelerated Filer | ☐ | Smaller reporting company | ☐ | |||
| Emerging growth company | ☐ | |||||
If an emerging growth company, indicate by check mark if the registrant has elected not to use the extended transition period for complying with any new or revised financial accounting standards provided pursuant to Section 13(a) of the Exchange Act. ☐
Indicate by check mark whether the Registrant is a shell company (as defined in Rule12b-2 of the Exchange Act). Yes ☐ No ☒
State the market value of the voting andnon-voting common equity held bynon-affiliates computed by reference to the price at which the common equity was last sold, or the average bid and asked price of such common equity, as of the last business day of the Registrant’s most recently completed second fiscal quarter: $225,324,000
Number of Common Units of Beneficial Interest outstanding as of January 31, 2019: 7,000,000
TABLE OF CONTENTS
i
CAUTIONARY STATEMENT CONCERNING FORWARD-LOOKING INFORMATION
This Report includes forward-looking statements within the meaning of Section 27A of the Securities Act of 1933, as amended (the “Securities Act”), and Section 21E of the Securities Exchange Act of 1934, as amended (the “Exchange Act”), that involve substantial risks and uncertainties. The matters discussed throughout this Report that are not historical facts are forward-looking statements. These forward-looking statements are based on the Fund’s and Invesco Capital Management LLC’s (the “Managing Owner”) current expectations, estimates and projections about the future results, performance, prospects and opportunities of the Fund and the Fund’s business and industry and their beliefs and assumptions about future events and speak only as of the date on which they are made. Words such as “anticipate,” “expect,” “intend,” “plan,” “believe,” “seek,” “outlook” and “estimate,” as well as similar words and phrases, signify forward-looking statements. Forward-looking statements are not guarantees of future results. Conditions and important factors, risks and uncertainties in the markets for financial instruments that the Fund trades, in the markets for related physical commodities, in the legal and regulatory regimes applicable to the Managing Owner, the Fund, and the Fund’s service providers, and in the broader economy may cause actual results to differ materially from those expressed by such forward-looking statements. These forward-looking statements are subject to a number of risks, uncertainties and other factors including, but not limited to, those described in this Report, including in Part I, Item 1A. “Risk Factors” and Part II, Item 7, “Management’s Discussion and Analysis of Financial Condition and Results of Operation” (“MD&A”), and other Securities and Exchange Commission (“SEC”) filings by the Fund that could cause the actual results, performance, prospects or opportunities of the Fund to differ materially from those expressed in, or implied by, these forward-looking statements.
You should not place undue reliance on any forward-looking statements. Except as expressly required by the Federal securities laws, the Fund and Managing Owner undertake no obligation to publicly update or revise any forward-looking statements or the risks, uncertainties or other factors described in this Report, as a result of new information, future events or changed circumstances or for any other reason after the date of this Report.
ii
| ITEM 1. | BUSINESS |
Introduction
Invesco DB Energy Fund (the “Fund”), a separate series of Invesco DB Multi-Sector Commodity Trust (the “Trust”), a Delaware statutory trust organized in seven separate series, was formed on August 3, 2006. The term of the Fund is perpetual (unless terminated earlier in certain circumstances) as provided for in the Fifth Amended and Restated Declaration of Trust and Trust Agreement of the Trust, as amended (the “Trust Agreement”). The Fund has an unlimited number of shares authorized for issuance.
Invesco Capital Management LLC (“Invesco”) has served as the managing owner (the “Managing Owner”), commodity pool operator and commodity trading advisor of the Trust and the Fund since February 23, 2015. The Managing Owner holds 40 general shares (the “General Shares”) of the Fund. The fiscal year end of the Fund is December 31st.
The Fund seeks to track changes, whether positive or negative, in the level of the DBIQ Optimum Yield Energy Index Excess Return™ (the “Index”) over time, plus the excess, if any, of the sum of the Fund’s interest income from its holdings of United States Treasury Obligations (“Treasury Income”), dividends from its holdings in money market mutual funds (affiliated or otherwise) (“Money Market Income”) and dividends or distributions of capital gains from its holdings ofT-Bill ETFs (as defined below)(“T-Bill ETF Income”) over the expenses of the Fund. The Fund invests in futures contracts in an attempt to track its Index. The Index is intended to reflect the change in market value of the energy sector. The commodities comprising the Index are Light Sweet Crude Oil, Ultra Low Sulphur Diesel (also commonly known as Heating Oil), Brent Crude Oil, RBOB Gasoline and Natural Gas (each, an “Index Commodity,” and collectively, the “Index Commodities”).
The Fund may invest directly in United States Treasury Obligations. The Fund may also gain exposure to United States Treasury Obligations through investments in exchange-traded funds (“ETFs”) (affiliated or otherwise) that track indexes that measure the performance of United States Treasury Obligations with a maximum remaining maturity of up to 12 months(“T-Bill ETFs”). The Fund invests in United States Treasury Obligations, money market mutual funds andT-Bill ETFs (affiliated or otherwise), if any, for margin and/or cash management purposes.
The Commodity Futures Trading Commission (the “CFTC”) and certain futures exchanges impose position limits on futures contracts that reference Index Commodities (the “Index Contracts”). As the Fund approaches or reaches position limits with respect to an Index Commodity, the Fund may commence investing in Index Contracts that reference other Index Commodities. In those circumstances, the Fund may also trade in futures contracts based on commodities other than Index Commodities that the Managing Owner reasonably believes tend to exhibit trading prices that correlate with an Index Contract. In addition, the Managing Owner may determine to invest in other futures contracts if at any time it is impractical or inefficient to gain full or partial exposure to an Index Commodity through the use of Index Contracts. These other futures contracts may or may not be based on an Index Commodity. When they are not, the Managing Owner may seek to select futures contracts that it reasonably believes tend to exhibit trading prices that correlate with an Index Contract.
The Fund offers common units of beneficial interest (the “Shares”) only to certain eligible financial institutions (the “Authorized Participants”) in one or more blocks of 200,000 Shares (“Basket”). The Fund commenced investment operations on January 3, 2007. The Fund commenced trading on the American Stock Exchange (which became the NYSE Alternext US LLC) on January 5, 2007 and, since November 25, 2008, has been listed on the NYSE Arca, Inc. (the “NYSE Arca”).
Index Description
The Managing Owner pays Deutsche Investment Management Americas Inc. (the “Index Sponsor”) a licensing fee and an index services fee for performing its duties.
These fees constitute a portion of the routine operational, administrative and other ordinary expenses which are paid out of the management fee to the Managing Owner (“Management Fee”) and are not charged to or reimbursed by the Fund.
Neither the Managing Owner nor any affiliate of the Managing Owner has any rights to influence the selection of the futures contracts underlying the Index. The Managing Owner has entered into a license agreement with the Index Sponsor to use the Index.
The Fund is not sponsored or endorsed by Deutsche Bank AG, Deutsche Investment Management Americas Inc. or any subsidiary or affiliate of Deutsche Bank AG or Deutsche Investment Management Americas Inc. (collectively, “Deutsche Bank”). The DBIQ Optimum Yield Energy Index Excess Return™ (the “Index”) is the exclusive property of Deutsche Investment Management Americas Inc. “DBIQ” and “Optimum Yield” are service marks of Deutsche Bank AG and have been licensed for use for certain purposes by Deutsche Investment Management Americas Inc. Neither Deutsche Bank nor any other party involved in, or related to, making or compiling the Index makes any representation or warranty, express or implied, concerning the Index, the Fund or the advisability of investing in securities generally. Neither Deutsche Bank nor any other party involved in, or related to, making or
1
compiling the Index has any obligation to take the needs of the Managing Owner or its clients into consideration in determining, composing or calculating the Index. Neither Deutsche Bank nor any other party involved in, or related to, making or compiling the Index is responsible for or has participated in the determination of the timing of, prices at, quantities or valuation of the Fund. Neither Deutsche Bank nor any other party involved in, or related to, making or compiling the Index has any obligation or liability in connection with the administration or trading of the Fund.
NEITHER DEUTSCHE BANK NOR ANY OTHER PARTY INVOLVED IN, OR RELATED TO, MAKING OR COMPILING THE INDEX, WARRANTS OR GUARANTEES THE ACCURACY AND/OR THE COMPLETENESS OF THE INDEX OR ANY DATA INCLUDED THEREIN AND SHALL HAVE NO LIABILITY FOR ANY ERRORS, OMISSIONS, OR INTERRUPTIONS THEREIN. NEITHER DEUTSCHE BANK NOR ANY OTHER PARTY INVOLVED IN, OR RELATED TO, MAKING OR COMPILING THE INDEX, MAKES ANY WARRANTY, EXPRESS OR IMPLIED, AS TO RESULTS TO BE OBTAINED BY INVESCO CAPITAL MANAGEMENT LLC FROM THE USE OF THE INDEX OR ANY DATA INCLUDED THEREIN. NEITHER DEUTSCHE BANK NOR ANY OTHER PARTY INVOLVED IN, OR RELATED TO, MAKING OR COMPILING THE INDEX, MAKES ANY EXPRESS OR IMPLIED WARRANTIES, AND EXPRESSLY DISCLAIMS ALL WARRANTIES, OF MERCHANTABILITY OR FITNESS FOR A PARTICULAR PURPOSE OR USE WITH RESPECT TO THE INDEX OR ANY DATA INCLUDED THEREIN. WITHOUT LIMITING ANY OF THE FOREGOING, IN NO EVENT SHALL DEUTSCHE BANK OR ANY OTHER PARTY INVOLVED IN, OR RELATED TO, MAKING OR COMPILING THE INDEX HAVE ANY LIABILITY FOR DIRECT, INDIRECT, PUNITIVE, SPECIAL, CONSEQUENTIAL OR ANY OTHER DAMAGES OR LOSSES (INCLUDING LOST PROFITS), EVEN IF NOTIFIED OF THE POSSIBILITY THEREOF. EXCEPT AS EXPRESSLY PROVIDED TO THE CONTRARY, THERE ARE NO THIRD PARTY BENEFICIARIES OF ANY AGREEMENTS OR ARRANGEMENTS BETWEEN DEUTSCHE BANK AND INVESCO CAPITAL MANAGEMENT LLC.
No purchaser, seller or holder of the Shares of this Fund, or any other person or entity, should use or refer to any Deutsche Bank trade name, trademark or service mark to sponsor, endorse, market or promote this Fund without first contacting Deutsche Bank to determine whether Deutsche Bank’s permission is required. Under no circumstances may any person or entity claim any affiliation with Deutsche Bank without the written permission of Deutsche Bank.
The Index Sponsor may fromtime-to-time subcontract the provision of the calculation and other services described below to one or more third parties. The Index is composed of notional amounts of each of the underlying Index Commodities. The notional amount of each Index Commodity included in the Index is intended to reflect the changes in market value of each such Index Commodity within the Index. The closing level of the Index is calculated on each business day by the Index Sponsor based on the closing price of the commodity futures contracts for each of the Index Commodities and the notional amount of such Index Commodity.
The Index is rebalanced annually in November to ensure that each of the Index Commodities is weighted in the same proportion that such Index Commodities were weighted on June 4, 1990. The composition of the Index may be adjusted in the event that the Index Sponsor is not able to calculate the closing prices of the Index Commodities.
The following table reflects the Fund weights of each Index Commodity or related futures contracts, as applicable, as of December 31, 2018:
Index Commodity | Fund Weight (%) | |||
RBOB Gasoline | 22.22 | % | ||
Heating Oil | 22.20 | % | ||
Brent Crude Oil | 22.00 | % | ||
Light Crude | 21.15 | % | ||
Natural Gas | 12.43 | % | ||
|
| |||
Closing Level as of December 31, 2018: | 100.00 | % | ||
|
| |||
Please seehttp://www.invesco.com/ETFs with respect to the most recently available weighted composition of the Fund and the composition of the Index.
The Index includes provisions for the replacement of futures contracts as they approach maturity. This replacement takes place over a period of time in order to lessen the impact on the market for the futures contracts being replaced. With respect to each Index Commodity, the Fund employs a rule-based approach when it “rolls” from one futures contract to another. The Index replaces the underlying futures contracts on an “optimum yield” basis.
The composition of the Index may be adjusted in the event that the Index Sponsor is not able to calculate the closing prices of the Index Commodities.
Rather than select a new futures contract based on a predetermined schedule (e.g., monthly), each Index Commodity rolls from one contract to another futures contract that is intended to generate the most favorable ‘implied roll yield’ under prevailing market conditions. Where there is an upward-sloping price curve for futures contracts, the implied roll yield is expected to be negative. The
2
selection of a new futures contract on an Index Commodity in such market conditions is designed to minimize the impact of negative roll yield. Conversely, where there is a downward-sloping price curve for futures contracts, the implied roll yield is expected to be positive. The selection of a new futures contract on an Index Commodity in such market conditions is designed to maximize the impact of positive roll yield. The Index takes the impact of implied roll yield into consideration by selecting, as the replacement for an expiring futures contract, the futures contract with a delivery month within the next thirteen months that generates the most favorable implied roll yield under the current market conditions.
The market condition in which the Index is designed to maximize the effect of positive roll yield when entering into new futures contracts is called backwardation. Backwardation exists when prices are higher for contracts with shorter-term expirations than those with longer-term expirations, a condition that is typically associated with commodities that are consumed quickly instead of being put in storage. Rolling in a backwardated market will tend to enhance returns from futures trading. The market condition in which the Index is designed to mitigate the effect of negative roll yield when entering into new futures contracts is called contango. Contango exists when contract prices are higher in distant delivery months than in nearer delivery months, typically due to costs associated with storing a given physical commodity for a longer period. Rolling in a contangoed market will tend to cause a drag on returns from futures trading. Returns from futures trading are called excess return, which is the combined return based on the spot prices of Index Commodities and the roll yield from trading futures contracts on Index Commodities.
The Index is calculated in USD on an excess return (unfunded) basis, which means that the Index reflects the return associated with spot prices for Index Commodities and the roll yield associated with trading futures contracts on Index Commodities. The Fund also invests in securities that are expected to generate income, including Treasury Securities, money market mutual funds, andT-Bill ETFs. These securities are held with the Custodian. In addition, Treasury Securities for deposit may be held with the Commodity Broker as margin for the Fund’s futures positions. The Index does not reflect any corresponding income characteristics.
The futures contract price for each Index Commodity will be the exchange closing price for such Index Commodity on a day on which the appropriate exchange is open for business (the “Index Business Days”). If a weekday is not an Exchange Business Day (as defined in the following sentence) but is an Index Business Day, the exchange closing price from the previous Index Business Day will be used for each Index Commodity. “Exchange Business Day” means, in respect of an Index Commodity, a day that is a trading day for such Index Commodity on the relevant exchange (unless either an Index disruption event or force majeure event has occurred).
On the first Index Business Day of each month (the “Verification Date”), each Index Commodity futures contract will be tested in order to determine whether to continue including it in the Index. If the Index Commodity futures contract requires delivery of the underlying commodity in the next month, known as the Delivery Month, a new Index Commodity futures contract will be selected for inclusion in the Index. For example, if the first Index Business Day is May 1 of the current year, and the Delivery Month of the Index Commodity futures contract currently in the Index is June of the current year, a new Index Commodity futures contract with a later Delivery Month will be selected.
For each underlying Index Commodity in the Index, the new Index Commodity futures contract selected will be the Index Commodity futures contract with the best possible “implied roll yield” based on the closing price for each eligible Index Commodity futures contract. Eligible Index Commodity futures contracts are any Index Commodity futures contracts having a Delivery Month (i) no sooner than the month after the Delivery Month of the Index Commodity futures contract currently in the Index, and (ii) no later than the thirteenth month after the Verification Date. For example, if the first Index Business Day is May 1 of the current year and the Delivery Month of an Index Commodity futures contract currently in the Index is June of the current year, the Delivery Month of an eligible new Index Commodity futures contract must be between July of the current year and June of the following year. The implied roll yield is then calculated and the futures contract on the Index Commodity with the best possible implied roll yield under the current market conditions is then selected. If two futures contracts have the same implied roll yield, the futures contract with the minimum number of months prior to the Delivery Month is selected.
After the futures contract selection, the monthly roll for each Index Commodity subject to a roll in that particular month unwinds the old futures contract and enters a position in the new futures contract. This takes place between the second and sixth Index Business Day of the month.
On each day during the roll period, new notional holdings are calculated. The calculations for the futures contracts on the old Index Commodities that are leaving the Index and the futures contracts on the new Index Commodities are then calculated.
On all days that are not monthly index roll days, the notional holdings of each Index Commodity future remains constant.
The Index isre-weighted on an annual basis on the sixth Index Business Day of each November.
The calculation of the Index is expressed as the weighted average return of the Index Commodities.
3
The Trustee
Under the Trust Agreement, Wilmington Trust Company, the trustee of the Trust and the Fund (the “Trustee”), has the power and authority to execute and file certificates as required by the Delaware Statutory Trust Act and to accept service of process on the Fund in the State of Delaware. The Managing Owner has the exclusive management and control of all aspects of the business of the Trust and the Fund. The Trustee will serve in that capacity until such time as the Managing Owner removes the Trustee or the Trustee resigns and a successor is appointed by the Managing Owner. The Trustee will have no duty or liability to supervise or monitor the performance of the Managing Owner, nor will the Trustee have any liability for the acts or omissions of the Managing Owner.
The Managing Owner
The Managing Owner was formed on February 7, 2003. The Managing Owner is an affiliate of Invesco Ltd. The Managing Owner was formed to be the managing owner of investment vehicles such as ETFs and has been managingnon-commodity futures based ETFs since 2003 and a commodity futures based ETF since 2014. The Managing Owner serves as the commodity pool operator and commodity trading advisor of the Trust and the Fund. The Managing Owner is registered as a commodity pool operator and commodity trading advisor with the CFTC and is a member of, and approved as a swap firm by, the National Futures Association (the “NFA”). As a registered commodity pool operator and commodity trading advisor, with respect to the Fund, the Managing Owner must comply with various regulatory requirements under the Commodity Exchange Act of 1936, as amended (the “Commodity Exchange Act”) and the rules and regulations of the CFTC and the NFA, including investor protection requirements, antifraud prohibitions, disclosure requirements, and reporting and recordkeeping requirements. The Managing Owner also is subject to periodic inspections and audits by the CFTC and NFA.
The Managing Owner’s main business offices are located at 3500 Lacey Road, Suite 700, Downers Grove, Illinois 60515, and its telephone number is(800) 983-0903.
The Fund pays the Managing Owner the Management Fee, monthly in arrears, in an amount equal to 0.75% per annum of the daily net asset value (“NAV”) of the Fund.
The Fund may, for margin and/or cash management purposes, invest in money market mutual funds and/orT-Bill ETFs that are managed by affiliates of the Managing Owner. The indirect portion of the management fee that the Fund may incur through such investment is in addition to the Management Fee paid to the Managing Owner. The Managing Owner has contractually agreed to waive indefinitely the fees that it receives in an amount equal to the indirect management fees that the Fund incurs through its investments in affiliated money market mutual funds and/or affiliatedT-Bill ETFs. The Managing Owner may terminate this fee waiver on 60 days notice.
Pursuant to the Trust Agreement, the Fund will indemnify the Managing Owner against any losses, judgments, liabilities, expenses and amounts paid in settlement of any claims sustained by it in connection with its activities on behalf of the Fund, except for any expenses resulting from gross negligence or willful misconduct.
The Commodity Broker
Morgan Stanley & Co. LLC, a Delaware limited liability company, serves as the Fund’s futures clearing broker (the “Commodity Broker”). The Commodity Broker is registered with the CFTC as a futures commission merchant and is a member of the NFA in such capacity.
A variety of executing brokers execute futures transactions on behalf of the Fund. Such executing brokersgive-up all such transactions to the Commodity Broker. In its capacity as clearing broker, the Commodity Broker may execute or receive transactions executed by others and clears all of the Fund’s futures transactions and performs certain administrative and custodial services for the Fund. The Commodity Broker is responsible, among other things, for providing periodic accountings of all dealings and actions taken by the Fund during the reporting period, together with an accounting of all securities, cash or other indebtedness or obligations held by it or its nominees for or on behalf of the Fund.
The Fund pays the Commodity Broker all brokerage commissions, including applicable exchange fees, NFA fees,give-up fees, pit brokerage fees and other transaction related fees and expenses charged in connection with trading activities. The Commodity Broker’s brokerage commissions and trading fees are determined on acontract-by-contract basis. Brokerage commissions and fees in any future fiscal year or any part of any future fiscal year may be greater than fees incurred in prior fiscal years. On average, total charges paid to the Commodity Broker were less than $6.00, $6.00 and $6.00 per round-turn trade1 for the years ended December 31, 2018, 2017 and 2016, respectively.
| 1 | A round-turn trade is a completed transaction involving both a purchase and a liquidating sale, or a sale followed by a covering purchase. |
4
The Administrator, Custodian and Transfer Agent
The Bank of New York Mellon (the “Administrator”, “Custodian” and “Transfer Agent”) is the administrator, custodian and transfer agent of the Fund. The Fund and the Administrator have entered into separate administrative, custodian, transfer agency and service agreements (collectively referred to as the “Administration Agreement”).
The Bank of New York Mellon, a banking corporation organized under the laws of the State of New York with trust powers, has an office at 2 Hanson Place, Brooklyn, New York, 11217. The Bank of New York Mellon is subject to supervision by the New York State Department of Financial Services and the Board of Governors of the Federal Reserve System.
Pursuant to the Administration Agreement, the Administrator performs or supervises the performance of services necessary for the operation and administration of the Fund (other than making investment decisions), including receiving and processing orders from Authorized Participants to create and redeem Baskets, NAV calculations, accounting and other fund administrative services. The Administrator maintains certain financial books and records, including: Basket creation and redemption records; fund accounting records; ledgers with respect to assets, liabilities, capital, income and expenses; the registrar, transfer journals and related details; and trading and related documents received from the Commodity Broker. The Managing Owner pays the Administrator administrative services fees out of the Management Fee.
The Distributor
Invesco Distributors, Inc. is the Fund’s distributor (the “Distributor”). Pursuant to the Distribution Services Agreement among the Managing Owner, the Fund and the Distributor, the Distributor assists the Managing Owner and the Administrator with certain functions and duties relating to distribution and marketing services to the Fund including reviewing and approving marketing materials. Prior to June 20, 2016, ALPS Distributors, Inc. provided distribution services to the Fund.
The Distribution Services Agreement is terminable without penalty on sixty days written notice by the Managing Owner or by the Distributor. The Distribution Services Agreement will automatically terminate in the event of its assignment.
Pursuant to the Distribution Services Agreement, the Fund will indemnify and hold harmless the Distributor and each of its directors and officers and each person, if any, who controls the Distributor within the meaning of Section 15 of the Securities Act, against any loss, liability, claim, damages or expenses (including the reasonable cost of investigating or defending any alleged loss, liability, claim, damages or expense and reasonable counsel fees incurred in connection therewith) arising by reason of any person acquiring any Shares, based upon the ground that the registration statement, prospectus, statement of additional information, shareholder reports or other information filed or made public by the Fund (as fromtime-to-time amended) included an untrue statement of a material fact or omitted a material fact required to be stated or necessary in order to make the statements therein not misleading under the Securities Act or any other statute or the common law.
The Managing Owner pays the Distributor a distribution fee out of the Management Fee.
Index Sponsor
The Managing Owner, on behalf of the Fund, has appointed Deutsche Investment Management Americas Inc. to serve as the index sponsor (the “Index Sponsor”). The Index Sponsor calculates and publishes the daily index levels and the indicative intraday index levels. Additionally, the Index Sponsor also calculates the indicative value per Share of the Fund throughout each business day.
The Managing Owner pays the Index Sponsor a licensing fee and an index services fee out of the Management Fee for performing its duties.
Marketing Agent
The Managing Owner, on behalf of the Trust and the Fund, has appointed Deutsche Investment Management Americas Inc. as the marketing agent (the “Marketing Agent”) to assist the Managing Owner by providing support to educate institutional investors about the DBIQ indices and to complete governmental or institutional due diligence questionnaires or requests for proposals related to the DBIQ indices.
The Managing Owner pays the Marketing Agent a marketing services fee out of the Management Fee.
The Marketing Agent will not open or maintain customer accounts or handle orders for the Fund. The Marketing Agent has no responsibility for the performance of the Fund or the decisions made or actions taken by the Managing Owner.
5
Tax Reporting
The Fund has retained the services of PricewaterhouseCoopers LLP to assist with certain tax reporting requirements of the Fund and its Shareholders.
Regulation
Futures exchanges in the United States are subject to regulation under the Commodity Exchange Act by the CFTC, the governmental agency having responsibility for regulation of futures exchanges and trading on those exchanges.
The Commodity Exchange Act and the CFTC also regulate the activities of “commodity trading advisors” and “commodity pool operators” and the CFTC has adopted regulations with respect to certain of such persons’ activities. Pursuant to its authority, the CFTC requires a commodity pool operator (such as the Managing Owner) to keep accurate, current and orderly records with respect to each pool it operates. The CFTC may suspend the registration of a commodity pool operator if the CFTC finds that the operator has violated the Commodity Exchange Act or regulations thereunder and in certain other circumstances. Suspension, restriction or termination of the Managing Owner’s registration as a commodity pool operator would prevent it, until such time (if any) as such registration were to be reinstated, from managing, and might result in the termination of, the Fund. The Commodity Exchange Act gives the CFTC similar authority with respect to the activities of commodity trading advisors, such as the Managing Owner. If the registration of a managing owner as a commodity trading advisor were to be terminated, restricted or suspended, the managing owner would be unable, until such time (if any) as such registration were to be reinstated, to render trading advice to the Fund. The Fund is not registered with the CFTC in any capacity.
The Commodity Exchange Act requires all “futures commission merchants,” such as the Commodity Broker, to meet and maintain specified fitness and financial requirements, to segregate customer funds from proprietary funds and account separately for all customers’ funds and positions, and to maintain specified books and records open to inspection by the staff of the CFTC.
The Commodity Exchange Act also gives the states certain powers to enforce its provisions and the regulations of the CFTC.
Shareholders are afforded certain rights for reparations under the Commodity Exchange Act. Shareholders may also be able to maintain a private right of action for certain violations of the Commodity Exchange Act. The CFTC has adopted rules implementing the reparation provisions of the Commodity Exchange Act which provide that any person may file a complaint for a reparations award with the CFTC for violation of the Commodity Exchange Act against a floor broker, futures commission merchant, introducing broker, commodity trading advisor, commodity pool operator, and their respective associated persons.
Pursuant to authority in the Commodity Exchange Act, the NFA was formed and registered with the CFTC as a “registered futures association.” At the present time, the NFA is the onlynon-exchange self-regulatory organization for derivatives professionals. NFA members are subject to NFA standards relating to fair trade practices, market integrity, and consumer protection. As the self-regulatory body of the derivatives industry, the NFA promulgates rules governing the conduct of derivatives professionals and disciplines those professionals who do not comply with such standards. The CFTC has delegated to the NFA responsibility for the registration of commodity trading advisors, commodity pool operators, futures commission merchants, introducing brokers, and swap dealers, among others, and their respective associated persons, as applicable, and floor brokers. The Commodity Broker and the Managing Owner are members of the NFA (the Fund is not required to become a member of the NFA).
The CFTC has no authority to regulate trading on foreign futures exchanges and markets but permits direct access to such markets from the United States with respect to foreign boards of trade that are registered as such with the CFTC.
Employees
The Fund has no employees.
Available Information
The Fund files with or submits to the SEC annual, quarterly and current reports and other information meeting the informational requirements of the Exchange Act. These reports are available on the Managing Owner’s website athttp://www.invesco.com/ETFs. Information in the Managing Owner’s website shall not be deemed to be a part of this Report or incorporated by reference herein unless otherwise expressly stated. The SEC maintains an Internet site that contains reports, proxy and information statements and other information filed electronically by us with the SEC which are available on the SEC’s Internet site athttp://www.sec.gov.
The Fund also posts monthly performance reports and its annual report, as required by the CFTC, on the Managing Owner’s website at the address listed above.
6
| ITEM 1A. | RISK FACTORS |
An investment in Shares involves a high degree of risk. Investors should consider carefully all of the risks described below, together with the other information contained in this Annual Report on Form10-K (the “Report”) and the Fund’s Prospectus, before making a decision to invest in Shares. If any of the following risks occur, the business, financial condition and results of operations of the Fund may be adversely affected.
Market Risks
NAV May Not Always Correspond to Market Price and, as a Result, Baskets May Be Created or Redeemed at a Value that Differs from the Market Price of the Shares.
Shares may trade at, above or below their NAV. The NAV fluctuates with changes in the market value of the Fund’s assets. The trading price of Shares fluctuates in accordance with changes in the NAV, intraday changes in the value of the futures contracts and market supply and demand. The amount of the discount or premium in the trading price of the Shares relative to their NAV may be influenced bynon-concurrent trading hours between NYSE Arca (the exchange on which the Shares trade) and the exchanges on which futures contracts on the Index Commodities trade. While the Shares are expected to trade on NYSE Arca until 4:00 p.m. (Eastern time), liquidity in the markets for the futures contracts on the Index Commodities are expected to be reduced whenever the principal markets for those contracts are closed. As a result, trading spreads, and the resulting premium or discount on Shares, may widen during these gaps in market trading hours.
The NYSE Arca May Halt Trading in the Shares Which Would Adversely Impact Your Ability to Sell Shares.
The Shares are listed for trading on the NYSE Arca. Trading in Shares may be halted due to market conditions or in light of certain procedures and safeguards under NYSE Arca rules. In addition, trading is subject to trading halts caused by extraordinary market volatility pursuant to “circuit breaker” rules that require trading to be halted for a specified period based on a specified market decline. If the Fund were no longer to meet the requirements necessary to maintain the listing of its Shares, the Shares would be delisted. In such a scenario, the Fund would be terminated.
The Lack of an Active Trading Market for the Shares May Result in Losses on Your Investment at the Time of Disposition of Your Shares.
Although the Shares are listed and traded on the NYSE Arca, there can be no guarantee that an active trading market for the Shares will be maintained. If you need to sell your Shares at a time when no active market for them exists, the price you receive for your Shares, assuming that you are able to sell them, likely will be lower than the price you would receive if an active market did exist.
Volatility May Cause the Total Loss of Your Investment.
Futures contracts prices have a high degree of volatility and are subject to rapid and substantial changes. Consequently, there is a risk that the value of your investment in the Fund could decrease significantly due to rapid and substantial changes in the prices of futures contracts held by the Fund. The Index’s average annual volatility since inception is 23.86%. Average annual volatility is the average of the Index’s volatility each year since its inception. Yearly volatility is the relative rate at which the price of the Index moves up and down, found by calculating the annualized standard deviation of the daily change in price for each business day in the given year.
In addition, the Fund enters sell orders with the Commodity Broker from time to time, to liquidate Index Contract positions in order to satisfy redemption requests or to pay expenses and liabilities. The Fund is subject to the risk that temporary aberrations or distortions will occur in the market for Index Contracts at the time those orders are executed. The prices received by the Fund from the liquidation of its positions could be adversely affected, which in turn could adversely affect the value of the Shares. Those aberrations or distortions may result from trading activities by other market participants or actions taken by the Commodity Broker, the CFTC, the exchanges or other regulatory authorities. If the Fund’s positions are liquidated at inopportune times or in a manner that temporarily distorts the market or otherwise causes a pricing aberration, the value of the Shares may be adversely affected.
7
The Fund’s Trading of Index Contracts May Adversely Affect the Price that the Fund Pays for Index Contracts.
The prices that the Fund pays for Index Contracts may be adversely affected by the trading of Index Contracts by other market participants. Transactions by other market participants may be based on their awareness of the Fund’s positions in Index Contracts. If other market participants are able to anticipate the timing of the Fund’s Index Contract transactions, for instance, they may be able to execute transactions in advance of the Fund. If that were to occur, those market participants may receive more favorable pricing for their Index Contract transactions than the Fund does for its own, subsequent Index Contract transactions. If the Fund’s Index Contract positions represent a significant part of the open long interest in those Index Contracts, moreover, other market participants may take that fact into account and trade in a manner that adversely affects the prices that the Fund obtains when trading Index Contracts. The Fund may not be able to counteract adverse pricing effects of its own positions and transactions in Index Contracts.
Withdrawal from Participation by Authorized Participants May Affect the Liquidity of Shares.
If one or more Authorized Participants withdraws from participation, it may become more difficult to create or redeem Baskets, which may reduce the liquidity of the Shares. If it becomes more difficult to create or redeem Baskets, the correlation between the price of the Shares and the NAV may be affected, which may affect the trading market for the Shares. Having fewer participants in the market for the Shares could also adversely affect the ability to arbitrage any price difference between futures contracts and the Shares, which may also affect the trading market and liquidity of the Shares.
Possible Illiquid Markets May Exacerbate Losses.
Futures positions cannot always be liquidated at the desired price. It is difficult to execute a trade at a specific price when there is a relatively small volume of buy and sell orders in a market. A market disruption, such as when foreign governments may take or be subject to political actions which disrupt the markets in their currencies or major commodities exports, can also make it difficult to liquidate a position.
Illiquidity may cause losses for the Fund. The large size of the positions which the Fund may acquire increases the risk of illiquidity by both making its positions more difficult to liquidate and increasing the losses incurred while trying to do so.
Trading on Futures Exchanges Outside the United States Is Not Subject to U.S. Regulation.
Trading on futures exchanges located outside the United States is not regulated by any United States governmental agency and may involve certain risks not applicable to trading on U.S. exchanges, including different or diminished investor protections. If the Fund trades contracts denominated in currencies other than U.S. dollars, the Fund will be exposed to the risk of adverse exchange-rate movements between the dollar and the currencies in which those contracts are denominated.
In addition, trading onnon-U.S. exchanges is subject to the risks presented by exchange controls, expropriation, increased tax burdens and exposure to local economic declines and political instability, among other factors. An adverse development with respect to any of these factors could reduce the profit or increase the loss earned on the Fund’s trades onnon-U.S. exchanges.
The Effect of Market Disruptions and Government Interventions Are Unpredictable and May Have an Adverse Effect on the Value of Your Shares.
The commodity futures markets may be subject to temporary distortions due to various factors, including lack of liquidity, congestion, disorderly closing periods, manipulation and disruptive conduct, limitations on deliverable supplies, excessive speculation, government regulation and intervention, technical and operational or system failures, nuclear accidents, terrorism, riots and acts of God.
Government intervention has in certain cases been implemented on an “emergency” basis, suddenly and substantially eliminating market participants’ ability to continue to implement certain strategies or manage the risk of their outstanding positions. These interventions have typically been unclear in scope and application, resulting in confusion and uncertainty which in itself has been materially detrimental to the efficient functioning of the markets as well as previously successful investment strategies.
The financial crisis of 2008-2009 and associated regulatory changes, including the Dodd-Frank Wall Street Reform and Consumer Protection Act (the “Dodd Frank Act”) are generally considered to have contributed to less credit being available to financial market participants. This is particularly the case for credit extended by banks and other traditional lending sources. The Fund does not borrow from lenders for the purpose of pursuing its investment objective. Nonetheless, restrictions on the availability of credit may adversely affect investors who borrow to purchase Shares and participants in the markets for financial instruments in which the Fund trades, including futures markets. Limitations on the availability of credit, whether in stressed market conditions or otherwise, may have a material adverse effect on investors and financial market participants, which in turn could affect the Fund’s ability to pursue its investment objective. Among other things, fewer prospective investors may adversely affect the Fund’s asset levels, and fewer financial market participants may reduce liquidity and adversely affect pricing for the financial instruments that the Fund seeks to trade.
8
The Fund may incur major losses in the event of disrupted markets and other extraordinary events in which historical pricing relationships become materially distorted. The risk of loss from pricing distortions is compounded by the fact that in disrupted markets many positions become illiquid, making it difficult or impossible to close out or liquidate positions against which the markets are moving. The large size of the positions which the Fund may acquire increases the risk of illiquidity by both making its positions more difficult to liquidate and increasing the losses incurred while trying to do so.
An Investment in the Shares May Be Adversely Affected by Competition from Other Methods of Investing in Commodities.
The Fund competes with other financial vehicles, including mutual funds, and other investment companies, ETFs, other index tracking commodity pools, actively traded commodity pools, hedge funds, traditional debt and equity securities issued by companies in the commodities industry, other securities backed by or linked to commodities, and direct investments in the underlying commodities or commodity futures contracts. Market and financial conditions, and other conditions beyond the Managing Owner’s control, may make it more attractive to invest in other financial vehicles or to invest in such commodities directly, which could limit the market for the Shares and therefore reduce the liquidity of the Shares.
The NAV Calculation of the Fund May Be Overstated or Understated Due to the Valuation Method Employed When a Settlement Price Is Not Available on the Date of NAV Calculation.
Calculating the NAV of the Fund includes, in part, any unrealized profits or losses on open commodity futures contracts. Under normal circumstances, the NAV of the Fund reflects the settlement price of open commodity futures contracts on the date when the NAV is being calculated. However, if a settlement price for a commodity futures contract could not be determined for any reason, the Managing Owner may value the futures contract pursuant to policies the Managing Owner has adopted. In such a situation, there is a risk that the resulting calculation of the Fund’s NAV could be understated or overstated, perhaps to a significant degree.
Futures Risks
Fluctuations in the Price of Assets Held by the Fund Could Have a Materially Adverse Effect on the Value of an Investment in Shares.
The Shares are designed to reflect as closely as possible the changes, positive or negative, in the level of the Index, over time, through the Fund’s portfolio of exchange-traded futures contracts on the Index Commodities. The value of the Shares relates directly to the value of the portfolio, less the liabilities (including estimated accrued but unpaid expenses) of the Fund. The price of the Index Commodities may fluctuate widely. Several factors may affect the prices of the Index Commodities, including, but not limited to:
| • | Global supply and demand of each of the Index Commodities, which may be influenced by such factors as forward selling by the various commodities producers, purchases made by the commodities’ producers to unwind their hedge positions and production and cost levels in the major markets of each of the Index Commodities; |
| • | Domestic and foreign interest rates and investors’ expectations concerning interest rates; |
| • | Domestic and foreign inflation rates and investors’ expectations concerning inflation rates; |
| • | Investment and trading activities of mutual funds, ETFs,closed-end funds, hedge funds and commodity funds; |
| • | Weather and other environmental conditions; |
| • | Acts of God; and |
| • | Global or regional political, economic or financial events and situations. |
Fewer Representative Commodities May Result in Greater Index Volatility.
The Index Commodities are RBOB Gasoline, Heating Oil, Brent Crude Oil, Light, Sweet Crude Oil, and Natural Gas. Other commodity indexes may contain a larger number of commodities than the Index. Accordingly, increased volatility in a single Index Commodity is expected to have a greater impact on the Index’s overall volatility than would likely be the case with increased volatility in a single commodity within a broader index. Because the Fund tracks the performance of the Index, your investment in the Fund will be exposed to the relatively greater impact on the Index of volatility in a single Index Commodity.
9
Because the Futures Contracts Have No Intrinsic Value, the Positive Performance of Your Investment Is Wholly Dependent Upon an Equal and Offsetting Loss.
Trading in futures contracts transfers the risk of future price movements from one market participant to another. For every gain in futures trading, there is an equal and offsetting loss. Accordingly, whether a futures trade is profitable for one party depends on whether the price paid, value received, or cost of delivery under the related futures contract is favorable to that party. The prices of stocks, bonds, and other assets could rise significantly and the economy as a whole could prosper while the Fund experiences losses as a result of pursuing its investment objective through trading in Index Contracts.
The Fund May Not Provide a Diversification Benefit to Investments in Other Asset Classes and May Result in Additional Losses to Your Portfolio.
Historically, commodity futures returns have tended not to be correlated with the returns of other assets such as stocks and bonds. Commodity futures contracts therefore have the potential to help diversify investor portfolios consisting of stocks and bonds, to the extent there is low or negative correlation between commodity futures contracts and other financial assets held in those portfolios. However, the fact that the Index is not inversely correlated with other assets such as stocks and bonds means that, in seeking to replicate the performance of the Index, the Fund will not necessarily be profitable during unfavorable periods for the stock or bond markets. If the Shares perform in a manner that correlates with the stock or bond markets or otherwise do not perform successfully, the Shares may not provide any diversification from losses in those markets. In such a scenario, the Shares may produce no gains to offset losses from investments in stocks, bonds, or related assets and may result in additional investment losses.
The Fund’s Returns from Futures Trading Will Be Affected by Market Conditions When Replacing Expiring Futures Contracts with New Futures Contracts on Index Commodities.
The Fund’s returns from futures trading are called excess return, which is the combined return based on the spot prices of Index Commodities and the roll yield from trading Index Contracts. Market conditions at the time the Fund replaces expiring Index Contracts with new Index Contracts – i.e., when Index Contracts are “rolled” – will affect the Fund’s roll yield. Those market conditions are referred to as backwardation and contango, which will generally affect the Fund’s roll yield as set forth below:
| • | Rolling in a backwardated market will tend to enhance returns from futures trading. Backwardation exists when prices are higher for contracts with shorter-term expirations than those with longer-term expirations, a condition that is typically associated with commodities that are consumed quickly instead of being put in storage. |
| • | Rolling in a contangoed market will tend to cause a drag on returns from futures trading. Contango exists when contract prices are higher in distant delivery months than in nearer delivery months, typically due to costs associated with storing a given physical commodity for a longer period. |
In seeking to track the performance of the Index, therefore, the Fund will be exposed to the effects of backwardation and contango when it rolls its positions in Index Contracts. The Index uses the Optimum YieldTM rolling methodology, which seeks to maximize the roll benefits in backwardated markets and to minimize the losses from rolling in contangoed markets. There can be no assurance that these outcomes will be obtained. The impact of backwardation and contango may also cause the Fund’s performance to vary from the returns of other price references, including the spot prices of one or more Index Commodities.
Index Risks
The Fund’s Performance May Not Always Replicate the Changes in the Levels of its Index.
Tracking the Index requires trading of the Fund’s portfolio with a view to tracking the Index over time and is dependent upon the skills of the Managing Owner and its trading principals, among other factors. It is possible that the Fund’s performance may not fully replicate the changes in closing levels of the Index due to disruptions in the markets for the relevant Index Commodities, the imposition of speculative position limits, or due to other extraordinary circumstances. The Managing Owner may determine to invest in other futures contracts if at any time it is impractical or inefficient to gain full or partial exposure to an Index Commodity through the use of Index Contracts. These other futures contracts may or may not be based on an Index Commodity. When they are not, the Managing Owner may seek to select futures contracts that it reasonably believes tend to exhibit trading prices that correlate with an Index Contract. As the Fund approaches or reaches position limits with respect to an Index Commodity, the Fund may commence investing in Index Contracts that reference other Index Commodities. In those circumstances, the Fund may also trade in futures contracts based on commodities other than Index Commodities that the Managing Owner reasonably believes tend to exhibit trading prices that correlate with an Index Contract. In addition, the Fund may not be able to replicate the changes in levels of the Index because the total return generated by the Fund is reduced by expenses and transaction costs, including those incurred in connection with the Fund’s trading activities, and increased by, as applicable, Treasury Income, Money Market Income andT-Bill ETF Income.
10
The Fund Is Not Actively Managed and Tracks the Index During Periods in Which the Index Is Flat or Declining as well as When the Index Is Rising.
The Fund is not actively managed on the basis of judgments relating to economic, financial and market conditions with a view to obtaining positive results under all market conditions. Instead, the Managing Owner seeks to cause the NAV to track the performance of the Index during periods in which the Index is flat or declining as well as when the Index is rising. Therefore, if positions in any one or more of the Index Commodities are declining in value, the Fund will not close out such positions, except in connection with a change in the composition or weighting of the Index.
Unusually LongPeak-to-Valley Drawdown Periods with Respect To the Index May Be Reflected in Equally LongPeak-to-Valley Drawdown Periods with Respect to the Performance of the Shares.
“Peak-to-valley drawdown” represents the cumulative percentage decline inmonth-end NAV per Share due to losses sustained during any period in which the initialmonth-end NAV per Share is not equaled or exceeded by a subsequentmonth-end NAV per Share.
Although past Index levels are not necessarily indicative of future Index levels, thepeak-to-valley drawdown periods that the Index has experienced have been unusually long and have lasted for multi-year drawdown periods.
Because it is expected that the Fund’s performance will track the change of its underlying Index, the Fund would experience a continuous drawdown during the period that the Index experiences such a drawdown. The value of your Shares will also decrease during such a period.
Regulatory Risks
Position Limits and Other Potential Limitations on Futures Trading May Restrict the Creation of Baskets and the Operation of the Fund.
Position Limits. CFTC and futures exchange rules impose position limits on market participants, including the Fund, trading in certain commodity futures contracts. These position limits prohibit any person from holding a position of more than a specific number of futures contracts. Generally, position limits in the physical delivery markets are set at a stricter level during the spot month, which is the month when the futures contract matures and becomes deliverable, versus the limits for any other month or for all months combined. Limits are generally applied on an aggregate basis to positions held in accounts that are subject to 10% or greater common ownership or control. There are exemptions from this general aggregation requirement.
The Index is composed of five Index Commodities, which are all subject to position limits imposed by the rules of the CFTC and/or futures exchanges on which the futures contracts for the applicable Index Commodities are traded. The CFTC has been seeking to amend its position limits rules for several years. In November 2013, the CFTC proposed for public comment new position limits and aggregation regulations. After a lengthy comment period on this proposal, the CFTCre-proposed, in December 2016, position limits for 25 commodity futures and options contracts, as well as for swaps that are economically equivalent to those contracts. In December 2016, the CFTC adopted rule amendments that provide exemptions from the general requirement to aggregate all positions that are held pursuant to 10% or greater common ownership or control.
The ultimate outcome of this rulemaking effort, and the resulting impact on the Fund of any final regulations that impose new or revised position limits, is unknown. It is also possible that futures exchanges may amend their existing position limits rules or adopt new requirements. In addition, the CFTC could separately implement other changes to specific position limits or to the regime as a whole. New or more restrictive position limits could reduce liquidity in the market, which would be likely to have adverse effects on the pricing of commodity futures contracts. Changes in CFTC and/or exchange-level position limits rules therefore could adversely affect the Fund’s ability to pursue its investment objective.
Position Aggregation. In general, a trader is required by CFTC or exchange rules, as applicable, to aggregate all positions in accounts as to which the trader has 10% or greater ownership or control. CFTC and exchange rules provide exemptions from this requirement. For example, a trader is not required to aggregate positions in multiple accounts that it owns or controls if that trader is able to satisfy the requirements of an exemption from aggregation of those accounts, including, where available, the independent account controller exemption.
Failure to comply with the independent account controller exemption or another exemption from the aggregation requirement could obligate the Managing Owner to aggregate positions in multiple accounts under its control, which could include the Fund and other commodity pools or accounts under the Managing Owner’s control. In such a scenario, the Fund may not be able to obtain exposure to one or more Index Contracts necessary to pursue its investment objective, or it may be required to liquidate existing Index Contract positions in order to comply with a limit. Such an outcome could adversely affect the Fund’s ability to pursue its investment objective or achieve favorable performance.
11
The CFTC amended its position aggregation rules in December 2016. The CFTC staff subsequently issued time-limitedno-action relief from compliance with certain requirements under the amended aggregation rules, including the general requirement to aggregate positions in the same commodity futures contracts traded pursuant to substantially identical trading strategies. Thisno-action relief expires on August 12, 2019.
Since coming into effect on January 3, 2018, Markets in Financial Instruments Directive II (“MiFID II”) requires the competent authorities of member states in the European Union (“EU”) to impose position limits on certain commodity derivatives contracts which are applicable to any person, whether or not based in the European Union. Pursuant to MiFID II, the UK’s regulatory agency, the Financial Conduct Authority (“FCA”), has established position limits applicable to aluminum, copper, lead, nickel, tin and zinc commodity derivative contracts traded on the London Metal Exchange (“LME”). LME may also impose accountability levels in certain contracts, where further directions in respect of those positions can then be required. If the Fund were to trade commodity derivatives contracts on other exchanges in the European Union, position limits may apply to such trading activity pursuant to MiFID II as implemented in the relevant national laws and regulations of member states. The United Kingdom (“UK”) will cease to be a member state of the EU on March 29, 2019. The EU and UK have agreed on a transitional period until December 31, 2020 during which the UK would remain subject to EU law and reciprocal rights of market access. However, that agreement is political and not yet legally binding. In the event the UK exits the EU without a transitional period, the UK commodity trading venues would immediately have more potential flexibility in setting position limits than is the case under MiFID II. In the event a transitional period is agreed then the status quo under MiFID II would continue until the end of that period. In addition, unless the EU agrees otherwise and subject to the possibility of such a transitional period, after the UK exits the EU any UK firm that was trading derivatives in EU markets will no longer be able to use its MiFID II passport to do so and instead would need to look to any MiFID II third country regime to access the EU market or establish a MiFID II compliant EU branch or subsidiary. The potential loss of MiFID II passports byUK-based firms through which the Fund trades derivatives in EU markets could adversely affect the Fund’s ability to continue doing so absent substitute arrangements for continued access to those markets.
Accountability Levels. Exchanges may establish accountability levels applicable to futures contracts instead of position limits. An exchange may order a person who holds or controls a position in excess of a position accountability level not to further increase its position, to comply with any prospective limit that exceeds the size of the position owned or controlled, or to reduce any open position that exceeds the position accountability level if the exchange determines that such action is necessary to maintain an orderly market. Position accountability levels could adversely affect the Fund’s ability to establish and maintain positions in commodity futures contracts to which such levels apply, if the Fund were to trade in such contracts. Such an outcome could adversely affect the Fund’s ability to pursue its investment objective.
Daily Limits. U.S. futures exchanges and some foreign exchanges have regulations that limit the amount of fluctuation in futures contract prices that may occur during a single business day. These limits are generally referred to as “daily price fluctuation limits” or “daily limits,” and the maximum or minimum price of a contract on any given day as a result of these limits is referred to as a “limit price”. Once a limit price has been reached in a particular contract, it is usually the case that no trades may be made at a different price than specified in the limit. The duration of limit prices generally varies. Limit prices may have the effect of precluding the Fund from trading in a particular contract or requiring the Fund to liquidate contracts at disadvantageous times or prices. Either of those outcomes could adversely affect the Fund’s ability to pursue its investment objective.
Potential Effects of Positions Limits, Accountability Levels, and Daily Limits. The Fund is currently subject to position limits and may be subject to new and more restrictive position limits in the future. If the Fund reached a position limit or accountability level or became subject to a daily limit, its ability to issue new Baskets or reinvest income in additional commodity futures contracts may be limited to the extent these restrictions limit its ability to establish new futures positions, add to existing positions, or otherwise transact in futures. Limiting the size of the Fund, or restricting the Fund’s futures trading, under these requirements could adversely affect the Fund’s ability to pursue its investment objective.
Failure of Futures Commission Merchants or Commodity Brokers to Segregate Assets May Cause Losses for the Fund.
The Commodity Exchange Act requires a futures commission merchant to segregate all funds received from customers from such futures commission merchant’s proprietary assets. If the Commodity Broker fails to segregate customer assets as required, the assets of the Fund might not be fully protected in the event of the Commodity Broker’s bankruptcy. Furthermore, in the event of the Commodity Broker’s bankruptcy, the Fund could be limited to recovering either apro ratashare of all available funds segregated on behalf of the Commodity Broker’s combined customer accounts or the Fund may not recover any assets at all, even though certain property specifically traceable to the Fund was held by the Commodity Broker.
The Commodity Exchange Act requires an approved derivatives clearing organization to segregate all funds and other property received from a clearing member’s customers in connection with U.S. futures and options contracts from any funds held at the clearing organization to support the clearing member’s proprietary trading. Nevertheless, customer funds held at a clearing organization in connection with any futures or options contracts may be held in a commingled omnibus account, which may not identify the name of the clearing member’s individual customers. With respect to futures and options contracts, a clearing organization may use assets of a
12
non-defaulting customer held in an omnibus account at the clearing organization to satisfy payment obligations of a defaulting customer of the clearing member to the clearing organization. In the event of a default of the clearing futures commission merchant’s other clients or the clearing futures commission merchant’s failure to extend its own funds in connection with any such default, a customer may not be able to recover the full amount of assets deposited by the clearing futures commission merchant with the clearing organization on the customer’s behalf.
In the event of a bankruptcy or insolvency of any exchange or a clearing house, the Fund could experience a loss of the funds deposited through the Commodity Broker as margin with the exchange or clearing house, a loss of any unrealized profits on its open positions on the exchange, and the loss of unrealized profits on its closed positions on the exchange.
Regulatory Changes or Actions May Alter the Operations and Profitability of the Fund
The regulation of commodity interest transactions and markets, including under the Dodd-Frank Act, is a rapidly changing area of law and is subject to ongoing modification by governmental and judicial action. In particular, the Dodd-Frank Act has expanded the regulation of markets, market participants and financial instruments. The regulatory regime under the Dodd-Frank Act has imposed additional compliance and legal burdens on participants in the markets for futures and other commodity interests. For example, under the Dodd-Frank Act new capital and risk requirements have been imposed on market intermediaries. Those requirements may cause the cost of trading to increase for market participants, like the Fund, that must interact with those intermediaries to carry out their trading activities. These increased costs can detract from the Fund’s performance.
The Fund and the Managing Owner Are Subject to Extensive Legal and Regulatory Requirements.
The Fund is subject to a comprehensive scheme of regulation under the federal commodity futures trading and securities laws, as well as futures market rules and the rules and listing standards for its Shares. The Fund and the Managing Owner could each be subject to sanctions for a failure to comply with those requirements, which could adversely affect the Fund’s financial performance and its ability to pursue its investment objective.
In addition, the Fund is subject to significant disclosure, internal control, governance, and financial reporting requirements because the Shares are publicly traded.
For example, the Fund is responsible for establishing and maintaining internal controls over financial reporting. Under this requirement, the Fund must adopt, implement and maintain an internal control system designed to provide reasonable assurance to its management regarding the preparation and fair presentation of published financial statements. The Fund is also required to adopt, implement, and maintain disclosure controls and procedures that are designed to ensure information required to be disclosed by the Fund in reports that it files or submits to the SEC is recorded, processed, summarized and reported within the time periods specified by the SEC. There is a risk that the Fund’s internal controls over financial reporting and disclosure controls and procedures could fail to work properly or otherwise fail to satisfy SEC requirements. Such a failure could result in the reporting or disclosure of incorrect information or a failure to report information on a timely basis. Such a failure could be to the disadvantage of Shareholders and could expose the Fund to penalties or otherwise adversely affect the Fund’s status under the federal securities laws and SEC regulations.
All internal control systems, no matter how well designed, have inherent limitations. Therefore, even those systems determined to be effective may provide only reasonable assurance with respect to financial statement preparation and presentation and other disclosure matters.
Current Discussions between the SEC and PricewaterhouseCoopers LLP regarding PricewaterhouseCoopers LLP’s Independence Could Have Potentially Adverse Consequences for the Fund.
PricewaterhouseCoopers LLP informed the Fund that it has identified an issue related to its independence under Rule2-01(c)(1)(ii)(A) of RegulationS-X (referred to as the Loan Rule). The Loan Rule prohibits accounting firms, such as PricewaterhouseCoopers LLP, from being deemed independent if they have certain financial relationships with their audit clients or certain affiliates of those clients. The Fund is required under various securities laws to have its financial statements audited by an independent accounting firm.
The Loan Rule specifically provides that an accounting firm would not be independent if it or certain affiliates and covered persons receive a loan from a lender that is a record or beneficial owner of more than ten percent of an audit client’s equity securities (referred to as a “more than ten percent owner”). For purposes of the Loan Rule, audit clients include the Fund as well as all registered investment companies advised by the Managing Owner and its affiliates, including other subsidiaries of the Managing Owner’s parent company, Invesco Ltd. (collectively, the “Invesco Fund Complex”). PricewaterhouseCoopers LLP informed the Fund it and certain affiliates and covered persons have relationships with lenders who hold, as record owner, more than ten percent of the shares of certain funds within the Invesco Fund Complex, which may implicate the Loan Rule.
13
On June 20, 2016, the SEC Staff issued a“no-action” letter to another mutual fund complex (see Fidelity Management & Research Company et al.,No-Action Letter) related to the audit independence issue described above. In that letter, the SEC confirmed that it would not recommend enforcement action against a fund that relied on audit services performed by an audit firm that was not in compliance with the Loan Rule in certain specified circumstances. On May 2, 2018, the SEC proposed amendments to the Loan Rule that, if adopted as proposed, would address many of the issues that led to issuance of theno-action letter. In connection with prior independence determinations, PricewaterhouseCoopers LLP communicated, as contemplated by theno-action letter, that it believes that it remains objective and impartial and that a reasonable investor possessing all the facts would conclude that PricewaterhouseCoopers LLP is able to exhibit the requisite objectivity and impartiality to report on the Fund’s financial statements as the independent registered public accounting firm. PricewaterhouseCoopers LLP also represented that it has complied with PCAOB Rule 3526(b)(1) and (2), which are conditions to the Funds relying on the no action letter, and affirmed that it is an independent accountant within the meaning of PCAOB Rule 3520. Therefore, the Managing Owner, the Fund and PricewaterhouseCoopers LLP concluded that PricewaterhouseCoopers LLP could continue as the Fund’s independent registered public accounting firm. The Invesco Fund Complex relied upon theno-action letter in reaching this conclusion.
If in the future the independence of PricewaterhouseCoopers LLP is called into question under the Loan Rule by circumstances that are not addressed in the SEC’sno-action letter, the Fund will need to take other action in order for the Fund’s filings with the SEC containing financial statements to be deemed compliant with applicable securities laws. Such additional actions could result in additional costs, impair the ability of the Fund to issue new shares or have other material adverse effects on the Fund. The SECno-action relief was initially set to expire eighteen (18) months from issuance but has been extended by the SEC without an expiration date, except that theno-action letter will be withdrawn upon the effectiveness of any amendments to the Loan Rule designed to address the concerns expressed in the letter.
Tax Risks
Shareholders Will Be Subject to Taxation on Their Allocable Share of the Fund’s Taxable Income, Whether or Not They Receive Cash Distributions.
Shareholders will be subject to U.S. federal income taxation and, in some cases, state, local, or foreign income taxation on their allocable share of the Fund’s taxable income, whether or not they receive cash distributions from the Fund. Shareholders may not receive cash distributions equal to their share of the Fund’s taxable income or even the tax liability that results from such income.
Items of Income, Gain, Loss and Deduction with Respect to Shares Could Be Reallocated if the IRS Does Not Accept the Assumptions or Conventions Used by the Fund in Allocating Such Items.
U.S. federal income tax rules applicable to partnerships are complex and often difficult to apply to publicly traded partnerships. The Fund will apply certain assumptions and conventions in an attempt to comply with applicable rules and to report items of income, gain, loss and deduction to Shareholders in a manner that reflects the Shareholders’ beneficial interest in such tax items, but these assumptions and conventions may not be in compliance with all aspects of the applicable tax requirements. It is possible that the United States Internal Revenue Service (the “IRS”) will successfully assert that the conventions and assumptions used by the Fund do not satisfy the technical requirements of the Internal Revenue Code of 1986, as amended (the “Code”) and/or the Federal Tax Regulations codified under 26 C.F.R., referred to herein as the Treasury Regulations, and could require that items of income, gain, loss and deduction be adjusted or reallocated in a manner that adversely affects one or more Shareholders.
The Fund is a partnership, which is not subject to U.S. federal income taxes. Rather, the partnership’s taxable income flows through to the owners, who are responsible for paying the applicable income taxes on the income allocated to them. For tax years beginning on or after January 1, 2018, the Fund is subject to partnership audit rules enacted as part of the Bipartisan Budget Act of 2015 (the “Centralized Partnership Audit Regime”). Under the Centralized Partnership Audit Regime, any IRS audit of the Fund would be conducted at the Fund level, and if the IRS determines an adjustment, the default rule is that the Fund would pay an “imputed underpayment” including interest and penalties, if applicable. The Fund may instead elect to make a“push-out” election, in which case the shareholders for the year that is under audit would be required to take into account the adjustments on their own personal income tax returns.
The Tax Cuts and Jobs Act (the “Tax Act”) Makes Significant Changes to U.S. Federal Income Tax Rules.
The Tax Act makes significant changes to the U.S. federal income tax rules for taxation of individuals and corporations, generally effective for taxable years beginning after December 31, 2017. Most of the changes applicable to individuals are temporary and would apply only to taxable years beginning after December 31, 2017 and before January 1, 2026. In particular for individuals, the Tax Act establishes for taxable years beginning after December 31, 2017 and before January 1, 2026 a 20% deduction for “qualified publicly traded partnership income” within the meaning of new Section 199A(e)(5) of the Code. In general, “qualified publicly traded partnership income” for this purpose is an item of income, gain, deduction or loss that is effectively connected with a United States trade or business and includable income for the year, but does not include certain investment income. It is currently not expected that the Fund’s income will be eligible for such deduction because, as discussed below, although the matter is not free from doubt, the Fund believes that the activities directly conducted by the Fund will not result in the Fund being engaged in a trade or business within the United States. Potential investors should consult their tax advisors regarding the availability of such deduction for their allocable share of the Fund’s items of income, gain, deduction and loss.
14
PROSPECTIVE INVESTORS ARE STRONGLY URGED TO CONSULT THEIR OWN TAX ADVISORS AND COUNSEL WITH RESPECT TO THE POSSIBLE TAX CONSEQUENCES TO THEM OF AN INVESTMENT IN THE SHARES; SUCH TAX CONSEQUENCES MAY DIFFER WITH RESPECT TO DIFFERENT INVESTORS.
Other Risks
An Insolvency Resulting From Another Series in the Trust or the Trust Itself May Have a Material Adverse Effect On the Fund.
The Fund is a series or a part of a Delaware statutory trust. Pursuant to Delaware law, the organization of the Trust provides that the assets and liabilities of the Fund are separate from the assets and liabilities of all other series of the Trust, as well as the larger Trust itself. Though such organization may, under state law, protect the assets of the Fund in an insolvency action brought by the creditors of another series of the Trust, this may be insufficient to protect the assets of the Fund from such creditors in an insolvency action in Federal court, or in a court in a foreign jurisdiction. Accordingly, an insolvency resulting from another series in the Trust or the Trust itself may have a material adverse effect on the Fund. The material risks associated with the other series have not been included in this Report.
Disruptions in the Ability to Create and Redeem Baskets May Adversely Affect Investors.
It is generally expected that the public trading price per Share will track the NAV per Share closely over time. The relationship between the public trading price per Share and the NAV per Share depends, to a considerable degree, on the ability of Authorized Participants or their clients or customers to purchase and redeem Baskets in the ordinary course. If the process for creating or redeeming Shares is impaired for any reason, Authorized Participants and their clients or customers may not be able to purchase and redeem Baskets or, even if possible, may choose not to do so. The inability to purchase and redeem Baskets, or the partial impairment of the ability to purchase and redeem Baskets, could result in Shares trading at a premium or discount to the NAV of the Fund. Such a premium or discount could be significant, depending upon the nature or duration of the impairment
If the Fund were to issue all Shares that have been registered, it would not be able to create new Baskets until it registered additional Shares and those additional Shares became available for sale. An inability to create new Baskets could increase the possibility that the trading price per Share would not track closely the NAV per Share. In addition, the Fund may, in its discretion, suspend the creation of Baskets. Suspension of creations may adversely affect how the Shares are traded and could cause Shares to trade at a premium or discount to the NAV of the Fund, perhaps to a significant degree.
The Shares Could Decrease in Value if Unanticipated Operational or Trading Problems Arise.
The mechanisms and procedures governing the creation, redemption and offering of the Shares have been developed specifically for the Fund. Consequently, there may be unanticipated problems with respect to the mechanics of the operations of the Fund and the trading of the Shares that could have a material adverse effect on an investment in the Shares. To the extent that unanticipated operational or trading problems arise, the Managing Owner’s past experience and qualifications may not be suitable for solving those problems.
Historical Performance of the Fund and the Index Is Not Indicative of Future Performance.
Past performance of the Fund or the Index is not necessarily indicative of future results. Therefore, past performance of the Fund or the Index should not be relied upon in deciding whether to buy Shares of the Fund.
Fees and Expenses May Deplete the Fund’s Assets if the Fund’s Investment Performance Is Not Favorable.
The Fund pays fees and expenses regardless of its investment performance. Such fees and expenses include asset-based fees of 0.75% per annum. Additional charges include brokerage fees of approximately 0.03% per annum in the aggregate and selling commissions. Selling commissions are not included in the Fund’s breakeven calculation. The sum of the Fund’s Treasury Income, Money Market Income and/orT-Bill ETF Income may not exceed its fees and expenses. If such income does not exceed its fees and expenses, in order to break even, the Fund’s futures trading activity will need to have a favorable performance that exceeds the difference between the sum of the Fund’s Treasury Income, Money Market Income and/orT-Bill ETF Income and its fees and expenses. If the Fund’s futures trading performance is not sufficiently favorable, the Fund’s expenses could deplete its assets over time. In such a scenario, the value of your Shares will decrease.
There May Be Circumstances That Could Prevent the Fund from Being Operated in a Manner Consistent with its Investment Objective.
There may be circumstances outside the control of the Managing Owner and/or the Fund that make it, for all practical purposes, impossible tore-position the Fund and/or to process a purchase or redemption order. Examples of such circumstances include: natural disasters; public service disruptions or utility problems such as those caused by fires, floods, extreme weather conditions, and power outages resulting in telephone, telecopy, and computer failures; market conditions or activities causing trading halts; systems failures involving computer or other information systems affecting the aforementioned parties, as well as DTC, or any other participant in the purchase process, and similar extraordinary events. While the Managing Owner has established and implemented a disaster recovery plan, circumstances such as those identified above may prevent the Fund from being operated in a manner consistent with its investment objective.
15
Redemption Orders for Baskets May Be Subject to Postponement, Suspension or Rejection Under Certain Circumstances.
The Managing Owner may, in its discretion, suspend the right of redemption or postpone the redemption order settlement date with respect to Baskets for (1) any period during which an emergency exists as a result of which the redemption distribution is not reasonably practicable, or (2) such other period as the Managing Owner determines to be necessary for the protection of the Shareholders. In addition, the Fund will reject a redemption order if the order is not in proper form as described in the participant agreement with the Authorized Participant, or if the fulfillment of the order, in the opinion of the Fund’s counsel, might be unlawful. Any such postponement, suspension or rejection could adversely affect a redeeming Authorized Participant. For example, the resulting delay may adversely affect the value of the Authorized Participant’s redemption proceeds if the NAV of the Fund declines during the period of delay. The Fund disclaims any liability for any loss or damage that may result from any such suspension or postponement.
Shareholders Do Not Have the Protections Associated with Ownership of Shares in an Investment Company Registered Under the Investment Company Act of 1940.
The Fund is not registered as an investment company under the Investment Company Act of 1940, as amended. Consequently, Shareholders do not have the legal and regulatory protections provided to the investors in investment companies that are registered as such.
Shareholders Do Not Have the Rights Enjoyed by Investors in Certain Other Vehicles.
The Shares have none of the statutory rights normally associated with the ownership of shares of a corporation. However, under Delaware law, a beneficial owner of a business trust (such as a Shareholder) may, under certain circumstances, institute legal action on behalf of himself and all other similarly situated beneficial owners to recover damages from a third party where a managing owner has failed or refused to institute legal action on behalf of himself and all other similarly situated beneficial owners to recover damages from a managing owner for violations of fiduciary duties, or on behalf of a business trust to recover damages from a third party where a managing owner has failed or refused to institute proceedings to recover such damages. The Shares have limited voting and distribution rights (for example, Shareholders do not have the right to elect directors and the Fund is not required to pay regular distributions, although the Fund may pay distributions in the discretion of the Managing Owner).
Various Actual and Potential Conflicts of Interest May Be Detrimental to Shareholders.
The Fund is subject to actual and potential conflicts of interest involving the Managing Owner or any of its affiliates, the Commodity Broker, including its principals and its affiliates, the Index Sponsor and Marketing Agent, and Invesco Distributors. The Managing Owner and its principals, all of whom are engaged in other investment activities, are not required to devote substantially all of their time to the business of the Fund, which also presents the potential for numerous conflicts of interest with the Fund. The Managing Owner and its principals and affiliates are engaged in a broad array of asset management and financial services activities and may engage in activities during the ordinary course of business that cause their interests or those of their other clients to conflict with those of the Fund and its Shareholders.
As a result of these and other relationships, parties involved with the Fund have a financial incentive to act in a manner other than in the best interests of the Fund and the Shareholders. For example, by investing in affiliated money market mutual funds and/orT-Bill ETFs for margin and/or cash management purposes, the Managing Owner may select affiliated money market mutual funds and/orT-Bill ETFs that may pay dividends that are lower thannon-affiliated money market mutual funds and/orT-Bill ETFs. In addition, the Managing Owner would have a conflict of interest if it sought to redeem the Fund’s interest in an affiliated money market mutual fund orT-Bill ETF in circumstances when such a redemption would be unfavorable for the affiliated fund. The Managing Owner has not established any formal procedure to resolve conflicts of interest. Consequently, investors are dependent on the good faith of the respective parties subject to such conflicts to resolve them equitably. Although the Managing Owner attempts to monitor these conflicts, it is extremely difficult, if not impossible, for the Managing Owner to ensure that these conflicts do not, in fact, result in adverse consequences to the Fund and the Shareholders.
The Fund may be subject to certain conflicts with respect to the Commodity Broker, including, but not limited to, conflicts that result from receiving greater amounts of compensation from other clients, or purchasing opposite or competing positions on behalf of third party accounts traded through the Commodity Broker.
Because the Managing Owner and Invesco Distributors are affiliates, the Managing Owner has a disincentive to replace Invesco Distributors. Furthermore, the Managing Owner did not conduct an arm’s length negotiation when it retained Invesco Distributors.
16
Lack of Independent Advisers Representing Investors.
The Managing Owner has consulted with counsel, accountants and other advisers regarding the operation of the Fund. No counsel has been appointed to represent you in connection with the Fund’s continuous offering of Shares. Accordingly, you should consult your own legal, tax and financial advisers about whether you should invest in the Fund.
Possibility of Termination of the Fund May Adversely Affect Your Portfolio.
It is ultimately within the discretion of the Managing Owner whether it will continue to operate and advise the Fund. The Managing Owner may withdraw from the Fund upon 120 days’ prior written notice to all Shareholders and the Trustee, which would cause the Fund to terminate unless a substitute managing owner was obtained. Shareholders owning 50% or more of the Shares have the power to terminate the Fund. If it is so exercised, investors who may wish to continue to invest in a vehicle that tracks the Fund’s Index will have to find another vehicle, and may not be able to find another vehicle that offers the same features as the Fund. See “Description of the Shares; Certain Material Terms of the Trust Agreement – Termination Events” in the Fund’s Prospectus for a summary of termination events. Such detrimental developments could cause you to liquidate your investments and upset the overall maturity and timing of your investment portfolio. If the registrations with the CFTC or memberships in the NFA of the Managing Owner or the Commodity Broker were revoked or suspended, such entity would no longer be able to provide services to the Fund.
Competing Claims Over Ownership of Intellectual Property Rights Related to the Fund Could Adversely Affect the Fund and an Investment in the Shares.
While the Managing Owner believes that all intellectual property rights needed to operate the Fund in the manner described in the Fund’s Prospectus are either owned by or licensed to the Managing Owner or have been obtained, third parties may allege or assert ownership of intellectual property rights which may be related to the design, structure and operations of the Fund. To the extent any claims of such ownership are brought or any proceedings are instituted to assert such claims, the issuance of any restraining orders or injunctions, the negotiation, litigation or settlement of such claims, or the ultimate disposition of such claims in a court of law may adversely affect the Fund and an investment in the Shares. For example, such actions could result in expenses or damages payable by the Fund, suspension of activities or the termination of the Fund.
The Value of the Shares Will Be Adversely Affected if the Fund is Required to Indemnify the Trustee or the Managing Owner.
Under the Trust Agreement, the Trustee and the Managing Owner have the right to be indemnified for any liability or expense they incur, except for any expenses resulting from gross negligence or willful misconduct. That means the Managing Owner may require the assets of the Fund to be sold in order to cover losses or liability suffered by it or by the Trustee. Any sale of that kind would reduce the NAV of the Fund and, consequently, the value of the Shares.
Although the Shares Are Limited Liability Investments, Certain Circumstances such as Bankruptcy of the Fund or Indemnification of the Fund by the Shareholders Will Increase a Shareholder’s Liability.
The Shares are limited liability investments; investors may not lose more than the amount that they invest including any appreciation in their investments. However, Shareholders could be required, as a matter of bankruptcy law, to return to the estate of the Fund any distribution they received at a time when the Fund was in fact insolvent or in violation of the Trust Agreement. In addition, Shareholders agree in the Trust Agreement that they will indemnify the Fund for any harm suffered by it as a result of:
| • | Shareholders’ actions unrelated to the business of the Fund, or |
| • | taxes imposed on the Shares by the states or municipalities in which such investors reside. |
The Fund May Lose Money on Its Holdings of Money Market Mutual Funds.
The Fund may invest in government money market funds that have chosen to not rely on the ability to impose fees on shareholder redemptions, or liquidity fees, or temporarily to suspend redemption privileges, or gates, if the government money market fund’s weekly liquid assets fall below a certain threshold. Although such government money market funds seek to preserve the value of an investment at $1.00 per share, there is no guarantee that they will be able to do so. As a result, the Fund may lose money by investing in a government money market fund. An investment in a government money market fund is not insured or guaranteed by the Federal Deposit Insurance Corporation (“FDIC”) or any other government agency. The share price of a government money market fund can fall below the $1.00 share price. The Fund cannot rely on or expect a government money market fund’s adviser or its affiliates to enter into support agreements or take other actions to maintain the government money market fund’s $1.00 share price. The credit quality of a government money market fund’s holdings can change rapidly in certain markets, and the default of a single holding could have an adverse impact on the government money market fund’s share price. Due to fluctuations in interest rates, the market value of securities held by a government money market fund may vary. A government money market fund’s share price can also be negatively affected during periods of high redemption pressures and/or illiquid markets.
17
Due to the Increased Use of Technologies, Intentional and Unintentional Cyber Attacks Pose Operational and Information Security Risks.
With the increased use of technologies such as the Internet and the dependence on computer systems to perform necessary business functions, the Fund is susceptible to operational and information security risks. In general, cyber incidents can result from deliberate attacks or unintentional events. Cyber attacks include, but are not limited to gaining unauthorized access to digital systems for purposes of misappropriating assets or sensitive information, corrupting data, or causing operational disruption.
Cyber attacks may also be carried out in a manner that does not require gaining unauthorized access, such as causingdenial-of-service attacks on websites. Cyber security failures or breaches of the Fund’s third party service providers (including, but not limited to, the Index Sponsor, the Administrator and the Transfer Agent) or money market mutual funds andT-Bill ETFs in which the Fund invests, have the ability to cause disruptions and impact business operations, potentially resulting in financial losses, the inability of Shareholders or Authorized Participants to transact business in Shares and Baskets respectively, violations of applicable privacy and other laws, regulatory fines, penalties, reputational damage, reimbursement or other compensation costs, and/or additional compliance costs. In addition, substantial costs may be incurred in order to prevent any cyber incidents in the future. The Fund and its Shareholders could be negatively impacted as a result.
While the Managing Owner has established business continuity plans and systems reasonably designed to detect and prevent such cyber attacks from being effective, there are inherent limitations in such plans and systems. For instance, it is possible that certain existing risks have not been identified or that new risks will emerge before countervailing measures can be implemented. Furthermore, the Fund cannot control, or even necessarily influence, the cyber security plans and systems put in place by the Fund’s third party service providers. Since the Fund is dependent upon third party service providers (including the Managing Owner) for substantially all of its operational needs, the Fund is subject to the risk that a cyber attack on a service provider will materially impair its normal operations even if the Fund itself is not subject to such an attack. Cyber attacks may also cause disruptions to the futures exchanges and clearinghouses through which the Fund invests in futures contracts and to the exchanges on which the Fund buys and sells shares ofT-Bill ETFs, which could result in disruptions to the Fund’s ability to pursue its investment objective, resulting in financial losses to the Fund and Shareholders.
| ITEM 1B. | UNRESOLVED STAFF COMMENTS |
None.
| ITEM 2. | PROPERTIES |
The Fund does not own or use physical properties in the conduct of its business. Its assets consist of futures contracts, cash, United States Treasury Obligations and may consist of money market mutual funds and/orT-Bill ETFs. The Managing Owner’s headquarters are located at 3500 Lacey Road, Suite 700, Downers Grove, Illinois 60515.
| ITEM 3. | LEGAL PROCEEDINGS |
None.
| ITEM 4. | MINE SAFETY DISCLOSURES |
Not applicable.
18
| ITEM 5. | MARKET FOR REGISTRANT’S COMMON EQUITY, RELATED STOCKHOLDER MATTERS AND ISSUER PURCHASES OF EQUITY SECURITIES |
Market Information
The Shares have been trading on the NYSE Arca since November 25, 2008 under the symbol “DBE.”
Holders
As of January 31, 2019, the Fund had 81 holders of record of its Shares.
Sales of Unregistered Securities and Use of Proceeds of Registered Securities
(a) There have been no unregistered sales of the Shares. No Shares are authorized for issuance by the Fund under equity compensation plans.
(b) Not applicable.
(c) The following table summarizes the redemptions by Authorized Participants during the Three Months Ended December 31, 2018:
Period of Redemption | Total Number of Shares Redeemed | Average Price Paid per Share | ||||||
October 1, 2018 to October 31, 2018 | $ | — | $ | — | ||||
November 1, 2018 to November 30, 2018 | 1,800,000 | $ | 15.86 | |||||
December 1, 2018 to December 31, 2018 | 4,800,000 | $ | 13.74 | |||||
|
|
|
| |||||
Total | 6,600,000 | $ | 14.32 | |||||
|
|
|
| |||||
| ITEM 6. | SELECTED FINANCIAL DATA |
The following table summarizes the relevant 2018, 2017, 2016, 2015 and 2014 financial data for the Fund and should be read in conjunction with the Fund’s financial statements, and the notes and schedules related thereto, which are included in this Report.
| Years Ended December 31, | ||||||||||||||||||||
| 2018 | 2017 | 2016 | 2015 | 2014 | ||||||||||||||||
Income(a) | $ | 3,666,213 | $ | 1,171,847 | $ | 366,208 | $ | 45,510 | $ | 95,300 | ||||||||||
Net investment income (loss) | $ | 2,143,529 | $ | 74,129 | $ | (591,240 | ) | $ | (986,570 | ) | $ | (2,109,949 | ) | |||||||
Net realized and net change in unrealized gains/(losses) on United States Treasury Obligations, Affiliated Investments and Commodity Futures Contracts | $ | (25,841,321 | ) | $ | 6,117,958 | $ | 21,916,883 | $ | (50,201,994 | ) | $ | (118,512,765 | ) | |||||||
Net Income (Loss) | $ | (23,697,792 | ) | $ | 6,192,087 | $ | 21,325,643 | $ | (51,188,564 | ) | $ | (120,622,714 | ) | |||||||
Net Income (Loss) per Share | $ | (2.05 | ) | $ | 0.79 | $ | 2.65 | $ | (5.98 | ) | $ | (12.03 | ) | |||||||
Return of Capital Distributions General Share | $ | (0.21 | ) | $ | — | $ | — | $ | — | $ | — | |||||||||
Return of Capital Distributions per Share | $ | (0.21 | ) | $ | — | $ | — | $ | — | $ | — | |||||||||
Net increase (decrease) in cash | $ | (856,046 | ) | $ | 856,046 | $ | (2,554,013 | ) | $ | (45,018,069 | ) | $ | 44,458,101 | |||||||
| As of December 31, | ||||||||||||||||||||
| 2018 | 2017 | 2016 | 2015 | 2014 | ||||||||||||||||
Total Assets | $ | 92,751,616 | $ | 178,160,120 | $ | 193,340,798 | $ | 93,760,092 | $ | 142,530,081 | ||||||||||
General Shares NAV | $ | 12.33 | $ | 14.59 | $ | 13.80 | $ | 11.15 | $ | 17.13 | ||||||||||
Shares NAV | $ | 12.33 | $ | 14.59 | $ | 13.80 | $ | 11.15 | $ | 17.13 | ||||||||||
| (a) | Income for the year ended December 31, 2014 includes interest expense on overdraft balances. These amounts are included in Interest Expense for the years ended December 31, 2018, 2017, 2016 and 2015. |
19
Selected Quarterly Financial Data (Unaudited)
| For the Three Months Ended | ||||||||||||||||
| March 31, 2018 | June 30, 2018 | September 30, 2018 | December 31, 2018 | |||||||||||||
Income | $ | 558,997 | $ | 795,392 | $ | 1,283,276 | $ | 1,028,548 | ||||||||
Net investment income (loss) | $ | 230,111 | $ | 407,569 | $ | 850,209 | $ | 655,640 | ||||||||
Net realized and net change in unrealized gains/(losses) on United States Treasury Obligations, Affiliated Investments and Commodity Futures Contracts | $ | 7,726,921 | $ | 22,409,984 | $ | 11,334,697 | $ | (67,312,923 | ) | |||||||
Net Income (loss) | $ | 7,957,032 | $ | 22,817,553 | $ | 12,184,906 | $ | (66,657,283 | ) | |||||||
Increase (decrease) in Net Asset Value | $ | (897,567 | ) | $ | 48,550,629 | $ | 2,391,457 | $ | (136,877,713 | ) | ||||||
Net Income (loss) per Share(a) | $ | 0.68 | $ | 1.83 | $ | 1.00 | $ | (5.56 | ) | |||||||
Return of Capital Distributions per General Share(a) | $ | — | $ | — | $ | — | $ | (0.21 | ) | |||||||
Return of Capital Distributions per Share(a) | $ | — | $ | — | $ | — | $ | (0.21 | ) | |||||||
| (a) | The amount shown for a share outstanding for quarterly statements may not correlate with year to date amounts due to timing of subscriptions and redemptions in relation to income earned or distributed. |
| For the Three Months Ended | ||||||||||||||||
| March 31, 2017 | June 30, 2017 | September 30, 2017 | December 31, 2017 | |||||||||||||
Income | $ | 183,253 | $ | 186,572 | $ | 254,119 | $ | 547,903 | ||||||||
Net investment income (loss) | $ | (135,040 | ) | $ | (45,619 | ) | $ | 30,952 | $ | 223,836 | ||||||
Net realized and net change in unrealized gains/(losses) on United States Treasury Obligations, Affiliated Investments and Commodity Futures Contracts | $ | (16,050,200 | ) | $ | (11,826,620 | ) | $ | 12,360,175 | $ | 21,634,603 | ||||||
Net Income (loss) | $ | (16,185,240 | ) | $ | (11,872,239 | ) | $ | 12,391,127 | $ | 21,858,439 | ||||||
Increase (decrease) in Net Asset Value | $ | (47,207,977 | ) | $ | (46,302,711 | ) | $ | 47,135,310 | $ | 31,209,580 | ||||||
Net Income (loss) per Share(a) | $ | (1.21 | ) | $ | (1.00 | ) | $ | 1.29 | $ | 1.71 | ||||||
| (a) | The amount shown for a share outstanding for quarterly statements may not correlate with year to date amounts due to timing of subscriptions and redemptions in relation to income earned or distributed. |
20
| ITEM 7. | MANAGEMENT’S DISCUSSION AND ANALYSIS OF FINANCIAL CONDITION AND RESULTS OF OPERATIONS |
This information should be read in conjunction with the financial statements and notes included in Item 8 of Part II of this Report. The discussion and analysis which follows may contain trend analysis and other forward-looking statements. See “Cautionary Statement Concerning Forward-Looking Information” above.
You should not place undue reliance on any forward-looking statements. Except as expressly required by the Federal securities laws, the Fund and the Managing Owner undertake no obligation to publicly update or revise any forward-looking statements or the risks, uncertainties or other factors described in this Report, as a result of new information, future events or changed circumstances or for any other reason after the date of this Report.
Overview/Introduction
Invesco Capital Management LLC (“Invesco”) has served as the managing owner (the “Managing Owner”), commodity pool operator and commodity trading advisor of the Trust and the Fund since February 23, 2015. The Managing Owner is registered with the Commodity Futures Trading Commission (the “CFTC”) as a commodity pool operator and a commodity trading advisor, and it is a member firm of the National Futures Association (“NFA”).
The Fund seeks to track changes, whether positive or negative, in the level of the DBIQ Optimum Yield Energy Index Excess Return™ (the “Index”) over time, plus the excess, if any, of the sum of the Fund’s interest income from its holdings of United States Treasury Obligations (“Treasury Income”), dividends from its holdings in money market mutual funds (affiliated or otherwise) (“Money Market Income”) and dividends or distributions of capital gains from its holdings ofT-Bill ETFs (as defined below)(“T-Bill ETF Income”) over the expenses of the Fund. The Fund invests in futures contracts in an attempt to track its Index. The Index is intended to reflect the change in market value of the energy sector. The commodities comprising the Index are Light Sweet Crude Oil, Ultra Low Sulphur Diesel (also commonly known as Heating Oil), Brent Crude Oil, RBOB Gasoline and Natural Gas (each, an “Index Commodity,” and collectively, the “Index Commodities”).
The Fund may invest directly in United States Treasury Obligations. The Fund may also gain exposure to United States Treasury Obligations through investments in exchange-traded funds (“ETFs”) (affiliated or otherwise) that track indexes that measure the performance of United States Treasury Obligations with a maximum remaining maturity of up to 12 months(“T-Bill ETFs”). The Fund invests in United States Treasury Obligations, money market mutual funds andT-Bill ETFs (affiliated or otherwise), if any, for margin and/or cash management purposes.
The Fund pursues its investment objective by investing in a portfolio of exchange-traded commodity futures contracts that expire in a specific month and trade on a specific exchange (the “Index Contracts”) in the Index Commodities. The Fund also holds United States Treasury Obligations andT-Bill ETFs, if any, for deposit with Morgan Stanley & Co. LLC, the Fund’s commodity broker (the “Commodity Broker”) as margin, to the extent permissible under CFTC rules and United States Treasury Obligations, cash, money market mutual funds andT-Bill ETFs (affiliated or otherwise), if any, on deposit with The Bank of New York Mellon (the “Custodian”), for cash management purposes. The aggregate notional value of the commodity futures contracts owned by the Fund is expected to approximate the aggregate net asset value (“NAV”) of the Fund, as opposed to the aggregate Index value.
The CFTC and certain futures exchanges impose position limits on futures contracts, including on Index Contracts. As the Fund approaches or reaches position limits with respect to an Index Commodity, the Fund may commence investing in Index Contracts that reference other Index Commodities. In those circumstances, the Fund may also trade in futures contracts based on commodities other than Index Commodities that the Managing Owner reasonably believes tend to exhibit trading prices that correlate with an Index Contract. In addition, the Managing Owner may determine to invest in other futures contracts if at any time it is impractical or inefficient to gain full or partial exposure to an Index Commodity through the use of Index Contracts. These other futures contracts may or may not be based on an Index Commodity. When they are not, the Managing Owner may seek to select futures contracts that it reasonably believes tend to exhibit trading prices that correlate with an Index Contract.
The Shares are intended to provide investment results that generally correspond to the changes, positive or negative, in the levels of the Index over time. The value of the Shares is expected to fluctuate in relation to changes in the value of the Fund’s portfolio. The market price of the Shares may not be identical to the NAV per Share, but these two valuations are expected to be very close.
Margin Calls
“Initial” or “original” margin is the minimum amount of funds that must be deposited by a futures trader with his commodity broker in order to initiate futures trading or to maintain an open position in futures contracts. “Maintenance” margin is the amount (generally less than initial margin) to which a trader’s account may decline before he must deliver additional margin. A margin deposit is like a cash performance bond. It helps assure the futures trader’s performance of the futures contract that the trader
21
purchases or sells. Futures contracts are customarily bought and sold on margin that represents a very small percentage (ranging upward from less than 2%) of the purchase price of the underlying commodity being traded. Because of such low margins, price fluctuations occurring in the futures markets may create profits and losses that are greater, in relation to the amount invested, than are customary in other forms of investments. The minimum amount of margin required in connection with a particular futures contract is set from time to time by the exchange on which such contract is traded, and may be modified from time to time by the exchange during the term of the contract. “Variation margin” is assessed daily to reflect changes in the value of the position.
Brokerage firms carrying accounts for traders in futures contracts may not accept lower, and generally require higher, amounts of margin as a matter of policy in order to afford further protection for themselves.
Margin requirements are computed each day by a commodity broker. When the market value of a particular open futures contract position changes to a point where the margin on deposit does not satisfy maintenance margin requirements, a margin call is made by the commodity broker. If the margin call is not met within a reasonable time, the broker may close out the Fund’s position. With respect to the Managing Owner’s trading, only the Managing Owner, and not the Fund or its Shareholders personally, will be subject to margin calls.
Position Limits and/or Accountability Levels
The Fund has not reached position limits with respect to the 2018, 2017 and 2016 reporting periods.
Net Asset Value
NAV means the total assets of the Fund, including, but not limited to, all commodity futures contracts, cash and investments less total liabilities of the Fund, each determined on the basis of U.S. generally accepted accounting principles (“U.S. GAAP”), consistently applied under the accrual method of accounting. All open commodity futures contracts will be calculated at their then current market value, which will be based upon the settlement price for that particular commodity futures contract traded on the applicable primary exchange on the date with respect to which NAV is being determined. Securities for which market quotations are not readily available or became unreliable are valued at fair value as determined in good faith following procedures approved by the Managing Owner. The amount of any distribution is a liability of the Fund from the day when the distribution is declared until it is paid.
NAV per Share is the NAV of the Fund divided by the number of outstanding Shares.
Market Risk
Trading in futures contracts involves the Fund entering into contractual commitments to purchase a particular commodity at a specified date and price. The market risk associated with the Fund’s commitments to purchase commodities is limited to the gross or face amount of the contracts held.
The Fund’s exposure to market risk is also influenced by a number of factors including the volatility of interest rates and foreign currency exchange rates, the liquidity of the markets in which the contracts are traded and the relationships among the contracts held. The inherent uncertainty of the Fund’s trading as well as the development of drastic market occurrences could ultimately lead to a loss of all or substantially all of the investors’ capital.
Credit Risk
When the Fund enters into futures contracts, the Fund is exposed to credit risk that the counterparty to the contract will not meet its obligations. The counterparty for futures contracts traded on United States and on most foreign futures exchanges is the clearing house associated with the particular exchange. In general, clearing houses are backed by their corporate members who may be required to share in the financial burden resulting from the nonperformance by one of their members and, as such, is designed to disperse and mitigate the credit risk posed by any other one member. In cases where the clearing house is not backed by the clearing members (i.e., some foreign exchanges), it may be backed by a consortium of banks or other financial institutions. There can be no assurance that any counterparty, clearing member or clearinghouse will meet its obligations to the Fund.
The Commodity Broker, when acting as the Fund’s futures commission merchant in accepting orders for the purchase or sale of domestic futures contracts, is required by CFTC regulations to separately account for and segregate as belonging to the Fund all assets of the Fund relating to domestic futures trading. The Commodity Broker is not allowed to commingle such assets with other assets of the Commodity Broker. In addition, CFTC regulations also require the Commodity Broker to hold in a secure account assets of the Fund related to foreign futures trading. While these legal requirements are designed to protect the customers of futures commission merchants, a failure by the Commodity Broker to comply with those requirements would be likely to have a material adverse effect on the Fund in the event that the Commodity Broker became insolvent or suffered other financial distress.
22
Liquidity
The Fund’s entire source of capital is derived from the Fund’s offering of Shares to Authorized Participants. The Fund in turn allocates its net assets to commodity futures trading. A significant portion of the NAV is held in United States Treasury Obligations, which may be used as margin for the Fund’s trading in commodity futures contracts and United States Treasury Obligations, money market mutual funds, cash andT-Bill ETFs, if any, which may be used for cash management purposes. The percentage that United States Treasury Obligations bear to the total net assets will vary from period to period as the market values of the Fund’s commodity interests change. A portion of the Fund’s United States Treasury Obligations are held for deposit with the Commodity Broker to meet margin requirements. All remaining cash, money market mutual funds,T-Bill ETFs, if any, and United States Treasury Obligations are on deposit with the Custodian. Interest earned on the Fund’s interest-bearing funds and dividends from the Fund’s holdings of money market mutual funds are paid to the Fund. Any dividends or distributions of capital gains received from the Fund’s holdings ofT-Bill ETFs, if any, are paid to the Fund.
The Fund’s commodity futures contracts may be subject to periods of illiquidity because of market conditions, regulatory considerations or for other reasons. For example, commodity exchanges generally have the ability to limit fluctuations in certain commodity futures contract prices during a single day by regulations referred to as “daily limits.” During a single day, no trades may be executed at prices beyond the daily limit. Once the price of a particular futures contract for a particular commodity has increased or decreased by an amount equal to the daily limit, positions in the commodity futures contract can neither be taken nor liquidated unless the traders are willing to effect trades at or within the limit. Commodity futures prices have occasionally moved the daily limit for several consecutive days with little or no trading. Such market conditions could prevent the Fund from promptly liquidating its commodity futures positions.
Because the Fund trades futures contracts, its capital is at risk due to changes in the value of futures contracts (market risk) or the inability of counterparties (including the Commodity Broker and/or exchange clearinghouses) to perform under the terms of the contracts (credit risk).
On any business day, an Authorized Participant may place an order with the Transfer Agent to redeem one or more Baskets. Redemption orders must be placed by 10:00 a.m., Eastern Time. The day on which the Managing Owner receives a valid redemption order is the redemption order date. The day on which a redemption order is settled is the redemption order settlement date. As provided below, the redemption order settlement date may occur up to two business days after the redemption order date. Redemption orders are irrevocable. The redemption procedures allow Authorized Participants to redeem Baskets. Individual Shareholders may not redeem directly from the Fund. Instead, individual Shareholders may only redeem Shares in integral multiples of 200,000 and only through an Authorized Participant.
Unless otherwise agreed to by the Managing Owner and the Authorized Participant as provided in the next sentence, by placing a redemption order, an Authorized Participant agrees to deliver the Baskets to be redeemed through DTC’s book-entry system to the Fund no later than the redemption order settlement date as of 2:45 p.m., Eastern Time, on the business day immediately following the redemption order date. Upon submission of a redemption order, the Authorized Participant may request the Managing Owner to agree to a redemption order settlement date up to two business days after the redemption order date. By placing a redemption order, and prior to receipt of the redemption proceeds, an Authorized Participant’s DTC account is charged thenon-refundable transaction fee due for the redemption order.
Redemption orders may be placed either (i) through the Continuous Net Settlement (“CNS”) clearing processes of the National Securities Clearing Corporation (the “NSCC”) (the “CNS Clearing Process”) or (ii) if outside the CNS Clearing Process, only through the facilities of The Depository Trust Company (“DTC” or the “Depository”) (the “DTC Process”), or a successor depository, and only in exchange for cash. By placing a redemption order, and prior to receipt of the redemption proceeds, an Authorized Participant’s DTC account is charged thenon-refundable transaction fee due for the redemption order and such fee is not borne by the Fund.
Capital Resources
The Fund does not have any material commitments for capital expenditures as of the end of the latest fiscal period.
The Fund is unaware of any (i) anticipated known demands, commitments or capital expenditures; (ii) material trends, favorable or unfavorable, in its capital resources; or (iii) trends or uncertainties that will have a material effect on operations.
Cash Flows
A primary cash flow activity of the Fund is to raise capital from Authorized Participants through the issuance of Shares. This cash is used to invest in United States Treasury Obligations, money market mutual funds andT-Bill ETFs, if any, and to meet margin requirements as a result of the positions taken in futures contracts to match the fluctuations of the Index the Fund is tracking.
23
As of the date of this Report, each of Bank of America Merrill Lynch, BMO Capital Markets Corp., BNP Paribas Securities Corp, Cantor Fitzgerald & Co., Citadel Securities LLC, Citigroup Global Markets, Credit Suisse Securities (USA) LLC, Deutsche Investment Management Americas Inc., Goldman Sachs & Co., Goldman Sachs Execution & Clearing LP, Interactive Brokers LLC, Jefferies LLC, JP Morgan Securities Inc., Knight Clearing Services LLC, Merrill Lynch Professional Clearing Corp, Morgan Stanley & Co. LLC, Nomura Securities International Inc., RBC Capital Markets LLC, SG Americas Securities LLC, Timber Hill LLC, UBS Securities, Virtu Financial BD LLC and Virtu Financial Capital Markets LLC has executed a Participant Agreement and are the only Authorized Participants.
Operating Activities
Net cash flow provided by (used for) operating activities was $60.9 million, $22.2 million and $(80.8) million for the years ended December 31, 2018, 2017 and 2016, respectively. These amounts primarily include net income (loss), net purchases and sales of money market mutual funds and net purchases and sales of United States Treasury Obligations and affiliated investments. The Fund invests in futures contracts in an attempt to track its Index. The Fund invests in United States Treasury Obligations, money market mutual funds andT-Bill ETFs (affiliated or otherwise), if any, for margin and/or cash management purposes only.
During the year ended December 31, 2018, $449.5 million was paid to purchase United States Treasury Obligations and $527.7 million was received from sales and maturing United States Treasury Obligations. During the year ended December 31, 2017, $415.9 million was paid to purchase United States Treasury Obligations and $457.9 million was received from sales and maturing United States Treasury Obligations. During the year ended December 31, 2016, $547.5 million was paid to purchase United States Treasury Obligations and $453.7 million was received from sales and maturing United States Treasury Obligations. $340.1 million was received from sales of affiliated investments and $331.7 million was paid to purchase affiliated investments during the year ended December 31, 2018. $327.8 million was received from sales of affiliated investments and $351.7 million was paid to purchase affiliated investments during the year ended December 31, 2017. $138.4 million was received from sales of affiliated investments and $147.8 million was paid to purchase affiliated investments during the year ended December 31, 2016.
Financing Activities
The Fund’s net cash flow provided by (used for) financing activities was $(61.8) million, $(21.4) million and $78.2 million during the years ended December 31, 2018, 2017 and 2016, respectively. This included $87.5 million, $118.0 million and $219.2 million from the sale of Shares to Authorized Participants and $149.0 million, $139.4 million and $141.0 million from Shares redeemed by Authorized Participants during the years ended December 31, 2018, 2017 and 2016, respectively. Payable for amount due to the Custodian increased (decreased) by $1.4 million, $(0.0) million and $0.0 million and during the years ended December 31, 2018, 2017 and 2016, respectively. During the year ended December 31, 2018, distributions paid to Shareholders were $1.7 million. There were no distributions paid to Shareholders during the years ended December 31, 2017 and 2016.
Results of Operations
FOR THE YEARS ENDED DECEMBER 31, 2018, 2017 AND 2016
The following graphs illustrate the percentage changes in (i) the market price of the Shares (as reflected by the line “Market”), (ii) the Fund’s NAV (as reflected by the line “NAV”), and (iii) the closing levels of the Index (as reflected by the line “DBIQ Opt Yield Energy Index ER”). Whenever the Treasury Income, Money Market Income andT-Bill ETF Income, if any, earned by the Fund exceeds Fund expenses, the price of the Shares generally exceeds the level of the Index primarily because the Share price reflects Treasury Income, Money Market Income andT-Bill ETF Income, if any, from the Fund’s collateral holdings whereas the Index does not consider such income. There can be no assurances that the price of the Shares or the Fund’s NAV will exceed the Index levels.
No representation is being made that the Index will or is likely to achieve closing levels consistent with or similar to those set forth herein. Similarly, no representation is being made that the Fund will generate profits or losses similar to the Fund’s past performance or changes in the Index closing levels.
24
COMPARISON OF MARKET, NAV AND DBIQ OPT YIELD ENERGY INDEX ER
FOR THE YEARS ENDED DECEMBER 31, 2018, 2017 AND 2016
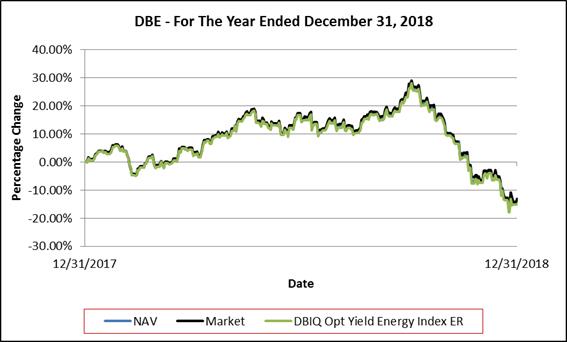
NEITHER THE PAST PERFORMANCE OF THE FUND NOR THE PRIOR INDEX LEVELS AND CHANGES,
POSITIVE OR NEGATIVE, SHOULD BE TAKEN AS AN INDICATION OF THE FUND’S FUTURE PERFORMANCE.
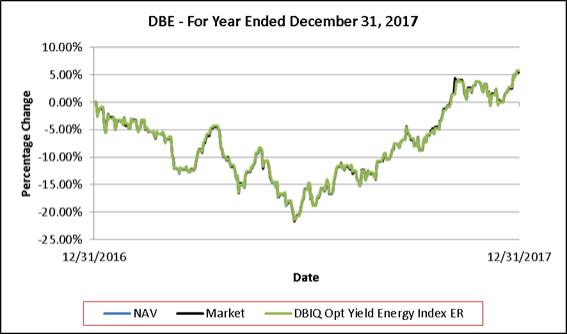
NEITHER THE PAST PERFORMANCE OF THE FUND NOR THE PRIOR INDEX LEVELS AND CHANGES,
POSITIVE OR NEGATIVE, SHOULD BE TAKEN AS AN INDICATION OF THE FUND’S FUTURE PERFORMANCE.
25
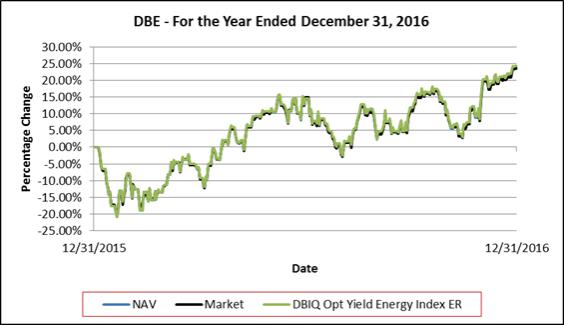
NEITHER THE PAST PERFORMANCE OF THE FUND NOR THE PRIOR INDEX LEVELS AND CHANGES,
POSITIVE OR NEGATIVE, SHOULD BE TAKEN AS AN INDICATION OF THE FUND’S FUTURE PERFORMANCE.
Performance Summary
This Report covers the years ended December 31, 2018, 2017 and 2016.
Past performance of the Fund is not necessarily indicative of future performance.
The Index is intended to reflect the change in market value of the Index Commodities. In turn, the Index is intended to reflect the energy sector. Past Index results are not necessarily indicative of future changes, positive or negative, in the Index closing levels. The DBIQ Optimum Yield Energy Index Total Return™ (the“DBIQ-OY Energy TR™”) consists of the Index plus3-month United States Treasury Obligations returns. Past results of theDBIQ-OY Energy TR™ are not necessarily indicative of future changes, positive or negative, in the closing levels of theDBIQ-OY Energy TR™.
The section “Summary of theDBIQ-OY Energy TR™ and Underlying Index Commodity Returns for the Years Ended December 31, 2018, 2017 and 2016” below provides an overview of the changes in the closing levels of theDBIQ-OY Energy TR™ by disclosing the change in market value of each underlying component Index Commodity through a “surrogate” (and analogous) index that also reflects 3 month United States Treasury Obligations returns. Please note also that the Fund’s objective is to track the Index (not theDBIQ-OY Energy TR™) and the Fund does not attempt to outperform or underperform the Index. The Index employs the optimum yield roll method with the objective of mitigating the negative effects of contango, the condition in which distant delivery prices for futures exceed spot prices, and maximizing the positive effects of backwardation, a condition opposite of contango.
26
Summary of theDBIQ-OY Energy TR™ and Underlying Index Commodity
Returns for the Years Ended December 31, 2018, 2017 and 2016
| AGGREGATE RETURNS FOR INDICES IN THE DBIQ-OY ENERGY TR™ | ||||||||||||
| Years Ended December 31, | ||||||||||||
Underlying Index | 2018 | 2017 | 2016 | |||||||||
DB Light Sweet Crude Oil Indices | (15.76 | )% | 6.46 | % | 7.43 | % | ||||||
DB Ultra Low Sulphur Diesel Indices | (11.95 | ) | 8.31 | 37.16 | % | |||||||
DB Brent Crude Oil Indices | 10.42 | 14.09 | 23.73 | % | ||||||||
DB RBOB Gasoline Indices | (23.35 | ) | 11.90 | 29.14 | % | |||||||
DB Natural Gas Indices | 1.41 | (22.39 | ) | 28.09 | % | |||||||
|
|
|
|
|
| |||||||
AGGREGATE RETURN | (13.34 | )% | 6.70 | % | 24.67 | % | ||||||
|
|
|
|
|
| |||||||
If the Fund’s Treasury Income, Money Market Income andT-Bill ETF Income were to exceed the Fund’s fees and expenses, the aggregate return on an investment in the Fund would be expected to outperform the Index and underperform theDBIQ-OY Energy TR™. The only difference between (i) the Index (the “Excess Return Index”) and (ii) theDBIQ-OY Energy TR™ (the “Total Return Index”) is that the Excess Return Index does not include interest income from fixed income securities while the Total Return Index does include such a component. Thus, the difference between the Excess Return Index and the Total Return Index is attributable entirely to the interest income attributable to the fixed income securities reflected in the Total Return Index. The Total Return Index does not actually hold any fixed income securities. If the Fund’s Treasury Income, Money Market Income andT-Bill ETF Income, if any, exceeds the Fund’s fees and expenses, then the amount of such excess is expected to be distributed periodically. The market price of the Shares is expected to closely track the Excess Return Index. The aggregate return on an investment in the Fund over any period is the sum of the capital appreciation or depreciation of the Shares over the period, plus the amount of any distributions during the period. Consequently, the Fund’s aggregate return is expected to outperform the Excess Return Index by the amount of the excess, if any, of the Fund’s Treasury Income, Money Market Income andT-Bill ETF Income over its fees and expenses. As a result of the Fund’s fees and expenses, however, the aggregate return on the Fund is expected to underperform the Total Return Index. If the Fund’s fees and expenses were to exceed the Fund’s Treasury Income, Money Market Income andT-Bill ETF Income, if any, the aggregate return on an investment in the Fund is expected to underperform the Excess Return Index.
FOR THE YEARS ENDED DECEMBER 31, 2018, 2017 AND 2016
Fund Share Price Performance
For the year ended December 31, 2018, the NYSE Arca market value of each Share decreased 13.05% from $14.54 per Share to $12.43 per Share. The Share price low and high for the year ended December 31, 2018 and related change from the Share price on December 31, 2017 was as follows: Shares traded at a low of $12.17 per Share(-16.33%) on December 24, 2018, and a high of $18.76 per Share (+28.99) on October 3, 2018. On December 31, 2018, the Fund paid a distribution of $0.20785 for each General Share and Share to holders of record as of December 26, 2018. Therefore, the total return for the Fund on a market value basis, was-13.05%.
For the year ended December 31, 2017, the NYSE Arca market value of each Share increased 5.44% from $13.79 per Share to $14.54 per Share. The Share price low and high for the year ended December 31, 2017 and related change from the Share price on December 31, 2016 was as follows: Shares traded at a low of $10.81 per Share (-21.65%) on June 21, 2017, and a high of $14.54 per Share (+5.44) on December 29, 2017. No distributions were paid to Shareholders during the year ended December 31, 2017. Therefore, the total return for the Fund, on a market value basis was +5.44%.
For the year ended December 31, 2016, the NYSE Arca market value of each Share increased 23.46% from $11.17 per Share to $13.79 per Share. The Share price low and high for the year ended December 31, 2016 and related change from the Share price on December 31, 2015 was as follows: Shares traded at a low of $8.92 per Share (-20.15%) on January 20, 2016, and a high of $13.79 per Share (+23.51%) on December 30, 2016. No distributions were paid to Shareholders during the year ended December 31, 2016. Therefore, the total return for the Fund, on a market value basis was +23.46%.
Fund Share Net Asset Performance
For the year ended December 31, 2018, the NAV of each Share decreased 14.01% from $14.59 per Share to $12.33 per Share. Falling commodity futures contract prices for Light Sweet Crude Oil, Ultra Low Sulphur Diesel and RBOB Gasoline were partially offset by rising commodity futures contract prices for Brent Crude Oil and Natural Gas during the year ended December 31, 2018 contributing to an overall 15.03% decrease in the level of the Index and to a 13.34% decrease in the level of theDBIQ-OY Energy TR™. On December 31, 2018, the Fund paid a distribution of $0.20785 for each General Share and Share to holders of record as of December 26, 2018. Therefore, the total return for the Fund on a NAV basis, was-14.01%.
27
Net income (loss) for the year ended December 31, 2018 was $(23.7) million, primarily resulting from income of $3.6 million, net realized gain (loss) of $12.5 million, net change in unrealized gain (loss) of $(38.3) million and operating expenses of $1.5 million.
For the year ended December 31, 2017, the NAV of each Share increased 5.72% from $13.80 per Share to $14.59 per Share. Rising commodity futures contract prices for Light Sweet Crude Oil, Ultra Low Sulphur Diesel, Brent Crude Oil and RBOB Gasoline were partially offset by falling commodity futures contract prices for Natural Gas during the year ended December 31, 2017 contributing to an overall 5.71% increase in the level of the Index and to a 6.70% increase in the level of theDBIQ-OY Energy TR™. No distributions were paid to Shareholders during the year ended December 31, 2017. Therefore, the total return for the Fund on a NAV basis was +5.72%.
Net income (loss) for the year ended December 31, 2017 was $6.2 million, primarily resulting from income of $1.2 million, net realized gain (loss) of $3.5 million, net change in unrealized gain (loss) of $2.6 million and operating expenses of $1.1 million.
For the year ended December 31, 2016, the NAV of each Share increased 23.77% from $11.15 per Share to $13.80 per Share. Rising commodity futures contract prices for Light Sweet Crude Oil, Ultra Low Sulphur Diesel, Brent Crude Oil, RBOB Gasoline and Natural Gas during the year ended December 31, 2016 contributed to an overall 24.67% increase in the level of theDBIQ-OY Energy TR™. No distributions were paid to Shareholders during the year ended December 31, 2016. Therefore, the total return for the Fund on a NAV basis was +23.77%.
Net income (loss) for the year ended December 31, 2016 was $21.3 million, primarily resulting from income of $0.4 million, net realized gain (loss) of $(20.2) million, net change in unrealized gain (loss) of $42.1 million and operating expenses of $1.0 million.
Critical Accounting Policies
The Fund’s critical accounting policies are as follows:
Preparation of the financial statements and related disclosures in conformity with U.S. GAAP requires the application of appropriate accounting rules and guidance, as well as the use of estimates, and requires management to make estimates and assumptions that affect the reported amounts of assets and liabilities, revenue and expense and related disclosure of contingent assets and liabilities during the reporting period of the financial statements and accompanying notes. The Fund’s application of these policies involves judgments and actual results may differ from the estimates used. There were no significant estimates used in the preparation of these financial statements.
Commodity futures contracts, United States Treasury Obligations,T-Bill ETFs and money market mutual funds are recorded on a trade date basis and at fair value in the financial statements, with changes in fair value, if any, reported in the Statements of Income and Expenses.
The use of fair value to measure financial instruments, with related unrealized gains or losses recognized in earnings in each period is fundamental to the Fund’s financial statements. The fair value of a financial instrument is the amount that would be received to sell an asset or paid to transfer a liability in an orderly transaction between market participants at the measurement date (the exit price).
United States Treasury Obligations are fair valued using an evaluated quote provided by an independent pricing service. Futures contracts are valued at the final settlement price set by an exchange on which they are principally traded. Investments inopen-end andclosed-end registered investment companies that do not trade on an exchange are valued at the end of day NAV per share. Investments inopen-end andclosed-end registered investment companies that trade on an exchange are valued at the last sales price or official closing price as of the close of the customary trading session on the exchange where the security is principally traded. Financial Accounting Standards Board (“FASB”) Accounting Standards Codification for fair value measurement and disclosure guidance requires a fair value hierarchy that prioritizes the inputs to valuation techniques used to measure fair value. The objective of a fair value measurement is to determine the price that would be received to sell an asset or paid to transfer a liability in an orderly transaction between market participants at the measurement date (an exit price). The hierarchy gives the highest priority to unadjusted quoted prices for identical assets or liabilities (Level 1 measurements) and the lowest priority to unobservable inputs (Level 3 measurements). Assets and liabilities are classified in their entirety based on the lowest level of input that is significant to the fair value measurement. See Note 6 within the financial statements in Item 8 for further information.
Securities for which market quotations are not readily available or became unreliable are valued at fair value as determined in good faith following procedures approved by the Managing Owner. Issuer-specific events, market trends, bid/asked quotes of brokers and information providers and other data may be reviewed in the course of making a good faith determination of a security’s fair value.
28
Realized gains (losses) from the sale or disposition of securities or derivatives are determined on a specific identification basis and recognized in the Statements of Income and Expenses in the period in which the contract is closed or the sale or disposition occurs, respectively.
Interest income on United States Treasury Obligations is recognized on an accrual basis when earned. Premiums and discounts are amortized or accreted over the life of the United States Treasury Obligations. Dividend income (net of withholding tax, if any) is recorded on theex-dividend date.
Off-Balance Sheet Arrangements and Contractual Obligations
In the normal course of its business, the Fund is a party to financial instruments withoff-balance sheet risk. The term“off-balance sheet risk” refers to an unrecorded potential liability that, even though it does not appear on the balance sheet, may result in a future obligation or loss. The financial instruments used by the Fund are commodity futures, the values of which are based upon an underlying asset and generally represent future commitments which have a reasonable possibility to be settled in cash or through physical delivery. The financial instruments are traded on an exchange and are standardized contracts.
The Fund has not utilized, nor does it expect to utilize in the future, special purpose entities to facilitateoff-balance sheet financing arrangements and has no loan guarantee arrangements oroff-balance sheet arrangements of any kind, other than agreements entered into in the normal course of business noted above, which may include indemnification provisions related to certain risks service providers undertake in providing services to the Fund. While the Fund’s exposure under such indemnification provisions cannot be estimated, these general business indemnifications are not expected to have a material impact on the Fund’s financial position. The Managing Owner expects the risk of loss relating to indemnification to be remote.
The Fund has financial obligations to the Managing Owner and the Commodity Broker under the Trust Agreement and its agreement with the Commodity Broker (the “Commodity Broker Agreement”), respectively. Management Fee payments made to the Managing Owner, pursuant to the Trust Agreement, are calculated as a fixed percentage of the Fund’s NAV. Commission payments to the Commodity Broker, pursuant to the Commodity Broker Agreement, are on acontract-by-contract, or round-turn, basis. As such, the Managing Owner cannot anticipate the amount of payments that will be required under these arrangements for future periods as NAVs and trading activity will not be known until a future date. The Fund’s agreement with the Commodity Broker may be terminated by either party for various reasons. All Management Fees and commission payments are paid to the Managing Owner and the Commodity Broker, respectively.
| ITEM 7A. | QUANTITATIVE AND QUALITATIVE DISCLOSURES ABOUT MARKET RISK |
INTRODUCTION
The Fund is designed to track the performance of the Index. The market sensitive instruments held by it are subject to the risk of trading loss. Unlike an operating company, the risk of market sensitive instruments is integral, not incidental, to the Fund’s main line of business.
Market movements can produce frequent changes in the fair market value of the Fund’s open positions and, consequently, in its earnings and cash flow. The Fund’s market risk is primarily influenced by changes in the prices of commodities.
Standard of Materiality
Materiality as used in this section, “Quantitative and Qualitative Disclosures About Market Risk,” is based on an assessment of reasonably possible market movements and the potential losses caused by such movements, taking into account the effects of margin, and any other multiplier features, as applicable, of the Fund’s market sensitive instruments.
QUANTIFYING THE FUND’S TRADING VALUE AT RISK
Quantitative Forward-Looking Statements
The following quantitative disclosures regarding the Fund’s market risk exposures contain “forward-looking statements” within the meaning of the safe harbor from civil liability provided for such statements by the Private Securities Litigation Reform Act of 1995 (set forth in Section 27A of the Securities Act of 1933 (the “Securities Act”) and Section 21E of the Exchange Act). All quantitative disclosures in this section are deemed to be forward-looking statements for purposes of the safe harbor, except for statements of historical fact (such as the dollar amount of maintenance margin required for market risk sensitive instruments held at the end of the reporting period).
29
Value at Risk (“VaR”) is a statistical measure of the value of losses that would not be expected to be exceeded over a given time horizon and at a given probability level arising from movement of underlying risk factors. Loss is measured as a decline in the fair value of the portfolio as a result of changes in any of the material variables by which fair values are determined. VaR is measured over a specified holding period (one day) and to a specified level of statistical confidence (99th percentile). However, the inherent uncertainty in the markets in which the Fund trades and the recurrence in the markets traded by the Fund of market movements far exceeding expectations could result in actual trading ornon-trading losses far beyond the indicated VaR or the Fund’s experience to date (i.e., “risk of ruin”). In light of these considerations, as well as the risks and uncertainties intrinsic to all future projections, the following VaR presentation does not constitute any assurance or representation that the Fund’s losses in any market sector will be limited to VaR.
THE FUND’S TRADING VALUE AT RISK
The Fund calculates VaR using the actual historical market movements of the Fund’s net assets.
The following table indicates the trading VaR associated with the Fund’s net assets as of December 31, 2018.
| For the Year Ended | ||||||||||||||||
| December 31, 2018 | ||||||||||||||||
Description | Net Assets | Daily Volatility | VaR* (99 Percentile) | Number of times VaR Exceeded | ||||||||||||
Invesco DB Energy Fund | $ | 91,215,745 | 1.24 | % | $ | 2,643,411 | 30 | |||||||||
The following table indicates the trading VaR associated with the Fund’s net assets as of December 31, 2017.
| For the Year Ended | ||||||||||||||||
| December 31, 2017 | ||||||||||||||||
Description | Net Assets | Daily Volatility | VaR* (99 Percentile) | Number of times VaR Exceeded | ||||||||||||
Invesco DB Energy Fund | $ | 178,048,939 | 1.00 | % | $ | 4,138,400 | 21 | |||||||||
| * | The VaR represents the one day downside risk, under normal market conditions, with a 99% confidence level. It is calculated using historical market moves of the Fund’s net assets and uses a one year look back. |
THE FUND’SNON-TRADING MARKET RISK
The Fund hasnon-trading market risk as a result of investing in short-term United States Treasury Obligations,T-Bill ETFs and money market mutual funds. The market risk represented by these investments is not expected to be material. Although the Fund purchases and sells shares ofT-Bill ETFs on an exchange, it does not establish or liquidate those positions for trading purposes.
QUALITATIVE DISCLOSURES REGARDING PRIMARY TRADING MARKET RISK EXPOSURES
The following qualitative disclosures regarding the Fund’s market risk exposures—except for those disclosures that are statements of historical fact—constitute forward-looking statements within the meaning of Section 27A of the Securities Act and Section 21E of the Exchange Act. The Fund’s primary market risk exposures are subject to numerous uncertainties, contingencies and risks. Government interventions, defaults and expropriations, illiquid markets, the emergence of dominant fundamental factors, political upheavals, changes in historical price relationships, an influx of new market participants, increased regulation and many other factors could result in material losses as well as in material changes to the risk exposures of the Fund. The Fund’s current market exposure may change materially. Investors may lose all or substantially all of their investment in the Fund.
The following were the primary trading risk exposures of the Fund as of December 31, 2018 by Index Commodity.
Light Sweet Crude Oil
The price of light sweet crude oil is volatile and is affected by numerous factors. The level of global industrial activity influences the demand for light sweet crude oil. In addition, various other factors can affect the demand for light sweet crude oil, such as weather, political events and labor activity. The supply of light sweet crude oil can be affected by many events, in particular, the meetings of the Organization of Petroleum Exporting Countries. Market expectations about events that will influence either demand or supply can cause prices for light sweet crude oil to fluctuate greatly. A significant amount of the world oil production capacity is controlled by a relatively small number of producers. Any large change in production by one of these producers could have a substantial effect on the price of light sweet crude oil.
30
Ultra Low Sulphur Diesel (also commonly known as Heating Oil)
The price of Ultra Low Sulphur Diesel is volatile and is affected by numerous factors. The level of global industrial activity influences the demand for Ultra Low Sulphur Diesel. In addition, the seasonal temperatures in countries throughout the world can also heavily influence the demand for Ultra Low Sulphur Diesel. Ultra Low Sulphur Diesel is derived from crude oil and as such, any factors that influence the supply of crude oil may also influence the supply of Ultra Low Sulphur Diesel.
Brent Crude Oil
The price of Brent Crude Oil is volatile and is affected by numerous factors. The price of Brent Crude Oil is influenced by many factors, including, but not limited to, the amount of output by oil producing nations, worldwide supply/stockpiles, weather, various geopolitical factors that cause supply disruptions (e.g., war, terrorism), global demand (particularly from emerging nations), currency fluctuations, and activities of market participants such as hedgers and speculators.
RBOB Gasoline
The price of RBOB Gasoline is volatile and is affected by numerous factors. The level of global industrial activity influences the demand for RBOB Gasoline. In addition, the demand has seasonal variations, which occur during “driving seasons” usually considered the summer months in North America and Europe. RBOB Gasoline is derived from crude oil and as such, any factors that influence the supply of crude oil may also influence the supply of RBOB Gasoline.
Natural Gas
The price of natural gas is volatile and is affected by numerous factors. The level of global industrial activity influences the demand for natural gas. In addition to the seasonal temperatures in countries throughout the world, any fluctuations in temperature may also heavily influence the demand for natural gas.
QUALITATIVE DISCLOSURES REGARDINGNON-TRADING MARKET RISK EXPOSURE
As noted above, the Fund hasnon-trading market risk as a result of investing in short-term United States Treasury Obligations,T-Bill ETFs and money market mutual funds. The market risk represented by these investments is not expected to be material.
QUALITATIVE DISCLOSURES REGARDING MEANS OF MANAGING RISK EXPOSURE
Under ordinary circumstances, the Managing Owner’s exercise of discretionary power is limited to determining whether the Fund will make a distribution. Under emergency or extraordinary circumstances, the Managing Owner’s use of its discretionary powers may increase. These special circumstances, for example, include the unavailability of the Index or certain natural or manmade disasters. The Managing Owner does not actively manage the Fund to avoid losses. The Fund only takes long positions in investments and does not employ “stop-loss” techniques.
31
| ITEM 8. | FINANCIAL STATEMENTS AND SUPPLEMENTARY DATA |
Index to Financial Statements
32
Report of Management on Internal Control over Financial Reporting
Management of Invesco Capital Management LLC, as managing owner (the “Managing Owner”) of Invesco DB Energy Fund (the “Fund”), is responsible for establishing and maintaining adequate internal control over financial reporting, as defined in Rules13a-15(f) and15d-15(f) of the Securities Exchange Act of 1934, as amended (the “Exchange Act”). Internal control over financial reporting is a process designed to provide reasonable assurance regarding the reliability of financial reporting and the preparation of financial statements for external purposes in accordance with generally accepted accounting principles.
Because of its inherent limitations, internal control over financial reporting may not prevent or detect misstatements. Also, projections of any evaluation of effectiveness to future periods are subject to the risk that controls may become inadequate because of changes in conditions, or that the degree of compliance with the policies or procedures may deteriorate.
We, Daniel Draper, Principal Executive Officer, and Kelli Gallegos, Principal Financial and Accounting Officer, Investment Pools, of the Managing Owner, assessed the effectiveness of the Fund’s internal control over financial reporting as of December 31, 2018. In making this assessment, we used the criteria set forth by the Committee of Sponsoring Organizations of the Treadway Commission (“COSO”) inInternal Control—Integrated Framework (2013). Based on our assessment and those criteria, we have concluded that the Fund maintained effective internal control over financial reporting as of December 31, 2018.
The Fund’s independent registered public accounting firm, PricewaterhouseCoopers LLP, has audited the Fund’s internal control over financial reporting as of December 31, 2018, as stated in their report on page 34 of the Fund’s Annual Report on Form10-K.
| By: | /S/ DANIEL DRAPER | |
| Name: | Daniel Draper | |
| Title: | Principal Executive Officer of the Managing Owner | |
| By: | /S/ KELLI GALLEGOS | |
| Name: | Kelli Gallegos | |
| Title: | Principal Financial and Accounting Officer, Investment Pools, of the Managing Owner | |
February 27, 2019
33
Report of Independent Registered Public Accounting Firm
To the Board of Managers of Invesco DB Multi-Sector Commodity Trust and Shareholders of Invesco DB Energy Fund
Opinions on the Financial Statements and Internal Control over Financial Reporting
We have audited the accompanying statements of financial condition, including the schedules of investments of Invesco DB Energy Fund (one of the funds constituting Invesco DB Multi-Sector Commodity Trust, hereafter referred to as the “Fund”) as of December 31, 2018 and December 31, 2017,and the related statements of income and expenses, of changes in shareholders’ equity and of cash flows for each of the three years in the period ended December 31, 2018, including the related notes (collectively referred to as the “financial statements”).We also have audited the Fund’s internal control over financial reporting as of December 31, 2018, based on criteria established inInternal Control - Integrated Framework (2013) issued by the Committee of Sponsoring Organizations of the Treadway Commission (COSO).
In our opinion, thefinancial statements referred to above present fairly, in all material respects, the financial position of the Fund as of December 31, 2018 and December 31, 2017, and the results of its operations and its cash flows for each of the three years in the period ended December 31, 2018in conformity with accounting principles generally accepted in the United States of America. Also in our opinion, the Fund maintained, in all material respects, effective internal control over financial reporting as of December 31, 2018, based on criteria established inInternal Control - Integrated Framework (2013) issued by the COSO.
Basis for Opinions
The Fund’s management is responsible for these financial statements, for maintaining effective internal control over financial reporting, and for its assessment of the effectiveness of internal control over financial reporting, included in the accompanying Report of Management on Internal Control Over Financial Reporting. Our responsibility is to express opinions on the Fund’sfinancial statements and on the Fund’s internal control over financial reporting based on our audits. We are a public accounting firm registered with the Public Company Accounting Oversight Board (United States) (“PCAOB”) and are required to be independent with respect to the Fund in accordance with the U.S. federal securities laws and the applicable rules and regulations of the Securities and Exchange Commission and the PCAOB.
We conducted our audits in accordance with the standards of the PCAOB. Those standards require that we plan and perform the audits to obtain reasonable assurance about whether thefinancial statements are free of material misstatement, whether due to error or fraud, and whether effective internal control over financial reporting was maintained in all material respects.
Our audits of thefinancial statements included performing procedures to assess the risks of material misstatement of thefinancial statements, whether due to error or fraud, and performing procedures that respond to those risks. Such procedures included examining, on a test basis, evidence regarding the amounts and disclosures in thefinancial statements. Our audits also included evaluating the accounting principles used and significant estimates made by management, as well as evaluating the overall presentation of thefinancial statements. Our audit of internal control over financial reporting included obtaining an understanding of internal control over financial reporting, assessing the risk that a material weakness exists, and testing and evaluating the design and operating effectiveness of internal control based on the assessed risk. Our audits also included performing such other procedures as we considered necessary in the circumstances. We believe that our audits provide a reasonable basis for our opinions.
Definition and Limitations of Internal Control over Financial Reporting
A fund’s internal control over financial reporting is a process designed to provide reasonable assurance regarding the reliability of financial reporting and the preparation of financial statements for external purposes in accordance with generally accepted accounting principles. A fund’s internal control over financial reporting includes those policies and procedures that (i) pertain to the maintenance of records that, in reasonable detail, accurately and fairly reflect the transactions and dispositions of the assets of the fund; (ii) provide reasonable assurance that transactions are recorded as necessary to permit preparation of financial statements in accordance with generally accepted accounting principles, and that receipts and expenditures of the fund are being made only in accordance with authorizations of management and directors of the fund; and (iii) provide reasonable assurance regarding prevention or timely detection of unauthorized acquisition, use, or disposition of the fund’s assets that could have a material effect on the financial statements.
34
Because of its inherent limitations, internal control over financial reporting may not prevent or detect misstatements. Also, projections of any evaluation of effectiveness to future periods are subject to the risk that controls may become inadequate because of changes in conditions, or that the degree of compliance with the policies or procedures may deteriorate.
/s/ PricewaterhouseCoopers LLP
Chicago, Illinois
February 27, 2019
We have served as the Fund’s auditor since 2013.
35
Invesco DB Energy Fund
Statements of Financial Condition
December 31, 2018 and 2017
| December 31, | December 31, | |||||||
| 2018 | 2017 | |||||||
Assets | ||||||||
United States Treasury Obligations, at value (cost $67,736,084 and $142,800,664, respectively) | $ | 67,734,740 | $ | 142,797,721 | ||||
Affiliated investments, at value (cost $24,903,778 and 33,304,228, respectively) | 24,916,229 | 33,284,413 | ||||||
Other investments: | ||||||||
Variation margin receivable- Commodity Futures Contracts | 91,024 | 1,212,368 | ||||||
Cash held by custodian | — | 856,046 | ||||||
Receivable for: | ||||||||
Dividends from affiliates | 9,623 | 9,572 | ||||||
|
|
|
| |||||
Total assets | $ | 92,751,616 | $ | 178,160,120 | ||||
|
|
|
| |||||
Liabilities | ||||||||
Payable for: | ||||||||
Distributions | $ | 83,140 | — | |||||
Due to custodian | 1,367,641 | $ | — | |||||
Management fees | 80,530 | 106,161 | ||||||
Brokerage commissions and fees | 4,560 | 5,020 | ||||||
|
|
|
| |||||
Total liabilities | 1,535,871 | 111,181 | ||||||
|
|
|
| |||||
Commitments and Contingencies (Note 10) | ||||||||
Equity | ||||||||
Shareholder’s equity—General Shares | 493 | 584 | ||||||
Shareholders’ equity—Shares | 91,215,252 | 178,048,355 | ||||||
|
|
|
| |||||
Total shareholders’ equity | 91,215,745 | 178,048,939 | ||||||
|
|
|
| |||||
Total liabilities and equity | $ | 92,751,616 | $ | 178,160,120 | ||||
|
|
|
| |||||
General Shares outstanding | 40 | 40 | ||||||
Shares outstanding | 7,400,000 | 12,200,000 | ||||||
Net asset value per share | $ | 12.33 | $ | 14.59 | ||||
Market value per share | $ | 12.43 | $ | 14.54 | ||||
See accompanying Notes to Financial Statements which are an integral part of the financial statements.
36
Invesco DB Energy Fund
December 31, 2018
Description | Percentage of Shareholders’ Equity | Value | Principal Value | |||||||||
United States Treasury Obligations(a) | ||||||||||||
U.S. Treasury Bills, 2.175% due January 3, 2019 | 18.64 | % | $ | 16,998,940 | $ | 17,000,000 | ||||||
U.S. Treasury Bills, 2.370% due February, 28, 2019 | 19.66 | 17,932,277 | 18,000,000 | |||||||||
U.S. Treasury Bills, 2.415% due March 28, 2019(b) | 23.98 | 21,877,086 | 22,000,000 | |||||||||
U.S. Treasury Bills, 2.465% due April 4, 2019 | 8.72 | 7,950,499 | 8,000,000 | |||||||||
U.S. Treasury Bills, 2.430% due May 2, 2019 | 3.26 | 2,975,938 | 3,000,000 | |||||||||
|
|
|
| |||||||||
Total United States Treasury Obligations (cost $67,736,084) | 74.26 | % | $ | 67,734,740 | ||||||||
|
|
|
| |||||||||
| Shares | ||||||||||||
Affiliated Investments | ||||||||||||
Exchange-Traded Fund | ||||||||||||
Invesco Treasury Collateral ETF (cost $20,000,061)(c) | 21.94 | % | $ | 20,012,512 | 189,800 | |||||||
Money Market Mutual Fund | ||||||||||||
Invesco Premier U.S. Government Money Portfolio - Institutional Class, 2.30% (cost $4,903,717)(d) | 5.37 | 4,903,717 | 4,903,717 | |||||||||
|
|
|
| |||||||||
Total Affiliated Investments (cost $24,903,778) | 27.31 | % | $ | 24,916,229 | ||||||||
|
|
|
| |||||||||
Total Investments in Securities (cost $92,639,862) | 101.57 | % | $ | 92,650,969 | ||||||||
|
|
|
| |||||||||
| (a) | Security may be traded on a discount basis. The interest rate shown represents the discount rate at the most recent auction date of the security prior to period end. |
| (b) | United States Treasury Obligations of $19,213,740 are on deposit with the Commodity Broker and held as maintenance margin for open futures contracts. |
| (c) | Affiliated company. The security and the Fund are affiliated by having the same investment adviser. See Note 8. |
| (d) | The security and the Fund are advised by wholly-owned subsidiaries of Invesco Ltd. and are therefore considered to be affiliated. The rate shown is the7-day SEC standardized yield as of December 31, 2018. |
Open Commodity Futures Contracts | Number of Contracts | Expiration Date | Notional Value | Value(e) | Unrealized Appreciation (Depreciation)(e) | |||||||||||||||
Long Futures Contracts | ||||||||||||||||||||
ICE-UK Brent Crude | 363 | November - 2019 | $ | 20,055,750 | $ | (5,928,121 | ) | $ | (5,928,121 | ) | ||||||||||
NYMEX Natural Gas | 424 | April - 2019 | $ | 11,329,280 | 108,092 | $ | 108,092 | |||||||||||||
NYMEX NY Harbor ULSD | 290 | May - 2019 | $ | 20,252,904 | (6,373,378 | ) | $ | (6,373,378 | ) | |||||||||||
NYMEX RBOB Gasoline | 362 | December - 2019 | $ | 20,295,820 | (2,526,927 | ) | $ | (2,526,927 | ) | |||||||||||
NYMEX WTI Crude | 422 | February - 2019 | $ | 19,293,840 | (7,948,405 | ) | $ | (7,948,405 | ) | |||||||||||
|
|
|
| |||||||||||||||||
Total Commodity Futures Contracts | $ | (22,668,739 | ) | $ | (22,668,739 | ) | ||||||||||||||
|
|
|
| |||||||||||||||||
| (e) | Unrealized Appreciation (Depreciation) and Value are presented above, net by contract. |
See accompanying Notes to Financial Statements which are an integral part of the financial statements.
37
Invesco DB Energy Fund
December 31, 2017
Description | Percentage of Shareholders’ Equity | Value | Principal Value | |||||||||
United States Treasury Obligations(a) | ||||||||||||
U.S. Treasury Bills, 1.180% due January 4, 2018 | 27.52 | % | $ | 48,996,927 | $ | 49,000,000 | ||||||
U.S. Treasury Bills, 1.245% due January 18, 2018 | 10.10 | 17,990,130 | 18,000,000 | |||||||||
U.S. Treasury Bills, 1.285% due February 22, 2018 | 28.59 | 50,908,965 | 51,000,000 | |||||||||
U.S. Treasury Bills, 1.285% due March 1, 2018(b) | 7.85 | 13,971,411 | 14,000,000 | |||||||||
U.S. Treasury Bills, 1.450% due June 7, 2018 | 6.14 | 10,930,288 | 11,000,000 | |||||||||
|
|
|
|
|
| |||||||
Total United States Treasury Obligations (cost $142,800,664) | 80.20 | % | $ | 142,797,721 | ||||||||
|
|
|
|
|
| |||||||
| Shares | ||||||||||||
Affiliated Investments | ||||||||||||
Exchange-Traded Fund | ||||||||||||
PowerShares Treasury Collateral Portfolio (cost $20,000,061)(c) | 11.22 | % | $ | 19,980,246 | 189,800 | |||||||
Money Market Mutual Fund | ||||||||||||
Invesco Premier U.S. Government Money Portfolio - Institutional Class, 1.15% (cost $13,304,167)(d) | 7.48 | 13,304,167 | 13,304,167 | |||||||||
|
|
|
| |||||||||
Total Affiliated Investments (cost $33,304,228) | 18.70 | % | $ | 33,284,413 | ||||||||
|
|
|
| |||||||||
Total Investments in Securities (cost $176,104,892) | 98.90 | % | $ | 176,082,134 | ||||||||
|
|
|
| |||||||||
| (a) | Security may be traded on a discount basis. The interest rate shown represents the discount rate at the most recent auction date of the security prior to period end. |
| (b) | United States Treasury Obligations of $13,970,600 are on deposit with the Commodity Broker and held as maintenance margin for open futures contracts. |
| (c) | Affiliated company. The security and the Fund are affiliated by having the same investment adviser. See Note 8. |
| (d) | The security and the Fund are advised by wholly-owned subsidiaries of Invesco Ltd. and are therefore considered to be affiliated. The rate shown is the7-day SEC standardized yield as of December 31, 2017. |
Open Commodity Futures Contracts | Number of Contracts | Expiration Date | Notional Value | Value(e) | Unrealized Appreciation (Depreciation)(e) | |||||||||||||||
Long Futures Contracts | ||||||||||||||||||||
ICE-UK Brent Crude | 644 | November - 2018 | $ | 40,778,080 | $ | 2,099,682 | $ | 2,099,682 | ||||||||||||
NYMEX Natural Gas | 592 | April - 2018 | 16,226,720 | (701,709 | ) | (701,709 | ) | |||||||||||||
NYMEX NY Harbor ULSD | 494 | May - 2018 | 41,043,693 | 7,807,550 | 7,807,550 | |||||||||||||||
NYMEX RBOB Gasoline | 538 | December - 2018 | 38,551,036 | 1,417,154 | 1,417,154 | |||||||||||||||
NYMEX WTI Crude | 685 | February - 2018 | 41,401,400 | 5,076,073 | 5,076,073 | |||||||||||||||
|
|
|
| |||||||||||||||||
Total Commodity Futures Contracts | $ | 15,698,750 | $ | 15,698,750 | ||||||||||||||||
|
|
|
| |||||||||||||||||
| (e) | Unrealized Appreciation (Depreciation) and Value are presented above, net by contract. |
See accompanying Notes to Financial Statements which are an integral part of the financial statements.
38
Invesco DB Energy Fund
Statements of Income and Expenses
For the Years Ended December 31, 2018, 2017 and 2016
| 2018 | 2017 | 2016 | ||||||||||
Income | ||||||||||||
Interest Income | $ | 3,146,104 | $ | 966,329 | $ | 356,979 | ||||||
Dividends from Affiliates | 520,109 | 205,518 | 9,229 | |||||||||
|
|
|
|
|
| |||||||
Total Income | 3,666,213 | 1,171,847 | 366,208 | |||||||||
|
|
|
|
|
| |||||||
Expenses | ||||||||||||
Management Fees | 1,503,272 | 1,088,651 | 915,058 | |||||||||
Brokerage Commissions and Fees | 29,556 | 38,053 | 40,509 | |||||||||
Interest Expense | 24,967 | 3,992 | 6,671 | |||||||||
|
|
|
|
|
| |||||||
Total Expenses | 1,557,795 | 1,130,696 | 962,238 | |||||||||
|
|
|
|
|
| |||||||
Less: Waivers | (35,111 | ) | (32,978 | ) | (4,790 | ) | ||||||
|
|
|
|
|
| |||||||
Net Expenses | 1,522,684 | 1,097,718 | 957,448 | |||||||||
|
|
|
|
|
| |||||||
Net Investment Income (Loss) | 2,143,529 | 74,129 | (591,240 | ) | ||||||||
|
|
|
|
|
| |||||||
Net Realized and Net Change in Unrealized Gain (Loss) on United States Treasury Obligations, Affiliated Investments and Commodity Futures Contracts | ||||||||||||
Net Realized Gain (Loss) on | ||||||||||||
United States Treasury Obligations | (12,186 | ) | (4,212 | ) | 2,468 | |||||||
Commodity Futures Contracts | 12,504,489 | 3,484,990 | (20,246,167 | ) | ||||||||
|
|
|
|
|
| |||||||
Net Realized Gain (Loss) | 12,492,303 | 3,480,778 | (20,243,699 | ) | ||||||||
|
|
|
|
|
| |||||||
Net Change in Unrealized Gain (Loss) on | ||||||||||||
United States Treasury Obligations | 1,599 | 2,701 | (11,162 | ) | ||||||||
Affiliated Investments | 32,266 | (19,815 | ) | — | ||||||||
Commodity Futures Contracts | (38,367,489 | ) | 2,654,294 | 42,171,744 | ||||||||
|
|
|
|
|
| |||||||
Net Change in Unrealized Gain (Loss) | (38,333,624 | ) | 2,637,180 | 42,160,582 | ||||||||
|
|
|
|
|
| |||||||
Net Realized and Net Change in Unrealized Gain (Loss) on United States Treasury Obligations, Affiliated Investments and Commodity Futures Contracts | (25,841,321 | ) | 6,117,958 | 21,916,883 | ||||||||
|
|
|
|
|
| |||||||
Net Income (Loss) | $ | (23,697,792 | ) | $ | 6,192,087 | $ | 21,325,643 | |||||
|
|
|
|
|
| |||||||
See accompanying Notes to Financial Statements which are an integral part of the financial statements.
39
Invesco DB Energy Fund
Statement of Changes in Shareholders’ Equity
For the Year Ended December 31, 2018
| General Shares | Shares | Total | ||||||||||||||||||
| Shares | Total Equity | Shares | Total Equity | Shareholders’ Equity | ||||||||||||||||
Balance at December 31, 2017 | 40 | $ | 584 | 12,200,000 | $ | 178,048,355 | $ | 178,048,939 | ||||||||||||
|
|
|
|
|
|
|
|
|
| |||||||||||
Purchases of Shares | 5,200,000 | 87,522,250 | 87,522,250 | |||||||||||||||||
Redemption of Shares | (10,000,000 | ) | (148,994,844 | ) | (148,994,844 | ) | ||||||||||||||
|
|
|
|
|
| |||||||||||||||
Net Increase (Decrease) due to Share Transactions | (4,800,000 | ) | (61,472,594 | ) | (61,472,594 | ) | ||||||||||||||
Return of Capital Distributions | (8 | ) | (1,662,800 | ) | (1,662,808 | ) | ||||||||||||||
Net Income (Loss) | ||||||||||||||||||||
Net Investment Income (Loss) | 8 | 2,143,521 | 2,143,529 | |||||||||||||||||
Net Realized Gain (Loss) on United States Treasury Obligations, Affiliated Investments and Commodity Futures Contracts | 48 | 12,492,255 | 12,492,303 | |||||||||||||||||
Net Change in Unrealized Gain (Loss) on United States Treasury Obligations, Affiliated Investments and Commodity Futures Contracts | (139 | ) | (38,333,485 | ) | (38,333,624 | ) | ||||||||||||||
|
|
|
|
|
| |||||||||||||||
Net Income (Loss) | (83 | ) | (23,697,709 | ) | (23,697,792 | ) | ||||||||||||||
|
|
|
|
|
|
|
|
|
| |||||||||||
Net Change in Shareholders’ Equity | — | (91 | ) | (4,800,000 | ) | (86,833,103 | ) | (86,833,194 | ) | |||||||||||
|
|
|
|
|
|
|
|
|
| |||||||||||
Balance at December 31, 2018 | 40 | $ | 493 | 7,400,000 | $ | 91,215,252 | $ | 91,215,745 | ||||||||||||
|
|
|
|
|
|
|
|
|
| |||||||||||
See accompanying Notes to Financial Statements which are an integral part of the financial statements.
40
Invesco DB Energy Fund
Statement of Changes in Shareholders’ Equity
For the Year Ended December 31, 2017
| General Shares | Shares | Total | ||||||||||||||||||
| Shares | Total Equity | Shares | Total Equity | Shareholders’ Equity | ||||||||||||||||
Balance at December 31, 2016 | 40 | $ | 552 | 14,000,000 | $ | 193,214,185 | $ | 193,214,737 | ||||||||||||
|
|
|
|
|
|
|
|
|
| |||||||||||
Purchases of Shares | 9,200,000 | 118,013,029 | 118,013,029 | |||||||||||||||||
Redemption of Shares | (11,000,000 | ) | (139,370,914 | ) | (139,370,914 | ) | ||||||||||||||
|
|
|
|
|
| |||||||||||||||
Net Increase (Decrease) due to Share Transactions | (1,800,000 | ) | (21,357,885 | ) | (21,357,885 | ) | ||||||||||||||
Net Income (Loss) | ||||||||||||||||||||
Net Investment Income (Loss) | — | 74,129 | 74,129 | |||||||||||||||||
Net Realized Gain (Loss) on United States Treasury Obligations, Affiliated Investments and Commodity Futures Contracts | 18 | 3,480,760 | 3,480,778 | |||||||||||||||||
Net Change in Unrealized Gain (Loss) on United States Treasury Obligations, Affiliated Investments and Commodity Futures Contracts | 14 | 2,637,166 | 2,637,180 | |||||||||||||||||
|
|
|
|
|
| |||||||||||||||
Net Income (Loss) | 32 | 6,192,055 | 6,192,087 | |||||||||||||||||
|
|
|
|
|
|
|
|
|
| |||||||||||
Net Change in Shareholders’ Equity | — | 32 | (1,800,000 | ) | (15,165,830 | ) | (15,165,798 | ) | ||||||||||||
|
|
|
|
|
|
|
|
|
| |||||||||||
Balance at December 31, 2017 | 40 | $ | 584 | 12,200,000 | $ | 178,048,355 | $ | 178,048,939 | ||||||||||||
|
|
|
|
|
|
|
|
|
| |||||||||||
See accompanying Notes to Financial Statements which are an integral part of the financial statements.
41
Invesco DB Energy Fund
Statement of Changes in Shareholders’ Equity
For the Year Ended December 31, 2016
| General Shares | Shares | Total | ||||||||||||||||||
| Shares | Total Equity | Shares | Total Equity | Shareholders’ Equity | ||||||||||||||||
Balance at January 1, 2016 | 40 | $ | 446 | 8,400,000 | $ | 93,691,628 | $ | 93,692,074 | ||||||||||||
|
|
|
|
|
|
|
|
|
| |||||||||||
Purchases of Shares | 17,800,000 | 219,166,864 | 219,166,864 | |||||||||||||||||
Redemption of Shares | (12,200,000 | ) | (140,969,844 | ) | (140,969,844 | ) | ||||||||||||||
|
|
|
|
|
| |||||||||||||||
Net Increase (Decrease) due to Share Transactions | 5,600,000 | 78,197,020 | 78,197,020 | |||||||||||||||||
Net Income (Loss) | ||||||||||||||||||||
Net Investment Income (Loss) | (3 | ) | (591,237 | ) | (591,240 | ) | ||||||||||||||
Net Realized Gain (Loss) on United States Treasury Obligations and Commodity Futures Contracts | (100 | ) | (20,243,599 | ) | (20,243,699 | ) | ||||||||||||||
Net Change in Unrealized Gain (Loss) on United States Treasury Obligations and Commodity Futures Contracts | 209 | 42,160,373 | 42,160,582 | |||||||||||||||||
|
|
|
|
|
| |||||||||||||||
Net Income (Loss) | 106 | 21,325,537 | 21,325,643 | |||||||||||||||||
|
|
|
|
|
|
|
|
|
| |||||||||||
Net Change in Shareholders’ Equity | — | 106 | 5,600,000 | 99,522,557 | 99,522,663 | |||||||||||||||
|
|
|
|
|
|
|
|
|
| |||||||||||
Balance at December 31, 2016 | 40 | $ | 552 | 14,000,000 | $ | 193,214,185 | $ | 193,214,737 | ||||||||||||
|
|
|
|
|
|
|
|
|
| |||||||||||
See accompanying Notes to Financial Statements which are an integral part of the financial statements.
42
Invesco DB Energy Fund
For the Years Ended December 31, 2018, 2017 and 2016
| 2018 | 2017 | 2016 | ||||||||||
Cash flows from operating activities: | ||||||||||||
Net Income (Loss) | $ | (23,697,792 | ) | $ | 6,192,087 | $ | 21,325,643 | |||||
Adjustments to reconcile net income (loss) to net cash provided by (used for) operating activities: | ||||||||||||
Cost of securities purchased | (449,526,267 | ) | (415,929,500 | ) | (547,480,251 | ) | ||||||
Proceeds from securities sold and matured | 527,706,719 | 457,934,125 | 453,681,210 | |||||||||
Cost of affiliated investments purchased | (331,668,015 | ) | (351,745,299 | ) | (147,807,257 | ) | ||||||
Proceeds from affiliated investments sold | 340,068,465 | 327,829,342 | 138,418,986 | |||||||||
Net accretion of discount on United States Treasury Obligations | (3,128,058 | ) | (966,329 | ) | (356,979 | ) | ||||||
Net realized (gain) loss on United States Treasury Obligations | 12,186 | 4,212 | (2,468 | ) | ||||||||
Net change in unrealized (gain) loss on United States Treasury Obligations and Affiliated Investments | (33,865 | ) | 17,114 | 11,162 | ||||||||
Change in operating assets and liabilities: | ||||||||||||
Variation margin - Commodity Futures Contracts | 1,121,344 | (1,099,627 | ) | 1,403,136 | ||||||||
Dividends from affiliates | (51 | ) | (7,314 | ) | (2,258 | ) | ||||||
Management fees | (25,631 | ) | (16,824 | ) | 59,965 | |||||||
Brokerage commissions and fees | (460 | ) | 2,444 | (2,422 | ) | |||||||
Distributions payable | 83,140 | — | — | |||||||||
|
|
|
|
|
| |||||||
Net cash provided by (used for) operating activities | 60,911,715 | 22,214,431 | (80,751,533 | ) | ||||||||
|
|
|
|
|
| |||||||
Cash flows from financing activities: | ||||||||||||
Distributions Paid to Shareholders | (1,662,808 | ) | — | — | ||||||||
Proceeds from purchases of Shares | 87,522,250 | 118,013,029 | 219,166,864 | |||||||||
Redemption of Shares | (148,994,844 | ) | (139,370,914 | ) | (140,969,844 | ) | ||||||
Increase (decrease) in payable for amount due to custodian, net | 1,367,641 | (500 | ) | 500 | ||||||||
|
|
|
|
|
| |||||||
Net cash provided by (used for) financing activities | (61,767,761 | ) | (21,358,385 | ) | 78,197,520 | |||||||
|
|
|
|
|
| |||||||
Net change in cash | (856,046 | ) | 856,046 | (2,554,013 | ) | |||||||
Cash at beginning of period | 856,046 | — | 2,554,013 | |||||||||
|
|
|
|
|
| |||||||
Cash at end of period | $ | — | $ | 856,046 | $ | — | ||||||
|
|
|
|
|
| |||||||
Supplemental disclosure of cash flow information | ||||||||||||
Cash paid for interest | $ | 24,967 | $ | 3,992 | $ | 6,671 | ||||||
See accompanying Notes to Financial Statements which are an integral part of the financial statements.
43
Invesco DB Energy Fund
December 31, 2018
Note 1—Organization
Invesco DB Energy Fund (the “Fund”), a separate series of Invesco DB Multi-Sector Commodity Trust (the “Trust”), a Delaware statutory trust organized in seven separate series, was formed on August 3, 2006. The term of the Fund is perpetual (unless terminated earlier in certain circumstances) as provided for in the Fifth Amended and Restated Declaration of Trust and Trust Agreement of the Trust, as amended (the “Trust Agreement”). The Fund has an unlimited number of shares authorized for issuance.
Invesco Capital Management LLC (“Invesco”) has served as the managing owner (the “Managing Owner”), commodity pool operator and commodity trading advisor of the Trust and the Fund since February 23, 2015. The Managing Owner holds 40 general shares (the “General Shares”) of the Fund. The fiscal year end of the Fund is December 31st.
The Fund seeks to track changes, whether positive or negative, in the level of the DBIQ Optimum Yield Energy Index Excess Return™ (the “Index”) over time, plus the excess, if any, of the sum of the Fund’s interest income from its holdings of United States Treasury Obligations (“Treasury Income”), dividends from its holdings in money market mutual funds (affiliated or otherwise) (“Money Market Income”) and dividends or distributions of capital gains from its holdings ofT-Bill ETFs (as defined below)(“T-Bill ETF Income”) over the expenses of the Fund. The Fund invests in futures contracts in an attempt to track its Index. The Index is intended to reflect the change in market value of the energy sector. The commodities comprising the Index are Light Sweet Crude Oil, Ultra Low Sulphur Diesel (also commonly known as Heating Oil), Brent Crude Oil, RBOB Gasoline and Natural Gas (each, an “Index Commodity,” and collectively, the “Index Commodities”).
The Fund may invest directly in United States Treasury Obligations. The Fund may also gain exposure to United States Treasury Obligations through investments in exchange-traded funds (“ETFs”) (affiliated or otherwise) that track indexes that measure the performance of United States Treasury Obligations with a maximum remaining maturity of up to 12 months(“T-Bill ETFs”). The Fund invests in United States Treasury Obligations, money market mutual funds andT-Bill ETFs (affiliated or otherwise), if any, for margin and/or cash management purposes.
The Commodity Futures Trading Commission (the “CFTC”) and certain futures exchanges impose position limits on futures contracts that reference Index Commodities (the “Index Contracts”). As the Fund approaches or reaches position limits with respect to an Index Commodity, the Fund may commence investing in Index Contracts that reference other Index Commodities. In those circumstances, the Fund may also trade in futures contracts based on commodities other than Index Commodities that the Managing Owner reasonably believes tend to exhibit trading prices that correlate with an Index Contract. In addition, the Managing Owner may determine to invest in other futures contracts if at any time it is impractical or inefficient to gain full or partial exposure to an Index Commodity through the use of Index Contracts. These other futures contracts may or may not be based on an Index Commodity. When they are not, the Managing Owner may seek to select futures contracts that it reasonably believes tend to exhibit trading prices that correlate with an Index Contract.
The Fund offers common units of beneficial interest (the “Shares”) only to certain eligible financial institutions (the “Authorized Participants”) in one or more blocks of 200,000 Shares (“Basket”). The Fund commenced investment operations on January 3, 2007. The Fund commenced trading on the American Stock Exchange (which became the NYSE Alternext US LLC) on January 5, 2007 and, since November 25, 2008, has been listed on the NYSE Arca, Inc. (the “NYSE Arca”).
This Annual Report (the “Annual Report”) covers the years ended December 31, 2018, 2017 and 2016. Past performance of the Fund is not necessarily indicative of future performance.
Note 2—Summary of Significant Accounting Policies
A. Basis of Presentation
The financial statements of the Fund have been prepared using accounting principles generally accepted in the United States of America (“U.S. GAAP”).
The Fund has determined that it meets the definition of an investment company and has prepared the financial statements in conformity with U.S. GAAP for investment companies in conformity with accounting and reporting guidance of the Financial Accounting Standards Board Accounting Standards Codification Topic 946,Financial Services—Investment Companies.
B. Accounting Estimates
The preparation of financial statements in conformity with U.S. GAAP requires management to make estimates and assumptions that affect the reported amounts of assets and liabilities at the date of the financial statements and the reported amounts of revenues and expenses during the reporting period. Actual results could differ from those estimates by a significant amount. In addition, the Fund monitors for material events or transactions that may occur or become known after theperiod-end date and before the date the financial statements are released to print.
44
C. Investment Valuations
Investments inopen-end andclosed-end registered investment companies that do not trade on an exchange are valued at theend-of-day net asset value (“NAV”) per share. Investments inopen-end andclosed-end registered investment companies that trade on an exchange are valued at the last sales price or official closing price as of the close of the customary trading session on the exchange where the security is principally traded.
United States Treasury Obligations are fair valued using an evaluated quote provided by an independent pricing service. Evaluated quotes provided by the pricing service may be determined without exclusive reliance on quoted prices, and may reflect appropriate factors such as developments related to specific securities, yield, quality, type of issue, coupon rate, maturity, individual trading characteristics and other market data. All debt obligations involve some risk of default with respect to interest and/or principal payments.
Futures contracts are valued at the final settlement price set by an exchange on which they are principally traded.
Securities for which market quotations are not readily available or became unreliable are valued at fair value as determined in good faith following procedures approved by the Managing Owner. Issuer-specific events, market trends, bid/asked quotes of brokers and information providers and other data may be reviewed in the course of making a good faith determination of a security’s fair value.
D. Investment Transactions and Investment Income
Investment transactions are accounted for on a trade date basis. Realized gains or losses from the sale or disposition of securities or derivatives are determined on a specific identification basis and recognized in the Statements of Income and Expenses in the period in which the contract is closed or the sale or disposition occurs, respectively. Interest income on United States Treasury Obligations is recognized on an accrual basis when earned. Premiums and discounts are amortized or accreted over the life of the United States Treasury Obligations. Dividend income (net of withholding tax, if any) is recorded on theex-dividend date.
E. Profit and Loss Allocations and Distributions
Pursuant to the Trust Agreement, income and expenses are allocatedpro rata to the Managing Owner as holder of the General Shares and to the Shareholders monthly based on their respective percentage interests as of the close of the last trading day of the preceding month. Distributions (other than redemption of units) may be made at the sole discretion of the Managing Owner on apro rata basis in accordance with the respective capital balances of the shareholders.
The Managing Owner has sole discretion in determining what distributions, if any, the Fund will make to Shareholders. A distribution for the year ended December 31, 2018 was paid on December 31, 2018 to holders of record as of December 26, 2018 at a rate of $0.20785 for each General Share and Share for a total distribution of $8 to General Shares and $1,662,800 to Shares.
The table below shows distributions per General Share and Share and in total for the years presented:
| Years Ended December 31, | ||||||||||||
| 2018 | 2017 | 2016 | ||||||||||
Distributions per General Share | $ | 0.20785 | $ | — | $ | — | ||||||
Distributions per Share | $ | 0.20785 | $ | — | $ | — | ||||||
Distributions paid to General Shares | $ | 8 | $ | — | $ | — | ||||||
Distributions paid to Shares | $ | 1,662,800 | $ | — | $ | — | ||||||
F. Routine Operational, Administrative and Other Ordinary Expenses
The Managing Owner is responsible for all routine operational, administrative and other ordinary expenses of the Fund, including, but not limited to, computer services, the fees and expenses of the Trustee, legal and accounting fees and expenses, tax preparation expenses, filing fees and printing, mailing and duplication costs. The Fund does not reimburse the Managing Owner for the routine operational, administrative and other ordinary expenses of the Fund. Accordingly, such expenses are not reflected in the Statements of Income and Expenses of the Fund.
45
G.Non-Recurring Fees and Expenses
The Fund pays allnon-recurring and unusual fees and expenses, if any, of itself, as determined by the Managing Owner.Non-recurring and unusual fees and expenses include fees and expenses, such as legal claims and liabilities, litigation costs, indemnification expenses or othernon-routine expenses.Non-recurring and unusual fees and expenses, by their nature, are unpredictable in terms of timing and amount. For the years ended December 31, 2018, 2017 and 2016, the Fund did not incur such expenses.
H. Brokerage Commissions and Fees
The Fund incurs all brokerage commissions, including applicable exchange fees, National Futures Association (“NFA”) fees,give-up fees, pit brokerage fees and other transaction related fees and expenses charged in connection with trading activities by the Commodity Broker (as defined below). These costs are recorded as Brokerage Commissions and Fees in the Statements of Income and Expenses. The Commodity Broker’s brokerage commissions and trading fees are determined on acontract-by-contract basis. On average, total charges paid to the Commodity Broker, as applicable were less than $6.00, $6.00 and $6.00 per round-turn trade during the years ended December 31, 2018, 2017 and 2016, respectively.
I. Income Taxes
The Fund is classified as a partnership for U.S. federal income tax purposes. Accordingly, the Fund will generally not incur U.S. federal income taxes. No provision for federal, state, and local income taxes has been made in the accompanying financial statements, as investors are individually liable for income taxes, if any, on their allocable share of the Fund’s income, gain, loss, deductions and other items.
The Managing Owner has reviewed all of the Fund’s open tax years and major jurisdictions and concluded that there is no tax liability resulting from unrecognized tax benefits relating to uncertain tax positions taken or expected to be taken in future tax returns. The Fund is also not aware of any tax positions for which it is reasonably possible that the total amounts of unrecognized tax benefits will significantly change in the next twelve months. The major tax jurisdiction for the Fund and the earliest tax year subject to examination: United States, 2015.
J. Commodity Futures Contracts
The Fund utilizes derivative instruments to achieve its investment objective. A commodity futures contract is an agreement between counterparties to purchase or sell a specified underlying commodity for a specified price, or to pay or receive a cash amount based on the value of an index or other reference instrument, at a future date. Initial margin deposits required upon entering into futures contracts are satisfied by the segregation of specific securities or cash as collateral with the Commodity Broker. During the period that the commodity futures contracts are open, changes in the value of the contracts are recognized as unrealized gains or losses by recalculating the value of the contracts on a daily basis. Subsequent or variation margin payments are received or made depending upon whether unrealized gains or losses are incurred. These amounts are reflected as a receivable or payable on the Statements of Financial Condition. When the contracts are closed or expire, the Fund recognizes a realized gain or loss equal to the difference between the proceeds from, or cost of, the closing transaction and the Fund’s basis in the contract. Realized gains (losses) and changes in unrealized appreciation (depreciation) on open positions are determined on a specific identification basis and recognized in the Statements of Income and Expenses in the period in which the contract is closed or the changes occur, respectively.
Note 3—Financial Instrument Risk
In the normal course of its business, the Fund is a party to financial instruments withoff-balance sheet risk. The term“off-balance sheet risk” refers to an unrecorded potential liability that, even though it does not appear on the balance sheet, may result in a future obligation or loss in excess of the amounts shown on the Statements of Financial Condition. The financial instruments used by the Fund are commodity futures contracts, the values of which are based upon an underlying asset and generally represent future commitments that have a reasonable possibility of being settled in cash or through physical delivery. The financial instruments are traded on an exchange and are standardized contracts.
Market risk is the potential for changes in the value of the financial instruments traded by the Fund due to market changes, including fluctuations in commodity prices. In entering into these futures contracts, there exists a market risk that such futures contracts may be significantly influenced by adverse market conditions, resulting in such futures contracts being less valuable. If the markets should move against all of the futures contracts at the same time, the Fund could experience substantial losses.
Credit risk is the possibility that a loss may occur due to the failure of the Commodity Broker and/or clearing house to perform according to the terms of a futures contract. Credit risk with respect to exchange-traded instruments is reduced to the extent that an exchange or clearing organization acts as a counterparty to the transactions. The Commodity Broker, when acting as the Fund’s futures commission merchant in accepting orders for the purchase or sale of domestic futures contracts, is required by CFTC regulations to separately account for and segregate as belonging to the Fund all assets of the Fund relating to domestic futures trading and the Commodity Broker is not allowed to commingle such assets with other assets of the Commodity Broker. In addition, CFTC regulations also require the Commodity Broker to hold in a secure account assets of the Fund related to foreign futures trading. The Fund’s risk of loss in the event of counterparty default is typically limited to the amounts recognized in the Statements of Financial Condition and not represented by the futures contract or notional amounts of the instruments.
46
The Fund has not utilized, nor does it expect to utilize in the future, special purpose entities to facilitateoff-balance sheet financing arrangements and has no loan guarantee arrangements oroff-balance sheet arrangements of any kind, other than agreements entered into in the normal course of business noted above.
Note 4 — Service Providers and Related Party Agreements
The Trustee
Under the Trust Agreement, Wilmington Trust Company, the trustee of the Trust and the Fund (the “Trustee”), has the power and authority to execute and file certificates as required by the Delaware Statutory Trust Act and to accept service of process on the Fund in the State of Delaware. The Managing Owner has the exclusive management and control of all aspects of the business of the Trust and the Fund. The Trustee will serve in that capacity until such time as the Managing Owner removes the Trustee or the Trustee resigns and a successor is appointed by the Managing Owner. The Trustee will have no duty or liability to supervise or monitor the performance of the Managing Owner, nor will the Trustee have any liability for the acts or omissions of the Managing Owner.
The Managing Owner
The Managing Owner serves as the Fund’s commodity pool operator, commodity trading advisor and managing owner. The Fund pays the Managing Owner a management fee, monthly in arrears, in an amount equal to 0.75% per annum of the daily NAV of the Fund (the “Management Fee”). The Fund, for cash management purposes, invests in money market mutual funds and/orT-Bill ETFs that are managed by affiliates of the Managing Owner. The indirect portion of the management fee that the Fund incurs through such investments is in addition to the Management Fee paid to the Managing Owner. The Managing Owner has contractually agreed to waive indefinitely the fees that it receives in an amount equal to the indirect management fees that the Fund incurs through its investments in affiliated money market mutual funds and/or affiliatedT-Bill ETFs. The Managing Owner may terminate this fee waiver on 60 days notice.
The Managing Owner waived fees of $35,111, $32,978 and $4,790 for the years ended December 31, 2018, 2017 and 2016, respectively.
The Distributor
Effective June 20, 2016, Invesco Distributors, Inc. (the “Distributor”) became distributor and began providing certain distribution services to the Fund. Pursuant to the Distribution Services Agreement among the Managing Owner, the Fund and the Distributor, the Distributor assists the Managing Owner and the Fund’s administrator, The Bank of New York Mellon with certain functions and duties relating to distribution and marketing services to the Fund including reviewing and approving marketing materials. Prior to June 20, 2016, ALPS Distributors, Inc. provided distribution services to the Fund.
The Managing Owner pays the Distributor a distribution fee out of the Management Fee.
The Commodity Broker
Morgan Stanley & Co. LLC, a Delaware limited liability company, serves as the Fund’s futures clearing broker (the “Commodity Broker”). The Commodity Broker is registered with the CFTC as a futures commission merchant and is a member of the NFA in such capacity.
A variety of executing brokers execute futures transactions on behalf of the Fund. Such executing brokersgive-up all such transactions to the Commodity Broker. In its capacity as clearing broker, the Commodity Broker may execute or receive transactions executed by others and clears all of the Fund’s futures transactions and performs certain administrative and custodial services for the Fund. The Commodity Broker is responsible, among other things, for providing periodic accountings of all dealings and actions taken by the Fund during the reporting period, together with an accounting of all securities, cash or other indebtedness or obligations held by it or its nominees for or on behalf of the Fund.
The Administrator, Custodian and Transfer Agent
The Bank of New York Mellon (the “Administrator”, “Custodian” and “Transfer Agent”) is the administrator, custodian and transfer agent of the Fund. The Fund and the Administrator have entered into separate administrative, custodian, transfer agency and service agreements (collectively referred to as the “Administration Agreement”).
Pursuant to the Administration Agreement, the Administrator performs or supervises the performance of services necessary for the operation and administration of the Fund (other than making investment decisions), including receiving and processing orders from Authorized Participants to create and redeem Baskets, NAV calculations, accounting and other fund administrative services. The Administrator maintains certain financial books and records, including: Basket creation and redemption records; fund accounting records; ledgers with respect to assets, liabilities, capital, income and expenses; the registrar, transfer journals and related details; and trading and related documents received from the Commodity Broker. The Managing Owner pays the Administrator fees for its services out of the Management Fee.
47
Index Sponsor
The Managing Owner, on behalf of the Fund, has appointed Deutsche Investment Management Americas Inc. to serve as the index sponsor (the “Index Sponsor”). The Index Sponsor calculates and publishes the daily index levels and the indicative intraday index levels. Additionally, the Index Sponsor also calculates the indicative value per Share of the Fund throughout each business day.
The Managing Owner pays the Index Sponsor a licensing fee and an index services fee out of the Management Fee for performing its duties.
Note 5—Deposits with Commodity Broker and Custodian
The Fund defines cash as cash held by the Custodian. There were no cash equivalents held by the Fund as of December 31, 2018 and 2017.
The Fund may deposit cash, United States Treasury Obligations,T-Bill ETFs and money market mutual funds with the Commodity Broker as margin, to the extent permissible under CFTC rules. The combination of the Fund’s deposits with its Commodity Broker of cash and United States Treasury Obligations and the unrealized profit or loss on open futures contracts represents the Fund’s overall equity in its broker trading account. To meet the Fund’s maintenance margin requirements, the Fund holds United States Treasury Obligations with the Commodity Broker. The Fund transfers cash to the Commodity Broker to satisfy variation margin requirements. The Fund earns interest on any excess cash deposited with the Commodity Broker and incurs interest expense on any deficit balance with the Commodity Broker.
The brokerage agreement with the Commodity Broker provides for the net settlement of all financial instruments covered by the agreement in the event of default or termination of any one contract. The Managing Owner will utilize any excess cash held at the Commodity Broker to offset any realized losses incurred in the commodity futures contracts, if available. To the extent that any excess cash held at the Commodity Broker is not adequate to cover any realized losses, a portion of the United States Treasury Obligations andT-Bill ETFs, if any, on deposit with the Commodity Broker will be sold to make additional cash available. For financial reporting purposes, the Fund offsets financial assets and financial liabilities that are subject to legally enforceable netting arrangements.
The Fund’s remaining cash, United States Treasury Obligations,T-Bill ETFs and money market mutual fund holdings are on deposit with the Custodian. The Fund is permitted to temporarily carry a negative or overdrawn balance in its account with the Custodian. The Fund incurs interest expense on any overdraft balance with the Custodian. Such balances, if any atperiod-end, are shown on the Statements of Financial Condition under the payable captionDue to custodian.
Note 6—Additional Valuation Information
U.S. GAAP defines fair value as the price that would be received to sell an asset or paid to transfer a liability in an orderly transaction between market participants at the measurement date, under current market conditions. U.S. GAAP establishes a hierarchy that prioritizes the inputs to valuation methods, giving the highest priority to readily available unadjusted quoted prices in an active market for identical assets (Level 1) and the lowest priority to significant unobservable inputs (Level 3), generally when market prices are not readily available or are unreliable. Based on the valuation inputs, the securities or other investments are tiered into one of three levels. Changes in valuation methods or market conditions may result in transfers in or out of an investment’s assigned level:
Level 1: Prices are determined using quoted prices in an active market for identical assets.
Level 2: Prices are determined using other significant observable inputs. Observable inputs are inputs that other market participants may use in pricing a security. These may include quoted prices for similar securities, interest rates, prepayment speeds, credit risk, yield curves, loss severities, default rates, discount rates, volatilities and others.
Level 3: Prices are determined using significant unobservable inputs. In situations where quoted prices or observable inputs are unavailable (for example, when there is little or no market activity for an investment at the end of the period), unobservable inputs may be used. Unobservable inputs reflect the Fund’s own assumptions about the factors market participants would use in determining fair value of the securities or instruments and would be based on the best available information.
The levels assigned to the securities valuations may not be an indication of the risk or liquidity associated with investing in those securities. Because of the inherent uncertainties of valuation, the values reflected in the financial statements may materially differ from the value received upon actual sale of those investments.
48
The following is a summary of the tiered valuation input levels as of December 31, 2018:
| Level 1 | Level 2 | Level 3 | Total | |||||||||||||
Investments in Securities | ||||||||||||||||
United States Treasury Obligations | $ | — | $ | 67,734,740 | $ | — | $ | 67,734,740 | ||||||||
Exchange-Traded Fund | 20,012,512 | — | — | 20,012,512 | ||||||||||||
Money Market Mutual Fund | 4,903,717 | — | — | 4,903,717 | ||||||||||||
|
|
|
|
|
|
|
| |||||||||
Total Investments in Securities | 24,916,229 | 67,734,740 | — | 92,650,969 | ||||||||||||
|
|
|
|
|
|
|
| |||||||||
Other Investments—Assets(a) | ||||||||||||||||
Commodity Futures Contracts | 108,092 | — | — | 108,092 | ||||||||||||
|
|
|
|
|
|
|
| |||||||||
Other Investments—Liabilities(a) | ||||||||||||||||
Commodity Futures Contracts | (22,776,831 | ) | — | — | (22,776,831 | ) | ||||||||||
|
|
|
|
|
|
|
| |||||||||
Total Other Investments | (22,668,739 | ) | — | — | (22,668,739 | ) | ||||||||||
|
|
|
|
|
|
|
| |||||||||
Total Investments | $ | 2,247,490 | $ | 67,734,740 | $ | — | $ | 69,982,230 | ||||||||
|
|
|
|
|
|
|
| |||||||||
| (a) | Unrealized appreciation (depreciation). |
The following is a summary of the tiered valuation input levels as of December 31, 2017:
| Level 1 | Level 2 | Level 3 | Total | |||||||||||||
Investments in Securities | ||||||||||||||||
United States Treasury Obligations | $ | — | $ | 142,797,721 | $ | — | $ | 142,797,721 | ||||||||
Exchange-Traded Fund | 19,980,246 | — | — | 19,980,246 | ||||||||||||
Money Market Mutual Fund | 13,304,167 | — | — | 13,304,167 | ||||||||||||
|
|
|
|
|
|
|
| |||||||||
Total Investments in Securities | 33,284,413 | 142,797,721 | — | 176,082,134 | ||||||||||||
|
|
|
|
|
|
|
| |||||||||
Other Investments—Assets(a) | ||||||||||||||||
Commodity Futures Contracts | 16,400,459 | — | — | 16,400,459 | ||||||||||||
|
|
|
|
|
|
|
| |||||||||
Other Investments—Liabilities(a) | ||||||||||||||||
Commodity Futures Contracts | (701,709 | ) | — | — | (701,709 | ) | ||||||||||
|
|
|
|
|
|
|
| |||||||||
Total Other Investments | 15,698,750 | — | — | 15,698,750 | ||||||||||||
|
|
|
|
|
|
|
| |||||||||
Total Investments | $ | 48,983,163 | $ | 142,797,721 | $ | — | $ | 191,780,884 | ||||||||
|
|
|
|
|
|
|
| |||||||||
| (a) | Unrealized appreciation (depreciation). |
Note 7 — Derivative Instruments
The Fair Value of Derivative Instruments is as follows:
| December 31, | ||||||||||||||||
| 2018 | 2017 | |||||||||||||||
Risk Exposure/Derivative Type(a) | Assets | Liabilities | Assets | Liabilities | ||||||||||||
Commodity risk | ||||||||||||||||
Commodity Futures Contracts | $ | 108,092 | $ | (22,776,831 | ) | $ | 16,400,459 | $ | (701,709 | ) | ||||||
| (a) | Includes cumulative appreciation (depreciation) of commodity futures contracts. Only the current day’s variation margin receivable (payable) is reported in the December 31, 2018 and December 31, 2017 Statements of Financial Condition. |
49
The following table presents derivative instruments that are either subject to an enforceable netting agreement or offset by collateral arrangements as of December 31, 2018, net by contract:
| Financial Derivative Assets | Financial Derivative Liabilities | Collateral (Received)/Pledged(a) | ||||||||||||||||||||||
Counterparty | Futures Contracts | Futures Contracts | Net value of derivatives | Non-Cash | Cash | Net amount | ||||||||||||||||||
Morgan Stanley & Co. LLC | $ | 22,867,855 | $ | (22,776,831 | ) | $ | 91,024 | $ | — | $ | — | $ | 91,024 | |||||||||||
The following table presents derivative instruments that are either subject to an enforceable netting agreement or offset by collateral arrangements as of December 31, 2017, net by contract:
| Financial Derivative Assets | Financial Derivative Liabilities | Collateral (Received)/Pledged(a) | ||||||||||||||||||||||
Counterparty | Futures Contracts | Futures Contracts | Net value of derivatives | Non-Cash | Cash | Net amount | ||||||||||||||||||
Morgan Stanley & Co. LLC | $ | 16,400,459 | $ | (15,188,091 | ) | $ | 1,212,368 | $ | — | $ | — | $ | 1,212,368 | |||||||||||
| (a) | As of December 31, 2018 and 2017, a portion of the Fund’s U.S. Treasury Obligations were required to be deposited as maintenance margin in support of the Fund’s futures positions. |
The Effect of Derivative Instruments on the Statements of Income and Expenses is as follows:
| For the Years Ended | ||||||||||||||||
| Location of Gain or (Loss) on Derivatives | December 31, | |||||||||||||||
Risk Exposure/Derivative Type | Recognized in Income | 2018 | 2017 | 2016 | ||||||||||||
Commodity risk | ||||||||||||||||
Commodity Futures Contracts | Net Realized Gain (Loss) | $ | 12,504,489 | $ | 3,484,990 | $ | (20,246,167 | ) | ||||||||
| Net Change in Unrealized Gain (Loss) | (38,367,489) | 2,654,294 | 42,171,744 | |||||||||||||
|
|
|
|
|
| |||||||||||
Total | $ | (25,863,000 | ) | $ | 6,139,284 | $ | 21,925,577 | |||||||||
|
|
|
|
|
| |||||||||||
The table below summarizes the average monthly notional value of futures contracts outstanding during the period:
| Years Ended December 31, | ||||||||||||
| 2018 | 2017 | 2016 | ||||||||||
Average Notional Value | $ | 196,313,610 | $ | 148,904,896 | $ | 123,907,251 | ||||||
Note 8 — Investments in Affiliates
The Invesco Treasury Collateral ETF (formerly PowerShares Treasury Collateral Portfolio) is an investment company registered under the Investment Company Act of 1940, as amended, whose shares are primarily purchased and sold on a national securities exchange. In seeking its investment objective, the Invesco Treasury Collateral ETF primarily holds U.S. Treasury Obligations that: (i) are issued in U.S. Dollars; (ii) have a minimum remaining maturity of at least one month and a maximum remaining maturity of 12 months at the time of rebalance; and (iii) have a minimum amount outstanding of $300 million. Because it is advised by the Managing Owner, the Invesco Treasury Collateral ETF is an affiliate of the Fund.
The following is a summary of the transactions in, and earnings from, investments in affiliates (excluding affiliated money market funds) for the year ended December 31, 2018.
| Value 12/31/2017 | Purchases at Cost | Proceeds from Sales | Change in Unrealized Appreciation (Depreciation) | Realized Gain (Loss) | Value 12/31/2018 | Dividend Income | ||||||||||||||||||||||
Invesco Treasury Collateral ETF | $ | 19,980,246 | $ | — | $ | — | $ | 32,266 | $ | — | $ | 20,012,512 | $ | 338,096 | ||||||||||||||
50
The following is a summary of the transactions in, and earnings from, investments in affiliates (excluding affiliated money market funds) for the year ended December 31, 2017.
| Value 12/31/2016 | Purchases at Cost | Proceeds from Sales | Change in Unrealized Appreciation (Depreciation) | Realized Gain (Loss) | Value 12/31/2017 | Dividend Income | ||||||||||||||||||||||
PowerShares Treasury Collateral Portfolio | $ | — | $ | 20,000,061 | $ | — | $ | (19,815 | ) | $ | — | $ | 19,980,246 | $ | 141,750 | |||||||||||||
Note 9—Share Purchases and Redemptions
(a) Purchases
On any business day, an Authorized Participant may place an order with the Transfer Agent to create one or more Baskets. Each Basket consists of a block of 200,000 Shares. For purposes of processing both creation and redemption orders, a “business day” means any day other than a day when banks in New York City are required or permitted to be closed. Creation orders must be placed by 10:00 a.m., Eastern Time. The day on which the Transfer Agent receives a valid creation order is the creation order date. The day on which a creation order is settled is the creation order settlement date. Cash settlement occurs at the creation order settlement date. As provided below, the creation order settlement date may occur up to two business days after the creation order date. By placing a creation order, and prior to delivery of such Baskets, an Authorized Participant’s Depository Trust Company (“DTC”) account is charged thenon-refundable transaction fee due for the creation order.
Unless otherwise agreed to by the Managing Owner and the Authorized Participant as provided in the next sentence, Baskets are issued on the creation order settlement date as of 2:45 p.m., Eastern Time, on the business day immediately following the creation order date at the applicable NAV per Share as of the closing time of the NYSE Arca or the last to close of the exchanges on which its futures contracts are traded, whichever is later, on the creation order date, but only if the required payment has been timely received. Upon submission of a creation order, the Authorized Participant may request the Managing Owner to agree to a creation order settlement date up to two business days after the creation order date.
(b) Redemptions
On any business day, an Authorized Participant may place an order with the Transfer Agent to redeem one or more Baskets. Redemption orders must be placed by 10:00 a.m., Eastern Time. The day on which the Managing Owner receives a valid redemption order is the redemption order date. The day on which a redemption order is settled is the redemption order settlement date. Cash settlement occurs at the redemption order settlement date. As provided below, the redemption order settlement date may occur up to two business days after the redemption order date. The redemption procedures allow Authorized Participants to redeem Baskets. Individual Shareholders may not redeem directly from the Fund. Instead, individual Shareholders may only redeem Shares in integral multiples of 200,000 and only through an Authorized Participant.
Unless otherwise agreed to by the Managing Owner and the Authorized Participant as provided in the next sentence, by placing a redemption order, an Authorized Participant agrees to deliver the Baskets to be redeemed through DTC’s book-entry system to the Fund no later than the redemption order settlement date as of 2:45 p.m., Eastern Time, on the business day immediately following the redemption order date. Upon submission of a redemption order, the Authorized Participant may request the Managing Owner to agree to a redemption order settlement date up to two business days after the redemption order date. By placing a redemption order, and prior to receipt of the redemption proceeds, an Authorized Participant’s DTC account is charged thenon-refundable transaction fee due for the redemption order.
The redemption proceeds from the Fund consist of the cash redemption amount. The cash redemption amount is equal to the NAV of the number of Basket(s) requested in the Authorized Participant’s redemption order as of the closing time of the NYSE Arca or the last to close of the exchanges on which the Fund’s futures contracts are traded, whichever is later, on the redemption order date. The Managing Owner will distribute the cash redemption amount at the redemption order settlement date as of 2:45 p.m., Eastern Time, on the redemption order settlement date through DTC to the account of the Authorized Participant as recorded on DTC’s book-entry system.
The redemption proceeds due from the Fund are delivered to the Authorized Participant at 2:45 p.m., Eastern Time, on the redemption order settlement date if, by such time, the Fund’s DTC account has been credited with the Baskets to be redeemed. If the Fund’s DTC account has not been credited with all of the Baskets to be redeemed by such time, the redemption distribution is delivered to the extent of whole Baskets received. Any remainder of the redemption distribution is delivered on the next business day to the extent of remaining whole Baskets received if the Transfer Agent receives the fee applicable to the extension of the redemption distribution date which the Managing Owner may, fromtime-to-time, determine and the remaining Baskets to be redeemed are credited to the Fund’s DTC account by 2:45 p.m., Eastern Time, on such next business day. Any further outstanding amount of the redemption order will be cancelled. The Managing Owner is also authorized to deliver the redemption distribution notwithstanding that the Baskets to be redeemed are not credited to the Fund’s DTC account by 2:45 p.m., Eastern Time, on the redemption order settlement date if the Authorized Participant has collateralized its obligation to deliver the Baskets through DTC’s book-entry system on such terms as the Managing Owner may determine fromtime-to-time.
51
Note 10—Commitments and Contingencies
The Managing Owner, either in its own capacity or in its capacity as the Managing Owner and on behalf of the Fund, has entered into various service agreements that contain a variety of representations, or provide indemnification provisions related to certain risks service providers undertake in performing services for the Fund. The Trust Agreement provides for the Fund to indemnify the Managing Owner and any affiliate of the Managing Owner that provides services to the Fund to the maximum extent permitted by applicable law, subject to certain exceptions for disqualifying conduct by the Managing Owner or such an affiliate. The Fund’s maximum exposure under these arrangements is unknown as this would involve future claims that may be made against the Fund that have not yet occurred. Further, the Fund has not had prior claims or losses pursuant to these contracts. Accordingly, the Managing Owner expects the risk of loss to be remote.
52
Note 11—Financial Highlights
The Fund is presenting the following NAV and financial highlights related to investment performance for a Share outstanding for the years ended December 31, 2018, 2017 and 2016. An individual investor’s return and ratios may vary based on the timing of capital transactions.
NAV per Share is the NAV of the Fund divided by the number of outstanding Shares at the date of each respective period presented.
| Years Ended December 31, | ||||||||||||
| 2018 | 2017 | 2016 | ||||||||||
Net Asset Value | ||||||||||||
Net asset value per Share, beginning of period | $ | 14.59 | $ | 13.80 | $ | 11.15 | ||||||
Net realized and change in unrealized gain (loss) on United States Treasury Obligations, Affiliated Investments and Commodity Futures Contracts | (2.22 | ) | 0.78 | 2.71 | ||||||||
Net investment income (loss)(a) | 0.17 | 0.01 | (0.06 | ) | ||||||||
|
|
|
|
|
| |||||||
Net income (loss) | (2.05 | ) | 0.79 | 2.65 | ||||||||
|
|
|
|
|
| |||||||
Less: | ||||||||||||
Return of Capital Distributions | (0.21 | ) | — | — | ||||||||
|
|
|
|
|
| |||||||
Net asset value per Share, end of period | $ | 12.33 | $ | 14.59 | $ | 13.80 | ||||||
|
|
|
|
|
| |||||||
Market value per Share, beginning of period(b) | $ | 14.54 | $ | 13.79 | $ | 11.17 | ||||||
|
|
|
|
|
| |||||||
Market value per Share, end of period(b) | $ | 12.43 | $ | 14.54 | $ | 13.79 | ||||||
|
|
|
|
|
| |||||||
Ratio to average Net Assets | ||||||||||||
Net investment income (loss) | 1.07 | % | 0.05 | % | (0.48 | )% | ||||||
|
|
|
|
|
| |||||||
Expenses, after waivers | 0.76 | % | 0.76 | % | 0.78 | % | ||||||
|
|
|
|
|
| |||||||
Expenses, prior to waivers | 0.78 | % | 0.78 | % | 0.79 | % | ||||||
|
|
|
|
|
| |||||||
Total Return, at net asset value(c) | (14.01 | )% | 5.72 | % | 23.77 | % | ||||||
|
|
|
|
|
| |||||||
Total Return, at market value(c) | (13.05 | )% | 5.44 | % | 23.46 | % | ||||||
|
|
|
|
|
| |||||||
| (a) | Based on average shares outstanding. |
| (b) | The mean between the last bid and ask prices. |
| (c) | Total Return, at NAV is calculated assuming an initial investment made at the NAV at the beginning of the period, reinvestment of all dividends and distributions at NAV during the period, and redemption of Shares on the last day of the period. Total Return, at NAV includes adjustments in accordance with U.S. GAAP and as such, the NAV for financial reporting purposes and the returns based upon those NAVs may differ from the NAVs and returns for shareholder transactions. Total Return, at market value is calculated assuming an initial investment made at the market value at the beginning of the period, reinvestment of all dividends and distributions at market value during the period, and redemption of Shares at the market value on the last day of the period. Not annualized for periods less than one year, if applicable. |
53
| ITEM 9. | CHANGES IN AND DISAGREEMENTS WITH ACCOUNTANTS ON ACCOUNTING AND FINANCIAL DISCLOSURE |
None.
| ITEM 9A. | CONTROLS AND PROCEDURES |
For purposes of this Item 9A, all references to the “Fund” shall be read to specifically include the Fund and the Trust. Please note that the disclosure controls and procedures and internal control over financial reporting of the Trust are the aggregate disclosure controls and procedures and internal control over financial reporting of the Fund and that of Invesco DB Agriculture Fund, Invesco DB Base Metals Fund, Invesco DB Gold Fund, Invesco DB Oil Fund, Invesco DB Precious Metals Fund and Invesco DB Silver Fund, each a series of the Trust.
Evaluation of Disclosure Controls and Procedures
Under the supervision and with the participation of the management of the Managing Owner, including Daniel Draper, its Principal Executive Officer, and Kelli Gallegos, its Principal Financial and Accounting Officer, Investment Pools, the Fund carried out an evaluation of the effectiveness of the design and operation of its disclosure controls and procedures (as defined in Rule13a-15(e) or15d-15(e) of the Securities Exchange Act of 1934, as amended (the “Exchange Act”)) as of December 31, 2018, the end of the period covered by this annual report, and, based upon that evaluation, Daniel Draper, the Principal Executive Officer of the Managing Owner, and Kelli Gallegos, the Principal Financial and Accounting Officer, Investment Pools, of the Managing Owner, concluded that the Fund’s disclosure controls and procedures were effective to provide reasonable assurance that information the Fund is required to disclose in the reports that it files or submits with the Securities and Exchange Commission (the “SEC”) under the Exchange Act is recorded, processed, summarized and reported, within the time periods specified in the SEC’s rules and forms, and to ensure that information required to be disclosed by the Fund in the reports that it files or submits under the Exchange Act is accumulated and communicated to management of the Managing Owner, including its Principal Executive Officer and Principal Financial Officer, as appropriate to allow timely decisions regarding required disclosure.
Changes in Internal Control Over Financial Reporting
There has been no change in internal control over financial reporting (as defined in the Rules13a-15(f) and15d-15(f) of the Exchange Act) that occurred during the quarter ended December 31, 2018 that has materially affected, or is reasonably likely to materially affect, the Fund’s internal control over financial reporting.
Management’s Annual Report on Internal Control Over Financial Reporting
Management of the Managing Owner is responsible for establishing and maintaining adequate internal control over financial reporting, as defined under Rules13a-15(f) and15d-15(f) of the Exchange Act, for the Fund. Daniel Draper, the Principal Executive Officer of the Managing Owner, and Kelli Gallegos, the Principal Financial and Accounting Officer, Investment Pools, of the Managing Owner, assessed the effectiveness of the Fund’s internal control over financial reporting as of December 31, 2018. Their report in connection with their assessment may be found in the “Report of Management on Internal Control Over Financial Reporting” on page 33 of this Annual Report on Form10-K.
The Fund’s independent registered public accounting firm, PricewaterhouseCoopers LLP, has audited the Fund’s internal control over financial reporting as of December 31, 2018, as stated in their report on page 34 of this Form10-K.
| ITEM 9B. | OTHER INFORMATION |
None.
54
| ITEM 10. | DIRECTORS AND EXECUTIVE OFFICERS OF THE REGISTRANT AND CORPORATE GOVERNANCE |
Board of Directors and Principal Officers
The Fund has no directors or principal officers and also does not have any employees. It is managed by the Managing Owner.
As of December 31, 2018, the board of managers and principal officers of the Managing Owner are as follows:
Name | Capacity | |
Daniel Draper | Chief Executive Officer, Board of Managers | |
Peter Hubbard | Vice President and Director of Portfolio Management | |
David Warren | Chief Administrative Officer, Board of Managers | |
Annette Lege | Principal | |
Kelli Gallegos | Principal Financial and Accounting Officer, Investment Pools | |
Melanie Zimdars | Chief Compliance Officer | |
John Zerr | Board of Managers | |
Brian Hartigan | Global Head of ETF Investments |
Invesco Group Services Inc. is also a principal of the Managing Owner.
The Managing Owner is managed by a Board of Managers. The Board of Managers is composed of Messrs. Draper, Warren and Zerr.
The Managing Owner has designated Mr. Hubbard as the trading principal of the Fund.
Daniel Draper (50) has been Chief Executive Officer of the Managing Owner since March 24, 2016. In this role, he has general oversight responsibilities for all of the Managing Owner’s business. Mr. Draper has been a Member of the Board of Managers of the Managing Owner since September 2013. In this role he is responsible for the management of the Managing Owner’s exchange traded fund business with direct functional reporting responsibilities for the Managing Owner’s portfolio management, products, marketing and capital markets teams. In such capacity, Mr. Draper also is responsible for managing the operations of the Invesco Funds. Previously, Mr. Draper was the Global Head of Exchange Traded Funds for Credit Suisse Asset Management, or Credit Suisse, based in London from March 2010 until June 2013, followed by a three monthnon-compete period pursuant to his employment terms with Credit Suisse. Credit Suisse is an asset management business of Credit Suisse Group, a financial services company. From January 2007 to March 2010, he was the Global Head of Exchange Traded Funds for Lyxor Asset Management in London, an investment management business unit of Societe Generale Corporate & Investment Banking. Mr. Draper was previously registered as a Significant Influence Functions (SIF) person with the UK’s Financial Conduct Authority. He withdrew SIF person status on June 30, 2013 when he left Credit Suisse. Mr. Draper received his MBA from the Kenan-Flagler Business School at the University of North Carolina at Chapel Hill and his BA from the College of William and Mary in Virginia. Mr. Draper is currently registered with FINRA and holds the Series 7, 24 and 63 registrations. Mr. Draper was listed as a principal of the Managing Owner on December 16, 2013.
Peter Hubbard (38) joined the Managing Owner in May 2005 as a portfolio manager and has been Vice President, Director of Portfolio Management since September 2012. In his role, Mr. Hubbard manages a team of eight portfolio managers. His responsibilities include facilitating all portfolio management processes associated with more than 200 equity and fixed income Invesco Funds listed in the United States, Canada and Europe. He is a graduate of Wheaton College with a B.A. degree in Business & Economics. Mr. Hubbard was listed as a principal and registered as an associated person of the Managing Owner on November 15, 2012 and January 1, 2013, respectively. Mr. Hubbard was registered as a swap associated person of the Managing Owner effective as of September 8, 2015.
David Warren (61) is Chief Administrative Officer, Americas, for Invesco Ltd., a global investment management company affiliated with the Managing Owner. He was appointed to this position in January 2007, and also holds the roles of Director, Executive Vice President and Chief Financial Officer of Invesco Canada Ltd., a Canadian investment management subsidiary of Invesco Ltd., since January 2009. He has been a Member of the Board of Managers and Chief Administrative Officer of the Managing Owner since January 2010, as well. In these capacities, Mr. Warren is responsible for general management support, in addition to executing on various strategic initiatives and overseeing the risk management framework for the business units operating within the Americas division of Invesco Ltd. He obtained a Bachelor’s Degree in Commerce from the University of Toronto as both a CA and CPA, and is a member of the Chartered Professional Accountants of Canada. Mr. Warren was listed as a principal of the Managing Owner on November 21, 2012.
Annette Lege(49) has been a Chief Accounting Officer and Head of Finance and Corporate Services (“FCS”) Business Services for Invesco Ltd. since March 2017. In this role, she is responsible for all aspects of Corporate Accounting including group financial reporting, internal controls and group accounting policies. Ms. Lege also manages Invesco’s Finance operations and shared service centers and has held this role since September 2015. Previously, Ms. Lege was Head of FCS Transformation Office from October
55
2013 through September 2015, with responsibility for business transformation initiatives taking place across FCS at Invesco. Before assuming that role in October 2013, Ms. Lege held the position of North American Corporate Controller at Invesco from March 2007 to October 2013. Ms. Lege is also a CPA, is licensed by FINRA as a Financial Operations Principal, and is a member of the Texas State Board of Public Accountants. Ms. Lege earned a BBA in accounting from the University of Houston. Ms. Lege was listed as a principal of the Managing Owner on March 30, 2017 and was listed as a principal of Invesco Advisors, Inc. on March 22, 2017.
Kelli Gallegos (48) has been Principal Financial and Accounting Officer – Investment Pools for the Managing Owner since September 2018. Additionally, since September 2018, Ms. Gallegos has been Principal Financial and Accounting Officer – Investment Pools of Invesco Specialized Products, LLC (sponsor to a suite of currency exchange-traded funds, “ISP”), Head of North America Fund Reporting of Invesco, Ltd. (“Invesco”, a global investment management company), and Vice President and Treasurer of Invesco Exchange Traded Fund Trust, Invesco Exchange-Traded Fund Trust II, Invesco India Exchange-Traded Fund Trust, Invesco Actively Managed Exchange-Traded Fund Trust, Invesco Actively Managed Exchange-Traded Commodity Fund Trust, and Invesco Exchange-Traded Self-Indexed Fund Trusts (each a registered investment company offering series of exchange-traded funds, the “Invesco ETFs”). She also serves as Vice President (since March 2016), Principal Financial Officer (since March 2016) and Assistant Treasurer (since December 2008) for a suite of mutual funds advised by Invesco Advisers, Inc., a registered investment adviser (the “Invesco Funds”). In her roles with the Managing Owner, ISP, Invesco, the Invesco ETFs and the Invesco Funds, Ms. Gallegos has financial and administrative oversight responsibilities for, and serves as Principal Financial Officer of the Invesco ETFs, the Trust, the Funds and the exchange-traded funds for which ISP serves as sponsor (the “CurrencyShares Trusts”). Previously, she was Director of Fund Financial Services from December 2008 to September 2018, Assistant Treasurer for the Managing Owner from January 2013 to September 2018, Assistant Treasurer of ISP from April 2018 to September 2018, Assistant Treasurer for the Invesco ETFs from September 2014 to September 2018 and Assistant Vice President for the Invesco Funds from December 2008 to March 2016. In such roles, Ms. Gallegos managed the group of personnel responsible for the preparation of fund financial statements and other information necessary for shareholder reports, fund prospectuses, regulatory filings, and for the coordination and oversight of third-party service providers of the Fund, the Invesco ETFs, the Invesco Funds, and the CurrencyShares Trusts. Ms. Gallegos earned a BBA in accounting from Harding University in Searcy, AR. Ms. Gallegos was listed as a principal of the Managing Owner on September 25, 2018.
Melanie H. Zimdars(42) has been Chief Compliance Officer of the Managing Owner since November 2017. In this role she is responsible for all aspects of regulatory compliance for the Managing Owner. Ms. Zimdars has also served as Chief Compliance Officer of Invesco Exchange-Traded Fund Trust, Invesco Exchange-Traded Fund Trust II, Invesco India Exchange-Traded Fund Trust, Invesco Actively Managed Exchange-Traded Fund Trust and Invesco Actively Managed Exchange-Traded Commodity Fund Trust since November 2017. From September 2009 to October 2017, she served as Vice President and Deputy Chief Compliance Officer at ALPS Holdings, Inc. where she was Chief Compliance Officer for six different mutual fund complexes, including active and passive ETFs andopen-end andclosed-end funds. Through its subsidiary companies, ALPS Holdings, Inc. is a provider of investment products and customized servicing solutions to the financial services industry. Ms. Zimdars received a BS degree from the University ofWisconsin-La Crosse. Ms. Zimdars was listed as a principal of the Managing Owner on February 1, 2018.
John Zerr (56) has been a Member of the Board of Managers of the Managing Owner since September 2006. Mr. Zerr has also served as Chief Operating Officer of the Americas for Invesco Ltd. since February 2018. Prior to his current position, Mr. Zerr served as Managing Director and General Counsel – U.S. Retail of Invesco Management Group, Inc., a registered investment adviser affiliated with the Managing Owner, from March 2006 until February 2018, where he was responsible for overseeing the U.S. Retail Legal Department for Invesco Ltd. and its affiliated companies. Mr. Zerr has also been a Senior Vice President and Secretary of IDI since March 2006 and June 2006, respectively. He also served as a Director of that entity until February 2010. Mr. Zerr has served as Senior Vice President of Invesco Advisers, Inc., a registered investment adviser affiliated with the Managing Owner, since December 2009. Mr. Zerr serves as a Director, Vice President and Secretary of Invesco Investment Services, Inc., a registered transfer agency since May 2007. Mr. Zerr has served as Director, Senior Vice President, General Counsel and Secretary of a number of other Invesco Ltd. wholly-owned subsidiaries which service or serviced portions of Invesco Ltd.’s U.S. Retail business since May 2007 and since June 2010 with respect to certain Van Kampen entities engaged in the asset management business that were acquired by Invesco Ltd. from Morgan Stanley. In each of the foregoing positions Mr. Zerr is responsible for overseeing legal operations. In such capacity, Mr. Zerr also is responsible for overseeing the legal activities of the Invesco Funds. Mr. Zerr earned a BA degree in economics from Ursinus College. He graduated cum laude with a J.D. from Temple University School of Law. Mr. Zerr was listed as a principal of the Managing Owner on December 6, 2012.
Brian Hartigan (40) joined the Managing Owner in May 2015 as Global Head of ETF Investments. In his role, Mr. Hartigan manages the portfolio management function at the Managing Owner, with the Director of Portfolio Management reporting to him. Previously from June 2010 until May of 2015, Mr. Hartigan was the Head of Portfolio Management and Research for Invesco Capital Markets, Inc., the sponsor of unit investment trusts. In that role, he oversaw portfolio management of Invesco unit trusts. He earned his B.A. from the University of St. Thomas in Minnesota and an MBA in finance from DePaul University. He is a CFA charterholder and a member of the CFA Society of Chicago. Mr. Hartigan was listed as a principal and registered as an associated person of the Managing Owner on February 21, 2018 and May 29, 2018, respectively.
56
Invesco Group Services Inc., which is a wholly owned, indirect subsidiary of Invesco Ltd., has been a principal of the Managing Owner since September 27, 2018 and has periodically been listed with NFA as a principal of other NFA members since May 17, 1990
Code of Ethics
The Fund has no officers or employees and is managed by Invesco Capital Management LLC. Invesco Capital Management LLC has adopted a code of ethics which applies to all of its employees and is available on request, free of charge, by calling1-800-983-0903 Monday through Friday, 8:00 a.m. to 5:00 p.m. Central Time.
| ITEM 11. | EXECUTIVE COMPENSATION |
The Fund has no employees, officers or directors. The Managing Owner receives a monthly Management Fee of 1/12th of 0.75% per annum of the daily NAV of the Fund at the end of each month.
For the year ended December 31, 2018, the Fund has incurred Management Fees of $1,503,272 of which $1,422,742 had been paid at December 31, 2018. Management Fees of $80,530 were unpaid at December 31, 2018 and are reported as a liability on the Statements of Financial Condition.
For the year ended December 31, 2018, the Fund has incurred brokerage commissions of $29,556 of which $24,996 had been paid at December 31, 2018. Brokerage commissions of $4,560 were unpaid at December 31, 2018 and are reported as a liability on the Statements of Financial Condition.
For the year ended December 31, 2017, the Fund has incurred Management Fees of $1,088,651 of which $982,490 had been paid at December 31, 2017. Management Fees of $106,161 were unpaid at December 31, 2017 and are reported as a liability on the Statements of Financial Condition.
For the year ended December 31, 2017, the Fund has incurred brokerage commissions of $38,053 of which $33,033 had been paid at December 31, 2017. Brokerage commissions of $5,020 were unpaid at December 31, 2017 and are reported as a liability on the Statements of Financial Condition.
For the year ended December 31, 2016, the Fund has incurred Management Fees of $915,058 of which $792,073 had been paid at December 31, 2016. Management Fees of $122,985 were unpaid at December 31, 2016 and are reported as a liability on the Statements of Financial Condition.
For the year ended December 31, 2016, the Fund has incurred brokerage commissions of $40,509 of which $37,933 had been paid at December 31, 2016. Brokerage commissions of $2,576 were unpaid at December 31, 2016 and are reported as a liability on the Statements of Financial Condition.
| ITEM 12. | SECURITY OWNERSHIP OF CERTAIN BENEFICIAL OWNERS AND MANAGEMENT AND RELATED STOCKHOLDER MATTERS |
The Fund has no officers or directors. The following table sets forth certain information regarding beneficial ownership of the Fund’s General Shares and Shares as of January 31, 2019, as known by management.
Title of Class | Name and Address of Beneficial Owner | Amount and Nature of Beneficial Ownership | Percent of Class | |||||
General Shares | Invesco Capital Management LLC 3500 Lacey Road, Suite 700 Downers Grove, Illinois 60515 | 40 | 100% | |||||
Shares | Invesco Ltd. 1555 Peachtree Street NE, Suite 1800 Atlanta, GA 30309 | 1,536,900 | 21.96% | |||||
Directors and Officers of Invesco Capital Management LLC as a group | — | Less than 0.01% | ||||||
The Fund has no securities authorized for issuance under equity compensation plans.
| ITEM 13. | CERTAIN RELATIONSHIPS AND RELATED TRANSACTIONS, AND DIRECTOR INDEPENDENCE |
See Item 11.
57
| ITEM 14. | PRINCIPAL ACCOUNTANT FEES AND SERVICES |
Audit andNon-Audit Fees
The following table sets forth the fees for professional services rendered by PricewaterhouseCoopers LLP, the Fund’s independent registered public accounting firm for the years ended December 31, 2018 and 2017.
| Fiscal Years Ended December 31, | ||||||||
| 2018 | 2017 | |||||||
Audit Fees | $ | 78,660 | $ | 86,034 | ||||
Audit-Related Fees(1) | 2,100 | — | ||||||
Tax Fees(2) | 140,564 | 109,943 | ||||||
All Other Fees | — | — | ||||||
|
|
|
| |||||
Total | $ | 221,324 | $ | 195,977 | ||||
|
|
|
| |||||
| (1) | Audit-Related Fees for fiscal year ended December 31, 2018 include fees billed for reviewing regulatory filings. |
| (2) | Tax Fees for fiscal years ended December 31, 2018 and 2017 include fees billed for preparing tax forms. |
Approval of Independent Registered Public Accounting Firm Services and Fees
The Managing Owner approved all of the services provided by PricewaterhouseCoopers LLP to the Fund described above. The Managing Ownerpre-approved all audit and allowednon-audit services of the Fund’s independent registered public accounting firm, including all engagement fees and terms.
58
ITEM 15. EXHIBITS AND FINANCIAL STATEMENT
SCHEDULES (a)(1) Financial Statements
See financial statements commencing on page 32 hereof.
(a)(2) Financial Statement Schedules
No financial statement schedules are filed herewith because (i) such schedules are not required or (ii) the information required has been presented in the aforementioned financial statements.
(a)(3) Exhibits
The following documents (unless otherwise indicated) are filed herewith and made a part of this Annual Report:
EXHIBIT NO. | DESCRIPTION | |
| 4.1 | Fifth Amended and Restated Declaration of Trust and Trust Agreement of the Registrant1 | |
| 4.1.1 | Amendment No. 1 to the Fifth Amended and Restated Declaration of Trust and Trust Agreement of the Registrant2 | |
| 4.1.2 | Amendment No. 2 to the Fifth Amended and Restated Declaration of Trust and Trust Agreement of the Registrant3 | |
| 4.2 | Form of Participant Agreement4 | |
| 10.1 | Form of Customer Agreement5 | |
| 10.2 | Form of Administration Agreement4 | |
| 10.3 | Form of Global Custody Agreement4 | |
| 10.4 | Form of Transfer Agency and Service Agreement4 | |
| 10.5 | Distribution Services Agreement2 | |
| 31.1 | Certification required under Exchange Act Rules13a-14 and15d-14 (filed herewith) | |
| 31.2 | Certification required under Exchange Act Rules13a-14 and15d-14 (filed herewith) | |
| 32.1 | Certification of Principal Executive Officer pursuant to 18 U.S.C. Section 1350 as adopted pursuant to Section 906 of the Sarbanes-Oxley Act of 2002 (furnished herewith) | |
| 32.2 | Certification of Principal Financial Officer pursuant to 18 U.S.C. Section 1350 as adopted pursuant to Section 906 of the Sarbanes-Oxley Act of 2002 (furnished herewith) | |
| 101 | Interactive data file pursuant to Rule 405 of RegulationS-T: (i) the Statements of Financial Condition of Invesco DB Energy Fund - December 31, 2018 and December 31, 2017, (ii) the Schedule of Investments of Invesco DB Energy Fund - December 31, 2018, (iii) the Schedule of Investments of Invesco DB Energy Fund - December 31, 2017, (iv) the Statements of Income and Expenses of Invesco DB Energy Fund - Years Ended December 31, 2018, 2017 and 2016, (v) the Statement of Changes in Shareholders’ Equity of Invesco DB Energy Fund - Year Ended December 31, 2018, (vi) the Statement of Changes in Shareholders’ Equity of Invesco DB Energy Fund - Year Ended December 31, 2017, (vii) the Statement of Changes in Shareholders’ Equity of Invesco DB Energy Fund - Year Ended December 31, 2016, (viii) the Statements of Cash Flows of Invesco DB Energy Fund - Years Ended December 31, 2018, 2017 and 2016, and (ix) Notes to Financial Statements of Invesco DB Energy Fund. | |
| 1 | Previously filed as an exhibit to Form8-K on February 25, 2015 and incorporated herein by reference. |
| 2 | Previously filed as an exhibit to Form8-K on June 20, 2016 and incorporated herein by reference. |
| 3 | Previously filed as an exhibit to Form8-K on June 4, 2018 and incorporated herein by reference. |
| 4 | Previously filed as an exhibit toPre-Effective Amendment No. 2 to a Registration Statement on FormS-1 on December 14, 2006 and incorporated herein by reference. |
| 5 | Previously filed as an exhibit to Form8-K on February 26, 2015 and incorporated herein by reference. |
59
SIGNATURES
Pursuant to the requirements of the Securities Exchange Act of 1934, the Registrant has duly caused this report to be signed on its behalf by the undersigned, thereunto duly authorized.
| Invesco DB Multi-Sector Commodity Trust on its own behalf and with respect to Invesco DB Energy Fund | ||||
| By: Invesco Capital Management LLC, | ||||
| its Managing Owner | ||||
| By: | /s/ DANIEL DRAPER | |||
| Name: | Daniel Draper | |||
| Title: | Principal Executive Officer | |||
| By: | /s/ KELLI GALLEGOS | |||
| Name: | Kelli Gallegos | |||
| Title: | Principal Financial and Accounting Officer, Investment Pools | |||
Dated: February 27, 2019
Exhibit 31.1
CERTIFICATION
I, Daniel Draper, certify that:
| 1. | I have reviewed this Annual Report on Form10-K of Invesco DB Energy Fund, a series of Invesco DB Multi-Sector Commodity Trust; |
| 2. | Based on my knowledge, this report does not contain any untrue statement of a material fact or omit to state a material fact necessary to make the statements made, in light of the circumstances under which such statements were made, not misleading with respect to the period covered by this report; |
| 3. | Based on my knowledge, the financial statements, and other financial information included in this report, fairly present in all material respects the financial condition, results of operations and cash flows of the registrant as of, and for, the periods presented in this report; |
| 4. | The registrant’s other certifying officer and I are responsible for establishing and maintaining disclosure controls and procedures (as defined in Exchange Act Rules 13a-15(e) and 15d-15(e)) and internal control over financial reporting (as defined in Exchange Act Rules 13a-15(f) and 15d-15(f)) for the registrant and have: |
| (a) | Designed such disclosure controls and procedures, or caused such disclosure controls and procedures to be designed under our supervision, to ensure that material information relating to the registrant, including its consolidated subsidiaries, is made known to us by others within those entities, particularly during the period in which this report is being prepared; |
| (b) | Designed such internal control over financial reporting, or caused such internal control over financial reporting to be designed under our supervision, to provide reasonable assurance regarding the reliability of financial reporting and the preparation of financial statements for external purposes in accordance with generally accepted accounting principles; |
| (c) | Evaluated the effectiveness of the registrant’s disclosure controls and procedures and presented in this report our conclusions about the effectiveness of the disclosure controls and procedures, as of the end of the period covered by this report based on such evaluation; and |
| (d) | Disclosed in this report any change in the registrant’s internal control over financial reporting that occurred during the registrant’s most recent fiscal quarter (the registrant’s fourth fiscal quarter in the case of an annual report) that has materially affected, or is reasonably likely to materially affect, the registrant’s internal control over financial reporting; and |
| 5. | The registrant’s other certifying officer and I have disclosed, based on our most recent evaluation of internal control over financial reporting, to the registrant’s auditors and the audit committee of the registrant’s board of directors (or persons performing the equivalent functions): |
| (a) | All significant deficiencies and material weaknesses in the design or operation of internal control over financial reporting which are reasonably likely to adversely affect the registrant’s ability to record, process, summarize and report financial information; and |
| (b) | Any fraud, whether or not material, that involves management or other employees who have a significant role in the registrant’s internal control over financial reporting. . |
| Dated: February 27, 2019 | /s/ Daniel Draper | |||||
| Daniel Draper | ||||||
| Principal Executive Officer |
Exhibit 31.2
CERTIFICATION
I, Kelli Gallegos, certify that:
| 1. | I have reviewed this Annual Report on Form10-K of Invesco DB Energy Fund, a series of Invesco DB Multi-Sector Commodity Trust; |
| 2. | Based on my knowledge, this report does not contain any untrue statement of a material fact or omit to state a material fact necessary to make the statements made, in light of the circumstances under which such statements were made, not misleading with respect to the period covered by this report; |
| 3. | Based on my knowledge, the financial statements, and other financial information included in this report, fairly present in all material respects the financial condition, results of operations and cash flows of the registrant as of, and for, the periods presented in this report; |
| 4. | The registrant’s other certifying officer and I are responsible for establishing and maintaining disclosure controls and procedures (as defined in Exchange Act Rules 13a-15(e) and 15d-15(e)) and internal control over financial reporting (as defined in Exchange Act Rules 13a-15(f) and 15d-15(f)) for the registrant and have: |
| (a) | Designed such disclosure controls and procedures, or caused such disclosure controls and procedures to be designed under our supervision, to ensure that material information relating to the registrant, including its consolidated subsidiaries, is made known to us by others within those entities, particularly during the period in which this report is being prepared; |
| (b) | Designed such internal control over financial reporting, or caused such internal control over financial reporting to be designed under our supervision, to provide reasonable assurance regarding the reliability of financial reporting and the preparation of financial statements for external purposes in accordance with generally accepted accounting principles; |
| (c) | Evaluated the effectiveness of the registrant’s disclosure controls and procedures and presented in this report our conclusions about the effectiveness of the disclosure controls and procedures, as of the end of the period covered by this report based on such evaluation; and |
| (d) | Disclosed in this report any change in the registrant’s internal control over financial reporting that occurred during the registrant’s most recent fiscal quarter (the registrant’s fourth fiscal quarter in the case of an annual report) that has materially affected, or is reasonably likely to materially affect, the registrant’s internal control over financial reporting; and |
| 5. | The registrant’s other certifying officer and I have disclosed, based on our most recent evaluation of internal control over financial reporting, to the registrant’s auditors and the audit committee of the registrant’s board of directors (or persons performing the equivalent functions): |
| (a) | All significant deficiencies and material weaknesses in the design or operation of internal control over financial reporting which are reasonably likely to adversely affect the registrant’s ability to record, process, summarize and report financial information; and |
| (b) | Any fraud, whether or not material, that involves management or other employees who have a significant role in the registrant’s internal control over financial reporting . |
| Dated: February 27, 2019 | /s/ Kelli Gallegos | |||||
| Kelli Gallegos | ||||||
| Principal Financial and Accounting Officer, Investment Pools |
Exhibit 32.1
CERTIFICATION PURSUANT TO
18 U.S.C. SECTION 1350
AS ADOPTED PURSUANT TO
SECTION 906 OF THE SARBANES-OXLEY ACT OF 2002
The undersigned, Daniel Draper, Principal Executive Officer of Invesco Capital Management LLC, the Managing Owner of Invesco DB Energy Fund (the “Fund”), a series of Invesco DB Multi-Sector Commodity Trust, hereby certifies pursuant to 18 U.S.C. Section 1350, as adopted pursuant to Section 906 of the Sarbanes-Oxley Act of 2002, that:
| (1) | The Fund’s Annual Report on Form10-K for the year ended December 31, 2018, as filed with the Securities and Exchange Commission on the date hereof (the “Annual Report”), fully complies with the requirements of Section 13(a) or 15(d) of the Securities Exchange Act of 1934, as amended; |
| (2) | The information contained in the Annual Report fairly presents, in all material respects, the financial condition and results of operations of the Fund; |
| (3) | This certification accompanies the report to which it relates, is not deemed filed with the Securities and Exchange Commission and is not to be incorporated by reference into any filing of the Company under the Securities Act of 1933, as amended, or the Securities Exchange Act of 1934, as amended (whether made before or after the date of such report), irrespective of any general incorporation language contained in such filing. |
| Dated: February 27, 2019 |
| /s/ Daniel Draper | ||||
| Daniel Draper | ||||||
| Principal Executive Officer |
Exhibit 32.2
CERTIFICATION PURSUANT TO
18 U.S.C. SECTION 1350
AS ADOPTED PURSUANT TO
SECTION 906 OF THE SARBANES-OXLEY ACT OF 2002
The undersigned, Kelli Gallegos, Principal Financial and Accounting Officer, Investment Pools of Invesco Capital Management LLC, the Managing Owner of Invesco DB Energy Fund (the “Fund”), a series of Invesco DB Multi-Sector Commodity Trust, hereby certifies pursuant to 18 U.S.C. Section 1350, as adopted pursuant to Section 906 of the Sarbanes-Oxley Act of 2002, that:
| (1) | The Fund’s Annual Report on Form10-K for the year ended December 31, 2018 as filed with the Securities and Exchange Commission on the date hereof (the “Annual Report”), fully complies with the requirements of Section 13(a) or 15(d) of the Securities Exchange Act of 1934, as amended; |
| (2) | The information contained in the Annual Report fairly presents, in all material respects, the financial condition and results of operations of the Fund; |
| (3) | This certification accompanies the report to which it relates, is not deemed filed with the Securities and Exchange Commission and is not to be incorporated by reference into any filing of the Company under the Securities Act of 1933, as amended, or the Securities Exchange Act of 1934, as amended (whether made before or after the date of such report), irrespective of any general incorporation language contained in such filing. |
| Dated: February 27, 2019 |
| /s/ Kelli Gallegos | ||||
| Kelli Gallegos | ||||||
| Principal Financial and Accounting Officer, Investment Pools |
UNITED STATES
SECURITIES AND EXCHANGE COMMISSION
WASHINGTON, D.C. 20549
FORM10-K
| ☒ | ANNUAL REPORT PURSUANT TO SECTION 13 OR 15(d) OF THE SECURITIES EXCHANGE ACT OF 1934 |
For the fiscal year ended December 31, 2018
OR
| ☐ | TRANSITION REPORT PURSUANT TO SECTION 13 OR 15(d) OF THE SECURITIES EXCHANGE ACT OF 1934 |
For the transition period from to
Commission File Number:001-33242
INVESCO DB OIL FUND
(A Series of Invesco DB Multi-Sector Commodity Trust)
(Exact name of Registrant as specified in its charter)
| Delaware | 87-0778062 | |
(State or Other Jurisdiction of Incorporation or Organization) | (I.R.S. Employer Identification No.) | |
c/o Invesco Capital Management LLC 3500 Lacey Road, Suite 700 Downers Grove, Illinois | 60515 | |
| (Address of Principal Executive Offices) | (Zip Code) | |
Registrant’s telephone number, including area code:(800) 983-0903
Securities registered pursuant to Section 12(b) of the Act:
Title of Each Class | Name of Each Exchange on Which Registered | |
| Common Units of Beneficial Interest | NYSE Arca, Inc. |
Securities registered pursuant to Section 12(g) of the Act: None
Indicate by check mark if the Registrant is a well-known seasoned issuer, as defined in Rule 405 of the Securities Act. Yes ☐ No ☒
Indicate by check mark if the Registrant is not required to file reports pursuant to Section 13 or Section 15(d) of the Act. Yes ☐ No ☒
Indicate by check mark whether the Registrant (1) has filed all reports required to be filed by Section 13 or 15(d) of the Securities Exchange Act of 1934 during the preceding 12 months (or for such shorter period that the Registrant was required to file such reports), and (2) has been subject to such filing requirements for the past 90 days. Yes ☒ No ☐
Indicate by check mark whether the Registrant has submitted electronically every Interactive Data File required to be submitted pursuant to Rule 405 of RegulationS-T (§232.405 of this chapter) during the preceding 12 months (or for such shorter period that the Registrant was required to submit such files). Yes ☒ No ☐
Indicate by check mark if disclosure of delinquent filers pursuant to Item 405 of RegulationS-K (§229.405 of this chapter) is not contained herein, and will not be contained, to the best of Registrant’s knowledge, in definitive proxy or information statements incorporated by reference in Part III of this Form10-K or any amendment to this Form10-K. ☒
Indicate by check mark whether the Registrant is a large accelerated filer, an accelerated filer, anon-accelerated filer, a smaller reporting company, or an emerging growth company. See the definitions of “large accelerated filer,” “accelerated filer,” “smaller reporting company,” and “emerging growth company” in Rule12b-2 of the Exchange Act.
| Large Accelerated Filer | ☐ | Accelerated Filer | ☒ | |||
| Non-Accelerated Filer | ☐ | Smaller reporting company | ☐ | |||
| Emerging growth company | ☐ | |||||
If an emerging growth company, indicate by check mark if the registrant has elected not to use the extended transition period for complying with any new or revised financial accounting standards provided pursuant to Section 13(a) of the Exchange Act. ☐
Indicate by check mark whether the Registrant is a shell company (as defined in Rule12b-2 of the Exchange Act). Yes ☐ No ☒
State the market value of the voting andnon-voting common equity held bynon-affiliates computed by reference to the price at which the common equity was last sold, or the average bid and asked price of such common equity, as of the last business day of the Registrant’s most recently completed second fiscal quarter: $386,880,000.
Number of Common Units of Beneficial Interest outstanding as of January 31, 2019: 32,200,000
TABLE OF CONTENTS
i
CAUTIONARY STATEMENT CONCERNING FORWARD-LOOKING INFORMATION
This Report includes forward-looking statements within the meaning of Section 27A of the Securities Act of 1933, as amended (the “Securities Act”), and Section 21E of the Securities Exchange Act of 1934, as amended (the “Exchange Act”), that involve substantial risks and uncertainties. The matters discussed throughout this Report that are not historical facts are forward-looking statements. These forward-looking statements are based on the Fund’s and Invesco Capital Management LLC’s (the “Managing Owner”) current expectations, estimates and projections about the future results, performance, prospects and opportunities of the Fund and the Fund’s business and industry and their beliefs and assumptions about future events and speak only as of the date on which they are made. Words such as “anticipate,” “expect,” “intend,” “plan,” “believe,” “seek,” “outlook” and “estimate,” as well as similar words and phrases, signify forward-looking statements. Forward-looking statements are not guarantees of future results. Conditions and important factors, risks and uncertainties in the markets for financial instruments that the Fund trades, in the markets for related physical commodities, in the legal and regulatory regimes applicable to the Managing Owner, the Fund, and the Fund’s service providers, and in the broader economy may cause actual results to differ materially from those expressed by such forward-looking statements. These forward-looking statements are subject to a number of risks, uncertainties and other factors including, but not limited to, those described in this Report, including in Part I, Item 1A. “Risk Factors” and Part II, Item 7, “Management’s Discussion and Analysis of Financial Condition and Results of Operation” (“MD&A”), and other Securities and Exchange Commission (“SEC”) filings by the Fund that could cause the actual results, performance, prospects or opportunities of the Fund to differ materially from those expressed in, or implied by, these forward-looking statements.
You should not place undue reliance on any forward-looking statements. Except as expressly required by the Federal securities laws, the Fund and Managing Owner undertake no obligation to publicly update or revise any forward-looking statements or the risks, uncertainties or other factors described in this Report, as a result of new information, future events or changed circumstances or for any other reason after the date of this Report.
ii
| ITEM 1. | BUSINESS |
Introduction
Invesco DB Oil Fund (the “Fund”), a separate series of Invesco DB Multi-Sector Commodity Trust (the “Trust”), a Delaware statutory trust organized in seven separate series, was formed on August 3, 2006. The term of the Fund is perpetual (unless terminated earlier in certain circumstances) as provided for in the Fifth Amended and Restated Declaration of Trust and Trust Agreement of the Fund, as amended (the “Trust Agreement”). The Fund has an unlimited number of shares authorized for issuance.
Invesco Capital Management LLC (“Invesco”) has served as the managing owner (the “Managing Owner”), commodity pool operator and commodity trading advisor of the Fund since February 23, 2015. The Managing Owner holds 40 general shares (the “General Shares”) of the Fund. The fiscal year end of the Fund is December 31st.
The Fund seeks to track changes, whether positive or negative, in the level of the DBIQ Optimum Yield Crude Oil Index Excess Return™ (the “Index”) over time, plus the excess, if any, of the sum of the Fund’s interest income from its holdings of United States Treasury Obligations (“Treasury Income”), dividends from its holdings in money market mutual funds (affiliated or otherwise) (“Money Market Income”) and dividends or distributions of capital gains from its holdings ofT-Bill ETFs (as defined below)(“T-Bill ETF Income”) over the expenses of the Fund. The Fund invests in futures contracts in an attempt to track its Index. The Index is intended to reflect the change in market value of the crude oil sector. The single commodity comprising the Index is Light Sweet Crude Oil (WTI) (the “Index Commodity”).
The Fund may invest directly in United States Treasury Obligations. The Fund may also gain exposure to United States Treasury Obligations through investments in exchange-traded funds (“ETFs”) (affiliated or otherwise) that track indexes that measure the performance of United States Treasury Obligations with a maximum remaining maturity of up to 12 months(“T-Bill ETFs”). The Fund invests in United States Treasury Obligations, money market mutual funds andT-Bill ETFs (affiliated or otherwise), if any, for margin and/or cash management purposes.
The Commodity Futures Trading Commission (the “CFTC”) and certain futures exchanges impose position limits on futures contracts that reference the Index Commodity (the “Index Contracts”). The Managing Owner may determine to invest in other futures contracts if at any time it is impractical or inefficient to gain full or partial exposure to the Index Commodity through the use of Index Contracts. These other futures contracts may or may not be based on the Index Commodity. When they are not, the Managing Owner may seek to select futures contracts that it reasonably believes tend to exhibit trading prices that correlate with an Index Contract.
The Fund offers common units of beneficial interest (the “Shares”) only to certain eligible financial institutions (the “Authorized Participants”) in one or more blocks of 200,000 Shares (“Basket”). The Fund commenced investment operations on January 3, 2007. The Fund commenced trading on the American Stock Exchange (which became the NYSE Alternext US LLC) on January 5, 2007 and, since November 25, 2008, has been listed on the NYSE Arca, Inc. (the “NYSE Arca”).
Index Description
The Managing Owner pays Deutsche Investment Management Americas Inc. (the “Index Sponsor”) a licensing fee and an index services fee for performing its duties.
These fees constitute a portion of the routine operational, administrative and other ordinary expenses which are paid out of the management fee paid to the managing owner (“Management Fee”) and are not charged to or reimbursed by the Fund.
Neither the Managing Owner nor any affiliate of the Managing Owner has any rights to influence the selection of the futures contracts underlying the Index. The Managing Owner has entered into a license agreement with the Index Sponsor to use the Index.
The Fund is not sponsored or endorsed by Deutsche Bank AG, Deutsche Investment Management Americas Inc. or any subsidiary or affiliate of Deutsche Bank AG or Deutsche Investment Management Americas Inc. (collectively, “Deutsche Bank”). The DBIQ Optimum Yield Crude Oil Index Excess Return™ (the “Index”) is the exclusive property of Deutsche Investment Management Americas Inc. “DBIQ” and “Optimum Yield” are a service marks of Deutsche Bank AG and have been licensed for use for certain purposes by Deutsche Investment Management Americas Inc. Neither Deutsche Bank nor any other party involved in, or related to, making or compiling the Index makes any representation or warranty, express or implied, concerning the Index, the Fund or the advisability of investing in securities generally. Neither Deutsche Bank nor any other party involved in, or related to, making or compiling the Index has any obligation to take the needs of the Managing Owner or its clients into consideration in determining, composing or calculating the Index. Neither Deutsche Bank nor any other party involved in, or related to, making or compiling the Index is responsible for or has participated in the determination of the timing of, prices at, quantities or valuation of the Fund. Neither Deutsche Bank nor any other party involved in, or related to, making or compiling the Index has any obligation or liability in connection with the administration or trading of the Fund.
1
NEITHER DEUTSCHE BANK NOR ANY OTHER PARTY INVOLVED IN, OR RELATED TO, MAKING OR COMPILING THE INDEX, WARRANTS OR GUARANTEES THE ACCURACY AND/OR THE COMPLETENESS OF THE INDEX OR ANY DATA INCLUDED THEREIN AND SHALL HAVE NO LIABILITY FOR ANY ERRORS, OMISSIONS, OR INTERRUPTIONS THEREIN. NEITHER DEUTSCHE BANK NOR ANY OTHER PARTY INVOLVED IN, OR RELATED TO, MAKING OR COMPILING THE INDEX, MAKES ANY WARRANTY, EXPRESS OR IMPLIED, AS TO RESULTS TO BE OBTAINED BY INVESCO CAPITAL MANAGEMENT LLC FROM THE USE OF THE INDEX OR ANY DATA INCLUDED THEREIN. NEITHER DEUTSCHE BANK NOR ANY OTHER PARTY INVOLVED IN, OR RELATED TO, MAKING OR COMPILING THE INDEX, MAKES ANY EXPRESS OR IMPLIED WARRANTIES, AND EXPRESSLY DISCLAIMS ALL WARRANTIES, OF MERCHANTABILITY OR FITNESS FOR A PARTICULAR PURPOSE OR USE WITH RESPECT TO THE INDEX OR ANY DATA INCLUDED THEREIN. WITHOUT LIMITING ANY OF THE FOREGOING, IN NO EVENT SHALL DEUTSCHE BANK OR ANY OTHER PARTY INVOLVED IN, OR RELATED TO, MAKING OR COMPILING THE INDEX HAVE ANY LIABILITY FOR DIRECT, INDIRECT, PUNITIVE, SPECIAL, CONSEQUENTIAL OR ANY OTHER DAMAGES OR LOSSES (INCLUDING LOST PROFITS), EVEN IF NOTIFIED OF THE POSSIBILITY THEREOF. EXCEPT AS EXPRESSLY PROVIDED TO THE CONTRARY, THERE ARE NO THIRD PARTY BENEFICIARIES OF ANY AGREEMENTS OR ARRANGEMENTS BETWEEN DEUTSCHE BANK AND INVESCO CAPITAL MANAGEMENT LLC.
No purchaser, seller or holder of the Shares of this Fund, or any other person or entity, should use or refer to any Deutsche Bank trade name, trademark or service mark to sponsor, endorse, market or promote this Fund without first contacting Deutsche Bank to determine whether Deutsche Bank’s permission is required. Under no circumstances may any person or entity claim any affiliation with Deutsche Bank without the written permission of Deutsche Bank.
The Index Sponsor may fromtime-to-time subcontract the provision of the calculation and other services described below to one or more third parties. The Index is composed of one underlying Index Commodity. The notional amount of the Index Commodity included in the Index is intended to reflect the changes in market value of the Index Commodity within the Index. The closing level of the Index is calculated on each business day by the Index Sponsor based on the closing price of the futures contracts for the Index Commodity and the notional amount of such Index Commodity.
The composition of the Index may be adjusted in the event that the Index Sponsor is not able to calculate the closing price of the Index Commodity.
The Index includes provisions for the replacement of futures contracts as they approach maturity. This replacement takes place over a period of time in order to lessen the impact on the market for the futures contracts being replaced. With respect to the Index Commodity, the Fund employs a rule-based approach when it ‘rolls’ from one futures contract to another.
Rather than select a new futures contract based on a predetermined schedule (e.g., monthly), each Index Commodity rolls from one contract to another futures contract that is intended to generate the most favorable ‘implied roll yield’ under prevailing market conditions. Where there is an upward-sloping price curve for futures contracts, the implied roll yield is expected to be negative. The selection of a new futures contract on the Index Commodity in such market conditions is designed to minimize the impact of negative roll yield. Conversely, where there is a downward-sloping price curve for futures contracts, the implied roll yield is expected to be positive. The selection of a new futures contract on the Index Commodity in such market conditions is designed to maximize the impact of positive roll yield. The Index takes the impact of implied roll yield into consideration by selecting, as the replacement for an expiring futures contract, the futures contract with a delivery month within the next thirteen months that generates the most favorable implied roll yield under the current market conditions.
The market condition in which the Index is designed to maximize the effect of positive roll yield when entering into new futures contracts is called backwardation. Backwardation exists when prices are higher for contracts with shorter-term expirations than those with longer-term expirations, a condition that is typically associated with commodities that are consumed quickly instead of being put in storage. Rolling in a backwardated market will tend to enhance returns from futures trading. The market condition in which the Index is designed to mitigate the effect of negative roll yield when entering into new futures contracts is called contango. Contango exists when contract prices are higher in distant delivery months than in nearer delivery months, typically due to costs associated with storing a given physical commodity for a longer period. Rolling in a contangoed market will tend to cause a drag on returns from futures trading. Returns from futures trading are called excess return, which is the combined return based on the spot prices of the Index Commodity and the roll yield from trading futures contracts on the Index Commodity.
The Index is calculated in USD on an excess return (unfunded) basis, which means that the Index reflects the return associated with spot prices for the Index Commodity and the roll yield associated with trading futures contracts on the Index Commodity. The Fund also invests in securities that are expected to generate income, including Treasury Securities, money market mutual funds, andT-Bill ETFs. These securities are held with the Custodian. In addition, Treasury Securities for deposit may be held with the Commodity Broker as margin for the Fund’s futures positions. The Index does not reflect any corresponding income characteristics.
The futures contract price for the Index Commodity will be the exchange closing price for the Index Commodity on a day on which the appropriate exchange is open for business (the “Index Business Days”). If a weekday is not an Exchange Business Day (as defined in the following sentence) but is an Index Business Day, the exchange closing price from the previous Index Business Day will be used for the Index Commodity. “Exchange Business Day” means, in respect of the Index Commodity, a day that is a trading day for the Index Commodity on the relevant exchange (unless either an Index disruption event or force majeure event has occurred).
2
On the first Index Business Day of each month (the “Verification Date”), the Index Commodity futures contract will be tested in order to determine whether to continue including it in the Index. If the Index Commodity futures contract requires delivery of the underlying commodity in the next month, known as the Delivery Month, a new Index Commodity futures contract will be selected for inclusion in the Index. For example, if the first Index Business Day is May 1 of the current year, and the Delivery Month of an Index Commodity futures contract currently in the Index is June of the current year, a new Index Commodity futures contract with a later Delivery Month will be selected.
For the underlying Index Commodity in the Index, the new Index Commodity futures contract selected will be the Index Commodity futures contract with the best possible “implied roll yield” based on the closing price for each eligible Index Commodity futures contract. Eligible Index Commodity futures contracts are any Index Commodity futures contracts having a Delivery Month (i) no sooner than the month after the Delivery Month of the Index Commodity futures contract currently in the Index, and (ii) no later than the thirteenth month after the Verification Date. For example, if the first Index Business Day is May 1 of the current year and the Delivery Month of an Index Commodity futures contract currently in the Index is June of the current year, the Delivery Month of an eligible new Index Commodity futures contract must be between July of the current year and June of the following year. The implied roll yield is then calculated and the futures contract on the Index Commodity with the best possible implied roll yield under the current market conditions is then selected. If two futures contracts have the same implied roll yield, the futures contract with the minimum number of months prior to the Delivery Month is selected.
After the futures contract selection, the monthly roll for the Index Commodity subject to a roll in that particular month unwinds the old commodity futures contract and enters a position in the new commodity futures contract. This takes place between the second and sixth Index Business Day of the month.
On each day during the roll period, new notional holdings are calculated. The calculations for the old futures contracts on the Index Commodity that are leaving the Index and the new futures contracts on the Index Commodity are then calculated.
On all days that are not monthly index roll days, the notional holdings of the Index Commodity future remains constant.
The Index isre-weighted on an annual basis on the sixth Index Business Day of each November.
The calculation of the Index is expressed as the weighted average return of the Index Commodity.
The Trustee
Under the Trust Agreement, Wilmington Trust Company, the trustee of the Fund (the “Trustee”), has the power and authority to execute and file certificates as required by the Delaware Statutory Trust Act and to accept service of process on the Fund in the State of Delaware. The Managing Owner has the exclusive management and control of all aspects of the business of the Fund. The Trustee will serve in that capacity until such time as the Managing Owner removes the Trustee or the Trustee resigns and a successor is appointed by the Managing Owner. The Trustee will have no duty or liability to supervise or monitor the performance of the Managing Owner, nor will the Trustee have any liability for the acts or omissions of the Managing Owner.
The Managing Owner
The Managing Owner was formed on February 7, 2003. The Managing Owner is an affiliate of Invesco Ltd. The Managing Owner was formed to be the managing owner of investment vehicles such as ETFs and has been managingnon-commodity futures based ETFs since 2003 and a commodity futures based ETF since 2014. The Managing Owner serves as the commodity pool operator and commodity trading advisor of the Fund. The Managing Owner is registered as a commodity pool operator and commodity trading advisor with the CFTC and is a member of, and approved as a swap firm by, the National Futures Association (the “NFA”). As a registered commodity pool operator and commodity trading advisor, with respect to the Fund, the Managing Owner must comply with various regulatory requirements under the Commodity Exchange Act of 1936, as amended (the “Commodity Exchange Act”) and the rules and regulations of the CFTC and the NFA, including investor protection requirements, antifraud prohibitions, disclosure requirements, and reporting and recordkeeping requirements. The Managing Owner also is subject to periodic inspections and audits by the CFTC and NFA.
The Managing Owner’s main business offices are located at 3500 Lacey Road, Suite 700, Downers Grove, Illinois 60515, and its telephone number is(800) 983-0903.
The Fund pays the Managing Owner the Management Fee, monthly in arrears, in an amount equal to 0.75% per annum of the daily net asset value (“NAV”) of the Fund.
The Fund may, for margin and/or cash management purposes, invest in money market mutual funds and/orT-Bill ETFs that are managed by affiliates of the Managing Owner. The indirect portion of the management fee that the Fund may incur through such investment is in addition to the Management Fee paid to the Managing Owner. The Managing Owner has contractually agreed to waive indefinitely the fees that it receives in an amount equal to the indirect management fees that the Fund incurs through its investments in affiliated money market mutual funds and/or affiliatedT-Bill ETFs. The Managing Owner may terminate this fee waiver on 60 days notice.
3
Pursuant to the Trust Agreement, the Fund will indemnify the Managing Owner against any losses, judgments, liabilities, expenses and amounts paid in settlement of any claims sustained by it in connection with its activities on behalf of the Fund incurred, except for any expenses resulting from gross negligence or willful misconduct.
The Commodity Broker
Morgan Stanley & Co. LLC, a Delaware limited liability company, serves as the Fund’s futures clearing broker (the “Commodity Broker”). The Commodity Broker is registered with the CFTC as a futures commission merchant and is a member of the NFA in such capacity.
A variety of executing brokers execute futures transactions on behalf of the Fund. Such executing brokersgive-up all such transactions to the Commodity Broker. In its capacity as clearing broker, the Commodity Broker may execute or receive transactions executed by others and clears all of the Fund’s futures transactions and performs certain administrative and custodial services for the Fund. The Commodity Broker is responsible, among other things, for providing periodic accountings of all dealings and actions taken by the Fund during the reporting period, together with an accounting of all securities, cash or other indebtedness or obligations held by it or its nominees for or on behalf of the Fund.
The Fund pays the Commodity Broker all brokerage commissions, including applicable exchange fees, NFA fees,give-up fees, pit brokerage fees and other transaction related fees and expenses charged in connection with trading activities. The Commodity Broker’s brokerage commissions and trading fees are determined on acontract-by-contract basis. Brokerage commissions and fees in any future fiscal year or any part of any future fiscal year may be greater than fees incurred in prior fiscal years. On average, total charges paid to the Commodity Broker were less than $6.00, $6.00 and $6.00 per round-turn trade1 for the years ended December 31, 2018, 2017 and 2016, respectively.
| 1 | A round-turn trade is a completed transaction involving both a purchase and a liquidating sale, or a sale followed by a covering purchase. |
The Administrator, Custodian and Transfer Agent
The Bank of New York Mellon (the “Administrator”, “Custodian” and “Transfer Agent”) is the administrator, custodian and transfer agent of the Fund. The Fund and the Administrator have entered into separate administrative, custodian, transfer agency and service agreements (collectively referred to as the “Administration Agreement”).
The Bank of New York Mellon, a banking corporation organized under the laws of the State of New York with trust powers, has an office at 2 Hanson Place, Brooklyn, New York, 11217. The Bank of New York Mellon is subject to supervision by the New York State Department of Financial Services and the Board of Governors of the Federal Reserve System.
Pursuant to the Administration Agreement, the Administrator performs or supervises the performance of services necessary for the operation and administration of the Fund (other than making investment decisions), including receiving and processing orders from Authorized Participants to create and redeem Baskets, NAV calculations, accounting and other fund administrative services. The Administrator maintains certain financial books and records, including: Basket creation and redemption records; fund accounting records; ledgers with respect to assets, liabilities, capital, income and expenses; the registrar, transfer journals and related details; and trading and related documents received from the Commodity Broker. The Managing Owner pays the Administrator administrative service fees out of the Management Fee.
The Distributor
Invesco Distributors, Inc. is the Fund’s distributor (the “Distributor”). Pursuant to the Distribution Services Agreement among the Managing Owner, the Fund and the Distributor, the Distributor assists the Managing Owner and the Administrator with certain functions and duties relating to distribution and marketing services to the Fund including reviewing and approving marketing materials. Prior to June 20, 2016, ALPS Distributors, Inc. provided distribution services to the Fund.
The Distribution Services Agreement is terminable without penalty on sixty days written notice by the Managing Owner or by the Distributor. The Distribution Services Agreement will automatically terminate in the event of its assignment.
Pursuant to the Distribution Services Agreement, the Fund will indemnify and hold harmless the Distributor and each of its directors and officers and each person, if any, who controls the Distributor within the meaning of Section 15 of the Securities Act, against any loss, liability, claim, damages or expenses (including the reasonable cost of investigating or defending any alleged loss, liability, claim, damages or expense and reasonable counsel fees incurred in connection therewith) arising by reason of any person acquiring any Shares, based upon the ground that the registration statement, prospectus, statement of additional information, shareholder reports or other information filed or made public by the Fund (as fromtime-to-time amended) included an untrue statement of a material fact or omitted a material fact required to be stated or necessary in order to make the statements therein not misleading under the Securities Act or any other statute or the common law.
4
The Managing Owner pays the Distributor a distribution fee out of the Management Fee.
Index Sponsor
The Managing Owner, on behalf of the Fund, has appointed Deutsche Investment Management Americas Inc. to serve as the index sponsor (the “Index Sponsor”). The Index Sponsor calculates and publishes the daily index levels and the indicative intraday index levels. Additionally, the Index Sponsor also calculates the indicative value per Share of the Fund throughout each business day.
The Managing Owner pays the Index Sponsor a licensing fee and an index services fee out of the Management Fee for performing its duties.
Marketing Agent
The Managing Owner, on behalf of the Fund, has appointed Deutsche Investment Management Americas Inc. as the marketing agent (the “Marketing Agent”) to assist the Managing Owner by providing support to educate institutional investors about the DBIQ indices and to complete governmental or institutional due diligence questionnaires or requests for proposals related to the DBIQ indices.
The Managing Owner pays the Marketing Agent a marketing services fee out of the Management Fee.
The Marketing Agent will not open or maintain customer accounts or handle orders for the Fund. The Marketing Agent has no responsibility for the performance of the Fund or the decisions made or actions taken by the Managing Owner.
Tax Reporting
The Fund has retained the services of PricewaterhouseCoopers LLP to assist with certain tax reporting requirements of the Fund and its Shareholders.
Regulation
Futures exchanges in the United States are subject to regulation under the Commodity Exchange Act by the CFTC, the governmental agency having responsibility for regulation of futures exchanges and trading on those exchanges.
The Commodity Exchange Act and the CFTC also regulate the activities of “commodity trading advisors” and “commodity pool operators” and the CFTC has adopted regulations with respect to certain of such persons’ activities. Pursuant to its authority, the CFTC requires a commodity pool operator (such as the Managing Owner) to keep accurate, current and orderly records with respect to each pool it operates. The CFTC may suspend the registration of a commodity pool operator if the CFTC finds that the operator has violated the Commodity Exchange Act or regulations thereunder and in certain other circumstances. Suspension, restriction or termination of the Managing Owner’s registration as a commodity pool operator would prevent it, until such time (if any) as such registration were to be reinstated, from managing, and might result in the termination of, the Fund. The Commodity Exchange Act gives the CFTC similar authority with respect to the activities of commodity trading advisors, such as the Managing Owner. If the registration of a managing owner as a commodity trading advisor were to be terminated, restricted or suspended, the managing owner would be unable, until such time (if any) as such registration were to be reinstated, to render trading advice to the Fund. The Fund is not registered with the CFTC in any capacity.
The Commodity Exchange Act requires all “futures commission merchants,” such as the Commodity Broker, to meet and maintain specified fitness and financial requirements, to segregate customer funds from proprietary funds and account separately for all customers’ funds and positions, and to maintain specified books and records open to inspection by the staff of the CFTC.
The Commodity Exchange Act also gives the states certain powers to enforce its provisions and the regulations of the CFTC.
Shareholders are afforded certain rights for reparations under the Commodity Exchange Act. Shareholders may also be able to maintain a private right of action for certain violations of the Commodity Exchange Act. The CFTC has adopted rules implementing the reparation provisions of the Commodity Exchange Act which provide that any person may file a complaint for a reparations award with the CFTC for violation of the Commodity Exchange Act against a floor broker, futures commission merchant, introducing broker, commodity trading advisor, commodity pool operator, and their respective associated persons.
Pursuant to authority in the Commodity Exchange Act, the NFA was formed and registered with the CFTC as a “registered futures association.” At the present time, the NFA is the onlynon-exchange self-regulatory organization for derivatives professionals. NFA members are subject to NFA standards relating to fair trade practices, market integrity, and consumer protection. As the self-regulatory body of the derivatives industry, the NFA promulgates rules governing the conduct of derivatives professionals and disciplines those professionals who do not comply with such standards. The CFTC has delegated to the NFA responsibility for the registration of commodity trading advisors, commodity pool operators, futures commission merchants, introducing brokers, and swap dealers, among others, and their respective associated persons, as applicable, and floor brokers. The Commodity Broker and the Managing Owner are members of the NFA (the Fund is not required to become a member of the NFA).
5
The CFTC has no authority to regulate trading on foreign futures exchanges and markets but permits direct access to such markets from the United States with respect to foreign boards of trade that are registered as such with the CFTC.
Employees
The Fund has no employees.
Available Information
The Fund files with or submits to the SEC annual, quarterly and current reports and other information meeting the informational requirements of the Exchange Act. These reports are available on the Managing Owner’s website athttp://www.invesco.com/ETFs. Information in the Managing Owner’s website shall not be deemed to be a part of this Report or incorporated by reference herein unless otherwise expressly stated. The SEC maintains an Internet site that contains reports, proxy and information statements and other information filed electronically by us with the SEC which are available on the SEC’s Internet site athttp://www.sec.gov.
The Fund also posts monthly performance reports and its annual report, as required by the CFTC, on the Managing Owner’s website at the address listed above.
| ITEM 1A. | RISK FACTORS |
An investment in Shares involves a high degree of risk. Investors should consider carefully all of the risks described below, together with the other information contained in this Annual Report on Form10-K (the “Report”) and the Fund’s Prospectus, before making a decision to invest in Shares. If any of the following risks occur, the business, financial condition and results of operations of the Fund may be adversely affected.
Market Risks
NAV May Not Always Correspond to Market Price and, as a Result, Baskets May Be Created or Redeemed at a Value that Differs from the Market Price of the Shares.
Shares may trade at, above or below their NAV. The NAV fluctuates with changes in the market value of the Fund’s assets. The trading price of Shares fluctuates in accordance with changes in the NAV, intraday changes in the value of the futures contracts and market supply and demand. The amount of the discount or premium in the trading price of the Shares relative to their NAV may be influenced bynon-concurrent trading hours between NYSE Arca (the exchange on which the Shares trade) and the exchanges on which futures contracts on the Index Commodity trade. While the Shares are expected to trade on NYSE Arca until 4:00 p.m. (Eastern time), liquidity in the markets for the futures contracts on the Index Commodity is expected to be reduced whenever the principal markets for those contracts are closed. As a result, trading spreads, and the resulting premium or discount on Shares, may widen during these gaps in market trading hours.
The NYSE Arca May Halt Trading in the Shares Which Would Adversely Impact Your Ability to Sell Shares.
The Shares are listed for trading on the NYSE Arca. Trading in Shares may be halted due to market conditions or in light of certain procedures and safeguards under NYSE Arca rules. In addition, trading is subject to trading halts caused by extraordinary market volatility pursuant to “circuit breaker” rules that require trading to be halted for a specified period based on a specified market decline. If the Fund were no longer to meet the requirements necessary to maintain the listing of its Shares, the Shares would be delisted. In such a scenario, the Fund would be terminated.
The Lack of an Active Trading Market for the Shares May Result in Losses on Your Investment at the Time of Disposition of Your Shares.
Although the Shares are listed and traded on the NYSE Arca, there can be no guarantee that an active trading market for the Shares will be maintained. If you need to sell your Shares at a time when no active market for them exists, the price you receive for your Shares, assuming that you are able to sell them, likely will be lower than the price you would receive if an active market did exist.
Volatility May Cause the Total Loss of Your Investment.
Futures contracts prices have a high degree of volatility and are subject to rapid and substantial changes. Consequently, there is a risk that the value of your investment in the Fund could decrease significantly due to rapid and substantial changes in the prices of futures contracts held by the Fund. The Index’s average annual volatility since inception is 26.49%. Average annual volatility is the average of the Index’s volatility each year since its inception. Yearly volatility is the relative rate at which the price of the Index moves up and down, found by calculating the annualized standard deviation of the daily change in price for each business day in the given year.
6
In addition, the Fund enters sell orders with the Commodity Broker from time to time to liquidate Index Contract positions in order to satisfy redemption requests or to pay expenses and liabilities. The Fund is subject to the risk that temporary aberrations or distortions will occur in the market for Index Contracts at the time those orders are executed. The prices received by the Fund from the liquidation of its positions could be adversely affected, which in turn could adversely affect the value of the Shares. Those aberrations or distortions may result from trading activities by other market participants or actions taken by the Commodity Broker, the CFTC, the exchanges or other regulatory authorities. If the Fund’s positions are liquidated at inopportune times or in a manner that temporarily distorts the market or otherwise causes a pricing aberration, the value of the Shares may be adversely affected.
The Fund’s Trading of Index Contracts May Adversely Affect the Price that the Fund Pays for Index Contracts.
The prices that the Fund pays for Index Contracts may be adversely affected by the trading of Index Contracts by other market participants. Transactions by other market participants may be based on their awareness of the Fund’s positions in Index Contracts. If other market participants are able to anticipate the timing of the Fund’s Index Contract transactions, for instance, they may be able to execute transactions in advance of the Fund. If that were to occur, those market participants may receive more favorable pricing for their Index Contract transactions than the Fund does for its own, subsequent Index Contract transactions. If the Fund’s Index Contract positions represent a significant part of the open long interest in those Index Contracts, moreover, other market participants may take that fact into account and trade in a manner that adversely affects the prices that the Fund obtains when trading Index Contracts. The Fund may not be able to counteract adverse pricing effects of its own positions and transactions in Index Contracts
Withdrawal from Participation by Authorized Participants May Affect the Liquidity of Shares.
If one or more Authorized Participants withdraws from participation, it may become more difficult to create or redeem Baskets, which may reduce the liquidity of the Shares. If it becomes more difficult to create or redeem Baskets, the correlation between the price of the Shares and the NAV may be affected, which may affect the trading market for the Shares. Having fewer participants in the market for the Shares could also adversely affect the ability to arbitrage any price difference between futures contracts and the Shares, which may also affect the trading market and liquidity of the Shares.
Possible Illiquid Markets May Exacerbate Losses.
Futures positions cannot always be liquidated at the desired price. It is difficult to execute a trade at a specific price when there is a relatively small volume of buy and sell orders in a market. A market disruption, such as when foreign governments may take or be subject to political actions which disrupt the markets in their currencies or major commodities exports, can also make it difficult to liquidate a position.
Illiquidity may cause losses for the Fund. The large size of the positions which the Fund may acquire increases the risk of illiquidity by both making its positions more difficult to liquidate and increasing the losses incurred while trying to do so.
Trading on Futures Exchanges Outside the United States Is Not Subject to U.S. Regulation.
Trading on futures exchanges located outside the United States is not regulated by any United States governmental agency and may involve certain risks not applicable to trading on U.S. exchanges, including different or diminished investor protections. If the Fund trades contracts denominated in currencies other than U.S. dollars, the Fund will be exposed to the risk of adverse exchange-rate movements between the dollar and the currencies in which those contracts are denominated.
In addition, trading onnon-U.S. exchanges is subject to the risks presented by exchange controls, expropriation, increased tax burdens and exposure to local economic declines and political instability, among other factors. An adverse development with respect to any of these factors could reduce the profit or increase the loss earned on the Fund’s trades onnon-U.S. exchanges.
The Effect of Market Disruptions and Government Interventions Are Unpredictable and May Have an Adverse Effect on the Value of Your Shares.
The commodity futures markets may be subject to temporary distortions due to various factors, including lack of liquidity, congestion, disorderly closing periods, manipulation and disruptive conduct, limitations on deliverable supplies, excessive speculation, government regulation and intervention, technical and operational or system failures, nuclear accidents, terrorism, riots and acts of God.
Government intervention has in certain cases been implemented on an “emergency” basis, suddenly and substantially eliminating market participants’ ability to continue to implement certain strategies or manage the risk of their outstanding positions. These interventions have typically been unclear in scope and application, resulting in confusion and uncertainty which in itself has been materially detrimental to the efficient functioning of the markets as well as previously successful investment strategies.
7
The financial crisis of 2008-2009 and associated regulatory changes, including the Dodd-Frank Wall Street Reform and Consumer Protection Act (the “Dodd Frank Act”) are generally considered to have contributed to less credit being available to financial market participants. This is particularly the case for credit extended by banks and other traditional lending sources. The Fund does not borrow from lenders for the purpose of pursuing its investment objective. Nonetheless, restrictions on the availability of credit may adversely affect investors who borrow to purchase Shares and participants in the markets for financial instruments in which the Fund trades, including futures markets. Limitations on the availability of credit, whether in stressed market conditions or otherwise, may have a material adverse effect on investors and financial market participants, which in turn could affect the Fund’s ability to pursue its investment objective. Among other things, fewer prospective investors may adversely affect the Fund’s asset levels, and fewer financial market participants may reduce liquidity and adversely affect pricing for the financial instruments that the Fund seeks to trade.
The Fund may incur major losses in the event of disrupted markets and other extraordinary events in which historical pricing relationships become materially distorted. The risk of loss from pricing distortions is compounded by the fact that in disrupted markets many positions become illiquid, making it difficult or impossible to close out or liquidate positions against which the markets are moving. The large size of the positions which the Fund may acquire increases the risk of illiquidity by both making its positions more difficult to liquidate and increasing the losses incurred while trying to do so.
An Investment in the Shares May Be Adversely Affected by Competition from Other Methods of Investing in Commodities.
The Fund competes with other financial vehicles, including mutual funds, ETFs and other investment companies, other index tracking commodity pools, actively traded commodity pools, hedge funds, traditional debt and equity securities issued by companies in the commodities industry, other securities backed by or linked to commodities, and direct investments in the underlying commodities or commodity futures contracts. Market and financial conditions, and other conditions beyond the Managing Owner’s control, may make it more attractive to invest in other financial vehicles or to invest in such commodities directly, which could limit the market for the Shares and therefore reduce the liquidity of the Shares.
The NAV Calculation of the Fund May Be Overstated or Understated Due to the Valuation Method Employed When a Settlement Price is Not Available on the Date of NAV Calculation.
Calculating the NAV of the Fund includes, in part, any unrealized profits or losses on open commodity futures contracts. Under normal circumstances, the NAV of the Fund reflects the settlement price of open commodity futures contracts on the date when the NAV is being calculated. However, if a settlement price for a commodity futures contract could not be determined for any reason, the Managing Owner may value the futures contract pursuant to policies the Managing Owner has adopted. In such a situation, there is a risk that the resulting calculation of the Fund’s NAV could be understated or overstated, perhaps to a significant degree.
Futures Risks
Fluctuations in the Price of Assets Held by the Fund Could Have a Materially Adverse Effect on the Value of an Investment in Shares.
The Shares are designed to reflect as closely as possible the changes, positive or negative, in the level of the Index, over time, through the Fund’s portfolio of exchange-traded futures contracts on the Index Commodity. The value of the Shares relates directly to the value of the portfolio, less the liabilities (including estimated accrued but unpaid expenses) of the Fund. The price of the Index Commodity may fluctuate widely. Several factors may affect the price of the Index Commodity, including, but not limited to:
| • | Global supply and demand of the Index Commodity, which may be influenced by such factors as forward selling by the various commodity’s producers, purchases made by the commodity’s producers to unwind their hedge positions and production and cost levels in the major markets of the Index Commodity; |
| • | Domestic and foreign interest rates and investors’ expectations concerning interest rates; |
| • | Domestic and foreign inflation rates and investors’ expectations concerning inflation rates; |
| • | Investment and trading activities of mutual funds, ETFs,closed-end funds, hedge funds and commodity funds; |
| • | Weather and other environmental conditions; |
| • | Acts of God; and |
| • | Global or regional political, economic or financial events and situations. |
8
Investing in a Single Commodity May Result in Greater Volatility than an Investment in a Multi-Commodity Index Fund.
The Fund invests in Index Contracts that seek exposure to a single commodity. Other commodity indexes may contain a larger number of commodities than the Index. Accordingly, increased volatility in the Index Commodity is expected to have a greater impact on the Index’s overall volatility than would likely be the case with increased volatility in a single commodity within a broader index. Because the Fund tracks the performance of the Index, your investment in the Fund will be exposed to the greater impact on the Index of volatility in a single Index Commodity.
Because the Futures Contracts Have No Intrinsic Value, the Positive Performance of Your Investment Is Wholly Dependent Upon an Equal and Offsetting Loss.
Trading in futures contracts transfers the risk of future price movements from one market participant to another. For every gain in futures trading, there is an equal and offsetting loss. Accordingly, whether a futures trade is profitable for one party depends on whether the price paid, value received, or cost of delivery under the related futures contract is favorable to that party. The prices of stocks, bonds, and other assets could rise significantly and the economy as a whole could prosper, while the Fund experiences losses as a result of pursuing its investment objective through trading Index Contracts.
The Fund May Not Provide a Diversification Benefit to Investments in Other Asset Classes and May Result in Additional Losses to Your Portfolio.
Historically, commodity futures returns have tended not to be correlated with the returns of other assets such as stocks and bonds. Commodity futures contracts therefore have the potential to help diversify investor portfolios consisting of stocks and bonds, to the extent there is low or negative correlation between commodity futures contracts and other assets held in those portfolios. However, the fact that the Index is not inversely correlated with other assets such as stocks and bonds means that, in seeking to replicate the performance of the Index, the Fund will not necessarily be profitable during unfavorable periods for the stock or bond markets. If the Shares perform in a manner that correlates with the stock or bond markets or otherwise do not perform successfully, the Shares may not provide any diversification from losses in those markets. In such a scenario, the Shares may produce no gains to offset losses from investments in stocks, bonds, or related assets and may result in additional investment losses.
The Fund’s Returns from Futures Trading Will Be Affected by Market Conditions When Replacing Expiring Futures Contracts With New Futures Contracts on the Index Commodity.
The Fund’s returns from futures trading are called excess return, which is the combined return based on the spot prices of the Index Commodity and the roll yield from trading Index Contracts. Market conditions at the time the Fund replaces expiring Index Contracts with new Index Contracts –i.e., when Index Contracts are “rolled” – will affect the Fund’s roll yield. Those market conditions are referred to as backwardation and contango, which will generally affect the Fund’s roll yield as set forth below:
| • | Rolling in a backwardated market will tend to enhance returns from futures trading. Backwardation exists when prices are higher for contracts with shorter-term expirations than those with longer-term expirations, a condition that is typically associated with commodities that are consumed quickly instead of being put in storage. |
| • | Rolling in a contangoed market will tend to cause a drag on returns from futures trading. Contango exists when contract prices are higher in distant delivery months than in nearer delivery months, typically due to costs associated with storing a given physical commodity for a longer period. |
In seeking to track the performance of the Index, therefore, the Fund will be exposed to the effects of backwardation and contango when it rolls its positions in Index Contracts. The Index uses the Optimum YieldTM rolling methodology, which seeks to maximize the roll benefits in backwardated markets and to minimize the losses from rolling in contangoed markets. There can be no assurance that these outcomes will be obtained. The impact of backwardation and contango may also cause the Fund’s performance to vary from the returns of other price references, including the spot prices of the Index Commodity.
Index Risks
The Fund’s Performance May Not Always Replicate the Changes in the Levels of Its Index.
Tracking the Index requires trading of the Fund’s portfolio with a view to tracking the Index over time and is dependent upon the skills of the Managing Owner and its trading principals, among other factors. It is possible that the Fund’s performance may not fully replicate the changes in the levels of the Index due to disruptions in the markets for the Index Commodity, the imposition of position limits or due to other extraordinary circumstances.
The Managing Owner may determine to invest in other futures contracts if at any time it is impractical or inefficient to gain full or partial exposure to the Index Commodity through an Index Contract. These other futures contracts may or may not be based on the Index Commodity. When they are not, the Managing Owner may seek to select futures contracts that it reasonably believes tend to exhibit trading prices that correlate with an Index Contract.
In addition, the Fund may not be able to replicate the changes in levels of the Index because the total return generated by the Fund is reduced by expenses and transaction costs, including those incurred in connection with the Fund’s trading activities, and increased by, as applicable, Treasury Income, Money Market Income andT-Bill ETF Income.
9
The Fund Is Not Actively Managed and Tracks the Index During Periods in Which the Index Is Flat or Declining as well as When the Index Is Rising.
The Fund is not actively managed on the basis of judgments relating to economic, financial and market conditions with a view to obtaining positive results under all market conditions. Instead, the Managing Owner seeks to cause the NAV to track the performance of the Index during periods in which the Index is flat or declining as well as when the Index is rising. Therefore, if positions in the Index Commodity are declining in value, the Fund will not close out such positions, except in connection with a change in the composition or weighting of the Index.
Unusually LongPeak-to-Valley Drawdown Periods with Respect To the Index May Be Reflected in Equally LongPeak-to-Valley Drawdown Periods with Respect to the Performance of the Shares.
“Peak-to-valley drawdown” represents the cumulative percentage decline inmonth-end NAV per Share due to losses sustained during any period in which the initialmonth-end NAV per Share is not equaled or exceeded by a subsequentmonth-end NAV per Share.
Although past Index levels are not necessarily indicative of future Index levels, thepeak-to-valley drawdown periods that the Index has experienced have been unusually long and have lasted for multi-year drawdown periods.
Because it is expected that the Fund’s performance will track the change of its underlying Index, the Fund would experience a continuous drawdown during the period that the Index experiences such a drawdown. The value of your Shares will also decrease during such a period.
Regulatory Risks
Position Limits and Other Potential Limitations on Futures Trading May Restrict the Creation of Baskets and the Operation of the Fund.
Position Limits. CFTC and futures exchange rules impose position limits on market participants, including the Fund, trading in certain commodity futures contracts. These position limits prohibit any person from holding a position of more than a specific number of futures contracts. Generally, position limits in the physical delivery markets are set at a stricter level during the spot month, which is the month when the futures contract matures and becomes deliverable, versus the limits for any other month or for all months combined. Limits are generally applied on an aggregate basis to positions held in accounts that are subject to 10% or greater common ownership or control. There are exemptions from this general aggregation requirement.
The Index is composed of one Index Commodity which is subject to position limits imposed by the CFTC and/or the rules of futures exchanges on which Index Contracts are traded. The CFTC has been seeking to amend its position limits rules for several years. In November 2013, the CFTC proposed for public comment new position limits and aggregation regulations. After a lengthy comment period on this proposal, the CFTCre-proposed, in December 2016, position limits for 25 commodity futures and options contracts, as well as for swaps that are economically equivalent to those contracts. In December 2016, the CFTC adopted rule amendments that provide exemptions from the general requirement to aggregate all positions that are held pursuant to 10% or greater common ownership or control.
The ultimate outcome of this rulemaking effort, and the resulting impact on the Fund of any final regulations that impose new or revised position limits, is unknown. It is also possible that futures exchanges may amend their existing position limits rules or adopt new requirements. In addition, the CFTC could separately implement other changes to specific position limits or to the regime as a whole. New or more restrictive position limits could reduce liquidity in the market, which would be likely to have adverse effects on the pricing of commodity futures contracts. Changes in CFTC and/or exchange-level position limits rules therefore could adversely affect the Fund’s ability to pursue its investment objective.
Position Aggregation. In general, a trader is required by CFTC or exchange rules, as applicable, to aggregate all positions in accounts as to which the trader has 10% or greater ownership or control. CFTC and exchange rules provide exemptions from this requirement. For example, a trader is not required to aggregate positions in multiple accounts that it owns or controls if that trader is able to satisfy the requirements of an exemption from aggregation of those accounts, including, where available, the independent account controller exemption.
Failure to comply with the independent account controller exemption or another exemption from the aggregation requirement could obligate the Managing Owner to aggregate positions in multiple accounts under its control, which could include the Fund and other commodity pools or accounts under the Managing Owner’s control. In such a scenario, the Fund may not be able to obtain exposure to one or more Index Contracts necessary to pursue its investment objective, or it may be required to liquidate existing Index Contract positions in order to comply with a limit. Such an outcome could adversely affect the Fund’s ability to pursue its investment objective or achieve favorable performance.
10
The CFTC amended its position aggregation rules in December 2016. The CFTC staff subsequently issued time-limitedno-action relief from compliance with certain requirements under the amended aggregation rules, including the general requirement to aggregate positions in the same commodity futures contracts traded pursuant to substantially identical trading strategies. Thisno-action relief expires on August 12, 2019.
Accountability Levels. Exchanges may establish accountability levels applicable to futures contracts instead of position limits. An exchange may order a person who holds or controls a position in excess of a position accountability level not to further increase its position, to comply with any prospective limit that exceeds the size of the position owned or controlled, or to reduce any open position that exceeds the position accountability level if the exchange determines that such action is necessary to maintain an orderly market. Position accountability levels could adversely affect the Fund’s ability to establish and maintain positions in commodity futures contracts to which such levels apply, if the Fund were to trade in such contracts. Such an outcome could adversely affect the Fund’s ability to pursue its investment objective.
Daily Limits. U.S. futures exchanges and some foreign exchanges have regulations that limit the amount of fluctuation in futures contract prices that may occur during a single business day. These limits are generally referred to as “daily price fluctuation limits” or “daily limits,” and the maximum or minimum price of a contract on any given day as a result of these limits is referred to as a “limit price.” Once a limit price has been reached in a particular contract, it is usually the case that no trades may be made at a different price than specified in the limit. The duration of limit prices generally varies. Limit prices may have the effect of precluding the Fund from trading in a particular contract or requiring the Fund to liquidate contracts at disadvantageous times or prices. Either of those outcomes could adversely affect the Fund’s ability to pursue its investment objective.
Potential Effects of Positions Limits, Accountability Levels, and Daily Limits. The Fund is currently subject to position limits and may be subject to new and more restrictive position limits in the future. If the Fund reached a position limit or accountability level or became subject to a daily limit, its ability to issue new Baskets or reinvest income in additional commodity futures contracts may be limited to the extent these restrictions limit its ability to establish new futures positions, add to existing positions, or otherwise transact in futures. Limiting the size of the Fund, or restricting the Fund’s futures trading, under these requirements could adversely affect the Fund’s ability to pursue its investment objective.
Failure of Futures Commission Merchants or Commodity Brokers to Segregate Assets May Cause Losses for the Fund.
The Commodity Exchange Act requires a futures commission merchant to segregate all funds received from customers from such futures commission merchant’s proprietary assets. If the Commodity Broker fails to segregate customer assets as required, the assets of the Fund might not be fully protected in the event of the Commodity Broker’s bankruptcy. Furthermore, in the event of the Commodity Broker’s bankruptcy, the Fund could be limited to recovering either apro ratashare of all available funds segregated on behalf of the Commodity Broker’s combined customer accounts or the Fund may not recover any assets at all, even though certain property specifically traceable to the Fund was held by the Commodity Broker.
The Commodity Exchange Act requires an approved derivatives clearing organization to segregate all funds and other property received from a clearing member’s customers in connection with U.S. futures and options contracts from any funds held at the clearing organization to support the clearing member’s proprietary trading. Nevertheless, customer funds held at a clearing organization in connection with any futures or options contracts may be held in a commingled omnibus account, which may not identify the name of the clearing member’s individual customers. With respect to futures and options contracts, a clearing organization may use assets of anon-defaulting customer held in an omnibus account at the clearing organization to satisfy payment obligations of a defaulting customer of the clearing member to the clearing organization. In the event of a default of the clearing futures commission merchant’s other clients or the clearing futures commission merchant’s failure to extend its own funds in connection with any such default, a customer may not be able to recover the full amount of assets deposited by the clearing futures commission merchant with the clearing organization on the customer’s behalf.
In the event of a bankruptcy or insolvency of any exchange or a clearing house, the Fund could experience a loss of the funds deposited through the Commodity Broker as margin with the exchange or clearing house, a loss of any unrealized profits on its open positions on the exchange, and the loss of unrealized profits on its closed positions on the exchange.
Regulatory Changes or Actions May Alter the Operations and Profitability of the Fund.
The regulation of commodity interest transactions and markets, including under the Dodd-Frank Act, is a rapidly changing area of law and is subject to ongoing modification by governmental and judicial action. In particular, the Dodd-Frank Act has expanded the regulation of markets, market participants and financial instruments. The regulatory regime under the Dodd-Frank Act has imposed additional compliance and legal burdens on participants in the markets for futures and other commodity interests. For example, under the Dodd-Frank Act new capital and risk requirements have been imposed on market intermediaries. Those requirements may cause the cost of trading to increase for market participants, like the Fund, that must interact with those intermediaries to carry out their trading activities. These increased costs can detract from the Fund’s performance.
The Fund and the Managing Owner Are Subject to Extensive Legal and Regulatory Requirements.
11
The Fund is subject to a comprehensive scheme of regulation under the federal commodity futures trading and securities laws, as well as futures market rules and the rules and listing standards for its Shares. The Fund and the Managing Owner could each be subject to sanctions for a failure to comply with those requirements, which could adversely affect the Fund’s financial performance and its ability to pursue its investment objective.
In addition, the Fund is subject to significant disclosure, internal control, governance, and financial reporting requirements because the Shares are publicly traded.
For example, the Fund is responsible for establishing and maintaining internal controls over financial reporting. Under this requirement, the Fund must adopt, implement and maintain an internal control system designed to provide reasonable assurance to its management regarding the preparation and fair presentation of published financial statements. The Fund is also required to adopt, implement, and maintain disclosure controls and procedures that are designed to ensure information required to be disclosed by the Fund in reports that it files or submits to the SEC is recorded, processed, summarized and reported within the time periods specified by the SEC. There is a risk that the Fund’s internal controls over financial reporting and disclosure controls and procedures could fail to work properly or otherwise fail to satisfy SEC requirements. Such a failure could result in the reporting or disclosure of incorrect information or a failure to report information on a timely basis. Such a failure could be to the disadvantage of Shareholders and could expose the Fund to penalties or otherwise adversely affect the Fund’s status under the federal securities laws and SEC regulations.
All internal control systems, no matter how well designed, have inherent limitations. Therefore, even those systems determined to be effective may provide only reasonable assurance with respect to financial statement preparation and presentation and other disclosure matters.
Current Discussions between the SEC and PricewaterhouseCoopers LLP regarding PricewaterhouseCoopers LLP’s Independence Could Have Potentially Adverse Consequences for the Fund.
PricewaterhouseCoopers LLP informed the Fund that it has identified an issue related to its independence under Rule2-01(c)(1)(ii)(A) of RegulationS-X (referred to as the Loan Rule). The Loan Rule prohibits accounting firms, such as PricewaterhouseCoopers LLP, from being deemed independent if they have certain financial relationships with their audit clients or certain affiliates of those clients. The Fund is required under various securities laws to have its financial statements audited by an independent accounting firm.
The Loan Rule specifically provides that an accounting firm would not be independent if it or certain affiliates and covered persons receive a loan from a lender that is a record or beneficial owner of more than ten percent of an audit client’s equity securities (referred to as a “more than ten percent owner”). For purposes of the Loan Rule, audit clients include the Fund as well as all registered investment companies advised by the Managing Owner and its affiliates, including other subsidiaries of the Managing Owner’s parent company, Invesco Ltd. (collectively, the “Invesco Fund Complex”). PricewaterhouseCoopers LLP informed the Fund it and certain affiliates and covered persons have relationships with lenders who hold, as record owner, more than ten percent of the shares of certain funds within the Invesco Fund Complex, which may implicate the Loan Rule.
On June 20, 2016, the SEC Staff issued a“no-action” letter to another mutual fund complex (see Fidelity Management & Research Company et al.,No-Action Letter) related to the audit independence issue described above. In that letter, the SEC confirmed that it would not recommend enforcement action against a fund that relied on audit services performed by an audit firm that was not in compliance with the Loan Rule in certain specified circumstances. On May 2, 2018, the SEC proposed amendments to the Loan Rule that, if adopted as proposed, would address many of the issues that led to issuance of theno-action letter. In connection with prior independence determinations, PricewaterhouseCoopers LLP communicated, as contemplated by theno-action letter, that it believes that it remains objective and impartial and that a reasonable investor possessing all the facts would conclude that PricewaterhouseCoopers LLP is able to exhibit the requisite objectivity and impartiality to report on the Fund’s financial statements as the independent registered public accounting firm. PricewaterhouseCoopers LLP also represented that it has complied with PCAOB Rule 3526(b)(1) and (2), which are conditions to the Funds relying on the no action letter, and affirmed that it is an independent accountant within the meaning of PCAOB Rule 3520. Therefore, the Managing Owner, the Fund and PricewaterhouseCoopers LLP concluded that PricewaterhouseCoopers LLP could continue as the Fund’s independent registered public accounting firm. The Invesco Fund Complex relied upon theno-action letter in reaching this conclusion.
If in the future the independence of PricewaterhouseCoopers LLP is called into question under the Loan Rule by circumstances that are not addressed in the SEC’sno-action letter, the Fund will need to take other action in order for the Fund’s filings with the SEC containing financial statements to be deemed compliant with applicable securities laws. Such additional actions could result in additional costs, impair the ability of the Fund to issue new shares or have other material adverse effects on the Fund. The SECno-action relief was initially set to expire eighteen (18) months from issuance but has been extended by the SEC without an expiration date, except that theno-action letter will be withdrawn upon the effectiveness of any amendments to the Loan Rule designed to address the concerns expressed in the letter.
12
Tax Risks
Shareholders Will Be Subject to Taxation on Their Allocable Share of the Fund’s Taxable Income, Whether or Not They Receive Cash Distributions.
Shareholders will be subject to U.S. federal income taxation and, in some cases, state, local, or foreign income taxation on their allocable share of the Fund’s taxable income, whether or not they receive cash distributions from the Fund. Shareholders may not receive cash distributions equal to their share of the Fund’s taxable income or even the tax liability that results from such income.
Items of Income, Gain, Loss and Deduction with Respect to Shares Could Be Reallocated if the IRS Does Not Accept the Assumptions or Conventions Used by the Fund in Allocating Such Items.
U.S. federal income tax rules applicable to partnerships are complex and often difficult to apply to publicly traded partnerships. The Fund will apply certain assumptions and conventions in an attempt to comply with applicable rules and to report items of income, gain, loss and deduction to Shareholders in a manner that reflects the Shareholders’ beneficial interest in such tax items, but these assumptions and conventions may not be in compliance with all aspects of the applicable tax requirements. It is possible that the United States Internal Revenue Service (the “IRS”) will successfully assert that the conventions and assumptions used by the Fund do not satisfy the technical requirements of the Internal Revenue Code of 1986, as amended (the “Code”) and/or the Federal Tax Regulations codified under 26 C.F.R., referred to herein as the Treasury Regulations, and could require that items of income, gain, loss and deduction be adjusted or reallocated in a manner that adversely affects one or more Shareholders.
The Fund is a partnership, which is not subject to U.S. federal income taxes. Rather, the partnership’s taxable income flows through to the owners, who are responsible for paying the applicable income taxes on the income allocated to them. For tax years beginning on or after January 1, 2018, the Fund is subject to partnership audit rules enacted as part of the Bipartisan Budget Act of 2015 (the “Centralized Partnership Audit Regime”). Under the Centralized Partnership Audit Regime, any IRS audit of the Fund would be conducted at the Fund level, and if the IRS determines an adjustment, the default rule is that the Fund would pay an “imputed underpayment” including interest and penalties, if applicable. The Fund may instead elect to make a“push-out” election, in which case the shareholders for the year that is under audit would be required to take into account the adjustments on their own personal income tax returns.
The Tax Cuts and Jobs Act (the “Tax Act”) Makes Significant Changes to U.S. Federal Income Tax Rules.
The Tax Act makes significant changes to the U.S. federal income tax rules for taxation of individuals and corporations, generally effective for taxable years beginning after December 31, 2017. Most of the changes applicable to individuals are temporary and would apply only to taxable years beginning after December 31, 2017 and before January 1, 2026. In particular for individuals, the Tax Act establishes for taxable years beginning after December 31, 2017 and before January 1, 2026 a 20% deduction for “qualified publicly traded partnership income” within the meaning of new Section 199A(e)(5) of the Code. In general, “qualified publicly traded partnership income” for this purpose is an item of income, gain, deduction or loss that is effectively connected with a United States trade or business and includable income for the year, but does not include certain investment income. It is currently not expected that the Fund’s income will be eligible for such deduction because, as discussed below, although the matter is not free from doubt, the Fund believes that the activities directly conducted by the Fund will not result in the Fund being engaged in a trade or business within the United States. Potential investors should consult their tax advisors regarding the availability of such deduction for their allocable share of the Fund’s items of income, gain, deduction and loss.
PROSPECTIVE INVESTORS ARE STRONGLY URGED TO CONSULT THEIR OWN TAX ADVISORS AND COUNSEL WITH RESPECT TO THE POSSIBLE TAX CONSEQUENCES TO THEM OF AN INVESTMENT IN THE SHARES; SUCH TAX CONSEQUENCES MAY DIFFER WITH RESPECT TO DIFFERENT INVESTORS.
Other Risks
An Insolvency Resulting from Another Series of the Trust or the Trust Itself May Have a Material Adverse Effect on the Fund.
The Fund is a series or a part of a Delaware statutory trust. Pursuant to Delaware law, the organization of the Trust provides that the assets and liabilities of the Fund are separate from the assets and liabilities of all other series of the Trust, as well as the larger Trust itself. Though such organization may, under state law, protect the assets of the Fund in an insolvency action brought by the creditors of another series of the Trust, this may be insufficient to protect the assets of the Fund from such creditors in an insolvency action in Federal court, or in a court in a foreign jurisdiction. Accordingly, an insolvency resulting from another series in the Trust or the Trust itself may have a material adverse effect on the Fund. The material risks associated with the other series have not been included in this Report.
13
Disruptions in the Ability to Create and Redeem Baskets May Adversely Affect Investors.
It is generally expected that the public trading price per Share will track the NAV per Share closely over time. The relationship between the public trading price per Share and the NAV per Share depends, to a considerable degree, on the ability of Authorized Participants or their clients or customers to purchase and redeem Baskets in the ordinary course. If the process for creating or redeeming Shares is impaired for any reason, Authorized Participants and their clients or customers may not be able to purchase and redeem Baskets or, even if possible, may choose not to do so. The inability to purchase and redeem Baskets, or the partial impairment of the ability to purchase and redeem Baskets, could result in Shares trading at a premium or discount to the NAV of the Fund. Such a premium or discount could be significant, depending upon the nature or duration of the impairment.
If the Fund were to issue all Shares that have been registered, it would not be able to create new Baskets until it registered additional Shares and those additional Shares became available for sale. An inability to create new Baskets could increase the possibility that the trading price per Share would not track closely the NAV per Share. In addition, the Fund may, in its discretion, suspend the creation of Baskets. Suspension of creations may adversely affect how the Shares are traded and could cause Shares to trade at a premium or discount to the NAV of the Fund, perhaps to a significant degree.
The Shares Could Decrease in Value if Unanticipated Operational or Trading Problems Arise.
The mechanisms and procedures governing the creation, redemption and offering of the Shares have been developed specifically for the Fund. Consequently, there may be unanticipated problems with respect to the mechanics of the operations of the Fund and the trading of the Shares that could have a material adverse effect on an investment in the Shares. To the extent that unanticipated operational or trading problems arise, the Managing Owner’s past experience and qualifications may not be suitable for solving those problems.
Historical Performance of the Fund and the Index Is Not Indicative of Future Performance.
Past performance of the Fund or the Index is not necessarily indicative of future results. Therefore, past performance of the Fund or the Index should not be relied upon in deciding whether to buy Shares of the Fund.
Fees and Expenses May Deplete the Fund’s Assets if the Fund’s Investment Performance Is Not Favorable.
The Fund pays fees and expenses regardless of its investment performance. Such fees and expenses include asset-based fees of 0.75% per annum. Additional charges include brokerage fees of approximately 0.03% per annum in the aggregate and selling commissions. Selling commissions are not included in the Fund’s breakeven calculation. The sum of the Fund’s Treasury Income, Money Market Income and/orT-Bill ETF Income may not exceed its fees and expenses. If such income does not exceed its fees and expenses, in order to break even, the Fund’s futures trading activity will need to have a favorable performance that exceeds the difference between the sum of the Fund’s Treasury Income, Money Market Income and/orT-Bill ETF Income and its fees and expenses. If the Fund’s futures trading performance is not sufficiently favorable, the Fund’s expenses could deplete its assets over time. In such a scenario, the value of your Shares will decrease.
There May Be Circumstances That Could Prevent the Fund from Being Operated in a Manner Consistent with its Investment Objective.
There may be circumstances outside the control of the Managing Owner and/or the Fund that make it, for all practical purposes, impossible tore-position the Fund and/or to process a purchase or redemption order. Examples of such circumstances include: natural disasters; public service disruptions or utility problems such as those caused by fires, floods, extreme weather conditions, and power outages resulting in telephone, telecopy, and computer failures; market conditions or activities causing trading halts; systems failures involving computer or other information systems affecting the aforementioned parties, as well as DTC, or any other participant in the purchase process, and similar extraordinary events. While the Managing Owner has established and implemented a disaster recovery plan, circumstances such as those identified above may prevent the Fund from being operated in a manner consistent with its investment objective.
Redemption Orders for Baskets May Be Subject to Postponement, Suspension or Rejection Under Certain Circumstances.
The Managing Owner may, in its discretion, suspend the right of redemption or postpone the redemption order settlement date with respect to Baskets for (1) any period during which an emergency exists as a result of which the redemption distribution is not reasonably practicable, or (2) such other period as the Managing Owner determines to be necessary for the protection of the Shareholders. In addition, the Fund will reject a redemption order if the order is not in proper form as described in the participant agreement with the Authorized Participant, or if the fulfillment of the order, in the opinion of the Fund’s counsel, might be unlawful. Any such postponement, suspension or rejection could adversely affect a redeeming Authorized Participant. For example, the resulting delay may adversely affect the value of the Authorized Participant’s redemption proceeds if the NAV of the Fund declines during the period of delay. The Fund disclaims any liability for any loss or damage that may result from any such suspension or postponement.
14
Shareholders Do Not Have the Protections Associated with Ownership of Shares in an Investment Company Registered Under the Investment Company Act of 1940.
The Fund is not registered as an investment company under the Investment Company Act of 1940, as amended. Consequently, Shareholders do not have the legal and regulatory protections provided to the investors in investment companies that are registered as such.
Shareholders Do Not Have the Rights Enjoyed by Investors in Certain Other Vehicles.
The Shares have none of the statutory rights normally associated with the ownership of shares of a corporation. However, under Delaware law, a beneficial owner of a business trust (such as a Shareholder) may, under certain circumstances, institute legal action on behalf of himself and all other similarly situated beneficial owners to recover damages from a third party where a managing owner has failed or refused to institute legal action on behalf of himself and all other similarly situated beneficial owners to recover damages from a managing owner for violations of fiduciary duties, or on behalf of a business trust to recover damages from a third party where a managing owner has failed or refused to institute proceedings to recover such damages. The Shares have limited voting and distribution rights (for example, Shareholders do not have the right to elect directors and the Fund is not required to pay regular distributions, although the Fund may pay distributions in the discretion of the Managing Owner).
Various Actual and Potential Conflicts of Interest May Be Detrimental to Shareholders.
The Fund is subject to actual and potential conflicts of interest involving the Managing Owner or any of its affiliates, the Commodity Broker, including its principals and its affiliates, the Index Sponsor and Marketing Agent, and Invesco Distributors. The Managing Owner and its principals, all of whom are engaged in other investment activities, are not required to devote substantially all of their time to the business of the Fund, which also presents the potential for numerous conflicts of interest with the Fund. The Managing Owner and its principals and affiliates are engaged in a broad array of asset management and financial services activities and may engage in activities during the ordinary course of business that cause their interests or those of their other clients to conflict with those of the Fund and its Shareholders.
As a result of these and other relationships, parties involved with the Fund have a financial incentive to act in a manner other than in the best interests of the Fund and the Shareholders. For example, by investing in affiliated money market mutual funds and/orT-Bill ETFs for margin and/or cash management purposes, the Managing Owner may select affiliated money market mutual funds and/orT-Bill ETFs that may pay dividends that are lower thannon-affiliated money market mutual funds and/orT-Bill ETFs. In addition, the Managing Owner would have a conflict of interest if it sought to redeem the Fund’s interest in an affiliated money market mutual fund orT-Bill ETF in circumstances when such a redemption would be unfavorable for the affiliated fund. The Managing Owner has not established any formal procedure to resolve conflicts of interest. Consequently, investors are dependent on the good faith of the respective parties subject to such conflicts to resolve them equitably. Although the Managing Owner attempts to monitor these conflicts, it is extremely difficult, if not impossible, for the Managing Owner to ensure that these conflicts do not, in fact, result in adverse consequences to the Fund and the Shareholders.
The Fund may be subject to certain conflicts with respect to the Commodity Broker, including, but not limited to, conflicts that result from receiving greater amounts of compensation from other clients, or purchasing opposite or competing positions on behalf of third party accounts traded through the Commodity Broker.
Because the Managing Owner and Invesco Distributors are affiliates, the Managing Owner has a disincentive to replace Invesco Distributors. Furthermore, the Managing Owner did not conduct an arm’s length negotiation when it retained Invesco Distributors.
Lack of Independent Advisers Representing Investors.
The Managing Owner has consulted with counsel, accountants and other advisers regarding the operation of the Fund. No counsel has been appointed to represent you in connection with the Fund’s continuous offering of Shares. Accordingly, you should consult your own legal, tax and financial advisers about whether you should invest in the Fund.
Possibility of Termination of the Fund May Adversely Affect Your Portfolio.
It is ultimately within the discretion of the Managing Owner whether it will continue to operate and advise the Fund. The Managing Owner may withdraw from the Fund upon 120 days’ prior written notice to all Shareholders and the Trustee, which would cause the Fund to terminate unless a substitute managing owner was obtained. Shareholders owning 50% or more of the Shares have the power to terminate the Fund. If it is so exercised, investors who may wish to continue to invest in a vehicle that tracks the Fund’s Index will have to find another vehicle, and may not be able to find another vehicle that offers the same features as the Fund. See “Description of the Shares; The Funds; Certain Material Terms of the Trust Agreement – Termination Events” in the Fund’s Prospectus for a summary of termination events. Such detrimental developments could cause you to liquidate your investments and upset the overall maturity and timing of your investment portfolio. If the registrations with the CFTC or memberships in the NFA of the Managing Owner or the Commodity Broker were revoked or suspended, such entity would no longer be able to provide services to the Fund.
15
Competing Claims Over Ownership of Intellectual Property Rights Related to the Fund Could Adversely Affect the Fund and an Investment in the Shares.
While the Managing Owner believes that all intellectual property rights needed to operate the Fund in the manner described in the Fund’s Prospectus are either owned by or licensed to the Managing Owner or have been obtained, third parties may allege or assert ownership of intellectual property rights which may be related to the design, structure and operations of the Fund. To the extent any claims of such ownership are brought or any proceedings are instituted to assert such claims, the issuance of any restraining orders or injunctions, the negotiation, litigation or settlement of such claims, or the ultimate disposition of such claims in a court of law may adversely affect the Fund and an investment in the Shares. For example, such actions could result in expenses or damages payable by the Fund, suspension of activities or the termination of the Fund.
The Value of the Shares Will Be Adversely Affected if the Fund Is Required to Indemnify the Trustee or the Managing Owner.
Under the Trust Agreement, the Trustee and the Managing Owner have the right to be indemnified for any liability or expense they incur, except for any expenses resulting from gross negligence or willful misconduct. That means the Managing Owner may require the assets of the Fund to be sold in order to cover losses or liability suffered by it or by the Trustee. Any sale of that kind would reduce the NAV of the Fund and, consequently, the value of the Shares.
Although the Shares Are Limited Liability Investments, Certain Circumstances such as Bankruptcy of the Fund or Indemnification of the Fund by the Shareholders Will Increase a Shareholder’s Liability.
The Shares are limited liability investments; investors may not lose more than the amount that they invest including any appreciation in their investments. However, Shareholders could be required, as a matter of bankruptcy law, to return to the estate of the Fund any distribution they received at a time when the Fund was in fact insolvent or in violation of the Trust Agreement. In addition, Shareholders agree in the Trust Agreement that they will indemnify the Fund for any harm suffered by it as a result of:
| • | Shareholders’ actions unrelated to the business of the Fund, or |
| • | taxes imposed on the Shares by the states or municipalities in which such investors reside. |
The Fund May Lose Money on Its Holdings of Money Market Mutual Funds.
The Fund may invest in government money market funds that have chosen to not rely on the ability to impose fees on shareholder redemptions, or liquidity fees, or temporarily to suspend redemption privileges, or gates, if the government money market fund’s weekly liquid assets fall below a certain threshold. Although such government money market funds seek to preserve the value of an investment at $1.00 per share, there is no guarantee that they will be able to do so. As a result, the Fund may lose money by investing in a government money market fund. An investment in a government money market fund is not insured or guaranteed by the Federal Deposit Insurance Corporation (“FDIC”) or any other government agency. The share price of a government money market fund can fall below the $1.00 share price. The Fund cannot rely on or expect a government money market fund’s adviser or its affiliates to enter into support agreements or take other actions to maintain the government money market fund’s $1.00 share price. The credit quality of a government money market fund’s holdings can change rapidly in certain markets, and the default of a single holding could have an adverse impact on the government money market fund’s share price. Due to fluctuations in interest rates, the market value of securities held by a government money market fund may vary. A government money market fund’s share price can also be negatively affected during periods of high redemption pressures and/or illiquid markets.
Due to the Increased Use of Technologies, Intentional and Unintentional Cyber Attacks Pose Operational and Information Security Risks.
With the increased use of technologies such as the Internet and the dependence on computer systems to perform necessary business functions, the Fund is susceptible to operational and information security risks. In general, cyber incidents can result from deliberate attacks or unintentional events. Cyber attacks include, but are not limited to gaining unauthorized access to digital systems for purposes of misappropriating assets or sensitive information, corrupting data, or causing operational disruption.
Cyber attacks may also be carried out in a manner that does not require gaining unauthorized access, such as causingdenial-of-service attacks on websites. Cyber security failures or breaches of the Fund’s third party service providers (including, but not limited to, the Index Sponsor, the Administrator and the Transfer Agent) or the money market mutual funds andT-Bill ETFs in which the Fund invests, have the ability to cause disruptions and impact business operations, potentially resulting in financial losses, the inability of Shareholders or Authorized Participants to transact business in Shares and Baskets, respectively, violations of applicable privacy and other laws, regulatory fines, penalties, reputational damage, reimbursement or other compensation costs, and/or additional compliance costs. In addition, substantial costs may be incurred in order to prevent any cyber incidents in the future. The Fund and its Shareholders could be negatively impacted as a result.
While the Managing Owner has established business continuity plans and systems reasonably designed to detect and prevent such cyber attacks from being effective, there are inherent limitations in such plans and systems. For instance, it is possible that certain existing risks have not been identified or that new risks will emerge before countervailing measures can be implemented. Furthermore,
16
the Fund cannot control, or even necessarily influence, the cyber security plans and systems put in place by the Fund’s third party service providers. Since the Fund is dependent upon third party service providers (including the Managing Owner) for substantially all of its operational needs, the Fund is subject to the risk that a cyber attack on a service provider will materially impair its normal operations even if the Fund itself is not subject to such an attack. Cyber attacks may also cause disruptions to the futures exchanges and clearinghouses through which the Fund invests in futures contracts and to the exchanges on which the Fund buys and sells shares ofT-Bill ETFs, which could result in disruptions to the Fund’s ability to pursue its investment objective, resulting in financial losses to the Fund and Shareholders.
| ITEM 1B. | UNRESOLVED STAFF COMMENTS |
None.
| ITEM 2. | PROPERTIES |
The Fund does not own or use physical properties in the conduct of its business. Its assets consist of futures contracts, cash, United States Treasury Obligations and may consist of money market mutual funds and/orT-Bill ETFs. The Managing Owner’s headquarters are located at 3500 Lacey Road, Suite 700, Downers Grove, Illinois 60515.
| ITEM 3. | LEGAL PROCEEDINGS |
None.
| ITEM 4. | MINE SAFETY DISCLOSURES |
Not applicable.
| ITEM 5. | MARKET FOR REGISTRANT’S COMMON EQUITY, RELATED STOCKHOLDER MATTERS AND ISSUER PURCHASES OF EQUITY SECURITIES |
Market Information
The Shares have been trading on the NYSE Arca since November 25, 2008 under the symbol “DBO.”
Holders
As of January 31, 2019, the Fund had 96 holders of record of its Shares.
Sales of Unregistered Securities and Use of Proceeds of Registered Securities
(a) There have been no unregistered sales of the Shares. No Shares are authorized for issuance by the Fund under equity compensation plans.
(b) Not applicable.
(c) The following table summarizes the redemptions by Authorized Participants during the Three Months Ended December 31, 2018:
Period of Redemption | Total Number of Shares Redeemed | Average Price Paid per Share | ||||||
October 1, 2018 to October 31, 2018 | 400,000 | $ | 13.17 | |||||
November 1, 2018 to November 30, 2018 | 2,800,000 | 9.89 | ||||||
December 1, 2018 to December 31, 2018 | 400,000 | 9.53 | ||||||
|
|
|
| |||||
Total | 3,600,000 | $ | 10.21 | |||||
|
|
|
| |||||
17
| ITEM 6. | SELECTED FINANCIAL DATA |
The following table summarizes the relevant 2018, 2017, 2016, 2015 and 2014 financial data for the Fund and should be read in conjunction with the Fund’s financial statements, and the notes and schedules related thereto, which are included in this report.
| Years Ended December 31, | ||||||||||||||||||||
| 2018 | 2017 | 2016 | 2015 | 2014 | ||||||||||||||||
Income(a) | $ | 7,238,660 | $ | 3,205,781 | $ | 1,235,732 | $ | 123,536 | $ | 104,628 | ||||||||||
Net investment income (loss) | $ | 4,019,922 | $ | 124,150 | $ | (2,171,777 | ) | $ | (3,914,384 | ) | $ | (2,037,831 | ) | |||||||
Net realized and net change in unrealized gains/(losses) on United States Treasury Obligations, Affiliated Investments and Commodity Futures Contracts | $ | (42,322,521 | ) | $ | 16,745,356 | $ | 49,964,955 | $ | (221,862,791 | ) | $ | (134,761,696 | ) | |||||||
Net Income (Loss) | $ | (38,302,599 | ) | $ | 16,869,506 | $ | 47,793,178 | $ | (225,777,175 | ) | $ | (136,799,527 | ) | |||||||
Net Income (Loss) per Share | $ | (1.70 | ) | $ | 0.54 | $ | 0.60 | $ | (6.44 | ) | $ | (12.18 | ) | |||||||
Return of Capital Distributions per General Share | $ | (0.13 | ) | $ | — | $ | — | $ | — | $ | — | |||||||||
Return of Capital Distributions per Share | $ | (0.13 | ) | $ | — | $ | — | $ | — | $ | — | |||||||||
Net increase (decrease) in cash | $ | (1,008,149 | ) | $ | 1,008,149 | $ | (32,179,166 | ) | $ | (36,434,784 | ) | $ | 62,836,866 | |||||||
| As of December 31, | ||||||||||||||||||||
| 2018 | 2017 | 2016 | 2015 | 2014 | ||||||||||||||||
Total Assets | $ | 261,940,169 | $ | 333,046,864 | $ | 453,548,425 | $ | 410,352,640 | $ | 290,416,811 | ||||||||||
General Shares NAV | $ | 8.38 | $ | 10.21 | $ | 9.67 | $ | 9.07 | $ | 15.51 | ||||||||||
Shares NAV | $ | 8.38 | $ | 10.21 | $ | 9.67 | $ | 9.07 | $ | 15.51 | ||||||||||
| (a) | Income for the year ended December 31, 2014 includes interest expense on overdraft balances. These amounts are included in Interest Expense for the years ended December 31, 2018, 2017, 2016 and 2015. |
Selected Quarterly Financial Data (Unaudited)
| For the Three Months Ended, | ||||||||||||||||
| March 31, 2018 | June 30, 2018 | September 30, 2018 | December 31, 2018 | |||||||||||||
Income | $ | 1,267,575 | $ | 1,986,234 | $ | 2,102,919 | $ | 1,881,932 | ||||||||
Net investment income (loss) | $ | 532,716 | $ | 1,014,367 | $ | 1,257,717 | $ | 1,215,122 | ||||||||
Net realized and net change in unrealized gains (losses) on United States Treasury Obligations, Affiliated Investments and Commodity Futures Contracts | $ | 34,030,979 | $ | 56,119,959 | $ | 24,949,786 | $ | (157,423,245 | ) | |||||||
Net Income (loss) | $ | 34,563,695 | $ | 57,134,326 | $ | 26,207,503 | $ | (156,208,123 | ) | |||||||
Increase (decrease) in Net Asset Value | $ | 11,102,350 | $ | 43,640,703 | $ | 16,092,553 | $ | (142,095,544 | ) | |||||||
Net Income (loss) per Share(a) | $ | 0.96 | $ | 1.33 | $ | 0.96 | $ | (4.95 | ) | |||||||
Return of Capital Distributions per General Share(a) | $ | — | $ | — | $ | — | $ | (0.13 | ) | |||||||
Return of Capital Distributions per Share(a) | $ | — | $ | — | $ | — | $ | (0.13 | ) | |||||||
| (a) | The amount shown for a share outstanding for quarterly statements may not correlate with year to date amounts due to timing of subscriptions and redemptions in relation to income earned or distributed. |
18
| For the Three Months Ended, | ||||||||||||||||
| March 31, 2017 | June 30, 2017 | September 30, 2017 | December 31, 2017 | |||||||||||||
Income | $ | 517,365 | $ | 688,113 | $ | 970,545 | $ | 1,029,758 | ||||||||
Net investment income (loss) | $ | (344,979 | ) | $ | (89,257 | ) | $ | 229,338 | $ | 329,048 | ||||||
Net realized and net change in unrealized gains (losses) on United States Treasury Obligations, Affiliated Investments and Commodity Futures Contracts | $ | (40,469,252 | ) | $ | (31,617,594 | ) | $ | 36,319,324 | $ | 52,512,878 | ||||||
Net Income (loss) | $ | (40,814,231 | ) | $ | (31,706,851 | ) | $ | 36,548,662 | $ | 52,841,926 | ||||||
Increase (decrease) in Net Asset Value | $ | (43,223,752 | ) | $ | (8,761,609 | ) | $ | 57,787,071 | $ | (125,726,023 | ) | |||||
Net Income (loss) per Share(a) | $ | (0.88 | ) | $ | (0.74 | ) | $ | 0.77 | $ | 1.39 | ||||||
| (a) | The amount shown for a share outstanding for quarterly statements may not correlate with year to date amounts due to timing of subscriptions and redemptions in relation to income earned or distributed. |
19
| ITEM 7. | MANAGEMENT’S DISCUSSION AND ANALYSIS OF FINANCIAL CONDITION AND RESULTS OF OPERATIONS |
This information should be read in conjunction with the financial statements and notes included in Item 8 of Part II of this Report. The discussion and analysis which follows may contain trend analysis and other forward-looking statements. See “Cautionary Statement Concerning Forward-Looking Information” above.
You should not place undue reliance on any forward-looking statements. Except as expressly required by the Federal securities laws, the Fund and the Managing Owner undertakes no obligation to publicly update or revise any forward-looking statements or the risks, uncertainties or other factors described in this Report, as a result of new information, future events or changed circumstances or for any other reason after the date of this Report.
Overview/Introduction
Invesco Capital Management LLC (“Invesco”) has served as the managing owner (the “Managing Owner”), commodity pool operator and commodity trading advisor of the Fund since February 23, 2015. The Managing Owner is registered with the Commodity Futures Trading Commission (the “CFTC”) as a commodity pool operator and a commodity trading advisor, and it is a member firm of the National Futures Association (“NFA”).
The Fund seeks to track changes, whether positive or negative, in the level of the DBIQ Optimum Yield Crude Oil Index Excess Return™ (the “Index”) over time, plus the excess, if any, of the sum of the Fund’s interest income from its holdings of United States Treasury Obligations (“Treasury Income”), dividends from its holdings in money market mutual funds (affiliated or otherwise) (“Money Market Income”) and dividends or distributions of capital gains from its holdings ofT-Bill ETFs (as defined below)(“T-Bill ETF Income”) over the expenses of the Fund. The Fund invests in futures contracts in an attempt to track its Index. The Index is intended to reflect the change in market value of the crude oil sector. The single commodity comprising the Index is Light Sweet Crude Oil (WTI) (the “Index Commodity”).
The Fund may invest directly in United States Treasury Obligations. The Fund may also gain exposure to United States Treasury Obligations through investments in exchange-traded funds (“ETFs”) (affiliated or otherwise) that track indexes that measure the performance of United States Treasury Obligations with a maximum remaining maturity of up to 12 months(“T-Bill ETFs”). The Fund invests in United States Treasury Obligations, money market mutual funds andT-Bill ETFs (affiliated or otherwise), if any, for margin and/or cash management purposes.
The Fund pursues its investment objective by investing in a portfolio of exchange-traded commodity futures contracts that expire in a specific month and trade on a specific exchange (the “Index Contracts”) in the single commodity comprising the Index (the “Index Commodity”). The single Index Commodity is Light Sweet Crude Oil (WTI). The Index is composed of notional amounts of the Index Commodity. The Fund also holds United States Treasury Obligations andT-Bill ETFs, if any, for deposit with Morgan Stanley & Co. LLC, the Fund’s commodity broker (the “Commodity Broker”) as margin, to the extent permissible under CFTC rules and United States Treasury Obligations, cash, money market mutual funds andT-Bill ETFs (affiliated or otherwise), if any, on deposit with The Bank of New York Mellon (the “Custodian”), for cash management purposes. The aggregate notional value of the commodity futures contracts owned by the Fund is expected to approximate the aggregate net asset value (“NAV”) of the Fund, as opposed to the aggregate Index value.
The CFTC and certain futures exchanges impose position limits on futures contracts, including on Index Contracts. The Managing Owner may determine to invest in other futures contracts if at any time it is impractical or inefficient to gain full or partial exposure to the Index Commodity through the use of Index Contracts. These other futures contracts may or may not be based on the Index Commodity. When they are not, the Managing Owner may seek to select futures contracts that it reasonably believes tend to exhibit trading prices that correlate with an Index Contract.
The Shares are intended to provide investment results that generally correspond to the changes, positive or negative, in the levels of the Index over time. The value of the Shares is expected to fluctuate in relation to changes in the value of the Fund’s portfolio. The market price of the Shares may not be identical to the NAV per Share, but these two valuations are expected to be very close.
Margin Calls
“Initial” or “original” margin is the minimum amount of funds that must be deposited by a futures trader with his commodity broker in order to initiate futures trading or to maintain an open position in futures contracts. “Maintenance” margin is the amount (generally less than initial margin) to which a trader’s account may decline before he must deliver additional margin. A margin deposit is like a cash performance bond. It helps assure the futures trader’s performance of the futures contract that the trader purchases or sells. Futures contracts are customarily bought and sold on margin that represents a very small percentage (ranging
20
upward from less than 2%) of the purchase price of the underlying commodity being traded. Because of such low margins, price fluctuations occurring in the futures markets may create profits and losses that are greater, in relation to the amount invested, than are customary in other forms of investments. The minimum amount of margin required in connection with a particular futures contract is set from time to time by the exchange on which such contract is traded, and may be modified from time to time by the exchange during the term of the contract. “Variation margin” is assessed daily to reflect changes in the value of the position.
Brokerage firms carrying accounts for traders in futures contracts may not accept lower, and generally require higher, amounts of margin as a matter of policy in order to afford further protection for themselves.
Margin requirements are computed each day by a commodity broker. When the market value of a particular open futures contract position changes to a point where the margin on deposit does not satisfy maintenance margin requirements, a margin call is made by the commodity broker. If the margin call is not met within a reasonable time, the broker may close out the Fund’s position. With respect to the Managing Owner’s trading, only the Managing Owner, and not the Fund or its Shareholders personally, will be subject to margin calls.
Position Limits and/or Accountability Levels
The Fund has not reached position limits with respect to the 2018, 2017 and 2016 reporting periods.
Net Asset Value
NAV means the total assets of the Fund, including, but not limited to, all commodity futures contracts, cash and investments less total liabilities of the Fund, each determined on the basis of U.S. generally accepted accounting principles (“U.S. GAAP”), consistently applied under the accrual method of accounting. All open commodity futures contracts will be calculated at their then current market value, which will be based upon the settlement price for that particular commodity futures contract traded on the applicable primary exchange on the date with respect to which NAV is being determined. Securities for which market quotations are not readily available or became unreliable are valued at fair value as determined in good faith following procedures approved by the Managing Owner. The amount of any distribution is a liability of the Fund from the day when the distribution is declared until it is paid.
NAV per Share is the NAV of the Fund divided by the number of outstanding Shares.
Market Risk
Trading in futures contracts involves the Fund entering into contractual commitments to purchase a particular commodity at a specified date and price. The market risk associated with the Fund’s commitments to purchase commodities is limited to the gross or face amount of the contracts held.
The Fund’s exposure to market risk is also influenced by a number of factors including the volatility of interest rates and foreign currency exchange rates, the liquidity of the markets in which the contracts are traded and the relationships among the contracts held. The inherent uncertainty of the Fund’s trading as well as the development of drastic market occurrences could ultimately lead to a loss of all or substantially all of the investors’ capital.
Credit Risk
When the Fund enters into futures contracts, the Fund is exposed to credit risk that the counterparty to the contract will not meet its obligations. The counterparty for futures contracts traded on United States and on most foreign futures exchanges is the clearing house associated with the particular exchange. In general, clearing houses are backed by their corporate members who may be required to share in the financial burden resulting from the nonperformance by one of their members and, as such, is designed to disperse and mitigate the credit risk posed by any other one member. In cases where the clearing house is not backed by the clearing members (i.e., some foreign exchanges), it may be backed by a consortium of banks or other financial institutions. There can be no assurance that any counterparty, clearing member or clearinghouse will meet its obligations to the Fund.
The Commodity Broker, when acting as the Fund’s futures commission merchant in accepting orders for the purchase or sale of domestic futures contracts, is required by CFTC regulations to separately account for and segregate as belonging to the Fund all assets of the Fund relating to domestic futures trading. The Commodity Broker is not allowed to commingle such assets with other assets of the Commodity Broker. In addition, CFTC regulations also require the Commodity Broker to hold in a secure account assets of the Fund related to foreign futures trading. While the legal requirements are designed to protect the customers of futures commission merchants, a failure by the Commodity Broker to comply with those requirements would be likely to have a material adverse effect on the Fund in the event that the Commodity Broker became insolvent or suffered other financial distress.
21
Liquidity
The Fund’s entire source of capital is derived from the Fund’s offering of Shares to Authorized Participants. The Fund in turn allocates its net assets to commodity futures trading. A significant portion of the NAV is held in United States Treasury Obligations, which may be used as margin for the Fund’s trading in commodity futures contracts and United States Treasury Obligations, money market mutual funds, cash andT-Bill ETFs, if any, which may be used for cash management purposes. The percentage that United States Treasury Obligations bear to the total net assets will vary from period to period as the market values of the Fund’s commodity interests change. A portion of the Fund’s United States Treasury Obligations are held for deposit with the Commodity Broker to meet margin requirements. All remaining cash, money market mutual funds,T-Bill ETFs, if any, and United States Treasury Obligations are on deposit with the Custodian. Interest earned on the Fund’s interest-bearing funds and dividends from the Fund’s holdings of money market mutual funds are paid to the Fund. Any dividends or distributions of capital gains received from the Fund’s holdings ofT-Bill ETFs, if any, are paid to the Fund.
The Fund’s commodity futures contracts may be subject to periods of illiquidity because of market conditions, regulatory considerations or for other reasons. For example, commodity exchanges generally have the ability to limit fluctuations in certain commodity futures contract prices during a single day by regulations referred to as “daily limits.” During a single day, no trades may be executed at prices beyond the daily limit. Once the price of a particular futures contract for a particular commodity has increased or decreased by an amount equal to the daily limit, positions in the commodity futures contract can neither be taken nor liquidated unless the traders are willing to effect trades at or within the limit. Commodity futures prices have occasionally moved the daily limit for several consecutive days with little or no trading. Such market conditions could prevent the Fund from promptly liquidating its commodity futures positions.
Because the Fund trades futures contracts, its capital is at risk due to changes in the value of futures contracts (market risk) or the inability of counterparties (including the Commodity Broker and/or exchange clearinghouses) to perform under the terms of the contracts (credit risk).
On any business day, an Authorized Participant may place an order with the Transfer Agent to redeem one or more Baskets. Redemption orders must be placed by 10:00 a.m., Eastern Time. The day on which the Managing Owner receives a valid redemption order is the redemption order date. The day on which a redemption order is settled is the redemption order settlement date. As provided below, the redemption order settlement date may occur up to two business days after the redemption order date. Redemption orders are irrevocable. The redemption procedures allow Authorized Participants to redeem Baskets. Individual Shareholders may not redeem directly from the Fund. Instead, individual Shareholders may only redeem Shares in integral multiples of 200,000 and only through an Authorized Participant.
Unless otherwise agreed to by the Managing Owner and the Authorized Participant as provided in the next sentence, by placing a redemption order, an Authorized Participant agrees to deliver the Baskets to be redeemed through DTC’s book-entry system to the Fund no later than the redemption order settlement date as of 2:45 p.m., Eastern Time, on the business day immediately following the redemption order date. Upon submission of a redemption order, the Authorized Participant may request the Managing Owner to agree to a redemption order settlement date up to two business days after the redemption order date. By placing a redemption order, and prior to receipt of the redemption proceeds, an Authorized Participant’s DTC account is charged thenon-refundable transaction fee due for the redemption order.
Redemption orders may be placed either (i) through the Continuous Net Settlement (“CNS”) clearing processes of the National Securities Clearing Corporation (the “NSCC”) (the “CNS Clearing Process”) or (ii) if outside the CNS Clearing Process, only through the facilities of The Depository Trust Company (“DTC” or the “Depository”) (the “DTC Process”), or a successor depository, and only in exchange for cash. By placing a redemption order, and prior to receipt of the redemption proceeds, an Authorized Participant’s DTC account is charged thenon-refundable transaction fee due for the redemption order and such fee is not borne by the Fund.
Capital Resources
The Fund does not have any material commitments for capital expenditures as of the end of the latest fiscal period.
The Fund is unaware of any (i) anticipated known demands, commitments or capital expenditures; (ii) material trends, favorable or unfavorable, in its capital resources; or (iii) trends or uncertainties that will have a material effect on operations.
Cash Flows
A primary cash flow activity of the Fund is to raise capital from Authorized Participants through the issuance of Shares. This cash is used to invest in United States Treasury Obligations, money market mutual funds andT-Bill ETFs, if any, and to meet margin requirements as a result of the positions taken in futures contracts to match the fluctuations of the Index the Fund is tracking.
22
As of the date of this Report, each of Bank of America Merrill Lynch, BMO Capital Markets Corp., BNP Paribas Securities Corp, Cantor Fitzgerald & Co., Citadel Securities LLC, Citigroup Global Markets, Credit Suisse Securities (USA) LLC, Deutsche Investment Management Americas Inc., Goldman Sachs & Co., Goldman Sachs Execution & Clearing LP, Interactive Brokers LLC, Jefferies LLC, JP Morgan Securities Inc., Knight Clearing Services LLC, Merrill Lynch Professional Clearing Corp, Morgan Stanley & Co. LLC, Nomura Securities International Inc., RBC Capital Markets LLC, SG Americas Securities LLC, Timber Hill LLC, UBS Securities, Virtu Financial BD LLC and Virtu Financial Capital Markets LLC has executed a Participant Agreement and are the only Authorized Participants.
Operating Activities
Net cash flow provided by (used for) operating activities was $31.8 million, $137.8 million and $(27.1) million for the years ended December 31, 2018, 2017 and 2016, respectively. These amounts primarily include net income (loss), net purchases and sales of money market mutual funds and net purchases and sales of United States Treasury Obligations and affiliated investments. The Fund invests in futures contracts in an attempt to track its Index. The Fund invests in United States Treasury Obligations, money market mutual funds andT-Bill ETFs (affiliated or otherwise), if any, for margin and/or cash management purposes only.
During the year ended December 31, 2018, $1,532.5 million was paid to purchase United States Treasury Obligations and $1,622.8 million was received from sales and maturing United States Treasury Obligations. During the year ended December 31, 2017, $1,354.6 million was paid to purchase United States Treasury Obligations and $1,484.7 million was received from sales and maturing United States Treasury Obligations. During the year ended December 31, 2016, $1,811.4 million was paid to purchase United States Treasury Obligations and $1,746.5 million was received from sales and maturing United States Treasury Obligations. $785.7 million was received from sales of affiliated investments and $801.6 million was paid to purchase affiliated investments during the year ended December 31, 2018. $807.9 million was received from sales of affiliated investments and $810.4 million was paid to purchase affiliated investments during the year ended December 31, 2017. $406.2 million was received from sales of affiliated investments and $421.2 million was paid to purchase affiliated investments during the year ended December 31, 2016.
Financing Activities
The Fund’s net cash flow provided by (used for) financing activities was $(32.8) million, $(136.8) million and $(5.1) million during the years ended December 31, 2018, 2017 and 2016, respectively. This included $930.0 million, $161.1 million and $157.7 million from Shares purchased by Authorized Participants and $958.8 million, $297.9 million and $162.8 million from Shares redeemed by Authorized Participants during the years ended December 31, 2018, 2017 and 2016, respectively. During the year ended December 31, 2018, distributions paid to Shareholder were $4.1 million. There were no distributions paid to Shareholders during the years ended December 31, 2017 and 2016.
Results of Operations
FOR THE YEARS ENDED DECEMBER 31, 2018, 2017 AND 2016
The following graphs illustrate the percentage changes in (i) the market price of the Shares (as reflected by the line “Market”), (ii) the Fund’s NAV (as reflected by the line “NAV”), and (iii) the closing levels of the Index (as reflected by the line “DBIQ Opt Yield Crude Oil Index ER”). Whenever the Treasury Income, Money Market Income andT-Bill ETF Income, if any, earned by the Fund exceeds Fund expenses, the price of the Shares generally exceeds the level of the Index primarily because the Share price reflects Treasury Income, Money Market Income andT-Bill ETF Income from the Fund’s collateral holdings whereas the Index does not consider such income. There can be no assurances that the price of the Shares or the Fund’s NAV will exceed the Index levels.
23
No representation is being made that the Index will or is likely to achieve closing levels consistent with or similar to those set forth herein. Similarly, no representation is being made that the Fund will generate profits or losses similar to the Fund’s past performance or changes in the Index closing levels.
COMPARISON OF MARKET, NAV AND DBIQ OPT YIELD CRUDE OIL INDEX ER
FOR THE YEARS ENDED DECEMBER 31, 2018, 2017 AND 2016
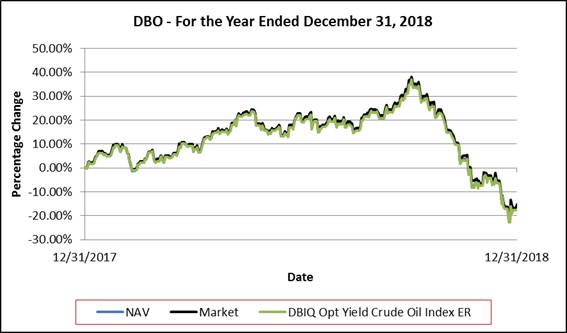
NEITHER THE PAST PERFORMANCE OF THE FUND NOR THE PRIOR INDEX LEVELS AND CHANGES,
POSITIVE OR NEGATIVE, SHOULD BE TAKEN AS AN INDICATION OF THE FUND’S FUTURE PERFORMANCE.
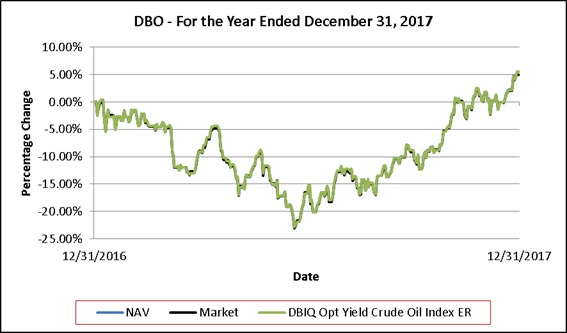
NEITHER THE PAST PERFORMANCE OF THE FUND NOR THE PRIOR INDEX LEVELS AND CHANGES,
POSITIVE OR NEGATIVE, SHOULD BE TAKEN AS AN INDICATION OF THE FUND’S FUTURE PERFORMANCE.
24
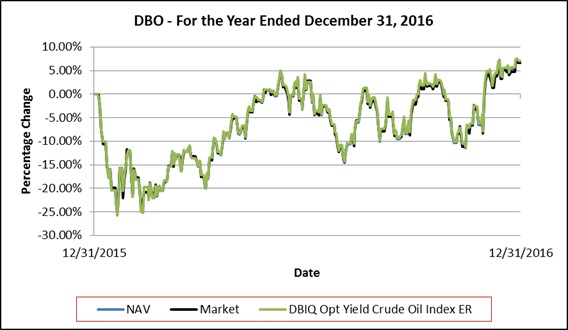
NEITHER THE PAST PERFORMANCE OF THE FUND NOR THE PRIOR INDEX LEVELS AND CHANGES,
POSITIVE OR NEGATIVE, SHOULD BE TAKEN AS AN INDICATION OF THE FUND’S FUTURE PERFORMANCE.
Performance Summary
This Report covers the years ended December 31, 2018, 2017 and 2016.
Past performance of the Fund is not necessarily indicative of future performance.
The Index is intended to reflect the change in market value of the Index Commodity. In turn, the Index is intended to reflect the oil sector. The DBIQ Optimum Yield Crude Oil Index Total Return™ (the“DBIQ-OY CL TR™”) consists of the Index plus3-month United States Treasury Obligations returns. Past results of theDBIQ-OY CL TR™ are not necessarily indicative of future changes, positive or negative, in the closing levels of theDBIQ-OY CL TR™.
The section “Summary of theDBIQ-OY CL TR™ and Underlying Index Commodity Returns for the years ended December 31, 2018, 2017 and 2016” below provides an overview of the changes in the closing levels ofDBIQ-OY CL TR™ by disclosing the change in market value of the underlying component Index Commodity through a “surrogate” (and analogous) index plus3-month United States Treasury Obligations returns. Please note also that the Fund’s objective is to track the Index (not theDBIQ-OY CL TR™), and the Fund does not attempt to outperform or underperform the Index. The Index employs the optimum yield roll method with the objective of mitigating the negative effects of contango, the condition in which distant delivery prices for futures exceed spot prices, and maximizing the positive effects of backwardation, a condition opposite of contango.
Summary of theDBIQ-OY CL TR™ and Underlying Index Commodity Returns for the
Years Ended December 31, 2018, 2017 and 2016
| Years Ended December 31, | ||||||||||||
Underlying Index | 2018 | 2017 | 2016 | |||||||||
DB Light Sweet Crude Oil (WTI) Indices | (15.76 | )% | 6.46 | % | 7.43 | % | ||||||
If the Fund’s Treasury Income, Money Market Income andT-Bill ETF Income were to exceed the Fund’s fees and expenses, the aggregate return on an investment in the Fund would be expected to outperform the Index and underperform theDBIQ-OY CL TR™. The only difference between (i) the Index (the “Excess Return Index”) and (ii) theDBIQ-OY CL TR ™ (the “Total Return Index”) is that the Excess Return Index does not include interest income from fixed income securities while the Total Return Index does include such a component. Thus, the difference between the Excess Return Index and the Total Return Index is attributable entirely to the interest income attributable to the fixed income securities reflected in the Total Return Index. The Total Return Index does not actually hold any fixed income securities. If the Fund’s Treasury Income, Money Market Income andT-Bill ETF Income, if any, exceeds the Fund’s fees and expenses, then the amount of such excess is expected to be distributed periodically. The market price of the Shares is expected to closely track the Excess Return Index. The aggregate return on an investment in the Fund over any period is the sum of the capital appreciation or depreciation of the Shares over the period, plus the amount of any distributions during the period.
25
Consequently, the Fund’s aggregate return is expected to outperform the Excess Return Index by the amount of the excess, if any, of the Fund’s Treasury Income, Money Market Income andT-Bill ETF Income over its fees and expenses. As a result of the Fund’s fees and expenses, however, the aggregate return on the Fund is expected to underperform the Total Return Index. If the Fund’s fees and expenses were to exceed the Fund’s Treasury Income, Money Market Income andT-Bill ETF Income, if any, the aggregate return on an investment in the Fund is expected to underperform the Excess Return Index.
FOR THE YEARS ENDED DECEMBER 31, 2018, 2017 AND 2016
Fund Share Price Performance
For the year ended December 31, 2018, the NYSE Arca market value of each Share decreased 15.26% from $10.16 per Share to $8.47 per Share. The Share price low and high for the year ended December 31, 2018 and related change from the Share price on December 31, 2017 was as follows: Shares traded at a low of $8.13 per Share(-19.99%) on December 24, 2018, and a high of $14.03 per Share (+38.11%) on October 3, 2018. On December 31, 2018, the Fund paid a distribution of $0.13438 for each General Share and Share to holders of record as of December 26, 2018. Therefore, the total return for the Fund, on a market value basis was-15.26%.
For the year ended December 31, 2017, the NYSE Arca market value of each Share increased 4.96% from $9.68 per Share to $10.16 per Share. The Share price low and high for the year ended December 31, 2017 and related change from the Share price on December 31, 2016 was as follows: Shares traded at a low of $7.45 per Share(-23.05%) on June 21, 2017, and a high of $10.16 per Share (+4.96%) on December 29, 2017. No distributions were paid to Shareholders during the year ended December 31, 2017. Therefore, the total return for the Fund, on a market value basis was +4.96%.
For the year ended December 31, 2016, the NYSE Arca market value of each Share increased 6.61% from $9.08 per Share to $9.68 per Share. The Share price low and high for the year ended December 31, 2016 and related change from the Share price on December 31, 2015 was as follows: Shares traded at a low of $6.82 per Share(-24.85%) on January 20, 2016, and a high of $9.71 per Share (+6.94%) on May 30, 2016. No distributions were paid to Shareholders during the year ended December 31, 2016. Therefore, the total return for the Fund, on a market value basis was +6.61%.
Fund Share Net Asset Performance
For the year ended December 31, 2018, the NAV of each Share decreased 16.52% from $10.21 per Share to $8.38 per Share. Falling commodity future contract prices for Light Sweet Crude Oil during the year ended December 31, 2018 contributed to an overall 17.40% decrease in the level of the Index and to a 15.76% decrease in the level of theDBIQ-OY CL TR™. On December 31, 2018, the Fund paid a distribution of $0.13438 for each General Share and Share to holders of record as of December 26, 2018. Therefore, the total return for the Fund on a NAV basis was-16.52%.
Net income (loss) for the year ended December 31, 2018 was $(38.3) million, primarily resulting from income of $7.2 million, net realized gain (loss) of $110.7 million, net change in unrealized gain (loss) of $(153.0) million and operating expenses of $3.2 million.
For the year ended December 31, 2017, the NAV of each Share increased 5.58% from $9.67 per Share to $10.21 per Share. Rising commodity future contract prices for Light Sweet Crude Oil during the year ended December 31, 2017 contributed to an overall 5.46% increase in the level of the Index and to a 6.46% increase in the level of theDBIQ-OY CL TR™. No distributions were paid to Shareholders during the year ended December 31, 2017. Therefore, the total return for the Fund on a NAV basis was +5.58%
Net income (loss) for the year ended December 31, 2017 was $16.9 million, primarily resulting from income of $3.2 million, net realized gain (loss) of $76.7 million, net change in unrealized gain (loss) of $(59.9) million and operating expenses of $3.1 million.
For the year ended December 31, 2016, the NAV of each Share increased 6.62% from $9.07 per Share to $9.67 per Share. Rising commodity future contract prices for Light Sweet Crude Oil during the year ended December 31, 2016 contributed to an overall 7.43% increase in the level of theDBIQ-OY CL TR™. No distributions were paid to Shareholders during the year ended December 31, 2015. Therefore, the total return for the Fund on a NAV basis was +6.62%
Net income (loss) for the year ended December 31, 2016 was $47.8 million, primarily resulting from income of $1.2 million, net realized gain (loss) of $(240.7) million, net change in unrealized gain (loss) of $290.7 million and operating expenses of $3.4 million.
26
Critical Accounting Policies
The Fund’s critical accounting policies are as follows:
Preparation of the financial statements and related disclosures in conformity with U.S. GAAP requires the application of appropriate accounting rules and guidance, as well as the use of estimates, and requires management to make estimates and assumptions that affect the reported amounts of assets and liabilities, revenue and expense and related disclosure of contingent assets and liabilities during the reporting period of the financial statements and accompanying notes. The Fund’s application of these policies involves judgments and actual results may differ from the estimates used. There were no significant estimates used in the preparation of these financial statements.
Commodity futures contracts, United States Treasury Obligations,T-Bill ETFs and money market mutual funds are recorded on a trade date basis and at fair value in the financial statements, with changes in fair value, if any, reported in the Statements of Income and Expenses.
The use of fair value to measure financial instruments, with related unrealized gains or losses recognized in earnings in each period is fundamental to the Fund’s financial statements. The fair value of a financial instrument is the amount that would be received to sell an asset or paid to transfer a liability in an orderly transaction between market participants at the measurement date (the exit price).
United States Treasury Obligations are fair valued using an evaluated quote provided by an independent pricing service. Futures contracts are valued at the final settlement price set by an exchange on which they are principally traded. Investments inopen-end andclosed-end registered investment companies that do not trade on an exchange are valued at the end of day NAV per share. Investments inopen-end andclosed-end registered investment companies that trade on an exchange are valued at the last sales price or official closing price as of the close of the customary trading session on the exchange where the security is principally traded. Financial Accounting Standards Board (“FASB”) Accounting Standards Codification for fair value measurement and disclosure guidance requires a fair value hierarchy that prioritizes the inputs to valuation techniques used to measure fair value. The objective of a fair value measurement is to determine the price that would be received to sell an asset or paid to transfer a liability in an orderly transaction between market participants at the measurement date (an exit price). The hierarchy gives the highest priority to unadjusted quoted prices for identical assets or liabilities (Level 1 measurements) and the lowest priority to unobservable inputs (Level 3 measurements). Assets and liabilities are classified in their entirety based on the lowest level of input that is significant to the fair value measurement. See Note 6 within the financial statements in Item 8 for further information.
Securities for which market quotations are not readily available or became unreliable are valued at fair value as determined in good faith following procedures approved by the Managing Owner. Issuer-specific events, market trends, bid/asked quotes of brokers and information providers and other data may be reviewed in the course of making a good faith determination of a security’s fair value.
Realized gains (losses) from the sale or disposition of securities or derivatives are determined on a specific identification basis and recognized in the Statements of Income and Expenses in the period in which the contract is closed or the sale or disposition occurs, respectively.
Interest income on United States Treasury Obligations is recognized on an accrual basis when earned. Premiums and discounts are amortized or accreted over the life of the United States Treasury Obligations. Dividend income (net of withholding tax, if any) is recorded on theex-dividend date.
Off-Balance Sheet Arrangements and Contractual Obligations
In the normal course of its business, the Fund is a party to financial instruments withoff-balance sheet risk. The term“off-balance sheet risk” refers to an unrecorded potential liability that, even though it does not appear on the balance sheet, may result in a future obligation or loss. The financial instruments used by the Fund are commodity futures, the values of which are based upon an underlying asset and generally represent future commitments which have a reasonable possibility to be settled in cash or through physical delivery. The financial instruments are traded on an exchange and are standardized contracts.
The Fund has not utilized, nor does it expect to utilize in the future, special purpose entities to facilitateoff-balance sheet financing arrangements and has no loan guarantee arrangements oroff-balance sheet arrangements of any kind, other than agreements entered into in the normal course of business noted above, which may include indemnification provisions related to certain risks service providers undertake in providing services to the Fund. While the Fund’s exposure under such indemnification provisions cannot be estimated, these general business indemnifications are not expected to have a material impact on the Fund’s financial position. The Managing Owner expects the risk of loss relating to indemnification to be remote.
27
The Fund has financial obligations to the Managing Owner and the Commodity Broker under the Trust Agreement and its agreement with the Commodity Broker (the “Commodity Broker Agreement”), respectively. Management Fee payments made to the Managing Owner, pursuant to the Trust Agreement, are calculated as a fixed percentage of the Fund’s NAV. Commission payments to the Commodity Broker, pursuant to the Commodity Broker Agreement, are on acontract-by-contract, or round-turn, basis. As such, the Managing Owner cannot anticipate the amount of payments that will be required under these arrangements for future periods as NAVs and trading activity will not be known until a future date. The Fund’s agreement with the Commodity Broker may be terminated by either party for various reasons. All Management Fees and commission payments are paid to the Managing Owner and the Commodity Broker, respectively.
| ITEM 7A. | QUANTITATIVE AND QUALITATIVE DISCLOSURES ABOUT MARKET RISK |
INTRODUCTION
The Fund is designed to replicate positions in a commodity index. The market sensitive instruments held by it are subject to the risk of trading loss. Unlike an operating company, the risk of market sensitive instruments is integral, not incidental, to the Fund’s main line of business.
Market movements can produce frequent changes in the fair market value of the Fund’s open positions and, consequently, in its earnings and cash flow. The Fund’s market risk is primarily influenced by changes in the prices of commodities.
Standard of Materiality
Materiality as used in this section, “Quantitative and Qualitative Disclosures About Market Risk,” is based on an assessment of reasonably possible market movements and the potential losses caused by such movements, taking into account the effects of margin, and any other multiplier features, as applicable, of the Fund’s market sensitive instruments.
QUANTIFYING THE FUND’S TRADING VALUE AT RISK
Quantitative Forward-Looking Statements
The following quantitative disclosures regarding the Fund’s market risk exposures contain “forward-looking statements” within the meaning of the safe harbor from civil liability provided for such statements by the Private Securities Litigation Reform Act of 1995 (set forth in Section 27A of the Securities Act of 1933 (the “Securities Act”) and Section 21E of the Exchange Act). All quantitative disclosures in this section are deemed to be forward-looking statements for purposes of the safe harbor, except for statements of historical fact (such as the dollar amount of maintenance margin required for market risk sensitive instruments held at the end of the reporting period).
Value at Risk (“VaR”) is a statistical measure of the value of losses that would not be expected to be exceeded over a given time horizon and at a given probability level arising from movement of underlying risk factors. Loss is measured as a decline in the fair value of the portfolio as a result of changes in any of the material variables by which fair values are determined. VaR is measured over a specified holding period (one day) and to a specified level of statistical confidence (99th percentile). However, the inherent uncertainty in the markets in which the Fund trades and the recurrence in the markets traded by the Fund of market movements far exceeding expectations could result in actual trading ornon-trading losses far beyond the indicated VaR or the Fund’s experience to date (i.e., “risk of ruin”). In light of these considerations, as well as the risks and uncertainties intrinsic to all future projections, the following VaR presentation does not constitute any assurance or representation that the Fund’s losses in any market sector will be limited to VaR.
THE FUND’S TRADING VALUE AT RISK
The Fund calculates VaR using the actual historical market movements of the Fund’s net assets.
28
The following table indicates the trading VaR associated with the Fund’s net assets as of December 31, 2018.
| For the Year Ended | ||||||||||||||||
| December 31, 2018 | ||||||||||||||||
Description | Net Assets | Daily Volatility | VaR* (99 Percentile) | Number of times VaR Exceeded | ||||||||||||
Invesco DB Oil Fund | $ | 261,573,403 | 1.55 | % | $ | 9,463,980 | 32 | |||||||||
The following table indicates the trading VaR associated with the Fund’s net assets as of December 31, 2017.
| For the Year Ended | ||||||||||||||||
| December 31, 2017 | ||||||||||||||||
Description | Net Assets | Daily Volatility | VaR* (99 Percentile) | Number of times VaR Exceeded | ||||||||||||
Invesco DB Oil Fund | $ | 332,833,341 | 1.15 | % | $ | 8,940,876 | 14 | |||||||||
| * | The VaR represents the one day downside risk, under normal market conditions, with a 99% confidence level. It is calculated using historical market moves of the Fund’s net assets and uses a one year look back. |
THE FUND’SNON-TRADING MARKET RISK
The Fund hasnon-trading market risk as a result of investing in short-term United States Treasury Obligations,T-Bill ETFs and money market mutual funds. The market risk represented by these investments is not expected to be material. Although the Fund purchases and sells shares ofT-Bill ETFs on an exchange, it does not establish or liquidate those positions for trading purposes.
QUALITATIVE DISCLOSURES REGARDING PRIMARY TRADING MARKET RISK EXPOSURES
The following qualitative disclosures regarding the Fund’s market risk exposures—except for those disclosures that are statements of historical fact—constitute forward-looking statements within the meaning of Section 27A of the Securities Act and Section 21E of the Exchange Act. The Fund’s primary market risk exposures are subject to numerous uncertainties, contingencies and risks. Government interventions, defaults and expropriations, illiquid markets, the emergence of dominant fundamental factors, political upheavals, changes in historical price relationships, an influx of new market participants, increased regulation and many other factors could result in material losses as well as in material changes to the risk exposures of the Fund. The Fund’s current market exposure may change materially. Investors may lose all or substantially all of their investment in the Fund.
The following were the primary trading risk exposures of the Fund as of December 31, 2018 by market sector:
Light Sweet Crude Oil
The price of Light Sweet Crude Oil is volatile and is affected by numerous factors. The level of global industrial activity influences the demand for Light Sweet Crude Oil. In addition, various other factors can affect the demand for Light Sweet Crude Oil, such as weather, political events and labor activity. The supply of Light Sweet Crude Oil can be affected by many events, in particular, the meetings of the Organization of Petroleum Exporting Countries. Market expectations about events that will influence either demand or supply can cause prices for Light Sweet Crude Oil to fluctuate greatly. A significant amount of the world oil production capacity is controlled by a relatively small number of producers. Any large change in production by one of these producers could have a substantial effect on the price of Light Sweet Crude Oil.
QUALITATIVE DISCLOSURES REGARDINGNON-TRADING MARKET RISK EXPOSURE
As noted above, the Fund hasnon-trading market risk as a result of investing in short-term United States Treasury Obligations,T-Bill ETFs and money market mutual funds. The market risk represented by these investments is not expected to be material.
QUALITATIVE DISCLOSURES REGARDING MEANS OF MANAGING RISK EXPOSURE
Under ordinary circumstances, the Managing Owner’s exercise of discretionary power is limited to determining whether the Fund will make a distribution. Under emergency or extraordinary circumstances, the Managing Owner’s use of its discretionary powers may increase. These special circumstances, for example, include the unavailability of the Index or certain natural or manmade disasters. The Managing Owner does not actively manage the Fund to avoid losses. The Fund only takes long positions in investments and does not employ “stop-loss” techniques.
29
| ITEM 8. | FINANCIAL STATEMENTS AND SUPPLEMENTARY DATA |
Index to Financial Statements
30
Report of Management on Internal Control
Over Financial Reporting
Management of Invesco Capital Management LLC, as managing owner (the “Managing Owner”) of Invesco DB Oil Fund (the “Fund”), is responsible for establishing and maintaining adequate internal control over financial reporting, as defined in Rules13a-15(f) and15d-15(f) of the Securities Exchange Act of 1934, as amended (the “Exchange Act”). Internal control over financial reporting is a process designed to provide reasonable assurance regarding the reliability of financial reporting and the preparation of financial statements for external purposes in accordance with generally accepted accounting principles
Because of its inherent limitations, internal control over financial reporting may not prevent or detect misstatements. Also, projections of any evaluation of effectiveness to future periods are subject to the risk that controls may become inadequate because of changes in conditions, or that the degree of compliance with the policies or procedures may deteriorate.
We, Daniel Draper, Principal Executive Officer, and Kelli Gallegos, Principal Financial and Accounting Officer, Investment Pools, of the Managing Owner, assessed the effectiveness of the Fund’s internal control over financial reporting as of December 31, 2018. In making this assessment, we used the criteria set forth by the Committee of Sponsoring Organizations of the Treadway Commission (“COSO”) inInternal Control—Integrated Framework (2013). Based on our assessment and those criteria, we have concluded that the Fund maintained effective internal control over financial reporting as of December 31, 2018.
The Fund’s independent registered public accounting firm, PricewaterhouseCoopers LLP, has audited the Fund’s internal control over financial reporting as of December 31, 2018, as stated in their report on page 32 of the Fund’s Annual Report on Form10-K.
| By: | /s/ DANIEL DRAPER | |
| Name: | Daniel Draper | |
| Title: | Principal Executive Officer of the Managing Owner | |
| By: | /s/ KELLI GALLEGOS | |
| Name: | Kelli Gallegos | |
| Title: | Principal Financial and Accounting Officer, Investment Pools, of the Managing Owner | |
February 27, 2019
31
Report of Independent Registered Public Accounting Firm
To the Board of Managers of Invesco DB Multi-Sector Commodity Trust and Shareholders of Invesco DB Oil Fund
Opinions on the Financial Statements and Internal Control over Financial Reporting
We have audited the accompanying statements of financial condition, including the schedules of investments of Invesco DB Oil Fund (one of the funds constituting Invesco DB Multi-Sector Commodity Trust, hereafter referred to as the “Fund”) as of December 31, 2018 and December 31, 2017,and the related statements of income and expenses, of changes in shareholders’ equity and of cash flows for each of the three years in the period ended December 31, 2018, including the related notes (collectively referred to as the “financial statements”).We also have audited the Fund’s internal control over financial reporting as of December 31, 2018, based on criteria established inInternal Control—Integrated Framework (2013) issued by the Committee of Sponsoring Organizations of the Treadway Commission (COSO).
In our opinion, thefinancial statements referred to above present fairly, in all material respects, the financial position of the Fund as of December 31, 2018 and December 31, 2017, and the results of its operations and its cash flows for each of the three years in the period ended December 31, 2018in conformity with accounting principles generally accepted in the United States of America. Also in our opinion, the Fund maintained, in all material respects, effective internal control over financial reporting as of December 31, 2018, based on criteria established inInternal Control—Integrated Framework (2013) issued by the COSO.
Basis for Opinions
The Fund’s management is responsible for these financial statements, for maintaining effective internal control over financial reporting, and for its assessment of the effectiveness of internal control over financial reporting, included in the accompanying Report of Management on Internal Control Over Financial Reporting. Our responsibility is to express opinions on the Fund’sfinancial statements and on the Fund’s internal control over financial reporting based on our audits. We are a public accounting firm registered with the Public Company Accounting Oversight Board (United States) (“PCAOB”) and are required to be independent with respect to the Fund in accordance with the U.S. federal securities laws and the applicable rules and regulations of the Securities and Exchange Commission and the PCAOB.
We conducted our audits in accordance with the standards of the PCAOB. Those standards require that we plan and perform the audits to obtain reasonable assurance about whether thefinancial statements are free of material misstatement, whether due to error or fraud, and whether effective internal control over financial reporting was maintained in all material respects.
Our audits of thefinancial statements included performing procedures to assess the risks of material misstatement of thefinancial statements, whether due to error or fraud, and performing procedures that respond to those risks. Such procedures included examining, on a test basis, evidence regarding the amounts and disclosures in thefinancial statements. Our audits also included evaluating the accounting principles used and significant estimates made by management, as well as evaluating the overall presentation of thefinancial statements. Our audit of internal control over financial reporting included obtaining an understanding of internal control over financial reporting, assessing the risk that a material weakness exists, and testing and evaluating the design and operating effectiveness of internal control based on the assessed risk. Our audits also included performing such other procedures as we considered necessary in the circumstances. We believe that our audits provide a reasonable basis for our opinions.
Definition and Limitations of Internal Control over Financial Reporting
A fund’s internal control over financial reporting is a process designed to provide reasonable assurance regarding the reliability of financial reporting and the preparation of financial statements for external purposes in accordance with generally accepted accounting principles. A fund’s internal control over financial reporting includes those policies and procedures that (i) pertain to the maintenance of records that, in reasonable detail, accurately and fairly reflect the transactions and dispositions of the assets of the fund; (ii) provide reasonable assurance that transactions are recorded as necessary to permit preparation of financial statements in accordance with generally accepted accounting principles, and that receipts and expenditures of the fund are being made only in accordance with authorizations of management and directors of the fund; and (iii) provide reasonable assurance regarding prevention or timely detection of unauthorized acquisition, use, or disposition of the fund’s assets that could have a material effect on the financial statements.
32
Because of its inherent limitations, internal control over financial reporting may not prevent or detect misstatements. Also, projections of any evaluation of effectiveness to future periods are subject to the risk that controls may become inadequate because of changes in conditions, or that the degree of compliance with the policies or procedures may deteriorate.
/s/ PricewaterhouseCoopers LLP
Chicago, Illinois
February 27, 2019
We have served as the Fund’s auditor since 2013.
33
Invesco DB Oil Fund
Statements of Financial Condition
December 31, 2018 and 2017
| December 31, | ||||||||
| 2018 | 2017 | |||||||
Assets | ||||||||
United States Treasury Obligations, at value (cost $227,903,022 and $311,509,304, respectively) | $ | 227,905,176 | $ | 311,472,491 | ||||
Affiliated Investments, at value (cost $33,299,423 and $17,417,436, respectively) | 33,302,539 | 17,412,477 | ||||||
Other investments: | ||||||||
Variation margin receivable- Commodity Futures Contracts | 686,400 | 3,138,420 | ||||||
Cash held by custodian | — | 1,008,149 | ||||||
Receivable for: | ||||||||
Dividends from affiliates | 46,054 | 15,327 | ||||||
|
|
|
| |||||
Total assets | $ | 261,940,169 | $ | 333,046,864 | ||||
|
|
|
| |||||
Liabilities | ||||||||
Payable for: | ||||||||
Due to custodian | 188,160 | — | ||||||
Management fees | 173,979 | 209,080 | ||||||
Brokerage commissions and fees | 4,627 | 4,443 | ||||||
|
|
|
| |||||
Total liabilities | 366,766 | 213,523 | ||||||
|
|
|
| |||||
Commitments and Contingencies (Note 10) | ||||||||
Equity | ||||||||
Shareholder’s equity—General Shares | 335 | 408 | ||||||
Shareholders’ equity—Shares | 261,573,068 | 332,832,933 | ||||||
|
|
|
| |||||
Total shareholders’ equity | 261,573,403 | 332,833,341 | ||||||
|
|
|
| |||||
Total liabilities and equity | $ | 261,940,169 | $ | 333,046,864 | ||||
|
|
|
| |||||
General Shares outstanding | 40 | 40 | ||||||
Shares outstanding | 31,200,000 | 32,600,000 | ||||||
Net asset value per share | $ | 8.38 | $ | 10.21 | ||||
Market value per share | $ | 8.47 | $ | 10.16 | ||||
See accompanying Notes to Financial Statements which are an integral part of the financial statements.
34
Invesco DB Oil Fund
December 31, 2018
Description | Percentage of Shareholders’ Equity | Value | Principal Value | |||||||||
United States Treasury Obligations(a) | ||||||||||||
U.S. Treasury Bills, 2.175% due January 3, 2019 | 19.88 | % | $ | 51,996,757 | $ | 52,000,000 | ||||||
U.S. Treasury Bills, 2.370% due February 28, 2019 | 12.95 | 33,872,079 | 34,000,000 | |||||||||
U.S. Treasury Bills, 2.465% due April 4, 2019(b) | 37.99 | 99,381,236 | 100,000,000 | |||||||||
U.S. Treasury Bills, 2.430% due May 2, 2019(b) | 16.31 | 42,655,104 | 43,000,000 | |||||||||
|
|
|
| |||||||||
Total United States Treasury Obligations (cost $227,903,022) | 87.13 | % | $ | 227,905,176 | ||||||||
|
|
|
| |||||||||
| Shares | ||||||||||||
Affiliated Investments | ||||||||||||
Exchange-Traded Fund | ||||||||||||
Invesco Treasury Collateral ETF (cost $5,005,284)(c) | 1.91 | 5,008,400 | 47,500 | |||||||||
Money Market Mutual Fund | ||||||||||||
Invesco Premier U.S. Government Money Portfolio - Institutional Class, 2.30% (cost $28,294,139)(d) | 10.82 | 28,294,139 | 28,294,139 | |||||||||
|
|
|
| |||||||||
Total Affiliated Investments (cost $33,299,423) | 12.73 | % | $ | 33,302,539 | ||||||||
|
|
|
| |||||||||
Total Investments in Securities (cost $261,202,445) | 99.86 | % | $ | 261,207,715 | ||||||||
|
|
|
| |||||||||
| (a) | Security may be traded on a discount basis. The interest rate shown represents the discount rate at the most recent auction date of the security prior to period end. |
| (b) | United States Treasury Obligations of $44,349,600 are on deposit with the Commodity Broker and held as maintenance margin for open futures contracts. |
| (c) | Affiliated company. The security and the Fund are affiliated by having the same investment adviser. See Note 8. |
| (d) | The security and the Fund are advised by wholly-owned subsidiaries of Invesco Ltd. and are therefore considered to be affiliated. The rate shown is the7-day SEC standardized yield as of December 31, 2018. |
Open Commodity Futures Contracts | Number of Contracts | Expiration Date | Notional Value | Value(e) | Unrealized Appreciation (Depreciation)(e) | |||||||||||||||
Long Futures Contracts | ||||||||||||||||||||
NYMEX WTI Crude | 5,720 | February - 2019 | $ | 261,518,400 | $ | (107,405,985 | ) | $ | (107,405,985 | ) | ||||||||||
| (e) | Unrealized Appreciation (Depreciation) and Value are presented above, net by contract. |
See accompanying Notes to Financial Statements which are an integral part of the financial statements.
35
Invesco DB Oil Fund
December 31, 2017
Description | Percentage of Shareholders’ Equity | Value | Principal Value | |||||||||
United States Treasury Obligations(a) | ||||||||||||
U.S. Treasury Bills, 1.180% due January 4, 2018 | 15.92 | % | $ | 52,996,676 | $ | 53,000,000 | ||||||
U.S. Treasury Bills, 1.245% due January 18, 2018 | 2.70 | 8,995,065 | 9,000,000 | |||||||||
U.S. Treasury Bills, 1.285% due February 22, 2018 | 24.89 | 82,851,845 | 83,000,000 | |||||||||
U.S. Treasury Bills, 1.285% due March 1, 2018(b) | 47.98 | 159,673,267 | 160,000,000 | |||||||||
U.S. Treasury Bills, 1.450% due June 7, 2018 | 2.09 | 6,955,638 | 7,000,000 | |||||||||
|
|
|
| |||||||||
Total United States Treasury Obligations (cost $311,509,304) | 93.58 | % | 311,472,491 | |||||||||
|
|
|
| |||||||||
| Shares | ||||||||||||
Affiliated Investments | ||||||||||||
Exchange-Traded Fund | ||||||||||||
PowerShares Treasury Collateral Portfolio (cost $5,005,284)(c) | 1.50 | 5,000,325 | 47,500 | |||||||||
Money Market Mutual Fund | ||||||||||||
Invesco Premier U.S. Government Money Portfolio- Institutional Class, 1.15% (cost $12,412,152)(d) | 3.73 | 12,412,152 | 12,412,152 | |||||||||
|
|
|
| |||||||||
Total Affiliated Investments (cost $17,417,436) | 5.23 | 17,412,477 | ||||||||||
|
|
|
| |||||||||
Total Investments in Securities (cost $328,926,740) | 98.81 | % | $ | 328,884,968 | ||||||||
|
|
|
| |||||||||
| (a) | Security may be traded on a discount basis. The interest rate shown represents the discount rate at the most recent auction date of the security prior to period end. |
| (b) | United States Treasury Obligations of $39,916,000 are on deposit with the Commodity Broker and held as maintenance margin for open futures contracts. |
| (c) | Affiliated company. The security and the Fund are affiliated by having the same investment adviser. See Note 8. |
| (d) | The security and the Fund are advised by wholly-owned subsidiaries of Invesco Ltd. and are therefore considered to be affiliated. The rate shown is the7-day SEC standardized yield as of December 31, 2017. |
Open Commodity Futures Contracts | Number of Contracts | Expiration Date | Notional Value | Value(e) | Unrealized Appreciation (Depreciation)(e) | |||||||||||||||
Long Futures Contracts | ||||||||||||||||||||
NYMEX WTI Crude | 5,506 | February - 2018 | $ | 332,782,640 | $ | 45,635,994 | $ | 45,635,994 | ||||||||||||
| (e) | Unrealized Appreciation (Depreciation) and Value are presented above, net by contract. |
See accompanying Notes to Financial Statements which are an integral part of the financial statements.
36
Invesco DB Oil Fund
Statements of Income and Expenses
For the Years Ended December 31, 2018 2017 and 2016
| 2018 | 2017 | 2016 | ||||||||||
Income | ||||||||||||
Interest Income | $ | 6,786,083 | $ | 3,009,035 | $ | 1,209,378 | ||||||
Dividends from Affiliates | 452,577 | 196,746 | 26,354 | |||||||||
|
|
|
|
|
| |||||||
Total Income | 7,238,660 | 3,205,781 | 1,235,732 | |||||||||
Expenses | ||||||||||||
Management Fee | 2,940,887 | 2,939,104 | 3,295,092 | |||||||||
Brokerage Commissions and Fees | 269,338 | 83,769 | 98,360 | |||||||||
Interest Expense | 51,897 | 104,874 | 28,626 | |||||||||
|
|
|
|
|
| |||||||
Total Expenses | 3,262,122 | 3,127,747 | 3,422,078 | |||||||||
|
|
|
|
|
| |||||||
Less: Waivers | (43,384 | ) | (46,116 | ) | (14,569 | ) | ||||||
|
|
|
|
|
| |||||||
Net Expenses | 3,218,738 | 3,081,631 | 3,407,509 | |||||||||
|
|
|
|
|
| |||||||
Net Investment Income (Loss) | 4,019,922 | 124,150 | (2,171,777 | ) | ||||||||
|
|
|
|
|
| |||||||
Net Realized and Net Change in Unrealized Gain (Loss) on United States Treasury Obligations, Affiliated Investments and Commodity Futures Contracts | ||||||||||||
Net Realized Gain (Loss) on | ||||||||||||
United States Treasury Obligations | (57,208 | ) | 335 | 1,974 | ||||||||
Commodity Futures Contracts | 110,729,624 | 76,668,337 | (240,714,315 | ) | ||||||||
|
|
|
|
|
| |||||||
Net Realized Gain (Loss) | 110,672,416 | 76,668,672 | (240,712,341 | ) | ||||||||
|
|
|
|
|
| |||||||
Net Change in Unrealized Gain (Loss) on | ||||||||||||
United States Treasury Obligations | 38,967 | (29,256 | ) | (5,039 | ) | |||||||
Affiliated Investments | 8,075 | (4,959 | ) | — | ||||||||
Commodity Futures Contracts | (153,041,979 | ) | (59,889,101 | ) | 290,682,335 | |||||||
|
|
|
|
|
| |||||||
Net Change in Unrealized Gain (Loss) | (152,994,937 | ) | (59,923,316 | ) | 290,677,296 | |||||||
|
|
|
|
|
| |||||||
Net Realized and Net Change in Unrealized Gain (Loss) on United States Treasury Obligations, Affiliated Investments and Commodity Futures Contracts | (42,322,521 | ) | 16,745,356 | 49,964,955 | ||||||||
|
|
|
|
|
| |||||||
Net Income (Loss) | $ | (38,302,599 | ) | $ | 16,869,506 | $ | 47,793,178 | |||||
|
|
|
|
|
| |||||||
See accompanying Notes to Financial Statements which are an integral part of the financial statements.
37
Invesco DB Oil Fund
Statement of Changes in Shareholders’ Equity
For the Year Ended December 31, 2018
| General Shares | Shares | Total | ||||||||||||||||||
| Shares | Total Equity | Shares | Total Equity | Shareholders’ Equity | ||||||||||||||||
Balance at December 31, 2017 | 40 | $ | 408 | 32,600,000 | $ | 332,832,933 | $ | 332,833,341 | ||||||||||||
|
|
|
|
|
|
|
|
|
| |||||||||||
Purchases of Shares | 81,000,000 | 929,964,445 | 929,964,445 | |||||||||||||||||
Redemption of Shares | (82,400,000 | ) | (958,809,751 | ) | (958,809,751 | ) | ||||||||||||||
|
|
|
|
|
| |||||||||||||||
Net Increase (Decrease) due to Share Transactions | (1,400,000 | ) | (28,845,306 | ) | (28,845,306 | ) | ||||||||||||||
Return of Capital Distributions | (8 | ) | (4,112,025 | ) | (4,112,033 | ) | ||||||||||||||
Net Income (Loss) | ||||||||||||||||||||
Net Investment Income (Loss) | 8 | 4,019,914 | 4,019,922 | |||||||||||||||||
Net Realized Gain (Loss) on United States Treasury Obligations, Affiliated Investments and Commodity Futures Contracts | 211 | 110,672,205 | 110,672,416 | |||||||||||||||||
Net Change in Unrealized Gain (Loss) on United States Treasury Obligations, Affiliated Investments and Commodity Futures Contracts | (284 | ) | (152,994,653 | ) | (152,994,937 | ) | ||||||||||||||
|
|
|
|
|
| |||||||||||||||
Net Income (Loss) | (65 | ) | (38,302,534 | ) | (38,302,599 | ) | ||||||||||||||
|
|
|
|
|
|
|
|
|
| |||||||||||
Net Change in Shareholders’ Equity | — | (73 | ) | (1,400,000 | ) | (71,259,865 | ) | (71,259,938 | ) | |||||||||||
|
|
|
|
|
|
|
|
|
| |||||||||||
Balance at December 31, 2018 | 40 | $ | 335 | 31,200,000 | $ | 261,573,068 | $ | 261,573,403 | ||||||||||||
|
|
|
|
|
|
|
|
|
| |||||||||||
See accompanying Notes to Financial Statements which are an integral part of the financial statements.
38
Invesco DB Oil Fund
Statement of Changes in Shareholders’ Equity
For the Year Ended December 31, 2017
| General Shares | Shares | Total | ||||||||||||||||||
| Shares | Total Equity | Shares | Total Equity | Shareholders’ Equity | ||||||||||||||||
Balance at December 31, 2016 | 40 | $ | 387 | 46,800,000 | $ | 452,757,267 | $ | 452,757,654 | ||||||||||||
|
|
|
|
|
|
|
|
|
| |||||||||||
Purchases of Shares | 19,000,000 | 161,111,372 | 161,111,372 | |||||||||||||||||
Redemption of Shares | (33,200,000 | ) | (297,905,191 | ) | (297,905,191 | ) | ||||||||||||||
|
|
|
|
|
| |||||||||||||||
Net Increase (Decrease) due to Share Transactions | (14,200,000 | ) | (136,793,819 | ) | (136,793,819 | ) | ||||||||||||||
Net Income (Loss) | ||||||||||||||||||||
Net Investment Income (Loss) | 1 | 124,149 | 124,150 | |||||||||||||||||
Net Realized Gain (Loss) on United States Treasury Obligations and Commodity Futures Contracts | 95 | 76,668,577 | 76,668,672 | |||||||||||||||||
Net Change in Unrealized Gain (Loss) on United States Treasury Obligations, Affiliated Investments and Commodity Futures Contracts | (75 | ) | (59,923,241 | ) | (59,923,316 | ) | ||||||||||||||
|
|
|
|
|
| |||||||||||||||
Net Income (Loss) | 21 | 16,869,485 | 16,869,506 | |||||||||||||||||
|
|
|
|
|
|
|
|
|
| |||||||||||
Net Change in Shareholders’ Equity | — | 21 | (14,200,000 | ) | (119,924,334 | ) | (119,924,313 | ) | ||||||||||||
|
|
|
|
|
|
|
|
|
| |||||||||||
Balance at December 31, 2017 | 40 | $ | 408 | 32,600,000 | $ | 332,832,933 | $ | 332,833,341 | ||||||||||||
|
|
|
|
|
|
|
|
|
| |||||||||||
See accompanying Notes to Financial Statements which are an integral part of the financial statements.
39
Invesco DB Oil Fund
Statement of Changes in Shareholders’ Equity
For the Year Ended December 31, 2016
| General Shares | Shares | Total | ||||||||||||||||||
| Shares | Total Equity | Shares | Total Equity | Shareholders’ Equity | ||||||||||||||||
Balance at January 1, 2016 | 40 | $ | 363 | 45,200,000 | $ | 410,070,234 | $ | 410,070,597 | ||||||||||||
|
|
|
|
|
|
|
|
|
| |||||||||||
Purchases of Shares | 20,600,000 | 157,691,418 | 157,691,418 | |||||||||||||||||
Redemption of Shares | (19,000,000 | ) | (162,797,539 | ) | (162,797,539 | ) | ||||||||||||||
|
|
|
|
|
| |||||||||||||||
Net Increase (Decrease) due to Share Transactions | 1,600,000 | (5,106,121 | ) | (5,106,121 | ) | |||||||||||||||
Net Income (Loss) | ||||||||||||||||||||
Net Investment Income (Loss) | (1 | ) | (2,171,776 | ) | (2,171,777 | ) | ||||||||||||||
Net Realized Gain (Loss) on United States Treasury Obligations and Commodity Futures Contracts | (121 | ) | (240,712,220 | ) | (240,712,341 | ) | ||||||||||||||
Net Change in Unrealized Gain (Loss) on United States Treasury Obligations and Commodity Futures Contracts | 146 | 290,677,150 | 290,677,296 | |||||||||||||||||
|
|
|
|
|
| |||||||||||||||
Net Income (Loss) | 24 | 47,793,154 | 47,793,178 | |||||||||||||||||
|
|
|
|
|
|
|
|
|
| |||||||||||
Net Change in Shareholders’ Equity | — | 24 | 1,600,000 | 42,687,033 | 42,687,057 | |||||||||||||||
|
|
|
|
|
|
|
|
|
| |||||||||||
Balance at December 31, 2016 | 40 | $ | 387 | 46,800,000 | $ | 452,757,267 | $ | 452,757,654 | ||||||||||||
|
|
|
|
|
|
|
|
|
| |||||||||||
See accompanying Notes to Financial Statements which are an integral part of the financial statements.
40
Invesco DB Oil Fund
For the Years Ended December 31, 2018, 2017 and 2016
| 2018 | 2017 | 2016 | ||||||||||
Cash flows from operating activities: | ||||||||||||
Net Income (Loss) | $ | (38,302,599 | ) | $ | 16,869,506 | $ | 47,793,178 | |||||
Adjustments to reconcile net income (loss) to net cash provided by (used for) operating activities: | ||||||||||||
Cost of securities purchased | (1,532,473,051 | ) | (1,354,621,461 | ) | (1,811,383,546 | ) | ||||||
Proceeds from securities sold and matured | 1,622,769,509 | 1,484,730,963 | 1,746,467,134 | |||||||||
Cost of affiliated investments purchased | (801,594,188 | ) | (810,359,831 | ) | (421,190,289 | ) | ||||||
Proceeds from affiliated investments sold | 785,712,202 | 807,885,234 | 406,247,450 | |||||||||
Net accretion of discount on United States Treasury Obligations | (6,747,385 | ) | (3,009,035 | ) | (1,209,378 | ) | ||||||
Net realized (gain) loss on United States Treasury Obligations and Affiliated Investments | 57,208 | (335 | ) | (1,974 | ) | |||||||
Net change in unrealized (gain) loss on United States Treasury Obligations and Affiliated Investments | (47,042 | ) | 34,215 | 5,039 | ||||||||
Change in operating assets and liabilities: | ||||||||||||
Variation margin- Commodity Futures Contracts | 2,452,020 | (3,635,400 | ) | 6,191,300 | ||||||||
Dividends from affiliates | (30,727 | ) | (11,620 | ) | (3,707 | ) | ||||||
Management fees | (35,101 | ) | (79,317 | ) | 9,823 | |||||||
Brokerage commissions and fees | 184 | (451 | ) | 1,425 | ||||||||
|
|
|
|
|
| |||||||
Net cash provided by (used for) operating activities | 31,761,030 | 137,802,468 | (27,073,545 | ) | ||||||||
|
|
|
|
|
| |||||||
Cash flows from financing activities: | ||||||||||||
Distributions paid to shareholders | (4,112,033 | ) | — | — | ||||||||
Proceeds from purchases of Shares | 929,964,445 | 161,111,372 | 157,691,418 | |||||||||
Redemption of Shares | (958,809,751 | ) | (297,905,191 | ) | (162,797,539 | ) | ||||||
Increase (decrease) in payable for amount due to custodian, net | 188,160 | (500 | ) | 500 | ||||||||
|
|
|
|
|
| |||||||
Net cash provided by (used for) financing activities | (32,769,179 | ) | (136,794,319 | ) | (5,105,621 | ) | ||||||
|
|
|
|
|
| |||||||
Net change in cash | (1,008,149 | ) | 1,008,149 | (32,179,166 | ) | |||||||
Cash at beginning of period | 1,008,149 | — | 32,179,166 | |||||||||
|
|
|
|
|
| |||||||
Cash at end of period | $ | — | $ | 1,008,149 | $ | — | ||||||
|
|
|
|
|
| |||||||
Supplemental disclosure of cash flow information | ||||||||||||
Cash paid for interest | $ | 51,897 | $ | 104,874 | $ | 28,626 | ||||||
See accompanying Notes to Financial Statements which are an integral part of the financial statements.
41
Invesco DB Oil Fund
December 31, 2018
Note 1 - Organization
Invesco DB Oil Fund (the “Fund”), a separate series of Invesco DB Multi-Sector Commodity Trust (the “Trust”), a Delaware statutory trust organized in seven separate series was formed on August 3, 2006. The term of the Fund is perpetual (unless terminated earlier in certain circumstances) as provided for in the Fifth Amended and Restated Declaration of Trust and Trust Agreement of the Fund, as amended (the “Trust Agreement”). The Fund has an unlimited number of shares authorized for issuance.
Invesco Capital Management LLC (“Invesco”) has served as the managing owner (the “Managing Owner”), commodity pool operator and commodity trading advisor of the Fund, since February 23, 2015. The Managing Owner holds 40 general shares (the “General Shares”) of the Fund. The fiscal year end of the Fund is December 31st.
The Fund seeks to track changes, whether positive or negative, in the level of the DBIQ Optimum Yield Crude Oil Index Excess Return™ (the “Index”) over time, plus the excess, if any, of the sum of the Fund’s interest income from its holdings of United States Treasury Obligations (“Treasury Income”), dividends from its holdings in money market mutual funds (affiliated or otherwise) (“Money Market Income”) and dividends or distributions of capital gains from its holdings ofT-Bill ETFs (as defined below)(“T-Bill ETF Income”) over the expenses of the Fund. The Fund invests in futures contracts in an attempt to track its Index. The Index is intended to reflect the change in market value of the crude oil sector. The single commodity comprising the Index is Light Sweet Crude Oil (WTI) (the “Index Commodity”).
The Fund may invest directly in United States Treasury Obligations. The Fund may also gain exposure to United States Treasury Obligations through investments in exchange-traded funds (“ETFs”) (affiliated or otherwise) that track indexes that measure the performance of United States Treasury Obligations with a maximum remaining maturity of up to 12 months(“T-Bill ETFs”). The Fund invests in United States Treasury Obligations, money market mutual funds andT-Bill ETFs (affiliated or otherwise), if any, for margin and/or cash management purposes.
The Commodity Futures Trading Commission (the “CFTC”) and certain futures exchanges impose position limits on futures contracts that reference the Index Commodity (the “Index Contracts”). The Managing Owner may determine to invest in other futures contracts if at any time it is impractical or inefficient to gain full or partial exposure to the Index Commodity through the use of Index Contracts. These other futures contracts may or may not be based on the Index Commodity. When they are not, the Managing Owner may seek to select futures contracts that it reasonably believes tend to exhibit trading prices that correlate with an Index Contract.
The Fund offers common units of beneficial interest (the “Shares”) only to certain eligible financial institutions (the “Authorized Participants”) in one or more blocks of 200,000 Shares (“Basket”). The Fund commenced investment operations on January 3, 2007. The Fund commenced trading on the American Stock Exchange (which became the NYSE Alternext US LLC) on January 5, 2007 and, since November 25, 2008, has been listed on the NYSE Arca, Inc. (the “NYSE Arca”).
This Annual Report (the “Annual Report”) covers the years ended December 31, 2018, 2017 and 2016. Past performance of the Fund is not necessarily indicative of future performance.
Note 2 - Summary of Significant Accounting Policies
A.Basis of Presentation
The financial statements of the Fund have been prepared using accounting principles generally accepted in the United States of America (“U.S. GAAP”).
The Fund has determined that it meets the definition of an investment company and has prepared the financial statements in conformity with U.S. GAAP for investment companies in conformity with accounting and reporting guidance of the Financial Accounting Standards Board Accounting Standards Codification Topic 946,Financial Services —Investment Companies.
B. Accounting Estimates
The preparation of financial statements in conformity with U.S. GAAP requires management to make estimates and assumptions that affect the reported amounts of assets and liabilities at the date of the financial statements and the reported amounts of revenues and expenses during the reporting period. Actual results could differ from those estimates by a significant amount. In addition, the Fund monitors for material events or transactions that may occur or become known after theperiod-end date and before the date the financial statements are released to print.
42
C. Investment Valuations
Investments inopen-end andclosed-end registered investment companies that do not trade on an exchange are valued at theend-of-day net asset value (“NAV”) per share. Investments inopen-end andclosed-end registered investment companies that trade on an exchange are valued at the last sales price or official closing price as of the close of the customary trading session on the exchange where the security is principally traded.
United States Treasury Obligations are fair valued using an evaluated quote provided by an independent pricing service. Evaluated quotes provided by the pricing service may be determined without exclusive reliance on quoted prices, and may reflect appropriate factors such as developments related to specific securities, yield, quality, type of issue, coupon rate, maturity, individual trading characteristics and other market data. All debt obligations involve some risk of default with respect to interest and/or principal payments.
Futures contracts are valued at the final settlement price set by an exchange on which they are principally traded.
Securities for which market quotations are not readily available or became unreliable are valued at fair value as determined in good faith following procedures approved by the Managing Owner. Issuer-specific events, market trends, bid/asked quotes of brokers and information providers and other data may be reviewed in the course of making a good faith determination of a security’s fair value.
D. Investment Transactions and Investment Income
Investment transactions are accounted for on a trade date basis. Realized gains or losses from the sale or disposition of securities or derivatives are determined on a specific identification basis and recognized in the Statements of Income and Expenses in the period in which the contract is closed or the sale or disposition occurs, respectively. Interest income on United States Treasury Obligations is recognized on an accrual basis when earned. Premiums and discounts are amortized or accreted over the life of the United States Treasury Obligations. Dividend income (net of withholding tax, if any) is recorded on theex-dividend date.
E. Profit and Loss Allocations and Distributions
Pursuant to the Trust Agreement, income and expenses are allocatedpro rata to the Managing Owner as holder of the General Shares and to the Shareholders monthly based on their respective percentage interests as of the close of the last trading day of the preceding month. Distributions (other than redemption of units) may be made at the sole discretion of the Managing Owner on apro rata basis in accordance with the respective capital balances of the shareholders.
The Managing Owner has sole discretion in determining what distributions, if any, the Fund will make to shareholders. A distribution for the year ended December 31, 2018 was paid on December 31, 2018 to holders of record as of December 26, 2018 at a rate of $0.13438 for each General Share and Share for the total distribution of $8 to General Shares and $4,112,025 to Share.
The table below shows distributions per General Share and Share in total for the years presented:
| Years Ended December 31. | ||||||||||||
| 2018 | 2017 | 2016 | ||||||||||
Distributions per General Share | $ | 0.13438 | $ | — | $ | — | ||||||
Distributions per Share | $ | 0.13438 | $ | — | $ | — | ||||||
Distributions paid to General Shares | $ | 8 | $ | — | $ | — | ||||||
Distributions paid to Shares | $ | 4,112,025 | $ | — | $ | — | ||||||
F. Routine Operational, Administrative and Other Ordinary Expenses
The Managing Owner is responsible for all routine operational, administrative and other ordinary expenses of the Fund, including, but not limited to, computer services, the fees and expenses of the Trustee, legal and accounting fees and expenses, tax preparation expenses, filing fees and printing, mailing and duplication costs. The Fund does not reimburse the Managing Owner for the routine operational, administrative and other ordinary expenses of the Fund. Accordingly, such expenses are not reflected in the Statements of Income and Expenses of the Fund.
G.Non-Recurring Fees and Expenses
The Fund pays allnon-recurring and unusual fees and expenses, if any, of itself, as determined by the Managing Owner.Non-recurring and unusual fees and expenses include fees and expenses, such as legal claims and liabilities, litigation costs, indemnification expenses or othernon-routine expenses.Non-recurring and unusual fees and expenses, by their nature, are unpredictable in terms of timing and amount. For the years ended December 31, 2018, 2017 and 2016, the Fund did not incur such expenses.
43
H. Brokerage Commissions and Fees
The Fund incurs all brokerage commissions, including applicable exchange fees, National Futures Association (“NFA”) fees,give-up fees, pit brokerage fees and other transaction related fees and expenses charged in connection with trading activities by the Commodity Broker (as defined below). These costs are recorded as Brokerage Commissions and Fees in the Statements of Income and Expenses. The Commodity Broker’s brokerage commissions and trading fees are determined on acontract-by-contract basis. On average, total charges paid to the Commodity Broker, as applicable were less than $6.00, $6.00 and $6.00 per round-turn trade during the years ended December 31, 2018, 2017 and 2016, respectively.
I. Income Taxes
The Fund is classified as a partnership for U.S. federal income tax purposes. Accordingly, the Fund will generally not incur U.S. federal income taxes. No provision for federal, state, and local income taxes has been made in the accompanying financial statements, as investors are individually liable for income taxes, if any, on their allocable share of the Fund’s income, gain, loss, deductions and other items.
The Managing Owner has reviewed all of the Fund’s open tax years and major jurisdictions and concluded that there is no tax liability resulting from unrecognized tax benefits relating to uncertain tax positions taken or expected to be taken in future tax returns. The Fund is also not aware of any tax positions for which it is reasonably possible that the total amounts of unrecognized tax benefits will significantly change in the next twelve months. The major tax jurisdiction for the Fund and the earliest tax year subject to examination: United States, 2015.
J. Commodity Futures Contracts
The Fund utilizes derivative instruments to achieve its investment objective. A commodity futures contract is an agreement between counterparties to purchase or sell a specified underlying commodity for a specified price, or to pay or receive a cash amount based on the value of an index or other reference instrument, at a future date. Initial margin deposits required upon entering into futures contracts are satisfied by the segregation of specific securities or cash as collateral with the Commodity Broker. During the period that the commodity futures contracts are open, changes in the value of the contracts are recognized as unrealized gains or losses by recalculating the value of the contracts on a daily basis. Subsequent or variation margin payments are received or made depending upon whether unrealized gains or losses are incurred. These amounts are reflected as a receivable or payable on the Statements of Financial Condition. When the contracts are closed or expire, the Fund recognizes a realized gain or loss equal to the difference between the proceeds from, or cost of, the closing transaction and the Fund’s basis in the contract. Realized gains (losses) and changes in unrealized appreciation (depreciation) on open positions are determined on a specific identification basis and recognized in the Statements of Income and Expenses in the period in which the contract is closed or the changes occur, respectively.
Note 3 - Financial Instrument Risk
In the normal course of its business, the Fund is a party to financial instruments withoff-balance sheet risk. The term“off-balance sheet risk” refers to an unrecorded potential liability that, even though it does not appear on the balance sheet, may result in a future obligation or loss in excess of the amounts shown on the Statements of Financial Condition. The financial instruments used by the Fund are commodity futures contracts, the values of which are based upon an underlying asset and generally represent future commitments that have a reasonable possibility of being settled in cash or through physical delivery. The financial instruments are traded on an exchange and are standardized contracts.
Market risk is the potential for changes in the value of the financial instruments traded by the Fund due to market changes, including fluctuations in commodity prices. In entering into these futures contracts, there exists a market risk that such futures contracts may be significantly influenced by adverse market conditions, resulting in such futures contracts being less valuable. If the markets should move against all of the futures contracts at the same time, the Fund could experience substantial losses.
Credit risk is the possibility that a loss may occur due to the failure of the Commodity Broker and/or clearing house to perform according to the terms of a futures contract. Credit risk with respect to exchange-traded instruments is reduced to the extent that an exchange or clearing organization acts as a counterparty to the transactions. The Commodity Broker, when acting as the Fund’s futures commission merchant in accepting orders for the purchase or sale of domestic futures contracts, is required by CFTC regulations to separately account for and segregate as belonging to the Fund all assets of the Fund relating to domestic futures trading. The Commodity Broker is not allowed to commingle such assets with other assets of the Commodity Broker. In addition, CFTC regulations also require the Commodity Broker to hold in a secure account assets of the Fund related to foreign futures trading. The Fund’s risk of loss in the event of counterparty default is typically limited to the amounts recognized in the Statements of Financial Condition and not represented by the futures contract or notional amounts of the instruments.
The Fund has not utilized, nor does it expect to utilize in the future, special purpose entities to facilitateoff-balance sheet financing arrangements and has no loan guarantee arrangements oroff-balance sheet arrangements of any kind, other than agreements entered into in the normal course of business noted above.
44
Note 4 – Service Providers and Related Party Agreements
The Trustee
Under the Trust Agreement, Wilmington Trust Company, the trustee of the Fund (the “Trustee”), has the power and authority to execute and file certificates as required by the Delaware Statutory Trust Act and to accept service of process on the Fund in the State of Delaware. The Managing Owner has the exclusive management and control of all aspects of the business of the Fund. The Trustee will serve in that capacity until such time as the Managing Owner removes the Trustee or the Trustee resigns and a successor is appointed by the Managing Owner. The Trustee will have no duty or liability to supervise or monitor the performance of the Managing Owner, nor will the Trustee have any liability for the acts or omissions of the Managing Owner.
The Managing Owner
The Managing Owner serves as the Fund’s commodity pool operator, commodity trading advisor and managing owner. The Fund pays the Managing Owner a management fee, monthly in arrears, in an amount equal to 0.75% per annum of the daily NAV of the Fund (the “Management Fee”). The Fund, for cash management purposes, invests in money market mutual funds and/orT-Bill ETFs that are managed by affiliates of the Managing Owner. The indirect portion of the management fee that the Fund incurs through such investments is in addition to the Management Fee paid to the Managing Owner. The Managing Owner has contractually agreed to waive indefinitely the fees that it receives in an amount equal to the indirect management fees that the Fund incurs through its investments in affiliated money market mutual funds and/or affiliatedT-Bill ETFs. The Managing Owner may terminate this fee waiver on 60 days notice.
The Managing Owner waived fees of $43,384, $46,116 and $14,569 for the years ended December 31, 2018, 2017 and 2016, respectively.
The Distributor
Effective June 20, 2016, Invesco Distributors, Inc. (the “Distributor”) became distributor and began providing certain distribution services to the Fund. Pursuant to the Distribution Services Agreement among the Managing Owner, the Fund and the Distributor, the Distributor assists the Managing Owner and the Fund’s administrator, The Bank of New York Mellon with certain functions and duties relating to distribution and marketing services to the Fund including reviewing and approving marketing materials. Prior to June 20, 2016, ALPS Distributors, Inc. provided distribution services to the Fund.
The Managing Owner pays the Distributor a distribution fee out of the Management Fee.
The Commodity Broker
Morgan Stanley & Co. LLC, a Delaware limited liability company, serves as the Fund’s futures clearing broker (the “Commodity Broker”). The Commodity Broker is registered with the CFTC as a futures commission merchant and is a member of the NFA in such capacity.
A variety of executing brokers execute futures transactions on behalf of the Fund. Such executing brokersgive-up all such transactions to the Commodity Broker. In its capacity as clearing broker, the Commodity Broker may execute or receive transactions executed by others and clears all of the Fund’s futures transactions and performs certain administrative and custodial services for the Fund. The Commodity Broker is responsible, among other things, for providing periodic accountings of all dealings and actions taken by the Fund during the reporting period, together with an accounting of all securities, cash or other indebtedness or obligations held by it or its nominees for or on behalf of the Fund.
The Administrator, Custodian and Transfer Agent
The Bank of New York Mellon (the “Administrator”, “Custodian” and “Transfer Agent”) is the administrator, custodian and transfer agent of the Fund. The Fund and the Administrator have entered into separate administrative, custodian, transfer agency and service agreements (collectively referred to as the “Administration Agreement”).
Pursuant to the Administration Agreement, the Administrator performs or supervises the performance of services necessary for the operation and administration of the Fund (other than making investment decisions), including receiving and processing orders from Authorized Participants to create and redeem Baskets, NAV calculations, accounting and other fund administrative services. The Administrator maintains certain financial books and records, including: Basket creation and redemption books and records, fund accounting records, ledgers with respect to assets, liabilities, capital, income and expenses, the registrar, transfer journals and related details, and trading and related documents received from the Commodity Broker. The Managing Owner pays the Administrator fees for its services out of the Management Fee.
45
Index Sponsor
The Managing Owner, on behalf of the Fund, has appointed Deutsche Investment Management Americas Inc. to serve as the index sponsor (the “Index Sponsor”). The Index Sponsor calculates and publishes the daily index levels and the indicative intraday index levels. Additionally, the Index Sponsor also calculates the indicative value per Share of the Fund throughout each business day.
The Managing Owner pays the Index Sponsor a licensing fee and an index services fee out of the Management Fee for performing its duties.
Note 5 - Deposits with Commodity Broker and Custodian
The Fund defines cash as cash held by the Custodian. There were no cash equivalents held by the Fund as of December 31, 2018 and 2017.
The Fund may deposit cash, United States Treasury Obligations,T-Bill ETFs and money market mutual funds with the Commodity Broker as margin, to the extent permissible under CFTC rules. The combination of the Fund’s deposits with its Commodity Broker of cash and United States Treasury Obligations and the unrealized profit or loss on open futures contracts represents the Fund’s overall equity in its broker trading account. To meet the Fund’s maintenance margin requirements, the Fund holds United States Treasury Obligations with the Commodity Broker. The Fund transfers cash to the Commodity Broker to satisfy variation margin requirements. The Fund earns interest on any excess cash deposited with the Commodity Broker and incurs interest expense on any deficit balance with the Commodity Broker.
The brokerage agreement with the Commodity Broker provides for the net settlement of all financial instruments covered by the agreement in the event of default or termination of any one contract. The Managing Owner will utilize any excess cash held at the Commodity Broker to offset any realized losses incurred in the commodity futures contracts, if available. To the extent that any excess cash held at the Commodity Broker is not adequate to cover any realized losses, a portion of the United States Treasury Obligations andT-Bill ETFs, if any, on deposit with the Commodity Broker will be sold to make additional cash available. For financial reporting purposes, the Fund offsets financial assets and financial liabilities that are subject to legally enforceable netting arrangements.
The Fund’s remaining cash, United States Treasury Obligations,T-Bill ETFs and money market mutual fund holdings are on deposit with the Custodian. The Fund is permitted to temporarily carry a negative or overdrawn balance in its account with the Custodian. The Fund incurs interest expense on any overdraft balance with the Custodian. Such balances, if any atperiod-end, are shown on the Statements of Financial Condition under the payable captionDue to custodian.
Note 6 - Additional Valuation Information
U.S. GAAP defines fair value as the price that would be received to sell an asset or paid to transfer a liability in an orderly transaction between market participants at the measurement date, under current market conditions. U.S. GAAP establishes a hierarchy that prioritizes the inputs to valuation methods, giving the highest priority to readily available unadjusted quoted prices in an active market for identical assets (Level 1) and the lowest priority to significant unobservable inputs (Level 3), generally when market prices are not readily available or are unreliable. Based on the valuation inputs, the securities or other investments are tiered into one of three levels. Changes in valuation methods or market conditions may result in transfers in or out of an investment’s assigned level:
Level 1: Prices are determined using quoted prices in an active market for identical assets.
Level 2: Prices are determined using other significant observable inputs. Observable inputs are inputs that other market participants may use in pricing a security. These may include quoted prices for similar securities, interest rates, prepayment speeds, credit risk, yield curves, loss severities, default rates, discount rates, volatilities and others.
Level 3: Prices are determined using significant unobservable inputs. In situations where quoted prices or observable inputs are unavailable (for example, when there is little or no market activity for an investment at the end of the period), unobservable inputs may be used. Unobservable inputs reflect the Fund’s own assumptions about the factors market participants would use in determining fair value of the securities or instruments and would be based on the best available information.
The levels assigned to the securities valuations may not be an indication of the risk or liquidity associated with investing in those securities. Because of the inherent uncertainties of valuation, the values reflected in the financial statements may materially differ from the value received upon actual sale of those investments.
46
The following is a summary of the tiered valuation input levels as of December 31, 2018:
| Level 1 | Level 2 | Level 3 | Total | |||||||||||||
Investments in Securities | ||||||||||||||||
United States Treasury Obligations | $ | — | $ | 227,905,176 | $ | — | $ | 227,905,176 | ||||||||
Exchange-Traded Fund | 5,008,400 | — | — | 5,008,400 | ||||||||||||
Money Market Mutual Fund | 28,294,139 | — | — | 28,294,139 | ||||||||||||
|
|
|
|
|
|
|
| |||||||||
Total Investments in Securities | 33,302,539 | 227,905,176 | — | 261,207,715 | ||||||||||||
|
|
|
|
|
|
|
| |||||||||
Other Investments - Liabilities(a) | ||||||||||||||||
Commodity Futures Contracts | (107,405,985 | ) | — | — | (107,405,985 | ) | ||||||||||
|
|
|
|
|
|
|
| |||||||||
Total Investments | $ | (74,103,446 | ) | $ | 227,905,176 | $ | — | $ | 153,801,730 | |||||||
|
|
|
|
|
|
|
| |||||||||
| (a) | Unrealized appreciation (depreciation). |
The following is a summary of the tiered valuation input levels as of December 31, 2017:
| Level 1 | Level 2 | Level 3 | Total | |||||||||||||
Investments in Securities | ||||||||||||||||
United States Treasury Obligations | $ | — | $ | 311,472,491 | $ | — | $ | 311,472,491 | ||||||||
Exchange-Traded Fund | 5,000,325 | — | — | 5,000,325 | ||||||||||||
Money Market Mutual Fund | 12,412,152 | — | — | 12,412,152 | ||||||||||||
|
|
|
|
|
|
|
| |||||||||
Total Investments in Securities | 17,412,477 | 311,472,491 | — | 328,884,968 | ||||||||||||
|
|
|
|
|
|
|
| |||||||||
Other Investments - Assets(a) | ||||||||||||||||
Commodity Futures Contracts | 45,635,994 | — | — | 45,635,994 | ||||||||||||
|
|
|
|
|
|
|
| |||||||||
Total Investments | $ | 63,048,471 | $ | 311,472,491 | $ | — | $ | 374,520,962 | ||||||||
|
|
|
|
|
|
|
| |||||||||
| (a) | Unrealized appreciation (depreciation). |
Note 7 – Derivative Instruments
The Fair Value of Derivative Instruments is as follows:
| December 31, | ||||||||||||||||
| 2018 | 2017 | |||||||||||||||
Risk Exposure/Derivative Type(a) | Assets | Liabilities | Assets | Liabilities | ||||||||||||
Commodity risk | ||||||||||||||||
Commodity Futures Contracts | $ | — | $ | (107,405,985 | ) | $ | 45,635,994 | $ | — | |||||||
| (a) | Includes cumulative appreciation (depreciation) of commodity futures contracts. Only the current day’s variation margin receivable (payable) is reported in the December 31, 2018 and December 31, 2017 Statements of Financial Condition. |
47
The following table presents derivative instruments that are either subject to an enforceable netting agreement or offset by collateral arrangements as of December 31, 2018, net by contract:
| Financial Derivative Assets | Financial Derivative Liabilities | Collateral (Received)/Pledged(a) | ||||||||||||||||||||||
Counterparty | Futures Contracts | Futures Contracts | Net value of derivatives | Non-Cash | Cash | Net amount | ||||||||||||||||||
Morgan Stanley & Co. LLC | $ | 108,092,385 | $ | (107,405,985 | ) | $ | 686,400 | $ | — | $ | — | $ | 686,400 | |||||||||||
The following table presents derivative instruments that are either subject to an enforceable netting agreement or offset by collateral arrangements as of December 31, 2017, net by contract:
| Financial Derivative Assets | Financial Derivative Liabilities | Collateral (Received)/Pledged(a) | ||||||||||||||||||||||
Counterparty | Futures Contracts | Futures Contracts | Net value of derivatives | Non-Cash | Cash | Net amount | ||||||||||||||||||
Morgan Stanley & Co. LLC | $ | 45,635,994 | $ | (42,497,574 | ) | $ | 3,138,420 | $ | — | $ | — | $ | 3,138,420 | |||||||||||
| (a) | As of December 31, 2018 and December 31, 2017, a portion of the Fund’s U.S. Treasury Obligations were required to be deposited as maintenance margin in support of the Fund’s futures positions. |
The Effect of Derivative Instruments on the Statements of Income and Expenses is as follows:
| Location of Gain or (Loss) on Derivatives | For the Years Ended December 31, | |||||||||||||
Risk Exposure/Derivative Type | Recognized in Income | 2018 | 2017 | 2016 | ||||||||||
Commodity risk | ||||||||||||||
Commodity Futures Contracts | Net Realized Gain (Loss) | $ | 110,729,624 | $ | 76,668,337 | $ | (240,714,315 | ) | ||||||
| Net Change in Unrealized Gain (Loss) | (153,041,979 | ) | (59,889,101 | ) | 290,682,335 | |||||||||
|
|
|
|
|
| |||||||||
Total | $ | (42,312,355 | ) | $ | 16,779,236 | $ | 49,968,020 | |||||||
|
|
|
|
|
| |||||||||
The table below summarizes the average monthly notional value of futures contracts outstanding during the period:
| Years Ended December 31, | ||||||||||||
| 2018 | 2017 | 2016 | ||||||||||
Average Notional Value | $ | 363,101,565 | $ | 397,184,327 | $ | 441,139,713 | ||||||
Note 8 - Investments in Affiliates
The Invesco Treasury Collateral ETF (formerly PowerShares Treasury Collateral Portfolio) is an investment company registered under the Investment Company Act of 1940, as amended, whose shares are primarily purchased and sold on a national securities exchange. In seeking its investment objective, the Invesco Treasury Collateral ETF primarily holds U.S. Treasury Obligations that: (i) are issued in U.S. Dollars; (ii) have a minimum remaining maturity of at least one month and a maximum remaining maturity of 12 months at the time of rebalance; and (iii) have a minimum amount outstanding of $300 million. Because it is advised by the Managing Owner, the Invesco Treasury Collateral ETF is an affiliate of the Fund.
The following is a summary of the transactions in, and earnings from, investments in affiliates (excluding affiliated money market funds) for the year ended December 31, 2018.
| Value 12/31/2017 | Purchases at Cost | Proceeds from Sales | Change in Unrealized Appreciation (Depreciation) | Realized Gain (Loss) | Value 12/31/2018 | Dividend Income | ||||||||||||||||||||||
Invesco Treasury Collateral ETF | $ | 5,000,325 | $ | — | $ | — | $ | 8,075 | $ | — | $ | 5,008,400 | $ | 84,613 | ||||||||||||||
48
The following is a summary of the transactions in, and earnings from, investments in affiliates (excluding affiliated money market funds) for the year ended December 31, 2017.
| Value 12/31/2016 | Purchases at Cost | Proceeds from Sales | Change in Unrealized Appreciation (Depreciation) | Realized Gain (Loss) | Value 12/31/2017 | Dividend Income | ||||||||||||||||||||||
PowerShares Treasury Collateral Portfolio | $ | — | $ | 5,005,284 | $ | — | $ | (4,959 | ) | $ | — | $ | 5,000,325 | $ | 35,475 | |||||||||||||
Note 9 - Share Purchases and Redemptions
(a) Purchases
On any business day, an Authorized Participant may place an order with the Transfer Agent to create one or more Baskets. Each Basket consists of a block of 200,000 Shares. For purposes of processing both creation and redemption orders, a “business day” means any day other than a day when banks in New York City are required or permitted to be closed. Creation orders must be placed by 10:00 a.m., Eastern Time. The day on which the Transfer Agent receives a valid creation order is the creation order date. The day on which a creation order is settled is the creation order settlement date. Cash settlement occurs at the creation order settlement date. As provided below, the creation order settlement date may occur up to two business days after the creation order date. By placing a creation order, and prior to delivery of such Baskets, an Authorized Participant’s Depository Trust Company (“DTC”) account is charged thenon-refundable transaction fee due for the creation order.
Unless otherwise agreed to by the Managing Owner and the Authorized Participant as provided in the next sentence, Baskets are issued on the creation order settlement date as of 2:45 p.m., Eastern Time, on the business day immediately following the creation order date at the applicable NAV per Share as of the closing time of the NYSE Arca or the last to close of the exchanges on which its futures contracts are traded, whichever is later, on the creation order date, but only if the required payment has been timely received. Upon submission of a creation order, the Authorized Participant may request the Managing Owner to agree to a creation order settlement date up to two business days after the creation order date.
(b) Redemptions
On any business day, an Authorized Participant may place an order with the Transfer Agent to redeem one or more Baskets. Redemption orders must be placed by 10:00 a.m., Eastern Time. The day on which the Managing Owner receives a valid redemption order is the redemption order date. The day on which a redemption order is settled is the redemption order settlement date. Cash settlement occurs at the redemption order settlement date. As provided below, the redemption order settlement date may occur up to two business days after the redemption order date. The redemption procedures allow Authorized Participants to redeem Baskets. Individual Shareholders may not redeem directly from the Fund. Instead, individual Shareholders may only redeem Shares in integral multiples of 200,000 and only through an Authorized Participant.
Unless otherwise agreed to by the Managing Owner and the Authorized Participant as provided in the next sentence, by placing a redemption order, an Authorized Participant agrees to deliver the Baskets to be redeemed through DTC’s book-entry system to the Fund no later than the redemption order settlement date as of 2:45 p.m., Eastern Time, on the business day immediately following the redemption order date. Upon submission of a redemption order, the Authorized Participant may request the Managing Owner to agree to a redemption order settlement date up to two business days after the redemption order date. By placing a redemption order, and prior to receipt of the redemption proceeds, an Authorized Participant’s DTC account is charged thenon-refundable transaction fee due for the redemption order.
The redemption proceeds from the Fund consist of the cash redemption amount. The cash redemption amount is equal to the NAV of the number of Basket(s) requested in the Authorized Participant’s redemption order as of the closing time of the NYSE Arca or the last to close of the exchanges on which the Fund’s futures contracts are traded, whichever is later, on the redemption order date. The Managing Owner will distribute the cash redemption amount at the redemption order settlement date as of 2:45 p.m., Eastern Time, on the redemption order settlement date through DTC to the account of the Authorized Participant as recorded on DTC’s book-entry system.
The redemption proceeds due from the Fund are delivered to the Authorized Participant at 2:45 p.m., Eastern Time, on the redemption order settlement date if, by such time, the Fund’s DTC account has been credited with the Baskets to be redeemed. If the Fund’s DTC account has not been credited with all of the Baskets to be redeemed by such time, the redemption distribution is delivered to the extent of whole Baskets received. Any remainder of the redemption distribution is delivered on the next business day to the extent of remaining whole Baskets received if the Transfer Agent receives the fee applicable to the extension of the redemption distribution date which the Managing Owner may, fromtime-to-time, determine and the remaining Baskets to be redeemed are credited to the Fund’s DTC account by 2:45 p.m., Eastern Time, on such next business day. Any further outstanding amount of the redemption order will be cancelled. The Managing Owner is also authorized to deliver the redemption distribution notwithstanding
49
that the Baskets to be redeemed are not credited to the Fund’s DTC account by 2:45 p.m., Eastern Time, on the redemption order settlement date if the Authorized Participant has collateralized its obligation to deliver the Baskets through DTC’s book-entry system on such terms as the Managing Owner may determine fromtime-to-time.
Note 10 - Commitments and Contingencies
The Managing Owner, either in its own capacity or in its capacity as the Managing Owner and on behalf of the Fund, has entered into various service agreements that contain a variety of representations, or provide indemnification provisions related to certain risks service providers undertake in performing services for the Fund. The Trust Agreement provides for the Fund to indemnify the Managing Owner and any affiliate of the Managing Owner that provides services to the Fund to the maximum extent permitted by applicable law, subject to certain exceptions for disqualifying conduct by the Managing Owner or such an affiliate. The Fund’s maximum exposure under these arrangements is unknown as this would involve future claims that may be made against the Fund that have not yet occurred. Further, the Fund has not had prior claims or losses pursuant to these contracts. Accordingly, the Managing Owner expects the risk of loss to be remote.
50
Note 11 - Financial Highlights
The Fund is presenting the following NAV and financial highlights related to investment performance for a Share outstanding for the years ended December 31, 2018, 2017 and 2016. An individual investor’s return and ratios may vary based on the timing of capital transactions.
NAV per Share is the NAV of the Fund divided by the number of outstanding Shares at the date of each respective period presented.
| Years Ended December 31, | ||||||||||||
| 2018 | 2017 | 2016 | ||||||||||
Net Asset Value | ||||||||||||
Net asset value per Share, beginning of period | $ | 10.21 | $ | 9.67 | $ | 9.07 | ||||||
Net realized and change in unrealized gain (loss) on United States Treasury Obligations, Affiliated Investments and Commodity Futures Contracts | (1.82 | ) | 0.54 | 0.64 | ||||||||
Net investment income (loss)(a) | 0.12 | 0.00 | (0.04 | ) | ||||||||
|
|
|
|
|
| |||||||
Net income (loss) | (1.70 | ) | 0.54 | 0.60 | ||||||||
|
|
|
|
|
| |||||||
Less: | ||||||||||||
Return of capital distributions | (0.13 | ) | — | — | ||||||||
|
|
|
|
|
| |||||||
Net asset value per Share, end of period | $ | 8.38 | $ | 10.21 | $ | 9.67 | ||||||
|
|
|
|
|
| |||||||
Market value per Share, beginning of period(b) | $ | 10.16 | $ | 9.68 | $ | 9.08 | ||||||
|
|
|
|
|
| |||||||
Market value per Share, end of period(b) | $ | 8.47 | $ | 10.16 | $ | 9.68 | ||||||
|
|
|
|
|
| |||||||
Ratio to average Net Assets | ||||||||||||
Net investment income (loss) | 1.03 | % | 0.03 | % | (0.49 | )% | ||||||
|
|
|
|
|
| |||||||
Expenses, after waivers | 0.82 | % | 0.79 | % | 0.78 | % | ||||||
|
|
|
|
|
| |||||||
Expenses, prior to waivers | 0.83 | % | 0.80 | % | 0.78 | % | ||||||
|
|
|
|
|
| |||||||
Total Return, at net asset value(c) | (16.52 | )% | 5.58 | % | 6.62 | % | ||||||
|
|
|
|
|
| |||||||
Total Return, at market value(c) | (15.26 | )% | 4.96 | % | 6.61 | % | ||||||
|
|
|
|
|
| |||||||
| (a) | Based on average shares outstanding. |
| (b) | The mean between the last bid and ask prices. |
| (c) | Total Return, at NAV is calculated assuming an initial investment made at the NAV at the beginning of the period, reinvestment of all dividends and distributions at NAV during the period, and redemption of Shares on the last day of the period. Total Return, at NAV includes adjustments in accordance with U.S. GAAP and as such, the NAV for financial reporting purposes and the returns based upon those NAVs may differ from the NAVs and returns for shareholder transactions. Total Return, at market value is calculated assuming an initial investment made at the market value at the beginning of the period, reinvestment of all dividends and distributions at market value during the period, and redemption of Shares at the market value on the last day of the period. Not annualized for periods less than one year, if applicable. |
51
| ITEM 9. | CHANGES IN AND DISAGREEMENTS WITH ACCOUNTANTS ON ACCOUNTING AND FINANCIAL DISCLOSURE |
None.
| ITEM 9A. | CONTROLS AND PROCEDURES |
For purposes of this Item 9A, all references to the “Fund” shall be read to specifically include the Fund and the Trust. Please note that the disclosure controls and procedures and internal control over financial reporting of the Trust are the aggregate disclosure controls and procedures and internal control over financial reporting of the Fund and that of Invesco DB Agriculture Fund, Invesco DB Base Metals Fund, Invesco DB Energy Fund, Invesco DB Gold Fund, Invesco DB Precious Metals Fund and Invesco DB Silver Fund, each a series of the Trust.
Evaluation of Disclosure Controls and Procedures
Under the supervision and with the participation of the management of the Managing Owner, including Daniel Draper, its Principal Executive Officer, and Kelli Gallegos, its Principal Financial and Accounting Officer, Investment Pools, the Fund carried out an evaluation of the effectiveness of the design and operation of its disclosure controls and procedures (as defined inRule 13a-15(e) or15d-15(e) of the Securities Exchange Act of 1934, as amended (the “Exchange Act”)) as of December 31, 2018, the end of the period covered by this Annual Report, and, based upon that evaluation, Daniel Draper, the Principal Executive Officer of the Managing Owner, and Kelli Gallegos, the Principal Financial and Accounting Officer, Investment Pools, of the Managing Owner, concluded that the Fund’s disclosure controls and procedures were effective to provide reasonable assurance that information the Fund is required to disclose in the reports that it files or submits with the Securities and Exchange Commission (the “SEC”) under the Exchange Act is recorded, processed, summarized and reported, within the time periods specified in the SEC’s rules and forms, and to ensure that information required to be disclosed by the Fund in the reports that it files or submits under the Exchange Act is accumulated and communicated to management of the Managing Owner, including its Principal Executive Officer and Principal Financial Officer, as appropriate to allow timely decisions regarding required disclosure.
Changes in Internal Control Over Financial Reporting
There has been no change in internal control over financial reporting (as defined in the Rules13a-15(f) and15d-15(f) of the Exchange Act) that occurred during the quarter ended December 31, 2018 that has materially affected, or is reasonably likely to materially affect, the Fund’s internal control over financial reporting.
Management’s Annual Report on Internal Control Over Financial Reporting
Management of the Managing Owner is responsible for establishing and maintaining adequate internal control over financial reporting, as defined under Rules13a-15(f) and15d-15(f) of the Exchange Act, for the Fund. Daniel Draper, the Principal Executive Officer of the Managing Owner, and Kelli Gallegos, the Principal Financial and Accounting Officer, Investment Pools, of the Managing Owner, assessed the effectiveness of the Fund’s internal control over financial reporting as of December 31, 2018. Their report in connection with their assessment may be found in the “Report of Management on Internal Control Over Financial Reporting” on page 31 of this Annual Report on Form10-K.
The Fund’s independent registered public accounting firm, PricewaterhouseCoopers LLP, has audited the Fund’s internal control over financial reporting as of December 31, 2018, as stated in their report on page 32 of this Form10-K.
| ITEM 9B. | OTHER INFORMATION |
None.
52
| ITEM 10. | DIRECTORS AND EXECUTIVE OFFICERS OF THE REGISTRANT AND CORPORATE GOVERNANCE |
Board of Directors and Principal Officers
The Fund has no directors or principal officers and also does not have any employees. It is managed by the Managing Owner.
As of December 31, 2018, the board of managers and principal officers of the Managing Owner are as follows:
Name | Capacity | |
Daniel Draper | Chief Executive Officer, Board of Managers | |
Peter Hubbard | Vice President and Director of Portfolio Management | |
David Warren | Chief Administrative Officer, Board of Managers | |
Annette Lege | Principal | |
Kelli Gallegos | Principal Financial and Accounting Officer, Investment Pools | |
Melanie Zimdars | Chief Compliance Officer | |
John Zerr | Board of Managers | |
Brian Hartigan | Global Head of ETF Investments |
Invesco Group Services Inc. is also a principal of the Managing Owner.
The Managing Owner is managed by a Board of Managers. The Board of Managers is composed of Messrs. Draper, Warren and Zerr.
The Managing Owner has designated Mr. Hubbard as the trading principal of the Fund.
Daniel Draper (50) has been Chief Executive Officer of the Managing Owner since March 24, 2016. In this role, he has general oversight responsibilities for all of the Managing Owner’s business. Mr. Draper has been a Member of the Board of Managers of the Managing Owner since September 2013. In this role he is responsible for the management of the Managing Owner’s exchange traded fund business with direct functional reporting responsibilities for the Managing Owner’s portfolio management, products, marketing and capital markets teams. In such capacity, Mr. Draper also is responsible for managing the operations of the Invesco Funds. Previously, Mr. Draper was the Global Head of Exchange Traded Funds for Credit Suisse Asset Management, or Credit Suisse, based in London from March 2010 until June 2013, followed by a three monthnon-compete period pursuant to his employment terms with Credit Suisse. Credit Suisse is an asset management business of Credit Suisse Group, a financial services company. From January 2007 to March 2010, he was the Global Head of Exchange Traded Funds for Lyxor Asset Management in London, an investment management business unit of Societe Generale Corporate & Investment Banking. Mr. Draper was previously registered as a Significant Influence Functions (SIF) person with the UK’s Financial Conduct Authority. He withdrew SIF person status on June 30, 2013 when he left Credit Suisse. Mr. Draper received his MBA from the Kenan-Flagler Business School at the University of North Carolina at Chapel Hill and his BA from the College of William and Mary in Virginia. Mr. Draper is currently registered with FINRA and holds the Series 7, 24 and 63 registrations. Mr. Draper was listed as a principal of the Managing Owner on December 16, 2013.
Peter Hubbard (38) joined the Managing Owner in May 2005 as a portfolio manager and has been Vice President, Director of Portfolio Management since September 2012. In his role, Mr. Hubbard manages a team of eight portfolio managers. His responsibilities include facilitating all portfolio management processes associated with more than 200 equity and fixed income Invesco Funds listed in the United States, Canada and Europe. He is a graduate of Wheaton College with a B.A. degree in Business & Economics. Mr. Hubbard was listed as a principal and registered as an associated person of the Managing Owner on November 15, 2012 and January 1, 2013, respectively. Mr. Hubbard was registered as a swap associated person of the Managing Owner effective as of September 8, 2015.
David Warren (61) is Chief Administrative Officer, Americas, for Invesco Ltd., a global investment management company affiliated with the Managing Owner. He was appointed to this position in January 2007, and also holds the roles of Director, Executive Vice President and Chief Financial Officer of Invesco Canada Ltd., a Canadian investment management subsidiary of Invesco Ltd., since January 2009. He has been a Member of the Board of Managers and Chief Administrative Officer of the Managing Owner since January 2010, as well. In these capacities, Mr. Warren is responsible for general management support, in addition to executing on various strategic initiatives and overseeing the risk management framework for the business units operating within the Americas division of Invesco Ltd. He obtained a Bachelor’s Degree in Commerce from the University of Toronto as both a CA and CPA, and is a member of the Chartered Professional Accountants of Canada. Mr. Warren was listed as a principal of the Managing Owner on November 21, 2012.
Annette Lege(49) has been a Chief Accounting Officer and Head of Finance and Corporate Services (“FCS”) Business Services for Invesco Ltd. since March 2017. In this role, she is responsible for all aspects of Corporate Accounting including group financial reporting, internal controls and group accounting policies. Ms. Lege also manages Invesco’s Finance operations and shared service
53
centers and has held this role since September 2015. Previously, Ms. Lege was Head of FCS Transformation Office from October 2013 through September 2015, with responsibility for business transformation initiatives taking place across FCS at Invesco. Before assuming that role in October 2013, Ms. Lege held the position of North American Corporate Controller at Invesco from March 2007 to October 2013. Ms. Lege is also a CPA, is licensed by FINRA as a Financial Operations Principal, and is a member of the Texas State Board of Public Accountants. Ms. Lege earned a BBA in accounting from the University of Houston. Ms. Lege was listed as a principal of the Managing Owner on March 30, 2017 and was listed as a principal of Invesco Advisors, Inc. on March 22, 2017.
Kelli Gallegos (48) has been Principal Financial and Accounting Officer – Investment Pools for the Managing Owner since September 2018. Additionally, since September 2018, Ms. Gallegos has been Principal Financial and Accounting Officer – Investment Pools of Invesco Specialized Products, LLC (sponsor to a suite of currency exchange-traded funds, “ISP”), Head of North America Fund Reporting of Invesco, Ltd. (“Invesco”, a global investment management company), and Vice President and Treasurer of Invesco Exchange Traded Fund Trust, Invesco Exchange-Traded Fund Trust II, Invesco India Exchange-Traded Fund Trust, Invesco Actively Managed Exchange-Traded Fund Trust, Invesco Actively Managed Exchange-Traded Commodity Fund Trust, and Invesco Exchange-Traded Self-Indexed Fund Trusts (each a registered investment company offering series of exchange-traded funds, the “Invesco ETFs”). She also serves as Vice President (since March 2016), Principal Financial Officer (since March 2016) and Assistant Treasurer (since December 2008) for a suite of mutual funds advised by Invesco Advisers, Inc., a registered investment adviser (the “Invesco Funds”). In her roles with the Managing Owner, ISP, Invesco, the Invesco ETFs and the Invesco Funds, Ms. Gallegos has financial and administrative oversight responsibilities for, and serves as Principal Financial Officer of the Invesco ETFs, the Trust, the Funds and the exchange-traded funds for which ISP serves as sponsor (the “CurrencyShares Trusts”). Previously, she was Director of Fund Financial Services from December 2008 to September 2018, Assistant Treasurer for the Managing Owner from January 2013 to September 2018, Assistant Treasurer of ISP from April 2018 to September 2018, Assistant Treasurer for the Invesco ETFs from September 2014 to September 2018 and Assistant Vice President for the Invesco Funds from December 2008 to March 2016. In such roles, Ms. Gallegos managed the group of personnel responsible for the preparation of fund financial statements and other information necessary for shareholder reports, fund prospectuses, regulatory filings, and for the coordination and oversight of third-party service providers of the Fund, the Invesco ETFs, the Invesco Funds, and the CurrencyShares Trusts. Ms. Gallegos earned a BBA in accounting from Harding University in Searcy, AR. Ms. Gallegos was listed as a principal of the Managing Owner on September 25, 2018.
Melanie H. Zimdars(42) has been Chief Compliance Officer of the Managing Owner since November 2017. In this role she is responsible for all aspects of regulatory compliance for the Managing Owner. Ms. Zimdars has also served as Chief Compliance Officer of Invesco Exchange-Traded Fund Trust, Invesco Exchange-Traded Fund Trust II, Invesco India Exchange-Traded Fund Trust, Invesco Actively Managed Exchange-Traded Fund Trust and Invesco Actively Managed Exchange-Traded Commodity Fund Trust since November 2017. From September 2009 to October 2017, she served as Vice President and Deputy Chief Compliance Officer at ALPS Holdings, Inc. where she was Chief Compliance Officer for six different mutual fund complexes, including active and passive ETFs andopen-end andclosed-end funds. Through its subsidiary companies, ALPS Holdings, Inc. is a provider of investment products and customized servicing solutions to the financial services industry. Ms. Zimdars received a BS degree from the University ofWisconsin-La Crosse. Ms. Zimdars was listed as a principal of the Managing Owner on February 1, 2018.
John Zerr (56) has been a Member of the Board of Managers of the Managing Owner since September 2006. Mr. Zerr has also served as Chief Operating Officer of the Americas for Invesco Ltd. since February 2018. Prior to his current position, Mr. Zerr served as Managing Director and General Counsel – U.S. Retail of Invesco Management Group, Inc., a registered investment adviser affiliated with the Managing Owner, from March 2006 until February 2018, where he was responsible for overseeing the U.S. Retail Legal Department for Invesco Ltd. and its affiliated companies. Mr. Zerr has also been a Senior Vice President and Secretary of IDI since March 2006 and June 2006, respectively. He also served as a Director of that entity until February 2010. Mr. Zerr has served as Senior Vice President of Invesco Advisers, Inc., a registered investment adviser affiliated with the Managing Owner, since December 2009. Mr. Zerr serves as a Director, Vice President and Secretary of Invesco Investment Services, Inc., a registered transfer agency since May 2007. Mr. Zerr has served as Director, Senior Vice President, General Counsel and Secretary of a number of other Invesco Ltd. wholly-owned subsidiaries which service or serviced portions of Invesco Ltd.’s U.S. Retail business since May 2007 and since June 2010 with respect to certain Van Kampen entities engaged in the asset management business that were acquired by Invesco Ltd. from Morgan Stanley. In each of the foregoing positions Mr. Zerr is responsible for overseeing legal operations. In such capacity, Mr. Zerr also is responsible for overseeing the legal activities of the Invesco Funds. Mr. Zerr earned a BA degree in economics from Ursinus College. He graduated cum laude with a J.D. from Temple University School of Law. Mr. Zerr was listed as a principal of the Managing Owner on December 6, 2012.
Brian Hartigan (40) joined the Managing Owner in May 2015 as Global Head of ETF Investments. In his role, Mr. Hartigan manages the portfolio management function at the Managing Owner, with the Director of Portfolio Management reporting to him. Previously from June 2010 until May of 2015, Mr. Hartigan was the Head of Portfolio Management and Research for Invesco Capital Markets, Inc., the sponsor of unit investment trusts. In that role, he oversaw portfolio management of Invesco unit trusts. He earned his B.A. from the University of St. Thomas in Minnesota and an MBA in finance from DePaul University. He is a CFA charterholder and a member of the CFA Society of Chicago. Mr. Hartigan was listed as a principal and registered as an associated person of the Managing Owner on February 21, 2018 and May 29, 2018, respectively.
54
Invesco Group Services Inc., which is a wholly owned, indirect subsidiary of Invesco Ltd., has been a principal of the Managing Owner since September 27, 2018 and has periodically been listed with NFA as a principal of other NFA members since May 17, 1990.
Code of Ethics
The Fund has no officers or employees and is managed by Invesco Capital Management LLC. Invesco Capital Management LLC has adopted a code of ethics which applies to all of its employees and is available on request, free of charge, by calling1-800-983-0903 Monday through Friday, 8:00 a.m. to 5:00 p.m. Central Time.
| ITEM 11. | EXECUTIVE COMPENSATION |
The Fund has no employees, officers or directors. The Managing Owner receives a monthly Management Fee of 1/12th of 0.75% per annum of the daily NAV of the Fund at the end of each month.
For the year ended December 31, 2018, the Fund has incurred Management Fees of $2,940,887 of which $2,766,908 had been paid at December 31, 2018. Management Fees of $173,979 were unpaid at December 31, 2018 and are reported as a liability on the Statements of Financial Condition.
For the year ended December 31, 2018, the Fund has incurred brokerage commissions of $269,338 of which $264,711 had been paid at December 31, 2018. Brokerage commissions of $4,627 were unpaid at December 31, 2018 and are reported as a liability on the Statements of Financial Condition.
For the year ended December 31, 2017, the Fund has incurred Management Fees of $2,939,104 of which $2,730,024 had been paid at December 31, 2017. Management Fees of $209,080 were unpaid at December 31, 2017 and are reported as a liability on the Statements of Financial Condition.
For the year ended December 31, 2017, the Fund has incurred brokerage commissions of $83,769 of which $79,326 had been paid at December 31, 2017. Brokerage commissions of $4,443 were unpaid at December 31, 2017 and are reported as a liability on the Statements of Financial Condition.
For the year ended December 31, 2016, the Fund has incurred Management Fees of $3,295,092 of which $3,006,695 had been paid at December 31, 2016. Management Fees of $288,397 were unpaid at December 31, 2016 and are reported as a liability on the Statements of Financial Condition.
For the year ended December 31, 2016, the Fund has incurred brokerage commissions of $98,360 of which $93,466 had been paid at December 31, 2016. Brokerage commissions of $4,894 were unpaid at December 31, 2016 and are reported as a liability on the Statements of Financial Condition.
| ITEM 12. | SECURITY OWNERSHIP OF CERTAIN BENEFICIAL OWNERS AND MANAGEMENT AND RELATED STOCKHOLDER MATTERS |
The Fund has no officers or directors. The following table sets forth certain information regarding beneficial ownership of the Fund’s General Shares and Shares as of January 31, 2019, as known by management. No person is known by the Managing Owner to own beneficially more than 5% of the outstanding shares of such class.
Title of Class | Name and Address of Beneficial Owner | Amount and Nature of Beneficial Ownership | Percent of Class | |||||||
General Shares | Invesco Capital Management LLC 3500 Lacey Road, Suite 700 Downers Grove, Illinois 60515 | 40 | 100 | % | ||||||
Shares | Directors and Officers of Invesco Capital Management LLC as a group | — | Less than 0.01 | % | ||||||
The Fund has no securities authorized for issuance under equity compensation plans.
| ITEM 13. | CERTAIN RELATIONSHIPS AND RELATED TRANSACTIONS, AND DIRECTOR INDEPENDENCE |
See Item 11.
55
| ITEM 14. | PRINCIPAL ACCOUNTANT FEES AND SERVICES |
Audit andNon-Audit Fees
The following table sets forth the fees for professional services rendered by PricewaterhouseCoopers LLP, the Fund’s independent registered public accounting firm for the years ended December 31, 2018 and 2017.
| Fiscal Years Ended December 31, | ||||||||
| 2018 | 2017 | |||||||
Audit Fees | $ | 78,660 | $ | 86,034 | ||||
Audit-Related Fees(1) | 2,100 | — | ||||||
Tax Fees(2) | 254,012 | 265,743 | ||||||
All Other Fees | — | — | ||||||
|
|
|
| |||||
Total | $ | 334,772 | $ | 351,777 | ||||
|
|
|
| |||||
| (1) | Audit-Related Fees for the fiscal year ended December 31, 2018 include fees billed for reviewing regulatory filings. |
| (2) | Tax Fees for the fiscal years ended December 31, 2018 and 2017 include fees billed for preparing tax forms. |
Approval of Independent Registered Public Accounting Firm Services and Fees
The Managing Owner approved all of the services provided by PricewaterhouseCoopers LLP to the Fund described above. The Managing Ownerpre-approved all audit and allowednon-audit services of the Fund’s independent registered public accounting firm, including all engagement fees and terms.
56
| ITEM 15. | EXHIBITS AND FINANCIAL STATEMENT SCHEDULES |
(a)(1) Financial Statements
See financial statements commencing on page 30 hereof.
(a)(2) Financial Statement Schedules
No financial statement schedules are filed herewith because (i) such schedules are not required or (ii) the information required has been presented in the aforementioned financial statements.
(a)(3) Exhibits
The following documents (unless otherwise indicated) are filed herewith and made a part of this Annual Report:
Exhibit No. | Description | |
| 4.1 | Fifth Amended and Restated Declaration of Trust and Trust Agreement of the Registrant1 | |
| 4.1.1 | Amendment No. 1 to the Fifth Amended and Restated Declaration of Trust and Trust Agreement of the Registrant2 | |
| 4.1.2 | Amendment No. 2 to the Fifth Amended and Restated Declaration of Trust and Trust Agreement of the Registrant3 | |
| 4.2 | Form of Participant Agreement4 | |
| 10.1 | Form of Customer Agreement5 | |
| 10.2 | Form of Administration Agreement4 | |
| 10.3 | Form of Global Custody Agreement4 | |
| 10.4 | Form of Transfer Agency and Service Agreement4 | |
| 10.5 | Distribution Services Agreement2 | |
| 31.1 | Certification required under Exchange Act Rules13a-14 and15d-14 (filed herewith) | |
| 31.2 | Certification required under Exchange Act Rules13a-14 and15d-14 (filed herewith) | |
| 32.1 | Certification of Principal Executive Officer pursuant to 18 U.S.C. Section 1350 as adopted pursuant to Section 906 of the Sarbanes-Oxley Act of 2002 (furnished herewith) | |
| 32.2 | Certification of Principal Financial Officer pursuant to 18 U.S.C. Section 1350 as adopted pursuant to Section 906 of the Sarbanes-Oxley Act of 2002 (furnished herewith) | |
| 101 | Interactive data file pursuant to Rule 405 of RegulationS-T: (i) the Statements of Financial Condition of Invesco DB Oil Fund — December 31, 2018 and December 31, 2017, (ii) the Schedule of Investments of Invesco DB Oil Fund — December 31, 2018, (iii) the Schedule of Investments of Invesco DB Oil Fund — December 31, 2017, (iv) the Statements of Income and Expenses of Invesco DB Oil Fund — Years Ended December 31, 2018, 2017 and 2016, (v) the Statement of Changes in Shareholders’ Equity of Invesco DB Oil Fund — Year Ended December 31, 2018, (vi) the Statement of Changes in Shareholders’ Equity of Invesco DB Oil Fund — Year Ended December 31, 2017, (vii) the Statement of Changes in Shareholders’ Equity of Invesco DB Oil Fund — Year Ended December 31, 2016, (viii) the Statements of Cash Flows of Invesco DB Oil Fund — Years Ended December 31, 2018, 2017 and 2016, and (ix) Notes to Financial Statements of Invesco DB Oil Fund. | |
| 1 | Previously filed as an exhibit to Form8-K on February 25, 2015 and incorporated herein by reference. |
| 2 | Previously filed as an exhibit to Form8-K on June 20, 2016 and incorporated herein by reference. |
| 3 | Previously filed as an exhibit to Form8-K on June 4, 2018 and incorporated herein by reference. |
| 4 | Previously filed as an exhibit toPre-Effective Amendment No. 2 to a Registration Statement on FormS-1 on December 14, 2006 and incorporated herein by reference. |
| 5 | Previously filed as an exhibit to Form8-K on February 26, 2015 and incorporated herein by reference. |
57
SIGNATURES
Pursuant to the requirements of the Securities Exchange Act of 1934, the Registrant has duly caused this report to be signed on its behalf by the undersigned, thereunto duly authorized.
| Invesco DB Multi-Sector Commodity Trust on its own behalf and with respect to Invesco DB Oil Fund | ||||||
| By: | Invesco Capital Management LLC, its Managing Owner | |||||
| By: | /s/ DANIEL DRAPER | |||||
| Name: | Daniel Draper | |||||
| Title: | Principal Executive Officer | |||||
| By: | /s/ KELLI GALLEGOS | |||||
| Name: | Kelli Gallegos | |||||
| Title: | Principal Financial and Accounting Officer, Investment Pools | |||||
| Dated: February 27, 2019 | ||||||
58
Exhibit 31.1
CERTIFICATION
I, Daniel Draper, certify that:
| 1. | I have reviewed this Annual Report on Form10-K of Invesco DB Oil Fund, a series of Invesco DB Multi-Sector Commodity Trust; |
| 2. | Based on my knowledge, this report does not contain any untrue statement of a material fact or omit to state a material fact necessary to make the statements made, in light of the circumstances under which such statements were made, not misleading with respect to the period covered by this report; |
| 3. | Based on my knowledge, the financial statements, and other financial information included in this report, fairly present in all material respects the financial condition, results of operations and cash flows of the registrant as of, and for, the periods presented in this report; |
| 4. | The registrant’s other certifying officer and I are responsible for establishing and maintaining disclosure controls and procedures (as defined in Exchange Act Rules 13a-15(e) and 15d-15(e)) and internal control over financial reporting (as defined in Exchange Act Rules 13a-15(f) and 15d-15(f)) for the registrant and have: |
| (a) | Designed such disclosure controls and procedures, or caused such disclosure controls and procedures to be designed under our supervision, to ensure that material information relating to the registrant, including its consolidated subsidiaries, is made known to us by others within those entities, particularly during the period in which this report is being prepared; |
| (b) | Designed such internal control over financial reporting, or caused such internal control over financial reporting to be designed under our supervision, to provide reasonable assurance regarding the reliability of financial reporting and the preparation of financial statements for external purposes in accordance with generally accepted accounting principles; |
| (c) | Evaluated the effectiveness of the registrant’s disclosure controls and procedures and presented in this report our conclusions about the effectiveness of the disclosure controls and procedures, as of the end of the period covered by this report based on such evaluation; and |
| (d) | Disclosed in this report any change in the registrant’s internal control over financial reporting that occurred during the registrant’s most recent fiscal quarter (the registrant’s fourth fiscal quarter in the case of an annual report) that has materially affected, or is reasonably likely to materially affect, the registrant’s internal control over financial reporting; and |
| 5. | The registrant’s other certifying officer and I have disclosed, based on our most recent evaluation of internal control over financial reporting, to the registrant’s auditors and the audit committee of the registrant’s board of directors (or persons performing the equivalent functions): |
| (a) | All significant deficiencies and material weaknesses in the design or operation of internal control over financial reporting which are reasonably likely to adversely affect the registrant’s ability to record, process, summarize and report financial information; and |
| (b) | Any fraud, whether or not material, that involves management or other employees who have a significant role in the registrant’s internal control over financial reporting. |
| Dated: February 27, 2019 | /s/ Daniel Draper | |||||
Daniel Draper | ||||||
Principal Executive Officer |
Exhibit 31.2
CERTIFICATION
I, Kelli Gallegos, certify that:
| 1. | I have reviewed this Annual Report on Form10-K of Invesco DB Oil Fund, a series of Invesco DB Multi-Sector Commodity Trust; |
| 2. | Based on my knowledge, this report does not contain any untrue statement of a material fact or omit to state a material fact necessary to make the statements made, in light of the circumstances under which such statements were made, not misleading with respect to the period covered by this report; |
| 3. | Based on my knowledge, the financial statements, and other financial information included in this report, fairly present in all material respects the financial condition, results of operations and cash flows of the registrant as of, and for, the periods presented in this report; |
| 4. | The registrant’s other certifying officer and I are responsible for establishing and maintaining disclosure controls and procedures (as defined in Exchange Act Rules 13a-15(e) and 15d-15(e)) and internal control over financial reporting (as defined in Exchange Act Rules 13a-15(f) and 15d-15(f)) for the registrant and have: |
| (a) | Designed such disclosure controls and procedures, or caused such disclosure controls and procedures to be designed under our supervision, to ensure that material information relating to the registrant, including its consolidated subsidiaries, is made known to us by others within those entities, particularly during the period in which this report is being prepared; |
| (b) | Designed such internal control over financial reporting, or caused such internal control over financial reporting to be designed under our supervision, to provide reasonable assurance regarding the reliability of financial reporting and the preparation of financial statements for external purposes in accordance with generally accepted accounting principles; |
| (c) | Evaluated the effectiveness of the registrant’s disclosure controls and procedures and presented in this report our conclusions about the effectiveness of the disclosure controls and procedures, as of the end of the period covered by this report based on such evaluation; and |
| (d) | Disclosed in this report any change in the registrant’s internal control over financial reporting that occurred during the registrant’s most recent fiscal quarter (the registrant’s fourth fiscal quarter in the case of an annual report) that has materially affected, or is reasonably likely to materially affect, the registrant’s internal control over financial reporting; and |
| 5. | The registrant’s other certifying officer and I have disclosed, based on our most recent evaluation of internal control over financial reporting, to the registrant’s auditors and the audit committee of the registrant’s board of directors (or persons performing the equivalent functions): |
| (a) | All significant deficiencies and material weaknesses in the design or operation of internal control over financial reporting which are reasonably likely to adversely affect the registrant’s ability to record, process, summarize and report financial information; and |
| (b) | Any fraud, whether or not material, that involves management or other employees who have a significant role in the registrant’s internal control over financial reporting. |
| Dated: February 27, 2019 | /s/ Kelli Gallegos | |||||
Kelli Gallegos | ||||||
Principal Financial and Accounting Officer, Investment Pools |
Exhibit 32.1
CERTIFICATION PURSUANT TO
18 U.S.C. SECTION 1350
AS ADOPTED PURSUANT TO
SECTION 906 OF THE SARBANES-OXLEY ACT OF 2002
The undersigned, Daniel Draper, Principal Executive Officer of Invesco Capital Management LLC, the Managing Owner of Invesco DB Oil Fund (the “Fund”), a series of Invesco DB Multi-Sector Commodity Trust, hereby certifies pursuant to 18 U.S.C. Section 1350, as adopted pursuant to Section 906 of the Sarbanes-Oxley Act of 2002, that:
| (1) | The Fund’s Annual Report on Form10-K for the year ended December 31, 2018, as filed with the Securities and Exchange Commission on the date hereof (the “Annual Report”), fully complies with the requirements of Section 13(a) or 15(d) of the Securities Exchange Act of 1934, as amended; |
| (2) | The information contained in the Annual Report fairly presents, in all material respects, the financial condition and results of operations of the Fund; |
| (3) | This certification accompanies the report to which it relates, is not deemed filed with the Securities and Exchange Commission and is not to be incorporated by reference into any filing of the Company under the Securities Act of 1933, as amended, or the Securities Exchange Act of 1934, as amended (whether made before or after the date of such report), irrespective of any general incorporation language contained in such filing. |
| Dated: February 27, 2019 | /s/ Daniel Draper | |||||
Daniel Draper | ||||||
Principal Executive Officer |
Exhibit 32.2
CERTIFICATION PURSUANT TO
18 U.S.C. SECTION 1350
AS ADOPTED PURSUANT TO
SECTION 906 OF THE SARBANES-OXLEY ACT OF 2002
The undersigned, Kelli Gallegos, Principal Financial and Accounting Officer, Investment Pools of Invesco Capital Management LLC, the Managing Owner of Invesco DB Oil Fund (the “Fund”), a series of Invesco DB Multi-Sector Commodity Trust, hereby certifies pursuant to 18 U.S.C. Section 1350, as adopted pursuant to Section 906 of the Sarbanes-Oxley Act of 2002, that:
| (1) | The Fund’s Annual Report on Form10-K for the year ended December 31, 2018, as filed with the Securities and Exchange Commission on the date hereof (the “Annual Report”), fully complies with the requirements of Section 13(a) or 15(d) of the Securities Exchange Act of 1934, as amended; |
| (2) | The information contained in the Annual Report fairly presents, in all material respects, the financial condition and results of operations of the Fund; |
| (3) | This certification accompanies the report to which it relates, is not deemed filed with the Securities and Exchange Commission and is not to be incorporated by reference into any filing of the Company under the Securities Act of 1933, as amended, or the Securities Exchange Act of 1934, as amended (whether made before or after the date of such report), irrespective of any general incorporation language contained in such filing. |
| Dated: February 27, 2019 | /s/ Kelli Gallegos | |||||
Kelli Gallegos | ||||||
Principal Financial and Accounting Officer, Investment Pools |
UNITED STATES
SECURITIES AND EXCHANGE COMMISSION
WASHINGTON, D.C. 20549
FORM10-K
| ☒ | ANNUAL REPORT PURSUANT TO SECTION 13 OR 15(d) OF THE SECURITIES EXCHANGE ACT OF 1934 |
For the fiscal year ended December 31, 2018
OR
| ☐ | TRANSITION REPORT PURSUANT TO SECTION 13 OR 15(d) OF THE SECURITIES EXCHANGE ACT OF 1934 |
For the transition period from to
Commission File Number:001-33244
INVESCO DB PRECIOUS METALS FUND
(A Series of Invesco DB Multi-Sector Commodity Trust)
(Exact name of Registrant as specified in its charter)
| Delaware | 87-0778065 | |
(State or Other Jurisdiction of Incorporation or Organization) | (I.R.S. Employer Identification No.) |
c/o Invesco Capital Management LLC 3500 Lacey Road, Suite 700 Downers Grove, Illinois | 60515 | |
| (Address of Principal Executive Offices) | (Zip Code) |
Registrant’s telephone number, including area code:(800) 983-0903
Securities registered pursuant to Section 12(b) of the Act:
Title of Each Class | Name of Each Exchange on Which Registered | |
| Common Units of Beneficial Interest | NYSE Arca, Inc. |
Securities registered pursuant to Section 12(g) of the Act: None
Indicate by check mark if the Registrant is a well-known seasoned issuer, as defined in Rule 405 of the Securities Act. Yes ☐ No ☒
Indicate by check mark if the Registrant is not required to file reports pursuant to Section 13 or Section 15(d) of the Act. Yes ☐ No ☒
Indicate by check mark whether the Registrant: (1) has filed all reports required to be filed by Section 13 or 15(d) of the Securities Exchange Act of 1934 during the preceding 12 months (or for such shorter period that the Registrant was required to file such reports), and (2) has been subject to such filing requirements for the past 90 days. Yes ☒ No ☐
Indicate by check mark whether the Registrant has submitted electronically every Interactive Data File required to be submitted pursuant to Rule 405 of RegulationS-T (§232.405 of this chapter) during the preceding 12 months (or for such shorter period that the Registrant was required to submit such files). Yes ☒ No ☐
Indicate by check mark if disclosure of delinquent filers pursuant to Item 405 of RegulationS-K (§229.405 of this chapter) is not contained herein, and will not be contained, to the best of Registrant’s knowledge, in definitive proxy or information statements incorporated by reference in Part III of this Form10-K or any amendment to this Form10-K. ☒
Indicate by check mark whether the Registrant is a large accelerated filer, an accelerated filer, anon-accelerated filer, a smaller reporting company, or an emerging growth company. See the definitions of “large accelerated filer,” “accelerated filer,” “smaller reporting company,” and “emerging growth company” in Rule12b-2 of the Exchange Act.
| Large Accelerated Filer | ☐ | Accelerated Filer | ☒ | |||
| Non-Accelerated Filer | ☐ | Smaller reporting company | ☐ | |||
| Emerging growth company | ☐ | |||||
If an emerging growth company, indicate by check mark if the registrant has elected not to use the extended transition period for complying with any new or revised financial accounting standards provided pursuant to Section 13(a) of the Exchange Act. ☐
Indicate by check mark whether the Registrant is a shell company (as defined in Rule12b-2 of the Exchange Act). Yes ☐ No ☒
State the market value of the voting andnon-voting common equity held bynon-affiliates computed by reference to the price at which the common equity was last sold, or the average bid and asked price of such common equity, as of the last business day of the Registrant’s most recently completed second fiscal quarter: $132,012,000
Number of Common Units of Beneficial Interest outstanding as of January 31, 2019: 3,800,000
TABLE OF CONTENTS
i
CAUTIONARY STATEMENT CONCERNING FORWARD-LOOKING INFORMATION
This Report includes forward-looking statements within the meaning of Section 27A of the Securities Act of 1933, as amended (the “Securities Act”), and Section 21E of the Securities Exchange Act of 1934, as amended (the “Exchange Act”), that involve substantial risks and uncertainties. The matters discussed throughout this Report that are not historical facts are forward-looking statements. These forward-looking statements are based on the Fund’s and Invesco Capital Management LLC’s (the “Managing Owner”) current expectations, estimates and projections about the future results, performance, prospects and opportunities of the Fund and the Fund’s business and industry and their beliefs and assumptions about future events and speak only as of the date on which they are made. Words such as “anticipate,” “expect,” “intend,” “plan,” “believe,” “seek,” “outlook” and “estimate,” as well as similar words and phrases, signify forward-looking statements. Forward-looking statements are not guarantees of future results. Conditions and important factors, risks and uncertainties in the markets for financial instruments that the Fund trades, in the markets for related physical commodities, in the legal and regulatory regimes applicable to the Managing Owner, the Fund, and the Fund’s service providers, and in the broader economy may cause actual results to differ materially from those expressed by such forward-looking statements. These forward-looking statements are subject to a number of risks, uncertainties and other factors including, but not limited to, those described in this Report, including in Part I, Item 1A. “Risk Factors” and Part II, Item 7, “Management’s Discussion and Analysis of Financial Condition and Results of Operation” (“MD&A”), and other Securities and Exchange Commission (“SEC”) filings by the Fund that could cause the actual results, performance, prospects or opportunities of the Fund to differ materially from those expressed in, or implied by, these forward-looking statements.
You should not place undue reliance on any forward-looking statements. Except as expressly required by the Federal securities laws, the Fund and Managing Owner undertake no obligation to publicly update or revise any forward-looking statements or the risks, uncertainties or other factors described in this Report, as a result of new information, future events or changed circumstances or for any other reason after the date of this Report.
ii
Introduction
Invesco DB Precious Metals Fund (the “Fund”), a separate series of Invesco DB Multi-Sector Commodity Trust (the “Trust”), a Delaware statutory trust organized in seven separate series, was formed on August 3, 2006. The term of the Fund is perpetual (unless terminated earlier in certain circumstances) as provided for in the Fifth Amended and Restated Declaration of Trust and Trust Agreement of the Fund, as amended (the “Trust Agreement”). The Fund has an unlimited number of shares authorized for issuance.
Invesco Capital Management LLC (“Invesco”) has served as the managing owner (the “Managing Owner”), commodity pool operator and commodity trading advisor of the Fund since February 23, 2015. The Managing Owner holds 40 general shares (the “General Shares”) of the Fund. The fiscal year end of the Fund is December 31st.
The Fund seeks to track changes, whether positive or negative, in the level of the DBIQ Optimum Yield Precious Metals Index Excess Return™ (the “Index”) over time, plus the excess, if any, of the sum of the Fund’s interest income from its holdings of United States Treasury Obligations (“Treasury Income”), dividends from its holdings in money market mutual funds (affiliated or otherwise) (“Money Market Income”) and dividends or distributions of capital gains from its holdings ofT-Bill ETFs (as defined below)(“T-Bill ETF Income”) over the expenses of the Fund. The Fund invests in futures contracts in an attempt to track its Index. The Index is intended to reflect the change in market value of the precious metals sector. The commodities comprising the Index are gold and silver (each an “Index Commodity”, and collectively, the “Index Commodities”).
The Fund may invest directly in United States Treasury Obligations. The Fund may also gain exposure to United States Treasury Obligations through investments in exchange-traded funds (“ETFs”) (affiliated or otherwise) that track indexes that measure the performance of United States Treasury Obligations with a maximum remaining maturity of up to 12 months(“T-Bill ETFs”). The Fund invests in United States Treasury Obligations, money market mutual funds andT-Bill ETFs (affiliated or otherwise), if any, for margin and/or cash management purposes.
The Commodity Futures Trading Commission (the “CFTC”) and certain futures exchanges impose position limits on futures contracts that reference Index Commodities (the “Index Contracts”). As the Fund approaches or reaches position limits with respect to an Index Commodity, the Fund may commence investing in Index Contracts that reference other Index Commodities. In those circumstances, the Fund may also trade in futures contracts based on commodities other than Index Commodities that the Managing Owner reasonably believes tend to exhibit trading prices that correlate with an Index Contract. In addition, the Managing Owner may determine to invest in other futures contracts if at any time it is impractical or inefficient to gain full or partial exposure to an Index Commodity through the use of Index Contracts. These other futures contracts may or may not be based on an Index Commodity. When they are not, the Managing Owner may seek to select futures contracts that it reasonably believes tend to exhibit trading prices that correlate with an Index Contract.
The Fund offers common units of beneficial interest (the “Shares”) only to certain eligible financial institutions (the “Authorized Participants”) in one or more blocks of 200,000 Shares (“Basket”). The Fund commenced investment operations on January 3, 2007. The Fund commenced trading on the American Stock Exchange (which became the NYSE Alternext US LLC (the “NYSE Alternext”)) on January 5, 2007 and, since November 25, 2008, has been listed on the NYSE Arca, Inc. (the “NYSE Arca”).
Index Description
The Managing Owner pays Deutsche Investment Management Americas Inc. (the “Index Sponsor”) a licensing fee and an index services fee for performing its duties.
These fees constitute a portion of the routine operational, administrative and other ordinary expenses which are paid out of the management fee paid to the Managing Owner (“Management Fee”) and are not charged to or reimbursed by the Fund.
Neither the Managing Owner nor any affiliate of the Managing Owner has any rights to influence the selection of the futures contracts underlying the Index. The Managing Owner has entered into a license agreement with the Index Sponsor to use the Index.
1
The Fund is not sponsored or endorsed by Deutsche Bank AG, Deutsche Investment Management Americas Inc. or any subsidiary or affiliate of Deutsche Bank AG or Deutsche Investment Management Americas Inc. (collectively, “Deutsche Bank”). The DBIQ Optimum Yield Precious Metals Index Excess Return™ (the“DBIQ-OY Precious Metals TR™”, or the “Index”) is the exclusive property of Deutsche Investment Management Americas Inc. “DBIQ” and “Optimum Yield” are service marks of Deutsche Bank AG and have been licensed for use for certain purposes by Deutsche Investment Management Americas Inc. Neither Deutsche Bank nor any other party involved in, or related to, making or compiling the Index makes any representation or warranty, express or implied, concerning the Index, the Fund or the advisability of investing in securities generally. Neither Deutsche Bank nor any other party involved in, or related to, making or compiling the Index has any obligation to take the needs of the Managing Owner or its clients into consideration in determining, composing or calculating the Index. Neither Deutsche Bank nor any other party involved in, or related to, making or compiling the Index is responsible for or has participated in the determination of the timing of, prices at, quantities or valuation of the Fund. Neither Deutsche Bank nor any other party involved in, or related to, making or compiling the Index has any obligation or liability in connection with the administration or trading of the Fund.
NEITHER DEUTSCHE BANK NOR ANY OTHER PARTY INVOLVED IN, OR RELATED TO, MAKING OR COMPILING THE INDEX, WARRANTS OR GUARANTEES THE ACCURACY AND/OR THE COMPLETENESS OF THE INDEX OR ANY DATA INCLUDED THEREIN AND SHALL HAVE NO LIABILITY FOR ANY ERRORS, OMISSIONS, OR INTERRUPTIONS THEREIN. NEITHER DEUTSCHE BANK NOR ANY OTHER PARTY INVOLVED IN, OR RELATED TO, MAKING OR COMPILING THE INDEX, MAKES ANY WARRANTY, EXPRESS OR IMPLIED, AS TO RESULTS TO BE OBTAINED BY INVESCO CAPITAL MANAGEMENT LLC FROM THE USE OF THE INDEX OR ANY DATA INCLUDED THEREIN. NEITHER DEUTSCHE BANK NOR ANY OTHER PARTY INVOLVED IN, OR RELATED TO, MAKING OR COMPILING THE INDEX, MAKES ANY EXPRESS OR IMPLIED WARRANTIES, AND EXPRESSLY DISCLAIMS ALL WARRANTIES, OF MERCHANTABILITY OR FITNESS FOR A PARTICULAR PURPOSE OR USE WITH RESPECT TO THE INDEX OR ANY DATA INCLUDED THEREIN. WITHOUT LIMITING ANY OF THE FOREGOING, IN NO EVENT SHALL DEUTSCHE BANK OR ANY OTHER PARTY INVOLVED IN, OR RELATED TO, MAKING OR COMPILING THE INDEX HAVE ANY LIABILITY FOR DIRECT, INDIRECT, PUNITIVE, SPECIAL, CONSEQUENTIAL OR ANY OTHER DAMAGES OR LOSSES (INCLUDING LOST PROFITS), EVEN IF NOTIFIED OF THE POSSIBILITY THEREOF. EXCEPT AS EXPRESSLY PROVIDED TO THE CONTRARY, THERE ARE NO THIRD PARTY BENEFICIARIES OF ANY AGREEMENTS OR ARRANGEMENTS BETWEEN DEUTSCHE BANK AND INVESCO CAPITAL MANAGEMENT LLC.
No purchaser, seller or holder of the Shares of this Fund, or any other person or entity, should use or refer to any Deutsche Bank trade name, trademark or service mark to sponsor, endorse, market or promote this Fund without first contacting Deutsche Bank to determine whether Deutsche Bank’s permission is required. Under no circumstances may any person or entity claim any affiliation with Deutsche Bank without the written permission of Deutsche Bank.
The Index Sponsor may fromtime-to-time subcontract the provision of the calculation and other services described below to one or more third parties. The Index is composed of notional amounts of each of the underlying Index Commodities. The notional amount of each Index Commodity included in the Index is intended to reflect the changes in market value of each such Index Commodity within the Index. The closing level of the Index is calculated on each business day by the Index Sponsor based on the closing price of the commodity futures contracts for each of the Index Commodities and the notional amount of such Index Commodity.
The Index is rebalanced annually in November to ensure that each of the Index Commodities is weighted in the same proportion that such Index Commodities were weighted on December 2, 1988. The composition of the Index may be adjusted in the event that the Index Sponsor is not able to calculate the closing prices of the Index Commodities.
The following table reflects the Fund weights of each Index Commodity, or related futures contracts, as applicable, as of December 31, 2018:
Index Commodity | Fund Weight (%) | |||
Gold | 79.56 | % | ||
Silver | 20.44 | |||
|
| |||
Closing Level as at December 31, 2018: | 100.00 | % | ||
|
| |||
Please see http://www.invesco.com/ETFs with respect to the most recently available weighted composition of the Fund and the composition of the Index.
The composition of the Index may be adjusted in the event that the Index Sponsor is not able to calculate the closing prices of the Index Commodities.
2
The Index includes provisions for the replacement of futures contracts as they approach maturity. This replacement takes place over a period of time in order to lessen the impact on the market for the futures contracts being replaced. With respect to each Index Commodity, the Fund employs a rule-based approach when it ‘rolls’ from one futures contract to another.
Rather than select a new futures contract based on a predetermined schedule (e.g., monthly), each Index Commodity rolls from one contract to another futures contract that is intended to generate the most favorable ‘implied roll yield’ under prevailing market conditions. Where there is an upward-sloping price curve for futures contracts, the implied roll yield is expected to be negative. The selection of a new futures contract on the Index Commodity in such market conditions is designed to minimize the impact of negative roll yield. Conversely, where there is a downward-sloping price curve for futures contracts, the implied roll yield is expected to be positive. The selection of a new futures contract on the Index Commodity in such market conditions is designed to maximize the impact of positive roll yield. The Index takes the impact of implied roll yield into consideration by selecting, as the replacement for an expiring futures contract, the futures contract with a delivery month within the next thirteen months that generates the most favorable implied roll yield under the current market conditions.
The market condition in which the Index is designed to maximize the effect of positive roll yield when entering into new futures contracts is called backwardation. Backwardation exists when prices are higher for contracts with shorter-term expirations than those with longer-term expirations, a condition that is typically associated with commodities that are consumed quickly instead of being put in storage. Rolling in a backwardated market will tend to enhance returns from futures trading. The market condition in which the Index is designed to mitigate the effect of negative roll yield when entering into new futures contracts is called contango. Contango exists when contract prices are higher in distant delivery months than in nearer delivery months, typically due to costs associated with storing a given physical commodity for a longer period. Rolling in a contangoed market will tend to cause a drag on returns from futures trading. Returns from futures trading are called excess return, which is the combined return based on the spot prices of Index Commodities and the roll yield from trading futures contracts on Index Commodities.
The Index is calculated in USD on an excess return (unfunded) basis, which means that the Index reflects the return associated with spot prices for Index Commodities and the roll yield associated with trading futures contracts on Index Commodities. The Fund also invests in securities that are expected to generate income, including Treasury Securities, money market mutual funds, andT-Bill ETFs. These securities are held with the Custodian. In addition, Treasury Securities for deposit may be held with the Commodity Broker as margin for the Fund’s futures positions. The Index does not reflect any corresponding income characteristics.
The futures contract price for each Index Commodity will be the exchange closing price for such Index Commodity on a day on which the appropriate exchange is open for business (the “Index Business Days”). If a weekday is not an Exchange Business Day (as defined in the following sentence) but is an Index Business Day, the exchange closing price from the previous Index Business Day will be used for each Index Commodity. “Exchange Business Day” means, in respect of an Index Commodity, a day that is a trading day for such Index Commodity on the relevant exchange (unless either an Index disruption event or force majeure event has occurred).
On the first Index Business Day of each month (the “Verification Date”), each Index Commodity futures contract will be tested in order to determine whether to continue including it in the Index. If the Index Commodity futures contract requires delivery of the underlying commodity in the next month, known as the Delivery Month, a new Index Commodity futures contract will be selected for inclusion in the Index. For example, if the first Index Business Day is May 1 of the current year, and the Delivery Month of the Index Commodity futures contract currently in the Index is June of the current year, a new Index Commodity futures contract with a later Delivery Month will be selected.
For each underlying Index Commodity in the Index, the new Index Commodity futures contract selected will be the Index Commodity futures contract with the best possible “implied roll yield” based on the closing price for each eligible Index Commodity futures contract. Eligible Index Commodity futures contracts are any Index Commodity futures contracts having a Delivery Month (i) no sooner than the month after the Delivery Month of the Index Commodity futures contract currently in the Index, and (ii) no later than the thirteenth month after the Verification Date. For example, if the first Index Business Day is May 1 of the current year and the Delivery Month of an Index Commodity futures contract currently in the Index is June of the current year, the Delivery Month of an eligible new Index Commodity futures contract must be between July of the current year and June of the following year. The implied roll yield is then calculated and the futures contract on the Index Commodity with the best possible implied roll yield under the current market conditions is then selected. If two futures contracts have the same implied roll yield, the futures contract with the minimum number of months prior to the Delivery Month is selected.
After the futures contract selection, the monthly roll for each Index Commodity subject to a roll in that particular month unwinds the old futures contract and enters a position in the new futures contract. This takes place between the second and sixth Index Business Day of the month.
On each day during the roll period, new notional holdings are calculated. The calculations for the futures contracts on the old Index Commodities that are leaving the Index and the futures contracts on the new Index Commodities are then calculated.
On all days that are not monthly index roll days, the notional holdings of each Index Commodity future remains constant.
The Index isre-weighted on an annual basis on the sixth Index Business Day of each November.
3
The calculation of the Index is expressed as the weighted average return of the Index Commodities.
The Trustee
Under the Trust Agreement, Wilmington Trust Company, the trustee of the Fund (the “Trustee”), has the power and authority to execute and file certificates as required by the Delaware Statutory Trust Act and to accept service of process on the Fund in the State of Delaware. The Managing Owner has the exclusive management and control of all aspects of the business of the Fund. The Trustee will serve in that capacity until such time as the Managing Owner removes the Trustee or the Trustee resigns and a successor is appointed by the Managing Owner. The Trustee will have no duty or liability to supervise or monitor the performance of the Managing Owner, nor will the Trustee have any liability for the acts or omissions of the Managing Owner.
The Managing Owner
The Managing Owner was formed on February 7, 2003. The Managing Owner is an affiliate of Invesco Ltd. The Managing Owner was formed to be the managing owner of investment vehicles such as ETFs and has been managingnon-commodity futures based ETFs since 2003 and a commodity futures based ETF since 2014. The Managing Owner serves as the commodity pool operator and commodity trading advisor of the Fund. The Managing Owner is registered as a commodity pool operator and commodity trading advisor with the CFTC and is a member of, and approved as a swap firm by, the National Futures Association (the “NFA”). As a registered commodity pool operator and commodity trading advisor, with respect to the Fund, the Managing Owner must comply with various regulatory requirements under the Commodity Exchange Act of 1936, as amended (the “Commodity Exchange Act”) and the rules and regulations of the CFTC and the NFA, including investor protection requirements, antifraud prohibitions, disclosure requirements, and reporting and recordkeeping requirements. The Managing Owner also is subject to periodic inspections and audits by the CFTC and NFA.
The Managing Owner’s main business offices are located at 3500 Lacey Road, Suite 700, Downers Grove, Illinois 60515, and its telephone number is(800) 983-0903.
The Fund pays the Managing Owner the Management Fee, monthly in arrears, in an amount equal to 0.75% per annum of the daily net asset value (“NAV”) of the Fund.
The Fund may, for margin and/or cash management purposes, invest in money market mutual funds and/orT-Bill ETFs that are managed by affiliates of the Managing Owner. The indirect portion of the management fee that the Fund may incur through such investment is in addition to the Management Fee paid to the Managing Owner. The Managing Owner has contractually agreed to waive indefinitely the fees that it receives in an amount equal to the indirect management fees that the Fund incurs through its investments in affiliated money market mutual funds and/or affiliatedT-Bill ETFs. The Managing Owner may terminate this fee waiver on 60 days notice.
Pursuant to the Trust Agreement, the Fund will indemnify the Managing Owner against any losses, judgments, liabilities, expenses and amounts paid in settlement of any claims sustained by it in connection with its activities on behalf of the Fund incurred, except for any expenses resulting from gross negligence or willful misconduct.
The Commodity Broker
Morgan Stanley & Co. LLC, a Delaware limited liability company, serves as the Fund’s futures clearing broker (the “Commodity Broker”). The Commodity Broker is registered with the CFTC as a futures commission merchant and is a member of the NFA in such capacity.
A variety of executing brokers execute futures transactions on behalf of the Fund. Such executing brokersgive-up all such transactions to the Commodity Broker. In its capacity as clearing broker, the Commodity Broker may execute or receive transactions executed by others and clears all of the Fund’s futures transactions and performs certain administrative and custodial services for the Fund. The Commodity Broker is responsible, among other things, for providing periodic accountings of all dealings and actions taken by the Fund during the reporting period, together with an accounting of all securities, cash or other indebtedness or obligations held by it or its nominees for or on behalf of the Fund.
The Fund pays the Commodity Broker all brokerage commissions, including applicable exchange fees, NFA fees,give-up fees, pit brokerage fees and other transaction related fees and expenses charged in connection with trading activities. The Commodity Broker’s brokerage commissions and trading fees are determined on acontract-by-contract basis. Brokerage commissions and fees in any future fiscal year or any part of any future fiscal year may be greater than fees incurred in prior fiscal years. On average, total charges paid to the Commodity Broker were less than $6.00, $6.00 and $6.00 per round-turn trade1 for the years ended December 31, 2018, 2017 and 2016, respectively.
| 1 | A round-turn trade is a completed transaction involving both a purchase and a liquidating sale, or a sale followed by a covering purchase. |
4
The Administrator, Custodian and Transfer Agent
The Bank of New York Mellon (the “Administrator,” “Custodian” and “Transfer Agent”) is the administrator, custodian and transfer agent of the Fund. The Fund and the Administrator have entered into separate administrative, custodian, transfer agency and service agreements (collectively referred to as the “Administration Agreement”).
The Bank of New York Mellon, a banking corporation organized under the laws of the State of New York with trust powers, has an office at 2 Hanson Place, Brooklyn, New York, 11217. The Bank of New York Mellon is subject to supervision by the New York State Department of Financial Services and the Board of Governors of the Federal Reserve System.
Pursuant to the Administration Agreement, the Administrator performs or supervises the performance of services necessary for the operation and administration of the Fund (other than making investment decisions), including receiving and processing orders from Authorized Participants to create and redeem Baskets, NAV calculations, accounting and other fund administrative services. The Administrator maintains certain financial books and records, including: Basket creation and redemption records; fund accounting records; ledgers with respect to assets, liabilities, capital, income and expenses; the registrar, transfer journals and related details; and trading and related documents received from the Commodity Broker. The Managing Owner pays the Administrator administrative services fees out of the Management Fee.
The Distributor
Invesco Distributors, Inc. is the Fund’s distributor (the “Distributor”). Pursuant to the Distribution Services Agreement among the Managing Owner, the Fund and the Distributor, the Distributor assists the Managing Owner and the Administrator with certain functions and duties relating to distribution and marketing services to the Fund including reviewing and approving marketing materials. Prior to June 20, 2016, ALPS Distributors, Inc. provided distribution services to the Fund.
The Distribution Services Agreement is terminable without penalty on sixty days written notice by the Managing Owner or by the Distributor. The Distribution Services Agreement will automatically terminate in the event of its assignment.
Pursuant to the Distribution Services Agreement, the Fund will indemnify and hold harmless the Distributor and each of its directors and officers and each person, if any, who controls the Distributor within the meaning of Section 15 of the Securities Act, against any loss, liability, claim, damages or expenses (including the reasonable cost of investigating or defending any alleged loss, liability, claim, damages or expense and reasonable counsel fees incurred in connection therewith) arising by reason of any person acquiring any Shares, based upon the ground that the registration statement, prospectus, statement of additional information, shareholder reports or other information filed or made public by the Fund (as fromtime-to-time amended) included an untrue statement of a material fact or omitted a material fact required to be stated or necessary in order to make the statements therein not misleading under the Securities Act or any other statute or the common law.
The Managing Owner pays the Distributor a distribution fee out of the Management Fee.
Index Sponsor
The Managing Owner, on behalf of the Fund, has appointed Deutsche Investment Management Americas Inc. to serve as the index sponsor (the “Index Sponsor”). The Index Sponsor calculates and publishes the daily index levels and the indicative intraday index levels. Additionally, the Index Sponsor also calculates the indicative value per Share of the Fund throughout each business day.
The Managing Owner pays the Index Sponsor a licensing fee and an index services fee out of the Management Fee for performing its duties.
Marketing Agent
The Managing Owner, on behalf of the Fund, has appointed Deutsche Investment Management Americas Inc. as the marketing agent (the “Marketing Agent”) to assist the Managing Owner by providing support to educate institutional investors about the DBIQ indices and to complete governmental or institutional due diligence questionnaires or requests for proposals related to the DBIQ indices.
The Managing Owner pays the Marketing Agent a marketing services fee out of the Management Fee.
The Marketing Agent will not open or maintain customer accounts or handle orders for the Fund. The Marketing Agent has no responsibility for the performance of the Fund or the decisions made or actions taken by the Managing Owner.
5
Tax Reporting
The Fund has retained the services of PricewaterhouseCoopers LLP to assist with certain tax reporting requirements of the Fund and its Shareholders.
Regulation
Futures exchanges in the United States are subject to regulation under the Commodity Exchange Act by the CFTC, the governmental agency having responsibility for regulation of futures exchanges and trading on those exchanges.
The Commodity Exchange Act and the CFTC also regulate the activities of “commodity trading advisors” and “commodity pool operators” and the CFTC has adopted regulations with respect to certain of such persons’ activities. Pursuant to its authority, the CFTC requires a commodity pool operator (such as the Managing Owner) to keep accurate, current and orderly records with respect to each pool it operates. The CFTC may suspend the registration of a commodity pool operator if the CFTC finds that the operator has violated the Commodity Exchange Act or regulations thereunder and in certain other circumstances. Suspension, restriction or termination of the Managing Owner’s registration as a commodity pool operator would prevent it, until such time (if any) as such registration were to be reinstated, from managing, and might result in the termination of, the Fund. The Commodity Exchange Act gives the CFTC similar authority with respect to the activities of commodity trading advisors, such as the Managing Owner. If the registration of a managing owner as a commodity trading advisor were to be terminated, restricted or suspended, the managing owner would be unable, until such time (if any) as such registration were to be reinstated, to render trading advice to the Fund. The Fund is not registered with the CFTC in any capacity.
The Commodity Exchange Act requires all “futures commission merchants,” such as the Commodity Broker, to meet and maintain specified fitness and financial requirements, to segregate customer funds from proprietary funds and account separately for all customers’ funds and positions, and to maintain specified books and records open to inspection by the staff of the CFTC.
The Commodity Exchange Act also gives the states certain powers to enforce its provisions and the regulations of the CFTC.
Shareholders are afforded certain rights for reparations under the Commodity Exchange Act. Shareholders may also be able to maintain a private right of action for certain violations of the Commodity Exchange Act. The CFTC has adopted rules implementing the reparation provisions of the Commodity Exchange Act which provide that any person may file a complaint for a reparations award with the CFTC for violation of the Commodity Exchange Act against a floor broker, futures commission merchant, introducing broker, commodity trading advisor, commodity pool operator, and their respective associated persons.
Pursuant to authority in the Commodity Exchange Act, the NFA was formed and registered with the CFTC as a “registered futures association.” At the present time, the NFA is the onlynon-exchange self-regulatory organization for derivatives professionals. NFA members are subject to NFA standards relating to fair trade practices, market integrity, and consumer protection. As the self-regulatory body of the derivatives industry, the NFA promulgates rules governing the conduct of derivatives professionals and disciplines those professionals who do not comply with such standards. The CFTC has delegated to the NFA responsibility for the registration of commodity trading advisors, commodity pool operators, futures commission merchants, introducing brokers, and swap dealers, among others, and their respective associated persons, as applicable, and floor brokers. The Commodity Broker and the Managing Owner are members of the NFA (the Fund is not required to become a member of the NFA).
The CFTC has no authority to regulate trading on foreign futures exchanges and markets but permits direct access to such markets from the United States with respect to foreign boards of trade that are registered as such with the CFTC.
Employees
The Fund has no employees.
Available Information
The Fund files with or submits to the SEC annual, quarterly and current reports and other information meeting the informational requirements of the Exchange Act. These reports are available on the Managing Owner’s website athttp://www.invesco.com/ETFs. Information in the Managing Owner’s website shall not be deemed to be a part of this Report or incorporated by reference herein unless otherwise expressly stated. The SEC maintains an Internet site that contains reports, proxy and information statements and other information filed electronically by us with the SEC which are available on the SEC’s Internet site athttp://www.sec.gov.
The Fund also posts monthly performance reports and its annual report, as required by the CFTC, on the Managing Owner’s website at the address listed above.
6
| ITEM 1A. | RISK FACTORS |
An investment in Shares involves a high degree of risk. Investors should consider carefully all of the risks described below, together with the other information contained in this Annual Report on Form10-K (the “Report”) and the Fund’s Prospectus, before making a decision to invest in Shares. If any of the following risks occur, the business, financial condition and results of operations of the Fund may be adversely affected.
Market Risks
NAV May Not Always Correspond to Market Price and, as a Result, Baskets May Be Created or Redeemed at a Value that Differs from the Market Price of the Shares.
Shares may trade at, above or below their NAV. The NAV fluctuates with changes in the market value of the Fund’s assets. The trading price of Shares fluctuates in accordance with changes in the NAV, intraday changes in the value of the futures contracts and market supply and demand. The amount of the discount or premium in the trading price of the Shares relative to their NAV may be influenced bynon-concurrent trading hours between NYSE Arca (the exchange on which the Shares trade) and the exchanges on which futures contracts on the Index Commodities trade. While the Shares are expected to trade on NYSE Arca until 4:00 p.m. (Eastern time), liquidity in the markets for the futures contracts on the Index Commodities are expected to be reduced whenever the principal markets for those contracts are closed. As a result, trading spreads, and the resulting premium or discount on Shares, may widen during these gaps in market trading hours.
The NYSE Arca May Halt Trading in the Shares Which Would Adversely Impact Your Ability to Sell Shares.
The Shares are listed for trading on the NYSE Arca. Trading in Shares may be halted due to market conditions or in light of certain procedures and safeguards under NYSE Arca rules. In addition, trading is subject to trading halts caused by extraordinary market volatility pursuant to “circuit breaker” rules that require trading to be halted for a specified period based on a specified market decline. If the Fund were no longer to meet the requirements necessary to maintain the listing of its Shares, the Shares would be delisted. In such a scenario, the Fund would be terminated.
The Lack of an Active Trading Market for the Shares May Result in Losses on Your Investment at the Time of Disposition of Your Shares.
Although the Shares are listed and traded on the NYSE Arca, there can be no guarantee that an active trading market for the Shares will be maintained. If you need to sell your Shares at a time when no active market for them exists, the price you receive for your Shares, assuming that you are able to sell them, likely will be lower than the price you would receive if an active market did exist.
Volatility May Cause the Total Loss of Your Investment.
Futures contracts prices have a high degree of volatility and are subject to rapid and substantial changes. Consequently, there is a risk that the value of your investment in the Fund could decrease significantly due to rapid and substantial changes in the prices of futures contracts held by the Fund. The Index’s average annual volatility since inception is 15.33%. Average annual volatility is the average of the Index’s volatility each year since its inception. Yearly volatility is the relative rate at which the price of the Index moves up and down, found by calculating the annualized standard deviation of the daily change in price for each business day in the given year.
In addition, the Fund enters sell orders with the Commodity Broker from time to time, to liquidate Index Contract positions in order to satisfy redemption requests or to pay expenses and liabilities. The Fund is subject to the risk that temporary aberrations or distortions will occur in the market for Index Contracts at the time those orders are executed. The prices received by the Fund from the liquidation of its positions could be adversely affected, which in turn could adversely affect the value of the Shares. Those aberrations or distortions may result from trading activities by other market participants or actions taken by the Commodity Broker, the CFTC, the exchanges or other regulatory authorities. If the Fund’s positions are liquidated at inopportune times or in a manner that temporarily distorts the market or otherwise causes a pricing aberration, the value of the Shares may be adversely affected.
The Fund’s Trading of Index Contracts May Adversely Affect the Price that the Fund Pays for Index Contracts.
The prices that the Fund pays for Index Contracts may be adversely affected by the trading of Index Contracts by other market participants. Transactions by other market participants may be based on their awareness of the Fund’s positions in Index Contracts. If other market participants are able to anticipate the timing of the Fund’s Index Contract transactions, for instance, they may be able to execute transactions in advance of the Fund. If that were to occur, those market participants may receive more favorable pricing for their Index Contract transactions than the Fund does for its own, subsequent Index Contract transactions. If the Fund’s Index Contract positions represent a significant part of the open long interest in those Index Contracts, moreover, other market participants may take that fact into account and trade in a manner that adversely affects the prices that the Fund obtains when trading Index Contracts. The Fund may not be able to counteract adverse pricing effects of its own positions and transactions in Index Contracts.
7
Withdrawal from Participation by Authorized Participants May Affect the Liquidity of Shares.
If one or more Authorized Participants withdraws from participation, it may become more difficult to create or redeem Baskets, which may reduce the liquidity of the Shares. If it becomes more difficult to create or redeem Baskets, the correlation between the price of the Shares and the NAV may be affected, which may affect the trading market for the Shares. Having fewer participants in the market for the Shares could also adversely affect the ability to arbitrage any price difference between futures contracts and the Shares, which may also affect the trading market and liquidity of the Shares.
Possible Illiquid Markets May Exacerbate Losses.
Futures positions cannot always be liquidated at the desired price. It is difficult to execute a trade at a specific price when there is a relatively small volume of buy and sell orders in a market. A market disruption, such as when foreign governments may take or be subject to political actions which disrupt the markets in their currencies or major commodities exports, can also make it difficult to liquidate a position.
Illiquidity may cause losses for the Fund. The large size of the positions which the Fund may acquire increases the risk of illiquidity by both making its positions more difficult to liquidate and increasing the losses incurred while trying to do so.
Trading on Futures Exchanges Outside the United States Is Not Subject to U.S. Regulation.
Trading on futures exchanges located outside the United States is not regulated by any United States governmental agency and may involve certain risks not applicable to trading on U.S. exchanges, including different or diminished investor protections. If the Fund trades contracts denominated in currencies other than U.S. dollars, the Fund will be exposed to the risk of adverse exchange-rate movements between the dollar and the currencies in which those contracts are denominated.
In addition, trading onnon-U.S. exchanges is subject to the risks presented by exchange controls, expropriation, increased tax burdens and exposure to local economic declines and political instability, among other factors. An adverse development with respect to any of these factors could reduce the profit or increase the loss earned on the Fund’s trades onnon-U.S. exchanges.
The Effect of Market Disruptions and Government Interventions Are Unpredictable and May Have an Adverse Effect on the Value of Your Shares.
The commodity futures markets may be subject to temporary distortions due to various factors, including lack of liquidity, congestion, disorderly closing periods, manipulation and disruptive conduct, limitations on deliverable supplies, excessive speculation, government regulation and intervention, technical and operational or system failures, nuclear accidents, terrorism, riots and acts of God.
Government intervention has in certain cases been implemented on an “emergency” basis, suddenly and substantially eliminating market participants’ ability to continue to implement certain strategies or manage the risk of their outstanding positions. These interventions have typically been unclear in scope and application, resulting in confusion and uncertainty which in itself has been materially detrimental to the efficient functioning of the markets as well as previously successful investment strategies.
The financial crisis of 2008-2009 and associated regulatory changes, including the Dodd-Frank Wall Street Reform and Consumer Protection Act (the “Dodd Frank Act”) are generally considered to have contributed to less credit being available to financial market participants. This is particularly the case for credit extended by banks and other traditional lending sources. The Fund does not borrow from lenders for the purpose of pursuing its investment objective. Nonetheless, restrictions on the availability of credit may adversely affect investors who borrow to purchase Shares and participants in the markets for financial instruments in which the Fund trades, including futures markets. Limitations on the availability of credit, whether in stressed market conditions or otherwise, may have a material adverse effect on investors and financial market participants, which in turn could affect the Fund’s ability to pursue its investment objective. Among other things, fewer prospective investors may adversely affect the Fund’s asset levels, and fewer financial market participants may reduce liquidity and adversely affect pricing for the financial instruments that the Fund seeks to trade.
The Fund may incur major losses in the event of disrupted markets and other extraordinary events in which historical pricing relationships become materially distorted. The risk of loss from pricing distortions is compounded by the fact that in disrupted markets many positions become illiquid, making it difficult or impossible to close out or liquidate positions against which the markets are moving. The large size of the positions which the Fund may acquire increases the risk of illiquidity by both making its positions more difficult to liquidate and increasing the losses incurred while trying to do so.
An Investment in the Shares May Be Adversely Affected by Competition from Other Methods of Investing in Commodities.
The Fund competes with other financial vehicles, including mutual funds, and other investment companies, ETFs, other index tracking commodity pools, actively traded commodity pools, hedge funds, traditional debt and equity securities issued by companies
8
in the commodities industry, other securities backed by or linked to commodities, and direct investments in the underlying commodities or commodity futures contracts. Market and financial conditions, and other conditions beyond the Managing Owner’s control, may make it more attractive to invest in other financial vehicles or to invest in such commodities directly, which could limit the market for the Shares and therefore reduce the liquidity of the Shares.
The NAV Calculation of the Fund May Be Overstated or Understated Due to the Valuation Method Employed When a Settlement Price Is Not Available on the Date of NAV Calculation.
Calculating the NAV of the Fund includes, in part, any unrealized profits or losses on open commodity futures contracts. Under normal circumstances, the NAV of the Fund reflects the settlement price of open commodity futures contracts on the date when the NAV is being calculated. However, if a settlement price for a commodity futures contract could not be determined for any reason, the Managing Owner may value the futures contract pursuant to policies the Managing Owner has adopted. In such a situation, there is a risk that the resulting calculation of the Fund’s NAV could be understated or overstated, perhaps to a significant degree.
Futures Risks
Fluctuations in the Price of Assets Held by the Fund Could Have a Materially Adverse Effect on the Value of an Investment in Shares.
The Shares are designed to reflect as closely as possible the changes, positive or negative, in the level of the Index, over time, through the Fund’s portfolio of exchange-traded futures contracts on the Index Commodities. The value of the Shares relates directly to the value of the portfolio, less the liabilities (including estimated accrued but unpaid expenses) of the Fund. The price of the Index Commodities may fluctuate widely. Several factors may affect the prices of the Index Commodities, including, but not limited to:
| • | Global supply and demand of each of the Index Commodities, which may be influenced by such factors as forward selling by the various commodities producers, purchases made by the commodities’ producers to unwind their hedge positions and production and cost levels in the major markets of each of the Index Commodities; |
| • | Domestic and foreign interest rates and investors’ expectations concerning interest rates; |
| • | Domestic and foreign inflation rates and investors’ expectations concerning inflation rates; |
| • | Investment and trading activities of mutual funds, ETFs,closed-end funds, hedge funds and commodity funds; |
| • | Weather and other environmental conditions; |
| • | Acts of God; and |
| • | Global or regional political, economic or financial events and situations. |
Fewer Representative Commodities May Result in Greater Index Volatility.
The Index Commodities are gold and silver. Other commodity indexes may contain a larger number of commodities than the Index. Accordingly, increased volatility in a single Index Commodity is expected to have a greater impact on the Index’s overall volatility than would likely be the case with increased volatility in a single commodity within a broader index. Because the Fund tracks the performance of the Index, your investment in the Fund will be exposed to the relatively greater impact on the Index of volatility in a single Index Commodity.
Because the Futures Contracts Have No Intrinsic Value, the Positive Performance of Your Investment Is Wholly Dependent Upon an Equal and Offsetting Loss.
Trading in futures contracts transfers the risk of future price movements from one market participant to another. For every gain in futures trading, there is an equal and offsetting loss. Accordingly, whether a futures trade is profitable for one party depends on whether the price paid, value received, or cost of delivery under the related futures contract is favorable to that party. The prices of stocks, bonds, and other assets could rise significantly and the economy as a whole could prosper while the Fund experiences losses as a result of pursuing its investment objective through trading in Index Contracts.
9
The Fund May Not Provide a Diversification Benefit to Investments in Other Asset Classes and May Result in Additional Losses to Your Portfolio.
Historically, commodity futures returns have tended not to be correlated with the returns of other assets such as stocks and bonds. Commodity futures contracts therefore have the potential to help diversify investor portfolios consisting of stocks and bonds, to the extent there is low or negative correlation between commodity futures contracts and other financial assets held in those portfolios. However, the fact that the Index is not inversely correlated with other assets such as stocks and bonds means that, in seeking to replicate the performance of the Index, the Fund will not necessarily be profitable during unfavorable periods for the stock or bond markets. If the Shares perform in a manner that correlates with the stock or bond markets or otherwise do not perform successfully, the Shares may not provide any diversification from losses in those markets. In such a scenario, the Shares may produce no gains to offset losses from investments in stocks, bonds, or related assets and may result in additional investment losses.
The Fund’s Returns from Futures Trading Will Be Affected by Market Conditions When Replacing Expiring Futures Contracts with New Futures Contracts on Index Commodities.
The Fund’s returns from futures trading are called excess return, which is the combined return based on the spot prices of Index Commodities and the roll yield from trading Index Contracts. Market conditions at the time the Fund replaces expiring Index Contracts with new Index Contracts –i.e., when Index Contracts are “rolled” – will affect the Fund’s roll yield. Those market conditions are referred to as backwardation and contango, which will generally affect the Fund’s roll yield as set forth below:
| • | Rolling in a backwardated market will tend to enhance returns from futures trading. Backwardation exists when prices are higher for contracts with shorter-term expirations than those with longer-term expirations, a condition that is typically associated with commodities that are consumed quickly instead of being put in storage. |
| • | Rolling in a contangoed market will tend to cause a drag on returns from futures trading. Contango exists when contract prices are higher in distant delivery months than in nearer delivery months, typically due to costs associated with storing a given physical commodity for a longer period. |
In seeking to track the performance of the Index, therefore, the Fund will be exposed to the effects of backwardation and contango when it rolls its positions in Index Contracts. The Index uses the Optimum YieldTM rolling methodology, which seeks to maximize the roll benefits in backwardated markets and to minimize the losses from rolling in contangoed markets. There can be no assurance that these outcomes will be obtained. The impact of backwardation and contango may also cause the Fund’s performance to vary from the returns of other price references, including the spot prices of one or more Index Commodities.
Index Risks
The Fund’s Performance May Not Always Replicate the Changes in the Levels of its Index.
Tracking the Index requires trading of the Fund’s portfolio with a view to tracking the Index over time and is dependent upon the skills of the Managing Owner and its trading principals, among other factors. It is possible that the Fund’s performance may not fully replicate the changes in closing levels of the Index due to disruptions in the markets for the relevant Index Commodities, the imposition of speculative position limits, or due to other extraordinary circumstances. The Managing Owner may determine to invest in other futures contracts if at any time it is impractical or inefficient to gain full or partial exposure to an Index Commodity through the use of Index Contracts. These other futures contracts may or may not be based on an Index Commodity. When they are not, the Managing Owner may seek to select futures contracts that it reasonably believes tend to exhibit trading prices that correlate with an Index Contract. As the Fund approaches or reaches position limits with respect to an Index Commodity, the Fund may commence investing in Index Contracts that reference other Index Commodities. In those circumstances, the Fund may also trade in futures contracts based on commodities other than Index Commodities that the Managing Owner reasonably believes tend to exhibit trading prices that correlate with an Index Contract. In addition, the Fund may not be able to replicate the changes in levels of the Index because the total return generated by the Fund is reduced by expenses and transaction costs, including those incurred in connection with the Fund’s trading activities, and increased by, as applicable, Treasury Income, Money Market Income andT-Bill ETF Income.
The Fund Is Not Actively Managed and Tracks the Index During Periods in Which the Index Is Flat or Declining as well as When the Index Is Rising.
The Fund is not actively managed on the basis of judgments relating to economic, financial and market conditions with a view to obtaining positive results under all market conditions. Instead, the Managing Owner seeks to cause the NAV to track the performance of the Index during periods in which the Index is flat or declining as well as when the Index is rising. Therefore, if positions in any one or more of the Index Commodities are declining in value, the Fund will not close out such positions, except in connection with a change in the composition or weighting of the Index.
10
Unusually LongPeak-to-Valley Drawdown Periods with Respect To the Index May Be Reflected in Equally LongPeak-to-Valley Drawdown Periods with Respect to the Performance of the Shares.
“Peak-to-valley drawdown” represents the cumulative percentage decline inmonth-end NAV per Share due to losses sustained during any period in which the initialmonth-end NAV per Share is not equaled or exceeded by a subsequentmonth-end NAV per Share.
Although past Index levels are not necessarily indicative of future Index levels, thepeak-to-valley drawdown periods that the Index has experienced have been unusually long and have lasted for multi-year drawdown periods.
Because it is expected that the Fund’s performance will track the change of its underlying Index, the Fund would experience a continuous drawdown during the period that the Index experiences such a drawdown. The value of your Shares will also decrease during such a period.
Regulatory Risks
Position Limits and Other Potential Limitations on Futures Trading May Restrict the Creation of Baskets and the Operation of the Fund.
Position Limits. CFTC and futures exchange rules impose position limits on market participants, including the Fund, trading in certain commodity futures contracts. These position limits prohibit any person from holding a position of more than a specific number of futures contracts. Generally, position limits in the physical delivery markets are set at a stricter level during the spot month, which is the month when the futures contract matures and becomes deliverable, versus the limits for any other month or for all months combined. Limits are generally applied on an aggregate basis to positions held in accounts that are subject to 10% or greater common ownership or control. There are exemptions from this general aggregation requirement.
The Index is composed of two Index Commodities, each of which is subject to position limits imposed by the CFTC and/or the rules of futures exchanges on which Index Contracts are traded. The CFTC has been seeking to amend its position limits rules for several years. In November 2013, the CFTC proposed for public comment new position limits and aggregation regulations. After a lengthy comment period on this proposal, the CFTCre-proposed, in December 2016, position limits for 25 commodity futures and options contracts, as well as for swaps that are economically equivalent to those contracts. In December 2016, the CFTC adopted rule amendments that provide exemptions from the general requirement to aggregate all positions that are held pursuant to 10% or greater common ownership or control.
The ultimate outcome of this rulemaking effort, and the resulting impact on the Fund of any final regulations that impose new or revised position limits, is unknown. It is also possible that futures exchanges may amend their existing position limits rules or adopt new requirements. In addition, the CFTC could separately implement other changes to specific position limits or to the regime as a whole. New or more restrictive position limits could reduce liquidity in the market, which would be likely to have adverse effects on the pricing of commodity futures contracts. Changes in CFTC and/or exchange-level position limits rules therefore could adversely affect the Fund’s ability to pursue its investment objective.
Position Aggregation. In general, a trader is required by CFTC or exchange rules, as applicable, to aggregate all positions in accounts as to which the trader has 10% or greater ownership or control. CFTC and exchange rules provide exemptions from this requirement. For example, a trader is not required to aggregate positions in multiple accounts that it owns or controls if that trader is able to satisfy the requirements of an exemption from aggregation of those accounts, including, where available, the independent account controller exemption.
Failure to comply with the independent account controller exemption or another exemption from the aggregation requirement could obligate the Managing Owner to aggregate positions in multiple accounts under its control, which could include the Fund and other commodity pools or accounts under the Managing Owner’s control. In such a scenario, the Fund may not be able to obtain exposure to one or more Index Contracts necessary to pursue its investment objective, or it may be required to liquidate existing Index Contract positions in order to comply with a limit. Such an outcome could adversely affect the Fund’s ability to pursue its investment objective or achieve favorable performance.
The CFTC amended its position aggregation rules in December 2016. The CFTC staff subsequently issued time-limitedno-action relief from compliance with certain requirements under the amended aggregation rules, including the general requirement to aggregate positions in the same commodity futures contracts traded pursuant to substantially identical trading strategies. Thisno-action relief expires on August 12, 2019.
11
Accountability Levels. Exchanges may establish accountability levels applicable to futures contracts instead of position limits. An exchange may order a person who holds or controls a position in excess of a position accountability level not to further increase its position, to comply with any prospective limit that exceeds the size of the position owned or controlled, or to reduce any open position that exceeds the position accountability level if the exchange determines that such action is necessary to maintain an orderly market. Position accountability levels could adversely affect the Fund’s ability to establish and maintain positions in commodity futures contracts to which such levels apply, if the Fund were to trade in such contracts. Such an outcome could adversely affect the Fund’s ability to pursue its investment objective.
Daily Limits. U.S. futures exchanges and some foreign exchanges have regulations that limit the amount of fluctuation in futures contract prices that may occur during a single business day. These limits are generally referred to as “daily price fluctuation limits” or “daily limits,” and the maximum or minimum price of a contract on any given day as a result of these limits is referred to as a “limit price.” Once a limit price has been reached in a particular contract, it is usually the case that no trades may be made at a different price than specified in the limit. The duration of limit prices generally varies. Limit prices may have the effect of precluding the Fund from trading in a particular contract or requiring the Fund to liquidate contracts at disadvantageous times or prices. Either of those outcomes could adversely affect the Fund’s ability to pursue its investment objective.
Potential Effects of Positions Limits, Accountability Levels, and Daily Limits. The Fund is currently subject to position limits and may be subject to new and more restrictive position limits in the future. If the Fund reached a position limit or accountability level or became subject to a daily limit, its ability to issue new Baskets or reinvest income in additional commodity futures contracts may be limited to the extent these restrictions limit its ability to establish new futures positions, add to existing positions, or otherwise transact in futures. Limiting the size of the Fund, or restricting the Fund’s futures trading, under these requirements could adversely affect the Fund’s ability to pursue its investment objective.
Failure of Futures Commission Merchants or Commodity Brokers to Segregate Assets May Cause Losses for the Fund.
The Commodity Exchange Act requires a futures commission merchant to segregate all funds received from customers from such futures commission merchant’s proprietary assets. If the Commodity Broker fails to segregate customer assets as required, the assets of the Fund might not be fully protected in the event of the Commodity Broker’s bankruptcy. Furthermore, in the event of the Commodity Broker’s bankruptcy, the Fund could be limited to recovering either a pro rata share of all available funds segregated on behalf of the Commodity Broker’s combined customer accounts or the Fund may not recover any assets at all, even though certain property specifically traceable to the Fund was held by the Commodity Broker.
The Commodity Exchange Act requires an approved derivatives clearing organization to segregate all funds and other property received from a clearing member’s customers in connection with U.S. futures and options contracts from any funds held at the clearing organization to support the clearing member’s proprietary trading. Nevertheless, customer funds held at a clearing organization in connection with any futures or options contracts may be held in a commingled omnibus account, which may not identify the name of the clearing member’s individual customers. With respect to futures and options contracts, a clearing organization may use assets of anon-defaulting customer held in an omnibus account at the clearing organization to satisfy payment obligations of a defaulting customer of the clearing member to the clearing organization. In the event of a default of the clearing futures commission merchant’s other clients or the clearing futures commission merchant’s failure to extend its own funds in connection with any such default, a customer may not be able to recover the full amount of assets deposited by the clearing futures commission merchant with the clearing organization on the customer’s behalf.
In the event of a bankruptcy or insolvency of any exchange or a clearing house, the Fund could experience a loss of the funds deposited through the Commodity Broker as margin with the exchange or clearing house, a loss of any unrealized profits on its open positions on the exchange, and the loss of unrealized profits on its closed positions on the exchange.
Regulatory Changes or Actions May Alter the Operations and Profitability of the Fund.
The regulation of commodity interest transactions and markets, including under the Dodd-Frank Act, is a rapidly changing area of law and is subject to ongoing modification by governmental and judicial action. In particular, the Dodd-Frank Act has expanded the regulation of markets, market participants and financial instruments. The new regulatory regime under the Dodd-Frank Act has imposed additional compliance and legal burdens on participants in the markets for futures and other commodity interests. For example, under the Dodd-Frank Act new capital and risk requirements have been imposed on market intermediaries. Those requirements may cause the cost of trading to increase for market participants, like the Fund, that must interact with those intermediaries to carry out their trading activities. These increased costs can detract from the Fund’s performance.
The Fund and the Managing Owner Are Subject to Extensive Legal and Regulatory Requirements.
The Fund is subject to a comprehensive scheme of regulation under the federal commodity futures trading and securities laws, as well as futures market rules and the rules and listing standards for its Shares. The Fund and the Managing Owner could each be subject to sanctions for a failure to comply with those requirements, which could adversely affect the Fund’s financial performance and its ability to pursue its investment objective.
12
In addition, the Fund is subject to significant disclosure, internal control, governance, and financial reporting requirements because the Shares are publicly traded.
For example, the Fund is responsible for establishing and maintaining internal controls over financial reporting. Under this requirement, the Fund must adopt, implement and maintain an internal control system designed to provide reasonable assurance to its management regarding the preparation and fair presentation of published financial statements. The Fund is also required to adopt, implement, and maintain disclosure controls and procedures that are designed to ensure information required to be disclosed by the Fund in reports that it files or submits to the SEC is recorded, processed, summarized and reported within the time periods specified by the SEC. There is a risk that the Fund’s internal controls over financial reporting and disclosure controls and procedures could fail to work properly or otherwise fail to satisfy SEC requirements. Such a failure could result in the reporting or disclosure of incorrect information or a failure to report information on a timely basis. Such a failure could be to the disadvantage of Shareholders and could expose the Fund to penalties or otherwise adversely affect the Fund’s status under the federal securities laws and SEC regulations.
All internal control systems, no matter how well designed, have inherent limitations. Therefore, even those systems determined to be effective may provide only reasonable assurance with respect to financial statement preparation and presentation and other disclosure matters.
Current Discussions between the SEC and PricewaterhouseCoopers LLP regarding PricewaterhouseCoopers LLP’s Independence Could Have Potentially Adverse Consequences for the Fund.
PricewaterhouseCoopers LLP informed the Fund that it has identified an issue related to its independence under Rule2-01(c)(1)(ii)(A) of RegulationS-X (referred to as the Loan Rule). The Loan Rule prohibits accounting firms, such as PricewaterhouseCoopers LLP, from being deemed independent if they have certain financial relationships with their audit clients or certain affiliates of those clients. The Fund is required under various securities laws to have its financial statements audited by an independent accounting firm.
The Loan Rule specifically provides that an accounting firm would not be independent if it or certain affiliates and covered persons receive a loan from a lender that is a record or beneficial owner of more than ten percent of an audit client’s equity securities (referred to as a “more than ten percent owner”). For purposes of the Loan Rule, audit clients include the Fund as well as all registered investment companies advised by the Managing Owner and its affiliates, including other subsidiaries of the Managing Owner’s parent company, Invesco Ltd. (collectively, the “Invesco Fund Complex”). PricewaterhouseCoopers LLP informed the Fund it and certain affiliates and covered persons have relationships with lenders who hold, as record owner, more than ten percent of the shares of certain funds within the Invesco Fund Complex, which may implicate the Loan Rule.
On June 20, 2016, the SEC Staff issued a“no-action” letter to another mutual fund complex (see Fidelity Management & Research Company et al.,No-Action Letter) related to the audit independence issue described above. In that letter, the SEC confirmed that it would not recommend enforcement action against a fund that relied on audit services performed by an audit firm that was not in compliance with the Loan Rule in certain specified circumstances. On May 2, 2018, the SEC proposed amendments to the Loan Rule that, if adopted as proposed, would address many of the issues that led to issuance of theno-action letter. In connection with prior independence determinations, PricewaterhouseCoopers LLP communicated, as contemplated by theno-action letter, that it believes that it remains objective and impartial and that a reasonable investor possessing all the facts would conclude that PricewaterhouseCoopers LLP is able to exhibit the requisite objectivity and impartiality to report on the Fund’s financial statements as the independent registered public accounting firm. PricewaterhouseCoopers LLP also represented that it has complied with PCAOB Rule 3526(b)(1) and (2), which are conditions to the Funds relying on the no action letter, and affirmed that it is an independent accountant within the meaning of PCAOB Rule 3520. Therefore, the Managing Owner, the Fund and PricewaterhouseCoopers LLP concluded that PricewaterhouseCoopers LLP could continue as the Fund’s independent registered public accounting firm. The Invesco Fund Complex relied upon theno-action letter in reaching this conclusion.
If in the future the independence of PricewaterhouseCoopers LLP is called into question under the Loan Rule by circumstances that are not addressed in the SEC’sno-action letter, the Fund will need to take other action in order for the Fund’s filings with the SEC containing financial statements to be deemed compliant with applicable securities laws. Such additional actions could result in additional costs, impair the ability of the Fund to issue new shares or have other material adverse effects on the Fund. The SECno-action relief was initially set to expire eighteen (18) months from issuance but has been extended by the SEC without an expiration date, except that theno-action letter will be withdrawn upon the effectiveness of any amendments to the Loan Rule designed to address the concerns expressed in the letter.
13
Tax Risks
Shareholders Will Be Subject to Taxation on Their Allocable Share of the Fund’s Taxable Income, Whether or Not They Receive Cash Distributions.
Shareholders will be subject to U.S. federal income taxation and, in some cases, state, local, or foreign income taxation on their allocable share of the Fund’s taxable income, whether or not they receive cash distributions from the Fund. Shareholders may not receive cash distributions equal to their share of the Fund’s taxable income or even the tax liability that results from such income.
Items of Income, Gain, Loss and Deduction with Respect to Shares Could Be Reallocated if the IRS Does Not Accept the Assumptions or Conventions Used by the Fund in Allocating Such Items.
U.S. federal income tax rules applicable to partnerships are complex and often difficult to apply to publicly traded partnerships. The Fund will apply certain assumptions and conventions in an attempt to comply with applicable rules and to report items of income, gain, loss and deduction to Shareholders in a manner that reflects the Shareholders’ beneficial interest in such tax items, but these assumptions and conventions may not be in compliance with all aspects of the applicable tax requirements. It is possible that the United States Internal Revenue Service (the “IRS”) will successfully assert that the conventions and assumptions used by the Fund do not satisfy the technical requirements of the Internal Revenue Code of 1986, as amended (the “Code”) and/or the Federal Tax Regulations codified under 26 C.F.R., referred to herein as the Treasury Regulations, and could require that items of income, gain, loss and deduction be adjusted or reallocated in a manner that adversely affects one or more Shareholders.
The Fund is a partnership, which is not subject to U.S. federal income taxes. Rather, the partnership’s taxable income flows through to the owners, who are responsible for paying the applicable income taxes on the income allocated to them. For tax years beginning on or after January 1, 2018, the Fund is subject to partnership audit rules enacted as part of the Bipartisan Budget Act of 2015 (the “Centralized Partnership Audit Regime”). Under the Centralized Partnership Audit Regime, any IRS audit of the Fund would be conducted at the Fund level, and if the IRS determines an adjustment, the default rule is that the Fund would pay an “imputed underpayment” including interest and penalties, if applicable. The Fund may instead elect to make a“push-out” election, in which case the shareholders for the year that is under audit would be required to take into account the adjustments on their own personal income tax returns.
The Tax Cuts and Jobs Act (the “Tax Act”) Makes Significant Changes to U.S. Federal Income Tax Rules.
The Tax Act makes significant changes to the U.S. federal income tax rules for taxation of individuals and corporations, generally effective for taxable years beginning after December 31, 2017. Most of the changes applicable to individuals are temporary and would apply only to taxable years beginning after December 31, 2017 and before January 1, 2026. In particular for individuals, the Tax Act establishes for taxable years beginning after December 31, 2017 and before January 1, 2026 a 20% deduction for “qualified publicly traded partnership income” within the meaning of new Section 199A(e)(5) of the Code. In general, “qualified publicly traded partnership income” for this purpose is an item of income, gain, deduction or loss that is effectively connected with a United States trade or business and includable income for the year, but does not include certain investment income. It is currently not expected that the Fund’s income will be eligible for such deduction because, as discussed below, although the matter is not free from doubt, the Fund believes that the activities directly conducted by the Fund will not result in the Fund being engaged in a trade or business within the United States. Potential investors should consult their tax advisors regarding the availability of such deduction for their allocable share of the Fund’s items of income, gain, deduction and loss.
PROSPECTIVE INVESTORS ARE STRONGLY URGED TO CONSULT THEIR OWN TAX ADVISORS AND COUNSEL WITH RESPECT TO THE POSSIBLE TAX CONSEQUENCES TO THEM OF AN INVESTMENT IN THE SHARES; SUCH TAX CONSEQUENCES MAY DIFFER WITH RESPECT TO DIFFERENT INVESTORS.
Other Risks
An Insolvency Resulting From Another Series in the Trust or the Trust Itself May Have a Material Adverse Effect On the Fund.
The Fund is a series or a part of a Delaware statutory trust. Pursuant to Delaware law, the organization of the Trust provides that the assets and liabilities of the Fund are separate from the assets and liabilities of all other series of the Trust, as well as the larger Trust itself. Though such organization may, under state law, protect the assets of the Fund in an insolvency action brought by the creditors of another series of the Trust, this may be insufficient to protect the assets of the Fund from such creditors in an insolvency action in Federal court, or in a court in a foreign jurisdiction. Accordingly, an insolvency resulting from another series in the Trust or the Trust itself may have a material adverse effect on the Fund. The material risks associated with the other series have not been included in this Report.
14
Disruptions in the Ability to Create and Redeem Baskets May Adversely Affect Investors.
It is generally expected that the public trading price per Share will track the NAV per Share closely over time. The relationship between the public trading price per Share and the NAV per Share depends, to a considerable degree, on the ability of Authorized Participants or their clients or customers to purchase and redeem Baskets in the ordinary course. If the process for creating or redeeming Shares is impaired for any reason, Authorized Participants and their clients or customers may not be able to purchase and redeem Baskets or, even if possible, may choose not to do so. The inability to purchase and redeem Baskets, or the partial impairment of the ability to purchase and redeem Baskets, could result in Shares trading at a premium or discount to the NAV of the Fund. Such a premium or discount could be significant, depending upon the nature or duration of the impairment.
If the Fund were to issue all Shares that have been registered, it would not be able to create new Baskets until it registered additional Shares and those additional Shares became available for sale. An inability to create new Baskets could increase the possibility that the trading price per Share would not track closely the NAV per Share. In addition, the Fund may, in its discretion, suspend the creation of Baskets. Suspension of creations may adversely affect how the Shares are traded and could cause Shares to trade at a premium or discount to the NAV of the Fund, perhaps to a significant degree.
The Shares Could Decrease in Value if Unanticipated Operational or Trading Problems Arise.
The mechanisms and procedures governing the creation, redemption and offering of the Shares have been developed specifically for the Fund. Consequently, there may be unanticipated problems with respect to the mechanics of the operations of the Fund and the trading of the Shares that could have a material adverse effect on an investment in the Shares. To the extent that unanticipated operational or trading problems arise, the Managing Owner’s past experience and qualifications may not be suitable for solving those problems.
Historical Performance of the Fund and the Index Is Not Indicative of Future Performance.
Past performance of the Fund or the Index is not necessarily indicative of future results. Therefore, past performance of the Fund or the Index should not be relied upon in deciding whether to buy Shares of the Fund.
Fees and Expenses May Deplete the Fund’s Assets if the Fund’s Investment Performance Is Not Favorable.
The Fund pays fees and expenses regardless of its investment performance. Such fees and expenses include asset-based fees of 0.75% per annum. Additional charges include brokerage fees of approximately 0.03% per annum in the aggregate and selling commissions. Selling commissions are not included in the Fund’s breakeven calculation. The sum of the Fund’s Treasury Income, Money Market Income and/orT-Bill ETF Income may not exceed its fees and expenses. If such income does not exceed its fees and expenses, in order to break even, the Fund’s futures trading activity will need to have a favorable performance that exceeds the difference between the sum of the Fund’s Treasury Income, Money Market Income and/orT-Bill ETF Income and its fees and expenses. If the Fund’s futures trading performance is not sufficiently favorable, the Fund’s expenses could deplete its assets over time. In such a scenario, the value of your Shares will decrease.
There May Be Circumstances That Could Prevent the Fund from Being Operated in a Manner Consistent with its Investment Objective.
There may be circumstances outside the control of the Managing Owner and/or the Fund that make it, for all practical purposes, impossible tore-position the Fund and/or to process a purchase or redemption order. Examples of such circumstances include: natural disasters; public service disruptions or utility problems such as those caused by fires, floods, extreme weather conditions, and power outages resulting in telephone, telecopy, and computer failures; market conditions or activities causing trading halts; systems failures involving computer or other information systems affecting the aforementioned parties, as well as DTC, or any other participant in the purchase process, and similar extraordinary events. While the Managing Owner has established and implemented a disaster recovery plan, circumstances such as those identified above may prevent the Fund from being operated in a manner consistent with its investment objective.
Redemption Orders for Baskets May Be Subject to Postponement, Suspension or Rejection Under Certain Circumstances.
The Managing Owner may, in its discretion, suspend the right of redemption or postpone the redemption order settlement date with respect to Baskets for (1) any period during which an emergency exists as a result of which the redemption distribution is not reasonably practicable, or (2) such other period as the Managing Owner determines to be necessary for the protection of the Shareholders. In addition, the Fund will reject a redemption order if the order is not in proper form as described in the participant agreement with the Authorized Participant, or if the fulfillment of the order, in the opinion of the Fund’s counsel, might be unlawful. Any such postponement, suspension or rejection could adversely affect a redeeming Authorized Participant. For example, the resulting delay may adversely affect the value of the Authorized Participant’s redemption proceeds if the NAV of the Fund declines during the period of delay. The Fund disclaims any liability for any loss or damage that may result from any such suspension or postponement.
15
Shareholders Do Not Have the Protections Associated with Ownership of Shares in an Investment Company Registered Under the Investment Company Act of 1940.
The Fund is not registered as an investment company under the Investment Company Act of 1940, as amended. Consequently, Shareholders do not have the legal and regulatory protections provided to the investors in investment companies that are registered as such.
Shareholders Do Not Have the Rights Enjoyed by Investors in Certain Other Vehicles.
The Shares have none of the statutory rights normally associated with the ownership of shares of a corporation. However, under Delaware law, a beneficial owner of a business trust (such as a Shareholder) may, under certain circumstances, institute legal action on behalf of himself and all other similarly situated beneficial owners to recover damages from a third party where a managing owner has failed or refused to institute legal action on behalf of himself and all other similarly situated beneficial owners to recover damages from a managing owner for violations of fiduciary duties, or on behalf of a business trust to recover damages from a third party where a managing owner has failed or refused to institute proceedings to recover such damages. The Shares have limited voting and distribution rights (for example, Shareholders do not have the right to elect directors and the Fund is not required to pay regular distributions, although the Fund may pay distributions in the discretion of the Managing Owner).
Various Actual and Potential Conflicts of Interest May Be Detrimental to Shareholders.
The Fund is subject to actual and potential conflicts of interest involving the Managing Owner or any of its affiliates, the Commodity Broker, including its principals and its affiliates, the Index Sponsor and Marketing Agent, and Invesco Distributors. The Managing Owner and its principals, all of whom are engaged in other investment activities, are not required to devote substantially all of their time to the business of the Fund, which also presents the potential for numerous conflicts of interest with the Fund. The Managing Owner and its principals and affiliates are engaged in a broad array of asset management and financial services activities and may engage in activities during the ordinary course of business that cause their interests or those of their other clients to conflict with those of the Fund and its Shareholders.
As a result of these and other relationships, parties involved with the Fund have a financial incentive to act in a manner other than in the best interests of the Fund and the Shareholders. For example, by investing in affiliated money market mutual funds and/orT-Bill ETFs for margin and/or cash management purposes, the Managing Owner may select affiliated money market mutual funds and/orT-Bill ETFs that may pay dividends that are lower thannon-affiliated money market mutual funds and/orT-Bill ETFs. In addition, the Managing Owner would have a conflict of interest if it sought to redeem the Fund’s interest in an affiliated money market mutual fund orT-Bill ETF in circumstances when such a redemption would be unfavorable for the affiliated fund. The Managing Owner has not established any formal procedure to resolve conflicts of interest. Consequently, investors are dependent on the good faith of the respective parties subject to such conflicts to resolve them equitably. Although the Managing Owner attempts to monitor these conflicts, it is extremely difficult, if not impossible, for the Managing Owner to ensure that these conflicts do not, in fact, result in adverse consequences to the Fund and the Shareholders.
The Fund may be subject to certain conflicts with respect to the Commodity Broker, including, but not limited to, conflicts that result from receiving greater amounts of compensation from other clients, or purchasing opposite or competing positions on behalf of third party accounts traded through the Commodity Broker.
Because the Managing Owner and Invesco Distributors are affiliates, the Managing Owner has a disincentive to replace Invesco Distributors. Furthermore, the Managing Owner did not conduct an arm’s length negotiation when it retained Invesco Distributors.
Lack of Independent Advisers Representing Investors.
The Managing Owner has consulted with counsel, accountants and other advisers regarding the operation of the Fund. No counsel has been appointed to represent you in connection with the Fund’s continuous offering of Shares. Accordingly, you should consult your own legal, tax and financial advisers about whether you should invest in the Shares.
Possibility of Termination of the Fund May Adversely Affect Your Portfolio.
It is ultimately within the discretion of the Managing Owner whether it will continue to operate and advise the Fund. The Managing Owner may withdraw from the Fund upon 120 days’ prior written notice to all Shareholders and the Trustee, which would cause the Fund to terminate unless a substitute managing owner was obtained. Shareholders owning 50% or more of the Shares have the power to terminate the Fund. If it is so exercised, investors who may wish to continue to invest in a vehicle that tracks the Fund’s Index will have to find another vehicle, and may not be able to find another vehicle that offers the same features as the Fund. See “Description of the Shares; Certain Material Terms of the Trust Agreement – Termination Events” in the Fund’s Prospectus for a
16
summary of termination events. Such detrimental developments could cause you to liquidate your investments and upset the overall maturity and timing of your investment portfolio. If the registrations with the CFTC or memberships in the NFA of the Managing Owner or the Commodity Broker were revoked or suspended, such entity would no longer be able to provide services to the Fund.
Competing Claims Over Ownership of Intellectual Property Rights Related to the Fund Could Adversely Affect the Fund and an Investment in the Shares.
While the Managing Owner believes that all intellectual property rights needed to operate the Fund in the manner described in the Fund’s Prospectus are either owned by or licensed to the Managing Owner or have been obtained, third parties may allege or assert ownership of intellectual property rights which may be related to the design, structure and operations of the Fund. To the extent any claims of such ownership are brought or any proceedings are instituted to assert such claims, the issuance of any restraining orders or injunctions, the negotiation, litigation or settlement of such claims, or the ultimate disposition of such claims in a court of law may adversely affect the Fund and an investment in the Shares. For example, such actions could result in expenses or damages payable by the Fund, suspension of activities or the termination of the Fund.
The Value of the Shares Will Be Adversely Affected if the Fund Is Required to Indemnify the Trustee or the Managing Owner.
Under the Trust Agreement, the Trustee and the Managing Owner have the right to be indemnified for any liability or expense they incur, except for any expenses resulting from gross negligence or willful misconduct. That means the Managing Owner may require the assets of the Fund to be sold in order to cover losses or liability suffered by it or by the Trustee. Any sale of that kind would reduce the NAV of the Fund and, consequently, the value of the Shares.
Although the Shares Are Limited Liability Investments, Certain Circumstances such as Bankruptcy of the Fund or Indemnification of the Fund by the Shareholders Will Increase a Shareholder’s Liability.
The Shares are limited liability investments; investors may not lose more than the amount that they invest including any appreciation in their investments. However, Shareholders could be required, as a matter of bankruptcy law, to return to the estate of the Fund any distribution they received at a time when the Fund was in fact insolvent or in violation of the Trust Agreement. In addition, Shareholders agree in the Trust Agreement that they will indemnify the Fund for any harm suffered by it as a result of:
| • | Shareholders’ actions unrelated to the business of the Fund, or |
| • | taxes imposed on the Shares by the states or municipalities in which such investors reside. |
The Fund May Lose Money on Its Holdings of Money Market Mutual Funds.
The Fund may invest in government money market funds that have chosen to not rely on the ability to impose fees on shareholder redemptions, or liquidity fees, or temporarily to suspend redemption privileges, or gates, if the government money market fund’s weekly liquid assets fall below a certain threshold. Although such government money market funds seek to preserve the value of an investment at $1.00 per share, there is no guarantee that they will be able to do so. As a result, the Fund may lose money by investing in a government money market fund. An investment in a government money market fund is not insured or guaranteed by the Federal Deposit Insurance Corporation (“FDIC”) or any other government agency. The share price of a government money market fund can fall below the $1.00 share price. The Fund cannot rely on or expect a government money market fund’s adviser or its affiliates to enter into support agreements or take other actions to maintain the government money market fund’s $1.00 share price. The credit quality of a government money market fund’s holdings can change rapidly in certain markets, and the default of a single holding could have an adverse impact on the government money market fund’s share price. Due to fluctuations in interest rates, the market value of securities held by a government money market fund may vary. A government money market fund’s share price can also be negatively affected during periods of high redemption pressures and/or illiquid markets.
Due to the Increased Use of Technologies, Intentional and Unintentional Cyber Attacks Pose Operational and Information Security Risks.
With the increased use of technologies such as the Internet and the dependence on computer systems to perform necessary business functions, the Fund is susceptible to operational and information security risks. In general, cyber incidents can result from deliberate attacks or unintentional events. Cyber attacks include, but are not limited to gaining unauthorized access to digital systems for purposes of misappropriating assets or sensitive information, corrupting data, or causing operational disruption.
Cyber attacks may also be carried out in a manner that does not require gaining unauthorized access, such as causingdenial-of-service attacks on websites. Cyber security failures or breaches of the Fund’s third party service providers (including, but not limited to, the Index Sponsor, the Administrator and the Transfer Agent) or money market mutual funds andT-Bill ETFs in which the Fund invests, have the ability to cause disruptions and impact business operations, potentially resulting in financial losses, the inability of Shareholders or Authorized Participants to transact business in Shares and Baskets respectively, violations of applicable privacy and
17
other laws, regulatory fines, penalties, reputational damage, reimbursement or other compensation costs, and/or additional compliance costs. In addition, substantial costs may be incurred in order to prevent any cyber incidents in the future. The Fund and its Shareholders could be negatively impacted as a result.
While the Managing Owner has established business continuity plans and systems reasonably designed to detect and prevent such cyber attacks from being effective, there are inherent limitations in such plans and systems. For instance, it is possible that certain existing risks have not been identified or that new risks will emerge before countervailing measures can be implemented. Furthermore, the Fund cannot control, or even necessarily influence, the cyber security plans and systems put in place by the Fund’s third party service providers. Since the Fund is dependent upon third party service providers (including the Managing Owner) for substantially all of its operational needs, the Fund is subject to the risk that a cyber attack on a service provider will materially impair its normal operations even if the Fund itself is not subject to such an attack. Cyber attacks may also cause disruptions to the futures exchanges and clearinghouses through which the Fund invests in futures contracts and to the exchanges on which the Fund buys and sells shares ofT-Bill ETFs, which could result in disruptions to the Fund’s ability to pursue its investment objective, resulting in financial losses to the Fund and Shareholders.
| ITEM 1B. | UNRESOLVED STAFF COMMENTS |
None.
| ITEM 2. | PROPERTIES |
The Fund does not own or use physical properties in the conduct of its business. Its assets consist of futures contracts, cash, United States Treasury Obligations and may consist of money market mutual funds and/orT-Bill ETFs. The Managing Owner’s headquarters are located at 3500 Lacey Road, Suite 700, Downers Grove, Illinois 60515.
| ITEM 3. | LEGAL PROCEEDINGS |
None.
| ITEM 4. | MINE SAFETY DISCLOSURES |
Not applicable.
18
| ITEM 5. | MARKET FOR REGISTRANT’S COMMON EQUITY, RELATED STOCKHOLDER MATTERS AND ISSUER PURCHASES OF EQUITY SECURITIES |
Market Information
The Shares traded on the NYSE Alternext from January 5, 2007 to November 25, 2008 and have been trading on the NYSE Arca since November 25, 2008 under the symbol “DBP.”
Holders
As of January 31, 2019, the Fund had 75 holders of record of its Shares.
Sales of Unregistered Securities and Use of Proceeds of Registered Securities
(a) There have been no unregistered sales of the Shares. No Shares are authorized for issuance by the Fund under equity compensation plans.
(b) Not applicable.
(c) The following table summarizes the redemptions by Authorized Participants during the Three Months Ended December 31, 2018:
Period of Redemption | Total Number of Shares Redeemed | Average Price Paid per Share | ||||||
October 1, 2018 to October 31, 2018 | 200,000 | $ | 35.33 | |||||
November 1, 2018 to November 30, 2018 | — | — | ||||||
December 1, 2018 to December 31, 2018 | 200,000 | 35.70 | ||||||
|
|
|
| |||||
Total | 400,000 | $ | 35.51 | |||||
|
|
|
| |||||
| ITEM 6. | SELECTED FINANCIAL DATA |
The following table summarizes the relevant 2018, 2017, 2016, 2015 and 2014 financial data for the Fund and should be read in conjunction with the Fund’s financial statements, and the notes and schedules related thereto, which are included in this report.
| Years Ended December 31, | ||||||||||||||||||||
| 2018 | 2017 | 2016 | 2015 | 2014 | ||||||||||||||||
Income(a) | $ | 2,493,310 | $ | 1,349,087 | $ | 581,601 | $ | 30,426 | $ | 53,356 | ||||||||||
Net investment income (loss) | $ | 1,430,818 | $ | 186,334 | $ | (965,076 | ) | $ | (926,836 | ) | $ | (1,364,366 | ) | |||||||
Net realized and net change in unrealized gains/(losses) on United States Treasury Obligations, Affiliated Investments and Commodity Futures Contracts | $ | (8,789,259 | ) | $ | 14,454,090 | $ | (5,134,819 | ) | $ | (11,886,494 | ) | $ | (11,016,131 | ) | ||||||
Net Income (Loss) | $ | (7,358,441 | ) | $ | 14,640,424 | $ | (6,099,895 | ) | $ | (12,813,330 | ) | $ | (12,380,497 | ) | ||||||
Net Income (Loss) per Share | $ | (1.94 | ) | $ | 3.80 | $ | 2.65 | $ | (4.31 | ) | $ | (2.58 | ) | |||||||
Return of Capital Distributions per General Share | $ | (0.45 | ) | $ | (0.05 | ) | $ | — | $ | — | $ | — | ||||||||
Return of Capital Distributions per Share | $ | (0.45 | ) | $ | (0.05 | ) | $ | — | $ | — | $ | — | ||||||||
Net increase (decrease) in cash | $ | (670,563 | ) | $ | (1,304,657 | ) | $ | (1,478,752 | ) | $ | (11,896,369 | ) | $ | 5,631,355 | ||||||
| As of December 31, | ||||||||||||||||||||
| 2018 | 2017 | 2016 | 2015 | 2014 | ||||||||||||||||
Total Assets | $ | 110,001,540 | $ | 154,829,376 | $ | 140,842,955 | $ | 96,949,469 | $ | 156,789,542 | ||||||||||
General Shares NAV | $ | 36.29 | $ | 38.68 | $ | 34.93 | $ | 32.28 | $ | 36.59 | ||||||||||
Shares NAV | $ | 36.29 | $ | 38.68 | $ | 34.93 | $ | 32.28 | $ | 36.59 | ||||||||||
| (a) | Income for the year ended December 31, 2014 includes interest expense on overdraft balances. These amounts are included in Interest Expense for the years ended December 31, 2018, 2017, 2016 and 2015. |
19
Selected Quarterly Financial Data (Unaudited)
| For the Three Months Ended, | ||||||||||||||||
| March 31, 2018 | June 30, 2018 | September 30, 2018 | December 31, 2018 | |||||||||||||
Income | $ | 649,607 | $ | 623,982 | $ | 595,176 | $ | 624,545 | ||||||||
Net investment income (loss) | $ | 321,526 | $ | 341,208 | $ | 363,772 | $ | 404,312 | ||||||||
Net realized and net change in unrealized gains/(losses) on United States Treasury Obligations, Affiliated Investments and Commodity Futures Contracts | $ | (522,786 | ) | $ | (7,168,291 | ) | $ | (7,741,572 | ) | $ | 6,643,390 | |||||
Net Income/(loss) | $ | (201,260 | ) | $ | (6,827,083 | ) | $ | (7,377,800 | ) | $ | 7,047,702 | |||||
Increase/(decrease) in Net Asset Value | $ | 22,794,280 | $ | (45,359,475 | ) | $ | (21,797,367 | ) | $ | (1,487,500 | ) | |||||
Net Income (loss) per Share(a) | $ | (0.09 | ) | $ | (1.88 | ) | $ | (2.22 | ) | $ | 2.25 | |||||
Return of Capital Distributions per General Share(a) | $ | — | $ | — | $ | — | $ | (0.45 | ) | |||||||
Return of Capital Distributions per Share(a) | $ | — | $ | — | $ | — | $ | (0.45 | ) | |||||||
| (a) | The amount shown for a share outstanding for quarterly statements may not correlate with year to date amounts due to timing of subscriptions and redemptions in relation to income earned or distributed. |
| For the Three Months Ended, | ||||||||||||||||
| March 31, 2017 | June 30, 2017 | September 30, 2017 | December 31, 2017 | |||||||||||||
Income | $ | 197,122 | $ | 285,334 | $ | 435,106 | $ | 431,525 | ||||||||
Net investment income (loss) | $ | (78,410 | ) | $ | 2,611 | $ | 122,114 | $ | 140,019 | |||||||
Net realized and net change in unrealized gains/(losses) on United States Treasury Obligations, Affiliated Investments and Commodity Futures Contracts | $ | 13,187,589 | $ | (5,073,754 | ) | $ | 3,591,753 | $ | 2,748,502 | |||||||
Net Income/(loss) | $ | 13,109,179 | $ | (5,071,143 | ) | $ | 3,713,867 | $ | 2,888,521 | |||||||
Increase/(decrease) in Net Asset Value | $ | 20,477,621 | $ | (4,312,049 | ) | $ | 11,281,557 | $ | (12,447,823 | ) | ||||||
Net Income (loss) per Share(a) | $ | 3.21 | $ | (1.02 | ) | $ | 0.87 | $ | 0.74 | |||||||
Return of Capital Distributions per General Share(a) | $ | — | $ | — | $ | — | $ | (0.05 | ) | |||||||
Return of Capital Distributions per Share(a) | $ | — | $ | — | $ | — | $ | (0.05 | ) | |||||||
| (a) | The amount shown for a share outstanding for quarterly statements may not correlate with year to date amounts due to timing of subscriptions and redemptions in relation to income earned or distributed. |
20
| ITEM 7. | MANAGEMENT’S DISCUSSION AND ANALYSIS OF FINANCIAL CONDITION AND RESULTS OF OPERATIONS |
This information should be read in conjunction with the financial statements and notes included in Item 8 of Part II of this Report. The discussion and analysis which follows may contain trend analysis and other forward-looking statements. See “Cautionary Statement Concerning Forward-Looking Information” above.
You should not place undue reliance on any forward-looking statements. Except as expressly required by the Federal securities laws, the Fund and the Managing Owner undertakes no obligation to publicly update or revise any forward-looking statements or the risks, uncertainties or other factors described in this Report, as a result of new information, future events or changed circumstances or for any other reason after the date of this Report.
Overview/Introduction
Invesco Capital Management LLC (“Invesco”) has served as the managing owner (the “Managing Owner”), commodity pool operator and commodity trading advisor of the Fund since February 23, 2015. The Managing Owner is registered with the Commodity Futures Trading Commission (the “CFTC”) as a commodity pool operator and a commodity trading advisor, and it is a member firm of the National Futures Association (“NFA”).
The Fund seeks to track changes, whether positive or negative, in the level of the DBIQ Optimum Yield Precious Metals Index Excess Return™ (the “Index”) over time, plus the excess, if any, of the sum of the Fund’s interest income from its holdings of United States Treasury Obligations (“Treasury Income”), dividends from its holdings in money market mutual funds (affiliated or otherwise) (“Money Market Income”) and dividends or distributions of capital gains from its holdings ofT-Bill ETFs (as defined below)(“T-Bill ETF Income”) over the expenses of the Fund. The Fund invests in futures contracts in an attempt to track its Index. The Index is intended to reflect the change in market value of the precious metals sector. The commodities comprising the Index are gold and silver (each an “Index Commodity,” and collectively, the “Index Commodities”).
The Fund may invest directly in United States Treasury Obligations. The Fund may also gain exposure to United States Treasury Obligations through investments in exchange-traded funds (“ETFs”) (affiliated or otherwise) that track indexes that measure the performance of United States Treasury Obligations with a maximum remaining maturity of up to 12 months(“T-Bill ETFs”). The Fund invests in United States Treasury Obligations, money market mutual funds andT-Bill ETFs (affiliated or otherwise), if any, for margin and/or cash management purposes.
The Fund pursues its investment objective by investing in a portfolio of exchange-traded commodity futures contracts that expire in a specific month and trade on a specific exchange (the “Index Contracts”) in the Index Commodities. The notional amounts of each Index Commodity included in the Index are broadly in proportion to historic levels of the world’s production and stocks of the Index Commodities. The Fund also holds United States Treasury Obligations andT-Bill ETFs, if any, for deposit with Morgan Stanley & Co. LLC, the Fund’s commodity broker (the “Commodity Broker”) as margin, to the extent permissible under CFTC rules and United States Treasury Obligations, cash, money market mutual funds andT-Bill ETFs (affiliated or otherwise), if any, on deposit with The Bank of New York Mellon (the “Custodian”), for cash management purposes. The aggregate notional value of the commodity futures contracts owned by the Fund is expected to approximate the aggregate net asset value (“NAV”) of the Fund, as opposed to the aggregate Index value.
The CFTC and certain futures exchanges impose position limits on futures contracts, including on Index Contracts. As the Fund approaches or reaches position limits with respect to an Index Commodity, the Fund may commence investing in Index Contracts that reference other Index Commodities. In those circumstances, the Fund may also trade in futures contracts based on commodities other than Index Commodities that the Managing Owner reasonably believes tend to exhibit trading prices that correlate with an Index Contract. In addition, the Managing Owner may determine to invest in other futures contracts if at any time it is impractical or inefficient to gain full or partial exposure to an Index Commodity through the use of Index Contracts. These other futures contracts may or may not be based on an Index Commodity. When they are not, the Managing Owner may seek to select futures contracts that it reasonably believes tend to exhibit trading prices that correlate with an Index Contract.
The Shares are intended to provide investment results that generally correspond to the changes, positive or negative, in the levels of the Index over time. The value of the Shares is expected to fluctuate in relation to changes in the value of the Fund’s portfolio. The market price of the Shares may not be identical to the NAV per Share, but these two valuations are expected to be very close.
Margin Calls
“Initial” or “original” margin is the minimum amount of funds that must be deposited by a futures trader with his commodity broker in order to initiate futures trading or to maintain an open position in futures contracts. “Maintenance” margin is the amount (generally less than initial margin) to which a trader’s account may decline before he must deliver additional margin. A margin deposit is like a cash performance bond. It helps assure the futures trader’s performance of the futures contract that the trader purchases or
21
sells. Futures contracts are customarily bought and sold on margin that represents a very small percentage (ranging upward from less than 2%) of the purchase price of the underlying commodity being traded. Because of such low margins, price fluctuations occurring in the futures markets may create profits and losses that are greater, in relation to the amount invested, than are customary in other forms of investments. The minimum amount of margin required in connection with a particular futures contract is set from time to time by the exchange on which such contract is traded, and may be modified from time to time by the exchange during the term of the contract. “Variation margin” is assessed daily to reflect changes in the value of the position.
Brokerage firms carrying accounts for traders in futures contracts may not accept lower, and generally require higher, amounts of margin as a matter of policy in order to afford further protection for themselves.
Margin requirements are computed each day by a commodity broker. When the market value of a particular open futures contract position changes to a point where the margin on deposit does not satisfy maintenance margin requirements, a margin call is made by the commodity broker. If the margin call is not met within a reasonable time, the broker may close out the Fund’s position. With respect to the Managing Owner’s trading, only the Managing Owner, and not the Fund or its Shareholders personally, will be subject to margin calls.
Position Limits and/or Accountability Levels
The Fund has not reached position limits with respect to the 2018, 2017 and 2016 reporting periods.
Net Asset Value
NAV means the total assets of the Fund, including, but not limited to, all commodity futures contracts, cash and investments less total liabilities of the Fund, each determined on the basis of U.S. generally accepted accounting principles (“U.S. GAAP”), consistently applied under the accrual method of accounting. All open commodity futures contracts will be calculated at their then current market value, which will be based upon the settlement price for that particular commodity futures contract traded on the applicable primary exchange on the date with respect to which NAV is being determined. Securities for which market quotations are not readily available or became unreliable are valued at fair value as determined in good faith following procedures approved by the Managing Owner. The amount of any distribution is a liability of the Fund from the day when the distribution is declared until it is paid.
NAV per Share is the NAV of the Fund divided by the number of outstanding Shares.
Market Risk
Trading in futures contracts involves the Fund entering into contractual commitments to purchase a particular commodity at a specified date and price. The market risk associated with the Fund’s commitments to purchase commodities is limited to the gross or face amount of the contracts held.
The Fund’s exposure to market risk is also influenced by a number of factors including the volatility of interest rates and foreign currency exchange rates, the liquidity of the markets in which the contracts are traded and the relationships among the contracts held. The inherent uncertainty of the Fund’s trading as well as the development of drastic market occurrences could ultimately lead to a loss of all or substantially all of the investors’ capital.
Credit Risk
When the Fund enters into futures contracts, the Fund is exposed to credit risk that the counterparty to the contract will not meet its obligations. The counterparty for futures contracts traded on United States and on most foreign futures exchanges is the clearing house associated with the particular exchange. In general, clearing houses are backed by their corporate members who may be required to share in the financial burden resulting from the nonperformance by one of their members and, as such, is designed to disperse and mitigate the credit risk posed by any other one member. In cases where the clearing house is not backed by the clearing members (i.e., some foreign exchanges), it may be backed by a consortium of banks or other financial institutions. There can be no assurance that any counterparty, clearing member or clearinghouse will meet its obligations to the Fund.
The Commodity Broker, when acting as the Fund’s futures commission merchant in accepting orders for the purchase or sale of domestic futures contracts, is required by CFTC regulations to separately account for and segregate as belonging to the Fund all assets of the Fund relating to domestic futures trading. The Commodity Broker is not allowed to commingle such assets with other assets of the Commodity Broker. In addition, CFTC regulations also require the Commodity Broker to hold in a secure account assets of the Fund related to foreign futures trading. While the legal requirements are designed to protect the customers of futures commission merchants, a failure by the Commodity Broker to comply with those requirements would be likely to have a material adverse effect on the Fund in the event that the Commodity Broker became insolvent or suffered other financial distress.
22
Liquidity
The Fund’s entire source of capital is derived from the Fund’s offering of Shares to Authorized Participants. The Fund in turn allocates its net assets to commodity futures trading. A significant portion of the NAV is held in United States Treasury Obligations, which may be used as margin for the Fund’s trading in commodity futures contracts and United States Treasury Obligations, money market mutual funds, cash andT-Bill ETFs, if any, which may be used for cash management purposes. The percentage that United States Treasury Obligations bear to the total net assets will vary from period to period as the market values of the Fund’s commodity interests change. A portion of the Fund’s United States Treasury Obligations are held for deposit with the Commodity Broker to meet margin requirements. All remaining cash, money market mutual funds,T-Bill ETFs, if any, and United States Treasury Obligations are on deposit with the Custodian. Interest earned on the Fund’s interest-bearing funds and dividends from the Fund’s holdings of money market mutual funds are paid to the Fund. Any dividends or distributions of capital gains received from the Fund’s holdings ofT-Bill ETFs, if any, are paid to the Fund.
The Fund’s commodity futures contracts may be subject to periods of illiquidity because of market conditions, regulatory considerations or for other reasons. For example, commodity exchanges generally have the ability to limit fluctuations in certain commodity futures contract prices during a single day by regulations referred to as “daily limits.” During a single day, no trades may be executed at prices beyond the daily limit. Once the price of a particular futures contract for a particular commodity has increased or decreased by an amount equal to the daily limit, positions in the commodity futures contract can neither be taken nor liquidated unless the traders are willing to effect trades at or within the limit. Commodity futures prices have occasionally moved the daily limit for several consecutive days with little or no trading. Such market conditions could prevent the Fund from promptly liquidating its commodity futures positions.
Because the Fund trades futures contracts, its capital is at risk due to changes in the value of futures contracts (market risk) or the inability of counterparties (including the Commodity Broker and/or exchange clearinghouses) to perform under the terms of the contracts (credit risk).
On any business day, an Authorized Participant may place an order with the Transfer Agent to redeem one or more Baskets. Redemption orders must be placed by 10:00 a.m., Eastern Time. The day on which the Managing Owner receives a valid redemption order is the redemption order date. The day on which a redemption order is settled is the redemption order settlement date. As provided below, the redemption order settlement date may occur up to two business days after the redemption order date. Redemption orders are irrevocable. The redemption procedures allow Authorized Participants to redeem Baskets. Individual Shareholders may not redeem directly from the Fund. Instead, individual Shareholders may only redeem Shares in integral multiples of 200,000 and only through an Authorized Participant.
Unless otherwise agreed to by the Managing Owner and the Authorized Participant as provided in the next sentence, by placing a redemption order, an Authorized Participant agrees to deliver the Baskets to be redeemed through DTC’s book-entry system to the Fund no later than the redemption order settlement date as of 2:45 p.m., Eastern Time, on the business day immediately following the redemption order date. Upon submission of a redemption order, the Authorized Participant may request the Managing Owner to agree to a redemption order settlement date up to two business days after the redemption order date. By placing a redemption order, and prior to receipt of the redemption proceeds, an Authorized Participant’s DTC account is charged thenon-refundable transaction fee due for the redemption order.
Redemption orders may be placed either (i) through the Continuous Net Settlement (“CNS”) clearing processes of the National Securities Clearing Corporation (the “NSCC”) (the “CNS Clearing Process”) or (ii) if outside the CNS Clearing Process, only through the facilities of The Depository Trust Company (“DTC” or the “Depository”) (the “DTC Process”), or a successor depository, and only in exchange for cash. By placing a redemption order, and prior to receipt of the redemption proceeds, an Authorized Participant’s DTC account is charged thenon-refundable transaction fee due for the redemption order and such fee is not borne by the Fund.
Capital Resources
The Fund does not have any material commitments for capital expenditures as of the end of the latest fiscal period.
The Fund is unaware of any (i) anticipated known demands, commitments or capital expenditures; (ii) material trends, favorable or unfavorable, in its capital resources; or (iii) trends or uncertainties that will have a material effect on operations.
Cash Flows
A primary cash flow activity of the Fund is to raise capital from Authorized Participants through the issuance of Shares. This cash is used to invest in United States Treasury Obligations, money market mutual funds andT-Bill ETFs, if any, and to meet margin requirements as a result of the positions taken in futures contracts to match the fluctuations of the Index the Fund is tracking.
As of the date of this Report, each of Bank of America Merrill Lynch, BMO Capital Markets Corp., BNP Paribas Securities Corp, Cantor Fitzgerald & Co., Citadel Securities LLC, Citigroup Global Markets, Credit Suisse Securities (USA) LLC, Deutsche Investment Management Americas Inc., Goldman Sachs & Co., Goldman Sachs Execution & Clearing LP, Interactive Brokers LLC, Jefferies LLC, JP Morgan Securities Inc., Knight Clearing Services LLC, Merrill Lynch Professional Clearing Corp, Morgan Stanley & Co. LLC, Nomura Securities International Inc., RBC Capital Markets LLC, SG Americas Securities LLC, Timber Hill LLC, UBS Securities, Virtu Financial BD LLC and Virtu Financial Capital Markets LLC has executed a Participant Agreement and are the only Authorized Participants.
23
Operating Activities
Net cash flow provided by (used for) operating activities was $36.8 million, (1.7) million and $(50.5) million for the years ended December 31, 2018, 2017 and 2016, respectively. These amounts primarily include net income (loss), net purchases and sales of money market mutual funds and net purchases and sales of United States Treasury Obligations and affiliated investments. The Fund invests in futures contracts in an attempt to track its Index. The Fund invests in United States Treasury Obligations, money market mutual funds andT-Bill ETFs (affiliated or otherwise), if any, for margin and/or cash management purposes only.
During the year ended December 31, 2018, $332.0 million was paid to purchase United States Treasury Obligations and $371.7 million was received from sales and maturing United States Treasury Obligations. During the year ended December 31, 2017, $433.6 million was paid to purchase United States Treasury Obligations and $426.9 million was received from sales and maturing United States Treasury Obligations. During the year ended December 31, 2016, $866.2 million was paid to purchase United States Treasury Obligations and $829.4 million was received from sales and maturing United States Treasury Obligations. $190.7 million was received from sales of affiliated investments and $185.4 million was paid to purchase affiliated investments during the year ended December 31, 2018. $249.2 million was received from sales of affiliated investments and $254.9 million was paid to purchase affiliated investments during the year ended December 31, 2017. $143.2 million was received from sales of affiliated investments and $151.3 million was paid to purchase affiliated investments during the year ended December 31, 2016.
Financing Activities
The Fund’s net cash flow provided by (used for) financing activities was $(37.4) million, $0.4 million and $49.0 million during the years ended December 31, 2018, 2017 and 2016, respectively. This included $45.7 million, $52.7 million and $232.2 million from the sale of Shares to Authorized Participants and $82.9 million, $52.2 million and $183.2 million from Shares redeemed by Authorized Participants during the years ended December 31, 2018, 2017 and 2016, respectively. During the year ended December 31, 2018, distributions paid to shareholders was $1.3 million. During the year ended December 31, 2017, distributions paid to shareholders was $0.2 million. There were no distributions paid to shareholders during the years ended December 31, 2016.
Results of Operations
FOR THE YEARS ENDED DECEMBER 31, 2018, 2017 AND 2016
The following graphs illustrate the percentage changes in (i) the market price of the Shares (as reflected by the line “Market”), (ii) the Fund’s NAV (as reflected by the line “NAV”), and (iii) the closing levels of the Index (as reflected by the line“DBIQ-Opt Yield Precious Metals Index ER”). Whenever the Treasury Income, Money Market Income andT-Bill ETF Income, if any, earned by the Fund exceeds Fund expenses, the price of the Shares generally exceeds the levels of the Index primarily because the Share price reflects Treasury Income, Money Market Income andT-Bill ETF Income from the Fund’s collateral holdings whereas the Index does not consider such income. There can be no assurances that the price of the Shares or the Fund’s NAV will exceed the Index levels.
No representation is being made that the Index will or is likely to achieve closing levels consistent with or similar to those set forth herein. Similarly, no representation is being made that the Fund will generate profits or losses similar to the Fund’s past performance or changes in the Index closing levels.
24
COMPARISON OF MARKET, NAV ANDDBIQ-OPT YIELD PRECIOUS METALS INDEX ER
FOR THE YEARS ENDED DECEMBER 31, 2018, 2017 AND 2016
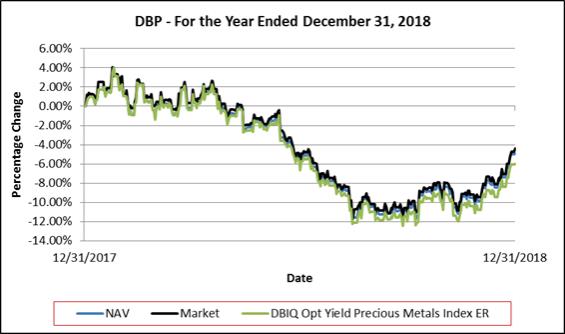
NEITHER THE PAST PERFORMANCE OF THE FUND NOR THE PRIOR INDEX LEVELS AND CHANGES,
POSITIVE OR NEGATIVE, SHOULD BE TAKEN AS AN INDICATION OF THE FUND’S FUTURE PERFORMANCE.
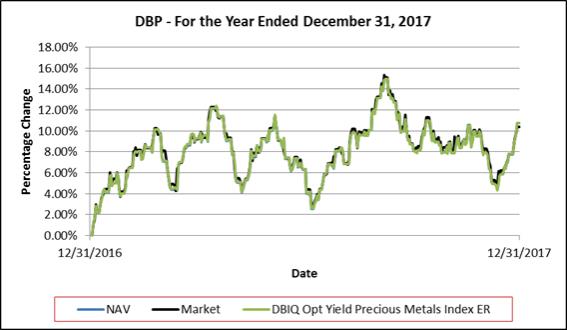
NEITHER THE PAST PERFORMANCE OF THE FUND NOR THE PRIOR INDEX LEVELS AND CHANGES,
POSITIVE OR NEGATIVE, SHOULD BE TAKEN AS AN INDICATION OF THE FUND’S FUTURE PERFORMANCE.
25
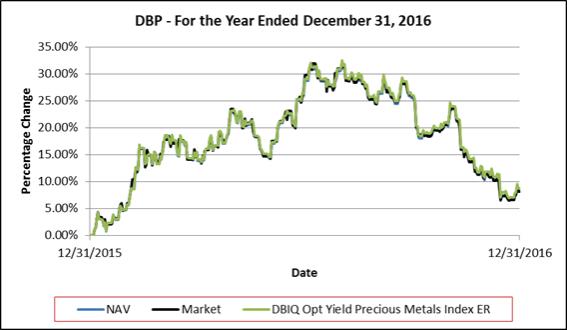
NEITHER THE PAST PERFORMANCE OF THE FUND NOR THE PRIOR INDEX LEVELS AND CHANGES,
POSITIVE OR NEGATIVE, SHOULD BE TAKEN AS AN INDICATION OF THE FUND’S FUTURE PERFORMANCE.
Performance Summary
This Report covers the years ended December 31, 2018, 2017 and 2016.
Past performance of the Fund is not necessarily indicative of future performance.
The Index is intended to reflect the change in market value of the Index Commodities. In turn, the Index is intended to reflect the precious metals sector. The DBIQ Optimum Yield Precious Metals Index Total Return ™, (the“DBIQ-OY Precious Metals TR™”) consists of the Index plus3-month United States Treasury Obligations returns. Past Index results are not necessarily indicative of future changes, positive or negative, in the Index closing levels. Past Index results are not necessarily indicative of future changes, positive or negative, in the Index closing levels.
The section “Summary of theDBIQ-OY Precious Metals TR™ and Underlying Index Commodity Returns for the years ended December 31, 2018, 2017 and 2016” below provides an overview of the changes in the closing levels ofDBIQ-OY Precious Metals TR™ by disclosing the change in market value of each underlying component Index Commodity through a “surrogate” (and analogous) index plus3-month United States Treasury Obligations returns. Please note also that the Fund’s objective is to track the Index (not theDBIQ-OY Precious Metals TR™), and the Fund does not attempt to outperform or underperform the Index. The Index employs the optimum yield roll method with the objective of mitigating the negative effects of contango, the condition in which distant delivery prices for futures exceed spot prices, and maximizing the positive effects of backwardation, a condition opposite of contango.
Summary of theDBIQ-OY Precious Metals TR™ and Underlying Index Commodity Returns for the Years Ended
December 31, 2018, 2017 and 2016
| AGGREGATE RETURNS FOR INDICES IN THE DBIQ-OY Precious Metals TR™ | ||||||||||||
| Years Ended December 31, | ||||||||||||
Underlying Index | 2018 | 2017 | 2016 | |||||||||
DB Gold Indices | (2.76 | )% | 13.17 | % | 7.62 | % | ||||||
DB Silver Indices | (10.09 | ) | 6.17 | 14.85 | ||||||||
|
|
|
|
|
| |||||||
AGGREGATE RETURN | (4.15 | )% | 11.78 | % | 9.10 | % | ||||||
|
|
|
|
|
| |||||||
26
If the Fund’s Treasury Income, Money Market Income andT-Bill ETF Income were to exceed the Fund’s fees and expenses, the aggregate return on an investment in the Fund would be expected to outperform the Index and underperform theDBIQ-OY Precious Metals TR™. The only difference between (i) the Index (the “Excess Return Index”) and (ii) theDBIQ-OY Precious Metals TR™ (the “Total Return Index”) is that the Excess Return Index does not include interest income from fixed income securities while the Total Return Index does include such a component. Thus, the difference between the Excess Return Index and the Total Return Index is attributable entirely to the interest income attributable to the fixed income securities reflected in the Total Return Index. The Total Return Index does not actually hold any fixed income securities. If the Fund’s Treasury Income, Money Market Income andT-Bill ETF Income, if any, exceeds the Fund’s fees and expenses, then the amount of such excess is expected to be distributed periodically. The market price of the Shares is expected to closely track the Excess Return Index. The aggregate return on an investment in the Fund over any period is the sum of the capital appreciation or depreciation of the Shares over the period, plus the amount of any distributions during the period. Consequently, the Fund’s aggregate return is expected to outperform the Excess Return Index by the amount of the excess, if any, of the Fund’s Treasury Income, Money Market Income andT-Bill ETF Income over its fees and expenses. As a result of the Fund’s fees and expenses, however, the aggregate return on the Fund is expected to underperform the Total Return Index. If the Fund’s fees and expenses were to exceed the Fund’s Treasury Income, Money Market Income andT-Bill ETF Income, if any, the aggregate return on an investment in the Fund is expected to underperform the Excess Return Index.
FOR THE YEARS ENDED DECEMBER 31, 2018, 2017 AND 2016
Fund Share Price Performance
For the year ended December 31, 2018, the NYSE Arca market value of each Share decreased 4.37% from $38.51 per Share to $36.37 per Share. The Share price low and high for the year ended December 31, 2018 and related change from the Share price on December 31, 2017 was as follows: Shares traded at a low of $34.00 per Share(-11.70%) on August 15, 2018, and a high of $40.08 per Share (+4.08%) on January 24, 2018. On December 31, 2018, the Fund paid a distribution of $0.44954 for each General Share and Share to holders of record as of December 26, 2018. Therefore, the total return for the Fund, on a market value basis was-4.37%.
For the year ended December 31, 2017, the NYSE Arca market value of each Share increased 10.54% from $34.88 per Share to $38.51 per Share. The Share price high and low for the year ended December 31, 2017 and related change from the Share price on December 31, 2016 was as follows: Shares traded at a low of $35.27 per Share (+1.10%) on January 3, 2017, and a high of $40.23 per Share (+15.34%) on September 7, 2017. On December 29, 2017, the Fund paid a distribution of $0.04534 for each General Share and Share to holders of record as of December 19, 2017. Therefore, the total return for the Fund, on a market value basis was +10.54%.
For the year ended December 31, 2016, the NYSE Arca market value of each Share increased 8.16% from $32.25 per Share to $34.88 per Share. The Share price high and low for the year ended December 31, 2016 and related change from the Share price on December 31, 2015 was as follows: Shares traded at a low of $32.62 per Share (+1.15%) on January 4, 2016, and a high of $42.62 per Share (+32.18%) on August 2, 2016. No distributions were paid to Shareholders during the year ended December 31, 2016. Therefore, the total return for the Fund, on a market value basis was +8.16%.
Fund Share Net Asset Performance
For the year ended December 31, 2018, the NAV of each Share decreased 5.00% from $38.68 per Share to $36.29 per Share. Falling commodity futures contracts prices for gold and silver futures contracts during the year ended December 31, 2018 contributed to an overall 6.02% decrease in the level of the Index and to a 4.15% decrease in the level of theDBIQ-OY Precious Metals TR™. On December 31, 2018, the Fund paid a distribution of $0.44954 for each General Share and Share to holders of record as of December 26, 2018. Therefore, the total return for the Fund on a NAV basis was-5.00%.
Net income (loss) for the year ended December 31, 2018 was $(7.4) million, resulting from $2.5 million of income, net realized gains (losses) of $(4.5) million, net change in unrealized gains (losses) of $(4.3) million and operating expenses of $1.1 million.
For the year ended December 31, 2017, the NAV of each Share increased 10.87% from $34.93 per Share to $38.68 per Share. Rising commodity futures contracts prices for gold and silver futures contracts during the year ended December 31, 2017 contributed to an overall 10.75% increase in the level of the Index and to a 11.78% increase in the level of theDBIQ-OY Precious Metals TR™. On December 29, 2017, the Fund paid a distribution of $0.04534 for each General Share and Share to holders of record as of December 19, 2017. Therefore, the total return for the Fund, on a NAV basis was +10.87%.
Net income (loss) for the year ended December 31, 2017 was $14.6 million, resulting from $1.3 million of income, net realized gains (losses) of $(14.7) million, net change in unrealized gains (losses) of $29.2 million and operating expenses of $1.2 million.
27
For the year ended December 31, 2016, the NAV of each Share increased 8.21% from $32.28 per Share to $34.93 per Share. Rising commodity futures contracts prices for gold and silver during the year ended December 31, 2016 contributed to an overall 9.10% increase in the level of theDBIQ-OY Precious Metals TR™. No distributions were paid to Shareholders during the year ended December 31, 2016. Therefore, the total return for the Fund, on a NAV basis was +8.21%.
Net income (loss) for the year ended December 31, 2016 was $(6.1) million, resulting from $0.6 million of income, net realized gains (losses) of $12.4 million, net change in unrealized gains (losses) of $(17.6) million and operating expenses of $1.5 million.
Critical Accounting Policies
The Fund’s critical accounting policies are as follows:
Preparation of the financial statements and related disclosures in conformity with U.S. GAAP requires the application of appropriate accounting rules and guidance, as well as the use of estimates, and requires management to make estimates and assumptions that affect the reported amounts of assets and liabilities, revenue and expense and related disclosure of contingent assets and liabilities during the reporting period of the financial statements and accompanying notes. The Fund’s application of these policies involves judgments and actual results may differ from the estimates used. There were no significant estimates used in the preparation of these financial statements.
Commodity futures contracts, United States Treasury Obligations,T-Bill ETFs and money market mutual funds are recorded on a trade date basis and at fair value in the financial statements, with changes in fair value, if any, reported in the Statements of Income and Expenses.
The use of fair value to measure financial instruments, with related unrealized gains or losses recognized in earnings in each period is fundamental to the Fund’s financial statements. The fair value of a financial instrument is the amount that would be received to sell an asset or paid to transfer a liability in an orderly transaction between market participants at the measurement date (the exit price).
United States Treasury Obligations are fair valued using an evaluated quote provided by an independent pricing service. Futures contracts are valued at the final settlement price set by an exchange on which they are principally traded. Investments inopen-end andclosed-end registered investment companies that do not trade on an exchange are valued at the end of day NAV per share. Investments inopen-end andclosed-end registered investment companies that trade on an exchange are valued at the last sales price or official closing price as of the close of the customary trading session on the exchange where the security is principally traded. Financial Accounting Standards Board (“FASB”) Accounting Standards Codification for fair value measurement and disclosure guidance requires a fair value hierarchy that prioritizes the inputs to valuation techniques used to measure fair value. The objective of a fair value measurement is to determine the price that would be received to sell an asset or paid to transfer a liability in an orderly transaction between market participants at the measurement date (an exit price). The hierarchy gives the highest priority to unadjusted quoted prices for identical assets or liabilities (Level 1 measurements) and the lowest priority to unobservable inputs (Level 3 measurements). Assets and liabilities are classified in their entirety based on the lowest level of input that is significant to the fair value measurement. See Note 6 within the financial statements in Item 8 for further information.
Securities for which market quotations are not readily available or became unreliable are valued at fair value as determined in good faith following procedures approved by the Managing Owner. Issuer-specific events, market trends, bid/asked quotes of brokers and information providers and other data may be reviewed in the course of making a good faith determination of a security’s fair value.
Realized gains (losses) from the sale or disposition of securities or derivatives are determined on a specific identification basis and recognized in the Statements of Income and Expenses in the period in which the contract is closed or the sale or disposition occurs, respectively.
Interest income on United States Treasury Obligations is recognized on an accrual basis when earned. Premiums and discounts are amortized or accreted over the life of the United States Treasury Obligations. Dividend income (net of withholding tax, if any) is recorded on theex-dividend date.
Off-Balance Sheet Arrangements and Contractual Obligations
In the normal course of its business, the Fund is a party to financial instruments withoff-balance sheet risk. The term“off-balance sheet risk” refers to an unrecorded potential liability that, even though it does not appear on the balance sheet, may result in a future obligation or loss. The financial instruments used by the Fund are commodity futures, the values of which are based upon an underlying asset and generally represent future commitments which have a reasonable possibility to be settled in cash or through physical delivery. The financial instruments are traded on an exchange and are standardized contracts.
28
The Fund has not utilized, nor does it expect to utilize in the future, special purpose entities to facilitateoff-balance sheet financing arrangements and has no loan guarantee arrangements oroff-balance sheet arrangements of any kind, other than agreements entered into in the normal course of business noted above, which may include indemnification provisions related to certain risks service providers undertake in providing services to the Fund. While the Fund’s exposure under such indemnification provisions cannot be estimated, these general business indemnifications are not expected to have a material impact on the Fund’s financial position. The Managing Owner expects the risk of loss relating to indemnification to be remote.
The Fund has financial obligations to the Managing Owner and the Commodity Broker under the Trust Agreement and its agreement with the Commodity Broker (the “Commodity Broker Agreement”), respectively. Management Fee payments made to the Managing Owner, pursuant to the Trust Agreement, are calculated as a fixed percentage of the Fund’s NAV. Commission payments to the Commodity Broker, pursuant to the Commodity Broker Agreement, are on acontract-by-contract, or round-turn, basis. As such, the Managing Owner cannot anticipate the amount of payments that will be required under these arrangements for future periods as NAVs and trading activity will not be known until a future date. The Fund’s agreement with the Commodity Broker may be terminated by either party for various reasons. All Management Fees and commission payments are paid to the Managing Owner and the Commodity Broker, respectively.
| ITEM 7A. | QUANTITATIVE AND QUALITATIVE DISCLOSURES ABOUT MARKET RISK |
INTRODUCTION
The Fund is designed to replicate positions in a commodity index. The market sensitive instruments held by it are subject to the risk of trading loss. Unlike an operating company, the risk of market sensitive instruments is integral, not incidental, to the Fund’s main line of business.
Market movements can produce frequent changes in the fair market value of the Fund’s open positions and, consequently, in its earnings and cash flow. The Fund’s market risk is primarily influenced by changes in the prices of commodities.
Standard of Materiality
Materiality as used in this section, “Quantitative and Qualitative Disclosures About Market Risk,” is based on an assessment of reasonably possible market movements and the potential losses caused by such movements, taking into account the effects of margin, and any other multiplier features, as applicable, of the Fund’s market sensitive instruments.
QUANTIFYING THE FUND’S TRADING VALUE AT RISK
Quantitative Forward-Looking Statements
The following quantitative disclosures regarding the Fund’s market risk exposures contain “forward-looking statements” within the meaning of the safe harbor from civil liability provided for such statements by the Private Securities Litigation Reform Act of 1995 (set forth in Section 27A of the Securities Act of 1933 (the “Securities Act”) and Section 21E of the Exchange Act). All quantitative disclosures in this section are deemed to be forward-looking statements for purposes of the safe harbor, except for statements of historical fact (such as the dollar amount of maintenance margin required for market risk sensitive instruments held at the end of the reporting period).
Value at Risk (“VaR”) is a statistical measure of the value of losses that would not be expected to be exceeded over a given time horizon and at a given probability level arising from movement of underlying risk factors. Loss is measured as a decline in the fair value of the portfolio as a result of changes in any of the material variables by which fair values are determined. VaR is measured over a specified holding period (one day) and to a specified level of statistical confidence (99th percentile). However, the inherent uncertainty in the markets in which the Fund trades and the recurrence in the markets traded by the Fund of market movements far exceeding expectations could result in actual trading ornon-trading losses far beyond the indicated VaR or the Fund’s experience to date (i.e., “risk of ruin”). In light of these considerations, as well as the risks and uncertainties intrinsic to all future projections, the following VaR presentation does not constitute any assurance or representation that the Fund’s losses in any market sector will be limited to VaR.
THE FUND’S TRADING VALUE AT RISK
The Fund calculates VaR using the actual historical market movements of the Fund’s net assets.
29
The following table indicates the trading VaR associated with the Fund’s net assets as of December 31, 2018.
| For the Year Ended | ||||||||||||||||
| December 31, 2018 | ||||||||||||||||
Description | Net Assets | Daily Volatility | VaR* (99 Percentile) | Number of times VaR Exceeded | ||||||||||||
Invesco DB Precious Metals Fund | $ | 108,880,930 | 0.59 | % | $ | 1,507,556 | 20 | |||||||||
The following table indicates the trading VaR associated with the Fund’s net assets as of December 31, 2017.
| For the Year Ended | ||||||||||||||||
| December 31, 2017 | ||||||||||||||||
Description | Net Assets | Daily Volatility | VaR* (99 Percentile) | Number of times VaR Exceeded | ||||||||||||
Invesco DB Precious Metals Fund | $ | 154,730,992 | 0.58 | % | $ | 2,093,635 | 10 | |||||||||
| * | The VaR represents the one day downside risk, under normal market conditions, with a 99% confidence level. It is calculated using historical market moves of the Fund’s net assets and uses a one year look back. |
THE FUND’SNON-TRADING MARKET RISK
The Fund hasnon-trading market risk as a result of investing in short-term United States Treasury Obligations,T-Bill ETFs and money market mutual funds. The market risk represented by these investments is not expected to be material. Although the Fund purchases and sells shares ofT-Bill ETFs on an exchange, it does not establish or liquidate those positions for trading purposes.
QUALITATIVE DISCLOSURES REGARDING PRIMARY TRADING MARKET RISK EXPOSURES
The following qualitative disclosures regarding the Fund’s market risk exposures—except for those disclosures that are statements of historical fact—constitute forward-looking statements within the meaning of Section 27A of the Securities Act and Section 21E of the Exchange Act. The Fund’s primary market risk exposures are subject to numerous uncertainties, contingencies and risks. Government interventions, defaults and expropriations, illiquid markets, the emergence of dominant fundamental factors, political upheavals, changes in historical price relationships, an influx of new market participants, increased regulation and many other factors could result in material losses as well as in material changes to the risk exposures of the Fund. The Fund’s current market exposure may change materially. Investors may lose all or substantially all of their investment in the Fund.
The following were the primary trading risk exposures of the Fund as of December 31, 2018 by Index Commodity:
Gold
The price of gold is volatile and is affected by numerous factors. Gold prices float freely in accordance with supply and demand. The price movement of gold may be influenced by a variety of factors, including announcements from central banks regarding reserve gold holdings, agreements among central banks, purchases and sales of gold by central banks, other governmental agencies that hold large supplies of gold, political uncertainties, economic concerns such as an increase or decrease in confidence in the global monetary system, the relative strength of the U.S. dollar, interest rates and numerous other factors. Gold prices may also be affected by industry factors such as industrial and jewelry demand.
Silver
The price of silver is volatile and is affected by numerous factors. The largest industrial users of silver (e.g., photographic, jewelry, and electronic industries) may influence its price. A change in economic conditions, such as a recession, can adversely affect industries which are dependent upon the use of silver. In turn, such a negative economic impact may decrease demand for silver, and, consequently, its price. Worldwide speculation and hedging activity by silver producers may also impact its price.
QUALITATIVE DISCLOSURES REGARDINGNON-TRADING MARKET RISK EXPOSURE
As noted above, the Fund hasnon-trading market risk as a result of investing in short-term United States Treasury Obligations,T-Bill ETFs and money market mutual funds. The market risk represented by these investments is not expected to be material.
QUALITATIVE DISCLOSURES REGARDING MEANS OF MANAGING RISK EXPOSURE
Under ordinary circumstances, the Managing Owner’s exercise of discretionary power is limited to determining whether the Fund will make a distribution. Under emergency or extraordinary circumstances, the Managing Owner’s use of its discretionary powers may increase. These special circumstances, for example, include the unavailability of the Index or certain natural or manmade disasters. The Managing Owner does not actively manage the Fund to avoid losses. The Fund only takes long positions in investments and does not employ “stop-loss” techniques.
30
ITEM 8. FINANCIAL STATEMENTS AND SUPPLEMENTARY DATA
Index to Financial Statements
31
Report of Management on Internal Control
Over Financial Reporting
Management of Invesco Capital Management LLC, as managing owner (the “Managing Owner”) of Invesco DB Precious Metals Fund (the “Fund”), is responsible for establishing and maintaining adequate internal control over financial reporting, as defined in Rules13a-15(f) and15d-15(f) of the Securities Exchange Act of 1934, as amended (the “Exchange Act”). Internal control over financial reporting is a process designed to provide reasonable assurance regarding the reliability of financial reporting and the preparation of financial statements for external purposes in accordance with generally accepted accounting principles.
Because of its inherent limitations, internal control over financial reporting may not prevent or detect misstatements. Also, projections of any evaluation of effectiveness to future periods are subject to the risk that controls may become inadequate because of changes in conditions, or that the degree of compliance with the policies or procedures may deteriorate.
We, Daniel Draper, Principal Executive Officer, and Kelli Gallegos, Principal Financial and Accounting Officer, Investment Pools, of the Managing Owner, assessed the effectiveness of the Fund’s internal control over financial reporting as of December 31, 2018. In making this assessment, we used the criteria set forth by the Committee of Sponsoring Organizations of the Treadway Commission (“COSO”) in Internal Control—Integrated Framework (2013). Based on our assessment and those criteria, we have concluded that the Fund maintained effective internal control over financial reporting as of December 31, 2018.
The Fund’s independent registered public accounting firm, PricewaterhouseCoopers LLP, has audited the Fund’s internal control over financial reporting as of December 31, 2018, as stated in their report on page 33 of the Fund’s Annual Report onForm 10-K.
| By: | /S/ DANIEL DRAPER | |
| Name: | Daniel Draper | |
| Title: | Principal Executive Officer of the Managing Owner | |
| By: | /S/ KELLI GALLEGOS | |
| Name: | Kelli Gallegos | |
| Title: | Principal Financial and Accounting Officer, Investment Pools, of the Managing Owner | |
February 27, 2019
32
Report of Independent Registered Public Accounting Firm
To the Board of Managers of Invesco DB Multi-Sector Commodity Trust and Shareholders of Invesco DB Precious Metals Fund
Opinions on the Financial Statements and Internal Control over Financial Reporting
We have audited the accompanying statements of financial condition, including the schedules of investments of Invesco DB Precious Metals Fund (one of the funds constituting Invesco DB Multi-Sector Commodity Trust, hereafter referred to as the “Fund”) as of December 31, 2018 and December 31, 2017,and the related statements of income and expenses, of changes in shareholders’ equity and of cash flows for each of the three years in the period ended December 31, 2018, including the related notes (collectively referred to as the “financial statements”).We also have audited the Fund’s internal control over financial reporting as of December 31, 2018, based on criteria established inInternal Control—Integrated Framework (2013) issued by the Committee of Sponsoring Organizations of the Treadway Commission (COSO).
In our opinion, thefinancial statements referred to above present fairly, in all material respects, the financial position of the Fund as of December 31, 2018 and December 31, 2017, and the results of its operations and its cash flows for each of the three years in the period ended December 31, 2018in conformity with accounting principles generally accepted in the United States of America. Also in our opinion, the Fund maintained, in all material respects, effective internal control over financial reporting as of December 31, 2018, based on criteria established inInternal Control—Integrated Framework (2013) issued by the COSO.
Basis for Opinions
The Fund’s management is responsible for these financial statements, for maintaining effective internal control over financial reporting, and for its assessment of the effectiveness of internal control over financial reporting, included in the accompanying Report of Management on Internal Control Over Financial Reporting. Our responsibility is to express opinions on the Fund’sfinancial statements and on the Fund’s internal control over financial reporting based on our audits. We are a public accounting firm registered with the Public Company Accounting Oversight Board (United States) (“PCAOB”) and are required to be independent with respect to the Fund in accordance with the U.S. federal securities laws and the applicable rules and regulations of the Securities and Exchange Commission and the PCAOB.
We conducted our audits in accordance with the standards of the PCAOB. Those standards require that we plan and perform the audits to obtain reasonable assurance about whether thefinancial statements are free of material misstatement, whether due to error or fraud, and whether effective internal control over financial reporting was maintained in all material respects.
Our audits of thefinancial statements included performing procedures to assess the risks of material misstatement of thefinancial statements, whether due to error or fraud, and performing procedures that respond to those risks. Such procedures included examining, on a test basis, evidence regarding the amounts and disclosures in thefinancial statements. Our audits also included evaluating the accounting principles used and significant estimates made by management, as well as evaluating the overall presentation of thefinancial statements. Our audit of internal control over financial reporting included obtaining an understanding of internal control over financial reporting, assessing the risk that a material weakness exists, and testing and evaluating the design and operating effectiveness of internal control based on the assessed risk. Our audits also included performing such other procedures as we considered necessary in the circumstances. We believe that our audits provide a reasonable basis for our opinions.
Definition and Limitations of Internal Control over Financial Reporting
A fund’s internal control over financial reporting is a process designed to provide reasonable assurance regarding the reliability of financial reporting and the preparation of financial statements for external purposes in accordance with generally accepted accounting principles. A fund’s internal control over financial reporting includes those policies and procedures that (i) pertain to the maintenance of records that, in reasonable detail, accurately and fairly reflect the transactions and dispositions of the assets of the fund; (ii) provide reasonable assurance that transactions are recorded as necessary to permit preparation of financial statements in accordance with generally accepted accounting principles, and that receipts and expenditures of the fund are being made only in accordance with authorizations of management and directors of the fund; and (iii) provide reasonable assurance regarding prevention or timely detection of unauthorized acquisition, use, or disposition of the fund’s assets that could have a material effect on the financial statements.
33
Because of its inherent limitations, internal control over financial reporting may not prevent or detect misstatements. Also, projections of any evaluation of effectiveness to future periods are subject to the risk that controls may become inadequate because of changes in conditions, or that the degree of compliance with the policies or procedures may deteriorate.
/s/ PricewaterhouseCoopers LLP
Chicago, Illinois
February 27, 2019
We have served as the Fund’s auditor since 2013.
34
Invesco DB Precious Metals Fund
Statements of Financial Condition
December 31, 2018 and 2017
| December 31, | December 31, | |||||||
| 2018 | 2017 | |||||||
Assets | ||||||||
United States Treasury Obligations, at value (cost $101,394,673 and $138,765,249, respectively) | $ | 101,406,388 | $ | 138,760,422 | ||||
Affiliated investments, at value and cost | 8,547,404 | 13,842,579 | ||||||
Other investments: | ||||||||
Variation margin receivable- Commodity Futures Contracts | 34,350 | 1,547,080 | ||||||
Cash held by custodian | — | 670,563 | ||||||
Receivable for: | ||||||||
Dividends from affiliates | 13,398 | 8,732 | ||||||
|
|
|
| |||||
Total assets | $ | 110,001,540 | $ | 154,829,376 | ||||
|
|
|
| |||||
Liabilities | ||||||||
Payable for: | ||||||||
Due to custodian | 1,045,728 | — | ||||||
Management fee | 69,878 | 93,370 | ||||||
Brokerage commissions and fees | 5,004 | 5,014 | ||||||
|
|
|
| |||||
Total liabilities | 1,120,610 | 98,384 | ||||||
|
|
|
| |||||
Commitments and Contingencies (Note 9) | ||||||||
Equity | ||||||||
Shareholder’s equity—General Shares | 1,452 | 1,547 | ||||||
Shareholders’ equity—Shares | 108,879,478 | 154,729,445 | ||||||
|
|
|
| |||||
Total shareholders’ equity | 108,880,930 | 154,730,992 | ||||||
|
|
|
| |||||
Total liabilities and equity | $ | 110,001,540 | $ | 154,829,376 | ||||
|
|
|
| |||||
General Shares outstanding | 40 | 40 | ||||||
Shares outstanding | 3,000,000 | 4,000,000 | ||||||
Net asset value per share | $ | 36.29 | $ | 38.68 | ||||
Market value per share | $ | 36.37 | $ | 38.51 | ||||
See accompanying Notes to Financial Statements which are an integral part of the financial statements.
35
Invesco DB Precious Metals Fund
December 31, 2018
Description | Percentage of Shareholders’ Equity | Value | Principal Value | |||||||||
United States Treasury Obligations(a) | ||||||||||||
U.S. Treasury Bills, 2.175% due January 3, 2019 | 22.96 | % | $ | 24,998,441 | $ | 25,000,000 | ||||||
U.S. Treasury Bills, 2.370% due February 28, 2019 | 5.49 | 5,977,426 | 6,000,000 | |||||||||
U.S. Treasury Bills, 2.430% due May 2, 2019(b) | 64.69 | 70,430,521 | 71,000,000 | |||||||||
|
|
|
| |||||||||
Total United States Treasury Obligations (cost $101,394,673) | 93.14 | % | $ | 101,406,388 | ||||||||
|
|
|
| |||||||||
| Shares | ||||||||||||
Affiliated Investments | ||||||||||||
Money Market Mutual Fund | ||||||||||||
Invesco Premier U.S. Government Money Portfolio- Institutional Class, 2.30% (cost $8,547,404)(c) | 7.85 | % | $ | 8,547,404 | 8,547,404 | |||||||
|
|
|
| |||||||||
Total Investments in Securities (cost $109,942,077) | 100.99 | % | $ | 109,953,792 | ||||||||
|
|
|
| |||||||||
| (a) | Security may be traded on a discount basis. The interest rate shown represents the discount rate at the most recent auction date of the security prior to period end. |
| (b) | United States Treasury Obligations of $12,003,200 are on deposit with the Commodity Broker and held as maintenance margin for open futures contracts. |
| (c) | The security and the Fund are advised by wholly-owned subsidiaries of Invesco Ltd. and are therefore considered to be affiliated. The rate shown is the7-day SEC standardized yield as of December 31, 2018. |
Open Commodity Futures Contracts | Number of Contracts | Expiration Date | Notional Value | Value(d) | Unrealized Appreciation (Depreciation)(d) | |||||||||||||||
Long Futures Contracts | ||||||||||||||||||||
COMEX Gold | 675 | February-2019 | $ | 86,487,750 | $ | 2,312,697 | $ | 2,312,697 | ||||||||||||
COMEX Silver | 284 | May-2019 | 22,188,920 | 1,238,077 | 1,238,077 | |||||||||||||||
|
|
|
| |||||||||||||||||
Total Commodity Futures Contracts | $ | 3,550,774 | $ | 3,550,774 | ||||||||||||||||
|
|
|
| |||||||||||||||||
| (d) | Unrealized Appreciation (Depreciation) and Value are presented above, net by contract. |
See accompanying Notes to Financial Statements which are an integral part of the financial statements.
36
Invesco DB Precious Metals Fund
December 31, 2017
Description | Percentage of Shareholders’ Equity | Value | Principal Value | |||||||||
United States Treasury Obligations(a) | ||||||||||||
U.S. Treasury Bills, 1.180% due January 4, 2018 | 54.29 | % | $ | 83,994,732 | $ | 84,000,000 | ||||||
U.S. Treasury Bills, 1.285% due February 22, 2018(b) | 6.45 | 9,982,150 | 10,000,000 | |||||||||
U.S. Treasury Bills, 1.285% due March 1, 2018(b) | 10.32 | 15,967,327 | 16,000,000 | |||||||||
U.S. Treasury Bills, 1.450% due June 7, 2018 | 18.62 | 28,816,213 | 29,000,000 | |||||||||
|
|
|
| |||||||||
Total United States Treasury Obligations (cost $138,765,249) | 89.68 | % | $ | 138,760,422 | ||||||||
|
|
|
| |||||||||
Affiliated Investments | ||||||||||||
| Shares | ||||||||||||
Money Market Mutual Fund | ||||||||||||
Invesco Premier U.S. Government Money Portfolio- Institutional Class, 1.15% (cost $13,842,579)(c) | 8.94 | % | $ | 13,842,579 | 13,842,579 | |||||||
|
|
|
| |||||||||
Total Investments in Securities (cost $152,607,828) | 98.62 | % | $ | 152,603,001 | ||||||||
|
|
|
| |||||||||
| (a) | Security may be traded on a discount basis. The interest rate shown represents the discount rate at the most recent auction date of the security prior to period end. |
| (b) | United States Treasury Obligations of $25,948,400 are on deposit with the Commodity Broker and held as maintenance margin for open futures contracts. |
| (c) | The security and the Fund are advised by wholly-owned subsidiaries of Invesco Ltd. and are therefore considered to be affiliated. The rate shown is the7-day SEC standardized yield as of December 31, 2017. |
Open Commodity Futures Contracts | Number of Contracts | Expiration Date | Notional Value | Value(d) | Unrealized Appreciation (Depreciation)(d) | |||||||||||||||
Long Futures Contracts | ||||||||||||||||||||
COMEX Gold | 940 | August-2018 | $ | 124,399,600 | $ | 7,820,930 | $ | 7,820,930 | ||||||||||||
COMEX Silver | 349 | December-2018 | 30,486,895 | 55,559 | 55,559 | |||||||||||||||
|
|
|
| |||||||||||||||||
Total Commodity Futures Contracts | $ | 7,876,489 | $ | 7,876,489 | ||||||||||||||||
|
|
|
| |||||||||||||||||
| (d) | Unrealized Appreciation (Depreciation) and Value are presented above, net by contract. |
See accompanying Notes to Financial Statements which are an integral part of the financial statements.
37
Invesco DB Precious Metals Fund
Statements of Income and Expenses
For the Years Ended December 31, 2018, 2017 and 2016
| 2018 | 2017 | 2016 | ||||||||||
Income | ||||||||||||
Interest Income | $ | 2,372,062 | $ | 1,278,292 | $ | 569,723 | ||||||
Dividends from Affiliates | 121,248 | 70,795 | 11,878 | |||||||||
|
|
|
|
|
| |||||||
Total Income | 2,493,310 | 1,349,087 | 581,601 | |||||||||
Expenses | ||||||||||||
Management Fee | 1,044,289 | 1,166,879 | 1,513,608 | |||||||||
Brokerage Commissions and Fees | 21,807 | 12,039 | 34,592 | |||||||||
Interest Expense | 10,193 | 2,132 | 5,249 | |||||||||
|
|
|
|
|
| |||||||
Total Expenses | 1,076,289 | 1,181,050 | 1,553,449 | |||||||||
|
|
|
|
|
| |||||||
Less: Waivers | (13,797 | ) | (18,297 | ) | (6,772 | ) | ||||||
|
|
|
|
|
| |||||||
Net Expenses | 1,062,492 | 1,162,753 | 1,546,677 | |||||||||
|
|
|
|
|
| |||||||
Net Investment Income (Loss) | 1,430,818 | 186,334 | (965,076 | ) | ||||||||
|
|
|
|
|
| |||||||
Net Realized and Net Change in Unrealized Gain (Loss) on United States Treasury Obligations, Affiliated Investments and Commodity Futures Contracts | ||||||||||||
Net Realized Gain (Loss) on | ||||||||||||
United States Treasury Obligations | (13,104 | ) | (1,449 | ) | 2,393 | |||||||
Commodity Futures Contracts | (4,466,982 | ) | (14,704,762 | ) | 12,494,189 | |||||||
|
|
|
|
|
| |||||||
Net Realized Gain (Loss) | (4,480,086 | ) | (14,706,211 | ) | 12,496,582 | |||||||
|
|
|
|
|
| |||||||
Net Change in Unrealized Gain (Loss) on | ||||||||||||
United States Treasury Obligations | 16,542 | (1,738 | ) | (2,483 | ) | |||||||
Commodity Futures Contracts | (4,325,715 | ) | 29,162,039 | (17,628,918 | ) | |||||||
|
|
|
|
|
| |||||||
Net Change in Unrealized Gain (Loss) | (4,309,173 | ) | 29,160,301 | (17,631,401 | ) | |||||||
|
|
|
|
|
| |||||||
Net Realized and Net Change in Unrealized Gain (Loss) on United States Treasury Obligations, Affiliated Investments and Commodity Futures Contracts | (8,789,259 | ) | 14,454,090 | (5,134,819 | ) | |||||||
|
|
|
|
|
| |||||||
Net Income (Loss) | $ | (7,358,441 | ) | $ | 14,640,424 | $ | (6,099,895 | ) | ||||
|
|
|
|
|
| |||||||
See accompanying Notes to Financial Statements which are an integral part of the financial statements.
38
Invesco DB Precious Metals Fund
Statement of Changes in Shareholders’ Equity
For the Year Ended December 31, 2018
| General Shares | Shares | Total | ||||||||||||||||||
| Shares | Total Equity | Shares | Total Equity | Shareholders’ Equity | ||||||||||||||||
Balance at December 31, 2017 | 40 | $ | 1,547 | 4,000,000 | $ | 154,729,445 | $ | 154,730,992 | ||||||||||||
|
|
|
|
|
|
|
|
|
| |||||||||||
Purchases of Shares | 1,200,000 | 45,744,082 | 45,744,082 | |||||||||||||||||
Redemption of Shares | (2,200,000 | ) | (82,887,065 | ) | (82,887,065 | ) | ||||||||||||||
|
|
|
|
|
| |||||||||||||||
Net Increase (Decrease) due to Share Transactions | (1,000,000 | ) | (37,142,983 | ) | (37,142,983 | ) | ||||||||||||||
Return of Capital Distributions | (18 | ) | (1,348,620 | ) | (1,348,638 | ) | ||||||||||||||
Net Income (Loss) | ||||||||||||||||||||
Net Investment Income (Loss) | 18 | 1,430,800 | 1,430,818 | |||||||||||||||||
Net Realized Gain (Loss) on United States Treasury Obligations, Affiliated Investments and Commodity Futures Contracts | (58 | ) | (4,480,028 | ) | (4,480,086 | ) | ||||||||||||||
Net Change in Unrealized Gain (Loss) on United States Treasury Obligations, Affiliated Investments and Commodity Futures Contracts | (37 | ) | (4,309,136 | ) | (4,309,173 | ) | ||||||||||||||
|
|
|
|
|
| |||||||||||||||
Net Income (Loss) | (77 | ) | (7,358,364 | ) | (7,358,441 | ) | ||||||||||||||
|
|
|
|
|
|
|
|
|
| |||||||||||
Net Change in Shareholders’ Equity | — | (95 | ) | (1,000,000 | ) | (45,849,967 | ) | (45,850,062 | ) | |||||||||||
|
|
|
|
|
|
|
|
|
| |||||||||||
Balance at December 31, 2018 | 40 | $ | 1,452 | 3,000,000 | $ | 108,879,478 | $ | 108,880,930 | ||||||||||||
|
|
|
|
|
|
|
|
|
| |||||||||||
See accompanying Notes to Financial Statements which are an integral part of the financial statements.
39
Invesco DB Precious Metals Fund
Statement of Changes in Shareholders’ Equity
For the Year Ended December 31, 2017
| General Shares | Shares | Total | ||||||||||||||||||
| Shares | Total Equity | Shares | Total Equity | Shareholders’ Equity | ||||||||||||||||
Balance at December 31, 2016 | 40 | $ | 1,397 | 4,000,000 | $ | 139,730,289 | $ | 139,731,686 | ||||||||||||
|
|
|
|
|
|
|
|
|
| |||||||||||
Purchases of Shares | 1,400,000 | 52,740,238 | 52,740,238 | |||||||||||||||||
Redemption of Shares | (1,400,000 | ) | (52,199,994 | ) | (52,199,994 | ) | ||||||||||||||
|
|
|
|
|
| |||||||||||||||
Net Increase (Decrease) due to Share Transactions | — | 540,244 | 540,244 | |||||||||||||||||
Return of Capital Distributions | (2 | ) | (181,360 | ) | (181,362 | ) | ||||||||||||||
Net Income (Loss) | ||||||||||||||||||||
Net Investment Income (Loss) | 2 | 186,332 | 186,334 | |||||||||||||||||
Net Realized Gain (Loss) on United States Treasury Obligations, Affiliated Investments and Commodity Futures Contracts | (149 | ) | (14,706,062 | ) | (14,706,211 | ) | ||||||||||||||
Net Change in Unrealized Gain (Loss) on United States Treasury Obligations, Affiliated Investments and Commodity Futures Contracts | 299 | 29,160,002 | 29,160,301 | |||||||||||||||||
|
|
|
|
|
| |||||||||||||||
Net Income (Loss) | 152 | 14,640,272 | 14,640,424 | |||||||||||||||||
|
|
|
|
|
|
|
|
|
| |||||||||||
Net Change in Shareholders’ Equity | — | 150 | — | 14,999,156 | 14,999,306 | |||||||||||||||
|
|
|
|
|
|
|
|
|
| |||||||||||
Balance at December 31, 2017 | 40 | $ | 1,547 | 4,000,000 | $ | 154,729,445 | $ | 154,730,992 | ||||||||||||
|
|
|
|
|
|
|
|
|
| |||||||||||
See accompanying Notes to Financial Statements which are an integral part of the financial statements.
40
Invesco DB Precious Metals Fund
Statement of Changes in Shareholders’ Equity
For the Year Ended December 31, 2016
| General Shares | Shares | Total | ||||||||||||||||||
| Shares | Total Equity | Shares | Total Equity | Shareholders’ Equity | ||||||||||||||||
Balance at January 1, 2016 | 40 | $ | 1,291 | 3,000,000 | $ | 96,842,282 | $ | 96,843,573 | ||||||||||||
|
|
|
|
|
|
|
|
|
| |||||||||||
Purchases of Shares | 5,800,000 | 232,200,316 | 232,200,316 | |||||||||||||||||
Redemption of Shares | (4,800,000 | ) | (183,212,308 | ) | (183,212,308 | ) | ||||||||||||||
|
|
|
|
|
| |||||||||||||||
Net Increase (Decrease) due to Share Transactions | 1,000,000 | 48,988,008 | 48,988,008 | |||||||||||||||||
Net Income (Loss) | ||||||||||||||||||||
Net Investment Income (Loss) | 17 | (965,093 | ) | (965,076 | ) | |||||||||||||||
Net Realized Gain (Loss) on United States Treasury Obligations and Commodity Futures Contracts | (217 | ) | 12,496,799 | 12,496,582 | ||||||||||||||||
Net Change in Unrealized Gain (Loss) on United States Treasury Obligations and Commodity Futures Contracts | 306 | (17,631,707 | ) | (17,631,401 | ) | |||||||||||||||
|
|
|
|
|
| |||||||||||||||
Net Income (Loss) | 106 | (6,100,001 | ) | (6,099,895 | ) | |||||||||||||||
|
|
|
|
|
|
|
|
|
| |||||||||||
Net Change in Shareholders’ Equity | — | 106 | 1,000,000 | 42,888,007 | 42,888,113 | |||||||||||||||
|
|
|
|
|
|
|
|
|
| |||||||||||
Balance at December 31, 2016 | 40 | $ | 1,397 | 4,000,000 | $ | 139,730,289 | $ | 139,731,686 | ||||||||||||
|
|
|
|
|
|
|
|
|
| |||||||||||
See accompanying Notes to Financial Statements which are an integral part of the financial statements.
41
Invesco DB Precious Metals Fund
For the Years Ended December 31, 2018, 2017 and 2016
| 2018 | 2017 | 2016 | ||||||||||
Cash flows from operating activities: | ||||||||||||
Net Income (Loss) | $ | (7,358,441 | ) | $ | 14,640,424 | $ | (6,099,895 | ) | ||||
Adjustments to reconcile net income (loss) to net cash provided by (used for) operating activities: | ||||||||||||
Cost of securities purchased | (332,023,595 | ) | (433,630,001 | ) | (866,152,732 | ) | ||||||
Proceeds from securities sold and matured | 371,745,671 | 426,920,885 | 829,441,661 | |||||||||
Cost of affiliated investments purchased | (185,432,009 | ) | (254,944,426 | ) | (151,251,802 | ) | ||||||
Proceeds from affiliated investments sold | 190,727,184 | 249,191,736 | 143,161,913 | |||||||||
Net accretion of discount on United States Treasury Obligations | (2,364,604 | ) | (1,278,292 | ) | (569,723 | ) | ||||||
Net realized (gain) loss on United States Treasury Obligations and Affiliated Investments | 13,104 | 1,449 | (2,393 | ) | ||||||||
Net change in unrealized (gain) loss on United States Treasury Obligations and Affiliated Investments | (16,542 | ) | 1,738 | 2,483 | ||||||||
Change in operating assets and liabilities: | ||||||||||||
Dividends from affiliates | (4,666 | ) | (7,087 | ) | (1,645 | ) | ||||||
Variation margin - Commodity Futures Contracts | 1,512,730 | (2,556,675 | ) | 970,220 | ||||||||
Management fee | (23,492 | ) | (3,497 | ) | 34,577 | |||||||
Brokerage commissions and fees | (10 | ) | 207 | 576 | ||||||||
|
|
|
|
|
| |||||||
Net cash provided by (used for) operating activities | 36,775,330 | (1,663,539 | ) | (50,466,760 | ) | |||||||
|
|
|
|
|
| |||||||
Cash flows from financing activities: | ||||||||||||
Distributions paid to shareholders | (1,348,638 | ) | (181,362 | ) | — | |||||||
Proceeds from purchases of Shares | 45,744,082 | 52,740,238 | 232,200,316 | |||||||||
Redemption of Shares | (82,887,065 | ) | (52,199,994 | ) | (183,212,308 | ) | ||||||
Increase in payable for amount due to custodian, net | 1,045,728 | — | — | |||||||||
|
|
|
|
|
| |||||||
Net cash provided by (used for) financing activities | (37,445,893 | ) | 358,882 | 48,988,008 | ||||||||
|
|
|
|
|
| |||||||
Net change in cash | (670,563 | ) | (1,304,657 | ) | (1,478,752 | ) | ||||||
Cash at beginning of period | 670,563 | 1,975,220 | 3,453,972 | |||||||||
|
|
|
|
|
| |||||||
Cash at end of period | $ | — | $ | 670,563 | $ | 1,975,220 | ||||||
|
|
|
|
|
| |||||||
Supplemental disclosure of cash flow information | ||||||||||||
Cash paid for interest | $ | 10,193 | $ | 2,132 | $ | 5,249 | ||||||
See accompanying Notes to Financial Statements which are an integral part of the financial statements.
42
Invesco DB Precious Metals Fund
December 31, 2018
Note 1 - Organization
Invesco DB Precious Metals Fund (the “Fund”), a separate series of Invesco DB Multi-Sector Commodity Trust (the “Trust”), a Delaware statutory trust organized in seven separate series, was formed on August 3, 2006. The term of the Fund is perpetual (unless terminated earlier in certain circumstances) as provided for in the Fifth Amended and Restated Declaration of Trust and Trust Agreement of the Fund, as amended (the “Trust Agreement”). The Fund has an unlimited number of shares authorized for issuance.
Invesco Capital Management LLC (“Invesco”) has served as the managing owner (the “Managing Owner”), commodity pool operator and commodity trading advisor of the Fund since February 23, 2015. The Managing Owner holds 40 general shares (the “General Shares”) of the Fund. The fiscal year end of the Fund is December 31st.
The Fund seeks to track changes, whether positive or negative, in the level of the DBIQ Optimum Yield Precious Metals Index Excess Return™ (the “Index”) over time, plus the excess, if any, of the sum of the Fund’s interest income from its holdings of United States Treasury Obligations (“Treasury Income”), dividends from its holdings in money market mutual funds (affiliated or otherwise) (“Money Market Income”) and dividends or distributions of capital gains from its holdings ofT-Bill ETFs (as defined below)(“T-Bill ETF Income”) over the expenses of the Fund. The Fund invests in futures contracts in an attempt to track its Index. The Index is intended to reflect the change in market value of the precious metals sector. The commodities comprising the Index are gold and silver (each an “Index Commodity”, and collectively, the “Index Commodities”).
The Fund may invest directly in United States Treasury Obligations. The Fund may also gain exposure to United States Treasury Obligations through investments in exchange-traded funds (“ETFs”) (affiliated or otherwise) that track indexes that measure the performance of United States Treasury Obligations with a maximum remaining maturity of up to 12 months(“T-Bill ETFs”). The Fund invests in United States Treasury Obligations, money market mutual funds andT-Bill ETFs (affiliated or otherwise), if any, for margin and/or cash management purposes.
The Commodity Futures Trading Commission (the “CFTC”) and certain futures exchanges impose position limits on futures contracts that reference Index Commodities (the “Index Contracts”). As the Fund approaches or reaches position limits with respect to an Index Commodity, the Fund may commence investing in Index Contracts that reference other Index Commodities. In those circumstances, the Fund may also trade in futures contracts based on commodities other than Index Commodities that the Managing Owner reasonably believes tend to exhibit trading prices that correlate with an Index Contract. In addition, the Managing Owner may determine to invest in other futures contracts if at any time it is impractical or inefficient to gain full or partial exposure to an Index Commodity through the use of Index Contracts. These other futures contracts may or may not be based on an Index Commodity. When they are not, the Managing Owner may seek to select futures contracts that it reasonably believes tend to exhibit trading prices that correlate with an Index Contract.
The Fund offers common units of beneficial interest (the “Shares”) only to certain eligible financial institutions (the “Authorized Participants”) in one or more blocks of 200,000 Shares (“Basket”). The Fund commenced investment operations on January 3, 2007. The Fund commenced trading on the American Stock Exchange (which became the NYSE Alternext US LLC) on January 5, 2007 and, since November 25, 2008, has been listed on the NYSE Arca, Inc. (the “NYSE Arca”).
This Annual Report (the “Annual Report”) covers the years ended December 31, 2018, 2017 and 2016. Past performance of the Fund is not necessarily indicative of future performance.
Note 2 - Summary of Significant Accounting Policies
A. Basis of Presentation
The financial statements of the Fund have been prepared using accounting principles generally accepted in the United States of America (“U.S. GAAP”).
The Fund has determined that it meets the definition of an investment company and has prepared the financial statements in conformity with U.S. GAAP for investment companies in conformity with accounting and reporting guidance of the Financial Accounting Standards Board Accounting Standards Codification Topic 946,Financial Services —Investment Companies.
B. Accounting Estimates
The preparation of financial statements in conformity with U.S. GAAP requires management to make estimates and assumptions that affect the reported amounts of assets and liabilities at the date of the financial statements and the reported amounts of revenues and expenses during the reporting period. Actual results could differ from those estimates by a significant amount. In addition, the Fund monitors for material events or transactions that may occur or become known after theperiod-end date and before the date the financial statements are released to print.
43
C. Investment Valuations
Investments inopen-end andclosed-end registered investment companies that do not trade on an exchange are valued at theend-of-day net asset value (“NAV”) per share. Investments inopen-end andclosed-end registered investment companies that trade on an exchange are valued at the last sales price or official closing price as of the close of the customary trading session on the exchange where the security is principally traded.
United States Treasury Obligations are fair valued using an evaluated quote provided by an independent pricing service. Evaluated quotes provided by the pricing service may be determined without exclusive reliance on quoted prices, and may reflect appropriate factors such as developments related to specific securities, yield, quality, type of issue, coupon rate, maturity, individual trading characteristics and other market data. All debt obligations involve some risk of default with respect to interest and/or principal payments.
Futures contracts are valued at the final settlement price set by an exchange on which they are principally traded.
Securities for which market quotations are not readily available or became unreliable are valued at fair value as determined in good faith following procedures approved by the Managing Owner. Issuer-specific events, market trends, bid/asked quotes of brokers and information providers and other data may be reviewed in the course of making a good faith determination of a security’s fair value.
D.Investment Transactions and Investment Income
Investment transactions are accounted for on a trade date basis. Realized gains or losses from the sale or disposition of securities or derivatives are determined on a specific identification basis and recognized in the Statements of Income and Expenses in the period in which the contract is closed or the sale or disposition occurs, respectively. Interest income on United States Treasury Obligations is recognized on an accrual basis when earned. Premiums and discounts are amortized or accreted over the life of the United States Treasury Obligations. Dividend income (net of withholding tax, if any) is recorded on theex-dividend date.
E. Profit and Loss Allocations and Distributions
Pursuant to the Trust Agreement, income and expenses are allocatedpro rata to the Managing Owner as holder of the General Shares and to the Shareholders monthly based on their respective percentage interests as of the close of the last trading day of the preceding month. Distributions (other than redemption of units) may be made at the sole discretion of the Managing Owner on apro rata basis in accordance with the respective capital balances of the shareholders.
The Managing Owner has sole discretion in determining what distributions, if any, the Fund will make to shareholders. A distribution for the year ended December 31, 2018 was paid on December 31, 2018 to holders of record as of December 26, 2018 at a rate of $0.44954 for each General Share and Share for the total distribution of $18 to General Shares and $1,348,620 to Shares.
The table below shows distributions per General Share and Share and in total for the years presented:
| For the Years Ended December 31, | ||||||||||||
| 2018 | 2017 | 2016 | ||||||||||
Distributions per General Share | $ | 0.44954 | $ | 0.04534 | $ | — | ||||||
Distributions per Share | $ | 0.44954 | $ | 0.04534 | $ | — | ||||||
Distributions paid to General Shares | $ | 18 | $ | 2 | $ | — | ||||||
Distributions paid to Shares | $ | 1,348,620 | $ | 181,360 | $ | — | ||||||
F. Routine Operational, Administrative and Other Ordinary Expenses
The Managing Owner is responsible for all routine operational, administrative and other ordinary expenses of the Fund, including, but not limited to, computer services, the fees and expenses of the Trustee, legal and accounting fees and expenses, tax preparation expenses, filing fees and printing, mailing and duplication costs. The Fund does not reimburse the Managing Owner for the routine operational, administrative and other ordinary expenses of the Fund. Accordingly, such expenses are not reflected in the Statements of Income and Expenses of the Fund.
G.Non-Recurring Fees and Expenses
The Fund pays allnon-recurring and unusual fees and expenses, if any, of itself, as determined by the Managing Owner.Non-recurring and unusual fees and expenses include fees and expenses such as legal claims and liabilities, litigation costs, indemnification expenses or othernon-routine expenses.Non-recurring and unusual fees and expenses, by their nature, are unpredictable in terms of timing and amount. For the years ended December 31, 2018, 2017 and 2016 the Fund did not incur such expenses.
44
H. Brokerage Commissions and Fees
The Fund incurs all brokerage commissions, including applicable exchange fees, National Futures Association (“NFA”) fees,give-up fees, pit brokerage fees and other transaction related fees and expenses charged in connection with trading activities by the Commodity Broker (as defined below). These costs are recorded as Brokerage Commissions and Fees in the Statements of Income and Expenses. The Commodity Broker’s brokerage commissions and trading fees are determined on acontract-by-contract basis. On average, total charges paid to the Commodity Broker, as applicable were less than $6.00, $6.00 and $6.00 per round-turn trade for the years ended December 31, 2018, 2017 and 2016, respectively.
I. Income Taxes
The Fund is classified as a partnership for U.S. federal income tax purposes. Accordingly, the Fund will generally not incur U.S. federal income taxes. No provision for federal, state, and local income taxes has been made in the accompanying financial statements, as investors are individually liable for income taxes, if any, on their allocable share of the Fund’s income, gain, loss, deductions and other items.
The Managing Owner has reviewed all of the Fund’s open tax years and major jurisdictions and concluded that there is no tax liability resulting from unrecognized tax benefits relating to uncertain tax positions taken or expected to be taken in future tax returns. The Fund is also not aware of any tax positions for which it is reasonably possible that the total amounts of unrecognized tax benefits will significantly change in the next twelve months. The major tax jurisdiction for the Fund and the earliest tax year subject to examination: United States, 2015.
J. Commodity Futures Contracts
The Fund utilizes derivative instruments to achieve its investment objective. A commodity futures contract is an agreement between counterparties to purchase or sell a specified underlying commodity for a specified price, or to pay or receive a cash amount based on the value of an index or other reference instrument, at a future date. Initial margin deposits required upon entering into futures contracts are satisfied by the segregation of specific securities or cash as collateral with the Commodity Broker. During the period that the commodity futures contracts are open, changes in the value of the contracts are recognized as unrealized gains or losses by recalculating the value of the contracts on a daily basis. Subsequent or variation margin payments are received or made depending upon whether unrealized gains or losses are incurred. These amounts are reflected as a receivable or payable on the Statements of Financial Condition. When the contracts are closed or expire, the Fund recognizes a realized gain or loss equal to the difference between the proceeds from, or cost of, the closing transaction and the Fund’s basis in the contract. Realized gains (losses) and changes in unrealized appreciation (depreciation) on open positions are determined on a specific identification basis and recognized in the Statements of Income and Expenses in the period in which the contract is closed or the changes occur, respectively.
Note 3 - Financial Instrument Risk
In the normal course of its business, the Fund is a party to financial instruments withoff-balance sheet risk. The term“off-balance sheet risk” refers to an unrecorded potential liability that, even though it does not appear on the balance sheet, may result in a future obligation or loss in excess of the amounts shown on the Statements of Financial Condition. The financial instruments used by the Fund are commodity futures contracts, the values of which are based upon an underlying asset and generally represent future commitments that have a reasonable possibility of being settled in cash or through physical delivery. The financial instruments are traded on an exchange and are standardized contracts.
Market risk is the potential for changes in the value of the financial instruments traded by the Fund due to market changes, including fluctuations in commodity prices. In entering into these futures contracts, there exists a market risk that such futures contracts may be significantly influenced by adverse market conditions, resulting in such futures contracts being less valuable. If the markets should move against all of the futures contracts at the same time, the Fund could experience substantial losses.
Credit risk is the possibility that a loss may occur due to the failure of the Commodity Broker and/or clearing house to perform according to the terms of a futures contract. Credit risk with respect to exchange-traded instruments is reduced to the extent that an exchange or clearing organization acts as a counterparty to the transactions. The Commodity Broker, when acting as the Fund’s futures commission merchant in accepting orders for the purchase or sale of domestic futures contracts, is required by CFTC regulations to separately account for and segregate as belonging to the Fund all assets of the Fund relating to domestic futures trading. The Commodity Broker is not allowed to commingle such assets with other assets of the Commodity Broker. In addition, CFTC regulations also require the Commodity Broker to hold in a secure account assets of the Fund related to foreign futures trading. The Fund’s risk of loss in the event of counterparty default is typically limited to the amounts recognized in the Statements of Financial Condition and not represented by the futures contract or notional amounts of the instruments.
The Fund has not utilized, nor does it expect to utilize in the future, special purpose entities to facilitateoff-balance sheet financing arrangements and has no loan guarantee arrangements oroff-balance sheet arrangements of any kind, other than agreements entered into in the normal course of business noted above.
45
Note 4 – Service Providers and Related Party Agreements
The Trustee
Under the Trust Agreement, Wilmington Trust Company, the trustee of the Fund (the “Trustee”), has the power and authority to execute and file certificates as required by the Delaware Statutory Trust Act and to accept service of process on the Fund in the State of Delaware. The Managing Owner has the exclusive management and control of all aspects of the business of the Fund. The Trustee will serve in that capacity until such time as the Managing Owner removes the Trustee or the Trustee resigns and a successor is appointed by the Managing Owner. The Trustee will have no duty or liability to supervise or monitor the performance of the Managing Owner, nor will the Trustee have any liability for the acts or omissions of the Managing Owner.
The Managing Owner
The Managing Owner serves as the Fund’s commodity pool operator, commodity trading advisor and managing owner. The Fund pays the Managing Owner a management fee, monthly in arrears, in an amount equal to 0.75% per annum of the daily NAV of the Fund (the “Management Fee”). The Fund, for cash management purposes, invests in money market mutual funds and/orT-Bill ETFs that are managed by affiliates of the Managing Owner. The indirect portion of the management fee that the Fund incurs through such investments is in addition to the Management Fee paid to the Managing Owner. The Managing Owner has contractually agreed to waive indefinitely the fees that it receives in an amount equal to the indirect management fees that the Fund incurs through its investments in affiliated money market mutual funds and/or affiliatedT-Bill ETFs. The Managing Owner may terminate this fee waiver on 60 days notice.
The Managing Owner waived fees of $13,797, $18,297 and $6,772 for the years ended December 31, 2018, 2017 and 2016, respectively.
The Distributor
Effective June 20, 2016, Invesco Distributors, Inc. (the “Distributor”) became distributor and began providing certain distribution services to the Fund. Pursuant to the Distribution Services Agreement among the Managing Owner, the Fund and the Distributor, the Distributor assists the Managing Owner and the Fund’s administrator, The Bank of New York Mellon, with certain functions and duties relating to distribution and marketing services to the Fund including reviewing and approving marketing materials. Prior to June 20, 2016, ALPS Distributors, Inc. provided distribution services to the Fund.
The Managing Owner pays the Distributor a distribution fee out of the Management Fee.
The Commodity Broker
Morgan Stanley & Co. LLC, a Delaware limited liability company, serves as the Fund’s futures clearing broker (the “Commodity Broker”). The Commodity Broker is registered with the CFTC as a futures commission merchant and is a member of the NFA in such capacity.
A variety of executing brokers execute futures transactions on behalf of the Fund. Such executing brokersgive-up all such transactions to the Commodity Broker. In its capacity as clearing broker, the Commodity Broker may execute or receive transactions executed by others and clears all of the Fund’s futures transactions and performs certain administrative and custodial services for the Fund. The Commodity Broker is responsible, among other things, for providing periodic accountings of all dealings and actions taken by the Fund during the reporting period, together with an accounting of all securities, cash or other indebtedness or obligations held by it or its nominees for or on behalf of the Fund.
The Administrator, Custodian and Transfer Agent
The Bank of New York Mellon (the “Administrator”, “Custodian” and “Transfer Agent”) is the administrator, custodian and transfer agent of the Fund. The Fund and the Administrator have entered into separate administrative, custodian, transfer agency and service agreements (collectively referred to as the “Administration Agreement”).
Pursuant to the Administration Agreement, the Administrator performs or supervises the performance of services necessary for the operation and administration of the Fund (other than making investment decisions), including receiving and processing orders from Authorized Participants to create and redeem Baskets, NAV calculations, accounting and other fund administrative services. The Administrator maintains certain financial books and records, including: Basket creation and redemption records; fund accounting records; ledgers with respect to assets, liabilities, capital, income and expenses; the registrar, transfer journals and related details; and trading and related documents received from the Commodity Broker. The Managing Owner pays the Administrator fees for its services out of the Management Fee.
Index Sponsor
The Managing Owner, on behalf of the Fund, has appointed Deutsche Investment Management Americas Inc. to serve as the index sponsor (the “Index Sponsor”). The Index Sponsor calculates and publishes the daily index levels and the indicative intraday index levels. Additionally, the Index Sponsor also calculates the indicative value per Share of the Fund throughout each business day.
The Managing Owner pays the Index Sponsor a licensing fee and an index services fee out of the Management Fee for performing its duties.
46
Note 5 - Deposits with Commodity Broker and Custodian
The Fund defines cash as cash held by the Custodian. There were no cash equivalents held by the Fund as of December 31, 2018 and 2017.
The Fund may deposit cash, United States Treasury Obligations,T-Bill ETFs and money market mutual funds with the Commodity Broker as margin, to the extent permissible under CFTC rules. The combination of the Fund’s deposits with its Commodity Broker of cash and United States Treasury Obligations and the unrealized profit or loss on open futures contracts represents the Fund’s overall equity in its broker trading account. To meet the Fund’s maintenance margin requirements, the Fund holds United States Treasury Obligations with the Commodity Broker. The Fund transfers cash to the Commodity Broker to satisfy variation margin requirements. The Fund earns interest on any excess cash deposited with the Commodity Broker and incurs interest expense on any deficit balance with the Commodity Broker.
The brokerage agreement with the Commodity Broker provides for the net settlement of all financial instruments covered by the agreement in the event of default or termination of any one contract. The Managing Owner will utilize any excess cash held at the Commodity Broker to offset any realized losses incurred in the commodity futures contracts, if available. To the extent that any excess cash held at the Commodity Broker is not adequate to cover any realized losses, a portion of the United States Treasury Obligations andT-Bill ETFs, if any, on deposit with the Commodity Broker will be sold to make additional cash available. For financial reporting purposes, the Fund offsets financial assets and financial liabilities that are subject to legally enforceable netting arrangements.
The Fund’s remaining cash, United States Treasury Obligations,T-Bill ETFs and money market mutual fund holdings are on deposit with the Custodian. The Fund is permitted to temporarily carry a negative or overdrawn balance in its account with the Custodian. The Fund incurs interest expense on any overdraft balance with the Custodian. Such balances, if any atperiod-end, are shown on the Statements of Financial Condition under the payable captionDue to custodian.
Note 6 - Additional Valuation Information
U.S. GAAP defines fair value as the price that would be received to sell an asset or paid to transfer a liability in an orderly transaction between market participants at the measurement date, under current market conditions. U.S. GAAP establishes a hierarchy that prioritizes the inputs to valuation methods, giving the highest priority to readily available unadjusted quoted prices in an active market for identical assets (Level 1) and the lowest priority to significant unobservable inputs (Level 3), generally when market prices are not readily available or are unreliable. Based on the valuation inputs, the securities or other investments are tiered into one of three levels. Changes in valuation methods or market conditions may result in transfers in or out of an investment’s assigned level:
Level 1: Prices are determined using quoted prices in an active market for identical assets.
Level 2: Prices are determined using other significant observable inputs. Observable inputs are inputs that other market participants may use in pricing a security. These may include quoted prices for similar securities, interest rates, prepayment speeds, credit risk, yield curves, loss severities, default rates, discount rates, volatilities and others.
Level 3: Prices are determined using significant unobservable inputs. In situations where quoted prices or observable inputs are unavailable (for example, when there is little or no market activity for an investment at the end of the period), unobservable inputs may be used. Unobservable inputs reflect the Fund’s own assumptions about the factors market participants would use in determining fair value of the securities or instruments and would be based on the best available information.
The levels assigned to the securities valuations may not be an indication of the risk or liquidity associated with investing in those securities. Because of the inherent uncertainties of valuation, the values reflected in the financial statements may materially differ from the value received upon actual sale of those investments.
The following is a summary of the tiered valuation input levels as of December 31, 2018:
| Level 1 | Level 2 | Level 3 | Total | |||||||||||||
Investments in Securities | ||||||||||||||||
United States Treasury Obligations | $ | — | $ | 101,406,388 | $ | — | $ | 101,406,388 | ||||||||
Money Market Mutual Fund | 8,547,404 | — | — | 8,547,404 | ||||||||||||
|
|
|
|
|
|
|
| |||||||||
Total Investments in Securities | 8,547,404 | 101,406,388 | — | 109,953,792 | ||||||||||||
|
|
|
|
|
|
|
| |||||||||
Other Investments - Assets(a) | ||||||||||||||||
Commodity Futures Contracts | 3,550,774 | — | — | 3,550,774 | ||||||||||||
|
|
|
|
|
|
|
| |||||||||
Total Investments | $ | 12,098,178 | $ | 101,406,388 | $ | — | $ | 113,504,566 | ||||||||
|
|
|
|
|
|
|
| |||||||||
| (a) | Unrealized appreciation (depreciation). |
47
The following is a summary of the tiered valuation input levels as of December 31, 2017:
| Level 1 | Level 2 | Level 3 | Total | |||||||||||||
Investments in Securities | ||||||||||||||||
United States Treasury Obligations | $ | — | $ | 138,760,422 | $ | — | $ | 138,760,422 | ||||||||
Money Market Mutual Fund | 13,842,579 | — | — | 13,842,579 | ||||||||||||
|
|
|
|
|
|
|
| |||||||||
Total Investments in Securities | 13,842,579 | 138,760,422 | — | 152,603,001 | ||||||||||||
|
|
|
|
|
|
|
| |||||||||
Other Investments - Assets(a) | ||||||||||||||||
Commodity Futures Contracts | 7,876,489 | — | — | 7,876,489 | ||||||||||||
|
|
|
|
|
|
|
| |||||||||
Total Investments | $ | 21,719,068 | $ | 138,760,422 | $ | — | $ | 160,479,490 | ||||||||
|
|
|
|
|
|
|
| |||||||||
| (a) | Unrealized appreciation (depreciation). |
Note 7 – Derivative Instruments
The Fair Value of Derivative Instruments is as follows:
| December 31, 2018 | December 31, 2017 | |||||||||||||||
Risk Exposure/Derivative Type(a) | Assets | Liabilities | Assets | Liabilities | ||||||||||||
Commodity risk | ||||||||||||||||
Commodity Futures Contracts | $ | 3,550,774 | $ | — | $ | 7,876,489 | $ | — | ||||||||
| (a) | Includes cumulative appreciation (depreciation) of commodity futures contracts. Only the current day’s variation margin receivable (payable) is reported in the December 31, 2018 and December 31, 2017 Statements of Financial Condition fornon-LME Commodity Futures Contracts. |
The following table presents derivative instruments that are either subject to an enforceable netting agreement or offset by collateral arrangements as of December 31, 2018, net by contract:
| Financial Derivative Assets | Financial Derivative Liabilities | Collateral (Received)/Pledged(a) | ||||||||||||||||||||||
Counterparty | Futures Contracts | Futures Contracts | Net value of derivatives | Non-Cash | Cash | Net amount | ||||||||||||||||||
Morgan Stanley & Co. LLC | $ | 3,550,774 | $ | (3,516,424 | ) | $ | 34,350 | $ | — | $ | — | $ | 34,350 | |||||||||||
The following table presents derivative instruments that are either subject to an enforceable netting agreement or offset by collateral arrangements as of December 31, 2017, net by contract:
| Financial Derivative Assets | Financial Derivative Liabilities | Collateral (Received)/Pledged(a) | ||||||||||||||||||||||
Counterparty | Futures Contracts | Futures Contracts | Net value of derivatives | Non-Cash | Cash | Net amount | ||||||||||||||||||
Morgan Stanley & Co. LLC | $ | 7,876,489 | $ | (6,329,409 | ) | $ | 1,547,080 | $ | — | $ | — | $ | 1,547,080 | |||||||||||
| (a) | As of December 31, 2018 and December 31, 2017, a portion of the Fund’s U.S. Treasury Obligations were required to be deposited as maintenance margin in support of the Fund’s futures positions. |
The Effect of Derivative Instruments on the Statements of Income and Expenses is as follows:
| For the Years Ended | ||||||||||||||
| Location of Gain or (Loss) on Derivatives | December 31, | |||||||||||||
Risk Exposure/Derivative Type | Recognized in Income | 2018 | 2017 | 2016 | ||||||||||
Commodity risk | ||||||||||||||
Commodity Futures Contracts | Net Realized Gain (Loss) | $ | (4,466,982 | ) | $ | (14,704,762 | ) | $ | 12,494,189 | |||||
Net Change in Unrealized Gain (Loss) | (4,325,715 | ) | 29,162,039 | (17,628,918 | ) | |||||||||
|
|
|
|
|
| |||||||||
Total | $ | (8,792,697 | ) | $ | 14,457,277 | $ | (5,134,729 | ) | ||||||
|
|
|
|
|
| |||||||||
The table below summarizes the average monthly notional value of futures contracts outstanding during the period:
| For the Years Ended | ||||||||||||
| December 31, | ||||||||||||
| 2018 | 2017 | 2016 | ||||||||||
Average Notional Value | $ | 138,102,225 | $ | 167,341,490 | $ | 193,503,462 | ||||||
48
Note 8 – Share Purchases and Redemptions
(a) Purchases
On any business day, an Authorized Participant may place an order with the Transfer Agent to create one or more Baskets. Each Basket consists of a block of 200,000 Shares. For purposes of processing both creation and redemption orders, a “business day” means any day other than a day when banks in New York City are required or permitted to be closed. Creation orders must be placed by 10:00 a.m., Eastern Time. The day on which the Transfer Agent receives a valid creation order is the creation order date. The day on which a creation order is settled is the creation order settlement date. Cash settlement occurs at the creation order settlement date. As provided below, the creation order settlement date may occur up to two business days after the creation order date. By placing a creation order, and prior to delivery of such Baskets, an Authorized Participant’s Depository Trust Company (“DTC”) account is charged thenon-refundable transaction fee due for the creation order.
Unless otherwise agreed to by the Managing Owner and the Authorized Participant as provided in the next sentence, Baskets are issued on the creation order settlement date as of 2:45 p.m., Eastern Time, on the business day immediately following the creation order date at the applicable NAV per Share as of the closing time of the NYSE Arca or the last to close of the exchanges on which its futures contracts are traded, whichever is later, on the creation order date, but only if the required payment has been timely received. Upon submission of a creation order, the Authorized Participant may request the Managing Owner to agree to a creation order settlement date up to two business days after the creation order date.
(b) Redemptions
On any business day, an Authorized Participant may place an order with the Transfer Agent to redeem one or more Baskets. Redemption orders must be placed by 10:00 a.m., Eastern Time. The day on which the Managing Owner receives a valid redemption order is the redemption order date. The day on which a redemption order is settled is the redemption order settlement date. Cash settlement occurs at the redemption order settlement date. As provided below, the redemption order settlement date may occur up to two business days after the redemption order date. The redemption procedures allow Authorized Participants to redeem Baskets. Individual Shareholders may not redeem directly from the Fund. Instead, individual Shareholders may only redeem Shares in integral multiples of 200,000 and only through an Authorized Participant.
Unless otherwise agreed to by the Managing Owner and the Authorized Participant as provided in the next sentence, by placing a redemption order, an Authorized Participant agrees to deliver the Baskets to be redeemed through DTC’s book-entry system to the Fund no later than the redemption order settlement date as of 2:45 p.m., Eastern Time, on the business day immediately following the redemption order date. Upon submission of a redemption order, the Authorized Participant may request the Managing Owner to agree to a redemption order settlement date up to two business days after the redemption order date. By placing a redemption order, and prior to receipt of the redemption proceeds, an Authorized Participant’s DTC account is charged thenon-refundable transaction fee due for the redemption order.
The redemption proceeds from the Fund consist of the cash redemption amount. The cash redemption amount is equal to the NAV of the number of Basket(s) requested in the Authorized Participant’s redemption order as of the closing time of the NYSE Arca or the last to close of the exchanges on which the Fund’s futures contracts are traded, whichever is later, on the redemption order date. The Managing Owner will distribute the cash redemption amount at the redemption order settlement date as of 2:45 p.m., Eastern Time, on the redemption order settlement date through DTC to the account of the Authorized Participant as recorded on DTC’s book-entry system.
The redemption proceeds due from the Fund are delivered to the Authorized Participant at 2:45 p.m., Eastern Time, on the redemption order settlement date if, by such time, the Fund’s DTC account has been credited with the Baskets to be redeemed. If the Fund’s DTC account has not been credited with all of the Baskets to be redeemed by such time, the redemption distribution is delivered to the extent of whole Baskets received. Any remainder of the redemption distribution is delivered on the next business day to the extent of remaining whole Baskets received if the Transfer Agent receives the fee applicable to the extension of the redemption distribution date which the Managing Owner may, fromtime-to-time, determine and the remaining Baskets to be redeemed are credited to the Fund’s DTC account by 2:45 p.m., Eastern Time, on such next business day. Any further outstanding amount of the redemption order will be cancelled. The Managing Owner is also authorized to deliver the redemption distribution notwithstanding that the Baskets to be redeemed are not credited to the Fund’s DTC account by 2:45 p.m., Eastern Time, on the redemption order settlement date if the Authorized Participant has collateralized its obligation to deliver the Baskets through DTC’s book-entry system on such terms as the Managing Owner may determine fromtime-to-time.
49
Note 9 - Commitments and Contingencies
The Managing Owner, either in its own capacity or in its capacity as the Managing Owner and on behalf of the Fund, has entered into various service agreements that contain a variety of representations, or provide indemnification provisions related to certain risks service providers undertake in performing services for the Fund. The Trust Agreement provides for the Fund to indemnify the Managing Owner and any affiliate of the Managing Owner that provides services to the Fund to the maximum extent permitted by applicable law, subject to certain exceptions for disqualifying conduct by the Managing Owner or such an affiliate. The Fund’s maximum exposure under these arrangements is unknown as this would involve future claims that may be made against the Fund that have not yet occurred. Further, the Fund has not had prior claims or losses pursuant to these contracts. Accordingly, the Managing Owner expects the risk of loss to be remote.
Note 10 - Financial Highlights
The Fund is presenting the following NAV and financial highlights related to investment performance for a Share outstanding for the years ended December 31, 2018, 2017 and 2016. An individual investor’s return and ratios may vary based on the timing of capital transactions.
NAV per Share is the NAV of the Fund divided by the number of outstanding Shares at the date of each respective period presented.
| Years Ended December 31, | ||||||||||||
| 2018 | 2017 | 2016 | ||||||||||
Net Asset Value | ||||||||||||
Net asset value per Share, beginning of period | $ | 38.68 | $ | 34.93 | $ | 32.28 | ||||||
Net realized and change in unrealized gain (loss) on United States Treasury Obligations, Affiliated Investments and Commodity Futures Contracts | (2.32 | ) | 3.75 | 2.84 | ||||||||
Net investment income (loss)(a) | 0.38 | 0.05 | (0.19 | ) | ||||||||
|
|
|
|
|
| |||||||
Net income (loss) | (1.94 | ) | 3.80 | 2.65 | ||||||||
|
|
|
|
|
| |||||||
Less: | ||||||||||||
Return of capital distributions | (0.45 | ) | (0.05 | ) | — | |||||||
|
|
|
|
|
| |||||||
Net asset value per Share, end of period | $ | 36.29 | $ | 38.68 | $ | 34.93 | ||||||
|
|
|
|
|
| |||||||
Market value per Share, beginning of period(b) | $ | 38.51 | $ | 34.88 | $ | 32.25 | ||||||
|
|
|
|
|
| |||||||
Market value per Share, end of period(b) | $ | 36.37 | $ | 38.51 | $ | 34.88 | ||||||
|
|
|
|
|
| |||||||
Ratio to average Net Assets | ||||||||||||
Net investment income (loss) | 1.03 | % | 0.12 | % | (0.48 | )% | ||||||
|
|
|
|
|
| |||||||
Expenses, after waivers | 0.76 | % | 0.75 | % | 0.77 | % | ||||||
|
|
|
|
|
| |||||||
Expenses, prior to waivers | 0.77 | % | 0.76 | % | 0.77 | % | ||||||
|
|
|
|
|
| |||||||
Total Return, at net asset value(c) | (5.00 | )% | 10.87 | % | 8.21 | % | ||||||
|
|
|
|
|
| |||||||
Total Return, at market value(c) | (4.37 | )% | 10.54 | % | 8.16 | % | ||||||
|
|
|
|
|
| |||||||
| (a) | Based on average shares outstanding. |
| (b) | The mean between the last bid and ask prices. |
| (c) | Total Return, at NAV is calculated assuming an initial investment made at the NAV at the beginning of the period, reinvestment of all dividends and distributions at NAV during the period, and redemption of Shares on the last day of the period. Total Return, at NAV includes adjustments in accordance with U.S. GAAP and as such, the NAV for financial reporting purposes and the returns based upon those NAVs may differ from the NAVs and returns for shareholder transactions. Total Return, at market value is calculated assuming an initial investment made at the market value at the beginning of the period, reinvestment of all dividends and distributions at market value during the period, and redemption of Shares at the market value on the last day of the period. Not annualized for periods less than one year, if applicable. |
50
| ITEM 9. | CHANGES IN AND DISAGREEMENTS WITH ACCOUNTANTS ON ACCOUNTING AND FINANCIAL DISCLOSURE |
None.
| ITEM 9A. | CONTROLS AND PROCEDURES |
For purposes of this Item 9A, all references to the “Fund” shall be read to specifically include the Fund and the Trust. Please note that the disclosure controls and procedures and internal control over financial reporting of the Trust are the aggregate disclosure controls and procedures and internal control over financial reporting of the Fund and that of Invesco DB Agriculture Fund, Invesco DB Base Metals Fund, Invesco DB Energy Fund, Invesco DB Gold Fund, Invesco DB Oil Fund and Invesco DB Silver Fund, each a series of the Trust
Evaluation of Disclosure Controls and Procedures
Under the supervision and with the participation of the management of the Managing Owner, including Daniel Draper, its Principal Executive Officer, and Kelli Gallegos, its Principal Financial and Accounting Officer, Investment Pools, the Fund carried out an evaluation of the effectiveness of the design and operation of its disclosure controls and procedures (as defined inRule 13a-15(e) or15d-15(e) of the Securities Exchange Act of 1934, as amended (the “Exchange Act”)) as of December 31, 2018, the end of the period covered by this Annual Report, and, based upon that evaluation, Daniel Draper, the Principal Executive Officer of the Managing Owner, and Kelli Gallegos, the Principal Financial and Accounting Officer, Investment Pools, of the Managing Owner concluded that the Fund’s disclosure controls and procedures were effective to provide reasonable assurance that information the Fund is required to disclose in the reports that it files or submits with the Securities and Exchange Commission (the “SEC”) under the Exchange Act is recorded, processed, summarized and reported, within the time periods specified in the SEC’s rules and forms, and to ensure that information required to be disclosed by the Fund in the reports that it files or submits under the Exchange Act is accumulated and communicated to management of the Managing Owner, including its Principal Executive Officer and Principal Financial Officer, as appropriate to allow timely decisions regarding required disclosure.
Changes in Internal Control Over Financial Reporting
There has been no change in internal control over financial reporting (as defined in the Rules13a-15(f) and15d-15(f) of the Exchange Act) that occurred during the quarter ended December 31, 2018 that has materially affected, or is reasonably likely to materially affect, the Fund’s internal control over financial reporting.
Management’s Annual Report on Internal Control Over Financial Reporting
Management of the Managing Owner is responsible for establishing and maintaining adequate internal control over financial reporting, as defined underRules 13a-15(f) and15d-15(f) of the Exchange Act, for the Fund. Daniel Draper, the Principal Executive Officer of the Managing Owner, and Kelli Gallegos, the Principal Financial and Accounting Officer, Investment Pools, of the Managing Owner, assessed the effectiveness of the Fund’s internal control over financial reporting as of December 31, 2018. Their report in connection with their assessment may be found in the “Report of Management on Internal Control Over Financial Reporting” on page 32 of this Annual Report onForm 10-K.
The Fund’s independent registered public accounting firm, PricewaterhouseCoopers LLP, has audited the Fund’s internal control over financial reporting as of December 31, 2018, as stated in their report on page 33 of this Form10-K.
| ITEM 9B. | OTHER INFORMATION |
None.
51
| ITEM 10. | DIRECTORS AND EXECUTIVE OFFICERS OF THE REGISTRANT AND CORPORATE GOVERNANCE |
Board of Directors and Principal Officers
The Fund has no directors or principal officers and also does not have any employees. It is managed by the Managing Owner.
As of December 31, 2018, the board of managers and principal officers of the Managing Owner are as follows:
Name | Capacity | |
| Daniel Draper | Chief Executive Officer, Board of Managers | |
| Peter Hubbard | Vice President and Director of Portfolio Management | |
| David Warren | Chief Administrative Officer, Board of Managers | |
| Annette Lege | Principal | |
| Kelli Gallegos | Principal Financial and Accounting Officer, Investment Pools | |
| Melanie Zimdars | Chief Compliance Officer | |
| John Zerr | Board of Managers | |
| Brian Hartigan | Global Head of ETF Investments |
Invesco Group Services Inc. is also a principal of the Managing Owner.
The Managing Owner is managed by a Board of Managers. The Board of Managers is composed of Messrs. Draper, Warren and Zerr.
The Managing Owner has designated Mr. Hubbard as the trading principal of the Fund.
Daniel Draper (50) has been Chief Executive Officer of the Managing Owner since March 24, 2016. In this role, he has general oversight responsibilities for all of the Managing Owner’s business. Mr. Draper has been a Member of the Board of Managers of the Managing Owner since September 2013. In this role he is responsible for the management of the Managing Owner’s exchange traded fund business with direct functional reporting responsibilities for the Managing Owner’s portfolio management, products, marketing and capital markets teams. In such capacity, Mr. Draper also is responsible for managing the operations of the Invesco Funds. Previously, Mr. Draper was the Global Head of Exchange Traded Funds for Credit Suisse Asset Management, or Credit Suisse, based in London from March 2010 until June 2013, followed by a three monthnon-compete period pursuant to his employment terms with Credit Suisse. Credit Suisse is an asset management business of Credit Suisse Group, a financial services company. From January 2007 to March 2010, he was the Global Head of Exchange Traded Funds for Lyxor Asset Management in London, an investment management business unit of Societe Generale Corporate & Investment Banking. Mr. Draper was previously registered as a Significant Influence Functions (SIF) person with the UK’s Financial Conduct Authority. He withdrew SIF person status on June 30, 2013 when he left Credit Suisse. Mr. Draper received his MBA from the Kenan-Flagler Business School at the University of North Carolina at Chapel Hill and his BA from the College of William and Mary in Virginia. Mr. Draper is currently registered with FINRA and holds the Series 7, 24 and 63 registrations. Mr. Draper was listed as a principal of the Managing Owner on December 16, 2013.
Peter Hubbard (38) joined the Managing Owner in May 2005 as a portfolio manager and has been Vice President, Director of Portfolio Management since September 2012. In his role, Mr. Hubbard manages a team of eight portfolio managers. His responsibilities include facilitating all portfolio management processes associated with more than 200 equity and fixed income Invesco Funds listed in the United States, Canada and Europe. He is a graduate of Wheaton College with a B.A. degree in Business & Economics. Mr. Hubbard was listed as a principal and registered as an associated person of the Managing Owner on November 15, 2012 and January 1, 2013, respectively. Mr. Hubbard was registered as a swap associated person of the Managing Owner effective as of September 8, 2015.
David Warren (61) is Chief Administrative Officer, Americas, for Invesco Ltd., a global investment management company affiliated with the Managing Owner. He was appointed to this position in January 2007, and also holds the roles of Director, Executive Vice President and Chief Financial Officer of Invesco Canada Ltd., a Canadian investment management subsidiary of Invesco Ltd., since January 2009. He has been a Member of the Board of Managers and Chief Administrative Officer of the Managing Owner since January 2010, as well. In these capacities, Mr. Warren is responsible for general management support, in addition to executing on various strategic initiatives and overseeing the risk management framework for the business units operating within the Americas division of Invesco Ltd. He obtained a Bachelor’s Degree in Commerce from the University of Toronto as both a CA and CPA, and is a member of the Chartered Professional Accountants of Canada. Mr. Warren was listed as a principal of the Managing Owner on November 21, 2012.
Annette Lege(49) has been a Chief Accounting Officer and Head of Finance and Corporate Services (“FCS”) Business Services for Invesco Ltd. since March 2017. In this role, she is responsible for all aspects of Corporate Accounting including group financial reporting, internal controls and group accounting policies. Ms. Lege also manages Invesco’s Finance operations and shared service centers and has held this role since September 2015. Previously, Ms. Lege was Head of FCS Transformation Office from October
52
2013 through September 2015, with responsibility for business transformation initiatives taking place across FCS at Invesco. Before assuming that role in October 2013, Ms. Lege held the position of North American Corporate Controller at Invesco from March 2007 to October 2013. Ms. Lege is also a CPA, is licensed by FINRA as a Financial Operations Principal, and is a member of the Texas State Board of Public Accountants. Ms. Lege earned a BBA in accounting from the University of Houston. Ms. Lege was listed as a principal of the Managing Owner on March 30, 2017 and was listed as a principal of Invesco Advisors, Inc. on March 22, 2017.
Kelli Gallegos (48) has been Principal Financial and Accounting Officer – Investment Pools for the Managing Owner since September 2018. Additionally, since September 2018, Ms. Gallegos has been Principal Financial and Accounting Officer – Investment Pools of Invesco Specialized Products, LLC (sponsor to a suite of currency exchange-traded funds, “ISP”), Head of North America Fund Reporting of Invesco, Ltd. (“Invesco”, a global investment management company), and Vice President and Treasurer of Invesco Exchange Traded Fund Trust, Invesco Exchange-Traded Fund Trust II, Invesco India Exchange-Traded Fund Trust, Invesco Actively Managed Exchange-Traded Fund Trust, Invesco Actively Managed Exchange-Traded Commodity Fund Trust, and Invesco Exchange-Traded Self-Indexed Fund Trusts (each a registered investment company offering series of exchange-traded funds, the “Invesco ETFs”). She also serves as Vice President (since March 2016), Principal Financial Officer (since March 2016) and Assistant Treasurer (since December 2008) for a suite of mutual funds advised by Invesco Advisers, Inc., a registered investment adviser (the “Invesco Funds”). In her roles with the Managing Owner, ISP, Invesco, the Invesco ETFs and the Invesco Funds, Ms. Gallegos has financial and administrative oversight responsibilities for, and serves as Principal Financial Officer of the Invesco ETFs, the Trust, the Funds and the exchange-traded funds for which ISP serves as sponsor (the “CurrencyShares Trusts”). Previously, she was Director of Fund Financial Services from December 2008 to September 2018, Assistant Treasurer for the Managing Owner from January 2013 to September 2018, Assistant Treasurer of ISP from April 2018 to September 2018, Assistant Treasurer for the Invesco ETFs from September 2014 to September 2018 and Assistant Vice President for the Invesco Funds from December 2008 to March 2016. In such roles, Ms. Gallegos managed the group of personnel responsible for the preparation of fund financial statements and other information necessary for shareholder reports, fund prospectuses, regulatory filings, and for the coordination and oversight of third-party service providers of the Fund, the Invesco ETFs, the Invesco Funds, and the CurrencyShares Trusts. Ms. Gallegos earned a BBA in accounting from Harding University in Searcy, AR. Ms. Gallegos was listed as a principal of the Managing Owner on September 25, 2018.
Melanie H. Zimdars(42) has been Chief Compliance Officer of the Managing Owner since November 2017. In this role she is responsible for all aspects of regulatory compliance for the Managing Owner. Ms. Zimdars has also served as Chief Compliance Officer of Invesco Exchange-Traded Fund Trust, Invesco Exchange-Traded Fund Trust II, Invesco India Exchange-Traded Fund Trust, Invesco Actively Managed Exchange-Traded Fund Trust and Invesco Actively Managed Exchange-Traded Commodity Fund Trust since November 2017. From September 2009 to October 2017, she served as Vice President and Deputy Chief Compliance Officer at ALPS Holdings, Inc. where she was Chief Compliance Officer for six different mutual fund complexes, including active and passive ETFs andopen-end andclosed-end funds. Through its subsidiary companies, ALPS Holdings, Inc. is a provider of investment products and customized servicing solutions to the financial services industry. Ms. Zimdars received a BS degree from the University ofWisconsin-La Crosse. Ms. Zimdars was listed as a principal of the Managing Owner on February 1, 2018.
John Zerr (56) has been a Member of the Board of Managers of the Managing Owner since September 2006. Mr. Zerr has also served as Chief Operating Officer of the Americas for Invesco Ltd. since February 2018. Prior to his current position, Mr. Zerr served as Managing Director and General Counsel – U.S. Retail of Invesco Management Group, Inc., a registered investment adviser affiliated with the Managing Owner, from March 2006 until February 2018, where he was responsible for overseeing the U.S. Retail Legal Department for Invesco Ltd. and its affiliated companies. Mr. Zerr has also been a Senior Vice President and Secretary of IDI since March 2006 and June 2006, respectively. He also served as a Director of that entity until February 2010. Mr. Zerr has served as Senior Vice President of Invesco Advisers, Inc., a registered investment adviser affiliated with the Managing Owner, since December 2009. Mr. Zerr serves as a Director, Vice President and Secretary of Invesco Investment Services, Inc., a registered transfer agency since May 2007. Mr. Zerr has served as Director, Senior Vice President, General Counsel and Secretary of a number of other Invesco Ltd. wholly-owned subsidiaries which service or serviced portions of Invesco Ltd.’s U.S. Retail business since May 2007 and since June 2010 with respect to certain Van Kampen entities engaged in the asset management business that were acquired by Invesco Ltd. from Morgan Stanley. In each of the foregoing positions Mr. Zerr is responsible for overseeing legal operations. In such capacity, Mr. Zerr also is responsible for overseeing the legal activities of the Invesco Funds. Mr. Zerr earned a BA degree in economics from Ursinus College. He graduated cum laude with a J.D. from Temple University School of Law. Mr. Zerr was listed as a principal of the Managing Owner on December 6, 2012.
Brian Hartigan (40) joined the Managing Owner in May 2015 as Global Head of ETF Investments. In his role, Mr. Hartigan manages the portfolio management function at the Managing Owner, with the Director of Portfolio Management reporting to him. Previously from June 2010 until May of 2015, Mr. Hartigan was the Head of Portfolio Management and Research for Invesco Capital Markets, Inc., the sponsor of unit investment trusts. In that role, he oversaw portfolio management of Invesco unit trusts. He earned his B.A. from the University of St. Thomas in Minnesota and an MBA in finance from DePaul University. He is a CFA charterholder and a member of the CFA Society of Chicago. Mr. Hartigan was listed as a principal and registered as an associated person of the Managing Owner on February 21, 2018 and May 29, 2018, respectively.
53
Invesco Group Services Inc., which is a wholly owned, indirect subsidiary of Invesco Ltd., has been a principal of the Managing Owner since September 27, 2018 and has periodically been listed with NFA as a principal of other NFA members since May 17, 1990.
Code of Ethics
The Fund has no officers or employees and is managed by Invesco Capital Management LLC. Invesco Capital Management LLC has adopted a code of ethics which applies to all of its employees and is available on request, free of charge, by calling1-800-983-0903 Monday through Friday, 8:00 a.m. to 5:00 p.m. Central Time.
| ITEM 11. | EXECUTIVE COMPENSATION |
The Fund has no employees, officers or directors. The Managing Owner receives a monthly Management Fee of 1/12th of 0.75% per annum of the daily NAV of the Fund at the end of each month.
For the year ended December 31, 2018, the Fund has incurred Management Fees of $1,044,289 of which $974,411 had been paid at December 31, 2018. Management Fees of $69,878 were unpaid at December 31, 2018 and are reported as a liability on the Statements of Financial Condition.
For the year ended December 31, 2018, the Fund has incurred brokerage commissions of $21,807 of which $16,803 had been paid at December 31, 2018. Brokerage commissions of $5,004 were unpaid at December 31, 2018 and are reported as a liability on the Statements of Financial Condition.
For the year ended December 31, 2017, the Fund has incurred Management Fees of $1,166,879 of which $1,073,509 had been paid at December 31, 2017. Management Fees of $93,370 were unpaid at December 31, 2017 and are reported as a liability on the Statements of Financial Condition.
For the year ended December 31, 2017, the Fund has incurred brokerage commissions of $12,039 of which $7,025 had been paid at December 31, 2017. Brokerage commissions of $5,014 were unpaid at December 31, 2017 and are reported as a liability on the Statements of Financial Condition.
For the year ended December 31, 2016, the Fund has incurred Management Fees of $1,513,608 of which $1,416,741 had been paid at December 31, 2016. Management Fees of $96,867 were unpaid at December 31, 2016 and are reported as a liability on the Statements of Financial Condition.
For the year ended December 31, 2016, the Fund has incurred brokerage commissions of $34,592 of which $29,785 had been paid at December 31, 2016. Brokerage commissions of $4,807 were unpaid at December 31, 2016 and are reported as a liability on the Statements of Financial Condition.
| ITEM 12. | SECURITY OWNERSHIP OF CERTAIN BENEFICIAL OWNERS AND MANAGEMENT AND RELATED STOCKHOLDER MATTERS |
The Fund has no officers or directors. The following table sets forth certain information regarding beneficial ownership of the Fund’s General Shares and Shares as of January 31, 2019, as known by management.
Title of Class | Name and Address of Beneficial Owner | Amount and Nature of Beneficial Ownership | Percent of Class | |||||||
General Shares | Invesco Capital Management LLC 3500 Lacey Road, Suite 700 Downers Grove, Illinois 60515 | 40 | 100 | % | ||||||
Shares | Invesco Ltd. 1555 Peachtree Street NE, Suite 1800 Atlanta, Georgia 30309 | 1,154,100 | 30.37 | % | ||||||
Directors and Officers of Invesco Capital Management LLC as a group | — | Less than 0.01 | % | |||||||
The Fund has no securities authorized for issuance under equity compensation plans.
| ITEM 13. | CERTAIN RELATIONSHIPS AND RELATED TRANSACTIONS, AND DIRECTOR INDEPENDENCE |
See Item 11.
54
| ITEM 14. | PRINCIPAL ACCOUNTANT FEES AND SERVICES |
Audit andNon-Audit Fees
The following table sets forth the fees for professional services rendered by PricewaterhouseCoopers LLP, the Fund’s independent registered public accounting firm for the years ended December 31, 2018 and 2017.
| Fiscal Years Ended December 31, | ||||||||
| 2018 | 2017 | |||||||
Audit Fees | $ | 78,660 | $ | 86,034 | ||||
Audit-Related Fees(1) | 2,100 | — | ||||||
Tax Fees(2) | 104,337 | 116,522 | ||||||
All Other Fees | — | — | ||||||
|
|
|
| |||||
Total | $ | 185,097 | $ | 202,556 | ||||
|
|
|
| |||||
| (1) | Audit-Related Fees for the fiscal year ended December 31, 2018 include fees billed for reviewing regulatory filings |
| (2) | Tax Fees for the fiscal years ended December 31, 2018 and 2017 include fees billed for preparing tax forms. |
Approval of Independent Registered Public Accounting Firm Services and Fees
The Managing Owner approved all of the services provided by PricewaterhouseCoopers LLP to the Fund described above. The Managing Ownerpre-approved all audit and allowednon-audit services of the Fund’s independent registered public accounting firm, including all engagement fees and terms.
55
| ITEM 15. | EXHIBITS AND FINANCIAL STATEMENT SCHEDULES |
(a)(1) Financial Statements
See financial statements commencing on page 31 hereof.
(a)(2) Financial Statement Schedules
No financial statement schedules are filed herewith because (i) such schedules are not required or (ii) the information required has been presented in the aforementioned financial statements.
(a)(3) Exhibits
The following documents (unless otherwise indicated) are filed herewith and made a part of this Annual Report:
EXHIBIT NO. | DESCRIPTION | |
| 4.1 | Fifth Amended and Restated Declaration of Trust and Trust Agreement of the Registrant1 | |
| 4.1.1 | Amendment No. 1 to the Fifth Amended and Restated Declaration of Trust and Trust Agreement of the Registrant2 | |
| 4.1.2 | Amendment No. 2 to the Fifth Amended and Restated Declaration of Trust and Trust Agreement of the Registrant3 | |
| 4.2 | Form of Participant Agreement4 | |
| 10.1 | Form of Customer Agreement5 | |
| 10.2 | Form of Administration Agreement4 | |
| 10.3 | Form of Global Custody Agreement4 | |
| 10.4 | Form of Transfer Agency and Service Agreement4 | |
| 10.5 | Distribution Services Agreement2 | |
| 23.1 | Consent of PricewaterhouseCoopers LLP | |
| 31.1 | Certification required under Exchange Act Rules13a-14 and15d-14 (filed herewith) | |
| 31.2 | Certification required under Exchange Act Rules13a-14 and15d-14 (filed herewith) | |
| 32.1 | Certification of Principal Executive Officer pursuant to 18 U.S.C. Section 1350 as adopted pursuant to Section 906 of the Sarbanes-Oxley Act of 2002 (furnished herewith) | |
| 32.2 | Certification of Principal Financial Officer pursuant to 18 U.S.C. Section 1350 as adopted pursuant to Section 906 of the Sarbanes-Oxley Act of 2002 (furnished herewith) | |
| 101 | Interactive data file pursuant to Rule 405 of RegulationS-T: (i) the Statements of Financial Condition of Invesco DB Precious Metals Fund—December 31, 2018 and December 31, 2017, (ii) the Schedule of Investments of Invesco DB Precious Metals Fund—December 31, 2018, (iii) the Schedule of Investments of Invesco DB Precious Metals Fund—December 31, 2017, (iv) the Statements of Income and Expenses of Invesco DB Precious Metals Fund—Years Ended December 31, 2018, 2017 and 2016, (v) the Statement of Changes in Shareholders’ Equity of Invesco DB Precious Metals Fund—Year Ended December 31, 2018, (vi) the Statement of Changes in Shareholders’ Equity of Invesco DB Precious Metals Fund—Year Ended December 31, 2017, (vii) the Statement of Changes in Shareholders’ Equity of Invesco DB Precious Metals Fund—Year Ended December 31, 2016, (viii) the Statements of Cash Flows of Invesco DB Precious Metals Fund—Years Ended December 31, 2018, 2017 and 2016, and (ix) Notes to Financial Statements of Invesco DB Precious Metals Fund. | |
| 1 | Previously filed as an exhibit to Form8-K on February 25, 2015 and incorporated herein by reference. |
| 2 | Previously filed as an exhibit to Form8-K on June 20, 2016 and incorporated herein by reference. |
| 3 | Previously filed as an exhibit to Form8-K on June 4, 2018 and incorporated herein by reference. |
| 4 | Previously filed as an exhibit toPre-Effective Amendment No. 2 to a Registration Statement on FormS-1 on December 14, 2006 and incorporated herein by reference. |
| 5 | Previously filed as an exhibit to Form8-K on February 26, 2015 and incorporated herein by reference. |
56
SIGNATURES
Pursuant to the requirements of the Securities Exchange Act of 1934, the Registrant has duly caused this report to be signed on its behalf by the undersigned, thereunto duly authorized.
Invesco DB Multi-Sector Commodity Trust on its own behalf and with respect to Invesco DB Precious Metals Fund | ||||||
| By: | Invesco Capital Management LLC, | |||||
| its Managing Owner | ||||||
| By: | /S/ DANIEL DRAPER | |||||
| Name: | Daniel Draper | |||||
| Title: | Principal Executive Officer | |||||
| By: | /S/ KELLI GALLEGOS | |||||
| Name: | Kelli Gallegos | |||||
| Title: | Principal Financial and Accounting Officer, Investment Pools | |||||
Dated: February 27, 2019
57
Exhibit 23.1
CONSENT OF INDEPENDENT REGISTERED PUBLIC ACCOUNTING FIRM
We hereby consent to the incorporation by reference in the Registration Statement on FormS-1 (No.333-228404-03) of Invesco DB Multi-Sector Commodity Trust of our report dated February 27, 2019 relating to the financial statementsand the effectiveness of internal control over financial reporting, which appears in Invesco DB Precious Metals Fund’s Form10-K.
/s/ PricewaterhouseCoopers LLP
Chicago, Illinois
February 27, 2019
Exhibit 31.1
CERTIFICATION
I, Daniel Draper, certify that:
| 1. | I have reviewed this Annual Report on Form10-K of Invesco DB Precious Metals Fund, a series of Invesco DB Multi-Sector Commodity Trust; |
| 2. | Based on my knowledge, this report does not contain any untrue statement of a material fact or omit to state a material fact necessary to make the statements made, in light of the circumstances under which such statements were made, not misleading with respect to the period covered by this report; |
| 3. | Based on my knowledge, the financial statements, and other financial information included in this report, fairly present in all material respects the financial condition, results of operations and cash flows of the registrant as of, and for, the periods presented in this report; |
| 4. | The registrant’s other certifying officer and I are responsible for establishing and maintaining disclosure controls and procedures (as defined in Exchange Act Rules 13a-15(e) and 15d-15(e)) and internal control over financial reporting (as defined in Exchange Act Rules 13a-15(f) and 15d-15(f)) for the registrant and have: |
| (a) | Designed such disclosure controls and procedures, or caused such disclosure controls and procedures to be designed under our supervision, to ensure that material information relating to the registrant, including its consolidated subsidiaries, is made known to us by others within those entities, particularly during the period in which this report is being prepared; |
| (b) | Designed such internal control over financial reporting, or caused such internal control over financial reporting to be designed under our supervision, to provide reasonable assurance regarding the reliability of financial reporting and the preparation of financial statements for external purposes in accordance with generally accepted accounting principles; |
| (c) | Evaluated the effectiveness of the registrant’s disclosure controls and procedures and presented in this report our conclusions about the effectiveness of the disclosure controls and procedures, as of the end of the period covered by this report based on such evaluation; and |
| (d) | Disclosed in this report any change in the registrant’s internal control over financial reporting that occurred during the registrant’s most recent fiscal quarter (the registrant’s fourth fiscal quarter in the case of an annual report) that has materially affected, or is reasonably likely to materially affect, the registrant’s internal control over financial reporting; and |
| 5. | The registrant’s other certifying officer and I have disclosed, based on our most recent evaluation of internal control over financial reporting, to the registrant’s auditors and the audit committee of the registrant’s board of directors (or persons performing the equivalent functions): |
| (a) | All significant deficiencies and material weaknesses in the design or operation of internal control over financial reporting which are reasonably likely to adversely affect the registrant’s ability to record, process, summarize and report financial information; and |
| (b) | Any fraud, whether or not material, that involves management or other employees who have a significant role in the registrant’s internal control over financial reporting. |
| Dated: February 27, 2019 | /s/ Daniel Draper | |||||
| Daniel Draper | ||||||
| Principal Executive Officer |
Exhibit 31.2
CERTIFICATION
I, Kelli Gallegos, certify that:
| 1. | I have reviewed this Annual Report on Form10-K of Invesco DB Precious Metals Fund, a series of Invesco DB Multi-Sector Commodity Trust; |
| 2. | Based on my knowledge, this report does not contain any untrue statement of a material fact or omit to state a material fact necessary to make the statements made, in light of the circumstances under which such statements were made, not misleading with respect to the period covered by this report; |
| 3. | Based on my knowledge, the financial statements, and other financial information included in this report, fairly present in all material respects the financial condition, results of operations and cash flows of the registrant as of, and for, the periods presented in this report; |
| 4. | The registrant’s other certifying officer and I are responsible for establishing and maintaining disclosure controls and procedures (as defined in Exchange Act Rules 13a-15(e) and 15d-15(e)) and internal control over financial reporting (as defined in Exchange Act Rules 13a-15(f) and 15d-15(f)) for the registrant and have: |
| (a) | Designed such disclosure controls and procedures, or caused such disclosure controls and procedures to be designed under our supervision, to ensure that material information relating to the registrant, including its consolidated subsidiaries, is made known to us by others within those entities, particularly during the period in which this report is being prepared; |
| (b) | Designed such internal control over financial reporting, or caused such internal control over financial reporting to be designed under our supervision, to provide reasonable assurance regarding the reliability of financial reporting and the preparation of financial statements for external purposes in accordance with generally accepted accounting principles; |
| (c) | Evaluated the effectiveness of the registrant’s disclosure controls and procedures and presented in this report our conclusions about the effectiveness of the disclosure controls and procedures, as of the end of the period covered by this report based on such evaluation; and |
| (d) | Disclosed in this report any change in the registrant’s internal control over financial reporting that occurred during the registrant’s most recent fiscal quarter (the registrant’s fourth fiscal quarter in the case of an annual report) that has materially affected, or is reasonably likely to materially affect, the registrant’s internal control over financial reporting; and |
| 5. | The registrant’s other certifying officer and I have disclosed, based on our most recent evaluation of internal control over financial reporting, to the registrant’s auditors and the audit committee of the registrant’s board of directors (or persons performing the equivalent functions): |
| (a) | All significant deficiencies and material weaknesses in the design or operation of internal control over financial reporting which are reasonably likely to adversely affect the registrant’s ability to record, process, summarize and report financial information; and |
| (b) | Any fraud, whether or not material, that involves management or other employees who have a significant role in the registrant’s internal control over financial reporting. |
| Dated: February 27, 2019 |
| /s/ Kelli Gallegos | ||||
| Kelli Gallegos | ||||||
| Principal Financial and Accounting Officer, Investment Pools |
Exhibit 32.1
CERTIFICATION PURSUANT TO
18 U.S.C. SECTION 1350
AS ADOPTED PURSUANT TO
SECTION 906 OF THE SARBANES-OXLEY ACT OF 2002
The undersigned, Daniel Draper, Principal Executive Officer of Invesco Capital Management LLC, the Managing Owner of Invesco DB Precious Metals Fund (the “Fund”), a series of Invesco DB Multi-Sector Commodity Trust, hereby certifies pursuant to 18 U.S.C. Section 1350, as adopted pursuant to Section 906 of the Sarbanes-Oxley Act of 2002, that:
| (1) | The Fund’s Annual Report on Form10-K for the year ended December 31, 2018, as filed with the Securities and Exchange Commission on the date hereof (the “Annual Report”), fully complies with the requirements of Section 13(a) or 15(d) of the Securities Exchange Act of 1934, as amended; |
| (2) | The information contained in the Annual Report fairly presents, in all material respects, the financial condition and results of operations of the Fund; |
| (3) | This certification accompanies the report to which it relates, is not deemed filed with the Securities and Exchange Commission and is not to be incorporated by reference into any filing of the Company under the Securities Act of 1933, as amended, or the Securities Exchange Act of 1934, as amended (whether made before or after the date of such report), irrespective of any general incorporation language contained in such filing. |
| Dated: February 27, 2019 |
| /s/ Daniel Draper | ||||
| Daniel Draper | ||||||
| Principal Executive Officer |
Exhibit 32.2
CERTIFICATION PURSUANT TO
18 U.S.C. SECTION 1350
AS ADOPTED PURSUANT TO
SECTION 906 OF THE SARBANES-OXLEY ACT OF 2002
The undersigned, Kelli Gallegos, Principal Financial and Accounting Officer, Investment Pools, of Invesco Capital Management LLC, the Managing Owner of Invesco DB Precious Metals Fund (the “Fund”), a series of Invesco DB Multi-Sector Commodity Trust, hereby certifies pursuant to 18 U.S.C. Section 1350, as adopted pursuant to Section 906 of the Sarbanes-Oxley Act of 2002, that:
| (1) | The Fund’s Annual Report on Form10-K for the year ended December 31, 2018, as filed with the Securities and Exchange Commission on the date hereof (the “Annual Report”), fully complies with the requirements of Section 13(a) or 15(d) of the Securities Exchange Act of 1934, as amended; |
| (2) | The information contained in the Annual Report fairly presents, in all material respects, the financial condition and results of operations of the Fund; |
| (3) | This certification accompanies the report to which it relates, is not deemed filed with the Securities and Exchange Commission and is not to be incorporated by reference into any filing of the Company under the Securities Act of 1933, as amended, or the Securities Exchange Act of 1934, as amended (whether made before or after the date of such report), irrespective of any general incorporation language contained in such filing. |
| Dated: February 27, 2019 |
| /s/ Kelli Gallegos | ||||
| Kelli Gallegos | ||||||
| Principal Financial and Accounting Officer, Investment Pools |
UNITED STATES
SECURITIES AND EXCHANGE COMMISSION
WASHINGTON, D.C. 20549
FORM10-K
| ☒ | ANNUAL REPORT PURSUANT TO SECTION 13 OR 15(d) OF THE SECURITIES EXCHANGE ACT OF 1934 |
For the fiscal year ended December 31, 2018
or
| ☐ | TRANSITION REPORT PURSUANT TO SECTION 13 OR 15(d) OF THE SECURITIES EXCHANGE ACT OF 1934 |
For the transition period from to
Commission FileNumber: 001-33231
INVESCO DB GOLD FUND
(A Series of Invesco DB Multi-Sector Commodity Trust)
(Exact name of Registrant as specified in its charter)
| Delaware | 87-0778067 | |
(State or Other Jurisdiction of Incorporation or Organization) | (I.R.S. Employer Identification No.) | |
c/o Invesco Capital Management LLC 3500 Lacey Road, Suite 700 Downers Grove, Illinois | 60515 | |
| (Address of Principal Executive Offices) | (Zip Code) | |
Registrant’s telephone number, including area code:(800) 983-0903
Securities registered pursuant to Section 12(b) of the Act:
Title of Each Class | Name of Each Exchange on Which Registered | |
| Common Units of Beneficial Interest | NYSE Arca, Inc. |
Securities registered pursuant to Section 12(g) of the Act: None
Indicate by check mark if the Registrant is a well-known seasoned issuer, as defined in Rule 405 of the Securities Act. Yes ☐ No ☒
Indicate by check mark if the Registrant is not required to file reports pursuant to Section 13 or Section 15(d) of the Act. Yes ☐ No ☒
Indicate by check mark whether the Registrant: (1) has filed all reports required to be filed by Section 13 or 15(d) of the Securities Exchange Act of 1934 during the preceding 12 months (or for such shorter period that the Registrant was required to file such reports), and (2) has been subject to such filing requirements for the past 90 days. Yes ☒ No ☐
Indicate by check mark whether the Registrant has submitted electronically every Interactive Data File required to be submitted pursuant to Rule 405 of RegulationS-T (§232.405 of this chapter) during the preceding 12 months (or for such shorter period that the Registrant was required to submit such files). Yes ☒ No ☐
Indicate by check mark if disclosure of delinquent filers pursuant to Item 405 of RegulationS-K (§229.405 of this chapter) is not contained herein, and will not be contained, to the best of Registrant’s knowledge, in definitive proxy or information statements incorporated by reference in Part III of this Form10-K or any amendment to this Form10-K. ☒
Indicate by check mark whether the Registrant is a large accelerated filer, an accelerated filer, anon-accelerated filer, a smaller reporting company, or an emerging growth company. See the definitions of “large accelerated filer,” “accelerated filer,” “smaller reporting company,” and “emerging growth company” in Rule12b-2 of the Exchange Act.
| Large Accelerated Filer | ☐ | Accelerated Filer | ☒ | |||
| Non-Accelerated Filer | ☐ | Smaller reporting company | ☒ | |||
| Emerging growth company | ☐ |
If an emerging growth company, indicate by check mark if the registrant has elected not to use the extended transition period for complying with any new or revised financial accounting standards provided pursuant to Section 13(a) of the Exchange Act. ☐
Indicate by check mark whether the Registrant is a shell company (as defined in Rule12b-2 of the Exchange Act). Yes ☐ No ☒
State the market value of the voting andnon-voting common equity held bynon-affiliates computed by reference to the price at which the common equity was last sold, or the average bid and asked price of such common equity, as of the last business day of the Registrant’s most recently completed second fiscal quarter: $142,164,000.
Number of Common Units of Beneficial Interest outstanding as of January 31, 2019: 3,400,000.
TABLE OF CONTENTS
i
CAUTIONARY STATEMENT CONCERNING FORWARD-LOOKING INFORMATION
This Report includes forward-looking statements within the meaning of Section 27A of the Securities Act of 1933, as amended (the “Securities Act”), and Section 21E of the Securities Exchange Act of 1934, as amended (the “Exchange Act”), that involve substantial risks and uncertainties. The matters discussed throughout this Report that are not historical facts are forward-looking statements. These forward-looking statements are based on the Fund’s and Invesco Capital Management LLC’s (the “Managing Owner”) current expectations, estimates and projections about the future results, performance, prospects and opportunities of the Fund and the Fund’s business and industry and their beliefs and assumptions about future events and speak only as of the date on which they are made. Words such as “anticipate,” “expect,” “intend,” “plan,” “believe,” “seek,” “outlook” and “estimate,” as well as similar words and phrases, signify forward-looking statements. Forward-looking statements are not guarantees of future results. Conditions and important factors, risks and uncertainties in the markets for financial instruments that the Fund trades, in the markets for related physical commodities, in the legal and regulatory regimes applicable to the Managing Owner, the Fund, and the Fund’s service providers, and in the broader economy may cause actual results to differ materially from those expressed by such forward-looking statements. These forward-looking statements are subject to a number of risks, uncertainties and other factors including, but not limited to, those described in this Report, including in Part I, Item 1A. “Risk Factors” and Part II, Item 7, “Management’s Discussion and Analysis of Financial Condition and Results of Operation” (“MD&A”), and other Securities and Exchange Commission (“SEC”) filings by the Fund that could cause the actual results, performance, prospects or opportunities of the Fund to differ materially from those expressed in, or implied by, these forward-looking statements.
You should not place undue reliance on any forward-looking statements. Except as expressly required by the Federal securities laws, the Fund and Managing Owner undertake no obligation to publicly update or revise any forward-looking statements or the risks, uncertainties or other factors described in this Report, as a result of new information, future events or changed circumstances or for any other reason after the date of this Report.
ii
| ITEM 1. | BUSINESS |
Introduction
Invesco DB Gold Fund (the “Fund”), a separate series of Invesco DB Multi-Sector Commodity Trust (the “Trust”), a Delaware statutory trust organized in seven separate series, was formed on August 3, 2006. The term of the Fund is perpetual (unless terminated earlier in certain circumstances) as provided for in the Fifth Amended and Restated Declaration of Trust and Trust Agreement of the Trust, as amended, (the “Trust Agreement”). The Fund has an unlimited number of shares authorized for issuance.
Invesco Capital Management LLC (“Invesco”) has served as the managing owner (the “Managing Owner”), commodity pool operator and commodity trading advisor of the Trust and the Fund, since February 23, 2015. The Managing Owner holds 40 general shares (the “General Shares”) of the Fund. The fiscal year end of the Fund is December 31st.
The Fund seeks to track changes, whether positive or negative, in the level of the DBIQ Optimum Yield Gold Index Excess Return™ (the “Index”) over time, plus the excess, if any, of the sum of the Fund’s interest income from its holdings of United States Treasury Obligations (“Treasury Income”), dividends from its holdings in money market mutual funds (affiliated or otherwise) (“Money Market Income”) and dividends or distributions of capital gains from its holdings ofT-Bill ETFs (as defined below)(“T-Bill ETF Income”) over the expenses of the Fund. The Fund invests in futures contracts in an attempt to track its Index. The Index is intended to reflect the change in market value of the gold sector. The single commodity comprising the Index is gold (the “Index Commodity”).
The Fund may invest directly in United States Treasury Obligations. The Fund may also gain exposure to United States Treasury Obligations through investments in exchange-traded funds (“ETFs”) (affiliated or otherwise) that track indexes that measure the performance of United States Treasury Obligations with a maximum remaining maturity of up to 12 months(“T-Bill ETFs”). The Fund invests in United States Treasury Obligations, money market mutual funds andT-Bill ETFs (affiliated or otherwise), if any, for margin and/or cash management purposes.
The Commodity Futures Trading Commission (the “CFTC”) and certain futures exchanges impose position limits on futures contracts that reference the Index Commodity (the “Index Contracts”). The Managing Owner may determine to invest in other futures contracts if at any time it is impractical or inefficient to gain full or partial exposure to the Index Commodity through the use of Index Contracts. These other futures contracts may or may not be based on the Index Commodity. When they are not, the Managing Owner may seek to select futures contracts that it reasonably believes tend to exhibit trading prices that correlate with an Index Contract.
The Fund offers common units of beneficial interest (the “Shares”) only to certain eligible financial institutions (the “Authorized Participants”) in one or more blocks of 200,000 Shares, called a Basket. The Fund commenced investment operations on January 3, 2007. The Fund commenced trading on the American Stock Exchange (which became the NYSE Alternext US LLC) on January 5, 2007 and, since November 25, 2008, has been listed on the NYSE Arca, Inc. (the “NYSE Arca”).
Index Description
The Managing Owner pays Deutsche Investment Management Americas Inc. (the “Index Sponsor”) a licensing fee and an index services fee for performing its duties.
These fees constitute a portion of the routine operational, administrative and other ordinary expenses which are paid out of the management fee paid to the Managing Owner (“Management Fee”) and are not charged to or reimbursed by the Fund.
Neither the Managing Owner nor any affiliate of the Managing Owner has any rights to influence the selection of the futures contracts underlying the Index. The Managing Owner has entered into a license agreement with the Index Sponsor to use the Index.
The Fund is not sponsored or endorsed by Deutsche Bank AG, Deutsche Investment Management Americas Inc. or any subsidiary or affiliate of Deutsche Bank AG or Deutsche Investment Management Americas Inc. (collectively, “Deutsche Bank”). The DBIQ Optimum Yield Gold Index Excess Return™ (the “Index”) is the exclusive property of Deutsche Investment Management Americas Inc. “DBIQ” and “Optimum Yield” are service marks of Deutsche Bank AG and have been licensed for use for certain purposes by Deutsche Investment Management Americas Inc. Neither Deutsche Bank nor any other party involved in, or related to, making or compiling the Index makes any representation or warranty, express or implied, concerning the Index, the Fund or the advisability of investing in securities generally. Neither Deutsche Bank nor any other party involved in, or related to, making or compiling the Index has any obligation to take the needs of the Managing Owner or its clients into consideration in determining, composing or calculating the Index. Neither Deutsche Bank nor any other party involved in, or related to, making or compiling the Index is responsible for or has participated in the determination of the timing of, prices at, quantities or valuation of the Fund. Neither Deutsche Bank nor any other party involved in, or related to, making or compiling the Index has any obligation or liability in connection with the administration or trading of the Fund.
1
NEITHER DEUTSCHE BANK NOR ANY OTHER PARTY INVOLVED IN, OR RELATED TO, MAKING OR COMPILING THE INDEX, WARRANTS OR GUARANTEES THE ACCURACY AND/OR THE COMPLETENESS OF THE INDEX OR ANY DATA INCLUDED THEREIN AND SHALL HAVE NO LIABILITY FOR ANY ERRORS, OMISSIONS, OR INTERRUPTIONS THEREIN. NEITHER DEUTSCHE BANK NOR ANY OTHER PARTY INVOLVED IN, OR RELATED TO, MAKING OR COMPILING THE INDEX, MAKES ANY WARRANTY, EXPRESS OR IMPLIED, AS TO RESULTS TO BE OBTAINED BY INVESCO CAPITAL MANAGEMENT LLC FROM THE USE OF THE INDEX OR ANY DATA INCLUDED THEREIN. NEITHER DEUTSCHE BANK NOR ANY OTHER PARTY INVOLVED IN, OR RELATED TO, MAKING OR COMPILING THE INDEX, MAKES ANY EXPRESS OR IMPLIED WARRANTIES, AND EXPRESSLY DISCLAIMS ALL WARRANTIES, OF MERCHANTABILITY OR FITNESS FOR A PARTICULAR PURPOSE OR USE WITH RESPECT TO THE INDEX OR ANY DATA INCLUDED THEREIN. WITHOUT LIMITING ANY OF THE FOREGOING, IN NO EVENT SHALL DEUTSCHE BANK OR ANY OTHER PARTY INVOLVED IN, OR RELATED TO, MAKING OR COMPILING THE INDEX HAVE ANY LIABILITY FOR DIRECT, INDIRECT, PUNITIVE, SPECIAL, CONSEQUENTIAL OR ANY OTHER DAMAGES OR LOSSES (INCLUDING LOST PROFITS), EVEN IF NOTIFIED OF THE POSSIBILITY THEREOF. EXCEPT AS EXPRESSLY PROVIDED TO THE CONTRARY, THERE ARE NO THIRD PARTY BENEFICIARIES OF ANY AGREEMENTS OR ARRANGEMENTS BETWEEN DEUTSCHE BANK AND INVESCO CAPITAL MANAGEMENT LLC.
No purchaser, seller or holder of the Shares of this Fund, or any other person or entity, should use or refer to any Deutsche Bank trade name, trademark or service mark to sponsor, endorse, market or promote this Fund without first contacting Deutsche Bank to determine whether Deutsche Bank’s permission is required. Under no circumstances may any person or entity claim any affiliation with Deutsche Bank without the written permission of Deutsche Bank.
The Index Sponsor may fromtime-to-time subcontract the provision of the calculation and other services described below to one or more third parties. The Index is composed of one underlying Index Commodity. The notional amount of the Index Commodity included in the Index is intended to reflect the changes in market value of the Index Commodity within the Index. The closing level of the Index is calculated on each business day by the Index Sponsor based on the closing price of the futures contracts for the Index Commodity and the notional amount of such Index Commodity.
The composition of the Index may be adjusted in the event that the Index Sponsor is not able to calculate the closing price of the Index Commodity.
The Index includes provisions for the replacement of futures contracts as they approach maturity. This replacement takes place over a period of time in order to lessen the impact on the market for the futures contracts being replaced. With respect to the Index Commodity, the Fund employs a rule-based approach when it “rolls” from one futures contract to another. The Index replaces the underlying futures contracts on an “optimum yield” basis.
Rather than select a new futures contract based on a predetermined schedule (e.g., monthly), each Index Commodity rolls from one contract to another futures contract that is intended to generate the most favorable ‘implied roll yield’ under prevailing market conditions. Where there is an upward-sloping price curve for futures contracts, the implied roll yield is expected to be negative. The selection of a new futures contract on the Index Commodity in such market conditions is designed to minimize the impact of negative roll yield. Conversely, where there is a downward-sloping price curve for futures contracts, the implied roll yield is expected to be positive. The selection of a new futures contract on the Index Commodity in such market conditions is designed to maximize the impact of positive roll yield. The Index takes the impact of implied roll yield into consideration by selecting, as the replacement for an expiring futures contract, the futures contract with a delivery month within the next thirteen months that generates the most favorable implied roll yield under the current market conditions.
The market condition in which the Index is designed to maximize the effect of positive roll yield when entering into new futures contracts is called backwardation. Backwardation exists when prices are higher for contracts with shorter-term expirations than those with longer-term expirations, a condition that is typically associated with commodities that are consumed quickly instead of being put in storage.Rolling in a backwardated market will tend to enhance returns from futures trading. The market condition in which the Index is designed to mitigate the effect of negative roll yield when entering into new futures contracts is called contango. Contango exists when contract prices are higher in distant delivery months than in nearer delivery months, typically due to costs associated with storing a given physical commodity for a longer period. Rolling in a contangoed market will tend to cause a drag on returns from futures trading. Returns from futures trading are called excess return, which is the combined return based on the spot prices of the Index Commodity and the roll yield from trading futures contracts on the Index Commodity.
The Index is calculated in USD on an excess return (unfunded) basis, which means that the Index reflects the return associated with spot prices for the Index Commodity and the roll yield associated with trading futures contracts on the Index Commodity. The Fund also invests in securities that are expected to generate income, including Treasury Securities, money market mutual funds, and T-Bill ETFs. These securities are held with the Custodian. In addition, Treasury Securities for deposit may be held with the Commodity Broker as margin for the Fund’s futures positions. The Index does not reflect any corresponding income characteristics.
The futures contract price for the Index Commodity will be the exchange closing price for the Index Commodity on a day on which the appropriate exchange is open for business (the “Index Business Day”). If a weekday is not an Exchange Business Day (as defined in the following sentence) but is an Index Business Day, the exchange closing price from the previous Index Business Day will be used for the Index Commodity. “Exchange Business Day” means, in respect of the Index Commodity, a day that is a trading day for the Index Commodity on the relevant exchange (unless either an Index disruption event or force majeure event has occurred).
2
On the first Index Business Day of each month (the “Verification Date”), the Index Commodity futures contract will be tested in order to determine whether to continue including it in the Index. If the Index Commodity futures contract requires delivery of the underlying commodity in the next month, known as the Delivery Month, a new Index Commodity futures contract will be selected for inclusion in the Index. For example, if the first Index Business Day is May 1 of the current year, and the Delivery Month of an Index Commodity futures contract currently in the Index is June of the current year, a new Index Commodity futures contract with a later Delivery Month will be selected.
For the underlying Index Commodity in the Index, the new Index Commodity futures contract selected will be the Index Commodity futures contract with the best possible “implied roll yield” based on the closing price for each eligible Index Commodity futures contract. Eligible Index Commodity futures contracts are any Index Commodity futures contracts having a Delivery Month (i) no sooner than the month after the Delivery Month of the Index Commodity futures contract currently in the Index, and (ii) no later than the thirteenth month after the Verification Date. For example, if the first Index Business Day is May 1 of the current year and the Delivery Month of an Index Commodity futures contract currently in the Index is June of the current year, the Delivery Month of an eligible new Index Commodity futures contract must be between July of the current year and June of the following year. The implied roll yield is then calculated and the futures contract on the Index Commodity with the best possible implied roll yield under the current market conditions is then selected. If two futures contracts have the same implied roll yield, the futures contract with the minimum number of months prior to the Delivery Month is selected.
After the selection of the replacement commodity futures contract, the monthly roll for the Index Commodity subject to a roll in that particular month unwinds the old commodity futures contract and enters a position in the new commodity futures contract. This takes place between the second and sixth Index Business Day of the month.
On each day during the roll period, new notional holdings are calculated. The calculations for the old futures contracts on the Index Commodity that are leaving the Index and the new futures contracts on the Index Commodity are then calculated.
On all days that are not monthly index roll days, the notional holdings of the Index Commodity future remains constant.
The Trustee
Under the Trust Agreement, Wilmington Trust Company, the trustee of the Trust and the Fund (the “Trustee”), has the power and authority to execute and file certificates as required by the Delaware Statutory Trust Act and to accept service of process on the Fund in the State of Delaware. The Managing Owner has the exclusive management and control of all aspects of the business of the Trust and the Fund. The Trustee will serve in that capacity until such time as the Managing Owner removes the Trustee or the Trustee resigns and a successor is appointed by the Managing Owner. The Trustee will have no duty or liability to supervise or monitor the performance of the Managing Owner, nor will the Trustee have any liability for the acts or omissions of the Managing Owner.
The Managing Owner
The Managing Owner was formed on February 7, 2003. The Managing Owner is an affiliate of Invesco Ltd. The Managing Owner was formed to be the managing owner of investment vehicles such as ETFs and has been managingnon-commodity futures based ETFs since 2003 and a commodity futures based ETF since 2014. The Managing Owner serves as the commodity pool operator and commodity trading advisor of the Trust and the Fund. The Managing Owner is registered as a commodity pool operator and commodity trading advisor with the CFTC and is a member of, and approved as a swap firm by, the National Futures Association (the “NFA”). As a registered commodity pool operator and commodity trading advisor, with respect to the Fund, the Managing Owner must comply with various regulatory requirements under the Commodity Exchange Act of 1936, as amended (the “Commodity Exchange Act”) and the rules and regulations of the CFTC and the NFA, including investor protection requirements, antifraud prohibitions, disclosure requirements, and reporting and recordkeeping requirements. The Managing Owner also is subject to periodic inspections and audits by the CFTC and NFA.
The Managing Owner’s main business offices are located at 3500 Lacey Road, Suite 700, Downers Grove, Illinois 60515, and its telephone number is(800) 983-0903.
The Fund pays the Managing Owner the Management Fee, monthly in arrears, in an amount equal to 0.75% per annum of the daily net asset value (“NAV”) of the Fund.
The Fund may, for margin and/or cash management purposes, invest in money market mutual funds and/orT-Bill ETFs that are managed by affiliates of the Managing Owner. The indirect portion of the management fee that the Fund may incur through such investment is in addition to the Management Fee paid to the Managing Owner. The Managing Owner has contractually agreed to waive indefinitely the fees that it receives in an amount equal to the indirect management fees that the Fund incurs through its investments in affiliated money market mutual funds and/or affiliatedT-Bill ETFs. The Managing Owner may terminate this fee waiver on 60 days notice
3
Pursuant to the Trust Agreement, the Fund will indemnify the Managing Owner against any losses, judgments, liabilities, expenses and amounts paid in settlement of any claims sustained by it in connection with its activities on behalf of the Fund incurred, except for any expenses resulting from gross negligence or willful misconduct.
The Commodity Broker
Morgan Stanley & Co. LLC, a Delaware limited liability company, serves as the Fund’s futures clearing broker (the “Commodity Broker”). The Commodity Broker is registered with the CFTC as a futures commission merchant and is a member of the NFA in such capacity.
A variety of executing brokers execute futures transactions on behalf of the Fund. Such executing brokersgive-up all such transactions to the Commodity Broker. In its capacity as clearing broker, the Commodity Broker may execute or receive transactions executed by others and clears all of the Fund’s futures transactions and performs certain administrative and custodial services for the Fund. The Commodity Broker is responsible, among other things, for providing periodic accountings of all dealings and actions taken by the Fund during the reporting period, together with an accounting of all securities, cash or other indebtedness or obligations held by it or its nominees for or on behalf of the Fund.
The Fund pays the Commodity Broker all brokerage commissions, including applicable exchange fees, NFA fees,give-up fees, pit brokerage fees and other transaction related fees and expenses charged in connection with trading activities. The Commodity Broker’s brokerage commissions and trading fees are determined on acontract-by-contract basis. Brokerage commissions and fees in any future fiscal year or any part of any future fiscal year may be greater than fees incurred in prior fiscal years. On average, total charges paid to the Commodity Broker were less than $6.00, $6.00 and $6.00 per round-turn trade1 for the years ended December 31, 2018, 2017 and 2016, respectively.
| 1 | A round-turn trade is a completed transaction involving both a purchase and a liquidating sale, or a sale followed by a covering purchase. |
The Administrator, Custodian and Transfer Agent
The Bank of New York Mellon (the “Administrator”, “Custodian” and “Transfer Agent”) is the administrator, custodian and transfer agent of the Fund. The Fund and the Administrator have entered into separate administrative, custodian, transfer agency and service agreements (collectively referred to as the “Administration Agreement”).
The Bank of New York Mellon, a banking corporation organized under the laws of the State of New York with trust powers, has an office at 2 Hanson Place, Brooklyn, New York, 11217. The Bank of New York Mellon is subject to supervision by the New York State Department of Financial Services and the Board of Governors of the Federal Reserve System.
Pursuant to the Administration Agreement, the Administrator performs or supervises the performance of services necessary for the operation and administration of the Fund (other than making investment decisions), including receiving and processing orders from Authorized Participants to create and redeem Baskets, NAV calculations, accounting and other fund administrative services. The Administrator maintains certain financial books and records, including: Basket creation and redemption records; fund accounting records; ledgers with respect to assets, liabilities, capital, income and expenses; the registrar, transfer journals and related details; and trading and related documents received from the Commodity Broker. The Managing Owner pays the Administrator administrative services fees out of the Management Fee.
The Distributor
Invesco Distributors, Inc. is the Fund’s distributor (the “Distributor”). Pursuant to the Distribution Services Agreement among the Managing Owner, the Fund and the Distributor, the Distributor assists the Managing Owner and the Administrator with certain functions and duties relating to distribution and marketing services to the Fund including reviewing and approving marketing materials. Prior to June 20, 2016, ALPS Distributors, Inc. provided distribution services to the Fund.
The Distribution Services Agreement is terminable without penalty on sixty days written notice by the Managing Owner or by the Distributor. The Distribution Services Agreement will automatically terminate in the event of its assignment.
Pursuant to the Distribution Services Agreement, the Fund will indemnify and hold harmless the Distributor and each of its directors and officers and each person, if any, who controls the Distributor within the meaning of Section 15 of the Securities Act, against any loss, liability, claim, damages or expenses (including the reasonable cost of investigating or defending any alleged loss, liability, claim, damages or expense and reasonable counsel fees incurred in connection therewith) arising by reason of any person acquiring any Shares, based upon the ground that the registration statement, prospectus, statement of additional information, shareholder reports or other information filed or made public by the Fund (as fromtime-to-time amended) included an untrue statement of a material fact or omitted a material fact required to be stated or necessary in order to make the statements therein not misleading under the Securities Act or any other statute or the common law.
The Managing Owner pays the Distributor a distribution fee out of the Management Fee.
4
Index Sponsor
The Managing Owner, on behalf of the Trust and the Fund, has appointed Deutsche Investment Management Americas Inc. to serve as the index sponsor (the “Index Sponsor”). The Index Sponsor calculates and publishes the daily index levels and the indicative intraday index levels. The Index Sponsor also calculates the indicative value per Share of the Fund throughout each business day.
The Managing Owner pays the Index Sponsor a licensing fee and an index services fee out of the Management Fee for performing its duties.
Marketing Agent
The Managing Owner, on behalf of the Trust and the Fund, has appointed Deutsche Investment Management Americas Inc. as the marketing agent (the “Marketing Agent”) to assist the Managing Owner by providing support to educate institutional investors about the Index and to complete governmental or institutional due diligence questionnaires or requests for proposals related to the Index.
The Managing Owner pays the Marketing Agent a marketing services fee out of the Management Fee.
The Marketing Agent will not open or maintain customer accounts or handle orders for the Fund. The Marketing Agent has no responsibility for the performance of the Fund or the decisions made or actions taken by the Managing Owner.
Tax Reporting
The Fund has retained the services of PricewaterhouseCoopers LLP to assist with certain tax reporting requirements of the Fund and its Shareholders.
Regulation
Futures exchanges in the United States are subject to regulation under the Commodity Exchange Act by the CFTC, the governmental agency having responsibility for regulation of futures exchanges and trading on those exchanges.
The Commodity Exchange Act and the CFTC also regulate the activities of “commodity trading advisors” and “commodity pool operators” and the CFTC has adopted regulations with respect to certain of such persons’ activities. Pursuant to its authority, the CFTC requires a commodity pool operator (such as the Managing Owner) to keep accurate, current and orderly records with respect to each pool it operates. The CFTC may suspend the registration of a commodity pool operator if the CFTC finds that the operator has violated the Commodity Exchange Act or regulations thereunder and in certain other circumstances. Suspension, restriction or termination of the Managing Owner’s registration as a commodity pool operator would prevent it, until such time (if any) as such registration were to be reinstated, from managing, and might result in the termination of, the Fund. The Commodity Exchange Act gives the CFTC similar authority with respect to the activities of commodity trading advisors, such as the Managing Owner. If the registration of a managing owner as a commodity trading advisor were to be terminated, restricted or suspended, the managing owner would be unable, until such time (if any) as such registration were to be reinstated, to render trading advice to the Fund. The Fund is not registered with the CFTC in any capacity.
The Commodity Exchange Act requires all “futures commission merchants,” such as the Commodity Broker, to meet and maintain specified fitness and financial requirements, to segregate customer funds from proprietary funds and account separately for all customers’ funds and positions, and to maintain specified books and records open to inspection by the staff of the CFTC.
The Commodity Exchange Act also gives the states certain powers to enforce its provisions and the regulations of the CFTC.
Shareholders are afforded certain rights for reparations under the Commodity Exchange Act. Shareholders may also be able to maintain a private right of action for certain violations of the Commodity Exchange Act. The CFTC has adopted rules implementing the reparation provisions of the Commodity Exchange Act which provide that any person may file a complaint for a reparations award with the CFTC for violation of the Commodity Exchange Act against a floor broker, futures commission merchant, introducing broker, commodity trading advisor, commodity pool operator, and their respective associated persons.
Pursuant to authority in the Commodity Exchange Act, the NFA was formed and registered with the CFTC as a “registered futures association.” At the present time, the NFA is the onlynon-exchange self-regulatory organization for derivatives professionals. NFA members are subject to NFA standards relating to fair trade practices, market integrity, and consumer protection. As the self-regulatory body of the derivatives industry, the NFA promulgates rules governing the conduct of derivatives professionals and disciplines those professionals who do not comply with such standards. The CFTC has delegated to the NFA responsibility for the registration of commodity trading advisors, commodity pool operators, futures commission merchants, introducing brokers, and swap dealers, among others, and their respective associated persons, as applicable, and floor brokers. The Commodity Broker and the Managing Owner are members of the NFA (the Fund is not required to become a member of the NFA).
5
The CFTC has no authority to regulate trading on foreign futures exchanges and markets but permits direct access to such markets from the United States with respect to foreign boards of trade that are registered as such with the CFTC.
Employees
The Fund has no employees.
Available Information
The Fund files with or submits to the SEC annual, quarterly and current reports and other information meeting the informational requirements of the Exchange Act. These reports are available on the Managing Owner’s website athttp://www.invesco.com/ETFs. Information in the Managing Owner’s website shall not be deemed to be a part of this Report or incorporated by reference herein unless otherwise expressly stated. The SEC maintains an Internet site that contains reports, proxy and information statements and other information filed electronically by us with the SEC which are available on the SEC’s Internet site athttp://www.sec.gov.
The Fund also posts monthly performance reports and its annual report, as required by the CFTC, on the Managing Owner’s website at the address listed above.
| ITEM 1A. | RISK FACTORS |
An investment in Shares involves a high degree of risk. Investors should consider carefully all of the risks describedbelow, together with the other information contained in this Annual Report on Form10-K (the “Report”) and the Fund’s Prospectus, before making a decision to invest in Shares. If any of the following risks occur, the business, financial condition and results of operations of the Fund may be adversely affected.
Market Risks
NAV May Not Always Correspond to Market Price and, as a Result, Baskets May Be Created or Redeemed at a Value that Differs from the Market Price of the Shares.
Shares may trade at, above or below their NAV. The NAV fluctuates with changes in the market value of the Fund’s assets. The trading price of Shares fluctuates in accordance with changes in the NAV, intraday changes in the value of the futures contracts and market supply and demand. The amount of the discount or premium in the trading price of the Shares relative to their NAV may be influenced bynon-concurrent trading hours between NYSE Arca (the exchange on which the Shares trade) and the exchanges on which futures contracts on the Index Commodity trade. While the Shares are expected to trade on NYSE Arca until 4:00 p.m. (Eastern time), liquidity in the markets for the futures contracts on the Index Commodity is expected to be reduced whenever the principal markets for those contracts are closed. As a result, trading spreads, and the resulting premium or discount on Shares, may widen during these gaps in market trading hours.
The NYSE Arca May Halt Trading in the Shares Which Would Adversely Impact Your Ability to Sell Shares.
The Shares are listed for trading on the NYSE Arca. Trading in Shares may be halted due to market conditions or in light of certain procedures and safeguards under NYSE Arca rules. In addition, trading is subject to trading halts caused by extraordinary market volatility pursuant to “circuit breaker” rules that require trading to be halted for a specified period based on a specified market decline. If the Fund were no longer to meet the requirements necessary to maintain the listing of its Shares, the Shares would be delisted. In such a scenario, the Fund would be terminated.
The Lack of an Active Trading Market for the Shares May Result in Losses on Your Investment at the Time of Disposition of Your Shares.
Although the Shares are listed and traded on the NYSE Arca, there can be no guarantee that an active trading market for the Shares will be maintained. If you need to sell your Shares at a time when no active market for them exists, the price you receive for your Shares, assuming that you are able to sell them, likely will be lower than the price you would receive if an active market did exist.
Volatility May Cause the Total Loss of Your Investment.
Futures contracts prices have a high degree of volatility and are subject to rapid and substantial changes. Consequently, there is a risk that the value of your investment in the Fund could decrease significantly due to rapid and substantial changes in the prices of futures contracts held by the Fund. The Index’s average annual volatility since inception is 14.12%. Average annual volatility is the average of the Index’s volatility each year since its inception. Yearly volatility is the relative rate at which the price of the Index moves up and down, found by calculating the annualized standard deviation of the daily change in price for each business day in the given year.
In addition, the Fund enters sell orders with the Commodity Broker from time to time, to liquidate Index Contract positions in order to satisfy redemption requests or to pay expenses and liabilities. The Fund is subject to the risk that temporary aberrations or distortions will occur in the market for Index Contracts at the time those orders are executed. The prices received by the Fund from the
6
liquidation of its positions could be adversely affected, which in turn could adversely affect the value of the Shares. Those aberrations or distortions may result from trading activities by other market participants or actions taken by the Commodity Broker, the CFTC, the exchanges or other regulatory authorities. If the Fund’s positions are liquidated at inopportune times or in a manner that temporarily distorts the market or otherwise causes a pricing aberration, the value of the Shares may be adversely affected.
The Fund’s Trading of Index Contracts May Adversely Affect the Price that the Fund Pays for Index Contracts.
The prices that the Fund pays for Index Contracts may be adversely affected by the trading of Index Contracts by other market participants. Transactions by other market participants may be based on their awareness of the Fund’s positions in Index Contracts. If other market participants are able to anticipate the timing of the Fund’s Index Contract transactions, for instance, they may be able to execute transactions in advance of the Fund. If that were to occur, those market participants may receive more favorable pricing for their Index Contract transactions than the Fund does for its own, subsequent Index Contract transactions. If the Fund’s Index Contract positions represent a significant part of the open long interest in those Index Contracts, moreover, other market participants may take that fact into account and trade in a manner that adversely affects the prices that the Fund obtains when trading Index Contracts. The Fund may not be able to counteract adverse pricing effects of its own positions and transactions in Index Contracts.
Withdrawal from Participation by Authorized Participants May Affect the Liquidity of Shares.
If one or more Authorized Participants withdraws from participation, it may become more difficult to create or redeem Baskets, which may reduce the liquidity of the Shares. If it becomes more difficult to create or redeem Baskets, the correlation between the price of the Shares and the NAV may be affected, which may affect the trading market for the Shares. Having fewer participants in the market for the Shares could also adversely affect the ability to arbitrage any price difference between futures contracts and the Shares, which may also affect the trading market and liquidity of the Shares.
Possible Illiquid Markets May Exacerbate Losses.
Futures positions cannot always be liquidated at the desired price. It is difficult to execute a trade at a specific price when there is a relatively small volume of buy and sell orders in a market. A market disruption, such as when foreign governments may take or be subject to political actions which disrupt the markets in their currencies or major commodities exports, can also make it difficult to liquidate a position.
Illiquidity may cause losses for the Fund. The large size of the positions which the Fund may acquire increases the risk of illiquidity by both making its positions more difficult to liquidate and increasing the losses incurred while trying to do so.
Trading on Futures Exchanges Outside the United States Is Not Subject to U.S. Regulation.
Trading on futures exchanges located outside the United States is not regulated by any United States governmental agency and may involve certain risks not applicable to trading on U.S. exchanges, including different or diminished investor protections. If the Fund trades contracts denominated in currencies other than U.S. dollars, the Fund will be exposed to the risk of adverse exchange-rate movements between the dollar and the currencies in which those contracts are denominated.
In addition, trading onnon-U.S. exchanges is subject to the risks presented by exchange controls, expropriation, increased tax burdens and exposure to local economic declines and political instability, among other factors. An adverse development with respect to any of these factors could reduce the profit or increase the loss earned on the Fund’s trades onnon-U.S. exchanges.
The Effect of Market Disruptions and Government Interventions Are Unpredictable and May Have an Adverse Effect on the Value of Your Shares.
The commodity futures markets may be subject to temporary distortions due to various factors, including lack of liquidity, congestion, disorderly closing periods, manipulation and disruptive conduct, limitations on deliverable supplies, excessive speculation, government regulation and intervention, technical and operational or system failures, nuclear accidents, terrorism, riots and acts of God.
Government intervention has in certain cases been implemented on an “emergency” basis, suddenly and substantially eliminating market participants’ ability to continue to implement certain strategies or manage the risk of their outstanding positions. These interventions have typically been unclear in scope and application, resulting in confusion and uncertainty which in itself has been materially detrimental to the efficient functioning of the markets as well as previously successful investment strategies.
The financial crisis of 2008-2009 and associated regulatory changes, including the Dodd-Frank Wall Street Reform and Consumer Protection Act (the “Dodd-Frank Act”) are generally considered to have contributed to less credit being available to financial market participants. This is particularly the case for credit extended by banks and other traditional lending sources. The Fund does not borrow from lenders for the purpose of pursuing its investment objective. Nonetheless, restrictions on the availability of credit may adversely affect investors who borrow to purchase Shares and participants in the markets for financial instruments in which the Fund trades, including futures markets. Limitations on the availability of credit, whether in stressed market conditions or otherwise, may have a material adverse effect on investors and financial market participants, which in turn could affect the Fund’s ability to pursue its investment objective. Among other things, fewer prospective investors may adversely affect the Fund’s asset levels, and fewer financial market participants may reduce liquidity and adversely affect pricing for the financial instruments that the Fund seeks to trade.
7
The Fund may incur major losses in the event of disrupted markets and other extraordinary events in which historical pricing relationships become materially distorted. The risk of loss from pricing distortions is compounded by the fact that in disrupted markets many positions become illiquid, making it difficult or impossible to close out or liquidate positions against which the markets are moving. The large size of the positions which the Fund may acquire increases the risk of illiquidity by both making its positions more difficult to liquidate and increasing the losses incurred while trying to do so.
An Investment in the Shares May Be Adversely Affected by Competition from Other Methods of Investing in Commodities.
The Fund competes with other financial vehicles, including mutual funds, ETFs, and other investment companies, other index tracking commodity pools, actively traded commodity pools, hedge funds, traditional debt and equity securities issued by companies in the commodities industry, other securities backed by or linked to commodities, and direct investments in the underlying commodities or commodity futures contracts. Market and financial conditions, and other conditions beyond the Managing Owner’s control, may make it more attractive to invest in other financial vehicles or to invest in such commodities directly, which could limit the market for the Shares and therefore reduce the liquidity of the Shares.
The NAV Calculation of the Fund May Be Overstated or Understated Due to the Valuation Method Employed When a Settlement Price is Not Available on the Date of NAV Calculation.
Calculating the NAV of the Fund includes, in part, any unrealized profits or losses on open commodity futures contracts. Under normal circumstances, the NAV of the Fund reflects the settlement price of open commodity futures contracts on the date when the NAV is being calculated. However, if a settlement price for a commodity futures contract could not be determined for any reason, the Managing Owner may value the futures contract pursuant to policies the Managing Owner has adopted. In such a situation, there is a risk that the resulting calculation of the Fund’s NAV could be understated or overstated, perhaps to a significant degree.
Futures Risks
Fluctuations in the Price of Assets Held by the Fund Could Have a Materially Adverse Effect on the Value of an Investment in Shares.
The Shares are designed to reflect as closely as possible the changes, positive or negative, in the level of the Index, over time, through the Fund’s portfolio of exchange-traded futures contracts on the Index Commodity. The value of the Shares relates directly to the value of the portfolio, less the liabilities (including estimated accrued but unpaid expenses) of the Fund. The price of the Index Commodity may fluctuate widely. Several factors may affect the prices of the Index Commodity, including, but not limited to:
| • | Global supply and demand of the Index Commodity, which may be influenced by such factors as forward selling by the various commodity’s producers, purchases made by the commodity’s producers to unwind their hedge positions and production and cost levels in the major markets of the Index Commodity; |
| • | Domestic and foreign interest rates and investors’ expectations concerning interest rates; |
| • | Domestic and foreign inflation rates and investors’ expectations concerning inflation rates; |
| • | Investment and trading activities of mutual funds, ETFs,closed-end funds, hedge funds and commodity funds; |
| • | Weather and other environmental conditions; |
| • | Acts of God; and |
| • | Global or regional political, economic or financial events and situations. |
Investing in a Single Commodity May Result in Greater Volatility than an Investment in a Multi-Commodity Index Fund.
The Fund invests in Index Contracts that seek exposure to a single commodity. Other commodity indexes may contain a larger number of commodities than the Index. Accordingly, increased volatility in the Index Commodity is expected to have a greater impact on the Index’s overall volatility than would likely be the case with increased volatility in a single commodity within a broader index. Because the Fund tracks the performance of the Index, your investment in the Fund will be exposed to the greater impact on the Index of volatility in a single Index Commodity.
Because the Futures Contracts Have No Intrinsic Value, the Positive Performance of Your Investment Is Wholly Dependent Upon an Equal and Offsetting Loss.
Trading in futures contracts transfers the risk of future price movements from one market participant to another. For every gain in futures trading, there is an equal and offsetting loss. Accordingly, whether a futures trade is profitable for one party depends on whether the price paid, value received, or cost of delivery under the related futures contract is favorable to that party. The prices of stocks, bonds, and other assets could rise significantly and the economy as a whole could prosper, while the Fund experiences losses as a result of pursuing its investment objective through trading Index Contracts.
8
The Fund May Not Provide a Diversification Benefit to Investments in Other Asset Classes and May Result in Additional Losses to your portfolio.
Historically, commodity futures returns have tended not to be correlated with the returns of other assets such as stocks and bonds. Commodity futures contracts therefore have the potential to help diversify investor portfolios consisting of stocks and bonds, to the extent there is low or negative correlation between commodity futures contracts and other assets held in those portfolios. However, the fact that the Index is not inversely correlated with other assets such as stocks and bonds means that, in seeking to replicate the performance of the Index, the Fund will not necessarily be profitable during unfavorable periods for the stock or bond markets. If the Shares perform in a manner that correlates with the stock or bond markets or otherwise do not perform successfully, the Shares may not provide any diversification from losses in those markets. In such a scenario, the Shares may produce no gains to offset losses from investments in stocks, bonds, or related assets and may result in additional investment losses.
The Fund’s Returns from Futures Trading Will Be Affected by Market Conditions When Replacing Expiring Futures Contracts With New Futures Contracts on the Index Commodity.
The Fund’s returns from futures trading are called excess return, which is the combined return based on the spot prices of the Index Commodity and the roll yield from trading Index Contracts. Market conditions at the time the Fund replaces expiring Index Contracts with new Index Contracts – i.e., when Index Contracts are “rolled” – will affect the Fund’s roll yield. Those market conditions are referred to as backwardation and contango, which will generally affect the Fund’s roll yield as set forth below:
| • | Rolling in a backwardated market will tend to enhance returns from futures trading. Backwardation exists when prices are higher for contracts with shorter-term expirations than those with longer-term expirations, a condition that is typically associated with commodities that are consumed quickly instead of being put in storage. |
| • | Rolling in a contangoed market will tend to cause a drag on returns from futures trading. Contango exists when contract prices are higher in distant delivery months than in nearer delivery months, typically due to costs associated with storing a given physical commodity for a longer period. |
In seeking to track the performance of the Index, therefore, the Fund will be exposed to the effects of backwardation and contango when it rolls its positions in Index Contracts. The Index uses the Optimum YieldTM rolling methodology, which seeks to maximize the roll benefits in backwardated markets and to minimize the losses from rolling in contangoed markets. There can be no assurance that these outcomes will be obtained. The impact of backwardation and contango may also cause the Fund’s performance to vary from the returns of other price references, including the spot prices of the Index Commodity.
Index Risks
The Fund’s Performance May Not Always Replicate the Changes in the Levels of its Index.
Tracking the Index requires trading of the Fund’s portfolio with a view to tracking the Index over time and is dependent upon the skills of the Managing Owner and its trading principals, among other factors. It is possible that the Fund’s performance may not fully replicate the changes in levels of the Index due to disruptions in the markets for the Index Commodity, the imposition of position limits, or due to other extraordinary circumstances.
The Managing Owner may determine to invest in other futures contracts if at any time it is impractical or inefficient to gain full or partial exposure to the Index Commodity through the use of Index Contracts. These other futures contracts may or may not be based on the Index Commodity. When they are not, the Managing Owner may seek to select futures contracts that it reasonably believes tend to exhibit trading prices that correlate with an Index Contract. In addition, the Fund may not be able to replicate the changes in levels of the Index because the total return generated by the Fund is reduced by expenses and transaction costs, including those incurred in connection with the Fund’s trading activities, and increased by, as applicable, Treasury Income, Money Market Income andT-Bill ETF Income.
The Fund Is Not Actively Managed and Tracks the Index During Periods in Which the Index Is Flat or Declining as well as When the Index Is Rising.
The Fund is not actively managed on the basis of judgments relating to economic, financial and market conditions with a view to obtaining positive results under all market conditions. Instead, the Managing Owner seeks to cause the NAV to track the performance of the Index during periods in which the Index is flat or declining as well as when the Index is rising. Therefore, if positions in the Index Commodity are declining in value, the Fund will not close out such positions, except in connection with a change in the composition or weighting of the Index.
9
Unusually LongPeak-to-Valley Drawdown Periods with Respect To the Index May Be Reflected in Equally LongPeak-to-Valley Drawdown Periods with Respect to the Performance of the Shares.
“Peak-to-valley drawdown” represents the cumulative percentage decline inmonth-end NAV per Share due to losses sustained during any period in which the initialmonth-end NAV per Share is not equaled or exceeded by a subsequentmonth-end NAV per Share.
Although past Index levels are not necessarily indicative of future Index levels, thepeak-to-valley drawdown periods that the Index has experienced have been unusually long and have lasted for multi-year drawdown periods.
Because it is expected that the Fund’s performance will track the change of its underlying Index, the Fund would experience a continuous drawdown during the period that the Index experiences such a drawdown. The value of your Shares will also decrease during such a period.
Regulatory Risks
Position Limits and Other Potential Limitations on Futures Trading May Restrict the Creation of Baskets and the Operation of the Fund.
Position Limits. CFTC and futures exchange rules impose position limits on market participants, including the Fund, trading in certain commodity futures contracts. These position limits prohibit any person from holding a position of more than a specific number of futures contracts. Generally, position limits in the physical delivery markets are set at a stricter level during the spot month, which is the month when the futures contract matures and becomes deliverable, versus the limits for any other month or for all months combined. Limits are generally applied on an aggregate basis to positions held in accounts that are subject to 10% or greater common ownership or control. There are exemptions from this general aggregation requirement.
The Index is composed of one Index Commodity, which is subject to position limits imposed by the CFTC and/or the rules of futures exchanges on which Index Contracts are traded. The CFTC has been seeking to amend its position limits rules for several years. In November 2013, the CFTC proposed for public comment new position limits and aggregation regulations. After a lengthy comment period on this proposal, the CFTCre-proposed, in December 2016, position limits for 25 commodity futures and options contracts, as well as for swaps that are economically equivalent to those contracts. In December 2016, the CFTC adopted rule amendments that provide exemptions from the general requirement to aggregate all positions that are held pursuant to 10% or greater common ownership or control.
The ultimate outcome of this rulemaking effort, and the resulting impact on the Fund of any final regulations that impose new or revised position limits, is unknown. It is also possible that futures exchanges may amend their existing position limits rules or adopt new requirements. In addition, the CFTC could separately implement other changes to specific position limits or to the regime as a whole. New or more restrictive position limits could reduce liquidity in the market, which would be likely to have adverse effects on the pricing of commodity futures contracts. Changes in CFTC and/or exchange-level position limits rules therefore could adversely affect the Fund’s ability to pursue its investment objective.
Position Aggregation. In general, a trader is required by CFTC or exchange rules, as applicable, to aggregate all positions in accounts as to which the trader has 10% or greater ownership or control. CFTC and exchange rules provide exemptions from this requirement. For example, a trader is not required to aggregate positions in multiple accounts that it owns or controls if that trader is able to satisfy the requirements of an exemption from aggregation of those accounts, including, where available, the independent account controller exemption.
Failure to comply with the independent account controller exemption or another exemption from the aggregation requirement could obligate the Managing Owner to aggregate positions in multiple accounts under its control, which could include the Fund and other commodity pools or accounts under the Managing Owner’s control. In such a scenario, the Fund may not be able to obtain exposure to one or more Index Contracts necessary to pursue its investment objective, or it may be required to liquidate existing Index Contract positions in order to comply with a limit. Such an outcome could adversely affect the Fund’s ability to pursue its investment objective or achieve favorable performance.
The CFTC amended its position aggregation rules in December 2016. The CFTC staff subsequently issued time-limitedno-action relief from compliance with certain requirements under the amended aggregation rules, including the general requirement to aggregate positions in the same commodity futures contracts traded pursuant to substantially identical trading strategies. Thisno-action relief expires on August 12, 2019.
Accountability Levels. Exchanges may establish accountability levels applicable to futures contracts instead of position limits. An exchange may order a person who holds or controls a position in excess of a position accountability level not to further increase its position, to comply with any prospective limit that exceeds the size of the position owned or controlled, or to reduce any open position that exceeds the position accountability level if the exchange determines that such action is necessary to maintain an orderly market. Position accountability levels could adversely affect the Fund’s ability to establish and maintain positions in commodity futures contracts to which such levels apply, if the Fund were to trade in such contracts. Such an outcome could adversely affect the Fund’s ability to pursue its investment objective.
10
Daily Limits. U.S. futures exchanges and some foreign exchanges have regulations that limit the amount of fluctuation in futures contract prices that may occur during a single business day. These limits are generally referred to as “daily price fluctuation limits” or “daily limits,” and the maximum or minimum price of a contract on any given day as a result of these limits is referred to as a “limit price”. Once a limit price has been reached in a particular contract, it is usually the case that no trades may be made at a different price than specified in the limit. The duration of limit prices generally varies. Limit prices may have the effect of precluding the Fund from trading in a particular contract or requiring the Fund to liquidate contracts at disadvantageous times or prices. Either of those outcomes could adversely affect the Fund’s ability to pursue its investment objective.
Potential Effects of Positions Limits, Accountability Levels, and Daily Limits. The Fund is currently subject to position limits and may be subject to new and more restrictive position limits in the future. If the Fund reached a position limit or accountability level or became subject to a daily limit, its ability to issue new Baskets or reinvest income in additional commodity futures contracts may be limited to the extent these restrictions limit its ability to establish new futures positions, add to existing positions, or otherwise transact in futures. Limiting the size of the Fund, or restricting the Fund’s futures trading, under these requirements could adversely affect the Fund’s ability to pursue its investment objective.
Failure of Futures Commission Merchants or Commodity Brokers to Segregate Assets May Cause Losses for the Fund.
The Commodity Exchange Act requires a futures commission merchant to segregate all funds received from customers from such futures commission merchant’s proprietary assets. If the Commodity Broker fails to segregate customer assets as required, the assets of the Fund might not be fully protected in the event of the Commodity Broker’s bankruptcy. Furthermore, in the event of the Commodity Broker’s bankruptcy, the Fund could be limited to recovering either apro ratashare of all available funds segregated on behalf of the Commodity Broker’s combined customer accounts or the Fund may not recover any assets at all, even though certain property specifically traceable to the Fund was held by the Commodity Broker.
The Commodity Exchange Act requires an approved derivatives clearing organization to segregate all funds and other property received from a clearing member’s customers in connection with U.S. futures and options contracts from any funds held at the clearing organization to support the clearing member’s proprietary trading. Nevertheless, customer funds held at a clearing organization in connection with any futures or options contracts may be held in a commingled omnibus account, which may not identify the name of the clearing member’s individual customers. With respect to futures and options contracts, a clearing organization may use assets of anon-defaulting customer held in an omnibus account at the clearing organization to satisfy payment obligations of a defaulting customer of the clearing member to the clearing organization. In the event of a default of the clearing futures commission merchant’s other clients or the clearing futures commission merchant’s failure to extend its own funds in connection with any such default, a customer may not be able to recover the full amount of assets deposited by the clearing futures commission merchant with the clearing organization on the customer’s behalf.
In the event of a bankruptcy or insolvency of any exchange or a clearing house, the Fund could experience a loss of the funds deposited through the Commodity Broker as margin with the exchange or clearing house, a loss of any unrealized profits on its open positions on the exchange, and the loss of unrealized profits on its closed positions on the exchange.
Regulatory Changes or Actions, May Alter the Operations and Profitability of the Fund.
The regulation of commodity interest transactions and markets, including under the Dodd-Frank Act, is a rapidly changing area of law and is subject to ongoing modification by governmental and judicial action. In particular, the Dodd-Frank Act has expanded the regulation of markets, market participants and financial instruments. The regulatory regime under the Dodd-Frank Act has imposed additional compliance and legal burdens on participants in the markets for futures and other commodity interests. For example, under the Dodd-Frank Act new capital and risk requirements have been imposed on market intermediaries. Those requirements may cause the cost of trading to increase for market participants, like the Fund, that must interact with those intermediaries to carry out their trading activities. These increased costs can detract from the Fund’s performance.
The Fund and the Managing Owner Are Subject to Extensive Legal and Regulatory Requirements.
The Fund is subject to a comprehensive scheme of regulation under the federal commodity futures trading and securities laws, as well as futures market rules and the rules and listing standards for its Shares. The Fund and the Managing Owner could each be subject to sanctions for a failure to comply with those requirements, which could adversely affect the Fund’s financial performance and its ability to pursue its investment objective.
In addition, the Fund is subject to significant disclosure, internal control, governance, and financial reporting requirements because the Shares are publicly traded.
For example, the Fund is responsible for establishing and maintaining internal controls over financial reporting. Under this requirement, the Fund must adopt, implement and maintain an internal control system designed to provide reasonable assurance to its management regarding the preparation and fair presentation of published financial statements. The Fund is also required to adopt, implement, and maintain disclosure controls and procedures that are designed to ensure information required to be disclosed by the Fund in reports that it files or submits to the SEC is recorded, processed, summarized and reported within the time periods specified by the SEC. There is a risk that the Fund’s internal controls over financial reporting and disclosure controls and procedures could fail to
11
work properly or otherwise fail to satisfy SEC requirements. Such a failure could result in the reporting or disclosure of incorrect information or a failure to report information on a timely basis. Such a failure could be to the disadvantage of Shareholders and could expose the Fund to penalties or otherwise adversely affect the Fund’s status under the federal securities laws and SEC regulations.
All internal control systems, no matter how well designed, have inherent limitations. Therefore, even those systems determined to be effective may provide only reasonable assurance with respect to financial statement preparation and presentation and other disclosure matters.
Current Discussions between the SEC and PricewaterhouseCoopers LLP regarding PricewaterhouseCoopers LLP’s Independence Could Have Potentially Adverse Consequences for the Fund.
PricewaterhouseCoopers LLP informed the Fund that it has identified an issue related to its independence under Rule2-01(c)(1)(ii)(A) of RegulationS-X (referred to as the Loan Rule). The Loan Rule prohibits accounting firms, such as PricewaterhouseCoopers LLP, from being deemed independent if they have certain financial relationships with their audit clients or certain affiliates of those clients. The Fund is required under various securities laws to have its financial statements audited by an independent accounting firm.
The Loan Rule specifically provides that an accounting firm would not be independent if it or certain affiliates and covered persons receive a loan from a lender that is a record or beneficial owner of more than ten percent of an audit client’s equity securities (referred to as a “more than ten percent owner”). For purposes of the Loan Rule, audit clients include the Fund as well as all registered investment companies advised by the Managing Owner and its affiliates, including other subsidiaries of the Managing Owner’s parent company, Invesco Ltd. (collectively, the “Invesco Fund Complex”). PricewaterhouseCoopers LLP informed the Fund it and certain affiliates and covered persons have relationships with lenders who hold, as record owner, more than ten percent of the shares of certain funds within the Invesco Fund Complex, which may implicate the Loan Rule.
On June 20, 2016, the SEC Staff issued a“no-action” letter to another mutual fund complex (see Fidelity Management & Research Company et al.,No-Action Letter) related to the audit independence issue described above. In that letter, the SEC confirmed that it would not recommend enforcement action against a fund that relied on audit services performed by an audit firm that was not in compliance with the Loan Rule in certain specified circumstances. On May 2, 2018, the SEC proposed amendments to the Loan Rule that, if adopted as proposed, would address many of the issues that led to issuance of theno-action letter. In connection with prior independence determinations, PricewaterhouseCoopers LLP communicated, as contemplated by theno-action letter, that it believes that it remains objective and impartial and that a reasonable investor possessing all the facts would conclude that PricewaterhouseCoopers LLP is able to exhibit the requisite objectivity and impartiality to report on the Fund’s financial statements as the independent registered public accounting firm. PricewaterhouseCoopers LLP also represented that it has complied with PCAOB Rule 3526(b)(1) and (2), which are conditions to the Funds relying on the no action letter, and affirmed that it is an independent accountant within the meaning of PCAOB Rule 3520. Therefore, the Managing Owner, the Fund and PricewaterhouseCoopers LLP concluded that PricewaterhouseCoopers LLP could continue as the Fund’s independent registered public accounting firm. The Invesco Fund Complex relied upon theno-action letter in reaching this conclusion.
If in the future the independence of PricewaterhouseCoopers LLP is called into question under the Loan Rule by circumstances that are not addressed in the SEC’sno-action letter, the Fund will need to take other action in order for the Fund’s filings with the SEC containing financial statements to be deemed compliant with applicable securities laws. Such additional actions could result in additional costs, impair the ability of the Fund to issue new shares or have other material adverse effects on the Fund. The SECno-action relief was initially set to expire eighteen (18) months from issuance but has been extended by the SEC without an expiration date, except that theno-action letter will be withdrawn upon the effectiveness of any amendments to the Loan Rule designed to address the concerns expressed in the letter.
Tax Risks
Shareholders Will Be Subject to Taxation on Their Allocable Share of the Fund’s Taxable Income, Whether or Not They Receive Cash Distributions.
Shareholders will be subject to U.S. federal income taxation and, in some cases, state, local, or foreign income taxation on their allocable share of the Fund’s taxable income, whether or not they receive cash distributions from the Fund. Shareholders may not receive cash distributions equal to their share of the Fund’s taxable income or even the tax liability that results from such income.
Items of Income, Gain, Loss and Deduction with Respect to Shares Could Be Reallocated if the IRS Does Not Accept the Assumptions or Conventions Used by the Fund in Allocating Such Items.
U.S. federal income tax rules applicable to partnerships are complex and often difficult to apply to publicly traded partnerships. The Fund will apply certain assumptions and conventions in an attempt to comply with applicable rules and to report items of income, gain, loss and deduction to Shareholders in a manner that reflects the Shareholders’ beneficial interest in such tax items, but these assumptions and conventions may not be in compliance with all aspects of the applicable tax requirements. It is possible that the
12
United States Internal Revenue Service (the “IRS”) will successfully assert that the conventions and assumptions used by the Fund do not satisfy the technical requirements of the Internal Revenue Code of 1986, as amended (the “Code”) and/or the Federal Tax Regulations codified under 26 C.F.R., referred to herein as the Treasury Regulations, and could require that items of income, gain, loss and deduction be adjusted or reallocated in a manner that adversely affects one or more Shareholders.
The Fund is a partnership, which is not subject to U.S. federal income taxes. Rather, the partnership’s taxable income flows through to the owners, who are responsible for paying the applicable income taxes on the income allocated to them. For tax years beginning on or after January 1, 2018, the Fund is subject to partnership audit rules enacted as part of the Bipartisan Budget Act of 2015 (the “Centralized Partnership Audit Regime”). Under the Centralized Partnership Audit Regime, any IRS audit of the Fund would be conducted at the Fund level, and if the IRS determines an adjustment, the default rule is that the Fund would pay an “imputed underpayment” including interest and penalties, if applicable. The Fund may instead elect to make a“push-out” election, in which case the shareholders for the year that is under audit would be required to take into account the adjustments on their own personal income tax returns.
The Tax Cuts and Jobs Act (the “Tax Act”) Makes Significant Changes to U.S. Federal Income Tax Rules.
The Tax Act makes significant changes to the U.S. federal income tax rules for taxation of individuals and corporations, generally effective for taxable years beginning after December 31, 2017. Most of the changes applicable to individuals are temporary and would apply only to taxable years beginning after December 31, 2017 and before January 1, 2026. In particular for individuals, the Tax Act establishes for taxable years beginning after December 31, 2017 and before January 1, 2026 a 20% deduction for “qualified publicly traded partnership income” within the meaning of new Section 199A(e)(5) of the Code. In general, “qualified publicly traded partnership income” for this purpose is an item of income, gain, deduction or loss that is effectively connected with a United States trade or business and includable income for the year, but does not include certain investment income. It is currently not expected that the Fund’s income will be eligible for such deduction because, as discussed below, although the matter is not free from doubt, the Fund believes that the activities directly conducted by the Fund will not result in the Fund being engaged in a trade or business within the United States. Potential investors should consult their tax advisors regarding the availability of such deduction for their allocable share of the Fund’s items of income, gain, deduction and loss.
PROSPECTIVE INVESTORS ARE STRONGLY URGED TO CONSULT THEIR OWN TAX ADVISORS AND COUNSEL WITH RESPECT TO THE POSSIBLE TAX CONSEQUENCES TO THEM OF AN INVESTMENT IN THE SHARES; SUCH TAX CONSEQUENCES MAY DIFFER WITH RESPECT TO DIFFERENT INVESTORS.
Other Risks
An Insolvency Resulting from Another Series in the Trust or the Trust Itself May Have a Material Adverse Effect On the Fund.
The Fund is a series or a part of a Delaware statutory trust. Pursuant to Delaware law, the organization of the Trust provides that the assets and liabilities of the Fund are separate from the assets and liabilities of all other series of the Trust, as well as the larger Trust itself. Though such organization may, under state law, protect the assets of the Fund in an insolvency action brought by the creditors of another series of the Trust, this may be insufficient to protect the assets of the Fund from such creditors in an insolvency action in Federal court, or in a court in a foreign jurisdiction. Accordingly, an insolvency resulting from another series in the Trust or the Trust itself may have a material adverse effect on the Fund. The material risks associated with the other series have not been included in this Report.
Disruptions in the Ability to Create and Redeem Baskets May Adversely Affect Investors.
It is generally expected that the public trading price per Share will track the NAV per Share closely over time. The relationship between the public trading price per Share and the NAV per Share depends, to a considerable degree, on the ability of Authorized Participants or their clients or customers to purchase and redeem Baskets in the ordinary course. If the process for creating or redeeming Shares is impaired for any reason, Authorized Participants and their clients or customers may not be able to purchase and redeem Baskets or, even if possible, may choose not to do so. The inability to purchase and redeem Baskets, or the partial impairment of the ability to purchase and redeem Baskets, could result in Shares trading at a premium or discount to the NAV of the Fund. Such a premium or discount could be significant, depending upon the nature or duration of the impairment.
If the Fund were to issue all Shares that have been registered, it would not be able to create new Baskets until it registered additional Shares and those additional Shares became available for sale. An inability to create new Baskets could increase the possibility that the trading price per Share would not track closely the NAV per Share. In addition, the Fund may, in its discretion, suspend the creation of Baskets. Suspension of creations may adversely affect how the Shares are traded and could cause Shares to trade at a premium or discount to the NAV of the Fund, perhaps to a significant degree.
The Shares Could Decrease in Value if Unanticipated Operational or Trading Problems Arise.
The mechanisms and procedures governing the creation, redemption and offering of the Shares have been developed specifically for the Fund. Consequently, there may be unanticipated problems with respect to the mechanics of the operations of the Fund and the trading of the Shares that could have a material adverse effect on an investment in the Shares. To the extent that unanticipated operational or trading problems arise, the Managing Owner’s past experience and qualifications may not be suitable for solving those problems.
13
Historical Performance of the Fund and the Index Is Not Indicative of Future Performance.
Past performance of the Fund or the Index is not necessarily indicative of future results. Therefore, past performance of the Fund or the Index should not be relied upon in deciding whether to buy Shares of the Fund.
Fees and Expenses May Deplete the Fund’s Assets if the Fund’s Investment Performance Is Not Favorable.
The Fund pays fees and expenses regardless of its investment performance. Such fees and expenses include asset-based fees of 0.75% per annum. Additional charges include brokerage fees of approximately 0.03% per annum in the aggregate and selling commissions. Selling commissions are not included in the Fund’s breakeven calculation. The sum of the Fund’s Treasury Income, Money Market Income and/orT-Bill ETF Income may not exceed its fees and expenses. If such income does not exceed its fees and expenses, in order to break even, the Fund’s futures trading activity will need to have a favorable performance that exceeds the difference between the sum of the Fund’s Treasury Income, Money Market Income and/orT-Bill ETF Income and its fees and expenses. If the Fund’s futures trading performance is not sufficiently favorable, the Fund’s expenses could deplete its assets over time. In such a scenario, the value of your Shares will decrease.
There May Be Circumstances That Could Prevent the Fund from Being Operated in a Manner Consistent with its Investment Objective.
There may be circumstances outside the control of the Managing Owner and/or the Fund that make it, for all practical purposes, impossible tore-position the Fund and/or to process a purchase or redemption order. Examples of such circumstances include: natural disasters; public service disruptions or utility problems such as those caused by fires, floods, extreme weather conditions, and power outages resulting in telephone, telecopy, and computer failures; market conditions or activities causing trading halts; systems failures involving computer or other information systems affecting the aforementioned parties, as well as DTC, or any other participant in the purchase process, and similar extraordinary events. While the Managing Owner has established and implemented a disaster recovery plan, circumstances such as those identified above may prevent the Fund from being operated in a manner consistent with its investment objective.
Redemption Orders for Baskets May Be Subject to Postponement, Suspension or Rejection Under Certain Circumstances.
The Managing Owner may, in its discretion, suspend the right of redemption or postpone the redemption order settlement date with respect to Baskets for (1) any period during which an emergency exists as a result of which the redemption distribution is not reasonably practicable, or (2) such other period as the Managing Owner determines to be necessary for the protection of the Shareholders. In addition, the Fund will reject a redemption order if the order is not in proper form as described in the participant agreement with the Authorized Participant, or if the fulfillment of the order, in the opinion of the Fund’s counsel, might be unlawful. Any such postponement, suspension or rejection could adversely affect a redeeming Authorized Participant. For example, the resulting delay may adversely affect the value of the Authorized Participant’s redemption proceeds if the NAV of the Fund declines during the period of delay. The Fund disclaims any liability for any loss or damage that may result from any such suspension or postponement.
Shareholders Do Not Have the Protections Associated with Ownership of Shares in an Investment Company Registered Under the Investment Company Act of 1940.
The Fund is not registered as an investment company under the Investment Company Act of 1940, as amended. Consequently, Shareholders do not have the legal and regulatory protections provided to the investors in investment companies that are registered as such.
Shareholders Do Not Have the Rights Enjoyed by Investors in Certain Other Vehicles.
The Shares have none of the statutory rights normally associated with the ownership of shares of a corporation. However, under Delaware law, a beneficial owner of a business trust (such as a Shareholder) may, under certain circumstances, institute legal action on behalf of himself and all other similarly situated beneficial owners to recover damages from a third party where a managing owner has failed or refused to institute legal action on behalf of himself and all other similarly situated beneficial owners to recover damages from a managing owner for violations of fiduciary duties, or on behalf of a business trust to recover damages from a third party where a managing owner has failed or refused to institute proceedings to recover such damages. The Shares have limited voting and distribution rights (for example, Shareholders do not have the right to elect directors and the Fund is not required to pay regular distributions, although the Fund may pay distributions in the discretion of the Managing Owner).
Various Actual and Potential Conflicts of Interest May Be Detrimental to Shareholders.
The Fund is subject to actual and potential conflicts of interest involving the Managing Owner or any of its affiliates, the Commodity Broker, including its principals and its affiliates, the Index Sponsor and Marketing Agent, and Invesco Distributors. The Managing Owner and its principals, all of whom are engaged in other investment activities, are not required to devote substantially all of their time to the business of the Fund, which also presents the potential for numerous conflicts of interest with the Fund. The Managing Owner and its principals and affiliates are engaged in a broad array of asset management and financial services activities and may engage in activities during the ordinary course of business that cause their interests or those of their other clients to conflict with those of the Fund and its Shareholders.
14
As a result of these and other relationships, parties involved with the Fund have a financial incentive to act in a manner other than in the best interests of the Fund and the Shareholders. For example, by investing in affiliated money market mutual funds and/orT-Bill ETFs for margin and/or cash management purposes, the Managing Owner may select affiliated money market mutual funds and/orT-Bill ETFs that may pay dividends that are lower thannon-affiliated money market mutual funds and/orT-Bill ETFs. In addition, the Managing Owner would have a conflict of interest if it sought to redeem the Fund’s interest in an affiliated money market mutual fund orT-Bill ETF in circumstances when such a redemption would be unfavorable for the affiliated fund. The Managing Owner has not established any formal procedure to resolve conflicts of interest. Consequently, investors are dependent on the good faith of the respective parties subject to such conflicts to resolve them equitably. Although the Managing Owner attempts to monitor these conflicts, it is extremely difficult, if not impossible, for the Managing Owner to ensure that these conflicts do not, in fact, result in adverse consequences to the Fund and the Shareholders.
The Fund may be subject to certain conflicts with respect to the Commodity Broker, including, but not limited to, conflicts that result from receiving greater amounts of compensation from other clients, or purchasing opposite or competing positions on behalf of third party accounts traded through the Commodity Broker.
Because the Managing Owner and Invesco Distributors are affiliates, the Managing Owner has a disincentive to replace Invesco Distributors. Furthermore, the Managing Owner did not conduct an arm’s length negotiation when it retained Invesco Distributors.
Lack of Independent Advisers Representing Investors.
The Managing Owner has consulted with counsel, accountants and other advisers regarding the operation of the Fund. No counsel has been appointed to represent you in connection with the Fund’s continuous offering of Shares. Accordingly, you should consult your own legal, tax and financial advisers about whether you should invest in the Fund.
Possibility of Termination of the Fund May Adversely Affect Your Portfolio.
It is ultimately within the discretion of the Managing Owner whether it will continue to operate and advise the Fund. The Managing Owner may withdraw from the Fund upon 120 days’ prior written notice to all Shareholders and the Trustee, which would cause the Fund to terminate unless a substitute managing owner was obtained. Shareholders owning 50% or more of the Shares have the power to terminate the Fund. If it is so exercised, investors who may wish to continue to invest in a vehicle that tracks the Fund’s Index will have to find another vehicle, and may not be able to find another vehicle that offers the same features as the Fund. See “Description of the Shares; The Funds; Certain Material Terms of the Trust Agreement – Termination Events” in the Fund’s Prospectus for a summary of termination events. Such detrimental developments could cause you to liquidate your investments and upset the overall maturity and timing of your investment portfolio. If the registrations with the CFTC or memberships in the NFA of the Managing Owner or the Commodity Broker were revoked or suspended, such entity would no longer be able to provide services to the Fund.
Competing Claims Over Ownership of Intellectual Property Rights Related to the Fund Could Adversely Affect the Fund and an Investment in the Shares.
While the Managing Owner believes that all intellectual property rights needed to operate the Fund in the manner described in the Fund’s Prospectus are either owned by or licensed to the Managing Owner or have been obtained, third parties may allege or assert ownership of intellectual property rights which may be related to the design, structure and operations of the Fund. To the extent any claims of such ownership are brought or any proceedings are instituted to assert such claims, the issuance of any restraining orders or injunctions, the negotiation, litigation or settlement of such claims, or the ultimate disposition of such claims in a court of law may adversely affect the Fund and an investment in the Shares. For example, such actions could result in expenses or damages payable by the Fund, suspension of activities or the termination of the Fund.
The Value of the Shares Will Be Adversely Affected if the Fund Is Required to Indemnify the Trustee or the Managing Owner.
Under the Trust Agreement, the Trustee and the Managing Owner have the right to be indemnified for any liability or expense they incur, except for any expenses resulting from gross negligence or willful misconduct. That means the Managing Owner may require the assets of the Fund to be sold in order to cover losses or liability suffered by it or by the Trustee. Any sale of that kind would reduce the NAV of the Fund and, consequently, the value of the Shares.
Although the Shares Are Limited Liability Investments, Certain Circumstances such as Bankruptcy of the Fund or Indemnification of the Fund by the Shareholders Will Increase a Shareholder’s Liability.
The Shares are limited liability investments; investors may not lose more than the amount that they invest including any appreciation in their investments. However, Shareholders could be required, as a matter of bankruptcy law, to return to the estate of the Fund any distribution they received at a time when the Fund was in fact insolvent or in violation of the Trust Agreement. In addition, Shareholders agree in the Trust Agreement that they will indemnify the Fund for any harm suffered by it as a result of:
| • | Shareholders’ actions unrelated to the business of the Fund, or |
15
| • | taxes imposed on the Shares by the states or municipalities in which such investors reside. |
The Fund May Lose Money on Its Holdings of Money Market Mutual Funds.
The Fund may invest in government money market funds that have chosen to not rely on the ability to impose fees on shareholder redemptions, or liquidity fees, or temporarily to suspend redemption privileges, or gates, if the government money market fund’s weekly liquid assets fall below a certain threshold. Although such government money market funds seek to preserve the value of an investment at $1.00 per share, there is no guarantee that they will be able to do so. As a result, the Fund may lose money by investing in a government money market fund. An investment in a government money market fund is not insured or guaranteed by the Federal Deposit Insurance Corporation (“FDIC”) or any other government agency. The share price of a government money market fund can fall below the $1.00 share price. The Fund cannot rely on or expect a government money market fund’s adviser or its affiliates to enter into support agreements or take other actions to maintain the government money market fund’s $1.00 share price. The credit quality of a government money market fund’s holdings can change rapidly in certain markets, and the default of a single holding could have an adverse impact on the government money market fund’s share price. Due to fluctuations in interest rates, the market value of securities held by a government money market fund may vary. A government money market fund’s share price can also be negatively affected during periods of high redemption pressures and/or illiquid markets.
Due to the Increased Use of Technologies, Intentional and Unintentional Cyber Attacks Pose Operational and Information Security Risks.
With the increased use of technologies such as the Internet and the dependence on computer systems to perform necessary business functions, the Fund is susceptible to operational and information security risks. In general, cyber incidents can result from deliberate attacks or unintentional events. Cyber attacks include, but are not limited to gaining unauthorized access to digital systems for purposes of misappropriating assets or sensitive information, corrupting data, or causing operational disruption.
Cyber attacks may also be carried out in a manner that does not require gaining unauthorized access, such as causingdenial-of-service attacks on websites. Cyber security failures or breaches of the Fund’s third party service providers (including, but not limited to, the Index Sponsor, the Administrator and the Transfer Agent) or the money market mutual funds andT-Bill ETFs in which the Fund invests, have the ability to cause disruptions and impact business operations, potentially resulting in financial losses, the inability of Shareholders or Authorized Participants to transact business in Shares and Baskets respectively, violations of applicable privacy and other laws, regulatory fines, penalties, reputational damage, reimbursement or other compensation costs, and/or additional compliance costs. In addition, substantial costs may be incurred in order to prevent any cyber incidents in the future. The Fund and its Shareholders could be negatively impacted as a result.
While the Managing Owner has established business continuity plans and systems reasonably designed to detect and prevent such cyber attacks from being effective, there are inherent limitations in such plans and systems. For instance, it is possible that certain existing risks have not been identified or that new risks will emerge before countervailing measures can be implemented. Furthermore, the Fund cannot control, or even necessarily influence, the cyber security plans and systems put in place by the Fund’s third party service providers. Since the Fund is dependent upon third party service providers (including the Managing Owner) for substantially all of its operational needs, the Fund is subject to the risk that a cyber attack on a service provider will materially impair its normal operations even if the Fund itself is not subject to such an attack. Cyber attacks may also cause disruptions to the futures exchanges and clearinghouses through which the Fund invests in futures contracts and to the exchanges on which the Fund buys and sells shares ofT-Bill ETFs, which could result in disruptions to the Fund’s ability to pursue its investment objective, resulting in financial losses to the Fund and Shareholders.
| ITEM 1B. | UNRESOLVED STAFF COMMENTS |
None.
| ITEM 2. | PROPERTIES |
The Fund does not own or use physical properties in the conduct of its business. Its assets consist of futures contracts, cash, United States Treasury Obligations and may consist of money market mutual funds and/orT-Bill ETFs. The Managing Owner’s headquarters are located at 3500 Lacey Road, Suite 700, Downers Grove, Illinois 60515.
| ITEM 3. | LEGAL PROCEEDINGS |
None.
| ITEM 4. | MINE SAFETY DISCLOSURES |
Not applicable.
16
| ITEM 5. | MARKET FOR REGISTRANT’S COMMON EQUITY, RELATED STOCKHOLDER MATTERS AND ISSUER PURCHASES OF EQUITY SECURITIES |
Market Information
The Shares have been trading on the NYSE Arca since November 25, 2008 under the symbol “DGL.”
Holders
As of January 31, 2019, the Fund had 69 holders of record of its Shares.
Sales of Unregistered Securities and Use of Proceeds of Registered Securities
(a) There have been no unregistered sales of the Shares. No Shares are authorized for issuance by the Fund under equity compensation plans.
(b) Not applicable.
(c) The following table summarizes the redemptions by Authorized Participants during the Three Months Ended December 31, 2018:
Period of Redemption | Total Number of Shares Redeemed | Average Price Paid per Share | ||||||
October 1, 2018 to October 31, 2018 | 600,000 | $ | 38.31 | |||||
November 1, 2018 to November 30, 2018 | — | $ | — | |||||
December 1, 2018 to December 31, 2018 | 200,000 | $ | 39.07 | |||||
|
|
|
| |||||
Total | 800,000 | $ | 38.50 | |||||
|
|
|
| |||||
| ITEM 6. | SELECTED FINANCIAL DATA |
The following table summarizes the relevant 2018, 2017, 2016, 2015 and 2014 financial data for the Fund and should be read in conjunction with the Fund’s financial statements, and the notes and schedules related thereto, which are included in this Report.
| Years Ended December 31, | ||||||||||||||||||||
| 2018 | 2017 | 2016 | 2015 | 2014 | ||||||||||||||||
Income(a) | $ | 2,618,279 | $ | 1,352,182 | $ | 642,744 | $ | 52,107 | $ | 53,278 | ||||||||||
Net investment income (loss) | $ | 1,494,430 | $ | 147,497 | $ | (1,029,543 | ) | $ | (1,094,709 | ) | $ | (1,166,103 | ) | |||||||
Net realized and net change in unrealized gains/(losses) on United States Treasury Obligations, Affiliated Investments and Commodity Futures Contracts | $ | (11,046,469 | ) | $ | 13,289,152 | $ | 1,190,691 | $ | (19,768,075 | ) | $ | (4,157,997 | ) | |||||||
Net Income (Loss) | $ | (9,552,039 | ) | $ | 13,436,649 | $ | 161,148 | $ | (20,862,784 | ) | $ | (5,324,100 | ) | |||||||
Net Income (Loss) per Share | $ | (1.51 | ) | $ | 4.51 | $ | 2.35 | $ | (4.48 | ) | $ | (1.15 | ) | |||||||
Return of Capital Distributions per General Share | $ | (0.58 | ) | $ | (0.04 | ) | $ | — | $ | — | $ | — | ||||||||
Return of Capital Distributions per Share | $ | (0.58 | ) | $ | (0.04 | ) | $ | — | $ | — | $ | — | ||||||||
Net increase (decrease) in cash | $ | (497,330 | ) | $ | (2,359,590 | ) | $ | (2,484,552 | ) | $ | (5,310,428 | ) | $ | 3,098,597 | ||||||
| As of December 31, | ||||||||||||||||||||
| 2018 | 2017 | 2016 | 2015 | 2014 | ||||||||||||||||
Total Assets | $ | 96,055,229 | $ | 141,242,298 | $ | 193,798,351 | $ | 138,856,883 | $ | 160,122,286 | ||||||||||
General Shares NAV | $ | 39.42 | $ | 41.51 | $ | 37.04 | $ | 34.69 | $ | 39.17 | ||||||||||
Shares NAV | $ | 39.42 | $ | 41.51 | $ | 37.04 | $ | 34.69 | $ | 39.17 | ||||||||||
| (a) | Income for the year ended December 31, 2014 includes interest expense on overdraft balances. These amounts are included in Interest Expense for the years ended December 31, 2018, 2017, 2016 and 2015. |
17
Selected Quarterly Financial Data (Unaudited)
| For the Three Months Ended | ||||||||||||||||
| March 31, 2018 | June 30, 2018 | September 30, 2018 | December 31, 2018 | |||||||||||||
Income | $ | 628,013 | $ | 777,041 | $ | 652,894 | $ | 560,331 | ||||||||
Net investment income (loss) | $ | 301,026 | $ | 441,149 | $ | 392,888 | $ | 359,367 | ||||||||
Net realized and net change in unrealized gains/(losses) on United States Treasury Obligations, Affiliated Investments and Commodity Futures Contracts | $ | 251,086 | $ | (10,195,728 | ) | $ | (7,413,763 | ) | $ | 6,311,936 | ||||||
Net Income/(loss) | $ | 552,112 | $ | (9,754,579 | ) | $ | (7,020,875 | ) | $ | 6,671,303 | ||||||
Increase/(decrease) in Net Asset Value | $ | 51,538,198 | $ | (50,420,390 | ) | $ | (29,903,925 | ) | $ | (17,751,636 | ) | |||||
Net Income (loss) per Share(a) | $ | 0.38 | $ | (2.37 | ) | $ | (2.07 | ) | $ | 2.55 | ||||||
Return of Capital Distributions per General Share(a) | $ | — | $ | — | $ | — | $ | (0.58 | ) | |||||||
Return of Capital Distributions per Share(a) | $ | — | $ | — | $ | — | $ | (0.58 | ) | |||||||
| (a) | The amount shown for a share outstanding for quarterly statements may not correlate with year to date amounts due to timing of subscriptions and redemptions in relation to income earned or distributed. |
| For the Three Months Ended | ||||||||||||||||
| March 31, 2017 | June 30, 2017 | September 30, 2017 | December 31, 2017 | |||||||||||||
Income | $ | 184,364 | $ | 341,738 | $ | 426,568 | $ | 399,512 | ||||||||
Net investment income (loss) | $ | (85,248 | ) | $ | 3,963 | $ | 106,635 | $ | 122,147 | |||||||
Net realized and net change in unrealized gains/(losses) on United States Treasury Obligations, Affiliated Investments and Commodity Futures Contracts | $ | 11,713,827 | $ | (3,137,700 | ) | $ | 2,668,106 | $ | 2,044,919 | |||||||
Net Income/(loss) | $ | 11,628,579 | $ | (3,133,737 | ) | $ | 2,774,741 | $ | 2,167,066 | |||||||
Increase/(decrease) in Net Asset Value | $ | (48,483,832 | ) | $ | 6,551,240 | $ | 45,238,478 | $ | (54,757,150 | ) | ||||||
Net Income (loss) per Share(a) | $ | 2.99 | $ | (0.38 | ) | $ | 1.16 | $ | 0.74 | |||||||
Return of Capital Distributions per General Share(a) | $ | — | $ | — | $ | — | $ | (0.04 | ) | |||||||
Return of Capital Distributions per Share(a) | $ | — | $ | — | $ | — | $ | (0.04 | ) | |||||||
| (a) | The amount shown for a share outstanding for quarterly statements may not correlate with year to date amounts due to timing of subscriptions and redemptions in relation to income earned or distributed. |
18
ITEM 7. MANAGEMENT’S DISCUSSION AND ANALYSIS OF FINANCIAL CONDITION AND RESULTS OF OPERATIONS
This information should be read in conjunction with the financial statements and notes included in Item 8 of Part II of this “Report”. The discussion and analysis which follows may contain trend analysis and other forward-looking statements. See “Cautionary Statement Concerning Forward-Looking Information” above.
You should not place undue reliance on any forward-looking statements and the Managing Owner. Except as expressly required by the Federal securities laws, the Fund undertakes no obligation to publicly update or revise any forward-looking statements or the risks, uncertainties or other factors described in this Report, as a result of new information, future events or changed circumstances or for any other reason after the date of this Report.
Overview/Introduction
Invesco Capital Management LLC (“Invesco”) has served as the managing owner (the “Managing Owner”), commodity pool operator and commodity trading advisor of the Trust and the Fund since February 23, 2015. The Managing Owner is registered with the Commodity Futures Trading Commission (the “CFTC”) as a commodity pool operator and a commodity trading advisor, and it is a member firm of the National Futures Association (“NFA”).
The Fund seeks to track changes, whether positive or negative, in the level of the DBIQ Optimum Yield Gold Index Excess Return™ (the “Index”) over time, plus the excess, if any, of the sum of the Fund’s interest income from its holdings of United States Treasury Obligations (“Treasury Income”), dividends from its holdings in money market mutual funds (affiliated or otherwise) (“Money Market Income”) and dividends or distributions of capital gains from its holdings ofT-Bill ETFs (as defined below)(“T-Bill ETF Income”) over the expenses of the Fund. The Fund invests in futures contracts in an attempt to track its Index. The Index is intended to reflect the change in market value of the gold sector. The single commodity comprising the Index is gold (the “Index Commodity”).
The Fund may invest directly in United States Treasury Obligations. The Fund may also gain exposure to United States Treasury Obligations through investments in exchange-traded funds (“ETFs”) (affiliated or otherwise) that track indexes that measure the performance of United States Treasury Obligations with a maximum remaining maturity of up to 12 months(“T-Bill ETFs”). The Fund invests in United States Treasury Obligations, money market mutual funds andT-Bill ETFs (affiliated or otherwise), if any, for margin and/or cash management purposes.
The Fund pursues its investment objective by investing in a portfolio of exchange-traded commodity futures contracts that expire in a specific month and trade on a specific exchange (the “Index Contracts”). The Fund also holds United States Treasury Obligations andT-Bill ETFs, if any, for deposit with Morgan Stanley & Co. LLC, the Fund’s commodity broker (the “Commodity Broker”) as margin, to the extent permissible under CFTC rules and United States Treasury Obligations, cash, money market mutual funds andT-Bill ETFs (affiliated or otherwise), if any, on deposit with The Bank of New York Mellon (the “Custodian”), for cash management purposes. The aggregate notional value of the commodity futures contracts owned by the Fund is expected to approximate the aggregate net asset value (“NAV”) of the Fund, as opposed to the aggregate Index value.
The CFTC and certain futures exchanges impose position limits on Index Contracts. The Managing Owner may determine to invest in other futures contracts if at any time it is impractical or inefficient to gain full or partial exposure to the Index Commodity through the use of Index Contracts. These other futures contracts may or may not be based on the Index Commodity. When they are not, the Managing Owner may seek to select futures contracts that it reasonably believes tend to exhibit trading prices that correlate with an Index Contract.
The Shares are intended to provide investment results that generally correspond to the changes, positive or negative, in the levels of the Index over time. The value of the Shares is expected to fluctuate in relation to changes in the value of the Fund’s portfolio. The market price of the Shares may not be identical to the NAV per Share, but these two valuations are expected to be very close.
Margin Calls
“Initial” or “original” margin is the minimum amount of funds that must be deposited by a futures trader with his commodity broker in order to initiate futures trading or to maintain an open position in futures contracts. “Maintenance” margin is the amount (generally less than initial margin) to which a trader’s account may decline before he must deliver additional margin. A margin deposit is like a cash performance bond. It helps assure the futures trader’s performance of the futures contract that the trader purchases or sells. Futures contracts are customarily bought and sold on margin that represents a very small percentage (ranging upward from less than 2%) of the purchase price of the underlying commodity being traded. Because of such low margins, price fluctuations occurring in the futures markets may create profits and losses that are greater, in relation to the amount invested, than are customary in other forms of investments. The minimum amount of margin required in connection with a particular futures contract is set from time to time by the exchange on which such contract is traded, and may be modified from time to time by the exchange during the term of the contract. “Variation margin” is assessed daily to reflect changes in the value of the position.
19
Brokerage firms carrying accounts for traders in futures contracts may not accept lower, and generally require higher, amounts of margin as a matter of policy in order to afford further protection for themselves.
Margin requirements are computed each day by a commodity broker. When the market value of a particular open futures contract position changes to a point where the margin on deposit does not satisfy maintenance margin requirements, a margin call is made by the commodity broker. If the margin call is not met within a reasonable time, the broker may close out the Fund’s position. With respect to the Managing Owner’s trading, only the Managing Owner, and not the Fund or its Shareholders personally, will be subject to margin calls.
Position Limits and/or Accountability Levels
The Fund has not reached position limits with respect to the 2018, 2017 and 2016 reporting periods.
Net Asset Value
NAV means the total assets of the Fund, including, but not limited to, all commodity futures contracts, cash and investments less total liabilities of the Fund, each determined on the basis of U.S. generally accepted accounting principles (“U.S. GAAP”), consistently applied under the accrual method of accounting. All open commodity futures contracts will be calculated at their then current market value, which will be based upon the settlement price for that particular commodity futures contract traded on the applicable primary exchange on the date with respect to which NAV is being determined. Securities for which market quotations are not readily available or became unreliable are valued at fair value as determined in good faith following procedures approved by the Managing Owner. The amount of any distribution is a liability of the Fund from the day when the distribution is declared until it is paid.
NAV per Share is the NAV of the Fund divided by the number of outstanding Shares.
Market Risk
Trading in futures contracts involves the Fund entering into contractual commitments to purchase a particular commodity at a specified date and price. The market risk associated with the Fund’s commitments to purchase commodities is limited to the gross or face amount of the contracts held.
The Fund’s exposure to market risk is also influenced by a number of factors including the volatility of interest rates and foreign currency exchange rates, the liquidity of the markets in which the contracts are traded and the relationships among the contracts held. The inherent uncertainty of the Fund’s trading as well as the development of drastic market occurrences could ultimately lead to a loss of all or substantially all of the investors’ capital.
Credit Risk
When the Fund enters into futures contracts, the Fund is exposed to credit risk that the counterparty to the contract will not meet its obligations. The counterparty for futures contracts traded on United States and on most foreign futures exchanges is the clearing house associated with the particular exchange. In general, clearing houses are backed by their corporate members who may be required to share in the financial burden resulting from the nonperformance by one of their members and, as such, is designed to disperse and mitigate the credit risk posed by any one member. In cases where the clearing house is not backed by the clearing members (i.e., some foreign exchanges), it may be backed by a consortium of banks or other financial institutions. There can be no assurance that any counterparty, clearing member or clearinghouse will meet its obligations to the Fund.
The Commodity Broker, when acting as the Fund’s futures commission merchant in accepting orders for the purchase or sale of domestic futures contracts, is required by CFTC regulations to separately account for and segregate as belonging to the Fund all assets of the Fund relating to domestic futures trading. The Commodity Broker is not allowed to commingle such assets with other assets of the Commodity Broker. In addition, CFTC regulations also require the Commodity Broker to hold in a secure account assets of the Fund related to foreign futures trading. While these legal requirements are designed to protect the customers of futures commission merchants, a failure by the Commodity Broker to comply with those requirements would be likely to have a material adverse effect on the Fund in the event that the Commodity Broker became insolvent or suffered other financial distress.
Liquidity
The Fund’s entire source of capital is derived from the Fund’s offering of Shares to Authorized Participants. The Fund in turn allocates its net assets to commodities trading. A significant portion of the NAV is held in United States Treasury Obligations, which may be used as margin for the Fund’s trading in commodity futures contracts and United States Treasury Obligations, money market mutual funds, cash andT-Bill ETFs, if any, which may be used for cash management purposes. The percentage that United States Treasury Obligations bear to the total net assets will vary from period to period as the market values of the Fund’s commodity interests change. A portion of the Fund’s United States Treasury Obligations is held for deposit with the Commodity Broker to meet margin
20
requirements. All remaining cash, money market mutual funds,T-Bill ETFs, if any, and United States Treasury Obligations are on deposit with the Custodian. Interest earned on the Fund’s interest-bearing funds and dividends from the Fund’s holdings of money market mutual funds are paid to the Fund. Any dividends or distributions of capital gains received from the Fund’s holdings ofT-Bill ETFs, if any, are paid to the Fund.
The Fund’s commodity futures contracts may be subject to periods of illiquidity because of market conditions, regulatory considerations or for other reasons. For example, U.S. futures exchanges and some foreign exchanges have regulations that limit the amount of fluctuation in futures contract prices that may occur during a single business day. These limits are generally referred to as “daily price fluctuation limits” or “daily limits,” and the maximum or minimum price of a contract on any given day as a result of these limits is referred to as a “limit price.” Once a limit price has been reached in a particular contract, it is usually the case that no trades may be made at a different price than specified in the limit. The duration of limit prices generally varies. Limit prices may have the effect of precluding the Fund from trading in a particular contract or requiring the Fund to liquidate contracts at disadvantageous times or prices. Either of those outcomes could adversely affect the Fund’s ability to pursue its investment objective or achieve favorable performance.
Because the Fund trades futures contracts, its capital is at risk due to changes in the value of futures contracts (market risk) or the inability of counterparties (including the Commodity Broker and/or exchange clearinghouses) to perform under the terms of the contracts (credit risk).
On any business day, an Authorized Participant may place an order with the Transfer Agent to redeem one or more blocks of 200,000 Shares (“Baskets”). Redemption orders must be placed by 10:00 a.m., Eastern Time. The day on which the Managing Owner receives a valid redemption order is the redemption order date. The day on which a redemption order is settled is the redemption order settlement date. As provided below, the redemption order settlement date may occur up to two business days after the redemption order date. Redemption orders are irrevocable. The redemption procedures allow Authorized Participants to redeem Baskets. Individual Shareholders may not redeem directly from the Fund. Instead, individual Shareholders may only redeem Shares in integral multiples of 200,000 and only through an Authorized Participant.
Unless otherwise agreed to by the Managing Owner and the Authorized Participant as provided in the next sentence, by placing a redemption order, an Authorized Participant agrees to deliver the Baskets to be redeemed through DTC’s book-entry system to the Fund no later than the redemption order settlement date as of 2:45 p.m., Eastern Time, on the business day immediately following the redemption order date. Upon submission of a redemption order, the Authorized Participant may request the Managing Owner to agree to a redemption order settlement date up to two business days after the redemption order date. By placing a redemption order, and prior to receipt of the redemption proceeds, an Authorized Participant’s DTC account is charged thenon-refundable transaction fee due for the redemption order.
Redemption orders may be placed either (i) through the Continuous Net Settlement (“CNS”) clearing processes of the National Securities Clearing Corporation (the “NSCC”) (the “CNS Clearing Process”) or (ii) if outside the CNS Clearing Process, only through the facilities of The Depository Trust Company (“DTC” or the “Depository”) (the “DTC Process”), or a successor depository, and only in exchange for cash. By placing a redemption order, and prior to receipt of the redemption proceeds, an Authorized Participant’s DTC account is charged thenon-refundable transaction fee due for the redemption order and such fee is not borne by the Fund.
Capital Resources
The Fund does not have any material commitments for capital expenditures as of the end of the latest fiscal period.
The Fund is unaware of any (i) anticipated known demands, commitments or capital expenditures; (ii) material trends, favorable or unfavorable, in its capital resources; or (iii) trends or uncertainties that will have a material effect on its operations.
Cash Flows
A primary cash flow activity of the Fund is to raise capital from Authorized Participants through the issuance of Shares. This cash is used to invest in United States Treasury Obligations, money market mutual funds andT-Bill ETFs, if any, and to meet margin requirements as a result of the positions taken in futures contracts to match the fluctuations of the Index.
As of the date of this Report, each of Bank of America Merrill Lynch, BMO Capital Markets Corp., BNP Paribas Securities Corp, Cantor Fitzgerald & Co., Citadel Securities LLC, Citigroup Global Markets, Credit Suisse Securities (USA) LLC, Deutsche Investment Management Americas Inc., Goldman Sachs & Co., Goldman Sachs Execution & Clearing LP, Interactive Brokers LLC, Jefferies LLC, JP Morgan Securities Inc., Knight Clearing Services LLC, Merrill Lynch Professional Clearing Corp, Morgan Stanley & Co. LLC, Nomura Securities International Inc., RBC Capital Markets LLC, SG Americas Securities LLC, Timber Hill LLC, UBS Securities, Virtu Financial BD LLC and Virtu Financial Capital Markets LLC has executed a Participant Agreement and are the only Authorized Participants.
21
Operating Activities
Net cash flow provided by (used for) operating activities was $35.2 million, $62.5 million and $(56.2) million for the years ended December 31, 2018, 2017 and 2016, respectively. These amounts primarily include net income (loss), net purchases and sales of money market mutual funds and net purchases and sales of United States Treasury Obligations which are held at fair value on the Statements of Financial Condition. The Fund invests in futures contracts in an attempt to track its Index. The Fund may hold United States Treasury Obligations and money market mutual funds for margin and/or cash management purposes.
During the year ended December 31, 2018, $334 million was paid to purchase United States Treasury Obligations and $374.6 million was received from sales and maturing United States Treasury Obligations. During the year ended December 31, 2017, $511.4 million was paid to purchase United States Treasury Obligations and $566.7 million was received from sales and maturing United States Treasury Obligations. During the year ended December 31, 2016, $882.7 million was paid to purchase United States Treasury Obligations and $836.0 million was received from sales and maturing United States Treasury Obligations. $119.7 million was received from sales of affiliated investments and $114.4 million was paid to purchase affiliated investments during the year ended December 31, 2018. $157.3 million was received from sales of affiliated investments and $159.8 million was paid to purchase affiliated investments during the year ended December 31, 2017. $150.3 million was received from sales of affiliated investments and $160.4 million was paid to purchase affiliated investments during the year ended December 31, 2016.
Financing Activities
The Fund’s net cash flow provided by (used for) financing activities was $(35.7) million, $(64.9) million and $53.7 million million during the years ended December 31, 2018, 2017 and 2016, respectively. This included $74.9 million, $148.0 million and $174.0 million from the sale of Shares to Authorized Participants and $110.5 million, $212.7 million and $120.4 million from the redemption of Shares to Authorized Participants during the years ended December 31, 2018, 2017 and 2016, respectively. Payable for amount due to custodian increased (decreased) by $1.2 million during the year ended December 31, 2018. There were no payable for amount due to custodian during the years ended December 31, 2017 and 2016. During the years ended December 31, 2018 and 2017, distributions paid to shareholders were $1.3 million and $0.1 million, respectively. There were no distributions paid to shareholders during the year ended December 31, 2016.
Results of Operations
FOR THE YEARS ENDED DECEMBER 31, 2018, 2017 AND 2016
The following graphs illustrate the percentage changes in (i) the market price of the Shares (as reflected by the line “Market”), (ii) the Fund’s NAV (as reflected by the line “NAV”), and (iii) the closing levels of the Index (as reflected by the line “DBIQ Opt Yield Gold Index ER”). Whenever the Treasury Income, Money Market Income andT-Bill ETF Income, if any, earned by the Fund exceeds Fund expenses, the price of the Shares generally exceeds the level of the Index primarily because the Share price reflects Treasury Income, Money Market Income andT-Bill ETF Income, if any, from the Fund’s collateral holdings whereas the Index does not consider such income. There can be no assurances that the price of the Shares or the Fund’s NAV will exceed the Index levels.
No representation is being made that the Index will or is likely to achieve closing levels consistent with or similar to those set forth herein. Similarly, no representation is being made that the Fund will generate profits or losses similar to the Fund’s past performance or changes in the Index closing levels.
22
COMPARISON OF MARKET, NAV AND DBIQ OPT YIELD GOLD INDEX ER
FOR THE YEARS ENDED DECEMBER 31, 2018, 2017 AND 2016
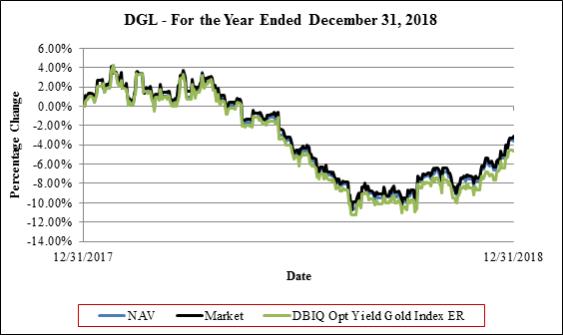
NEITHER THE PAST PERFORMANCE OF THE FUND NOR THE PRIOR INDEX LEVELS AND CHANGES,
POSITIVE OR NEGATIVE, SHOULD BE TAKEN AS AN INDICATION OF THE FUND’S FUTURE PERFORMANCE.
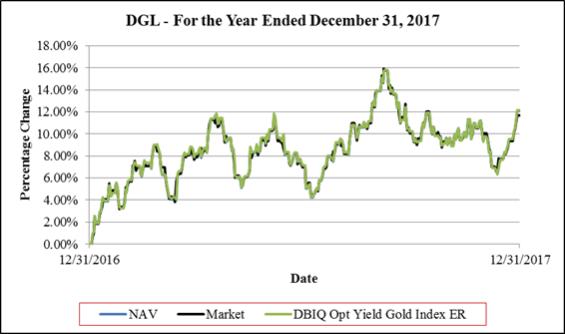
NEITHER THE PAST PERFORMANCE OF THE FUND NOR THE PRIOR INDEX LEVELS AND CHANGES,
POSITIVE OR NEGATIVE, SHOULD BE TAKEN AS AN INDICATION OF THE FUND’S FUTURE PERFORMANCE.
23
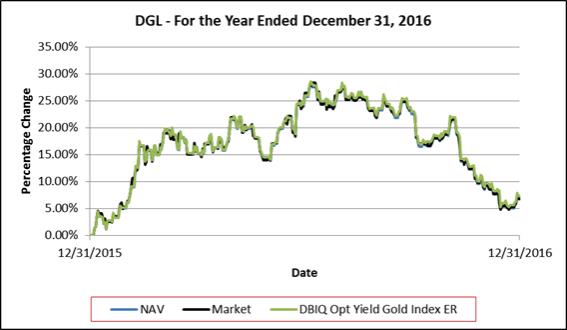
NEITHER THE PAST PERFORMANCE OF THE FUND NOR THE PRIOR INDEX LEVELS AND CHANGES,
POSITIVE OR NEGATIVE, SHOULD BE TAKEN AS AN INDICATION OF THE FUND’S FUTURE PERFORMANCE.
Performance Summary
This Report covers the years ended December 31, 2018, 2017 and 2016.
Past performance of the Fund is not necessarily indicative of future performance.
The Index is intended to reflect the change in market value of the Index Commodity. In turn, the Index is intended to reflect the gold sector. Past Index results are not necessarily indicative of future changes, positive or negative, in the Index closing levels. The DBIQ Optimum Yield Gold Index Total Return™ (the“DBIQ-OY Gold TR™”) consists of the Index plus3-month United States Treasury Obligations returns. Past results of theDBIQ-OY Gold TR™ are not necessarily indicative of future changes, positive or negative, in the closing levels of theDBIQ-OY Gold TR™.
The section “Summary of theDBIQ-OY Gold TR™ and Underlying Index Commodity Returns for the Years Ended December 31, 2018, 2017 and 2016” below provides an overview of the changes in the closing levels ofDBIQ-OY Gold TR™ by disclosing the change in market value of the underlying component Index Commodity through a “surrogate” (and analogous) index that also reflects3-month United States Treasury Obligations returns. Please note also that the Fund’s objective is to track the Index (not theDBIQ-OY Gold TR™) and the Fund does not attempt to outperform or underperform the Index. The Index employs the optimum yield roll method with the objective of mitigating the negative effects of contango, the condition in which distant delivery prices for futures exceed spot prices, and maximizing the positive effects of backwardation, a condition opposite of contango.
Summary of theDBIQ-OY Gold TR™ and Underlying Index Commodity Returns for the Years Ended December 31, 2018, 2017 and 2016
| AGGREGATE RETURNS | ||||||||||||
| Years Ended December 31, | ||||||||||||
Underlying Index | 2018 | 2017 | 2016 | |||||||||
DB Gold Indices | (2.76 | )% | 13.17 | % | 7.62 | % | ||||||
|
|
|
|
|
| |||||||
If the Fund’s Treasury Income, Money Market Income andT-Bill ETF Income were to exceed the Fund’s fees and expenses, the aggregate return on an investment in the Fund would be expected to outperform the Index and underperform theDBIQ-OY Gold TR™. The only difference between (i) the Index (the “Excess Return Index”) and (ii) theDBIQ-OY Gold TR™ (the “Total Return Index”) is that the Excess Return Index does not include interest income from fixed income securities while the Total Return Index does include such a component. Thus, the difference between the Excess Return Index and the Total Return Index is attributable entirely to the interest income attributable to the fixed income securities reflected in the Total Return Index. The Total Return Index does not actually hold any fixed income securities. If the Fund’s Treasury Income, Money Market Income andT-Bill ETF Income, if any, exceeds the Fund’s fees and expenses, then the amount of such excess is expected to be distributed periodically. The market price of the Shares is expected to closely track the Excess Return Index. The aggregate return on an investment in the Fund over any period is the sum of the capital appreciation or depreciation of the Shares over the period, plus the amount of any distributions during the
24
period. Consequently, the Fund’s aggregate return is expected to outperform the Excess Return Index by the amount of the excess, if any, of the Fund’s Treasury Income, Money Market Income andT-Bill ETF Income over its fees and expenses. As a result of the Fund’s fees and expenses, however, the aggregate return on the Fund is expected to underperform the Total Return Index. If the Fund’s fees and expenses were to exceed the Fund’s Treasury Income, Money Market Income andT-Bill ETF Income, if any, the aggregate return on an investment in the Fund is expected to underperform the Excess Return Index.
FOR THE YEARS ENDED DECEMBER 31, 2018, 2017 AND 2016
Fund Share Price Performance
For the year ended December 31, 2018, the NYSE Arca market value of each Share decreased 3.06% from $41.37 per Share to $39.52 per Share. The Share price low and high for the year ended December 31, 2018 and related change from the Share price from December 31, 2017 was as follows: Shares traded at a low of $36.93 per Share(-10.73%) on August 16, 2018, and a high of $43.09 per Share (+4.17%) on January 24, 2018. On December 31, 2018, the Fund paid a distribution of $0.57908 for each General Share and Share to holders of record as of December 26, 2018. Therefore, the total return for the Fund, on a market value basis, was-3.06%.
For the year ended December 31, 2017, the NYSE Arca market value of each Share increased 11.78% from $37.05 per Share to $41.37 per Share. The Share price low and high for the year ended December 31, 2017 and related change from the Share price from December 31, 2016 was as follows: Shares traded at a low of $37.29 per Share (+0.66%) on January 3, 2017, and a high of $42.95 per Share (+15.94%) on September 7, 2017. On December 29, 2017, the Fund paid a distribution of $0.04202 for each General Share and Share to holders of record as of December 19, 2017. Therefore, the total return for the Fund, on a market value basis, was +11.78%.
For the year ended December 31, 2016, the NYSE Arca market value of each Share increased 6.86% from $34.67 per Share to $37.05 per Share. The Share price low and high for the year ended December 31, 2016 and related change from the Share price from December 31, 2015 was as follows: Shares traded at a low of $35.15 per Share (+1.38%) on January 4, 2016, and a high of $44.53 per Share (+28.43%) on July 8, 2016. No distributions were paid to Shareholders during the year ended December 31, 2016. Therefore, the total return for the Fund, on a market value basis, was +6.86%.
Fund Share Net Asset Performance
For the year ended December 31, 2018, the NAV of each Share decreased 3.63% from $41.51 per Share to $39.42 per Share. Falling prices in the price of gold futures contracts during the year ended December 31, 2018 contributed to an overall 4.65% decrease in the level of the Index and a 2.76% decrease in the level of theDBIQ-OY Gold TR™. On December 31, 2018, the Fund paid a distribution of $0.57908 for each General Share and Share to holders of record as of December 26, 2018. Therefore, the total return for the Fund on a NAV basis was-3.63%.
Net income (loss) for the year ended December 31, 2018 was $(9.6) million, primarily resulting from $2.6 million of income, net realized gain (loss) of $(7.9) million, net change in unrealized gain (loss) of $(3.2) million and operating expenses of $1.1 million.
For the year ended December 31, 2017, the NAV of each Share increased 12.18% from $37.04 per Share to $41.51 per Share. Rising prices in the price of gold futures contracts during the year ended December 31, 2017 contributed to an overall 12.12% increase in the level of the Index and a 13.17% increase in the level of theDBIQ-OY Gold TR™. On December 29, 2017, the Fund paid a distribution of $0.04202 for each General Share and Share to holders of record as of December 19, 2017. Therefore, the total return for the Fund on a NAV basis was +12.18%.
Net income (loss) for the year ended December 31, 2017 was $13.4 million, primarily resulting from $1.3 million of income, net realized gain (loss) of $(25.0) million, net change in unrealized gain (loss) of $38.3 million and operating expenses of $1.2 million.
For the year ended December 31, 2016, the NAV of each Share increased 6.78% from $34.69 per Share to $37.04 per Share. Rising prices in the price of gold futures contracts during the year ended December 31, 2016 contributed to an overall 7.62% increase in the level of theDBIQ-OY Gold TR™. No distributions were paid to Shareholders during the year ended December 31, 2016. Therefore, the total return for the Fund on a NAV basis was 6.78%.
Net income (loss) for the year ended December 31, 2016 was $0.2 million, primarily resulting from $0.7 million of income, net realized gain (loss) of $28.3 million, net change in unrealized gain (loss) of $(27.1) million and operating expenses of $1.7 million.
Critical Accounting Policies
The Fund’s critical accounting policies are as follows:
Preparation of the financial statements and related disclosures in conformity with U.S. GAAP requires the application of appropriate accounting rules and guidance, as well as the use of estimates, and requires management to make estimates and assumptions that affect the reported amounts of assets and liabilities, revenue and expense and related disclosure of contingent assets and liabilities during the reporting period of the financial statements and accompanying notes. The Fund’s application of these policies involves judgments and actual results may differ from the estimates used. There were no significant estimates used in the preparation of these financial statements.
25
Commodity futures contracts, United States Treasury Obligations,T-Bill ETFs and money market mutual funds are recorded on a trade date basis and at fair value in the financial statements, with changes in fair value, if any, reported in the Statements of Income and Expenses.
The use of fair value to measure financial instruments, with related unrealized gains or losses recognized in earnings in each period is fundamental to the Fund’s financial statements. The fair value of a financial instrument is the amount that would be received to sell an asset or paid to transfer a liability in an orderly transaction between market participants at the measurement date (the exit price).
United States Treasury Obligations are fair valued using an evaluated quote provided by an independent pricing service. Futures contracts are valued at the final settlement price set by an exchange on which they are principally traded. Investments inopen-end andclosed-end registered investment companies that do not trade on an exchange are valued at the end of day NAV per share. Investments inopen-end andclosed-end registered investment companies that trade on an exchange are valued at the last sales price or official closing price as of the close of the customary trading session on the exchange where the security is principally traded. Financial Accounting Standards Board (“FASB”) Accounting Standards Codification for fair value measurement and disclosure guidance requires a fair value hierarchy that prioritizes the inputs to valuation techniques used to measure fair value. The objective of a fair value measurement is to determine the price that would be received to sell an asset or paid to transfer a liability in an orderly transaction between market participants at the measurement date (an exit price). The hierarchy gives the highest priority to unadjusted quoted prices for identical assets or liabilities (Level 1 measurements) and the lowest priority to unobservable inputs (Level 3 measurements). Assets and liabilities are classified in their entirety based on the lowest level of input that is significant to the fair value measurement. See Note 6 within the financial statements in Item 8 for further information.
Securities for which market quotations are not readily available or became unreliable are valued at fair value as determined in good faith following procedures approved by the Managing Owner. Issuer-specific events, market trends, bid/asked quotes of brokers and information providers and other data may be reviewed in the course of making a good faith determination of a security’s fair value.
Realized gains (losses) from the sale or disposition of securities or derivatives are determined on a specific identification basis and recognized in the Statements of Income and Expenses in the period in which the contract is closed or the sale or disposition occurs, respectively.
Interest income on United States Treasury Obligations is recognized on an accrual basis when earned. Premiums and discounts are amortized or accreted over the life of the United States Treasury Obligations. Dividend income (net of withholding tax, if any) is recorded on theex-dividend date.
Off-Balance Sheet Arrangements and Contractual Obligations
In the normal course of its business, the Fund is a party to financial instruments withoff-balance sheet risk. The term“off-balance sheet risk” refers to an unrecorded potential liability that, even though it does not appear on the balance sheet, may result in a future obligation or loss. The financial instruments used by the Fund are commodity futures, the values of which are based upon an underlying asset and generally represent future commitments which have a reasonable possibility to be settled in cash or through physical delivery. The financial instruments are traded on an exchange and are standardized contracts.
The Fund has not utilized, nor does it expect to utilize in the future, special purpose entities to facilitateoff-balance sheet financing arrangements and has no loan guarantee arrangements oroff-balance sheet arrangements of any kind, other than agreements entered into in the normal course of business noted above, which may include indemnification provisions related to certain risks service providers undertake in providing services to the Fund. While the Fund’s exposure under such indemnification provisions cannot be estimated, these general business indemnifications are not expected to have a material impact on the Fund’s financial position. The Managing Owner expects the risk of loss relating to indemnification to be remote.
The Fund has financial obligations to the Managing Owner and the Commodity Broker under the Trust Agreement and its agreement with the Commodity Broker (the “Commodity Broker Agreement”), respectively. Management Fee payments made to the Managing Owner, pursuant to the Trust Agreement, are calculated as a fixed percentage of the Fund’s NAV. Commission payments to the Commodity Broker, pursuant to the Commodity Broker Agreement, are on acontract-by-contract, or round-turn, basis. As such, the Managing Owner cannot anticipate the amount of payments that will be required under these arrangements for future periods as NAVs and trading activity will not be known until a future date. The Fund’s agreement with the Commodity Broker may be terminated by either party for various reasons. All Management Fees and commission payments are paid to the Managing Owner and the Commodity Broker, respectively.
| ITEM 7A. | QUANTITATIVE AND QUALITATIVE DISCLOSURES ABOUT MARKET RISK |
INTRODUCTION
The Fund is designed to track the performance of the Index. The market sensitive instruments held by it are subject to the risk of trading loss. Unlike an operating company, the risk of market sensitive instruments is integral, not incidental, to the Fund’s main line of business.
26
Market movements can produce frequent changes in the fair market value of the Fund’s open positions and, consequently, in its earnings and cash flow. The Fund’s market risk is primarily influenced by changes in the prices of commodities.
Standard of Materiality
Materiality as used in this section, “Quantitative and Qualitative Disclosures About Market Risk,” is based on an assessment of reasonably possible market movements and the potential losses caused by such movements, taking into account the effects of margin and any other multiplier features, as applicable, of the Fund’s market sensitive instruments.
QUANTIFYING THE FUND’S TRADING VALUE AT RISK
Quantitative Forward-Looking Statements
The following quantitative disclosures regarding the Fund’s market risk exposures contain “forward-looking statements” within the meaning of the safe harbor from civil liability provided for such statements by the Private Securities Litigation Reform Act of 1995 (set forth in Section 27A of the Securities Act and Section 21E of the Exchange Act). All quantitative disclosures in this section are deemed to be forward-looking statements for purposes of the safe harbor, except for statements of historical fact (such as the dollar amount of maintenance margin required for market risk sensitive instruments held at the end of the reporting period).
Value at Risk (“VaR”) is a statistical measure of the value of losses that would not be expected to be exceeded over a given time horizon and at a given probability level arising from movement of underlying risk factors. Loss is measured as a decline in the fair value of the portfolio as a result of changes in any of the material variables by which fair values are determined. VaR is measured over a specified holding period (one day) and to a specified level of statistical confidence (99th percentile). However, the inherent uncertainty in the markets in which the Fund trades and the recurrence in the markets traded by the Fund of market movements far exceeding expectations could result in actual trading ornon-trading losses far beyond the indicated VaR or the Fund’s experience to date (i.e., “risk of ruin”). In light of these considerations, as well as the risks and uncertainties intrinsic to all future projections, the following VaR presentation does not constitute any assurance or representation that the Fund’s losses in any market sector will be limited to VaR..
THE FUND’S TRADING VALUE AT RISK
The Fund calculates VaR using the actual historical market movements of the Fund’s net assets.
The following table indicates the trading VaR associated with the Fund’s net assets as of December 31, 2018.
| For the Year Ended | ||||||||||||||||
| December 31, 2018 | ||||||||||||||||
Description | Net Assets | Daily Volatility | VaR* (99 Percentile) | Number of times VaR Exceeded | ||||||||||||
Invesco DB Gold Fund | $ | 94,613,599 | 0.54 | % | $ | 1,201,166 | 21 | |||||||||
The following table indicates the trading VaR associated with the Fund’s net assets as of December 31, 2017.
| For the Year Ended | ||||||||||||||||
| December 31, 2017 | ||||||||||||||||
Description | Net Assets | Daily Volatility | VaR* (99 Percentile) | Number of times VaR Exceeded | ||||||||||||
Invesco DB Gold Fund | $ | 141,151,352 | 0.54 | % | $ | 1,776,028 | 11 | |||||||||
| * | The VaR represents the one day downside risk, under normal market conditions, with a 99% confidence level. It is calculated using historical market moves of the Fund’s net assets and uses a one year look-back. |
THE FUND’SNON-TRADING MARKET RISK
The Fund hasnon-trading market risk as a result of investing in short-term United States Treasury Obligations,T-Bill ETFs and money market mutual funds. The market risk represented by these investments is not expected to be material. Although the Fund purchases and sells shares ofT-Bill ETFs on an exchange, it does not establish or liquidate those positions for trading purposes.
QUALITATIVE DISCLOSURES REGARDING PRIMARY TRADING MARKET RISK EXPOSURES
The following qualitative disclosures regarding the Fund’s market risk exposures—except for those disclosures that are statements of historical fact—constitute forward-looking statements within the meaning of Section 27A of the Securities Act and Section 21E of the Exchange Act. The Fund’s primary market risk exposures are subject to numerous uncertainties, contingencies and risks. Government interventions, defaults and expropriations, illiquid markets, the emergence of dominant fundamental factors, political upheavals, changes in historical price relationships, an influx of new market participants, increased regulation and many other factors could result in material losses as well as in material changes to the risk exposures of the Fund. The Fund’s current market exposure may change materially. Investors may lose all or substantially all of their investment in the Fund.
27
The following were the primary trading risk exposures of the Fund as of December 31, 2018:
Gold
The price of gold is volatile and is affected by numerous factors. Gold prices float freely in accordance with supply and demand. The price movement of gold may be influenced by a variety of factors, including announcements from central banks regarding reserve gold holdings, agreements among central banks, purchases and sales of gold by central banks, other governmental agencies that hold large supplies of gold, political uncertainties, economic concerns such as an increase or decrease in confidence in the global monetary system, the relative strength of the U.S. dollar, interest rates and numerous other factors. Gold prices may also be affected by industry factors such as industrial and jewelry demand.
QUALITATIVE DISCLOSURES REGARDINGNON-TRADING MARKET RISK EXPOSURE
As noted above, the Fund hasnon-trading market risk as a result of investing in short-term United States Treasury Obligations,T-Bill ETFs and money market mutual funds. The market risk represented by these investments is not expected to be material.
QUALITATIVE DISCLOSURES REGARDING MEANS OF MANAGING RISK EXPOSURE
Under ordinary circumstances, the Managing Owner’s exercise of discretionary power is limited to determining whether the Fund will make a distribution. Under emergency or extraordinary circumstances, the Managing Owner’s use of its discretionary powers may increase. These special circumstances, for example, include the unavailability of the Index or certain natural orman-made disasters. The Managing Owner does not actively manage the Fund to avoid losses. The Fund only takes long positions in investments and does not employ “stop-loss” techniques.
28
| ITEM 8. | FINANCIAL STATEMENTS AND SUPPLEMENTARY DATA |
Index to Financial Statements
29
Report of Management on Internal Control
Over Financial Reporting
Management of Invesco Capital Management LLC, as managing owner (the “Managing Owner”) of Invesco DB Gold Fund (the “Fund”), is responsible for establishing and maintaining adequate internal control over financial reporting, as defined in Rules13a-15(f) and15d-15(f) of the Securities Exchange Act of 1934, as amended (the “Exchange Act”). Internal control over financial reporting is a process designed to provide reasonable assurance regarding the reliability of financial reporting and the preparation of financial statements for external purposes in accordance with generally accepted accounting principles.
Because of its inherent limitations, internal control over financial reporting may not prevent or detect misstatements. Also, projections of any evaluation of effectiveness to future periods are subject to the risk that controls may become inadequate because of changes in conditions, or that the degree of compliance with the policies or procedures may deteriorate.
We, Daniel Draper, Principal Executive Officer, and Kelli Gallegos, Principal Financial and Accounting Officer, Investment Pools, of the Managing Owner, assessed the effectiveness of the Fund’s internal control over financial reporting as of December 31, 2018. In making this assessment, we used the criteria set forth by the Committee of Sponsoring Organizations of the Treadway Commission (“COSO”) inInternal Control—Integrated Framework (2013). Based on our assessment and those criteria, we have concluded that the Fund maintained effective internal control over financial reporting as of December 31, 2018.
The Fund’s independent registered public accounting firm, PricewaterhouseCoopers LLP, has audited the Fund’s internal control over financial reporting as of December 31, 2018, as stated in their report on page 31 of the Fund’s Annual Report on Form10-K.
| By: | /s/ DANIEL DRAPER | |
| Name: | Daniel Draper | |
| Title: | Principal Executive Officer of the Managing Owner | |
| By: | /s/ KELLI GALLEGOS | |
| Name: | Kelli Gallegos | |
| Title: | Principal Financial and Accounting Officer, Investment Pools, of the Managing Owner | |
February 27, 2019
30
Report of Independent Registered Public Accounting Firm
To the Board of Managers of Invesco DB Multi-Sector Commodity Trust and Shareholders of Invesco DB Gold Fund
Opinions on the Financial Statements and Internal Control over Financial Reporting
We have audited the accompanying statements of financial condition, including the schedules of investments of Invesco DB Gold Fund (one of the funds constituting Invesco DB Multi-Sector Commodity Trust, hereafter referred to as the “Fund”) as of December 31, 2018 and December 31, 2017,and the related statements of income and expenses, of changes in shareholders’ equity and of cash flows for each of the three years in the period ended December 31, 2018, including the related notes (collectively referred to as the “financial statements”).We also have audited the Fund’s internal control over financial reporting as of December 31, 2018, based on criteria established inInternal Control—Integrated Framework (2013) issued by the Committee of Sponsoring Organizations of the Treadway Commission (COSO).
In our opinion, thefinancial statements referred to above present fairly, in all material respects, the financial position of the Fund as of December 31, 2018 and December 31, 2017, and the results of its operations and its cash flows for each of the three years in the period ended December 31, 2018in conformity with accounting principles generally accepted in the United States of America. Also in our opinion, the Fund maintained, in all material respects, effective internal control over financial reporting as of December 31, 2018, based on criteria established inInternal Control—Integrated Framework (2013) issued by the COSO.
Basis for Opinions
The Fund’s management is responsible for these financial statements, for maintaining effective internal control over financial reporting, and for its assessment of the effectiveness of internal control over financial reporting, included in the accompanying Report of Management on Internal Control Over Financial Reporting. Our responsibility is to express opinions on the Fund’sfinancial statements and on the Fund’s internal control over financial reporting based on our audits. We are a public accounting firm registered with the Public Company Accounting Oversight Board (United States) (“PCAOB”) and are required to be independent with respect to the Fund in accordance with the U.S. federal securities laws and the applicable rules and regulations of the Securities and Exchange Commission and the PCAOB.
We conducted our audits in accordance with the standards of the PCAOB. Those standards require that we plan and perform the audits to obtain reasonable assurance about whether thefinancial statements are free of material misstatement, whether due to error or fraud, and whether effective internal control over financial reporting was maintained in all material respects.
Our audits of thefinancial statements included performing procedures to assess the risks of material misstatement of thefinancial statements, whether due to error or fraud, and performing procedures that respond to those risks. Such procedures included examining, on a test basis, evidence regarding the amounts and disclosures in thefinancial statements. Our audits also included evaluating the accounting principles used and significant estimates made by management, as well as evaluating the overall presentation of thefinancial statements. Our audit of internal control over financial reporting included obtaining an understanding of internal control over financial reporting, assessing the risk that a material weakness exists, and testing and evaluating the design and operating effectiveness of internal control based on the assessed risk. Our audits also included performing such other procedures as we considered necessary in the circumstances. We believe that our audits provide a reasonable basis for our opinions.
Definition and Limitations of Internal Control over Financial Reporting
A fund’s internal control over financial reporting is a process designed to provide reasonable assurance regarding the reliability of financial reporting and the preparation of financial statements for external purposes in accordance with generally accepted accounting principles. A fund’s internal control over financial reporting includes those policies and procedures that (i) pertain to the maintenance of records that, in reasonable detail, accurately and fairly reflect the transactions and dispositions of the assets of the fund; (ii) provide reasonable assurance that transactions are recorded as necessary to permit preparation of financial statements in accordance with generally accepted accounting principles, and that receipts and expenditures of the fund are being made only in accordance with authorizations of management and directors of the fund; and (iii) provide reasonable assurance regarding prevention or timely detection of unauthorized acquisition, use, or disposition of the fund’s assets that could have a material effect on the financial statements.
31
Because of its inherent limitations, internal control over financial reporting may not prevent or detect misstatements. Also, projections of any evaluation of effectiveness to future periods are subject to the risk that controls may become inadequate because of changes in conditions, or that the degree of compliance with the policies or procedures may deteriorate.
/s/ PricewaterhouseCoopers LLP
Chicago, Illinois
February 27, 2019
We have served as the Fund’s auditor since 2013.
32
Invesco DB Gold Fund
Statements of Financial Condition
December 31, 2018 and 2017
| December 31, | December 31, | |||||||
| 2018 | 2017 | |||||||
Assets | ||||||||
United States Treasury Obligations, at value (cost $88,695,430 and $126,838,949, respectively) | $ | 88,687,386 | $ | 126,820,422 | ||||
Affiliated investments, at value and cost | 7,355,184 | 12,604,725 | ||||||
Other investments: | ||||||||
Variation margin receivable- Commodity Futures Contracts | — | 1,312,410 | ||||||
Cash held by custodian | — | 497,330 | ||||||
Receivable for: | ||||||||
Dividends from affiliates | 12,659 | 7,411 | ||||||
|
|
|
| |||||
Total assets | $ | 96,055,229 | $ | 141,242,298 | ||||
|
|
|
| |||||
Liabilities | ||||||||
Other investments: | ||||||||
Variation margin payable- Commodity Futures Contracts | $ | 125,460 | $ | — | ||||
Payable for: | ||||||||
Due to custodian | 1,249,595 | — | ||||||
Management fees | 61,574 | 85,935 | ||||||
Brokerage commissions and fees | 5,001 | 5,011 | ||||||
|
|
|
| |||||
Total liabilities | 1,441,630 | 90,946 | ||||||
|
|
|
| |||||
Commitments and Contingencies (Note 9) | ||||||||
Equity | ||||||||
Shareholder’s equity—General Shares | 1,577 | 1,660 | ||||||
Shareholders’ equity—Shares | 94,612,022 | 141,149,692 | ||||||
|
|
|
| |||||
Total shareholders’ equity | 94,613,599 | 141,151,352 | ||||||
|
|
|
| |||||
Total liabilities and equity | $ | 96,055,229 | $ | 141,242,298 | ||||
|
|
|
| |||||
General Shares outstanding | 40 | 40 | ||||||
Shares outstanding | 2,400,000 | 3,400,000 | ||||||
Net asset value per share | $ | 39.42 | $ | 41.51 | ||||
Market value per share | $ | 39.52 | $ | 41.37 | ||||
See accompanying Notes to Financial Statements which are an integral part of the financial statements.
33
Invesco DB Gold Fund
December 31, 2018
Description | Percentage of Shareholders’ Equity | Value | Principal Value | |||||||||
United States Treasury Obligations(a) | ||||||||||||
U.S. Treasury Bills, 2.175% due January 3, 2019 | 19.03 | % | $ | 17,998,877 | $ | 18,000,000 | ||||||
U.S. Treasury Bills, 2.370% due February 28, 2019(b) | 61.07 | 57,781,781 | 58,000,000 | |||||||||
U.S. Treasury Bills, 2.465% due April 4, 2019 | 6.30 | 5,962,874 | 6,000,000 | |||||||||
U.S. Treasury Bills, 2.430% due May 2, 2019 | 7.34 | 6,943,854 | 7,000,000 | |||||||||
|
|
|
| |||||||||
Total United States Treasury Obligations (cost $88,695,430) | 93.74 | % | $ | 88,687,386 | ||||||||
|
|
|
| |||||||||
Affiliated Investments | ||||||||||||
Money Market Mutual Fund | Shares | |||||||||||
Invesco Premier U.S. Government Money Portfolio- Institutional Class, 2.30% (cost $7,355,184)(c) | 7.77 | % | $ | 7,355,184 | 7,355,184 | |||||||
|
|
|
| |||||||||
Total Investments in Securities (cost $96,050,614) | 101.51 | % | $ | 96,042,570 | ||||||||
|
|
|
| |||||||||
| (a) | Security may be traded on a discount basis. The interest rate shown represents the discount rate at the most recent auction date of the security prior to period end. |
| (b) | United States Treasury Obligations of $11,157,440 are on deposit with the Commodity Broker and held as maintenance margin for open futures contracts. |
| (c) | The security and the Fund are advised by wholly-owned subsidiaries of Invesco Ltd. and are therefore considered to be affiliated. The rate shown is the7-day SEC standardized yield as of December 31, 2018. |
Open Commodity Futures Contracts | Number of Contracts | Expiration Date | Notional Value | Value(d) | Unrealized Appreciation (Depreciation)(d) | |||||||||||||||
Long Futures Contracts | ||||||||||||||||||||
COMEX Gold | 738 | February-2019 | 94,559,940 | 2,528,218 | $ | 2,528,218 | ||||||||||||||
| (d) | Unrealized Appreciation (Depreciation) and Value are presented above, net by contract. |
See accompanying Notes to Financial Statements which are an integral part of the financial statements.
34
Invesco DB Gold Fund
December 31, 2017
Description | Percentage of Shareholders’ Equity | Value | Principal Value | |||||||||
United States Treasury Obligations(a) | ||||||||||||
U.S. Treasury Bills, 1.180% due January 4, 2018 | 27.63 | % | $ | 38,997,554 | $ | 39,000,000 | ||||||
U.S. Treasury Bills, 1.285% due February 22, 2018 | 7.07 | 9,982,150 | 10,000,000 | |||||||||
U.S. Treasury Bills, 1.285% due March 1, 2018(b) | 55.15 | 77,840,718 | 78,000,000 | |||||||||
|
|
|
| |||||||||
Total United States Treasury Obligations (cost $126,838,949) | 89.85 | % | $ | 126,820,422 | ||||||||
|
|
|
| |||||||||
Affiliated Investments | ||||||||||||
Money Market Mutual Fund | Shares | |||||||||||
Invesco Premier U.S. Government Money Portfolio- Institutional Class, 1.15% (cost $12,604,725)(c) | 8.93 | % | $ | 12,604,725 | 12,604,725 | |||||||
|
|
|
| |||||||||
Total Investments in Securities (cost $139,443,674) | 98.78 | % | $ | 139,425,147 | ||||||||
|
|
|
| |||||||||
| (a) | Security may be traded on a discount basis. The interest rate shown represents the discount rate at the most recent auction date of the security prior to period end. |
| (b) | United States Treasury Obligations of $29,937,000 are on deposit with the Commodity Broker and held as maintenance margin for open futures contracts. |
| (c) | The security and the Fund are advised by wholly-owned subsidiaries of Invesco Ltd. and are therefore considered to be affiliated. The rate shown is the7-day SEC standardized yield as of December 31, 2017. |
Open Commodity Futures Contracts | Number of Contracts | Expiration Date | Notional Value | Value(d) | Unrealized Appreciation (Depreciation)(d) | |||||||||||||||
Long Futures Contracts | ||||||||||||||||||||
COMEX Gold | 1,067 | August-2018 | $ | 141,206,780 | $ | 5,735,253 | $ | 5,735,253 | ||||||||||||
| (d) | Unrealized Appreciation (Depreciation) and Value are presented above, net by contract. |
See accompanying Notes to Financial Statements which are an integral part of the financial statements.
35
Invesco DB Gold Fund
Statements of Income and Expenses
For the Years Ended December 31, 2018, 2017 and 2016
| 2018 | 2017 | 2016 | ||||||||||
Income | ||||||||||||
Interest Income | $ | 2,482,660 | $ | 1,287,879 | $ | 629,285 | ||||||
Dividends from Affiliates | 135,619 | 64,303 | 13,459 | |||||||||
|
|
|
|
|
| |||||||
Total Income | 2,618,279 | 1,352,182 | 642,744 | |||||||||
|
|
|
|
|
| |||||||
Expenses | ||||||||||||
Management Fees | 1,102,728 | 1,195,875 | 1,638,603 | |||||||||
Brokerage Commissions and Fees | 26,104 | 23,034 | 35,962 | |||||||||
Interest Expense | 9,758 | 2,101 | 5,204 | |||||||||
|
|
|
|
|
| |||||||
Total Expenses | 1,138,590 | 1,221,010 | 1,679,769 | |||||||||
|
|
|
|
|
| |||||||
Less: Waivers | (14,741 | ) | (16,325 | ) | (7,482 | ) | ||||||
|
|
|
|
|
| |||||||
Net Expenses | 1,123,849 | 1,204,685 | 1,672,287 | |||||||||
|
|
|
|
|
| |||||||
Net Investment Income (Loss) | 1,494,430 | 147,497 | (1,029,543 | ) | ||||||||
|
|
|
|
|
| |||||||
Net Realized and Net Change in Unrealized Gain (Loss) on United States Treasury Obligations, Affiliated Investments and Commodity Futures Contracts | ||||||||||||
Net Realized Gain (Loss) on | ||||||||||||
United States Treasury Obligations | (16,963 | ) | (4,874 | ) | 2,752 | |||||||
Commodity Futures Contracts | (7,832,954 | ) | (24,968,839 | ) | 28,320,094 | |||||||
|
|
|
|
|
| |||||||
Net Realized Gain (Loss) | (7,849,917 | ) | (24,973,713 | ) | 28,322,846 | |||||||
|
|
|
|
|
| |||||||
Net Change in Unrealized Gain (Loss) on | ||||||||||||
United States Treasury Obligations | 10,483 | (15,664 | ) | (5,203 | ) | |||||||
Commodity Futures Contracts | (3,207,035 | ) | 38,278,529 | (27,126,952 | ) | |||||||
|
|
|
|
|
| |||||||
Net Change in Unrealized Gain (Loss) | (3,196,552 | ) | 38,262,865 | (27,132,155 | ) | |||||||
|
|
|
|
|
| |||||||
Net Realized and Net Change in Unrealized Gain (Loss) on United States Treasury Obligations, Affiliated Investments and Commodity Futures Contracts | (11,046,469 | ) | 13,289,152 | 1,190,691 | ||||||||
|
|
|
|
|
| |||||||
Net Income (Loss) | $ | (9,552,039 | ) | $ | 13,436,649 | $ | 161,148 | |||||
|
|
|
|
|
| |||||||
See accompanying Notes to Financial Statements which are an integral part of the financial statements.
36
Invesco DB Gold Fund
Statement of Changes in Shareholders’ Equity
For the Year Ended December 31, 2018
| General Shares | Shares | Total | ||||||||||||||||||
| Shares | Total Equity | Shares | Total Equity | Shareholders’ Equity | ||||||||||||||||
Balance at December 31, 2017 | 40 | $ | 1,660 | 3,400,000 | $ | 141,149,692 | $ | 141,151,352 | ||||||||||||
|
|
|
|
|
|
|
|
|
| |||||||||||
Purchases of Shares | 1,800,000 | 74,884,102 | 74,884,102 | |||||||||||||||||
Redemption of Shares | (2,800,000 | ) | (110,480,001 | ) | (110,480,001 | ) | ||||||||||||||
|
|
|
|
|
| |||||||||||||||
Net Increase (Decrease) due to Share Transactions | (1,000,000 | ) | (35,595,899 | ) | (35,595,899 | ) | ||||||||||||||
Return of Capital Distributions | (23 | ) | (1,389,792 | ) | (1,389,815 | ) | ||||||||||||||
Net Income (Loss) | ||||||||||||||||||||
Net Investment Income (Loss) | 23 | 1,494,407 | 1,494,430 | |||||||||||||||||
Net Realized Gain (Loss) on United States Treasury Obligations, Affiliated Investments and Commodity Futures Contracts | (68 | ) | (7,849,849 | ) | (7,849,917 | ) | ||||||||||||||
Net Change in Unrealized Gain (Loss) on United States Treasury Obligations, Affiliated Investments and Commodity Futures Contracts | (15 | ) | (3,196,537 | ) | (3,196,552 | ) | ||||||||||||||
|
|
|
|
|
| |||||||||||||||
Net Income (Loss) | (60 | ) | (9,551,979 | ) | (9,552,039 | ) | ||||||||||||||
|
|
|
|
|
|
|
|
|
| |||||||||||
Net Change in Shareholders’ Equity | — | (83 | ) | (1,000,000 | ) | (46,537,670 | ) | (46,537,753 | ) | |||||||||||
|
|
|
|
|
|
|
|
|
| |||||||||||
Balance at December 31, 2018 | 40 | $ | 1,577 | 2,400,000 | $ | 94,612,022 | $ | 94,613,599 | ||||||||||||
|
|
|
|
|
|
|
|
|
| |||||||||||
See accompanying Notes to Financial Statements which are an integral part of the financial statements.
37
Invesco DB Gold Fund
Statement of Changes in Shareholders’ Equity
For the Year Ended December 31, 2017
| General Shares | Shares | Total | ||||||||||||||||||
| Shares | Total Equity | Shares | Total Equity | Shareholders’ Equity | ||||||||||||||||
Balance at December 31, 2016 | 40 | $ | 1,482 | 5,200,000 | $ | 192,601,134 | $ | 192,602,616 | ||||||||||||
|
|
|
|
|
|
|
|
|
| |||||||||||
Purchases of Shares | 3,600,000 | 147,993,274 | 147,993,274 | |||||||||||||||||
|
| |||||||||||||||||||
Redemption of Shares | (5,400,000 | ) | (212,738,317 | ) | (212,738,317 | ) | ||||||||||||||
|
|
|
|
|
| |||||||||||||||
Net Increase (Decrease) due to Share Transactions | (1,800,000 | ) | (64,745,043 | ) | (64,745,043 | ) | ||||||||||||||
Return of Capital Distributions | (2 | ) | (142,868 | ) | (142,870 | ) | ||||||||||||||
Net Income (Loss) | ||||||||||||||||||||
Net Investment Income (Loss) | 2 | 147,495 | 147,497 | |||||||||||||||||
Net Realized Gain (Loss) on United States Treasury Obligations, Affiliated Investments and Commodity Futures Contracts | (331 | ) | (24,973,382 | ) | (24,973,713 | ) | ||||||||||||||
Net Change in Unrealized Gain (Loss) on United States Treasury Obligations, Affiliated Investments and Commodity Futures Contracts | 509 | 38,262,356 | 38,262,865 | |||||||||||||||||
|
|
|
|
|
| |||||||||||||||
Net Income (Loss) | 180 | 13,436,469 | 13,436,649 | |||||||||||||||||
|
|
|
|
|
|
|
|
|
| |||||||||||
Net Change in Shareholders’ Equity | — | 178 | (1,800,000 | ) | (51,451,442 | ) | (51,451,264 | ) | ||||||||||||
|
|
|
|
|
|
|
|
|
| |||||||||||
Balance at December 31, 2017 | 40 | $ | 1,660 | 3,400,000 | $ | 141,149,692 | $ | 141,151,352 | ||||||||||||
|
|
|
|
|
|
|
|
|
| |||||||||||
See accompanying Notes to Financial Statements which are an integral part of the financial statements.
38
Invesco DB Gold Fund
Statement of Changes in Shareholders’ Equity
For the Year Ended December 31, 2016
| General Shares | Shares | Total | ||||||||||||||||||
| Shares | Total Equity | Shares | Total Equity | Shareholders’ Equity | ||||||||||||||||
Balance at January 1, 2016 | 40 | $ | 1,388 | 4,000,000 | $ | 138,762,554 | $ | 138,763,942 | ||||||||||||
|
|
|
|
|
|
|
|
|
| |||||||||||
Sales of Shares | 4,200,000 | 174,045,830 | 174,045,830 | |||||||||||||||||
|
| |||||||||||||||||||
Redemption of Shares | (3,000,000 | ) | (120,368,304 | ) | (120,368,304 | ) | ||||||||||||||
|
|
|
|
|
| |||||||||||||||
Net Increase (Decrease) due to Share Transactions | 1,200,000 | 53,677,526 | 53,677,526 | |||||||||||||||||
Net Income (Loss) | ||||||||||||||||||||
Net Investment Income (Loss) | (600 | ) | (1,028,943 | ) | (1,029,543 | ) | ||||||||||||||
|
| |||||||||||||||||||
Net Realized Gain (Loss) on United States Treasury Obligations and Commodity Futures Contracts | 16,521 | 28,306,325 | 28,322,846 | |||||||||||||||||
|
| |||||||||||||||||||
Net Change in Unrealized Gain (Loss) on United States Treasury Obligations and Commodity Futures Contracts | (15,827 | ) | (27,116,328 | ) | (27,132,155 | ) | ||||||||||||||
|
|
|
|
|
| |||||||||||||||
Net Income (Loss) | 94 | 161,054 | 161,148 | |||||||||||||||||
|
|
|
|
|
|
|
|
|
| |||||||||||
Net Change in Shareholders’ Equity | — | 94 | 1,200,000 | 53,838,580 | 53,838,674 | |||||||||||||||
|
|
|
|
|
|
|
|
|
| |||||||||||
Balance at December 31, 2016 | 40 | $ | 1,482 | 5,200,000 | $ | 192,601,134 | $ | 192,602,616 | ||||||||||||
|
|
|
|
|
|
|
|
|
| |||||||||||
See accompanying Notes to Financial Statements which are an integral part of the financial statements.
39
Invesco DB Gold Fund
For the Years Ended December 31, 2018, 2017 and 2016
| 2018 | 2017 | 2016 | ||||||||||
Cash flows from operating activities: | ||||||||||||
Net Income (Loss) | $ | (9,552,039 | ) | $ | 13,436,649 | $ | 161,148 | |||||
Adjustments to reconcile net income (loss) to net cash provided by (used for) operating activities: | ||||||||||||
Cost of securities purchased | (334,022,990 | ) | (511,417,474 | ) | (882,661,673 | ) | ||||||
Proceeds from securities sold and matured | 374,625,016 | 566,668,684 | 835,973,487 | |||||||||
Cost of affiliated investments purchased | (114,449,256 | ) | (159,767,380 | ) | (160,448,052 | ) | ||||||
Proceeds from affiliated investments sold | 119,698,797 | 157,297,467 | 150,313,240 | |||||||||
Net accretion of discount on United States Treasury Obligations | (2,475,470 | ) | (1,287,879 | ) | (629,285 | ) | ||||||
Net realized (gain) loss on United States Treasury Obligations and Affiliated Investments | 16,963 | 4,874 | (2,752 | ) | ||||||||
Net change in unrealized (gain) loss on United States Treasury Obligations and Affiliated Investments | (10,483 | ) | 15,664 | 5,203 | ||||||||
Change in operating assets and liabilities: | ||||||||||||
Variation margin- Commodity Futures Contracts | 1,437,870 | (2,375,450 | ) | 1,089,180 | ||||||||
Dividends from affiliates | (5,248 | ) | (5,083 | ) | (2,328 | ) | ||||||
Management fees | (24,361 | ) | (41,755 | ) | 38,670 | |||||||
Brokerage commissions and fees | (10 | ) | 6 | 1,084 | ||||||||
|
|
|
|
|
| |||||||
Net cash provided by (used for) operating activities | 35,238,789 | 62,528,323 | (56,162,078 | ) | ||||||||
|
|
|
|
|
| |||||||
Cash flows from financing activities: | ||||||||||||
Distributions paid to shareholders | (1,389,815 | ) | (142,870 | ) | — | |||||||
Proceeds from purchases of Shares | 74,884,102 | 147,993,274 | 174,045,830 | |||||||||
Redemption of Shares | (110,480,001 | ) | (212,738,317 | ) | (120,368,304 | ) | ||||||
Increase in payable for amount due to custodian, net | 1,249,595 | — | — | |||||||||
|
|
|
|
|
| |||||||
Net cash provided by (used for) financing activities | (35,736,119 | ) | (64,887,913 | ) | 53,677,526 | |||||||
|
|
|
|
|
| |||||||
Net change in cash | (497,330 | ) | (2,359,590 | ) | (2,484,552 | ) | ||||||
Cash at beginning of period | 497,330 | 2,856,920 | 5,341,472 | |||||||||
|
|
|
|
|
| |||||||
Cash at end of period | $ | — | $ | 497,330 | $ | 2,856,920 | ||||||
|
|
|
|
|
| |||||||
Supplemental disclosure of cash flow information | ||||||||||||
Cash paid for interest | $ | 9,758 | $ | 2,101 | $ | 5,204 | ||||||
See accompanying Notes to Financial Statements which are an integral part of the financial statements.
40
Invesco DB Gold Fund
December 31, 2018
Note 1 - Organization
Invesco DB Gold Fund (the “Fund”), a separate series of Invesco DB Multi-Sector Commodity Trust (the “Trust”), a Delaware statutory trust organized in seven separate series, was formed on August 3, 2006. The term of the Fund is perpetual (unless terminated earlier in certain circumstances) as provided for in the Fifth Amended and Restated Declaration of Trust and Trust Agreement of the Trust, as amended, (the “Trust Agreement”). The Fund has an unlimited number of shares authorized for issuance.
Invesco Capital Management LLC (“Invesco”) has served as the managing owner (the “Managing Owner”), commodity pool operator and commodity trading advisor of the Trust and the Fund, since February 23, 2015. The Managing Owner holds 40 general shares (the “General Shares”) of the Fund. The fiscal year end of the Fund is December 31st.
The Fund seeks to track changes, whether positive or negative, in the level of the DBIQ Optimum Yield Gold Index Excess Return™ (the “Index”) over time, plus the excess, if any, of the sum of the Fund’s interest income from its holdings of United States Treasury Obligations (“Treasury Income”), dividends from its holdings in money market mutual funds (affiliated or otherwise) (“Money Market Income”) and dividends or distributions of capital gains from its holdings ofT-Bill ETFs (as defined below)(“T-Bill ETF Income”) over the expenses of the Fund. The Fund invests in futures contracts in an attempt to track its Index. The Index is intended to reflect the change in market value of the gold sector. The single commodity comprising the Index is gold (the “Index Commodity”).
The Fund may invest directly in United States Treasury Obligations. The Fund may also gain exposure to United States Treasury Obligations through investments in exchange-traded funds (“ETFs”) (affiliated or otherwise) that track indexes that measure the performance of United States Treasury Obligations with a maximum remaining maturity of up to 12 months(“T-Bill ETFs”). The Fund invests in United States Treasury Obligations, money market mutual funds andT-Bill ETFs (affiliated or otherwise), if any, for margin and/or cash management purposes.
The Commodity Futures Trading Commission (the “CFTC”) and certain futures exchanges impose position limits on futures contracts that reference the Index Commodity (the “Index Contracts”). The Managing Owner may determine to invest in other futures contracts if at any time it is impractical or inefficient to gain full or partial exposure to the Index Commodity through the use of Index Contracts. These other futures contracts may or may not be based on the Index Commodity. When they are not, the Managing Owner may seek to select futures contracts that it reasonably believes tend to exhibit trading prices that correlate with an Index Contract.
The Fund offers common units of beneficial interest (the “Shares”) only to certain eligible financial institutions (the “Authorized Participants”) in one or more blocks of 200,000 Shares, called a Basket. The Fund commenced investment operations on January 3, 2007. The Fund commenced trading on the American Stock Exchange (which became the NYSE Alternext US LLC) on January 5, 2007 and, since November 25, 2008, has been listed on the NYSE Arca, Inc. (the “NYSE Arca”).
This Annual Report (the “Annual Report”) covers the years ended December 31, 2018, 2017 and 2016. Past performance of the Fund is not necessarily indicative of future performance.
Note 2 - Summary of Significant Accounting Policies
A. Basis of Presentation
The financial statements of the Fund have been prepared using accounting principles generally accepted in the United States of America (“U.S. GAAP”).
The Fund has determined that it meets the definition of an investment company and has prepared the financial statements in conformity with U.S. GAAP for investment companies in conformity with accounting and reporting guidance of the Financial Accounting Standards Board Accounting Standards Codification Topic 946,Financial Services —Investment Companies.
B. Accounting Estimates
The preparation of financial statements in conformity with U.S. GAAP requires management to make estimates and assumptions that affect the reported amounts of assets and liabilities at the date of the financial statements and the reported amounts of revenues and expenses during the reporting period. Actual results could differ from those estimates by a significant amount. In addition, the Fund monitors for material events or transactions that may occur or become known after theperiod-end date and before the date the financial statements are released to print.
C. Investment Valuations
Investments inopen-end andclosed-end registered investment companies that do not trade on an exchange are valued at theend-of-day net asset value (“NAV”) per share. Investments inopen-end andclosed-end registered investment companies that trade on an exchange are valued at the last sales price or official closing price as of the close of the customary trading session on the exchange where the security is principally traded.
41
United States Treasury Obligations are fair valued using an evaluated quote provided by an independent pricing service. Evaluated quotes provided by the pricing service may be determined without exclusive reliance on quoted prices, and may reflect appropriate factors such as developments related to specific securities, yield, quality, type of issue, coupon rate, maturity, individual trading characteristics and other market data. All debt obligations involve some risk of default with respect to interest and/or principal payments.
Futures contracts are valued at the final settlement price set by an exchange on which they are principally traded.
Securities for which market quotations are not readily available or became unreliable are valued at fair value as determined in good faith following procedures approved by the Managing Owner. Issuer-specific events, market trends, bid/asked quotes of brokers and information providers and other data may be reviewed in the course of making a good faith determination of a security’s fair value.
D. Investment Transactions and Investment Income
Investment transactions are accounted for on a trade date basis. Realized gains or losses from the sale or disposition of securities or derivatives are determined on a specific identification basis and recognized in the Statements of Income and Expenses in the period in which the contract is closed or the sale or disposition occurs, respectively. Interest income on United States Treasury Obligations is recognized on an accrual basis when earned. Premiums and discounts are amortized or accreted over the life of the United States Treasury Obligations. Dividend income (net of withholding tax, if any) is recorded on theex-dividend date.
E. Profit and Loss Allocations and Distributions
Pursuant to the Trust Agreement, income and expenses are allocatedpro rata to the Managing Owner as holder of the General Shares and to the Shareholders monthly based on their respective percentage interests as of the close of the last trading day of the preceding month. Distributions (other than redemption of units) may be made at the sole discretion of the Managing Owner on apro rata basis in accordance with the respective capital balances of the shareholders.
The Managing Owner has sole discretion in determining what distributions, if any, the Fund will make to shareholders. A distribution for the year ended December 31, 2018 was paid on December 31, 2018 to holders of record as of December 26, 2018 at a rate of $0.57908 for each General Share and Share for the total distribution of $23 to General Shares and $1,389,792 to Shares.
The table below shows distributions per General Share and Share and in total for the years presented:
| Years Ended December 31, | ||||||||||||
| 2018 | 2017 | 2016 | ||||||||||
Distributions per General Share | $ | 0.57908 | $ | 0.04202 | $ | — | ||||||
Distributions per Share | $ | 0.57908 | $ | 0.04202 | $ | — | ||||||
Distributions paid to General Shares | $ | 23 | $ | 2 | $ | — | ||||||
Distributions paid to Shares | $ | 1,389,792 | $ | 142,868 | $ | — | ||||||
F. Routine Operational, Administrative and Other Ordinary Expenses
The Managing Owner is responsible for all routine operational, administrative and other ordinary expenses of the Fund, including, but not limited to, computer services, the fees and expenses of the Trustee, legal and accounting fees and expenses, tax preparation expenses, filing fees and printing, mailing and duplication costs. The Fund does not reimburse the Managing Owner for the routine operational, administrative and other ordinary expenses of the Fund. Accordingly, such expenses are not reflected in the Statements of Income and Expenses of the Fund.
G.Non-Recurring Fees and Expenses
The Fund pays allnon-recurring and unusual fees and expenses, if any, of itself, as determined by the Managing Owner.Non-recurring and unusual fees and expenses include fees and expenses, such as legal claims and liabilities, litigation costs, indemnification expenses or other nonroutine expenses.Non-recurring and unusual fees and expenses, by their nature, are unpredictable in terms of timing and amount. For the years ended December 31, 2018, 2017 and 2016, the Fund did not incur such expenses.
42
H. Brokerage Commissions and Fees
The Fund incurs all brokerage commissions, including applicable exchange fees, National Futures Association (“NFA”) fees,give-up fees, pit brokerage fees and other transaction related fees and expenses charged in connection with trading activities by the Commodity Broker (as defined below). These costs are recorded as Brokerage Commissions and Fees in the Statements of Income and Expenses. The Commodity Broker’s brokerage commissions and trading fees are determined on acontract-by-contract basis. On average, total charges paid to the Commodity Broker, as applicable were less than $6.00, $6.00 and $6.00 per round-turn trade during the years ended December 31, 2018, 2017 and 2016, respectively.
I. Income Taxes
The Fund is classified as a partnership for U.S. federal income tax purposes. Accordingly, the Fund will generally not incur U.S. federal income taxes. No provision for federal, state, and local income taxes has been made in the accompanying financial statements, as investors are individually liable for income taxes, if any, on their allocable share of the Fund’s income, gain, loss, deductions and other items.
The Managing Owner has reviewed all of the Fund’s open tax years and major jurisdictions and concluded that there is no tax liability resulting from unrecognized tax benefits relating to uncertain tax positions taken or expected to be taken in future tax returns. The Fund is also not aware of any tax positions for which it is reasonably possible that the total amounts of unrecognized tax benefits will significantly change in the next twelve months. The major tax jurisdiction for the Fund and the earliest tax year subject to examination: United States, 2015.
J. Commodity Futures Contracts
The Fund utilizes derivative instruments to achieve its investment objective. A commodity futures contract is an agreement between counterparties to purchase or sell a specified underlying commodity for a specified price, or to pay or receive a cash amount based on the value of an index or other reference instrument, at a future date. Initial margin deposits required upon entering into futures contracts are satisfied by the segregation of specific securities or cash as collateral with the Commodity Broker. During the period that the commodity futures contracts are open, changes in the value of the contracts are recognized as unrealized gains or losses by recalculating the value of the contracts on a daily basis. Subsequent or variation margin payments are received or made depending upon whether unrealized gains or losses are incurred. These amounts are reflected as a receivable or payable on the Statements of Financial Condition. When the contracts are closed or expire, the Fund recognizes a realized gain or loss equal to the difference between the proceeds from, or cost of, the closing transaction and the Fund’s basis in the contract. Realized gains (losses) and changes in unrealized appreciation (depreciation) on open positions are determined on a specific identification basis and recognized in the Statements of Income and Expenses in the period in which the contract is closed or the changes occur, respectively.
Note 3 - Financial Instrument Risk
In the normal course of its business, the Fund is a party to financial instruments withoff-balance sheet risk. The term“off-balance sheet risk” refers to an unrecorded potential liability that, even though it does not appear on the balance sheet, may result in a future obligation or loss in excess of the amounts shown on the Statements of Financial Condition. The financial instruments used by the Fund are commodity futures contracts, the values of which are based upon an underlying asset and generally represent future commitments that have a reasonable possibility of being settled in cash or through physical delivery. The financial instruments are traded on an exchange and are standardized contracts.
Market risk is the potential for changes in the value of the financial instruments traded by the Fund due to market changes, including fluctuations in commodity prices. In entering into these futures contracts, there exists a market risk that such futures contracts may be significantly influenced by adverse market conditions, resulting in such futures contracts being less valuable. If the markets should move against all of the futures contracts at the same time, the Fund could experience substantial losses.
Credit risk is the possibility that a loss may occur due to the failure of the Commodity Broker and/or clearing house to perform according to the terms of a futures contract. Credit risk with respect to exchange-traded instruments is reduced to the extent that an exchange or clearing organization acts as a counterparty to the transactions. The Commodity Broker, when acting as the Fund’s futures commission merchant in accepting orders for the purchase or sale of domestic futures contracts, is required by CFTC regulations to separately account for and segregate as belonging to the Fund all assets of the Fund relating to domestic futures trading. The Commodity Broker is not allowed to commingle such assets with other assets of the Commodity Broker. In addition, CFTC regulations also require the Commodity Broker to hold in a secure account assets of the Fund related to foreign futures trading. The Fund’s risk of loss in the event of counterparty default is typically limited to the amounts recognized in the Statements of Financial Condition and not represented by the futures contract or notional amounts of the instruments.
The Fund has not utilized, nor does it expect to utilize in the future, special purpose entities to facilitateoff-balance sheet financing arrangements and has no loan guarantee arrangements oroff-balance sheet arrangements of any kind, other than agreements entered into in the normal course of business noted above.
43
Note 4 – Service Providers and Related Party Agreements
The Trustee
Under the Trust Agreement, Wilmington Trust Company, the trustee of the Trust and the Fund (the “Trustee”), has the power and authority to execute and file certificates as required by the Delaware Statutory Trust Act and to accept service of process on the Fund in the State of Delaware. The Managing Owner has the exclusive management and control of all aspects of the business of the Trust and the Fund. The Trustee will serve in that capacity until such time as the Managing Owner removes the Trustee or the Trustee resigns and a successor is appointed by the Managing Owner. The Trustee will have no duty or liability to supervise or monitor the performance of the Managing Owner, nor will the Trustee have any liability for the acts or omissions of the Managing Owner.
The Managing Owner
The Managing Owner serves as the Fund’s commodity pool operator, commodity trading advisor and managing owner. The Fund pays the Managing Owner a management fee, monthly in arrears, in an amount equal to 0.75% per annum of the daily NAV of the Fund (the “Management Fee”). The Fund, for cash management purposes, invests in money market mutual funds and/orT-Bill ETFs that are managed by affiliates of the Managing Owner. The indirect portion of the management fee that the Fund incurs through such investments is in addition to the Management Fee paid to the Managing Owner. The Managing Owner has contractually agreed to waive indefinitely the fees that it receives in an amount equal to the indirect management fees that the Fund incurs through its investments in affiliated money market mutual funds and/or affiliatedT-Bill ETFs. The Managing Owner may terminate this fee waiver on 60 days notice.
The Managing Owner waived fees of $14,741, $16,325 and $7,482 for the years ended December 31, 2018, 2017 and 2016, respectively.
The Distributor
Effective June 20, 2016, Invesco Distributors, Inc. (the “Distributor”) became distributor and began providing certain distribution services to the Fund. Pursuant to the Distribution Services Agreement among the Managing Owner, the Fund and the Distributor, the Distributor assists the Managing Owner and the Fund’s administrator, The Bank of New York Mellon, with certain functions and duties relating to distribution and marketing services to the Fund including reviewing and approving marketing materials. Prior to June 20, 2016, ALPS Distributors, Inc. provided distribution services to the Fund.
The Managing Owner pays the Distributor a distribution fee out of the Management Fee.
The Commodity Broker
Morgan Stanley & Co. LLC, a Delaware limited liability company, serves as the Fund’s futures clearing broker (the “Commodity Broker”). The Commodity Broker is registered with the CFTC as a futures commission merchant and is a member of the NFA in such capacity.
A variety of executing brokers execute futures transactions on behalf of the Fund. Such executing brokersgive-up all such transactions to the Commodity Broker. In its capacity as clearing broker, the Commodity Broker may execute or receive transactions executed by others and clears all of the Fund’s futures transactions and performs certain administrative and custodial services for the Fund. The Commodity Broker is responsible, among other things, for providing periodic accountings of all dealings and actions taken by the Fund during the reporting period, together with an accounting of all securities, cash or other indebtedness or obligations held by it or its nominees for or on behalf of the Fund.
The Administrator, Custodian and Transfer Agent
The Bank of New York Mellon (the “Administrator”, “Custodian” and “Transfer Agent”) is the administrator, custodian and transfer agent of the Fund. The Fund and the Administrator have entered into separate administrative, custodian, transfer agency and service agreements (collectively referred to as the “Administration Agreement”).
Pursuant to the Administration Agreement, the Administrator performs or supervises the performance of services necessary for the operation and administration of the Fund (other than making investment decisions), including receiving and processing orders from Authorized Participants to create and redeem Baskets, NAV calculations, accounting and other fund administrative services. The Administrator maintains certain financial books and records, including: Basket creation and redemption records; fund accounting records; ledgers with respect to assets, liabilities, capital, income and expenses; the registrar, transfer journals and related details; and trading and related documents received from the Commodity Broker. The Managing Owner pays the Administrator fees for its services out of the Management Fee.
44
Index Sponsor
The Managing Owner, on behalf of the Fund, has appointed Deutsche Investment Management Americas Inc. to serve as the index sponsor (the “Index Sponsor”). The Index Sponsor calculates and publishes the daily index levels and the indicative intraday index levels. Additionally, the Index Sponsor also calculates the indicative value per Share of the Fund throughout each business day.
The Managing Owner pays the Index Sponsor a licensing fee and an index services fee out of the Management Fee for performing its duties.
Note 5 - Deposits with Commodity Broker and Custodian
The Fund defines cash as cash held by the Custodian. There were no cash equivalents held by the Fund as of December 31, 2018 and 2017.
The Fund may deposit cash, United States Treasury Obligations,T-Bill ETFs and money market mutual funds with the Commodity Broker as margin, to the extent permissible under CFTC rules. The combination of the Fund’s deposits with its Commodity Broker of cash and United States Treasury Obligations and the unrealized profit or loss on open futures contracts represents the Fund’s overall equity in its broker trading account. To meet the Fund’s maintenance margin requirements, the Fund holds United States Treasury Obligations with the Commodity Broker. The Fund transfers cash to the Commodity Broker to satisfy variation margin requirements. The Fund earns interest on any excess cash deposited with the Commodity Broker and incurs interest expense on any deficit balance with the Commodity Broker.
The brokerage agreement with the Commodity Broker provides for the net settlement of all financial instruments covered by the agreement in the event of default or termination of any one contract. The Managing Owner will utilize any excess cash held at the Commodity Broker to offset any realized losses incurred in the commodity futures contracts, if available. To the extent that any excess cash held at the Commodity Broker is not adequate to cover any realized losses, a portion of the United States Treasury Obligations andT-Bill ETFs, if any, on deposit with the Commodity Broker will be sold to make additional cash available. For financial reporting purposes, the Fund offsets financial assets and financial liabilities that are subject to legally enforceable netting arrangements.
The Fund’s remaining cash, United States Treasury Obligations,T-Bill ETFs and money market mutual fund holdings are on deposit with the Custodian. The Fund is permitted to temporarily carry a negative or overdrawn balance in its account with the Custodian. The Fund incurs interest expense on any overdraft balance with the Custodian. Such balances, if any atperiod-end, are shown on the Statements of Financial Condition under the payable captionDue to Custodian.
Note 6 - Additional Valuation Information
U.S. GAAP defines fair value as the price that would be received to sell an asset or paid to transfer a liability in an orderly transaction between market participants at the measurement date, under current market conditions. U.S. GAAP establishes a hierarchy that prioritizes the inputs to valuation methods, giving the highest priority to readily available unadjusted quoted prices in an active market for identical assets (Level 1) and the lowest priority to significant unobservable inputs (Level 3), generally when market prices are not readily available or are unreliable. Based on the valuation inputs, the securities or other investments are tiered into one of three levels. Changes in valuation methods or market conditions may result in transfers in or out of an investment’s assigned level:
Level 1: Prices are determined using quoted prices in an active market for identical assets.
Level 2: Prices are determined using other significant observable inputs. Observable inputs are inputs that other market participants may use in pricing a security. These may include quoted prices for similar securities, interest rates, prepayment speeds, credit risk, yield curves, loss severities, default rates, discount rates, volatilities and others.
Level 3: Prices are determined using significant unobservable inputs. In situations where quoted prices or observable inputs are unavailable (for example, when there is little or no market activity for an investment at the end of the period), unobservable inputs may be used. Unobservable inputs reflect the Fund’s own assumptions about the factors market participants would use in determining fair value of the securities or instruments and would be based on the best available information.
The levels assigned to the securities valuations may not be an indication of the risk or liquidity associated with investing in those securities. Because of the inherent uncertainties of valuation, the values reflected in the financial statements may materially differ from the value received upon actual sale of those investments.
45
The following is a summary of the tiered valuation input levels as of December 31, 2018:
| Level 1 | Level 2 | Level 3 | Total | |||||||||||||
Investments in Securities | ||||||||||||||||
United States Treasury Obligations | $ | — | $ | 88,687,386 | $ | — | $ | 88,687,386 | ||||||||
Money Market Mutual Fund | 7,355,184 | — | — | 7,355,184 | ||||||||||||
|
|
|
|
|
|
|
| |||||||||
Total Investments in Securities | 7,355,184 | 88,687,386 | — | 96,042,570 | ||||||||||||
|
|
|
|
|
|
|
| |||||||||
Other Investments - Assets(a) | ||||||||||||||||
Commodity Futures Contracts | 2,528,218 | — | — | 2,528,218 | ||||||||||||
|
|
|
|
|
|
|
| |||||||||
Total Investments | $ | 9,883,402 | $ | 88,687,386 | $ | — | $ | 98,570,788 | ||||||||
|
|
|
|
|
|
|
| |||||||||
| (a) | Unrealized appreciation (depreciation). |
The following is a summary of the tiered valuation input levels as of December 31, 2017:
| Level 1 | Level 2 | Level 3 | Total | |||||||||||||
Investments in Securities | ||||||||||||||||
United States Treasury Obligations | $ | — | $ | 126,820,422 | $ | — | $ | 126,820,422 | ||||||||
Money Market Mutual Fund | 12,604,725 | — | — | 12,604,725 | ||||||||||||
|
|
|
|
|
|
|
| |||||||||
Total Investments in Securities | 12,604,725 | 126,820,422 | — | 139,425,147 | ||||||||||||
|
|
|
|
|
|
|
| |||||||||
Other Investments - Assets(a) | ||||||||||||||||
Commodity Futures Contracts | 5,735,253 | — | — | 5,735,253 | ||||||||||||
|
|
|
|
|
|
|
| |||||||||
Total Investments | $ | 18,339,978 | $ | 126,820,422 | $ | — | $ | 145,160,400 | ||||||||
|
|
|
|
|
|
|
| |||||||||
| (a) | Unrealized appreciation (depreciation). |
Note 7 – Derivative Instruments
The Fair Value of Derivative Instruments is as follows:
| December 31, 2018 | December 31, 2017 | |||||||||||||||
Risk Exposure/Derivative Type(a) | Assets | Liabilities | Assets | Liabilities | ||||||||||||
Commodity risk | ||||||||||||||||
Commodity Futures Contracts | $ | 2,528,218 | $ | — | $ | 5,735,253 | $ | — | ||||||||
| (a) | Includes cumulative appreciation (depreciation) of commodity futures contracts. Only the current day’s variation margin receivable (payable) is reported in the December 31, 2018 and December 31, 2017 Statements of Financial Condition. |
The following table presents derivative instruments that are either subject to an enforceable netting agreement or offset by collateral arrangements as of December 31, 2018, net by contract:
| Financial Derivative Assets | Financial Derivative Liabilities | Collateral (Received)/Pledged(a) | ||||||||||||||||||||||
Counterparty | Futures Contracts | Futures Contracts | Net value of derivatives | Non-Cash | Cash | Net amount | ||||||||||||||||||
Morgan Stanley & Co. LLC | $ | 2,528,218 | $ | (2,653,678 | ) | $ | (125,460 | ) | $ | 125,460 | $ | — | $ | — | ||||||||||
The following table presents derivative instruments that are either subject to an enforceable netting agreement or offset by collateral arrangements as of December 31, 2017, net by contract:
| Financial Derivative Assets | Financial Derivative Liabilities | Collateral (Received)/Pledged(a) | ||||||||||||||||||||||
Counterparty | Futures Contracts | Futures Contracts | Net value of derivatives | Non-Cash | Cash | Net amount | ||||||||||||||||||
Morgan Stanley & Co. LLC | $ | 5,735,253 | $ | (4,422,843 | ) | $ | 1,312,410 | $ | — | $ | — | $ | 1,312,410 | |||||||||||
| (a) | As of December 31, 2018 and December 31, 2017, a portion of the Fund’s U.S. Treasury Obligations were required to be deposited as maintenance margin in support of the Fund’s futures positions. |
46
The Effect of Derivative Instruments on the Statements of Income and Expenses is as follows:
| For the Years Ended | ||||||||||||||
| Location of Gain or (Loss) on Derivatives | December 31, | |||||||||||||
Risk Exposure/Derivative Type | Recognized in Income | 2018 | 2017 | 2016 | ||||||||||
Commodity risk | ||||||||||||||
Commodity Futures Contracts | Net Realized Gain (Loss) | $ | (7,832,954 | ) | $ | (24,968,839 | ) | $ | 28,320,094 | |||||
Net Change in Unrealized Gain (Loss) | (3,207,035 | ) | 38,278,529 | (27,126,952 | ) | |||||||||
|
|
|
|
|
| |||||||||
Total | $ | (11,039,989 | ) | $ | 13,309,690 | $ | 1,193,142 | |||||||
|
|
|
|
|
| |||||||||
The table below summarizes the average monthly notional value of futures contracts outstanding during the period:
| For the Years Ended | ||||||||||||
| December 31, | ||||||||||||
| 2018 | 2017 | 2016 | ||||||||||
Average Notional Value | $ | 144,139,712 | $ | 159,274,091 | $ | 213,033,892 | ||||||
Note 8 - Share Purchases and Redemptions
(a) Purchases
On any business day, an Authorized Participant may place an order with the Transfer Agent to create one or more Baskets. Each Basket consists of a block of 200,000 Shares. For purposes of processing both creation and redemption orders, a “business day” means any day other than a day when banks in New York City are required or permitted to be closed. Creation orders must be placed by 10:00 a.m., Eastern Time. The day on which the Transfer Agent receives a valid creation order is the creation order date. The day on which a creation order is settled is the creation order settlement date. Cash settlement occurs at the creation order settlement date. As provided below, the creation order settlement date may occur up to two business days after the creation order date. By placing a creation order, and prior to delivery of such Baskets, an Authorized Participant’s Depository Trust Company (“DTC”) account is charged thenon-refundable transaction fee due for the creation order.
Unless otherwise agreed to by the Managing Owner and the Authorized Participant as provided in the next sentence, Baskets are issued on the creation order settlement date as of 2:45 p.m., Eastern Time, on the business day immediately following the creation order date at the applicable NAV per Share as of the closing time of the NYSE Arca or the last to close of the exchanges on which its futures contracts are traded, whichever is later, on the creation order date, but only if the required payment has been timely received. Upon submission of a creation order, the Authorized Participant may request the Managing Owner to agree to a creation order settlement date up to two business days after the creation order date.
(b) Redemptions
On any business day, an Authorized Participant may place an order with the Transfer Agent to redeem one or more Baskets. Redemption orders must be placed by 10:00 a.m., Eastern Time. The day on which the Managing Owner receives a valid redemption order is the redemption order date. The day on which a redemption order is settled is the redemption order settlement date. Cash settlement occurs at the redemption order settlement date. As provided below, the redemption order settlement date may occur up to two business days after the redemption order date. The redemption procedures allow Authorized Participants to redeem Baskets. Individual Shareholders may not redeem directly from the Fund. Instead, individual Shareholders may only redeem Shares in integral multiples of 200,000 and only through an Authorized Participant.
Unless otherwise agreed to by the Managing Owner and the Authorized Participant as provided in the next sentence, by placing a redemption order, an Authorized Participant agrees to deliver the Baskets to be redeemed through DTC’s book-entry system to the Fund no later than the redemption order settlement date as of 2:45 p.m., Eastern Time, on the business day immediately following the redemption order date. Upon submission of a redemption order, the Authorized Participant may request the Managing Owner to agree to a redemption order settlement date up to two business days after the redemption order date. By placing a redemption order, and prior to receipt of the redemption proceeds, an Authorized Participant’s DTC account is charged thenon-refundable transaction fee due for the redemption order.
The redemption proceeds from the Fund consist of the cash redemption amount. The cash redemption amount is equal to the NAV of the number of Basket(s) requested in the Authorized Participant’s redemption order as of the closing time of the NYSE Arca or the last to close of the exchanges on which the Fund’s futures contracts are traded, whichever is later, on the redemption order date. The Managing Owner will distribute the cash redemption amount at the redemption order settlement date as of 2:45 p.m., Eastern Time, on the redemption order settlement date through DTC to the account of the Authorized Participant as recorded on DTC’s book-entry system.
47
The redemption proceeds due from the Fund are delivered to the Authorized Participant at 2:45 p.m., Eastern Time, on the redemption order settlement date if, by such time, the Fund’s DTC account has been credited with the Baskets to be redeemed. If the Fund’s DTC account has not been credited with all of the Baskets to be redeemed by such time, the redemption distribution is delivered to the extent of whole Baskets received. Any remainder of the redemption distribution is delivered on the next business day to the extent of remaining whole Baskets received if the Transfer Agent receives the fee applicable to the extension of the redemption distribution date which the Managing Owner may, fromtime-to-time, determine and the remaining Baskets to be redeemed are credited to the Fund’s DTC account by 2:45 p.m., Eastern Time, on such next business day. Any further outstanding amount of the redemption order will be cancelled. The Managing Owner is also authorized to deliver the redemption distribution notwithstanding that the Baskets to be redeemed are not credited to the Fund’s DTC account by 2:45 p.m., Eastern Time, on the redemption order settlement date if the Authorized Participant has collateralized its obligation to deliver the Baskets through DTC’s book-entry system on such terms as the Managing Owner may determine fromtime-to-time.
Note 9 - Commitments and Contingencies
The Managing Owner, either in its own capacity or in its capacity as the Managing Owner and on behalf of the Fund, has entered into various service agreements that contain a variety of representations, or provide indemnification provisions related to certain risks service providers undertake in performing services for the Fund. The Trust Agreement provides for the Fund to indemnify the Managing Owner and any affiliate of the Managing Owner that provides services to the Fund to the maximum extent permitted by applicable law, subject to certain exceptions for disqualifying conduct by the Managing Owner or such an affiliate. The Fund’s maximum exposure under these arrangements is unknown as this would involve future claims that may be made against the Fund that have not yet occurred. Further, the Fund has not had prior claims or losses pursuant to these contracts. Accordingly, the Managing Owner expects the risk of loss to be remote.
48
Note 10 - Financial Highlights
The Fund is presenting the following NAV and financial highlights related to investment performance for a Share outstanding for the years ended December 31, 2018, 2017 and 2016. An individual investor’s return and ratios may vary based on the timing of capital transactions.
NAV per Share is the NAV of the Fund divided by the number of outstanding Shares at the date of each respective period presented.
| Years Ended December 31, | ||||||||||||
| 2018 | 2017 | 2016 | ||||||||||
Net Asset Value | ||||||||||||
Net asset value per Share, beginning of period | $ | 41.51 | $ | 37.04 | $ | 34.69 | ||||||
Net realized and change in unrealized gain (loss) on United States Treasury Obligations, Affiliated Investments and Commodity Futures Contracts | (1.92 | ) | 4.47 | 2.54 | ||||||||
Net investment income (loss)(a) | 0.41 | 0.04 | (0.19 | ) | ||||||||
|
|
|
|
|
| |||||||
Net income (loss) | (1.51 | ) | 4.51 | 2.35 | ||||||||
|
|
|
|
|
| |||||||
Less: | ||||||||||||
Return of capital distributions | (0.58 | ) | (0.04 | ) | — | |||||||
|
|
|
|
|
| |||||||
Net asset value per Share, end of period | $ | 39.42 | $ | 41.51 | $ | 37.04 | ||||||
|
|
|
|
|
| |||||||
Market value per Share, beginning of period(b) | $ | 41.37 | $ | 37.05 | $ | 34.67 | ||||||
|
|
|
|
|
| |||||||
Market value per Share, end of period(b) | $ | 39.52 | $ | 41.37 | $ | 37.05 | ||||||
|
|
|
|
|
| |||||||
Ratio to average Net Assets | ||||||||||||
Net investment income (loss) | 1.02 | % | 0.09 | % | (0.47 | )% | ||||||
|
|
|
|
|
| |||||||
Expenses, after waivers | 0.76 | % | 0.76 | % | 0.77 | % | ||||||
|
|
|
|
|
| |||||||
Expenses, prior to waivers | 0.77 | % | 0.77 | % | 0.77 | % | ||||||
|
|
|
|
|
| |||||||
Total Return, at net asset value(c) | (3.63 | )% | 12.18 | % | 6.78 | % | ||||||
|
|
|
|
|
| |||||||
Total Return, at market value(c) | (3.06 | )% | 11.78 | % | 6.86 | % | ||||||
|
|
|
|
|
| |||||||
| (a) | Based on average shares outstanding. |
| (b) | The mean between the last bid and ask prices. |
| (c) | Total Return, at NAV is calculated assuming an initial investment made at the NAV at the beginning of the period, reinvestment of all dividends and distributions at NAV during the period, and redemption of Shares on the last day of the period. Total Return, at NAV includes adjustments in accordance with U.S. GAAP and as such, the NAV for financial reporting purposes and the returns based upon those NAVs may differ from the NAVs and returns for shareholder transactions. Total Return, at market value is calculated assuming an initial investment made at the market value at the beginning of the period, reinvestment of all dividends and distributions at market value during the period, and redemption of Shares at the market value on the last day of the period. Not annualized for periods less than one year, if applicable. |
49
| ITEM 9. | CHANGES IN AND DISAGREEMENTS WITH ACCOUNTANTS ON ACCOUNTING AND FINANCIAL DISCLOSURE |
None.
| ITEM 9A. | CONTROLS AND PROCEDURES |
For purposes of this Item 9A, all references to the “Fund” shall be read to specifically include the Fund and the Trust. Please note that the disclosure controls and procedures and internal control over financial reporting of the Trust are the aggregate disclosure controls and procedures and internal control over financial reporting of the Fund and that of Invesco DB Agriculture Fund, Invesco DB Base Metals Fund, Invesco DB Energy Fund, Invesco DB Oil Fund, Invesco DB Precious Metals Fund and Invesco DB Silver Fund, each a series of the Trust.
Evaluation of Disclosure Controls and Procedures
Under the supervision and with the participation of the management of the Managing Owner, including Daniel Draper, its Principal Executive Officer, and Kelli Gallegos, its Principal Financial and Accounting Officer, Investment Pools, the Fund carried out an evaluation of the effectiveness of the design and operation of its disclosure controls and procedures (as defined in Rule13a-15(e) or15d-15(e) of the Securities Exchange Act of 1934, as amended (the “Exchange Act”)) as of December 31, 2018, the end of the period covered by this annual report, and, based upon that evaluation, Daniel Draper, the Principal Executive Officer of the Managing Owner, and Kelli Gallegos, the Principal Financial and Accounting Officer, Investment Pools, of the Managing Owner, concluded that the Fund’s disclosure controls and procedures were effective to provide reasonable assurance that information the Fund is required to disclose in the reports that it files or submits with the Securities and Exchange Commission (the “SEC”) under the Exchange Act is recorded, processed, summarized and reported, within the time periods specified in the SEC’s rules and forms, and to ensure that information required to be disclosed by the Fund in the reports that it files or submits under the Exchange Act is accumulated and communicated to management of the Managing Owner, including its Principal Executive Officer and Principal Financial Officer, as appropriate to allow timely decisions regarding required disclosure.
Changes in Internal Control Over Financial Reporting
There has been no change in internal control over financial reporting (as defined in the Rules13a-15(f) and15d-15(f) of the Exchange Act) that occurred during the quarter ended December 31, 2018 that has materially affected, or is reasonably likely to materially affect, the Fund’s internal control over financial reporting.
Management’s Annual Report on Internal Control Over Financial Reporting
Management of the Managing Owner is responsible for establishing and maintaining adequate internal control over financial reporting, as defined under Rules13a-15(f) and15d-15(f) of the Exchange Act, for the Fund. Daniel Draper, the Principal Executive Officer of the Managing Owner, and Kelli Gallegos, the Principal Financial and Accounting Officer, Investment Pools, of the Managing Owner, assessed the effectiveness of the Fund’s internal control over financial reporting as of December 31, 2018. Their report in connection with their assessment may be found in the “Report of Management on Internal Control Over Financial Reporting” on page 30 of this Annual Report on Form10-K.
The Fund’s independent registered public accounting firm, PricewaterhouseCoopers LLP, has audited the Fund’s internal control over financial reporting as of December 31, 2018, as stated in their report on page 31 of this Form10-K.
| ITEM 9B. | OTHER INFORMATION |
None.
50
| ITEM 10. | DIRECTORS AND EXECUTIVE OFFICERS OF THE REGISTRANT AND CORPORATE GOVERNANCE |
Board of Directors and Principal Officers
The Fund has no directors or principal officers and also does not have any employees. It is managed by the Managing Owner.
As of December 31, 2018, the board of managers and principal officers of the Managing Owner are as follows:
Name | Capacity | |
Daniel Draper | Chief Executive Officer, Board of Managers | |
Peter Hubbard | Vice President and Director of Portfolio Management | |
David Warren | Chief Administrative Officer, Board of Managers | |
Annette Lege | Principal | |
Kelli Gallegos | Principal Financial and Accounting Officer, Investment Pools | |
Melanie Zimdars | Chief Compliance Officer | |
John Zerr | Board of Managers | |
Brian Hartigan | Global Head of ETF Investments |
Invesco Group Services Inc. is also a principal of the Managing Owner.
The Managing Owner is managed by a Board of Managers. The Board of Managers is composed of Messrs. Draper, Warren and Zerr.
The Managing Owner has designated Mr. Hubbard as the trading principal of the Fund.
Daniel Draper (50) has been Chief Executive Officer of the Managing Owner since March 24, 2016. In this role, he has general oversight responsibilities for all of the Managing Owner’s business. Mr. Draper has been a Member of the Board of Managers of the Managing Owner since September 2013. In this role he is responsible for the management of the Managing Owner’s exchange traded fund business with direct functional reporting responsibilities for the Managing Owner’s portfolio management, products, marketing and capital markets teams. In such capacity, Mr. Draper also is responsible for managing the operations of the Invesco Funds. Previously, Mr. Draper was the Global Head of Exchange Traded Funds for Credit Suisse Asset Management, or Credit Suisse, based in London from March 2010 until June 2013, followed by a three monthnon-compete period pursuant to his employment terms with Credit Suisse. Credit Suisse is an asset management business of Credit Suisse Group, a financial services company. From January 2007 to March 2010, he was the Global Head of Exchange Traded Funds for Lyxor Asset Management in London, an investment management business unit of Societe Generale Corporate & Investment Banking. Mr. Draper was previously registered as a Significant Influence Functions (SIF) person with the UK’s Financial Conduct Authority. He withdrew SIF person status on June 30, 2013 when he left Credit Suisse. Mr. Draper received his MBA from the Kenan-Flagler Business School at the University of North Carolina at Chapel Hill and his BA from the College of William and Mary in Virginia. Mr. Draper is currently registered with FINRA and holds the Series 7, 24 and 63 registrations. Mr. Draper was listed as a principal of the Managing Owner on December 16, 2013.
Peter Hubbard (38) joined the Managing Owner in May 2005 as a portfolio manager and has been Vice President, Director of Portfolio Management since September 2012. In his role, Mr. Hubbard manages a team of eight portfolio managers. His responsibilities include facilitating all portfolio management processes associated with more than 200 equity and fixed income Invesco Funds listed in the United States, Canada and Europe. He is a graduate of Wheaton College with a B.A. degree in Business & Economics. Mr. Hubbard was listed as a principal and registered as an associated person of the Managing Owner on November 15, 2012 and January 1, 2013, respectively. Mr. Hubbard was registered as a swap associated person of the Managing Owner effective as of September 8, 2015.
David Warren (61) is Chief Administrative Officer, Americas, for Invesco Ltd., a global investment management company affiliated with the Managing Owner. He was appointed to this position in January 2007, and also holds the roles of Director, Executive Vice President and Chief Financial Officer of Invesco Canada Ltd., a Canadian investment management subsidiary of Invesco Ltd., since January 2009. He has been a Member of the Board of Managers and Chief Administrative Officer of the Managing Owner since January 2010, as well. In these capacities, Mr. Warren is responsible for general management support, in addition to executing on various strategic initiatives and overseeing the risk management framework for the business units operating within the Americas division of Invesco Ltd. He obtained a Bachelor’s Degree in Commerce from the University of Toronto as both a CA and CPA, and is a member of the Chartered Professional Accountants of Canada. Mr. Warren was listed as a principal of the Managing Owner on November 21, 2012.
Annette Lege (49) has been a Chief Accounting Officer and Head of Finance and Corporate Services (“FCS”) Business Services for Invesco Ltd. since March 2017. In this role, she is responsible for all aspects of Corporate Accounting including group financial reporting, internal controls and group accounting policies. Ms Lege also manages Invesco’s Finance operations and shared service centers and has held this role since September 2015. Previously, Ms. Lege was Head of FCS Transformation Office from October 2013 through September 2015, with responsibility for business transformation initiatives taking place across FCS at Invesco. Before
51
assuming that role in October 2013, Ms. Lege held the position of North American Corporate Controller at Invesco from March 2007 to October 2013. Ms. Lege is also a CPA, is licensed by FINRA as a Financial Operations Principal, and is a member of the Texas State Board of Public Accountants. Ms. Lege earned a BBA in accounting from the University of Houston. Ms. Lege was listed as a principal of the Managing Owner on March 30, 2017 and was listed as a principal of Invesco Advisors, Inc. on March 22, 2017.
Kelli Gallegos (48) has been Principal Financial and Accounting Officer – Investment Pools for the Managing Owner since September 2018. Additionally, since September 2018, Ms. Gallegos has been Principal Financial and Accounting Officer – Investment Pools of Invesco Specialized Products, LLC (sponsor to a suite of currency exchange-traded funds, “ISP”), Head of North America Fund Reporting of Invesco, Ltd. (“Invesco”, a global investment management company), and Vice President and Treasurer of Invesco Exchange Traded Fund Trust, Invesco Exchange-Traded Fund Trust II, Invesco India Exchange-Traded Fund Trust, Invesco Actively Managed Exchange-Traded Fund Trust, Invesco Actively Managed Exchange-Traded Commodity Fund Trust, and Invesco Exchange-Traded Self-Indexed Fund Trusts (each a registered investment company offering series of exchange-traded funds, the “Invesco ETFs”). She also serves as Vice President (since March 2016), Principal Financial Officer (since March 2016) and Assistant Treasurer (since December 2008) for a suite of mutual funds advised by Invesco Advisers, Inc., a registered investment adviser (the “Invesco Funds”). In her roles with the Managing Owner, ISP, Invesco, the Invesco ETFs and the Invesco Funds, Ms. Gallegos has financial and administrative oversight responsibilities for, and serves as Principal Financial Officer of the Invesco ETFs, the Trust, the Funds and the exchange-traded funds for which ISP serves as sponsor (the “CurrencyShares Trusts”). Previously, she was Director of Fund Financial Services from December 2008 to September 2018, Assistant Treasurer for the Managing Owner from January 2013 to September 2018, Assistant Treasurer of ISP from April 2018 to September 2018, Assistant Treasurer for the Invesco ETFs from September 2014 to September 2018 and Assistant Vice President for the Invesco Funds from December 2008 to March 2016. In such roles, Ms. Gallegos managed the group of personnel responsible for the preparation of fund financial statements and other information necessary for shareholder reports, fund prospectuses, regulatory filings, and for the coordination and oversight of third-party service providers of the Fund, the Invesco ETFs, the Invesco Funds, and the CurrencyShares Trusts. Ms. Gallegos earned a BBA in accounting from Harding University in Searcy, AR. Ms. Gallegos was listed as a principal of the Managing Owner on September 25, 2018.
Melanie H. Zimdars (42) has been Chief Compliance Officer of the Managing Owner since November 2017. In this role she is responsible for all aspects of regulatory compliance for the Managing Owner. Ms. Zimdars has also served as Chief Compliance Officer of Invesco Exchange-Traded Fund Trust, Invesco Exchange-Traded Fund Trust II, Invesco Exchange-Traded Fund Trust, Invesco Actively Managed Exchange-Traded Fund Trust and Invesco Actively Managed Exchange-Traded Commodity Fund Trust since November 2017. From September 2009 to October 2017, she served as Vice President and Deputy Chief Compliance Officer at ALPS Holdings, Inc. where she was Chief Compliance Officer for six different mutual fund complexes, including active and passive ETFs andopen-end andclosed-end funds. Through its subsidiary companies, ALPS Holdings, Inc. is a provider of investment products and customized servicing solutions to the financial services industry. Ms. Zimdars received a BS degree from the University ofWisconsin-La Crosse. Ms. Zimdars was listed as a principal of the Managing Owner on February 1, 2018.
John Zerr (56) has been a Member of the Board of Managers of the Managing Owner since September 2006. Mr. Zerr has also served as Chief Operating Officer of the Americas for Invesco Ltd. since February 2018. Prior to his current position, Mr.Zerr served as Managing Director and General Counsel – U.S. Retail of Invesco Management Group, Inc., a registered investment adviser affiliated with the Managing Owner, from March 2006 until February 2018, where he was responsible for overseeing the U.S. Retail Legal Department for Invesco Ltd. and its affiliated companies. Mr. Zerr has also been a Senior Vice President and Secretary of IDI since March 2006 and June 2006, respectively. He also served as a Director of that entity until February 2010. Mr. Zerr has served as Senior Vice President of Invesco Advisers, Inc., a registered investment adviser affiliated with the Managing Owner, since December 2009. Mr. Zerr serves as a Director, Vice President and Secretary of Invesco Investment Services, Inc., a registered transfer agency since May 2007. Mr. Zerr has served as Director, Senior Vice President, General Counsel and Secretary of a number of other Invesco Ltd. wholly-owned subsidiaries which service or serviced portions of Invesco Ltd.’s U.S. Retail business since May 2007 and since June 2010 with respect to certain Van Kampen entities engaged in the asset management business that were acquired by Invesco Ltd. from Morgan Stanley. In each of the foregoing positions Mr. Zerr is responsible for overseeing legal operations. In such capacity, Mr. Zerr also is responsible for overseeing the legal activities of the Invesco Funds. Mr. Zerr earned a BA degree in economics from Ursinus College. He graduated cum laude with a J.D. from Temple University School of Law. Mr. Zerr was listed as a principal of the Managing Owner on December 6, 2012.
Brian Hartigan (40) joined the Managing Owner in May 2015 as Global Head of ETF Investments. In his role, Mr. Hartigan manages the portfolio management function at the Managing Owner, with the Director of Portfolio Management reporting to him. Previously from June 2010 until May of 2015, Mr. Hartigan was the Head of Portfolio Management and Research for Invesco Capital Markets, Inc., the sponsor of unit investment trusts. In that role, he oversaw portfolio management of Invesco unit trusts. He earned his B.A. from the University of St. Thomas in Minnesota and an MBA in finance from DePaul University. He is a CFA charterholder and a member of the CFA Society of Chicago. Mr. Hartigan was listed as a principal and registered as an associated person of the Managing Owner on February 21, 2018 and May 29, 2018, respectively.
52
Invesco Group Services Inc., which is a wholly owned, indirect subsidiary of Invesco Ltd., has been a principal of the Managing Owner since September 27, 2018 and has periodically been listed with NFA as a principal of other NFA members since May 17, 1990.
Code of Ethics
The Fund has no officers or employees and is managed by Invesco Capital Management LLC. Invesco Capital Management LLC has adopted a code of ethics which applies to all of its employees and is available on request, free of charge, by calling1-800-983-0903 Monday through Friday, 8:00 a.m. to 5:00 p.m. Central Time.
| ITEM 11. | EXECUTIVE COMPENSATION |
The Fund has no employees, officers or directors. The Managing Owner receives a monthly Management Fee of 1/12th of 0.75% per annum of the daily net asset value of the Fund at the end of each month.
For the year ended December 31, 2018, the Fund has incurred Management Fees of $1,102,728 of which $1,041,154 had been paid at December 31, 2018. Management Fees of $61,574 were unpaid at December 31, 2018 and are reported as a liability on the Statements of Financial Condition.
For the year ended December 31, 2018, the Fund has incurred brokerage commissions of $26,104 of which $21,103 had been paid at December 31, 2018. Brokerage commissions of $5,001 were unpaid at December 31, 2018 and are reported as a liability on the Statements of Financial Condition.
For the year ended December 31, 2017, the Fund has incurred Management Fees of $1,195,875 of which $1,109,940 had been paid at December 31, 2017. Management Fees of $85,935 were unpaid at December 31, 2017 and are reported as a liability on the Statements of Financial Condition.
For the year ended December 31, 2017, the Fund has incurred brokerage commissions of $23,034 of which $18,023 had been paid at December 31, 2017. Brokerage commissions of $5,011 were unpaid at December 31, 2017 and are reported as a liability on the Statements of Financial Condition.
For the year ended December 31, 2016, the Fund has incurred Management Fees of $1,638,603 of which $1,510,913 had been paid at December 31, 2016. Management Fees of $127,690 were unpaid at December 31, 2016 and are reported as a liability on the Statements of Financial Condition.
For the year ended December 31, 2016, the Fund has incurred brokerage commissions of $35,962 of which $30,957 had been paid at December 31, 2016. Brokerage commissions of $5,005 were unpaid at December 31, 2016 and are reported as a liability on the Statements of Financial Condition.
| ITEM 12. | SECURITY OWNERSHIP OF CERTAIN BENEFICIAL OWNERS AND MANAGEMENT AND RELATED STOCKHOLDER MATTERS |
The Fund has no officers or directors. The following table sets forth certain information regarding beneficial ownership of the Fund’s General Shares and Shares as of January 31, 2019, as known by management. No person is known by the Managing Owner to own beneficially more than 5% of the outstanding Shares of such class.
Title of Class | Name and Address of Beneficial Owner | Amount and Nature of Beneficial Ownership | Percent of Class | |||||||
General Shares | Invesco Capital Management LLC 3500 Lacey Road, Suite 700 Downers Grove, Illinois 60515 | 40 | 100 | % | ||||||
Shares | Directors and Officers of Invesco Capital Management LLC as a group | — | Less than 0.1 | % | ||||||
The Fund has no securities authorized for issuance under equity compensation plans.
| ITEM 13. | CERTAIN RELATIONSHIPS AND RELATED TRANSACTIONS, AND DIRECTOR INDEPENDENCE |
See Item 11.
53
| ITEM 14. | PRINCIPAL ACCOUNTANT FEES AND SERVICES |
Audit andNon-Audit Fees
The following table sets forth the fees for professional services rendered by PricewaterhouseCoopers LLP, the Fund’s independent registered public accounting firm for the years ended December 31, 2018 and 2017.
| Fiscal Years Ended December 31, | ||||||||
| 2018 | 2017 | |||||||
Audit Fees | $ | 78,660 | $ | 86,034 | ||||
Audit-Related Fees(1) | 2,100 | — | ||||||
Tax Fees(2) | 109,109 | 118,905 | ||||||
All Other Fees | — | — | ||||||
|
|
|
| |||||
Total | $ | 189,869 | $ | 204,939 | ||||
|
|
|
| |||||
| (1) | Audit-Related Fees for fiscal year ended December 31, 2018 include fees billed for reviewing regulatory filings. |
| (2) | Tax Fees for the fiscal years ended December 31, 2018 and 2017 include fees billed for preparing tax forms. |
Approval of Independent Registered Public Accounting Firm Services and Fees
The Managing Owner approved all of the services provided by PricewaterhouseCoopers LLP to the Fund described above. The Managing Ownerpre-approved all audit and allowednon-audit services of the Fund’s independent registered public accounting firm, including all engagement fees and terms.
54
| ITEM 15. | EXHIBITS AND FINANCIAL STATEMENT SCHEDULES |
(a)(1) Financial Statements
See financial statements commencing on page 29 hereof.
(a)(2) Financial Statement Schedules
No financial statement schedules are filed herewith because (i) such schedules are not required or (ii) the information required has been presented in the aforementioned financial statements.
(a)(3) Exhibits
The following documents (unless otherwise indicated) are filed herewith and made a part of this Annual Report:
EXHIBIT NO. | DESCRIPTION | |
| 4.1 | Fifth Amended and Restated Declaration of Trust and Trust Agreement of the Registrant1 | |
| 4.1.1 | Amendment No. 1 to the Fifth Amended and Restated Declaration of Trust and Trust Agreement of the Registrant2 | |
| 4.1.2 | Amendment No. 2 to the Fifth Amended and Restated Declaration of Trust and Trust Agreement of the Registrant3 | |
| 4.2 | Form of Participant Agreement4 | |
| 10.1 | Form of Customer Agreement5 | |
| 10.2 | Form of Administration Agreement4 | |
| 10.3 | Form of Global Custody Agreement4 | |
| 10.4 | Form of Transfer Agency and Service Agreement4 | |
| 10.5 | Distribution Services Agreement2 | |
| 23.1 | Consent of PricewaterhouseCoopers LLP | |
| 31.1 | Certification required under Exchange Act Rules13a-14 and15d-14 (filed herewith) | |
| 31.2 | Certification required under Exchange Act Rules13a-14 and15d-14 (filed herewith) | |
| 32.1 | Certification of Principal Executive Officer pursuant to 18 U.S.C. Section 1350 as adopted pursuant to Section 906 of the Sarbanes-Oxley Act of 2002 (furnished herewith) | |
| 32.2 | Certification of Principal Financial Officer pursuant to 18 U.S.C. Section 1350 as adopted pursuant to Section 906 of the Sarbanes-Oxley Act of 2002 (furnished herewith) | |
| 101 | Interactive data file pursuant to Rule 405 of RegulationS-T: (i) the Statements of Financial Condition of Invesco DB Gold Fund—December 31, 2018 and December 31, 2017, (ii) the Schedule of Investments of Invesco DB Gold Fund—December 31, 2018, (iii) the Schedule of Investments of Invesco DB Gold Fund—December 31, 2017, (iv) the Statements of Income and Expenses of Invesco DB Gold Fund—Years Ended December 31, 2018, 2017 and 2016, (v) the Statement of Changes in Shareholders’ Equity of Invesco DB Gold Fund—Year Ended December 31, 2018, (vi) the Statement of Changes in Shareholders’ Equity of Invesco DB Gold Fund—Year Ended December 31, 2017, (vii) the Statement of Changes in Shareholders’ Equity of Invesco DB Gold Fund— Year Ended December 31, 2016, (viii) the Statements of Cash Flows of Invesco DB Gold Fund—Years Ended December 31, 2018, 2017 and 2016, and (ix) Notes to Financial Statements of Invesco DB Gold Fund. | |
| 1 | Previously filed as an exhibit to Form8-K on February 25, 2015 and incorporated herein by reference. |
| 2 | Previously filed as an exhibit to Form8-K on June 20, 2016 and incorporated herein by reference. |
| 3 | Previously filed as an exhibit to Form8-K on June 4, 2018 and incorporated herein by reference. |
| 4 | Previously filed as an exhibit toPre-Effective Amendment No. 2 to a Registration Statement on FormS-1 on December 14, 2006 and incorporated herein by reference. |
| 5 | Previously filed as an exhibit to Form8-K on February 26, 2015 and incorporated herein by reference. |
55
SIGNATURES
Pursuant to the requirements of the Securities Exchange Act of 1934, the Registrant has duly caused this report to be signed on its behalf by the undersigned, thereunto duly authorized.
| Invesco DB Multi-Sector Commodity Trust on its own behalf and with respect to Invesco DB Gold Fund | ||||||
| By: | Invesco Capital Management LLC, | |||||
| its Managing Owner | ||||||
| By: | /s/ DANIEL DRAPER | |||||
| Name: | Daniel Draper | |||||
| Title: | Principal Executive Officer | |||||
| By: | /s/ KELLI GALLEGOS | |||||
| Name: | Kelli Gallegos | |||||
| Title: | Principal Financial and Accounting Officer, Investment Pools | |||||
Dated: February 27, 2019
56
Exhibit 23.1
CONSENT OF INDEPENDENT REGISTERED PUBLIC ACCOUNTING FIRM
We hereby consent to the incorporation by reference in the Registration Statement on FormS-1 (No.333-228404-04) of Invesco DB Multi-Sector Commodity Trust of our report dated February 27, 2019 relating to the financial statementsand the effectiveness of internal control over financial reporting, which appears in Invesco DB Gold Fund’s Form10-K.
/s/ PricewaterhouseCoopers LLP
Chicago, Illinois
February 27, 2019
Exhibit 31.1
CERTIFICATION
I, Daniel Draper, certify that:
| 1. | I have reviewed this Annual Report on Form10-K of Invesco DB Gold Fund, a series of Invesco DB Multi-Sector Commodity Trust; |
| 2. | Based on my knowledge, this report does not contain any untrue statement of a material fact or omit to state a material fact necessary to make the statements made, in light of the circumstances under which such statements were made, not misleading with respect to the period covered by this report; |
| 3. | Based on my knowledge, the financial statements, and other financial information included in this report, fairly present in all material respects the financial condition, results of operations and cash flows of the registrant as of, and for, the periods presented in this report; |
| 4. | The registrant’s other certifying officer and I are responsible for establishing and maintaining disclosure controls and procedures (as defined in Exchange Act Rules13a-15(e) and15d-15(e)) and internal control over financial reporting (as defined in Exchange Act Rules13a-15(f) and15d-15(f)) for the registrant and have: |
| (a) | Designed such disclosure controls and procedures, or caused such disclosure controls and procedures to be designed under our supervision, to ensure that material information relating to the registrant, including its consolidated subsidiaries, is made known to us by others within those entities, particularly during the period in which this report is being prepared; |
| (b) | Designed such internal control over financial reporting, or caused such internal control over financial reporting to be designed under our supervision, to provide reasonable assurance regarding the reliability of financial reporting and the preparation of financial statements for external purposes in accordance with generally accepted accounting principles; |
| (c) | Evaluated the effectiveness of the registrant’s disclosure controls and procedures and presented in this report our conclusions about the effectiveness of the disclosure controls and procedures, as of the end of the period covered by this report based on such evaluation; and |
| (d) | Disclosed in this report any change in the registrant’s internal control over financial reporting that occurred during the registrant’s most recent fiscal quarter (the registrant’s fourth fiscal quarter in the case of an annual report) that has materially affected, or is reasonably likely to materially affect, the registrant’s internal control over financial reporting; and |
| 5. | The registrant’s other certifying officer and I have disclosed, based on our most recent evaluation of internal control over financial reporting, to the registrant’s auditors and the audit committee of the registrant’s board of directors (or persons performing the equivalent functions): |
| (a) | All significant deficiencies and material weaknesses in the design or operation of internal control over financial reporting which are reasonably likely to adversely affect the registrant’s ability to record, process, summarize and report financial information; and |
| (b) | Any fraud, whether or not material, that involves management or other employees who have a significant role in the registrant’s internal control over financial reporting. |
| Dated: February 27, 2019 | /s/ Daniel Draper | |||||
| Daniel Draper | ||||||
| Principal Executive Officer |
Exhibit 31.2
CERTIFICATION
I, Kelli Gallegos, certify that:
| 1. | I have reviewed this Annual Report on Form10-K of Invesco DB Gold Fund, a series of Invesco DB Multi-Sector Commodity Trust; |
| 2. | Based on my knowledge, this report does not contain any untrue statement of a material fact or omit to state a material fact necessary to make the statements made, in light of the circumstances under which such statements were made, not misleading with respect to the period covered by this report; |
| 3. | Based on my knowledge, the financial statements, and other financial information included in this report, fairly present in all material respects the financial condition, results of operations and cash flows of the registrant as of, and for, the periods presented in this report; |
| 4. | The registrant’s other certifying officer and I are responsible for establishing and maintaining disclosure controls and procedures (as defined in Exchange Act Rules13a-15(e) and15d-15(e)) and internal control over financial reporting (as defined in Exchange Act Rules13a-15(f) and15d-15(f)) for the registrant and have: |
| (a) | Designed such disclosure controls and procedures, or caused such disclosure controls and procedures to be designed under our supervision, to ensure that material information relating to the registrant, including its consolidated subsidiaries, is made known to us by others within those entities, particularly during the period in which this report is being prepared; |
| (b) | Designed such internal control over financial reporting, or caused such internal control over financial reporting to be designed under our supervision, to provide reasonable assurance regarding the reliability of financial reporting and the preparation of financial statements for external purposes in accordance with generally accepted accounting principles; |
| (c) | Evaluated the effectiveness of the registrant’s disclosure controls and procedures and presented in this report our conclusions about the effectiveness of the disclosure controls and procedures, as of the end of the period covered by this report based on such evaluation; and |
| (d) | Disclosed in this report any change in the registrant’s internal control over financial reporting that occurred during the registrant’s most recent fiscal quarter (the registrant’s fourth fiscal quarter in the case of an annual report) that has materially affected, or is reasonably likely to materially affect, the registrant’s internal control over financial reporting; and |
| 5. | The registrant’s other certifying officer and I have disclosed, based on our most recent evaluation of internal control over financial reporting, to the registrant’s auditors and the audit committee of the registrant’s board of directors (or persons performing the equivalent functions): |
| (a) | All significant deficiencies and material weaknesses in the design or operation of internal control over financial reporting which are reasonably likely to adversely affect the registrant’s ability to record, process, summarize and report financial information; and |
| (b) | Any fraud, whether or not material, that involves management or other employees who have a significant role in the registrant’s internal control over financial reporting. |
| Dated: February 27, 2019 | /s/ Kelli Gallegos | |||||
| Kelli Gallegos | ||||||
| Principal Financial and Accounting Officer, Investment Pools |
Exhibit 32.1
CERTIFICATION PURSUANT TO
18 U.S.C. SECTION 1350
AS ADOPTED PURSUANT TO
SECTION 906 OF THE SARBANES-OXLEY ACT OF 2002
The undersigned, Daniel Draper, Principal Executive Officer of Invesco Capital Management LLC, the Managing Owner of Invesco DB Gold Fund (the “Fund”), a series of Invesco DB Multi-Sector Commodity Trust, hereby certifies pursuant to 18 U.S.C. Section 1350, as adopted pursuant to Section 906 of the Sarbanes-Oxley Act of 2002, that:
| (1) | The Fund’s Annual Report on Form10-K for the year ended December 31, 2018, as filed with the Securities and Exchange Commission on the date hereof (the “Annual Report”), fully complies with the requirements of Section 13(a) or 15(d) of the Securities Exchange Act of 1934, as amended; |
| (2) | The information contained in the Annual Report fairly presents, in all material respects, the financial condition and results of operations of the Fund; |
| (3) | This certification accompanies the report to which it relates, is not deemed filed with the Securities and Exchange Commission and is not to be incorporated by reference into any filing of the Company under the Securities Act of 1933, as amended, or the Securities Exchange Act of 1934, as amended (whether made before or after the date of such report), irrespective of any general incorporation language contained in such filing. |
| Dated: February 27, 2019 | /s/ Daniel Draper | |||||
| Daniel Draper | ||||||
| Principal Executive Officer |
Exhibit 32.2
CERTIFICATION PURSUANT TO
18 U.S.C. SECTION 1350
AS ADOPTED PURSUANT TO
SECTION 906 OF THE SARBANES-OXLEY ACT OF 2002
The undersigned, Kelli Gallegos, Principal Financial and Accounting Officer, Investment Pools, of Invesco Capital Management LLC, the Managing Owner of Invesco DB Gold Fund (the “Fund”), a series of Invesco DB Multi-Sector Commodity Trust, hereby certifies pursuant to 18 U.S.C. Section 1350, as adopted pursuant to Section 906 of the Sarbanes-Oxley Act of 2002, that:
| (1) | The Fund’s Annual Report on Form10-K for the year ended December 31, 2018, as filed with the Securities and Exchange Commission on the date hereof (the “Annual Report”), fully complies with the requirements of Section 13(a) or 15(d) of the Securities Exchange Act of 1934, as amended; |
| (2) | The information contained in the Annual Report fairly presents, in all material respects, the financial condition and results of operations of the Fund; |
| (3) | This certification accompanies the report to which it relates, is not deemed filed with the Securities and Exchange Commission and is not to be incorporated by reference into any filing of the Company under the Securities Act of 1933, as amended, or the Securities Exchange Act of 1934, as amended (whether made before or after the date of such report), irrespective of any general incorporation language contained in such filing. |
| Dated: February 27, 2019 | /s/ Kelli Gallegos | |||||
| Kelli Gallegos | ||||||
| Principal Financial and Accounting Officer, Investment Pools |
UNITED STATES
SECURITIES AND EXCHANGE COMMISSION
WASHINGTON, D.C. 20549
FORM10-K
| ☒ | ANNUAL REPORT PURSUANT TO SECTION 13 OR 15(d) OF THE SECURITIES EXCHANGE ACT OF 1934 |
For the fiscal year ended December 31, 2018
OR
| ☐ | TRANSITION REPORT PURSUANT TO SECTION 13 OR 15(d) OF THE SECURITIES EXCHANGE ACT OF 1934 |
For the transition period from to
Commission File Number:001-33236
INVESCO DB BASE METALS FUND
(A Series of Invesco DB Multi-Sector Commodity Trust)
(Exact name of Registrant as specified in its charter)
| Delaware | 87-0778075 | |
(State or Other Jurisdiction of Incorporation or Organization) | (I.R.S. Employer Identification No.) | |
c/o Invesco Capital Management LLC 3500 Lacey Road, Suite 700 Downers Grove, Illinois | 60515 | |
| (Address of Principal Executive Offices) | (Zip Code) | |
Registrant’s telephone number, including area code:(800) 983-0903
Securities registered pursuant to Section 12(b) of the Act:
Title of Each Class | Name of Each Exchange on Which Registered | |
| Common Units of Beneficial Interest | NYSE Arca, Inc. |
Securities registered pursuant to Section 12(g) of the Act: None
Indicate by check mark if the Registrant is a well-known seasoned issuer, as defined in Rule 405 of the Securities Act. Yes ☐ No ☒
Indicate by check mark if the Registrant is not required to file reports pursuant to Section 13 or Section 15(d) of the Act. Yes ☐ No ☒
Indicate by check mark whether the Registrant: (1) has filed all reports required to be filed by Section 13 or 15(d) of the Securities Exchange Act of 1934 during the preceding 12 months (or for such shorter period that the Registrant was required to file such reports), and (2) has been subject to such filing requirements for the past 90 days. Yes ☒ No ☐
Indicate by check mark whether the Registrant has submitted electronically every Interactive Data File required to be submitted pursuant to Rule 405 of RegulationS-T (§232.405 of this chapter) during the preceding 12 months (or for such shorter period that the Registrant was required to submit such files). Yes ☒ No ☐
Indicate by check mark if disclosure of delinquent filers pursuant to Item 405 of RegulationS-K (§229.405 of this chapter) is not contained herein, and will not be contained, to the best of Registrant’s knowledge, in definitive proxy or information statements incorporated by reference in Part III of this Form10-K or any amendment to this Form10-K. ☒
Indicate by check mark whether the Registrant is a large accelerated filer, an accelerated filer, anon-accelerated filer, a smaller reporting company, or an emerging growth company. See the definitions of “large accelerated filer,” “accelerated filer,” “smaller reporting company,” and “emerging growth company” in Rule12b-2 of the Exchange Act.
| Large Accelerated Filer | ☐ | Accelerated Filer | ☒ | |||
| Non-Accelerated Filer | ☐ | Smaller reporting company | ☐ | |||
| Emerging growth company | ☐ | |||||
If an emerging growth company, indicate by check mark if the registrant has elected not to use the extended transition period for complying with any new or revised financial accounting standards provided pursuant to Section 13(a) of the Exchange Act. ☐.
Indicate by check mark whether the Registrant is a shell company (as defined in Rule12b-2 of the Exchange Act). Yes ☐ No ☒
State the market value of the voting andnon-voting common equity held bynon-affiliates computed by reference to the price at which the common equity was last sold, or the average bid and asked price of such common equity, as of the last business day of the Registrant’s most recently completed second fiscal quarter: $306,414,000.
Number of Common Units of Beneficial Interest outstanding as of January 31, 2019: 10,600,000
TABLE OF CONTENTS
i
CAUTIONARY STATEMENT CONCERNING FORWARD-LOOKING INFORMATION
This Report includes forward-looking statements within the meaning of Section 27A of the Securities Act of 1933, as amended (the “Securities Act”), and Section 21E of the Securities Exchange Act of 1934, as amended (the “Exchange Act”), that involve substantial risks and uncertainties. The matters discussed throughout this Report that are not historical facts are forward-looking statements. These forward-looking statements are based on the Fund’s and Invesco Capital Management LLC’s (the “Managing Owner”) current expectations, estimates and projections about the future results, performance, prospects and opportunities of the Fund and the Fund’s business and industry and their beliefs and assumptions about future events and speak only as of the date on which they are made. Words such as “anticipate,” “expect,” “intend,” “plan,” “believe,” “seek,” “outlook” and “estimate,” as well as similar words and phrases, signify forward-looking statements. Forward-looking statements are not guarantees of future results. Conditions and important factors, risks and uncertainties in the markets for financial instruments that the Fund trades, in the markets for related physical commodities, in the legal and regulatory regimes applicable to the Managing Owner, the Fund, and the Fund’s service providers, and in the broader economy may cause actual results to differ materially from those expressed by such forward-looking statements. These forward-looking statements are subject to a number of risks, uncertainties and other factors including, but not limited to, those described in this Report, including in Part I, Item 1A. “Risk Factors” and Part II, Item 7, “Management’s Discussion and Analysis of Financial Condition and Results of Operation” (“MD&A”), and other Securities and Exchange Commission (“SEC”) filings by the Fund that could cause the actual results, performance, prospects or opportunities of the Fund to differ materially from those expressed in, or implied by, these forward-looking statements.
You should not place undue reliance on any forward-looking statements. Except as expressly required by the Federal securities laws, the Fund and Managing Owner undertake no obligation to publicly update or revise any forward-looking statements or the risks, uncertainties or other factors described in this Report, as a result of new information, future events or changed circumstances or for any other reason after the date of this Report.
ii
| ITEM 1. | BUSINESS |
Introduction
Invesco DB Base Metals Fund (the “Fund”), a separate series of Invesco DB Multi-Sector Commodity Trust (the “Trust”), a Delaware statutory trust organized in seven separate series, was formed on August 3, 2006. The term of the Fund is perpetual (unless terminated earlier in certain circumstances) as provided for in the Fifth Amended and Restated Declaration of Trust and Trust Agreement of the Fund, as amended (the “Trust Agreement”). The Fund has an unlimited number of shares authorized for issuance.
Invesco Capital Management LLC (“Invesco”) has served as the managing owner (the “Managing Owner”), commodity pool operator and commodity trading advisor of the Fund since February 23, 2015. The Managing Owner holds 40 general shares (the “General Shares”) of the Fund. The fiscal year end of the Fund is December 31st.
The Fund seeks to track changes, whether positive or negative, in the level of the DBIQ Optimum Yield Industrial Metals Index Excess Return™ (the “Index”) over time, plus the excess, if any, of the sum of the Fund’s interest income from its holdings of United States Treasury Obligations (“Treasury Income”), dividends from its holdings in money market mutual funds (affiliated or otherwise) (“Money Market Income”) and dividends or distributions of capital gains from its holdings ofT-Bill ETFs (as defined below)(“T-Bill ETF Income”) over the expenses of the Fund. The Fund invests in futures contracts in an attempt to track its Index. The Index is intended to reflect the change in market value of the base metals sector. The commodities comprising the Index are aluminum, zinc and copper—Grade A (each an “Index Commodity”, and collectively, the “Index Commodities”).
The Fund may invest directly in United States Treasury Obligations. The Fund may also gain exposure to United States Treasury Obligations through investments in exchange-traded funds (“ETFs”) (affiliated or otherwise) that track indexes that measure the performance of United States Treasury Obligations with a maximum remaining maturity of up to 12 months(“T-Bill ETFs”). The Fund invests in United States Treasury Obligations, money market mutual funds andT-Bill ETFs (affiliated or otherwise), if any, for margin and/or cash management purposes.
The Commodity Futures Trading Commission (the “CFTC”) and certain futures exchanges impose position limits on futures contracts that reference Index Commodities (the “Index Contracts”). As the Fund approaches or reaches position limits with respect to an Index Commodity, the Fund may commence investing in Index Contracts that reference other Index Commodities. In those circumstances, the Fund may also trade in futures contracts based on commodities other than Index Commodities that the Managing Owner reasonably believes tend to exhibit trading prices that correlate with an Index Contract. In addition, the Managing Owner may determine to invest in other futures contracts if at any time it is impractical or inefficient to gain full or partial exposure to an Index Commodity through the use of Index Contracts. These other futures contracts may or may not be based on an Index Commodity. When they are not, the Managing Owner may seek to select futures contracts that it reasonably believes tend to exhibit trading prices that correlate with an Index Contract.
The Fund offers common units of beneficial interest (the “Shares”) only to certain eligible financial institutions (the “Authorized Participants”) in one or more blocks of 200,000 Shares (“Basket”). The Fund commenced investment operations on January 3, 2007. The Fund commenced trading on the American Stock Exchange (which became the NYSE Alternext US LLC (the “NYSE Alternext”)) on January 5, 2007 and, since November 25, 2008, has been listed on the NYSE Arca, Inc. (the “NYSE Arca”).
Index Description
The Managing Owner pays Deutsche Investment Management Americas Inc. (the “Index Sponsor”) a licensing fee and an index services fee for performing its duties.
These fees constitute a portion of the routine operational, administrative and other ordinary expenses which are paid out of the management fee paid to the Managing Owner (“Management Fee”) and are not charged to or reimbursed by the Fund.
Neither the Managing Owner nor any affiliate of the Managing Owner has any rights to influence the selection of the futures contracts underlying the Index. The Managing Owner has entered into a license agreement with the Index Sponsor to use the Index.
The Fund is not sponsored or endorsed by Deutsche Bank AG, Deutsche Investment Management Americas Inc. or any subsidiary or affiliate of Deutsche Bank AG or Deutsche Investment Management Americas Inc. (collectively, “Deutsche Bank”). The DBIQ Optimum Yield Industrial Metals Index Excess Return™ (the “Index”) is the exclusive property of Deutsche Investment Management Americas Inc. “DBIQ” and “Optimum Yield” are service marks of Deutsche Bank AG and have been licensed for use for certain purposes by Deutsche Investment Management Americas Inc. Neither Deutsche Bank nor any other party involved in, or related to, making or compiling the Index makes any representation or warranty, express or implied, concerning the Index, the Fund or the advisability of investing in securities generally. Neither Deutsche Bank nor any other party involved in, or related to, making or compiling the Index has any obligation to take the needs of the Managing Owner or its clients into consideration in determining, composing or calculating the Index. Neither Deutsche Bank nor any other party involved in, or related to, making or compiling the
1
Index is responsible for or has participated in the determination of the timing of, prices at, quantities or valuation of the Fund. Neither Deutsche Bank nor any other party involved in, or related to, making or compiling the Index has any obligation or liability in connection with the administration or trading of the Fund.
NEITHER DEUTSCHE BANK NOR ANY OTHER PARTY INVOLVED IN, OR RELATED TO, MAKING OR COMPILING THE INDEX, WARRANTS OR GUARANTEES THE ACCURACY AND/OR THE COMPLETENESS OF THE INDEX OR ANY DATA INCLUDED THEREIN AND SHALL HAVE NO LIABILITY FOR ANY ERRORS, OMISSIONS, OR INTERRUPTIONS THEREIN. NEITHER DEUTSCHE BANK NOR ANY OTHER PARTY INVOLVED IN, OR RELATED TO, MAKING OR COMPILING THE INDEX, MAKES ANY WARRANTY, EXPRESS OR IMPLIED, AS TO RESULTS TO BE OBTAINED BY INVESCO CAPITAL MANAGEMENT LLC FROM THE USE OF THE INDEX OR ANY DATA INCLUDED THEREIN. NEITHER DEUTSCHE BANK NOR ANY OTHER PARTY INVOLVED IN, OR RELATED TO, MAKING OR COMPILING THE INDEX, MAKES ANY EXPRESS OR IMPLIED WARRANTIES, AND EXPRESSLY DISCLAIMS ALL WARRANTIES, OF MERCHANTABILITY OR FITNESS FOR A PARTICULAR PURPOSE OR USE WITH RESPECT TO THE INDEX OR ANY DATA INCLUDED THEREIN. WITHOUT LIMITING ANY OF THE FOREGOING, IN NO EVENT SHALL DEUTSCHE BANK OR ANY OTHER PARTY INVOLVED IN, OR RELATED TO, MAKING OR COMPILING THE INDEX HAVE ANY LIABILITY FOR DIRECT, INDIRECT, PUNITIVE, SPECIAL, CONSEQUENTIAL OR ANY OTHER DAMAGES OR LOSSES (INCLUDING LOST PROFITS), EVEN IF NOTIFIED OF THE POSSIBILITY THEREOF. EXCEPT AS EXPRESSLY PROVIDED TO THE CONTRARY, THERE ARE NO THIRD PARTY BENEFICIARIES OF ANY AGREEMENTS OR ARRANGEMENTS BETWEEN DEUTSCHE BANK AND INVESCO CAPITAL MANAGEMENT LLC.
No purchaser, seller or holder of the Shares of this Fund, or any other person or entity, should use or refer to any Deutsche Bank trade name, trademark or service mark to sponsor, endorse, market or promote this Fund without first contacting Deutsche Bank to determine whether Deutsche Bank’s permission is required. Under no circumstances may any person or entity claim any affiliation with Deutsche Bank without the written permission of Deutsche Bank.
The Index Sponsor may fromtime-to-time subcontract the provision of the calculation and other services described below to one or more third parties. The Index is composed of notional amounts of each of the underlying Index Commodities. The notional amount of each Index Commodity included in the Index is intended to reflect the changes in market value of each such Index Commodity within the Index. The closing level of the Index is calculated on each business day by the Index Sponsor based on the closing price of the commodity futures contracts for each of the Index Commodities and the notional amount of such Index Commodity.
The Index is rebalanced annually in November to ensure that each of the Index Commodities is weighted in the same proportion that such Index Commodities were weighted on September 3, 1997. The composition of the Index may be adjusted in the event that the Index Sponsor is not able to calculate the closing prices of the Index Commodities.
The following table reflects the Fund weights of each Index Commodity or related futures contracts, as applicable, as of December 31, 2018:
Index Commodity | Fund Weight (%) | |||
Aluminum | 32.23 | % | ||
Zinc | 34.17 | |||
Copper-Grade A | 33.60 | |||
|
| |||
Closing Level as of December 31, 2018: | 100.00 | % | ||
|
| |||
Please seehttp://www.invesco.com/ETFs with respect to the most recently available weighted composition of the Fund and the composition of the Index.
The Index includes provisions for the replacement of futures contracts as they approach maturity. This replacement takes place over a period of time in order to lessen the impact on the market for the futures contracts being replaced. With respect to each Index Commodity, the Fund employs a rule-based approach when it “rolls” from one futures contract to another.
Rather than select a new futures contract based on a predetermined schedule (e.g., monthly), each Index Commodity rolls from one contract to another futures contract that is intended to generate the most favorable ‘implied roll yield’ under prevailing market conditions. Where there is an upward-sloping price curve for futures contracts, the implied roll yield is expected to be negative. The selection of a new futures contract on an Index Commodity in such market conditions is designed to minimize the impact of negative roll yield. Conversely, where there is a downward-sloping price curve for futures contracts, the implied roll yield is expected to be positive. The selection of a new futures contract on an Index Commodity in such market conditions is designed to maximize the impact of positive roll yield. The Index takes the impact of implied roll yield into consideration by selecting, as the replacement for an expiring futures contract, the futures contract with a delivery month within the next thirteen months that generates the most favorable implied roll yield under the current market conditions.
2
The market condition in which the Index is designed to maximize the effect of positive roll yield when entering into new futures contracts is called backwardation. Backwardation exists when prices are higher for contracts with shorter-term expirations than those with longer-term expirations, a condition that is typically associated with commodities that are consumed quickly instead of being put in storage. Rolling in a backwardated market will tend to enhance returns from futures trading. The market condition in which the Index is designed to mitigate the effect of negative roll yield when entering into new futures contracts is called contango. Contango exists when contract prices are higher in distant delivery months than in nearer delivery months, typically due to costs associated with storing a given physical commodity for a longer period. Rolling in a contangoed market will tend to cause a drag on returns from futures trading. Returns from futures trading are called excess return, which is the combined return based on the spot prices of Index Commodities and the roll yield from trading futures contracts on Index Commodities.
The Index is calculated in USD on an excess return (unfunded) basis, which means that the Index reflects the return associated with spot prices for Index Commodities and the roll yield associated with trading futures contracts on Index Commodities. The Fund also invests in securities that are expected to generate income, including Treasury Securities, money market mutual funds, andT-Bill ETFs. These securities are held with the Custodian. In addition, Treasury Securities for deposit may be held with the Commodity Broker as margin for the Fund’s futures positions. The Index does not reflect any corresponding income characteristics.
The futures contract price for each Index Commodity will be the exchange closing price for such Index Commodity on a day on which the appropriate exchange is open for business (the “Index Business Days”). If a weekday is not an Exchange Business Day (as defined in the following sentence) but is an Index Business Day, the exchange closing price from the previous Index Business Day will be used for each Index Commodity. “Exchange Business Day” means, in respect of an Index Commodity, a day that is a trading day for such Index Commodity on the relevant exchange (unless either an Index disruption event or force majeure event has occurred).
On the first Index Business Day of each month (the “Verification Date”), each Index Commodity futures contract will be tested in order to determine whether to continue including it in the Index. If the Index Commodity futures contract requires delivery of the underlying commodity in the next month, known as the Delivery Month, a new Index Commodity futures contract will be selected for inclusion in the Index. For example, if the first Index Business Day is May 1 of the current year, and the Delivery Month of the Index Commodity futures contract currently in the Index is June of the current year, a new Index Commodity futures contract with a later Delivery Month will be selected.
For each underlying Index Commodity in the Index, the new Index Commodity futures contract selected will be the Index Commodity futures contract with the best possible “implied roll yield” based on the closing price for each eligible Index Commodity futures contract. Eligible Index Commodity futures contracts are any Index Commodity futures contracts having a Delivery Month (i) no sooner than the month after the Delivery Month of the Index Commodity futures contract currently in the Index, and (ii) no later than the thirteenth month after the Verification Date. For example, if the first Index Business Day is May 1 of the current year and the Delivery Month of an Index Commodity futures contract currently in the Index is June of the current year, the Delivery Month of an eligible new Index Commodity futures contract must be between July of the current year and June of the following year. The implied roll yield is then calculated and the futures contract on the Index Commodity with the best possible implied roll yield under the current market conditions is then selected. If two futures contracts have the same implied roll yield, the futures contract with the minimum number of months prior to the Delivery Month is selected.
After the futures contract selection, the monthly roll for each Index Commodity subject to a roll in that particular month unwinds the old futures contract and enters a position in the new futures contract. This takes place between the second and sixth Index Business Day of the month.
On each day during the roll period, new notional holdings are calculated. The calculations for the futures contracts on the old Index Commodities that are leaving the Index and the futures contracts on the new Index Commodities are then calculated.
On all days that are not monthly index roll days, the notional holdings of each Index Commodity future remains constant.
The Index isre-weighted on an annual basis on the sixth Index Business Day of each November.
The calculation of the Index is expressed as the weighted average return of the Index Commodities.
The Trustee
Under the Trust Agreement, Wilmington Trust Company, the trustee of the Fund (the “Trustee”), has the power and authority to execute and file certificates as required by the Delaware Statutory Trust Act and to accept service of process on the Fund in the State of Delaware. The Managing Owner has the exclusive management and control of all aspects of the business of the Fund. The Trustee will serve in that capacity until such time as the Managing Owner removes the Trustee or the Trustee resigns and a successor is appointed by the Managing Owner. The Trustee will have no duty or liability to supervise or monitor the performance of the Managing Owner, nor will the Trustee have any liability for the acts or omissions of the Managing Owner.
The Managing Owner
The Managing Owner was formed on February 7, 2003. The Managing Owner is an affiliate of Invesco Ltd. The Managing Owner was formed to be the managing owner of investment vehicles such as ETFs and has been managingnon-commodity futures
3
based ETFs since 2003 and a commodity futures based ETF since 2014. The Managing Owner serves as the commodity pool operator and commodity trading advisor of the Fund. The Managing Owner is registered as a commodity pool operator and commodity trading advisor with the CFTC and is a member of, and approved as a swap firm by, the National Futures Association (the “NFA”). As a registered commodity pool operator and commodity trading advisor, with respect to the Fund, the Managing Owner must comply with various regulatory requirements under the Commodity Exchange Act of 1936, as amended (the “Commodity Exchange Act”) and the rules and regulations of the CFTC and the NFA, including investor protection requirements, antifraud prohibitions, disclosure requirements, and reporting and recordkeeping requirements. The Managing Owner also is subject to periodic inspections and audits by the CFTC and NFA.
The Managing Owner’s main business offices are located at 3500 Lacey Road, Suite 700, Downers Grove, Illinois 60515, and its telephone number is(800) 983-0903.
The Fund pays the Managing Owner the Management Fee, monthly in arrears, in an amount equal to 0.75% per annum of the daily net asset value (“NAV”) of the Fund.
The Fund may, for margin and/or cash management purposes, invest in money market mutual funds and/orT-Bill ETFs that are managed by affiliates of the Managing Owner. The indirect portion of the management fee that the Fund may incur through such investment is in addition to the Management Fee paid to the Managing Owner. The Managing Owner has contractually agreed to waive indefinitely the fees that it receives in an amount equal to the indirect management fees that the Fund incurs through its investments in affiliated money market mutual funds and/or affiliatedT-Bill ETFs. The Managing Owner may terminate this fee waiver on 60 days notice.
Pursuant to the Trust Agreement, the Fund will indemnify the Managing Owner against any losses, judgments, liabilities, expenses and amounts paid in settlement of any claims sustained by it in connection with its activities on behalf of the Fund incurred, except for any expenses resulting from gross negligence or willful misconduct.
The Commodity Broker
Morgan Stanley & Co. LLC, a Delaware limited liability company, serves as the Fund’s futures clearing broker (the “Commodity Broker”). The Commodity Broker is registered with the CFTC as a futures commission merchant and is a member of the NFA in such capacity.
A variety of executing brokers execute futures transactions on behalf of the Fund. Such executing brokersgive-up all such transactions to the Commodity Broker. In its capacity as clearing broker, the Commodity Broker may execute or receive transactions executed by others and clears all of the Fund’s futures transactions and performs certain administrative and custodial services for the Fund. The Commodity Broker is responsible, among other things, for providing periodic accountings of all dealings and actions taken by the Fund during the reporting period, together with an accounting of all securities, cash or other indebtedness or obligations held by it or its nominees for or on behalf of the Fund.
The Fund pays the Commodity Broker all brokerage commissions, including applicable exchange fees, NFA fees,give-up fees, pit brokerage fees and other transaction related fees and expenses charged in connection with trading activities. The Commodity Broker’s brokerage commissions and trading fees are determined on acontract-by-contract basis. Brokerage commissions and fees in any future fiscal year or any part of any future fiscal year may be greater than fees incurred in prior fiscal years. On average, total charges paid to the Commodity Broker were less than $19.00, $19.00 and $19.00 per round-turn trade1 for the years ended December 31, 2018, 2017 and 2016, respectively.
| 1 | A round-turn trade is a completed transaction involving both a purchase and a liquidating sale, or a sale followed by a covering purchase. |
The Administrator, Custodian and Transfer Agent
The Bank of New York Mellon (the “Administrator”, “Custodian” and “Transfer Agent”) is the administrator, custodian and transfer agent of the Fund. The Fund and the Administrator have entered into separate administrative, custodian, transfer agency and service agreements (collectively referred to as the “Administration Agreement”).
The Bank of New York Mellon, a banking corporation organized under the laws of the State of New York with trust powers, has an office at 2 Hanson Place, Brooklyn, New York, 11217. The Bank of New York Mellon is subject to supervision by the New York State Department of Financial Services and the Board of Governors of the Federal Reserve System.
Pursuant to the Administration Agreement, the Administrator performs or supervises the performance of services necessary for the operation and administration of the Fund (other than making investment decisions), including receiving and processing orders from Authorized Participants to create and redeem Baskets, NAV calculations, accounting and other fund administrative services. The Administrator maintains certain financial books and records, including: Basket creation and redemption records; fund accounting records; ledgers with respect to assets, liabilities, capital, income and expenses; the registrar, transfer journals and related details; and trading and related documents received from the Commodity Broker. The Managing Owner pays the Administrator administrative services fees out of the Management Fee.
4
The Distributor
Invesco Distributors, Inc. is the Fund’s distributor (the “Distributor”). Pursuant to the Distribution Services Agreement among the Managing Owner, the Fund and the Distributor, the Distributor assists the Managing Owner and the Administrator with certain functions and duties relating to distribution and marketing services to the Fund including reviewing and approving marketing materials. Prior to June 20, 2016, ALPS Distributors, Inc. provided distribution services to the Fund.
The Distribution Services Agreement is terminable without penalty on sixty days written notice by the Managing Owner or by the Distributor. The Distribution Services Agreement will automatically terminate in the event of its assignment.
Pursuant to the Distribution Services Agreement, the Fund will indemnify and hold harmless the Distributor and each of its directors and officers and each person, if any, who controls the Distributor within the meaning of Section 15 of the Securities Act, against any loss, liability, claim, damages or expenses (including the reasonable cost of investigating or defending any alleged loss, liability, claim, damages or expense and reasonable counsel fees incurred in connection therewith) arising by reason of any person acquiring any Shares, based upon the ground that the registration statement, prospectus, statement of additional information, shareholder reports or other information filed or made public by the Fund (as fromtime-to-time amended) included an untrue statement of a material fact or omitted a material fact required to be stated or necessary in order to make the statements therein not misleading under the Securities Act or any other statute or the common law.
The Managing Owner pays the Distributor a distribution fee out of the Management Fee.
Index Sponsor
The Managing Owner, on behalf of the Fund, has appointed Deutsche Investment Management Americas Inc. to serve as the index sponsor (the “Index Sponsor”). The Index Sponsor calculates and publishes the daily index levels and the indicative intraday index levels. Additionally, the Index Sponsor also calculates the indicative value per Share of the Fund throughout each business day.
The Managing Owner pays the Index Sponsor a licensing fee and an index services fee out of the Management Fee for performing its duties.
Marketing Agent
The Managing Owner, on behalf of the Fund, has appointed Deutsche Investment Management Americas Inc. as the marketing agent (the “Marketing Agent”) to assist the Managing Owner by providing support to educate institutional investors about the DBIQ indices and to complete governmental or institutional due diligence questionnaires or requests for proposals related to the DBIQ indices.
The Managing Owner pays the Marketing Agent a marketing services fee out of the Management Fee.
The Marketing Agent will not open or maintain customer accounts or handle orders for the Fund. The Marketing Agent has no responsibility for the performance of the Fund or the decisions made or actions taken by the Managing Owner.
Tax Reporting
The Fund has retained the services of PricewaterhouseCoopers LLP to assist with certain tax reporting requirements of the Fund and its Shareholders.
Regulation
Futures exchanges in the United States are subject to regulation under the Commodity Exchange Act by the CFTC, the governmental agency having responsibility for regulation of futures exchanges and trading on those exchanges.
The Commodity Exchange Act and the CFTC also regulate the activities of “commodity trading advisors” and “commodity pool operators” and the CFTC has adopted regulations with respect to certain of such persons’ activities. Pursuant to its authority, the CFTC requires a commodity pool operator (such as the Managing Owner) to keep accurate, current and orderly records with respect to each pool it operates. The CFTC may suspend the registration of a commodity pool operator if the CFTC finds that the operator has violated the Commodity Exchange Act or regulations thereunder and in certain other circumstances. Suspension, restriction or termination of the Managing Owner’s registration as a commodity pool operator would prevent it, until such time (if any) as such registration were to be reinstated, from managing, and might result in the termination of, the Fund. The Commodity Exchange Act gives the CFTC similar authority with respect to the activities of commodity trading advisors, such as the Managing Owner. If the registration of a managing owner as a commodity trading advisor were to be terminated, restricted or suspended, the managing owner would be unable, until such time (if any) as such registration were to be reinstated, to render trading advice to the Fund. The Fund is not registered with the CFTC in any capacity.
5
The Commodity Exchange Act requires all “futures commission merchants,” such as the Commodity Broker, to meet and maintain specified fitness and financial requirements, to segregate customer funds from proprietary funds and account separately for all customers’ funds and positions, and to maintain specified books and records open to inspection by the staff of the CFTC.
The Commodity Exchange Act also gives the states certain powers to enforce its provisions and the regulations of the CFTC.
Shareholders are afforded certain rights for reparations under the Commodity Exchange Act. Shareholders may also be able to maintain a private right of action for certain violations of the Commodity Exchange Act. The CFTC has adopted rules implementing the reparation provisions of the Commodity Exchange Act which provide that any person may file a complaint for a reparations award with the CFTC for violation of the Commodity Exchange Act against a floor broker, futures commission merchant, introducing broker, commodity trading advisor, commodity pool operator, and their respective associated persons.
Pursuant to authority in the Commodity Exchange Act, the NFA was formed and registered with the CFTC as a “registered futures association.” At the present time, the NFA is the onlynon-exchange self-regulatory organization for derivatives professionals. NFA members are subject to NFA standards relating to fair trade practices, market integrity, and consumer protection. As the self-regulatory body of the derivatives industry, the NFA promulgates rules governing the conduct of derivatives professionals and disciplines those professionals who do not comply with such standards. The CFTC has delegated to the NFA responsibility for the registration of commodity trading advisors, commodity pool operators, futures commission merchants, introducing brokers, and swap dealers, among others, and their respective associated persons, as applicable, and floor brokers. The Commodity Broker and the Managing Owner are members of the NFA (the Fund is not required to become a member of the NFA).
The CFTC has no authority to regulate trading on foreign futures exchanges and markets but permits direct access to such markets from the United States with respect to foreign boards of trade that are registered as such with the CFTC.
Employees
The Fund has no employees.
Available Information
The Fund files with or submits to the SEC annual, quarterly and current reports and other information meeting the informational requirements of the Exchange Act. These reports are available on the Managing Owner’s website athttp://www.invesco.com/ETFs. Information in the Managing Owner’s website shall not be deemed to be a part of this Report or incorporated by reference herein unless otherwise expressly stated. The SEC maintains an Internet site that contains reports, proxy and information statements and other information filed electronically by us with the SEC which are available on the SEC’s Internet site athttp://www.sec.gov.
The Fund also posts monthly performance reports and its annual report, as required by the CFTC, on the Managing Owner’s website at the address listed above.
6
| ITEM 1A. | RISK FACTORS |
An investment in Shares involves a high degree of risk. Investors should consider carefully all of the risks described below, together with the other information contained in this Annual Report on Form10-K (the “Report”) and the Fund’s Prospectus, before making a decision to invest in Shares. If any of the following risks occur, the business, financial condition and results of operations of the Fund may be adversely affected.
Market Risks
NAV May Not Always Correspond to Market Price and, as a Result, Baskets May Be Created or Redeemed at a Value that Differs from the Market Price of the Shares.
Shares may trade at, above or below their NAV. The NAV fluctuates with changes in the market value of the Fund’s assets. The trading price of Shares fluctuates in accordance with changes in the NAV, intraday changes in the value of the futures contracts and market supply and demand. The amount of the discount or premium in the trading price of the Shares relative to their NAV may be influenced bynon-concurrent trading hours between NYSE Arca (the exchange on which the Shares trade) and the exchanges on which futures contracts on the Index Commodities trade. While the Shares are expected to trade on NYSE Arca until 4:00 p.m. (Eastern time), liquidity in the markets for the futures contracts on the Index Commodities are expected to be reduced whenever the principal markets for those contracts are closed. As a result, trading spreads, and the resulting premium or discount on Shares, may widen during these gaps in market trading hours.
The NYSE Arca May Halt Trading in the Shares Which Would Adversely Impact Your Ability to Sell Shares.
The Shares are listed for trading on the NYSE Arca. Trading in Shares may be halted due to market conditions or in light of certain procedures and safeguards under NYSE Arca rules. In addition, trading is subject to trading halts caused by extraordinary market volatility pursuant to “circuit breaker” rules that require trading to be halted for a specified period based on a specified market decline. If the Fund were no longer to meet the requirements necessary to maintain the listing of its Shares, the Shares would be delisted. In such a scenario, the Fund would be terminated.
The Lack of an Active Trading Market for the Shares May Result in Losses on Your Investment at the Time of Disposition of Your Shares.
Although the Shares are listed and traded on the NYSE Arca, there can be no guarantee that an active trading market for the Shares will be maintained. If you need to sell your Shares at a time when no active market for them exists, the price you receive for your Shares, assuming that you are able to sell them, likely will be lower than the price you would receive if an active market did exist.
Volatility May Cause the Total Loss of Your Investment.
Futures contracts prices have a high degree of volatility and are subject to rapid and substantial changes. Consequently, there is a risk that the value of your investment in the Fund could decrease significantly due to rapid and substantial changes in the prices of futures contracts held by the Fund. The Index’s average annual volatility since inception is 17.87%. Average annual volatility is the average of the Index’s volatility each year since its inception. Yearly volatility is the relative rate at which the price of the Index moves up and down, found by calculating the annualized standard deviation of the daily change in price for each business day in the given year.
In addition, the Fund enters sell orders with the Commodity Broker from time to time, to liquidate Index Contract positions in order to satisfy redemption requests or to pay expenses and liabilities. The Fund is subject to the risk that temporary aberrations or distortions will occur in the market for Index Contracts at the time those orders are executed. The prices received by the Fund from the liquidation of its positions could be adversely affected, which in turn could adversely affect the value of the Shares. Those aberrations or distortions may result from trading activities by other market participants or actions taken by the Commodity Broker, the CFTC, the exchanges or other regulatory authorities. If the Fund’s positions are liquidated at inopportune times or in a manner that temporarily distorts the market or otherwise causes a pricing aberration, the value of the Shares may be adversely affected.
The Fund’s Trading of Index Contracts May Adversely Affect the Price that the Fund Pays for Index Contracts.
The prices that the Fund pays for Index Contracts may be adversely affected by the trading of Index Contracts by other market participants. Transactions by other market participants may be based on their awareness of the Fund’s positions in Index Contracts. If other market participants are able to anticipate the timing of the Fund’s Index Contract transactions, for instance, they may be able to execute transactions in advance of the Fund. If that were to occur, those market participants may receive more favorable pricing for their Index Contract transactions than the Fund does for its own, subsequent Index Contract transactions. If the Fund’s Index Contract positions represent a significant part of the open long interest in those Index Contracts, moreover, other market participants may take that fact into account and trade in a manner that adversely affects the prices that the Fund obtains when trading Index Contracts. The Fund may not be able to counteract adverse pricing effects of its own positions and transactions in Index Contracts.
7
Withdrawal from Participation by Authorized Participants May Affect the Liquidity of Shares.
If one or more Authorized Participants withdraws from participation, it may become more difficult to create or redeem Baskets, which may reduce the liquidity of the Shares. If it becomes more difficult to create or redeem Baskets, the correlation between the price of the Shares and the NAV may be affected, which may affect the trading market for the Shares. Having fewer participants in the market for the Shares could also adversely affect the ability to arbitrage any price difference between the futures contracts and the Shares, which may also affect the trading market and liquidity of the Shares.
Possible Illiquid Markets May Exacerbate Losses.
Futures positions cannot always be liquidated at the desired price. It is difficult to execute a trade at a specific price when there is a relatively small volume of buy and sell orders in a market. A market disruption, such as when foreign governments may take or be subject to political actions which disrupt the markets in their currencies or major commodities exports, can also make it difficult to liquidate a position.
Illiquidity may cause losses for the Fund. The large size of the positions which the Fund may acquire increases the risk of illiquidity by both making its positions more difficult to liquidate and increasing the losses incurred while trying to do so.
Trading on Futures Exchanges Outside the United States Is Not Subject to U.S. Regulation.
Trading on futures exchanges located outside the United States is not regulated by any United States governmental agency and may involve certain risks not applicable to trading on U.S. exchanges, including different or diminished investor protections. If the Fund trades contracts denominated in currencies other than U.S. dollars, the Fund will be exposed to the risk of adverse exchange-rate movements between the dollar and the currencies in which those contracts are denominated.
In addition, trading onnon-U.S. exchanges is subject to the risks presented by exchange controls, expropriation, increased tax burdens and exposure to local economic declines and political instability, among other factors. An adverse development with respect to any of these factors could reduce the profit or increase the loss earned on the Fund’s trades onnon-U.S. exchanges.
The Effect of Market Disruptions and Government Interventions Are Unpredictable and May Have an Adverse Effect on the Value of Your Shares.
The commodity futures markets may be subject to temporary distortions due to various factors, including lack of liquidity, congestion, disorderly closing periods, manipulation and disruptive conduct, limitations on deliverable supplies, excessive speculation, government regulation and intervention, technical and operational or system failures, nuclear accidents, terrorism, riots and acts of God.
Government intervention has in certain cases been implemented on an “emergency” basis, suddenly and substantially eliminating market participants’ ability to continue to implement certain strategies or manage the risk of their outstanding positions. These interventions have typically been unclear in scope and application, resulting in confusion and uncertainty which in itself has been materially detrimental to the efficient functioning of the markets as well as previously successful investment strategies.
The financial crisis of 2008-2009 and associated regulatory changes, including the Dodd-Frank Wall Street Reform and Consumer Protection Act (the “Dodd Frank Act”) are generally considered to have contributed to less credit being available to financial market participants. This is particularly the case for credit extended by banks and other traditional lending sources. The Fund does not borrow from lenders for the purpose of pursuing its investment objective. Nonetheless, restrictions on the availability of credit may adversely affect investors who borrow to purchase Shares and participants in the markets for financial instruments in which the Fund trades, including futures markets. Limitations on the availability of credit, whether in stressed market conditions or otherwise, may have a material adverse effect on investors and financial market participants, which in turn could affect the Fund’s ability to pursue its investment objective. Among other things, fewer prospective investors may adversely affect the Fund’s asset levels, and fewer financial market participants may reduce liquidity and adversely affect pricing for the financial instruments that the Fund seeks to trade.
The Fund may incur major losses in the event of disrupted markets and other extraordinary events in which historical pricing relationships become materially distorted. The risk of loss from pricing distortions is compounded by the fact that in disrupted markets many positions become illiquid, making it difficult or impossible to close out or liquidate positions against which the markets are moving. The large size of the positions which the Fund may acquire increases the risk of illiquidity by both making its positions more difficult to liquidate and increasing the losses incurred while trying to do so.
An Investment in the Shares May Be Adversely Affected by Competition from Other Methods of Investing in Commodities.
The Fund competes with other financial vehicles, including mutual funds, and other investment companies, ETFs, other index tracking commodity pools, actively traded commodity pools, hedge funds, traditional debt and equity securities issued by companies in the commodities industry, other securities backed by or linked to commodities, and direct investments in the underlying commodities or commodity futures contracts. Market and financial conditions, and other conditions beyond the Managing Owner’s control, may make it more attractive to invest in other financial vehicles or to invest in such commodities directly, which could limit the market for the Shares and therefore reduce the liquidity of the Shares.
8
The NAV Calculation of the Fund May Be Overstated or Understated Due to the Valuation Method Employed When a Settlement Price Is Not Available on the Date of NAV Calculation.
Calculating the NAV of the Fund includes, in part, any unrealized profits or losses on open commodity futures contracts. Under normal circumstances, the NAV of the Fund reflects the settlement price of open commodity futures contracts on the date when the NAV is being calculated. However, if a settlement price for a commodity futures contract could not be determined for any reason, the Managing Owner may value the futures contract pursuant to policies the Managing Owner has adopted. In such a situation, there is a risk that the resulting calculation of the Fund’s NAV could be understated or overstated, perhaps to a significant degree.
Futures Risks
Fluctuations in the Price of Assets Held by the Fund Could Have a Materially Adverse Effect on the Value of an Investment in Shares.
The Shares are designed to reflect as closely as possible the changes, positive or negative, in the level of the Index, over time, through the Fund’s portfolio of exchange-traded futures contracts on the Index Commodities. The value of the Shares relates directly to the value of the portfolio, less the liabilities (including estimated accrued but unpaid expenses) of the Fund. The price of the Index Commodities may fluctuate widely. Several factors may affect the prices of the Index Commodities, including, but not limited to:
| • | Global supply and demand of each of the Index Commodities, which may be influenced by such factors as forward selling by the various commodities producers, purchases made by the commodities’ producers to unwind their hedge positions and production and cost levels in the major markets of each of the Index Commodities; |
| • | Domestic and foreign interest rates and investors’ expectations concerning interest rates; |
| • | Domestic and foreign inflation rates and investors’ expectations concerning inflation rates; |
| • | Investment and trading activities of mutual funds, ETFs,closed-end funds, hedge funds and commodity funds; |
| • | Weather and other environmental conditions; |
| • | Acts of God; and |
| • | Global or regional political, economic or financial events and situations. |
Fewer Representative Commodities May Result in Greater Index Volatility.
The Index Commodities are Aluminum, Zinc and Copper-Grade A. Other commodity indexes may contain a larger number of commodities than the Index. Accordingly, increased volatility in a single Index Commodity is expected to have a greater impact on the Index’s overall volatility than would likely be the case with increased volatility in a single commodity within a broader index. Because the Fund tracks the performance of the Index, your investment in the Fund will be exposed to the relatively greater impact on the Index of volatility in a single Index Commodity.
Because the Futures Contracts Have No Intrinsic Value, the Positive Performance of Your Investment Is Wholly Dependent Upon an Equal and Offsetting Loss.
Trading in futures contracts transfers the risk of future price movements from one market participant to another. For every gain in futures trading, there is an equal and offsetting loss. Accordingly, whether a futures trade is profitable for one party depends on whether the price paid, value received, or cost of delivery under the related futures contract is favorable to that party. The prices of stocks, bonds, and other assets could rise significantly and the economy as a whole could prosper while the Fund experiences losses as a result of pursuing its investment objective through trading in Index Contracts.
The Fund May Not Provide a Diversification Benefit to Investments in Other Asset Classes and May Result in Additional Losses to Your Portfolio.
Historically, commodity futures returns have tended not to be correlated with the returns of other assets such as stocks and bonds. Commodity futures contracts therefore have the potential to help diversify investor portfolios consisting of stocks and bonds, to the extent there is low or negative correlation between commodity futures contracts and other financial assets held in those portfolios. However, the fact that the Index is not inversely correlated with other assets such as stocks and bonds means that, in seeking to replicate the performance of the Index, the Fund will not necessarily be profitable during unfavorable periods for the stock or bond markets. If the Shares perform in a manner that correlates with the stock or bond markets or otherwise do not perform successfully, the Shares may not provide any diversification from losses in those markets. In such a scenario, the Shares may produce no gains to offset losses from investments in stocks, bonds, or related assets and may result in additional investment losses.
9
The Fund’s Returns from Futures Trading Will Be Affected by Market Conditions When Replacing Expiring Futures Contracts With New Futures Contracts on Index Commodities.
The Fund’s returns from futures trading are called excess return, which is the combined return based on the spot prices of Index Commodities and the roll yield from trading Index Contracts. Market conditions at the time the Fund replaces expiring Index Contracts with new Index Contracts –i.e., when Index Contracts are “rolled” – will affect the Fund’s roll yield. Those market conditions are referred to as backwardation and contango, which will generally affect the Fund’s roll yield as set forth below:
| • | Rolling in a backwardated market will tend to enhance returns from futures trading. Backwardation exists when prices are higher for contracts with shorter-term expirations than those with longer-term expirations, a condition that is typically associated with commodities that are consumed quickly instead of being put in storage. |
| • | Rolling in a contangoed market will tend to cause a drag on returns from futures trading. Contango exists when contract prices are higher in distant delivery months than in nearer delivery months, typically due to costs associated with storing a given physical commodity for a longer period. |
In seeking to track the performance of the Index, therefore, the Fund will be exposed to the effects of backwardation and contango when it rolls its positions in Index Contracts. The Index uses the Optimum YieldTM rolling methodology, which seeks to maximize the roll benefits in backwardated markets and to minimize the losses from rolling in contangoed markets. There can be no assurance that these outcomes will be obtained. The impact of backwardation and contango may also cause the Fund’s performance to vary from the returns of other price references, including the spot prices of one or more Index Commodities.
Index Risks
The Fund’s Performance May Not Always Replicate the Changes in the Levels of its Index.
Tracking the Index requires trading of the Fund’s portfolio with a view to tracking the Index over time and is dependent upon the skills of the Managing Owner and its trading principals, among other factors. It is possible that the Fund’s performance may not fully replicate the changes in closing levels of the Index due to disruptions in the markets for the relevant Index Commodities, the imposition of speculative position limits, or due to other extraordinary circumstances. The Managing Owner may determine to invest in other futures contracts if at any time it is impractical or inefficient to gain full or partial exposure to an Index Commodity through the use of Index Contracts. These other futures contracts may or may not be based on an Index Commodity. When they are not, the Managing Owner may seek to select futures contracts that it reasonably believes tend to exhibit trading prices that correlate with an Index Contract. As the Fund approaches or reaches position limits with respect to an Index Commodity, the Fund may commence investing in Index Contracts that reference other Index Commodities. In those circumstances, the Fund may also trade in futures contracts based on commodities other than Index Commodities that the Managing Owner reasonably believes tend to exhibit trading prices that correlate with an Index Contract. In addition, the Fund may not be able to replicate the changes in levels of the Index because the total return generated by the Fund is reduced by expenses and transaction costs, including those incurred in connection with the Fund’s trading activities, and increased by, as applicable, Treasury Income, Money Market Income andT-Bill ETF Income.
The Fund Is Not Actively Managed and Tracks the Index During Periods in Which the Index Is Flat or Declining as well as When the Index Is Rising.
The Fund is not actively managed on the basis of judgments relating to economic, financial and market conditions with a view to obtaining positive results under all market conditions. Instead, the Managing Owner seeks to cause the NAV to track the performance of the Index during periods in which the Index is flat or declining as well as when the Index is rising. Therefore, if positions in any one or more of the Index Commodities are declining in value, the Fund will not close out such positions, except in connection with a change in the composition or weighting of the Index.
Unusually LongPeak-to-Valley Drawdown Periods With Respect To the Index May Be Reflected in Equally LongPeak-to-Valley Drawdown Periods with Respect to the Performance of the Shares.
“Peak-to-valley drawdown” represents the cumulative percentage decline inmonth-end NAV per Share due to losses sustained during any period in which the initialmonth-end NAV per Share is not equaled or exceeded by a subsequentmonth-end NAV per Share.
Although past Index levels are not necessarily indicative of future Index levels, thepeak-to-valley drawdown periods that the Index has experienced have been unusually long and have lasted for multi-year drawdown periods.
10
Because it is expected that the Fund’s performance will track the change of its underlying Index, the Fund would experience a continuous drawdown during the period that the Index experiences such a drawdown. The value of your Shares will also decrease during such a period.
Regulatory Risks
Position Limits and Other Potential Limitations on Futures Trading May Restrict the Creation of Baskets and the Operation of the Fund.
Position Limits. CFTC and futures exchange rules impose position limits on market participants, including the Fund, trading in certain commodity futures contracts. These position limits prohibit any person from holding a position of more than a specific number of futures contracts. Generally, position limits in the physical delivery markets are set at a stricter level during the spot month, which is the month when the futures contract matures and becomes deliverable, versus the limits for any other month or for all months combined. Limits are generally applied on an aggregate basis to positions held in accounts that are subject to 10% or greater common ownership or control. There are exemptions from this general aggregation requirement.
The Index is composed of three Index Commodities, each of which are subject to position limits imposed by the rules of futures exchanges on which Index Contracts are traded. The CFTC has been seeking to amend its position limits rules for several years. In November 2013, the CFTC proposed for public comment new position limits and aggregation regulations. After a lengthy comment period on this proposal, the CFTCre-proposed, in December 2016, position limits for 25 commodity futures and options contracts, as well as for swaps that are economically equivalent to those contracts. In December 2016, the CFTC adopted rule amendments that provide exemptions from the general requirement to aggregate all positions that are held pursuant to 10% or greater common ownership or control.
The ultimate outcome of this rulemaking effort, and the resulting impact on the Fund of any final regulations that impose new or revised position limits, is unknown. It is also possible that futures exchanges may amend their existing position limits rules or adopt new requirements. In addition, the CFTC could separately implement other changes to specific position limits or to the regime as a whole. New or more restrictive position limits could reduce liquidity in the market, which would be likely to have adverse effects on the pricing of commodity futures contracts. Changes in CFTC and/or exchange-level position limits rules therefore could adversely affect the Fund’s ability to pursue its investment objective.
Position Aggregation. In general, a trader is required by CFTC or exchange rules, as applicable, to aggregate all positions in accounts as to which the trader has 10% or greater ownership or control. CFTC and exchange rules provide exemptions from this requirement. For example, a trader is not required to aggregate positions in multiple accounts that it owns or controls if that trader is able to satisfy the requirements of an exemption from aggregation of those accounts, including, where available, the independent account controller exemption.
Failure to comply with the independent account controller exemption or another exemption from the aggregation requirement could obligate the Managing Owner to aggregate positions in multiple accounts under its control, which could include the Fund and other commodity pools or accounts under the Managing Owner’s control. In such a scenario, the Fund may not be able to obtain exposure to one or more Index Contracts necessary to pursue its investment objective, or it may be required to liquidate existing Index Contract positions in order to comply with a limit. Such an outcome could adversely affect the Fund’s ability to pursue its investment objective or achieve favorable performance.
The CFTC amended its position aggregation rules in December 2016. The CFTC staff subsequently issued time-limitedno-action relief from compliance with certain requirements under the amended aggregation rules, including the general requirement to aggregate positions in the same commodity futures contracts traded pursuant to substantially identical trading strategies. Thisno-action relief expires on August 12, 2019.
Since coming into effect on January 3, 2018, Markets in Financial Instruments Directive II (“MiFID II”) requires the competent authorities of member states in the European Union (“EU”) to impose position limits on certain commodity derivatives contracts which are applicable to any person, whether or not based in the European Union. Pursuant to MiFID II, the UK’s regulatory agency, the Financial Conduct Authority (“FCA”), has established position limits applicable to aluminum, copper, lead, nickel, tin and zinc commodity derivative contracts traded on the London Metal Exchange (“LME”). LME may also impose accountability levels in certain contracts, where further directions in respect of those positions can then be required. If the Fund were to trade commodity derivatives contracts on other exchanges in the European Union, position limits may apply to such trading activity pursuant to MiFID II as implemented in the relevant national laws and regulations of member states. The United Kingdom (“UK”) will cease to be a member state of the EU on March 29, 2019.The EU and UK have agreed on a transitional period until December 31, 2020 during which the UK would remain subject to EU law and reciprocal rights of market access. However, that agreement is political and not yet legally binding. In the event the UK exits the EU without a transitional period, the UK commodity trading venues would immediately have more potential flexibility in setting position limits than is the case under MiFID II. In the event a transitional period is agreed then the status quo under MiFID II would continue until the end of that period. In addition, unless the EU agrees otherwise and subject to the possibility of such a transitional period, after the UK exits the EU any UK firm that was trading derivatives in EU markets will no longer be able to use its MiFID II passport to do so and instead would need to look to any MiFID II third country
11
regime to access the EU market or establish a MiFID II compliant EU branch or subsidiary. The potential loss of MiFID II passports byUK-based firms through which the Fund trades derivatives in EU markets could adversely affect the Fund’s ability to continue doing so absent substitute arrangements for continued access to those markets.
Accountability Levels. Exchanges may establish accountability levels applicable to futures contracts instead of position limits. An exchange may order a person who holds or controls a position in excess of a position accountability level not to further increase its position, to comply with any prospective limit that exceeds the size of the position owned or controlled, or to reduce any open position that exceeds the position accountability level if the exchange determines that such action is necessary to maintain an orderly market. Position accountability levels could adversely affect the Fund’s ability to establish and maintain positions in commodity futures contracts to which such levels apply, if the Fund were to trade in such contracts. Such an outcome could adversely affect the Fund’s ability to pursue its investment objective.
Daily Limits. U.S. futures exchanges and some foreign exchanges have regulations that limit the amount of fluctuation in futures contract prices that may occur during a single business day. These limits are generally referred to as “daily price fluctuation limits” or “daily limits,” and the maximum or minimum price of a contract on any given day as a result of these limits is referred to as a “limit price”. Once a limit price has been reached in a particular contract, it is usually the case that no trades may be made at a different price than specified in the limit. The duration of limit prices generally varies. Limit prices may have the effect of precluding the Fund from trading in a particular contract or requiring the Fund to liquidate contracts at disadvantageous times or prices. Either of those outcomes could adversely affect the Fund’s ability to pursue its investment objective.
Potential Effects of Positions Limits, Accountability Levels, and Daily Limits. The Fund is currently subject to position limits and may be subject to new and more restrictive position limits in the future. If the Fund reached a position limit or accountability level or became subject to a daily limit, its ability to issue new Baskets or reinvest income in additional commodity futures contracts may be limited to the extent these restrictions limit its ability to establish new futures positions, add to existing positions, or otherwise transact in futures. Limiting the size of the Fund, or restricting the Fund’s futures trading, under these requirements could adversely affect the Fund’s ability to pursue its investment objective.
Failure of Futures Commission Merchants or Commodity Brokers to Segregate Assets May Cause Losses for the Fund.
The Commodity Exchange Act requires a futures commission merchant to segregate all funds received from customers from such futures commission merchant’s proprietary assets. If the Commodity Broker fails to segregate customer assets as required, the assets of the Fund might not be fully protected in the event of the Commodity Broker’s bankruptcy. Furthermore, in the event of the Commodity Broker’s bankruptcy, the Fund could be limited to recovering either apro ratashare of all available funds segregated on behalf of the Commodity Broker’s combined customer accounts or the Fund may not recover any assets at all, even though certain property specifically traceable to the Fund was held by the Commodity Broker.
The Commodity Exchange Act requires an approved derivatives clearing organization to segregate all funds and other property received from a clearing member’s customers in connection with U.S. futures and options contracts from any funds held at the clearing organization to support the clearing member’s proprietary trading. Nevertheless, customer funds held at a clearing organization in connection with any futures or options contracts may be held in a commingled omnibus account, which may not identify the name of the clearing member’s individual customers. With respect to futures and options contracts, a clearing organization may use assets of anon-defaulting customer held in an omnibus account at the clearing organization to satisfy payment obligations of a defaulting customer of the clearing member to the clearing organization. In the event of a default of the clearing futures commission merchant’s other clients or the clearing futures commission merchant’s failure to extend its own funds in connection with any such default, a customer may not be able to recover the full amount of assets deposited by the clearing futures commission merchant with the clearing organization on the customer’s behalf.
In the event of a bankruptcy or insolvency of any exchange or a clearing house, the Fund could experience a loss of the funds deposited through the Commodity Broker as margin with the exchange or clearing house, a loss of any unrealized profits on its open positions on the exchange, and the loss of unrealized profits on its closed positions on the exchange.
Regulatory Changes or Actions May Alter the Operations and Profitability of the Fund.
The regulation of commodity interest transactions and markets, including under the Dodd-Frank Act, is a rapidly changing area of law and is subject to ongoing modification by governmental and judicial action. In particular, the Dodd-Frank Act has expanded the regulation of markets, market participants and financial instruments. The new regulatory regime under the Dodd-Frank Act has imposed additional compliance and legal burdens on participants in the markets for futures and other commodity interests. For example, under the Dodd-Frank Act new capital and risk requirements have been imposed on market intermediaries. Those requirements may cause the cost of trading to increase for market participants, like the Fund, that must interact with those intermediaries to carry out their trading activities. These increased costs can detract from the Fund’s performance.
12
The Fund and the Managing Owner Are Subject to Extensive Legal and Regulatory Requirements.
The Fund is subject to a comprehensive scheme of regulation under the federal commodity futures trading and securities laws, as well as futures market rules and the rules and listing standards for its Shares. The Fund and the Managing Owner could each be subject to sanctions for a failure to comply with those requirements, which could adversely affect the Fund’s financial performance and its ability to pursue its investment objective.
In addition, the Fund is subject to significant disclosure, internal control, governance, and financial reporting requirements because the Shares are publicly traded.
For example, the Fund is responsible for establishing and maintaining internal controls over financial reporting. Under this requirement, the Fund must adopt, implement and maintain an internal control system designed to provide reasonable assurance to its management regarding the preparation and fair presentation of published financial statements. The Fund is also required to adopt, implement, and maintain disclosure controls and procedures that are designed to ensure information required to be disclosed by the Fund in reports that it files or submits to the SEC is recorded, processed, summarized and reported within the time periods specified by the SEC. There is a risk that the Fund’s internal controls over financial reporting and disclosure controls and procedures could fail to work properly or otherwise fail to satisfy SEC requirements. Such a failure could result in the reporting or disclosure of incorrect information or a failure to report information on a timely basis. Such a failure could be to the disadvantage of Shareholders and could expose the Fund to penalties or otherwise adversely affect the Fund’s status under the federal securities laws and SEC regulations.
All internal control systems, no matter how well designed, have inherent limitations. Therefore, even those systems determined to be effective may provide only reasonable assurance with respect to financial statement preparation and presentation and other disclosure matters.
Current Discussions between the SEC and PricewaterhouseCoopers LLP regarding PricewaterhouseCoopers LLP’s Independence Could Have Potentially Adverse Consequences for the Fund.
PricewaterhouseCoopers LLP informed the Fund that it has identified an issue related to its independence under Rule2-01(c)(1)(ii)(A) of RegulationS-X (referred to as the Loan Rule). The Loan Rule prohibits accounting firms, such as PricewaterhouseCoopers LLP, from being deemed independent if they have certain financial relationships with their audit clients or certain affiliates of those clients. The Fund is required under various securities laws to have its financial statements audited by an independent accounting firm.
The Loan Rule specifically provides that an accounting firm would not be independent if it or certain affiliates and covered persons receive a loan from a lender that is a record or beneficial owner of more than ten percent of an audit client’s equity securities (referred to as a “more than ten percent owner”). For purposes of the Loan Rule, audit clients include the Fund as well as all registered investment companies advised by the Managing Owner and its affiliates, including other subsidiaries of the Managing Owner’s parent company, Invesco Ltd. (collectively, the “Invesco Fund Complex”). PricewaterhouseCoopers LLP informed the Fund it and certain affiliates and covered persons have relationships with lenders who hold, as record owner, more than ten percent of the shares of certain funds within the Invesco Fund Complex, which may implicate the Loan Rule.
On June 20, 2016, the SEC Staff issued a“no-action” letter to another mutual fund complex (see Fidelity Management & Research Company et al.,No-Action Letter) related to the audit independence issue described above. In that letter, the SEC confirmed that it would not recommend enforcement action against a fund that relied on audit services performed by an audit firm that was not in compliance with the Loan Rule in certain specified circumstances. On May 2, 2018, the SEC proposed amendments to the Loan Rule that, if adopted as proposed, would address many of the issues that led to issuance of theno-action letter. In connection with prior independence determinations, PricewaterhouseCoopers LLP communicated, as contemplated by theno-action letter, that it believes that it remains objective and impartial and that a reasonable investor possessing all the facts would conclude that PricewaterhouseCoopers LLP is able to exhibit the requisite objectivity and impartiality to report on the Fund’s financial statements as the independent registered public accounting firm. PricewaterhouseCoopers LLP also represented that it has complied with PCAOB Rule 3526(b)(1) and (2), which are conditions to the Funds relying on the no action letter, and affirmed that it is an independent accountant within the meaning of PCAOB Rule 3520. Therefore, the Managing Owner, the Fund and PricewaterhouseCoopers LLP concluded that PricewaterhouseCoopers LLP could continue as the Fund’s independent registered public accounting firm. The Invesco Fund Complex relied upon theno-action letter in reaching this conclusion.
If in the future the independence of PricewaterhouseCoopers LLP is called into question under the Loan Rule by circumstances that are not addressed in the SEC’sno-action letter, the Fund will need to take other action in order for the Fund’s filings with the SEC containing financial statements to be deemed compliant with applicable securities laws. Such additional actions could result in additional costs, impair the ability of the Fund to issue new shares or have other material adverse effects on the Fund. The SECno-action relief was initially set to expire eighteen (18) months from issuance but has been extended by the SEC without an expiration date, except that theno-action letter will be withdrawn upon the effectiveness of any amendments to the Loan Rule designed to address the concerns expressed in the letter.
13
Tax Risks
Shareholders Will Be Subject to Taxation on Their Allocable Share of the Fund’s Taxable Income, Whether or Not They Receive Cash Distributions.
Shareholders will be subject to U.S. federal income taxation and, in some cases, state, local, or foreign income taxation on their allocable share of the Fund’s taxable income, whether or not they receive cash distributions from the Fund. Shareholders may not receive cash distributions equal to their share of the Fund’s taxable income or even the tax liability that results from such income.
Items of Income, Gain, Loss and Deduction with Respect to Shares Could Be Reallocated if the IRS Does Not Accept the Assumptions or Conventions Used by the Fund in Allocating Such Items.
U.S. federal income tax rules applicable to partnerships are complex and often difficult to apply to publicly traded partnerships. The Fund will apply certain assumptions and conventions in an attempt to comply with applicable rules and to report items of income, gain, loss and deduction to Shareholders in a manner that reflects the Shareholders’ beneficial interest in such tax items, but these assumptions and conventions may not be in compliance with all aspects of the applicable tax requirements. It is possible that the United States Internal Revenue Service (the “IRS”) will successfully assert that the conventions and assumptions used by the Fund do not satisfy the technical requirements of the Internal Revenue Code of 1986, as amended (the “Code”) and/or the Federal Tax Regulations codified under 26 C.F.R., referred to herein as the Treasury Regulations, and could require that items of income, gain, loss and deduction be adjusted or reallocated in a manner that adversely affects one or more Shareholders.
The Fund is a partnership, which is not subject to U.S. federal income taxes. Rather, the partnership’s taxable income flows through to the owners, who are responsible for paying the applicable income taxes on the income allocated to them. For tax years beginning on or after January 1, 2018, the Fund is subject to partnership audit rules enacted as part of the Bipartisan Budget Act of 2015 (the “Centralized Partnership Audit Regime”). Under the Centralized Partnership Audit Regime, any IRS audit of the Fund would be conducted at the Fund level, and if the IRS determines an adjustment, the default rule is that the Fund would pay an “imputed underpayment” including interest and penalties, if applicable. The Fund may instead elect to make a“push-out” election, in which case the shareholders for the year that is under audit would be required to take into account the adjustments on their own personal income tax returns.
The Tax Cuts and Jobs Act (the “Tax Act”) Makes Significant Changes to U.S. Federal Income Tax Rules.
The Tax Act makes significant changes to the U.S. federal income tax rules for taxation of individuals and corporations, generally effective for taxable years beginning after December 31, 2017. Most of the changes applicable to individuals are temporary and would apply only to taxable years beginning after December 31, 2017 and before January 1, 2026. In particular for individuals, the Tax Act establishes for taxable years beginning after December 31, 2017 and before January 1, 2026 a 20% deduction for “qualified publicly traded partnership income” within the meaning of new Section 199A(e)(5) of the Code. In general, “qualified publicly traded partnership income” for this purpose is an item of income, gain, deduction or loss that is effectively connected with a United States trade or business and includable income for the year, but does not include certain investment income. It is currently not expected that the Fund’s income will be eligible for such deduction because, as discussed below, although the matter is not free from doubt, the Fund believes that the activities directly conducted by the Fund will not result in the Fund being engaged in a trade or business within the United States. Potential investors should consult their tax advisors regarding the availability of such deduction for their allocable share of the Fund’s items of income, gain, deduction and loss.
PROSPECTIVE INVESTORS ARE STRONGLY URGED TO CONSULT THEIR OWN TAX ADVISORS AND COUNSEL WITH RESPECT TO THE POSSIBLE TAX CONSEQUENCES TO THEM OF AN INVESTMENT IN THE SHARES; SUCH TAX CONSEQUENCES MAY DIFFER WITH RESPECT TO DIFFERENT INVESTORS.
Other Risks
An Insolvency Resulting From Another Series in the Trust or the Trust Itself May Have a Material Adverse Effect On the Fund.
The Fund is a series or a part of a Delaware statutory trust. Pursuant to Delaware law, the organization of the Trust provides that the assets and liabilities of the Fund are separate from the assets and liabilities of all other series of the Trust, as well as the larger Trust itself. Though such organization may, under state law, protect the assets of the Fund in an insolvency action brought by the creditors of another series of the Trust, this may be insufficient to protect the assets of the Fund from such creditors in an insolvency action in Federal court, or in a court in a foreign jurisdiction. Accordingly, an insolvency resulting from another series in the Trust or the Trust itself may have a material adverse effect on the Fund. The material risks associated with the other series have not been included in this Report
14
Disruptions in the Ability to Create and Redeem Baskets May Adversely Affect Investors.
It is generally expected that the public trading price per Share will track the NAV per Share closely over time. The relationship between the public trading price per Share and the NAV per Share depends, to a considerable degree, on the ability of Authorized Participants or their clients or customers to purchase and redeem Baskets in the ordinary course. If the process for creating or redeeming Shares is impaired for any reason, Authorized Participants and their clients or customers may not be able to purchase and redeem Baskets or, even if possible, may choose not to do so. The inability to purchase and redeem Baskets, or the partial impairment of the ability to purchase and redeem Baskets, could result in Shares trading at a premium or discount to the NAV of the Fund. Such a premium or discount could be significant, depending upon the nature or duration of the impairment.
If the Fund were to issue all Shares that have been registered, it would not be able to create new Baskets until it registered additional Shares and those additional Shares became available for sale. An inability to create new Baskets could increase the possibility that the trading price per Share would not track closely the NAV per Share. In addition, the Fund may, in its discretion, suspend the creation of Baskets. Suspension of creations may adversely affect how the Shares are traded and could cause Shares to trade at a premium or discount to the NAV of the Fund, perhaps to a significant degree.
The Shares Could Decrease in Value if Unanticipated Operational or Trading Problems Arise.
The mechanisms and procedures governing the creation, redemption and offering of the Shares have been developed specifically for the Fund. Consequently, there may be unanticipated problems with respect to the mechanics of the operations of the Fund and the trading of the Shares that could have a material adverse effect on an investment in the Shares. To the extent that unanticipated operational or trading problems arise, the Managing Owner’s past experience and qualifications may not be suitable for solving those problems.
Historical Performance of the Fund and the Index Is Not Indicative of Future Performance.
Past performance of the Fund or the Index is not necessarily indicative of future results. Therefore, past performance of the Fund or the Index should not be relied upon in deciding whether to buy Shares of the Fund.
Fees and Expenses May Deplete the Fund’s Assets if the Fund’s Investment Performance Is Not Favorable.
The Fund pays fees and expenses regardless of its investment performance. Such fees and expenses include asset-based fees of 0.75% per annum. Additional charges include brokerage fees of approximately 0.07% per annum in the aggregate and selling commissions. Selling commissions are not included in the Fund’s breakeven calculation. The sum of the Fund’s Treasury Income, Money Market Income and/orT-Bill ETF Income may not exceed its fees and expenses. If such income does not exceed its fees and expenses, in order to break even, the Fund’s futures trading activity will need to have a favorable performance that exceeds the difference between the sum of the Fund’s Treasury Income, Money Market Income and/orT-Bill ETF Income and its fees and expenses. If the Fund’s futures trading performance is not sufficiently favorable, the Fund’s expenses could deplete its assets over time. In such a scenario, the value of your Shares will decrease.
There May Be Circumstances That Could Prevent the Fund from Being Operated in a Manner Consistent with its Investment Objective.
There may be circumstances outside the control of the Managing Owner and/or the Fund that make it, for all practical purposes, impossible tore-position the Fund and/or to process a purchase or redemption order. Examples of such circumstances include: natural disasters; public service disruptions or utility problems such as those caused by fires, floods, extreme weather conditions, and power outages resulting in telephone, telecopy, and computer failures; market conditions or activities causing trading halts; systems failures involving computer or other information systems affecting the aforementioned parties, as well as DTC, or any other participant in the purchase process, and similar extraordinary events. While the Managing Owner has established and implemented a disaster recovery plan, circumstances such as those identified above may prevent the Fund from being operated in a manner consistent with its investment objective.
Redemption Orders for Baskets May Be Subject to Postponement, Suspension or Rejection Under Certain Circumstances.
The Managing Owner may, in its discretion, suspend the right of redemption or postpone the redemption order settlement date with respect to Baskets for (1) any period during which an emergency exists as a result of which the redemption distribution is not reasonably practicable, or (2) such other period as the Managing Owner determines to be necessary for the protection of the Shareholders. In addition, the Fund will reject a redemption order if the order is not in proper form as described in the participant agreement with the Authorized Participant, or if the fulfillment of the order, in the opinion of the Fund’s counsel, might be unlawful. Any such postponement, suspension or rejection could adversely affect a redeeming Authorized Participant. For example, the resulting delay may adversely affect the value of the Authorized Participant’s redemption proceeds if the NAV of the Fund declines during the period of delay. The Fund disclaims any liability for any loss or damage that may result from any such suspension or postponement.
15
Shareholders Do Not Have the Protections Associated with Ownership of Shares in an Investment Company Registered Under the Investment Company Act of 1940.
The Fund is not registered as an investment company under the Investment Company Act of 1940, as amended. Consequently, Shareholders do not have the legal and regulatory protections provided to the investors in investment companies that are registered as such.
Shareholders Do Not Have the Rights Enjoyed by Investors in Certain Other Vehicles.
The Shares have none of the statutory rights normally associated with the ownership of shares of a corporation. However, under Delaware law, a beneficial owner of a business trust (such as a Shareholder) may, under certain circumstances, institute legal action on behalf of himself and all other similarly situated beneficial owners to recover damages from a third party where a managing owner has failed or refused to institute legal action on behalf of himself and all other similarly situated beneficial owners to recover damages from a managing owner for violations of fiduciary duties, or on behalf of a business trust to recover damages from a third party where a managing owner has failed or refused to institute proceedings to recover such damages. The Shares have limited voting and distribution rights (for example, Shareholders do not have the right to elect directors and the Fund is not required to pay regular distributions, although the Fund may pay distributions in the discretion of the Managing Owner).
Various Actual and Potential Conflicts of Interest May Be Detrimental to Shareholders.
The Fund is subject to actual and potential conflicts of interest involving the Managing Owner or any of its affiliates, the Commodity Broker, including its principals and its affiliates, the Index Sponsor and Marketing Agent, and Invesco Distributors. The Managing Owner and its principals, all of whom are engaged in other investment activities, are not required to devote substantially all of their time to the business of the Fund, which also presents the potential for numerous conflicts of interest with the Fund. The Managing Owner and its principals and affiliates are engaged in a broad array of asset management and financial services activities and may engage in activities during the ordinary course of business that cause their interests or those of their other clients to conflict with those of the Fund and its Shareholders.
As a result of these and other relationships, parties involved with the Fund have a financial incentive to act in a manner other than in the best interests of the Fund and the Shareholders. For example, by investing in affiliated money market mutual funds and/orT-Bill ETFs for margin and/or cash management purposes, the Managing Owner may select affiliated money market mutual funds and/orT-Bill ETFs that may pay dividends that are lower thannon-affiliated money market mutual funds and/orT-Bill ETFs. In addition, the Managing Owner would have a conflict of interest if it sought to redeem the Fund’s interest in an affiliated money market mutual fund orT-Bill ETF in circumstances when such a redemption would be unfavorable for the affiliated fund. The Managing Owner has not established any formal procedure to resolve conflicts of interest. Consequently, investors are dependent on the good faith of the respective parties subject to such conflicts to resolve them equitably. Although the Managing Owner attempts to monitor these conflicts, it is extremely difficult, if not impossible, for the Managing Owner to ensure that these conflicts do not, in fact, result in adverse consequences to the Fund and the Shareholders.
The Fund may be subject to certain conflicts with respect to the Commodity Broker, including, but not limited to, conflicts that result from receiving greater amounts of compensation from other clients, or purchasing opposite or competing positions on behalf of third party accounts traded through the Commodity Broker.
Because the Managing Owner and Invesco Distributors are affiliates, the Managing Owner has a disincentive to replace Invesco Distributors. Furthermore, the Managing Owner did not conduct an arm’s length negotiation when it retained Invesco Distributors.
Lack of Independent Advisers Representing Investors.
The Managing Owner has consulted with counsel, accountants and other advisers regarding the operation of the Fund. No counsel has been appointed to represent you in connection with the Fund’s continuous offering of Shares. Accordingly, you should consult your own legal, tax and financial advisers about whether you should invest in the Shares.
Possibility of Termination of the Fund May Adversely Affect Your Portfolio.
It is ultimately within the discretion of the Managing Owner whether it will continue to operate and advise the Fund. The Managing Owner may withdraw from the Fund upon 120 days’ prior written notice to all Shareholders and the Trustee, which would cause the Fund to terminate unless a substitute managing owner was obtained. Shareholders owning 50% or more of the Shares have the power to terminate the Fund. If it is so exercised, investors who may wish to continue to invest in a vehicle that tracks the Fund’s Index will have to find another vehicle, and may not be able to find another vehicle that offers the same features as the Fund. See “Description of the Shares; Certain Material Terms of the Trust Agreement – Termination Events” in the Fund’s Prospectus for a summary of termination events. Such detrimental developments could cause you to liquidate your investments and upset the overall maturity and timing of your investment portfolio. If the registrations with the CFTC or memberships in the NFA of the Managing Owner or the Commodity Broker were revoked or suspended, such entity would no longer be able to provide services to the Fund.
16
Competing Claims Over Ownership of Intellectual Property Rights Related to the Fund Could Adversely Affect the Fund and an Investment in the Shares.
While the Managing Owner believes that all intellectual property rights needed to operate the Fund in the manner described in the Fund’s Prospectus are either owned by or licensed to the Managing Owner or have been obtained, third parties may allege or assert ownership of intellectual property rights which may be related to the design, structure and operations of the Fund. To the extent any claims of such ownership are brought or any proceedings are instituted to assert such claims, the issuance of any restraining orders or injunctions, the negotiation, litigation or settlement of such claims, or the ultimate disposition of such claims in a court of law may adversely affect the Fund and an investment in the Shares. For example, such actions could result in expenses or damages payable by the Fund, suspension of activities or the termination of the Fund.
The Value of the Shares Will Be Adversely Affected if the Fund Is Required to Indemnify the Trustee or the Managing Owner.
Under the Trust Agreement, the Trustee and the Managing Owner have the right to be indemnified for any liability or expense they incur, except for any expenses resulting from gross negligence or willful misconduct. That means the Managing Owner may require the assets of the Fund to be sold in order to cover losses or liability suffered by it or by the Trustee. Any sale of that kind would reduce the NAV of the Fund and, consequently, the value of the Shares.
Although the Shares Are Limited Liability Investments, Certain Circumstances such as Bankruptcy of the Fund or Indemnification of the Fund by the Shareholders Will Increase a Shareholder’s Liability.
The Shares are limited liability investments; investors may not lose more than the amount that they invest including any appreciation in their investments. However, Shareholders could be required, as a matter of bankruptcy law, to return to the estate of the Fund any distribution they received at a time when the Fund was in fact insolvent or in violation of the Trust Agreement. In addition, Shareholders agree in the Trust Agreement that they will indemnify the Fund for any harm suffered by it as a result of:
| • | Shareholders’ actions unrelated to the business of the Fund, or |
| • | taxes imposed on the Shares by the states or municipalities in which such investors reside. |
The Fund May Lose Money on Its Holdings of Money Market Mutual Funds.
The Fund may invest in government money market funds that have chosen to not rely on the ability to impose fees on shareholder redemptions, or liquidity fees, or temporarily to suspend redemption privileges, or gates, if the government money market fund’s weekly liquid assets fall below a certain threshold. Although such government money market funds seek to preserve the value of an investment at $1.00 per share, there is no guarantee that they will be able to do so. As a result, the Fund may lose money by investing in a government money market fund. An investment in a government money market fund is not insured or guaranteed by the Federal Deposit Insurance Corporation (“FDIC”) or any other government agency. The share price of a government money market fund can fall below the $1.00 share price. The Fund cannot rely on or expect a government money market fund’s adviser or its affiliates to enter into support agreements or take other actions to maintain the government money market fund’s $1.00 share price. The credit quality of a government money market fund’s holdings can change rapidly in certain markets, and the default of a single holding could have an adverse impact on the government money market fund’s share price. Due to fluctuations in interest rates, the market value of securities held by a government money market fund may vary. A government money market fund’s share price can also be negatively affected during periods of high redemption pressures and/or illiquid markets.
Due to the Increased Use of Technologies, Intentional and Unintentional Cyber Attacks Pose Operational and Information Security Risks.
With the increased use of technologies such as the Internet and the dependence on computer systems to perform necessary business functions, the Fund is susceptible to operational and information security risks. In general, cyber incidents can result from deliberate attacks or unintentional events. Cyber attacks include, but are not limited to gaining unauthorized access to digital systems for purposes of misappropriating assets or sensitive information, corrupting data, or causing operational disruption.
Cyber attacks may also be carried out in a manner that does not require gaining unauthorized access, such as causingdenial-of-service attacks on websites. Cyber security failures or breaches of the Fund’s third party service providers (including, but not limited to, the Index Sponsor, the Administrator and the Transfer Agent) or money market mutual funds andT-Bill ETFs in which the Fund invests, have the ability to cause disruptions and impact business operations, potentially resulting in financial losses, the inability of Shareholders or Authorized Participants to transact business in Shares and Baskets respectively, violations of applicable privacy and other laws, regulatory fines, penalties, reputational damage, reimbursement or other compensation costs, and/or additional compliance costs. In addition, substantial costs may be incurred in order to prevent any cyber incidents in the future. The Fund and its Shareholders could be negatively impacted as a result.
While the Managing Owner has established business continuity plans and systems reasonably designed to detect and prevent such cyber attacks from being effective, there are inherent limitations in such plans and systems. For instance, it is possible that certain existing risks have not been identified or that new risks will emerge before countervailing measures can be implemented.
17
Furthermore, the Fund cannot control, or even necessarily influence, the cyber security plans and systems put in place by the Fund’s third party service providers. Since the Fund is dependent upon third party service providers (including the Managing Owner) for substantially all of its operational needs, the Fund is subject to the risk that a cyber attack on a service provider will materially impair its normal operations even if the Fund itself is not subject to such an attack. Cyber attacks may also cause disruptions to the futures exchanges and clearinghouses through which the Fund invests in futures contracts and to the exchanges on which the Fund buys and sells shares ofT-Bill ETFs, which could result in disruptions to the Fund’s ability to pursue its investment objective, resulting in financial losses to the Fund and Shareholders.
| ITEM 1B. | UNRESOLVED STAFF COMMENTS |
None.
| ITEM 2. | PROPERTIES |
The Fund does not own or use physical properties in the conduct of its business. Its assets consist of futures contracts, cash, United States Treasury Obligations and may consist of money market mutual funds and/orT-Bill ETFs. The Managing Owner’s headquarters are located at 3500 Lacey Road, Suite 700, Downers Grove, Illinois 60515.
| ITEM 3. | LEGAL PROCEEDINGS |
None.
| ITEM 4. | MINE SAFETY DISCLOSURES |
Not applicable.
18
| ITEM 5. | MARKET FOR REGISTRANT’S COMMON EQUITY, RELATED STOCKHOLDER MATTERS AND ISSUER PURCHASES OF EQUITY SECURITIES |
Market Information
The Shares have been trading on the NYSE Arca since November 25, 2008 under the symbol “DBB.”
Holders
As of January 31, 2019, the Fund had 95 holders of record of its Shares.
Sales of Unregistered Securities and Use of Proceeds of Registered Securities
| (a) | There have been no unregistered sales of the Shares. No Shares are authorized for issuance by the Fund under equity compensation plans. |
| (b) | Not applicable |
| (c) | The following table summarizes the redemptions by Authorized Participants during the Three Months Ended December 31, 2018: |
Period of Redemption | Total Number of Shares Redeemed | Average Price Paid per Share | ||||||
October 1, 2018 to October 31, 2018 | 1,000,000 | $ | 16.49 | |||||
November 1, 2018 to November 30, 2018 | 2,000,000 | $ | 16.27 | |||||
December 1, 2018 to December 31, 2018 | 600,000 | $ | 15.71 | |||||
|
|
|
| |||||
Total | 3,600,000 | $ | 16.24 | |||||
|
|
|
| |||||
| ITEM 6. | SELECTED FINANCIAL DATA |
The following table summarizes the relevant 2018, 2017, 2016, 2015 and 2014 financial data for the Fund and should be read in conjunction with the Fund’s financial statements, and the notes and schedules related thereto, which are included in this report.
| Year Ended December 31, | ||||||||||||||||||||
| 2018 | 2017 | 2016 | 2015 | 2014 | ||||||||||||||||
Income(a) | $ | 5,335,506 | $ | 2,020,666 | $ | 465,565 | $ | 74,872 | $ | 86,176 | ||||||||||
Net investment income (loss) | $ | 2,699,091 | $ | (101,918 | ) | $ | (953,117 | ) | $ | (1,523,092 | ) | $ | (2,220,435 | ) | ||||||
Net realized and net change in unrealized gains/(losses) on United States Treasury Obligations, Affiliated Investments and Commodity Futures Contracts | $ | (65,327,824 | ) | $ | 71,255,932 | $ | 36,679,030 | $ | (56,130,471 | ) | $ | (10,108,015 | ) | |||||||
Net Income (Loss) | $ | (62,628,733 | ) | $ | 71,154,014 | $ | 35,725,913 | $ | (57,653,563 | ) | $ | (12,328,450 | ) | |||||||
Net Income (Loss) per Share | $ | (3.71 | ) | $ | 4.44 | $ | 3.08 | $ | (4.12 | ) | $ | (0.79 | ) | |||||||
Return of Capital Distributions per General Share | $ | (0.24 | ) | $ | — | $ | — | $ | — | $ | — | |||||||||
Return of Capital Distributions per Share | $ | (0.24 | ) | $ | — | $ | — | $ | — | $ | — | |||||||||
Net increase (decrease) in cash | $ | — | $ | — | $ | (4,850,927 | ) | $ | (22,513,825 | ) | $ | 2,586,018 | ||||||||
| As of December 31, | ||||||||||||||||||||
| 2018 | 2017 | 2016 | 2015 | 2014 | ||||||||||||||||
Total Assets | $ | 209,290,471 | $ | 315,009,009 | $ | 284,449,176 | $ | 126,944,288 | $ | 250,885,301 | ||||||||||
General Shares NAV | $ | 15.44 | $ | 19.39 | $ | 14.95 | $ | 11.87 | $ | 15.99 | ||||||||||
Shares NAV | $ | 15.44 | $ | 19.39 | $ | 14.95 | $ | 11.87 | $ | 15.99 | ||||||||||
| a) | Income for the year ended December 31, 2014 includes interest expense on overdraft balances. These amounts are included in Interest Expense for the years ended December 31, 2018, 2017, 2016 and 2015. |
19
Selected Quarterly Financial Data (Unaudited)
| For the Three Months Ended, | ||||||||||||||||
| March 31, 2018 | June 30, 2018 | September 30, 2018 | December 31, 2018 | |||||||||||||
Income | $ | 1,103,157 | $ | 1,346,424 | $ | 1,466,019 | $ | 1,419,906 | ||||||||
Net investment income (loss) | $ | 446,732 | $ | 723,851 | $ | 859,617 | $ | 668,891 | ||||||||
Net realized and net change in unrealized gains/(losses) on United States Treasury Obligations, Affiliated Investments and Commodity Futures Contracts | $ | (23,510,761 | ) | $ | (9,777,635 | ) | $ | (19,347,778 | ) | $ | (12,691,650 | ) | ||||
Net Income/(loss) | $ | (23,064,029 | ) | $ | (9,053,784 | ) | $ | (18,488,161 | ) | $ | (12,022,759 | ) | ||||
Increase/(decrease) in Net Asset Value | $ | 34,815,391 | $ | (42,189,011 | ) | $ | (116,762,219 | ) | $ | (29,395,629 | ) | |||||
Net Income (loss) per Share(a) | $ | (1.22 | ) | $ | (0.54 | ) | $ | (0.97 | ) | $ | (0.98 | ) | ||||
Return of Capital Distributions per General Share(a) | $ | — | $ | — | $ | — | $ | (0.24 | ) | |||||||
Return of Capital Distributions per Share(a) | $ | — | $ | — | $ | — | $ | (0.24 | ) | |||||||
| a) | The amount shown for a share outstanding for quarterly statements may not correlate with year to date amounts due to timing of subscriptions and redemptions in relation to income earned or distributed. |
| For the Three Months Ended, | ||||||||||||||||
| March 31, 2017 | June 30, 2017 | September 30, 2017 | December 31, 2017 | |||||||||||||
Income | $ | 331,449 | $ | 373,533 | $ | 546,005 | $ | 769,679 | ||||||||
Net investment income (loss) | $ | (224,851 | ) | $ | (84,806 | ) | $ | 18,164 | $ | 189,575 | ||||||
Net realized and net change in unrealized gains/(losses) on United States Treasury Obligations, Affiliated Investments and Commodity Futures Contracts | $ | 26,883,849 | $ | (3,979,574 | ) | $ | 28,062,349 | $ | 20,289,308 | |||||||
Net Income/(loss) | $ | 26,658,998 | $ | (4,064,380 | ) | $ | 28,080,513 | $ | 20,478,883 | |||||||
Increase/(decrease) in Net Asset Value | $ | (2,374,729 | ) | $ | (72,987,400 | ) | $ | 80,520,718 | $ | 24,796,783 | ||||||
Net Income (loss) per Share(a) | $ | 1.43 | $ | (0.07 | ) | $ | 1.77 | $ | 1.31 | |||||||
| a) | The amount shown for a share outstanding for quarterly statements may not correlate with year to date amounts due to timing of subscriptions and redemptions in relation to income earned or distributed. |
20
| ITEM 7. | MANAGEMENT’S DISCUSSION AND ANALYSIS OF FINANCIAL CONDITION AND RESULTS OF OPERATIONS |
This information should be read in conjunction with the financial statements and notes included in Item 8 of Part II of this Report. The discussion and analysis which follows may contain trend analysis and other forward-looking statements. See “Cautionary Statement Concerning Forward-Looking Information” above.
You should not place undue reliance on any forward-looking statements. Except as expressly required by the Federal securities laws, the Fund and the Managing Owner undertakes no obligation to publicly update or revise any forward-looking statements or the risks, uncertainties or other factors described in this Report, as a result of new information, future events or changed circumstances or for any other reason after the date of this Report.
Overview/Introduction
Invesco Capital Management LLC (“Invesco”) has served as the managing owner (the “Managing Owner”), commodity pool operator and commodity trading advisor of the Trust and the Fund since February 23, 2015. The Managing Owner is registered with the Commodity Futures Trading Commission (the “CFTC”) as a commodity pool operator and a commodity trading advisor, and it is a member firm of the National Futures Association (“NFA”).
The Fund seeks to track changes, whether positive or negative, in the level of the DBIQ Optimum Yield Industrial Metals Index Excess Return™ (the “Index”) over time, plus the excess, if any, of the sum of the Fund’s interest income from its holdings of United States Treasury Obligations (“Treasury Income”), dividends from its holdings in money market mutual funds (affiliated or otherwise) (“Money Market Income”) and dividends or distributions of capital gains from its holdings ofT-Bill ETFs (as defined below)(“T-Bill ETF Income”) over the expenses of the Fund. The Fund invests in futures contracts in an attempt to track its Index. The Index is intended to reflect the change in market value of the base metals sector. The commodities comprising the Index are aluminum, zinc and copper—Grade A (each an “Index Commodity”, and collectively, the “Index Commodities”).
The Fund may invest directly in United States Treasury Obligations. The Fund may also gain exposure to United States Treasury Obligations through investments in exchange-traded funds (“ETFs”) (affiliated or otherwise) that track indexes that measure the performance of United States Treasury Obligations with a maximum remaining maturity of up to 12 months(“T-Bill ETFs”). The Fund invests in United States Treasury Obligations, money market mutual funds andT-Bill ETFs (affiliated or otherwise), if any, for margin and/or cash management purposes.
The Fund pursues its investment objective by investing in a portfolio of exchange-traded commodity futures contracts that expire in a specific month and trade on a specific exchange (the “Index Contracts”) in the Index Commodities. The notional amounts of each Index Commodity included in the Index are broadly in proportion to historic levels of the world’s production and stocks of the Index Commodities. The Fund also holds United States Treasury Obligations andT-Bill ETFs, if any, for deposit with Morgan Stanley & Co. LLC, the Fund’s commodity broker (the “Commodity Broker”) as margin, to the extent permissible under CFTC rules and United States Treasury Obligations, cash, money market mutual funds andT-Bill ETFs (affiliated or otherwise), if any, on deposit with The Bank of New York Mellon (the “Custodian”), for cash management purposes. The aggregate notional value of the commodity futures contracts owned by the Fund is expected to approximate the aggregate net asset value (“NAV”) of the Fund, as opposed to the aggregate Index value.
The CFTC and certain futures exchanges impose position limits on futures contracts, including on Index Contracts. As the Fund approaches or reaches position limits with respect to an Index Commodity, the Fund may commence investing in Index Contracts that reference other Index Commodities. In those circumstances, the Fund may also trade in futures contracts based on commodities other than Index Commodities that the Managing Owner reasonably believes tend to exhibit trading prices that correlate with an Index Contract. In addition, the Managing Owner may determine to invest in other futures contracts if at any time it is impractical or inefficient to gain full or partial exposure to an Index Commodity through the use of Index Contracts. These other futures contracts may or may not be based on an Index Commodity. When they are not, the Managing Owner may seek to select futures contracts that it reasonably believes tend to exhibit trading prices that correlate with an Index Contract.
The Shares are intended to provide investment results that generally correspond to the changes, positive or negative, in the levels of the Index over time. The value of the Shares is expected to fluctuate in relation to changes in the value of the Fund’s portfolio. The market price of the Shares may not be identical to the NAV per Share, but these two valuations are expected to be very close.
Margin Calls
“Initial” or “original” margin is the minimum amount of funds that must be deposited by a futures trader with his commodity broker in order to initiate futures trading or to maintain an open position in futures contracts. “Maintenance” margin is the amount (generally less than initial margin) to which a trader’s account may decline before he must deliver additional margin. A margin deposit
21
is like a cash performance bond. It helps assure the futures trader’s performance of the futures contract that the trader purchases or sells. Futures contracts are customarily bought and sold on margin that represents a very small percentage (ranging upward from less than 2%) of the purchase price of the underlying commodity being traded. Because of such low margins, price fluctuations occurring in the futures markets may create profits and losses that are greater, in relation to the amount invested, than are customary in other forms of investments. The minimum amount of margin required in connection with a particular futures contract is set from time to time by the exchange on which such contract is traded, and may be modified from time to time by the exchange during the term of the contract. “Variation margin” is assessed daily to reflect changes in the value of the position.
Brokerage firms carrying accounts for traders in futures contracts may not accept lower, and generally require higher, amounts of margin as a matter of policy in order to afford further protection for themselves.
Margin requirements are computed each day by a commodity broker. When the market value of a particular open futures contract position changes to a point where the margin on deposit does not satisfy maintenance margin requirements, a margin call is made by the commodity broker. If the margin call is not met within a reasonable time, the broker may close out the Fund’s position. With respect to the Managing Owner’s trading, only the Managing Owner, and not the Fund or its Shareholders personally, will be subject to margin calls.Position Limits and/or Accountability Levels
The Fund has not reached position limits with respect to the 2018, 2017 and 2016 reporting periods.
Net Asset Value
NAV means the total assets of the Fund, including, but not limited to, all commodity futures contracts, cash and investments less total liabilities of the Fund, each determined on the basis of U.S. generally accepted accounting principles (“U.S. GAAP”), consistently applied under the accrual method of accounting. All open commodity futures contracts will be calculated at their then current market value, which will be based upon the settlement price for that particular commodity futures contract traded on the applicable primary exchange on the date with respect to which NAV is being determined. Securities for which market quotations are not readily available or became unreliable are valued at fair value as determined in good faith following procedures approved by the Managing Owner. The amount of any distribution is a liability of the Fund from the day when the distribution is declared until it is paid.
NAV per Share is the NAV of the Fund divided by the number of outstanding Shares.
Market Risk
Trading in futures contracts involves the Fund entering into contractual commitments to purchase a particular commodity at a specified date and price. The market risk associated with the Fund’s commitments to purchase commodities is limited to the gross or face amount of the contracts held.
The Fund’s exposure to market risk is also influenced by a number of factors including the volatility of interest rates and foreign currency exchange rates, the liquidity of the markets in which the contracts are traded and the relationships among the contracts held. The inherent uncertainty of the Fund’s trading as well as the development of drastic market occurrences could ultimately lead to a loss of all or substantially all of the investors’ capital.
Credit Risk
When the Fund enters into futures contracts, the Fund is exposed to credit risk that the counterparty to the contract will not meet its obligations. The counterparty for futures contracts traded on United States and on most foreign futures exchanges is the clearing house associated with the particular exchange. In general, clearing houses are backed by their corporate members who may be required to share in the financial burden resulting from the nonperformance by one of their members and, as such, is designed to disperse and mitigate the credit risk posed by any other one member. In cases where the clearing house is not backed by the clearing members (i.e., some foreign exchanges), it may be backed by a consortium of banks or other financial institutions. There can be no assurance that any counterparty, clearing member or clearinghouse will meet its obligations to the Fund.
The Commodity Broker, when acting as the Fund’s futures commission merchant in accepting orders for the purchase or sale of domestic futures contracts, is required by CFTC regulations to separately account for and segregate as belonging to the Fund all assets of the Fund relating to domestic futures trading. The Commodity Broker is not allowed to commingle such assets with other assets of the Commodity Broker. In addition, CFTC regulations also require the Commodity Broker to hold in a secure account assets of the Fund related to foreign futures trading. While the legal requirements are designed to protect the customers of futures commission merchants, a failure by the Commodity Broker to comply with those requirements would be likely to have a material adverse effect on the Fund in the event that the Commodity Broker became insolvent or suffered other financial distress.
22
Liquidity
The Fund’s entire source of capital is derived from the Fund’s offering of Shares to Authorized Participants. The Fund in turn allocates its net assets to commodity futures trading. A significant portion of the NAV is held in United States Treasury Obligations, which may be used as margin for the Fund’s trading in commodity futures contracts and United States Treasury Obligations, money market mutual funds, cash andT-Bill ETFs, if any, which may be used for cash management purposes. The percentage that United States Treasury Obligations bear to the total net assets will vary from period to period as the market values of the Fund’s commodity interests change. A portion of the Fund’s United States Treasury Obligations are held for deposit with the Commodity Broker to meet margin requirements. All remaining cash, money market mutual funds,T-Bill ETFs, if any, and United States Treasury Obligations are on deposit with the Custodian. Interest earned on the Fund’s interest-bearing funds and dividends from the Fund’s holdings of money market mutual funds are paid to the Fund. Any dividends or distributions of capital gains received from the Fund’s holdings ofT-Bill ETFs, if any, are paid to the Fund.
The Fund’s commodity futures contracts may be subject to periods of illiquidity because of market conditions, regulatory considerations or for other reasons. For example, commodity exchanges generally have the ability to limit fluctuations in certain commodity futures contract prices during a single day by regulations referred to as “daily limits.” During a single day, no trades may be executed at prices beyond the daily limit. Once the price of a particular futures contract for a particular commodity has increased or decreased by an amount equal to the daily limit, positions in the commodity futures contract can neither be taken nor liquidated unless the traders are willing to effect trades at or within the limit. Commodity futures prices have occasionally moved the daily limit for several consecutive days with little or no trading. Such market conditions could prevent the Fund from promptly liquidating its commodity futures positions.
Because the Fund trades futures contracts, its capital is at risk due to changes in the value of futures contracts (market risk) or the inability of counterparties (including the Commodity Broker and/or exchange clearinghouses) to perform under the terms of the contracts (credit risk).
On any business day, an Authorized Participant may place an order with the Transfer Agent to redeem one or more Baskets. Redemption orders must be placed by 10:00 a.m., Eastern Time. The day on which the Managing Owner receives a valid redemption order is the redemption order date. The day on which a redemption order is settled is the redemption order settlement date. As provided below, the redemption order settlement date may occur up to two business days after the redemption order date. Redemption orders are irrevocable. The redemption procedures allow Authorized Participants to redeem Baskets. Individual Shareholders may not redeem directly from the Fund. Instead, individual Shareholders may only redeem Shares in integral multiples of 200,000 and only through an Authorized Participant.
Unless otherwise agreed to by the Managing Owner and the Authorized Participant as provided in the next sentence, by placing a redemption order, an Authorized Participant agrees to deliver the Baskets to be redeemed through DTC’s book-entry system to the Fund no later than the redemption order settlement date as of 2:45 p.m., Eastern Time, on the business day immediately following the redemption order date. Upon submission of a redemption order, the Authorized Participant may request the Managing Owner to agree to a redemption order settlement date up to two business days after the redemption order date. By placing a redemption order, and prior to receipt of the redemption proceeds, an Authorized Participant’s DTC account is charged thenon-refundable transaction fee due for the redemption order.
Redemption orders may be placed either (i) through the Continuous Net Settlement (“CNS”) clearing processes of the National Securities Clearing Corporation (the “ NSCC”) (the “CNS Clearing Process”) or (ii) if outside the CNS Clearing Process, only through the facilities of The Depository Trust Company (“DTC” or the “Depository”) (the “DTC Process”), or a successor depository, and only in exchange for cash. By placing a redemption order, and prior to receipt of the redemption proceeds, an Authorized Participant’s DTC account is charged thenon-refundable transaction fee due for the redemption order and such fee is not borne by the Fund.
Capital Resources
The Fund does not have any material commitments for capital expenditures as of the end of the latest fiscal period.
The Fund is unaware of any (i) anticipated known demands, commitments or capital expenditures; (ii) material trends, favorable or unfavorable, in its capital resources; or (iii) trends or uncertainties that will have a material effect on operations.
Cash Flows
A primary cash flow activity of the Fund is to raise capital from Authorized Participants through the issuance of Shares. This cash is used to invest in United States Treasury Obligations, money market mutual funds andT-Bill ETFs, if any, and to meet margin requirements as a result of the positions taken in futures contracts to match the fluctuations of the Index the Fund is tracking.
As of the date of this Report, each of Bank of America Merrill Lynch, BMO Capital Markets Corp., BNP Paribas Securities Corp, Cantor Fitzgerald & Co., Citadel Securities LLC, Citigroup Global Markets, Credit Suisse Securities (USA) LLC, Deutsche Investment Management Americas Inc., Goldman Sachs & Co., Goldman Sachs Execution & Clearing LP, Interactive Brokers LLC,
23
Jefferies LLC, JP Morgan Securities Inc., Knight Clearing Services LLC, Merrill Lynch Professional Clearing Corp, Morgan Stanley & Co. LLC, Nomura Securities International Inc., RBC Capital Markets LLC, SG Americas Securities LLC, Timber Hill LLC, UBS Securities, Virtu Financial BD LLC and Virtu Financial Capital Markets LLC has executed a Participant Agreement and are the only Authorized Participants.
Operating Activities
Net cash flow provided by (used for) operating activities was $88.3 million, $41.2 and $(139.3) million for the years ended December 31, 2018, 2017 and 2016, respectively. These amounts primarily include net income (loss), net purchases and sales of money market mutual funds and net purchases and sales of United States Treasury Obligations and affiliated investments. The Fund invests in futures contracts in an attempt to track its Index. The Fund invests in United States Treasury Obligations, money market mutual funds andT-Bill ETFs (affiliated or otherwise), if any, for margin and/or cash management purposes only.
During the year ended December 31, 2018, $708.8 million was paid to purchase United States Treasury Obligations and $769.8 million was received from sales and maturing United States Treasury Obligations. During the year ended December 31, 2017, $747.0 million was paid to purchase United States Treasury Obligations and $757.0 million was received from sales and maturing United States Treasury Obligations. During the year ended December 31, 2016, $655.2 million was paid to purchase United States Treasury Obligations and $539.0 million was received from sales and maturing United States Treasury Obligations. $286.5 million was received from sales of affiliated investments and $268.5 million was paid to purchase affiliated investments during the year ended December 31, 2018. $411.8 million was received from sales of affiliated investments and $431.6 million was paid to purchase affiliated investments during the year ended December 31, 2017. $138.3 million was received from sales of affiliated investments and $157.6 million was paid to purchase affiliated investments during the year ended December 31, 2016. Unrealized appreciation (depreciation) on United States Treasury Obligations, affiliated investments and commodity futures contracts increased (decreased) Net cash provided by (used for) operating activities by $47.7 million, $(19.0) million and $(26.4) million during the years ended December 31, 2018, 2017 and 2016, respectively.
Financing Activities
The Fund’s net cash flow provided by (used for) financing activities was $(88.3) million, $(41.2) million and $134.4 million during the years ended December 31, 2018, 2017 and 2016, respectively. This included $137.8 million, $101.7 million and $248.1 million from the sale of Shares to Authorized Participants and $226.0 million, $142.9 million and $113.7 million from Shares redeemed by Authorized Participants during the years ended December 31, 2018, 2017 and 2016, respectively. During the year ended December 31, 2018, distributions paid to Shareholders were $2.6 million. There were no distributions paid to Shareholders during the years ended December 31, 2017 and 2016.
Results of Operations
FOR THE YEARS ENDED DECEMBER 31, 2018, 2017 AND 2016
The following graphs illustrate the percentage changes in (i) the market price of the Shares (as reflected by the line “Market”), (ii) the Fund’s NAV (as reflected by the line “NAV”), and (iii) the closing levels of the Index (as reflected by the line“DBIQ-OY Industrial Metals ER™”). Whenever the Treasury Income, Money Market Income andT-Bill ETF Income, if any, earned by the Fund exceeds Fund expenses, the price of the Shares generally exceeds the level of the Index primarily because the Share price reflects Treasury Income, Money Market Income andT-Bill ETF Income, if any, from the Fund’s collateral holdings whereas the Index does not consider such income. There can be no assurances that the price of the Shares or the Fund’s NAV will exceed the Index levels.
No representation is being made that the Index will or is likely to achieve closing levels consistent with or similar to those set forth herein. Similarly, no representation is being made that the Fund will generate profits or losses similar to the Fund’s past performance or changes in the Index closing levels.
24
COMPARISON OF MARKET, NAV ANDDBIQ-OY INDUSTRIAL METALS INDEX ER
FOR THE YEARS ENDED DECEMBER 31, 2018, 2017 AND 2016
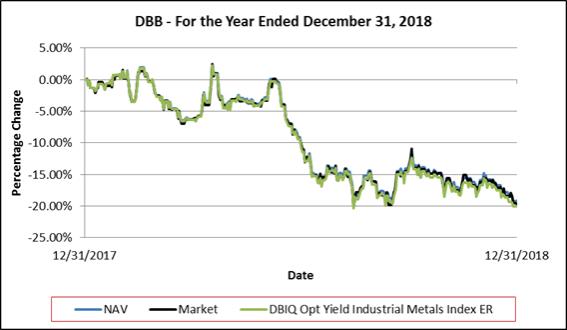
NEITHER THE PAST PERFORMANCE OF THE FUND NOR THE PRIOR INDEX LEVELS AND CHANGES, POSITIVE OR NEGATIVE, SHOULD BE TAKEN AS AN INDICATION OF THE FUND’S FUTURE PERFORMANCE.
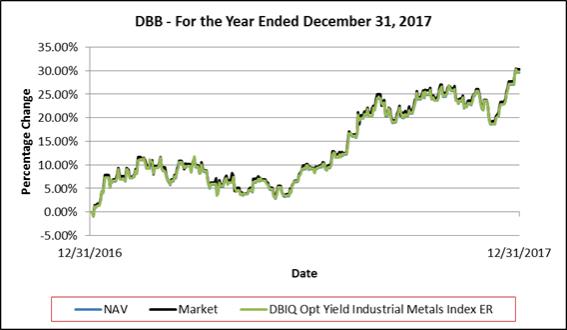
NEITHER THE PAST PERFORMANCE OF THE FUND NOR THE PRIOR INDEX LEVELS AND CHANGES, POSITIVE OR NEGATIVE, SHOULD BE TAKEN AS AN INDICATION OF THE FUND’S FUTURE PERFORMANCE.
25
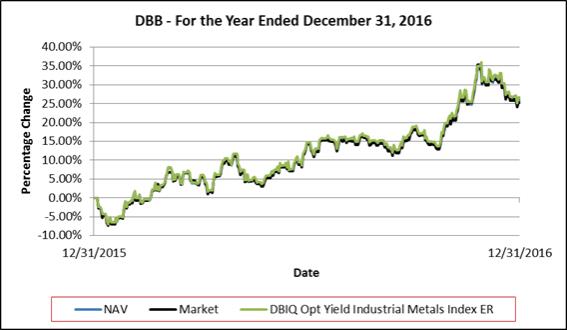
NEITHER THE PAST PERFORMANCE OF THE FUND NOR THE PRIOR INDEX LEVELS AND CHANGES, POSITIVE OR NEGATIVE, SHOULD BE TAKEN AS AN INDICATION OF THE FUND’S FUTURE PERFORMANCE.
26
Performance Summary
This Report covers the years ended December 31, 2018, 2017 and 2016.
Past performance of the Fund is not necessarily indicative of future performance.
The Index is intended to reflect the change in market value of the Index Commodities. In turn, the Index is intended to reflect the base metals sector. The DBIQ Optimum Yield Industrial Metals Index Total Return™ (the“DBIQ-OY Industrial Metals TR™”) consists of the Index plus3-month United States Treasury Obligations returns. Past results of theDBIQ-OY Industrial Metals TR™ are not necessarily indicative of future changes, positive or negative, in the closing levels of theDBIQ-OY Industrial Metals TR™.
The section “Summary of theDBIQ-OY Industrial Metals TR™ and Underlying Index Commodity Returns for the Years Ended December 31, 2018, 2017 and 2016” below provides an overview of the changes in the closing levels ofDBIQ-OY Industrial Metals TR™ by disclosing the change in market value of each underlying component Index Commodity through a “surrogate” (and analogous) index plus3-month United States Treasury Obligations returns. Please note also that the Fund’s objective is to track the Index (not theDBIQ-OY Industrial Metals TR™), and the Fund does not attempt to outperform or underperform the Index. The Index employs the optimum yield roll method with the objective of mitigating the negative effects of contango, the condition in which distant delivery prices for futures exceed spot prices, and maximizing the positive effects of backwardation, a condition opposite of contango.
Summary of theDBIQ-OY Industrial Metals TR™ and Underlying Index Commodity
Returns for the Years Ended December 31, 2018, 2017 and 2016
| AGGREGATE RETURNS FOR INDICES IN THE DBIQ-OY INDUSTRIAL METALS TR™ | ||||||||||||
| Years Ended December 31, | ||||||||||||
Underlying Index | 2018 | 2017 | 2016 | |||||||||
DB Aluminum Indices | (17.68 | )% | 32.71 | % | 8.60 | % | ||||||
DB Zinc Indices | (20.98 | ) | 28.49 | 55.62 | ||||||||
DB Copper—Grade A Indices | (17.05 | ) | 31.48 | 17.54 | ||||||||
|
|
|
|
|
| |||||||
AGGREGATE RETURN | (18.43 | )% | 30.93 | % | 27.11 | % | ||||||
|
|
|
|
|
| |||||||
If the Fund’s Treasury Income, Money Market Income andT-Bill ETF Income were to exceed the Fund’s fees and expenses, the aggregate return on an investment in the Fund would be expected to outperform the Index and underperform theDBIQ-OY Industrial Metals TR™. The only difference between (i) the Index (the “Excess Return Index”) and (ii) theDBIQ-OY Industrial Metals TR™ (the “Total Return Index”) is that the Excess Return Index does not include interest income from fixed income securities while the Total Return Index does include such a component. Thus, the difference between the Excess Return Index and the Total Return Index is attributable entirely to the interest income attributable to the fixed income securities reflected in the Total Return Index. The Total Return Index does not actually hold any fixed income securities. If the Fund’s Treasury Income, Money Market Income andT-Bill ETF Income, if any, exceeds the Fund’s fees and expenses, then the amount of such excess is expected to be distributed periodically. The market price of the Shares is expected to closely track the Excess Return Index. The aggregate return on an investment in the Fund over any period is the sum of the capital appreciation or depreciation of the Shares over the period, plus the amount of any distributions during the period. Consequently, the Fund’s aggregate return is expected to outperform the Excess Return Index by the amount of the excess, if any, of the Fund’s Treasury Income, Money Market Income andT-Bill ETF Income over its fees and expenses. As a result of the Fund’s fees and expenses, however, the aggregate return on the Fund is expected to underperform the Total Return Index. If the Fund’s fees and expenses were to exceed the Fund’s Treasury Income, Money Market Income andT-Bill ETF Income, if any, the aggregate return on an investment in the Fund is expected to underperform the Excess Return Index.
FOR THE YEARS ENDED DECEMBER 31, 2018, 2017 AND 2016
Fund Share Price Performance
For the year ended December 31, 2018, the NYSE Arca market value of each Share decreased 19.61% from $19.43 per Share to $15.38 per Share. The Share price low and high for the year ended December 31, 2018 and related change from the Share price on December 31, 2017 was as follows: Shares traded at a low of $15.38 per Share(-20.85%) on December 31, 2018, and a high of $19.90 per Share (+2.45%) on April 18, 2018. On December 31, 2018, the Fund paid a distribution of $0.24376 for each General Share and Share to holders of record as of December 26, 2018. Therefore, the total return for the Fund, on a market value basis was-19.61%.
For the year ended December 31, 2017, the NYSE Arca market value of each Share increased 30.32% from $14.91 per Share to $19.43 per Share. The Share price high and low for the year ended December 31, 2017 and related change from the Share price on December 31, 2016 was as follows: Shares traded at a low of $14.80 per Share(-0.74%) on January 3, 2017, and a high of $19.44 per Share (+30.39%) on December 28, 2017. No distributions were paid to Shareholders during the year ended December 31, 2017. Therefore, the total return for the Fund, on a market value basis was +30.32%.
27
For the year ended December 31, 2016, the NYSE Arca market value of each Share increased 25.19% from $11.91 per Share to $14.91 per Share. The Share price high and low for the year ended December 31, 2016 and related change from the Share price on December 31, 2015 was as follows: Shares traded at a low of $11.02 per Share(-7.43%) on January 12, 2016, and a high of $16.11 per Share (+35.28%) on November 25, 2016. No distributions were paid to Shareholders during the year ended December 31, 2016. Therefore, the total return for the Fund, on a market value basis was +25.19%.
Fund Share Net Asset Performance
For the year ended December 31, 2018, the NAV of each Share decreased 19.13% from $19.39 per Share to $15.44 per Share. Falling commodity futures contract prices for Copper, Zinc and Aluminum during the year ended December 31, 2018 contributed to an overall 20.02% decrease in the level of the Index and to a 18.43% decrease in the level of theDBIQ-OY Industrial Metals TR™. On December 31, 2018, the Fund paid a distribution of $0.24376 for each General Share and Share to holders of record as of December 26, 2018. Therefore, the total return for the Fund on a NAV basis was-19.13%.
Net income (loss) for the year ended December 31, 2018 was $(62.6) million, resulting from $5.3 million of income, net realized gain (loss) of $(17.6) million, net change in unrealized gain (loss) of $(47.7) million and operating expenses of $2.6 million.
For the year ended December 31, 2017, the NAV of each Share increased 29.70% from $14.95 per Share to $19.39 per Share. Rising commodity futures contract prices for Copper, Zinc and Aluminum during the year ended December 31, 2017 contributed to an overall 29.71% increase in the level of the Index and to a 30.93% increase in the level of theDBIQ-OY Industrial Metals TR™. No distributions were paid to Shareholders during the year ended December 31, 2017. Therefore, the total return for the Fund on a NAV basis was +29.70%.
Net income (loss) for the year ended December 31, 2017 was $71.2 million, resulting from $2.0 million of income, net realized gain (loss) of $52.3 million, net change in unrealized gain (loss) of $19.0 million and operating expenses of $2.1 million.
For the year ended December 31, 2016, the NAV of each Share increased 25.95% from $11.87 per Share to $14.95 per Share. Rising commodity futures contract prices for Copper, Zinc and Aluminum during the year ended December 31, 2016 contributed to an overall 27.11% increase in the level of theDBIQ-OY Industrial Metals TR™. No distributions were paid to Shareholders during the year ended December 31, 2016. Therefore, the total return for the Fund on a NAV basis was +25.95%.
Net income (loss) for the year ended December 31, 2016 was $35.7 million, resulting from $0.4 million of income, net realized gain (loss) of $10.3 million, net change in unrealized gain (loss) of $26.4 million and operating expenses of $1.4 million.
Critical Accounting Policies
The Fund’s critical accounting policies are as follows:
Preparation of the financial statements and related disclosures in conformity with U.S. GAAP requires the application of appropriate accounting rules and guidance, as well as the use of estimates, and requires management to make estimates and assumptions that affect the reported amounts of assets and liabilities, revenue and expense and related disclosure of contingent assets and liabilities during the reporting period of the financial statements and accompanying notes. The Fund’s application of these policies involves judgments and actual results may differ from the estimates used. There were no significant estimates used in the preparation of these financial statements.
Commodity futures contracts, United States Treasury Obligations,T-Bill ETFs and money market mutual funds are recorded on a trade date basis and at fair value in the financial statements, with changes in fair value, if any, reported in the Statements of Income and Expenses.
The use of fair value to measure financial instruments, with related unrealized gains or losses recognized in earnings in each period is fundamental to the Fund’s financial statements. The fair value of a financial instrument is the amount that would be received to sell an asset or paid to transfer a liability in an orderly transaction between market participants at the measurement date (the exit price).
United States Treasury Obligations are fair valued using an evaluated quote provided by an independent pricing service. Futures contracts are valued at the final settlement price set by an exchange on which they are principally traded. Investments inopen-end andclosed-end registered investment companies that do not trade on an exchange are valued at the end of day NAV per share. Investments inopen-end andclosed-end registered investment companies that trade on an exchange are valued at the last sales price or official closing price as of the close of the customary trading session on the exchange where the security is principally traded. Financial
28
Accounting Standards Board (“FASB”) Accounting Standards Codification for fair value measurement and disclosure guidance requires a fair value hierarchy that prioritizes the inputs to valuation techniques used to measure fair value. The objective of a fair value measurement is to determine the price that would be received to sell an asset or paid to transfer a liability in an orderly transaction between market participants at the measurement date (an exit price). The hierarchy gives the highest priority to unadjusted quoted prices for identical assets or liabilities (Level 1 measurements) and the lowest priority to unobservable inputs (Level 3 measurements). Assets and liabilities are classified in their entirety based on the lowest level of input that is significant to the fair value measurement. See Note 6 within the financial statements in Item 8 for further information.
Securities for which market quotations are not readily available or became unreliable are valued at fair value as determined in good faith following procedures approved by the Managing Owner. Issuer-specific events, market trends, bid/asked quotes of brokers and information providers and other data may be reviewed in the course of making a good faith determination of a security’s fair value.
Realized gains (losses) from the sale or disposition of securities or derivatives are determined on a specific identification basis and recognized in the Statements of Income and Expenses in the period in which the contract is closed or the sale or disposition occurs, respectively.
Interest income on United States Treasury Obligations is recognized on an accrual basis when earned. Premiums and discounts are amortized or accreted over the life of the United States Treasury Obligations. Dividend income (net of withholding tax, if any) is recorded on theex-dividend date.
Off-Balance Sheet Arrangements and Contractual Obligations
In the normal course of its business, the Fund is a party to financial instruments withoff-balance sheet risk. The term“off-balance sheet risk” refers to an unrecorded potential liability that, even though it does not appear on the balance sheet, may result in a future obligation or loss. The financial instruments used by the Fund are commodity futures, the values of which are based upon an underlying asset and generally represent future commitments which have a reasonable possibility to be settled in cash or through physical delivery. The financial instruments are traded on an exchange and are standardized contracts.
The Fund has not utilized, nor does it expect to utilize in the future, special purpose entities to facilitateoff-balance sheet financing arrangements and has no loan guarantee arrangements oroff-balance sheet arrangements of any kind, other than agreements entered into in the normal course of business noted above, which may include indemnification provisions related to certain risks service providers undertake in providing services to the Fund. While the Fund’s exposure under such indemnification provisions cannot be estimated, these general business indemnifications are not expected to have a material impact on the Fund’s financial position. The Managing Owner expects the risk of loss relating to indemnification to be remote.
The Fund has financial obligations to the Managing Owner and the Commodity Broker under the Trust Agreement and its agreement with the Commodity Broker (the “Commodity Broker Agreement”), respectively. Management Fee payments made to the Managing Owner, pursuant to the Trust Agreement, are calculated as a fixed percentage of the Fund’s NAV. Commission payments to the Commodity Broker, pursuant to the Commodity Broker Agreement, are on acontract-by-contract, or round-turn, basis. As such, the Managing Owner cannot anticipate the amount of payments that will be required under these arrangements for future periods as NAVs and trading activity will not be known until a future date. The Fund’s agreement with the Commodity Broker may be terminated by either party for various reasons. All Management Fees and commission payments are paid to the Managing Owner and the Commodity Broker, respectively.
| ITEM 7A. | QUANTITATIVE AND QUALITATIVE DISCLOSURES ABOUT MARKET RISK |
INTRODUCTION
The Fund is designed to replicate positions in a commodity index. The market sensitive instruments held by it are subject to the risk of trading loss. Unlike an operating company, the risk of market sensitive instruments is integral, not incidental, to the Fund’s main line of business.
Market movements can produce frequent changes in the fair market value of the Fund’s open positions and, consequently, in its earnings and cash flow. The Fund’s market risk is primarily influenced by changes in the prices of commodities.
29
Standard of Materiality
Materiality as used in this section, “Quantitative and Qualitative Disclosures About Market Risk,” is based on an assessment of reasonably possible market movements and the potential losses caused by such movements, taking into account the effects of margin, and any other multiplier features, as applicable, of the Fund’s market sensitive instruments.
QUANTIFYING THE FUND’S TRADING VALUE AT RISK
Quantitative Forward-Looking Statements
The following quantitative disclosures regarding the Fund’s market risk exposures contain “forward-looking statements” within the meaning of the safe harbor from civil liability provided for such statements by the Private Securities Litigation Reform Act of 1995 (set forth in Section 27A of the Securities Act of 1933 (the “Securities Act”) and Section 21E of the Exchange Act). All quantitative disclosures in this section are deemed to be forward-looking statements for purposes of the safe harbor, except for statements of historical fact (such as the dollar amount of maintenance margin required for market risk sensitive instruments held at the end of the reporting period).
Value at Risk (“VaR”) is a statistical measure of the value of losses that would not be expected to be exceeded over a given time horizon and at a given probability level arising from movement of underlying risk factors. Loss is measured as a decline in the fair value of the portfolio as a result of changes in any of the material variables by which fair values are determined. VaR is measured over a specified holding period (one day) and to a specified level of statistical confidence (99th percentile). However, the inherent uncertainty in the markets in which the Fund trades and the recurrence in the markets traded by the Fund of market movements far exceeding expectations could result in actual trading ornon-trading losses far beyond the indicated VaR or the Fund’s experience to date (i.e., “risk of ruin”). In light of these considerations, as well as the risks and uncertainties intrinsic to all future projections, the following VaR presentation does not constitute any assurance or representation that the Fund’s losses in any market sector will be limited to VaR.
THE FUND’S TRADING VALUE AT RISK
The Fund calculates VaR using the actual historical market movements of the Fund’s net assets.
The following table indicates the trading VaR associated with the Fund’s net assets as of December 31, 2018.
| For the Year Ended | ||||||||||||||||
| December 31, 2018 | ||||||||||||||||
Description | Net Assets | Daily Volatility | VaR* (99 Percentile) | Number of times VaR Exceeded | ||||||||||||
Invesco DB Base Metals Fund | $ | 160,559,793 | 0.84 | % | $ | 3,124,948 | 38 | |||||||||
The following table indicates the trading VaR associated with the Fund’s net assets as of December 31, 2017.
| For the Year Ended | ||||||||||||||||
| December 31, 2017 | ||||||||||||||||
Description | Net Assets | Daily Volatility | VaR* (99 Percentile) | Number of times VaR Exceeded | ||||||||||||
Invesco DB Base Metals Fund | $ | 314,091,261 | 0.79 | % | $ | 5,779,453 | 17 | |||||||||
| * | The VaR represents the one day downside risk, under normal market conditions, with a 99% confidence level. It is calculated using historical market moves of the Fund’s net assets and uses a one year look back. |
THE FUND’SNON-TRADING MARKET RISK
The Fund hasnon-trading market risk as a result of investing in short-term United States Treasury Obligations,T-Bill ETFs and money market mutual funds. The market risk represented by these investments is not expected to be material. Although the Fund purchases and sells shares ofT-Bill ETFs on an exchange, it does not establish or liquidate those positions for trading purposes.
QUALITATIVE DISCLOSURES REGARDING PRIMARY TRADING MARKET RISK EXPOSURES
The following qualitative disclosures regarding the Fund’s market risk exposures—except for those disclosures that are statements of historical fact—constitute forward-looking statements within the meaning of Section 27A of the Securities Act and Section 21E of the Exchange Act. The Fund’s primary market risk exposures are subject to numerous uncertainties, contingencies and risks. Government interventions, defaults and expropriations, illiquid markets, the emergence of dominant fundamental factors,
30
political upheavals, changes in historical price relationships, an influx of new market participants, increased regulation and many other factors could result in material losses as well as in material changes to the risk exposures of the Fund. The Fund’s current market exposure may change materially. Investors may lose all or substantially all of their investment in the Fund.
The following were the primary trading risk exposures of the Fund as of December 31, 2018:
Aluminum
The price of aluminum is volatile. The price movement of aluminum may be influenced by a variety of factors, including the level of global industrial activity and demand, especially relating to the transportation, packaging and building sectors, each of which significantly influences the demand, and in turn, the price of aluminum. Prices for aluminum are influenced by a number of factors including the level of economic activity in large aluminum consuming markets, political uncertainties, economic concerns and the rate of supply of new metal from producers. The production of aluminum is a power intensive process that requires large amounts of inexpensive power. Disruptions in the amount of energy available to aluminum producers could affect the supply of aluminum.
Zinc
The price of zinc is volatile and is affected by numerous factors. The price of zinc is primarily affected by the global demand for and supply of zinc. Demand for zinc is significantly influenced by the level of global industrial economic activity. The galvanized steel industrial sector is particularly important given that the use of zinc in the manufacture of galvanized steel accounts for approximately 50% of world-wide zinc demand. The galvanized steel sector is in turn heavily dependent on the automobile and construction sectors. An additional, but highly volatile component of demand, is adjustments to inventory in response to changes in economic activity and/or pricing levels. The supply of zinc concentrate (the raw material) has generally been dominated by China, Australia, North America and Latin America. The supply of zinc is also affected by current and previous price levels, which will influence investment decisions in new mines and smelters. It is not possible to predict the aggregate effect of all or any combination of these factors.
Copper
The price of copper is volatile. The price of copper is primarily affected by the global demand for and supply of copper. Demand for copper is significantly influenced by the level of global industrial economic activity. Industrial sectors which are particularly important include the electrical and construction sectors. In recent years demand has been supported by strong consumption from newly industrializing countries, which continue to be in a copper-intensive period of economic growth as they develop their infrastructure (such as China). An additional, but highly volatile, component of demand is adjustments to inventory in response to changes in economic activity and/or pricing levels. Apart from the United States, Canada and Australia, the majority of copper concentrate supply (the raw material) comes from outside the Organization for Economic Cooperation and Development countries. Chile is the largest producer of copper concentrate. In previous years, copper supply has been affected by strikes, financial problems, political turmoil and terrorist activity.
QUALITATIVE DISCLOSURES REGARDINGNON-TRADING MARKET RISK EXPOSURE
As noted above, the Fund hasnon-trading market risk as a result of investing in short-term United States Treasury Obligations,T-Bill ETFs and money market mutual funds. The market risk represented by these investments is not expected to be material.
QUALITATIVE DISCLOSURES REGARDING MEANS OF MANAGING RISK EXPOSURE
Under ordinary circumstances, the Managing Owner’s exercise of discretionary power is limited to determining whether the Fund will make a distribution. Under emergency or extraordinary circumstances, the Managing Owner’s use of its discretionary powers may increase. These special circumstances, for example, include the unavailability of the Index or certain natural or manmade disasters. The Managing Owner does not actively manage the Fund to avoid losses. The Fund only takes long positions in investments and does not employ “stop-loss” techniques.
31
| ITEM 8. | FINANCIAL STATEMENTS AND SUPPLEMENTARY DATA |
Index to Financial Statements
32
REPORT OF MANAGEMENT ON INTERNAL CONTROL
OVER FINANCIAL REPORTING
Management of Invesco Capital Management LLC, as managing owner (the “Managing Owner”) of Invesco DB Base Metals Fund (the “Fund”), is responsible for establishing and maintaining adequate internal control over financial reporting, as defined in Rules13a-15(f) and15d-15(f) of the Securities Exchange Act of 1934, as amended (the “Exchange Act”). Internal control over financial reporting is a process designed to provide reasonable assurance regarding the reliability of financial reporting and the preparation of financial statements for external purposes in accordance with generally accepted accounting principles.
Because of its inherent limitations, internal control over financial reporting may not prevent or detect misstatements. Also, projections of any evaluation of effectiveness to future periods are subject to the risk that controls may become inadequate because of changes in conditions, or that the degree of compliance with the policies or procedures may deteriorate.
We, Daniel Draper, Principal Executive Officer, and Kelli Gallegos, Principal Financial and Accounting Officer, Investment Pools, of the Managing Owner, assessed the effectiveness of the Fund’s internal control over financial reporting as of December 31, 2018. In making this assessment, we used the criteria set forth by the Committee of Sponsoring Organizations of the Treadway Commission (“COSO”) inInternal Control—Integrated Framework (2013). Based on our assessment and those criteria, we have concluded that the Fund maintained effective internal control over financial reporting as of December 31, 2018.
The Fund’s independent registered public accounting firm, PricewaterhouseCoopers LLP, has audited the Fund’s internal control over financial reporting as of December 31, 2018, as stated in their report on page 34 of the Fund’s Annual Report onForm 10-K.
| By: | /S/ DANIEL DRAPER | |
| Name: | Daniel Draper | |
| Title: | Principal Executive Officer of the Managing Owner | |
| By: | /S/ KELLI GALLEGOS | |
| Name: | Kelli Gallegos | |
| Title: | Principal Financial and Accounting Officer, Investment Pools of the Managing Owner | |
February 27, 2019
33
Report of Independent Registered Public Accounting Firm
To the Board of Managers of Invesco DB Multi-Sector Commodity Trust and Shareholders of Invesco DB Base Metals Fund
Opinions on the Financial Statements and Internal Control over Financial Reporting
We have audited the accompanying statements of financial condition, including the schedules of investments of Invesco DB Base Metals Fund (one of the funds constituting Invesco DB Multi-Sector Commodity Trust, hereafter referred to as the “Fund”) as of December 31, 2018 and December 31, 2017,and the related statements of income and expenses, of changes in shareholders’ equity and of cash flows for each of the three years in the period ended December 31, 2018, including the related notes (collectively referred to as the “financial statements”).We also have audited the Fund’s internal control over financial reporting as of December 31, 2018, based on criteria established inInternal Control—Integrated Framework (2013) issued by the Committee of Sponsoring Organizations of the Treadway Commission (COSO).
In our opinion, thefinancial statements referred to above present fairly, in all material respects, the financial position of the Fund as of December 31, 2018 and December 31, 2017, and the results of its operations and its cash flows for each of the three years in the period ended December 31, 2018in conformity with accounting principles generally accepted in the United States of America. Also in our opinion, the Fund maintained, in all material respects, effective internal control over financial reporting as of December 31, 2018, based on criteria established inInternal Control—Integrated Framework (2013) issued by the COSO.
Basis for Opinions
The Fund’s management is responsible for these financial statements, for maintaining effective internal control over financial reporting, and for its assessment of the effectiveness of internal control over financial reporting, included in the accompanying Report of Management on Internal Control Over Financial Reporting. Our responsibility is to express opinions on the Fund’sfinancial statements and on the Fund’s internal control over financial reporting based on our audits. We are a public accounting firm registered with the Public Company Accounting Oversight Board (United States) (“PCAOB”) and are required to be independent with respect to the Fund in accordance with the U.S. federal securities laws and the applicable rules and regulations of the Securities and Exchange Commission and the PCAOB.
We conducted our audits in accordance with the standards of the PCAOB. Those standards require that we plan and perform the audits to obtain reasonable assurance about whether thefinancial statements are free of material misstatement, whether due to error or fraud, and whether effective internal control over financial reporting was maintained in all material respects.
Our audits of thefinancial statements included performing procedures to assess the risks of material misstatement of thefinancial statements, whether due to error or fraud, and performing procedures that respond to those risks. Such procedures included examining, on a test basis, evidence regarding the amounts and disclosures in thefinancial statements. Our audits also included evaluating the accounting principles used and significant estimates made by management, as well as evaluating the overall presentation of thefinancial statements. Our audit of internal control over financial reporting included obtaining an understanding of internal control over financial reporting, assessing the risk that a material weakness exists, and testing and evaluating the design and operating effectiveness of internal control based on the assessed risk. Our audits also included performing such other procedures as we considered necessary in the circumstances. We believe that our audits provide a reasonable basis for our opinions.
Definition and Limitations of Internal Control over Financial Reporting
A fund’s internal control over financial reporting is a process designed to provide reasonable assurance regarding the reliability of financial reporting and the preparation of financial statements for external purposes in accordance with generally accepted accounting principles. A fund’s internal control over financial reporting includes those policies and procedures that (i) pertain to the maintenance of records that, in reasonable detail, accurately and fairly reflect the transactions and dispositions of the assets of the fund; (ii) provide reasonable assurance that transactions are recorded as necessary to permit preparation of financial statements in accordance with generally accepted accounting principles, and that receipts and expenditures of the fund are being made only in accordance with authorizations of management and
34
directors of the fund; and (iii) provide reasonable assurance regarding prevention or timely detection of unauthorized acquisition, use, or disposition of the fund’s assets that could have a material effect on the financial statements.
Because of its inherent limitations, internal control over financial reporting may not prevent or detect misstatements. Also, projections of any evaluation of effectiveness to future periods are subject to the risk that controls may become inadequate because of changes in conditions, or that the degree of compliance with the policies or procedures may deteriorate.
/s/ PricewaterhouseCoopers LLP
Chicago, Illinois
February 27, 2019
We have served as the Fund’s auditor since 2013.
35
Invesco DB Base Metals Fund
Statements of Financial Condition
December 31, 2018 and 2017
| December 31, | December 31, | |||||||
| 2018 | 2017 | |||||||
Assets | ||||||||
United States Treasury Obligations, at value (cost $188,137,875 and $244,424,302, respectively) | $ | 188,139,552 | $ | 244,408,079 | ||||
Affiliated Investments, at value (cost $21,111,527 and $39,110,095, respectively) | 21,121,492 | 39,094,237 | ||||||
Other investments: | ||||||||
Net unrealized appreciation on LME Commodity Futures Contracts | — | 31,489,170 | ||||||
Receivable for: | ||||||||
Dividends from affiliates | 29,427 | 17,523 | ||||||
|
|
|
| |||||
Total assets | $ | 209,290,471 | $ | 315,009,009 | ||||
|
|
|
| |||||
Liabilities | ||||||||
Other investments: | ||||||||
LME Commodity Futures Contracts payable | $ | 29,760,275 | $ | 731,031 | ||||
Net unrealized depreciation on LME Commodity Futures Contracts | 16,226,963 | — | ||||||
Payable for: | ||||||||
Due to Custodian | 2,632,618 | — | ||||||
Management fees | 106,412 | 182,156 | ||||||
Brokerage commissions and fees | 4,410 | 4,561 | ||||||
|
|
|
| |||||
Total liabilities | 48,730,678 | 917,748 | ||||||
|
|
|
| |||||
Commitments and Contingencies (Note 10) | ||||||||
Equity | ||||||||
Shareholder’s equity—General Shares | 618 | 776 | ||||||
Shareholders’ equity—Shares | 160,559,175 | 314,090,485 | ||||||
|
|
|
| |||||
Total shareholders’ equity | 160,559,793 | 314,091,261 | ||||||
|
|
|
| |||||
Total liabilities and equity | $ | 209,290,471 | $ | 315,009,009 | ||||
|
|
|
| |||||
General Shares outstanding | 40 | 40 | ||||||
Shares outstanding | 10,400,000 | 16,200,000 | ||||||
Net asset value per share | $ | 15.44 | $ | 19.39 | ||||
Market value per share | $ | 15.38 | $ | 19.43 | ||||
See accompanying Notes to Financial Statements which are an integral part of the financial statements.
36
Invesco DB Base Metals Fund
December 31, 2018
Description | Percentage of Shareholders’ Equity | Value | Principal Value | |||||||||
United States Treasury Obligations(a) | ||||||||||||
U.S. Treasury Bills, 2.175% due January 3, 2019 | 28.65 | % | $ | 45,997,132 | $ | 46,000,000 | ||||||
U.S. Treasury Bills, 2.370% due February 28, 2019(b) | 20.48 | 32,875,841 | 33,000,000 | |||||||||
U.S. Treasury Bills, 2.415% due March 28, 2019 | 13.62 | 21,877,086 | 22,000,000 | |||||||||
U.S. Treasury Bills, 2.465% due April 4, 2019(b) | 32.19 | 51,678,243 | 52,000,000 | |||||||||
U.S. Treasury Bills, 2.430% due May 2, 2019 | 22.24 | 35,711,250 | 36,000,000 | |||||||||
|
|
|
| |||||||||
Total United States Treasury Obligations (cost $188,137,875) | 117.18 | % | $ | 188,139,552 | ||||||||
|
|
|
| |||||||||
| Affiliated Investments | Shares | |||||||||||
Exchange-Traded Fund | ||||||||||||
Invesco Treasury Collateral ETF (Cost $16,006,371)(c) | 9.97 | % | $ | 16,016,336 | 151,900 | |||||||
Money Market Mutual Fund | ||||||||||||
Invesco Premier U.S. Government Money Portfolio- Institutional Class, 2.30% (cost $5,105,156)(d) | 3.18 | 5,105,156 | 5,105,156 | |||||||||
|
|
|
| |||||||||
Total Affiliated Investments (cost $21,111,527) | 13.15 | % | $ | 21,121,492 | ||||||||
|
|
|
| |||||||||
Total Investments in Securities (cost $209,249,402) | 130.33 | % | $ | 209,261,044 | ||||||||
|
|
|
| |||||||||
| (a) | Security may be traded on a discount basis. The interest rate shown represents the discount rate at the most recent auction date of the security prior to period end. |
| (b) | United States Treasury Obligations of $68,216,920 are on deposit with the Commodity Broker and held as maintenance margin for open futures contracts. |
| (c) | Affiliated company. The security and the Fund are affiliated by having the same investment adviser. See Note 8. |
| (d) | The security and the Fund are advised by wholly-owned subsidiaries of Invesco Ltd. and are therefore considered to be affiliated. The rate shown is the7-day SEC standardized yield as of December 31, 2018. |
Open Commodity Futures Contracts | Number of Contracts | Expiration Date | Notional Value | Value(e) | Unrealized Appreciation (Depreciation)(e) | |||||||||||||||
Long Futures Contracts | ||||||||||||||||||||
LME Aluminum | 1,090 | October-2019 | $ | 51,747,750 | $ | (5,847,244 | ) | $ | (5,847,244 | ) | ||||||||||
LME Copper | 362 | February-2019 | 54,008,138 | (7,786,544 | ) | (7,786,544 | ) | |||||||||||||
LME Zinc | 888 | March-2019 | 54,845,100 | (2,593,175 | ) | (2,593,175 | ) | |||||||||||||
|
|
|
| |||||||||||||||||
Total Commodity Futures Contracts | $ | (16,226,963 | ) | $ | (16,226,963 | ) | ||||||||||||||
|
|
|
| |||||||||||||||||
| (e) | Unrealized Appreciation (Depreciation) and Value are presented above, net by contract. |
See accompanying Notes to Financial Statements which are an integral part of the financial statements.
37
Invesco DB Base Metals Fund
December 31, 2017
Description | Percentage of Shareholders’ Equity | Value | Principal Value | |||||||||
United States Treasury Obligations(a) | ||||||||||||
U.S. Treasury Bills, 1.180% due January 4, 2018 | 14.01 | % | $ | 43,997,241 | $ | 44,000,000 | ||||||
U.S. Treasury Bills, 1.245% due January 18, 2018 | 14.95 | 46,974,228 | 47,000,000 | |||||||||
U.S. Treasury Bills, 1.285% due February 22, 2018 | 16.21 | 50,908,965 | 51,000,000 | |||||||||
U.S. Treasury Bills, 1.285% due March 1, 2018(b) | 13.34 | 41,914,233 | 42,000,000 | |||||||||
U.S. Treasury Bills, 1.450% due June 7, 2018 | 19.30 | 60,613,412 | 61,000,000 | |||||||||
|
|
|
| |||||||||
Total United States Treasury Obligations (cost $244,424,302) | 77.81 | % | $ | 244,408,079 | ||||||||
|
|
|
| |||||||||
| Affiliated Investments | Shares | |||||||||||
Exchange-Traded Fund | ||||||||||||
PowerShares Treasury Collateral Portfolio (Cost $16,006,371)(c) | 5.09 | % | $ | 15,990,513 | 151,900 | |||||||
Money Market Mutual Fund | ||||||||||||
Invesco Premier U.S. Government Money Portfolio- Institutional Class, 1.15% (cost $23,103,724)(d) | 7.36 | 23,103,724 | 23,103,724 | |||||||||
|
|
|
| |||||||||
Total Affiliated Investments (cost $39,110,095) | 12.45 | % | $ | 39,094,237 | ||||||||
|
|
|
| |||||||||
Total Investments in Securities (cost $283,534,397) | 90.26 | % | $ | 283,502,316 | ||||||||
|
|
|
| |||||||||
| (a) | Security may be traded on a discount basis. The interest rate shown represents the discount rate at the most recent auction date of the security prior to period end. |
| (b) | United States Treasury Obligations of $12,972,700 are on deposit with the Commodity Broker and held as maintenance margin for open futures contracts. |
| (c) | Affiliated company. The security and the Fund are affiliated by having the same investment adviser. See Note 8. |
| (d) | The security and the Fund are advised by wholly-owned subsidiaries of Invesco Ltd. and are therefore considered to be affiliated. The rate shown is the7-day SEC standardized yield as of December 31, 2017. |
Open Commodity Futures Contracts | Number of Contracts | Expiration Date | Notional Value | Value(e) | Unrealized Appreciation (Depreciation)(e) | |||||||||||||||
Long Futures Contracts | ||||||||||||||||||||
LME Aluminum | 1,860 | October-2018 | $ | 106,903,500 | $ | 6,848,032 | $ | 6,848,032 | ||||||||||||
LME Copper | 583 | February-2018 | 105,442,838 | 20,057,969 | 20,057,969 | |||||||||||||||
LME Zinc | 1,265 | January-2019 | 101,832,500 | 4,583,169 | 4,583,169 | |||||||||||||||
|
|
|
| |||||||||||||||||
Total Commodity Futures Contracts | $ | 31,489,170 | $ | 31,489,170 | ||||||||||||||||
|
|
|
| |||||||||||||||||
| (e) | Unrealized Appreciation (Depreciation) and Value are presented above, net by contract. |
See accompanying Notes to Financial Statements which are an integral part of the financial statements.
38
Invesco DB Base Metals Fund
Statements of Income and Expenses
For the Years Ended December 31, 2018, 2017 and 2016
| 2018 | 2017 | 2016 | ||||||||||
Income | ||||||||||||
Interest Income | $ | 4,816,653 | $ | 1,790,354 | $ | 448,660 | ||||||
Dividends from Affiliates | 518,853 | 230,312 | 16,905 | |||||||||
|
|
|
|
|
| |||||||
Total Income | 5,335,506 | 2,020,666 | 465,565 | |||||||||
|
|
|
|
|
| |||||||
Expenses | ||||||||||||
Management Fee | 2,055,268 | 2,075,308 | 1,211,820 | |||||||||
Brokerage Commissions and Fees | 65,733 | 90,108 | 175,794 | |||||||||
Interest Expense | 555,910 | — | 39,878 | |||||||||
|
|
|
|
|
| |||||||
Total Expenses | 2,676,911 | 2,165,416 | 1,427,492 | |||||||||
|
|
|
|
|
| |||||||
Less: Waivers | (40,496 | ) | (42,832 | ) | (8,810 | ) | ||||||
|
|
|
|
|
| |||||||
Net Expenses | 2,636,415 | 2,122,584 | 1,418,682 | |||||||||
|
|
|
|
|
| |||||||
Net Investment Income (Loss) | 2,699,091 | (101,918 | ) | (953,117 | ) | |||||||
|
|
|
|
|
| |||||||
Net Realized and Net Change in Unrealized Gain (Loss) on United States Treasury Obligations, Affiliated Investments and Commodity Futures Contracts | ||||||||||||
Net Realized Gain (Loss) on | ||||||||||||
United States Treasury Obligations | (6,892 | ) | (438 | ) | 5,903 | |||||||
Commodity Futures Contracts | (17,648,522 | ) | 52,294,017 | 10,296,432 | ||||||||
|
|
|
|
|
| |||||||
Net Realized Gain (Loss) | (17,655,414 | ) | 52,293,579 | 10,302,335 | ||||||||
|
|
|
|
|
| |||||||
Net Change in Unrealized Gain (Loss) on | ||||||||||||
United States Treasury Obligations | 17,900 | (15,054 | ) | (10,429 | ) | |||||||
Affiliated Investments | 25,823 | (15,858 | ) | — | ||||||||
Commodity Futures Contracts | (47,716,133 | ) | 18,993,265 | 26,387,124 | ||||||||
|
|
|
|
|
| |||||||
Net Change in Unrealized Gain (Loss) | (47,672,410 | ) | 18,962,353 | 26,376,695 | ||||||||
|
|
|
|
|
| |||||||
Net Realized and Net Change in Unrealized Gain (Loss) on United States Treasury Obligations, Affiliated Investments and Commodity Futures Contracts | (65,327,824 | ) | 71,255,932 | 36,679,030 | ||||||||
|
|
|
|
|
| |||||||
Net Income (Loss) | $ | (62,628,733 | ) | $ | 71,154,014 | $ | 35,725,913 | |||||
|
|
|
|
|
| |||||||
See accompanying Notes to Financial Statements which are an integral part of the financial statements.
39
Invesco DB Base Metals Fund
Statement of Changes in Shareholders’ Equity
For the Year Ended December 31, 2018
| General Shares | Shares | Total | ||||||||||||||||||
| Shares | Total Equity | Shares | Total Equity | Shareholders’ Equity | ||||||||||||||||
Balance at December 31, 2017 | 40 | $ | 776 | 16,200,000 | $ | 314,090,485 | $ | 314,091,261 | ||||||||||||
|
|
|
|
|
|
|
|
|
| |||||||||||
Purchases of Shares | 7,600,000 | 137,772,825 | 137,772,825 | |||||||||||||||||
Redemption of Shares | (13,400,000 | ) | (226,042,942 | ) | (226,042,942 | ) | ||||||||||||||
|
|
|
|
|
| |||||||||||||||
Net Increase (Decrease) due to Share Transactions | (5,800,000 | ) | (88,270,117 | ) | (88,270,117 | ) | ||||||||||||||
Return of Capital Distributions | (10 | ) | (2,632,608 | ) | (2,632,618 | ) | ||||||||||||||
Net Income (Loss) | ||||||||||||||||||||
Net Investment Income (Loss) | 10 | 2,699,081 | 2,699,091 | |||||||||||||||||
Net Realized Gain (Loss) on United States Treasury Obligations, Affiliated Investments and Commodity Futures Contracts | (45 | ) | (17,655,369 | ) | (17,655,414 | ) | ||||||||||||||
Net Change in Unrealized Gain (Loss) on United States Treasury Obligations, Affiliated Investments and Commodity Futures Contracts | (113 | ) | (47,672,297 | ) | (47,672,410 | ) | ||||||||||||||
|
|
|
|
|
| |||||||||||||||
Net Income (Loss) | (148 | ) | (62,628,585 | ) | (62,628,733 | ) | ||||||||||||||
|
|
|
|
|
|
|
|
|
| |||||||||||
Net Change in Shareholders’ Equity | — | (158 | ) | (5,800,000 | ) | (153,531,310 | ) | (153,531,468 | ) | |||||||||||
|
|
|
|
|
|
|
|
|
| |||||||||||
Balance at December 31, 2018 | 40 | $ | 618 | 10,400,000 | $ | 160,559,175 | $ | 160,559,793 | ||||||||||||
|
|
|
|
|
|
|
|
|
| |||||||||||
See accompanying Notes to Financial Statements which are an integral part of the financial statements.
40
Invesco DB Base Metals Fund
Statement of Changes in Shareholders’ Equity
For the Year Ended December 31, 2017
| General Shares | Shares | Total | ||||||||||||||||||
| Shares | Total Equity | Shares | Total Equity | Shareholders’ Equity | ||||||||||||||||
Balance at December 31, 2016 | 40 | $ | 598 | 19,000,000 | $ | 284,135,291 | $ | 284,135,889 | ||||||||||||
|
|
|
|
|
|
|
|
|
| |||||||||||
Purchases of Shares | 6,000,000 | 101,698,521 | 101,698,521 | |||||||||||||||||
Redemption of Shares | (8,800,000 | ) | (142,897,163 | ) | (142,897,163 | ) | ||||||||||||||
|
|
|
|
|
| |||||||||||||||
Net Increase (Decrease) due to Share Transactions | (2,800,000 | ) | (41,198,642 | ) | (41,198,642 | ) | ||||||||||||||
Net Income (Loss) | ||||||||||||||||||||
Net Investment Income (Loss) | — | (101,918 | ) | (101,918 | ) | |||||||||||||||
Net Realized Gain (Loss) on United States Treasury Obligations, Affiliated Investments and Commodity Futures Contracts | 131 | 52,293,448 | 52,293,579 | |||||||||||||||||
Net Change in Unrealized Gain (Loss) on United States Treasury Obligations, Affiliated Investments and Commodity Futures Contracts | 47 | 18,962,306 | 18,962,353 | |||||||||||||||||
|
|
|
|
|
| |||||||||||||||
Net Income (Loss) | 178 | 71,153,836 | 71,154,014 | |||||||||||||||||
|
|
|
|
|
|
|
|
|
| |||||||||||
Net Change in Shareholders’ Equity | — | 178 | (2,800,000 | ) | 29,955,194 | 29,955,372 | ||||||||||||||
|
|
|
|
|
|
|
|
|
| |||||||||||
Balance at December 31, 2017 | 40 | $ | 776 | 16,200,000 | $ | 314,090,485 | $ | 314,091,261 | ||||||||||||
|
|
|
|
|
|
|
|
|
| |||||||||||
See accompanying Notes to Financial Statements which are an integral part of the financial statements.
41
Invesco DB Base Metals Fund
Statement of Changes in Shareholders’ Equity
For the Year Ended December 31, 2016
| General Shares | Shares | Total | ||||||||||||||||||
| Shares | Total Equity | Shares | Total Equity | Shareholders’ Equity | ||||||||||||||||
Balance at January 1, 2016 | 40 | $ | 475 | 9,600,000 | $ | 113,982,837 | $ | 113,983,312 | ||||||||||||
|
|
|
|
|
|
|
|
|
| |||||||||||
Purchases of Shares | 18,200,000 | 248,146,420 | 248,146,420 | |||||||||||||||||
Redemption of Shares | (8,800,000 | ) | (113,719,756 | ) | (113,719,756 | ) | ||||||||||||||
|
|
|
|
|
| |||||||||||||||
Net Increase (Decrease) due to Share Transactions | 9,400,000 | 134,426,664 | 134,426,664 | |||||||||||||||||
Net Income (Loss) | ||||||||||||||||||||
Net Investment Income (Loss) | (3 | ) | (953,114 | ) | (953,117 | ) | ||||||||||||||
Net Realized Gain (Loss) on United States Treasury Obligations and Commodity Futures Contracts | 35 | 10,302,300 | 10,302,335 | |||||||||||||||||
Net Change in Unrealized Gain (Loss) on United States Treasury Obligations and Commodity Futures Contracts | 91 | 26,376,604 | 26,376,695 | |||||||||||||||||
|
|
|
|
|
| |||||||||||||||
Net Income (Loss) | 123 | 35,725,790 | 35,725,913 | |||||||||||||||||
|
|
|
|
|
|
|
|
|
| |||||||||||
Net Change in Shareholders’ Equity | — | 123 | 9,400,000 | 170,152,454 | 170,152,577 | |||||||||||||||
|
|
|
|
|
|
|
|
|
| |||||||||||
Balance at December 31, 2016 | 40 | $ | 598 | 19,000,000 | $ | 284,135,291 | $ | 284,135,889 | ||||||||||||
|
|
|
|
|
|
|
|
|
| |||||||||||
See accompanying Notes to Financial Statements which are an integral part of the financial statements.
42
Invesco DB Base Metals Fund
For the Years Ended December 31, 2018, 2017 and 2016
| 2018 | 2017 | 2016 | ||||||||||
Cash flows from operating activities: | ||||||||||||
Net Income (Loss) | $ | (62,628,733 | ) | $ | 71,154,014 | $ | 35,725,913 | |||||
Adjustments to reconcile net income (loss) to net cash provided by (used for) operating activities: | ||||||||||||
Cost of securities purchased | (708,832,519 | ) | (746,953,251 | ) | (655,227,831 | ) | ||||||
Proceeds from securities sold and matured | 769,759,157 | 756,990,870 | 538,985,029 | |||||||||
Cost of affiliated investments purchased | (268,510,956 | ) | (431,642,566 | ) | (157,619,562 | ) | ||||||
Proceeds from affiliated investments sold | 286,509,524 | 411,809,298 | 138,342,735 | |||||||||
Net accretion of discount on United States Treasury Obligations | (4,647,103 | ) | (1,789,674 | ) | (448,660 | ) | ||||||
Net realized (gain) loss on United States Treasury Obligations and Affiliated Investments | 6,892 | 438 | (5,903 | ) | ||||||||
Net change in unrealized (gain) loss on United States Treasury Obligations, Affiliated Investments and Commodity Futures Contracts | 47,672,410 | (18,962,353 | ) | (26,376,695 | ) | |||||||
Change in operating assets and liabilities: | ||||||||||||
Dividends from affiliates | (11,904 | ) | (12,595 | ) | (4,928 | ) | ||||||
LME Commodity Futures Contracts | 29,029,244 | 601,320 | (12,743,413 | ) | ||||||||
Management fees | (75,744 | ) | 3,141 | 96,170 | ||||||||
Brokerage commissions and fees | (151 | ) | — | (446 | ) | |||||||
|
|
|
|
|
| |||||||
Net cash provided by (used for) operating activities | 88,270,117 | 41,198,642 | (139,277,591 | ) | ||||||||
|
|
|
|
|
| |||||||
Cash flows from financing activities: | ||||||||||||
Distributions paid to shareholders | (2,632,618 | ) | — | — | ||||||||
Proceeds from purchases of Shares | 137,772,825 | 101,698,521 | 248,146,420 | |||||||||
Redemption of Shares | (226,042,942 | ) | (142,897,163 | ) | (113,719,756 | ) | ||||||
Increase in payable for amount due to custodian, net | 2,632,618 | — | — | |||||||||
|
|
|
|
|
| |||||||
Net cash provided by (used for) financing activities | (88,270,117 | ) | (41,198,642 | ) | 134,426,664 | |||||||
|
|
|
|
|
| |||||||
Net change in cash | — | — | (4,850,927 | ) | ||||||||
Cash at beginning of period | — | — | 4,850,927 | |||||||||
|
|
|
|
|
| |||||||
Cash at end of period | $ | — | $ | — | $ | — | ||||||
|
|
|
|
|
| |||||||
Supplemental disclosure of cash flow information | ||||||||||||
Cash paid for interest | $ | 555,910 | $ | — | $ | 39,878 | ||||||
See accompanying Notes to Financial Statements which are an integral part of the financial statements.
43
Invesco DB Base Metals Fund
December 31, 2018
Note 1 - Organization
Invesco DB Base Metals Fund (the “Fund”), a separate series of Invesco DB Multi-Sector Commodity Trust (the “Trust”), was formed as a Delaware statutory trust organized in seven separate series was formed on August 3, 2006. The term of the Fund is perpetual (unless terminated earlier in certain circumstances) as provided for in the Fifth Amended and Restated Declaration of Trust and Trust Agreement of the Fund, as amended (the “Trust Agreement”). The Fund has an unlimited number of shares authorized for issuance.
Invesco Capital Management LLC (“Invesco”) has served as the managing owner (the “Managing Owner”), commodity pool operator and commodity trading advisor of the Trust and the Fund since February 23, 2015. The Managing Owner holds 40 general shares (the “General Shares”) of the Fund. The fiscal year end of the Fund is December 31st.
The Fund seeks to track changes, whether positive or negative, in the level of the DBIQ Optimum Yield Diversified Commodity Index Excess ReturnTM (the “Index”) over time, plus the excess, if any, of the sum of the Fund’s interest income from its holdings of United States Treasury Obligations (“Treasury Income”), dividends from its holdings in money market mutual funds (affiliated or otherwise) (“Money Market Income”) and dividends or distributions of capital gains from its holdings ofT-Bill ETFs (as defined below)(“T-Bill ETF Income”) over the expenses of the Fund. The Fund invests in futures contracts in an attempt to track its Index. The Index is intended to reflect the change in market value of the commodity sector. The Index is intended to reflect the change in market value of the base metals sector. The commodities comprising the Index are aluminum, zinc and copper—Grade A (each an “Index Commodity”, and collectively, the “Index Commodities”).
The Fund may invest directly in United States Treasury Obligations. The Fund may also gain exposure to United States Treasury Obligations through investments in exchange-traded funds (“ETFs”) (affiliated or otherwise) that track indexes that measure the performance of United States Treasury Obligations with a maximum remaining maturity of up to 12 months(“T-Bill ETFs”). The Fund invests in United States Treasury Obligations, money market mutual funds andT-Bill ETFs (affiliated or otherwise), if any, for margin and/or cash management purposes.
The Commodity Futures Trading Commission (the “CFTC”) and certain futures exchanges impose position limits on futures contracts that reference Index Commodities (the “Index Contracts”). As the Fund approaches or reaches position limits with respect to an Index Commodity, the Fund may commence investing in Index Contracts that reference other Index Commodities. In those circumstances, the Fund may also trade in futures contracts based on commodities other than Index Commodities that the Managing Owner reasonably believes tend to exhibit trading prices that correlate with an Index Contract. In addition, the Managing Owner may determine to invest in other futures contracts if at any time it is impractical or inefficient to gain full or partial exposure to an Index Commodity through the use of Index Contracts. These other futures contracts may or may not be based on an Index Commodity. When they are not, the Managing Owner may seek to select futures contracts that it reasonably believes tend to exhibit trading prices that correlate with an Index Contract.
The Fund offers common units of beneficial interest (the “Shares”) only to certain eligible financial institutions (the “Authorized Participants”) in one or more blocks of 200,000 Shares (“Basket”). The Fund commenced investment operations on January 3, 2007. The Fund commenced trading on the American Stock Exchange (which became the NYSE Alternext US LLC) on January 5, 2007 and, since November 25, 2008, has been listed on the NYSE Arca, Inc. (the “NYSE Arca”).
This Annual Report (the “Annual Report”) covers the years ended December 31, 2018, 2017 and 2016. Past performance of the Fund is not necessarily indicative of future performance.
Note 2 - Summary of Significant Accounting Policies
A.Basis of Presentation
The financial statements of the Fund have been prepared using accounting principles generally accepted in the United States of America (“U.S. GAAP”).
The Fund has determined that it meets the definition of an investment company and has prepared the financial statements in conformity with U.S. GAAP for investment companies in conformity with accounting and reporting guidance of the Financial Accounting Standards Board Accounting Standards Codification Topic 946,Financial Services —Investment Companies.
B. Accounting Estimates
The preparation of financial statements in conformity with U.S. GAAP requires management to make estimates and assumptions that affect the reported amounts of assets and liabilities at the date of the financial statements and the reported amounts of revenues
44
and expenses during the reporting period. Actual results could differ from those estimates by a significant amount. In addition, the Fund monitors for material events or transactions that may occur or become known after theperiod-end date and before the date the financial statements are released to print.
C. Investment Valuations
Investments inopen-end andclosed-end registered investment companies that do not trade on an exchange are valued at theend-of-day net asset value (“NAV”) per share. Investments inopen-end andclosed-end registered investment companies that trade on an exchange are valued at the last sales price or official closing price as of the close of the customary trading session on the exchange where the security is principally traded.
United States Treasury Obligations are fair valued using an evaluated quote provided by an independent pricing service. Evaluated quotes provided by the pricing service may be determined without exclusive reliance on quoted prices, and may reflect appropriate factors such as developments related to specific securities, yield, quality, type of issue, coupon rate, maturity, individual trading characteristics and other market data. All debt obligations involve some risk of default with respect to interest and/or principal payments.
Futures contracts are valued at the final settlement price set by an exchange on which they are principally traded.
Securities for which market quotations are not readily available or became unreliable are valued at fair value as determined in good faith following procedures approved by the Managing Owner. Issuer-specific events, market trends, bid/asked quotes of brokers and information providers and other data may be reviewed in the course of making a good faith determination of a security’s fair value.
D. Investment Transactions and Investment Income
Investment transactions are accounted for on a trade date basis. Realized gains or losses from the sale or disposition of securities or derivatives are determined on a specific identification basis and recognized in the Statements of Income and Expenses in the period in which the contract is closed or the sale or disposition occurs, respectively. Interest income on United States Treasury Obligations is recognized on an accrual basis when earned. Premiums and discounts are amortized or accreted over the life of the United States Treasury Obligations. Dividend income (net of withholding tax, if any) is recorded on theex-dividend date.
E. Profit and Loss Allocations and Distributions
Pursuant to the Trust Agreement, income and expenses are allocatedpro rata to the Managing Owner as holder of the General Shares and to the Shareholders monthly based on their respective percentage interests as of the close of the last trading day of the preceding month. Distributions (other than redemption of units) may be made at the sole discretion of the Managing Owner on apro rata basis in accordance with the respective capital balances of the shareholders.
The Managing Owner has sole discretion in determining what distributions, if any, the Fund will make to shareholders. A distribution for the year ended December 31, 2018 was paid on December 31, 2018 to holders of record as of December 26, 2018 at a rate of $0.24376 for each General Share and Share for a total distribution of $10 to General Shares and $2,632,608 to Shares.
The table below shows distributions per General Share and Share and in total for the years presented:
| Years Ended December 31. | ||||||||||||
| 2018 | 2017 | 2016 | ||||||||||
Distributions per General Share | $ | 0.24376 | $ | — | $ | — | ||||||
Distributions per Share | $ | 0.24376 | $ | — | $ | — | ||||||
Distributions paid to General Shares | $ | 10 | $ | — | $ | — | ||||||
Distributions paid to Shares | $ | 2,632,608 | $ | — | $ | — | ||||||
F. Routine Operational, Administrative and Other Ordinary Expenses
The Managing Owner is responsible for all routine operational, administrative and other ordinary expenses of the Fund, including, but not limited to, computer services, the fees and expenses of the Trustee, legal and accounting fees and expenses, tax preparation expenses, filing fees and printing, mailing and duplication costs. The Fund does not reimburse the Managing Owner for the routine operational, administrative and other ordinary expenses of the Fund. Accordingly, such expenses are not reflected in the Statements of Income and Expenses of the Fund.
45
G.Non-Recurring Fees and Expenses
The Fund pays allnon-recurring and unusual fees and expenses, if any, of itself, as determined by the Managing Owner.Non-recurring and unusual fees and expenses include fees and expenses, such as legal claims and liabilities, litigation costs, indemnification expenses or othernon-routine expenses.Non-recurring and unusual fees and expenses, by their nature, are unpredictable in terms of timing and amount. For the years ended December 31, 2018, 2017 and 2016, the Fund did not incur such expenses.
H. Brokerage Commissions and Fees
The Fund incurs all brokerage commissions, including applicable exchange fees, National Futures Association (“NFA”) fees,give-up fees, pit brokerage fees and other transaction related fees and expenses charged in connection with trading activities by the Commodity Broker (as defined below). These costs are recorded as Brokerage Commissions and Fees in the Statements of Income and Expenses. The Commodity Broker’s brokerage commissions and trading fees are determined on acontract-by-contract basis. On average, total charges paid to the Commodity Broker, as applicable were less than $19.00, $19.00 and $19.00 per round-turn trade during the years ended December 31, 2018, 2017 and 2016, respectively.
I. Income Taxes
The Fund is classified as a partnership for U.S. federal income tax purposes. Accordingly, the Fund will generally not incur U.S. federal income taxes. No provision for federal, state, and local income taxes has been made in the accompanying financial statements, as investors are individually liable for income taxes, if any, on their allocable share of the Fund’s income, gain, loss, deductions and other items.
The Managing Owner has reviewed all of the Fund’s open tax years and major jurisdictions and concluded that there is no tax liability resulting from unrecognized tax benefits relating to uncertain tax positions taken or expected to be taken in future tax returns. The Fund is also not aware of any tax positions for which it is reasonably possible that the total amounts of unrecognized tax benefits will significantly change in the next twelve months. The major tax jurisdiction for the Fund and the earliest tax year subject to examination: United States, 2015.
J. Commodity Futures Contracts
The Fund utilizes derivative instruments to achieve its investment objective. A commodity futures contract is an agreement between counterparties to purchase or sell a specified underlying commodity for a specified price, or to pay or receive a cash amount based on the value of an index or other reference instrument, at a future date. Initial margin deposits required upon entering into futures contracts are satisfied by the segregation of specific securities or cash as collateral with the Commodity Broker. During the period that the commodity futures contracts are open, changes in the value of the contracts are recognized as unrealized gains or losses by recalculating the value of the contracts on a daily basis. Subsequent or variation margin payments are received or made onnon-LME commodity futures contracts depending upon whether unrealized gains or losses are incurred. These amounts are reflected as a receivable or payable on the Statements of Financial Condition. For LME contracts, subsequent or variation margin payments are not made and the value of the contracts is presented as net unrealized appreciation (depreciation) on the Statements of Financial Condition. When LME ornon-LME contracts are closed or expire, the Fund recognizes a realized gain or loss equal to the difference between the proceeds from, or cost of, the closing transaction and the Fund’s basis in the contract. Realized gains (losses) and changes in unrealized appreciation (depreciation) on open positions are determined on a specific identification basis and recognized in the Statements of Income and Expenses in the period in which the contract is closed or the changes occur, respectively.
K. Receivable/(Payable) for LME Contracts
The Fund trades aluminum, copper and zinc commodity futures contracts on the LME. For settlement of futures contracts traded on the LME, cash is not transferred until the settled futures contracts expire. As of December 31, 2018, the Fund had a payable to the Commodity Broker of $29,760,275, related to net realized losses on LME contracts, which have been closed out but for which the contract was not yet expired. As of December 31, 2017, the Fund had a payable to the Commodity Broker of $731,031, related to net realized losses on LME contracts which have been closed out but for which the contract has not yet expired.
Note 3 - Financial Instrument Risk
In the normal course of its business, the Fund is a party to financial instruments withoff-balance sheet risk. The term“off-balance sheet risk” refers to an unrecorded potential liability that, even though it does not appear on the balance sheet, may result in a future obligation or loss in excess of the amounts shown on the Statements of Financial Condition. The financial instruments used by the Fund are commodity futures contracts, the values of which are based upon an underlying asset and generally represent future commitments that have a reasonable possibility of being settled in cash or through physical delivery. The financial instruments are traded on an exchange and are standardized contracts.
Market risk is the potential for changes in the value of the financial instruments traded by the Fund due to market changes, including fluctuations in commodity prices. In entering into these futures contracts, there exists a market risk that such futures contracts may be significantly influenced by adverse market conditions, resulting in such futures contracts being less valuable. If the markets should move against all of the futures contracts at the same time, the Fund could experience substantial losses.
46
Credit risk is the possibility that a loss may occur due to the failure of the Commodity Broker and/or clearing house to perform according to the terms of a futures contract. Credit risk with respect to exchange-traded instruments is reduced to the extent that an exchange or clearing organization acts as a counterparty to the transactions. The Commodity Broker, when acting as the Fund’s futures commission merchant in accepting orders for the purchase or sale of domestic futures contracts, is required by CFTC regulations to separately account for and segregate as belonging to the Fund all assets of the Fund relating to domestic futures trading. The Commodity Broker is not allowed to commingle such assets with other assets of the Commodity Broker. In addition, CFTC regulations also require the Commodity Broker to hold in a secure account assets of the Fund related to foreign futures trading. The Fund’s risk of loss in the event of counterparty default is typically limited to the amounts recognized in the Statements of Financial Condition and not represented by the futures contract or notional amounts of the instruments.
The Fund has not utilized, nor does it expect to utilize in the future, special purpose entities to facilitateoff-balance sheet financing arrangements and has no loan guarantee arrangements oroff-balance sheet arrangements of any kind, other than agreements entered into in the normal course of business noted above.
Note 4 – Service Providers and Related Party Agreements
The Trustee
Under the Trust Agreement, Wilmington Trust Company, the trustee of the Fund (the “Trustee”), has the power and authority to execute and file certificates as required by the Delaware Statutory Trust Act and to accept service of process on the Fund in the State of Delaware. The Managing Owner has the exclusive management and control of all aspects of the business of the Fund. The Trustee will serve in that capacity until such time as the Managing Owner removes the Trustee or the Trustee resigns and a successor is appointed by the Managing Owner. The Trustee will have no duty or liability to supervise or monitor the performance of the Managing Owner, nor will the Trustee have any liability for the acts or omissions of the Managing Owner.
The Managing Owner
The Managing Owner serves as the Fund’s commodity pool operator, commodity trading advisor and managing owner. The Fund pays the Managing Owner a management fee, monthly in arrears, in an amount equal to 0.75% per annum of the daily NAV of the Fund (the “Management Fee”). The Fund, for cash management purposes, invests in money market mutual funds and/orT-Bill ETFs that are managed by affiliates of the Managing Owner. The indirect portion of the management fee that the Fund incurs through such investments is in addition to the Management Fee paid to the Managing Owner. The Managing Owner has contractually agreed to waive indefinitely the fees that it receives in an amount equal to the indirect management fees that the Fund incurs through its investments in affiliated money market mutual funds and/or affiliatedT-Bill ETFs. The Managing Owner may terminate this fee waiver on 60 days notice.
The Managing Owner waived fees of $40,496, $42,832 and $8,810 for the years ended December 31, 2018, 2017 and 2016, respectively.
The Distributor
Effective June 20, 2016, Invesco Distributors, Inc. (the “Distributor”) became distributor and began providing certain distribution services to the Fund. Pursuant to the Distribution Services Agreement among the Managing Owner, the Fund and the Distributor, the Distributor assists the Managing Owner and the Fund’s administrator, The Bank of New York Mellon with certain functions and duties relating to distribution and marketing services to the Fund including reviewing and approving marketing materials. Prior to June 20, 2016, ALPS Distributors, Inc. provided distribution services to the Fund.
The Managing Owner pays the Distributor a distribution fee out of the Management Fee.
The Commodity Broker
Morgan Stanley & Co. LLC, a Delaware limited liability company, serves as the Fund’s futures clearing broker (the “Commodity Broker”). The Commodity Broker is registered with the CFTC as a futures commission merchant and is a member of the NFA in such capacity.
A variety of executing brokers execute futures transactions on behalf of the Fund. Such executing brokersgive-up all such transactions to the Commodity Broker. In its capacity as clearing broker, the Commodity Broker may execute or receive transactions executed by others and clears all of the Fund’s futures transactions and performs certain administrative and custodial services for the Fund. The Commodity Broker is responsible, among other things, for providing periodic accountings of all dealings and actions taken by the Fund during the reporting period, together with an accounting of all securities, cash or other indebtedness or obligations held by it or its nominees for or on behalf of the Fund.
47
The Administrator, Custodian and Transfer Agent
The Bank of New York Mellon (the “Administrator”, “Custodian” and “Transfer Agent”) is the administrator, custodian and transfer agent of the Fund. The Fund and the Administrator have entered into separate administrative, custodian, transfer agency and service agreements (collectively referred to as the “Administration Agreement”).
Pursuant to the Administration Agreement, the Administrator performs or supervises the performance of services necessary for the operation and administration of the Fund (other than making investment decisions), including receiving and processing orders from Authorized Participants to create and redeem Baskets, NAV calculations, accounting and other fund administrative services. The Administrator maintains certain financial books and records, including: Basket creation and redemption records; fund accounting records; ledgers with respect to assets, liabilities, capital, income and expenses; the registrar, transfer journals and related details; and trading and related documents received from the Commodity Broker. The Managing Owner pays the Administrator fees for its services out of the Management Fee.
Index Sponsor
The Managing Owner, on behalf of the Fund, has appointed Deutsche Investment Management Americas Inc. to serve as the index sponsor (the “Index Sponsor”). The Index Sponsor calculates and publishes the daily index levels and the indicative intraday index levels. Additionally, the Index Sponsor also calculates the indicative value per Share of the Fund throughout each business day.
The Managing Owner pays the Index Sponsor a licensing fee and an index services fee out of the Management Fee for performing its duties.
Note 5 - Deposits with Commodity Broker and Custodian
The Fund defines cash as cash held by the Custodian. There were no cash equivalents held by the Fund as of December 31, 2018 and 2017.
The Fund may deposit cash, United States Treasury Obligations,T-Bill ETFs and money market mutual funds with the Commodity Broker as margin, to the extent permissible under CFTC rules. The combination of the Fund’s deposits with its Commodity Broker of cash and United States Treasury Obligations and the unrealized profit or loss on open futures contracts represents the Fund’s overall equity in its broker trading account. To meet the Fund’s maintenance margin requirements, the Fund holds United States Treasury Obligations with the Commodity Broker. The Fund transfers cash to the Commodity Broker to satisfy variation margin requirements. The Fund earns interest on any excess cash deposited with the Commodity Broker and incurs interest expense on any deficit balance with the Commodity Broker.
The brokerage agreement with the Commodity Broker provides for the net settlement of all financial instruments covered by the agreement in the event of default or termination of any one contract. The Managing Owner will utilize any excess cash held at the Commodity Broker to offset any realized losses incurred in the commodity futures contracts, if available. To the extent that any excess cash held at the Commodity Broker is not adequate to cover any realized losses, a portion of the United States Treasury Obligations andT-Bill ETFs, if any, on deposit with the Commodity Broker will be sold to make additional cash available. For financial reporting purposes, the Fund offsets financial assets and financial liabilities that are subject to legally enforceable netting arrangements.
The Fund’s remaining cash, United States Treasury Obligations,T-Bill ETFs and money market mutual fund holdings are on deposit with the Custodian. The Fund is permitted to temporarily carry a negative or overdrawn balance in its account with the Custodian. The Fund incurs interest expense on any overdraft balance with the Custodian. Such balances, if any atperiod-end, are shown on the Statements of Financial Condition under the payable captionDue to custodian.
Note 6 - Additional Valuation Information
U.S. GAAP defines fair value as the price that would be received to sell an asset or paid to transfer a liability in an orderly transaction between market participants at the measurement date, under current market conditions. U.S. GAAP establishes a hierarchy that prioritizes the inputs to valuation methods, giving the highest priority to readily available unadjusted quoted prices in an active market for identical assets (Level 1) and the lowest priority to significant unobservable inputs (Level 3), generally when market prices are not readily available or are unreliable. Based on the valuation inputs, the securities or other investments are tiered into one of three levels. Changes in valuation methods or market conditions may result in transfers in or out of an investment’s assigned level:
Level 1: Prices are determined using quoted prices in an active market for identical assets.
Level 2: Prices are determined using other significant observable inputs. Observable inputs are inputs that other market participants may use in pricing a security. These may include quoted prices for similar securities, interest rates, prepayment speeds, credit risk, yield curves, loss severities, default rates, discount rates, volatilities and others.
Level 3: Prices are determined using significant unobservable inputs. In situations where quoted prices or observable inputs are unavailable (for example, when there is little or no market activity for an investment at the end of the period), unobservable inputs may be used. Unobservable inputs reflect the Fund’s own assumptions about the factors market participants would use in determining fair value of the securities or instruments and would be based on the best available information.
48
The levels assigned to the securities valuations may not be an indication of the risk or liquidity associated with investing in those securities. Because of the inherent uncertainties of valuation, the values reflected in the financial statements may materially differ from the value received upon actual sale of those investments.
The following is a summary of the tiered valuation input levels as of December 31, 2018:
| Level 1 | Level 2 | Level 3 | Total | |||||||||||||
Investments in Securities | ||||||||||||||||
United States Treasury Obligations | $ | — | $ | 188,139,552 | $ | — | $ | 188,139,552 | ||||||||
Exchange-Traded Fund | 16,016,336 | — | — | 16,016,336 | ||||||||||||
Money Market Mutual Fund | 5,105,156 | — | — | 5,105,156 | ||||||||||||
|
|
|
|
|
|
|
| |||||||||
Total Investments in Securities | 21,121,492 | 188,139,552 | — | 209,261,044 | ||||||||||||
|
|
|
|
|
|
|
| |||||||||
Other Investments - Liabilities(a) | ||||||||||||||||
Commodity Futures Contracts | (16,226,963 | ) | — | — | (16,226,963 | ) | ||||||||||
|
|
|
|
|
|
|
| |||||||||
Total Investments | $ | 4,894,529 | $ | 188,139,552 | $ | — | $ | 193,034,081 | ||||||||
|
|
|
|
|
|
|
| |||||||||
| (a) | Unrealized appreciation (depreciation). |
The following is a summary of the tiered valuation input levels as of December 31, 2017:
| Level 1 | Level 2 | Level 3 | Total | |||||||||||||
Investments in Securities | ||||||||||||||||
United States Treasury Obligations | $ | — | $ | 244,408,079 | $ | — | $ | 244,408,079 | ||||||||
Exchange-Traded Fund | 15,990,513 | — | — | 15,990,513 | ||||||||||||
Money Market Mutual Fund | 23,103,724 | — | — | 23,103,724 | ||||||||||||
|
|
|
|
|
|
|
| |||||||||
Total Investments in Securities | 39,094,237 | 244,408,079 | — | 283,502,316 | ||||||||||||
|
|
|
|
|
|
|
| |||||||||
Other Investments - Assets (a) | ||||||||||||||||
Commodity Futures Contracts | 31,489,170 | — | — | 31,489,170 | ||||||||||||
|
|
|
|
|
|
|
| |||||||||
Total Investments | $ | 70,583,407 | $ | 244,408,079 | $ | — | $ | 314,991,486 | ||||||||
|
|
|
|
|
|
|
| |||||||||
| (a) | Unrealized appreciation (depreciation). |
Note 7 – Derivative Instruments
The Fair Value of Derivative Instruments is as follows:
| December 31, 2018 | December 31, 2017 | |||||||||||||||
Risk Exposure/Derivative Type(a) | Assets | Liabilities | Assets | Liabilities | ||||||||||||
Commodity risk | ||||||||||||||||
Commodity Futures Contracts | $ | — | $ | (16,226,963 | ) | $ | 31,489,170 | $ | — | |||||||
| (a) | Includes cumulative appreciation (depreciation) of commodity futures contracts. |
49
The following table presents derivative instruments that are either subject to an enforceable netting agreement or offset by collateral arrangements as of December 31, 2018, net by contract:
| Financial Derivative Assets | Financial Derivative Liabilities | Net value of derivatives | Collateral (Received)/Pledged(a) | |||||||||||||||||||||
Counterparty | Futures Contracts | Futures Contracts | Non-Cash | Cash | Net amount | |||||||||||||||||||
Morgan Stanley & Co. LLC | $ | — | $ | (16,226,963 | ) | $ | (16,226,963 | ) | $ | 16,226,963 | $ | — | $ | — | ||||||||||
|
|
|
|
|
|
|
|
|
|
|
| |||||||||||||
The following table presents derivative instruments that are either subject to an enforceable netting agreement or offset by collateral arrangements as of December 31, 2017, net by contract:
| Financial Derivative Assets | Financial Derivative Liabilities | Net value of derivatives | Collateral (Received)/ Pledged(a) | |||||||||||||||||||||
Counterparty | Futures Contracts | Futures Contracts | Non-Cash | Cash | Net amount | |||||||||||||||||||
Morgan Stanley & Co. LLC | $ | 31,489,170 | $ | — | $ | 31,489,170 | $ | — | $ | — | $ | 31,489,170 | ||||||||||||
|
|
|
|
|
|
|
|
|
|
|
| |||||||||||||
| (a) | As of December 31, 2018 and December 31, 2017, a portion of the Fund’s U.S. Treasury Obligations were required to be deposited as maintenance margin in support of the Fund’s futures positions. |
The Effect of Derivative Instruments on the Statements of Income and Expenses is as follows:
| �� | For the Years Ended | |||||||||||||
Location of Gain or (Loss) on Derivatives | December 31, | |||||||||||||
Risk Exposure/Derivative Type | Recognized in Income | 2018 | 2017 | 2016 | ||||||||||
Commodity risk | ||||||||||||||
Commodity Futures Contracts | Net Realized Gain (Loss) | $ | (17,648,522 | ) | $ | 52,294,017 | $ | 10,296,432 | ||||||
Net Change in Unrealized Gain (Loss) | (47,716,133 | ) | 18,993,265 | 26,387,124 | ||||||||||
|
|
|
|
|
| |||||||||
Total | $ | (65,364,655 | ) | $ | 71,287,282 | $ | 36,683,556 | |||||||
|
|
|
|
|
| |||||||||
The table below summarizes the average monthly notional value of futures contracts outstanding during the period:
| For the Years Ended | ||||||||||||
| December 31, | ||||||||||||
| 2018 | 2017 | 2016 | ||||||||||
Average Notional Value | $ | 269,933,202 | $ | 303,299,280 | $ | 164,728,036 | ||||||
Note 8 - Investments in Affiliates
The Invesco Treasury Collateral ETF (formerly PowerShares Treasury Collateral Portfolio) is an investment company registered under the Investment Company Act of 1940, as amended, whose shares are primarily purchased and sold on a national securities exchange. In seeking its investment objective, the Invesco Treasury Collateral ETF primarily holds U.S. Treasury Obligations that: (i) are issued in U.S. Dollars; (ii) have a minimum remaining maturity of at least one month and a maximum remaining maturity of 12 months at the time of rebalance; and (iii) have a minimum amount outstanding of $300 million. Because it is advised by the Managing Owner, the Invesco Treasury Collateral ETF is an affiliate of the Fund.
The following is a summary of the transactions in, and earnings from, investments in affiliates (excluding affiliated money market funds) for the year ended December 31, 2018.
| Value 12/31/2017 | Purchases at Cost | Proceeds from Sales | Change in Unrealized Appreciation (Depreciation) | Realized Gain (Loss) | Value 12/31/2018 | Dividend Income | ||||||||||||||||||||||
Invesco Treasury Collateral ETF | $ | 15,990,513 | $ | — | $ | — | $ | 25,823 | $ | — | $ | 16,016,336 | $ | 270,584 | ||||||||||||||
50
The following is a summary of the transactions in, and earnings from, investments in affiliates (excluding affiliated money market funds) for the year ended December 31, 2017.
| Value 12/31/2016 | Purchases at Cost | Proceeds from Sales | Change in Unrealized Appreciation (Depreciation) | Realized Gain (Loss) | Value 12/31/2017 | Dividend Income | ||||||||||||||||||||||
PowerShares Treasury Collateral Portfolio | $ | — | $ | 16,006,371 | $ | — | $ | (15,858 | ) | $ | — | $ | 15,990,513 | $ | 113,445 | |||||||||||||
Note 9 - Share Purchases and Redemptions
(a) Purchases
On any business day, an Authorized Participant may place an order with the Transfer Agent to create one or more Baskets. Each Basket consists of a block of 200,000 Shares. For purposes of processing both creation and redemption orders, a “business day” means any day other than a day when banks in New York City are required or permitted to be closed. Creation orders must be placed by 10:00 a.m., Eastern Time. The day on which the Transfer Agent receives a valid creation order is the creation order date. The day on which a creation order is settled is the creation order settlement date. Cash settlement occurs at the creation order settlement date. As provided below, the creation order settlement date may occur up to two business days after the creation order date. By placing a creation order, and prior to delivery of such Baskets, an Authorized Participant’s Depository Trust Company (“DTC”) account is charged thenon-refundable transaction fee due for the creation order.
Unless otherwise agreed to by the Managing Owner and the Authorized Participant as provided in the next sentence, Baskets are issued on the creation order settlement date as of 2:45 p.m., Eastern Time, on the business day immediately following the creation order date at the applicable NAV per Share as of the closing time of the NYSE Arca or the last to close of the exchanges on which its futures contracts are traded, whichever is later, on the creation order date, but only if the required payment has been timely received. Upon submission of a creation order, the Authorized Participant may request the Managing Owner to agree to a creation order settlement date up to two business days after the creation order date.
(b) Redemptions
On any business day, an Authorized Participant may place an order with the Transfer Agent to redeem one or more Baskets. Redemption orders must be placed by 10:00 a.m., Eastern Time. The day on which the Managing Owner receives a valid redemption order is the redemption order date. The day on which a redemption order is settled is the redemption order settlement date. Cash settlement occurs at the redemption order settlement date. As provided below, the redemption order settlement date may occur up to two business days after the redemption order date. The redemption procedures allow Authorized Participants to redeem Baskets. Individual Shareholders may not redeem directly from the Fund. Instead, individual Shareholders may only redeem Shares in integral multiples of 200,000 and only through an Authorized Participant.
Unless otherwise agreed to by the Managing Owner and the Authorized Participant as provided in the next sentence, by placing a redemption order, an Authorized Participant agrees to deliver the Baskets to be redeemed through DTC’s book-entry system to the Fund no later than the redemption order settlement date as of 2:45 p.m., Eastern Time, on the business day immediately following the redemption order date. Upon submission of a redemption order, the Authorized Participant may request the Managing Owner to agree to a redemption order settlement date up to two business days after the redemption order date. By placing a redemption order, and prior to receipt of the redemption proceeds, an Authorized Participant’s DTC account is charged thenon-refundable transaction fee due for the redemption order.
The redemption proceeds from the Fund consist of the cash redemption amount. The cash redemption amount is equal to the NAV of the number of Basket(s) requested in the Authorized Participant’s redemption order as of the closing time of the NYSE Arca or the last to close of the exchanges on which the Fund’s futures contracts are traded, whichever is later, on the redemption order date. The Managing Owner will distribute the cash redemption amount at the redemption order settlement date as of 2:45 p.m., Eastern Time, on the redemption order settlement date through DTC to the account of the Authorized Participant as recorded on DTC’s book-entry system.
The redemption proceeds due from the Fund are delivered to the Authorized Participant at 2:45 p.m., Eastern Time, on the redemption order settlement date if, by such time, the Fund’s DTC account has been credited with the Baskets to be redeemed. If the Fund’s DTC account has not been credited with all of the Baskets to be redeemed by such time, the redemption distribution is delivered to the extent of whole Baskets received. Any remainder of the redemption distribution is delivered on the next business day to the extent of remaining whole Baskets received if the Transfer Agent receives the fee applicable to the extension of the redemption distribution date which the Managing Owner may, fromtime-to-time, determine and the remaining Baskets to be redeemed are credited to the Fund’s DTC account by 2:45 p.m., Eastern Time, on such next business day. Any further outstanding amount of the redemption order will be cancelled. The Managing Owner is also authorized to deliver the redemption distribution notwithstanding
51
that the Baskets to be redeemed are not credited to the Fund’s DTC account by 2:45 p.m., Eastern Time, on the redemption order settlement date if the Authorized Participant has collateralized its obligation to deliver the Baskets through DTC’s book-entry system on such terms as the Managing Owner may determine fromtime-to-time.
Note 10 - Commitments and Contingencies
The Managing Owner, either in its own capacity or in its capacity as the Managing Owner and on behalf of the Fund, has entered into various service agreements that contain a variety of representations, or provide indemnification provisions related to certain risks service providers undertake in performing services for the Fund. The Trust Agreement provides for the Fund to indemnify the Managing Owner and any affiliate of the Managing Owner that provides services to the Fund to the maximum extent permitted by applicable law, subject to certain exceptions for disqualifying conduct by the Managing Owner or such an affiliate. The Fund’s maximum exposure under these arrangements is unknown as this would involve future claims that may be made against the Fund that have not yet occurred. Further, the Fund has not had prior claims or losses pursuant to these contracts. Accordingly, the Managing Owner expects the risk of loss to be remote.
Note 11 - Financial Highlights
The Fund is presenting the following NAV and financial highlights related to investment performance for a Share outstanding for the years ended December 31, 2018, 2017 and 2016. An individual investor’s return and ratios may vary based on the timing of capital transactions.
NAV per Share is the NAV of the Fund divided by the number of outstanding Shares at the date of each respective period presented.
| Years Ended December 31, | ||||||||||||
| 2018 | 2017 | 2016 | ||||||||||
Net Asset Value | ||||||||||||
Net asset value per Share, beginning of period | $ | 19.39 | $ | 14.95 | $ | 11.87 | ||||||
Net realized and change in unrealized gain (loss) on United States Treasury Obligations, Affiliated Investments and Commodity Futures Contracts | (3.89 | ) | 4.45 | 3.16 | ||||||||
Net investment income (loss)(a) | 0.18 | (0.01 | ) | (0.08 | ) | |||||||
|
|
|
|
|
| |||||||
Net income (loss) | (3.71 | ) | 4.44 | 3.08 | ||||||||
|
|
|
|
|
| |||||||
Less: | ||||||||||||
Return of capital distributions | (0.24 | ) | — | — | ||||||||
|
|
|
|
|
| |||||||
Net asset value per Share, end of period | $ | 15.44 | $ | 19.39 | $ | 14.95 | ||||||
|
|
|
|
|
| |||||||
Market value per Share, beginning of period(b) | $ | 19.43 | $ | 14.91 | $ | 11.91 | ||||||
|
|
|
|
|
| |||||||
Market value per Share, end of period(b) | $ | 15.38 | $ | 19.43 | $ | 14.91 | ||||||
|
|
|
|
|
| |||||||
Ratio to average Net Assets | ||||||||||||
Net investment income (loss) | 0.98 | % | (0.04 | )% | (0.59 | )% | ||||||
|
|
|
|
|
| |||||||
Expenses, after waivers | 0.96 | % | 0.77 | % | 0.88 | % | ||||||
|
|
|
|
|
| |||||||
Expenses, prior to waivers | 0.98 | % | 0.78 | % | 0.88 | % | ||||||
|
|
|
|
|
| |||||||
Total Return, at net asset value(c) | (19.13 | )% | 29.70 | % | 25.95 | % | ||||||
|
|
|
|
|
| |||||||
Total Return, at market value(c) | (19.61 | )% | 30.32 | % | 25.19 | % | ||||||
|
|
|
|
|
| |||||||
| (a) | Based on average shares outstanding. |
| (b) | The mean between the last bid and ask prices. |
| (c) | Total Return, at NAV is calculated assuming an initial investment made at the NAV at the beginning of the period, reinvestment of all dividends and distributions at NAV during the period, and redemption of Shares on the last day of the period. Total Return, at NAV includes adjustments in accordance with U.S. GAAP and as such, the NAV for financial reporting purposes and the returns based upon those NAVs may differ from the NAVs and returns for shareholder transactions. Total Return, at market value is calculated assuming an initial investment made at the market value at the beginning of the period, reinvestment of all dividends and distributions at market value during the period, and redemption of Shares at the market value on the last day of the period. Not annualized for periods less than one year, if applicable. |
52
| ITEM 9. | CHANGES IN AND DISAGREEMENTS WITH ACCOUNTANTS ON ACCOUNTING AND FINANCIAL DISCLOSURE |
None.
| ITEM 9A. | CONTROLS AND PROCEDURES |
For purposes of this Item 9A, all references to the “Fund” shall be read to specifically include the Fund and the Trust. Please note that the disclosure controls and procedures and internal control over financial reporting of the Trust are the aggregate disclosure controls and procedures and internal control over financial reporting of the Fund and that of Invesco DB Agriculture Fund, Invesco DB Energy Fund, Invesco DB Gold Fund, Invesco DB Oil Fund, Invesco DB Precious Metals Fund and Invesco DB Silver Fund, each a series of the Trust.
Evaluation of Disclosure Controls and Procedures
Under the supervision and with the participation of the management of the Managing Owner, including Daniel Draper, its Principal Executive Officer, and Kelli Gallegos, its Principal Financial and Accounting Officer, Investment Pools, the Fund carried out an evaluation of the effectiveness of the design and operation of its disclosure controls and procedures (as defined in Rule13a-15(e) or15d-15(e) of the Securities Exchange Act of 1934, as amended (the “Exchange Act”)) as of December 31, 2018, the end of the period covered by this Annual Report, and, based upon that evaluation, Daniel Draper, the Principal Executive Officer of the Managing Owner, and Kelli Gallegos, the Principal Financial and Accounting Officer, Investment Pools, of the Managing Owner, concluded that the Fund’s disclosure controls and procedures were effective to provide reasonable assurance that information the Fund is required to disclose in the reports that it files or submits with the Securities and Exchange Commission (the “SEC”) under the Exchange Act is recorded, processed, summarized and reported, within the time periods specified in the SEC’s rules and forms, and to ensure that information required to be disclosed by the Fund in the reports that it files or submits under the Exchange Act is accumulated and communicated to management of the Managing Owner, including its Principal Executive Officer and Principal Financial Officer, as appropriate to allow timely decisions regarding required disclosure.
Changes in Internal Control Over Financial Reporting
There has been no change in internal control over financial reporting (as defined in the Rules13a-15(f) and15d-15(f) of the Exchange Act) that occurred during the quarter ended December 31, 2018 that has materially affected, or is reasonably likely to materially affect, the Fund’s internal control over financial reporting.
Management’s Annual Report on Internal Control Over Financial Reporting
Management of the Managing Owner is responsible for establishing and maintaining adequate internal control over financial reporting, as defined underRules 13a-15(f) and15d-15(f) of the Exchange Act, for the Fund. Daniel Draper, the Principal Executive Officer of the Managing Owner, and Kelli Gallegos, the Principal Financial and Accounting Officer, Investment Pools, of the Managing Owner, assessed the effectiveness of the Fund’s internal control over financial reporting as of December 31, 2018. Their report in connection with their assessment may be found in the “Report of Management on Internal Control Over Financial Reporting” on page 33 of this Annual Report onForm 10-K.
The Fund’s independent registered public accounting firm, PricewaterhouseCoopers LLP, has audited the Fund’s internal control over financial reporting as of December 31, 2018, as stated in their report on page 34 of this Form10-K.
| ITEM 9B. | OTHER INFORMATION |
None.
53
| ITEM 10. | DIRECTORS AND EXECUTIVE OFFICERS OF THE REGISTRANT AND CORPORATE GOVERNANCE |
Board of Directors and Principal Officers
The Fund has no directors or principal officers and also does not have any employees. It is managed by the Managing Owner.
As of December 31, 2018, the board of managers and principal officers of the Managing Owner are as follows:
Name | Capacity | |
| Daniel Draper | Chief Executive Officer, Board of Managers | |
| Peter Hubbard | Vice President and Director of Portfolio Management | |
| David Warren | Chief Administrative Officer, Board of Managers | |
| Annette Lege | Principal | |
| Kelli Gallegos | Principal Financial and Accounting Officer, Investment Pools | |
| Melanie Zimdars | Chief Compliance Officer | |
| John Zerr | Board of Managers | |
| Brian Hartigan | Global Head of ETF Investments |
Invesco Group Services Inc. is also a principal of the Managing Owner.
The Managing Owner is managed by a Board of Managers. The Board of Managers is composed of Messrs. Draper, Warren and Zerr.
The Managing Owner has designated Mr. Hubbard as the trading principal of the Fund.
Daniel Draper (50) has been Chief Executive Officer of the Managing Owner since March 24, 2016. In this role, he has general oversight responsibilities for all of the Managing Owner’s business. Mr. Draper has been a Member of the Board of Managers of the Managing Owner since September 2013. In this role he is responsible for the management of the Managing Owner’s exchange traded fund business with direct functional reporting responsibilities for the Managing Owner’s portfolio management, products, marketing and capital markets teams. In such capacity, Mr. Draper also is responsible for managing the operations of the Invesco Funds. Previously, Mr. Draper was the Global Head of Exchange Traded Funds for Credit Suisse Asset Management, or Credit Suisse, based in London from March 2010 until June 2013, followed by a three monthnon-compete period pursuant to his employment terms with Credit Suisse. Credit Suisse is an asset management business of Credit Suisse Group, a financial services company. From January 2007 to March 2010, he was the Global Head of Exchange Traded Funds for Lyxor Asset Management in London, an investment management business unit of Societe Generale Corporate & Investment Banking. Mr. Draper was previously registered as a Significant Influence Functions (SIF) person with the UK’s Financial Conduct Authority. He withdrew SIF person status on June 30, 2013 when he left Credit Suisse. Mr. Draper received his MBA from the Kenan-Flagler Business School at the University of North Carolina at Chapel Hill and his BA from the College of William and Mary in Virginia. Mr. Draper is currently registered with FINRA and holds the Series 7, 24 and 63 registrations. Mr. Draper was listed as a principal of the Managing Owner on December 16, 2013.
Peter Hubbard (38) joined the Managing Owner in May 2005 as a portfolio manager and has been Vice President, Director of Portfolio Management since September 2012. In his role, Mr. Hubbard manages a team of eight portfolio managers. His responsibilities include facilitating all portfolio management processes associated with more than 200 equity and fixed income Invesco Funds listed in the United States, Canada and Europe. He is a graduate of Wheaton College with a B.A. degree in Business & Economics. Mr. Hubbard was listed as a principal and registered as an associated person of the Managing Owner on November 15, 2012 and January 1, 2013, respectively. Mr. Hubbard was registered as a swap associated person of the Managing Owner effective as of September 8, 2015.
David Warren (61) is Chief Administrative Officer, Americas, for Invesco Ltd., a global investment management company affiliated with the Managing Owner. He was appointed to this position in January 2007, and also holds the roles of Director, Executive Vice President and Chief Financial Officer of Invesco Canada Ltd., a Canadian investment management subsidiary of Invesco Ltd., since January 2009. He has been a Member of the Board of Managers and Chief Administrative Officer of the Managing Owner since January 2010, as well. In these capacities, Mr. Warren is responsible for general management support, in addition to executing on various strategic initiatives and overseeing the risk management framework for the business units operating within the Americas division of Invesco Ltd. He obtained a Bachelor’s Degree in Commerce from the University of Toronto as both a CA and CPA, and is a member of the Chartered Professional Accountants of Canada. Mr. Warren was listed as a principal of the Managing Owner on November 21, 2012.
Annette Lege(49) has been a Chief Accounting Officer and Head of Finance and Corporate Services (“FCS”) Business Services for Invesco Ltd. since March 2017. In this role, she is responsible for all aspects of Corporate Accounting including group financial reporting, internal controls and group accounting policies. Ms. Lege also manages Invesco’s Finance operations and shared service
54
centers and has held this role since September 2015. Previously, Ms. Lege was Head of FCS Transformation Office from October 2013 through September 2015, with responsibility for business transformation initiatives taking place across FCS at Invesco. Before assuming that role in October 2013, Ms. Lege held the position of North American Corporate Controller at Invesco from March 2007 to October 2013. Ms. Lege is also a CPA, is licensed by FINRA as a Financial Operations Principal, and is a member of the Texas State Board of Public Accountants. Ms. Lege earned a BBA in accounting from the University of Houston. Ms. Lege was listed as a principal of the Managing Owner on March 30, 2017 and was listed as a principal of Invesco Advisors, Inc. on March 22, 2017.
Kelli Gallegos (48) has been Principal Financial and Accounting Officer – Investment Pools for the Managing Owner since September 2018. Additionally, since September 2018, Ms. Gallegos has been Principal Financial and Accounting Officer – Investment Pools of Invesco Specialized Products, LLC (sponsor to a suite of currency exchange-traded funds, “ISP”), Head of North America Fund Reporting of Invesco, Ltd. (“Invesco”, a global investment management company), and Vice President and Treasurer of Invesco Exchange Traded Fund Trust, Invesco Exchange-Traded Fund Trust II, Invesco India Exchange-Traded Fund Trust, Invesco Actively Managed Exchange-Traded Fund Trust, Invesco Actively Managed Exchange-Traded Commodity Fund Trust, and Invesco Exchange-Traded Self-Indexed Fund Trusts (each a registered investment company offering series of exchange-traded funds, the “Invesco ETFs”). She also serves as Vice President (since March 2016), Principal Financial Officer (since March 2016) and Assistant Treasurer (since December 2008) for a suite of mutual funds advised by Invesco Advisers, Inc., a registered investment adviser (the “Invesco Funds”). In her roles with the Managing Owner, ISP, Invesco, the Invesco ETFs and the Invesco Funds, Ms. Gallegos has financial and administrative oversight responsibilities for, and serves as Principal Financial Officer of the Invesco ETFs, the Trust, the Funds and the exchange-traded funds for which ISP serves as sponsor (the “CurrencyShares Trusts”). Previously, she was Director of Fund Financial Services from December 2008 to September 2018, Assistant Treasurer for the Managing Owner from January 2013 to September 2018, Assistant Treasurer of ISP from April 2018 to September 2018, Assistant Treasurer for the Invesco ETFs from September 2014 to September 2018 and Assistant Vice President for the Invesco Funds from December 2008 to March 2016. In such roles, Ms. Gallegos managed the group of personnel responsible for the preparation of fund financial statements and other information necessary for shareholder reports, fund prospectuses, regulatory filings, and for the coordination and oversight of third-party service providers of the Fund, the Invesco ETFs, the Invesco Funds, and the CurrencyShares Trusts. Ms. Gallegos earned a BBA in accounting from Harding University in Searcy, AR. Ms. Gallegos was listed as a principal of the Managing Owner on September 25, 2018.
Melanie H. Zimdars(42) has been Chief Compliance Officer of the Managing Owner since November 2017. In this role she is responsible for all aspects of regulatory compliance for the Managing Owner. Ms. Zimdars has also served as Chief Compliance Officer of Invesco Exchange-Traded Fund Trust, Invesco Exchange-Traded Fund Trust II, Invesco India Exchange-Traded Fund Trust, Invesco Actively Managed Exchange-Traded Fund Trust and Invesco Actively Managed Exchange-Traded Commodity Fund Trust since November 2017. From September 2009 to October 2017, she served as Vice President and Deputy Chief Compliance Officer at ALPS Holdings, Inc. where she was Chief Compliance Officer for six different mutual fund complexes, including active and passive ETFs andopen-end andclosed-end funds. Through its subsidiary companies, ALPS Holdings, Inc. is a provider of investment products and customized servicing solutions to the financial services industry. Ms. Zimdars received a BS degree from the University ofWisconsin-La Crosse. Ms. Zimdars was listed as a principal of the Managing Owner on February 1, 2018.
John Zerr (56) has been a Member of the Board of Managers of the Managing Owner since September 2006. Mr. Zerr has also served as Chief Operating Officer of the Americas for Invesco Ltd. since February 2018. Prior to his current position, Mr. Zerr served as Managing Director and General Counsel – U.S. Retail of Invesco Management Group, Inc., a registered investment adviser affiliated with the Managing Owner, from March 2006 until February 2018, where he was responsible for overseeing the U.S. Retail Legal Department for Invesco Ltd. and its affiliated companies. Mr. Zerr has also been a Senior Vice President and Secretary of IDI since March 2006 and June 2006, respectively. He also served as a Director of that entity until February 2010. Mr. Zerr has served as Senior Vice President of Invesco Advisers, Inc., a registered investment adviser affiliated with the Managing Owner, since December 2009. Mr. Zerr serves as a Director, Vice President and Secretary of Invesco Investment Services, Inc., a registered transfer agency since May 2007. Mr. Zerr has served as Director, Senior Vice President, General Counsel and Secretary of a number of other Invesco Ltd. wholly-owned subsidiaries which service or serviced portions of Invesco Ltd.’s U.S. Retail business since May 2007 and since June 2010 with respect to certain Van Kampen entities engaged in the asset management business that were acquired by Invesco Ltd. from Morgan Stanley. In each of the foregoing positions Mr. Zerr is responsible for overseeing legal operations. In such capacity, Mr. Zerr also is responsible for overseeing the legal activities of the Invesco Funds. Mr. Zerr earned a BA degree in economics from Ursinus College. He graduated cum laude with a J.D. from Temple University School of Law. Mr. Zerr was listed as a principal of the Managing Owner on December 6, 2012.
Brian Hartigan (40) joined the Managing Owner in May 2015 as Global Head of ETF Investments. In his role, Mr. Hartigan manages the portfolio management function at the Managing Owner, with the Director of Portfolio Management reporting to him. Previously from June 2010 until May of 2015, Mr. Hartigan was the Head of Portfolio Management and Research for Invesco Capital Markets, Inc., the sponsor of unit investment trusts. In that role, he oversaw portfolio management of Invesco unit trusts. He earned his B.A. from the University of St. Thomas in Minnesota and an MBA in finance from DePaul University. He is a CFA charterholder and a member of the CFA Society of Chicago. Mr. Hartigan was listed as a principal and registered as an associated person of the Managing Owner on February 21, 2018 and May 29, 2018, respectively.
55
Invesco Group Services Inc., which is a wholly owned, indirect subsidiary of Invesco Ltd., has been a principal of the Managing Owner since September 27, 2018 and has periodically been listed with NFA as a principal of other NFA members since May 17, 1990.
Code of Ethics
The Fund has no officers or employees and is managed by Invesco Capital Management LLC. Invesco Capital Management LLC has adopted a code of ethics which applies to all of its employees and is available on request, free of charge, by calling1-800-983-0903 Monday through Friday, 8:00 a.m. to 5:00 p.m. Central Time.
| ITEM 11. | EXECUTIVE COMPENSATION |
The Fund has no employees, officers or directors. The Managing Owner receives a monthly Management Fee of 1/12th of 0.75% per annum of the daily NAV of the Fund at the end of each month.
For the year ended December 31, 2018, the Fund has incurred Management Fees of $2,055,268 of which $1,948,856 had been paid at December 31, 2018. Management Fees of $106,412 were unpaid at December 31, 2018 and are reported as a liability on the Statements of Financial Condition.
For the year Ended December 31, 2018, the Fund has incurred brokerage commissions of $65,733 of which $61,323 had been paid at December 31, 2018. Brokerage commissions of $4,410 were unpaid at December 31, 2018 and are reported as a liability on the Statements of Financial Condition.
For the year ended December 31, 2017, the Fund has incurred Management Fees of $2,075,308 of which $1,893,152 had been paid at December 31, 2017. Management Fees of $182,156 were unpaid at December 31, 2017 and are reported as a liability on the Statements of Financial Condition.
For the year Ended December 31, 2017, the Fund has incurred brokerage commissions of $90,108 of which $85,547 had been paid at December 31, 2017. Brokerage commissions of $4,561 were unpaid at December 31, 2017 and are reported as a liability on the Statements of Financial Condition.
For the year ended December 31, 2016, the Fund has incurred Management Fees of $1,211,820 of which $1,032,805 had been paid at December 31, 2016. Management Fees of $179,015 were unpaid at December 31, 2016 and are reported as a liability on the Statements of Financial Condition.
For the year ended December 31, 2016, the Fund has incurred brokerage commissions of $175,794 of which $171,233 had been paid at December 31, 2016. Brokerage commissions of $4,561 were unpaid at December 31, 2016 and are reported as a liability on the Statements of Financial Condition.
| ITEM 12. | SECURITY OWNERSHIP OF CERTAIN BENEFICIAL OWNERS AND MANAGEMENT AND RELATED STOCKHOLDER MATTERS |
The Fund has no officers or directors. The following table sets forth certain information regarding beneficial ownership of the Fund’s General Shares and Shares as of January 31, 2019, as known by management.
Title of Class | Name and Address of Beneficial Owner | Amount and Nature of Beneficial Ownership | Percent of Class | |||||||
General Shares | Invesco Capital Management LLC 3500 Lacey Road, Suite 700 Downers Grove, Illinois 60515 | 40 | 100 | % | ||||||
Shares | Invesco Ltd. 1555 Peachtree Street NE, Suite 1800 Atlanta, Georgia 30309 | 2,040,251 | 19.62 | % | ||||||
Directors and Officers of Invesco Capital Management LLC as a group | — | Less than 0.01 | % | |||||||
The Fund has no securities authorized for issuance under equity compensation plans.
| ITEM 13. | CERTAIN RELATIONSHIPS AND RELATED TRANSACTIONS, AND DIRECTOR INDEPENDENCE |
See Item 11.
56
| ITEM 14. | PRINCIPAL ACCOUNTANT FEES AND SERVICES |
Audit andNon-Audit Fees
The following table sets forth the fees for professional services rendered by PricewaterhouseCoopers LLP, the Fund’s independent registered public accounting firm for the years ended December 31, 2018 and 2017.
| Fiscal Years Ended December 31, | ||||||||
| 2018 | 2017 | |||||||
Audit Fees | $ | 78,660 | $ | 86,034 | ||||
Audit-Related Fees(1) | 2,110 | — | ||||||
Tax Fees(2) | 184,213 | 193,071 | ||||||
All Other Fees | — | — | ||||||
|
|
|
| |||||
Total | $ | 264,983 | $ | 279,105 | ||||
|
|
|
| |||||
| (1) | Audit-Related Fees for the fiscal year ended December 31, 2018 include fees billed for reviewing regulatory filings. |
| (2) | Tax Fees for the fiscal years ended December 31, 2018 and 2017 include fees billed for preparing tax forms. |
Approval of Independent Registered Public Accounting Firm Services and Fees
The Managing Owner approved all of the services provided by PricewaterhouseCoopers LLP to the Fund described above. The Managing Ownerpre-approved all audit and allowednon-audit services of the Fund’s independent registered public accounting firm, including all engagement fees and terms.
57
| ITEM 15. | EXHIBITS AND FINANCIAL STATEMENT SCHEDULES |
(a)(1) Financial Statements
See financial statements commencing on page 32 hereof.
(a)(2) Financial Statement Schedules
No financial statement schedules are filed herewith because (i) such schedules are not required or (ii) the information required has been presented in the aforementioned financial statements.
(a)(3) Exhibits
The following documents (unless otherwise indicated) are filed herewith and made a part of this Annual Report:
EXHIBIT NO. | DESCRIPTION | |
| 4.1 | Fifth Amended and Restated Declaration of Trust and Trust Agreement of the Registrant1 | |
| 4.1.1 | Amendment No. 1 to the Fifth Amended and Restated Declaration of Trust and Trust Agreement of the Registrant2 | |
| 4.1.2 | Amendment No. 2 to the Fifth Amended and Restated Declaration of Trust and Trust Agreement of the Registrant3 | |
| 4.2 | Form of Participant Agreement4 | |
| 10.1 | Form of Customer Agreement5 | |
| 10.2 | Form of Administration Agreement4 | |
| 10.3 | Form of Global Custody Agreement4 | |
| 10.4 | Form of Transfer Agency and Service Agreement4 | |
| 10.5 | Distribution Services Agreement2 | |
| 31.1 | Certification required under Exchange Act Rules13a-14 and15d-14 (filed herewith) | |
| 31.2 | Certification required under Exchange Act Rules13a-14 and15d-14 (filed herewith) | |
| 32.1 | Certification of Principal Executive Officer pursuant to 18 U.S.C. Section 1350 as adopted pursuant to Section 906 of the Sarbanes-Oxley Act of 2002 (furnished herewith) | |
| 32.2 | Certification of Principal Financial Officer pursuant to 18 U.S.C. Section 1350 as adopted pursuant to Section 906 of the Sarbanes-Oxley Act of 2002 (furnished herewith) | |
| 101 | Interactive data file pursuant to Rule 405 of RegulationS-T: (i) the Statements of Financial Condition of Invesco DB Base Metals Fund—December 31, 2018 and December 31, 2017, (ii) the Schedule of Investments of Invesco DB Base Metals Fund—December 31, 2018, (iii) the Schedule of Investments of Invesco DB Base Metals Fund—December 31, 2017, (iv) the Statements of Income and Expenses of Invesco DB Base Metals Fund—Years Ended December 31, 2018, 2017 and 2016, (v) the Statement of Changes in Shareholders’ Equity of Invesco DB Base Metals Fund—Year Ended December 31, 2018, (vi) the Statement of Changes in Shareholders’ Equity of Invesco DB Base Metals Fund—Year Ended December 31, 2017, (vii) the Statement of Changes in Shareholders’ Equity of Invesco DB Base Metals Fund—Year Ended December 31, 2016, (viii) the Statements of Cash Flows of Invesco DB Base Metals Fund—Years Ended December 31, 2018, 2017 and 2016, and (ix) Notes to Financial Statements of Invesco DB Base Metals Fund. | |
| 1 | Previously filed as an exhibit to Form8-K on February 25, 2015 and incorporated herein by reference. |
| 2 | Previously filed as an exhibit to Form8-K on June 20, 2016 and incorporated herein by reference. |
| 3 | Previously filed as an exhibit to Form8-K on June 4, 2018 and incorporated herein by reference. |
| 4 | Previously filed as an exhibit toPre-Effective Amendment No. 2 to a Registration Statement on FormS-1 on December 14, 2006 and incorporated herein by reference. |
| 5 | Previously filed as an exhibit to Form8-K on February 26, 2015 and incorporated herein by reference. |
58
SIGNATURES
Pursuant to the requirements of the Securities Exchange Act of 1934, the Registrant has duly caused this report to be signed on its behalf by the undersigned, thereunto duly authorized.
| Invesco DB Multi-Sector Commodity Trust on its own behalf and with respect to Invesco DB Base Metals Fund | ||||||
| By: | Invesco Capital Management LLC, | |||||
| its Managing Owner | ||||||
| By: | /S/ DANIEL DRAPER | |||||
| Name: | Daniel Draper | |||||
| Title: | Principal Executive Officer | |||||
| By: | /S/ KELLI GALLEGOS | |||||
| Name: | Kelli Gallegos | |||||
| Title: | Principal Financial and Accounting Officer, Investment Pools | |||||
Dated: February 27, 2019
59
Exhibit 31.1
CERTIFICATION
I, Daniel Draper, certify that:
| 1. | I have reviewed this Annual Report on Form10-K of Invesco DB Base Metals Fund, a series of Invesco DB Multi-Sector Commodity Trust; |
| 2. | Based on my knowledge, this report does not contain any untrue statement of a material fact or omit to state a material fact necessary to make the statements made, in light of the circumstances under which such statements were made, not misleading with respect to the period covered by this report; |
| 3. | Based on my knowledge, the financial statements, and other financial information included in this report, fairly present in all material respects the financial condition, results of operations and cash flows of the registrant as of, and for, the periods presented in this report; |
| 4. | The registrant’s other certifying officer and I are responsible for establishing and maintaining disclosure controls and procedures (as defined in Exchange Act Rules 13a-15(e) and 15d-15(e)) and internal control over financial reporting (as defined in Exchange Act Rules 13a-15(f) and 15d-15(f)) for the registrant and have: |
| (a) | Designed such disclosure controls and procedures, or caused such disclosure controls and procedures to be designed under our supervision, to ensure that material information relating to the registrant, including its consolidated subsidiaries, is made known to us by others within those entities, particularly during the period in which this report is being prepared; |
| (b) | Designed such internal control over financial reporting, or caused such internal control over financial reporting to be designed under our supervision, to provide reasonable assurance regarding the reliability of financial reporting and the preparation of financial statements for external purposes in accordance with generally accepted accounting principles; |
| (c) | Evaluated the effectiveness of the registrant’s disclosure controls and procedures and presented in this report our conclusions about the effectiveness of the disclosure controls and procedures, as of the end of the period covered by this report based on such evaluation; and |
| (d) | Disclosed in this report any change in the registrant’s internal control over financial reporting that occurred during the registrant’s most recent fiscal quarter (the registrant’s fourth fiscal quarter in the case of an annual report) that has materially affected, or is reasonably likely to materially affect, the registrant’s internal control over financial reporting; and |
| 5. | The registrant’s other certifying officer and I have disclosed, based on our most recent evaluation of internal control over financial reporting, to the registrant’s auditors and the audit committee of the registrant’s board of directors (or persons performing the equivalent functions): |
| (a) | All significant deficiencies and material weaknesses in the design or operation of internal control over financial reporting which are reasonably likely to adversely affect the registrant’s ability to record, process, summarize and report financial information; and |
| (b) | Any fraud, whether or not material, that involves management or other employees who have a significant role in the registrant’s internal control over financial reporting. |
| Dated: February 27, 2019 | /s/ Daniel Draper | |||||
| Daniel Draper | ||||||
| Principal Executive Officer |
Exhibit 31.2
CERTIFICATION
I, Kelli Gallegos, certify that:
| 1. | I have reviewed this Annual Report on Form10-K of Invesco DB Base Metals Fund, a series of Invesco DB Multi-Sector Commodity Trust; |
| 2. | Based on my knowledge, this report does not contain any untrue statement of a material fact or omit to state a material fact necessary to make the statements made, in light of the circumstances under which such statements were made, not misleading with respect to the period covered by this report; |
| 3. | Based on my knowledge, the financial statements, and other financial information included in this report, fairly present in all material respects the financial condition, results of operations and cash flows of the registrant as of, and for, the periods presented in this report; |
| 4. | The registrant’s other certifying officer and I are responsible for establishing and maintaining disclosure controls and procedures (as defined in Exchange Act Rules 13a-15(e) and 15d-15(e)) and internal control over financial reporting (as defined in Exchange Act Rules 13a-15(f) and 15d-15(f)) for the registrant and have: |
| (a) | Designed such disclosure controls and procedures, or caused such disclosure controls and procedures to be designed under our supervision, to ensure that material information relating to the registrant, including its consolidated subsidiaries, is made known to us by others within those entities, particularly during the period in which this report is being prepared; |
| (b) | Designed such internal control over financial reporting, or caused such internal control over financial reporting to be designed under our supervision, to provide reasonable assurance regarding the reliability of financial reporting and the preparation of financial statements for external purposes in accordance with generally accepted accounting principles; |
| (c) | Evaluated the effectiveness of the registrant’s disclosure controls and procedures and presented in this report our conclusions about the effectiveness of the disclosure controls and procedures, as of the end of the period covered by this report based on such evaluation; and |
| (d) | Disclosed in this report any change in the registrant’s internal control over financial reporting that occurred during the registrant’s most recent fiscal quarter (the registrant’s fourth fiscal quarter in the case of an annual report) that has materially affected, or is reasonably likely to materially affect, the registrant’s internal control over financial reporting; and |
| 5. | The registrant’s other certifying officer and I have disclosed, based on our most recent evaluation of internal control over financial reporting, to the registrant’s auditors and the audit committee of the registrant’s board of directors (or persons performing the equivalent functions): |
| (a) | All significant deficiencies and material weaknesses in the design or operation of internal control over financial reporting which are reasonably likely to adversely affect the registrant’s ability to record, process, summarize and report financial information; and |
| (b) | Any fraud, whether or not material, that involves management or other employees who have a significant role in the registrant’s internal control over financial reporting. |
| Dated: February 27, 2019 | /s/ Kelli Gallegos | |||||
Kelli Gallegos | ||||||
Principal Financial and Accounting Officer, Investment Pools |
Exhibit 32.1
CERTIFICATION PURSUANT TO
18 U.S.C. SECTION 1350
AS ADOPTED PURSUANT TO
SECTION 906 OF THE SARBANES-OXLEY ACT OF 2002
The undersigned, Daniel Draper, Principal Executive Officer of Invesco Capital Management LLC, the Managing Owner of Invesco DB Base Metals Fund (the “Fund”), a series of Invesco DB Multi-Sector Commodity Trust, hereby certifies pursuant to 18 U.S.C. Section 1350, as adopted pursuant to Section 906 of the Sarbanes-Oxley Act of 2002, that:
| (1) | The Fund’s Annual Report on Form10-K for the year ended December 31, 2018, as filed with the Securities and Exchange Commission on the date hereof (the “Annual Report”), fully complies with the requirements of Section 13(a) or 15(d) of the Securities Exchange Act of 1934, as amended; |
| (2) | The information contained in the Annual Report fairly presents, in all material respects, the financial condition and results of operations of the Fund; |
| (3) | This certification accompanies the report to which it relates, is not deemed filed with the Securities and Exchange Commission and is not to be incorporated by reference into any filing of the Company under the Securities Act of 1933, as amended, or the Securities Exchange Act of 1934, as amended (whether made before or after the date of such report), irrespective of any general incorporation language contained in such filing. |
| Dated: February 27, 2019 | /s/ Daniel Draper | |||||
Daniel Draper | ||||||
Principal Executive Officer |
Exhibit 32.2
CERTIFICATION PURSUANT TO
18 U.S.C. SECTION 1350
AS ADOPTED PURSUANT TO
SECTION 906 OF THE SARBANES-OXLEY ACT OF 2002
The undersigned, Kelli Gallegos, Principal Financial and Accounting Officer, Investment Pools, of Invesco Capital Management LLC, the Managing Owner of Invesco DB Base Metals Fund (the “Fund”), a series of Invesco DB Multi-Sector Commodity Trust, hereby certifies pursuant to 18 U.S.C. Section 1350, as adopted pursuant to Section 906 of the Sarbanes-Oxley Act of 2002, that:
| (1) | The Fund’s Annual Report on Form10-K for the year ended December 31, 2018, as filed with the Securities and Exchange Commission on the date hereof (the “Annual Report”), fully complies with the requirements of Section 13(a) or 15(d) of the Securities Exchange Act of 1934, as amended; |
| (2) | The information contained in the Annual Report fairly presents, in all material respects, the financial condition and results of operations of the Fund; |
| (3) | This certification accompanies the report to which it relates, is not deemed filed with the Securities and Exchange Commission and is not to be incorporated by reference into any filing of the Company under the Securities Act of 1933, as amended, or the Securities Exchange Act of 1934, as amended (whether made before or after the date of such report), irrespective of any general incorporation language contained in such filing. |
| Dated: February 27, 2019 | /s/ Kelli Gallegos | |||||
Kelli Gallegos | ||||||
Principal Financial and Accounting Officer, Investment Pools |