UNITED STATES
SECURITIES AND EXCHANGE COMMISSION
Washington, D.C. 20549
FORM 20-F
| ¨ | REGISTRATION STATEMENT PURSUANT TO SECTION 12(b) or (g) OF THE SECURITIES EXCHANGE ACT OF 1934 |
OR
| x | ANNUAL REPORT PURSUANT TO SECTION 13 OR 15(d) OF THE SECURITIES EXCHANGE ACT OF 1934 |
For the fiscal year ended: 1 January 2010
OR
| ¨ | TRANSITION REPORT PURSUANT TO SECTION 13 OR 15(d) OF THE SECURITIES EXCHANGE ACT OF 1934 |
OR
| ¨ | SHELL COMPANY REPORT PURSUANT TO SECTION 13 OR 15(d) OF THE SECURITIES EXCHANGE ACT OF 1934 |
Date of event requiring this shell company report
For the transition period from to
Commission file number 000-53684
CSR plc
(Exact name of Registrant as specified in its charter)
ENGLAND
(Jurisdiction of incorporation or organization)
Churchill House, Cambridge Business Park, Cowley Road, Cambridge, CB4 0WZ, England, Tel: +44 (0) 1223 692 000
(Address of principal executive offices)
Adam R. Dolinko, General Counsel — Tel: +44 (0) 1223 692 000, Fax: +44 (0) 1223 692 001 Churchill House, Cambridge Business Park, Cowley Road, Cambridge CB4 0WZ, England
(Name, Telephone, E-mail and/or Facsimile number and Address of Company Contact Person)
Securities registered or to be registered pursuant to Section 12(b) of the Act: None
Securities registered or to be registered pursuant to Section 12(g) of the Act: Ordinary Shares, par value £0.001
Securities for which there is a reporting obligation pursuant to Section 15(d) of the Act: None
Indicate the number of outstanding shares of each of the issuer’s classes of capital or common stock as of the close of the period covered by the annual report.
| | |
| Ordinary Shares, par value £0.001 | | 182,187,878 |
Indicate by check mark if the registrant is a well-known seasoned issuer, as defined in Rule 405 of the Securities Act. Yes ¨ No x
If this report is an annual or transition report, indicate by check mark if the registrant is not required to file reports pursuant to Section 13 or 15(d) of the Securities Exchange Act of 1934. Yes ¨ No x
Indicate by check mark whether the Registrant (1) has filed all reports required to be filed by Section 13 or 15(d) of the Securities Exchange Act of 1934 during the preceding 12 months (or for such shorter period that the Registrant was required to file such reports), and (2) has been subject to such filing requirements for the past 90 days. Yes x No ¨
Indicate by check mark whether the registrant has submitted electronically and posted on its corporate Web site, if any, every Interactive Data File required to be submitted and posted pursuant to Rule 405 of Regulation S-T (§232.405 of this chapter) during the preceding 12 months (or for such shorter period that the registrant was required to submit and post such files). Yes ¨ No ¨
Indicate by check mark whether the registrant is a large accelerated filer, an accelerated filer, or a non-accelerated filer. See definition of “accelerated filer and large accelerated filer” in Rule 12b-2 of the Exchange Act. (Check one):
| | | | |
Large accelerated filer ¨ | | Accelerated filer ¨ | | Non-accelerated filer x |
Indicate by check mark which basis of accounting the registrant has used to prepare the financial statements included in this filing:
| | | | |
U.S. GAAP ¨ | | International Financial Reporting Standards as issued by the International Accounting Standards Board x | | Other ¨ |
If “Other” has been checked in response to the previous question, indicate by check mark which financial statement item the registrant has elected to follow. Item 17 ¨ Item 18 ¨
If this is an annual report, indicate by check mark whether the registrant is a shell company (as defined in Rule 12b-2 of the Exchange Act). Yes ¨ No x
(APPLICABLE ONLY TO ISSUERS INVOLVED IN BANKRUPTCY PROCEEDINGS DURING THE PAST FIVE YEARS.)
Indicate by check mark whether the registrant has filed all documents and reports required to be filed by Sections 12, 13 or 15(d) of the Securities Exchange Act of 1934 subsequent to the distribution of securities under a plan confirmed by a court. Yes ¨ No ¨

csr
Better connected
CSR plc Annual Report and Form 20-F 2009
Our technology is everywhere
CSR plc
Annual Report
and Form 20-F
2009
This is the Annual Report of CSR plc for the year ended 1 January 2010. It complies with UK regulations and is the Annual Report on Form 20-F for the US Securities and Exchange Commission to meet US regulations. Cross references to the itemized headings of the Form 20-F are included on page 176. This Annual Report has been sent to shareholders who have elected to receive a copy. A separate notice of the annual general meeting to be held on 19 May 2010 has been issued to all shareholders.
In this Annual Report, references to “CSR”, “the Group”, “the Company”, “we”, and “our” are to CSR plc and its subsidiaries (including SiRF Technology Holdings, Inc., which became a subsidiary of CSR in June 2009) and lines of business, or any of them as the context may require.
References to the years 2009, 2008 and 2007 are to the financial years ended 1 January 2010 (for 2009), 2 January 2009 (for 2008) and 28 December 2007 (for 2007). Unless otherwise stated, all non-financial statistics are at 1 January 2010.
This Annual Report contains forward looking statements with respect to the Group’s financial condition, operating results and business strategy, plans and objectives. Please see the section entitled “Cautionary Note Regarding Forward Looking Statements” and the discussion of our principal risks and uncertainties in the section entitled “Risk Factors”.
This Annual Report includes measures which are not defined by generally accepted accounting principles, or GAAP, such as International Financial Reporting Standards, or IFRS. These non-GAAP measures are included in this Annual Report because the directors believe they are useful to investors. Our management uses these non-GAAP measures, along with the most directly comparable GAAP financial measures, in evaluating our operating performance and value creation. These non-GAAP measures include “underlying research and development expenses”, “underlying sales, marketing and administration expenses”, “underlying operating profit”, “underlying net profit”, “underlying diluted earnings per share” and “free cash flow”. For a detailed discussion of the reasons behind this presentation and full reconciliations of each measure to the most directly comparable IFRS measure, refer to the discussion on pages 15–16 and 39–44.
Statutory income statement information is given on page 93 of the financial statements.
This Annual Report contains references to CSR’s website. These references are for convenience only – we are not incorporating by reference any information posted on www.csr.com.
This Annual Report has been drawn up and presented in accordance with and in reliance upon applicable English company law and the liabilities of the directors in connection with this report shall be subject to the limitations and restrictions provided by such law.

Who we are What we do
We deliver platforms that enrich consumer experience by connecting people, content and services. Connecting with leaders CSR is a leading provider of connectivity, audio and location platforms. Our technologies are enhancing consumer experience worldwide through products delivered by market leaders in the mobile phone, automotive, consumer and computer industries. In 2009, CSR won more Bluetooth design-wins than all of our competitors combined. Connecting with your location With the acquisition of SiRF, we now have a leading position in connectivity and location platforms. We can enhance the user experience with mainstream mobile devices by intelligent integration of multiple wireless connectivity and location-awareness technologies. Never again should you be lost or disconnected. Just look around, our technologies are used all over the world to help you be location aware and connected. Connecting with extra senses Our audio platforms significantly enhance consumer experience with voice and music in hands-free and headset environments. Connecting with quality We have a global reputation for commercial and operational excellence. Leaders in multiple markets rely on us to deliver to their exacting standards. Our GPS and Bluetooth technology is a leader in the automotive sector, a market renowned around the world for their incredibly high standards and quality requirements. Connecting with opportunity CSR launched a completely refreshed product portfolio in 2009 with new Bluetooth, GPS and Wi-Fi offerings. There are a range of potential applications for these products to connect people, content and services.
Handsets
Mono headsets
Stereo headsets
Wi-Fi
MP3 players
Automotive
GPS
PCs
Gaming
Consumer

Where we do it
A leading provider of wireless connectivity technology, we have 1,348 skilled professionals operating out of 11 countries.
Phoenix, USA Employees 50
Seoul & Gumi, South Korea Employees 41
Cambridge, UK Employees 621
Cedar Rapids, USA Employees 14
Dallas, USA Employees 26
Singapore Employees 7
Detroit, USA Employees 23
Aalborg, Denmark Employees 37
Sophia Antipolis, France Employees 27
Stockholm, Sweden Employees 21
San Jose & Santa Ana, USA Employees 159
Tokyo, Japan Employees 26
Taipei & Chungli, Taiwan Employees 38
Bangalore & Noida, India Employees 104
Beijing, Shanghai & Shenzhen, China. Employees 154

DIRECTORS’ REPORTCHAIRMAN’S STATEMENT
2009 has been a year of substantial achievement for your company against a most difficult economic backcloth. We took decisive management action, saw the opportunity for a value-creating transaction, which we successfully completed, and strengthened our balance sheet. Consequently, we are well positioned to build on the strengths of the enlarged CSR and return to growth in 2010.
A year ago, my comments focused on the unprecedented economic down-turn, following the global financial crisis and explained how we were actively taking steps that would position the Group to come through the difficult conditions that 2009 was expected to create.
This year, my comments focus on CSR’s achievements in 2009 and our ability to leverage these through 2010 and beyond.
As we expected, 2009 was indeed a very challenging year. General consumer confidence across the world hit new lows. For us, this was reflected both by decreased levels of demand for consumer electronics and also by substantial de-stocking by our customers and by their distribution channels, particularly in the first half of the year. Inevitably, demand for our products, and hence our revenue, was directly affected. 2009 revenue was $601.4 million, a fall of $93.5 million, or 13% down, on the revenue of $694.9 million for 2008. Ignoring the contribution to revenues in the second half of 2009 from the acquisition of SiRF, CSR’s revenues on a like for like basis were approximately $471.4 million or 32% lower than 2008. The operating loss for the year was $15.9 million, against a loss of $8.5 million in 2008. Underlying operating profit fell to $26.9 million in 2009 from $72.8 million in 2008.
A year ago, I nevertheless expressed the view that our strategy and the prompt actions we had taken in response to the downturn positioned us to work through the difficult times, and that we were capable
of building on our strengths and would fight to maintain our market leading position. I also expressed confidence in our management team to take the action necessary to achieve these objectives and in the underlying opportunities for future growth in the wireless connectivity markets.
This confidence was well placed. Management did indeed take the necessary actions, delivering as we had promised on the efficiency programmes we put in place. In addition, the pace of penetration of wireless connectivity and new applications has continued in mobile phones, in consumer electronics more widely and in other sectors, such as automotive.
The Board also recognised that challenging times can create opportunities. We identified such an opportunity in the acquisition with SiRF, a market leader in location and related technology, and a business we saw as being wholly complementary to our own.
We announced the SiRF transaction in February last year and completed it last June. SiRF is now fully integrated into CSR. The new business contributed approximately $130.0 million in revenue, out of a total of $407.9 million for the second half of 2009. Moreover, SiRF has enlarged our business, brought talented new people into our organisation, expanded our technological capabilities, our customer base and our position in the Connectivity Centre, delivered synergies in accordance with our expectations and helped increase our cash flows.
It has already added shareholder value, and it has helped CSR exit 2009 a stronger company, with greater potential to further add value.
We remain appropriately cautious about the global economic outlook for 2010. Who wouldn’t? But we believe that our strengths and the dynamics of our market place mean we can look again to organic growth this year. We also remain alert to possible
CSR plc Annual Report and Financial Statements 2009
2
further value-creating strategic moves. We have no current specific intentions, but our world is not static, and we believe CSR has the proven ability to take advantage of selective opportunities and we end 2009 with a markedly strengthened balance sheet with over $400 million net cash and treasury deposits.
In preparation for the SiRF transaction, the management teams worked together on a detailed and robust integration plan which we initiated as soon as the deal was finalised. In addition to giving us a strong presence in Silicon Valley and China, the acquisition brought a substantial number of new people into the organisation. The combination of two technology companies with the inevitable overlap in skill-sets and roles unfortunately meant that some redundancies in each of the formerly separate organisations was necessary. The redundancy process was carried out with sensitivity but also promptly, allowing us to re-align the newly enlarged organisation and to focus on the future and the growth of the new business.
Product portfolio
2009 saw us make significant progress on developing our product portfolio.
We launched our new BC7000 family of products which comprises our latest generation of Bluetooth with FM transmit and receive functionality. This was positively received. It has reinforced business from existing customers and has led to new demand from others.
Other key product launches have included our BT/Wi-Fi module, our standalone Wi-Fi chip and CSR Synergy, our new software stack, which supports the integration of multiple wireless devices and builds on the successful legacy of our widely adopted BlueCore Host Software.
Following the acquisition of SiRF, we also secured business with SiRFstarIV, our next generation GPS chip and a direct reflection of the collaboration between the newly combined CSR and SiRF teams.
As Joep van Beurden, our CEO explores in his review, we expect the sharing of knowledge, ideas and experience within our enlarged technology teams to result in further significant product announcements
during this year, in projects that advance and go beyond our established strongholds in GPS and Bluetooth.
Board changes
Following the completion of the SiRF acquisition, we were delighted to welcome Dado Banatao, SiRF’s Executive Chairman and Interim CEO, as a Non-Executive Director. Dado brings a broad perspective and extensive experience in our sector gained from executive and non-executive roles he has held in semiconductor businesses around the world and from his background as an engineer, from which he is credited with developing several key semiconductor technologies.
In addition, Kanwar Chadha, a founder and former Vice President of Marketing at SiRF, has joined our Board as an Executive Director and our Chief Marketing Officer. Well-known and respected throughout our industry, Kanwar was instrumental in the growth and development of SiRF and brings extensive knowledge of the consumer technology landscape. He has over 23 years of experience in various, technical, marketing and management positions at leading organisations including S3 Inc., AQuesT, Inc., and Intel.
As planned, David Tucker who was chairman of our Audit Committee and our Senior Independent Director, retired in May last year. We thank him very much for his expertise and valuable contribution to the Board over the last five years.
Following David’s retirement, Anthony Carlisle, who has been a non-executive director of CSR since July 2005, was appointed the Senior Independent Director, and Andrew Allner, who joined our Board in October 2008 was appointed Chairman of the Audit Committee. We are delighted to have such strong individuals to assume where David left off.
A committed team
CSR is a global business serving a global market. Our products are sold to leading electronic consumer brands who in turn sell to customers around the world. Our key designs are created in the UK, US and China, whilst most of our manufacturing takes place in the Far East. The consumers who rely on our products are located around the world.
CSR plc Annual Report and Financial Statements 2009
3
DIRECTORS’ REPORT CHAIRMAN’S STATEMENT continued
What we are today, and what we can become tomorrow, flow directly from the skills, dedication and attitude of our people. I find it encouraging and energising to see so many different nationalities and skill-sets working together across the full range of disciplines in our organisation and across the geographies in which we operate. Through their efforts, we are executing well, delivering on our Connectivity Centre and platform strategy and opening-up new areas for growth. I thank them all unreservedly for their resilience, commitment and contribution.
2010 will be another challenging year, but I expect us to continue to build on the progress made in 2009. We have an excellent and growing suite of products, a well-judged strategy, a strong financial base and a great team. We look forward with confidence.
Ron Mackintosh
Chairman
CSR plc Annual Report and Financial Statements 2009
4
DIRECTORS’ REPORTCHIEF EXECUTIVE’S REVIEW
Despite the considerable macro challenges of 2009, CSR made strong strategic, operational and commercial progress during the year. This has strengthened our business, delivered significant shareholder value over the year and positioned us for our next phase of growth.
In the first half of last year, the management actions we had put in place at the end of 2008 meant we were in a much stronger position to withstand the impacts of the global recession. We also took the opportunity for a value-creating acquisition of SiRF which we completed at the end of June.
We predicted that the first half of 2009 would prove difficult and our results reflected this with revenue down for that period at $193.5 million in 2009 against $349.3 million in 2008. In the second half, largely as a result of the ending of de-stocking in our customer channels, and the successful integration of SiRF, we were able to increase revenues against the equivalent period in 2008, saw a return to profitability and substantially strengthened our balance sheet. SiRF contributed approximately $130.0 million of revenue in the second half, resulting in revenues for that period being $407.9 million compared with $345.6 million in 2008.
Throughout the year, we launched an entire new generation of connectivity, audio and location products. Commercially, our design win traction has been excellent. This is illustrated by the fact that we won more Bluetooth design wins in 2009 than all of our competition put together.
2010 will not be plain sailing for anyone; but the achievements of last year have significantly widened and deepened our pool of talent, product portfolio and market position. Coupled with our strong financial position, all this equips us to grow and create shareholder value.
2009 – a platform for 2010 and beyond
Throughout 2009, the company has stayed focused on the Connectivity Centre. The Connectivity Centre brings together many aspects of wireless connectivity products: Bluetooth, FM radio, Wi-Fi, high quality audio for music, Bluetooth low energy, Near Field Communications and GPS location-finding
technology. All these technologies can ultimately co-exist alongside each other.
The acquisition of SiRF has complemented CSR’s existing software GPS technology, materially expanded our GPS product offerings and has turned our company into a leader in location technology.
Building on our strength in the Connectivity Centre, the combined company has successfully expanded our product portfolio and offer connectivity, location and audio platforms.
CSR and SiRF: natural partners
Opportunity is an integral aspect of crisis and when we saw the opportunity to acquire SiRF we moved quickly. Coming as it did at the economic and market nadir, this required courage and commitment from both management teams, boards and shareholders.
With the two companies coming together, it was important that the integration was carried out smoothly and at speed. I am proud to report that we fully integrated the two entities within three months, and ahead of schedule. As an example of the speed with which we integrated, the new, combined sales force was fully operational within just two days, keeping any disruption at the customer level to an absolute minimum.
The new strengths brought into the enlarged company prompted an evolution in the way we work with our market places during 2009. We are now organised into three Business Units: Handsets (HBU), Automotive & PNDs (APBU) and Audio and Consumer Electronics (ACBU). HBU accounts for around half of our revenue, with the balance shared roughly equally across the other two units.
CSR plc Annual Report and Financial Statements 2009
5
DIRECTORS’ REPORT CHIEF EXECUTIVE’S REVIEW continued
A new generation of platforms and products
Throughout 2009 we launched an entire new generation of connectivity, audio and location platforms and products, these included:
| | · | | The BC7000 family, which combines Bluetooth with FM Transmit, FM Receive, Bluetooth low energy and GPS capability. This brand new, high performance product is now designed-in with multiple Tier One customers. |
| | · | | UniFi6000, our third generation embedded Wi-Fi product, offers the smallest chip size together with low cost. Announced in Q4, we are currently ramping into mass production with three customers, including with our launch customer (a leading Japanese mobile phone manufacturer), who are all taking UniFi6000 as part of our CSR9000 module. There is also significant interest from other customers. |
| | · | | CSR9000, our Bluetooth, FM radio and Wi-Fi combination module, is in mass production. In November, we learned that this product had been certified under China’s Wireless LAN Authentication and Privacy Infrastructure (WAPI) qualification, making it an ideal option for China’s many OEMs developing leading wireless technologies for the rapidly growing Chinese market. |
| | · | | The SiRFstarIVe and IVt next generation GPS products both achieved successful launches in the summer, to considerable customer acclaim. SiRFstarIVe is optimised for consumer electronic devices such as digital cameras, while the SiRFstarIVt is optimised for mobile phones. We are delighted that we started mass production in the fourth quarter of 2009 with SiRFstarIV, following a design-win with a leading North American smartphone manufacturer. |
| | · | | Also in 2009, prior to the acquisition, SiRF launched two SOC (system on chip) products, SiRFatlasIV and SiRFprima. These SOCs are complete personal navigation devices on a single piece of silicon, and bring new standards of performance to both the high and the low ends of the PND marketplace. |
Seizing the opportunities presented by connectivity, location and audio platforms
With this new generation of products in our Connectivity Centre portfolio, we are a well-balanced company in an excellent position to exploit the opportunities available in 2010.
Our research, which is derived from our proprietary information as well as an analysis of data from research firms, indicates that the total global market for connectivity location and audio platforms in 2008 was around $3.5 billion. Depending on the macroeconomic picture, we expect this market to increase in value by between 15% and 30% per year and to be worth between $5 billion and $7 billion by 2012. Connectivity, location and audio are some of the few areas in the semi-conductor industry showing this degree of value growth.
The growth opportunity mirrors our three Business Units. In handsets, growth is being driven by the market penetration of smart phones and their Bluetooth, GPS and audio and Wi-Fi capabilities. There is significant momentum behind smart phones. Nokia and RIM and other seasoned performers in this sector are being joined by relative newcomers such as Palm, Dell, Google and HTC to enable more and more consumers to take the internet with them, wherever they go.
We are now seeing similar trends in the automotive sector. Many vehicles already feature Bluetooth and GPS, and Wi-Fi is the next logical step. Consumer electronics are on a similar journey. A digital camera can sync with a PC via Bluetooth to create a back-up of a photo while using GPS to ascertain location.
Operational excellence
Our reputation is built on technical and commercial innovation, supported by a continuous focus on operational excellence for delivering integrated circuits to our customers utilising the strong relationships with our fabrication and test partners. This continued during 2009, as with the integration of SiRF, we added additional partners to our supply chain.
We place significant emphasis on the working relationships with our suppliers. As a key part of the planning for the acquisition and the execution of our integration plan, our senior executives met with each
CSR plc Annual Report and Financial Statements 2009
6
of our suppliers to discuss the acquisition and outline our objectives, to ensure continuity of supply with our customers. Also during 2009, the strength of partnership between CSR and TSMC enabled significant progress in the development of the 40nm RF CMOS technology for the company’s next generation product families. CSR also continued to enhance and expand its capacity for advanced WLCSP technology addressing all segments of the merged company’s wireless product portfolio, which provides us with technological advantage and provides real benefits in reducing our manufacturing costs.
And of course we continued our long standing tradition of industry leading customer service.
Confidence in the future
At CSR we have not only survived a difficult period, but we have strengthened our position in many ways. As a leading pure-play connectivity company, we have a broad customer base, an extensive product portfolio and a talented team committed to delivering excellent customer service and an enhanced consumer experience.
We are a leading player in the market for wireless connectivity and location: a fast growing segment in the semiconductor market. We are not dependent on a technology inflexion point or for an infant market to show signs of growth. The Connectivity Centre is established as the real value centre: the opportunity is here, and it is here now.
This has been a very harsh recession and our industry is certainly not in full recovery mode. As Vice Chairman of the Global Semi-conductor Alliance, I am aware of the mood of our peers and recognise that there remains work to be done.
We expect the market for connectivity audio and location platforms to increase in value by between 15% and 30% per year. Our strong strategic, operational and commercial progress puts us in an excellent position to make use of this opportunity.
For 2010, we naturally have caution about the global economic outlook, but we believe that the market for connectivity audio and location platforms will show significant growth by value this year and, indeed, beyond. Our achievements of last year have significantly widened and deepened our capacity and capabilities and, coupled with our strong financial position, this positions us to take advantage of the opportunities and build growth and further shareholder value.
Outlook
The global economy and our marketplace ended 2009 in significantly better health than they started, and this improved tone has continued into 2010. We will maintain caution about the strength of the economic recovery, but we nevertheless expect demand for our products to continue to grow, with 2010 seeing significantly increased penetration of connectivity, audio and location technologies. Consumer demand for smartphones and other connectivity devices has gathered pace, and Bluetooth, GPS and Wi-Fi are becoming important features not just in handsets, but in an increasingly wide array of electronic consumer devices and the automotive industry.
Our business is performing well. We expect to ramp several of our new product lines in 2010 – BC7000, CSR9000 and SiRFstarIV are all ramping in line with our expectations. Our early success with these new products gives us confidence in our ability to gain market share in a growing market.
Joep van Beurden
Chief Executive Officer
CSR plc Annual Report and Financial Statements 2009
7
DIRECTORS’ REPORTBUSINESS AND FINANCIAL REVIEW
|
| |
Business and financial review |
Introduction
CSR is a leading provider of multifunction connectivity, audio and location platforms. CSR’s technology portfolio includes:
| | · | | Global Positioning Systems, (GPS); |
| | · | | Frequency Modulated (FM) Radio; |
| | · | | Wireless-Fidelity or Wi-Fi (typically associated with wireless communication standard (IEEE802.11); |
| | · | | Near Field Communication (NFC) which is a short range wireless frequency which enables the transfer of data, including larger files and secure transaction, between devices. |
Together these technologies enable silicon platforms that incorporate fully integrated radio, baseband and microcontroller elements to seamlessly access the Connectivity Centre and other platforms for the benefit of consumers.
CSR’s technologies have been adopted by market leaders into a wide range of mobile consumer devices such as mobile phones, automobile navigation and telematics systems, personal navigation devices (PNDs), wireless headsets, personal computers (PCs), mobile internet devices, GPS recreational devices, digital cameras, gaming devices, plus a wide range of personal and commercial tracking applications.
Strategy
Our strategic objective is to be a leading supplier of integrated circuits for wireless connectivity. To achieve this goal, we intend to:
Focus on technologies that form key parts of connectivity and other platforms including Bluetooth, GPS, NFC, high quality audio and Wi-Fi.
We believe that large opportunities exist for the deployment of short-range wireless products that provide high quality co-existence capable of operating
concurrently without degradation in optimum performance and that Bluetooth, FM radio, GPS location finding technology, Wi-Fi, high quality audio for music, NFC and other to be developed future wireless technologies can all ultimately co-exist alongside each other.
We believe that the market for connectivity, audio and location products in the medium term will be driven primarily by developments in smart and feature phones. We believe that, with our help, customers can put world-class connectivity in their products at competitive prices and are able to choose, within reason, what capabilities they need for any particular product to meet end-customer demand. This provides our customers with an important differentiator. Despite the economic slowdown, we believe that these markets have the potential to grow from around $3.5 billion in 2008 to between $5 billion and $7 billion by 2012.
Increase software content in new products.
We believe that increased software content can improve the robustness and flexibility of our solutions and helps to distinguish them from competing offerings. We also believe our software can increase the overall value proposition of our products and assists customers in efficient integration of our solutions into their devices.
In addition, we believe software developed by us or by developers using our development tools, increases the likelihood that customers will use our products in future designs. We intend to increase the emphasis on software in the future in order to increase the software content of our solutions.
We aim to continue to develop tools to allow OEMs and ODMs to develop their own applications software. This, together with our own embedded software, will help enable us and our customers to create highly featured and differentiated products.
Extend expertise within our existing capabilities in wireless technologies.
We expect to continue the evolution of our expertise in Bluetooth technology to seek differentiated products for different segments of the market. Our customers are presently incorporating our seventh generation of Bluetooth into new products that went
CSR plc Annual Report and Financial Statements 2009
8
into mass production in the third quarter of 2009. We intend to continue the development of further generations of our BlueCore integrated circuits to seek additional features and functionality, reduce size, and lower power consumption.
Focus on lowering the cost of integrated circuits.
We intend to continue using the industry standard Complementary Metal Oxide Semiconductor technology, or CMOS, manufacturing process to enable us to supply integrated circuits with small chip size and low cost, and in high volumes. As we improve our designs, manufacturing and testing technology and obtain greater operational efficiencies with increasing commercial deployment of our integrated circuits, we believe we will be able to continue to reduce the production costs of our integrated circuits.
We have, since 2001, progressively transitioned to smaller “geometries” or size of the integrated circuits, which is critical to reducing costs for our customers, and maintaining a competitive advantage. In 2008, we developed a range of new products at 90nm and 65nm form factor. In 2009, CSR increased volume production for both 90nm and 65nm products. In addition, since 2008 we have been engaged with TSMC on the development of 40nm technology for advanced radio frequency/wireless product applications.
We have developed advanced new packaging technology to complement our world-leading Wafer Level Chip Scale Package, or WLCSP, capability. WLCSP enables us to prepare and package a chip at the wafer level instead of the more traditional method, which involves assembling the package after the wafer has been diced into individual chips.
We have expanded our assembly manufacturing base by qualifying the Advanced Semiconductor Engineering, or ASE, facility in Shanghai, China for manufacturing low cost packages. In addition, we have extended our WLCSP capability by transitioning new products from 8” wafers to ASE’s new 12” wafer manufacturing line. This provides efficiencies in testing and packaging and therefore saves on costs.
We work closely with our partners when implementing these new products, as the process of adopting
leading-edge technologies brings significant challenges. In conjunction with TSMC and ASE, we work to ensure that the introduction of these changes does not adversely impact either delivery schedules or product quality. We intend to continue to build on the strong relationships with both TSMC and ASE, ensuring that our customers benefit from an operational capability focused on world-leading quality, delivery and performance.
In addition, with the acquisition of SiRF the supply chain sourcing base has expanded to include Samsung, IBM and ST Microelectronics for wafer manufacturing. Assembly and test supply has also expanded and includes such major suppliers as STATS ChipPAC Limited, Amkor Technology Inc and Siliconware Precision Industries Limited. We are actively working on multiple projects with this expanded supply team to ensure cost effective manufacturing capability and exceptional quality across all fabrication disciplines.
Enhance sales, marketing and technical support organisations.
We are committed to maintaining the high levels of technical support we currently provide to our customers, as well as pursuing new markets. We believe that this enables customers to efficiently and effectively integrate our solutions into their devices. We provide this application and engineering support to customers at global locations thereby enabling us to best support our customers.
Leverage expertise in next generation wireless markets.
We believe that the evolution of existing wireless standards and the introduction of new standards, with differing performance characteristics that enable new applications, provides a substantial medium term opportunity. Our single chip, radio frequency and software design expertise, combined with our knowledge of the integration of wireless solutions with our customers’ products, puts us in a favourable position to pursue such future opportunities as they arise.
Our strategy depends on a number of factors, and may be materially adversely affected by a deterioration in economic conditions, manufacturing or testing problems arising at our independent suppliers, delays
CSR plc Annual Report and Financial Statements 2009
9
DIRECTORS’ REPORT BUSINESS AND FINANCIAL REVIEW continued
in designing and introducing new products, competitive pressures and other risks. For a discussion of these risks, see “Risk Factors.”
Overview
Our revenue was $601.4 million for 2009, a decline of 13.5% compared to 2008 revenue of $694.9 million (2007: $848.6 million) and is generated principally from the sale of our products to original equipment manufacturers, or OEMs, and original design manufacturers, or ODMs, serving the retail consumer market. Prior to 2009, over 95% of our revenue was derived from the supply of Bluetooth products.
Our operating loss for 2009 was $15.9 million compared to a loss of $8.5 million in 2008 (2007: profit of $150.1 million). The underlying operating profit for 2009 decreased to $26.9 million compared to $72.8 million in 2008 (2007: underlying operating profit of $181.3 million). Underlying operating profit is a non-GAAP measure, an explanation of our use of non-GAAP measures is given on page 15.
On 26 June, 2009, we completed the acquisition of SiRF Technology Holdings, Inc., or SiRF, in a share-for-share transaction in which SiRF became a subsidiary of CSR, satisfied through the issue of 47,658,256 ordinary shares in CSR plc. Based on the share price of our ordinary shares at the time the transaction was announced on 9 February 2009, this represented a total consideration of approximately $136 million, which, due to increases in our share price, subsequently increased to $281.5 million on the date of the acquisition.
Following the acquisition, around $130 million of the Group’s revenue during the remainder of 2009 was derived from GPS products, all of which came from SiRF. The performance of the GPS business acquired as a result of the acquisition in the second half of 2009 was consistent with our expectations at the time of completion. Excluding the contribution to revenues in the second half of 2009 from the acquisition of SiRF, CSR’s revenues on a like for like basis were approximately $471.4 million or 32% lower than 2008. Our financial results for 2009 include SiRF from the date of completion, but SiRF’s financial performance is not reflected in our financial results for the period of 2009 prior to the acquisition or for any of the prior financial years.
Throughout the year we also maintained our investment in product innovation, reinforced our execution and built upon our strong customer relationships. Innovative research and development, or R&D, has a material impact on our competitive position, the quality of our products and our results. R&D is at the heart of CSR’s strength in the products and solutions that we offer to our customers, underpinning and enabling our ability to compete effectively.
A core objective of CSR’s R&D effort is to bring to market innovative integrated circuits and connectivity solutions to replace existing products and technologies that may be nearing the end of their product lifecycle. Product lifecycles vary – in some cases they can extend to several years, while in others the rate of technological innovation may compress the lifecycle. Product average selling prices generally decline over the product life cycle.
CSR invested $169.7 million in R&D in 2009 as compared with $158.1 million in 2008 and $147.5 million in 2007. We believe that this level of investment is important to ensure that we are able to continue to compete effectively in a rapidly evolving market which requires the advancement of existing technologies and the development of innovative solutions in order to sell our products to customers.
A discussion of the changes in financial performance of the Business Segments starts on page 18.
SiRF is a party to several pending lawsuits, which commenced before the acquisition by CSR and which seek both monetary damages and injunctive relief. The Company is defending these suits vigorously. No provision has been made in the financial statements because it is not possible to make a reliable estimate of the outcome of this litigation. For further information concerning this litigation, please see page 49 as well as note 27 to the Consolidated Financial Statements on pages 133 and 134.
Business Segments
Following the acquisition of SiRF in June 2009, we reorganised the business into three business units: Handsets (HBU); Audio & Consumer (ACBU) which includes headsets, PCs and consumer products; and Automotive & Personal Navigation Devices (APBU). Prior to this, in the 2008 and 2007 fiscal years, we
CSR plc Annual Report and Financial Statements 2009
10
operated in two business segments: Cellular, which included handsets and headsets; and Non-Cellular, which included applications beyond the mobile phone, such as PC, automotive and consumer applications. The comparative financial information has been restated to be comparable for the three new business segments. As stated above segment information for the period prior to the acquisition does not include SiRF’s financial results.
In 2009, approximately 52% of revenue was generated by the HBU segment, approximately 27% was generated by the ACBU segment and approximately 21% was derived from the APBU segment. This compared to 50%, 43% and 7% respectively in 2008. Approximately 60% or $78 million of the total revenue in the APBU segment is derived from GPS-related products following the acquisition of SiRF.
HBU segmentDuring 2009, overall revenue in our handset segment declined by 9.7% compared to 2008, mainly as a result of the continued impact of the loss of a Bluetooth FM programme with one of our largest customers, which we have previously reported. For a detailed explanation on this matter please see page 17. The overall decline in our sales from 2008 to 2009 was partially offset by the inclusion of revenue derived from the sale of SiRF GPS products in the second half of the year following our acquisition of SiRF.
In 2009, we launched BC7000, our Bluetooth and FM Receive/Transmit combination chip device. We secured a number of design wins during the year and by the latter part of 2009 this chip was shipping into three leading Tier One manufacturers in multiple handset programmes. We expect that during 2010, the level of our revenue derived from BC7000 will increase as a result of additional design wins and the sale of new devices using this technology. This supports our belief that it is possible to mitigate against economic conditions by bringing differentiating technologies to the market and thereby protecting or securing greater market share.
During 2009, the HBU segment made good progress in the launch of new products with a number of our latest generation technologies creating strong interest. Commercial highlights included good performance
from BC6, our standalone Bluetooth offering, which entered volume production in 2008, and which became our best selling product in 2009, overtaking BC4, the largest selling Bluetooth chip of all time, which was first launched in 2005.
CSR was the first company to qualify its solution for the new Bluetooth 4.0 low energy (“BTLE”) specification, continuing our history of being the first company to qualify every Bluetooth standard. While the standard has just been ratified, we are working with multiple customers across multiple end user markets on interesting applications of BTLE and we expect this new standard, which enables a low energy variant of Bluetooth, to become increasingly important as Bluetooth proliferates across more consumer devices.
We also achieved design wins with a number of OEMs for our first generation Wi-Fi part, UniFi1050, which delivered modest sales in 2009. We have been encouraged by customer interest in either our latest generation Wi-Fi product, UniFi6000, our discrete chip-on-board solution, or CSR9000, our combination product with Bluetooth, FM and Wi-Fi technologies. These products are focused on the handset market and early engagements on potential design wins have been positive. In the final quarter of 2009, we started shipping CSR9000 to a leading Japanese mobile telephone manufacturer in addition to two other customers, and we continue to work with a number of other Tier One customers with whom we are targeting additional programmes for 2010.
In GPS technology, the acquisition of SiRF brought together the market leading capabilities of the SiRFstar product family with CSR’s own GPS know-how. With the integration of our teams, following completion of the acquisition in June, we continued to develop various products in this area, including the launch in the third quarter of SiRFstarIV.
This product features micropower SiRFaware and SiRFGeoRecov to enhance location sensitivity and navigation performance and enable the device to be fully operational very quickly after being switched on with minimal battery use. Customer interest in SiRFstarIV during the early sampling phase has been encouraging and this has led to our first design-win with one of the world’s leading smartphone manufacturers in the fourth quarter.
CSR plc Annual Report and Financial Statements 2009
11
DIRECTORS’ REPORT BUSINESS AND FINANCIAL REVIEW continued
ACBU segmentRevenue in our Audio and Consumer segment fell by 45.5% against 2008 to $163.3 million. Revenue was adversely impacted during 2009 by the decline in the total headset market of around 50% (analysis based on CSR’s considered view of a number of analysts’ market reports). For a detailed explanation of the factors impacting sales, please refer to page 17, which discusses revenue performance in 2009.
We focused considerable attention on improving our position in the PC market, recently launching solutions jointly developed with two Taiwan-based vendors, Realtek and Ralink, who are established suppliers of Wi-Fi technology for the PC market. The solutions are part of our strategy to work with other leading technology companies to offer integrated solutions, combining features with significant differentiation in this competitive arena. Our relationships with Realtek and Ralink are gaining momentum and have already resulted in a design-win with a leading PC manufacturer. We are in active dialogue with a number of other leading PC manufacturers who have been quick to see the benefits of our integrated solution. Another segment that has been gaining interest with consumers is the tablet market where we were recently designed into the new ICD Vega touch screen tablet running on the Android platform.
Despite the fall in the total headset market for much of 2009, the high-end headset market experienced increasing demand for advanced high-end technologies that enable OEM’s to provide additional features that enhance the consumer’s experience when listening to speech or music, and an example of this was in the market for Stereo Bluetooth headsets. Contributing to this demand was Apple’s updated iPhone Operating System 3.0, which was launched in the first half of the year. This has led to a significant increase in the number of devices that can now stream stereo audio over Bluetooth and as a result, our customers are increasingly interested in advanced audio distribution profile (or A2DP) stereo Bluetooth streaming. We have the market leading products in this area, and during the third quarter, we also released the world’s first Bluetooth Software Development Kits (SDKs) that enable headset manufacturers to build Bluetooth accessories that conform to the “Made for iPod” standard.
Competition in the headset segment is growing, particularly in developing markets such as China,
where price competition in particular is fierce, especially in the low end markets. Despite these challenges, we continued to be the leading global supplier of Bluetooth integrated circuits for the headset market and we believe that we offer superior technology. We continue to invest in enhanced audio features for higher end headsets, through maintaining our audio centre of excellence in Detroit, where we develop our market leading “Clear Voice Capture” or CVC software and collaborations with key audio specialists such as SRS labs. This is borne out by the growing number of headset manufacturers now endorsing Bluetooth as a high-quality audio transmission mechanism.
In gaming, where the economic downturn was expected to result in a severe decline in end user demand and possible delays in the launch of new products to the market, we saw sales hold up better than we had anticipated and also achieved some encouraging design wins. Particularly pleasing was our win from Sony for their latest portable device the PSP Go which featured our BC5120 product. We also won slots in the controllers for a refreshed PS3 Slim during the year. Manufacturers of gaming devices are heavily reliant on the Christmas market and initial indications are that sales for Christmas 2009 were better than expected, for example in the PS3. The PSP Go is the first portable gaming device to include Bluetooth and we see significant opportunity in this area. Recognising the dominance of the three main gaming manufacturers, we continue to pursue opportunities to grow our market share with all of them.
GPS is becoming increasingly relevant to consumer electronics manufacturers with the increased proliferation of location based services and we saw strong interest for our latest GPS technologies. For example, SiRFstarIII is being designed into an increasing number of digital cameras and camcorders.
APBU segmentIn this segment our revenue grew by 149% against 2008. The increase in revenue was as a result of the acquisition of SiRF. Of total GPS revenue gained through the acquisition, approximately 60% was in the APBU segment. This year also saw increased adoption of our Bluetooth and GPS into new build cars. In the second half of the year, car manufacturers increased the volume of new cars largely in response to recycling initiatives by a number
CSR plc Annual Report and Financial Statements 2009
12
of governments encouraging consumers to replace aged vehicles with new models. In addition, there is a general trend to embed more connectivity and location technologies in new cars. Finally, the difficult macroeconomic climate led many automotive manufacturers to give away optional extras in an effort to stimulate demand during the year, including inbuilt Bluetooth handsfree kits. These factors resulted in significantly greater than expected demand for our automotive products. Our ability to support customers by fulfilling the unexpected requirement for higher volumes of our products helped strengthen our reputation in this demanding sector. We continue to work with a wide range of automotive OEMs and Tier One suppliers which we believe offer opportunities for further growth through 2010. For example, we are engaged with a leading distributor with the aim of selling our latest generation Wi-Fi into the automotive industry.
In 2009, the PND market started on a weak footing following disappointing Christmas 2008 sales. This prompted concerns about the future of PNDs which proved to be premature. Nevertheless, demand was weakest in Europe with North America also seeing weak or flat demand for PNDs. In contrast, the Far East and the developing world continued to see increased levels of demand as electronic mapping for navigation is still new to many of these countries. The market continues to remain very competitive, particularly in the so-called “white box” market in the Far East. However, our business is performing well and a good demonstration of the benefits of the acquisition is our recent design-win to supply a leading North American electronics manufacturer where we are providing both the GPS (via our System on Chip (SoC) platform SiRFatlas) and also Bluetooth.
SiRFprima, our high-end System on Chip (SoC) platform that combines all the necessary electronic circuits and parts for a complete system and integrates them into a single silicon chip focused on the in-dash automotive market, has also received two design-wins in China that we expect will lead to significant sales during 2010. We have also achieved design wins with SiRFatlasIV, our entry-level SoC platform for the PND market.
Market Overview
Our results of operations during 2007-2009 were materially affected by the following trends, several of
which are likely to continue, in addition to factors connected with the economic downturn that impacted the results for 2009 (other than destocking which is largely complete), and which we expect are likely to affect performance in 2010. These include:
| | · | | change in the size of the market for short-range wireless voice and data communications and location and location-based services; |
| | · | | general economic conditions, which affect the level of demand from retail consumers for the connectivity, location and audio products which use our technology; |
| | · | | the impact of intense competition, from third parties, including in respect of product features, pricing strategies and release of new products; |
| | · | | the recognised trend in the semiconductor industry for declining average selling prices; |
| | · | | the tendency for demand in consumer products to be affected by seasonality; |
| | · | | cyclical trends in the semi-conductor industry generally; |
| | · | | restructuring in the semiconductor industry arising from the economic downturn which could affect the availability of sufficient capacity to meet our demands for integrated circuits; and |
| | · | | fluctuations in currency exchange rates, which can affect CSR’s costs in light of the global nature of its business. |
The market for short-range wireless connectivity products has grown very quickly over the last few years. In 2009, notwithstanding the economic recession, the market for these products is believed to have grown by around 20% over 2008 from 2.2 billion units to 2.7 billion units. Even allowing for the current economic uncertainties, based on our analysis of third party market data, we estimate that the market for these solutions may grow from around $3.5 billion in 2008 to between $5 billion and $7 billion by 2012.
In handsets, although on a unit basis the market showed a slight decline in 2009, there remain opportunities, particularly in phones which feature multiple connectivity, audio and location based technologies, where growth is being driven by the market penetration of smart phones with Bluetooth, GPS, audio and Wi-Fi capabilities. There is significant
CSR plc Annual Report and Financial Statements 2009
13
DIRECTORS’ REPORT BUSINESS AND FINANCIAL REVIEW continued
momentum behind smart phones, where Nokia and RIM and other established brands in this sector are being joined by relative newcomers such as Palm, Dell, Google and HTC.
We are also seeing positive trends in the adoption of wireless connectivity technologies by the automotive sector. Many vehicles already feature Bluetooth and GPS and we believe that Wi-Fi is a next step. Consumer electronics shows similar trends. A digital camera can use Bluetooth to sync with a PC to create a back-up of a photo, it can use GPS to ascertain its location, and because the camera knows its location it can use Wi-Fi to access the internet and deliver more information about what the consumer is photographing.
As a consequence of the market opportunities in connectivity, audio and location-based services, competition has intensified as existing and new entrants seek to establish and grow market share. This trend of increasing competition is expected to continue. As the number of companies supplying wireless technology solutions increases, our customers have access to a greater variety of alternative solutions with differing features to those offered by CSR. They are also able to seek better prices in return for awarding contracts and, similarly, competitors are often prepared to offer lower prices in order to secure new business. Our markets have also been impacted by the global economic downturn, which has particularly affected the consumer-oriented markets into which our customers sell.
Much of the technology which we develop and supply to our customers is installed into devices which are sold into consumer markets. Demand for consumer products and therefore for our own products is subject to seasonal variation. This in turn
affects our results which typically are stronger in the second and third quarters of a financial year as our customers increase orders in anticipation of demand for their own products.
Revenue derived from the supply of integrated circuits featuring our Bluetooth technologies remained the most significant part of our revenue in 2009. We believe that, whilst the overall Bluetooth market increased by around 10% in unit terms in 2009, total market revenue from Bluetooth fell in 2009 for the first time which is a result of the ongoing trend towards lower prices over a product’s lifecycle, combined with the fact that a larger proportion of the overall Bluetooth market was derived from the sale of handsets (which generally have lower average selling prices). The economic downturn that intensified in the latter part of 2008 and into 2009, together with continuing uncertainties for the near term economic environment, coupled with market competition, also adversely impacted CSR’s results of operations in 2008 and 2009.
We rely on our suppliers to provide the volumes of integrated circuits sufficient to meet the demands for our products from our customers. The economic downturn has resulted in measures being taken by a number of foundries who manufacture, assemble and test integrated circuits to restructure their businesses, resulting in a contraction of overall capacity for the supply of integrated circuits. If we were unable to secure sufficient capacity from our foundries, our ability to meet customer demand could be affected. We work to maintain a strong relationship with our suppliers and the company has benefited from the commitment of a number of key suppliers who have supported our business. We continue to work closely with our suppliers in order to ensure our business requirements are able to be satisfied.
CSR plc Annual Report and Financial Statements 2009
14
Financial Performance
The following table summarises our income statement:
| | | | | | | | | |
| | | 2009 | | | 2008 | | | 2007 | |
| | | $ million | | | $ million | | | $ million | |
| Revenue | | 601.4 | | | 694.9 | | | 848.6 | |
| Cost of sales | | (333.1 | ) | | (385.1 | ) | | (452.3 | ) |
| Gross profit | | 268.3 | | | 309.8 | | | 396.3 | |
| | | |
| Other research and development | | 155.5 | | | 147.9 | | | 135.1 | |
| Share-based payment charges | | 6.8 | | | 4.8 | | | 5.8 | |
| Amortisation of acquired intangible assets | | 7.4 | | | 5.4 | | | 6.6 | |
| Total Research and development expenses | | 169.7 | | | 158.1 | | | 147.5 | |
| | | |
| Other sales, marketing and administrative expenses | | 85.9 | | | 89.1 | | | 79.9 | |
| Asset impairment | | – | | | 52.9 | | | – | |
| Amortisation of acquired intangible assets | | 2.0 | | | – | | | – | |
| Share-based payment charges | | 3.8 | | | 2.8 | | | 3.5 | |
| Integration and restructuring | | 12.2 | | | 14.4 | | | – | |
| Patent settlement | | – | | | – | | | 15.0 | |
| Deferred tax adjustment to goodwill | | – | | | 1.0 | | | 0.3 | |
| Acquisition fees | | 10.6 | | | – | | | – | |
| Total Sales, marketing and administrative expenses | | 114.5 | | | 160.2 | | | 98.7 | |
| | | |
| Operating (loss) profit | | (15.9 | ) | | (8.5 | ) | | 150.1 | |
| Investment income | | 1.9 | | | 6.1 | | | 7.9 | |
| Finance costs | | (0.2 | ) | | (4.1 | ) | | (2.4 | ) |
| | | |
| (Loss) profit before tax | | (14.2 | ) | | (6.5 | ) | | 155.6 | |
| Tax | | 2.9 | | | (0.5 | ) | | (42.8 | ) |
| (Loss) profit for the period | | (11.3 | ) | | (6.9 | ) | | 112.8 | |
Non-GAAP measures
Some discussions and analyses in this Annual Report include measures which are not defined by generally accepted accounting principles (GAAP) such as IFRS. We believe this information, along with comparable IFRS measures, is useful to investors. Our management uses these financial measures, along with the most directly comparable IFRS
financial measures, in evaluating our operating performance and value creation. Non-GAAP financial measures should not be considered in isolation from, or as a substitute for, financial information presented in compliance with IFRS. Non-GAAP financial measures as reported by us may not be comparable with similarly titled amounts reported by other companies.
CSR plc Annual Report and Financial Statements 2009
15
DIRECTORS’ REPORT BUSINESS AND FINANCIAL REVIEW continued
In the following sections and elsewhere in this Annual Report we discuss the following non-GAAP measures:
| | · | | “Underlying research and development expenses” which is equivalent to the heading “Other research and development expenses” in the table above; |
| | · | | “Underlying sales, marketing and administration expenses” which is equivalent to the heading “Other sales, marketing and administration expenses” in the table above; |
| | · | | “Underlying operating profit” which represents “Gross profit” after deduction of “underlying research and development” and “underlying sales, marketing and administrative expenses”; |
| | · | | “Underlying net profit” which represents underlying operating profit, plus investment income, less finance costs and tax, excluding the tax effects of the adjustments made to underlying operating profit; |
| | · | | “Underlying diluted earnings per share” which represents underlying net profit divided by the weighted average number of dilutive shares; and |
| | · | | “Free cash flow” which represents cash generated by operations, less amounts spent on tangible and intangible fixed assets. |
For a detailed discussion of the reasons behind this presentation and full reconciliations of each measure to the most directly comparable IFRS measure, refer to pages 39 to 44.
The following table presents revenue, cost of sales, gross profit, total research and development expenses, underlying research and development expenses, total sales, marketing and administrative expenses, underlying sales, marketing and administrative expenses, operating (loss) profit and underlying operating profit, all in absolute terms and as a percentage of revenue, for 2009 and 2008:
| | | | | | | | | | | | | | | | | | |
| | | 2009 | | | 2008 | | | Increase/
(decrease)
$ million | | | %
change | |
| | Amount
$ million | | | % of
Revenue | | | Amount
$ million | | | % of
Revenue | | | |
Revenue | | 601.4 | | | 100 | | | 694.9 | | | 100 | | | (93.5 | ) | | (13.5 | ) |
Cost of sales | | 333.1 | | | 55.4 | | | 385.1 | | | 55.4 | | | (52.0 | ) | | (13.5 | ) |
Gross profit | | 268.3 | | | 44.6 | | | 309.8 | | | 44.6 | | | (41.5 | ) | | (13.4 | ) |
Research and development expenses | | 169.7 | | | 28.2 | | | 158.1 | | | 22.8 | | | 11.6 | | | 7.3 | |
Underlying Research and development expenses | | 155.5 | | | 25.9 | | | 147.9 | | | 21.3 | | | 7.6 | | | 5.1 | |
Sales, marketing and administrative expenses | | 114.5 | | | 19.0 | | | 160.2 | | | 23.1 | | | (45.7 | ) | | (28.5 | ) |
Underlying Sales, marketing and administrative expenses | | 85.9 | | | 14.3 | | | 89.1 | | | 12.8 | | | (3.2 | ) | | (3.6 | ) |
Operating loss | | (15.9 | ) | | (2.6 | ) | | (8.5 | ) | | (1.2 | ) | | (7.4 | ) | | (87.1 | ) |
Underlying operating profit | | 26.9 | | | 4.5 | | | 72.8 | | | 10.5 | | | (45.9 | ) | | (63.0 | ) |
CSR plc Annual Report and Financial Statements 2009
16
The following table presents revenue, cost of sales, gross profit, total research and development expenses, underlying research and development expenses, total sales, marketing and administrative expenses, underlying sales, marketing and administrative expenses, operating (loss) profit and underlying operating profit, all in absolute terms and as a percentage of revenue, for 2008 and 2007:
| | | | | | | | | | | | | | | | |
| | | 2008 | | | 2007 | | Increase/
(decrease)
$ million | | | %
change | |
| | Amount
$ million | | | % of
Revenue | | | Amount
$ million | | % of
Revenue | | |
Revenue | | 694.9 | | | 100 | | | 848.6 | | 100 | | (153.7 | ) | | (18.1 | ) |
Cost of sales | | 385.1 | | | 55.4 | | | 452.3 | | 53.3 | | (67.2 | ) | | (14.9 | ) |
Gross profit | | 309.8 | | | 44.6 | | | 396.3 | | 46.7 | | (86.5 | ) | | (21.8 | ) |
Research and development expenses | | 158.1 | | | 22.8 | | | 147.5 | | 17.4 | | 10.6 | | | 7.2 | |
Underlying Research and development expenses | | 147.9 | | | 21.3 | | | 135.1 | | 15.9 | | 12.7 | | | 9.4 | |
Sales, marketing and administrative expenses | | 160.2 | | | 23.1 | | | 98.7 | | 11.7 | | 61.5 | | | 62.5 | |
Underlying Sales, marketing and administrative expenses | | 89.1 | | | 12.8 | | | 79.9 | | 9.4 | | 9.2 | | | 11.5 | |
Operating (loss) profit | | (8.5 | ) | | (1.2 | ) | | 150.1 | | 17.7 | | (158.6 | ) | | (105.7 | ) |
Underlying operating profit | | 72.8 | | | 10.5 | | | 181.3 | | 21.4 | | (108.5 | ) | | (59.8 | ) |
Revenue Our revenue in 2009 fell to $601.4 million, representing a 13.5% decrease on 2008 revenue ($694.9 million). SiRF’s contribution to revenue since the acquisition on 26 June 2009 reduced the revenue decline by around 18% or approximately $130.0 million. Excluding SiRF GPS revenue, our revenue declined by $223.5 million, or 32%, in 2009. We believe that over the same period, the Bluetooth market increased by around 10% in terms of total units sold, although our units sold fell by 16%.
There were two primary reasons for our declining sales volumes from 2008 to 2009. The first was the loss of market share in handsets, due to the loss of a Bluetooth+FM programme with our BC5 FM chip at one of our largest customers (this had also been the main reason for the decline in sales in 2008 compared to 2007). The second was the overall decline in the headset market, which we believe fell by around 50% in revenue terms, with our business impacted to a similar extent.
The adverse impact from our loss of the Bluetooth+FM programme was larger in 2009 than in 2008, as the proportion of Bluetooth+FM programmes at this customer grew compared to the Bluetooth-only programmes which were reaching their end of life. Towards the end of 2009, we commenced shipment of our BC7000 Bluetooth+FM device to this customer.
There was a further revenue impact due to the volume-weighted average selling price declining by 8.4% year on year. Average selling price for the legacy CSR Bluetooth business declined by 19.8% but this was partially offset by the higher average selling price for SiRF products.
In the second half of 2009, as expected, we commenced volume shipments of our BC7000 devices to several major customers of the handset business unit, which had a positive impact on revenue and we expect further growth in revenue from this product in 2010.
The acquisition of SiRF has widened our customer base, and the proportion of revenue derived from our top ten customers has fallen in part as a result from 67% in 2008 to 54% in 2009 (in the first half of 2009, 70% of revenue was derived from our top ten customers). This increased diversity in our customer base has significantly reduced our dependency on several key customers. Our largest customer represented 11% of revenue in 2009 compared to 19% in 2008.
Our revenue for 2008 fell to $694.9 million compared to 2007 revenue of $848.6 million, an 18.1% decrease. This was principally due to a reduction of 13.8% year on year in the volume-weighted average
CSR plc Annual Report and Financial Statements 2009
17
DIRECTORS’ REPORT BUSINESS AND FINANCIAL REVIEW continued
selling price, which reflected a combination of the trend to lower prices over the life-cycle of our products and competitive pressures in the low-cost headset and other markets, coupled with lower shipment volume, as a result of a sharp decline in demand from customers at the end of 2008. Volumes of product shipped fell by 5% from 2007 to 2008, largely as a consequence of the loss of a BC5 FM device programme already mentioned and the decline in demand at the end of 2008.
The loss of the Bluetooth+FM programme resulted in the revenue we derived from the largest customer as a proportion of our total revenue declining from 29% in 2006 to 26% in 2007 and to 19% in 2008.
We have, however, maintained our strong relationship with this customer, (which was not our largest customer in 2009) and, based on the development of our next generation Bluetooth device BC7000, started to regain market share with this customer in the second half of 2009.
Segment analysis The following table presents CSR’s segmental revenue for 2009, 2008 and 2007. Data for 2008 and 2007 have been restated in line with changes introduced during 2009 to our business segments explained below. SiRF revenue is included in this data only for the portion of 2009 following the acquisition.
| | | | | | | | | | | | |
| | | 2009 | | 2008 | | 2009 vs. 2008 | | | 2007 | | 2008 vs. 2007 | |
| | | $ million | | $ million | | % change | | | $ million | | % change | |
Handsets Business Unit | | 310.8 | | 344.2 | | (9.7 | ) | | 415.2 | | (17.1 | ) |
Audio & Consumer Business Unit | | 163.3 | | 299.6 | | (45.5 | ) | | 382.7 | | (21.7 | ) |
Automotive & PND Business Unit | | 127.3 | | 51.1 | | 149.1 | | | 50.7 | | 0.8 | |
Total | | 601.4 | | 694.9 | | (13.5 | ) | | 848.6 | | (18.1 | ) |
During 2009, following the acquisition of SiRF, we reorganised our business into three business units, Handsets (HBU), Audio & Consumer (ACBU) and Automotive and PND (APBU). Each business unit has a manager who is part of the senior executive team. Results for each business unit are regularly reviewed in various forums by senior management, including the CEO and CFO to understand how they have impacted the results of the Group and to assist in the allocation of resources.
HBU segmentHandset segment revenue, which represented 52% of our total revenue in 2009, decreased 9.7% compared to 2008. Excluding SiRF GPS revenue, the fall was around 23%. This was mainly due to the loss of market share arising from a lost Bluetooth+FM programme explained on page 17.
These effects were partially offset by the increased revenue from GPS shipments, in the second half of the year, following the acquisition of SiRF. The GPS derived revenue in this segment represented approximately $52 million out of the total GPS revenue of approximately $130 million following the acquisition of SiRF.
Our handset segment revenue, which represents around half of our total revenue decreased 17.1% in 2008 compared to 2007. This was mainly due to a decline in revenue from our largest handset customer, as noted above.
Our BC6 ROM device was our largest shipping product in 2009, overtaking BC4 ROM which was the second largest shipping product. BC4 ROM started shipping in volume in 2005 and was our largest selling product in each of 2006, 2007 and 2008.
ACBU segmentAudio & Consumer segment revenue, which represented 27% of our total revenue in 2009, decreased 45.5% compared to 2008, when it represented 43% of total revenue. Headset revenue was adversely impacted during 2009 by a decline in the total headset market of around 50%. This was a combination of the headset supply chain being significantly oversupplied during the first half of 2009, as a result of the build up of inventory during the second half of 2008 and the global economic downturn. The oversupply was in large part due to over ordering from customers in response to the legislation adopted in California
CSR plc Annual Report and Financial Statements 2009
18
which came into effect in the middle of 2008 requiring that drivers only make and receive calls on their mobile phones using hands-free technology. These levels of inventory had largely cleared by the start of the second half of the year with the result that order levels recovered; better reflecting underlying market demand. The significant loss of PC market share during 2008 continued to have a negative impact on revenue. The acquisition of SiRF added only a very small amount of revenue to this business unit.
ACBU revenue declined 21.7% between 2007 and 2008. This was mainly due to a decline in revenue from PC customers, where we lost market share due to strong competition.
APBU segmentAutomotive & PND segment revenue, which represented 21% of our total revenue in 2009, increased 149.1% compared to 2008, when it represented just 7% of total revenue. This increase was due to the SiRF GPS revenue after the acquisition, with Bluetooth revenue performing relatively well and remaining flat against 2008 in a challenging market. Approximately 60% of revenue in the automotive and PND segment for 2009 was derived from GPS based revenue, resulting from the acquisition of SiRF.
APBU revenue increased slightly from $50.7 million in 2007 to $51.1 million in 2008.
Geographical analysisWe operate in four principal geographic areas – the U.K., the rest of Europe, the Americas and Asia. The table below provides, for the periods indicated, our revenue from external customers by geographical location, on the basis of customers’ manufacturing location:
| | | | | | |
| | | 52 weeks
ended
1 January
2010 | | 53 weeks
ended
2 January
2009 | | 52 weeks
ended
28 December
2007 |
| | | $ million | | $ million | | $ million |
UK | | 0.3 | | 1.0 | | 1.8 |
Rest of Europe | | | | | | |
- Finland | | 2.7 | | 6.3 | | 15.4 |
- Germany | | 21.3 | | 18.4 | | 8.4 |
- Hungary | | 27.5 | | 36.5 | | 46.3 |
- Other | | 17.7 | | 1.5 | | 3.1 |
| | | |
USA | | 40.2 | | 34.6 | | 54.0 |
Americas (excluding USA) | | 22.4 | | 10.6 | | 13.3 |
| | | |
Asia | | | | | | |
- China and Hong Kong | | 208.9 | | 232.8 | | 298.9 |
- Taiwan | | 46.1 | | 100.0 | | 127.8 |
- Korea | | 90.0 | | 96.0 | | 104.8 |
- Japan | | 80.3 | | 121.8 | | 159.6 |
- Other Asia Pacific | | 44.0 | | 35.4 | | 15.2 |
| | | 601.4 | | 694.9 | | 848.6 |
Major CustomersSales to our largest customer accounted for approximately 11% of revenue, (or approximately $67.8 million) in 2009, as compared to 19% of revenue, (or approximately $135.0 million) in 2008 and 26% of revenue, (or $220.1 million), in 2007. In 2009, sales to our second largest customer also contributed nearly 11% of revenue or approximately $63.9 million. In 2008, sales to the second largest customer contributed 11% of revenue (approximately $75.6 million). In 2007, only our largest customer exceeded 10% of revenue in the period. In 2009, revenue from our top five customers represented 43% of total revenue, as compared to 50% in 2008 and 53% in 2007.
Gross profitGross profit consists of revenue less cost of sales. In 2009, our gross margin, the ratio of
CSR plc Annual Report and Financial Statements 2009
19
DIRECTORS’ REPORT BUSINESS AND FINANCIAL REVIEW continued
gross profit to revenue remained at 44.6% of revenue, the same as in 2008. In absolute terms, gross profit fell to $268.3 million from $309.8 million in 2008, a decrease of 13.4%.
The acquisition of SiRF had a significant favourable impact on gross margins and increased the second half gross margin percentage. We estimate that SiRF’s historical gross margins on a comparable basis to CSR were around 47% for 2008 and 54% in 2007, which are above the levels historically achieved by CSR. Our gross margin in the first half of 2009 was 41.2%, this increased to 46.2% in the second half of the year due to a significant improvement in the Bluetooth margins achieved and also as a result of the acquisition of SiRF as there are generally higher gross margins on GPS products.
The 2009 gross profit is stated after a $5.8 million charge for fair valued inventory acquired in
connection with the acquisition of SiRF; the $5.8 million fair value adjustment had a negative effect of 1% on the gross margin.
Our gross margin for 2008 fell to 44.6% from 46.7% in 2007. In absolute terms, gross profit declined to $309.8 million from $396.3 million in 2007, a decrease of 22%. This decline resulted in part from increased competition and pressure on margins and also from a change in the mix of end market demand towards handset related sales, which generally have lower margins and feature the basic Bluetooth devices, and away from shipments to the higher margin headset and PC sectors.
The effects of this shift were partially offset by reductions in production costs exceeding selling price reductions, which had a beneficial effect on gross margins. The overall lower level of revenue also impacted gross margins due to certain fixed overheads recorded in cost of sales.
Research and developmentR&D expense consists of total research and development which is further broken down into underlying research and development, share-based payment charges and amortisation of acquired intangible assets. Underlying R&D consists primarily of staff costs, engineering costs and depreciation. The following table sets forth the primary components of R&D expenses during the 2009 and 2008 fiscal years:
| | | | | | | | | | | | |
| | | 2009 | | 2008 | | 2009 vs. 2008 Increase | | 2008 vs. 2009 % change |
| | | Amount | | % of
Revenue | | Amount | | % of
Revenue | | |
| | | $ million | | | | $ million | | | | $ million | | |
Research and development | | | | | | | | | | | | |
Underlying research and development | | 155.5 | | 25.9 | | 147.9 | | 21.3 | | 7.6 | | 5.1 |
Share-based payment charges | | 6.8 | | 1.1 | | 4.8 | | 0.7 | | 2.0 | | 41.3 |
Amortisation of acquired intangible assets | | 7.4 | | 1.2 | | 5.4 | | 0.8 | | 2.0 | | 38.2 |
Total | | 169.7 | | 28.2 | | 158.1 | | 22.8 | | 11.6 | | 7.3 |
In 2009, R&D costs were $169.7 million, a 7.3% increase from the $158.1 million of R&D expenditure in 2008.
Underlying research and development costs increased to $155.5 million in 2009 from $147.9 million in 2008, this was mainly due to the increased headcount in the second half of 2009 following the acquisition of SiRF (2009 average headcount: 811, 2008 average headcount: 697), however these increases were partially offset by the savings made in the Q4 2008 restructuring programme which
saved $20 million across all operating expense categories, and the synergy restructuring programme implemented at completion of the acquisition, which aimed to make $35 million of annualised savings across all operating expense categories within 60 days. These targets were successfully met and delivered ahead of schedule.
The remaining increase in R&D expense was mainly due to the acquisition of SiRF: share options that had been issued to SiRF employees before the completion date were rolled over into CSR share
CSR plc Annual Report and Financial Statements 2009
20
options, leading to a $2.0 million increase in the R&D share-based payment charge in 2009 and amortisation of intangible assets recognised on acquisition contributed a further $2.0 million of the increase.
We expect to continue to invest in technological innovation, with a focus on technologies that form key parts of connectivity, location and audio platforms.
The following table sets forth the primary components of R&D expenses during the 2008 and 2007 fiscal years:
| | | | | | | | | | | | | | |
| | | 2008 | | 2007 | | 2008 vs. 2007 Increase/
(decrease) | | | 2008 vs.
2007 % change | |
| | | Amount | | % of
Revenue | | Amount | | % of
Revenue | | |
| | | $ million | | | | $ million | | | | $ million | | | | |
Research and development | | | | | | | | | | | | | | |
Underlying research and development | | 147.9 | | 21.3 | | 135.1 | | 15.9 | | 12.8 | | | 9.5 | |
Share-based payment charges | | 4.8 | | 0.7 | | 5.8 | | 0.7 | | (1.0 | ) | | (17.2 | ) |
Amortisation of acquired intangible assets | | 5.4 | | 0.8 | | 6.6 | | 0.8 | | (1.2 | ) | | (18.2 | ) |
Total | | 158.1 | | 22.8 | | 147.5 | | 17.4 | | 10.6 | | | 7.2 | |
In 2008, our R&D costs were $158.1 million, a 7.1% increase from $147.5 million in 2007. The increase reflected a 4% average increase in the number of R&D personnel in the first three quarters of 2008, which was reversed in the fourth quarter, and a 6% increase in the exchange rate at which we converted our pound sterling costs into U.S. dollars (2008: $1.98 = £1.00, 2007: $1.86 = £1.00).
Sales, General & AdministrativeSales, General & Administrative, or SG&A, consists of total sales, marketing and administrative expenses which is further broken down into underlying sales, marketing and administrative expenses, asset impairment, amortisation of acquired intangible assets, share-based payment charges, acquisition fees, integration and restructuring expenses and patent dispute settlement costs.
The following table presents the components of SG&A during the 2009 and 2008 fiscal years:
| | | | | | | | | | | | | | |
| | | 2009 | | 2008 | | 2009 vs. 2008 Increase/
(decrease) | | | 2009 vs.
2008 % change | |
| | | Amount | | % of
Revenue | | Amount | | % of
Revenue | | |
| | | $ million | | | | $ million | | | | $ million | | | | |
Sales, marketing and administrative | | | | | | | | | | | | | | |
Underlying sales, marketing and administrative expenses | | 85.9 | | 14.3 | | 89.1 | | 12.8 | | (3.2 | ) | | (3.6 | ) |
Asset impairment | | – | | – | | 52.9 | | 7.6 | | (52.9 | ) | | (100.0 | ) |
Amortisation of acquired intangible assets | | 2.0 | | 0.3 | | – | | – | | 2.0 | | | – | |
Share-based payment charges | | 3.8 | | 0.6 | | 2.8 | | 0.4 | | 1.0 | | | 35.7 | |
Integration and restructuring | | 12.2 | | 2.0 | | 14.4 | | 2.1 | | (2.2 | ) | | (15.3 | ) |
Deferred tax adjustment to goodwill | | – | | – | | 1.0 | | 0.1 | | (1.0 | ) | | (100.0 | ) |
Acquisition fees | | 10.6 | | 1.8 | | – | | – | | 10.6 | | | – | |
Total | | 114.5 | | 19.0 | | 160.2 | | 23.1 | | (45.7 | ) | | (28.5 | ) |
CSR plc Annual Report and Financial Statements 2009
21
DIRECTORS’ REPORT BUSINESS AND FINANCIAL REVIEW continued
Sales, marketing and administrative costs in 2009 were $114.5 million, representing a 28.5% decrease from $160.2 million in 2008, the largest change being the impairment of $52.9 million in 2008, which did not recur. The costs of the Q4 2008 restructuring at $14.4 million were slightly higher than the 2009 integration and restructuring programme associated with the acquisition of SiRF which totalled $12.2 million. The main components of this charge in 2009 were onerous lease charges of $2.2 million, severance costs of $4.3 million and consultancy and legal costs of $4.5 million.
Acquisition fees were $10.6 million, which included brokers’ fees, reporting accountant fees and legal fees associated with the acquisition of SiRF. These were charged to the income statement in accordance with International Financial Reporting Standard 3 (revised 2008), which CSR early adopted for the 2009 financial reporting period. Under the rules of the previous IFRS3 applied to our previous acquisitions,
these costs would have been included within the cost of the investment and ultimately within goodwill.
There was a charge of $2.0 million for the amortisation of acquired intangible assets in 2009, this was the amortisation of customer relationships and trade names recognised on the acquisition of SiRF.
Underlying sales, marketing and administrative expenses were $85.9 million representing a 3.6% decrease compared to 2008 underlying sales, marketing and administrative expenses of $89.1 million. There was an increase in the cost base as a result of the acquisition of SiRF; however, the impact of this was more than offset by the cost savings as a result of both the Q4 2008 restructuring and the 2009 synergy programme. There was a further decrease as the 2008 expenses include approximately $2.0 million on independent consultants retained in connection with our operational assessment.
The following table presents the components of SG&A during the 2008 and 2007 fiscal years:
| | | | | | | | | | | | | | |
| | | 2008 | | 2007 | | 2008 vs. 2007 Increase/
(decrease) | | | 2008 vs. 2007 % change | |
| | | Amount | | % of
Revenue | | Amount | | % of
Revenue | | |
| | | $ million | | | | $ million | | | | $ million | | | | |
Sales, general and administrative | | | | | | | | | | | | | | |
Underlying sales, marketing and administrative expenses | | 89.1 | | 12.8 | | 79.9 | | 9.4 | | 9.2 | | | 11.5 | |
Asset impairment | | 52.9 | | 7.6 | | – | | – | | 52.9 | | | – | |
Share-based payment charges | | 2.8 | | 0.4 | | 3.5 | | 0.4 | | (0.7 | ) | | (20.0 | ) |
Integration and restructuring | | 14.4 | | 2.1 | | – | | – | | 14.4 | | | – | |
Deferred tax adjustment to goodwill | | 1.0 | | 0.1 | | 0.3 | | – | | 0.7 | | | 233.3 | |
Patent dispute settlement | | – | | – | | 15.0 | | 1.8 | | (15.0 | ) | | (100.0 | ) |
Total | | 160.2 | | 23.1 | | 98.7 | | 11.6 | | 61.6 | | | 62.5 | |
Sales, general and administrative costs in 2008 were $160.2 million, representing a 62.5% increase from $98.7 million in 2007, mainly due to the charges described below.
As a result of an operational strategy assessment in May 2008, we decided to cease ongoing investment in the UbiNetics protocol stack. This had been acquired with the software business of UbiNetics (VPT)
Limited in August 2005. The main reason for the acquisition had been to expand our footprint in the handset for which a protocol stack was considered necessary. As a result of the subsequent evolution of the market however, we took the view, then also shared by most of the industry, that the integration of Bluetooth and other technologies into the baseband was unlikely to happen in a meaningful sense in the near future. We therefore focused our resources on our capabilities in the Connectivity
CSR plc Annual Report and Financial Statements 2009
22
Centre. This resulted in a non-cash impairment charge of $52.9 million, which included the write down of the goodwill relating to the UbiNetics acquisition ($36.9 million) and certain assets which will not be used in future development activities ($16.0 million).
In response to the economic downturn, a cost reduction programme was implemented in the fourth quarter of 2008, with the aim of reducing ongoing annualised operating expenses by $20 million in 2009. This programme was successfully completed, and savings commenced in the first quarter of 2009, resulting in a charge of $14.4 million and the removal of costs of approximately $20 million on an annualised basis.
During 2007, we reached an agreement with the Washington Research Foundation (WRF) to settle its patent infringement suit issued against twelve of our customers. We remained of the view that WRF’s infringement suit against its Bluetooth chips was without merit. Notwithstanding this, we believed that an early resolution of the claim was both in our own and in our customers’ best interests and accordingly, a settlement payment of $15.0 million was made in April 2007. In connection with this settlement, we obtained an undertaking from WRF not to sue us, our suppliers, customers or end users for the alleged infringement by our products of the patents asserted in the suit.
Underlying sales, marketing and administrative expenses were $89.1 million in 2008 representing an 11.5% increase over 2007 underlying sales, marketing and administrative expenses of $79.9 million. This increase resulted from a combination of a 3% average increase in headcount in the first three quarters of 2008 (before the restructuring exercise) and a 6% increase in the exchange rates that we used to record our sterling-denominated costs. There was a further increase in exchange losses of $0.9 million, due to translation differences on un-hedged, non-U.S. dollar denominated assets and liabilities, following the volatility on international foreign currency markets. Underlying sales, marketing and administrative expenses also reflect expenditures of approximately $2 million on independent consultants retained in connection with our operational assessment described above.
Operating ResultThe operating loss for 2009 was $15.9 million compared to a loss of $8.5 million in 2008. Underlying operating profit for 2009 was $26.9 million compared to an underlying operating profit of $72.8 million in 2008 and the differences consist primarily of the lower revenue and gross profit as underlying operating expenses were $241.4 million in 2009 compared with $237.0 million in 2008, an increase of 1.9% and represented a smaller part of the decrease in underlying operating profit. The operating margin in 2009, (including the non-underlying operating expense items noted above) was a loss of 2.6% compared to a loss of 1.2% in 2008. The underlying operating margin for 2009 was 4.5% compared to 10.5% in 2008.
The operating loss for 2008 was $8.5 million, compared to a profit of $150.1 million in 2007. Underlying operating profit declined to $72.8 million in 2008 from $181.3 million in 2007.
Investment incomeOur investment income primarily represents interest earned on our cash and cash equivalents. During 2009, we had a monthly average of $336.7 million in cash, cash equivalents and treasury deposits, an increase of 46% from the monthly average in 2008. A major reason for the increase was the cash, cash equivalents and treasury deposits of $111.5 million acquired through the acquisition of SiRF. Investment income decreased to $1.9 million in 2009 compared to $6.1 million in 2008, as a result of significantly lower UK and US interest rates.
Investment income decreased to $6.1 million in 2008 compared to $7.9 million in 2007. During 2008, we had a monthly average cash, cash equivalents and treasury deposits balance of $231.1 million, an increase of 40% from the monthly average in 2007. However, this increase was offset by the significantly lower UK and US interest rates.
Finance costsFinance costs consist of interest expense and similar charges, unwinding of discount on contingent consideration and foreign exchange losses. Our finance costs amounted to $0.2 million in 2009, a 94% decrease compared to $4.1 million in 2008. This decrease was primarily due to a loss of $2.6 million for 2008 in foreign exchange translations due to the reduction in the GBP:USD exchange rate
CSR plc Annual Report and Financial Statements 2009
23
DIRECTORS’ REPORT BUSINESS AND FINANCIAL REVIEW continued
during that year, and in 2009, there was a gain of $1.0 million as the GBP:USD exchange rate increased.
Our finance costs amounted to $4.1 million in 2008, a 71% increase compared to $2.4 million in 2007. This increase was primarily due to $2.6 million foreign exchange losses noted above.
Tax The tax credit for 2009 was $2.9 million representing an effective tax rate of 20.6%, compared to a charge of $0.5 million in 2008.
The effective tax rate for the year of 20.6% was lower than the UK statutory rate of 28% due to the benefits of the enhanced tax deduction for R&D expenditure and the impact of lower tax rates in various jurisdictions in which our subsidiaries operate, however this was offset by the tax impact of non-deductible expenses, including the acquisition fees of $10.6 million explained on page 22 and adjustments in respect of prior years. In 2008, when we had a loss before tax of $6.5 million, the tax charge was $0.5 million a sharp decline from $42.8 million in 2007 as a result of our operating loss in 2008. The major items that affected the tax charge were the non-deductible goodwill impairment of $36.9 million related to UbiNetics (VPT) Limited explained on page 22 and the enhanced tax deduction allowed for R&D expenditure. In 2007, when we had profit before tax of $155.6 million, the tax charge was $42.8 million, reflecting a marginal tax rate on corporate earnings of 27.5%.
For 2010 we currently expect our effective tax rate to be approximately 25%, and for accumulated tax losses to offset current tax payable, resulting in minimal cash tax for the year.
Net (loss) incomeWe suffered a net loss of $11.3 million in 2009, compared to a net loss of $6.9 million in 2008. This increased net loss was mainly due to the lower level of revenue and gross profit, along with the acquisition fees of $10.6 million although these effects were offset by the reduction in impairment charges of $52.9 million which occurred in 2008. The remaining impact was due to increases in operating expenses, due to the cost base acquired with SiRF. Underlying net profit decreased from $64.2 million in 2008 to $30.7 million in 2009 due mainly to the lower revenue and gross profit, underlying operating expenses were
$241.4 million in 2009 compared with $237.0 million in 2008, an increase of 1.9% and represented a smaller part of the decrease in underlying net profit.
We suffered a net loss of $6.9 million in 2008, compared to net income of $112.8 million in 2007.
Earnings per shareBasic and diluted loss per share was $0.07 for 2009, compared to basic and diluted loss per share of $0.05 for 2008. Underlying diluted earnings per share for 2009 was $0.20 per share, a decrease of 59%, compared to $0.49 per share for 2008. The 2009 earnings per share was impacted by the issuance of 47.7 million shares in connection with the acquisition of SiRF, which increased by 24.9 million the average weighted basic shares outstanding, and therefore had a $0.01 positive impact on the basic and diluted loss per share and a $0.03 negative impact on underlying diluted earnings per share.
Financial Position
| | | | | | |
| | | 1 January 2010 | | | 2 January 2009 | |
| | | $ million | | | $ million | |
Non-current assets | | | | | | |
Goodwill | | 221.5 | | | 106.3 | |
Other intangible assets | | 45.0 | | | 20.8 | |
Property, plant and equipment | | 40.5 | | | 48.2 | |
Deferred tax asset | | 4.3 | | | 6.5 | |
| | | 311.3 | | | 181.8 | |
Current assets | | | | | | |
Inventory | | 72.3 | | | 66.2 | |
Derivative financial instruments | | 2.4 | | | – | |
Trade and other receivables | | 104.8 | | | 81.8 | |
Treasury deposits | | 241.8 | | | 81.0 | |
Cash and cash equivalents | | 170.6 | | | 180.9 | |
| | | 591.9 | | | 409.9 | |
Total assets | | 903.2 | | | 591.7 | |
| | | | | | | |
Current liabilities | | (126.4 | ) | | (102.1 | ) |
Non-current liabilities | | (2.7 | ) | | (22.9 | ) |
Total liabilities | | (129.1 | ) | | (125.0 | ) |
| | | | | | | |
Net assets | | 774.1 | | | 466.7 | |
CSR plc Annual Report and Financial Statements 2009
24
Note that under IAS1 (revised) an opening balance sheet position as at 28 December 2007 has been presented in the financial statements. Commentary on this balance sheet has not been included.
Goodwill Goodwill arose on the acquisitions of SiRF in 2009, CPS and NordNav in 2007 and Clarity and UbiNetics during 2005.
Goodwill of $139.6 million was recognised on the acquisition of SiRF during 2009. Of this, $84.1 million was allocated to the handset segment, $12.8 million was allocated to the audio and consumer segment and $42.7 million was allocated to the automotive and PND segment, this allocation was performed based on the expected future benefits for these segments. Also during the period, the estimated remaining consideration payable on the NordNav acquisition was adjusted from $17.5 million to $nil in line with current forecasts of the amount due under the sale and purchase agreement. This adjustment decreased the goodwill allocated to the handset segment. During 2009, a deferred tax asset was recognised for the brought forward losses of NordNav, and CPS totalling $6.9 million. This adjustment decreased the goodwill allocated to the handset segment.
As a result of the decision to terminate development of the UbiNetics protocol stack in 2008, all goodwill of $36.9 million relating to the UbiNetics acquisition was written off. The remaining balance of $221.5 million represents the goodwill from the SiRF, CPS, NordNav and Clarity acquisitions. The annual impairment review did not indicate any impairment of the remaining balances.
Fixed assets (other tangible assets and property, plant and equipment) Fixed assets at 1 January 2010 included the net book value of our software licences of $4.3 million (2008: $5.2 million), which support R&D, $3.3 million of ERP development and licensing costs, shown in assets in the course of construction, $3.2 million of internally developed technology which consists of development kits to enhance our design capabilities at advanced technology nodes, along with $22.5 million of in-process and developed R&D purchased as part of the acquisitions in 2009 and 2007 (2008: $14.3 million) and $11.6 million of trade names and customer relationships acquired with SiRF.
The value of our in-process and developed R&D increased by $8.2 million. This was due to $15.5 million acquired with SiRF, less total amortisation for the enlarged group of $7.3 million. The $11.6 million of trade names and customer relationships represents the $13.8 million acquired with SiRF less amortisation of $2.2 million.
The majority of the balance of our tangible fixed assets is made up of test equipment and IT equipment, including 18 production testers which we consign to our subcontractors. During 2009, we commenced work on a new combined ERP system for the enlarged group and by the end of the year we had spent $3.3 million in development and licensing costs.
Inventory Inventory at 1 January 2010 stood at $72.3 million, a 9% increase from the level ($66.2 million) at 2 January 2009, which represents 63 inventory days (2008: 76 days) of the previous three months cost of sales. We aim to keep sufficient inventory to meet the often short customer order lead times in this industry.
Trade receivables Trade receivables increased to $84.3 million as at 1 January 2010, up from $65.2 million at 2 January 2009. The increase was due to the significantly higher level of revenue in the fourth quarter of 2009, compared to the fourth quarter of 2008. Days’ sales outstanding decreased to 40 days (2008: 58 days). The increase in days’ sales outstanding in 2008 was due to the non-payment of invoices on the due date by one distributor. This receivable was collected and the issue has not recurred.
Liabilities Our total liabilities increased to $129.1 million at 1 January 2010 from $125.0 million at 2 January 2009.
Accounts payable increased by $15.0 million, due to the larger cost base acquired with SiRF and increased manufacturing related creditors. Accounts payable was particularly low in 2008 as there was a reduction in production levels towards the end of 2008 due to the action we took to reduce inventory in line with demand forecasts for early 2009.
Accruals increased by $39.3 million and the major increases were an increase in payroll related accruals
CSR plc Annual Report and Financial Statements 2009
25
DIRECTORS’ REPORT BUSINESS AND FINANCIAL REVIEW continued
of $23.5 million and increases in manufacturing related accruals of $14.7 million, for goods received but not invoiced by the supplier.
Tax liabilities decreased by $4.4 million, mainly due to the recognition of deferred tax assets mentioned above under “Goodwill”, which occurred in the same jurisdictions as the deferred tax liabilities and hence could be offset.
These movements were offset by the decrease in the contingent consideration related to NordNav of $17.5 million, mentioned above, and the significant decrease in the negative fair value of forward foreign exchange contracts in place. The liability decreased by $31.8 million in the year as expected, as the differential between the forward contract exchange rates and the current exchange rate narrowed. Further information on our hedging is given below. The future liability will depend upon the differential between current exchange rates and those rates committed as part of our hedging portfolio. We continue to put forward contracts in place for our forecast sterling expenditures 11-15 months in advance.
Liquidity and Capital Resources
Our primary source of liquidity is our cash flow from operations. At present, we do not rely on third party financing for any operational cash requirements and therefore liquidity risk is not considered a significant risk. In our opinion, working capital is sufficient for our present requirements.
We manage liquidity risk by maintaining adequate cash reserves and by continuously monitoring forecasted and actual cash flows and matching the maturity of financial assets and liabilities.
Cash Flows
| | | | | | | | | |
| | | 2009 | | | 2008 | | | 2007 | |
| | | $ million | | | $ million | | | $ million | |
Operating cash flows before movements in working capital | | 29.7 | | | 88.1 | | | 192.5 | |
Working capital | | 20.6 | | | 8.2 | | | 59.9 | |
Taxation | | (0.8 | ) | | (30.0 | ) | | (29.8 | ) |
Interest paid | | (1.3 | ) | | (0.3 | ) | | (0.4 | ) |
R&D tax credit received | | 2.0 | | | 0.3 | | | – | |
Net cash from operating activities | | 50.2 | | | 66.3 | | | 222.2 | |
Treasury management(1) | | (113.5 | ) | | (22.7 | ) | | (14.3 | ) |
Acquisitions of subsidiaries | | 66.5 | | | (11.7 | ) | | (82.0 | ) |
Capital expenditure (purchase of intangible assets and property, plant and equipment) | | (13.3 | ) | | (22.7 | ) | | (29.5 | ) |
Other financing activities | | (1.2 | ) | | 1.2 | | | (0.1 | ) |
Purchases of own shares | | – | | | (20.2 | ) | | (20.0 | ) |
Net cash (outflow) inflow | | (11.3 | ) | | (9.8 | ) | | 76.3 | |
(1) Represents the aggregate of interest received, purchase of treasury deposits and treasury deposits acquired with subsidiaries.
Cash, cash equivalents and treasury deposits increased to $412.4 million at 1 January 2010, from $261.9 million at January 2, 2009, an increase of $150.5 million. The difference compared to the outflow of $11.3 million shown in the table above is due to amounts placed on treasury deposit of $160.8 million of which $45.0 million was acquired through the acquisition of SiRF (the impact of this is contained within “Treasury Management” in the table above) and a foreign exchange gain of $1.0 million from retranslation of non-US dollar cash balances. Treasury deposits represent deposits with an initial term of greater than 90 days, which are shown separately from cash and cash equivalents on CSR’s consolidated balance sheet.
During 2009, there was a net cash outflow of $11.3 million, as compared with an outflow of $9.8 million in 2008. Operating cash flow before movements in working capital contributed $29.7 million as compared to $88.1 million in 2008. The reduction in cash was much larger than the decline in the operating loss because the 2008 operating loss was stated after the $52.9 million non-cash impairment, with movements in working capital resulting in a cash inflow of
CSR plc Annual Report and Financial Statements 2009
26
$20.6 million as compared to $8.2 million in 2008. The differences were mainly due to timing of purchases from subcontractors in the fourth quarter of each year and receipt of cash from customers at the 2008 year end where a distributor failed to pay on time.
In 2008, there was a net cash outflow of $9.8 million, as compared with an inflow of $76.3 million in 2007. Operating cash flow before movements in working capital contributed $88.1 million, as compared with $192.5 million in 2007, with movements in working capital resulting in a cash inflow of $8.2 million, as compared with an inflow of $59.9 million in 2007. In 2007, there was a substantial benefit from working capital movements in the year, mainly due to timing of purchases from subcontractors and receipt of cash from customers at the 2007 year end, compared to the 2006 year end. This pattern was not repeated in 2008.
Cash, cash equivalents and treasury deposits increased to $261.9 million at January 2, 2009 from $245.4 million at December 28, 2007, an increase of $16.5 million.
The net cash inflow on acquisitions of subsidiaries of $66.5 million in 2009 represented the $111.5 million of cash, cash equivalents and treasury deposits acquired through the SiRF acquisition, excluding the $45.0 million of treasury deposits with initial maturities over 90 days and the acquisition fees paid of $10.6 million, which were included in the operating cash flows before movements in working capital.
Cash outflows on acquisitions of subsidiaries of $11.7 million during 2008 related to payments of deferred consideration on the NordNav acquisition and the repayment of the loan notes related to the CPS acquisition. Cash outflows on acquisitions of $82.0 million during 2007 related to payments of approximately $34 million for the CPS acquisition, and approximately $48 million for the NordNav acquisition (which included $8 million of contingent consideration).
During 2008, there was a cash outflow of $20.2 million for the purchase of shares in CSR plc by the CSR Employee Benefit Trust, as compared to $20.0 million in 2007. There were no purchases during 2009.
Capital Expenditure
The table below summarises additions to fixed assets in our last three fiscal years. The amounts differ from the cash outflow on capital expenditure due to movements in payables and accruals.
| | | | | | | | | | | | |
| | | 2009 | | 2008 | | 2009 vs.
2008
in % | | | 2007 | | 2008 vs.
2007
in % | |
| | | $ million | | $ million | | | | | $ million | | | |
Other intangible assets | | 5.9 | | 3.8 | | 55.3 | | | 7.1 | | (46.5 | ) |
Property, plant and equipment | | 7.7 | | 19.3 | | (60.1 | ) | | 24.6 | | (21.5 | ) |
Total | | 13.6 | | 23.1 | | (41.1 | ) | | 31.7 | | (27.2 | ) |
Our capital expenditure declined by 41.1% from 2008 to 2009. In order to reduce manufacturing costs, and to secure sufficient testing capacity, we purchase production test equipment and consign it to its subcontractors’ sites in Taiwan. We own 18 consigned production testers each costing around $1.5 million when purchased. In 2008, we purchased three additional testers, and did not add to these in 2009.
In intangible assets, we spent $3.3 million developing a new Group wide ERP system during 2009, which is expected to be placed into service in 2010. We also spent $2.0 million completing a design kit for advanced technology nodes. In tangible assets, around $3.0 million of the additions related to IS infrastructure upgrades and expansions, to ensure a stable operating base for the development teams.
We expect some increases in capital expenditure in 2010 due to ongoing product development programmes.
Taxation and Financing
Our net tax in 2009 was a cash inflow of $1.2 million, the majority of which was the receipt of an R&D tax credit in France. This compared to the tax paid of $30.0 million in 2008, and $29.8 million in 2007. We expect cash inflows from taxation in 2010, as it is possible to carry back the tax loss in the UK to offset against the 2008 tax paid and obtain a refund. The Group corporation tax creditor of $1.3 million is more than offset by the current tax receivable of $5.4 million.
CSR plc Annual Report and Financial Statements 2009
27
DIRECTORS’ REPORT BUSINESS AND FINANCIAL REVIEW continued
There was a cash outflow from other financing of $1.2 million, principally due to repayments under finance leases of $1.2 million, while in 2008 we had an inflow of $1.2 million, which was principally due to the proceeds on issues of shares upon exercise of share options by employees under our various share option plans, as compared to an outflow of $0.1 million in 2007.
Hedge Accounting
Substantially all our sales and costs of sale are denominated in US dollars, the functional currency of all the entities within the Group. Approximately 30% of our operating costs are denominated in pounds sterling.
In order to reduce the volatility of our earnings due to exchange rate fluctuations, we enter into forward foreign exchange contracts to fix an exchange rate for our future pounds sterling-denominated expenditures. We commit to forward contracts between 11 and 15 months in advance, according to our treasury policy. These contracts are accounted for as cash flow hedges and will not affect profit or loss until the period in which the related transaction is recorded or we conclude that it is no longer probable that the hedged transaction will occur. These contracts also form hedges against exchange gains or losses on the related pounds sterling liabilities.
As of 1 January 2010, forward contracts were in place that gave an average GBP:USD exchange rate of 1.56 for the coming 11 to 15 months. Historically, the average forward contract rate was as follows: 2009: 1.93; 2008: 1.98; and 2007: 1.88. We expect that with the contracts in place as of 1 January 2010, our sterling denominated expenditures will cost around 19.2% less in U.S. dollar terms in 2010.
The fair value asset of the contracts in place as of 1 January 2010 was $2.2 million. $3.5 million of the related expense was deferred in hedging reserves. The difference of $1.3 million has been recorded as an expense in the income statement as the related transactions have been recorded. More detail is included in note 33 to the consolidated financial statements.
Capital Management and Treasury Policy
Our policy is to maintain a strong capital base so as to maintain customer, creditor, investor and market confidence as well as to sustain future development of the business.
Our main forms of liquid investments in 2009 were bank and money market deposits. We intend to reinvest cash balances in the business either through higher levels of investment in working capital and fixed assets or through mergers and acquisitions activity, to support our long-term ambitions.
Our issued share capital as of 1 January 2010 was 182,187,878 ordinary shares of 0.1 pence each, an increase of 49,297,057 shares from the 132,890,821 ordinary shares issued in 2008, the major change was due to the issue of 47,658,256 as part of the acquisition of SiRF, these shares were exchanged for the total issued share capital of SiRF.
As a result of the funds raised through our initial public offering in March 2004, our subsequent positive operating cash flows and the acquisition of SiRF, which contributed $111.5 million of treasury deposits, cash and cash equivalents in June 2009, we had a total of $412.4 million of treasury deposits, cash and cash equivalents at 1 January 2010, an increase of 57.5% from the $261.9 million we held at 2 January 2009.
Neither CSR nor any of its subsidiaries is subject to any externally imposed capital requirements.
We hold our cash and liquid investments in accordance with the counterparty and settlement risk limits of the treasury policy approved by our Board of directors. We maintain a policy in the placement of cash deposits and investments with counterparties such that at any one time cash is placed with at least three approved financial institutions. No counterparty with a credit rating of less than Aa3 will be approved. We review the internal control environment regularly, through a rolling plan of internal audits, the results of which are reported to the Audit Committee.
Dividend policy
We do not intend to pay a dividend for the foreseeable future. We currently intend to retain future earnings to fund the development and growth of our business.
CSR plc Annual Report and Financial Statements 2009
28
Any future payment of dividends will be at the discretion of the Board, after taking into account various factors, including our financial condition, operating results, current and anticipated cash needs and plans for expansion.
CSR Employee Benefit Trust (EBT)
From time to time, the CSR Employee Benefit Trust purchases CSR ordinary shares in the stock market. The timing of these purchases is subject to compliance with the listing rules of the UK Listing Authority, agreement between CSR and the Trustee of the Employee Benefit Trust and on prevailing market prices. The shares are intended to be used for satisfying obligations to deliver shares on the exercise by employees of share options under CSR’s share option programmes, thereby reducing dilution and pressure against institutional investor dilution guidelines.
During 2009, no purchases were made. During 2008, the Employee Benefit Trust purchased 3,222,813 CSR ordinary shares, as compared to 1,466,767 shares in 2007, for a total cash consideration of $20.2 million, as compared to $20.0 million in 2007.
Off-Balance Sheet Arrangements
As of 1 January 2010, we did not have any off-balance sheet arrangements.
Contractual Obligations and Commitments
As of 1 January 2010 our principal contractual obligations and commitments consisted of amounts payable under finance leases, operating leases, trade and other payables and outstanding purchase obligations.
The following table summarises our contractual obligations and commitments as of 1 January 2010:
| | | | | | | | | | |
| | | Total | | Less
than 1 Year | | 1 to 3
Years | | 3 to 5
Years | | More
than 5 Years |
| | | $ million | | $ million | | $ million | | $ million | | $ million |
Finance leases | | 0.3 | | 0.3 | | – | | – | | – |
Operating leases | | 20.7 | | 10.9 | | 9.8 | | – | | – |
Trade and other payables | | 119.4 | | 119.4 | | – | | – | | – |
Purchase obligations | | 69.0 | | 69.0 | | – | | – | | – |
The table above excludes tax contingencies of $0.9 million because we are unable to make reasonably reliable estimates of the period of cash settlement associated with these obligations with the respective taxing authorities.
Significant Changes
There have been no significant changes in the financial or trading position of the Company since 1 January 2010.
Quantitative and Qualitative Disclosures about Market Risk
Details of quantitative and qualitative disclosures about Market Risk are given in note 33 to the consolidated financial statements.
Key Performance Indicators
We use a range of financial and non-financial performance measures, which we refer to as key performance indicators or KPIs reported on a periodic basis, to measure performance over time. During 2009, we have added gross margin and operating expenses by function as additional financial KPIs; we have added the average cost per employee as a non-financial KPI. No changes have been made to the source of data or calculation methods used in the period. The source of all data is consistent with published financial and non financial information.
To measure growth of the business:
Revenuerepresents sales of integrated circuits to customers, sales of services to customers and royalty income from products sold under a royalty earning licence net of any estimated provisions for credit notes and returns.
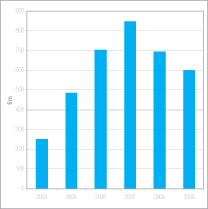
CSR plc Annual Report and Financial Statements 2009
29
DIRECTORS’ REPORT BUSINESS AND FINANCIAL REVIEW continued
Our revenue in 2009 fell to $601.4 million, representing a 13.5% decrease on 2008 revenue ($694.9 million). SiRF’s contribution to revenue since the acquisition on 26 June 2009 reduced the revenue decline by around 18% or approximately $130.0 million. Excluding SiRF GPS revenue, our revenue declined by $223.5 million, or 32%, in 2009. We believe that over the same period, the Bluetooth market increased by around 10% in terms of total units sold, although our units sold fell by 16%.
There were two primary reasons for our declining sales volumes from 2008 to 2009. The first was the loss of market share in handsets, due to the loss of a Bluetooth+FM programme with our BC5 FM chip at one of our largest customers (this had also been the main reason for the decline in sales in 2008 compared to 2007). The second was the overall decline in the headset market, which we believe fell by around 50% in revenue terms, with our business impacted to a similar extent.
The adverse impact from our loss of the Bluetooth+FM programme was larger in 2009 than in 2008, as the proportion of Bluetooth+FM programmes at this customer grew compared to the Bluetooth-only programmes which were reaching their end of life. Towards the end of 2009, we commenced shipment of our BC7000 Bluetooth+FM device to this customer.
Further discussion of revenue is given in the Financial Performance section above.
To measure performance of the business:
Gross marginis used as a measure of the profitability of our sales. We aim to maintain our gross margin in the mid 40% range. Maintaining gross margin involves a combination of production cost management, minimisation of production overheads and maintaining selling prices by introducing new feature-rich devices which can command a premium selling price.
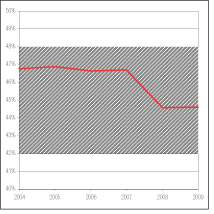
Gross margin in 2009 remained at 44.6%, the same as in 2008. However, gross margin is stated after the charge for fair valued inventory acquired with SiRF (inventory was valued at selling price less costs to complete), this charge was $5.8m. This fair value adjustment reduced gross margin by 1%.
The acquisition of SiRF had a significant favourable impact on gross margin, which increased the second half gross margin percentage. We target gross margin in the mid 40% range and the SiRF acquisition has enabled us to maintain our gross margin at the mid to upper end of that range, with the first half gross margin of 41.2% increasing to 46.2% in the second half.
Further discussion of gross margin is given in the Financial Performance section above.
Underlying operating expenses by functionwhich represents total research and development and total sales, marketing and administrative expenses, (both excluding share-based payment charges, amortisation of acquisition related intangibles, goodwill impairment, acquisition costs, patent settlement costs, deferred
CSR plc Annual Report and Financial Statements 2009
30
tax adjustments to goodwill and integration and restructuring charges) are used as a measure of the costs of the underlying business.
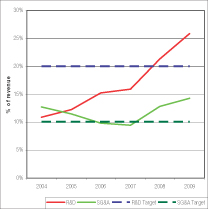
We monitor these costs as a percentage of revenue, and aim to maintain R&D cost at or around our target of 20%, and SG&A costs at or around our target of 10%. We have taken action in the past, such as in our 2008 restructuring programme to reduce costs to achieve this target. During 2009, the percentage of operating expenses rose above this level primarily due to the lower level of revenue (discussed above) and the effects of the economic downturn. The combination of the actions taken to reduce costs after the SiRF acquisition have reduced costs and the benefit of the increase in our GPS revenue during the second half of the year, are allowing us to continue the move towards our target.
Whilst we aim for these operating targets, we balance that objective with our view of the appropriate level of operating expense to support the current and future success of the business. Therefore in 2009, we did not cut operating expenditure further despite the lower revenue levels as we believe that the current level of expense will support the growth of the business as economic conditions improve.
Underlying diluted earnings per shareis used as a measure of the interest each current share and each potentially dilutive share has in the performance of the business. Underlying diluted earnings per share is calculated as underlying earnings (underlying earnings is (loss) profit for the period, add back share-based payment charges, amortisation of acquisition related intangibles, goodwill impairment, acquisition costs, patent settlement costs and integration and restructuring charges and less any tax impacts of these items, taking account of the deductability or taxability of these items) divided by the number of current shares and potentially dilutive shares outstanding.
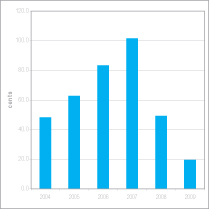
Underlying diluted earnings per share in 2009 was $0.20, a decrease of 59% compared to $0.49 in 2008.
The decrease resulted from the reductions in revenue and gross profit, along with the increases in underlying operating expenses, all of which are described in more detail above under the Financial Performance section. Growth of underlying diluted earnings per share is a key performance condition for a number of share option schemes. Vesting depends upon relative growth of earnings per share, adjusted for the UK retail price index or RPI against targets set at the time of grant. None of these conditions were met for the current or preceding year, due to the declines in underlying diluted earnings per share.
CSR plc Annual Report and Financial Statements 2009
31
DIRECTORS’ REPORT BUSINESS AND FINANCIAL REVIEW continued
To measure working capital management:
Inventory turnsis used as a measure of the management of inventory levels in the business and represents the number of times inventory turns over in an annual period based on the last three months cost of sales of that annual period.
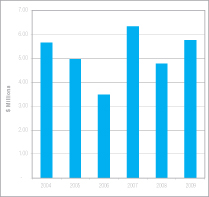
Inventory turns increased in 2009 to 5.8 for the period from 4.8 in 2008. The increase meant that 2009 inventory turns reflected levels generally expected. 2008 turns were lower due to customers notifying us of reductions in orders within the lead-time for production from our suppliers leading to higher than planned inventory balances. Some of the increased turns in 2009 were also due to changes in our supply chain, as some of the GPS products are purchased as finished goods items, rather than manufactured, which required less investment in working capital.
Days sales outstanding (DSO)is a measure of the number of days that it takes us to collect cash after a sale has been made. We calculate days sales outstanding by taking the balance of trade receivables outstanding at the end of the annual period, dividing by the revenue for the previous two monthly periods and then multiplying by the number of days in those monthly periods.
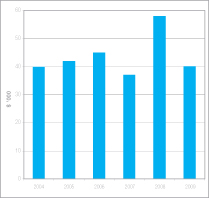
Note: Data is given at year end dates.
The decrease in days sales outstanding for 2009 of 40 days against 2008 figure of 58 reflected a return to more normal levels, within the range of 40-45 days. The increase in days sales outstanding in 2008 was due to the non-payment of invoices on the due date by one distributor.
CSR plc Annual Report and Financial Statements 2009
32
Free cash flow is used to represent the cash that we are able to generate from our operations after taking into account cash flows on capital expenditure. We calculate free cash flow as cash generated by operations (as per the cash flow statement on page 44) less expenditure on tangible and intangible assets (not including those acquired through acquisition) in the 52 week period (as shown on the cash flow statement).
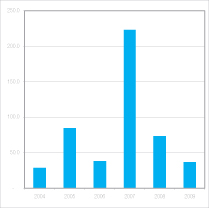
Free cash flow declined to $37.0 million (2008: $73.7 million), mainly as a result of our lower gross profit and higher operating expenditures. In 2009, there was a substantial benefit from working capital movements of $20.6 million in the year, compared to $8.2 million in 2008, mainly due to timing of purchases from subcontractors and receipt of cash from customers at the 2009 year end, compared to the 2008 year end. Further analysis of the Company’s liquidity and also of capital resources is set out on pages 26 to 29.
Average cost per employee for each 52 week period is used as a non-financial key performance indicator of the cost of our key resource – people. It is calculated as salary costs, pension costs and social security costs, divided by the monthly average number of employees for the period, with pounds sterling costs converted to US dollars at the forward contract rate in place for that period.
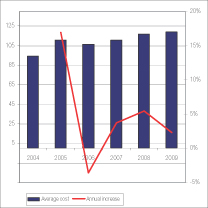
We manage the average cost of our employees carefully and aim to expand and utilise our resources in the most efficient way. In the past year we moved part of our software development operation to Bangalore in India, capitalising on the lower staff costs in the region and the rich pool of talent. As part of the SiRF acquisition, we have acquired a substantial development team in China who are actively contributing to the Group’s new products, particularly in the System on Chip (SoC) area. We expect to continue to develop our business in these areas, which not only have a plentiful supply of talented engineers, but are also located near many of our customers in key growth markets.
The annual increase in 2009 for staff costs was 2.3% and reflects a combination of a change in the mix of employee location, payrises and currency fluctuations. Much of the increase in 2009 was due to the increase in the number of our US based employees through the SiRF acquisition, which was not fully offset by the increase in staff in China and India.
CSR plc Annual Report and Financial Statements 2009
33
DIRECTORS’ REPORT BUSINESS AND FINANCIAL REVIEW continued
Headcount as at the end of the 52 week period is used as a non-financial key performance indicator of the resources available in the business and is monitored closely in relation to productivity and research and development output.
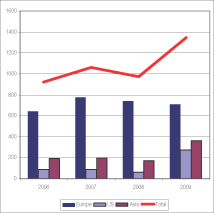
Note: Data is given at year end dates.
Headcount has increased from 975 at the end of 2008 to 1,348 at 1 January 2010; an increase of 38%. This was primarily due to the acquisition of SiRF during Q2 2009, bringing an additional 482 employees to the Group. A restructuring programme was implemented at the end of Q2 2009 as one of the measures taken to achieve the anticipated $35 million of annualised synergies arising from the acquisition. This led to approximately 100 employees leaving the combined Group. The headcount reductions were implemented following careful consideration of CSR’s long-term strategic objectives and shorter term targets for 2009 and 2010.
Social Responsibility
We recognise the importance of social, environmental and ethical (SEE) matters and during 2009, continued to work towards compliance with the ABI disclosure guidelines on social responsibility. We believe that our work is part of a continuous improvement to develop standards and working practices that represent tangible improvements in the way in which we undertake our business and also meets our responsibilities to the wider community and all our stakeholders. This includes the impact through our operations on the environment, on the safety and well being of our employees, and end users of our products as well as those who contribute to the
process of the development and manufacture of our products through our suppliers, distributors and customers. Following the acquisition of SiRF, we recognise that we need to more effectively harmonise best practices which presently are carried out by separate parts of the group. This is an ongoing objective for 2010.
SEE matters are considered an integral part of the philosophy of the Company, and the Board and its committees receive reports as part of their routine business on aspects of SEE issues in addition to other reports from those directors responsible for such matters as may be appropriate from time to time.
The Company expects the highest of ethical standards of all its employees and its policies and procedures support its stated aim of acting with integrity in all aspects of its operations.
From the time of his appointment in June 2008, the Board director responsible for health and safety matters has been Will Gardiner, Chief Financial Officer. Mr Gardiner met on a number of occasions with those who manage the Company’s health and safety issues including the Chair of the Health, Safety and Environmental (HSE) Committee. An annual report is presented to the Board covering health and safety matters, which includes statistics on accidents and incidents, progress against targets from the previous period and objectives for the next year.
In the UK, we have a Health, Safety and Environmental Committee which meets regularly and is chaired by the Group Facilities Manager, who is also the senior health and safety manager for the Group. Our Health, Safety, and Environmental policies are available to all employees on our intranet site as are the minutes of the HSE Committee and current HSE initiatives. Current initiatives are explained below.
Throughout 2009 we continued to assess the existing measures around health and safety management at a number of our overseas offices. This entailed a base line assessment of health and safety standards and management at the locations visited, in addition to providing training on basic practices. This was augmented by guidance on establishing or improving on current local policies by reference to both local law and best practice within the Group. These activities
CSR plc Annual Report and Financial Statements 2009
34
will be extended throughout 2010 to include the additional offices that form part of the enlarged CSR group, in particular following the acquisition of SiRF.
The executive director with responsibility for the Group’s Environmental Management System (EMS) is Mr Chris Ladas, Operations Director. The EMS, which has the support of the Board, has been developed reflecting our existing low eco-footprint, with all employees working in office based environments, whilst recognising that high standards should be established and maintained across all aspects of our operations. The ongoing management of EMS is overseen by a team incorporating managers responsible for Facilities, Business Management Systems and Quality Assurance.
In June 2009, the Company’s recertification assessment against both ISO 14001 and OHSAS 18001 was undertaken by Lloyds Register Quality Assurance Limited which is an internationally recognised independent assessor. No major nonconformities were raised during this visit. Minor nonconformities found during the reviews were either addressed immediately or, in certain instances, a corrective action plan has been implemented. Progress in carrying out the action plans is monitored by the Company’s internal Quality Assurance department. The assessments confirmed that the Company’s Management System continues to satisfy the requirements of ISO 14001:2004 and BS OHSAS 18001:2007, and continued certification to these standards was awarded.
Certification requires that we have an Environmental Management System (EMS) which defines the environmental policy of the Group and sets objectives intended to drive continuous improvements in environmental awareness and practices.
Our environmental policy includes commitments to:
| | · | | employee consultation and training; |
| | · | | assessment of our activities and product related environmental impacts to identify targets for continuous improvement; and |
| | · | | legal compliance and due consideration of other stakeholder environmental requirements. |
We believe that we are taking considerable steps to contribute to sound environmental practices, covering not only the manufacture and supply of our products but also positive measures to establish and build on good working practices within our various office locations.
We continue to prepare for the introduction in the UK of the Carbon Reduction Commitment (or “CRC”) which begins in 2010. The CRC is a new mandatory Energy Efficiency Scheme in the UK that aims to reduce energy consumption and contribute to a reduction in carbon dioxide (CO2) emissions. This objective is being managed through financial levies on businesses in the UK based on the consumption of electricity.
The CRC applies to organisations that meet certain criteria relating to their consumption of electricity derived from units purchased in 2008. Based on the qualifying criteria, we must participate in the CRC scheme.
Organisations that participate will have to monitor their energy use and either show reductions against prescribed targets or purchase allowances for each tonne of CO2, based on energy consumed. There are also annual registration fees to pay beginning in 2010 and until the scheme ends, with 2010 being the first data reporting and registration year. Allowances will be sold by the UK Government in each compliance year through the initial CRC phase from 2011 to 2013. This is intended to provide a direct incentive for businesses to reduce energy use emissions, since the lower the emissions, the lower the levy paid to the Government. A performance league table will also be published showing the comparative performance of all organisations in reducing emissions, reflecting the annual returns from UK businesses.
We have developed plans and investigated appropriate measures in readiness for the implementation of the CRC scheme.
As part of the Carbon Reduction Commitment in the UK, we continued our energy monitoring programme that encompasses taking readings of our electrical distribution boards to identify potential areas where energy efficiencies can be made. This has highlighted a number of systems where potential savings are
CSR plc Annual Report and Financial Statements 2009
35
DIRECTORS’ REPORT BUSINESS AND FINANCIAL REVIEW continued
possible and during 2009 we focused our attention on air conditioning and building management systems by adjusting operating times to give optimal utilization.
Looking forward into 2010, we are developing purchasing strategies in order that an evaluation of the energy efficiency of a particular item of equipment is part of the selection criteria. This has already featured in decisions taken on the replacement of the main chillers at our Cambridge site, which constitutes one of our largest offices globally. This is an example of a practice which we could adopt across all our operations.
We remain committed to finding ways in which we can develop further the recycling of spent materials.
During 2008 we met our target of reducing by 40% of total waste produced, the amount of material being consigned to landfill in the UK. In 2009 we extended our recycling waste streams to include the recycling of plastics and cans, and bio-waste and set a stretching target of recycling 50% of all the waste we produced in the UK which was successfully met. In conjunction with a local waste contractor our bio waste is processed into compost which can then be made available to local farmers and members of the public as a soil conditioner. The total amount of waste being recycled during 2009 rose from 895,940 litres to 1,130,300 litres. Over the same period, we experienced a 6.7% increase in the amount of waste produced from 2,234,000 litres to 2,384,120.
The main objective for 2009 was to tackle our waste “at source” by finding ways in which we can prevent potential waste from coming on to site in the first place. This has proved very challenging since we have established through the review that a significant proportion of the waste we consign is unsolicited or unnecessary multiple copies of paper based materials provided by third parties. During 2010 we will be looking at ways in which we can limit the amount of this material being provided to us, whilst still maintaining the existing challenging recycling target. We will also target increasing our recycling of waste materials from 50% in 2009 to 55% in 2010.
During 2009 we continued to utilise Information Technology to support existing energy efficiencies whilst still providing state of the art research facilities
and data storage capacity. Since 2007, we have successfully reduced power consumption in the UK as a result of improvements to the way in which we store and configure our information systems, resulting in the equivalent of around 220 fewer physical servers. This is equivalent to a reduction in power consumption against figures as at the end of 2006 of 37%, providing both financial and environmental benefits.
In recognition of the increasing globalisation of our business operations, in 2008 we reported on our intention to adopt video conferencing, which was expected to provide further financial benefits, operating efficiencies and reduction in our carbon footprint. Our target at the start of 2009, was to reduce travel expenditure by 25%. From 1 May 2009, we implemented a programme of rolling out video and audio conferencing facilities across all our international locations to improve operational efficiencies, and with the aim of reducing our overseas travel. Given the nature of the business activities undertaken by the Company in the integration process with SiRF, these facilities provided a significant tool with which to conduct meetings thereby limiting the increase in overseas travel. The acquisition however did mean that our original target for reducing travel was not met. Nevertheless, these facilities have been used for an average of approximately 190 hours every month since its introduction and we envisage utilisation of this facility to increase through 2010. Our objective over the coming year is to further enhance the video conferencing solution by extending the capabilities to external parties. This next step will allow the company to communicate with customers, partners and suppliers more effectively while at the same time reduce the need to travel.
An ongoing objective is to optimise the use of “greener” materials in our end products. We are committed to developing and supplying products which meet the highest standards as regards minimising the use of hazardous substances. CSR’s products are manufactured and packaged in a variety of forms. Most of these products are already manufactured according to CSR’s own “green” standards. The green standards have been developed by CSR as part of continual engagement with leading global companies who are customers of CSR and also with the support of our suppliers. CSR’s green standards therefore reflect not only internationally recognised guidelines but also the feedback of our
CSR plc Annual Report and Financial Statements 2009
36
customers, whose requirements frequently exceed the minimum conditions set by governments and regulators. 2009 has seen the integration of CSR and SiRF into one company. Both companies had existing programmes for development of “green” products. Since the acquisition a single “green” standard has been agreed and all new products developed have met this standardised requirement.
As part of our commitment to ensure compliance to international requirements, during the early part of 2010, we will perform a review of the “green” standards promulgated by national and supranational agencies, particularly to review developments from the Japan Green Procurement Survey Standardisation Initiative (JGPSSI) and in the USA, the Joint Industry Group (JIG). It is expected that our “green” standard will be upgraded to cover both these requirements following this review.
We have dedicated internal resource which assists in the development of all new products and the review of existing product lines targeting the use of greener materials. Part of their role is to monitor established and pending legislation and standards published by national and supranational governments and agencies and to ensure that we are proactive in going beyond the minimum requirements in our compliance with the types and quantities of materials used.
In this respect we work closely with both customers and suppliers in developing products which reduce the use of hazardous materials, and through testing and certification ensures ongoing compliance.
Our standard integrated circuits are fully compliant with all existing European legislation, including RoHS and REACH, as well as in other territories where equivalent legislation has been introduced.
In addition to procedures that establish and monitor compliance, we have processes in place to make sure that customers are supported with up to date materials information and laboratory analysis to validate the environmental compliance of our products.
We recognise the importance of ensuring that our key suppliers have appropriate policies and practices on SEE matters. Key manufacturing partners are selected and assessed based on certification to appropriate globally recognised standards such as ISO 14001, OHSAS 18001 and SA 8000. Audits of their
operations are undertaken regularly to ensure that appropriate standards and certification exists.
During 2009, a review of product environmental compliance was conducted by our Supplier Audit Team at TSMC and ASE in Taiwan. This confirmed that current certifications to the recognised standards mentioned above were being maintained. The review also considered the suppliers wider HSE policies and management systems in connection with our requirements. The results of these assessments were reported to our management, which concluded that the suppliers complied with our requirements.
Based on the extent of our ongoing engagement with health, safety and environmental matters the Board is satisfied that there are no significant risks affecting its strategic objectives or the long or short term value of the Group.
Employees
As of 2 January 2009, we had 975 employees. As a result of the acquisition of SiRF on 26 June 2009, 482 SiRF employees joined the CSR plc Group. As a result of the restructuring programme that commenced at the end of Q2 2009, approximately 100 employees left CSR. At 1 January 2010, we had 1,348 employees, of which 961 were allocated to R&D, 258 to sales and marketing and 129 to general and administrative. The following tables provides a breakdown of the numbers of employees by functional area and region as of the last three financial year ends:
| | | | | | |
| Functional area | | As of
1 January
2010 | | As of
2 January
2009 | | As of
28 December
2007 |
Research & development | | 961 | | 660 | | 714 |
Sales & marketing | | 258 | | 210 | | 235 |
General and administrative | | 129 | | 105 | | 113 |
Total | | 1,348 | | 975 | | 1,062 |
| | | |
| Region | | As of
1 January
2010 | | As of
2 January
2009 | | As of
28 December
2007 |
Europe | | 711 | | 740 | | 776 |
Asia | | 362 | | 173 | | 199 |
US | | 275 | | 62 | | 87 |
Total | | 1,348 | | 975 | | 1,062 |
CSR plc Annual Report and Financial Statements 2009
37
DIRECTORS’ REPORT BUSINESS AND FINANCIAL REVIEW continued
We recognise that a key development for all employees in 2009 was the work in connection with the integration of CSR and SiRF following the acquisition in June 2009. Bringing together the two workforces was a key driver in achieving the synergies offered by the acquisition, and the organisation as a whole had a significant role to play in the successful accomplishment of this work.
Immediately following the acquisition of SiRF, we implemented plans to restructure the organisation. These were carried out following careful consideration of the strategic objectives and the targeted synergies which had been identified as part of the rationale for the acquisition. This analysis was undertaken in conjunction with operational management to ensure that core projects remained adequately resourced. We believe it was particularly important that all employees received timely information and were kept up-dated on developments as it affected them. Careful attention was given to implementing changes fairly and consistently across all countries in which we operate. This included encouraging regular feedback from employees through line management and each of the HR offices in the various locations during the course of implementing significant changes.
We recognise that in a business where technical excellence, strong self motivation and creative thinking are key to remaining a world leader and building future success, our employees play a critical part in enabling the fulfilment of our objectives and delivering long term growth. The challenging economic environment experienced in 2009 did not alter the importance which we attach to creating a high performance working environment, which allows our employees to reach their full potential in a highly technical and innovative arena. We actively review and encourage the personal development of our employees and have implemented performance processes to ensure that adequate focus is given to retain and inspire employees to deliver innovative solutions for our customers. We remain committed to providing our employees with a workplace that not only encourages excellence in their performance but also engenders well being and personal satisfaction.
We invest in training and career progression to support employees in their career development, which we believe also benefits our customers in the quality of service and enables us to remain a world leading
provider of wireless connectivity solutions. The Company promotes and supports individuals and teams through both on-the-job and formal training and works to encourage the development of knowledge sharing networks.
To develop attractive and competitive remuneration packages, we regularly review and benchmark our
salary and benefits against companies in our sector and have developed incentives that are aligned to our business delivery and commercial goals, recognising that we operate in a global market.
In the period immediately after June 2009, the Company implemented a detailed review of benefits provisions in all countries where SiRF and CSR have employees, carefully comparing the prevailing benefits structures for the two companies as well as market practice in each territory to develop harmonised benefits that offer a compelling reward structure to current and potential employees in what is recognised as a highly competitive market. Some of the key changes introduced as a result of this review were 401(k) matching for the SiRF team in the US, and an enhancement of local benefits for the team in China, in response to a changing reward landscape in this rapidly evolving market. The feedback from employees to these changes has been largely positive.
We recognise our responsibilities to ensure fair treatment of all employees in accordance with national legislation in the territories in which we operate. Equal opportunities for appropriate training, career development and promotion are available to all employees, regardless of any physical disability, gender, religion, race or nationality. In particular, having regard to their aptitudes and abilities, we give full and fair consideration to applications for employment received from disabled persons. Provisions for pensions are available for all employees either through participation in the state pension schemes operated by the country in which the employee is resident or provision of a defined contribution pension scheme. Such defined contribution schemes are maintained in accordance with legislative requirements, custom and practice and Group policy as appropriate.
In October 2009, having completed the integration work, we issued our second employee engagement
CSR plc Annual Report and Financial Statements 2009
38
survey. The survey had an extremely high response rate of 83%, which CSR believes demonstrates the genuine commitment amongst the Company’s employees. In a year which saw significant change for employees, results from the survey showed positive feedback on the way change was planned and communicated, and a continued sense of satisfaction in working for the Group. There were no significant differences in engagement between the legacy CSR and SiRF teams which also supported the general feedback that the integration had been implemented effectively. The results from the survey have been shared with all employees and a series of focus groups are now working on addressing specific areas identified from these results.
As explained above, one area of positive feedback has been on employee communication and this reflects further developments over the past 12 months. The global e-newsletter, “Rhythm”, continues to provide information for employees globally and we believe it offers a key means of communication about developments across the organisation. Readership has continued to increase with some articles accessed by as many as 850 or over 60% of employees. The contribution to Rhythm spans all levels of the organisation and addresses wide ranging topics that support business and social networks within our growing Group.
Our intranet has also undergone significant change in 2009. Combined with the use of workspaces and specialist user tools, the intranet also features local and global news as well as departmental content and discussion forums which have proven to aide employee engagement and the sharing of helpful news and information.
During 2009, two global meetings were broadcast live from the Cambridge Corn Exchange and in “real time” to each of the Company’s international locations. Presentations are given on key developments in the business with the opportunity for questions from each office. CSR believes that this forum is an important part of enabling the exchange of views and ideas as well as providing its employees with a clear understanding of strategy.
Our employees are not covered by any collective bargaining arrangements
Reconciliation of non-GAAP measures to IFRS measures
In the following sections we set out our definitions of the following non-GAAP measures and provide reconciliations to relevant IFRS measures:
| | · | | underlying operating profit; |
| | · | | underlying research and development expenses; |
| | · | | underlying sales, marketing and administrative expenses; |
| | · | | underlying diluted earnings per share; and |
Underlying operating profit, underlying net profit, underlying research and development expenses, underlying sales, marketing and administrative expenses and underlying diluted earnings per share are non-GAAP measures. We comment on these in detail here because they are the way in which we measure our business internally, they form the basis for management’s performance targets, resource allocation decisions and we use them to determine and manage the long term growth of the business. We present and discuss these measures in order to:
| | · | | provide consistency with the way management view the business and discuss performance with investors; |
| | · | | ensure that the measures are fully understood in the light of how CSR manages the business; |
| | · | | comply with UK Company Law which requires the presentation of the Group’s Key Performance Indicators; |
| | · | | properly define the metrics used and confirm their calculation; |
| | · | | share the metrics with all investors at the same time; |
CSR plc Annual Report and Financial Statements 2009
39
DIRECTORS’ REPORT BUSINESS AND FINANCIAL REVIEW continued
| | · | | disclose the main drivers of management remuneration; |
| | · | | improve transparency for investors; |
| | · | | assist investors in their assessment of the long-term value of CSR; and |
| | · | | therefore assist investors in understanding management behaviour. |
Beginning on page 41 we provide a reconciliation of each measure to the nearest IFRS measure: underlying operating profit to IFRS operating profit, underlying net profit to IFRS net (loss) profit, underlying operating expenses to IFRS operating expenses, underlying diluted earnings per share to diluted earnings per share and free cash flow to cash generated by operations.
In each of the underlying measures we add back the amortisation and impairment of acquired intangible assets, including goodwill. Our revenue is driven by the performance of our technology and our customer relationships, some of which is internally generated and some of which has been acquired. The acquired technologies and customer relationships are assigned a finite life and result in an amortisation charge being recorded in arriving at operating profit. There are no similar charges associated with our internally generated technology and other intangible assets. In addition, from time to time, the Group may be required to recognise impairments of intangibles and goodwill. No similar charges can occur from our organically grown businesses. We believe that excluding acquisition intangible amortisation and goodwill impairment from our measures of operating performance allows the operating performance of the businesses that were organically grown and those that have resulted from acquisitions to be analysed on a more comparable basis.
From time to time events occur which due to their size or nature are considered separately when discussing the trading performance of the Group. The gains and losses on these discrete items can have a material impact on the absolute amount of, and trend in, the operating profit and results for the year. Therefore any gains and losses on such items are analysed outside the underlying results to enable the trends in the underlying performance of the business to be
understood. Where items are excluded from the underlying results we provide additional information on these items to enable a full understanding of the events and their financial impact. Examples of such items are acquisition related fees incurred in 2009 in connection with the SiRF acquisition, deferred tax adjustments to goodwill and the patent dispute settlement in 2007.
In each of the underlying measures we add back share option charges. We believe share option charges reflects a non-cash cost which may obscure the trends in the underlying business and these charges are based on a number of assumptions linked to our share price, the volatility of our share price, the expected performance of our share price compared to a number of other comparator companies and assumptions around employee behaviour. Therefore management of the segments are not held accountable for the impact of this item on their results of operations.
Further, management believes that due to these subjective assumptions involved in determining the fair value of equity awards and the varying methodologies used to determine equity based compensation across various companies, excluding these amounts from underlying operating profit and underlying net (loss) profit enhances comparisons of the underlying operating performance of the business with other similar companies. Therefore any charges from these share-based payments are analysed outside the underlying results to enable the trends in the underlying performance of the business to be understood.
Caution
CSR cautions that, whilst we have defined underlying operating profit, underlying net profit, underlying operating expenses, underlying diluted earnings per share and free cash flow, they are not defined terms under IFRS or other GAAP and therefore these definitions should be carefully reviewed and understood by investors. Investors should be aware that their application may vary in practice from other similarly titled measures presented by other companies and therefore these measures may not be fully comparable between companies. In particular:
| | · | | Underlying measures of operating expenses and diluted earnings per share are not intended to be a substitute for, or superior to, IFRS measures in the financial statements; |
CSR plc Annual Report and Financial Statements 2009
40
| | · | | The usefulness of free cash flow as an indicator of investment value is limited, as such measures are based on historical information. |
| | · | | The adjusted items are in some cases recurring or could be expected to recur in the future, and we do not represent that these are in any way extraordinary or outside the normal course of business. |
| | · | | Some of the items that have been adjusted or excluded from non-GAAP performance measures presented in this Annual Report, such as integration or restructuring charges, are based on management’s judgment, in terms of both classification and estimation. |
Underlying operating profit
The table below gives a reconciliation of “underlying operating profit” to the heading “Operating (loss) profit for the period” as presented on the consolidated income statement on page 93 for the three years presented in the income statement.
| | | | | | | | |
| | | 52 weeks ended 1 January 2010 | | | 53 weeks ended 2 January 2009 | | | 52 weeks ended 28 December 2007 |
| | | $’000 | | | $’000 | | | $’000 |
Operating (loss) profit | | (15,914 | ) | | (8,515 | ) | | 150,098 |
| | | |
Add back: | | | | | | | | |
Research and development (“R&D”) expenses: | | | | | | | | |
Share-based payment charges | | 6,763 | | | 4,785 | | | 5,778 |
Amortisation of acquired intangible assets | | 7,488 | | | 5,418 | | | 6,609 |
| | | |
Sales, marketing and administrative expenses (“SG&A”): | | | | | | | | |
Share-based payment charges | | 3,818 | | | 2,801 | | | 3,497 |
Amortisation of acquired intangible assets | | 1,979 | | | – | | | – |
Integration and restructuring | | 12,227 | | | 14,445 | | | – |
Acquisition-related fees | | 10,572 | | | – | | | – |
Deferred tax adjustment to goodwill | | – | | | 978 | | | 279 |
Asset impairment | | – | | | 52,918 | | | – |
Patent dispute settlement | | – | | | – | | | 15,000 |
| | | |
Underlying operating profit | | 26,933 | | | 72,830 | | | 181,261 |
CSR plc Annual Report and Financial Statements 2009
41
DIRECTORS’ REPORT BUSINESS AND FINANCIAL REVIEW continued
Underlying operating expenses
The table below gives a reconciliation of “underlying research and development expenses” and “underlying sales, marketing and administrative expenses” to the headings “Total Research and Development expenses” and “Total Sales, Marketing and Administrative expenses” as presented on the consolidated income statement on page 93 for the three years presented in the income statement. The calculations for 2004, 2005 and 2006 which are used in the Key Performance Indicator section are performed on a consistent basis.
| | | | | | | | | |
| | | 52 weeks ended 1 January 2010 | | | 53 weeks ended
2 January 2009 | | | 52 weeks ended 28 December 2007 | |
| | | $’000 | | | $’000 | | | $’000 | |
Total research and development expenses | | (169,713 | ) | | (158,167 | ) | | (147,541 | ) |
| | | |
Add back: | | | | | | | | | |
Share-based payment charges | | 6,763 | | | 4,785 | | | 5,778 | |
Amortisation of acquired intangible assets | | 7,488 | | | 5,418 | | | 6,609 | |
Underlying research and development | | (155,462 | ) | | (147,964 | ) | | (135,154 | ) |
Total sales, marketing and administrative expenses | | (114,501 | ) | | (160,176 | ) | | (98,635 | ) |
| | | |
Add back: | | | | | | | | | |
Share-based payment charges | | 3,818 | | | 2,801 | | | 3,497 | |
Amortisation of acquired intangible assets | | 1,979 | | | – | | | – | |
Integration and restructuring | | 12,227 | | | 14,445 | | | – | |
Acquisition-related fees | | 10,572 | | | – | | | – | |
Deferred tax adjustment to goodwill | | – | | | 978 | | | 279 | |
Asset impairment | | – | | | 52,918 | | | – | |
Patent dispute settlement | | – | | | – | | | 15,000 | |
Underlying Sales, marketing and administrative expenses | | (85,905 | ) | | (89,034 | ) | | (79,859 | ) |
CSR plc Annual Report and Financial Statements 2009
42
Underlying net profit
The table below gives a reconciliation of “underlying net profit” to the heading “(Loss) profit for the period” as presented on the consolidated income statement on page 93 for the three years presented in the income statement. The calculations for 2004, 2005 and 2006 which are utilised in the Key Performance Indicator section for calculation of underlying diluted earnings per share are performed on a consistent basis.
| | | | | | | | | |
| | | 52 weeks ended 1 January 2010 $’000 | | | 53 weeks ended
2 January 2009
$’000 | | | 52 weeks ended 28 December 2007 $’000 | |
(Loss) profit for the period | | (11,309 | ) | | (6,939 | ) | | 112,804 | |
| | | |
Add back: | | | | | | | | | |
Research and development (“R&D”) expenses: | | | | | | | | | |
Share-based payment charges | | 6,763 | | | 4,785 | | | 5,778 | |
Amortisation of acquired intangible assets | | 7,488 | | | 5,418 | | | 6,609 | |
| | | |
Sales, marketing and administrative expenses (“SG&A”): | | | | | | | | | |
Share-based payment charges | | 3,818 | | | 2,801 | | | 3,497 | |
Amortisation of acquired intangible assets | | 1,979 | | | – | | | – | |
Integration and restructuring | | 12,227 | | | 14,445 | | | – | |
Acquisition-related fees | | 10,572 | | | – | | | – | |
Deferred tax adjustment to goodwill | | – | | | 978 | | | 279 | |
Asset impairment | | – | | | 52,918 | | | – | |
Patent dispute settlement | | – | | | – | | | 15,000 | |
| | | |
Less: | | | | | | | | | |
Tax effects of adjustments above | | (810 | ) | | (10,176 | ) | | (6,483 | ) |
Underlying net profit | | 30,728 | | | 64,230 | | | 137,484 | |
Underlying diluted earnings per share
Underlying diluted earnings per share is calculated as underlying net profit as shown above divided by the weighted average number of dilutive shares as shown below.
The table below gives a reconciliation of diluted shares to the diluted shares used in calculating earnings per share as presented on the consolidated income statement on page 93 for the three years presented in the income statement. The numbers differ for 2008 and 2009 as in the loss per share calculation presented for those periods, share options are not dilutive, however they are dilutive for underlying dilutive earnings per share as underlying earnings represented a profit in both these years. There is no difference in the number of dilutive shares for 2004, 2005 and 2006.
| | | | | | |
| | | 52 weeks ended 1 January 2010 | | 53 weeks ended 2 January 2009 | | 52 weeks ended 28 December 2007 |
| | | Number of
shares | | Number of
shares | | Number of shares |
Weighted average number of shares used in diluted earnings per share calculations | | 153,927,671 | | 128,617,601 | | 135,596,821 |
Effect of dilutive potential ordinary shares – share options | | 3,520,499 | | 1,993,152 | | – |
Weighted average number of shares used in underlying diluted earnings per share calculations | | 157,448,170 | | 130,610,753 | | 135,596,821 |
CSR plc Annual Report and Financial Statements 2009
43
DIRECTORS’ REPORT BUSINESS AND FINANCIAL REVIEW continued
Free cash flow
Free cash flow is calculated as cash generated by operations (as per the consolidated cash flow statement on page 96) less expenditure on tangible and intangible assets (not including those acquired through acquisition) in the 52 week period (as shown on the cash flow statement).
The table below gives a reconciliation of “free cash flow” to the heading “cash generated by operations” as presented on the consolidated cash flow statement on page 96 for the three years presented in the cash flow statement. The calculations for 2004, 2005 and 2006 which are utilised in the Key Performance Indicator section for calculation of free cash flow are performed on a consistent basis.
| | | | | | | | | |
| | | 52 weeks ended 1 January 2010 | | | 53 weeks ended
2 January 2009 | | | 52 weeks ended 28 December 2007 | |
| | | $’000 | | | $’000 | | | $’000 | |
Cash generated by operations | | 50,280 | | | 96,335 | | | 252,355 | |
| | | |
Less: | | | | | | | | | |
Purchase of property, plant and equipment | | (7,528 | ) | | (20,232 | ) | | (24,382 | ) |
Purchase of intangible assets | | (5,799 | ) | | (2,448 | ) | | (5,098 | ) |
Free cash flow | | 36,953 | | | 73,655 | | | 222,875 | |
Will Gardiner
Chief Financial Officer
CSR plc Annual Report and Financial Statements 2009
44
DIRECTORS’ REPORT RISK FACTORS
This section describes the principal known risks and uncertainties that could have a material adverse effect on our business, financial condition, prospects, liquidity or results of operations. The factors discussed below should not be regarded as a complete and comprehensive statement of all potential risks and uncertainties that we face. Additional risks and uncertainties of which we are not aware or which we currently believe are immaterial may also adversely affect our business, financial condition, prospects, liquidity or results of operations. For information on our risk management policies and procedures, see “– Corporate Governance – Internal control – Managing Risks.”
Risks related to the company
Our fabless business model, which relies on third party foundries and subcontractors for the manufacture, assembly and testing of our integrated circuit products, exposes us to risks.
We do not own or operate a fabrication facility. We use third party foundries and subcontractors to manufacture, assemble and test all of our products. We are therefore reliant on these third parties to provide the required capacity to manufacture, assemble and test all of our products and to provide high quality products on time. We rely in particular on Taiwan Semiconductor Manufacturing Company and Advanced Semiconductor Engineering, both of Taiwan, which undertake a significant proportion of the total subcontracted work on our behalf.
Because we are wholly reliant on these third parties, and in particular on TSMC and ASE, we are subject to risks, including:
| | · | | interruptions in manufacturing or testing at supplier sites, resulting for example from earthquake, pandemic, natural disaster or geopolitical instability, shortage of materials or failures in their own suppliers; |
| | · | | disruption in supply, changes in working practices affecting product qualification or product quality, changes in management personnel affecting working relationships, availability of manufacturing capacity or adverse changes to pricing, that may occur within our |
| | | suppliers, including potentially as a result of reorganisations, mergers, acquisitions or disposals affecting our suppliers; |
| | · | | the risk that our key suppliers experience financial troubles or become insolvent; |
| | · | | quality problems in our suppliers’ manufacturing sites, resulting in lower yields, product failures and product returns; |
| | · | | inadequate manufacturing capacity, if our key suppliers commit their manufacturing resources to others, experience plant shut-downs or closures, or are unable or unwilling to expand capacity or upgrade manufacturing capabilities to meet market demand; and |
| | · | | limited control over delivery schedules, quality assurance and control and production costs. |
Because we have no long term supply contracts, our suppliers are generally not obligated to perform services or supply products to us for any specific period, in any specific quantities, or at any specific price, except as may be provided in a particular purchase order. In the event we cannot source products we need from one of our third party suppliers, due for example to a business interruption event, we may be unable quickly to source our requirements from alternative suppliers. Any of these developments would adversely affect our ability to deliver products, undermine our perceived reliability, and harm our financial condition and results of operations.
The average selling prices of our products are likely to decrease rapidly.
The average selling prices of our products have historically declined significantly over their life, and this is likely to continue. We regularly reduce the average selling prices of our products in response to competitive pricing pressures, new product introductions by us or our competitors and other factors. In 2009, we experienced significant downward pressure on prices for a number of mature products, and we expect to have to reduce prices on all of our products as they mature. The global recession has caused a significant downturn in the
CSR plc Annual Report and Financial Statements 2009
45
DIRECTORS’ REPORT RISK FACTORS continued
semiconductor industry, resulting in our competitors becoming more aggressive in their pricing practices, behaviour which we expect to continue in the foreseeable future. Our financial results could be materially adversely affected if we fail to offset reduced prices by increasing our sales volumes, reducing our costs, or successfully introducing new products at higher prices. Despite the measures taken in 2008 and 2009 to reduce our costs as part of restructuring measures, we still saw a decline in our operating profit in each of 2008 and 2009.
The length of our product design cycle exposes us to risks.
The design and sales cycle for our integrated circuits can take up to 36 months, and in exceptional cases even longer, and achieving volume production of products using our integrated circuits can take an additional six months or more. This lengthy design cycle makes it difficult to forecast product demand and the timing of orders, and exposes us to the risk that orders will not ultimately materialize in accordance with our expectations. Even if we have a design win, it may never result in volume shipments. In addition, the delays inherent in lengthy design cycles increase the risk that our customers may seek to cancel or modify orders.
We may suffer delays or experience problems in the introduction of new products.
Our products are complex and may contain undetected hardware and software errors or failures when first introduced or as new versions are tested. The resolution of these errors could cause us to invest significant capital and other resources and divert technical staff from other development efforts. If the introduction of products is delayed, our ability to compete and maintain market share may be materially adversely affected. If we deliver products with errors, defects or bugs, or that are susceptible to connectivity viruses, our credibility and the market acceptance and sales of our products could be materially adversely affected.
We are subject to risks associated with the transition to smaller geometry process technologies.
To remain competitive, we expect to continue to transition our semiconductor products to increasingly smaller line width geometries. This transition requires modifications to the manufacturing processes and the
re-design of some products as well as standard cells and other integrated circuit designs that may be used in multiple products. This may result in reduced manufacturing yields, delays in product deliveries and increased expenses, all of which could materially adversely impact our results of operations.
We may fail to develop new products and revenue sources or fail to secure new orders with our new technologies.
Our future success is dependent upon our ability to develop new semiconductor solutions for existing and new markets, introduce those products in a cost-effective and timely manner, and convince leading equipment manufacturers to select those products for design into their own new products. Our success also depends on the development of these markets and adoption of the technologies by our customers. We cannot predict the adoption of these technologies or the growth rate, if any. If we are not able to develop and introduce new products successfully and in a cost effective and timely manner, our business, prospects, financial condition and results of operations will be materially adversely affected.
We may fail on an accurate and timely basis to anticipate technological and market trends.
We are subject to the risk that we may incorrectly assess trends in technological evolution, industry standards and/or market requirements. This could cause us to invest our R&D monies in the wrong areas, develop products that fail to meet our customers’ needs, or fail to pursue product development opportunities that our competitors seize. Technological and market trends are difficult to predict. If we are unable to predict market requirements, end customer demand for product features and evolving industry standards, our prospects and results of operations could be materially adversely affected.
The integration of multiple wireless technologies coexisting with one another on a single chip may take longer than expected and customer demand for these combination chips may be slow to develop or may not develop at all.
The integration of multiple technologies on a single chip which we are developing is a complex process which may take longer to achieve than foreseen and may not achieve the expected level of performance. It is also possible that the demand from customers for
CSR plc Annual Report and Financial Statements 2009
46
wireless connectivity solutions incorporating such multiple technologies in a single die is slower to develop than anticipated or fails to develop at all. This could have a material adverse effect on our business and financial condition.
Errors or defects in our products could result in claims from customers.
Integrated circuits are highly complex products, and the integrated circuits that we supply to our customers are required to operate to very precise specifications. We may not detect errors in the research and development of a product or in its manufacture before it is supplied to customers or installed in the customers’ own finished devices. Any such errors could result in the customers’ devices being faulty, which would result in returns from consumers. If the device’s failure were attributable to us, we may face claims for losses or damages, costs for rectifying the defects or replacing the product, and loss of revenue if customers cancel orders. In some cases we have agreements with customers that provide warranty protection or indemnities. Some of these agreements have no limitations on liability, and where there are limitations they may not be enforceable. Our insurance coverage against losses that might arise as a result of some product defects may not be sufficient to cover claims that are asserted against us, and may not continue to be available on reasonable terms in the future. Product defects could also have longer-term harmful effects on our reputation or our relationships with our customers. Any of the foregoing could have a material adverse impact on our business, financial condition and results of operations, which in turn could impact our share price.
We rely on a few large customers for a significant portion of our revenue.
We work with a broad range of customers across our product portfolio but a few large customers represent a material portion of our total revenue. Our largest customer accounted for approximately 11% of our net revenue in 2009 and 19% in 2008. Our top five customers accounted for 43% of our net revenue in 2009 and 50% in 2008. If we fail to maintain a good relationship with our key customers, fail to meet the customers’ product needs on a timely basis, lose design wins for our products with our key customers, or if any key customer were to reduce or change its orders to us, seek alternate suppliers, increase its
product returns or become unable or fail to meet its payment obligations to us, our revenue could decline materially and our operating results could be materially adversely affected. If any key customer were to merge or be acquired, this could jeopardise our customer- supplier relationship, particularly if it merges with or is acquired by one of our competitors. If any of our key customers have financial or other difficulties such as an interruption to their own operations that affects their ability to maintain their business for example a sudden disruption caused by fire, flood, earthquake or other event, this could result in a decline in its orders to us and thus adversely affect our business and financial performance.
We depend on a sole supplier for some critical components.
We purchase critical components from a single supplier for certain products. The loss of such supplier, disruption of the supply chain, or delays or changes in the design cycle time could result in delays in the manufacture and shipment of products, additional expense associated with obtaining a new supplier, impaired margins, reduced production volumes, strained customer relations and loss of business or could otherwise materially adversely affect our business and results of operations.
We rely on Information Technology and automated systems to conduct our business
We rely on Information Technology (or “IT”) and automated systems to support our operations globally. A failure or interruption to these systems could materially and adversely affect our business and operations and as a result our financial performance. Our IT systems are a key part of our day to day business, the loss or disruption of which could affect many aspects of our business, from the development of products, to the ordering and delivery of products, to the accurate recording of financial information. The loss of IT systems could affect our development work, for example by delaying a project, causing errors to occur in the software we develop for our products, or could mean that we are unable to launch new products on time. In addition, loss of our systems could disrupt or cause delays in recording and satisfying customer orders, or result in errors in ordering of products from our suppliers. We could also lose the means to make decisions on the conduct of our business on a timely basis which could affect business or investment decisions. If our IT systems fail to evolve in conjunction with the needs of
CSR plc Annual Report and Financial Statements 2009
47
DIRECTORS’ REPORT RISK FACTORS continued
our business, for example because of lack of investment or failure to predict future business needs, our ability to develop new products, maintain adequate operating system or grow our business could be adversely affected. Any of these events could result in loss of business, additional costs, or inaccurate recording of key business and financial information, which could materially adversely affect our business and results of operations.
International economic, political and other risks may harm our results of operations.
We derive nearly all of our revenue from sales outside of the U.K. Because we conduct business internationally, we are subject to economic, political and other risks in each of the countries in which we operate, and our customers are subject to these risks in the countries in which they operate. Such risks include ensuring compliance with multiple sets of laws and regulations, which can change often and may be in conflict, relating to the import and export of our and our customers’ products, employment, taxes, and other laws and regulations that apply in our industry; complying with local business practices and managing cultural differences; working with local infrastructure and transportation networks; and designing products to comply with local regulatory requirements. If we or our customers fail, or are unable, to manage these risks in the various markets in which we operate, our results of operations may be materially adversely affected.
We may in the future require debt or equity financing, which may not be available on reasonable terms or at all.
We may, in the future, need to raise additional funds to grow our business. While conditions in the debt and equity capital markets have improved during 2009, we may be unable to raise additional funds, on reasonable terms, through public or private securities issuances, bank borrowing or other means. Any future share issuances may be dilutive to shareholders, and debt financing, if available, may subject us to restrictive covenants. Our failure to raise capital, if needed, on reasonable terms could have a material adverse effect on our financial condition.
We may be subject to claims that we infringe third party intellectual property rights.
We have in the past been, and currently are, subject to patent infringement litigation. We may be subject to
further intellectual property claims by third parties alleging infringements of their patents or other intellectual property rights. Companies in the semiconductor industry often aggressively protect and pursue their intellectual property rights. Other parties, including companies that assemble a portfolio of patents and use it to derive substantial licensing revenues, may assert intellectual property infringement claims against our products. Intellectual property claims could adversely affect our ability to market our products, require the re-design of our products or require us to seek licenses from third parties, and seriously harm both our reputation and operating results. The defence of such claims and any adverse settlement could result in significant costs and divert the attention of our management or other key employees. As we diversify into different wireless technologies, we may become more susceptible to these types of infringement claims. Any of the foregoing could have a material adverse impact on our business, operating expenses, financial condition and results of operations.
SiRF became a member of the CSR Group and a subsidiary of CSR plc on 26 June 2009. The outcome of any litigation is uncertain and either favourable or unfavourable outcomes could have a material impact. If infringement claims are brought against the CSR Group, these assertions could distract CSR’s management and necessitate the expenditure by the Group of potentially significant funds and resources to defend or settle such claims. No assurance can be made that third parties, including Broadcom, will not seek to commence additional litigation against the CSR Group including requesting formal enforcement action against SiRF and/or the CSR Group, or that the pending and/or additional litigation will not have a material adverse effect on the CSR Group’s business.
The CSR Group cannot be certain that it will have the financial resources to defend itself against any patent or other intellectual property litigation. If the CSR Group is unsuccessful in any challenge to its rights to market and sell its products, the CSR Group may, among other things, be required to:
| | · | | pay actual damages, royalties, lost profits and/or increased damages and the third party’s attorneys’ fees, which may be substantial; |
CSR plc Annual Report and Financial Statements 2009
48
| | · | | cease the development, manufacture, use, marketing and/or sale of products that use the intellectual property in question through a court-imposed sanction called an injunction; |
| | · | | expend significant resources to modify or redesign its products, manufacturing processes or other technology so that it does not infringe others’ intellectual property rights or to develop or acquire non-infringing technology, which may not be possible; or |
| | · | | obtain licenses to the disputed rights, which could require the payment of substantial upfront fees and future royalty payments and may not be available to it on acceptable terms, if at all, or to cease marketing the challenged products. Before the CSR Group could be successful in defending an infringement claim, the CSR Group’s customers may already be reluctant to include the CSR Group on their future product design. Therefore, even if the CSR Group is successful in defending an infringement action, negative publicity could already have a material adverse effect on its business in addition to the expense, time delay, and burden on management of the litigation itself. |
The U.S. International Trade Commission, or ITC, has determined that certain products of SiRF and its customers infringe patents held by Broadcom Corporation, or Broadcom. Although SiRF has obtained approval from U.S. Customs for the importation of products at issue containing new versions of its software, if Broadcom is successful in obtaining a judgment for substantial monetary damages or granting an injunction against SiRF in relation to SiRF’s alleged infringement, our customer relationships may be harmed, and our business, revenue, expenses, financial position and results of operations could be materially adversely affected.
SiRF and four of its customers are subject to a limited exclusion order and cease and desist orders issued by the ITC, which prohibit the unlicensed entry and sale into the United States of certain products of SiRF and its customers that the ITC has determined infringe six patents held by Broadcom. In August 2008, the ITC concluded that all six of the asserted Broadcom patents were valid and were infringed by certain of SiRF’s products.
Pursuant to a letter dated 21 May 2009 and received by SiRF on 29 May 2009, U.S. Customs issued a determination involving the redesigned software incorporated into the GPS devices subject to the limited exclusion order issued by the ITC in the ITC proceeding, that SiRF had established by a preponderance of the evidence that SiRF’s redesigned GPS chips fall outside of the scope of the exclusion order issued by the ITC. Broadcom asked the ITC to commence an informal enforcement proceeding against SiRF and two of its customers alleging violations of the cease and desist orders, which SiRF opposed, and which request was denied by the ITC. Irrespective of the determination by U.S. Customs, there is a risk that the ITC may commence formal enforcement proceedings if Broadcom made such a request. Our business could be materially and adversely affected by such ITC proceedings including, for example, if the redesigned software is found to be infringing.
We are also involved in two patent infringement suits with Broadcom in the United States District Court for the Central District of California. We have denied Broadcom’s claimed allegations against us in both suits. One of these suits seeks monetary damages for and injunctive relief from the alleged infringement of four patents, two of which are at issue in the ITC proceeding. The other suit seeks similar relief in relation to three other Broadcom patents. In this suit, scheduled for trial in November of this year, Broadcom added allegations against us for False Advertising and Unfair Competition and we have asserted allegations against Broadcom for False Advertising and Unfair Competition. There is a risk that in one or both of these suits we could be ordered to pay substantial damages to Broadcom for alleged past infringement, enjoined from further allegedly infringing activities including with respect to certain products, and/or required to pay royalties for any alleged future infringement at a level determined by the court.
Furthermore, no assurance can be made that Broadcom will not seek to commence additional litigation against us, including SiRF, or that the pending or additional litigation with Broadcom will not have a material adverse effect on our business, customer relationships, expenses or results of operations.
CSR plc Annual Report and Financial Statements 2009
49
DIRECTORS’ REPORT RISK FACTORS continued
Our intellectual property indemnification practices may adversely impact our business.
We have agreed to indemnify some customers for costs and damages of intellectual property infringement in some circumstances, which may subject us to significant indemnification claims by our customers or others. We may also have to defend related third-party infringement claims made directly against us. In some instances, our products are designed for use in devices used by potentially millions of consumers, such as cellular telephones, and our server software is placed on servers providing wireless network services to end-users, both of which could subject it to considerable exposure should an infringement claim occur. One of our major customers advised us that it had received notice from one of our competitors that the incorporation of our chip sets into products requires the payment of patent license fees to the competitor. If this competitor or another competitor pursued such claims, our business could be materially adversely affected
We may fail or be unable to obtain sufficient patent protection, which could harm our competitive position and increase our expenses.
Protecting of our proprietary technology is an important part of being able to compete successfully. Our patent applications may not provide sufficient protection for all competitive aspects of our technology or may not result in issued patents. Issued patents may not provide competitive advantages to us. The laws of some foreign countries, such as China, in which we operate and/or from which we derive significant amounts of revenue, do not protect intellectual property to the same extent as, for example, the laws of the United States and western Europe. Our competitors may independently develop similar technologies or design around our patents and could also successfully challenge any issued patent. Even where we have an issued patent, we may choose not to pursue all instances of patent infringement. Our failure or inability to obtain sufficient patent protection could harm our competitive position and increase our expenses if we are required to pay license fees under patents issued to others.
Our acquisition of SiRF Technology and/or future mergers or acquisitions may not achieve anticipated commercial, technological or financial benefits, including synergies, and could divert management’s attention, cause ownership dilution to our shareholders, and adversely affect our results of operations and share price.
From time to time, we have made, and may wish in the future to make acquisitions and engage in mergers and other strategic transactions that are intended to support our business and commercial objectives, growth and diversification. These strategic transactions may fail to achieve the desired objectives, including for example cost savings, revenue enhancements or technology advancements that we hope to derive. In particular, our ability to successfully realise cost synergies and revenue enhancements and the timing of this realisation may be adversely affected by a variety of factors, including but not limited to:
| | · | | our broad geographic areas of operations and the resulting potential complexity of integrating the separate business operations we acquire with our culture and strategies on a timely basis or at all; |
| | · | | the risk that key employees in acquired businesses may leave, for instance because they are insufficiently incentivised to remain, do not integrate well with our management culture, or are enticed away by competitors; |
| | · | | difficulties in retaining or developing the customer relationships of the acquired company; |
| | · | | the difficulty of implementing cost savings plans; |
| | · | | the difficulty in identifying and managing liabilities associated with any business we acquire; |
| | · | | the technical challenges associated with combining the technologies of the acquired company with our own technologies; and |
| | · | | unforeseeable events, including major changes in the industries and markets in which we and the acquired company operate. |
CSR plc Annual Report and Financial Statements 2009
50
The success of any strategic transactions will depend on, among other things, our ability to identify suitable acquisition targets and to finance the transaction. Consideration of strategic opportunities could divert management’s attention from our business and the financing of acquisitions may negatively impact our financial condition and could require us to seek funding from the capital markets, or result in substantial dilution to shareholders.
These and other factors may cause a material adverse effect on our business, prospects, results of operations and financial condition.
Loss of key employees could hurt our competitive position.
Our success depends to a significant extent upon our key senior executives and R&D, engineering, marketing, sales, support and other personnel and our ability to continue to attract, retain and motivate qualified personnel. The loss of the services of any of these key personnel without adequate replacement or the inability to attract new qualified personnel could have a material adverse effect on us.
We may encounter difficulties or incur unexpected costs in complying with the Sarbanes-Oxley Act.
To comply with Section 404 of the Sarbanes-Oxley Act and related SEC rules, CSR and its independent registered public accounting firm will be required to assess the effectiveness of our internal control over financial reporting in each of our future annual reports on Form 20-F, and to identify any material weaknesses. In connection with this process we may need to make changes to our financial and managerial controls, which may result in substantial expenses and compliance costs. If our management is unable to implement enhancements on a timely basis to our internal controls that are determined to be necessary to address material weaknesses, (if any), we could be subject to enhanced regulatory scrutiny and a loss of investor confidence, which could lead to a decline in the trading price of our ordinary shares.
Risks related to the industry
Depressed economic conditions may continue to adversely affect our financial performance.
Our products are predominantly supplied for adoption into devices intended for the consumer market. If depressed economic conditions persist or worsen, demand levels for our customers’ products, and therefore for our products, are likely to be materially adversely affected. We expect that a substantial portion of our revenue will continue to be derived from the sale of our technologies to the consumer electronics market and therefore, to the extent that sales of such consumer devices decline, our revenue and our results of operations and financial condition could be materially adversely affected. Any difficulties experienced by customers and suppliers in accessing sources of liquidity could seriously disrupt their businesses, which could lead to a significant reduction in their future orders of our products or the inability or failure on their part to meet their payment obligations to us.
Our quarterly and therefore annual revenue and operating results are affected by a wide variety of factors, making them difficult to predict and, if we do not meet quarterly and therefore annual financial expectations, our share price will likely decline.
Our quarterly and therefore annual revenue and operating results are affected by a wide variety of factors, making them difficult to predict. Our results have in the past fluctuated significantly from quarter to quarter, a trend we would expect to continue. Our operating results in some quarters or annual periods may be materially below market expectations, which would cause the market price of our shares to decline. Our quarterly or annual periods operating results may fluctuate as a result of the risks discussed in this section and other factors, including:
| | · | | global economic conditions; |
| | · | | the cyclical nature of the semiconductor industry, |
| | · | | performance of our key customers in the markets they serve; |
CSR plc Annual Report and Financial Statements 2009
51
DIRECTORS’ REPORT RISK FACTORS continued
| | · | | delays in the introduction of new products; |
| | · | | changes in the relative volume of sales of our chip sets, our premium software offerings and our IP cores or other products and product mix, which have significantly different average selling prices and gross margins; |
| | · | | unpredictable volume, timing and cancellation of customer orders; |
| | · | | the availability, pricing and timeliness of delivery of components used in our customers’ products; |
| | · | | changes in foreign exchange rates; |
| | · | | the timing of new product announcements or introductions by us or by our competitors; |
| | · | | design losses to our competitors |
| | · | | the introduction or delay in launch of the our customers’ products that use our technology; |
| | · | | a decision by one of our customers to terminate use of our technology; |
| | · | | seasonality in our various target markets; |
| | · | | difficulties in managing our product transitions effectively; |
| | · | | intangible asset write-downs; and |
| | · | | developments in litigation proceedings involving the company, including fluctuations in litigation expenses. |
We base our planned operating expenses in part on our expectations of future revenue, and our expenses are relatively fixed in the short term. If revenue for a particular period is lower than we expect, we may be unable to reduce our operating expenses proportionately for that period, which would harm our operating results.
We are subject to foreign currency exchange risks.
Substantially all of our sales and cost of sales are denominated in US dollars, which is the functional currency of all the entities within the Group. A significant portion of our operating costs and taxation is denominated in pounds sterling. Although we put in place forward exchange contracts 11 to 15 months in advance to fix the exchange rate of the US dollar to pound sterling for the majority of these costs, movements in the US dollar to pound sterling rate impact any pound sterling operating costs not covered by the forward contracts and, in the longer term, movements in the rate of exchange will impact all of our sterling costs, as it will affect the rate fixed by the forward contracts being put in place for future expenditures. We are also exposed to foreign exchange risks from costs recorded in other currencies, which are currently not covered by forward contracts. A material appreciation of the value of the US dollar against pound sterling could have a material adverse effect on our current year results of operations, mainly due to revaluation losses on sterling-denominated assets, as the forward contracts mentioned above provide a hedge to movements in most sterling-denominated liabilities. A material depreciation of the value of the US dollar against pound sterling could have a material adverse effect on our future results of operations, due to the recording of pound sterling operating expense at a higher US dollar exchange rate.
Our business is highly cyclical, subject to rapid change and evolving industry standards, and has experienced significant downturns, including in connection with the recent global financial crisis.
We operate in the global semiconductor industry, which is highly cyclical, subject to rapid change and evolving industry standards and has experienced significant downturns, often in connection with maturing products and declines in general economic conditions, including in connection with the recent global financial crisis. Such downturns have reflected decreases in product demand, production overcapacity, excess inventory levels and accelerated erosion in average selling prices, which can have a material adverse effect on our business. These factors have in the past and may in the future cause substantial fluctuations in our revenue and results of operations.
CSR plc Annual Report and Financial Statements 2009
52
We may not accurately forecast demand for our products, and as a result may hold excess inventory or suffer from product shortages.
The level of inventory required in our business is sensitive to changes in the actual demand for our products compared with our forecast of sales of those products. In addition, we supply a wide range of products which are not interchangeable between customers or applications. Accurate forecasting of demand in the volatile and dynamic sectors in which we operate can be very difficult, particularly in times of rapidly changing economic conditions and uncertain demand from end consumers for retail products. Actual demand from our customers compared to forecasted demand has the potential to vary significantly. If changes in actual market conditions are less favourable than those projected, we will hold higher levels of inventory than is required to satisfy customer demand. This may result in us holding inventory which we are unable to sell, due to customers no longer requiring the product held in inventory. We may need to reduce the selling price of the surplus products in order to sell the inventory, and this may still not be sufficient incentive to customers to enable us to sell the excess inventory. In this situation we may suffer reduced margins, inventory write-offs or both. Similarly, in time of growing demand, either generally or for particular products, we may not order sufficient inventory to satisfy customer requirements and as a result not be able to meet customer orders in a timely manner. Obtaining additional supply may be costly or impossible, and failing to meet customer needs may adversely affect customer relationships and reduce our revenue, which would adversely affect our results of operations.
The financial difficulties or failure of our distributors could cause us to suffer an immediate financial loss and affect our ability to supply products to end customers.
We supply a significant proportion of our products to end customers through third party distributors. Our largest distributor accounted for approximately 12% of our net revenue in 2009 and 24% in 2008. Our distributors are wholly independent third parties, which supplement our own direct marketing and sales efforts. The current economic environment presents significant challenges to the stability of distributors. Uncertain demand patterns, restrictions on credit terms and slowdown in orders represent a significant
adverse trading environment for distributors which could affect their ability to continue in business. We are subject to the risk that one or more of our distributors could suffer serious financial difficulties, or be unable to continue in business. In these circumstances, our own business with our customers would be disrupted if they are unable to obtain our products on a timely basis. We may be unable to collect amounts due from a failed distributor for products which have been supplied or to recover those products in default of non-payment. Each of these events could have a material adverse effect on our business and financial performance.
We may fail to compete successfully in a very competitive market.
The market for our products is highly competitive and rapidly evolving. We compete in different product lines to varying degrees on the following characteristics:
| | · | | product system compatibility; |
| | · | | product design and technology; |
| | · | | timely introduction of new products; |
| | · | | manufacturing yields; and |
| | · | | sales and technical support. |
Given the intense competition in the semiconductor industry, if our products are not selected by current or potential customers, our business, financial condition and results of operations will be materially adversely affected.
We are seeing increased competition throughout the market for wireless connectivity products. The increased competition could result in more
CSR plc Annual Report and Financial Statements 2009
53
DIRECTORS’ REPORT RISK FACTORS continued
pronounced price reductions, reduced margins and/ or loss of market share. Within our markets, we face competition from public and private companies, as well as the in-house design efforts of our customers. A number of our competitors have significantly greater financial, technical, manufacturing, marketing, sales and other resources than us. We may fail to compete successfully, which could materially adversely affect our business and financial performance.
Some of our customers could become our competitors.
Some of our customers are also large integrated circuit suppliers and some of our large customers already have expertise in-house in the technologies which we develop and supply. These large customers have longer operating histories, significantly greater resources and name recognition, and a larger base of customers than we do. The process of licensing our technology to and support of such customers entails the transfer of technology that may enable them to become a source of competition to us, despite our efforts to protect our intellectual property rights. Each new design by a customer presents a competitive situation. In the past, design win opportunities have been lost to divisions within our customers and this may occur to us in the future. If our customers become our competitors, we may lose them as customers and they may no longer license products from us, or in the same volumes, which may have a material adverse effect on our results of operations.
Our technologies could decline in importance or be superseded by an alternative technology.
We derive the majority of our revenue from sales of our Bluetooth- and GPS-based products. We would be materially adversely affected if either of these technologies were to decline, or be replaced entirely, as the prevailing technology for short-range wireless communication and location-based services, or if superior technologies were developed that resulted in our products being less competitive. We continue to invest in the development of next generation products, but our future products may not gain market acceptance, we may fail to identify markets for our products or our products could be rendered obsolete by the development of a new, superior technology.
The market for GPS-based location awareness capabilities in high-volume consumer and commercial applications may not develop as quickly as we expect.
The market for GPS-based location awareness technology in high-volume consumer and commercial applications is continually evolving and its potential is uncertain. Many of these GPS-based applications have not been commercially introduced or have not achieved widespread acceptance. The success of our GPS-based business depends on the rapid development of this market. We cannot predict the growth rate, if any, of this market. The development of this market depends on several factors, including government mandates such as E911 mandate in the United States and E110 mandate in Japan, the development of location awareness infrastructure by wireless network operators and the availability of location-aware content and services. If the market for high-volume consumer and commercial GPS-based applications fails to develop in a timely manner, the growth and success of our business may be limited.
Our technologies could be integrated into other integrated circuits.
The Bluetooth and GPS standards have each evolved over the time since their first introduction and an ever increasing array of features have been added to the chips required by our customers. At the same time, our ability to optimize chip design and industry-wide manufacturing improvements means that the physical size of the Bluetooth-only and GPS functions has been progressively reduced. If our products cease to be used as an “anchor point” around which to integrate other technologies, or if the functions that our products support were ultimately integrated into one of the cellular chips in the phone, our business would be materially adversely affected. Similarly, the emerging technologies which we have under development or which we may release in the future, may be integrated into one of the cellular chips in the phone, which could also materially adversely affect our future business.
Government regulation of our technologies may increase our cost of doing business and/or decrease demand for our products.
The market for our technologies is and in the future may be increasingly affected by controls on exports or restrictions on application of measures adopted by governments or other supra-national organisations. For example, GPS technology is restricted and its
CSR plc Annual Report and Financial Statements 2009
54
export is controlled. Our business may be impacted by government regulations because its technology relies on the GPS satellite network and radio frequency bands, aspects of which are controlled or regulated by the U.S. and other governments. The U.S. government may restrict specific uses of GPS technology in some applications for privacy or other reasons and block the civilian GPS signal at any time or in hostile areas. In December 2004, the President of the United States authorized a new national policy that established guidance and implementation actions for space-based positioning, navigation, timing programmes, augmentations and activities for U.S. national and homeland security, civil, scientific, and commercial purposes. Government regulation and other actions taken in relation to the GPS satellite network and other radio frequency bands used by our technologies such as Bluetooth could interrupt or increase our cost of doing business and/or decrease demand for our products, any of which could materially adverse effect on our business.
Personal privacy concerns may limit the demand for consumer and commercial applications and demand for our products.
Our products rely on the ability to receive, analyse, transmit and store information. Consumers may not accept some applications because of concerns that our products could compromise their personal privacy. For example, consumers could consider that our products allow for unwanted interception or intrusion into transferred data, may enable unwanted access into the devices being used, or may allow the consumer’s location to be tracked and that this information could be collected, stored and used by others against the wishes of the consumer concerned. Governments may disallow specific uses of these technologies for privacy or other reasons or could subject the industry to regulation. If consumers view our products as a threat to their privacy, demand could decline, which could materially adversely affect our operations and financial results.
Part of our business uses a royalty-based business model, which has inherent risks.
In recent periods we have derived a portion of our net revenue from large customers in the wireless markets from royalties paid by licensees of our technology. We depend on our ability to structure, negotiate and enforce agreements for the determination and payment of royalties. If a significant licensee
terminates its relationship with us, demands price reductions, decides to adopt a competitors’ technology over our technology or if we are unable to negotiate and renew existing agreements with significant licensees, our royalty revenue, gross margins and net income could be adversely impacted. We face risks inherent in a royalty-based business model, many of which are outside of our control.
We are highly reliant upon the success of our customers’ products.
We rely on equipment manufacturers to select our products to be designed into their products. Even if an equipment manufacturer selects our product, the customer’s product may not be commercially successful. As a result, sales of our products are largely dependent on the commercial success of our customers’ products. If the customers’ products are unsuccessful, our business may be materially adversely affected.
Our business and future operating results may be materially adversely affected by events outside of our control.
We conduct our business in many foreign territories. Our wireless solutions are supplied to end customers based in diverse locations, who in turn market their products worldwide into many countries. Our own operations and also the success of the customers’ products (and therefore our financial success) may be affected by changes in economic, financial and political stability in various countries or geographic regions. Adverse changes in one or more of these countries or in geographical regions generally, including, for example, economic decline, failing financial systems, political upheaval, civil unrest, terrorism, wars, outbreaks of diseases or natural disasters, could have a material adverse effect on our ability to conduct our business and on our financial and operational performance. For example, we procure supplies from, conduct business in or otherwise derive significant revenue from China and Taiwan. While the Chinese government has pursued economic reforms for a number of years, it continues to exert considerable direct and indirect influence on the economy. Future actions by the Chinese government, including the reversal of economic reforms and return to a more centrally planned economy, could have a significant effect on economic conditions in China, which may have a material impact on our business and revenue. Further, developments
CSR plc Annual Report and Financial Statements 2009
55
DIRECTORS’ REPORT RISK FACTORS continued
that adversely affect the political stability or economic conditions in Taiwan, including the potential impact of natural disasters on the geographically concentrated operations of our suppliers, could materially and adversely affect our business and revenue.
Risks related to owning CSR ordinary shares
As we do not currently intend to list our ordinary shares on any U.S. national securities exchange or create a sponsored ADR program, a U.S. trading market for our ordinary shares may not develop.
We do not currently intend to list our ordinary shares on any U.S. securities exchange, and do not have current plans to create a sponsored American Depositary Receipt program for our ordinary shares. As a result, an active U.S. trading market for our ordinary shares may not develop. Furthermore, it may be time-consuming and expensive for U.S. holders of our ordinary shares to dispose of their ordinary shares.
We may decide in the future to terminate our reporting obligations under the Exchange Act.
We may decide to deregister the ordinary shares with the SEC and terminate our reporting obligations under the Exchange Act if we comply with the SEC requirements to effect such termination. For example, because we have filed this Annual Report on Form 20-F with the SEC, following twelve months after the effective date of the registration statement on Form F-4 that we filed in June 2009, we will have the ability to terminate our registration under the Exchange Act if there are less than a certain number of resident U.S. holders of our ordinary shares or if the trading volume of such shares is below a certain level. Were we to terminate our registration under the Exchange Act, we would no longer be subject to SEC reporting requirements (for example, the requirement to file annual reports on Form 20-F and information regarding certain material events on Form 6-K) and other obligations (for example, those arising under the Sarbanes-Oxley Act of 2002) of an SEC reporting company.
We may be treated as a passive foreign investment company.
As a company domiciled outside of the United States with substantial cash assets, there is an ongoing risk that the Company may be treated as a passive foreign investment company (often referred to as a “PFIC”) for U.S. federal income tax purpose s depending on the
ratio of our share price (which affects the valuation of certain assets including goodwill) to our holdings of cash and liquid assets such as bank deposits and marketable securities. A non-U.S. corporation generally will be considered a PFIC for any taxable year in which 75% or more of its gross income is passive income, or 50% or more of the average value of its assets are considered “passive assets” (generally, assets that generate passive income). This determination is highly factual, and will depend upon, among other things, our market valuation and future financial performance. We believe we were not a PFIC for the taxable year ended in December 2009, but if we were to be classified as a PFIC for any future taxable year, holders of CSR ordinary shares who are U.S. taxpayers would be subject to adverse U.S. federal income tax consequences.
Shareholders in countries other than the United Kingdom will suffer dilution if they are unable to participate in future pre-emptive equity offerings.
Under English law, shareholders usually have pre-emptive rights to subscribe on a pro rata basis in the issuance of new shares for cash. The exercise of pre-emptive rights by certain shareholders not resident in the United Kingdom may be restricted by applicable law or practice in the United Kingdom and the United States. In particular, the exercise of pre-emptive rights by U.S. shareholders would be prohibited unless the rights offering is registered under the Securities Act or an exemption from the registration requirements of the Securities Act applies. If no exemption applies and we do not wish to register the rights offering, shareholders in the United States may not be able or permitted to exercise their pre-emptive rights. We are also permitted under English law to disapply pre-emptive rights (subject to the approval of our shareholders by special resolution and investor committee guidance on the limits of any such disapplication) and thereby exclude certain shareholders, such as overseas shareholders, including in the United States, from participating in a rights offering (usually to avoid a breach of local securities laws).
Your rights as a CSR shareholder will be governed by English law, which may differ from the laws of other jurisdictions.
Because CSR is a public limited company incorporated under the laws of England and Wales,
CSR plc Annual Report and Financial Statements 2009
56
your rights as a shareholder will be governed by English law and by CSR’s memorandum and articles of association. These rights differ from the typical rights of shareholders in companies in other jurisdictions. For further information with respect to our ordinary shares, see “Memorandum and Articles of Association.”
Shareholders in countries outside of the United Kingdom may have difficulty suing us or our directors, or in enforcing judgments obtained outside of the United Kingdom.
CSR is domiciled in the United Kingdom, and most of our directors are residents of the United Kingdom. As a result, it may not be possible for shareholders in other countries to begin litigation against us or our directors, or to obtain discovery of relevant documents and/or the testimony of witnesses. Shareholders in other countries may have difficulties in enforcing judgments obtained outside of the United Kingdom.
The market value of our ordinary shares may be adversely affected by fluctuations in the exchange rate between the pound sterling and other currencies.
Fluctuations in the exchange rate between the pound sterling and other currencies will affect the market value of our ordinary shares when expressed in that other currency. If the relative value of the pound sterling to another currency declines, the equivalent value against the pound sterling price of our ordinary shares traded on the London Stock Exchange will also decline. Although our current policy is not to pay dividends, any dividends we may decide to pay in the future would be paid in pounds sterling, which would
be subject to the same risks. Shareholders outside the United Kingdom who sell their shares must do so on the London Stock Exchange against payment in pounds sterling. As a result of any fluctuations in the exchange rate between the currency of choice of the shareholder and the pound sterling, non-U.K. resident shareholders may receive a reduced value upon the sale of their ordinary shares and will also incur transaction costs when converting the pound sterling into another currency.
The market price of our ordinary shares is volatile. Our shareholders may be unable to resell their shares at or above the price at which they acquired them.
The stock market in general and our ordinary shares in particular have recently experienced significant price and volume volatility. Our ordinary shares are subject to significant fluctuations due to many factors, including but not limited to fluctuations in operating results, announcements regarding new products, product enhancements or technological advances by us or our competitors, changes in earnings estimates by market analysts, and general market conditions or market conditions specific to particular industries. Our share price is subject to speculation in the press and the analyst community, changes in recommendations by financial analysts, changes in investors’ or analysts’ valuation measures for our stock, changes in global financial markets and global economies and general market trends unrelated to our performance. Technology stocks have experienced wide fluctuations in prices, which sometimes have been unrelated to their operating performance. The market price of our ordinary shares could be adversely affected by these factors and fluctuations.
CSR plc Annual Report and Financial Statements 2009
57
DIRECTORS’ REPORTBOARD OF DIRECTORS
|
| |
Directors’ report - Board of directors |
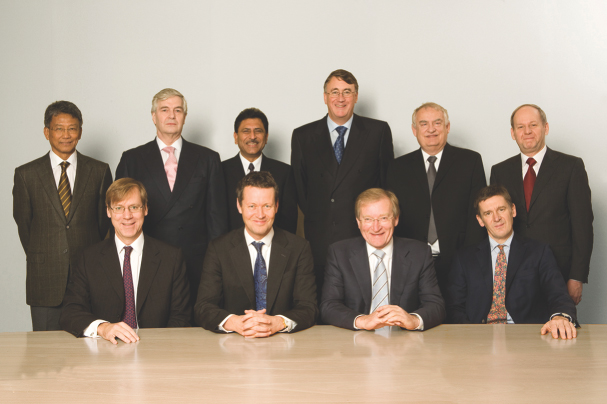
Board of Directors

CSR plc Annual Report and Financial Statements 2009
< Audit Committee
n Remuneration Committee
· Nomination Committee
Directors Biographies
1. Diosdado Banatao
Mr Banatao (age 63), non-executive director, joined the CSR Board on 26 June 2009. Prior to this, Mr Banatao served as Executive Chairman of the Board and Interim CEO for SiRF. Mr Banatao is the managing partner of Tallwood Venture Capital. Prior to forming Tallwood Venture Capital, Mr Banatao was a venture partner at Mayfield Fund. Mr Banatao has co-founded three technology start-ups, S3 (SBLU) Incorporated (which changed its name to SonicBlue Incorporated), Chips & Technologies (INTC) and Mostron. Mr Banatao has also held positions at National Semiconductor, Seeq Technologies, Intersil, and Commodore International. Mr Banatao also served as Chairman and led investments in Marvell Technology Group, Acclaim Communications, acquired by Level One, Newport Communications, acquired by Broadcom, Cyras Systems, acquired by Ciena and Stream Machine, acquired by Cirrus Logic. Mr Banatao holds a BSEE, cum laude, from the Mapua Institute of Technology in the Phillipines and MS in Electrical Engineering and Computer Science from Stanford University.
2. Will Gardiner
Mr Gardiner (age 45), Chief Financial Officer, joined CSR as Chief Financial Officer in June 2008. Prior to joining CSR, Mr Gardiner was Finance Director for Technology and Enterprise at BSkyB plc. Before its acquisition by BSkyB in 2006, Mr Gardiner had since 2001 been CFO of Easynet Group plc, a pan-European broadband telecoms company. Between 1991 and 2001, Mr Gardiner held a number of senior roles within JPMorgan’s investment banking division, specializing in the telecoms and technology sectors. Mr Gardiner has a BA from Harvard College and MA from Johns Hopkins University.
3. Anthony Carlisle < n ·
Mr Carlisle (age 62), non-executive director and Senior Independent Director, was appointed a non-executive director of CSR in July 2005 and was appointed as Senior Independent Director on 27 May 2009. Mr Carlisle is the Chief Executive of Citigate Dewe Rogerson Consultancy. He has over 30 years experience in marketing and communications, advising major companies in the UK and internationally. He holds a BA in Economics and is a Fellow of the Institute of Public Relations.
4. Joep van Beurden
Mr van Beurden (age 49), Chief Executive Officer, was appointed Chief Executive Officer on 1 November 2007. Prior to joining CSR, Mr van Beurden was Chief Executive of NexWave Inc., a provider of embedded software solutions for the consumer electronics market based in France. Before joining NexWave, Mr van Beurden held senior positions at Canesta Inc., a fabless semiconductor company in San Jose, California and Philips Components also in San Jose. Prior to that, Mr van Beurden had worked for five years for management and strategy consultants McKinsey & Company in Amsterdam. Mr van Beurden has also worked as a crude oil trader for Royal Dutch Shell in Rotterdam and lectured in Physics and Electronics at the University of Zambia. In January 2009, Mr van Beurden was appointed a director of the Global Semiconductor Alliance, (GSA) a not-for-profit organisation supporting collaboration, supply chain integration and innovation in the global semiconductor industry. In December 2009 the GSA appointed Mr van Beurden as a Vice Chairman. Mr van Beurden holds a Masters degree in Applied Physics from Twente University of Technology in Enschede, The Netherlands.
5. Kanwar Chadha
Mr Chadha (age 50), Chief Marketing Officer joined CSR on 26 June 2009, following the acquisition of SiRF Technology Holdings Inc. where he was a founder, head of marketing and a member of the Board of Directors. Mr Chadha has over 25 years’ of experience in various marketing and management positions. Prior to founding SiRF, Mr Chadha served as general manager of the multimedia group and director of strategic marketing at S3 Inc., where he led the development of innovative audio and video processing technologies. Before joining S3 Inc, Mr Chadha co-founded AQuesT Inc., a developer of multimedia and 3D graphics acceleration products and served as its chairman. Prior to his entrepreneurial ventures, he served at Intel in various product marketing positions, including product line manager for the i860 RISC processor and floating point co-processors 8087/287/387. Mr Chadha received his B.Tech. in electrical engineering from the Indian Institute of Technology, New Delhi and later his MS in CIS from the University of Pennsylvania simultaneously with an MBA from the Wharton School of Business at the University of Pennsylvania.
6. Ron Mackintosh n ·
Mr Mackintosh (age 61), Chairman, has served as a non-executive director since May 2004 and was appointed Chairman with effect from 2 May 2007. Mr Mackintosh is a non-executive director of software company Fidessa Group plc. Mr Mackintosh has held a number of senior executive positions in European technology companies. Between 1992 and 2000, Mr Mackintosh was chief executive of Computer Sciences Corporation’s (CSC) European business, which had revenues of $2.5 billion. He is also a former director of Gemplus SA, and the former chairman of each of Smartstream Technologies Ltd,
CSR plc Annual Report and Financial Statements 2009
59
DIRECTORS’ REPORTBOARD OF DIRECTORS continued
Northgate Information Solutions plc and also of Differentis, a privately owned IT consultancy which, he co-founded in July 2000. Mr Mackintosh is Chairman of the Nomination Committee and a member of the Remuneration Committee.
7. Andrew Allner < n ·
Mr Allner (age 56), non-executive director, joined CSR as a non-executive director on 1 October 2008. Mr Allner was appointed chairman of the Audit Committee on 27 May 2009. Mr Allner is a chartered accountant with extensive experience in senior executive and non-executive positions. Between 2004 and 2007, Mr Allner was Group Finance Director at RHM plc, taking a lead role in its flotation in July 2005 on the London Stock Exchange. Prior to joining RHM plc, Mr Allner was CEO of Enodis PLC. Mr Allner has also served in senior executive positions with Dalgety PLC, Amersham International PLC and Guinness PLC. He is a former partner of Price Waterhouse. Mr Allner is presently a non-executive director and chairman of the audit committee at Northgate plc, a non-executive director and chairman of the remuneration committee at Marshalls plc, and a non-executive director and the chairman of the audit committee of The Go-Ahead Group plc. He is a member of the Institute of Chartered
Accountants in England and Wales. Mr Allner is Chairman of the Audit Committee and is a member of the Remuneration and Nomination Committees.
8. James Collier
Mr Collier (age 51), Chief Technical Officer, has served as CSR’s Chief Technical Officer since its establishment in April 1999. Mr Collier is a co-founder of CSR. Between 1984 and April 1999, Mr Collier held a number of executive and technical positions at Cambridge Consultants Ltd. Prior to 1984, Mr Collier held a number of executive and technical positions at Schlumberger. Mr Collier has a degree in Physics from the University of Oxford.
9. Christopher Ladas
Mr Ladas (age 64), Operations Director, was appointed a director of CSR on 1 January 2008. He has served as CSR’s Senior Vice President, Operations since May 2000. Between January 1996 and May 2000, Mr Ladas served as the vice president of operations at Micro Linear Corporation. Prior to 1996, Mr Ladas held several managerial and technical positions at National Semiconductor, Fairchild, Harris, Sperry, Motorola and Signetics. Mr Ladas holds a BS in Chemistry from Arizona State University, US. He is
also a member of the Institute of Electrical and Electronics Engineers and a member of the Europe, Middle East and Africa Leadership Council of the Global Semiconductor Alliance.
10. Sergio Giacoletto-Roggio < n ·
Mr Giacoletto-Roggio (age 60), non-executive director, joined CSR as a non-executive director on 4 January 2007. He is Chairman of the Remuneration Committee. In December 2008, Mr Giacoletto-Roggio retired from Oracle Corporation, where he had been executive vice president of Oracle Corporation, Europe, Middle East and Africa and a member of Oracle’s executive committee. Prior to joining Oracle in 1997, Mr Giacoletto-Roggio was President, value added services at AT&T, before which he spent 20 years with Digital Equipment Corporation in various senior management and executive roles. Mr Giacoletto-Roggio has served on multiple company boards and IT industry associations. He is currently non-executive director and the senior independent director of Logica plc, a non-executive director of Colt Telecom SA and the chairman of Sophis Holding (Luxembourg) SCA. Mr Giacoletto-Roggio holds a Masters in Computer Science from the University of Turin. He is chairman of the Remuneration Committee and is a member of the Audit and Nomination Committees.
CSR plc Annual Report and Financial Statements 2009
60
DIRECTORS’ REPORTCORPORATE GOVERNANCE
|
| |
Directors’ report – Corporate governance |
Chairman’s introduction
Your Board is accountable to the Company’s shareholders for creating and delivering sustainable shareholder value through the management of the Group’s business. We are committed to high standards of corporate governance which we recognise is fundamental to business integrity and to enabling the Group to operate successfully.
The Company expects all directors and employees to act honestly, with integrity and fairness and this is supported by established policies and is reinforced through a culture which is driven from the Board members across the organisation. As an increasingly global business, the Group strives to act in accordance with the laws and customs of the countries in which it operates; adopt proper standards of business practice and procedure and respect the culture of every country where it does business.
The following report and the report of the Remuneration Committee on pages 73 to 85 explains how the Board operates, the roles of the Board members and how the Board and its Committees function to ensure compliance with the principles of corporate governance. It also sets out how we encourage our employees across the Group to contribute to ensuring that the Group as a whole operates to high standards of governance, in their participation within the business of the Board and its Committees and as individuals through their responsibility to support these principles.
Ron Mackintosh
Statement of compliance
The Company’s shares are listed on the London Stock Exchange and therefore, under the Listing Rules of the Financial Services Authority, the Board must report on compliance with the provisions set out in Section 1 of the 2008 Combined Code on Corporate Governance (the “Code”’), which are appended to the Listing Rules.
In addition to complying with UK corporate governance requirements, the Company must also follow US securities laws and regulations due to registration of its ordinary shares with the US Securities and Exchange Commission, although it is not listed on a US stock exchange.
Other than the provision relating to the balance of executive and non-executive directors on the Board over the period between 27 May 2009 and 1 January 2010, the Board has complied with the provisions of the Code. On 27 May 2009, Mr David Tucker, a non-executive director, retired from the Board. As a result, from that date, the Board had a greater number of executive directors than non-executive directors. On 26 June 2009, at the time of the completion of the acquisition of SiRF Technology Holdings, Inc., Mr Diosdado Banatao and Mr Kanwar Chadha were appointed as directors; Mr Banatao as a non-executive director and Mr Chadha as an executive director. Following the appointments, the balance of executive and non-executive directors remained non-compliant with the Code as the Board remained composed of more executive directors than non-executive directors.
As explained in the Circular issued to shareholders on 4 June 2009, in deciding to offer Messrs. Banatao and Chadha positions as directors of the Company, the Board considered that their knowledge and experience in the management of SiRF and their extensive understanding of the semiconductor industry will be beneficial not only to the integration of CSR and SiRF, but also to the development of the business of the combined company going forward. When considering the appointment of Mr Banatao to the role of a non-executive director, the Board discussed his independence from management at the time of appointment. The Board is satisfied that Mr Banatao is independent of the Company, the Board and management, since he has not had any previous relationship or dealings with the Company.
Following a suitable period after these appointments, and with due regard and consideration given to the balance of skills and experience, the Board will address the appointment of an additional non-executive director during 2010. The Board considers that, notwithstanding the non-compliance with the provisions of the Code, an appropriate balance of skills and experience has been in place to enable the Board to perform its responsibilities effectively.
CSR plc Annual Report and Financial Statements 2009
61
DIRECTORS’ REPORT CORPORATE GOVERNANCE continued
The Board believes that succession planning should be an area for focus, particularly in light of the acquisition of SiRF and as part of this recognition, a proposal on possible steps was developed in November 2009, which has been approved for execution in 2010. As a result, the Board expects to consider this matter further during 2010.
The Board is aware of the review of the Code conducted by the UK Financial Reporting Council which was completed and published in 2009. The Board will reflect the revisions to the Code in its practices during the course of 2010 and will report on these matters in the next annual report issued in 2011 to shareholders.
Executive Ethics Policy
All employees of the Group, including the executive directors and senior officers, must comply with the Group’s Ethics Policy recently adopted following the Company’s registration with the US Securities and Exchange Commission. In addition, the Company has adopted an Executive Ethics Policy that applies to executive directors, senior officers and other specified employees and is intended to meet the “code of ethics” requirements of Section 406 of the US Sarbanes-Oxley Act. A copy of the Executive Ethics Policy may be found at www.csr.com/ethicspolicy.
The following statements describe how the Board operates and the respective roles of the Chairman, non-executive and executive directors.
The Board
As at 1 January 2010, the Board comprised ten members, being the Chairman, Mr Ron Mackintosh, five executive directors and four non-executive directors. Of those in post as at 1 January 2010, eight directors including Mr Mackintosh had served throughout the year.
The four executive directors in office at 1 January 2010 who had served throughout the year were Mr Joep van Beurden, Chief Executive Officer, Mr Will Gardiner, Chief Financial Officer, Mr James Collier, Chief Technical Officer and Mr Chris Ladas, Operations Director. Mr Kanwar Chadha was appointed as an executive director on 26 June 2009. The three non-executive directors who served throughout the year, each of whom is considered
independent of management, were Mr Anthony Carlisle, Mr Sergio Giacoletto-Roggio and Mr Andrew Allner. Mr Diosdado Banatao was appointed as a non-executive director on 26 June 2009.
Mr Mackintosh has served as Chairman of the Board since May 2007 and as a non-executive director of the Company since May 2004. In the opinion of the Board, on each of his appointments as a non-executive director and as Chairman, Mr Mackintosh was independent of management. The Board is satisfied that Mr Mackintosh is able to devote the necessary time commitment to the role of Chairman of the Board.
Mr Tucker served as the Senior Independent Director and Chairman of the Audit Committee until he retired from the Board on 27 May 2009. With effect from 27 May 2009, Mr Anthony Carlisle was appointed the Senior Independent Director and Mr Andrew Allner, a chartered accountant with recent and relevant financial experience, was appointed Chairman of the Audit Committee. Mr Gardiner is the director responsible for health and safety. The directors possess diverse business experience in spheres complementary to CSR’s activities, as well as other sectors. Biographies of the directors are shown on pages 59 and 60. Mr Brett Gladden served as Company Secretary throughout the year.
The Conduct of the Business of the Board
The Board meets regularly during the year as well as on an adhoc basis as required by time critical business needs. During the course of 2009 regular meetings were augmented by additional meetings to enable discussion with other Board members and advisers on the proposed acquisition of SiRF. This included understanding the implications for the Company registering with the US Securities and Exchange Commission, the relisting of the Company’s ordinary shares on the London Stock Exchange and the development and review of associated documents in regard to these matters and the issue of a circular to shareholders seeking approval for the acquisition.
The Board is responsible to shareholders for the effective and proper management and control of the Company and Group and has a formal schedule of matters reserved for its decisions. Its primary role is to determine and review strategy and policy, consider
CSR plc Annual Report and Financial Statements 2009
62
acquisitions and disposals, assess requests for major capital expenditure and give consideration to all other significant financial matters. This process is undertaken following discussions in conjunction with senior executive management, who in turn are responsible for the day-to-day conduct of the Group’s operations and for reporting to the Board on the progress being made in meeting the objectives.
The Chairman ensures that the Board functions effectively, overseeing the timely and effective provision of information to the Board and that the business of the Board is properly conducted. A comprehensive file of briefing papers and a meeting agenda is provided for each director in advance of each meeting. Decisions are taken by the Board, taking into account, where appropriate, the recommendations of its Committees and advice from external consultants and executive management.
The non-executive directors of the Board have diverse business, financial and technical experience, details of which are summarised on pages 59 and 60 and they each play a full role in the consideration of matters brought before the Board. This includes:
| | · | | considering, approving and monitoring performance against strategic objectives through detailed reviews conducted at Board level; |
| | · | | providing entrepreneurial leadership within a framework of prudent and effective controls, which enable risks to be assessed and managed; and |
| | · | | setting the Group’s values and standards and ensuring that its obligations to its shareholders and other stakeholders are understood and met. |
Non-executive directors are expected to constructively challenge and contribute to the development of strategy, scrutinise the performance of management in meeting agreed goals and objectives and monitor the reporting of performance.
The Board regularly reviews strategy as part of its normal business. This includes holding two offsite meetings each year, the agendas for which cover a
broad range of financial, commercial and technical aspects concerning the strategic objectives for the Group. These meetings are held in the summer and autumn, with different members of the management team attending, depending on the topics for discussion.
With the agreement of the Board, during 2009, individual non-executive directors provided specific support and advice on discrete issues being considered by the Company, according to their particular skills and experience. Mr Giacoletto-Roggio acted in an advisory capacity to the Integration Committee (the remit of which is explained in more detail on page 68) in the planning of the integration of the Company and SiRF and he was able to report on these matters to the Board as a whole. During October 2009, the Chairman travelled with the CEO to a number of offices around the Group’s locations worldwide to meet with staff to discuss the Company’s vision and strategy and also progress on the integration. Following the acquisition of SiRF, the Board as a whole also travelled to California for a meeting, the business of which included discussions on the future strategy for the enlarged group. Whilst in California, the Board also visited the Group’s offices in San Jose to hold meetings with members of staff who had joined as a result of the acquisition of SiRF and attend demonstrations on products under development.
Independence of non-executive directors and segregation of duties
In accordance with the provisions of the Code, consideration has been given to the independence of all the non-executive directors. The Board considers all the non-executive directors to be independent of management and free from any business or other relationship that could materially interfere with the exercise of independent judgement.
The division of responsibilities between the non-executive Chairman and Mr van Beurden, CEO, is sufficiently clear in the opinion of the Board that it is not required that they be formally documented. The Chairman is responsible for the running and leadership of the Board. The CEO is responsible for leading and managing the business within the authorities delegated by the Board.
CSR plc Annual Report and Financial Statements 2009
63
DIRECTORS’ REPORT CORPORATE GOVERNANCE continued
The CEO has day-to-day responsibility for the Group and has reporting to him executive management who in turn are responsible for the performance of discrete commercial and operational activities of the Group. This includes management teams responsible for reviewing the implementation of established objectives and assessing performance of particular functions against those objectives. Representatives from these teams in turn attend and report to a weekly executive leadership forum which includes the executive directors. The CEO also meets regularly with the managers and leaders in various established forums that fit with the operational cycles of the Group. The CEO formally reports at each meeting of the Board on salient matters arising from the execution of his responsibilities.
The Board met 11 times during the year and the attendance of each of the directors is shown on page 72.
Evaluation of the Performance of the Board
In the final quarter of 2009, the Board undertook a formal process of performance evaluation. Each director who had served to that point throughout the year completed a confidential survey prepared by the Company Secretary, covering a wide range of matters associated with the activities and conduct of the Board and its Committees. The process was conducted without reference to external agencies. The merits of using external agencies to support the evaluation process is reviewed from time to time, and will be looked at in more detail during 2010. A detailed summary of the responses from each participating director was prepared by the Company Secretary which was considered by the Board in December 2009 as an agenda item which was led by the Chairman.
The overall conclusion was that the Board and its Committees were performing appropriately, whilst proposing that additional attention be given to certain areas, including the development of Group-wide measures for succession planning, in particular for senior roles within the organisation. The Board also recognised the importance of appointing an additional non-executive director, which will be addressed during 2010 as explained above.
The Chairman holds regular meetings with all the directors individually. In addition, prior to the year end,
the Chairman held a meeting with the non-executive directors to discuss the performance of the executive directors which concluded that they were each performing well.
In December 2009, the non-executive directors, led by the Senior Independent Director, met in the absence of the Chairman to appraise the performance of Mr Mackintosh as Chairman. The non-executive directors concluded that he had performed well.
Policy on Appointment and Re-Appointment
In accordance with the Company’s Articles of Association, all directors are required to retire and submit themselves for re-election at least once every three years.
It is the policy of the Board that non-executive directors are appointed for an initial term of three years. The director’s performance is assessed throughout the term. An appointment may, if performance is satisfactory, be extended for a further period not exceeding three years. Non-executive directors should not generally serve for more than nine years.
At this year’s Annual General Meeting Mr Mackintosh will be retiring in accordance with the Company’s Articles of Association and will be offering himself for re-election. As part of its formal business in February 2010, the Board considered and supported Mr Mackintosh’s re-appointment for a further three year term. The initial three year term of Mr Sergio Giacoletto-Roggio concludes in January 2010. As part of its formal business in December 2009, the Board considered and approved the renewal of Mr Giacoletto-Roggio’s appointment for a further three year term, effective from 4 January 2010. At this year’s Annual General Meeting Mr Giacoletto-Roggio will be retiring in accordance with the Company’s Articles of Association and will be offering himself for re-election.
Mr Diosdado Banatao who was appointed a non-executive director on completion of the acquisition of SiRF has a letter of appointment effective for a three year term from 26 June 2009. In accordance with the Company’s Articles, Mr Banatao will be offering himself for election at the 2010 Annual General Meeting being the first General Meeting of the Company since his appointment.
CSR plc Annual Report and Financial Statements 2009
64
Mr Kanwar Chadha was appointed an executive director on completion of the acquisition of SiRF. In accordance with the Company’s Articles of Association, Mr Chadha will be offering himself for election at the 2010 Annual General Meeting being the first General Meeting of the Company since his appointment.
Further information on each of the directors standing for re-election and election are set forth in the Notice of the Annual General Meeting which is in a separate document issued to all shareholders.
On appointment, all directors are asked to confirm they have sufficient time to devote to their duties which, along with their duties and roles are confirmed in their letter of appointment. They are also advised that they have access to the advice and services of the Company Secretary and, in addition, that they are entitled to seek independent professional advice in the furtherance of their duties, if necessary, at the Company’s expense. As part of their induction, the directors are provided with a detailed file explaining their role and duties, in addition to background information on the Company and Group as well as the function and recent deliberations of the Board and its committees. In addition, where appropriate, meetings with advisers to the Company and Board are arranged to assist in briefing a director on appointment.
Directors are also provided with information and assistance in the event of any change in their role.
Indemnities to Directors
In accordance with the Company’s Articles of Association, directors are granted an indemnity from the Company to the extent permitted by law in respect of liabilities incurred as a result of the performance of their duties in their capacity as directors to the Company. The indemnity would not provide any coverage to the extent that a director is proven to have acted fraudulently or dishonestly. The Company has also arranged insurance coverage in respect of legal action against the directors and officers.
Communications with shareholders
Principally via the executive directors, the Company seeks to build on a mutual understanding of
objectives with its major shareholders through regular meetings and presentations following announcements of each quarter’s results.
The Senior Independent Director, Mr Anthony Carlisle, is available to meet institutional shareholders should there be unresolved matters they wish to bring to his attention. The Board is also appraised of discussions with major shareholders to ensure that executive and non-executive directors consider any matters which might be raised by those shareholders and to enable all directors to understand shareholders’ views. This includes feedback from the meetings attended by executive directors and the Chairman, in addition to reports from the Company’s advisers on their engagement with shareholders on behalf of the Company. During 2009, the Chairman of the Remuneration Committee met with a number of shareholders to discuss the Board’s remuneration policy, which included a review of changes introduced in 2009 to aspects of the remuneration of executive directors, primarily concerning the performance conditions applying to the vesting of share options and share awards, the details of which were disclosed in the report of the Remuneration Committee for the period ending 2 January 2009.
Non-executive directors attend the Annual General Meetings and will also make themselves available to meet with shareholders on other occasions where requested. Corporate information is available on the Company’s website, www.csr.com.
Committees of the Board
The Board has three Committees, Remuneration, Audit and Nomination. Throughout the year, the Chairman and each of Mr Allner, Mr Carlisle and Mr Giacoletto-Roggio were members of the Remuneration and Nomination Committees. Mr Mackintosh attends meetings of the Audit Committee by invitation. Mr Tucker was a member of the Remuneration and Nomination Committees and Chairman of the Audit Committee until he stood down from the Board on 27 May 2009.
In accordance with the Code, the duties of the Committees are set out in formal terms of reference. These are available from the Company Secretary and can be found on the Company’s website, www.csr.com. Membership of the Committees is
CSR plc Annual Report and Financial Statements 2009
65
DIRECTORS’ REPORT CORPORATE GOVERNANCE continued
shown on page 59 and 60. The Company Secretary acts as secretary to each of the Committees. The terms of reference are each subject to annual review.
Remuneration Committee
Mr Sergio Giacoletto-Roggio is the Chairman of the Remuneration Committee, which position he has held since September 2007. The other members of the Committee at 1 January 2010 were Messrs Allner, Carlisle and Mackintosh.
The principal function of the Remuneration Committee is to establish and review the terms and conditions for the executive directors, and the overall policy framework for the remuneration of other senior executives and the Group as a whole. The Remuneration Committee met four times during the year and the attendance of its members is shown in the table on page 72.
The report to shareholders on the role of the Remuneration Committee, how directors are remunerated, together with details of individual directors’ remuneration are shown on pages 73 to 85.
Nomination Committee
Mr Ron Mackintosh is the Chairman of the Nomination Committee, which position he has held since 2 May 2007. The other members of the Nomination Committee at 1 January 2010 were Messrs Allner, Carlisle and Giacoletto-Roggio.
The Nomination Committee meets as appropriate to consider appointments to the Board and to consider succession planning at senior levels within the Company. The Nomination Committee reviews the composition of the Board, particularly in relation to the diversity of skills, experience and terms of office and seeks to ensure that both executive and non-executive directors have the necessary skills and attributes for the future success of the Group.
The Nomination Committee retains external search consultants as appropriate to assist the Committee in identifying candidates for appointments to the Board.
During 2009, the Nomination Committee did not meet separately, but did meet as part of the formal proceedings of the Board on one occasion to
consider the appointments of Mr Banatao and Mr Chadha. As explained on page 61, the appointments of both Mr Banatao and Mr Chadha, were considered in conjunction with the acquisition of SiRF and also the extensive experience and knowledge which they were both able to bring to the combined company going forward. As a result, the Nomination Committee did not consult with external agencies in regards to their appointments.
Audit Committee
Mr Andrew Allner is the Chairman of the Audit Committee, a position he has held since 27 May 2009. Mr Allner was appointed following the retirement from the Board of Mr David Tucker who had acted as Chairman of the Audit Committee since February 2004. The Board has determined that Mr Allner, a Chartered Accountant, has “recent and relevant financial experience” for the purposes of the Code and is an “audit committee financial expert” for the purposes of US securities laws.
The Board has further determined that for the purposes of US securities laws, although CSR is not listed in the United States, Mr Allner is independent in accordance with the definition of independence in Rule 5605(a)(2) of the listing rules of the NASDAQ Stock Market.
The other members of the Audit Committee at 1 January 2010 were Messrs Carlisle and Giacoletto-Roggio. Mr Mackintosh, Chairman of the Board, attends meetings of the Audit Committee by invitation. The experience and expertise of the members of the Audit Committee are summarised on pages 59 and 60. The attendance of its members is shown in the table on page 72.
Role of the Audit Committee
The Audit Committee is responsible for the development, implementation and monitoring of the Company’s policy on external audit and for overseeing the objectivity and effectiveness of the auditors. The Audit Committee monitors the conduct of the statutory audits of the consolidated reports and financial statements of the Group and its subsidiaries. This includes consideration of the areas of focus of the audits in conjunction with the external auditors and assessment of their findings and recommendations, where relevant.
CSR plc Annual Report and Financial Statements 2009
66
The Audit Committee recommends the appointment and re-appointment of the Group’s external auditors and considers the scope of their audit work, the terms of their appointment, their fees and the cost effectiveness of their work.
The Audit Committee also monitors the effectiveness of the Group’s internal control systems, accounting policies and practices, risk management procedures and compliance controls, as well as the statement on internal controls before it is agreed by the Board for each year’s annual report.
A detailed agenda of matters for discussion at the meeting, together with supporting papers is provided in advance of each meeting. The agenda incorporates a range of standard business items considered at each meeting. Routine business items include reports from the CFO and Internal Auditor as well as a draft form of the announcement on the Group’s financial results for the relevant quarter. In addition the Audit Committee addresses a number of other items as part of its schedule of business through the course of a year, such as risk management, business continuity planning, treasury policy and procedures, tax planning and the Group’s policy manual as well as such ad-hoc matters as are deemed appropriate. The schedule of agenda items for the calendar year was last reviewed and approved by the Audit Committee in July 2009.
The Audit Committee invites the Chief Executive Officer, the Chief Financial Officer, the Internal Auditor and senior representatives of the external auditors to attend meetings as appropriate to the business being considered. In addition, the Audit Committee has the right to invite any other employees to attend meetings where this is considered to be appropriate.
The Conduct of the Business of the Audit Committee
The Audit Committee met four times during the year in the execution of its responsibilities. The more material matters considered and any proposals for action were reported by the Chairman of the Audit Committee to the subsequent meeting of the full Board. During 2009, in addition to the routine business, the Audit Committee received reports on additional matters falling within its terms of reference, the primary focus of which was initially information in connection with the proposed acquisition of SiRF Technology Holdings Inc and, following completion of the acquisition, on
progress with the integration of the two companies, which included financial, tax and treasury, business systems and wider commercial matters. More details on this work is set out below.
The Audit Committee reviews all proposed announcements to be made by the Group to the extent they contain financial information, but primarily the announcement of the Group’s results released each quarter to the markets and investors. Each quarter, as part of its routine business, the Audit Committee receives a detailed report from the Chief Financial Officer on the performance of the Group. In addition to a summary of the balance sheet and income statements, the report incorporates detailed analysis on a range of key metrics which tracks the performance of the Group and its business units. This information forms part of the discussions by the Audit Committee to ensure that material matters are properly considered and discussed with management and where appropriate the external auditors. The information and the discussions in turn supports the understanding of the Audit Committee on the nature of disclosures which should be made in the Group’s financial results.
During the year, the Audit Committee considered and was advised on the work which was conducted in connection with the submission of the Registration Statement on Form F-4 to the US Securities and Exchange Commission and separately the approval and release of both the Circular to shareholders advising on the proposed acquisition of SiRF and the Prospectus in connection with the re-admission to listing of the Company’s ordinary shares on the London Stock Exchange in accordance with the requirements of the UK Listing Rules.
The Audit Committee monitors the effectiveness of the internal audit function, approving the annual internal audit plan, and thereafter reviewing reports on the results of internal audit work which has been conducted. These reports are provided on a quarterly basis and up-date the Audit Committee on the progress in addressing any recommendations that have been made arising from the audits which have been conducted.
At an early stage in the assessment of the tasks and risks associated with integrating CSR plc with SiRF,
CSR plc Annual Report and Financial Statements 2009
67
DIRECTORS’ REPORT CORPORATE GOVERNANCE continued
the Board and Audit Committee recognised the importance of establishing dedicated internal resource whose responsibility it would be to develop an integration plan and facilitate the implementation of that plan post acquisition.
This was delegated to an Integration Committee, which was resourced from within the Company whilst being supported by external consultants. In the course of the planning and execution of the integration programme, it was felt appropriate that the Internal Auditor should be seconded to the Integration Committee. This was regarded as appropriate based on his knowledge of the business of CSR and the contribution he was able to make in implementing best practices within the enlarged company in addition to facilitating the transition of policies, procedures and controls from two organisations into one. Acting in this capacity the Internal Auditor was also able to report to senior management and the Audit Committee on the progress of integration. As a result, the Internal Auditor was seconded for a significant proportion of his time to the Integration Committee.
The Audit Committee received detailed reports arising from the work of the Integration Committee on various aspects associated with both the planning and execution of the integration of the separate businesses and operations of CSR and SiRF following completion of the acquisition. Particular attention was given to the timely integration of financial systems in order to best ensure accurate recording and reporting of financial matters, within a consistent framework of accounting policies which applied for the enlarged group as a whole.
Since the Company became subject to the reporting requirements of the US Securities Exchange Act of 1934, the Audit Committee has received reports from management regarding the Company’s compliance with requirements under the Exchange Act (including those rules and regulations that apply by reason of the US Sarbanes-Oxley Act of 2002) that relate to financial reporting and other disclosure matters. These requirements relate among other things to disclosure controls and procedures (which became applicable in June 2009) and internal control over financial reporting (which will apply beginning in the current fiscal year).
The Audit Committee approved an internal audit plan in July 2009, following completion of the acquisition of SiRF. The plan provided for reviews of aspects of the controls and procedures of the newly acquired company to ensure an appropriate level of confidence at an early stage in areas which the Audit Committee considered to be of particular importance. As part of the adoption of the plan, the Audit Committee also supported the utilisation of external resources to assist in timely execution and reporting.
During the year, the Audit Committee appointed Ernst & Young LLP to conduct an internal audit of the Company’s Treasury Policy and Procedures. The use of external advisers was considered appropriate given the increasing complexity of Treasury matters affecting the Company and to assist management in a thorough understanding of the Treasury practices and policies within SiRF. The findings and recommendations from that audit were considered at the meeting of the Audit Committee held in October 2009. Reflecting a combination of management comments and the recommendations of the review, the Audit Committee considered a revised Treasury Policy which was subsequently approved by the Board in October 2009.
Following the completion of the integration with SiRF, the present Internal Auditor has been appointed to another role within the finance department of the Group. Steps are being taken to appoint a new internal auditor and it is anticipated that an appointment will be made in the spring of 2010. In the interim, aspects of the internal audit plan for 2009 continue to be supported by external professional resources.
The routine business of the Committee at each meeting includes an up-date on litigation concerning the Group. In the time leading up to the proposed acquisition of SiRF, the Board considered and took advice on litigation as it concerned SiRF. Following the acquisition, at the proposal of the Committee, a sub-committee of the Board led by the Chairman has been established which meets to consider matters connected with material litigation, which has as invited attendees members of the Group’s executive management.
CSR plc Annual Report and Financial Statements 2009
68
Interaction with the External Auditors
During 2009, as part of its formal business, the Audit Committee met on four occasions with the external auditors. On two occasions the Audit Committee also held separate meetings with the external auditors at which no executive director or employee of the Company was present.
In relation to the appointment of external auditors and in order to safeguard auditor independence and objectivity, the Audit Committee has a policy of permitted services which details the services that can be provided by the Group’s auditors and those services which require specific advance approval by the Audit Committee. The policy also details services that the Group’s auditors are not permitted to provide. For permitted services, the Audit Committee has delegated the determination of fees to the Chief Financial Officer, provided the fee does not exceed £100,000. No services can be provided in excess of £100,000 without the prior approval of the Audit Committee. The policy was reviewed and revised in October 2009. Both the existing policy and the policy in place prior to October 2009 were complied with throughout the year.
The Audit Committee is aware of and has approved the audit and non-audit services which have been provided during 2009 by the Company’s external auditors, Deloitte LLP. Those non-audit services concerned advice on tax matters and transaction support in connection with the SiRF acquisition which was considered to be appropriate, given their in-depth knowledge of the affairs and financial practices in the Group. The Audit Committee is satisfied that, notwithstanding this work, Deloitte LLP have retained objectivity and independence during the year.
The following table sets forth the fees paid by the Company to the external auditors as approved by the Audit Committee.
| | | | | | |
| | | 2009 | | 2008 | | 2007 |
| | | $’000 | | $’000 | | $’000 |
Audit Fees | | 936 | | 360 | | 357 |
Audit-related services | | 103 | | 34 | | 34 |
Taxation services | | 511 | | 130 | | 146 |
Other Services | | 2,189 | | – | | – |
Total | | 3,739 | | 524 | | 537 |
The line for Other Services for 2009 includes $316,000 for advisory work provided by Deloitte LLP in connection with the acquisition of SiRF. The remaining balance for other services primarily consists of Deloitte LLP acting as UK reporting accountant and SEC regulatory reporting accountant.
Deloitte LLP has been the Company’s auditors since July 2002 and the cost, scope and effectiveness of the audit are reviewed regularly. The most recent full review, including release of tenders to other possible audit firms was conducted in 2005. In 2009, the Chairman of the Audit Committee led a meeting which reviewed the effectiveness of the external auditors which concluded that Deloitte LLP was performing satisfactorily and should be recommended for re-appointment at the Annual General Meeting.
The Chairman of the Audit Committee attends the Company’s Annual General Meeting to respond to any shareholder questions that might be raised concerning the Audit Committee’s activities.
Internal control
Philosophy and policy
The objective of the directors and senior management is to safeguard and increase the value of the business and assets of the Company. Part of this objective requires the development of relevant policies and appropriate internal controls to ensure proper management of the Company’s resources and the identification of risks which might serve to undermine them.
The Board is ultimately responsible for the Group’s system of internal control and for reviewing its effectiveness. The systems and processes established by the Board are designed to manage, rather than eliminate the risk of failure to achieve business objectives and provide reasonable, not absolute, assurance against misstatement or loss. The Board has delegated responsibility for the review of practices and procedures to the Audit Committee. The Company’s senior management, in conjunction with external advisers are responsible for undertaking periodic reviews of the suitability of current systems on which they report to the Audit Committee.
The Audit Committee reviews the findings to ensure the effectiveness and efficiency of the processes
CSR plc Annual Report and Financial Statements 2009
69
DIRECTORS’ REPORT CORPORATE GOVERNANCE continued
implemented by senior management. This includes discussions with senior management of the Group and consideration of reports that have been submitted. These findings are in turn regularly reviewed and discussed by the full Board. The Board is satisfied that this process accords with the internal control guidance for directors set out in the Turnbull Report “Internal Control: Guidance for Directors on the Combined Code” and that through its interface with management, the Board is aware of the major risks facing the Group and the steps taken by the Group to mitigate such risks, so far as is possible.
The risk evaluation process has been the subject of review during 2009, and a revised process adopted which reflects the changing nature of the business. This ongoing review process included a detailed assessment of the key risks affecting the Group prior to the acquisition of SiRF. The assessment was reported in detail in the Prospectus dated 24 June 2009 which was submitted to the UKLA as part of the completion of the acquisition of SiRF and also within the Form F-4 filed with the US Securities and Exchange Commission on 29 May 2009 (as amended). Following completion of the acquisition of SiRF, the management of the combined organisation was engaged to complete a further review of the key risks as part of the integration of the two entities. The findings from these reviews were considered by the Audit Committee. A risk evaluation process has been implemented throughout 2009 and was in place up to the date of approval of this Annual Report and the financial statements. Following a recommendation by the Audit Committee, a meeting of the Board dedicated to the consideration of key risks of the Group was held in January 2010 in order to allow for detailed discussion on issues of risk and risk management and to augment the process for approval of the Annual Report and financial statements. That meeting determined that the steps being taken by management were satisfactory.
Managing risks
The Board confirms that the actions it considers necessary have been or are being taken to remedy such failings and weaknesses which it has determined to be significant from its review of the system of internal control. This has involved considering the matters reported to it and developing plans and programmes that it considers are reasonable in the circumstances.
A summary of the structures and processes in place to identify and manage risks across the Group are set out below.
Risk profiling
There is an ongoing process to identify and evaluate risks faced by the Group, through the conduct of regular meetings by the Group’s senior management, and engagement of external consultants where in the opinion of the Group’s senior management this is considered appropriate. Findings are reported to the Audit Committee together with recommended actions for managing the risks and a timetable for implementation. The assessment of prioritised risks is refreshed on a regular basis to reflect changes to the business and any observations or proposals arising from events since the last review. A schedule of the prioritised risks is developed and reviewed by management to ensure that possible mitigation measures are considered and plans for action agreed. Responsibility is assigned within the Group for carrying out proposed actions which are also reviewed and up-dated by management. Such a process of review was conducted in the months following the acquisition of SiRF.
Controlling risk
The Group has policies which address a range of key business risks, including financial, treasury, health and safety and the protection of intellectual property. The policies are made available to relevant employees through policy manuals, an intranet site and also via employee briefings on specific topics.
Periodically, reviews are performed in order to verify that ongoing practices within relevant parts of the Group comply with current policies. In addition, policies are themselves reviewed against best practice and in order to take appropriate account of developments both within or external to the Group’s business operations. Steps are ongoing to embed internal control and risk management further into the operations of the Group and to deal with areas of improvement which come to management’s and to the Board’s attention.
As explained in the Directors’ Report – Business and Financial Review on pages 27 to 29, the Group has a treasury policy for the placement of cash deposits with financial institutions. In September 2009, Ernst & Young LLP conducted an internal audit of the
CSR plc Annual Report and Financial Statements 2009
70
Company’s Treasury Policy and Procedures. The use of external advisers was considered appropriate given the increasing complexity of Treasury matters affecting the Company and to assist management in a thorough understanding of the Treasury practices and policies within SiRF. The findings and recommendations from that audit were considered at the scheduled meeting of the Audit Committee held in October 2009 as part of its annual review of the Treasury Policy. The review also considered amongst other aspects of the policy, the requirement for the Group’s cash to be spread amongst multiple counter-parties and the minimum credit ratings required to be met to allow the Group to make a deposit with each counter-party, in addition to the authorities required to manage the movement of funds. Reflecting a combination of management comments and the recommendations of the review, the Audit Committee considered a revised Treasury Policy. This was subsequently submitted for adoption by the Board which occurred in October 2009.
As one aspect of ensuring a culture of integrity and encouraging high standards throughout the organisation, the Group has a formal whistle-blowing policy. The policy provides information on the process to follow in the event that any employee feels it appropriate to make a disclosure where they believe there has been improper conduct or actions which could cause the company’s good standing to be called into question. The policy was most recently up-dated during 2006. The Audit Committee ensures that employees are reminded of the existence of the policy and of the Company’s commitment to respond appropriately to circumstances warranting investigation. The Audit Committee is satisfied that the policy provides an adequate basis for employees to make representations in confidence to the Group and for appropriate and proportionate investigation.
During 2009, a Group-wide programme was initiated providing for management to carry out self-assessments to determine ongoing compliance with Group policies and to report the findings. These reports are provided to the Internal Auditor who will provide interim reports between each internal audit review. The intention of the process is to support management across the Group in better understanding how their teams are meeting Group standards and to encourage more timely corrective action where appropriate. In preparing for the reviews,
support has been provided through the provision of self assessment forms and training on the conduct of the assessments.
Monitoring and managing the status of residual risk
The actions arising from external and internal assessments of risks are consolidated and during 2009 the results were reported to the Audit Committee.
The Audit Committee assesses the findings and proposed actions for addressing residual risks and also advises on areas for further attention.
Business continuity planning
Since 2007 a rolling programme aimed at improving the Group’s Business Continuity Plan has been in place. The project has been facilitated by the risk management practice of a leading independent consultant. Through workshops and one-on-one interviews, the potential significant risks are identified and an action plan implemented to enable the Group to respond in the event that such a risk arose. That plan was the subject of further work during 2009. This included a workshop attended by senior management conducted in November 2009 which assessed the adequacy of existing plans and provided feedback on areas for further development across the Group. There is a programme of further reviews and testing due to take place during 2010. The findings and steps taken to date have been reported to the Audit Committee.
Internal financial controls
The Group has a comprehensive system for regular monitoring and reporting of financial performance and assessing the adequacy of the Group’s systems of internal controls. Risk assessment and evaluation is an integral part of the annual planning cycle. This includes assessment of the Group’s strategic direction, objectives and financial returns and the risks in achieving them.
As part of the planning cycle, a detailed budget is prepared by management and thereafter is reviewed and formally adopted by the Board. The budget and other targets are regularly updated via a rolling forecasting process and regular business review meetings are also held involving senior management worldwide, at which the Group’s overall performance
CSR plc Annual Report and Financial Statements 2009
71
DIRECTORS’ REPORT CORPORATE GOVERNANCE continued
is assessed. The results of these reviews are reported to and discussed by the Audit Committee and the Board at each meeting. A summary of the key financial and non-financial risks inherent in the Group’s business is given on pages 45 to 57.
These processes are supported by discrete reviews conducted by the Internal Auditor and external advisers, as determined by the Audit Committee, in addition to the routine audits.
The Board confirms that it has reviewed the effectiveness of the system of internal controls which were in place throughout the financial year and up to the date of signing the Financial Statements for the 52 week period ended 1 January 2010.
This Annual Report does not include a report of management’s assessment regarding internal control over financial reporting or an attestation report of the company’s registered public accounting firm pursuant to US securities laws due to a transition period established by rules of the US Securities and Exchange Commission for companies who have recently filed an initial registration statement with the US Securities and Exchange Commission.
Disclosure controls and procedures
The executive management, with the participation of the Chief Executive Officer and Chief Financial Officer, evaluated the effectiveness of the Group’s disclosure controls and procedures (as defined in Rules 13a-15(e) and 15d-15(e) under the US Securities Exchange Act of 1934, as amended, or the Exchange Act) as of 1 January 2010. The Group’s disclosure controls and procedures are designed to ensure that the information which the Group is required to disclose in the reports that are filed or submitted under the Exchange Act is (i) recorded, processed, summarised and reported within the time periods specified in the US Securities and Exchange Commission’s rules and forms and (ii) accumulated and communicated to management, including the Chief Executive Officer and Chief Financial Officer, as the principal executive and financial officers, respectively, to allow timely decisions regarding required disclosures.
Based on that evaluation, the Chief Executive Officer and Chief Financial Officer concluded that the Group’s disclosure controls and procedures were effective as of the end of the period covered by this report.
Attendance at meetings
The table below shows the attendance of each of the directors at meetings of the Board and its Committees held during the 52 weeks ended 1 January 2010.
| | | | | | | | |
| No. of Meetings | | Board | | Audit | | Remuneration | | Nomination |
| | | 11
| | 4 | | 6 | | 1 |
A J Allner | | 11 | | 4 | | 5 | | 1 |
D Banatao1 | | 3 | | – | | – | | – |
J A J van Beurden | | 11 | | – | | – | | – |
A E C G Carlisle | | 10 | | 4 | | 5 | | 1 |
K Chadha1 | | 4 | | – | | – | | – |
J D Y Collier | | 11 | | – | | – | | – |
D D W Gardiner | | 11 | | – | | – | | – |
S Giacoletto-Roggio | | 10 | | 4 | | 6 | | 1 |
C A Ladas | | 11 | | – | | – | | – |
R W Mackintosh | | 10 | | – | | 6 | | 1 |
D L Tucker2 | | 6 | | 2 | | 2 | | 1 |
1 Appointed to the Board effective from completion of the acquisition of SiRF in June 2009
2 Retired from the Board on 27 May 2009
Annual General Meeting resolutions
The resolutions to be proposed at the Annual General Meeting to be held on 19 May 2010, together with explanatory notes, appear in the separate Notice of the Annual General Meeting, which has been sent to all registered shareholders.
By Order of the Board
Brett Gladden
Company Secretary
9 February 2010
CSR plc Annual Report and Financial Statements 2009
72
DIRECTORS’ REPORT DIRECTORS’ REMUNERATION REPORT
|
| |
Directors’ report – Directors’ remuneration report |
The Board presents the Remuneration Report for the 52 weeks ended 1 January 2010.
Role of the Remuneration Committee
The Board sets the Company’s remuneration policy. The Remuneration Committee (“the Committee”) makes recommendations to the Board within its agreed terms of reference (available on the Company’s website www.csr.com or from the Company Secretary at the Company’s registered office) on the Company’s framework of executive remuneration and its cost.
The Committee also determines on behalf of the Board, specific remuneration packages for each of the executive directors and for the Chairman. The Committee administers the Company’s share incentive plans for employees and monitors and provides guidance on the level and structure of remuneration for senior management who report to the Chief Executive Officer. The Board itself determines the remuneration of the non-executive directors. No director plays a part in any discussion about their own remuneration.
Mr Giacoletto-Roggio is Chairman of the Committee. The other current members of the Committee, all of whom are independent non-executive directors within the definition of the Code, are set out on pages 59 and 60. Mr Mackintosh, Chairman of the Board, attends meetings of the Committee as a member. The Company Secretary acts as secretary to the Committee. None of the members of the Committee has any personal financial interest (other than as shareholders), conflicts of interests arising from cross-directorships or day-to-day involvement in running the business of the Company.
An evaluation of the performance of the Committee was conducted during 2009, in regards to which more information is contained in the Corporate Governance report on page 64.
The Committee has access to detailed external research from independent consultants. During the year, professional advice has been provided by Hewitt New Bridge Street (HNBS), Slaughter and May, Faegre and Benson LLP and Alithos Limited. Each of the advisers were appointed by the Committee. Slaughter and May act as legal advisers to the
Company generally and Faegre and Benson also provide additional legal advice to the Company. Neither Hewitt New Bridge Street nor Alithos Limited provides other services to the Company. Terms of engagement with each provider are available from the Company Secretary.
The Committee determines policy for the remuneration of the executive directors and is consulted and provides guidance on the broader remuneration policies for the Group below Board level based on recommendations of the Chief Executive Officer and the other executive directors. Further information on meetings held and attendance by the members of the Committee is disclosed in the Corporate Governance report on page 72.
The Directors’ Report on Remuneration for the period ended 2 January 2009 was approved by the shareholders at the Annual General Meeting held in May 2009. As required by the Companies Act, shareholders will be invited to approve this report at the Annual General Meeting to be held on 19 May 2010.
This Report has been prepared in accordance with the Companies Act 2006 (“the Act”). The report also meets the relevant requirements of the Listing Rules of the Financial Services Authority and describes how the Board has applied the Principles of Good Governance relating to directors’ remuneration.
The Act requires the auditors to report to the Company’s members on certain parts of the Remuneration Report and to state whether in their opinion those parts of the Remuneration Report have been properly prepared in accordance with the Act. The Remuneration Report has therefore been divided into separate sections for audited and unaudited information.
In setting the remuneration policy, the Committee takes into account the strategic objectives of the Group and the expected performance of individual directors within their areas of responsibility. Targets set in association with the performance related elements of pay take into account the strategic objectives of the Company for example in the development and release of particular chips, and the development of strategic partnerships. These are
CSR plc Annual Report and Financial Statements 2009
73
DIRECTORS’ REPORT DIRECTORS’ REMUNERATION REPORT continued
reviewed each year in the context of the plans set for the group as a whole and are agreed for each executive director at the start of a financial year.
Unaudited information
Changes in executive directors
With effect from completion of the SiRF acquisition on 26 June 2009, Mr Kanwar Chadha was appointed as an executive director to the Board and Chief Marketing Officer of CSR plc. Mr Chadha was a founder and an executive director of SiRF Technology Holdings Inc and served as Vice President of Strategic Corporate Initiatives, Corporate Marketing and as Secretary at the time of the completion of the acquisition. Mr Chadha’s biography and professional experience is set out on page 59.
On 4 August 2009, Mr Chadha was granted options and share awards under the Company’s Share Option and Share Award Plans of 400% of salary for share options and 200% of salary for share awards. These exceptional awards were made as the Committee recognised the importance of retaining and motivating Mr Chadha following the acquisition and going forward. Each of the grants made under the Share Option and Share Award Plans are subject to satisfying performance conditions. All of the options and shares granted to Mr Chadha are subject to a three year retention period and the requirement that, subject to certain mitigating factors, he is an employee at the end of the retention period.
Remuneration policy for the executive directors
Executive remuneration packages are designed in order to attract, motivate and retain employees of the highest calibre required by the Group in order to achieve its objectives, to meet the needs of customers and enhance value to shareholders. There are five main elements of the remuneration package for executive directors and senior management, which include medium and long term incentives comprising basic annual salary, benefits-in-kind, the opportunity to participate in a money purchase pension scheme, a cash bonus plan and participation in the Company’s share incentive plans.
The Company’s policy is that a substantial proportion of the remuneration of the executive directors should be performance-related. The payment of both cash bonuses and the vesting of share incentives are subject to meeting performance conditions
established by the Committee at the beginning of each performance period reflecting what, at that time, the Committee considers to be demanding targets. These targets are set taking appropriate account of the challenging and rapidly evolving market in which the Group operates, and the expectations of the investment community on the Company’s potential future performance.
The Remuneration Committee considers corporate performance on environmental, social and governance issues and the extent to which these should be incorporated into the performance-related benefits of individual directors. The Committee looked at the matter at the end of 2009 and determined that, given the Company’s current activities and its strategic imperatives for 2010, it was not appropriate to incorporate such matters specifically within the incentive arrangements for any executive director during 2010. This will be kept under review on an annual basis.
Basic salary
An executive director’s basic salary is considered by the Committee on appointment and then reviewed each year and when an individual changes position or responsibility. When making a determination as to the appropriate remuneration, the Committee considers remuneration practices within the Group as a whole and where considered relevant, conducts objective research on companies within the Company’s UK listed peers of a similar size with an international focus, reflecting that the Company is competing in a global market. The target salary is at mid-market (noting that after promotion or appointment to the Board it may take several years to meet this policy), with the opportunity to go above this level, subject to sustained individual performance.
With the exception of Mr Ladas and Mr Chadha, both of whom are paid their salary in US Dollars, the executive directors in office at 1 January 2010 were paid in pounds sterling. Details of the basic salary of the executive directors who served during the period ended 1 January 2010 are set forth in the table on page 82.
As previously reported, salary levels were not adjusted at 1 January 2009 following the review conducted in December 2008. The Committee’s decision, which was supported by the Board as a whole, was
CSR plc Annual Report and Financial Statements 2009
74
considered appropriate given the prevailing economic environment and the decision was in keeping with the general pay freeze which had been adopted for the Group.
As stipulated in the 2008 report of the Committee to shareholders, the Committee kept under review whether any increases were warranted during the year.
In July 2009, following the completion of the acquisition of SiRF, the Committee reviewed the salary level of Mr van Beurden, the Chief Executive Officer. The Committee assessed his overall performance since joining the Company and took into account the contribution he had made to facilitate the acquisition of SiRF, whilst also noting that his salary had remained unchanged since his appointment in November 2007. The Committee consulted with and took advice provided by HNBS which highlighted that Mr van Beurden’s salary was significantly below mid-market against a specific peer group and a general group of similar sized companies. Having regard to these elements, the Committee concluded that Mr van Beurden should be awarded an increase in basic annual salary to £400,000 per annum which was effective from 1 July 2009. This increased salary remains below the identified mid-market.
As a result of this change in basic annual salary, the bonus potential for Mr van Beurden for 2009 was adjusted to ensure that the total potential cash remuneration before and after the basic salary increase was broadly comparable. This was achieved by reducing the maximum potential bonus from 150% to 100% of salary for Mr van Beurden effective from 1 July 2009. Prior to 1 July 2009, Mr van Beurden’s annual total potential cash remuneration would have been £750,000. Following the increase to Mr van Beurden’s basic salary and the reduction of his maximum potential bonus, the annual total potential cash remuneration became £775,000.
Current salaries at February 2010 are:
| | | |
J A J van Beurden | | £ | 400,000 |
J D Y Collier | | £ | 286,000 |
D D W Gardiner | | £ | 301,600 |
C A Ladas | | $ | 312,000 |
K Chadha | | $ | 312,000 |
In keeping with a decision on the review of salaries for the Group as a whole, the salaries for the executive directors were reviewed in February 2010, with any adjustment to take effect from 1 April 2010. The adjustment will be backdated to 1 January 2010 and the increase in salary for the first quarter will be paid in the March salary. This adjustment is being carried out in 2010 only and applies to all employees.
Benefits-in-kind
The executive directors receive certain benefits-in-kind, comprising private medical insurance, life assurance of four times basic salary, and personal accident insurance and subsistence expenses. During 2009, Mr Ladas, who lives in the US, was provided with support towards the cost of a UK temporary residence reflecting his frequent travel and stays in the United Kingdom as part of the performance of his role. Mr Ladas and Mr Chadha also receive US-based dental plan insurance.
Cash bonus plan
The Committee is responsible for determining on what basis to incentivise employees, including executive directors, through a cash bonus plan. The Committee establishes against defined targets the minimum threshold at which a bonus will be payable and the maximum potential award. In setting appropriate bonus thresholds and targets, the Committee may refer to the objective research on a comparator group as noted on page 74 under “Basic salary”.
The performance metrics used for the 2009 cash bonus comprised underlying operating profit and cash generation in addition to personal performance objectives. These targets were set after considering the Company’s budgeted underlying operating profit and market expectations on financial performance, in addition to cash flow targets which recognised the significance of good cash management required in the challenging economic environment prevailing when the targets were established. The targets were agreed based upon objectives which were considered to be appropriate and stretching against the background of the prevailing economic conditions.
Achievement of targets based on the Company’s financial and strategic objectives and the personal performance of individual directors would result in determination by the Committee of the appropriate size of the bonus having regard to actual performance against the targets. The maximum potential bonus
CSR plc Annual Report and Financial Statements 2009
75
DIRECTORS’ REPORT DIRECTORS’ REMUNERATION REPORT continued
payable for the 52 weeks ended 1 January 2010 was 150% of salary for the period prior to 1 July 2009 and 100% of salary from 1 July 2009 for Mr van Beurden (adjusted for the reason explained above) and 100% of salary for other executive directors. The on-target bonus potential for Mr van Beurden was 75% of salary for the period prior to 1 July 2009 and 50% of salary from 1 July 2009 and 50% of salary for other executive directors.
The on-target financial objectives set at the beginning of the performance period were exceeded, which resulted in payment of bonus being made in accordance with pre-determined hurdles. The extent to which these targets had been satisfied was initially considered by the audit committee and then discussed by the remuneration committee. In addition, the Committee also considered the extent to which the personal objectives had been satisfied for each executive director in order to assess the amount which should be paid. Based on this assessment, the amount of the bonus paid to each executive director is as shown below.
| | | |
J A J van Beurden | | £ | 395,500 |
J D Y Collier | | £ | 221,537 |
D D W Gardiner | | £ | 269,870 |
C A Ladas | | $ | 241,676 |
Following the decision of Mr Chadha to waive his entitlement to a cash bonus, the Committee determined to allot Mr Chadha 16,580 ordinary shares in the Company, in the form of restricted shares, which, subject to remaining an employee as at 1 March 2011, will be transferred to Mr Chadha at that date. There are no further performance conditions applying to the transfer of the restricted shares and Mr Chadha may elect to hold or sell the shares on transfer at 1 March 2011.
The Committee reviewed the bonus potential of the executive directors in February 2010 for the 2010 financial year. The cash bonus potential was set at a maximum potential of 100% of salary. For each of Mr van Beurden and Mr Gardiner the bonus potential comprises a combined cash element up to a maximum potential of 100% of salary and a share element, which for Mr van Beurden is a maximum opportunity of 120,000 shares and for Mr Gardiner is a maximum opportunity of 100,000. Both the cash and share elements are subject to satisfying financial,
strategic and personal objectives set by the Committee. The shares will, subject to meeting the performance conditions, vest in March 2011. Each of Mr van Beurden and Mr Gardiner may elect to sell sufficient shares to satisfy the tax liability on vesting, but are otherwise required to hold the shares they receive for a further period of 12 months.
Targets for the bonus plan for 2010 have been determined by taking into account the financial targets and strategic objectives of the Company, with due regard for market expectations in addition to personal objectives set for each of the executive directors. All executive directors in office at 2 January 2010 have been invited to participate in the cash bonus plan for 2010.
The use of a deferral period or potential clawback provisions in the cash bonus plan will be considered in due course along with other matters raised in the revised Combined Code.
Share option plans
The Company has a number of share option plans intended to facilitate the motivation and retention of employees. Two of the plans were established prior to the Company’s flotation, being the Founders Share Option Plan and the Global Share Option Plan. Whilst not all the awards under these two plans have been exercised, the plans are closed for the purpose of any new awards, and neither plan was used during 2009 for grants to executive directors or to other employees.
Following shareholder approval at the 2004 Annual General Meeting, the Company established the CSR plc Share Option Plan (“CSOP”). The reason for the introduction of this plan was to provide a means by which to incentivise the executive directors and employees whilst aligning their interests more closely with those of the Company’s shareholders. The Committee has responsibility for supervising the CSOP and the grant of options in accordance with its rules.
Awards are made to executive directors and other employees at the discretion of the Committee. Awards for directors and other senior employees are subject to a three year retention period and the requirement that, subject to certain mitigating factors, the participant is an employee at the end of the retention period.
CSR plc Annual Report and Financial Statements 2009
76
In December 2009, the Committee initiated a detailed review of the structure of the plans used by the Company to grant options to Directors and other employees. This review has been undertaken with due regard to the growth of the business and the increased relative size of the Group outside of the UK following in particular the acquisition of SiRF in 2009. The review recognises the global nature of the Group’s business and the need to attract retain and motivate employees at all levels of the Group who can support the change in scale and spread of the business and support its objectives for further growth in the future. This process will involve consultation with shareholders during the course of 2010.
Since the introduction of the CSOP, through to and including grants made in 2008, the vesting of shares was subject to a performance target based on the growth over a three year period in the Company’s underlying earnings per share. Details of the targets for grants made in 2008 and prior years appear as notes to the table on page 85. The performance target for the 2007 grants were not met, and these options therefore lapse.
As disclosed in the report of the Committee for 2008, following a review conducted in December 2008 by the Committee in conjunction with its adviser HNBS, of long term share reward structures, as applied across the Group from executive director level down, the Committee decided that the target for options under the CSOP would, for grants made in 2009, be based on relative Total Shareholder Return of the Company against a peer group over a period of three years. The peer group is shown below.
The Committee reviewed in February 2010 the grants of share options under the company’s plans for each of the executive directors. The Committee looked in particular at the bonus arrangements for the CEO and CFO, and, taking into consideration the exceptional performance of each over the period since they each joined the Company, and in particular during 2009, it was decided it was appropriate to make a higher grant under each plan at 200% of salary under the CSOP and 200% of salary under the Share Award Plan.
Total Shareholder Return comparator group of companies
The following basket of comparator companies is used for determining the relative TSR performance of the Company, for grants being made in 2010.
| | | | |
ARM Holdings plc | | GN Store Nord A/S | | QUALCOMM Incorporated |
Advanced Semiconductor Engineering, Inc. | | Hewlett-Packard Development Company L.P. | | STMicroelectronics N.V. |
ASML Holding N.V. | | Infineon Technology AG | | Silicon Laboratories Inc. |
Analog Devices, Inc. | | Intel Corporation | | Skyworks Solutions, Inc. |
Apple Computer, Inc. | | Logitech International SA | | Spirent plc |
Atheros Communications, Inc. | | Marvell Technology Group Ltd | | Synopsys Inc. |
austriamicrosystems AG | | Motorola, Inc. | | Taiwan Semiconductor Manufacturing Company Limited |
Broadcom Corporation | | National Semiconductor Corporation | | Teradyne, Inc. |
Cirrus Logic, Inc. | | Nokia Oyj | | Texas Instruments Incorporated |
Conexant Systems, Inc. | | PMC-Sierra, Inc. | | Wolfson Microelectronics plc |
Dell, Inc. | | Plantronics, Inc. | | |
The grants in 2009 included additional companies in the comparator group, being Bookham Inc, Dialog Semiconductor plc, Nordic Semiconductor ASA, Research in Motion Ltd and Wavecom SA
CSR plc Annual Report and Financial Statements 2009
77
DIRECTORS’ REPORT DIRECTORS’ REMUNERATION REPORT continued
The Committee decided that the thresholds to be met would be as follows. None of the options shall vest if the Company’s relative position is below median. 30% of a grant shall vest at median, with full vesting of a grant for performance at the upper quartile. Shares shall vest on a straight-line basis between the median and upper quartile, with no retesting of the performance condition if it is not met at the end of the three year period.
The performance condition is considered by the Committee to be challenging and appropriately aligned with shareholder interest to achieving sustained performance in the return to shareholders over the three year performance period. This same target has been adopted in respect of grants to be made in 2010.
The rules of the CSOP do not allow for options to be granted at a discount to the Company’s share price at the date of grant.
The Company’s policy is to grant options to executive directors at the discretion of the Committee up to a maximum of 200% of salary, taking into account individual performance. Pursuant to the rules of the CSOP, the Committee also reserves to its discretion the right to grant awards at a higher proportion of basic salary which, in exceptional circumstances only, such as recruitment of a new executive or key employee, could be up to 400% of basic salary.
The Company operates an HM Revenue and Customs approved SAYE Share Option Scheme for eligible employees under which options may be granted at a discount of up to 20% of market value. Executive directors resident in the UK are eligible to participate in the SAYE Share Option Scheme.
Following the acquisition of SiRF, and as approved by shareholders at the General Meeting held on 25 June 2009, the Company introduced an Employee Share Purchase Plan (the “ESPP”) specifically for its US employees under which the option to acquire shares in the Company may be granted at a discount of up to 15% of the market value. US-based employees are invited to participate in the ESPP during an offer period which is expected to be made once every twelve months. The ESPP allows US employees to save a pre-determined amount from their monthly salary which may at the end of a specified savings period be used towards the purchase of shares in the Company. US resident directors may participate in the ESPP.
Performance share awards
At the Annual General Meeting held in May 2005, shareholders approved the introduction of a Share Award Plan called the CSR Share Award Plan. Awards are made to executive directors and other employees at the discretion of the Committee.
Since the introduction of the Share Award Plan, vesting of the Share Awards made to executive directors and senior management have been subject to Total Shareholder Return (“TSR”) over a fixed three year period with an additional requirement that the Company should have achieved a sustained improvement in underlying financial performance over the same three year period. Grants of share awards below this level (which have been small in value) have been subject only to employment at the end of the retention period.
With the decision to extend the grant of share awards with accompanying performance conditions to other employees, the Committee had decided that for grants in 2009, the performance condition for vesting would be underlying earnings per share.
The detail of the condition is that no Share Award will vest for a compound underlying EPS growth of less than 7.5% per annum, adjusted for RPI. 30% vests for a compound underlying EPS growth of 7.5% per annum, adjusted for RPI and full vesting of the share awards occurs for a compound underlying EPS growth of 15% per annum adjusted for RPI. Share awards vest on a straight line basis for a compound underlying EPS growth between 7.5% and 15% adjusted for RPI. There is no retesting of the performance condition if it is not met at the end of the three year performance period.
The Committee considers that these performance conditions are appropriate for the form of award and are suitably stretching.
Grants made in May 2005 completed the three year retention period in May 2008. Following completion of the three year performance period (1 January 2005 to 31 December 2007) for these grants the Committee considered a report which had been prepared by an independent agency, Alithos Limited, on the Company’s TSR performance. That report concluded that the Company’s comparative TSR performance against its peer group resulted in a ranking that allowed for 89.87% of the original grants to employees to vest.
CSR plc Annual Report and Financial Statements 2009
78
The TSR performance target for the grants made in 2006 were not met and the Share Awards therefore lapse. The TSR performance target for the grants made in 2007 were not met, and the Share Awards therefore lapse.
The performance condition in respect of grants to be made in 2010 is subject to meeting specific EPS targets in 2012. In order for 20% of the grant to vest, the Company must achieve an EPS of 58 cents, increasing to vesting at 100% for achieving an EPS of 70 cents. Above 58 cents up to maximum vesting at 70 cents, the shares will vest on a straight line basis.
In accordance with the rules of the CSR Share Award Plan, the Committee will reserve the right to grant awards at a proportion of basic salary normally up to a maximum of 100% of salary (200% in exceptional circumstances).
The table below summarises awards granted and exercised in 2009 under the CSR Share Award Plan, and the total awards held by each executive director at 1 January 2010.
No significant amendments are proposed to be made to the terms and conditions of any entitlement of an executive director under these share incentive plans.
The level of award is considered each year in the light of performance.
The Company monitors the awards of shares made under the various share plans which it operates in relation to their effect on dilution limits. Following shareholder approval at the 2005 Annual General Meeting, the Company is able to make selective share awards while maintaining the traditional overall 10% limit on awards as a proportion of the issued share capital in any rolling ten year period.
Conscious of the need to ensure that the satisfaction of issue of new shares to employees pursuant to its share schemes operates within ABI guidelines, the CSR Employee Benefit Trust (the “Trust”) was established during 2007. The Trust will enable the grant of shares to employees on exercise of vested options to be met by using shares acquired by the Trust in the open market.
During 2008, the Trust acquired in the open market an aggregate of 3,222,813 ordinary shares in CSR plc. This was satisfied through cash drawn down under the terms of a Loan Facility Agreement established at the time of the creation of the Trust. During 2009 the Trust did not acquire any shares. The details of each purchase of ordinary shares in CSR plc and the total holding by the Trust is shown in note 25 to the Consolidated Financial Statements on page 132.
| | | | | | | | | | | | | | | | | | | |
| Name | | Awards
held at
2 January
2009 | | Date of
2009 award | | Awards
made | | Awards
price (£) | | Award
vesting date | | Awards
exercised
in 2009 | | Lapsed
in 2009 | | | Interests
held at
1 January
2010 | | Performance cycle
for the 2009 Awards |
J D Y Collier | | 126,175 | | 12-Mar-09 | | 103,643 | | 2.0825 | | 12-Mar-12 | | – | | (18,393 | ) | | 211,425 | | 1-Jan-09 to 31-Dec-11 |
J A J van Beurden | | 188,547 | | 12-Mar-09 | | 113,065 | | 2.0825 | | 12-Mar-12 | | – | | – | | | 301,612 | | 1-Jan-09 to 31-Dec-11 |
D D W Gardiner | | 179,800 | | 12-Mar-09 | | 109,296 | | 2.0825 | | 12-Mar-12 | | – | | – | | | 289,096 | | 1-Jan-09 to 31-Dec-11 |
C A Ladas | | 51,228 | | 12-Mar-09 | | 81,682 | | 2.0825 | | 12-Mar-12 | | – | | (6,000 | ) | | 126,910 | | 1-Jan-09 to 31-Dec-11 |
K Chadha* | | – | | 4-Aug-09 | | 70,000 | | 4.2790 | | 4-Aug-12 | | – | | – | | | 70,000 | | 1-Jan-09 to 31-Dec-11 |
* Mr Chadha also holds 18,525 of share awards that were held prior to the acquisition (see details of options on page 84).
Pension arrangements
Three of the executive directors serving at the year end were members of the Cambridge Silicon Radio Retirement Benefits Scheme (“the UK Pension Plan”) which is an HM Revenue and Customs approved money purchase (defined contribution) scheme operated for eligible employees in the United
Kingdom. One executive director has established their own personal pension plan to which the Company contributes. One director participates in the US 401K Plan which the Company operates for its US-resident employees.
Contributions are determined as a percentage of the employee’s gross basic salary. Details of the actual
CSR plc Annual Report and Financial Statements 2009
79
DIRECTORS’ REPORT DIRECTORS’ REMUNERATION REPORT continued
contributions made by the Group to the UK Pension Plan and the US 401K Plan on behalf of the executive directors are set out in the table on page 83.
Normal retirement age is 65 for employees and executive directors.
Other than basic salary, no element of the directors’ remuneration is pensionable.
Share ownership
Executive directors are encouraged to build up a shareholding in the Company to a level equivalent to 100% of their basic salary. This shareholding can be satisfied through retention of 50% (or more at the discretion of the director concerned) of the shares obtained as a result of participating in a Company share plan, net of the shares sold to finance option exercises or to pay a National Insurance or income tax liability or overseas equivalent. The programme specifically excludes the need for directors to make a personal investment should awards not vest. Normally the Committee would expect the executive director to achieve the holding within five years following appointment to the Board.
Performance graph
The graph below shows the Company’s performance, measured by total shareholder return, compared with the performance of the FTSE 250 index.
The FTSE 250 index has been selected for this comparison because it is a broad equity index of which CSR plc is a constituent company.
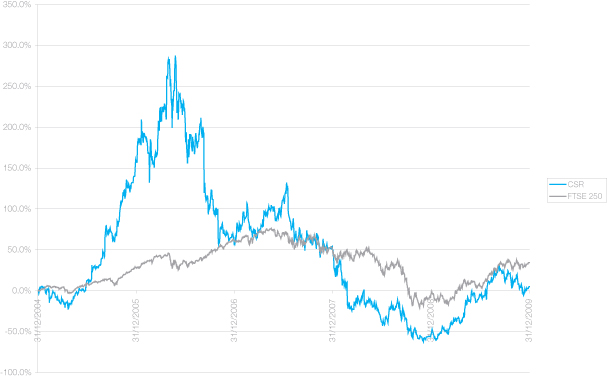
CSR plc Annual Report and Financial Statements 2009
80
Directors’ contracts
It is the Company’s policy that executive directors should have contracts of an indefinite term. As disclosed below executive directors have a service contract which is subject to one year’s notice from the Company. Each of Mr van Beurden, Mr Collier, Mr Gardiner and Mr Ladas has a service agreement requiring them to give six months’ notice to the Company.
The details of the directors’ service contracts and notice period from the Company under their respective contracts for those in office at the year end are summarised in the table below:
| | | | |
| Name of director | | Date of service contract | | Period of
notice |
J A J van Beurden | | 29 September 2007 | | 1 year |
J D Y Collier | | 25 February 2004 | | 1 year |
D D W Gardiner | | 27 February 2008 | | 1 year |
C A Ladas | | 12 December 2007 | | 1 year |
In the event of termination, a director would be entitled to a payment not exceeding one year’s remuneration. In an appropriate case, the Company would have regard to the departing director’s duty to mitigate against costs to the Company.
The contract with Mr Chadha remains to be finalised.
Non-executive directors
All non-executive directors have specific terms of engagement provided in formal letters of appointment and their remuneration is determined by the Board within the limits set by the Articles of Association and based on independent surveys of fees paid to non-executive directors of similar companies. The fees for non-executive directors are considered each year. The non-executive directors are appointed for a three year fixed term, subject to re-appointment by the shareholders.
The letter of appointment of Mr Giacoletto-Roggio was due for renewal in January 2010. Following confirmation from Mr Giacoletto-Roggio that he was prepared to remain a director for a further three year period, the Board determined at its meeting in December 2009 to re-appoint Mr Giacoletto-Roggio for a further three years effective from 4 January
2010. Mr Giacoletto-Roggio will be standing for re-election at the Annual General Meeting being held on 19 May 2010.
The terms and conditions of appointment are available for inspection at the Company’s registered office during normal business hours on request to the Company Secretary and up to 15 minutes prior to and at the Company’s Annual General Meeting.
In May 2009 the Board reviewed the fees payable to non-executive directors and determined that there should be no increase in the current arrangements. The basic fee for a non-executive director therefore remained £42,000. Following the retirement of Mr David Tucker from the Board immediately on the conclusion of the Annual General Meeting held in May 2009, Mr Andrew Allner was appointed chairman of the Audit Committee and Mr Anthony Carlisle was appointed the Senior Independent Director. As a result, the fee paid to Mr Allner was increased by £6,000 on a pro-rata basis and the fee paid to Mr Carlisle was increased by £5,500 on a pro-rata basis. The fee paid to Mr Giacoletto-Roggio, who acts as Chairman of the Remuneration Committee remained at £47,700. The fee paid to Mr Mackintosh as Chairman of the Board remained £170,000. Fees are paid wholly in cash.
The fees of the non-executive directors and the Chairman were reviewed in February 2010. It was determined that the basic fee paid to non-executive directors would increase to £45,000. It was also agreed that the fee payable to Mr Carlisle in his capacity as Senior Independent Director would be adjusted by the payment of a further £8,500 (previously £5,500), to Mr Allner in his capacity as chairman of the audit committee by payment of a further £9,000 (previously £6,000) and to Mr Giacoletto-Roggio in his capacity as chairman of the remuneration committee £8,700 (previously £5,700). The fee payable to Mr Mackintosh, as Chairman of the Board was increased to £180,000.
Non-executive directors do not receive any bonus, do not participate in awards under the Company’s share schemes and are not eligible to join the Company’s pension scheme.
CSR plc Annual Report and Financial Statements 2009
81
DIRECTORS’ REPORT DIRECTORS’ REMUNERATION REPORT continued
Mr Banatao who is proposed for election and both Mr Giacoletto-Roggio and Mr Mackintosh who are proposed for re-election, being non-executive directors, do not have a service contract.
| | | | |
| Name of director | | Date of letter of appointment | | Duration of appointment |
R W Mackintosh | | 2 May 2007 | | 3 years |
A E C G Carlisle | | 23 September 2008 | | 3 years |
S Giacoletto-Roggio | | 4 January 2010 | | 3 years |
A J Allner | | 23 September 2008 | | 3 years |
D Banatao | | 24 November 2009 | | 3 years* |
* Effective from 26 June 2009.
Outside appointments
Executive directors are entitled to accept appointments outside the Company provided that the Chairman’s permission is sought prior to accepting the appointment. Whether or not the director concerned is permitted to retain their fees is considered on a case by case basis.
Audited Information
Directors’ emoluments or fees
The emoluments or fees of the directors serving during the year, for the financial years 2008 and 2009 were as follows:
Emoluments in respect of a person accepting office as a director
| | | | | | | | | | | | | |
| Name of director | | Fees/Basic salary $ | | Benefits-in-kind $ | | Annual bonuses $ | | | Other
emoluments¥ $ | | 2009 total $ | | 2008 total $ |
Executive | | | | | | | | | | | | | |
J D Y Collier | | 529,588 | | 1,753 | | 353,129 | | | – | | 884,470 | | 530,287 |
P G G Goodridge† | | – | | – | | – | | | – | | – | | 112,995 |
J A J van Beurden• | | 672,870 | | 1,753 | | 630,427 | | | – | | 1,305,050 | | 615,084 |
C A Ladas¥ | | 308,231 | | 30,111 | | 241,676 | | | 530,159 | | 1,110,177 | | 801,201 |
D D W Gardiner | | 558,475 | | 1,753 | | 430,173 | | | – | | 990,401 | | 759,249 |
K Chadhap | | 125,000 | | 12,230 | | 120,000 | ‡ | | – | | 257,230 | | – |
| | | | | | | | | | | | | | |
Non-executive | | | | | | | | | | | | | |
D L Tucker* | | 42,743 | | – | | – | | | – | | 42,743 | | 102,733 |
R W Macintosh | | 327,382 | | – | | – | | | – | | 327,382 | | 329,775 |
A E C G Carlisle | | 86,996 | | – | | – | | | – | | 86,996 | | 80,572 |
S Giacoletto-Roggio | | 91,859 | | – | | – | | | – | | 91,859 | | 91,586 |
A J Allner | | 87,552 | | – | | – | | | – | | 87,552 | | 20,788 |
D Banataop | | 41,194 | | – | | – | | | – | | 41,194 | | – |
Total | | 2,871,890 | | 47,600 | | 1,775,405 | | | 530,159 | | 5,225,054 | | 3,444,270 |
The salary and fees for Mr Ladas, Mr Banatao and Mr Chadha were paid in US Dollars.
The salary and fees for other directors were paid in Pounds Sterling but, denominated in US Dollars for reporting purposes, consistent with the accounting policies of the Company.
The fees for Mr Giacoletto-Roggio were paid in US Dollars and then from mid-year onwards were paid in Pounds Sterling.
† Resigned 29 February 2008 remaining employed to 31 May 2008.
• Mr van Beurden received a bonus of £150,000 in February 2009 which was disclosed in 2007 as part of his emoluments in respect of a person accepting office as a director.
CSR plc Annual Report and Financial Statements 2009
82
* Mr Tucker stood down on 27 May 2009.
¥ Other emoluments represents the cost met by the Company for travel to the UK and temporary residence for Mr Ladas, a US citizen and resident in California in connection with the performance of his duties. The benefits are consistent with those provided to Mr Ladas prior to his appointment as an executive director. Mr Ladas heads the Operations function of the Group, a post he has held since 2000 and he is responsible for managing the manufacture and supply of the Company’s products in which capacity he is required to undertake extensive travel around the world.
p The salary and fees paid respectively to Mr Chadha and Mr Banatao are from the date of appointment of 26 June 2009.
‡Following the decision of Mr Chadha to waive his entitlement to a cash bonus, subsequent to 9 February 2010, the Committee determined to allot Mr Chadha 16,580 ordinary shares in the Company, in the form of restricted shares, which, subject to remaining an employee as at 1 March 2011, will be transferred to Mr Chadha at 1 March 2011. There are no further performance conditions applying to the transfer of the restricted shares and Mr Chadha may elect to hold or sell the shares on transfer at 1 March 2011.
Aggregate directors’ remuneration
The aggregate directors’ remuneration was as follows:
| | | | |
| | | 2009 $ | | 2008 $ |
Emoluments | | 5,225,054 | | 3,444,270 |
Gains on exercise of share options | | 986,565 | | 26,000 |
Money purchase pension contributions | | 273,030 | | 240,810 |
| | | 6,484,649 | | 3,711,080 |
Directors’ pension entitlements
Contributions paid or accrued by the Group in respect of the directors during the year were as follows:
| | | | |
| | | 2009 $ | | 2008 $ |
J D Y Collier | | 74,142 | | 76,176 |
P G G Goodridge | | – | | 10,645 |
J A J van Beurden | | 94,202 | | 83,101 |
D D W Gardiner | | 78,186 | | 46,888 |
C A Ladas | | 24,000 | | 24,000 |
K Chadha | | 2,500 | | – |
| | | 273,030 | | 240,810 |
Directors’ share options
Aggregate emoluments disclosed on page 82 do not include any amounts for the value of options to acquire ordinary shares in the Company granted to or held by the directors.
Details of the options exercised by directors and of the gains arising on the exercise of options in the 52 week period to 1 January 2010 and the prior period are shown below:
| | | | | | | | | | | | | | |
Name of director | | Grant description | | Date of exercise | | Number
exercised | | Cost per share
£ | | Market value
per share £ | | Gains on
exercise $ Note(i) | | Gains on exercise 2008 $ |
J D Y Collier | | Founder
Grant | | 2 March 2009 | | 382,002 | | 0.054 | | 1.880 | | 986,565 | | – |
C A Ladas | | Performance
Award | | 4 December 2008 | | 11,234 | | 0.001 | | 1.565 | | – | | 26,000 |
Note (i): The US $ gain represents the number of options exercised multiplied by the market value per share shown in Pounds Sterling and translated at the US $/ Pounds Sterling exchange rate prevailing on the date of exercise.
CSR plc Annual Report and Financial Statements 2009
83
DIRECTORS’ REPORT DIRECTORS’ REMUNERATION REPORT continued
Details of options for directors who served during the year or have been appointed since the year end but prior to the approval of this report are shown below:
| | | | | | | | | | | | | | | | | | | | |
Name of
director | | Scheme | | 2 January 2009 (or date of
appointment) Note (ii) | | Granted | | Exercised | | | Lapsed | | | 1 January 2010 (or date of
appointment) | | Exercise Price £ Note (ii) | | Date from which
exercisable | | Expiry Date |
J D Y Collier | | Founders | | 382,002 | | – | | (382,002) | | | – | | | – | | 0.054 | | 01-Sep-09(i) | | 01-Sep-09 |
| | | Global | | 120,000 | | – | | – | | | – | | | 120,000 | | 0.503 | | 10-May-01(i) | | 10-May-10 |
| | | CSOP | | 75,000 | | – | | – | | | – | | | 75,000 | | 2.000 | | 26-Feb-07(iii) | | 26-Feb-14 |
| | | CSOP | | 62,350 | | – | | – | | | – | | | 62,350 | | 3.210 | | 05-May-08(v) | | 05-May-15 |
| | | Performance award | | 16,940 | | – | | – | | | – | | | 16,940 | | 0.001 | | 05-May-08(vi) | | 05-May-15 |
| | | CSOP | | 24,525 | | – | | – | | | (24,525 | ) | | – | | 9.990 | | 01-Mar-09(vii) | | 01-Mar-16 |
| | | Performance award | | 18,393 | | – | | – | | | (18,393 | ) | | – | | 0.001 | | 01-Mar-09(vi) | | 01-Mar-16 |
| | | Performance award | | 25,122 | | – | | – | | | | | | 25,122 | | 0.001 | | 28-Feb-10(vi) | | 28-Feb-17 |
| | | CSOP | | 33,496 | | – | | – | | | – | | | 33,496 | | 7.680 | | 28-Feb-10(viii) | | 28-Feb-17 |
| | | CSOP | | 87,025 | | – | | – | | | – | | | 87,025 | | 3.160 | | 05-Mar-11(x) | | 05-Mar-18 |
| | | Performance award | | 65,720 | | – | | – | | | – | | | 65,720 | | 0.001 | | 05-Mar-11(vi) | | 05-Mar-18 |
| | | SAYE | | 3,797 | | – | | – | | | – | | | 3,797 | | 2.528 | | 28-Mar-11(iv) | | 28-Sep-11 |
| | | Performance award | | – | | 103,643 | | – | | | – | | | 103,643 | | 0.001 | | 12-Mar-12(xii) | | 12-Mar-19 |
| | | CSOP | | – | | 132,052 | | – | | | – | | | 132,052 | | 2.0825 | | 12-Mar-12(xiii) | | 12-Mar-19 |
J A J van Beurden | | CSOP | | 186,190 | | – | | – | | | – | | | 186,190 | | 6.445 | | 14-Nov-10(x) | | 14-Nov-17 |
| | | Performance award | | 93,603 | | – | | – | | | – | | | 93,603 | | 0.001 | | 14-Nov-10(vi) | | 14-Nov-17 |
| | | Recruitment award | | 25,000 | | – | | – | | | – | | | 25,000 | | 0.001 | | 14-Nov-10(ix) | | 14-Dec-10 |
| | | CSOP | | 94,936 | | – | | – | | | – | | | 94,936 | | 3.160 | | 05-Mar-11(x) | | 05-Mar-18 |
| | | Performance award | | 71,694 | | – | | – | | | – | | | 71,694 | | 0.001 | | 05-Mar-11(vi) | | 05-Mar-18 |
| | | SAYE | | 3,797 | | – | | – | | | (3,797) | | | – | | 2.528 | | 28-Mar-11(iv) | | 28-Sep-11 |
| | | Performance award | | 23,250 | | – | | – | | | – | | | 23,250 | | 0.001 | | 11-Jun-11(vi) | | 11-Jun-18 |
| | | CSOP | | 96,463 | | – | | – | | | – | | | 96,463 | | 3.110 | | 11-Jun-11(x) | | 11-Jun-18 |
| | | Performance award | | – | | 113,065 | | – | | | – | | | 113,065 | | 0.001 | | 12-Mar-12(xii) | | 12-Mar-19 |
| | | CSOP | | – | | 144,057 | | – | | | – | | | 144,057 | | 2.0825 | | 12-Mar-12(xiii) | | 12-Mar-19 |
| | | SAYE | | – | | 5,538 | | – | | | – | | | 5,538 | | 1.625 | | 16-May-12(iv) | | 31-Oct-12 |
C A Ladas | | Global | | 48,751 | | – | | – | | | – | | | 48,751 | | 0.503 | | 15-May-01(i) | | 15-May-10 |
| | | CSOP | | 67,000 | | – | | – | | | – | | | 67,000 | | 2.000 | | 26-Feb-07(iii) | | 26-Feb-14 |
| | | CSOP | | 20,600 | | – | | – | | | – | | | 20,600 | | 3.210 | | 05-May-08(v) | | 05-May-15 |
| | | CSOP | | 11,000 | | – | | – | | | (11,000) | | | – | | 12.410 | | 25-May-09(vii) | | 25-May-16 |
| | | Performance award | | 6,000 | | – | | – | | | (6,000) | | | – | | 0.001 | | 25-May-09(vi) | | 25-May-16 |
| | | Performance award | | 9,132 | | – | | – | | | – | | | 9,132 | | 0.001 | | 05-Jun-10(vi) | | 05-Jun-17 |
| | | CSOP | | 18,264 | | – | | – | | | – | | | 18,264 | | 7.860 | | 05-Jun-10(viii) | | 05-Jun-17 |
| | | CSOP | | 47,798 | | – | | – | | | – | | | 47,798 | | 3.160 | | 05-Mar-11(x) | | 05-Mar-18 |
| | | Performance award | | 36,096 | | – | | – | | | – | | | 36,096 | | 0.001 | | 05-Mar-11(vi) | | 05-Mar-18 |
| | | Performance award | | – | | 81,682 | | – | | | – | | | 81,682 | | 0.001 | | 12-Mar-12(xii) | | 12-Mar-19 |
| | | CSOP | | – | | 104,072 | | – | | | – | | | 104,072 | | 2.0825 | | 12-Mar-12(xiii) | | 12-Mar-19 |
D D W Gardiner | | CSOP | | 279,742 | | – | | – | | | – | | | 279,742 | | 3.110 | | 11-Jun-11(x) | | 11-Jun-18 |
| | | Performance award | | 179,800 | | – | | – | | | – | | | 179,800 | | 0.001 | | 11-Jun-11(vi) | | 11-Jun-18 |
| | | Recruitment award | | 20,000 | | | | – | | | – | | | 20,000 | | 0.001 | | 11-Jun-11(xi) | | 11-Jul-11 |
| | | Performance award | | – | | 109,296 | | – | | | – | | | 109,296 | | 0.001 | | 12-Mar-12(xii) | | 12-Mar-19 |
| | | CSOP | | – | | 139,255 | | – | | | – | | | 139,255 | | 2.0825 | | 12-Mar-12(xiii) | | 12-Mar-19 |
| | | SAYE | | – | | 5,538 | | – | | | – | | | 5,538 | | 1.652 | | 16-May-12(iv) | | 31-Oct-12 |
K Chadha* | | Performance award | | – | | 70,000 | | – | | | – | | | 70,000 | | 0.001 | | 04-Aug-12(xii) | | 04-Aug-19 |
| | | CSOP | | – | | 138,071 | | – | | | – | | | 138,071 | | 4.279 | | 04-Aug-12(xiii) | | 04-Aug-19 |
| | | SiRF Awards | | 18,525 | | – | | – | | | – | | | 18,525 | | 0.001 | | 29-Apr-10(xiv) | | 29-Apr-10 |
| | | SiRF Options | | 214,890 | | – | | – | | | – | | | 214,890 | | 1.65 | | 26-Jun-09(xiv) | | 10-Apr-10 |
| | | SiRF Options | | 57,643 | | – | | – | | | – | | | 57,643 | | 3.29 | | 26-June-09(xiv) | | 17-Dec-11 |
| | | SiRF Options | | 37,049 | | – | | – | | | – | | | 37,049 | | 3.29 | | 26-June-09(xiv) | | 26-Nov-13 |
| | | SiRF Options | | 100,997 | | – | | – | | | – | | | 100,997 | | 10.28 | | 26-Jun-09(xiv) | | 14-Dec-14 |
| | | SiRF Options | | 11,856 | | – | | – | | | – | | | 11,856 | | 20.67 | | 24-Apr-11(xiv) | | 29-Apr-13 |
| | | SiRF Options | | 37,050 | | – | | – | | | – | | | 37,050 | | 4.62 | | 24-Apr-10(xiv) | | 29-Apr-14 |
D Banatao* | | SiRF Options | | 11,578 | | – | | – | | | – | | | 11,578 | | 10.74 | | 26-Jun-09(xiv) | | 20-Jul-10 |
| | | SiRF Options | | 7,827 | | – | | – | | | – | | | 7,827 | | 11.17 | | 26-Jun-09(xiv) | | 18-May-11 |
| | | SiRF Options | | 13,338 | | – | | – | | | – | | | 13,338 | | 29.75 | | 26-Jun-09(xiv) | | 04-May-16 |
| | | SiRF Options | | 13,338 | | – | | – | | | – | | | 13,338 | | 20.00 | | 26-Jun-09(xiv) | | 03-May-17 |
Total | | | | 2,777,577 | | 1,146,269 | | (382,002 | ) | | (63,715) | | | 3,478,129 | | | | | | |
* Appointed 26 June 2009
CSR plc Annual Report and Financial Statements 2009
84
Note (i): Vesting of option 20% on anniversary of grant, then 5% each subsequent calendar quarter end (31 March, 30 June, 30 September, 31 December) for 16 quarters.
Note (ii): Numbers are adjusted to reflect changes to the share capital structure on listing in March 2004.
Note (iii): Options granted to Directors under the CSOP scheme in 2004 vest after three years and have certain performance criteria attached. The options vest in proportions from 10% – 100% dependent upon the EPS achieved by the Group for the year ended 31 December 2006, the target EPS was in the range $0.17 to $0.26. Thereafter the option may be exercised for the rest of its ten year life without further test. The performance condition was satisfied and the options have vested.
Note (iv): Options granted under the SAYE scheme vest after three years and must be exercised within 6 months of vesting date.
Note (v): Options granted under the CSOP scheme vest after three years and have certain performance criteria attached. For options to vest, the EPS growth must be greater than the growth in the RPI plus a compound 4% per annum over a fixed period of three financial years beginning in January 2005. The performance condition was satisfied and the options have vested. Options expire on the 10th anniversary of the date of grant.
Note (vi): Shares granted under the Share Award scheme in 2005, 2006, 2007 and 2008 vest after three years and have certain performance conditions attached. The shares vest in proportions from 30% to 100% dependent on the Company’s TSR against a basket of comparator companies established at the start of the three year period and thereafter only if the Company’s underlying financial performance has improved to the satisfaction of the Remuneration Committee, details of which shall be disclosed to shareholders in reports of the Remuneration Committee subsequent to the determination of the Committee.
Note (vii): Options granted under the CSOP scheme in 2006 also vest after three years and have performance criteria attached. No options will vest if EPS growth is below a compound 12% per annum plus RPI. If the Company’s EPS growth meets or exceeds a compound of 12% per annum plus RPI, 30% of the share options will vest. If the Company’s EPS growth meets or exceeds a compound 14% per annum plus RPI an additional 50% of the share options will vest. If the Company’s EPS growth meets or exceeds a compound 17% per annum plus RPI all options will vest. The performance condition for the grant in 2006 has not been satisfied and therefore the options have lapsed.
Note (viii): Options granted under the CSOP scheme between 1 January 2007 and 31 August 2007 also vest after three years and have performance criteria attached. No options will vest if EPS growth is below a compound 12% per annum plus RPI. If the Company’s EPS growth meets or exceeds a compound of 12% per annum plus RPI, 30% of the share options will vest. If the Company’s EPS growth meets or exceeds a compound 14% per annum plus RPI an additional 50% of the share options will vest. If the Company’s EPS growth meets or exceeds a compound 17% per annum plus RPI all options will vest.
Note (ix): To facilitate the recruitment of Mr van Beurden, the Company agreed to award Mr van Beurden 25,000 ordinary shares in the Company. The award is subject to vesting after the satisfaction of conditions relating to service.
Note (x): Options granted under the CSOP scheme between August 2007 and the end of 2008 also vest after three years and have performance criteria attached. No options will vest if EPS growth is below a compound 5% per annum plus RPI. If the Company’s EPS growth is equal to compound 5% per annum plus RPI, 30% of the share options will vest. For EPS performance above a compound 5% per annum plus RPI up to a compound 12.5% per annum plus RPI, the proportion of shares that shall vest is determined on a straight line basis pro-rata between 30% and 100%. If the Company’s EPS growth over the three year performance period exceeds a compound 12.5% per annum plus RPI, all the options vest.
Note (xi): To facilitate the recruitment of Mr Gardiner, the Company agreed to award Mr Gardiner 20,000 ordinary shares in the Company. The award is subject to vesting after the satisfaction of conditions relating to service.
Note (xii): Awards granted under the Share Award Scheme in 2009 are subject to a three year vesting period and have performance criteria attached. No options will vest if the compound EPS growth is less than 7.5% per annum, adjusted for RPI. 30% vests for a compound growth of 7.5% per annum, adjusted for RPI and full vesting occurs for a compound EPS growth of 15% per annum adjusted for RPI. Share awards vest on a straight line basis for a compound EPS growth between 7.5% and 15% adjusted for RPI.
Note (xiii): Grants made in 2009 under the CSOP scheme are subject to a three year vesting period and have a performance condition attached. This is based on the relative TSR of the Company against a basket of comparator companies established at the start of the vesting period. The shares vest in proportions from 30% to 100% dependent on the Company’s TSR against that basket of comparator companies.
Note (xiv): SiRF Options and Awards are replacement options rolled over from the acquisition of SiRF Technology Holdings Inc at a conversion ratio and exchange rate specified in the merger agreement. The vesting of each of these grants is not subject to the fulfilment of performance conditions, which is consistent with the prevailing rules of the schemes under which the grants were made.
Note (xv): Mr Chadha participates in an Employee Share Purchase Plan which commenced on 6 November 2009. Mr Chadha has elected to contribute the maximum amounts as allowed under IRS rules into the plan which state that a maximum of 10% of salary can be contributed, capped at $5,000.
The market price of the ordinary shares at 1 January 2010 was £4.09 and the range during the year was £1.57 to £5.08.
This report was approved by the Board of directors and signed on its behalf by:
S Giacoletto-Roggio
Chairman, Remuneration Committee
9 February 2010
CSR plc Annual Report and Financial Statements 2009
85
DIRECTORS’ REPORTOTHER STATUTORY INFORMATION
|
| |
Directors’ report – Other statutory information |
The directors submit this Annual Report and the audited consolidated financial statements of the Company and its subsidiaries for the 52 week period ended 1 January 2010.
Activities and business review
CSR is a leading developer and provider of single chip wireless solutions designed to support data and voice communications between a wide range of products over short range radio links. More detailed information on the principal activities of CSR plc and its subsidiaries, together with a review of the businesses and a description of the principal risks and uncertainties facing the Group along with other information that fulfils the requirements of the Business and Financial Review are set out on pages 8 to 44 and 45 to 57. Some information required by applicable US securities laws is set out in the section entitled “Corporate and Share Information”. The use of financial instruments is covered within the Directors’ Report – Business and Financial Review. Details of the subsidiaries and branches of the Company are set out in note 42 on page 151.
Financial results
For a discussion of our financial results, please refer to the Directors’ Report – Business and Financial Review on pages 8 to 44.
Our operating loss for 2009 was $15.9 million compared to a loss of $8.5 million in 2008 (2007: profit of $150.1 million). The underlying operating profit for 2009 decreased to $26.9 million compared to $72.8 million in 2008 (2007: underlying operating profit of $181.3 million). Underlying operating profit is a non-GAAP measure; an explanation of our use of non-GAAP measures is given on page 15. Revenue showed a decrease of 13% to $601.4 million from $694.9 million for the 52 week period to 1 January 2010 and underlying diluted earnings per share were $0.20 down from $0.49 for the 52 week period to 1 January 2010. Basic and diluted earnings per share were a loss of $0.07 for 2009, compared to basic and diluted loss per share of $0.05 for 2008.
In accordance with stated policy, explained on page 28, no dividend will be paid in respect of the 52 weeks ended 1 January 2010 (2008: nil).
Future development
It remains the Board’s intention to develop the Group through organic growth and selective acquisition.
Directors of the Board
The directors who served during the year are detailed on page 62 of the Directors Report – Corporate Governance.
Change of control
All of the Company’s share schemes contain provisions relating to a change of control of the Company following a takeover. Outstanding options and awards would, subject to satisfaction of applicable performance conditions and certain rules of the particular schemes normally vest and become exercisable on a change of control (subject to a pro-rata adjustment reflecting the time elapsed since the month in which the grant was made).
Share capital
The Company’s ordinary shares with a nominal value of 0.1p per share, are quoted on the London Stock Exchange. The rights and obligations attaching to the Company’s ordinary shares are set out in the Company’s Articles of Association, copies of which can be obtained from Companies House in the UK or by writing to the Company Secretary. There are no restrictions on the voting rights attaching to the Company’s ordinary shares. No person holds securities in the Company carrying special rights with regard to control of the Company. The Company is not aware of any agreements between holders of securities that may result in restrictions on the transfer of securities or on voting rights. Unless expressly stated to the contrary in the Articles of Association of the Company, the Company’s Articles of Association may be amended by special resolution of the Company’s shareholders. A summary of the Company’s Articles of Association are set out on pages 160 to 165.
During the 52 weeks ended 1 January 2010, options were exercised pursuant to the Company’s share schemes. The number of shares allotted and the consideration received in respect of such allotments are detailed in note 24 of the Financial Statements beginning on page 128.
ABI Guidelines relating to directors’ power to allot share capital and disapply pre-emption rights, are reflected in Resolution 10 (the “Section 551 Authority”) and Resolution 11 respectively, in the Notice of Meeting.
CSR plc Annual Report and Financial Statements 2009
86
The directors propose (Paragraph (A) of Resolution 10 in the Notice of Meeting) to renew the authority granted at the 2009 Annual General Meeting to authorise the directors to allot equity or grant rights in respect of equity shares up to an aggregate nominal value of £61,029 (representing approximately one-third of the ordinary shares issued as at the latest practicable date).
In accordance with ABI Guidelines, the directors also propose (Paragraph (B) of Resolution 10 in the Notice of Meeting) to renew the authority granted at the 2009 Annual General Meeting to authorise the directors to allot or grant rights in respect of equity shares representing two-thirds of the Company’s issued share capital as at the latest practicable date (as reduced by the nominal amount of any allotment or grant made under paragraph (A) of Resolution 10) in the case of a compensatory rights issue. This authority, if renewed, will represent in total an aggregate nominal value of £122,058. This Section 551 Authority, if approved, will expire at the conclusion of the Annual General Meeting to be held in 2011 or 19 August 2011, whichever is the earlier.
The limited power granted to the directors at the 2009 Annual General Meeting to allot equity shares for cash other than pro-rata to existing shareholders expires on the conclusion of this year’s Annual General Meeting to be held on 19 May 2010. Subject to renewal of the Section 551 Authority, the directors recommend (Resolution 11 in the Notice of Meeting) that this authority also be renewed so as to give the directors the ability (until the earlier of 19 August 2011, or the conclusion of the Annual General Meeting to be held in 2011) to issue equity shares for cash other than pro-rata to existing shareholders, in connection with a rights issue or up to a limit of 5% of the ordinary shares issued at the 1 March 2010. The directors have no present intention to issue equity shares for cash other than pursuant to the Company’s employee share schemes.
The directors recommend that you vote in favour of Resolutions 10 and 11 to maintain the Company’s flexibility in relation to future share issues, including any issues to finance business opportunities should appropriate circumstances arise.
A Special Resolution will be proposed (Resolution 12 in the Notice of Meeting) to renew the directors’
limited authority to repurchase ordinary shares in the market. This authority will be limited to a maximum of 18,308,724 ordinary shares (representing 10% of the Company’s issued share capital as at the latest practicable date) and also sets the minimum and maximum prices which may be paid.
The directors believe it is advantageous for the Company to have the flexibility to make market purchases of its own shares. In the event that shares are purchased, they would either be cancelled (and the number in issue would be reduced accordingly) or, subject to the legislation referred to below, retained as treasury shares. The directors will only make purchases after consideration of the possible effect on earnings per share, the long term benefits to shareholders and consultation with advisers. The directors have no present intention to purchase shares in the Company.
The Companies (Acquisition of Own Shares) (Treasury Shares) Regulations 2003 allow shares repurchased by the Company to be held as treasury shares that may be cancelled, sold for cash or used for the purpose of employee share schemes. The Company currently holds no shares in treasury. The authority contained in the Special Resolution will expire at the earlier of 19 August 2011, or the conclusion of the Annual General Meeting to be held in 2011. It is the current intention of the directors to renew this authority annually.
New Articles of Association
Following final implementation of the Companies Act 2006, and the coming into force of the Companies (Shareholders Rights) Regulations 2009, the directors are seeking approval for the adoption of new articles of association.
The principal changes introduced in the new articles are summarised in the Appendix to the Notice of Annual General Meeting. Other changes, which are of a minor, technical or clarifying nature and also some more minor changes which merely reflect changes made by the Companies Act 2006 or the Shareholders’ Rights Regulations, or conform the language of the new articles with that used in the model articles for public companies produced by the Department for Business, Innovation and Skills have not been noted in the Appendix. The new articles showing all changes to the current articles are available for inspection, at the Company’s registered
CSR plc Annual Report and Financial Statements 2009
87
DIRECTORS’ REPORTOTHER STATUTORY INFORMATION continued
office during normal working hours on a weekday (except Saturdays, Sundays and public holidays) until the Annual General Meeting and at the Annual General Meeting location from 15 minutes before the Annual General Meeting until it ends.
Notice required for shareholder meetings
The Shareholders Rights Directive was implemented in the UK by the Companies (Shareholders’ Rights) Regulations 2009 on 3 August 2009. The Regulations implementing this Directive increase the notice period for general meetings of the Company to 21 days, unless shareholders agree to a shorter notice period. On the basis of a resolution passed at the 2009 Annual General Meeting, the Company is currently able to call general meetings (other than an annual general meeting) on 14 days’ notice and would like to preserve this ability. Resolution 14 seeks such approval. The approval will be effective until the Company’s next annual general meeting, when it is intended that a similar resolution will be proposed. In accordance with the Directive, the Company will offer an electronic voting facility for a general meeting called on 14 days’ notice.
Employee Benefit Trust
The CSR Employee Benefit Trust was established in 2007 to facilitate satisfying the issue of shares to employees within the Group on exercise of vested options under the various share option plans of the Company.
During 2009, no ordinary shares in CSR plc were acquired by the Trust. The details of the purchases in prior years of ordinary shares in CSR plc is shown in note 25 to the Financial Statements on page 132. The Trust holds a total of 4,689,580 ordinary shares in CSR plc representing 2.57% of the issued share capital at the date of this report.
As participants in the share options plans, the executive directors of the Company are potential beneficiaries from the shares held by the Trust and are therefore regarded for the purposes of the Companies Act as being interested in ordinary shares held by the Trust.
Directors
Details of the directors of the Board who served during the year are contained on page 62. Biographies of the directors in office at 1 January 2010 are on pages 59 and 60.
Pursuant to the Company’s Articles of Association a director shall retire from office and may offer himself for re-appointment when they have been appointed since the last Annual General Meeting, held office in the preceding two annual general meetings and did not retire at either of them or has been in office for a continuous period of nine years or more at the date of the meeting.
In accordance with the Articles of Association, the directors retiring at the Annual General Meeting will include Mr Kanwar Chadha, executive director and Chief Marketing Officer, and Mr Diosdado Banatao, a non-executive director, as they have been appointed since the last meeting. Being eligible, Mr Chadha and Mr Banatao offer themselves for election.
Mr Ron Mackintosh, non-executive director and Chairman of the Board, and Mr Sergio Giacoletto-Roggio, non-executive director and Chairman of the Remuneration Committee, will also be retiring and, being eligible, offer themselves for re-appointment. The directors considered the performance of Mr Mackintosh and Mr Giacoletto-Roggio in connection with their re-appointment and determined they had performed well. Accordingly, the Board supports Mr Mackintosh’s and Mr Giacoletto-Roggio’s submission for re-appointment.
The interests of the executive directors in the options of the Company are detailed in the Remuneration Report on page 84.
Directors’ interests in shares
The directors in office at 1 January 2010 and their families had the under-mentioned interests in the ordinary shares of the Company.
| | | | |
| | | 1 January
2010 | | 2 January
2009 |
Andrew Allner | | 2,850 | | – |
Diosdado Banatao | | 1,590,049 | | – |
Joep van Beurden | | – | | – |
Anthony Carlisle | | 4,000 | | 4,000 |
Kanwar Chadha | | 633,510 | | – |
James Collier | | 1,019,163 | | 1,014,911 |
Will Gardiner | | – | | – |
Sergio Giacoletto-Roggio | | 5,000 | | 5,000 |
Chris Ladas | | 86,234 | | 86,234 |
Ron Mackintosh | | 125,000 | | 100,000 |
CSR plc Annual Report and Financial Statements 2009
88
There were no changes to the directors’ shareholdings between 1 January 2010 and 9 February 2010. The foregoing holdings do not include the ordinary shares held by the CSR Employee Benefit Trust in which the executive directors are potential beneficiaries as disclosed earlier.
Conflicts of interests
The Company has procedures in place to deal with conflicts of interests and believes that procedures are operated efficiently.
Payment of creditors
The Group agrees payment terms with its suppliers when it enters into binding purchase contracts to ensure that suppliers are made aware of terms of payment. The Company abides by these terms of payment. At 1 January 2010 the number of creditor days outstanding for the Company was 30 (2008: 30) and for the Group was 61 (2008: 64).
Donations
The Company and employees support a number of charities for a variety of causes. For the period ended 1 January 2010, the Company made charitable donations totalling $6,550 to charities local to the Group’s operations. The Company did not make any political donations during the year.
Directors’ responsibility statement
The directors are responsible for preparing the Annual Report and the financial statements in accordance with applicable law and regulations.
Company law requires the directors to prepare financial statements for each financial year. Under that law the directors are required to prepare the Group financial statements in accordance with International Financial Reporting Standards (IFRSs) as adopted by the European Union and Article 4 of the IAS Regulation and have also chosen to prepare the Company financial statements under IFRSs as adopted by the EU. The financial statements are also prepared in accordance with the IFRS as issued by the International Accounting Standards Board. Under company law the directors must not approve the accounts unless they are satisfied that they give a true and fair view of the state of affairs of the company and of the profit or loss of the company for that period. In
preparing these financial statements, International Accounting Standard 1 requires that directors:
| | · | | properly select and apply accounting policies; |
| | · | | present information, including accounting policies, in a manner that provides relevant, reliable, comparable and understandable information; |
| | · | | provide additional disclosures when compliance with the specific requirements in IFRSs are insufficient to enable users to understand the impact of particular transactions, other events and conditions on the entity’s financial position and financial performance; and |
| | · | | make an assessment of the company’s ability to continue as a going concern. |
The directors are responsible for keeping adequate accounting records that are sufficient to show and explain the company’s transactions and disclose with reasonable accuracy at any time the financial position of the company and enable them to ensure that the financial statements comply with the Companies Act 2006. They are also responsible for safeguarding the assets of the company and hence for taking reasonable steps for the prevention and detection of fraud and other irregularities.
The directors are responsible for the maintenance and integrity of the corporate and financial information included on the Company’s website. Legislation in the United Kingdom governing the preparation and dissemination of financial statements may differ from legislation in other jurisdictions.
Each of the persons who is a director at the date of the approval of this report confirms that:
| | · | | so far as the director is aware, there is no relevant audit information of which the Company’s auditors are unaware, |
| | · | | the director has taken all the steps that he ought to have taken as a director to make himself aware of the relevant audit information and to establish that the Company’s auditors are aware of that information. |
CSR plc Annual Report and Financial Statements 2009
89
DIRECTORS’ REPORTOTHER STATUTORY INFORMATION continued
| | · | | the Financial Statements, prepared in accordance with the applicable set of accounting standards, give a true and fair view of the assets, liabilities, financial position and profit of CSR and the undertakings included in the consolidation taken as a whole; and |
| | · | | the report includes a fair review of the development and performance of the business and the position of the Company and the undertakings included in the consolidation taken as a whole together with a description of the principal risks and uncertainties that they face. |
The directors, having prepared the Financial Statements, have permitted the auditors to take whatever steps they consider appropriate for the purpose of enabling them to give their audit opinion.
Substantial shareholdings
As at the dates shown below, the Company had received the following notifications of substantial interests (3% or more) in the total voting rights of the Company, as disclosed to the Company under the Disclosure and Transparency Rules.
| | | | | |
| | | Disclosed Holding† | | | % of issued Ordinary share capital |
The BlackRock Group | | 23,335,886 | ‡ | | 12.75 |
| Schroders Plc and its subsidiaries | | 22,557,170 | | | 12.32 |
Fidelity | | 9,520,363 | | | 5.20 |
| Majedie Asset Management Limited | | 7,170,285 | | | 3.92 |
| Legal & General Group plc and its subsidiaries | | 6,803,525 | | | 3.72 |
Norges Bank | | 6,158,306 | | | 3.37 |
† at 1 March 2010
‡ at 9 March 2010
Going concern
The Financial Statements have been prepared on the going concern basis. The directors have considered future cash forecasts and revenue projections, based on prudent market data, in their consideration of going concern.
The Group’s business activities, together with the factors likely to affect its future development, performance and position are set out on pages 8 to 57. The financial position of the Group, its cash flows and liquidity position are described in the Business and Financial Review on pages 26 to 29. In addition, note 33 to the Consolidated Financial Statements includes the Group’s objectives, policies and processes for managing its capital; its financial risk management objectives; details of the financial instruments and hedging activities; and its exposure to credit risk. The principal risks and uncertainties which could adversely impact the long term performance of the Group are discussed on pages 45 to 57 in the Business and Financial Review. All of these matters have been taken into account by the directors in coming to their conclusions on going concern.
Management is currently of the opinion that the Group has adequate financial resources and a robust policy towards treasury risk and cash flow management. The directors believe that the Group is adequately placed to manage its business risks successfully despite the current uncertain economic outlook and challenging macro economic conditions.
After making enquiries, the directors have a reasonable expectation that the Company and the Group have adequate resources to continue in operational existence for the foreseeable future. Accordingly, they continue to adopt the going concern basis in preparing the Annual Report and Financial Statements.
Auditors
Deloitte LLP are the Company’s auditors and have expressed their willingness to continue in the office of auditors and therefore, in accordance with Section 418 of the Companies Act 2006, a resolution for their re-appointment will be proposed at the forthcoming Annual General Meeting.
By Order of the Board
Brett Gladden
Company Secretary
9 February 2010
CSR plc Annual Report and Financial Statements 2009
90
INDEPENDENT AUDITORS’ REPORT TO THE MEMBERS OF CSR PLC
We have audited the financial statements of CSR plc for the 52 week period ended 1 January 2010 which comprise the consolidated income statement, the consolidated and parent Company balance sheets, the consolidated and parent Company cash flow statements, the consolidated and parent Company statement of comprehensive income, the consolidated and parent Company statement of changes in equity, and the related notes 1 to 49. The financial reporting framework that has been applied in their preparation is applicable law and International Financial Reporting Standards (IFRSs) as adopted by the European Union and as regards the parent Company financial statements, as applied in accordance with the provisions of the Companies Act 2006.
This report is made solely to the Company’s members, as a body, in accordance with Chapter 3 of Part 16 of the Companies Act 2006. Our audit work has been undertaken so that we might state to the Company’s members those matters we are required to state to them in an auditors’ report and for no other purpose. To the fullest extent permitted by law, we do not accept or assume responsibility to anyone other than the Company and the Company’s members as a body, for our audit work, for this report, or for the opinions we have formed.
Respective responsibilities of directors and auditors
As explained more fully in the Directors’ Responsibilities Statement, the directors are responsible for the preparation of the financial statements and for being satisfied that they give a true and fair view. Our responsibility is to audit the financial statements in accordance with applicable law and International Standards on Auditing (UK and Ireland). Those standards require us to comply with the Auditing Practices Board’s (APB’s) Ethical Standards for Auditors.
Scope of the audit of the financial statements
An audit involves obtaining evidence about the amounts and disclosures in the financial statements sufficient to give reasonable assurance that the financial statements are free from material misstatement, whether caused by fraud or error. This includes an assessment of: whether the accounting policies are appropriate to the Group’s and the parent Company’s circumstances and have been consistently applied and adequately disclosed; the reasonableness of significant accounting estimates made by the directors; and the overall presentation of the financial statements.
Opinion on financial statements
In our opinion:
| | · | | the financial statements give a true and fair view of the state of the Group’s and of the parent Company’s affairs as at 1 January 2010 and of the Group’s loss for the 52 week period then ended; |
| | · | | the Group financial statements have been properly prepared in accordance with IFRSs as adopted by the European Union; |
| | · | | the parent Company financial statements have been properly prepared in accordance with IFRSs as adopted by the European Union and as applied in accordance with the provisions of the Companies Act 2006; and |
| | · | | the financial statements have been prepared in accordance with the requirements of the Companies Act 2006 and, as regards the Group financial statements, Article 4 of the IAS Regulation. |
Separate opinion in relation to IFRSs as issued by the IASB
As explained in note 3 to the Group financial statements, the Group in addition to complying with its legal obligation to apply IFRSs as adopted by the European Union, has also applied IFRSs as issued by the International Accounting Standards Board (IASB).
In our opinion the Group financial statements comply with IFRSs as issued by the IASB.
Opinion on other matters prescribed by the Companies Act 2006
In our opinion:
| | · | | the part of the Directors’ Remuneration Report to be audited has been properly prepared in accordance with the Companies Act 2006; and |
| | · | | the information given in the Directors’ Report for the financial year for which the financial statements are prepared is consistent with the financial statements. |
CSR plc Annual Report and Financial Statements 2009
91
INDEPENDENT AUDITORS’ REPORT TO THE MEMBERS OF CSR PLC continued
Matters on which we are required to report by exception
We have nothing to report in respect of the following:
Under the Companies Act 2006 we are required to report to you if, in our opinion:
| | · | | adequate accounting records have not been kept by the parent Company, or returns adequate for our audit have not been received from branches not visited by us; or |
| | · | | the parent Company financial statements and the part of the Directors’ Remuneration Report to be audited are not in agreement with the accounting records and returns; or |
| | · | | certain disclosures of directors’ remuneration specified by law are not made; or |
| | · | | we have not received all the information and explanations we require for our audit. |
Under the Listing Rules we are required to review:
| | · | | the directors’ statement contained within the Directors’ Report in relation to going concern; and |
| | · | | the part of the Corporate Governance Statement relating to the Company’s compliance with the nine provisions of the June 2008 Combined Code specified for our review. |
Panos Kakoullis (Senior Statutory Auditor)
for and on behalf of Deloitte LLP
Chartered Accountants and Statutory Auditors
London, United Kingdom
9 February 2010
CSR plc Annual Report and Financial Statements 2009
92
CONSOLIDATED INCOME STATEMENT52 weeks ended 1 January 2010
| | | | | | | | | | | |
| | | | | 52 weeks ended 1 January 2010 | | | 53 weeks ended
2 January 2009 | | | 52 weeks ended 28 December 2007 | |
| | | Notes | | $’000 | | | $’000 | | | $’000 | |
Revenue | | 5,6 | | 601,399 | | | 694,865 | | | 848,622 | |
Cost of sales | | | | (333,099 | ) | | (385,037 | ) | | (452,348 | ) |
Gross profit | | | | 268,300 | | | 309,828 | | | 396,274 | |
Research and development (“R&D”) expenses: | | | | | | | | | | | |
Other research and development | | | | (155,462 | ) | | (147,964 | ) | | (135,154 | ) |
Share-based payment charges | | | | (6,763 | ) | | (4,785 | ) | | (5,778 | ) |
Amortisation of acquired intangible assets | | | | (7,488 | ) | | (5,418 | ) | | (6,609 | ) |
Total research and development expenses | | | | (169,713 | ) | | (158,167 | ) | | (147,541 | ) |
Sales, marketing and administrative expenses (“SG&A”): | | | | | | | | | | | |
Other sales, marketing and administrative expenses | | | | (85,905 | ) | | (89,034 | ) | | (79,859 | ) |
Share-based payment charges | | | | (3,818 | ) | | (2,801 | ) | | (3,497 | ) |
Amortisation of acquired intangible assets | | | | (1,979 | ) | | – | | | – | |
Integration and restructuring expenses | | 29 | | (12,227 | ) | | (14,445 | ) | | – | |
Acquisition-related fees | | | | (10,572 | ) | | – | | | – | |
Deferred tax adjustment to goodwill | | | | – | | | (978 | ) | | (279 | ) |
Asset impairment | | 30 | | – | | | (52,918 | ) | | – | |
Patent dispute settlement | | 36 | | – | | | – | | | (15,000 | ) |
Total sales, marketing and administrative expenses | | | | (114,501 | ) | | (160,176 | ) | | (98,635 | ) |
Operating (loss) profit | | | | (15,914 | ) | | (8,515 | ) | | 150,098 | |
Investment income | | 5 | | 1,915 | | | 6,139 | | | 7,938 | |
Finance costs | | 10 | | (243 | ) | | (4,075 | ) | | (2,437 | ) |
(Loss) profit before tax | | | | (14,242 | ) | | (6,451 | ) | | 155,599 | |
Tax | | 11 | | 2,933 | | | (488 | ) | | (42,795 | ) |
(Loss) profit for the period | | 7 | | (11,309 | ) | | (6,939 | ) | | 112,804 | |
(Loss) earnings per share | | | | $ | | | $ | | | $ | |
Basic | | 12 | | (0.07 | ) | | (0.05 | ) | | 0.86 | |
| | | | | | | | | | | | |
Diluted | | 12 | | (0.07 | ) | | (0.05 | ) | | 0.83 | |
The results were all derived from continuing operations. The loss for the period and losses and profits for the prior periods is wholly attributable to equity holders of the parent company, CSR plc.
CONSOLIDATED STATEMENT OF COMPREHENSIVE INCOME52 weeks ended 1 January 2010
| | | | | | | | | | | |
| | | | | 52 weeks ended 1 January 2010 | | | 53 weeks ended 2 January 2009 | | | 52 weeks ended 28 December 2007 | |
| | | Notes | | $’000 | | | $’000 | | | $’000 | |
(Loss) profit for the period | | | | (11,309 | ) | | (6,939 | ) | | 112,804 | |
Other comprehensive income | | | | | | | | | | | |
Gain (loss) on cash flow hedges | | 25 | | 34,228 | | | (31,677 | ) | | (4,906 | ) |
Adjustments to deferred tax from reduced UK tax rates | | | | – | | | – | | | (11 | ) |
Net tax on cash flow hedges in equity | | 25 | | (9,589 | ) | | 8,930 | | | 1,382 | |
Transferred to income statement in respect of cash flow hedges | | 25 | | (5,463 | ) | | 7,316 | | | 836 | |
Tax on items transferred from equity | | 25 | | 1,530 | | | (2,052 | ) | | (225 | ) |
Total comprehensive income (loss) for the period | | | | 9,397 | | | (24,422 | ) | | 109,880 | |
CSR plc Annual Report and Financial Statements 2009
93
CONSOLIDATED BALANCE SHEET1 January 2010
| | | | | | | | | | | |
| | | | | 1 January
2010 | | | 2 January
2009 | | | 28 December
2007 | |
| | | Notes | | $’000 | | | $’000 | | | $’000 | |
Non-current assets | | | | | | | | | | | |
Goodwill | | 13 | | 221,451 | | | 106,322 | | | 144,207 | |
Other intangible assets | | 14 | | 44,974 | | | 20,797 | | | 45,144 | |
Property, plant and equipment | | 15 | | 40,551 | | | 48,173 | | | 52,924 | |
Deferred tax asset | | 19 | | 4,341 | | | 6,481 | | | 7,021 | |
| | | | | 311,317 | | | 181,773 | | | 249,296 | |
Current assets | | | | | | | | | | | |
Inventories | | 16 | | 72,345 | | | 66,201 | | | 77,256 | |
Derivative financial instruments | | 18 | | 2,397 | | | – | | | 696 | |
Trade and other receivables | | 17 | | 99,347 | | | 80,417 | | | 97,019 | |
Corporation tax debtor | | | | 5,433 | | | 1,392 | | | 187 | |
Treasury deposits and investments | | 17 | | 241,763 | | | 81,000 | | | 52,065 | |
Cash and cash equivalents | | 17 | | 170,601 | | | 180,898 | | | 193,311 | |
| | | | | 591,886 | | | 409,908 | | | 420,534 | |
Total assets | | | | 903,203 | | | 591,681 | | | 669,830 | |
| | | | |
Current liabilities | | | | | | | | | | | |
Trade and other payables | | 21 | | 116,366 | | | 62,170 | | | 93,376 | |
Current tax liabilities | | | | 1,332 | | | 1,648 | | | 26,851 | |
Obligations under finance leases | | 20 | | 326 | | | 1,057 | | | 3,108 | |
Derivative financial instruments | | 18 | | 230 | | | 32,062 | | | 1,080 | |
Provisions | | 23 | | 8,122 | | | 4,408 | | | 2,414 | |
Contingent consideration | | 22 | | – | | | 753 | | | 25,988 | |
| | | | | 126,376 | | | 102,098 | | | 152,817 | |
Net current assets | | | | 465,510 | | | 307,810 | | | 267,717 | |
| | | | |
Non-current liabilities | | | | | | | | | | | |
Deferred tax liability | | 19 | | – | | | 4,002 | | | 8,208 | |
Contingent consideration | | 22 | | – | | | 16,747 | | | – | |
Long-term provisions | | 23 | | 2,716 | | | 1,795 | | | – | |
Obligations under finance leases | | 20 | | – | | | 293 | | | 142 | |
| | | | | 2,716 | | | 22,837 | | | 8,350 | |
Total liabilities | | | | 129,092 | | | 124,935 | | | 161,167 | |
Net assets | | | | 774,111 | | | 466,746 | | | 508,663 | |
| | | | |
Equity | | | | | | | | | | | |
Share capital | | 24 | | 318 | | | 238 | | | 236 | |
Share premium account | | 25 | | 363,032 | | | 91,448 | | | 89,926 | |
Capital redemption reserve | | 25 | | 950 | | | 950 | | | 950 | |
Merger reserve | | 25 | | 61,574 | | | 61,574 | | | 61,574 | |
Employee benefit trust reserve | | 25 | | (40,224 | ) | | (40,224 | ) | | (20,025 | ) |
Hedging reserve | | 25 | | 3,505 | | | (25,260 | ) | | (899 | ) |
Share-based payment reserve | | 25 | | 48,446 | | | 27,864 | | | 20,278 | |
Tax reserve | | 25 | | 33,433 | | | 35,770 | | | 35,298 | |
Retained earnings | | 25 | | 303,077 | | | 314,386 | | | 321,325 | |
Total equity | | | | 774,111 | | | 466,746 | | | 508,663 | |
The financial statements of CSR plc, registered number 4187346, were approved by the Board of directors and authorised for issue.
They were signed on its behalf by:
| | | | | | |
| Will Gardiner | | | | Ron Mackintosh | | |
| 9 February 2010 | | | | 9 February 2010 | | |
CSR plc Annual Report and Financial Statements 2009
94
CONSOLIDATED STATEMENT OF CHANGES IN EQUITY
Equity attributable to equity holders of the Company
| | | | | | | | | | | | | | | | | | | | | | | | | |
| | | Called-up
share
capital | | Share
premium
account | | Capital
redemption
reserve | | Merger
reserve | | Employee
Benefit
Trust
Reserve | | | Hedging
reserve | | | Share-
based
payment
reserve | | Tax
reserve | | | Retained
earnings | | | Total | |
| | | $’000 | | $’000 | | $’000 | | $’000 | | $’000 | | | $’000 | | | $’000 | | $’000 | | | $’000 | | | $’000 | |
At 2 January 2009 | | 238 | | 91,448 | | 950 | | 61,574 | | (40,224 | ) | | (25,260 | ) | | 27,864 | | 35,770 | | | 314,386 | | | 466,746 | |
Loss for the period | | – | | – | | – | | – | | – | | | – | | | – | | – | | | (11,309 | ) | | (11,309 | ) |
Other comprehensive income for the period | | – | | – | | – | | – | | – | | | 28,765 | | | – | | (8,059 | ) | | – | | | 20,706 | |
Total comprehensive income for the period | | – | | – | | – | | – | | – | | | 28,765 | | | – | | (8,059 | ) | | (11,309 | ) | | 9,397 | |
Share issues | | 80 | | 271,584 | | – | | – | | – | | | – | | | – | | – | | | – | | | 271,664 | |
Credit to equity for equity-settled share-based payments | | – | | – | | – | | – | | – | | | – | | | 10,581 | | – | | | – | | | 10,581 | |
Credit to equity for equity-settled share-based payments issued on acquisitions | | – | | – | | – | | – | | – | | | – | | | 10,001 | | – | | | – | | | 10,001 | |
Current tax benefit taken directly to equity on share option gains | | – | | – | | – | | – | | – | | | – | | | – | | 2,648 | | | – | | | 2,648 | |
Deferred tax on share-based payment transactions | | – | | – | | – | | – | | – | | | – | | | – | | 3,074 | | | – | | | 3,074 | |
At 1 January 2010 | | 318 | | 363,032 | | 950 | | 61,574 | | (40,224 | ) | | 3,505 | | | 48,446 | | 33,433 | | | 303,077 | | | 774,111 | |
| | | | | | | | | | |
At 28 December 2007 | | 236 | | 89,926 | | 950 | | 61,574 | | (20,025 | ) | | (899 | ) | | 20,278 | | 35,298 | | | 321,325 | | | 508,663 | |
Loss for the period | | – | | – | | – | | – | | – | | | – | | | – | | – | | | (6,939 | ) | | (6,939 | ) |
Other comprehensive income for the period | | – | | – | | – | | – | | – | | | (24,361 | ) | | – | | 6,878 | | | – | | | (17,483 | ) |
Total comprehensive income for the period | | – | | – | | – | | – | | – | | | (24,361 | ) | | – | | 6,878 | | | (6,939 | ) | | (24,422 | ) |
Share issues | | 2 | | 1,522 | | – | | – | | – | | | – | | | – | | – | | | – | | | 1,524 | |
Credit to equity for equity-settled share-based payments | | – | | – | | – | | – | | – | | | – | | | 7,586 | | – | | | – | | | 7,586 | |
Current tax benefit taken directly to equity on share option gains | | – | | – | | – | | – | | – | | | – | | | – | | 1,359 | | | – | | | 1,359 | |
Deferred tax on share-based payment transactions | | – | | – | | – | | – | | – | | | – | | | – | | (7,765 | ) | | – | | | (7,765 | ) |
Purchase of own shares | | – | | – | | – | | – | | (20,199 | ) | | – | | | – | | – | | | – | | | (20,199 | ) |
At 2 January 2009 | | 238 | | 91,448 | | 950 | | 61,574 | | (40,224 | ) | | (25,260 | ) | | 27,864 | | 35,770 | | | 314,386 | | | 466,746 | |
| | | | | | | | | | |
At 30 December 2006 | | 232 | | 84,111 | | 950 | | 61,574 | | – | | | 3,171 | | | 11,003 | | 36,647 | | | 208,521 | | | 406,209 | |
Loss for the period | | – | | – | | – | | – | | – | | | – | | | – | | – | | | 112,804 | | | 112,804 | |
Other comprehensive income for the period | | – | | – | | – | | – | | – | | | (4,070 | ) | | – | | 1,146 | | | – | | | (2,924 | ) |
Total comprehensive income for the period | | – | | – | | – | | – | | – | | | (4,070 | ) | | – | | 1,146 | | | 112,804 | | | 109,880 | |
Share issues | | 4 | | 5,815 | | – | | – | | – | | | – | | | – | | – | | | – | | | 5,819 | |
Credit to equity for equity-settled share-based payments | | – | | – | | – | | – | | – | | | – | | | 9,275 | | – | | | – | | | 9,275 | |
Current tax benefit taken directly to equity on share option gains | | – | | – | | – | | – | | – | | | – | | | – | | 5,511 | | | – | | | 5,511 | |
Effective tax rate adjustment | | – | | – | | – | | – | | – | | | – | | | – | | (772 | ) | | | | | (772 | ) |
Deferred tax on share-based payment transactions | | – | | – | | – | | – | | – | | | – | | | – | | (7,234 | ) | | – | | | (7,234 | ) |
Purchase of own shares | | – | | – | | – | | – | | (20,025 | ) | | – | | | – | | – | | | – | | | (20,025 | ) |
At 28 December 2007 | | 236 | | 89,926 | | 950 | | 61,574 | | (20,025 | ) | | (899 | ) | | 20,278 | | 35,298 | | | 321,325 | | | 508,663 | |
CSR plc Annual Report and Financial Statements 2009
95
CONSOLIDATED CASH FLOW STATEMENT52 weeks ended 1 January 2010
| | | | | | | | | | | |
| | | | | 52 weeks
ended
1 January
2010 | | | 53 weeks
ended
2 January
2009 | | | 52 weeks
ended
28 December
2007 | |
| | | Notes | | $’000 | | | $’000 | | | $’000 | |
Net cash from operating activities | | 26 | | 50,233 | | | 66,301 | | | 222,178 | |
Investing activities | | | | | | | | | | | |
Interest received | | | | 2,307 | | | 6,187 | | | 7,752 | |
Purchase of treasury deposits, net of treasury deposits acquired with subsidiary | | | | (115,793 | ) | | (28,935 | ) | | (22,065 | ) |
Purchases of property, plant and equipment | | | | (7,528 | ) | | (20,232 | ) | | (24,382 | ) |
Purchases of intangible assets | | | | (5,799 | ) | | (2,448 | ) | | (5,098 | ) |
Acquisition of subsidiaries | | 35 | | 66,489 | | | (11,689 | ) | | (81,946 | ) |
Net cash used in investing activities | | | | (60,324 | ) | | (57,117 | ) | | (125,739 | ) |
Financing activities | | | | | | | | | | | |
Repayments of obligations under finance leases | | | | (1,282 | ) | | (279 | ) | | (5,924 | ) |
Purchases of own shares | | | | – | | | (20,199 | ) | | (20,025 | ) |
Proceeds on issue of shares | | | | 66 | | | 1,524 | | | 5,824 | |
Net cash used in financing activities | | | | (1,216 | ) | | (18,954 | ) | | (20,125 | ) |
Net (decrease) increase in cash and cash equivalents | | | | (11,307 | ) | | (9,770 | ) | | 76,314 | |
Cash and cash equivalents at beginning of period | | | | 180,898 | | | 193,311 | | | 117,494 | |
Effect of foreign exchange rate changes | | | | 1,010 | | | (2,643 | ) | | (497 | ) |
Cash and cash equivalents at end of period | | | | 170,601 | | | 180,898 | | | 193,311 | |
CSR plc Annual Report and Financial Statements 2009
96
NOTES TO THE CONSOLIDATED FINANCIAL STATEMENTS
1. General Information
CSR plc is a company incorporated in the United Kingdom under the Companies Act 2006. The address of the registered office is Churchill House, Cambridge Business Park, Cowley Road, Cambridge, CB4 0WZ, United Kingdom. The nature of the Group’s operations and its principal activities are set out in note 6.
These financial statements are presented in US dollars because that is the currency of the primary economic environment in which the Group operates. Foreign operations are included in accordance with the policies set out in note 3.
Going concern
The financial statements have been prepared on the going concern basis. The directors have considered future cash forecasts and revenue projections, based on prudent market data, in their consideration of going concern. The issues surrounding going concern are discussed regularly by the Board and were evaluated as part of the Group’s budget for the next financial year and the Group’s longer term plans.
Note 33 includes the Group’s objectives, policies and processes for managing its capital; its financial risk management objectives; details of the financial instruments and hedging activities; and its exposure to credit risk. Management is currently of the opinion that the Group has adequate financial resources and a robust policy towards treasury risk and cash flow management. The Group has $412.4 million of cash and cash equivalents, including treasury deposits and investments, as at 1 January 2010 and no debt liabilities. The directors believe that the Group is adequately placed to manage its business risks successfully despite the current uncertain economic outlook and challenging macro economic conditions.
After making enquiries, the directors have a reasonable expectation that the Company and the Group have adequate resources to continue in operational existence for the foreseeable future. Accordingly, they continue to adopt the going concern basis in preparing the financial statements.
2. Adoption of New and Revised Standards
In the current financial period, the Group has adopted International Financial Reporting Standard 2 (amended) “Share-based payment – vesting conditions and cancellations”, International Accounting Standard 1 “Presentation of Financial Statements” (revised 2007), Amendments to International Financial Reporting Standard 7 “Financial Instruments” and both International Financial Reporting Standard 3 “Business Combinations” (as revised in 2008) and International Accounting Standard 27 “Consolidated and separate financial statements” (as revised in 2008) in advance of their effective date.
The amendments to IFRS 2 require, amongst other things, the acceleration of share-based payment charges relating to employees who cease to contribute to a SAYE scheme. The application of this Standard has not required a restatement of comparative periods.
The main change affecting CSR as a result of adopting IAS 1 (revised) requires the presentation of a statement of changes in equity as a primary statement, separate from the income statement and statement of comprehensive income. As a result, a consolidated statement of changes in equity has been included as a primary statement, showing changes in each component of equity for each period presented.
Due to the retrospective restatement of segments following the internal reorganisation outlined in note 6, in line with IAS 1 (revised), CSR has presented an opening balance sheet position as at 28 December 2007 and the associated accompanying opening position in the notes to the financial statements. There is no impact on the opening balance sheet position as a result of this restatement. A balance sheet as at 30 December 2006 has not been presented as the restatement of segment information had no impact on the balance sheet as at this date.
The impact of the early adoption of IFRS 3 (revised) and IAS 27 (revised) has resulted in some changes to the Group’s accounting policies and in accordance with the transitional provisions of IFRS 3(2008), that Standard has been applied prospectively to business combinations for which the acquisition date is on or after 3 January 2009:
The impact of IFRS 3(2008) Business Combinations has been:
| | · | | to change the basis for allocating a portion of the purchase consideration in a business combination to replacement share-based payment awards granted at the time of the combination; |
CSR plc Annual Report and Financial Statements 2009
97
NOTES TO THE CONSOLIDATED FINANCIAL STATEMENTS continued
2. Adoption of New and Revised Standards (continued)
| | · | | to require that acquisition-related costs be accounted for separately from the business combination, generally leading to those costs being expensed when incurred. |
| | · | | to remove the requirement to adjust goodwill when recognising deferred tax assets for losses subsequent to the initial acquisition accounting for acquisitions under either IFRS 3(2008) or IFRS 3 (as issued in 2004) subsequent to 3 January 2009. |
The amendments to IFRS 7 expand the disclosures required in respect of fair value measurements and liquidity risk.
Standards not affecting the reported results nor the financial position:
The following new and revised Standards and Interpretations have been adopted in the current period. Their adoption has not had any significant impact on the amounts reported in these financial statements but may impact the accounting for future transactions and arrangements.
| | |
Amendments to IAS 39 | | Financial instrument: Recognition and Measurement and IFRS 7 Financial Instruments:
Disclosures |
IAS 38 (amended) | | Intangible Assets |
IAS 40 (amended) | | Investment property |
IAS 20 (amended) | | Accounting for Government Grants and Disclosure of Government Assistance |
IAS23 (revised 2007) | | Borrowing Costs |
IAS 32 (amended)/IAS 1 | | Puttable Financial Instruments and Obligations Arising on Liquidation |
IAS 39 (amended) | | Financial instruments: Recognition and Measurement – Eligible Hedged Items |
IFRIC 9 (amended)/ IAS 39 (amended) | | Reassessment of Embedded Derivatives and Financial Instruments: Recognition and Measurement |
IFRIC 15 | | Agreements for the Construction of Real Estate |
IFRIC 16 | | Hedges of a Net Investment in a Foreign Operation |
IFRIC 18 | | Transfers of Assets from customers |
At the date of authorisation of these financial statements, the following Standards and Interpretations which have not yet been applied in these financial statements were in issue but not yet effective (and in some cases, had not yet been adopted by the EU):
| | |
IFRS 9 | | Financial Instruments |
IFRIC 14 | | Prepayments of a minimum funding requirements |
IFRIC 19 | | Extinguishing financial liabilities with equity instruments |
IFRS 2 (amended) | | Group cash-settled share-based payment transactions |
IFRS 1 (amended) | | Additional exemptions for first-time adopters |
IAS 32 (amended) | | Classification of Rights Issues |
IAS 24 (amended) | | Related Party Disclosures |
Improvements to IFRSs (April 2009) | | |
The directors anticipate that the adoption of these Standards and Interpretations in future periods will have no material impact on the financial statements of the Group.
CSR plc Annual Report and Financial Statements 2009
98
3. Accounting Policies
Basis of Accounting
The financial statements have been prepared in accordance with International Financial Reporting Standards (IFRSs) as issued by the International Accounting Standards Board (“IASB”) and as adopted by the European Union (EU).
The financial statements have been prepared on the historical cost basis, except for the revaluation of financial instruments. The principal accounting policies adopted are set out below. The financial statements cover the 52 week period from 3 January 2009 to 1 January 2010; the comparatives are presented for the 53 week period from 29 December 2007 to 2 January 2009 and for the 52 week period from 30 December 2006 to 28 December 2007. The financial statements are reported on a 52 or 53 week basis to be consistent with the Group’s internal reporting.
Basis of Consolidation
The consolidated financial statements incorporate the financial statements of CSR plc (the Company) and entities controlled by the Company (its subsidiaries, together the Group) drawn up to the dates indicated in the primary financial statements. Control is achieved where the Company has the power to govern the financial and operating policies of an investee entity so as to obtain benefits from its activities.
The results of subsidiaries acquired or disposed of during the year are included in the consolidated income statement from the effective date of acquisition or up to the effective date of disposal, as appropriate.
Where necessary, adjustments are made to the financial statements of subsidiaries to bring the accounting policies used into line with those used by the Group.
All intra-Group transactions, balances, income and expenses are eliminated on consolidation.
Business Combinations
Acquisitions of subsidiaries and businesses are accounted for using the acquisition method. The consideration for each acquisition is measured at the aggregate of the fair values (at the date of exchange) of assets given, liabilities incurred or assumed, and equity instruments issued by the Group in exchange for the control of the acquiree. Acquisition-related costs are recognised in the profit or loss as incurred for acquisitions that have occurred since the adoption of IFRS 3 (revised). Previous acquisitions have not been restated.
Where applicable, the consideration for the acquisition includes any asset or liability resulting from a contingent consideration arrangement, measured at its acquisition-date fair value. Subsequent changes in such fair values are adjusted against cost of acquisition where they qualify as measurement period adjustments (see below). All other subsequent changes in the fair value of contingent consideration classified as an asset or liability are accounted for in accordance with relevant IFRSs. Changes in the fair value of contingent consideration classified in equity are not recognised.
The acquiree’s identifiable assets, liabilities and contingent liabilities that meet the conditions for recognition under IFRS 3 (2008) are recognised at their fair value at the acquisition date, except that:
| | · | | Deferred tax assets and liabilities and liabilities or assets related to employee benefit arrangements are recognised and measured in accordance with IAS 12Income taxes and IAS 19Employee Benefits respectively; |
| | · | | Liabilities or equity instruments related to the replacement by the Group of an acquiree’s share-based payment awards are measured in accordance with IFRS 2Share-based Payment; |
| | · | | Assets (or disposal groups) that are classified as held for sale in accordance with IFRS 5Non-current Assets Held for Sale and Discontinued Operations are measured in accordance with that Standard. |
If the initial accounting for a business combination is incomplete by the end of the reporting period in which the combination occurs, the Group reports provisional amounts for the items for which the accounting is incomplete. Those provisional amounts are adjusted during the measurement period (see below), or additional assets or liabilities are recognised to reflect new information obtained about facts and circumstances that existed as at the acquisition date that, if known, would have affected the amounts recognised as of that date.
CSR plc Annual Report and Financial Statements 2009
99
NOTES TO THE CONSOLIDATED FINANCIAL STATEMENTS continued
3. Accounting Policies (continued)
Business Combinations (continued)
The measurement period is the period from the date of acquisition to the date the Group obtains complete information about facts and circumstances that existed as of the acquisition date – and is subject to a maximum of one year.
The transition provisions given in IFRS 3 (2008) are such that the rules governing the treatment of contingent consideration for pre-adoption business combinations do not change.
Where there are acquiree share-based payment awards that will be exchanged for awards held by the Group, the fair value of the outstanding awards is allocated between consideration and post-combination service in accordance with IFRS 3 (revised 2008).
The Group recognises a contingent liability as of the acquisition date if there is a present obligation that arises from past events and its fair value can be measured reliably in accordance with IFRS 3 (revised 2008).
Goodwill
Goodwill arising in a business combination is recognised as an asset at the date that control is acquired (the acquisition date). Goodwill is measured as the excess of the sum of the consideration transferred, the amount of any non-controlling interest in the acquiree and the fair value of the Group’s previously held equity interest (if any) in the entity over the net of the acquisition-date amounts of identifiable assets acquired and the liabilities assumed.
If, after reassessment, the Group’s interest in the fair value of the acquiree’s identifiable net assets exceeds the sum of the consideration transferred, the amount of any non-controlling interest in the acquiree and the fair value of the Group’s previously held equity interest (if any), the excess is recognised in profit or loss as a bargain purchase made.
For the purpose of impairment testing, goodwill is allocated to each of the Group’s cash-generating units expected to benefit from the synergies of the combination. Cash-generating units to which goodwill has been allocated are tested annually or more frequently when there is an indication that the unit may be impaired. To determine the recoverable amount of the cash-generating unit, the Group uses discounted projected cash flows based on approved budgets and projections covering a period up to five years and estimates growth rates, terminal growth rates and discount rates specific to the economic environment within which the cash-generating unit is operating. If the recoverable amount of the cash-generating unit is less than the carrying amount of the unit, the impairment loss is allocated first to reduce the carrying amount of any goodwill allocated to the unit and then to the other assets of the unit pro rata on the basis of the carrying amount of each asset in the unit. An impairment loss recognised for goodwill is not reversed in a subsequent period.
On disposal of a subsidiary the attributable amount of goodwill is included in the determination of the profit or loss on disposal.
Revenue Recognition
Revenue is recognised when it is probable that economic benefits will flow to the Group and delivery has occurred or the service has been provided, the sales price is fixed or determinable, and collectibility is reasonably assured. These criteria are generally met at the time the product is shipped and delivered to the customer and, depending on the delivery conditions, title and risk have passed to the customer and acceptance of the product, when contractually required, has been obtained, or, in cases where such acceptance is not contractually required, when management has established that all aforementioned conditions for revenue recognition have been met and no further post-shipment obligations exist other than obligations under warranty. Examples of the above-mentioned delivery conditions are “Free on Board point of delivery” and “Costs, Insurance Paid point of delivery”, where the point of delivery may be the shipping warehouse or any other point of destination as agreed in the contract with the customer and where title and risk in the goods pass to the customer.
Revenues are recorded net of sales taxes, customer discounts, rebates and similar charges. For products for which a right of return exists during a defined period, revenue recognition is determined based on the historical pattern of actual returns, or in cases where such information is lacking, revenue recognition is postponed until the return period has lapsed. Return policies are typically based on customary return arrangements in local markets. Revenue is shown net of estimated provision for credit notes and returns.
A provision for product warranty is made at the time of revenue recognition and reflects the estimated costs of replacement and free of charge services that will be incurred by the Company with respect to the sold products.
CSR plc Annual Report and Financial Statements 2009
100
3. Accounting Policies (continued)
Revenue Recognition (continued)
Royalty income, which is generally earned based upon a percentage of sales or a fixed amount per royalty earning product, is recognised upon shipment by the licencee.
Interest income is accrued on a time basis, by reference to the principal outstanding and at the effective interest rate applicable.
Leasing
Leases are classified as finance leases whenever the terms of the lease transfer substantially all the risks and rewards of ownership to the lessee. All other leases are classified as operating leases.
Assets held under finance leases are recognised as assets of the Group at their fair value or, if lower, at the present value of the minimum lease payments, each determined at the inception of the lease. The corresponding liability to the lessor is included in the balance sheet as a finance lease obligation. Lease payments are apportioned between finance charges and reduction of the lease obligation so as to achieve a constant rate of interest on the remaining balance of the liability. Finance charges are charged directly to the income statement.
Rentals payable under operating leases are charged to the income statement on a straight-line basis over the term of the relevant lease.
Benefits received and receivable as an incentive to enter into an operating lease are also spread on a straight line basis over the lease term.
Foreign Currencies
The functional currency of CSR plc is the US dollar and this is also the presentation currency for the consolidated financial statements. Transactions in currencies other than US dollars are recorded at the rates of exchange prevailing on the dates of the transactions. At each balance sheet date, monetary assets and liabilities that are denominated in foreign currencies are retranslated at the rates prevailing on the balance sheet date. Non-monetary assets and liabilities carried at fair value that are denominated in foreign currencies are translated at the rates prevailing at the date when the fair value was determined. Gains and losses arising on retranslation are included in the net profit or loss for the period except for exchange differences on transactions entered into to hedge certain foreign currency risks (see policy on Hedge Accounting).
In order to hedge its exposure to certain foreign exchange risks, the Group enters into forward contracts (see Financial Instruments policy for details of the Group’s accounting policies in respect of such derivative financial instruments).
On consolidation, the assets and liabilities of the Group’s overseas operations are translated at exchange rates prevailing on the balance sheet date. Income and expense items are translated at the average exchange rates for the period. Currency translation differences are recognised directly in equity.
Operating (Loss) Profit
Operating (loss) profit is stated before investment income and finance costs.
The income statement has been presented with certain items split out as separate line items. Management believes that this presentation aids the understanding of the Group’s financial performance and this presentation is used for internal performance evaluation. Items that have been split out on the face of the income statement are the amortisation of acquired intangible assets, share-based payment charges under IFRS 2, charges associated with integration and restructuring, acquisition fees, in 2008 and 2007 the deferred tax adjustment to goodwill, in 2008 the asset impairment and in 2007, the patent dispute settlement.
Retirement Benefit Costs
Payments to defined contribution retirement benefit schemes are charged as an expense as they fall due. Differences between contributions payable in the period and contributions actually paid are shown as either accruals or prepayments in the balance sheet.
Taxation
The tax expense represents the sum of the current tax expense and the deferred tax expense for the period.
CSR plc Annual Report and Financial Statements 2009
101
NOTES TO THE CONSOLIDATED FINANCIAL STATEMENTS continued
3. Accounting Policies (continued)
Taxation (continued)
The tax payable is based on taxable (loss) profit for the period. Taxable profit differs from net profit as reported in the income statement because it excludes items of income and expense that are taxable or deductible in other periods and it further excludes items that are never taxable or deductible. The Group’s liability for current tax is calculated using tax rates that have been enacted or substantively enacted by the balance sheet date.
Deferred tax is the tax expected to be payable or recoverable on differences between the carrying amounts of assets and liabilities in the financial statements and the corresponding tax bases used in the computation of taxable profit, and is accounted for using the balance sheet liability method. Deferred tax liabilities are generally recognised for all taxable temporary differences and deferred tax assets are recognised to the extent that it is probable that taxable profits will be available against which deductible temporary differences, unused carried forward tax losses and unused carried forward tax credits can be utilised. However, such assets and liabilities are not recognised if the temporary differences arise from:
| | · | | the initial recognition of goodwill; |
| | · | | the initial recognition (other than in a business combination) of other assets and liabilities in a transaction that affects neither the taxable profit nor the accounting profit; |
| | · | | investments in subsidiaries and associates, and interests in joint ventures, where the Group is able to control the reversal of the temporary difference and it is probable that the temporary difference will not reverse in the foreseeable future. |
The carrying amount of deferred tax assets is reviewed at each balance sheet date and reduced to the extent that it is no longer probable that sufficient taxable profits will be available to allow all or part of the asset to be recovered.
Deferred tax is calculated at the tax rates that are expected to apply in the period when the liability is settled or the asset is realised. Deferred tax is charged or credited in the income statement, except when it relates to items charged or credited directly to equity, in which case deferred tax is also dealt with in equity.
Deferred tax assets and liabilities are offset when there is a legally enforceable right to set off current tax assets against current tax liabilities and when they relate to income taxes levied by the same taxation authority and the Group intends to settle its current tax assets and liabilities on a net basis.
Judgement is required when determining the provision for taxes as the tax treatment of some transactions cannot be finally determined until a formal resolution has been reached with the tax authorities. Tax benefits are not recognised unless it is probable that the benefit will be obtained. Tax provisions are made if it is probable that a liability will arise and the liability can be reliably measured. The Group reviews each significant tax liability or benefit to assess the appropriate accounting treatment.
Government grants, by means of tax relief for research and development expenditure, are recognised as income as qualifying expenditures are made.
Property, Plant and Equipment
Property, plant and equipment are stated at cost less accumulated depreciation and any recognised impairment loss.
Depreciation is charged so as to write off the cost of the assets, less estimated residual value, over their estimated useful lives, using the straight line method, on the following basis:
| | | | |
Computer equipment | | 2 to 3 years | | |
| | |
Test equipment | | 2 to 5 years | | |
| | |
Office equipment | | 3 years | | |
| | |
Furniture and fittings | | 5 years | | |
| | |
Leasehold improvements | | Minimum lease period | | |
CSR plc Annual Report and Financial Statements 2009
102
3. Accounting Policies (continued)
Property, Plant and Equipment (continued)
Residual values are the estimated amount that the Group would obtain from disposal of the asset, after deducting estimated costs of disposal, if the asset were already of the age and in the condition expected at the end of its useful life, based on prices prevailing at the balance sheet date.
In general residual values are zero or negligible, due to the technical and specialised nature of assets held. Residual values are reviewed annually.
Assets held under finance leases are depreciated over their expected useful lives on the same basis as owned assets or, where shorter, over the term of the relevant lease.
The gain or loss arising on the disposal or retirement of an asset is determined as the difference between the sales proceeds and the carrying amount of the asset and is recognised in the income statement.
Assets in the course of construction are carried at cost less any recognised impairment losses. Costs included are those that directly relate to the construction of the asset. Depreciation of these assets commences when the assets are ready for their intended use.
Other Intangible Assets
Other intangible fixed assets are stated at cost or fair value for items acquired in business combinations, net of amortisation and any provision for impairment. No amortisation is provided on assets in the course of construction. On other intangible fixed assets, amortisation is provided at rates calculated to write off the cost or fair value, less estimated residual value, of each asset on a straight line basis over its expected useful life as follows:
| | | | |
Software licences | | Licence term | | |
| | |
Customer contracts and relationships | | 3 to 4 years | | |
| | |
Purchased R&D | | 4 to 10 years | | |
| | |
Internally developed technology | | 3 years | | |
| | |
Purchased developed technology | | 3 to 4 years | | |
| | |
Trade names | | 2 years | | |
Residual values are the estimated amount that the Group would obtain from disposal of the asset, after deducting estimated costs of disposal, if the asset were already of the age and in the condition expected at the end of its useful life, based on prices prevailing at the balance sheet date.
In general residual values are zero or negligible, due to the technical and specialised nature of assets held. Residual values are reviewed annually.
Assets held under finance leases are depreciated over their expected useful lives on the same basis as owned assets or, where shorter, over the term of the relevant lease.
The gain or loss arising on the disposal or retirement of an asset is determined as the difference between the sales proceeds and the carrying amount of the asset and is recognised in the income statement.
Assets in the course of construction are carried at cost net of any provision for impairment. Costs included are those that directly relate to the construction or production of the asset. Amortisation of these assets commences when the assets are ready for their intended use.
Research and Development Expenditure
Expenditure on research activities is recognised as an expense in the period in which it is incurred.
CSR plc Annual Report and Financial Statements 2009
103
NOTES TO THE CONSOLIDATED FINANCIAL STATEMENTS continued
3. Accounting Policies (continued)
Research and Development Expenditure (continued)
An internally generated intangible asset arising from the Group’s product development is recognised only if all of the following conditions are met:
| | · | | an asset is created that can be identified (such as a new device or software); |
| | · | | the project from which the asset arises meets the Group’s criteria for assessing technical feasibility; |
| | · | | it is probable that the asset created will generate future economic benefits; and |
| | · | | the development cost of the asset can be measured reliably. |
Internally generated intangible assets are amortised on a straight line basis over their useful lives. Where no internally generated intangible asset can be recognised, development expenditure is recognised as an expense in the period in which it is incurred.
Impairment of Tangible and Intangible Assets Excluding Goodwill
At each balance sheet date, the Group reviews the carrying amounts of its tangible and intangible assets to determine whether there is any indication that those assets have suffered an impairment loss. If any such indication exists, the recoverable amount of the asset is estimated in order to determine the extent of the impairment loss (if any). Where the asset does not generate cash flows that are independent from other assets, the Group estimates the recoverable amount of the cash-generating unit to which the asset belongs. An intangible asset with an indefinite useful life is tested for impairment annually and whenever there is an indication that the asset may be impaired.
Recoverable amount is the higher of fair value less costs to sell and value in use. In assessing value in use, the estimated future cash flows are discounted to their present values using a pre-tax discount rate that reflects current market assessments of the time value of money and the risks specific to the asset for which the estimates of future cash flows have not been adjusted.
If the recoverable amount of an asset (or cash-generating unit) is estimated to be less than its carrying amount, the carrying amount of the asset (cash-generating unit) is reduced to its recoverable amount. An impairment loss is recognised as an expense immediately. After the recognition of an impairment loss, any depreciation or amortisation charge for the asset is adjusted for future periods to allocate the asset’s revised carrying value, less estimated residual value, on a systematic basis, over its remaining useful life.
Where an impairment loss subsequently reverses, the carrying amount of the asset (cash-generating unit) is increased to the revised estimate of its recoverable amount, but the reversal is limited so that the increased carrying amount does not exceed the carrying amount that would have been determined had no impairment loss been recognised for the asset (cash-generating unit) in prior years. A reversal of an impairment loss is recognised as income immediately.
Inventories
Inventories are stated at the lower of cost and net realisable value. Cost comprises direct materials and, where applicable, those overheads that have been incurred in bringing the inventories to their present location and condition. Cost is calculated using the first-in-first-out (FIFO) method. Net realisable value represents the estimated selling price less all estimated costs of completion and costs to be incurred in marketing, selling and distribution.
Financial Instruments
Financial assets and financial liabilities are recognised on the Group’s balance sheet when the Group becomes a party to the contractual provisions of the instrument.
Loans and Receivables
Trade receivables, loans and other receivables that have fixed or determinable payments that are not quoted in an active market are classified as loans and receivables. Loans and receivables are measured at amortised cost using the effective interest method, less any impairment or appropriate allowances for estimated irrecoverable amounts. Interest income is recognised by applying the effective interest rate, except for short-term receivables when the recognition of interest would be immaterial.
CSR plc Annual Report and Financial Statements 2009
104
3. Accounting Policies (continued)
Financial Instruments (continued)
Treasury deposits and investments
Treasury deposits and investments are recognised and derecognised on a trade date where a purchase or sale of an investment is under a contract whose terms require delivery of the investment within the timeframe established by the market concerned, and are initially measured at cost, including transaction costs.
Treasury deposits and investments consist of money market deposits in USD, GBP and obligations of the United States government treasury with original maturities of over ninety days. Interest income is recorded as it accrues over the period of the investment at rates fixed at the time of inception.
Cash and Cash Equivalents
Cash and cash equivalents comprise cash on hand and demand deposits and other short-term highly liquid investments that are readily available convertible to a known amount of cash and are subject to an insignificant risk of changes in value.
Financial Assets at FVTPL (Fair Value Through Profit and Loss)
Financial Assets are classified as FVTPL where the asset liability has been designated as FVTPL.
A financial asset may be designated as FVTPL upon initial recognition if:
| | · | | Such designation eliminates or significantly reduces a measurement or recognition inconsistency that would otherwise arise; or |
| | · | | The financial asset forms part of a group of financial assets or financial liabilities or both, which is managed and its performance evaluated on a fair value basis, in accordance with the Group’s documented risk management or investment strategy, and information about the Group is provided internally on that basis; or |
| | · | | It forms part of a contract containing one or more embedded derivatives, and IAS 39 Financial Instruments: Recognition and Measurement permits the entire combined contract (asset or liability) to be designated FVTPL. |
Financial assets at FVTPL are stated at fair value, with any resultant gain or loss recognised in profit or loss. Fair value is determined in the manner described in note 33.
Derecognition of Financial Assets
The Group derecognises a financial asset only when the contractual rights to the cash flows from the asset expire; or it transfers the financial asset and substantially all the risks and rewards of ownership of the asset to another entity. If the Group neither transfers nor retains substantially all the risks and rewards of ownership and continues to control the transferred asset, the Group recognises its retained interest in the asset and an associated liability for amounts it may have to pay.
Impairment of Financial Assets
Financial assets are assessed for indicators of impairment at each balance sheet date. Financial assets are impaired when there is objective evidence that, as a result of one or more events that have occurred after the initial recognition of the asset, the estimated future cash flows of the investment have been impaired. Objective evidence of impairment could include significant financial difficulty of the issuer or the counterparty; or default or delinquency in interest or principal payments; or it becoming probable that the borrower will enter bankruptcy or financial re-organisation.
The carrying amount of the financial asset is reduced by the impairment loss directly for all financial assets with the exception of trade receivables where the carrying amount is reduced through the use of an allowance account. When a trade receivable is considered uncollectible, it is written off against the allowance account.
Subsequent recoveries of amounts previously written off are credited against the allowance account. Changes in the carrying amount of the allowance account are recognised in profit or loss.
Financial Liabilities and Equity
Financial liabilities and equity instruments are classified according to the substance of the contractual arrangements entered into.
CSR plc Annual Report and Financial Statements 2009
105
NOTES TO THE CONSOLIDATED FINANCIAL STATEMENTS continued
3. Accounting Policies (continued)
Financial Instruments (continued)
Trade Payables
Trade payables are not interest bearing and are initially measured at fair value, net of transaction cost.
Subsequently these are measured at amortised cost using the effective interest method, with interest recognised on an effective yield basis.
Equity Instruments
An equity instrument is any contract that evidences a residual interest in the assets of the Group after deducting all of its liabilities. Equity instruments issued by the Group are recorded at the proceeds received, net of direct issue costs.
Financial Liabilities at FVTPL (Fair Value Through Profit and Loss)
Financial liabilities are classified as FVTPL where the financial liability has been designated as FVTPL.
A financial liability may be designated as FVTPL upon initial recognition if:
| | · | | Such designation eliminates or significantly reduces a measurement or recognition inconsistency that would otherwise arise; or |
| | · | | The financial liability forms part of a group of financial assets or financial liabilities or both, which is managed and its performance evaluated on a fair value basis, in accordance with the Group’s documented risk management or investment strategy, and information about the Group is provided internally on that basis; or |
| | · | | It forms part of a contract containing one or more embedded derivatives, and IAS 39 Financial Instruments: Recognition and Measurement permits the entire combined contract (asset or liability) to be designated FVTPL. |
Financial liabilities at FVTPL are stated at fair value, with any resultant gain or loss recognised in profit or loss.
Derecognition of Financial Liabilities
The Group derecognises financial liabilities when, and only when, the Group’s obligations are discharged, cancelled or they expire.
Derivative Financial Instruments
The Group’s activities expose it primarily to the financial risks of changes in foreign currency exchange rates. The Group uses foreign exchange forward contracts to hedge these exposures. The Group does not use derivative financial instruments for speculative purposes. Further details of derivative financial instruments are disclosed in note 33 to the financial statements.
The use of financial derivatives is governed by the Group’s policies approved by the Board of directors, which provides written principles on the use of financial derivatives. The Group’s policy is to hedge between 75% and 90% of forecast GBP expenditure for the following 11 to 15 months.
Derivative financial instruments are initially recorded at fair value at the date a derivative contract is entered into and are subsequently remeasured to fair value at each balance sheet date. The resulting gain or loss is recognised in profit or loss immediately unless the derivative is designated and effective as a hedging instrument, in which event the timing of the recognition in profit or loss depends on the nature of the hedge relationship.
Hedge Accounting
Hedges of foreign exchange risk on firm commitments are accounted for as cash flow hedges.
At the inception of the hedge relationship, the Group documents the relationship between the hedging instrument and the hedged item, along with its risk management objectives and its strategy for undertaking various hedge transactions. Furthermore, at the inception of the hedge and on an ongoing basis, the Group documents whether the hedging instrument that is used in a hedging relationship is highly effective in offsetting changes in cash flows of the hedged item.
Note 18 sets out details of the fair values of the derivative instruments used for hedging purposes.
CSR plc Annual Report and Financial Statements 2009
106
3. Accounting Policies (continued)
Financial Instruments (continued)
Movements in the hedging reserve in equity are also detailed in the statement of changes in equity.
Cash Flow Hedges
The effective portion of changes in the fair value of derivatives that are designated and qualify as cash flow hedges are deferred in equity. The gain or loss relating to the ineffective portion is recognised immediately in profit or loss.
Amounts deferred in equity are recycled into profit or loss in the periods when the hedged item is recognised in profit or loss. When the forecast transaction that is hedged results in the recognition of a non-financial asset or a non-financial liability, the gains and losses previously deferred in equity are transferred from equity and included in the initial measurement of the cost of the asset or liability.
Hedge accounting is discontinued when the Group revokes the hedging relationship, the hedging instrument expires or is sold, terminated, exercised or no longer qualifies for hedge accounting. Any cumulative gain or loss deferred in equity at that time remains in equity and is recognised when the forecast transaction is ultimately recognised in profit or loss. When a forecast transaction is no longer expected to occur, the cumulative gain or loss that was deferred in equity is recognised immediately in profit or loss.
Provisions
Provisions for warranty and returns costs are recognised at the date of sale of the relevant products, at the directors’ best estimate of the expenditure required to settle the Group’s liability.
Provision is made for onerous contracts at the fair value of the minimum unavoidable payments, net of any amounts recoverable. Where amounts are known and timings certain, onerous amounts are accrued instead.
Share-Based Payment
The Group has applied the requirements of IFRS 2 Share-based Payment. In accordance with the transitional provisions, IFRS 2 has been applied to all grants of equity instruments after 7 November 2002 that were unvested as of 1 January 2005.
The Group issues equity-settled share-based payments to certain employees, including share options with non-market based vesting conditions. Equity settled share-based payments are measured at the fair value at the date of grant. The fair value determined at the grant date of the equity-settled share-based payments is expensed on a straight-line basis over the vesting period, based on the Group’s estimate of shares that will eventually vest.
For grants where options vest in instalments over the vesting period, each instalment is treated as a separate grant, which results in fair value of each instalment being spread across the vesting period of that instalment.
Fair value is measured by use of a Black-Scholes model for most of share options in issue. The expected life used in the model has been adjusted, based on management’s best estimate, for the effects of non-transferability, exercise restrictions, and behavioural considerations.
For certain share options which include TSR related condition the fair value is estimated through the use of a Monte-Carlo simulation.
For a business combination where there are acquiree share-based payment awards that will be exchanged for awards held by the Group, the fair value of the outstanding awards is allocated between consideration and post-combination service in accordance with IFRS 3 (revised 2008) using the valuation techniques described in IFRS 2. The allocation of the fair value of the options outstanding to consideration results in a credit to equity in the share-based payment reserve.
Employee Benefit Trust
The Group has established an employee benefit trust which is a separately administered trust and is funded by loans from Group companies. The assets of the trust comprise shares in CSR plc and cash balances. The Group recognises assets and liabilities of the trust in the consolidated accounts and shares held by the trust are recorded at cost as a deduction from shareholders’ equity.
CSR plc Annual Report and Financial Statements 2009
107
NOTES TO THE CONSOLIDATED FINANCIAL STATEMENTS continued
3. Accounting Policies (continued)
Contingent liabilities
A contingent liability may arise where there is possible obligation that arises from past events, whose occurrence or non-occurrence will only be confirmed by uncertain future events or where a present obligation arises from past events but where an outflow of resources from the Group is not probable and/or the amount of the obligation cannot be reliably measured. The Group recognises liabilities where there is a present obligation and an outflow of resources from the Group is probable and can be reliably measured.
4. Critical Accounting Judgements and Key Sources of Estimation and Uncertainty
These consolidated financial statements have been prepared in accordance with IFRS as issued by the IASB and as adopted by the European Union (EU).
The preparation of financial statements requires the directors to make estimates and assumptions about future events that affect the reported amounts of assets and liabilities and disclosure of contingent assets and liabilities.
Future events and their effects cannot be determined with absolute certainty. Therefore, the determination of estimates requires the exercise of judgement based on various assumptions and other factors such as historical experience, current and expected economic conditions. The directors constantly re-evaluate these significant factors and make adjustments where facts and circumstances dictate. The directors believe that the following accounting policies are critical due to the degree of estimation required and / or the potential material impact they may have on the Group’s financial position and performance.
Inventory Valuation
Inventories are stated at the lower of cost and net realisable value. Provisions for excess or obsolete inventory are recorded based upon assumptions about future demand and market conditions.
The level of inventory provisioning required is sensitive to changes in the forecast sales of particular products which is dependent on changes in conditions in the Group’s markets. If changes in actual market conditions are less favourable than those projected, additional inventory provisions may be required; similarly if changes in actual market conditions are more favourable than predicted, the Group may be able to release a proportion of the inventory provision.
Business Combinations and Goodwill Impairments
The amount of goodwill initially recognised as a result of a business combination is dependent on the allocation of the purchase price to the fair value of the identifiable assets acquired and the contingent liabilities assumed. The Group uses judgement, estimates and involves external specialists in determining the fair value of identifiable assets and liabilities acquired in a business combination, as well as calculating the fair value of the purchase consideration on acquisition.
Allocation of the purchase price affects the results of the Group as finite lived intangible assets are amortised, whereas indefinite lived intangible assets, including goodwill, are not amortised and could result in differing amortisation charges based on the allocation to indefinite lived and finite lived intangible assets.
The Group assesses the carrying value of identifiable intangible assets, long-lived assets and goodwill annually, or more frequently if events or changes in circumstances indicate that such carrying value may not be recoverable. Factors considered important, which could trigger an impairment review, include the following:
| | · | | significant under performance relative to historical or projected future results; |
| | · | | significant changes in the manner of our use of the acquired assets or the strategy for our overall business; and |
| | · | | significantly negative industry or economic trends. |
This assessment is based upon projections of anticipated discounted future cash flows. The most significant variables in determining cash flows are future growth in sales, discount rates, terminal values, the number of years on which to base the cash flow projections, as well as the assumptions and estimates used to determine the cash inflows and outflows.
The Group determines discount rates to be used based on the risk inherent in the related activity’s current business model and industry comparisons. Terminal values are based on the expected life of products and forecasted life cycle and forecasted cash flows over that period. While the Group believes that its assumptions are appropriate, such amounts estimated could differ materially from what will actually occur in the future. In assessing goodwill, these discounted cash flows are prepared at a cash-generating unit level.
CSR plc Annual Report and Financial Statements 2009
108
4. Critical Accounting Judgements and Key Sources of Estimation and Uncertainty (continued)
Business Combinations and Goodwill Impairments (continued)
Note 13 to the financial statements provides further disclosures on the assumptions underlying the impairment review and the allocation of goodwill by reportable segments.
Provisions for Returns and Warranty Claims
The Group provides for the estimated cost of returns and product warranties at the time revenue is recognised. The Group’s products are covered by product warranty plans of varying periods, depending on local practices and regulations. While the Group engages in extensive product quality programs and processes, including actively monitoring and evaluating the quality of our component suppliers, our warranty obligations are affected by actual product failure rates (field failure rates) and by material usage and service delivery costs incurred in correcting a product failure.
The Group’s warranty provision is established based upon its best estimates of the amounts necessary to settle future and existing claims on products sold as of the balance sheet date. As the Group continuously introduces new products which incorporate complex technology, and as local laws, regulations and practices may change, it will be increasingly difficult to anticipate our failure rates, the length of warranty periods and repair costs. While the Group believes that its warranty provisions are adequate and that the judgements applied are appropriate, the ultimate cost of product warranty could differ materially from our estimates. When the actual warranty cost of our products is lower than we originally anticipated, the Group releases an appropriate proportion of the provision, and if the warranty cost is higher than anticipated, the Group increases the provision.
Accounting for Share-based Payments
The Group applies IFRS 2 “Share-based payments” in relation to the accounting for share-based payments in respect of options and share awards granted after 7 November 2002 and which had not vested as at 1 January 2005.
Under IFRS 2, the share-based compensation is measured at the grant date, based on the estimated fair value of the award, and is recognised as an expense over the employee’s requisite service period.
The fair value of most of the options granted is measured by use of a Black-Scholes model, taking into account the terms and conditions upon which the options were granted. The expected life used in the model has been adjusted, based on management’s best estimate for the effects of non-transferability, exercise restrictions and, behavioural considerations. The volatility used in the model is based on movements in the Group’s share price for a period matching that of the vesting period of the options. The risk-free interest rate used is the implied yield currently available on zero-coupon government issues in the UK, with a remaining term equal to the expected term of the option being valued (based on the option’s remaining contractual life and taking into account the effects of expected early exercise). For certain share awards which include total shareholder return related conditions, the fair value is estimated through the use of a Monte-Carlo simulation.
The amount recognised as an expense is adjusted to reflect the actual number of shares that vest.
Non-market vesting conditions are included in assumptions about the number of shares that are expected to become exercisable. The estimates of the number of share options and awards that are expected to become exercisable are reviewed at each balance sheet date. The impact of the revision of original estimates, if any, is recognised in the income statement and a corresponding adjustment to equity. Note 31 to the Consolidated Financial Statements provides details on the valuation assumptions made for each grant of share options and awards during the period.
Share Options and Taxation
In the UK and US the Group is entitled to a tax deduction for amounts treated as compensation on exercise of certain employees’ share options under each jurisdiction’s tax rules. This gives rise to a temporary difference between the accounting and tax bases and hence a deferred tax asset is recorded. This asset is calculated by comparing the estimated amount of tax deduction to be obtained in the future (based on the share price at the balance sheet date) with the share-based payment expense recorded in the income statement. If the amount of estimated future tax deduction exceeds the cumulative amount of share-based payment expense at the statutory rate, the excess is recorded directly in equity, against retained earnings.
No share-based payment expense is recorded in respect of options granted before 7 November 2002. Nevertheless, tax deductions have arisen and will continue to arise on these options. The tax effects in relation to these options are recorded directly in equity against retained earnings.
CSR plc Annual Report and Financial Statements 2009
109
NOTES TO THE CONSOLIDATED FINANCIAL STATEMENTS continued
4. Critical Accounting Judgements and Key Sources of Estimation and Uncertainty (continued)
Revenue recognition
Sales are recognised when the significant risks and rewards of ownership have transferred to the buyer, continuing managerial involvement usually associated with ownership and effective control have ceased, the amount of revenue can be measured reliably, it is probable that economic benefits associated with the transaction will flow to the Group and the costs incurred or to be incurred in respect of the transaction can be measured reliably.
This requires the Group to assess at the point of delivery whether these criteria have been met. When the Group determines that such criteria have been met, revenue is recognised. The Group records estimated reductions to revenue for pricing agreements, price protection, other volume based rebates and expected returns. Estimated sales adjustments for volume based discount programs are based largely on shipment information.
Income Taxes
The Group is subject to the income tax laws of the various tax jurisdictions in which we operate, principally the United Kingdom. These laws are complex and subject to different interpretations by taxpayers and tax authorities. When establishing income tax provisions, we therefore make a number of judgments and interpretations about the application and interaction of these laws. Changes in these tax laws or our interpretations of these laws and the resolution of future tax audits could significantly impact our effective tax rate and the results of operations in a given period.
The Group estimates its income taxes in each of the jurisdictions in which it operates. This process involves estimating its current tax liability together with assessing temporary differences resulting from differing treatment of items for tax and accounting purposes. These differences result in the recognition of deferred tax assets and liabilities, which are included within the consolidated balance sheet to the extent that we believe they are recoverable.
In recognising deferred tax assets, the Group considers profit forecasts including the effect of exchange rate fluctuations on sales and external market conditions. Where it is probable that a position may be successfully challenged by revenue authorities, a tax provision is created for the tax on the probable adjustment.
Management’s judgement is required in determining the provision for income taxes, deferred tax assets and liabilities. Deferred tax assets have been recognised where management believes there are sufficient taxable temporary differences or convincing other evidence that sufficient taxable profit will be available in future to realise deferred tax assets.
Although the deferred tax assets which have been recognised are considered realisable, actual amounts could be reduced if future taxable income is lower than expected. This can materially affect the Group’s reported net income and financial position.
Hedge Accounting for Financial Instruments
The financial instruments that are used in hedging transactions are assessed both at inception and quarterly thereafter to ensure they are effective in offsetting changes in either the fair value or cash flows of the related underlying exposures. Hedge accounting is used for foreign currency risk exposures and for firm and forecast commitments to hedge foreign currency risk exposures. Management’s judgement is required to determine whether a future transaction is probable. External market data is applied in measuring the hedge effectiveness of financial instruments. Hedge ineffectiveness is recognised immediately in the income statement. Refer to note 33 for details of the hedging relationships as well as the impact of the hedge on the pre-tax profit or loss for the period.
Litigation and claims
The Group may be subject to claims, legal actions and complaints, including patent infringements, arising in the normal course of business. The likelihood and ultimate outcome of such occurrences is not presently determinable therefore the Group uses estimation and judgement on whether any of these claims or litigation should result in a contingent liability being recognised.
Issues can, and do, take many years to resolve. Significant items of litigation and claims on which the Group has exercised accounting judgement in respect of whether or not to recognise a contingent liability are discussed in note 27. The inherent uncertainty regarding the outcome of these items means eventual resolution could differ from the accounting estimates and therefore impact the Group’s results and cash flows.
CSR plc Annual Report and Financial Statements 2009
110
5. Revenue
| | | | | | |
| | | 52 weeks ended
1 January 2010 | | 53 weeks ended
2 January 2009 | | 52 weeks ended
28 December 2007 |
| | | $’000 | | $’000 | | $’000 |
Sale of goods | | 597,430 | | 693,698 | | 846,831 |
Royalties | | 3,969 | | 1,167 | | 1,791 |
| | | 601,399 | | 694,865 | | 848,622 |
Investment income | | 1,915 | | 6,139 | | 7,938 |
| | | 603,314 | | 701,004 | | 856,560 |
Investment income is interest on bank deposits.
6. Segmental Reporting
CSR is a leading provider of multifunction connectivity, audio and location platforms.
Products and Services from which Reportable Segments Derive their Revenues
Following an internal reorganisation in the first half of 2009, the reportable segments of CSR changed from those shown in the 2008 Annual Report and accordingly, the prior period disclosures have been restated.
The Group’s new reportable segments under IFRS 8Operating Segments are as follows:
| | |
Handset Business Unit (HBU) | | Mobile Handsets |
Audio and Consumer Business Unit (ACBU) | | Headsets, PC and Consumer Applications |
Automotive and PND (APBU) | | Automotive and Personal Navigation Device (PND) applications |
Segment Revenues and Results
The reportable segments previously disclosed were Cellular and Non-Cellular.
The handset and headset businesses were previously included within the Cellular segment prior to the internal reorganisation and have now been split between HBU and ACBU. The Non-Cellular reportable segment has now been split between the ACBU and APBU reportable segments.
The following is an analysis of the Group’s revenue and results by reportable segment:
| | | | | | | | | | | | |
| 52 weeks ended 1 January 2010 | | HBU | | ACBU | | APBU | | Unallocated | | | Consolidated | |
| | $’000 | | $’000 | | $’000 | | $’000 | | | $’000 | |
Revenue | | | | | | | | | | | | |
Total segment revenue | | 310,792 | | 163,271 | | 127,336 | | – | | | 601,399 | |
Result | | | | | | | | | | | | |
Underlying operating profit | | 4,641 | | 6,246 | | 16,046 | | – | | | 26,933 | |
Share-based payment charges | | | | | | | | (10,581 | ) | | (10,581 | ) |
Amortisation of acquired intangible assets | | | | | | | | (9,467 | ) | | (9,467 | ) |
Integration and restructuring | | | | | | | | (12,227 | ) | | (12,227 | ) |
Acquisition-related fees | | | | | | | | (10,572 | ) | | (10,572 | ) |
Operating loss | | | | | | | | | | | (15,914 | ) |
Investment income (note 5) | | | | | | | | | | | 1,915 | |
Finance costs (note 10) | | | | | | | | | | | (243 | ) |
Loss before tax | | | | | | | | | | | (14,242 | ) |
The Group discloses underlying operating profit as the measure of segment result as this is the measure used in the decision-making and resource allocation process of the Chief Operating Decision Maker, which is the Group’s Chief Executive Officer.
CSR plc Annual Report and Financial Statements 2009
111
NOTES TO THE CONSOLIDATED FINANCIAL STATEMENTS continued
6. Segmental Reporting (continued)
Segment Revenues and Results (continued)
Investment income and finance costs are not allocated to reportable segments for the purposes of reporting to the Group’s Chief Executive Officer.
A substantial proportion of R&D costs are allocated to the handset business unit. Other operating costs are allocated on activity. This method of cost allocation is used to report costs to the Group’s Chief Executive Officer for the purposes of resource allocation and assessment of segment performance.
The accounting policies for the reportable segments are the same as the Group’s accounting policies.
Underlying operating profit represents operating profit earned by each segment without allocation, in each period, of acquisition-related fees, share-based payment charges, integration and restructuring charges, charges related to the amortisation of acquired intangible assets, the adjustment to goodwill in respect of deferred tax in 2007 and 2008, the asset impairment charges in 2008, and in 2007, the patent dispute settlement.
The following is an analysis of the Group’s revenue and results by reportable segment in the 53 weeks ended 2 January 2009 restated for the changes in reportable segments:
| | | | | | | | | | | | | |
| 53 weeks ended 2 January 2009 | | HBU | | | ACBU | | APBU | | Unallocated | | | Consolidated | |
| | $’000 | | | $’000 | | $’000 | | $’000 | | | $’000 | |
Revenue | | | | | | | | | | | | | |
Total segment revenue | | 344,198 | | | 299,572 | | 51,095 | | – | | | 694,865 | |
Result | | | | | | | | | | | | | |
Underlying operating profit | | (8,536 | ) | | 63,377 | | 17,989 | | – | | | 72,830 | |
Share-based payment charges | | | | | | | | | (7,586 | ) | | (7,586 | ) |
Amortisation of acquired intangible assets | | | | | | | | | (5,418 | ) | | (5,418 | ) |
Integration and restructuring | | | | | | | | | (14,445 | ) | | (14,445 | ) |
Deferred tax adjustment to goodwill | | | | | | | | | (978 | ) | | (978 | ) |
Asset impairment | | | | | | | | | (52,918 | ) | | (52,918 | ) |
Operating loss | | | | | | | | | | | | (8,515 | ) |
Investment income (note 5) | | | | | | | | | | | | 6,139 | |
Finance costs (note 10) | | | | | | | | | | | | (4,075 | ) |
Loss before tax | | | | | | | | | | | | (6,451 | ) |
The following is an analysis of the Group’s revenue and results by reportable segment in the 52 weeks ended 28 December 2007 restated for the changes in reportable segments:
| | | | | | | | | | | | |
| 52 weeks ended 28 December 2007 | | HBU | | ACBU | | APBU | | Unallocated | | | Consolidated | |
| | $’000 | | $’000 | | $’000 | | $’000 | | | $’000 | |
Revenue | | | | | | | | | | | | |
Total segment revenue | | 415,214 | | 382,678 | | 50,730 | | – | | | 848,622 | |
Result | | | | | | | | | | | | |
Underlying operating profit | | 37,027 | | 117,486 | | 26,748 | | – | | | 181,261 | |
Share-based payment charges | | | | | | | | (9,275 | ) | | (9,275 | ) |
Amortisation of acquired intangible assets | | | | | | | | (6,609 | ) | | (6,609 | ) |
Deferred tax adjustment to goodwill | | | | | | | | (279 | ) | | (279 | ) |
Patent dispute settlement | | | | | | | | (15,000 | ) | | (15,000 | ) |
Operating profit | | | | | | | | | | | 150,098 | |
Investment income (note 5) | | | | | | | | | | | 7,938 | |
Finance costs (note 10) | | | | | | | | | | | (2,437 | ) |
Profit before tax | | | | | | | | | | | 155,599 | |
CSR plc Annual Report and Financial Statements 2009
112
6. Segmental Reporting (continued)
Segment Assets
| | | | | | |
| | | 1 January
2010 | | 2 January
2009 | | 28 December
2007 |
| | | $’000 | | $’000 | | $’000 |
HBU | | 280,688 | | 223,171 | | 306,564 |
ACBU | | 66,113 | | 67,564 | | 81,407 |
APBU | | 116,773 | | 16,001 | | 13,200 |
Total segment assets | | 463,574 | | 306,736 | | 401,171 |
| | | |
Deferred tax asset | | 4,341 | | 6,481 | | 7,021 |
Derivative financial instruments | | 2,397 | | – | | 696 |
Other receivables | | 15,094 | | 15,174 | | 15,379 |
Corporation tax debtor | | 5,433 | | 1,392 | | 187 |
Treasury deposits and investments | | 241,763 | | 81,000 | | 52,065 |
Cash and cash equivalents | | 170,601 | | 180,898 | | 193,311 |
Total assets | | 903,203 | | 591,681 | | 669,830 |
Assets allocated to reportable segments are goodwill (allocation is described in note 14), property, plant and equipment, intangible assets, trade receivables and inventory. All other assets are unallocated. Assets are allocated to the segment which has responsibility for their control.
No information is provided for segment liabilities as this measure is not provided to the chief operating decision maker.
Other Segment Information
| | | | | | | | | | |
| 52 weeks ended 1 January 2010 | | HBU | | ACBU | | APBU | | Unallocated | | Consolidated |
| | $’000 | | $’000 | | $’000 | | $’000 | | $’000 |
Depreciation of tangible fixed assets and amortisation of intangible assets | | 10,952 | | 6,238 | | 3,586 | | 9,467 | | 30,243 |
Additions to non-current assets | | 103,701 | | 33,205 | | 45,571 | | – | | 182,477 |
| | | | | |
| 53 weeks ended 2 January 2009 | | HBU | | ACBU | | APBU | | Unallocated | | Consolidated |
| | $’000 | | $’000 | | $’000 | | $’000 | | $’000 |
Depreciation of tangible fixed assets and amortisation of intangible assets | | 18,181 | | 5,996 | | 1,008 | | 5,418 | | 30,603 |
Additions to non-current assets | | 16,651 | | 5,491 | | 922 | | – | | 23,064 |
| | | | | |
| 52 weeks ended 28 December 2007 | | HBU | | ACBU | | APBU | | Unallocated | | Consolidated |
| | $’000 | | $’000 | | $’000 | | $’000 | | $’000 |
Depreciation of tangible fixed assets and amortisation of intangible assets | | 20,108 | | 6,631 | | 1,115 | | 6,609 | | 34,463 |
Additions to non-current assets | | 157,385 | | 13,084 | | 788 | | – | | 171,257 |
Revenues from Major Products and Services
The Group’s revenues from its major products and services were as follows:
| | | | | | |
| | | 52 weeks ended
1 January 2010 | | 53 weeks ended
2 January 2009 | | 52 weeks ended
28 December 2008 |
| | | $’000 | | $’000 | | $’000 |
Sale of integrated circuits | | 585,241 | | 683,520 | | 838,115 |
Sale of software | | 12,189 | | 10,178 | | 8,716 |
Royalties | | 3,969 | | 1,167 | | 1,791 |
Consolidated revenue (excluding investment income) | | 601,399 | | 694,865 | | 848,622 |
CSR plc Annual Report and Financial Statements 2009
113
NOTES TO THE CONSOLIDATED FINANCIAL STATEMENTS continued
6. Segmental Reporting (continued)
Geographical Information
The Group operates in four principal geographical areas – the UK (country of domicile), Rest of Europe, the Americas and Asia. The Group’s revenue from external customers and information about its segment assets (non-current assets excluding deferred tax assets and other financial assets) by geographical location is detailed below:
| | | | | | |
| | | 52 weeks ended
1 January 2010 | | 53 weeks ended
2 January 2009 | | 52 weeks ended
28 December 2007 |
| | | $’000 | | $’000 | | $’000 |
UK | | 251 | | 967 | | 1,777 |
Rest of Europe | | | | | | |
– Finland | | 2,734 | | 6,305 | | 15,416 |
– Germany | | 21,288 | | 18,413 | | 8,454 |
– Hungary | | 27,512 | | 36,535 | | 46,287 |
– Other | | 17,653 | | 1,538 | | 3,066 |
USA | | 40,151 | | 34,584 | | 54,039 |
Americas (excluding USA) | | 22,395 | | 10,564 | | 13,324 |
Asia | | | | | | |
– China and Hong Kong | | 208,906 | | 232,699 | | 298,882 |
– Taiwan | | 46,131 | | 100,024 | | 127,779 |
– Korea | | 90,045 | | 95,987 | | 104,817 |
– Japan | | 80,327 | | 121,838 | | 159,604 |
– Other Asia Pacific | | 44,006 | | 35,411 | | 15,177 |
| | | 601,399 | | 694,865 | | 848,622 |
Revenues are attributed to geographical areas on the basis of the customer’s manufacturing location.
| | | | | | |
| | | Non-current assets |
| | | 52 weeks ended
1 January 2010 | | 53 weeks ended
2 January 2009 | | 52 weeks ended
28 December 2007 |
| | | $’000 | | $’000 | | $’000 |
UK | | 65,418 | | 75,167 | | 131,648 |
Rest of Europe | | 47,857 | | 73,122 | | 75,636 |
USA | | 182,997 | | 14,467 | | 16,224 |
Asia | | 10,704 | | 12,536 | | 18,767 |
| | | 306,976 | | 175,292 | | 242,275 |
Non-current assets being goodwill, property, plant and equipment and other intangible assets are attributed to the location where they are situated
Information About Major Customers
In 2009, included in revenues arising from HBU are revenues of approximately $67.8 million (11% of revenues) relating to the Group’s largest customer. In 2008 and 2007, revenues in HBU, APBU and ACBU relating to the Group’s largest customer were, in 2008, $135.0 million, (19% of revenues) and in, 2007: $220.1 million, (26% of revenues).
In 2009 revenues of approximately $63.9 million (11% of revenues) were included within both the HBU and ACBU segments which arose from sales to the Group’s second largest customer. In 2008, revenues of approximately $75.6 million (11% of revenues) were included within both the HBU and ACBU segments which arose from sales to the Group’s second largest customer. In 2007 only the largest customer of the Group exceeded 10% of revenue in the 52 week period. Revenue from the top five customers represents 43% of revenues (2008: 50%; 2007: 52%).
CSR plc Annual Report and Financial Statements 2009
114
7. (Loss) Profit for the Period
(Loss) profit for the period has been arrived at after charging (crediting):
| | | | | | | |
| | | 52 weeks ended
1 January 2010 | | | 53 weeks ended
2 January 2009 | | 52 weeks ended
28 December 2008 |
| | | $’000 | | | $’000 | | $’000 |
Net foreign exchange (gains) losses | | (2,231 | ) | | 4,466 | | 1,500 |
Research and development costs | | 169,713 | | | 158,167 | | 147,541 |
Depreciation of property, plant and equipment | | 18,383 | | | 20,135 | | 17,427 |
Loss on disposal of property, plant and equipment | | 56 | | | 545 | | 75 |
Loss on disposal of intangible assets | | 447 | | | 186 | | 93 |
Patent dispute settlement | | – | | | – | | 15,000 |
Integration and restructuring (see note 29) | | 12,227 | | | 14,445 | | – |
Impairment of assets (see note 30) | | – | | | 52,918 | | – |
Acquisition fees | | 10,572 | | | – | | – |
Amortisation of intangible assets | | 11,860 | | | 10,468 | | 17,036 |
Staff costs (see note 9) | | 155,240 | | | 130,006 | | 121,278 |
Cost of inventories recognised as expense | | 315,138 | | | 362,527 | | 432,106 |
Write-downs of inventories recognised as an expense | | 1,216 | | | 5,085 | | 4,598 |
Auditors’ remuneration for audit services (see note 8) | | 936 | | | 360 | | 357 |
Deferred tax adjustment to goodwill (see note 13) | | – | | | 978 | | 279 |
8. Auditors’ remuneration
| | | | | | | |
| | | 52 weeks ended
1 January 2010 | | 53 weeks ended
2 January 2009 | | 52 weeks ended
28 December 2007 |
| | | $’000 | | $’000 | | $’000 |
Fees payable to the Company’s auditors for the audit of the Company’s annual accounts | | | 243 | | 93 | | 92 |
Fees payable to the Company’s auditors and their associates for other services to the Group | | | | | | | |
– The audit of the Company’s subsidiaries pursuant to legislation | | | 693 | | 267 | | 265 |
Total audit fee | | | 936 | | 360 | | 357 |
Interim Review | | | 103 | | 34 | | 34 |
Tax services | | | 511 | | 130 | | 146 |
Corporate finance services – SEC regulatory reporting accounting | | | 705 | | – | | – |
– UK reporting accountant | | | 1,140 | | – | | – |
– Due diligence | | | 316 | | – | | – |
– Other | | | 28 | | – | | – |
Total non audit fees | | | 2,803 | | 164 | | 180 |
9. Staff Costs
The average monthly number of employees (including executive directors) was:
| | | | | | |
| | | 52 weeks ended
1 January 2010 | | 53 weeks ended
2 January 2009 | | 52 weeks ended
28 December 2007 |
| | | Number | | Number | | Number |
Research and development | | 811 | | 697 | | 670 |
Sales and marketing | | 238 | | 240 | | 232 |
General and administrative | | 118 | | 112 | | 110 |
| | | 1,167 | | 1,049 | | 1,012 |
CSR plc Annual Report and Financial Statements 2009
115
NOTES TO THE CONSOLIDATED FINANCIAL STATEMENTS continued
9. Staff Costs (continued)
Their aggregate remuneration comprised:
| | | | | | |
| | | 52 weeks ended
1 January 2010 | | 53 weeks ended
2 January 2009 | | 52 weeks ended
28 December 2007 |
| | | $’000 | | $’000 | | $’000 |
Salaries | | 128,160 | | 104,720 | | 96,921 |
Social security costs | | 9,945 | | 10,479 | | 9,147 |
Other pension costs | | 6,551 | | 7,221 | | 5,935 |
Share option charges* | | 10,584 | | 7,586 | | 9,275 |
| | | 155,240 | | 130,006 | | 121,278 |
* Share option charges for the 53 weeks ended 2 January 2009 include $0.2 million included within “Restructuring charges” (see note 30).
10. Finance Costs
| | | | | | | |
| | | 52 weeks ended
1 January 2010 | | | 53 weeks ended
2 January 2009 | | 52 weeks ended
28 December 2007 |
| | | $’000 | | | $’000 | | $’000 |
Interest expense and similar charges | | 795 | | | 286 | | 237 |
Unwinding of discount on contingent consideration | | – | | | 1,141 | | 1,602 |
Unwinding of discount on onerous lease provision | | 459 | | | – | | – |
Interest payable on acquisition loan notes | | – | | | – | | 100 |
Foreign exchange (gains) losses | | (1,011 | ) | | 2,648 | | 498 |
| | | 243 | | | 4,075 | | 2,437 |
11. Taxation
| | | | | | | | | |
| | | 52 weeks ended
1 January 2010 | | | 53 weeks ended
2 January 2009 | | | 52 weeks ended
28 December 2007 | |
| | | $’000 | | | $’000 | | | $’000 | |
Current income tax (recoverable) payable for the year | | (4,820 | ) | | 5,517 | | | 38,311 | |
Current income tax benefit recognised in equity (note 25) | | 1,048 | | | 1,359 | | | 5,511 | |
Current income tax charge | | (3,772 | ) | | 6,876 | | | 43,822 | |
Adjustment in respect of current income tax of prior years | | 738 | | | (1,835 | ) | | 1,195 | |
Total current income tax (credit) charge | | 3,034 | | | 5,041 | | | 45,017 | |
Deferred tax (credit) charge | | (3,235 | ) | | (3,086 | ) | | 322 | |
Deferred tax rate change impact | | – | | | – | | | (1,088 | ) |
Adjustment in respect of deferred tax of prior years | | 3,336 | | | (1,467 | ) | | (1,456 | ) |
Total deferred tax charge (credit) (note 19) | | 101 | | | (4,553 | ) | | (2,222 | ) |
Total tax (credit) charge | | (2,933 | ) | | 488 | | | 42,795 | |
Corporation tax is calculated at 28.0% (2008: 28.5%; 2007: 30%); of the estimated assessable (loss) profit for the year.
Taxation for other jurisdictions is calculated at the rates prevailing in the respective jurisdictions.
CSR plc Annual Report and Financial Statements 2009
116
11. Taxation (continued)
The (credit) charge for the year can be reconciled to the (loss) profit per the income statement as follows:
| | | | | | | | | | | | | | | | | | |
| | | 52 weeks ended
1 January 2010 | | | 53 weeks ended
2 January 2009 | | | 52 weeks ended
28 December 2007 | |
| | | $’000 | | | % | | | $’000 | | | % | | | $’000 | | | % | |
(Loss) profit before tax | | (14,242 | ) | | 100.0 | | | (6,451 | ) | | 100.0 | | | 155,599 | | | 100.0 | |
| | | | | | |
Tax at the UK corporation tax rate of 28.0% (2008: 28.5%, 2007: 30%) | | (3,988 | ) | | 28.0 | | | (1,839 | ) | | 28.5 | | | 46,680 | | | 30.0 | |
Tax benefit of additional specific tax reliefs | | (7,727 | ) | | 54.3 | | | (6,020 | ) | | 93.3 | | | (5,628 | ) | | (3.6 | ) |
Non taxable income on intercompany financing | | – | | | – | | | (3,154 | ) | | 48.9 | | | – | | | – | |
Effect of different tax rates of subsidiaries operating in other tax jurisdictions | | (2,320 | ) | | 16.3 | | | 707 | | | (11.0 | ) | | 539 | | | 0.3 | |
Adjustments to tax charge in respect of prior years | | 4,074 | | | (28.6 | ) | | (3,302 | ) | | 51.2 | | | (261 | ) | | (0.2 | ) |
Impairment of goodwill | | – | | | – | | | 10,804 | | | (167.5 | ) | | – | | | – | |
Deferred tax rate adjustments | | – | | | – | | | – | | | – | | | (1,088 | ) | | (0.7 | ) |
Non-deductible expenses | | 3,647 | | | (25.6 | ) | | 3,292 | | | (51.0 | ) | | 2,553 | | | 1.7 | |
De-recognition of tax losses | | 1,171 | | | (8.2 | ) | | – | | | – | | | – | | | – | |
Acquisition related legal and professional costs | | 2,210 | | | (15.6 | ) | | – | | | – | | | – | | | – | |
Tax (credit) expense and effective tax rate for the period | | (2,933 | ) | | 20.6 | | | 488 | | | (7.6 | ) | | 42,795 | | | 27.5 | |
In March 2007, the UK Government announced that they would introduce legislation that reduced the corporation tax rate to 28% from 1 April 2008. This legislation was fully enacted. The deferred tax assets and liabilities, previously stated at 30% of the temporary differences were remeasured to 28% of those amounts. In addition, the blended current tax rate for the 53 weeks ended 2 January 2009 reduced to 28.5%.
Adjustments to tax charge in respect of prior periods is due to the tax effect of acquisition accounting adjustments in 2009, the revision of the estimated tax benefits of research and development claims in 2008 and 2009 and remeasuring foreign exchange impacts on the recognised tax provisions in 2008.
Non-deductible expenses include items not deductible for tax purposes such as legal and professional fees, and in 2008 and 2007, the unwinding of the discount on the contingent consideration and also some share option expenses. In 2007, this also included additional provision related to uncertain tax positions.
$1.6 million of current tax benefit has been recognised in equity for a prior year deduction agreed with the tax authorities for the share option gains of a former employee. We are in continuing discussions regarding an additional amount related to share option gains which if agreed would give a further benefit of up to five times the amount already recognised.
12. Earnings Per Share
The calculations of earnings per share are based on the following data:
| | | | | | | | |
| | | 52 weeks ended
1 January 2010 | | | 53 weeks ended
2 January 2009 | | | 52 weeks ended
28 December 2007 |
| | | $’000 | | | $’000 | | | $’000 |
Earnings | | | | | | | | |
(Loss) earnings for the financial period | | (11,309 | ) | | (6,939 | ) | | 112,804 |
| | | |
| | | Number of shares | | | Number of shares | | | Number of shares |
Number of shares | | | | | | | | |
Weighted average number of shares: | | | | | | | | |
For basic earnings per share | | 153,927,671 | | | 128,617,601 | | | 130,690,101 |
Effect of dilutive potential ordinary shares – share options | | – | | | – | | | 4,906,720 |
For diluted earnings per share | | 153,927,671 | | | 128,617,601 | | | 135,596,821 |
CSR plc Annual Report and Financial Statements 2009
117
NOTES TO THE CONSOLIDATED FINANCIAL STATEMENTS continued
12. Earnings Per Share (continued)
The dilutive effect of potential ordinary shares is nil as a loss has been made in the 52 weeks ended 1 January 2010 (53 weeks ended 2 January 2009: nil) however there were 3,520,499 potentially dilutive options at 1 January 2010 (2 January 2009: 1,993,152; 28 December 2007: 4,906,720).
13. Goodwill
| | | |
| | | $’000 | |
Cost and carrying amount | | | |
At 30 December 2006 | | 51,952 | |
Recognition on acquisition of subsidiaries | | 92,534 | |
Adjustment for recognition of deferred tax asset | | (279 | ) |
At 28 December 2007 | | 144,207 | |
Impairment losses for the period | | (36,907 | ) |
Adjustment for recognition of deferred tax asset | | (978 | ) |
At 2 January 2009 | | 106,322 | |
Recognised on acquisition of SiRF Technology Holdings Inc. | | 139,577 | |
Adjustment to estimated contingent consideration | | (17,500 | ) |
Adjustment of deferred tax (note 19) | | (6,948 | ) |
At 1 January 2010 | | 221,451 | |
At the time of the acquisitions of Clarity Technologies in 2005 and CPS Limited and NordNav Technologies AB in 2007, the acquired entities included brought forward tax losses. SiRF Technology Holdings Inc also included brought forward tax losses on acquisition in 2009.
These were recognised only to the extent that deferred tax liabilities related to temporary timing differences existed. During 2007 and 2008, a further deferred tax asset was recognised for some of these losses related to Clarity Technologies Inc, and NordNav Technologies AB, and, in accordance with IFRS 3 (as issued in 2004), an equivalent adjustment was made to goodwill. This resulted in a charge of $978,000 in 2008 (2007: $279,000) that was included within administrative expenses. During 2009, CSR plc implemented IFRS 3 (revised), this has resulted in a prospective change in accounting, and current year and future deferred tax adjustments will not impact goodwill.
The estimated contingent consideration related to the 2007 acquisition of NordNav Technologies AB, in line with current forecasts of the amount due under the sale and purchase agreement (note 22).
Goodwill acquired in a business combination is allocated, at acquisition, to the cash generating units that are expected to benefit from that business combination. The carrying amount of goodwill has been allocated as follows:
| | | | | | |
| | | 1 January 2010 | | 2 January 2009 | | 28 December 2007 |
| Reportable segments and cash generating units | | $’000 | | $’000 | | $’000 |
HBU | | 151,477 | | 91,835 | | 129,441 |
ACBU | | 18,570 | | 5,795 | | 5,906 |
APBU | | 51,404 | | 8,692 | | 8,860 |
| | | 221,451 | | 106,322 | | 144,207 |
In 2006, goodwill acquired in a business combination was allocated to the single cash-generating unit. As a result of an internal reorganisation at the end of 2006, goodwill was reallocated to the cash generating units expected to receive the benefit based on the relative fair value of each cash generating unit. Following the acquisition of SiRF Technology Holdings Inc, there was a further internal reorganisation; existing goodwill was allocated to the appropriate new cash generating units which integrated the previous cash generating units and new SiRF goodwill arising on that acquisition was allocated to the cash generating units expected to receive the future benefits of the acquisition such as the expected revenue synergies and cost savings.
Goodwill of $139.6 million was recognised on the acquisition of SiRF during 2009. Of this, $84.1 million was allocated to the handset cash generating unit, $12.8 million was allocated to the audio and consumer cash generating unit and $42.7 million was allocated to the automotive and PND cash generating unit, based on the expected future benefits for these cash generating units.
CSR plc Annual Report and Financial Statements 2009
118
13. Goodwill (continued)
Also during the period, the estimated remaining consideration payable on the NordNav acquisition was adjusted from $17.5 million to $nil in line with current forecasts of the amount due under the sale and purchase agreement, this adjustment decreased the goodwill allocated to the handset cash generating unit.
The Group tests goodwill annually for impairment or more frequently if there are indications that goodwill might be impaired. Following the annual impairment test which takes place in the fourth quarter of each year, it was determined that no further impairment of goodwill is required.
The recoverable amount of each cash-generating unit is determined from a value in use calculation. The key assumptions for the value in use calculations are those regarding the discount rates, terminal growth rates, future growth in sales and expected changes to selling prices and direct costs during the period. These assumptions have been revised in the year in light of the continuing difficult economic conditions, this has resulted in more conservative estimates about the future and specifically a reduction in the terminal growth rate used for the impairment calculation. Management estimates discount rates using pre-tax rates that reflect current market assessments of the time value of money and the risks specific to CSR.
Changes in selling prices and direct costs are based on historical information and expectations of future changes in the market.
The Group has conducted sensitivity analysis on a variety of scenarios on the impairment test of each CGU’s carrying value. The sensitivity analysis demonstrates that sufficient headroom exists to ensure the carrying value exceeds the recoverable amount for all reasonable scenarios likely to occur.
For all cash generating units the Group prepares cash flow forecasts derived from the most recent financial budget approved by management for the next year and extrapolates cash flow forecasts for the following four years, based on long range plans. These long range plans are based on recent reports on the markets we operate in produced by independent analysts. Management uses this information to produce realistic plans when combined with internal and customer specific information. The key factor in the cash flow forecasts is the ability to forecast revenue. A terminal value is included for the period beyond five years from the balance sheet date based on the estimated cash flow in the fifth year and a terminal growth rate of 1.5% (2008: 2.5%). This terminal growth rate does not exceed the average long-term growth rate for the relevant markets.
The rate used to discount the forecast cash flows is 9% (2008: 9%; 2007: 9%).
CSR plc Annual Report and Financial Statements 2009
119
NOTES TO THE CONSOLIDATED FINANCIAL STATEMENTS continued
14. Other Intangible Assets
| | | | | | | | | | | | | | | | | | | |
| | | Internally
Developed
Technology | | Trade
names | | Purchased
Developed
Technology | | Purchased in process
research and
development | | Customer
contracts and
relationships | | Software
licences | | | Assets in the course of
construction | | | Total | |
| | | $’000 | | $’000 | | $’000 | | $’000 | | $’000 | | $’000 | | | $’000 | | | $’000 | |
Cost | | | | | | | | | | | | | | | | | | | |
At 29 December 2006 | | – | | – | | – | | 13,400 | | 2,000 | | 34,964 | | | – | | | 50,364 | |
Additions | | – | | – | | – | | – | | – | | 7,087 | | | – | | | 7,087 | |
Acquired with acquisition of subsidiary | | – | | – | | – | | 23,500 | | – | | – | | | – | | | 23,500 | |
Disposals | | – | | – | | – | | – | | – | | (1,183 | ) | | – | | | (1,183 | ) |
At 28 December 2007 | | – | | – | | – | | 36,900 | | 2,000 | | 40,868 | | | – | | | 79,768 | |
Additions | | – | | – | | – | | – | | – | | 2,419 | | | 1,345 | | | 3,764 | |
Disposals | | – | | – | | – | | – | | – | | (8,940 | ) | | – | | | (8,940 | ) |
At 2 January 2009 | | – | | – | | – | | 36,900 | | 2,000 | | 34,347 | | | 1,345 | | | 74,592 | |
Additions | | – | | – | | – | | – | | – | | 558 | | | 5,390 | | | 5,948 | |
Disposals | | – | | – | | – | | – | | – | | (661 | ) | | – | | | (661 | ) |
Transfers | | 3,388 | | – | | – | | – | | – | | – | | | (3,388 | ) | | – | |
Acquired with acquisition of subsidiary | | – | | 2,300 | | 11,600 | | 3,900 | | 11,500 | | 1,236 | | | – | | | 30,536 | |
At 1 January 2010 | | 3,388 | | 2,300 | | 11,600 | | 40,800 | | 13,500 | | 35,480 | | | 3,347 | | | 110,415 | |
| | | | | | | | |
Amortisation | | | | | | | | | | | | | | | | | | | |
At 29 December 2006 | | – | | – | | – | | 1,940 | | 1,036 | | 15,702 | | | – | | | 18,678 | |
Charge for the year | | – | | – | | – | | 5,942 | | 667 | | 10,427 | | | – | | | 17,036 | |
Disposals | | – | | – | | – | | – | | – | | (1,090 | ) | | – | | | (1,090 | ) |
At 28 December 2007 | | – | | – | | – | | 7,882 | | 1,703 | | 25,039 | | | – | | | 34,624 | |
Charge for the year | | – | | – | | – | | 5,121 | | 297 | | 5,050 | | | – | | | 10,468 | |
Disposals | | – | | – | | – | | – | | – | | (3,900 | ) | | – | | | (3,900 | ) |
Impairment losses | | – | | – | | – | | 9,603 | | – | | 3,000 | | | – | | | 12,603 | |
At 2 January 2009 | | – | | – | | – | | 22,606 | | 2,000 | | 29,189 | | | – | | | 53,795 | |
Charge for the year | | 188 | | 599 | | 2,014 | | 5,244 | | 1,610 | | 2,205 | | | – | | | 11,860 | |
Disposals | | – | | – | | – | | – | | – | | (214 | ) | | – | | | (214 | ) |
At 1 January 2010 | | 188 | | 599 | | 2,014 | | 27,850 | | 3,610 | | 31,180 | | | – | | | 65,441 | |
| | | | | | | | |
Carrying amount | | | | | | | | | | | | | | | | | | | |
At 1 January 2010 | | 3,200 | | 1,701 | | 9,586 | | 12,950 | | 9,890 | | 4,300 | | | 3,347 | | | 44,974 | |
At 2 January 2009 | | – | | – | | – | | 14,294 | | – | | 5,158 | | | 1,345 | | | 20,797 | |
At 28 December 2007 | | – | | – | | – | | 29,018 | | 297 | | 15,829 | | | – | | | 45,144 | |
| | | | | | | | |
Leased assets included above: | | | | | | | | | | | | | | | | | | | |
| | | | | | | | |
At 1 January 2010 | | – | | – | | – | | – | | – | | – | | | – | | | – | |
At 2 January 2009 | | – | | – | | – | | – | | – | | 211 | | | – | | | 211 | |
At 28 December 2007 | | – | | – | | – | | – | | – | | 3,209 | | | – | | | 3,209 | |
The impairment losses of $12.6 million in 2008 are included within “Administrative expenses” in the income statement and relate to acquisition-related intangible assets and software licences which were written off as the result of the Operational Assessment in 2008.
At 1 January 2010, the Group had entered into contractual commitments for the acquisition of other intangible assets amounting to $973,000 (2008:$ nil; 2007: $ nil).
CSR plc Annual Report and Financial Statements 2009
120
15. Property, Plant and Equipment
| | | | | | | | | | | | | | | | | | | | | |
| | | Test
equipment | | | Leasehold
improvements | | | Furniture
and fittings | | | Computer
equipment | | | Office
equipment | | | Assets
in the course of
construction | | | Total | |
| | | $’000 | | | $’000 | | | $’000 | | | $’000 | | | $’000 | | | $’000 | | | $’000 | |
Cost | | | | | | | | | | | | | | | | | | | | | |
At 29 December 2006 | | 49,837 | | | 3,593 | | | 3,585 | | | 20,316 | | | 2,373 | | | – | | | 79,704 | |
Additions | | 15,634 | | | 3,687 | | | 642 | | | 3,147 | | | 589 | | | 937 | | | 24,636 | |
Disposals | | (1,099 | ) | | (27 | ) | | (583 | ) | | (2,362 | ) | | (100 | ) | | – | | | (4,171 | ) |
Acquired with acquisition of subsidiary | | 701 | | | – | | | 283 | | | 327 | | | 56 | | | – | | | 1,367 | |
At 28 December 2007 | | 65,073 | | | 7,253 | | | 3,927 | | | 21,428 | | | 2,918 | | | 937 | | | 101,536 | |
Additions | | 11,988 | | | 389 | | | 567 | | | 5,944 | | | 412 | | | – | | | 19,300 | |
Disposals | | (494 | ) | | – | | | (43 | ) | | (3,841 | ) | | (149 | ) | | – | | | (4,527 | ) |
Transfers | | 937 | | | – | | | – | | | – | | | – | | | (937 | ) | | – | |
At 2 January 2009 | | 77,504 | | | 7,642 | | | 4,451 | | | 23,531 | | | 3,181 | | | – | | | 116,309 | |
Additions | | 3,508 | | | 378 | | | 256 | | | 2,959 | | | 551 | | | – | | | 7,652 | |
Disposals | | (152 | ) | | – | | | (154 | ) | | (479 | ) | | (14 | ) | | – | | | (799 | ) |
Acquired with acquisition of subsidiary | | 1,850 | | | 306 | | | 11 | | | 909 | | | 89 | | | – | | | 3,165 | |
At 1 January 2010 | | 82,710 | | | 8,326 | | | 4,564 | | | 26,920 | | | 3,807 | | | – | | | 126,327 | |
| | | | | | | |
Depreciation | | | | | | | | | | | | | | | | | | | | | |
At 29 December 2006 | | 18,226 | | | 823 | | | 1,313 | | | 12,765 | | | 1,123 | | | – | | | 34,250 | |
Charge for the year | | 9,451 | | | 1,276 | | | 545 | | | 5,474 | | | 681 | | | – | | | 17,427 | |
Disposals | | (1,082 | ) | | (8 | ) | | (560 | ) | | (2,350 | ) | | (96 | ) | | – | | | (4,096 | ) |
Acquired with acquisition of subsidiary | | 545 | | | – | | | 279 | | | 194 | | | 13 | | | – | | | 1,031 | |
At 28 December 2007 | | 27,140 | | | 2,091 | | | 1,577 | | | 16,083 | | | 1,721 | | | – | | | 48,612 | |
Charge for the year | | 12,133 | | | 2,000 | | | 757 | | | 4,566 | | | 679 | | | – | | | 20,135 | |
Disposals | | (320 | ) | | – | | | (37 | ) | | (3,618 | ) | | (44 | ) | | – | | | (4,019 | ) |
Impairment losses | | 3,408 | | | – | | | – | | | – | | | – | | | – | | | 3,408 | |
At 2 January 2009 | | 42,361 | | | 4,091 | | | 2,297 | | | 17,031 | | | 2,356 | | | – | | | 68,136 | |
Charge for the year | | 11,952 | | | 1,394 | | | 1,127 | | | 3,328 | | | 582 | | | – | | | 18,383 | |
Disposals | | (99 | ) | | – | | | (142 | ) | | (488 | ) | | (14 | ) | | – | | | (743 | ) |
At 1 January 2010 | | 54,214 | | | 5,485 | | | 3,282 | | | 19,871 | | | 2,924 | | | – | | | 85,776 | |
Carrying amount | | | | | | | | | | | | | | | | | | | | | |
At 1 January 2010 | | 28,496 | | | 2,841 | | | 1,282 | | | 7,049 | | | 883 | | | – | | | 40,551 | |
At 2 January 2009 | | 35,143 | | | 3,551 | | | 2,154 | | | 6,500 | | | 825 | | | – | | | 48,173 | |
At 28 December 2007 | | 37,933 | | | 5,162 | | | 2,350 | | | 5,345 | | | 1,197 | | | 937 | | | 52,924 | |
| | | | | | | |
Leased assets included above: | | | | | | | | | | | | | | | | | | | | | |
| | | | | | | |
Carrying amount | | | | | | | | | | | | | | | | | | | | | |
At 1 January 2010 | | – | | | – | | | – | | | – | | | 624 | | | – | | | 624 | |
At 2 January 2009 | | – | | | – | | | – | | | – | | | 981 | | | – | | | 981 | |
At 28 December 2007 | | – | | | – | | | – | | | – | | | 6 | | | – | | | 6 | |
At 1 January 2010, the Group had entered into contractual commitments for the acquisition of property, plant and equipment amounting to $31,000 (2008: $nil; 2007: $nil).
The impairment losses in 2008 of $3.4 million were included within “Administrative expenses” in the income statement and relate to tangible assets which have been written down to their recoverable amount as a result of the Operational Assessment which took
CSR plc Annual Report and Financial Statements 2009
121
NOTES TO THE CONSOLIDATED FINANCIAL STATEMENTS continued
15. Property, Plant and Equipment (continued)
place in 2008 (see note 30). Their recoverable amount was the fair value of the assets less their estimated costs to sell, with the fair value less their estimated costs to sell being determined by reference to an active market for those assets.
16. Inventories
| | | | | | |
| | | 1 January 2010 | | 2 January 2009 | | 28 December 2007 |
| | | $’000 | | $’000 | | $’000 |
Raw materials | | 19,081 | | 37,403 | | 16,819 |
Work in progress | | 10,475 | | 1,765 | | 10,724 |
Finished goods | | 42,789 | | 27,033 | | 49,713 |
| | | 72,345 | | 66,201 | | 77,256 |
17. Other Financial Assets
| | | | | | |
| Trade and other receivables | | 1 January 2010 | | 2 January 2009 | | 28 December 2007 |
| | | $’000 | | $’000 | | $’000 |
Amounts receivable for sale of goods and software | | 80,986 | | 64,971 | | 81,593 |
Amounts receivable for royalties | | 3,267 | | 272 | | 47 |
Total trade receivables | | 84,253 | | 65,243 | | 81,640 |
VAT | | 735 | | 1,649 | | 1,696 |
Other debtors | | 3,339 | | 2,819 | | 5,067 |
Prepayments and accrued income | | 11,020 | | 10,706 | | 8,616 |
| | | 99,347 | | 80,417 | | 97,019 |
The average credit period taken on trade receivables is 40 days (2008: 58 days; 2007: 37 days). An allowance has been made for estimated irrecoverable amounts within trade receivables of $114,000 (2008: $3,000; 2007: $3,000). This allowance has been determined by reference to past default experience. An allowance for credit notes and price adjustments has also been made within trade receivables of $557,000 (2008: $1,902,000; 2007: $150,000).
Before accepting any new customers, the Group uses a credit scoring system to assess the potential customer’s credit quality and define credit limits by customer. Credit limits and credit quality are regularly reviewed.
It is the policy of the Group to only transact with creditworthy entities to mitigate the risk of default associated with trade receivables. The Group provides for trade receivables based on amounts estimated as irrecoverable determined by reference to past default experience.
The directors consider that the carrying amount of trade and other receivables approximates to their fair value.
Cash and Cash Equivalents
Bank balances and cash comprise cash held by the Group and short term bank deposits with an original maturity of three months or less. The carrying amount of these assets approximates to their fair value.
Treasury Deposits and Investment
Treasury deposits and investments represent bank deposits and obligations of the United States treasury with an original maturity of over three months. Some of these amounts are held as FVTPL assets (see note 33).
Credit Risk
The Group’s principal financial assets are bank balances and cash, treasury deposits and trade and other receivables.
The credit risk on liquid funds and derivative financial instruments is actively managed to limit the associated risk and counterparties are banks with high credit ratings assigned by international credit rating agencies.
CSR plc Annual Report and Financial Statements 2009
122
17. Other Financial Assets (continued)
Credit Risk (continued)
Exposure to credit risk
The carrying amount of financial assets represents the maximum credit exposure. The maximum exposure to credit risk at the reporting date was:
| | | | | | |
| | | 1 January 2010 | | 2 January 2009 | | 28 December 2007 |
| | | $’000 | | $’000 | | $’000 |
Total trade receivables | | 84,253 | | 65,243 | | 81,640 |
Cash and cash equivalents | | 170,601 | | 180,898 | | 193,311 |
Treasury deposits and investments | | 241,763 | | 81,000 | | 52,065 |
Derivative financial instruments | | 2,397 | | – | | 696 |
| | | 499,014 | | 327,141 | | 327,712 |
The maximum exposure to credit risk for total trade receivables at the reporting date by geographic region was:
| | | | | | |
| | | 1 January 2010 | | 2 January 2009 | | 28 December 2007 |
| | | $’000 | | $’000 | | $’000 |
Europe | | 16,621 | | 10,815 | | 13,906 |
USA | | 7,695 | | 11,623 | | 6,540 |
Asia | | 53,109 | | 41,527 | | 60,438 |
Other | | 6,828 | | 1,278 | | 756 |
| | | 84,253 | | 65,243 | | 81,640 |
The Group’s exposure to credit risk is spread over a number of counterparties and customers with limited concentrations.
The Group’s largest customer accounts for $1.6 million of trade receivables at 1 January 2010 (2 January 2009: $7.5 million; 28 December 2007: $18.4 million).
Impairment Losses
The aging of total trade receivables at the reporting date was:
| | | | | | | | | | | | | | | |
| | | Gross
1 January
2010 | | Impairment
1 January
2010 | | | Gross
2 January
2009 | | Impairment
2 January
2009 | | | Gross
28 December
2007 | | Impairment
28 December
2007 | |
| | | $’000 | | $’000 | | | $’000 | | $’000 | | | $’000 | | $’000 | |
Not past due | | 72,405 | | (174 | ) | | 59,155 | | (1,502 | ) | | 79,071 | | (150 | ) |
Past due 1–30 days | | 10,305 | | – | | | 6,964 | | (100 | ) | | 2,654 | | – | |
Past due 31–60 days | | 1,753 | | (151 | ) | | 500 | | – | | | 5 | | – | |
Past due 61–90 days | | – | | – | | | 529 | | (303 | ) | | – | | – | |
Past due 91–120 days | | 112 | | – | | | – | | – | | | – | | – | |
More than 121 days past due | | 349 | | (346 | ) | | – | | – | | | 63 | | (3 | ) |
| | | 84,924 | | (671 | ) | | 67,148 | | (1,905 | ) | | 81,793 | | (153 | ) |
The movement in the allowances in respect of trade receivables during the period was as follows:
| | | | | | | | | |
| | | 1 January 2010 | | | 2 January 2009 | | | 28 December 2007 | |
| | | $’000 | | | $’000 | | | $’000 | |
Balance at the beginning of the period | | 1,905 | | | 153 | | | 242 | |
Utilised in the period | | (3,159 | ) | | (403 | ) | | (3,211 | ) |
Additional provisions in the period | | 1,925 | | | 2,155 | | | 3,122 | |
Balance at the end of the period | | 671 | | | 1,905 | | | 153 | |
CSR plc Annual Report and Financial Statements 2009
123
NOTES TO THE CONSOLIDATED FINANCIAL STATEMENTS continued
17. Other Financial Assets (continued)
Credit Risk (continued)
Included in the Group’s trade receivables balance are debtors with a carrying amount of $12,022,000 (2008: $7,590,000; 2007: $2,719,000) which are past due but for which the Group has not provided, as there has been no significant change in the credit quality of the receivables and the amounts are still considered recoverable. $8.7 million of the past due but not provided trade receivables were received within two weeks of the balance sheet date (2008: $6.0 million; 2007: $1.9 million).
Based on past experience, the Group believes that no impairment allowance is necessary in respect of trade receivables not past due, other than for credit notes or price adjustments.
18. Derivative Financial Instruments
Currency Derivatives
The Group utilises currency derivatives to hedge significant future transactions and cash flows. The instruments purchased are denominated in GBP.
At the balance sheet date, the total notional amount of outstanding forward foreign exchange contracts that the Group has committed is as below:
| | | | | | |
| | | 1 January 2010 | | 2 January 2009 | | 28 December 2007 |
| | | $’000 | | $’000 | | $’000 |
Forward foreign exchange contracts | | 86,747 | | 121,640 | | 178,628 |
These arrangements are designed to address significant exchange exposures for the next 15 months (2008: 13 months) and are renewed on a rolling basis to cover between 11 and 15 months forward.
At the balance sheet date, the fair value of the Group’s currency derivatives is shown below:
Derivatives that are designated and effective as hedging instruments carried at fair value
| | | | | | | | | |
| | | 1 January 2010 | | | 2 January 2009 | | | 28 December 2007 | |
| | | $’000 | | | $’000 | | | $’000 | |
Forward foreign exchange contracts – assets | | 2,120 | | | – | | | 181 | |
– liabilities | | (230 | ) | | (26,051 | ) | | (1,080 | ) |
| | | 1,890 | | | (26,043 | ) | | (899 | ) |
The fair value of currency derivatives that are designated and effective as cash flow hedges amounting to a net asset of $1,890,000 (2008: liability of $26,043,000; 2007:net liability of $899,000) has been deferred in equity.
Net amounts of $5,186,000 (2008: $3,876,000; 2007: $748,000) and $277,000 (2008: $183,000; 2007: $88,000) respectively have been transferred to operating expenses in the income statement and fixed assets in respect of contracts maturing in the period.
Financial assets (liabilities) Carried at Fair Value Through Profit or Loss (FVTPL)
| | | | | | | |
| | | 1 January 2010 | | 2 January 2009 | | | 28 December 2007 |
| | | $’000 | | $’000 | | | $’000 |
Forward foreign exchange contracts | | 277 | | (6,011 | ) | | 515 |
| | | 277 | | (6,011 | ) | | 515 |
The forward foreign exchange contracts carried at FVTPL in 2008 were previously designated as effective cash flow hedges but became ineffective as a result of the October 2008 restructuring programme. Further details of derivative financial instruments are given in note 33.
CSR plc Annual Report and Financial Statements 2009
124
19. Deferred Tax
The following are the major deferred tax assets and liabilities recognised by the Group and movements thereon during the period and prior reporting period:
| | | | | | | | | | | | | | | | | | | | | |
| | | Accelerated tax depreciation | | | Share-based
payment | | | Fair value
adjustments on
acquisition | | | Tax losses | | | Hedging
differences | | | Other short-term temporary differences | | | Total | |
| | | $’000 | | | $’000 | | | $’000 | | | $’000 | | | $’000 | | | $’000 | | | $’000 | |
At 29 December 2006 | | (10,507 | ) | | 17,376 | | | (3,587 | ) | | 3,368 | | | – | | | 4,700 | | | 11,350 | |
Credit (charge) to income | | 2,301 | | | 2,051 | | | 1,741 | | | (1,036 | ) | | – | | | (3,923 | ) | | 1,134 | |
(Charge) credit to equity | | – | | | (7,840 | ) | | – | | | 606 | | | 206 | | | – | | | (7,028 | ) |
Acquisition of subsidiary | | – | | | – | | | (6,948 | ) | | – | | | – | | | – | | | (6,948 | ) |
Deferred tax rate adjustment to income | | 547 | | | – | | | 586 | | | – | | | – | | | (45 | ) | | 1,088 | |
Deferred tax rate adjustment to equity | | – | | | (772 | ) | | – | | | – | | | (11 | ) | | – | | | (783 | ) |
At 28 December 2007 | | (7,659 | ) | | 10,815 | | | (8,208 | ) | | 2,938 | | | 195 | | | 732 | | | (1,187 | ) |
Credit (charge) to income | | 3,533 | | | (917 | ) | | 4,206 | | | (2,297 | ) | | – | | | 28 | | | 4,553 | |
(Charge) credit to equity | | – | | | (8,644 | ) | | – | | | 879 | | | 6,878 | | | – | | | (887 | ) |
At 2 January 2009 | | (4,126 | ) | | 1,254 | | | (4,002 | ) | | 1,520 | | | 7,073 | | | 760 | | | 2,479 | |
Credit (charge) to income | | 3,582 | | | 435 | | | 5,555 | | | (9,514 | ) | | – | | | (159 | ) | | (101 | ) |
Credit (charge) to equity | | – | | | 3,074 | | | – | | | – | | | (8,059 | ) | | – | | | (4,985 | ) |
On acquisition | | – | | | – | | | (14,057 | ) | | 14,057 | | | – | | | – | | | – | |
Adjustments to prior period acquisition accounting (note 13) | | – | | | – | | | – | | | 6,948 | | | – | | | – | | | 6,948 | |
At 1 January 2010 | | (544 | ) | | 4,763 | | | (12,504 | ) | | 13,011 | | | (986 | ) | | 601 | | | 4,341 | |
Certain deferred tax assets and liabilities have been offset where they relate to the same taxation authority and net settlement and offset is permitted. The following is the analysis of the deferred tax balances (after offset) for financial reporting purposes:
| | | | | | | | |
| | | 1 January 2010 | | 2 January 2009 | | | 28 December 2007 | |
| | | $’000 | | $’000 | | | $’000 | |
Deferred tax liabilities | | – | | (4,002 | ) | | (8,208 | ) |
Deferred tax assets | | 4,341 | | 6,481 | | | 7,021 | |
| | | 4,341 | | 2,479 | | | (1,187 | ) |
At the balance sheet date, the Group has unused tax losses of $261,542,000 (2008: $126,588,000; 2007:$175,564,000) available for offset against future profits. A deferred tax asset has been recognised in respect of $39,334,000 (2008: $4,416,000; 2007: $7,793,000) of such losses. No deferred tax asset has been recognised in respect of the remaining $222,208,000 (2008: $122,442,000; 2007: $167,771,000) due to the unpredictability of future profit streams within certain subsidiary entities. Included in unrecognised tax losses are losses of $107,647,000 (2008: $34,381,000; 2007: $47,819,000) that will expire in 5-20 years. Other losses may be carried forward indefinitely.
At the balance sheet date, no deferred tax liability has been recognised on temporary differences of $3,239,000 ( 2008: $22,974,000, 2007: $14,754,000) relating to the unremitted earnings of overseas subsidiaries as the Group is able to control the timing of the reversal of these temporary differences and it is probable that they will not reverse in the foreseeable future. The temporary differences at 1 January 2010 are significantly reduced from the previous year as a result of a change to UK tax legislation which largely exempts from UK tax, overseas dividends received on or after 1 July 2009. The temporary differences at 1 January 2010 represent only the unremitted earnings of those overseas subsidiaries where remittance to the UK of those earnings may still result in a tax liability, principally as a result of dividend withholding taxes levied by the overseas tax jurisdictions in which those subsidiaries operate.
As of 1 January 2010, the Group recognized deferred tax assets that exceed deferred tax liabilities by $4,341,000 in entities which have suffered a loss in the current period. This is based on management’s assessment that it is probable that the respective entities will have taxable profits against which the unused tax losses and deductible temporary differences can be utilized. Generally, in
CSR plc Annual Report and Financial Statements 2009
125
NOTES TO THE CONSOLIDATED FINANCIAL STATEMENTS continued
19. Deferred Tax (continued)
determining the amounts of deferred tax assets to be recognized, management uses profitability information and, if relevant, forecasted operating results, based upon approved business plans, including a review of the tax planning opportunities and other relevant considerations.
20. Obligations Under Finance Leases
| | | | | | | | | | | | | | | |
| | | Minimum lease payments | | Present value of minimum lease payments | |
| | | 1 January
2010 | | 2 January
2009 | | 28 December
2007 | | 1 January
2010 | | | 2 January
2009 | | | 28 December
2007 | |
| | | $’000 | | $’000 | | $’000 | | $’000 | | | $’000 | | | $’000 | |
Amounts payable under finance leases: | | | | | | | | | | | | | | | |
Within one year | | 326 | | 1,057 | | 3,109 | | 326 | | | 1,057 | | | 3,108 | |
In the second to fifth years inclusive | | – | | 293 | | 142 | | – | | | 293 | | | 142 | |
| | | 326 | | 1,350 | | 3,251 | | 326 | | | 1,350 | | | 3,250 | |
Less: future finance charges | | – | | – | | 1 | | – | | | – | | | – | |
Present value of lease | | 326 | | 1,350 | | 3,250 | | 326 | | | 1,350 | | | 3,250 | |
| Less: Amount due for settlement within 12 months (shown under current liabilities) | | | | | | | | (326 | ) | | (1,057 | ) | | (3,108 | ) |
Amount due for settlement after 12 months | | | | | | | | – | | | 293 | | | 142 | |
It is the Group’s policy to lease certain of its equipment under finance leases and purchase certain software licences under agreements containing deferred payment terms. The average lease term is 3.0 years. Interest rates are fixed at the contract date; all of the agreements containing deferred payment terms are interest free. For the period ended 1 January 2010, the average effective borrowing rate was 0% (2008: 0.14%). All leases are on a fixed repayment basis and no arrangements have been entered into for contingent rental payments.
Lease obligations with a present value of $326,000 (2008: $1,350,000; 2007: $1,045,000) are denominated in Sterling. All other obligations are denominated in US dollars.
The Group’s obligations under finance leases are secured by the lessors’ right over the leased assets.
21. Other Financial Liabilities
Trade and Other Payables
| | | | | | |
| | | 1 January 2010 | | 2 January 2009 | | 28 December 2007 |
| | | $’000 | | $’000 | | $’000 |
Trade creditors | | 52,472 | | 37,451 | | 62,681 |
Other taxation and social security | | 2,751 | | 2,809 | | 2,923 |
Other payables | | 29 | | 87 | | 3,778 |
Inventory accruals | | 17,259 | | 4,210 | | 4,201 |
Other accruals and deferred income | | 43,855 | | 17,613 | | 19,793 |
| | | 116,366 | | 62,170 | | 93,376 |
Trade creditors and accruals principally comprise amounts outstanding for trade purchases and ongoing costs. The average credit period taken for trade purchases is 61 days (2008: 64 days; 2007: 54 days).
The directors consider that the carrying amount of trade and other payables approximates to their fair value.
For most suppliers, no interest is charged on trade payables. The Group has financial risk management policies in place to ensure that all payables are paid within the credit time-frame.
CSR plc Annual Report and Financial Statements 2009
126
22. Contingent Consideration
| | | | | | |
| | | 1 January 2010 | | 2 January 2009 | | 28 December 2007 |
| | | $’000 | | $’000 | | $’000 |
Amounts included within current liabilities | | – | | 753 | | 25,988 |
Amounts included within non-current liabilities | | – | | 16,747 | | – |
| | | – | | 17,500 | | 25,988 |
The contingent consideration related to milestone payments for the acquisition of NordNav Technologies AB. The consideration will be settled in instalments if certain performance criteria are achieved before September 2010. In the previous reporting period, it was believed these performance criteria would be met. As at 1 January 2010, management considers the payment of the consideration a remote possibility.
23. Provisions
| | | | | | | | | | | | |
| | | Onerous contract
provision | | | Onerous lease
provision | | | Returns and warranty
provision | | | Total | |
| | | $’000 | | | $’000 | | | $’000 | | | $’000 | |
At 30 December 2006 | | – | | | – | | | 4,100 | | | 4,100 | |
On acquisition of subsidiary | | – | | | 546 | | | – | | | 546 | |
Additional provision in the period | | – | | | 178 | | | 176 | | | 354 | |
Released in the period | | – | | | – | | | (1,756 | ) | | (1,756 | ) |
Utilised in period | | – | | | (450 | ) | | (380 | ) | | (830 | ) |
At 28 December 2007 | | – | | | 274 | | | 2,140 | | | 2,414 | |
Additional provision in the period (note 29) | | – | | | 3,264 | | | 1,157 | | | 4,421 | |
Utilised in period | | – | | | (125 | ) | | (507 | ) | | (632 | ) |
At 2 January 2009 | | – | | | 3,413 | | | 2,790 | | | 6,203 | |
Additional provision in the period | | – | | | 2,349 | | | 1,956 | | | 4,305 | |
On acquisition of subsidiary | | 3,220 | | | – | | | 322 | | | 3,542 | |
Utilised in period | | (230 | ) | | (1,233 | ) | | (1,749 | ) | | (3,212 | ) |
At 1 January 2010 | | 2,990 | | | 4,529 | | | 3,319 | | | 10,838 | |
| | | | | | |
| | | 1 January
2010 | | 2 January
2009 | | 28 December
2007 |
| | | $’000 | | $’000 | | $’000 |
Amounts included within current liabilities | | 8,122 | | 4,408 | | 2,414 |
Amounts included within non-current liabilities | | 2,716 | | 1,795 | | – |
| | | 10,838 | | 6,203 | | 2,414 |
Onerous Lease Provision
The Group has provided for the discounted anticipated costs of satisfying the terms of any onerous leases, less any anticipated income from subletting the buildings. It is anticipated that the provision will be used over the remaining lease terms (6 years). The 2009 additional provision relates to onerous lease charges for buildings being vacated as part of the integration and restructuring activities that took place after the acquisition of SiRF Technology Holdings, Inc. in June 2009.
Returns and Warranty Provision
The Group provides for the anticipated costs associated with contractual liabilities under standard warranty terms. It is anticipated that the provision will be utilised within one year (see note 4).
Onerous Contract Provision
The Group has provided for the remaining costs due under a contract signed by SiRF Technology Inc in 2008. It was concluded prior to the completion of the acquisition that the intellectual property licensed under the contract was not going to be utilised in any SiRF products. There are no benefits expected to be realised from this contract. The payments are expected to be made during 2010.
CSR plc Annual Report and Financial Statements 2009
127
NOTES TO THE CONSOLIDATED FINANCIAL STATEMENTS continued
24. Called-up Share Capital
Company
Authorised Share Capital
| | | | | | |
| | | 1 January
2010 | | 2 January
2009 | | 28 December
2007 |
| | | £’000 | | £’000 | | £’000 |
350,000,000 (2 January 2009 and 28 December 2007:
185,000,000) Ordinary Shares of £0.001 each—equity | | 350 | | 185 | | 185 |
Allotted, Called-up and Fully Paid:
| | | | | | |
| | | 1 January
2010 | | 2 January
2009 | | 28 December
2007 |
| | | $’000 | | $’000 | | $’000 |
182,187,878 (2 January 2009: 132,890,821; 28 December 2007:132,073,576) Ordinary Shares of £0.001 each—equity | | 318 | | 238 | | 236 |
Changes to Share Capital:
Equity Shares:
1,638,801 Ordinary Shares were issued from employee option exercises between 3 January 2009 and 1 January 2010. Consideration was $2,253,576, at a premium of $2,250,987.
47,658,256 ordinary shares were issued on 26 June 2009 and admitted to trading on the London Stock Exchange. These shares represented the equity consideration for the acquisition of SiRF Technology Holdings Inc. (note 35) and represented a consideration of $271,524,109, at a premium of $271,446,364.
Fees of $1,847,406 were incurred as a consequence of the share issue and have been shown as a deduction from equity against share premium.
On the same date, 133,678,208 of CSR plc shares in issue were delisted and readmitted to the London Stock Exchange in accordance with the Listing Rules, as the acquisition of SiRF Technology Holdings Inc. represented a reverse takeover under the Listing Rules. The transaction is not treated as a reverse takeover for accounting purposes.
The Company has one class of ordinary shares which carry no right to fixed income.
CSR plc Annual Report and Financial Statements 2009
128
24. Called-up Share Capital (continued)
Changes to Share Capital: (continued)
The following options and share awards over Ordinary Shares of £0.001 have been granted and were outstanding at the end of the period:
| | | | | | | |
| Grant date | | Number of shares
subject to option or
share award | | Exercise price
per share £ | | Vesting
period | |
21 February 2000 to 4 October 2000 | | 360,601 | | 0.50333 | | 5 years | |
3 November 2000 to 15 January 2002 | | 420,635 | | 2.38500 | | 5 years | |
25 November 2002 to 10 November 2003 | | 156,194 | | 1.01000 | | 5 years | |
18 November 2003 to 2 February 2004 | | 152,202 | | 1.02500 | | 5 years | |
26 February 2004 | | 295,920 | | 2.35000 | | 3 years | |
26 February 2004 | | 75,422 | | 2.35000 | | 3 years | 2 |
26 February 2004 | | 111,100 | | 2.00000 | | 3 years | |
26 February 2004 | | 236,898 | | 2.00000 | | 3 years | 2 |
30 June 2004 | | 10,000 | | 4.02000 | | 3 years | 2 |
30 September 2004 | | 20,000 | | 3.62500 | | 3 years | 2 |
5 May 2005 | | 242,500 | | 3.21000 | | 3 years | 2 |
5 May 2005 | | 88,601 | | 0.00100 | | 3 years | |
5 May 2005 | | 113,371 | | 0.00100 | | 3 years | 1 |
1 March 2006 | | 25,000 | | 9.05000 | | 3 years | |
25 May 2006 | | 436,360 | | 12.4100 | | 5 years | |
25 May 2006 | | 18,804 | | 0.00100 | | 3 years | |
2 August 2006 | | 22,662 | | 11.0967 | | 5 years | |
1 November 2006 | | 1,763 | | 9.08800 | | 3 years | 3 |
15 November 2006 | | 87,966 | | 6.27000 | | 5 years | |
28 February 2007 | | 49,295 | | 7.68000 | | 5 years | |
28 February 2007 | | 25,122 | | 0.00100 | | 3 years | 1 |
28 February 2007 | | 57,399 | | 7.68000 | | 3 years | 2 |
28 March 2007 | | 50,997 | | 5.84800 | | 3 years | 3 |
9 May 2007 | | 44,881 | | 7.57000 | | 5 years | |
5 June 2007 | | 120,471 | | 0.00100 | | 3 years | 1 |
5 June 2007 | | 308,945 | | 7.86000 | | 3 years | 2 |
5 June 2007 | | 98,338 | | 0.00100 | | 3 years | |
1 August 2007 | | 63,318 | | 7.2900 | | 5 years | |
14 November 2007 | | 186,190 | | 6.4450 | | 3 years | 2 |
14 November 2007 | | 93,404 | | 6.4450 | | 5 years | |
14 November 2007 | | 93,603 | | 0.00100 | | 3 years | 1 |
14 November 2007 | | 25,000 | | 0.00100 | | 3 years | |
10 December 2007 | | 36,864 | | 5.156 | | 3 years | 3 |
5 March 2008 | | 73,485 | | 3.160 | | 5 years | |
5 March 2008 | | 315,202 | | 3.160 | | 3 years | 2 |
5 March 2008 | | 173,510 | | 0.00100 | | 3 years | 1 |
28 March 2008 | | 267,880 | | 2.528 | | 3 years | 3 |
11 June 2008 | | 312,945 | | 0.00100 | | 3 years | 1 |
11 June 2008 | | 575,237 | | 3.110 | | 3 years | 2 |
11 June 2008 | | 216,988 | | 0.00100 | | 3 years | |
11 June 2008 | | 170,703 | | 0.00100 | | 2 years | |
11 June 2008 | | 35,966 | | 3.110 | | 5 years | |
4 August 2008 | | 15,584 | | 0.00100 | | 3 years | 1 |
12 August 2008 | | 103,463 | | 3.2875 | | 3 years | 2 |
25 September 2008 | | 80,789 | | 2.7850 | | 3 years | 2 |
CSR plc Annual Report and Financial Statements 2009
129
NOTES TO THE CONSOLIDATED FINANCIAL STATEMENTS continued
24. Called-up Share Capital (continued)
Changes to Share Capital (continued)
| | | | | | | |
| Grant date | | Number of shares
subject to option or
share award | | Exercise price
per share £ | | Vesting
period | |
4 November 2008 | | 30,606 | | 0.00100 | | 2 years | |
4 November 2008 | | 16,746 | | 2.045 | | 3 years | |
12 March 2009 | | 45,041 | | 0.00100 | | 2 years | |
12 March 2009 | | 1,247,378 | | 0.00100 | | 3 years | 2 |
12 March 2009 | | 1,052,320 | | 2.0825 | | 3 years | 1 |
13 March 2009 | | 1,157,154 | | 1.6520 | | 3 years | 3 |
26 June 2009 | | 1,844,064 | | 0.00100 | | Various | |
26 June 2009 | | 4,174,310 | | Various | | Various | |
4 August 2009 | | 138,071 | | 4.2790 | | 3 years | 1 |
4 August 2009 | | 70,000 | | 0.00100 | | 3 years | 2 |
1 September 2009 | | 8,989 | | 0.00100 | | 2 years | |
| | | 16,256,257 | | | | | |
1 These options have vesting conditions based on the Company’s performance against comparator companies based on TSR rankings over the vesting period.
2 These options have vesting conditions based on EPS growth over the vesting period.
3 These options have been issued as part of the Company’s SAYE scheme.
Exercise period: Vested options and share awards are exercisable within ten years from the grant date, SAYE options are exercisable within 6 months of the vesting date.
CSR plc Annual Report and Financial Statements 2009
130
25. Reserves
| | | | | | | | | | | | | | | | | | | | | | | |
| | | Share
premium
account | | Capital
redemption
reserve | | Merger
reserve | | Employee
Benefit
Trust
Reserve | | | Hedging
reserve | | | Share-
based
payment
reserve | | Tax
reserve | | | Retained
earnings | | | Total | |
| | | $’000 | | $’000 | | $’000 | | $’000 | | | $’000 | | | $’000 | | $’000 | | | $’000 | | | $’000 | |
At 30 December 2006 | | 84,111 | | 950 | | 61,574 | | – | | | 3,171 | | | 11,003 | | 36,647 | | | 208,521 | | | 405,977 | |
Share issues (net of share issue costs) | | 5,815 | | – | | – | | – | | | – | | | – | | – | | | – | | | 5,815 | |
Share-based payment | | – | | – | | – | | – | | | – | | | 9,275 | | – | | | – | | | 9,275 | |
Deferred tax benefit on share option gains | | – | | – | | – | | – | | | – | | | – | | (7,234 | ) | | – | | | (7,234 | ) |
| Current tax benefit taken directly to equity on share option gains | | – | | – | | – | | – | | | – | | | – | | 5,511 | | | – | | | 5,511 | |
Purchase of own shares | | – | | – | | – | | (20,025 | ) | | – | | | – | | – | | | – | | | (20,025 | ) |
Current tax on hedging reserves | | – | | – | | – | | – | | | – | | | – | | 951 | | | – | | | 951 | |
Deferred tax on hedging reserve | | – | | – | | – | | – | | | – | | | – | | 206 | | | – | | | 206 | |
Effective tax rate adjustment | | – | | – | | – | | – | | | – | | | – | | (783 | ) | | – | | | (783 | ) |
Loss on cash flow hedges | | – | | – | | – | | – | | | (4,906 | ) | | – | | – | | | – | | | (4,906 | ) |
| Transferred to income statement in respect of cash flow hedges | | – | | – | | – | | – | | | 836 | | | – | | – | | | – | | | 836 | |
Profit for the period | | – | | – | | – | | – | | | – | | | – | | – | | | 112,804 | | | 112,804 | |
At 28 December 2007 | | 89,926 | | 950 | | 61,574 | | (20,025 | ) | | (899 | ) | | 20,278 | | 35,298 | | | 321,325 | | | 508,427 | |
Share issues (net of share issue costs) | | 1,522 | | – | | – | | – | | | – | | | – | | – | | | – | | | 1,522 | |
Share-based payment | | – | | – | | – | | – | | | – | | | 7,586 | | – | | | – | | | 7,586 | |
Deferred tax benefit on share option gains | | – | | – | | – | | – | | | – | | | – | | (7,765 | ) | | – | | | (7,765 | ) |
| Current tax benefit taken directly to equity on share option gains | | – | | – | | – | | – | | | – | | | – | | 1,359 | | | – | | | 1,359 | |
Purchase of own shares | | – | | – | | – | | (20,199 | ) | | – | | | – | | – | | | – | | | (20,199 | ) |
Deferred tax on hedging reserve | | – | | – | | – | | – | | | – | | | – | | 6,878 | | | – | | | 6,878 | |
Loss on cash flow hedges | | – | | – | | – | | – | | | (31,677 | ) | | – | | – | | | – | | | (31,677 | ) |
| Transferred to income statement in respect of cash flow hedges | | – | | – | | – | | – | | | 7,316 | | | – | | – | | | – | | | 7,316 | |
Loss for the period | | – | | – | | – | | – | | | – | | | – | | – | | | (6,939 | ) | | (6,939 | ) |
At 2 January 2009 | | 91,448 | | 950 | | 61,574 | | (40,224 | ) | | (25,260 | ) | | 27,864 | | 35,770 | | | 314,386 | | | 466,508 | |
Share issues (net of share issue costs) | | 271,584 | | – | | – | | – | | | – | | | – | | – | | | – | | | 271,584 | |
Share-based payment | | – | | – | | – | | – | | | – | | | 10,581 | | – | | | – | | | 10,581 | |
Acquisition-related share-based payment | | – | | – | | – | | – | | | – | | | 10,001 | | – | | | – | | | 10,001 | |
Deferred tax benefit on share option gains | | – | | – | | – | | – | | | – | | | – | | 3,074 | | | – | | | 3,074 | |
| Current tax benefit taken directly to equity on share option gains | | – | | – | | – | | – | | | – | | | – | | 1,048 | | | – | | | 1,048 | |
| Current tax benefit relating to prior years taken directly to equity on share option gains | | – | | – | | – | | – | | | – | | | – | | 1,600 | | | – | | | 1,600 | |
Gain on cash flow hedges | | – | | – | | – | | – | | | 34,228 | | | – | | | | | – | | | 34,228 | |
Deferred tax on hedging reserve | | – | | – | | – | | – | | | – | | | – | | (8,059 | ) | | – | | | (8,059 | ) |
| Transferred to income statement in respect of cash flow hedges | | – | | – | | – | | – | | | (5,463 | ) | | – | | – | | | – | | | (5,463 | ) |
Loss for the period | | – | | – | | – | | – | | | – | | | – | | – | | | (11,309 | ) | | (11,309 | ) |
At 1 January 2010 | | 363,032 | | 950 | | 61,574 | | (40,224 | ) | | 3,505 | | | 48,446 | | 33,433 | | | 303,077 | | | 773,793 | |
A tax reserve has been included to show movements in equity caused by tax adjustments reflecting movements in tax not recorded in the income statement.
CSR plc Annual Report and Financial Statements 2009
131
NOTES TO THE CONSOLIDATED FINANCIAL STATEMENTS continued
25. Reserves (continued)
The share premium account, capital redemption reserve and hedging reserve are not distributable. The merger reserve arose on the combination of CSR plc and Cambridge Silicon Radio Limited and is not distributable.
The Employee Benefit Trust Reserve represents the cost of shares in CSR plc purchased in the market and held by the CSR plc Employee Benefit Trust to satisfy options under the Group’s share option schemes. Between 18 March 2008 and 25 March 2008, the CSR Employee Benefit Trust (“the Trust”) purchased 3,222,813 ordinary shares at prices between £3.37 and £3.03. On 3 May 2007, the Trust purchased 334,890 ordinary shares at an average price of £7.41 pence per share. Between 6 June 2007 and 7 June 2007, the Trust purchased 336,425 ordinary shares at an average price of £7.38 per share. Between 26 September 2007 and 28 September 2007, the Trust purchased 795,452 ordinary shares at an average price of £6.24 per share.
The shares acquired by the Trust do not represent treasury shares for the purposes of the Companies Act and therefore remain as issued share capital.
For accounting purposes, the treatment of the shares acquired by the Trust is different. In preparing the consolidated Group accounts, the shares held by the Trust are treated as a deduction in shareholders’ equity.
26. Notes to the Cash Flow Statement
| | | | | | | | | |
| | | 52 weeks ended
1 January 2010 | | | 53 weeks ended
2 January 2009 | | | 52 weeks ended
28 December 2007 | |
| | | $’000 | | | $’000 | | | $’000 | |
Net (loss) profit for the period | | (11,309 | ) | | (6,939 | ) | | 112,804 | |
Adjustments for: | | | | | | | | | |
Investment income | | (1,915 | ) | | (6,139 | ) | | (7,938 | ) |
Finance costs | | 243 | | | 4,075 | | | 2,437 | |
Income tax (credit) expense | | (2,933 | ) | | 488 | | | 42,795 | |
Operating (loss) profit | | (15,914 | ) | | (8,515 | ) | | 150,098 | |
Depreciation of property, plant and equipment | | 18,383 | | | 20,135 | | | 17,427 | |
Amortisation of intangible assets | | 11,860 | | | 10,468 | | | 17,036 | |
Impairment of assets | | – | | | 52,918 | | | – | |
Deferred tax transfer to goodwill | | – | | | 978 | | | 279 | |
Loss on disposal of property, plant and equipment | | 56 | | | 545 | | | 75 | |
Loss on disposal of intangible assets | | 447 | | | 186 | | | 93 | |
Share related charges | | 10,581 | | | 7,586 | | | 9,275 | |
Increase (decrease) in provisions | | 4,313 | | | 3,789 | | | (1,814 | ) |
Operating cash flows before movements in working capital | | 29,726 | | | 88,090 | | | 192,469 | |
Decrease in inventories | | 8,679 | | | 11,055 | | | 29,319 | |
Decrease in receivables | | 3,642 | | | 17,253 | | | 8,173 | |
Increase (decrease) in payables | | 8,233 | | | (20,063 | ) | | 22,394 | |
Cash generated by operations | | 50,280 | | | 96,335 | | | 252,355 | |
Foreign taxes paid | | (782 | ) | | (1,290 | ) | | (1,117 | ) |
Corporation tax paid | | – | | | (28,738 | ) | | (28,702 | ) |
Interest paid | | (1,252 | ) | | (326 | ) | | (358 | ) |
R&D tax credit received | | 1,987 | | | 320 | | | – | |
Net cash from operating activities | | 50,233 | | | 66,301 | | | 222,178 | |
Cash and cash equivalents (which are presented as a single class of asset on the face of the balance sheet) comprise cash at bank and other short term highly liquid investments with an original maturity of three months or less.
Acquisition of subsidiaries in the 53 weeks to 2 January 2009 represents payments of contingent consideration arising from prior period acquisitions.
In the 52 weeks to 1 January 2010, additions to software licences during the year amounting to $nil were purchased under staged payment plans (2 January 2009: $nil; 28 December 2007: $2,260,000;).
CSR plc Annual Report and Financial Statements 2009
132
26. Notes to the Cash Flow Statement (continued)
The acquisition of SiRF Technology Holdings Inc in the 52 weeks ended 1 January 2010 (see note 35) was a significant non cash transaction in the period as the consideration for the transaction was satisfied through the issuance of additional shares (see note 24).
27. Contingent liabilities
Patent disputes
Broadcom Corp. v. SiRF Technology, Inc. and CSR plc, Case No. SACV08-546 (Central District of California, filed 14 May 2008)
On 14 May 2008, Broadcom Corporation (“Broadcom”) sued SiRF Technology, Inc. (“SiRF”) alleging infringement of four Broadcom patents. The suit, captioned Broadcom Corporation v. SiRF Technology, Inc., Case No. SACV08-546, is pending in the Federal District Court for the Central District of California. SiRF responded to Broadcom’s Complaint on 4 June 2008, denying infringement and alleging counterclaims seeking, inter alia, judicial declarations that SiRF does not infringe the patents-in-suit and that the patents are invalid.
On 13 October 2009, Broadcom filed a First Amended Complaint (“FAC”) adding CSR plc (“CSR”) as a defendant and asserting additional claims for false advertising under the Lanham Act, California Business and Professions Code section 17500, et. seq. (false advertising), and California Business and Professions Code section 17200, et seq. (unfair competition). Broadcom asserted each of its original and new claims against both SiRF and CSR.
SiRF and CSR responded to Broadcom’s FAC on 28 October 2009, denying infringement and alleging counterclaims seeking, inter alia, declarations that SiRF and CSR do not infringe and that the patents are invalid. SiRF also asserted new counterclaims for (1) false advertising under the Lanham Act and California Business and Professions Code sections 17200, et seq. and 17500, et seq., and for (2) frivolous litigation under section 17200.
The trial of this matter has been set for 16 November 2010. It is not possible to predict the outcome of the litigation with any level of certainty. The Group intends to defend itself vigorously. No provision has been made in these financial statements because, it is not possible to make a reliable estimate of the outcome of this litigation.
No provision was included as part of the acquisition accounting as it is not possible and was not possible at the time of the acquisition to make a reliable estimate of the outcome of this litigation.
In the Matter of CERTAIN GPS DEVICES AND PRODUCTS CONTAINING SAME, Investigation No. 337-TA-602 (initiated 7 May 2007)
On 7 May 2007, the International Trade Commission (“ITC”) initiated an investigation of SiRF and other entities based on a complaint filed by Global Locate, Inc. (“Global Locate”). Global Locate’s complaint alleged a violation of the Tariff Act of 1930 (19 U.S.C. § 1337) based on SiRF’s alleged infringement of six patents. Broadcom later joined the action as a complainant, following its acquisition of Global Locate. On 8 August 2008, the administrative law judge (“ALJ”) issued an initial determination on Broadcom/Global Locate’s claims, finding a violation of section 1337 with respect to the asserted patents. On 22 August 2008, the ALJ issued a recommended determination on remedy and bonding that, among other things, recommended an importation ban with respect to certain of the allegedly infringing SiRF products.
On 15 January 2009, the ITC (1) issued a limited exclusion order prohibiting the entry by SiRF and the other named respondents of unlicensed SiRF GPS chips, and products incorporating them, that had been found to infringe various claims of the asserted patents and (2) issued a cease-and-desist order against SiRF. Finally, for any temporary importation of the relevant products during the Presidential review period for the ITC’s decision, the ITC set the bond at 100% of the value of the imported products.
The ITC’s decision became final on 16 March 2009, at the conclusion of the Presidential review period. On 1 May 2009, SiRF filed an appeal with the United States Court of Appeals for the Federal Circuit asking that the Federal Circuit reverse the ITC’s findings with respect to all six asserted patents. On 4 November 2009, the Federal Circuit heard oral argument of SiRF’s appeal, which remains pending. The Group continues to defend itself vigorously
No provision has been made in these financial statements because it is not possible to make a reliable estimate of the outcome of these legal proceedings.
Securities Actions
a) U.S. District Court Cases
In February 2008, multiple putative class action lawsuits were filed in the United States District Court for the Northern District of California against SiRF and certain of its officers and directors at that time. These complaints allege that SiRF, and certain of its
CSR plc Annual Report and Financial Statements 2009
133
NOTES TO THE CONSOLIDATED FINANCIAL STATEMENTS continued
27. Contingent liabilities (continued)
Securities Actions (continued)
officers and directors, made misleading statements and/or omissions relating to its business and operating results in violation of the federal securities laws. These federal cases were consolidated and on 8 January 2010, the court granted final approval of a negotiated settlement, which required SiRF to pay $2,900,000, inclusive of attorneys fees, all of which was covered by SiRF’s insurance.
b) California State Court Cases
Two consolidated shareholder derivative lawsuits were filed in February 2008 in the Superior Court of the State of California (Santa Clara County) against certain of SiRF’s officers and directors at that time. These two lawsuits were consolidated with two shareholder lawsuits filed in February 2009 relating to the SiRF-CSR Merger Agreement. On 22 May 2009, SiRF signed a Memorandum of Understanding pursuant to which it agreed to settle all of the aforementioned California state court litigation for $385,000. The parties entered into a stipulation of settlement on 21 October 2009, and the settlement was preliminarily approved by the court on 23 December 2009. The court has scheduled a hearing on 16 April 2010 for consideration of final approval of the settlement. SiRF continues to deny all allegations of liability, and denies that plaintiffs have suffered any damages. Any settlement would be entirely covered by SiRF’s insurance.
28. Operating Lease Arrangements
| | | | | | |
| | | 52 weeks ended
1 January 2010 | | 53 weeks ended
2 January 2009 | | 52 weeks ended
28 December 2007 |
| | | $’000 | | $’000 | | $’000 |
| Minimum lease payments under operating leases recognised in the income statement for the year | | 13,984 | | 10,311 | | 6,955 |
At the balance sheet date, the Group had outstanding commitments for future minimum lease payments under non-cancellable operating leases, which fall due as follows:
| | | | | | |
| | | 1 January 2010 | | 2 January 2009 | | 28 December 2007 |
| | | $’000 | | $’000 | | $’000 |
Within one year | | 10,884 | | 8,799 | | 6,924 |
In the second to fifth years inclusive | | 9,839 | | 9,041 | | 16,590 |
After five years | | – | | – | | 4,180 |
| | | 20,723 | | 17,840 | | 27,694 |
Operating lease payments represent rentals payable by the Group for certain of its office properties, office equipment and software licences. Leases are negotiated for an average term of 3.35 years and rentals are fixed for an average of 3.35 years.
29. Integration and restructuring
A restructuring program was implemented at the end of Q2 2009, following the acquisition of SiRF Technology Holdings Inc. This led to almost 100 employees leaving the Group. The headcount reductions were implemented following careful consideration of the long-term strategic objectives and shorter term targets for 2009 and 2010. This planning commenced prior to the acquisition date to ensure that once the Group was able to operate as a single business, the Group could integrate and restructure as quickly as possible and ensure that the core projects of the enlarged Group were adequately resourced.
The main components of the $12.2 million charge were onerous lease charges of $2.2 million, severance costs of $4.3 million, consultancy and legal costs of $4.5 million and $1.2 million of other integration related costs. Approximately 100 employees left the Group as part of the 2009 combined integration and restructuring programme spread through [all] functions mostly in the UK and US.
At 1 January 2010, there were $0.6 million of accruals in respect of remaining payments to be made to employees under the integration and restructuring programme; cash outflows relating to the onerous leases of buildings being vacated are expected to occur in the next year.
In 2008, CSR plc announced a restructuring programme in the fourth quarter with the aim of reducing ongoing operating expenses by around $20 million in 2009. This was successfully completed and delivered the predicted savings. Approximately 100 employees left the Group as part of the 2008 restructuring programme spread through all functions mostly in the UK, US and Sweden. A one-time restructuring charge of $14.4 million was recorded in 2008 including $5.6 million of severance, $3.3 million of currency hedging charges (due to the reduction in Sterling requirements in 2009) and $3.9 million of onerous lease and building-related charges for buildings being vacated as part of the restructuring. At 2 January 2009, there were no payments remaining to be made to employees under the restructuring programme; cash outflows relating to the onerous leases of buildings being vacated are expected to occur in the next six years.
CSR plc Annual Report and Financial Statements 2009
134
30. Impairment of Assets
During 2008, a non-cash impairment charge of $52.9 million was recorded. This resulted from the decision to discontinue investment in UbiNetics’ protocol software development programme following the recommendations of the Operational Assessment in April 2008.
During the Assessment, the Group looked at its market in great detail and consulted widely to review the opportunities for winning in the global market for wireless solutions. The Group undertook in-depth discussions with customers on all continents, and asked the leading customers where they anticipated the most growth. The Group also carried out an analysis of its own capabilities and identified strengths and weaknesses to determine our future strategy.
The impairment was charged to administrative expenses in the consolidated income statement.
31. Share-Based Payments
CSR plc has grants and awards in the following Share Schemes which result in charges to the Income Statement:
Global Share Option Scheme
The Company has a share option scheme for all employees of the Group, under which share options were issued prior to flotation, at a price based on the most recent private funding round. All employees were granted options on joining CSR. These options had a vesting period of five years, with 20% of options vesting one year after grant, then the remainder vesting in equal quarterly instalments over the remaining four years. Other options (in addition to those related to employees joining) were also granted under this scheme. In all cases if the options remain unexercised after a period of ten years from the date of grant, the options lapse. Options are forfeited if the employee leaves the Group before the options vest. No grants have been made under this scheme since flotation.
Company Share Option Plan (CSOP)
The Company introduced a new scheme at flotation called the CSR plc Share Option Plan. The following grants have been made under the scheme:
Flotation Grant
On the Company’s flotation in February 2004, the Company issued share options to all employees, at a price based on the share price on the day of flotation. The vesting period was three years. If the options remain unexercised after a period of ten years from the date of grant, the options lapse. Options are forfeited if the employee leaves the Group before the options vest.
Performance Grants
On the Company’s flotation in February 2004, and in May 2005, May 2006, May 2007, June 2008 and certain other dates (relating to employees joining) the Company issued share options at a price based on the average share price over the preceding three days. For options granted between 2004 and 2008, the vesting period of these grants is three years and vesting is dependent upon meeting certain EPS based performance conditions. If the options remain unexercised after a period of ten years from the date of grant, the options lapse. Options are forfeited if the employee leaves the Group before the options vest.
With the decision to extend the grant of share awards with accompanying performance conditions to other employees, the Committee had decided that for grants in 2009, the performance condition for vesting would be changed to Total Shareholder Return (TSR).
The vesting period of these share options remains three years. The vesting of the options is also subject to the Group satisfying a performance condition based on the Total Shareholder Return of the Company’s shares when compared to a group of companies selected at the time an award is first granted. In order for the shares to vest, the Group must have met or exceeded certain TSR thresholds when compared with the TSR performance of the group of other companies.
Starter Grants
The Company grants options to new starters to assist in recruitment. Options are exercisable at a price equal to the average share price on the three days preceding the grant date. The vesting period of the options is over a period of five years with 40% vesting after two years and 5% vesting each quarter thereafter. If the options remain unexercised after a period of 10 years from the date of grant, the options lapse. Grants are forfeited if the employee leaves the Group before the options vest. The Company has also issued starter grants to senior employees that vest after three years. No starter grants with these characteristics were issued in the current period.
CSR plc Annual Report and Financial Statements 2009
135
NOTES TO THE CONSOLIDATED FINANCIAL STATEMENTS continued
31. Share-Based Payments (continued)
CSR Share Award Plan
In May 2005, following approval of shareholders at the 2005 Annual General Meeting, the Company introduced the CSR plc Share Award Plan, which allows for options to be granted for exercise at a future date at a price equivalent to the nominal value of the Company’s shares of £0.001. The following awards have been made:
Retention Awards
The Company issues certain employees with rights to purchase shares at nominal value (£0.001) as a method of staff retention. The vesting period of these share awards is either two or three years. If the share awards remain unexercised after a period of ten years from the date of grant, the awards lapse. Awards are forfeited if the employee leaves the Group before the options vest.
Performance Awards
The Company issues certain employees with rights to purchase shares at nominal value (£0.001) as a method of staff incentivisation. The vesting period of these share awards is three years. For grants between 2005 and 2008, the vesting of the awards is also subject to the Group satisfying two performance conditions. The first is the Total Shareholder Return of the Company’s shares when compared to a group of companies selected at the time an award is first granted. The second is improvement in the underlying financial performance of the Group. In order for the shares to vest, the Group must have met or exceeded certain TSR thresholds when compared with the TSR performance of the group of other companies. In the event the Group satisfies any one of the TSR thresholds, the Remuneration Committee then considers the extent of any improvement in the underlying financial performance of the Group.
In 2009, the Company issued certain employees with rights to purchase shares at nominal value. The vesting period of these grants is three years and vesting is dependent upon meeting certain EPS based performance conditions.
If the options remain unexercised after a period of ten years from the date of grant, the options lapse. Options are forfeited if the employee leaves the Group before the options vest.
Starter Awards
The Company grants rights to new starters to purchase shares at nominal value (£0.001) to assist recruitment. The vesting period of these awards is two years. If the share awards remain unexercised after a period of ten years from the date of grant, the awards lapse. Awards are forfeited if the employee leaves the Group before the options vest.
SAYE Schemes
The Company operates a SAYE scheme, whereby UK employees are allowed to subscribe to a monthly savings amount for a period of three years; at the end of the three year period, the employee is allowed to either receive their saved amount plus interest or purchase shares in the Company at a price based on the average share price on the three days prior to commencement of the SAYE scheme, discounted by 20%. This scheme is open to all employees subject to Inland Revenue approved limits on total investment, and invitations are issued at regular intervals. Employees have a period of six months following the conclusion of the scheme to exercise their option to purchase shares.
Employee Stock Purchase Plan (ESPP)
The Company operates an ESPP scheme for its US employees whereby eligible employees are allowed to have salary withholdings of up to 15% of cash compensation to purchase ordinary shares in the Company at a price equal to 85% of the lower of the fair market value of the shares on the first trading day of the offering period or the fair market value on the purchase date.
SiRF Technology Holdings Inc., plans
For purely historic purposes of settling pre-acquisition obligations of option and award exercise, the Company has assumed all the obligations of the former SiRF Technology Holdings Inc. under pre-existing plans utilised by SiRF which comprise the 1995 Stock plan, the 2004 Stock Incentive Plan, the TrueSpan 2004 Stock Incentive Plan and the Centrality 1999 Stock Plan. The Company will not issue any options or awards under these plans going forward. All contractual terms of the assumed options remain the same, except for the converted number of shares and exercise price which were based on an exchange ratio determined as part of the merger agreement.
CSR plc Annual Report and Financial Statements 2009
136
31. Share-Based Payments (continued)
Details of the share options outstanding during the year are as follows:
| | | | | | | | | | | | | | | |
| | | 1 January 2010 | | 2 January 2009 | | 28 December 2007 |
| | | Number of
share options | | | Weighted
average
exercise price | | Number of
share options | | | Weighted
average
exercise price | | Number of
share options | | | Weighted
average
exercise price |
| | | | | | (in £) | | | | | (in £) | | | | | (in £) |
Outstanding at beginning of period | | 9,956,891 | | | 3.12 | | 8,726,947 | | | 3.62 | | 9,225,832 | | | 2.96 |
Granted during the period | | 3,839,150 | | | 1.24 | | 3,279,870 | | | 1.94 | | 2,260,514 | | | 5.20 |
Replacement options granted to SiRF employees on acquisition | | 7,311,686 | | | 7.58 | | – | | | – | | – | | | – |
Forfeited during the period | | (3,212,669 | ) | | 5.81 | | (1,232,681 | ) | | 5.17 | | (892,031 | ) | | 1.21 |
Exercised during the period | | (1,638,801 | ) | | 0.85 | | (817,245 | ) | | 0.95 | | (1,867,368 | ) | | 1.56 |
Outstanding at the end of the period | | 16,256,257 | | | 4.57 | | 9,956,891 | | | 3.12 | | 8,726,947 | | | 3.62 |
Exercisable at the end of the period | | 6,208,976 | | | 8.33 | | 5,671,192 | | | 3.63 | | 3,579,373 | | | 1.38 |
The weighted average share price at the date of exercise for share options exercised during the period was £3.43 (2008: £3.56; 2007: £8.63).
The options outstanding at 1 January 2010 had a weighted average remaining contractual life of 7 years (2008: 8 years; 2007: 7 years).
In 2009, options were granted on 12 March, 16 March, 26 June, 4 August and 1 September. The aggregate estimated fair value of the options granted on those dates is $15,308,000. The weighted average fair value of these options was $1.78. In 2008, options were granted on 5 March, 28 March, 11 June, 4 August, 12 August, 25 September and 4 November. The aggregate estimated fair value of the options granted on those dates is $9,504,000. The weighted average fair value of these options was $3.01. In 2007, options were granted on 28 February, 28 March, 9 May, 5 June, 1 August, 14 November and 10 December. The aggregate estimated fair value of the options granted on those dates is $10,567,000. The weighted average fair value of these options was $5.25.
The fair values of the share option and share award grants were based on the following inputs:
SAYE Schemes
The inputs to the Black-Scholes model are as follows:
| | | | | | |
| | | 52 weeks ended
1 January 2010 | | 53 weeks ended
2 January 2009 | | 52 weeks ended
28 December 2007 |
Weighted average share price (£) | | 2.03 | | 3.24 | | 6.40 – 5.89 |
Weighted average exercise price (£) | | 1.65 | | 2.53 | | 5.84 – 5.16 |
Expected volatility | | 61% | | 54% | | 50% – 51% |
Expected life | | 3 years | | 3 years | | 3 years |
Risk free rate | | 2.53% | | 4.32% | | 4.93% – 4.72% |
Expected dividends | | 0% | | 0% | | 0% |
Expected volatility was determined by calculating the historical volatility of the Group’s share price over a three year period, equivalent to the vesting period of the options. The expected life used in the model has been adjusted based on management’s best estimates, for the effects of non-transferability, exercise restrictions and behavioural considerations.
Company Share Option Plan (CSOP)
The inputs to the Black-Scholes model are as follows:
| | | | | | |
| | | 52 weeks ended
1 January 2010 | | 53 weeks ended
2 January 2009 | | 52 weeks ended
28 December 2007 |
Weighted average share price (£) | | 2.08 – 4.35 | | 2.86 – 3.33 | | 6.16 – 7.65 |
Weighted average exercise price (£) | | 2.08 – 4.28 | | 2.78 – 3.29 | | 6.45 – 7.86 |
Expected volatility | | 61% | | 54% – 58% | | 49% – 51% |
Expected life | | 3 – 4 years | | 3 – 4 years | | 3 – 4 years |
Risk free rate | | 2.53% | | 4.18% – 5.20% | | 4.24% – 5.40% |
Expected dividends | | 0% | | 0% | | 0% |
CSR plc Annual Report and Financial Statements 2009
137
NOTES TO THE CONSOLIDATED FINANCIAL STATEMENTS continued
31. Share-Based Payments (continued)
Company Share Option Plan (CSOP) (continued)
Expected volatility was determined by calculating the historical volatility of the Group’s share price over a time period equivalent to the vesting period of the options. The expected life used in the model has been adjusted based on management’s best estimates, for the effects of non-transferability, exercise restrictions and behavioural considerations. The adjustments for the performance conditions are reflected in the proportion of options anticipated to vest.
For options issued in 2009, the fair value was based upon Monte-Carlo simulation of the performance of the 38 comparator companies included in the TSR conditions of the award. The Monte Carlo simulation incorporates a range of other assumptions based on the TSR comparator companies; those assumptions given above relate to the Group.
Expected volatility for each Company was determined by calculating the historical volatility of the individual Company’s share price over the 3 years from the date of grant.
Starter Grants
The inputs to the Black-Scholes model are as follows:
| | | | | | |
| | | 52 weeks ended
1 January 2010 | | 53 weeks ended
2 January 2009 | | 52 weeks ended
28 December 2007 |
Weighted average share price (£) | | – | | 2.12 – 3.33 | | 6.16 – 7.65 |
Weighted average exercise price (£) | | – | | 2.04 – 2.12 | | 6.45 – 7.57 |
Expected volatility | | – | | 56% – 60% | | 53 – 54% |
Expected life | | – | | 3 – 5 years | | 3 – 5 years |
Risk free rate | | – | | 4.02% – 5.20% | | 4.80% – 5.25% |
Expected dividends | | – | | 0% | | 0% |
Expected volatility was determined by calculating the historical volatility of the Group’s share price over a time period equivalent to the vesting period of the options The expected life used in the model has been adjusted based on management’s best estimate, for the effects of non-transferability, exercise restrictions and behavioural considerations.
Retention Awards and Starter Awards
The fair value was based upon the share price on the date of grant.
Performance Awards
| | | | | | |
| | | 52 weeks ended
1 January 2010 | | 53 weeks ended
2 January 2009 | | 52 weeks ended
28 December 2007 |
Weighted average share price (£) | | – | | 3.04 – 3.33 | | 7.65 – 6.16 |
Weighted average exercise price (£) | | – | | 0.001 | | 0.001 |
Expected volatility | | – | | 59% – 57% | | 51% – 53% |
Expected life | | – | | 3 – 4 years | | 3 – 4 years |
Risk free rate | | – | | 5.00% – 5.25% | | 5.25% – 5.75% |
Expected dividends | | – | | 0% | | 0% |
For pre-2009 awards, the fair value was based upon Monte-Carlo simulation of the performance of the 38 comparator companies included in the TSR conditions of the award. Expected volatility for each Company was determined by calculating the historical volatility of the individual Company’s share price over the 3 years from the date of grant.
For awards issued in 2009, the fair value was based on the share price on the date of grant as the performance conditions were market based.
ESPP scheme
The fair value of the ESPP awards was based upon the Monte Carlo simulation of the likely gain to be made by each employee over the course of the scheme.
CSR plc Annual Report and Financial Statements 2009
138
31. Share-Based Payments (continued)
Share Option Charges
The Group recognised total expenses of $10,581,000 (2008: $7,586,000; 2007: $9,275,000;) related to equity-settled share-based payment transactions.
32. Retirement Benefits Scheme
The Group operates a defined contribution retirement benefit scheme for all qualifying employees. The assets of the scheme are held separately from those of the Group in funds under the control of trustees.
The total cost recorded in the income statement of $6,551,000 (2008: $7,221,000; 2007: $5,935,000) represents contributions payable to this scheme by the Group at rates specified in the rules of the plan. As at 1 January 2010, contributions of $nil (2 January 2009: $nil; 28 December 2007: $nil) due in respect of the current reporting period had not been paid over to the scheme.
33. Financial Instruments
Financial Risk Management
The Group has exposure to the following risks from its use of financial instruments:
This note presents information about the Group’s exposure to each of the above risks, the Group’s objectives, policies and processes for measuring and managing risk, and the Group’s management of capital. Further quantitative disclosures are included throughout these consolidated financial statements.
The Board of Directors has overall responsibility for the establishment and oversight of the Group’s risk management framework. Risk management policies and systems are reviewed regularly to reflect changes in market conditions and the Group’s activities. The Group’s Audit Committee oversees how management monitors compliance with the Group’s risk management framework in relation to the risks faced by the Group.
Capital Risk Management
The Group’s policy is to maintain a strong capital base so as to maintain investor, creditor and market confidence and to sustain future development of the business. CSR intends to reinvest its cash balances in the business either through higher levels of investment in working capital and fixed assets or through further M&A activity to support the long-term ambitions of the Group. The capital structure of the Group consists of cash and cash equivalents, treasury deposits and equity attributable to the equity holders of CSR plc, comprising issued share capital, reserves and retained earnings as disclosed in notes 24 and 25. The Group is not subject to any externally imposed capital requirements.
As a result of the funds raised through the initial public offering in March 2004, subsequent positive operating cash flows and the cash and cash equivalents acquired with SiRF Technology Holdings Inc, the Group has a total of $412.4 million of treasury deposits and cash and cash equivalents as at 1 January 2010 (2 January 2009: $261.9 million; 28 December 2007: $245.4 million).
CSR plc Annual Report and Financial Statements 2009
139
NOTES TO THE CONSOLIDATED FINANCIAL STATEMENTS continued
33. Financial Instruments (continued)
Significant Accounting Policies
Details of the significant accounting policies and methods adopted, including the criteria for recognition, the basis of measurement and the basis on which income and expenses are recognised, in respect of each class of financial asset, financial liability and equity instrument are disclosed in note 3 to the financial statements.
| | | | | | | | | |
| | | 1 January 2010 | | | 2 January 2009 | | | 28 December 2007 | |
| | | $’000 | | | $’000 | | | $’000 | |
Financial assets | | | | | | | | | |
Loans and receivables (including cash and cash equivalents and treasury deposits) | | 500,691 | | | 333,000 | | | 333,966 | |
Derivative instruments in designated hedge accounting relationships | | 2,120 | | | – | | | 181 | |
Fair value through profit and loss (FVTPL) | | 277 | | | – | | | 515 | |
| | | 503,088 | | | 333,000 | | | 334,662 | |
Financial liabilities | | | | | | | | | |
Derivative instruments in designated hedge accounting relationships | | (230 | ) | | (26,043 | ) | | (1,080 | ) |
Amortised cost | | (96,809 | ) | | (75,828 | ) | | (113,731 | ) |
Fair value through profit and loss (FVTPL) | | – | | | (6,011 | ) | | – | |
| | | (97,039 | ) | | (107,890 | ) | | (114,811 | ) |
Market Risk
Market risk is the risk that changes in market prices, such as foreign currency exchange rates and interest rate risk will affect the Group’s income or the value of its holdings of financial instruments. The objective of market risk management is to manage and control market risk exposures within acceptable parameters, while optimising the return on risk.
Market risk exposures are measured using sensitivity analysis.
Foreign Currency Risk Management
Substantially all of the Group’s sales and costs of sales are denominated in US dollars, the functional currency of all the entities within the Group. A substantial proportion of the Group’s fixed costs are denominated in Sterling and the majority of the remainder is non-USD denominated. This exposure to different currencies may result in gains or losses with respect to movements in foreign exchange rates and the impact of such fluctuations could be material. Accordingly, the Group enters into hedging transactions pursuant to which it purchases Sterling under forward purchase contracts in order to cover the majority of its Sterling exposure.
The carrying amounts of the Group’s Sterling denominated monetary assets and liabilities at the reporting date are as follows:
| | | | | | | | | | | | | | | |
| | | Liabilities | | | Assets |
| | | 1 January
2010 | | | 2 January
2009 | | | 28 December
2007 | | | 1 January
2010 | | 2 January
2009 | | 28 December
2007 |
| | | £’000 | | | £’000 |
GBP sterling | | (14,735 | ) | | (9,092 | ) | | (9,051 | ) | | 2,390 | | 3,833 | | 7,669 |
The following significant exchange rates applied during the period:
| | | | | | | | | | | | |
| | | Weighted average forward contract rate (contracts maturing in the period) | | Period end spot rate |
| | | 1 January
2010 | | 2 January
2009 | | 28 December
2007 | | 1 January
2010 | | 2 January
2009 | | 28 December
2007 |
GBP: USD | | 1.9281 | | 1.9830 | | 1.8877 | | 1.6165 | | 1.4521 | | 1.9905 |
Foreign Currency Sensitivity Analysis
A 10 percent strengthening of the US dollar against GBP sterling would have decreased equity and profit or increased loss after tax by the amounts shown below as at the reporting date shown. In management’s opinion, this is a reasonably possible change given current market conditions.
CSR plc Annual Report and Financial Statements 2009
140
33. Financial Instruments (continued)
Foreign Currency Sensitivity Analysis (continued)
This analysis assumes that all other variables, in particular interest rates and other foreign currencies, remain constant. The analysis is performed on the same basis for 2008 and 2007.
| | | | | | |
| 1 January 2010 | | Equity | | | Profit or (loss) | |
| | | $’000 | | | $’000 | |
GBP | | (5,174 | ) | | (1,180 | ) |
| | | | | | |
| 2 January 2009 | | Equity | | | Profit or (loss) | |
| | | $’000 | | | $’000 | |
GBP | | (5,624 | ) | | (716 | ) |
| | | | | | |
| 28 December 2007 | | Equity | | | Profit or (loss) | |
| | | $’000 | | | $’000 | |
GBP | | (10,919 | ) | | (1,052 | ) |
A 10 percent weakening of the US dollar against GBP sterling would have had the equal but opposite effect, on the basis that all the other variables remain constant.
The movement in loss for the period is mainly attributable to the Group’s exposure to exchange movements in sterling denominated monetary assets and liabilities. The movement in equity is mainly as a result of the changes in fair value of forward foreign exchange contracts.
Forward Foreign Exchange Contracts
The following table indicates the periods in which the cash flows associated with derivatives that are cash flow or fair value hedges are expected to occur:
| | | | | | | | | | | | | |
| Cash flow hedges | | Carrying
Amount | | | Expected
cash flows | | 3 months
or less | | 3-6
months | | 6-12
months | | More
than one
year |
1 January 2010 | | | | | | | | | | | | | |
Forward foreign exchange contracts $’000 | | 2,167 | | | 86,747 | | 20,699 | | 15,082 | | 30,829 | | 20,137 |
Forward foreign exchange contracts £’000 | | – | | | 55,000 | | 14,000 | | 9,500 | | 19,000 | | 12,500 |
2 January 2009 | | | | | | | | | | | | | |
Forward foreign exchange contracts $’000 | | (29,597 | ) | | 120,979 | | 31,602 | | 30,752 | | 53,319 | | 5,306 |
Forward foreign exchange contracts £’000 | | – | | | 63,500 | | 16,000 | | 16,000 | | 28,000 | | 3,500 |
28 December 2007 | | | | | | | | | | | | | |
Forward foreign exchange contracts $’000 | | (384 | ) | | 178,628 | | 35,853 | | 35,636 | | 71,568 | | 35,571 |
Forward foreign exchange contracts £’000 | | – | | | 90,090 | | 18,090 | | 18,000 | | 36,000 | | 18,000 |
The Directors consider the periods in which the cash flows associated with the derivatives that are cash flow hedges are expected to occur approximate the periods when the cash flows associated with those cash flows are likely to impact profit or loss.
Interest Rate Risk Management
The Group has no significant direct exposure to fluctuations in interest rates other than those on interest-bearing cash balances. The majority of cash balances are held at fixed rates of interest and the effective rate of interest on those cash balances in the period was 0.54% (53 weeks ended 2 January 2009: 4.67%; 52 weeks ended 28 December 2007: 5.16%).
CSR plc Annual Report and Financial Statements 2009
141
NOTES TO THE CONSOLIDATED FINANCIAL STATEMENTS continued
33. Financial Instruments (continued)
Credit risk
Credit Risk Management
Credit risk refers to the risk that a counterparty will default on its contractual obligations resulting in financial loss to the Group. The Group has adopted a policy of only dealing with creditworthy counterparties and obtaining sufficient collateral where appropriate, as a means of mitigating the risk of financial loss from defaults. The Group only transacts with entities that are rated the equivalent of investment grade and above for Treasury management purposes. This information is supplied by independent rating agencies where available and if not available, the Group uses other publicly financial available information and its own trading records to rate its major customers. The Group’s exposure and the credit ratings of its counterparties are continuously monitored and credit exposure is controlled by counterparty limits.
The credit risk on liquid funds and derivative financial instruments is limited because counterparties are banks with high credit ratings assigned by international credit rating agencies.
For cash and cash equivalents and treasury deposits, the Company only transacts with entities that are equivalent to investment grade and above.
Disclosures related to the credit risk associated with trade receivables are in note 17.
Liquidity risk
Liquidity Risk Management
The Group manages liquidity risk by maintaining adequate cash reserves and by continuously monitoring forecast and actual cash flows and matching the maturity of financial assets and liabilities. The Group has no significant borrowings from third parties and therefore liquidity risk is not considered a significant risk at this time. The table below details the Group’s remaining contractual maturity for it non-derivative financial liabilities with agreed repayment periods. The tables have been prepared based on undiscounted cash flows of financial liabilities based on the earliest date on which the Group can be required to pay.
| | | | | | | | | | | | |
| 1 January 2010 | | Less than one month | | 1-2 months | | 2-3 months | | 3-6 months | | More than 6 months | | Total |
| | | $’000 | | $’000 | | $’000 | | $’000 | | $’000 | | $’000 |
Obligations under finance | | – | | – | | – | | – | | 326 | | 326 |
Other payables | | 261 | | – | | 1,712 | | – | | 482 | | 2,455 |
Onerous lease provision (undiscounted) | | – | | 101 | | 202 | | 462 | | 4,108 | | 4,873 |
| | | 261 | | 101 | | 1,914 | | 462 | | 4,916 | | 7,654 |
| | | | | | |
| 2 January 2009 | | Less than one month | | 1-2 months | | 2-3 months | | 3-6 months | | More than 6 months | | Total |
| | | $’000 | | $’000 | | $’000 | | $’000 | | $’000 | | $’000 |
Obligations under finance leases | | – | | – | | 766 | | – | | 584 | | 1,350 |
Contingent consideration (note 22) (undiscounted) | | – | | – | | – | | – | | 17,500 | | 17,500 |
Other payables | | 376 | | – | | 649 | | – | | 381 | | 1,406 |
Onerous lease provision (undiscounted) | | – | | 9 | | 467 | | 436 | | 3,328 | | 4,240 |
| | | 376 | | 9 | | 1,882 | | 436 | | 21,793 | | 24,496 |
| | | | | | |
| 28 December 2007 | | Less than one month | | 1-2 months | | 2-3 months | | 3-6 months | | More than 6 months | | Total |
| | | $’000 | | $’000 | | $’000 | | $’000 | | $’000 | | $’000 |
Obligations under finance leases | | – | | 131 | | – | | 1,256 | | 1,864 | | 3,251 |
Contingent consideration (note 22) (undiscounted) | | – | | 9,625 | | – | | – | | 17,500 | | 27,125 |
Unsecured loan notes issued on acquisition of CPS | | – | | 1,865 | | – | | 257 | | – | | 2,122 |
Other payables | | 6 | | – | | 1,239 | | – | | 424 | | 1,669 |
Onerous lease provision (undiscounted) | | – | | – | | – | | – | | 545 | | 545 |
| | | 6 | | 11,621 | | 1,239 | | 1,513 | | 20,333 | | 34,712 |
CSR plc Annual Report and Financial Statements 2009
142
33. Financial Instruments (continued)
Liquidity risk (continued)
Fair Value of Financial Instruments
The fair values of financial assets and liabilities are determined as follows:
Trade receivables and trade and other payables: The carrying amount of these short-term financial instruments approximates their fair value.
Derivatives: The fair value is estimated by discounting the difference between the contractual forward price and the current forward price for the residual maturity of the contract using an appropriate discount rate.
The carrying amounts of financial assets and liabilities in the financial statements approximates their fair values.
The following table provides an analysis of the financial assets, specifically money market funds and marketable debt instruments that are measured on a recurring basis, subsequent to initial recognition at fair value, grouped into Levels 1 to 3 based on the degree to which the fair value is observable as at 1 January 2010:
Level 1 fair value measurements are those derived from quoted prices (unadjusted) in active markets for identical assets or liabilities;
Level 2 fair value measurements are those derived from inputs other than quoted prices included within Level 1 that are observable for the asset or liability, either directly (i.e. as prices) or indirectly (i.e. derived from prices); and
Level 3 fair value measurements are those derived from valuation techniques that include significant inputs for the asset and liability that are not based on observable market data (unobservable inputs)
| | | | | | | | |
1 January 2010 | | Quoted prices in
Active Markets for
Identical Assets | | Significant Other
Observable Inputs | | Significant
Unobservable Inputs | | Total |
| | (Level 1) | | (Level 2) | | (Level 3) | | |
| | $’000 | | $’000 | | $’000 | | $’000 |
Financial assets at FVTPL | | | | | | | | |
United States government fixed income debt securities1 | | 71,763 | | – | | – | | 71,763 |
1 Included within Treasury Deposits on the CSR Consolidated balance sheet
34. Related Party Transactions
Transactions between the Company and its subsidiaries, which are related parties, have been eliminated on consolidation and are not disclosed in this note.
Remuneration of key management personnel
The remuneration of the directors, who are the key management personnel of the Group, is set out below:
| | | | | | | |
| | | 52 weeks
ended
1 January
2010 | | | 53 weeks
ended
2 January
2009 | | 52 weeks
ended
28 December
2007 |
| | | $’000 | | | $’000 | | $’000 |
Short-term employee benefits | | 5,225 | | | 3,444 | | 2,976 |
Post-employment benefits | | 273 | | | 241 | | 166 |
Other long-term benefits | | – | | | – | | 299 |
Termination benefits | | – | | | – | | 991 |
Share-based payment | | (473 | ) | | 537 | | 67 |
| | | 5,025 | | | 4,222 | | 4,499 |
Prior to the acquisition of SiRF Technology Holdings Inc, Diosdado Banatao held an interest in SiRF common stock and in options to acquire SiRF common stock granted pursuant to option plans operated by SiRF and which were subsequently assumed by CSR.
CSR plc Annual Report and Financial Statements 2009
143
NOTES TO THE CONSOLIDATED FINANCIAL STATEMENTS continued
34. Related Party Transactions (continued)
Remuneration of key management personnel (continued)
With effect from completion on 26 June 2009, these interests were converted into a holding of 1,590,049 CSR ordinary shares and 46,081 options to acquire CSR ordinary shares.
Prior to the acquisition of SiRF Technology Holdings Inc, Kanwar Chadha held an interest in SiRF common stock and in options to acquire SiRF common stock granted pursuant to option plans operated by SiRF and which were subsequently assumed by CSR.
With effect from completion on 26 June 2009, these interests were converted into a holding of 633,510 CSR ordinary shares and 478,010 options to acquire CSR ordinary shares.
During 2009, Joep van Beurden (CEO) became Vice Chairman of the Global Semiconductor Alliance (GSA). CSR plc has paid membership fees of $32,600 to the GSA in the course of 2009. These transactions were at arms length.
During 2007, an escrow payment of $11,158 was made to John Scarisbrick (formerly CEO of CSR plc) in relation to the 2005 acquisition of UbiNetics (VPT) Limited.
On 12 January 2007, the Company paid John Scarisbrick (formerly CEO of CSR plc) $49,477 for 2,388,188 E shares in Cambridge Positioning Systems Limited as part of the acquisition of Cambridge Positioning Systems Limited.
35. Acquisition of subsidiary
SiRF Technology Holdings, Inc. (under IFRS 3 (revised 2008))
On 26 June 2009, the Group acquired 100% of the issued share capital of SiRF Technology Holdings, Inc, a semiconductor supplier of Global Positioning System or GPS based location technology solutions, for a consideration of $281.5 million. Each share of SiRF common stock was exchanged for 0.741 of a CSR plc ordinary share, par value £0.001 per share. The acquisition provides CSR with leading capability in GPS which complements CSR’s existing Bluetooth and Wi-Fi solutions. The Group exchanged 47,658,246 shares in CSR plc for 100% of the issued share capital of SiRF Technology Holdings Inc at a CSR plc share price of £3.4925 and exchange rate of 1.6313 US dollars to GBP.
| | | |
| | | $’000 | |
Recognised amounts of identifiable assets acquired and liabilities assumed at fair value | | | |
Financial assets | | 135,172 | |
Inventory | | 14,823 | |
Property, plant and equipment | | 3,165 | |
Intangible assets | | 30,536 | |
Financial liabilities | | (41,748 | ) |
Net assets acquired | | 141,948 | |
Allocation to goodwill | | 139,577 | |
Total consideration | | 281,525 | |
Purchase price: | | | |
Fair value of shares issued | | 271,524 | |
Fair value of share options exchanged | | 21,617 | |
Less: unvested portion of the fair value of share options | | (11,492 | ) |
Less: excess of fair value of vested share options over the original awards | | (124 | ) |
| | | 281,525 | |
Net cash inflow arising on acquisition | | | |
Cash and cash equivalents acquired | | 66,489 | |
Directly attributable costs | | (10,572 | ) |
| | | 55,917 | |
Cash and cash equivalents acquired totalled $66.5 million. Treasury deposits and investments of $45.0 million were also acquired giving a total of $111.5 million of cash, cash equivalents, treasury deposits and investments acquired.
CSR plc Annual Report and Financial Statements 2009
144
35. Acquisition of subsidiary (continued)
SiRF Technology Holdings, Inc. (under IFRS 3 (revised 2008)) (continued)
The goodwill arising on the acquisition of SiRF Technology Holdings Inc, is attributable to the anticipated profitability of the Group’s products in the GPS market and the anticipated future operating synergies from the combination. It is not anticipated that the goodwill will be tax deductible.
SiRF Technology Holdings Inc contributed $130.0 million to revenue and a profit of $21.4 million to loss before tax for the period between the date of acquisition and the balance sheet date.
If the acquisition of SiRF Technology Holdings Inc had been completed on the first day of the accounting period, Group revenues for the period would have been $683.9 million and Group loss would have been $14.1 million but this does not reflect any synergistic benefits of the acquisition.
A contingent liability has not been recognised on acquisition for the litigation described in note 27 as the fair value of the liability cannot be reliably measured as it was not possible at the time of the acquisition and has not been possible since to make a reliable estimate of the outcome of this litigation due to the inherent uncertainty of litigation and the early stage of proceedings.
Cambridge Positioning Systems Limited (under IFRS 3 as issued in 2004)
On 12 January 2007, the Group acquired 100% of the issued share capital of Cambridge Positioning Systems Limited for a consideration of $35.0 million.
| | | | | | | | | |
| | | Book
value | | | Fair value
adjustments | | | Fair value | |
| | | $’000 | | | $’000 | | | $’000 | |
Property, plant and equipment | | 345 | | | (125 | ) | | 220 | |
Intangible assets | | – | | | 9,900 | | | 9,900 | |
Deferred tax adjustment on fair value adjustments | | – | | | (2,868 | ) | | (2,868 | ) |
Current assets | | 1,581 | | | – | | | 1,581 | |
Current liabilities | | (6,830 | ) | | (219 | ) | | (7,049 | ) |
Net assets acquired | | (4,904 | ) | | 6,688 | | | 1,784 | |
Allocation to goodwill | | | | | | | | 28,810 | |
Total consideration | | | | | | | | 30,594 | |
Satisfied by: | | | | | | | | | |
Cash and cash equivalents | | | | | | | | 27,318 | |
Loan notes | | | | | | | | 2,214 | |
Directly attributable costs | | | | | | | | 1,062 | |
| | | | | | | | | 30,594 | |
Net cash outflow arising on acquisition | | | | | | | | | |
Cash consideration | | | | | | | | (27,318 | ) |
Working capital adjustment | | | | | | | | (219 | ) |
Repayment of Cambridge Positioning Systems loans on acquisition | | | | | | | | (5,468 | ) |
Cash and cash equivalents acquired | | | | | | | | 256 | |
Partial repayment of loan notes | | | | | | | | (148 | ) |
Directly attributable costs | | | | | | | | (1,062 | ) |
| | | | | | | | | (33,959 | ) |
The goodwill of $28.8 million arising on the acquisition of Cambridge Positioning Systems Limited is attributable to the anticipated profitability resulting from Cambridge Positioning System Limited’s specialised GPS location system technology. The value of the assembled workforce of Cambridge Positioning Systems Limited was not recognised as a separately identifiable intangible assets and its value was subsumed into goodwill.
Cambridge Positioning Systems Limited contributed $488,000 to revenues and reduced the Group’s profit before tax by $1,625,000 between the date of acquisition and the balance sheet date.
CSR plc Annual Report and Financial Statements 2009
145
NOTES TO THE CONSOLIDATED FINANCIAL STATEMENTS continued
35. Acquisition of subsidiary (continued)
Cambridge Positioning Systems Limited (under IFRS 3 as issued in 2004) (continued)
If the acquisition of Cambridge Positioning Systems Limited had been completed on the first day of the financial period, Group revenues for the period would have been $848,631,000 and Group profit attributable to equity holders of the parent would have been $111,998,000.
NordNav Technologies AB (under IFRS 3 as issued in 2004)
On 12 January 2007, the Group acquired 100% of the issued share capital of NordNav Technologies AB for a consideration of $40.0 million and contingent deferred consideration of $35.0 million.
| | | | | | | | | |
| | | Book
value | | | Fair value
adjustments | | | Fair value | |
| | | $’000 | | | $’000 | | | $’000 | |
Property, plant and equipment | | 116 | | | – | | | 116 | |
Intangible assets | | – | | | 13,600 | | | 13,600 | |
Deferred tax adjustment on fair value adjustments | | – | | | (4,080 | ) | | (4,080 | ) |
Current assets | | 1,338 | | | – | | | 1,338 | |
Current liabilities | | (1,454 | ) | | – | | | (1,454 | ) |
Net assets acquired | | – | | | 9,520 | | | 9,520 | |
Allocation to goodwill | | | | | | | | 63,724 | |
Total consideration | | | | | | | | 73,244 | |
Satisfied by: | | | | | | | | | |
Cash and cash equivalents | | | | | | | | 40,000 | |
Directly attributable costs | | | | | | | | 983 | |
Contingent consideration (discounted) (note 22) | | | | | | | | 32,261 | |
| | | | | | | | | 73,244 | |
Net cash outflow arising on acquisition | | | | | | | | | |
Cash consideration | | | | | | | | (40,000 | ) |
Working capital adjustments | | | | | | | | (164 | ) |
Contingent consideration (note 22) | | | | | | | | (7,875 | ) |
Directly attributable costs | | | | | | | | (983 | ) |
Cash and cash equivalents acquired | | | | | | | | 1,035 | |
| | | | | | | | | (47,987 | ) |
The goodwill of $63.7 million arising on the acquisition of NordNav Technologies AB is attributable to the anticipated profitability resulting from NordNav Technologies AB’s software-based GPS solution. The value of the assembled workforce of NordNav Technologies AB was not recognised as a separately identifiable intangible assets and its value was subsumed into goodwill.
NordNav Technologies AB contributed $191,000 to revenues and reduced the Group’s profit before tax by $2,330,000 between the date of acquisition and the balance sheet date.
If the acquisition of NordNav Technologies AB had been completed on the first day of the financial period, Group revenues for the period would have been $848,625,000 and Group profit attributable to equity holders of the parent would have been $112,355,000.
36. Patent Dispute Settlement
During 2007, the Group reached an agreement with the Washington Research Foundation (WRF) to settle the patent infringement suit issued against 12 of the Group’s customers. The complaint referred to certain U.S. patents owned by the University of Washington claimed to be relevant to Bluetooth chips.
The Group remained of the view that WRF’s infringement suit was without merit. Notwithstanding this, the Group believed that an early resolution of the claim was both in the Group and the Group’s customers best interests and accordingly a payment of $15.0 million was made in April 2007.
CSR plc Annual Report and Financial Statements 2009
146
COMPANY STATEMENT OF COMPREHENSIVE INCOME 52 weeks ended 1 January 2010
| | | | | | | | | |
| | | 52 weeks ended 1 January 2010 | | | 53 weeks ended 2 January 2009 | | | 52 weeks ended 28 December 2007 | |
| | | $’000 | | | $’000 | | | $’000 | |
Loss for the period | | (13,745 | ) | | (51,671 | ) | | (7,637 | ) |
Other comprehensive loss being total comprehensive loss for the period | | (13,745 | ) | | (51,671 | ) | | (7,637 | ) |
COMPANY STATEMENT OF CHANGES IN EQUITY
| | | | | | | | | | | | | | |
| | | Equity attributable to equity holders of the Company | |
| | | Called-up
share
capital | | Share
premium
account | | Capital
redemption
reserve | | Share-
based
payment reserve | | Retained
earnings | | | Total | |
| | | $’000 | | $’000 | | $’000 | | $’000 | | $’000 | | | $’000 | |
At 30 December 2006 | | 232 | | 84,111 | | 950 | | 11,003 | | 1,034 | | | 97,330 | |
Loss for the period | | – | | – | | – | | – | | (7,637 | ) | | (7,637 | ) |
Share issues | | 4 | | 5,815 | | – | | – | | – | | | 5,819 | |
Credit to equity for equity-settled share-based payments | | – | | – | | – | | 9,275 | | – | | | 9,275 | |
At 28 December 2007 | | 236 | | 89,926 | | 950 | | 20,278 | | (6,603 | ) | | 104,787 | |
Loss for the period | | – | | – | | – | | – | | (51,671 | ) | | (51,671 | ) |
Share issues | | 2 | | 1,522 | | – | | – | | – | | | 1,524 | |
Credit to equity for equity-settled share-based payments | | – | | – | | – | | 7,586 | | – | | | 7,586 | |
At 2 January 2009 | | 238 | | 91,448 | | 950 | | 27,864 | | (58,274 | ) | | 62,226 | |
Loss for the period | | – | | – | | – | | – | | (13,745 | ) | | (13,745 | ) |
Share issues | | 80 | | 271,584 | | – | | – | | – | | | 271,664 | |
| Credit to equity for equity-settled share-based payments issued on acquisitions | | – | | – | | – | | 10,001 | | – | | | 10,001 | |
Credit to equity for equity-settled share-based payments | | – | | – | | – | | 10,581 | | – | | | 10,581 | |
At 1 January 2010 | | 318 | | 363,032 | | 950 | | 48,446 | | (72,019 | ) | | 340,727 | |
CSR plc Annual Report and Financial Statements 2009
147
COMPANY BALANCE SHEET 1 January 2010
| | | | | | | | | | | |
| | | | | 1 January 2010 | | | 2 January 2009 | | | 28 December 2007 | |
| | | Notes | | $’000 | | | $’000 | | | $’000 | |
Non-current assets | | | | | | | | | | | |
Subsidiaries | | 42 | | 407,428 | | | 132,822 | | | 174,555 | |
Current assets | | | | | | | | | | | |
Other receivables | | 43 | | 33,425 | | | 29,429 | | | 20,313 | |
Treasury deposits | | 43 | | 160,000 | | | 81,000 | | | 52,065 | |
Cash and cash equivalents | | 43 | | 20,000 | | | 64,000 | | | 85,000 | |
| | | | | 213,425 | | | 174,429 | | | 157,378 | |
Total assets | | | | 620,853 | | | 307,251 | | | 331,933 | |
Current liabilities | | | | | | | | | | | |
Trade and other payables | | 44 | | 279,368 | | | 227,525 | | | 201,158 | |
Contingent consideration | | 45 | | – | | | 753 | | | 25,988 | |
Tax liabilities | | | | 758 | | | – | | | – | |
| | | | | 280,126 | | | 228,278 | | | 227,146 | |
Net current liabilities | | | | (66,701 | ) | | (53,849 | ) | | (69,768 | ) |
Non-current liabilities | | | | | | | | | | | |
Contingent consideration | | 45 | | – | | | 16,747 | | | – | |
Total liabilities | | | | 280,126 | | | 245,025 | | | 227,146 | |
Net assets | | | | 340,727 | | | 62,226 | | | 104,787 | |
Equity | | | | | | | | | | | |
Share capital | | 24 | | 318 | | | 238 | | | 236 | |
Share premium account | | 25 | | 363,032 | | | 91,448 | | | 89,926 | |
Capital redemption reserve | | 25 | | 950 | | | 950 | | | 950 | |
Share-based payment reserve | | 25 | | 48,446 | | | 27,864 | | | 20,278 | |
Retained losses | | 46 | | (72,019 | ) | | (58,274 | ) | | (6,603 | ) |
Total equity | | | | 340,727 | | | 62,226 | | | 104,787 | |
The financial statements of CSR plc, registered number 4187346, were approved by the Board of directors and authorised for issue.
They were signed on its behalf by:
| | | | | | |
| Will Gardiner | | | | Ron Mackintosh | | |
| 9 February 2010 | | | | 9 February 2010 | | |
CSR plc Annual Report and Financial Statements 2009
148
COMPANY CASH FLOW STATEMENT 52 weeks ended 1 January 2010
| | | | | | | | | | | |
| | | | | 52 weeks
ended
1 January
2010 | | | 53 weeks
ended
2 January
2009 | | | 52 weeks
ended
28 December
2007 | |
| | | Notes | | $’000 | | | $’000 | | | $’000 | |
Net cash from operating activities | | 47 | | 32,360 | | | 9,255 | | | 111,611 | |
Investing activities | | | | | | | | | | | |
Interest received | | | | 1,974 | | | 4,111 | | | 4,454 | |
Purchase of treasury deposits | | | | (79,000 | ) | | (28,935 | ) | | (22,065 | ) |
Acquisition of subsidiary | | | | – | | | (11,689 | ) | | (81,946 | ) |
Net cash used in investing activities | | | | (77,026 | ) | | (36,513 | ) | | (99,557 | ) |
Financing activities | | | | | | | | | | | |
Proceeds on issue of share capital | | | | 66 | | | 1,524 | | | 5,824 | |
Net cash from financing activities | | | | 66 | | | 1,524 | | | 5,824 | |
Net (decrease) increase in cash and cash equivalents | | | | (44,600 | ) | | (25,734 | ) | | 17,878 | |
Cash and cash equivalents at beginning of period | | | | 64,000 | | | 85,000 | | | 65,000 | |
Effect of foreign exchange rate changes | | | | 600 | | | 4,734 | | | 2,122 | |
Cash and cash equivalents at end of period | | | | 20,000 | | | 64,000 | | | 85,000 | |
NOTES TO THE COMPANY FINANCIAL STATEMENTS
37. Significant accounting policies
The separate financial statements of the Company are presented as required by the Companies Act 2006. As permitted by that Act, the separate financial statements have been prepared in accordance with International Financial Reporting Standards as issued by the IASB and as adopted by the EU.
The financial statements have been prepared on the historical cost basis. The principal accounting policies adopted are the same as those set out in note 3 to the consolidated financial statements.
38. Loss attributable to CSR plc
The loss for the financial year dealt with in the financial statements of the parent Company, CSR plc, was $13,745,000 (2008: $51,671,000; 2007: $7,637,000). As permitted by s408 of the Companies Act 2006, no separate income statement is presented in respect of the parent Company.
Loss is stated after charging (crediting):
| | | | | | | |
| | | 52 weeks
ended
1 January
2010 | | 53 weeks
ended
2 January
2009 | | | 52 weeks
ended
28 December
2007 |
| | | $’000 | | $’000 | | | $’000 |
Net foreign exchange losses (gains) | | 1,488 | | (4,739 | ) | | 301 |
Auditors’ remuneration for audit services | | 243 | | 93 | | | 92 |
The Company had 5 employees during 2009 (2008: 3) who were the Directors of CSR plc.
The Directors’ remuneration in both years was borne by Cambridge Silicon Radio Limited and was not attributable to the Company.
39. Investment income
| | | | | | |
| | | 52 weeks
ended
1 January
2010 | | 53 weeks
ended
2 January
2009 | | 52 weeks
ended
28 December
2007 |
| | | $’000 | | $’000 | | $’000 |
Income from bank deposits | | 1,607 | | 4,084 | | 4,503 |
CSR plc Annual Report and Financial Statements 2009
149
NOTES TO THE COMPANY FINANCIAL STATEMENTS Continued
40. Finance costs
| | | | | | | | | |
| | | 52 weeks
ended
1 January
2010 | | | 53 weeks
ended
2 January
2009 | | | 52 weeks
ended
28 December
2007 | |
| | | $’000 | | | $’000 | | | $’000 | |
Interest payable on acquisition loan notes | | – | | | 8 | | | 100 | |
Unwinding of discount on deferred consideration | | – | | | 1,141 | | | 1,602 | |
Interest on intercompany balance | | 722 | | | 5,663 | | | 6,749 | |
Foreign exchange gains | | (600 | ) | | (6 | ) | | (2,122 | ) |
| | | 122 | | | 6,806 | | | 6,329 | |
41. Taxation
| | | | | | |
| | | 52 weeks
ended
1 January
2010 | | 53 weeks
ended
2 January
2009 | | 52 weeks
ended
28 December
2007 |
| | | $’000 | | $’000 | | $’000 |
Total tax charge | | 757 | | – | | – |
Corporation tax is calculated at 28% (2008: 28.5%; 2007: 30%) of the estimated assessable profit for the year.
| | | | | | | | | | | | | | | | | | |
| | | 52 weeks ended 1 January 2010 | | | 53 weeks ended 2 January 2009 | | | 52 weeks ended
28 December 2007 | |
| | | $’000 | | | % | | | $’000 | | | % | | | $’000 | | | % | |
Loss before tax | | (12,988 | ) | | 100.0 | | | (51,671 | ) | | 100.0 | | | (7,637 | ) | | 100.0 | |
Tax at the UK corporation tax rate of 28.0% (2008: 28.5%, 2008: 30%) | | (3,637 | ) | | 28.0 | | | (14,726 | ) | | (28.5 | ) | | (2,291 | ) | | (30.0 | ) |
Impairment of investment | | – | | | – | | | 14,056 | | | 27.2 | | | – | | | – | |
Non-deductible expenses | | 2,184 | | | (16.8 | ) | | 324 | | | 0.6 | | | – | | | – | |
Acquisition related legal and professional costs | | 2,210 | | | (17.0 | ) | | – | | | – | | | – | | | – | |
Group relief surrendered to other Group companies for nil consideration | | – | | | – | | | 346 | | | 0.7 | | | 2,291 | | | 30.0 | |
Tax expense and effective tax rate for the period | | 757 | | | (5.8 | ) | | – | | | – | | | – | | | – | |
In March 2007, the UK Government announced that they would introduce legislation that reduced the corporation tax rate to 28% from 1 April 2008. This legislation is fully enacted. The deferred tax and liabilities, previously stated at 30% of the temporary differences were remeasured to 28% of those amounts. In addition, the blended current tax rate for 2008 reduced to 28.5%.
CSR plc Annual Report and Financial Statements 2009
150
42. Subsidiaries
Details of the Company’s subsidiaries at 1 January 2010 are as follows:
| | | | | | |
| Name | | Place of incorporation (or registration) and operation | | Proportion of
ownership
interest % | | Proportion of
voting power held % |
Direct ownership | | | | | | |
Cambridge Silicon Radio Limited | | UK | | 100 | | 100 |
UbiNetics VPT Limited | | UK | | 100 | | 100 |
Cambridge Positioning Systems Limited | | UK | | 100 | | 100 |
NordNav Technologies Aktiebolag | | Sweden | | 100 | | 100 |
SiRF Technology Holdings Inc. | | USA | | 100 | | 100 |
| | | |
Indirect ownership | | | | | | |
Cambridge Silicon Radio Inc. | | USA | | 100 | | 100 |
CSR China (Shanghai) Co. Limited | | China | | 100 | | 100 |
CSR KK | | Japan | | 100 | | 100 |
CSR Korea Limited | | Korea | | 100 | | 100 |
CSR Sweden AB | | Sweden | | 100 | | 100 |
Cambridge Silicon Radio Sarl | | France | | 100 | | 100 |
Cambridge Silicon Radio (UK) Limited | | UK | | 100 | | 100 |
Cambridge Silicon Radio Holdings Inc. | | Delaware | | 100 | | 100 |
Clarity Technologies, Inc. | | Michigan | | 100 | | 100 |
CSR (India) Private Limited | | India | | 100 | | 100 |
UbiNetics Wireless Technologies (Shenzen) Company Limited | | China | | 100 | | 100 |
UbiNetics (Cayman Islands) Ltd | | Cayman Islands | | 100 | | 100 |
UbiNetics (Hong Kong) Limited | | Hong Kong | | 100 | | 100 |
UbiNetics (North America) Inc. | | USA | | 100 | | 100 |
UbiNetics (IP) Limited | | UK | | 100 | | 100 |
UbiNetics 3G Limited | | UK | | 100 | | 100 |
UbiNetics Module Limited | | UK | | 100 | | 100 |
UbiNetics Technology Limited | | UK | | 100 | | 100 |
UbiNetics Designs Limited | | UK | | 100 | | 100 |
Coverge Limited | | UK | | 100 | | 100 |
C.P.S. Ltd | | UK | | 100 | | 100 |
SiRF Technology Inc | | USA | | 100 | | 100 |
Enuvis Inc | | USA | | 100 | | 100 |
Truespan Inc | | USA | | 100 | | 100 |
SiRF Technology Holdings China LLC | | USA | | 100 | | 100 |
Shanghai SiRF Technology Co Ltd | | China | | 100 | | 100 |
SiRF Technology Cayman Limited | | Cayman Islands | | 100 | | 100 |
SiRF Technology Singapore Pte Ltd | | Singapore | | 100 | | 100 |
SiRF Technology GK | | Japan | | 100 | | 100 |
SiRF International LLC | | USA | | 100 | | 100 |
SiRF Technology GmbH | | Germany | | 100 | | 100 |
SiRF Technology India Pvt Ltd | | India | | 100 | | 100 |
Centrality Limited | | Cayman Islands | | 100 | | 100 |
SiRF Technology Korea | | Korea | | 100 | | 100 |
CSR plc Annual Report and Financial Statements 2009
151
NOTES TO THE COMPANY FINANCIAL STATEMENTS Continued
42. Subsidiaries (continued)
Investments in subsidiary undertakings
| | | | | | |
| | | 1 January 2010 | | | 2 January 2009 | |
| | | $’000 | | | $’000 | |
Cost and net book value | | | | | | |
At the beginning of the period | | 132,822 | | | 174,555 | |
Acquisition of subsidiaries | | 281,525 | | | – | |
Capital contributions arising from IFRIC 11 charges | | 10,581 | | | 7,586 | |
Impairment of investment in UbiNetics VPT Limited | | – | | | (49,319 | ) |
Adjustment investment in NordNav Technologies (see note 22) | | (17,500 | ) | | – | |
At the end of the period | | 407,428 | | | 132,822 | |
During 2008, the investment in UbiNetics VPT Limited was written down to $nil. This resulted from the decision to discontinue investment in the UbiNetics protocol software development programme following the recommendations of the Operational Assessment carried out to determine future strategy. The impairment is charged to Administrative Expenses in the company only income statement.
43. Financial assets
Other receivables
| | | | | | |
| | | 1 January 2010 | | 2 January 2009 | | 28 December 2007 |
| | | $’000 | | $’000 | | $’000 |
Prepayments and accrued income | | 112 | | 405 | | 432 |
Amounts receivable from other Group undertakings | | 33,313 | | 29,024 | | 19,881 |
| | | 33,425 | | 29,429 | | 20,313 |
The directors consider that the carrying amount of other receivables approximates their fair value.
Amounts receivable from other Group undertakings are neither past due nor impaired as management considers that the CSR Employee Benefit Trust has sufficient assets to fulfil its future obligations.
Cash and cash equivalents
Bank balances and cash comprise cash held by the Company and short term bank deposits with an original maturity of three months or less. The carrying amount of these assets approximates their fair value.
Treasury deposits
Treasury deposits represent bank deposits with an original maturity of over three months.
44. Financial liabilities
Trade and other payables
| | | | | | |
| | | 1 January 2010 | | 2 January 2009 | | 28 December 2007 |
| | | $’000 | | $’000 | | $’000 |
Amounts owed to subsidiary undertakings | | 279,340 | | 227,515 | | 199,049 |
Accruals and deferred income | | 28 | | 10 | | 44 |
Other payables | | – | | – | | 2,065 |
| | | 279,368 | | 227,525 | | 201,158 |
The directors consider that the carrying amount of trade and other payables approximates their fair value.
45. Contingent consideration
| | | | | | |
| | | 1 January 2010 | | 2 January 2009 | | 28 December 2007 |
| | | $’000 | | $’000 | | $’000 |
Amounts included within current liabilities | | – | | 753 | | 25,988 |
Amounts included within non-current liabilities | | – | | 16,747 | | – |
| | | – | | 17,500 | | 25,988 |
CSR plc Annual Report and Financial Statements 2009
152
45. Contingent consideration (continued)
The contingent consideration relates to milestone payments for the acquisition of NordNav Technologies AB. The consideration is due to be settled in instalments once certain performance criteria have been achieved. In 2009, it was determined that these performance criteria would not be met and the liability was derecognised.
46. Reserves
| | | |
| | | Retained losses | |
| | | $’000 | |
Balance at 28 December 2007 | | (6,603 | ) |
Net loss for the period | | (51,671 | ) |
Balance 2 January 2009 | | (58,274 | ) |
Net loss for the period | | (13,745 | ) |
Balance at 1 January 2010 | | (72,019 | ) |
The movements on the other reserves are disclosed in note 25 to the consolidated financial statements.
47. Notes to the cash flow statement
| | | | | | | | | |
| | | 52 weeks ended 1 January 2010 | | | 53 weeks ended 2 January 2009 | | | 52 weeks ended
28 December 2007 | |
| | | $’000 | | | $’000 | | | $’000 | |
Net loss | | (13,745 | ) | | (51,671 | ) | | (7,637 | ) |
Adjustments for: | | | | | | | | | |
Investment income | | (1,607 | ) | | (4,084 | ) | | (4,503 | ) |
Finance costs | | 122 | | | 6,806 | | | 6,328 | |
Income tax expense | | 757 | | | – | | | – | |
Operating loss | | (14,473 | ) | | (48,949 | ) | | (5,812 | ) |
Impairment of investment in subsidiary | | – | | | 49,319 | | | – | |
Operating cash flows before movements in working capital | | (14,473 | ) | | 370 | | | (5,812 | ) |
Increase in receivables | | (4,289 | ) | | (8,995 | ) | | (19,970 | ) |
Increase in payables | | 51,122 | | | 17,880 | | | 137,393 | |
Cash generated by operations being net cash from operating activities | | 32,360 | | | 9,255 | | | 111,611 | |
Cash and cash equivalents (which are presented as a single class of asset on the face of the balance sheet) comprise cash at bank and other short term highly liquid investments with an original maturity of three months or less.
48. Financial instruments
Capital risk management
The Company manages its capital to ensure that a strong capital base is maintained to sustain the future growth and development of the Group.
The capital structure of the Company consists of debt in the form of contingent consideration disclosed in note 45, cash and cash equivalents, treasury deposits and equity attributable to equity holders of the parent, comprising issued capital, reserves and retained earnings as disclosed in note 46.
There are no externally imposed capital requirements on the Company.
Categories of financial instruments
| | | | | | |
| | | 1 January 2010 | | 2 January 2009 | | 28 December 2007 |
| | | $’000 | | $’000 | | $’000 |
Financial assets | | | | | | |
Loans and receivables (including cash and cash equivalents and treasury deposits) | | 213,425 | | 174,429 | | 157,378 |
Financial liabilities | | | | | | |
Amortised cost | | 279,368 | | 245,025 | | 227,146 |
CSR plc Annual Report and Financial Statements 2009
153
NOTES TO THE COMPANY FINANCIAL STATEMENTS Continued
48. Financial instruments (continued)
Categories of financial instruments (continued)
At the reporting date there are no loans and receivables designated at fair value through profit and loss. The carrying amount reflected above represents the Company’s maximum exposure to credit risk for such loans and receivables.
Financial risk management objectives
The Group Treasury function provides services to the Company, co-ordinates access to domestic and international financial markets and monitors and manages the financial risks relating to the operations of the Company.
The main risks the Company is exposed to are the currency risk component of market risk, credit risk, and liquidity risk.
Foreign currency risk management
The Company does not seek to manage the currency risk component of market risk as these risks are managed on a Group level. The Company does not enter into any financial derivative contracts. The Company does not enter into, or trade financial instruments, including derivative financial instruments, for speculative purposes.
Foreign currency sensitivity analysis
The sensitivity analysis below has been determined based on the exposure of the Company to foreign currency movements for its non-derivative financial instruments at the balance sheet date.
If the US dollar had strengthened by 10 percent against GBP sterling, the Company’s:
| | · | | Loss for the 52 week period ended 1 January 2010 would have decreased by $946,000. Loss for the 53 week period ended 2 January 2009 would have decreased by $1,017,000. In both periods, this is mainly attributable to the Company’s exposure to foreign exchange movements on Sterling denominated monetary assets and liabilities; |
| | · | | there is no impact on other equity reserves (2008: $nil). |
A 10 percent weakening of the US dollar against GBP sterling would have had the equal but opposite effect, on the basis that all the other variables remain constant.
In management’s opinion, this is a reasonably possible change in currency rates given current market conditions. This analysis assumes all other variables, in particular interest rates and other foreign currencies, remain constant. The analysis is performed on the same basis for 2008.
Interest rate risk management
The company has no significant direct exposures to fluctuations in interest rates other than those on interest bearing cash balances. The majority of cash balances are held at fixed rates of interest and the effective rate of interest on those balances in the period was 0.54% (2008: 4.67%).
Credit risk management
Credit risk refers to the risk that counterparties will default on their contractual obligations resulting in financial loss to the Company. For cash and cash equivalents and treasury deposits, the Company only transacts with entities that are equivalent to investment grade and above and Group treasury policy dictates that less than 20% of the total balance on cash and equivalents and treasury deposits will be placed on term deposit with counterparties who have a Moody’s credit rating of less than Aa1. Other financial assets consist of amounts receivable from related parties. The Company’s exposure to significant concentration of credit risk on receivables from related parties is detailed in note 49.
Liquidity risk management
Ultimate responsibility for the liquidity risk management of the Company rests with the Board of Directors which manages the liquidity requirements of the Company in terms of short, medium and long-term funding requirements. The Company manages liquidity risk via the Group’s Treasury function using sources of financing from other Group entities and investing excess liquidity. The Company manages excess reserves by continuously monitoring forecast and actual cash flows and matching maturity profiles of financial assets and liabilities.
CSR plc Annual Report and Financial Statements 2009
154
48. Financial instruments (continued)
Liquidity risk management (continued)
The following tables detail the Company’s remaining contractual maturity for its non-derivative financial liabilities. The tables have been drawn up based on the earliest date on which the Company can be required to pay. The table includes both interest and principal cash flows.
| | | | | | | | | | | | |
| 1 January 2010 | | Less than
one month | | 1-2 months | | 2-3 months | | 3-6 months | | More than
6 months | | Total |
| | | $’000 | | $’000 | | $’000 | | $’000 | | $’000 | | $’000 |
Amounts owed to subsidiary undertakings | | – | | – | | – | | – | | 279,340 | | 279,340 |
| | | – | | – | | – | | – | | 279,340 | | 279,340 |
| | | | | | |
| 2 January 2009 | | Less than
one month | | 1-2 months | | 2-3 months | | 3-6 months | | More than
6 months | | Total |
| | | $’000 | | $’000 | | $’000 | | $’000 | | $’000 | | $’000 |
Contingent consideration (undiscounted) | | – | | – | | – | | – | | 17,500 | | 17,500 |
Amounts owed to subsidiary undertakings | | – | | – | | – | | – | | 227,515 | | 227,515 |
| | | – | | – | | – | | – | | 245,015 | | 245,015 |
| | | | | | |
| 28 December 2007 | | Less than
one month | | 1-2 months | | 2-3 months | | 3-6 months | | More than
6 months | | Total |
| | | $’000 | | $’000 | | $’000 | | $’000 | | $’000 | | $’000 |
Contingent consideration (undiscounted) | | – | | 9,625 | | – | | – | | 17,500 | | 27,125 |
Unsecured loan notes on acquisition | | – | | 1,865 | | – | | 257 | | – | | 2,122 |
Amounts owed to subsidiary undertakings | | – | | – | | – | | – | | 199,049 | | 199,049 |
| | | – | | 11,490 | | – | | 257 | | 216,549 | | 228,296 |
Management do not expect amounts owed to subsidiary undertakings to be repaid in the next operating cycle.
Fair value of financial instruments
Details of the methods of determining the fair values of the Company’s financial assets and financial liabilities are discussed in notes 43 and 44.
The carrying amounts of financial assets and liabilities recorded at amortised cost in the financial statements which approximates their fair values in the opinion of the Directors.
49. Related party transactions
Transactions between the Company and its subsidiaries, which are related parties, are disclosed below:
| | | | | | | | | |
| | | 52 weeks
ended
1 January
2010 | | | 53 weeks
ended
2 January
2009 | | | 52 weeks
ended
28 December
2007 | |
| | | $’000 | | | $’000 | | | $’000 | |
Cambridge Silicon Radio Limited | | | | | | | | | |
– Funding received from Cambridge Silicon Radio Limited | | 48,289 | | | 9,086 | | | 118,779 | |
– Services received from Cambridge Silicon Radio Limited | | 2,814 | | | 13,725 | | | 14,149 | |
– Interest charged on intercompany balance | | 722 | | | 5,663 | | | 6,749 | |
CSR Employee Benefit Trust | | | | | | | | | |
– Funding provided | | – | | | (10,000 | ) | | (119,881 | ) |
– Exchange gains and loss | | 3,286 | | | 857 | | | – | |
SiRF Technology Inc. | | | | | | | | | |
- Funding provided | | (1,002 | ) | | – | | | – | |
Balances between the Company and its subsidiaries, which are related parties, are disclosed below:
| | | | | | | | | |
| | | 1 January
2010 | | | 2 January
2009 | | | 28 December
2007 | |
| | | $’000 | | | $’000 | | | $’000 | |
Cambridge Silicon Radio Limited | | (279,340 | ) | | (227,515 | ) | | (199,041 | ) |
CSR Employee Benefit Trust | | 32,311 | | | 29,024 | | | 19,881 | |
SiRF Technology Inc | | 1,002 | | | – | | | – | |
CSR plc Annual Report and Financial Statements 2009
155
FIVE YEAR SUMMARY
| | | | | | | | | | | | | | | |
| | | 2009 | | | 2008 | | | 2007 | | | 2006 | | | 2005 | |
| | | $’000 | | | $’000 | | | $’000 | | | $’000 | | | $’000 | |
Results | | | | | | | | | | | | | | | |
Turnover | | 601,399 | | | 694,865 | | | 848,622 | | | 704,695 | | | 486,531 | |
Operating profit (loss) | | (15,914 | ) | | (8,515 | ) | | 150,098 | | | 148,995 | | | 111,936 | |
Profit (loss) before tax | | (14,242 | ) | | (6,451 | ) | | 155,599 | | | 154,397 | | | 114,366 | |
Taxation | | 2,933 | | | (488 | ) | | (42,795 | ) | | (43,200 | ) | | (31,210 | ) |
Profit (loss) for the financial year | | (11,309 | ) | | (6,939 | ) | | 112,804 | | | 111,197 | | | 83,156 | |
| | | | | |
Assets employed | | | | | | | | | | | | | | | |
Total assets | | | | | | | | | | | | | | | |
Non-current assets | | 311,317 | | | 181,773 | | | 249,296 | | | 140,442 | | | 118,883 | |
Net current assets | | 465,510 | | | 307,810 | | | 267,717 | | | 269,000 | | | 160,133 | |
Non-current liabilities | | (2,716 | ) | | (22,837 | ) | | (8,350 | ) | | (3,233 | ) | | (1,979 | ) |
Net assets | | 774,111 | | | 466,746 | | | 508,663 | | | 406,209 | | | 277,037 | |
Authorised share capital (£’000) | | 350,000 | | | 185,000 | | | 185,000 | | | 185,000 | | | 185,000 | |
Number of shares outstanding (number) | | 182,187,878 | | | 132,890,821 | | | 132,072,576 | | | 130,206,208 | | | 127,879,155 | |
| | | | | |
Key statistics | | $ | | | $ | | | $ | | | $ | | | $ | |
Earnings (loss) per share | | (0.07 | ) | | (0.05 | ) | | 0.86 | | | 0.86 | | | 0.67 | |
Diluted earnings (loss) per share | | (0.07 | ) | | (0.05 | ) | | 0.83 | | | 0.82 | | | 0.62 | |
CSR plc Annual Report and Financial Statements 2009
156
DIRECTORS’ REPORTCORPORATE AND SHARE INFORMATION
|
| |
Directors’ report – Corporate and share information |
History and Development
CSR plc is the holding company of an international group of companies the principal activities of which are the design and supply of integrated circuits or silicon chips for wireless connectivity. CSR is domiciled in England and Wales and its registered office and principal place of business is at Churchill House, Cambridge Business Park, Cowley Road, Cambridge CB4 0WZ and its telephone number is +44 (0) 1223 692000.
CSR was established in Cambridge in April 1999 by an engineering and marketing team that previously worked at Cambridge Consultants Limited, a technology and consulting firm based in Cambridge that transferred certain assets, including the assignment and license on a non-exclusive royalty free basis of intellectual property rights, to CSR in exchange for ordinary shares.
CSR plc (the holding company) was incorporated and registered in England and Wales on 26 March 2001 with the name Cambridge Silicon Radio Holdings Limited (registered number 04187346), as a private company limited by shares under the U.K. Companies Acts. On 10 July 2001, CSR was re-registered as a public company limited by shares with the name Cambridge Silicon Radio Holdings PLC; on 25 October 2002, CSR was re-registered as a private company limited by shares with the name Cambridge Silicon Radio Holdings Limited; and on 19 February 2004, it was re-registered as a public company limited by shares with the name CSR plc. CSR ordinary shares were admitted to the Official List of the U.K. Listing Authority and to trading on the main market of the London Stock Exchange in March 2004 and CSR is a constituent of the FTSE 250 Index.
Beginning in 2005, we have sought to broaden our technological base and product range through a series of acquisitions, as follows:
| | · | | In March 2005, we acquired Clarity Technologies, Inc. for $17.1 million, in cash. |
| | · | | In August 2005, we acquired the software business of UbiNetics (VPT) Limited for $48 million in cash. In May 2008, as a result of an operational strategy assessment we decided to cease our ongoing investment and write off the |
| | | investment we had made in the UbiNetics protocol software development program, which had been acquired with the software business of UbiNetics in August 2005. |
| | · | | In January 2007, we acquired NordNav for an initial consideration of $40 million, in cash. In 2008, we paid a further consideration of $17.5 million in cash. Through this acquisition, we acquired early-stage GPS technology and intellectual property to develop a software-based GPS solution. |
| | · | | In January 2007, we also acquired CPS for $35 million in cash. Through this acquisition, we acquired specialized location system technology to address solutions when GPS signals may be unavailable (e.g., indoors). |
| | · | | In June 2009, we acquired the GPS-based business of SiRF, for a consideration satisfied by the issue of shares in CSR plc to holders of SiRF Common Stock as at 26 June 2009 at a ratio of 0.741 of a CSR ordinary share for each SiRF share, which at 26 June 2009, valued SiRF at $281.5 million. Through the transaction, we acquired a leader in semiconductor-based GPS location platforms with strong hardware, software and system capabilities, as a further step towards building on our leading position in the Connectivity Centre. |
Sales and Marketing
CSR’s sales and marketing function is centered in Cambridge with sales liaison offices in Dallas and Detroit, United States; Taipei, Taiwan; Seoul and Gumi, South Korea; Tokyo, Japan; and Shanghai and Shenzhen, China.
CSR markets to OEMs and ODMs, principally through its direct sales force and, in North America, through sales representatives. CSR also markets its products through a global network of distributors.
CSR’s marketing efforts are supported by a team of applications engineers who provide technical support and assistance to existing and potential customers in
CSR plc Annual Report and Financial Statements 2009
157
DIRECTORS’ REPORTCORPORATE AND SHARE INFORMATION continued
designing, testing and qualifying systems that incorporate its products. This support is generally provided without charge to customers who have the potential to purchase large volumes of products.
An important part of CSR’s marketing effort involves providing technical support to product developers to encourage them to design products using CSR’s chips. For this purpose, CSR provides a range of development kits and tools. For a discussion of CSR’s revenue by product segment, see “Business and Financial Review – Financial Performance – Segment Analysis” of this annual report. For a discussion of CSR’s revenues by geographic area, see “Business and Financial Review – Financial Performance – Geographical Analysis” of this annual report.
Manufacturing and Assembly
CSR is a “fabless” semiconductor company. Because CSR uses independent fabrication facilities to manufacture its products, we subcontract wafer fabrication and assembly to Taiwan Semiconductor Manufacturing Company, (or TSMC), in Taiwan, IBM in the United States, Samsung in South Korea and STMicroelectronics in Italy and France. We also subcontract assembly, testing and shipping to Advanced Semiconductor Engineering, (or ASE), in Taiwan, STATS ChipPAC Limited, (STATS) in Korea and Malaysia, Amkor Technology Inc in Taiwan and China, Siliconware Precision Industries Limited in Taiwan, Samsung in South Korea, ST Microelectronics in Italy and France, Signetics Corp in Korea and King Yuan Electronics Co., Ltd (KYEC) in Taiwan. We also rely on Global Uni Chip, a design foundary, to provide turnkey solutions for our system on chip, or SoC products. We do not have any long-term contracts with any of these third parties, and thus have no assurance as to their long-term availability or cost.
Prior to the acquisition of SiRF, all wafer fabrication, test, assembly and packaging was subcontracted to TSMC and ASE. As part of the integration of SiRF following the acquisition in June 2009, we added additional partners to our supply chain who had previously supported SiRF in order to enable the enlarged portfolio of products to be supplied to our customers. Through all these subcontractors we work to ensure that the Group is able to maintain sufficient capacity to support the demand for our integrated circuits, which can be affected in the event of a loss of
capacity at a supplier due to events affecting their business, or increased demand from our competitors which may mean we are unable to secure the volumes of products we require to meet customer demand.
Raw Materials
CSR sources the manufacture of its silicon wafers, and sources the testing of wafers and packaging of its integrated circuits from various subcontractors named above, who have facilities spread across multiple locations, primarily in the Asia Pacific region. CSR also purchases flash memory from a sole supplier, SST, and certain other passive components from other suppliers. These passive components are standard components capable of being obtained through alternative sources, subject to the conduct of a product qualification process prior to adoption into manufacturing.
Seasonality
CSR has historically experienced increased net revenue in its second and third quarters primarily due to seasonal demand related to the holiday season and end of calendar year spending patterns in corporate budgets. Due to continued economic uncertainty and other factors, past historical patterns should not be considered a reliable indicator of CSR’s future net revenue or financial performance and historical seasonal patterns may not recur.
Governmental Regulation
CSR is not aware of any governmental regulations that would have a material effect on its business.
Intellectual Property
Our success and ability to compete depends to a significant degree upon the protection of our proprietary technology. As of 1 January 2010, we had 582 patents granted worldwide. Of this total, CSR has 250 patents granted in the United States and 332 patents granted in other territories, with expiration dates ranging from 2010 to 2029, along with 284 pending patent applications in the United States and 485 pending patent applications in other territories. We intend to continue to assess appropriate occasions for seeking patent protection for those aspects of our technology that we believe provides significant competitive advantage. Although we file patents to protect our inventions, our revenue is not
CSR plc Annual Report and Financial Statements 2009
158
dependent on any particular patent. We do not believe that the expiration or loss of a particular patent would materially harm our business.
CSR’s Bluetooth products use the Bluetooth trademark, which is owned by the Bluetooth SIG, or special interest group, a trade association of which CSR is a member. Any company incorporating Bluetooth wireless technology into products or services, or re-branding a product with Bluetooth technology, must become a member of the Bluetooth SIG. The Bluetooth trademark is licensed on a worldwide, royalty-free, non-exclusive, non-transferable, personal basis for use by companies that are incorporating qualified Bluetooth wireless technology into their products. CSR is a member of the Bluetooth SIG and licensee of the Bluetooth trademark.
CSR plc
Churchill House
Cambridge Business Park
Milton Road
Cambridge
CB4 OWZ
Registered in England and Wales 4187346
www.csr.com
| | |
| Advisors | | |
Auditors | | Deloitte LLP |
Corporate brokers | | JPMorgan Cazenove Limited, UBS |
Solicitors | | Slaughter and May |
Bank | | Lloyds TSB Bank plc |
| | | |
Share Information at 1 March 2010 |
| |
Shares outstanding | | |
Trading Symbol | | CSR |
Country of Registration | | Great Britain |
Market | | London Stock Exchange |
SEDOL | | 3414738 |
Registrar | | Equiniti, Aspect House, Spencer Road, Lansing, West Sussex, BN99 BDA |
| | | | |
| Capital Structure | | | | |
| Holding | | Number of
Shareholders | | % age of total
shareholders |
1 – 1,000 | | 598 | | 42.32 |
1001 – 5000 | | 329 | | 23.28 |
5,001 – 10,000 | | 99 | | 7.01 |
10,001 – 50,000 | | 154 | | 10.90 |
50,001 – 100,000 | | 59 | | 4.18 |
100,001 – 250,000 | | 66 | | 4.67 |
Over 250,000 | | 108 | | 7.64 |
Total | | 1,413 | | 100 |
Market Prices
The primary trading market for CSR ordinary shares is the London Stock Exchange, where CSR ordinary shares trade under the ticker symbol “CSR.L”. As of 1 January 2010, there were 182,187,878 CSR ordinary shares outstanding.
The following table shows the high and low market prices for CSR ordinary shares in pounds sterling for the five most recent full financial years, for each full financial quarter for the two most recent full financial years and for each month within the last six months:
| | | | |
| | | CSR Ordinary Shares (pence) |
| Year | | High | | Low |
2010 | | 508.00 | | 157.25 |
2009 | | 600.00 | | 150.25 |
2007 | | 905.00 | | 548.00 |
2006 | | 1,512.00 | | 613.00 |
2005 | | 936.00 | | 301.25 |
| | | | | |
| | | CSR Ordinary Shares (pence) |
| Quarter | | High | | Low |
Fourth Quarter 2009 | | 485.70 | | 368.80 |
Third Quarter 2009 | | 508.00 | | 347.75 |
Second Quarter 2009 | | 389.75 | | 234.00 |
First Quarter 2009 | | 260.25 | | 157.25 |
Fourth Quarter 2008 | | 274.25 | | 150.25 |
Third Quarter 2008 | | 347.25 | | 224.00 |
Second Quarter 2008 | | 395.00 | | 274.50 |
First Quarter 2008 | | 600.00 | | 295.00 |
CSR plc Annual Report and Financial Statements 2009
159
DIRECTORS’ REPORTCORPORATE AND SHARE INFORMATION continued
| | | | |
| | | | | |
| | | CSR Ordinary Shares (pence) |
| Month | | High | | Low |
February 2010 | | 441.00 | | 505.00 |
January 2010 | | 457.50 | | 417.40 |
December 2009 | | 420.00 | | 368.80 |
November 2009 | | 467.20 | | 400.00 |
October 2009 | | 485.70 | | 402.10 |
September 2009 | | 508.00 | | 453.50 |
Exchange rates
The following table sets out, for the periods and dates indicated, the period end, average, high and low exchanges rates for pounds sterling expressed in US dollars per £1.00.
| | | | | | |
| Year ended 31 December | | Average | | High | | Low |
2009 | | 1.57 | | 1.70 | | 1.38 |
2008 | | 1.85 | | 2.03 | | 1.44 |
2007 | | 2.00 | | 2.11 | | 1.92 |
2006 | | 1.84 | | 1.98 | | 1.72 |
2005 | | 1.81 | | 1.92 | | 1.71 |
| | | | |
| Month | | High | | Low |
February 2010 | | 1.61 | | 1.52 |
January 2010 | | 1.64 | | 1.59 |
December 2009 | | 1.66 | | 1.59 |
November 2009 | | 1.68 | | 1.64 |
October 2009 | | 1.66 | | 1.58 |
September 2009 | | 1.67 | | 1.59 |
Major Shareholders
Information regarding our major shareholders is disclosed on page 90. None of the holders of CSR ordinary shares has voting rights that differ from those of other shareholders. As of 1 March 2010, there were 98 shareholders with a US address on the register of shareholders, representing approximately 0.64% of CSR’s outstanding share capital. Because many of our ordinary shares are held by brokers and nominees, the number of record shareholders in the US may not be representative of the number of US beneficial shareholders of our ordinary shares. CSR is not directly or indirectly owned or controlled by any government, person or other legal entity. There are no arrangements known to CSR that could result in a change of control of CSR.
Agent in the United States
The Company’s agent for service in the United States is National Registered Agents, Inc, 160 Greentree Drive, Suite 101, Dover, Delaware 19904.
Documents on Display
We previously filed with the United States Securities and Exchange Commission, or the SEC, a registration statement on Form F-4 (File No. 333-159615) and a related prospectus with respect to an offering of our ordinary shares in the United States. Under the Exchange Act, we are required to file reports and other information with the SEC. Copies of these reports and other information, when so filed, including documents referred to in this Annual Report, may be inspected without charge and may be obtained at prescribed rates at the public reference facilities maintained by the SEC at Judiciary Plaza, 100 F Street, N.E., Washington, D.C. 20549. For further information regarding the operation of the public reference room and the copy charges, please call the SEC at 1-800-SEC-0330. The SEC maintains a web site at http://www.sec.gov that contains reports, proxy and information statements, and other information regarding registrants that make electronic filings with the SEC using its EDGAR system. As a foreign private issuer, we are exempt from the rules of the Exchange Act prescribing the furnishing and content of quarterly reports and proxy statements, and our executive officers, directors and principal shareholders are exempt from the reporting and short-swing profit recovery provisions contained in Section 16 of the Exchange Act.
This Annual Report is also available, free of charge, at www.csr.com. You may also obtain copies of this Report, free of charge, by mail.
Memorandum and Articles of Association
The following summarizes certain provisions of the Company’s Memorandum and Articles of Association and applicable English law, as currently in effect. This summary is qualified in its entirety by reference to the UK Companies Act and the Company’s Memorandum and Articles of Association, copies of which can be obtained from Companies House in the United Kingdom or by writing to the Company Secretary. Copies of the Company’s Memorandum and Articles of Association, as currently in force, are available from the U.S. Securities and Exchange Commission website at www.sec.gov.
CSR plc Annual Report and Financial Statements 2009
160
At the AGM scheduled to be held on 19 May 2010, the Company proposes to amend the Articles of Association to reflect the full implementation of the Companies Act 2006 on 1 October 2009.
Objects and purposes
CSR plc was incorporated and registered in England and Wales on 26 March, 2001 with the name Cambridge Silicon Radio Holdings Limited, as a private company limited by shares under the UK Companies Acts. On 10 July, 2001, CSR was re-registered as a public company limited by shares with the name Cambridge Silicon Radio Holdings PLC; on 25 October, 2002, CSR was re-registered as a private company limited by shares with the name Cambridge Silicon Radio Holdings Limited; and on 19 February, 2004, it was re-registered as a public company limited by shares with the name CSR plc (registered number 04187346).
The Memorandum of Association of CSR provides that the Company’s objects are to carry on the business of a holding company, the development and design of electronic hardware and computer software and other objects more particularly set out in Clause 4 of the Memorandum of Association. Since 1 October 2009, the Companies Act 2006 treats certain clauses of the Memorandum of Association, including Clause 4, as part of the Company’s Articles of Association. However, the Companies Act 2006 abolishes the need for companies to have an objects clause and for this reason, the Company is proposing to remove its objects clause at the 2010 AGM.
Directors
The business of the Company is conducted under the supervision of the Board.
Conflicts of interest
The UK Companies Act requires a director of a company who is in any way interested, directly or indirectly, in a contract or proposed contract with the company to declare the nature and extent of his interest to the other directors of the company. The UK Companies Act also requires that a director must avoid a situation where a director has, or could have, a direct or indirect interest that conflicts, or possibly may conflict, with the company’s interests. It allows directors of public companies to authorize such conflicts where appropriate, if a company’s articles of association so permit. CSR’s Articles of Association
provide that the Board may in specified circumstances authorize any matter that would otherwise involve a director breaching his duty under the UK Companies Acts to avoid a conflict of interest. They also provide that, subject to authorization of such conflict, a director may retain any benefit derived by reason of that interest.
Director compensation
The Board sets the Company’s remuneration policy. The Remuneration Committee determines on behalf of the Board, specific remuneration packages for each of the executive directors and for the Chairman. Only non-executive directors serve on the Remuneration Committee and the members of the Remuneration Committee are independent of executive management. The Remuneration Committee monitors and provides guidance on the level and structure of remuneration for senior management who report to the Chief Executive Officer. The Board itself determines the remuneration of the non-executive directors. No director may participate in discussions relating to his or her own terms and conditions of service or remuneration.
Borrowing powers
The Board may exercise the Company’s borrowing powers. Save with the previous sanction of an ordinary resolution, such borrowing powers are restricted where the principal amount outstanding of all borrowings is equal to the greater of £300,000,000 and three times the Company’s adjusted capital and reserves.
Retirement
At every annual general meeting, any director who (a) has been appointed by the Board since the last annual general meeting, or (b) held office at the time of the two preceding annual general meetings and did not retire at either of them, or (c) has held office with the Company, other than employment or executive office, for a continuous period of nine years or more at the date of the meeting, shall retire from office and may offer himself for re-appointment by the members.
Director qualifying shares
Directors of the Company are not required by the Memorandum or the Articles of Association to hold any shares in the Company.
CSR plc Annual Report and Financial Statements 2009
161
DIRECTORS’ REPORTCORPORATE AND SHARE INFORMATION continued
Rights and restrictions attaching to the shares
Dividend rights
The shareholders may by ordinary resolution from time to time declare dividends not exceeding the amount recommended by the Board. The Board may pay interim dividends, and also any fixed rate dividend, whenever the financial position of CSR, in the opinion of the Board, justifies its payment. If the Board acts in good faith, it is not liable to holders of shares with preferred or similar rights for losses arising from the payment of interim or fixed dividends on other shares.
The Board may withhold payment of all or any part of any dividends or other moneys payable in respect of CSR’s shares from a person with a 0.25% interest if such a person has been served with a restriction notice after failure to provide CSR with information concerning interests in those shares required to be provided under the UK Companies Act.
The Board may, if authorized by an ordinary resolution, offer shareholders (excluding any member holding shares as treasury shares) in respect of any dividend the right to elect to receive shares by way of scrip dividend instead of cash.
Any dividend unclaimed after a period of 12 years from the date when it was declared or became due for payment must be forfeited and revert to CSR. CSR may stop sending checks, warrants or similar financial instruments in payment of dividends by post in respect of any shares or may cease to employ any other means of payment, including payment by means of a relevant system, for dividends if either (i) at least two consecutive payments have remained uncashed or are returned undelivered or that means of payment has failed or (ii) one payment remains uncashed or is returned undelivered or that means of payment has failed and reasonable inquiries have failed to establish any new postal address or account of the holder. In addition, CSR must resume sending dividend checks, warrants or similar financial instruments or employing that means of payment if the holder requests such resumption in writing.
Voting rights
Under English law, a shareholder who is present in person and entitled to vote at a shareholders’ meeting is entitled to one vote on a show of hands regardless of the number of shares he or she holds. Every proxy present who has been duly appointed by a
shareholder entitled to vote on the resolution has one vote on a show of hands, unless the proxy is appointed by more than one shareholder in which case the proxy has one vote for and one vote against if the proxy has been instructed by one or more shareholders to vote for the resolution and by one or more shareholders to vote against the resolution.
The Articles of Association provide that resolutions put to a vote at a shareholders’ meeting will be decided on a show of hands, unless a poll is demanded by: (a) the chairman of the meeting; (b) not less than five members present in person or by proxy and entitled to vote; (c) a member or members present in person or by proxy and representing not less than one-tenth of the total voting rights of all the members having the right to vote at the meeting; or (d) a member or members present in person or by proxy and holding shares in CSR conferring a right to vote at the meeting being shares on which an aggregate sum has been paid up equal to not less than one-tenth of the total sum paid up on all the shares conferring that right.
A demand for a poll may be withdrawn with the consent of the chairman of the meeting at any time before the close of the meeting or the taking of the poll, whichever is the earlier. A demand so withdrawn shall not invalidate the result of a show of hands declared before the demand was made.
Under English law, any shareholder entitled to attend and vote at a meeting is entitled to appoint a proxy to exercise all or any of his rights to attend, speak and vote at a meeting of the company.
Generally under English law, two shareholders present in person or by proxy constitute a quorum for the purpose of a general meeting, unless the company’s articles of association specify otherwise. The Articles of Association specify that two members present in person or by proxy and entitled to vote constitute a quorum for all purposes.
At each annual general meeting of shareholders, directors are elected to fill the vacancies resulting from the retirement of directors described above under “Directors – Retirement”. Accordingly, not all directors stand for election each year. The Memorandum and Articles of Association do not provide for or permit cumulative voting.
CSR plc Annual Report and Financial Statements 2009
162
Under the Articles of Association, no member is entitled to vote at any general meeting or class meeting in respect to any share held by him if any call or other sum then payable by him in respect of that share remains unpaid or if a member has been served with a restriction notice after failure to provide CSR with information concerning interests in those shares required to be provided under the UK Companies Act.
Rights to share in profits
Other than the provisions outlined above in relation to dividends that have been declared and the provisions below in relation to rights on a liquidation of CSR, shareholders have no rights to share in the profits of CSR.
Pre-emptive rights
Subject to the UK Companies Act, any equity securities issued by CSR for cash must first be offered to CSR shareholders in proportion to their existing holdings of CSR ordinary shares.
The UK Companies Act and the listing rules made by the UK Listing Authority, or the listing rules, allow for the disapplication of pre-emption rights, which may be waived by a special resolution of CSR shareholders, either generally or specifically, for a maximum period not exceeding five years.
Liquidation rights
The rights of shareholders to share in any surplus in the event of liquidation are not expressly dealt with in the Memorandum and Articles of Association. Under English law, if CSR is wound up (whether the liquidation is voluntary, under supervision of the Court or by the Court), the liquidator is under a duty to collect in and realize the assets of CSR and to distribute them to CSR’s creditors and, if there is a surplus, to CSR shareholders according to their entitlements. This applies whether the assets consist of property of one kind or of different kinds.
Redemption provisions
Subject to the provisions of the UK Companies Act and the listing rules, CSR may purchase or contract to purchase any of its ordinary shares on or off-market. CSR may only purchase its ordinary shares out of distributable reserves or the proceeds of a new issue of shares made for the purpose of funding the repurchase.
Sinking fund provisions
CSR shares are not subject to any sinking fund provision under its Memorandum or Articles of Association or under English law.
Capital calls
Shareholders have no liability for capital calls by the Company except with respect to the unpaid amount, if any, respecting their shares consisting of the nominal value of the shares and any premium which may be payable on those shares. The directors can call on shareholders to pay such amounts that have not yet been paid to the Company for their shares.
Provisions applicable only to significant shareholders
There are no provisions in the Memorandum or Articles of Association discriminating against a shareholder as a result of his or her ownership of a substantial number of shares.
Variation of rights
The Articles of Association provide that the rights attached to any class of shares may be varied with the written consent of the holders of not less than three-fourths in nominal value of the issued shares of that class (calculated excluding any shares held as treasury shares), or with the sanction of a special resolution passed at a separate general meeting of the holders of those shares. At every such separate general meeting (except an adjourned meeting) the quorum must be two persons holding or representing by proxy not less than one-third in nominal value of the issued shares of the class (calculated excluding any shares held as treasury shares).
The rights conferred upon the holders of any shares are not, unless otherwise expressly provided in the rights attaching to those shares, deemed to be varied by the creation or issue of further shares ranking equally with them.
General meetings
The Articles of Association rely on the UK Companies Act provisions dealing with the calling of general meetings. An annual general meeting of shareholders must be held once in every year within a period of six months beginning with the day following CSR’s accounting reference date (which is December 31). CSR’s Board may convene a general meeting of shareholders whenever they think fit or where they are requisitioned to do so by CSR shareholders in accordance with the UK Companies Act.
CSR plc Annual Report and Financial Statements 2009
163
DIRECTORS’ REPORTCORPORATE AND SHARE INFORMATION continued
General meetings may be held at such time and place as may be determined by CSR’s Board. An annual general meeting must be convened on at least 21 days’ written notice to shareholders entitled to receive notices. General meetings must be convened on at least 21 days’ written notice unless the requisite majority of shareholders has agreed to short notice. Two shareholders must be present in person or by proxy and entitled to vote to constitute a quorum for all purposes at general meetings of CSR.
Limitation on voting rights
Persons who are neither residents in the UK nor UK nationals may freely hold, vote and transfer shares in the same manner as UK residents or nationals. Any member whose registered address is not within the UK can give the Company a postal address within the UK at which notices may be served on him. Otherwise, a member whose registered address is not within the UK is not entitled to receive any notice from the Company.
Change of control
The Company can issue additional shares with any rights or restrictions attached to them as long as not restricted by any rights attached to existing shares. These rights or restrictions can be decided by the directors so long as there is no conflict with any resolution passed by the shareholders. The ability of the directors to issue shares with rights or restrictions that are different than those attached to the currently outstanding ordinary shares could have the effect of delaying, deferring or preventing change of control of the Company.
In addition, as discussed above under “Directors – Retirement”, directors stand for re-election at an annual general meeting only if they are required by the terms of the Articles of Association to have retired from office in connection with such annual general meeting. As a result, not every director stands for re-election at each annual general meeting. Because this would prevent shareholders from replacing the entire board at a single meeting, this provision could also have the effect of delaying, deferring or preventing a change in control of the Company.
Disclosure of interests in shares
The UK Financial Services Authority and Disclosure and Transparency Rules impose an obligation upon a person who acquires or ceases to have notifiable
interest in the relevant share capital of a public company to notify the company of that fact within two days (excluding weekends and bank holidays) of his or her knowing of its occurrence. The disclosure threshold is 3%.
In addition, the UK Companies Act provides that a public company may, by notice in writing, require a person whom the company knows or reasonably believes to be or to have been within the three preceding years, interested in the company’s issued voting share capital to (1) confirm whether this is or is not the case, and (2) if this is the case, to give further information that the company requires relating to his interest or any other interest in the company’s shares of which he is aware.
The Articles of Association provide that if the holder of any shares or a person who appears to be interested in those shares, fails to comply within the relevant period with any statutory notice in respect of those shares, or makes a statement in response to the notice which is false or inadequate in a material particular, CSR may restrict the rights relating to the identified shares, following a restriction notice. The restriction notice will state that the identified shares no longer give the shareholder any right to attend or vote either personally or by proxy at a shareholders’ meeting or to exercise any right in relation to the shareholders’ meetings. Where the identified shares make up 0.25% or more (in amount or in number) of the existing shares of a class at the date of delivery of the restriction notice, the restriction notice can also contain the following further restrictions: (i) the Board can withhold any dividend or part of a dividend or other money otherwise payable in respect of the identified shares without any right to he holder to receive any shares in lieu of dividend; and (ii) the Board can refuse to register a transfer of any of the identified shares which are certificated shares unless the Board is satisfied that they have been sold outright to an independent third party. Once a restriction notice has been given, the Board is free to cancel it or exclude any shares from it at any time they think fit. In addition, it must cancel the restriction notice within seven days of being satisfied that all information requested in the statutory notice has been given. Also, where any of the identified shares are sold and the Directors are satisfied that they were sold outright to an independent third party, they must cancel the restriction notice within seven days of receipt of the notification of the sale. The Articles of
CSR plc Annual Report and Financial Statements 2009
164
Association do not restrict in any way the provision of the legislation which apply to failures to comply with notices under the legislation.
The UK City Code on Takeovers and Mergers imposes rigorous disclosure requirements affecting parties to a proposed takeover, their “associates” and persons acting “in concert” in relation to the shares of a company. These requirements also extend to dealings by persons who directly or indirectly own or control (either before or as a result of the dealing) 1% or more of the equity shares in an offeror or offeree company or of any other class of shares relevant to the offer in question.
Rule 13d-1 of the U.S. Securities Exchange Act of 1934 requires that a person or group acquiring beneficial ownership of more than 5% of equity securities registered under that Act discloses such information to the SEC within 10 days after the acquisition.
CSR is required by the listing rules of the UK Listing Authority to disclose in its annual report the identity and share interests of its directors and any persons connected with them, as defined in the UK Companies Act, and of any person with an interest of 3% or more of its CSR ordinary shares.
Persons discharging managerial responsibilities (primarily directors and some senior executives), and their connected persons, must notify a public company such as CSR in writing of the occurrence of all transactions conducted on their own account in the shares of the company, or derivatives or any other financial instruments relating to those shares within four business days of the day on which the transaction occurred. The notification must contain specified information, including the name of the person involved, the type of transaction, the date on which it occurred, and the price and volume of the transaction. The public company must notify a regulatory news service (which will make the information public) of any information notified to it in accordance with these provisions. The notification to a regulatory news service must be made as soon as possible, and in any event by no later than the end of the business day following the receipt of the information by the company.
Differences from law in host country
With respect to the items described above, applicable UK law is not significantly different from applicable U.S. law.
Changes in share capital
CSR may by ordinary resolution increase, consolidate, or consolidate and then subdivide its shares or any of them. Subject to the Companies Act, CSR, by resolution, may determine that, as between shares resulting from a subdivision, any of them may have a preference or advantage, or may be subject to restrictions as compared with the others. CSR may, by special resolution, reduce its share capital, share premium account, capital redemption reserve or any other undistributable reserve.
Material contracts
Excluding contracts entered into in the ordinary course of business, no contracts have been entered into in the two years preceding the date of this document by CSR or any other member of the Group that are considered material to its results or operations, other than the merger agreement with SiRF. On 9 February 2009, CSR entered into an agreement and plan of merger with SiRF Technology Holdings, Inc., pursuant to which a subsidiary of CSR was merged with and into SiRF, with SiRF as the surviving corporation. Under the merger agreement, CSR issued ordinary shares to SiRF shareholders with a total value of $281.5 million as of the date the acquisition was completed on 26 June 2009. This transaction is discussed further in the section entitled “Business and Financial Review” on page 10.
Exchange Controls
There are currently no foreign exchange control restrictions on CSR’s ability to pay dividends on its ordinary shares or on the conduct of its operations imposed by English law. There are currently no limitations on the right of non-residents or foreign owners to hold or vote CSR ordinary shares imposed by English law or CSR’s articles of association.
Taxation (US Holders)
US federal income tax matters
The following general discussion describes the material US federal income tax consequences of the
CSR plc Annual Report and Financial Statements 2009
165
DIRECTORS’ REPORTCORPORATE AND SHARE INFORMATION continued
ownership of ordinary shares that are generally applicable to US holders (as defined below). However, this discussion does not address all aspects of taxation that may be relevant to particular US holders in light of their personal investment or tax circumstances or to persons that are subject to special tax rules. In addition, this discussion does not address the tax treatment of special classes of US holders, such as banks, insurance companies, tax-exempt entities, financial institutions, broker-dealers, persons holding ordinary shares as part of a hedging or conversion transaction or as part of a “straddle,” US expatriates, persons subject to the alternative minimum tax, and non-US holders. This discussion may not be applicable to holders who acquired ordinary shares pursuant to the exercise of options or warrants or otherwise as compensation. Furthermore, this discussion of US federal income tax matters does not give a detailed discussion of any state or local tax considerations or tax considerations with respect to any non-US jurisdiction. We urge you to consult your own tax advisor as to the specific tax consequences of the ownership of ordinary shares, including the applicable US federal, state, local and foreign tax consequences to you of the ownership of ordinary shares.
As used in this discussion of US federal income tax consequences, a “US holder” means a holder of ordinary shares who or that holds such stock as a capital asset within the meaning of the Internal Revenue Code of 1986, as amended, or the Internal Revenue Code, and is for US federal income tax purposes (i) a citizen or resident of the United States, (ii) a corporation or other entity taxable as a corporation organized under the laws of the United States, any State thereof or the District of Columbia, (iii) a trust if a court within the United States is able to exercise primary jurisdiction over its administration and one or more US persons have authority to control all substantial decisions of the trust, or (iv) any person that is subject to US federal income tax on its worldwide income. As used herein, a “non-US holder” refers to any holder of ordinary shares (other than a partnership) who is not a “US holder.”
This discussion is based on the Internal Revenue Code, applicable Department of Treasury regulations, judicial authority, and administrative rulings and practice, all as of the date of this annual report. This discussion is not binding on the US Internal Revenue
Service, or the IRS, or the courts. Future legislative, judicial, or administrative changes or interpretations, which may or may not be retroactive, may adversely affect the accuracy of this discussion.
Passive Foreign Investment Company Rules
Special US federal income tax rules apply to US holders owning stock of a passive foreign investment company, or PFIC. A foreign corporation generally will be considered a PFIC for any taxable year in which (i) 75% or more of its gross income is passive income, or (ii) 50% or more of the average value of its assets are considered “passive assets” (generally, assets that generate passive income). Based upon an analysis of CSR’s holdings during the taxable year ended January 1, 2010 of cash and liquid assets such as bank deposits and marketable securities (all of which are “passive” assets for these purposes) and CSR’s share price for such period (which affects the valuation of certain assets, including goodwill), CSR believes that it did not qualify as a PFIC for its taxable year ended January 1, 2010. Moreover, based on current projections of CSR’s passive assets and expected share price, CSR believes that it will not qualify as a PFIC for its taxable year ending December 31, 2010. However, the determination of whether a company is a PFIC is highly factual, and will depend, among other things, upon CSR’s actual holdings of passive assets and share price during such period. Given CSR’s significant holdings of passive assets such as cash and marketable securities, if CSR’s share price were to decline for an extended time to levels comparable to its low point during January 2009, it is possible that CSR would be treated as a PFIC in a future taxable year. CSR will continue to monitor whether it qualifies as a PFIC, and will notify US holders of ordinary shares if it determines that it is a PFIC for a given taxable year.
If CSR were classified as a PFIC for any taxable year during which US holders hold ordinary shares, US holders would be subject to special, adverse rules unless, as described below, they make either a “QEF” election or a “mark-to-market” election with respect to their ordinary shares. Absent such elections, US holders’ gain from the sale or other disposition of ordinary shares and “excess distributions” received from CSR would be ordinary income. Such income would be taxed as if the gain or excess distribution had been realized ratably over the US holders’ holding period and would be increased by an interest charge
CSR plc Annual Report and Financial Statements 2009
166
with respect to underpayments of tax as if the ratable portion of the gain or excess distribution with respect to a given prior taxable year had been subject to tax in such year. An excess distribution generally would be any distribution to a US holder with respect to ordinary shares during a single taxable year that is greater than 125% of the average annual distributions received by such US holder with respect to ordinary shares during the three preceding taxable years or, if shorter, during his or her holding period with respect to the ordinary shares. For these purposes, gifts, exchanges pursuant to corporate reorganizations, and pledges of ordinary shares for use as a security for a loan may be treated as taxable dispositions.
US holders who make neither a mark-to-market election nor a QEF election will be required to file an IRS Form 8621 if they own ordinary shares in any year in which CSR is a PFIC and they receive a distribution from CSR or dispose of their CSR shares (and will also be required to file this form to make certain elections with respect to their CSR shares).
Mark-to-Market Election
If ordinary shares are considered to be traded on a “qualified exchange or other market,” US holders would not be subject to the foregoing PFIC taxation rules if they make a “mark-to-market” election with respect to their ordinary shares. Although the determination of whether shares are traded on a “qualified exchange or other market” is factual and there is no specific authority that designates certain non-US exchanges as “qualified exchanges,” CSR expects that US holders of ordinary shares will be able to make this election because CSR’s shares are currently traded on the LSE. However, no assurance can be provided in this regard. After making such an election, US holders generally would include as ordinary income in each year during which the election is in effect and during which CSR is a PFIC the excess, if any, of the fair market value of ordinary shares at the end of the taxable year over their adjusted basis in such ordinary shares. US holders also would be allowed to take an ordinary loss in respect of the excess, if any, of their adjusted basis in ordinary shares over their fair market value at the end of the taxable year (but only to the extent of the net amount of income that was previously included as a result of the mark-to-market election). US holders’ tax basis in ordinary shares would be adjusted to reflect any income or loss amounts resulting from a mark-to-market election. If
made, a mark-to-market election would be effective for the taxable year for which the election was made and for all subsequent taxable years in which CSR is a PFIC unless the ordinary shares were not considered to be traded on a “qualified exchange or other market” or the IRS consented to the revocation of the election. For any year for which CSR is not a PFIC, the mark-to-market election is inoperative. US holders make the mark-to-market election on IRS Form 8621, which must be filed along with their tax return for the taxable year for which the election is to take effect on or before the due date for such return (including extensions). US holders who decide to make the mark-to-market election are advised to make the election for the first taxable year for which CSR is a PFIC. US holders must report income and loss with respect to the election for each year for which CSR is a PFIC on IRS Form 8621.
QEF Election
The PFIC taxation rules outlined above also would not apply to US holders that elect to treat CSR as a “qualified electing fund” or “QEF.” US holders that are eligible for and timely make a QEF election, would include in income each year for which CSR is a PFIC (and would be subject to current US federal income tax on) their pro rata share of CSR’s ordinary earnings, as ordinary income, and net capital gains, as long-term capital gain, for the taxable year that ends with or within their taxable year, regardless of whether such amounts are actually distributed. Any such ordinary income would not be eligible for the favorable rates applicable to qualified dividend income. Corporate US holders would not be eligible for a dividends received deduction in respect of such income or gain. US holders’ adjusted tax basis in ordinary shares would be increased to reflect taxed but undistributed earnings and profits. Distributions of earnings and profits that had been previously taxed would result in a corresponding reduction in US holders’ adjusted tax basis in ordinary shares and would not be taxed again. US holders would not, however, be entitled to a deduction for their pro rata share of any losses that CSR incurred with respect to any year.
US holders may only make a QEF election if CSR provides them with the information needed to determine CSR’s ordinary earnings and net capital gains. If it is a PFIC, CSR will provide US holders with the information that is necessary in order to make a QEF election and to report their shares of ordinary
CSR plc Annual Report and Financial Statements 2009
167
DIRECTORS’ REPORTCORPORATE AND SHARE INFORMATION continued
earnings and net capital gains for each year for which CSR is a PFIC. CSR has had substantial taxable income in prior years, and may have taxable income in 2010 or any future year in which it is a PFIC. As CSR historically has not made cash distributions with respect to its stock, US holders may be taxed on significant “phantom” income if they make a QEF election. A US holder may make a separate election to defer the payment of taxes on undistributed income inclusions under the QEF rules, but any taxes deferred would be subject to an interest change. For any year for which CSR is not a PFIC, the QEF election would be inoperative. If US holders make a QEF election, they would generally recognize capital gain or loss on the sale, exchange or other disposition of ordinary shares. The QEF election is made by each US holder, and can only be revoked with the consent of the IRS. US holders make the QEF election on IRS Form 8621, which must be filed along with their tax return for the first taxable year to which the election will apply on or before the due date for such return (including extensions). US holders who decide to make the QEF election are advised to make the election for the first taxable year for which CSR is a PFIC. A US holder also must file Form 8621 with the IRS for each subsequent year that the election is in effect.
US holders cannot make both a mark-to-market election and a QEF election.
US holders are urged to consult their own tax advisors concerning the potential application of the PFIC rules to their ownership and disposition of ordinary shares, including the availability and advisability of making a mark-to-market or QEF election.
Taxation of Dividends
Subject to the PFIC rules described above, for US federal income tax purposes, a US holder will generally include in gross income the amount of any dividend paid by CSR to the extent paid out of CSR’s current and/or accumulated earnings and profits, as determined for US federal income tax purposes, as ordinary income when the dividend is actually received by the US holder. Individual US holders currently are taxed at a maximum rate of 15% on dividends received from “qualified foreign corporations,” provided the US holders satisfy certain holding period and other requirements. In order to be treated as a “qualified foreign corporation,” CSR must be eligible
for benefits of the United States income tax treaty with the United Kingdom. Although CSR believes that it is currently eligible for such treaty benefits, there can be no assurance that this will be the case for any taxable year. Further, individual US holders will not be eligible for the reduced rates of dividend taxation if CSR is a PFIC for the taxable year of the dividend payment or the preceding taxable year. Corporate US holders will be taxed on dividends received from CSR at a 35% tax rate. Dividends generally will be income from sources outside of the United States for foreign tax credit limitation purposes, and generally will not be eligible for the dividends-received deduction that is allowed to US corporations in respect of dividends received from other US corporations. Distributions in excess of CSR’s current and/or accumulated earnings and profits, as determined for US federal income tax purposes, will be treated as a non-taxable return of capital to the extent of the US holder’s tax basis in the ordinary shares and thereafter as capital gain.
The amount of the dividend includible in the income of a US holder will be the US dollar value of the dividend determined at the spot rate on the date that dividend is includible in the income of the US holder, regardless of whether the payment is in fact converted into US dollars at such time. A US holder will have a basis in any GBP distributed by CSR equal to the US dollar value of the GBP on the date it is actually or constructively received by the US holder. Generally, any gain or loss resulting from currency exchange fluctuations during the period from the date the dividend payment is includible in income to the date that payment is converted into US dollars will be treated as ordinary income or loss.
Taxation of Capital Gains
Subject to the PFIC rules described above, upon a sale or other disposition of ordinary shares, a US holder will generally recognize gain or loss for US federal income tax purposes in an amount equal to the difference between the US dollar value of the amount realized and the US holder’s tax basis, determined in US dollars, in the ordinary shares. Gain or loss recognized will be long-term capital gain or loss with respect to ordinary shares held for more than 12 months at the time of the sale or other disposition and any gain recognized generally will be income from sources within the United States for foreign tax credit limitation purposes. The deductibility of capital losses is subject to significant limitations.
CSR plc Annual Report and Financial Statements 2009
168
Backup Withholding and Information Reporting
In general, dividend payments with respect to ordinary shares and proceeds from the sale or other disposition of ordinary shares made (or deemed made) within the United States may be subject to information reporting to the IRS and US backup withholding (currently at a rate of 28%). Backup withholding will generally not apply to a holder who:
| | · | | furnishes a correct taxpayer identification number and certifies, under penalties of perjury, that such holder is not subject to backup withholding on a Form W-9, and otherwise complies with applicable requirements of the backup withholding rules; |
| | · | | is a corporation or otherwise exempt from backup withholding and, when required, demonstrates this fact; or |
| | · | | provides a certification of foreign status on Form W-8BEN or a successor form. |
Backup withholding is not an additional tax. Amounts withheld under the backup withholding rules will be allowed as a refund or credit against a holder’s US federal income tax liability, provided the holder furnished the required information to the IRS.
UK tax matters
The following paragraphs summarise the material UK tax consequences for investors who are not resident in the UK for UK tax purposes (including US investors who are not resident in the UK for UK tax purposes) regarding ownership and disposal of CSR ordinary shares.
The following paragraphs, which are intended as a general guide only, are based on current UK tax legislation and what is understood to be HM Revenue & Customs (the UK tax authority) practice (which are both subject to change at any time). They summarise certain limited aspects of the UK tax treatment of holders of CSR ordinary shares and apply only to the position of holders of CSR ordinary shares who for UK tax purposes are beneficial owners of their CSR ordinary shares, hold their CSR ordinary shares as an investment (and not as assets to be realised in the course of a trade) and are not treated as having acquired their CSR ordinary shares by reason of their
or another’s employment. The following paragraphs do not apply to individuals or companies that hold, directly or indirectly, 10% or more of the voting power in CSR. Holders of CSR ordinary shares who are in any doubt as to their taxation position should consult an appropriate professional advisor immediately.
Taxation of Dividends
Under current UK taxation legislation, no tax will be withheld by CSR from cash dividend payments. Holders of CSR ordinary shares who are resident outside of the UK will generally not receive any payment from HM Revenue & Customs in respect of any tax credit on dividends paid by CSR.
Holders of CSR ordinary shares who are not resident or, in the case of individuals, ordinarily resident, in the UK and who do not carry on a trade, profession, or vocation in the UK through a branch, agency or permanent establishment in connection with which their CSR ordinary shares are held, used or acquired will not generally be liable to pay any UK tax in respect of any dividends received on their CSR ordinary shares. Holders of CSR ordinary shares who are resident or, in the case of individuals, ordinarily resident, in the UK or who carry on a trade, profession or vocation in the UK through a branch, agency or permanent establishment in connection with which their CSR ordinary shares are held, used or acquired are encouraged to consult appropriate professional advisors.
Under its current dividend policy, CSR does not intend to pay a dividend for the foreseeable future. Any future payment of dividends will be at the discretion of CSR’s board of directors.
Taxation of Capital Gains
A holder of CSR ordinary shares will not ordinarily be liable for UK tax on capital gains realised on the disposal of CSR ordinary shares, unless, at the time of the disposal, he or she carries on a trade, profession or vocation in the UK through a branch or agency (in the case of an individual shareholder) or a permanent establishment (in the case of a corporate shareholder) and those CSR ordinary shares are, or have been, used, held or acquired for the purposes of that trade, profession or vocation or branch or agency or permanent establishment (as the case may be).
CSR plc Annual Report and Financial Statements 2009
169
DIRECTORS’ REPORTCORPORATE AND SHARE INFORMATION continued
A holder of CSR ordinary shares who is an individual and who has ceased to be resident or ordinarily resident in the UK for UK tax purposes for a period of less than five years of assessment and who disposes of all or part of his CSR ordinary shares during that period of temporary non-residence may be liable on his return to the UK to taxation on chargeable gains arising during the period of absence, subject to any available exemption or relief.
Stamp Duty and Stamp Duty Reserve Tax
No UK stamp duty or UK stamp duty reserve tax (“UK SDRT”) will generally be payable on the issue of CSR ordinary shares.
Subject to the paragraph below, where CSR ordinary shares are issued or transferred (i) to, or to a nominee or agent for, a person whose business is or includes the provision of clearance services, or a Clearance Service, or (ii) to, or to a nominee or agent for, a person whose business is or includes issuing depositary receipts, or a Depositary Receipt System, UK stamp duty or UK SDRT will generally be payable at the rate of 1.5% of the consideration paid (rounded up to the nearest multiple of £5 in the case of UK stamp duty). The UK stamp duty or UK SDRT will generally be paid by the Clearance Service or the Depositary Receipt System, as the case may be, but will, in practice, generally be reimbursed by the relevant participant in the Clearance Service or the Depositary Receipt System. A Clearance Service can elect under section 97A of the Finance Act 1986, or Section 97A, provided certain conditions are satisfied, for the normal rate of UK stamp duty or UK SDRT (generally no charge on issue and a charge at 0.5% of the amount or value of the consideration paid, rounded up to the nearest £5 in the case of UK stamp duty, on transfer) to apply to issues or transfers of CSR ordinary shares into, and transactions within, such Clearance Service instead of the higher rate of 1.5% generally applying to an issue or transfer of CSR ordinary shares into the Clearance Service and the ability to transfer CSR ordinary shares while in the Clearance Service without there being UK stamp duty or UK SDRT.
Following a recent decision of the European Court of Justice, HM Revenue & Customs have announced that they will not seek to apply the 1.5% UK SDRT charge where new shares are first issued into an
EU Clearance Service or an EU Depositary Receipt System. In light of that announcement, if would seem that, in the view of HM Revenue & Customs, the 1.5% UK SDRT charge will continue to apply to (i) the transfer of existing shares to Clearance Services or Depositary Receipt Systems, in each case whether or not in the EU and (ii) the issue of new shares to non-EU Clearance Services or non-EU Depositary Receipt Systems. However, a charge to UK SDRT at 1.5% on the issue of new shares to a non-EU Clearance Service or a non-EU Depositary Receipt System is arguably not consistent with the aforementioned decision of the European Court of Justice.
No UK stamp duty or UK SDRT will generally be payable on the issue of CSR ordinary shares into CREST (the London Stock Exchange’s paperless trading system), but, subject to the paragraph above, UK SDRT will be payable to the extent that the CSR ordinary shares are issued to, or into the CREST account of, a Clearance Service or a nominee or agent for a Clearance Service which has not made an election in relation to the CSR ordinary shares under Section 97A or to, or into the CREST account of, a Depositary Receipt System or a nominee or agent for a Depositary Receipt System. The UK stamp duty or UK SDRT will generally be paid by the Clearance Service or the Depositary Receipt System, as the case may be, but will, in practice, generally be reimbursed by the relevant participant in the Clearance Service or the Depositary Receipt System.
Subject to an exemption for certain low value transactions, the transfer on sale of CSR ordinary shares in certificated form, or a right to such shares, will generally give rise to a liability, usually met by the purchaser, toad valoremUK stamp duty at the rate of 0.5% (rounded up to the nearest multiple of £5) of the amount or value of the consideration paid. An agreement to transfer such shares or a right to such shares which is or becomes unconditional will generally give rise to UK SDRT at the rate of 0.5% of the amount or value of the consideration paid, such UK SDRT generally being payable by the transferee or purchaser. The liability to UK SDRT will generally be cancelled or any UK SDRT paid will be refunded if the agreement is completed by a duly stamped transfer within six years of either the date of the agreement or, if the agreement was conditional, the date when the agreement became unconditional.
CSR plc Annual Report and Financial Statements 2009
170
A transfer of CSR ordinary shares on a paperless basis through CREST will generally be subject to UK SDRT at the rate of 0.5% of the amount or value of the consideration paid, which will be collected and accounted for to HM Revenue & Customs by CREST (such UK SDRT generally being borne by the transferee or purchaser). No UK stamp duty or UK SDRT will arise on a transfer of CSR ordinary shares into CREST provided that, in the case of UK SDRT, the transfer is not for money or money’s worth.
Generally, a gift of CSR ordinary shares or a transfer of such shares from a nominee to the beneficial owner will give rise to neither UK stamp duty nor UK SDRT.
The above statements are intended only as a general guide to the current UK stamp duty and UK SDRT position. Transfers to certain categories of person are not liable to UK stamp duty or UK SDRT and others may be liable at a higher rate.
Property
CSR’s corporate headquarters is located on the Cambridge Business Park, Cambridge, Cambridgeshire, England, where it occupies approximately 51,000 square feet under a lease expiring in September 2014. CSR also leases property in the following areas, which serve as its research and development, sales and customer support and administration offices:
| | | | | | |
| Location | | Sq. feet | | Lease
Expiration | | Purpose |
Churchill House, Cambridge, England | | 51,000 | | September 2014 | | R&D |
St John’s House, Cambridge, England | | 33,100 | | August 2016 | | Sales and administration |
Unit 400, Cambridge, England | | 24,100 | | September 2016 | | 17,151 sq ft sublet |
Phoenix, Arizona, 85044 USA(2) | | 26,300 | | July 2012 | | Engineering and product development |
Richardson, Texas 75080 USA | | 18,828 | | May 2016 | | Sales and administration |
San Jose, California, USA | | 48,000 | | November 30, 2010 | | Engineering and product development and sales |
Santa Ana, California, USA | | 12,643 | | December 2013 | | Engineering and product development |
Cedar Rapids, Iowa, USA | | 7,400 | | April 2013 | | Engineering and product development |
Stockholm, Sweden | | 5,167 | | September 2011 | | R&D and administration |
Bangalore, India | | 26,516 | | May 2012 | | R&D and administration |
Noida, India(1) | | 9,200 | | March 2014 | | Engineering and product development |
Shanghai, China | | 12,121 | | April 2012 | | Sales and administration |
Chungli City, Taiwan | | 4,340 | | March 2011 | | Sales |
Sophia Antipolis, France | | 7,513 | | February 2011 | | R&D |
(1) We may terminate this lease upon six months notice.
CSR plc Annual Report and Financial Statements 2009
171
| | | | | | |
| Location | | Address | | Telephone | | Fax |
China – Beijing | | Room #1829, 18F, China Merchants Tower, No. 118, Jian Guo Road, Chao Yang District, Beijing, China | | +86 10 587 956 70 | | +86 10 587 956 18 |
China – Shanghai | | 34 floor, No 28 Xin Jinqiao Road, Pudong, Shanghai, 201206 China | | +86 21 2898 1600 | | +86 21 3382 1173 |
China – Shenzhen | | Rm 1202 Tower II Kerry Plaza No 1 Zhongxin 4 Road, Futian, Shenzhen, Guangdong 514048 China | | +86 755 2151 6000 | | +86 755 2151 6019 |
Denmark – Aalborg | | Novi Science Park, Niels Jernes Vej 10, 9220 Aalborg East, Denmark | | +45 99 324 100 | | +45 99 324 101 |
France – Sophia Antipolis | | Les 2 Arcs, Bat. B, etage 4, 1800 Route des Cretes, Sophia Antipolis, 06560 Valbonne France | | +33 489 737000 | | +33 489 737001 |
India – Bangalore | | 11th Floor, Tower C, IBC Knowledge Park, #4/1 Bannerghatta Main Road, Bangalore, 560 029 India | | +91 80 2518 3000 | | +91 80 2518 3001 |
India – Noida | | A 1-A, Sector 16, Noida, 201301 India | | +91 120 469 6000 | | +91 120 251 0584 |
Japan – Tokyo | | Kojimachi KS Square 9F, 5-3-3 Kojimachi, Chiyoda-ku,Tokyo, 102-0083 Japan | | +81 3 5276 2911 | | +81 3 5276 2915 |
Korea – Gumi | | 3rd Floor, Shinwon Building, 275-26 Hwangsang-Dong, Gumi-Si, Gyungsangbuk-Do 730928, S Korea | | +82 54 476 8677 | | +82 54 476 8680 |
Korea – Seoul | | 15th Floor West Wing POSCO Centre, 892 Daichi-Dong, Gangnam-Gu Seoul, 135-777 S Korea | | +82 2 6444 2000 | | +82 2 6444 2001 |
Sweden – Stockholm | | Stadsgarden 10 116 45 Stockholm, Sweden | | +46 8 39 00 00 | | +46 8 412 47 40 |
Taiwan – Chungli | | 11th Floor, No 142 and No 146, Jhongshan Road, Chungli City, Taoyuan County 32041, Taiwan | | +886 3 4267000 | | +886 3 4267001 |
Taiwan – Taipei | | 6 Floor No 407 Ruey Kuang Road, Neihu, Taipei 11492, Taiwan | | +886 2 2650 2000 | | +886 2 2650 2099 |
UK – Cambridge | | Churchill House, Cambridge Business Park, Cowley Rd Cambridge, England. CB4 OWZ | | +44 1223 692000 | | +44 1223 692001 |
UK – Cambridge | | St John’s House, St. John’s Innovation Park, Cambridge, England. CB4 0ZT | | +44 1223 692000 | | +44 1223 692001 |
USA – Cedar Rapids | | 5021 Duffy Drive NE Cedar Rapids, Iowa, 52402 USA | | +1 319 294 5687 | | +1 319 294 5841 |
USA – Detroit | | 1740 Opdyke Court Auburn Hills Detroit, Michigan, 48326 USA | | +1 248 409 1400 | | +1 248 409 1401 |
USA – Phoenix | | 4940 East Beverly Road Phoenix, Arizona, 85044 USA | | +1 602 343 2600 | | +1 602 343 2611 |
USA – Richardson | | 2425 North Central Expressway, Suite 1000, Richardson, Texas 75080 USA | | +1 408 467 0410 | | +1(972) 231 1440 |
USA – San Jose | | 217 Devcon Drive San Jose, California, 95112 USA | | +1 408 467 0410 | | +1 408 467 0420 |
USA – Santa Ana | | 1231 East Dyer Road Suite 200 Santa Ana, California, 92705 USA | | +1 714 435 4900 | | +1 714 435 4993 |
Singapore | | 101 Thomson Road #08-06, United Square, Singapore 307591 | | +65 682 70666 | | no fax |
CSR plc Annual Report and Financial Statements 2009
GLOSSARY
AGPS:assisted GPS: an augmentation to GPS where the mobile phone network can provide the almanac and ephemeris data. By using the mobile phone network, the GPS receiver does not need to decode data from the satellites, thus both speeding up acquisition of a fix and allowing fixes to be made in areas where GPS signals are too weak to allow decoding of data but are nonetheless strong enough to be used to measure time of arrival (see also “GPS”)
Android: Android is a software platform for mobile devices based on a Linux kernel, initially developed by Google and later the Open Handset Alliance
attach rate:represents the rate of adoption of additional products or technologies on to the primary or “hosting” product
baseband:describing that part of a radio telecommunication system in which information is processed before modulating on to, or after demodulating off, a radio frequency (RF) carrier wave
BiCMOS or Bi-polar CMOS:is a process which combines bipolar junction transistors on CMOS technology. The combination utilises the high speed, high gain and low output characteristics of the bipolar technology with the high density logic gates of the CMOS technology. It has advantages for RF performance, reduced power consumption and low noise circuits
bipolar:bipolar refers to the enhancement of the conduction of current within a transistor that enables the control of a larger electrical current thereby providing an amplified signal
bill of materials:a list of the individual parts (or material) which comprise a finished product and the cost of each of those individual parts
BlueCore:means the CSR family of single chip CMOS based (see below) Bluetooth solutions which integrate onto one chip the Radio Frequency (RF), baseband and communications protocol stack
Bluetooth:is an open wireless protocol for exchanging data over short distances from fixed and mobile devices
Bluetooth low energy or BTLE:is designed to work side-by-side with and complement Bluetooth. It operates in 2.4 GHz ISM band. Devices using ultra low power Bluetooth will be smaller and more energy-efficient than their Bluetooth counterparts
cellular:derives from “cellphone” and means a mobile phone or other device which communicates through a network of radio “cells”
CMOS:Complementary Metal Oxide Semiconductor technology: a semiconductor process technology that uses planar transistors to make chips that consume relatively low power and permit a high level of integration
chip:short for a microchip; semiconductor device or integrated circuit
co-exist/co-existence:means the ability of two systems to operate in parallel without interfering with the other
connectivity:enabling two electronic devices to communicate with each other and transfer data (voice/audio/music/picture/word files) using radio waves
Connectivity Centre:a term first promulgated by CSR in its application to wireless connectivity solutions; the Connectivity Centre brings together many aspects of short range wireless connectivity products with excellent co-existence capable of operating concurrently without degradation in optimum performance of each of the individual functions
CSP:Chip-Scale Package: a semiconductor package which is as small as the semiconductor chip and is used for small form factor applications such as mobile phones, PDAs and wireless devices
design win:CSR records a design win when a product using one of its IC’s becomes Bluetooth qualified
die:another word for chip: often used to refer to the “chips” whilst they are still an integral part of the silicon “wafer” or where they have been cut from the “wafer” but are, as yet, unpackaged
digital:the representation of data by a series of bits or discrete values such as 0s and 1s
EGPS:enhanced GPS: as the name suggests an enhancement to GPS whereby measurements are made by the GPS receiver on the signals received from the mobile phone network which allow both fine time and frequency assistance to the GPS receiver. This further accelerates acquisition of a fix, as well as allowing, when GPS signals are unavailable, fall-back to a fix made solely from the measurements made on the cellular network (see also “GPS”)
ERP System: Enterprise Resource Planning System is a company wide computer software system used to manage and co-ordinate internal and external resources. The system facilitates the flow and management of information to improve data sharing and decision making using a computer network
FM or FM Radio: is a radio wave broadcast technology that conveys sound – voice and music – using a carrier wave which varies its frequency during transmission, producing high quality audio clarity and tone
fabless:short for fabricationless, a business model used in the semiconductor industry, where the
CSR plc Annual Report and Financial Statements 2009
173
manufacture (or fabrication) of IC’s is subcontracted to a foundry
fabless semiconductor company:company that uses a third party semiconductor fabrication service to manufacture silicon chips as opposed to fabrication facilities owned directly
feature phone:a mobile phone which has added functionality over and above a base model designed specifically to meet the requirements of a particular market segment. Typically these “features” can include a digital camera, Bluetooth connectivity, FM radio or MP3 player. These phones are intended to occupy the mid-market segment
firmware:software which interfaces with and typically configures and manages the hardware in a system
flash memory:electronic memory where the contents (usually an applications programme) may be programmed prior to use and which retains its contents irrespective of applied power
foundry:a semiconductor manufacturing site that makes integrated circuits
GPS:Global Positioning Systems: a satellite based radio navigation system that allows receiving devices to take an accurate location fix of the device on the surface of the earth. Positions are derived by measuring the time of arrival of signals broadcast from the constellation of satellites, and knowledge of the instantaneous positions of the satellites. (The information required to calculate this being broadcast at a very low data rate by the satellites themselves, and is known as almanac and ephemeris data)
host software:software running on the system in which the device is embedded
IC or integrated circuit:a semiconductor device consisting of many thousands or millions of interconnected transistors and other components
ISM Bands:ISM Bands or Industrial, Scientific and Medical are radio frequencies reserved around the world for unlicensed use originally intended for industrial, scientific and medical products rather than general communication. Their international unlicensed status makes them suitable for lower power communication systems like Bluetooth, WirelessLAN etc and means they are being widely adopted in these areas
ISO:International Standards Organisation: the international organisation responsible for developing and maintaining worldwide standards for manufacturing, environmental management systems, computers, data communications, and many other fields
ISO 9000:a series of international standards for quality assurance in business practices, ratified by the ISO beginning in 1987. Certification of ISO 9000 compliance is important for selling many types of goods and services including data-communications equipment and services
location-based service (LBS):is an information and entertainment service, accessible with mobile devices through the mobile network and utilising the ability to make use of the geographical position of the mobile device. LBS services include services to identify a location of a person or object, such as discovering the nearest banking cash machine or the whereabouts of a friend or employee
memory:any device that can store data in machine-readable format which may include RAM, ROM and Flash
microcontroller:often defined as being a microprocessor together with its memory and a means of allowing input and output
Module or Multi-chip Module: is a self contained component that comprises a number of integrated circuits (ICs) and discrete components on a substrate to allow the module to be used as if it were a single component.
MP3:a file format which compresses or “shrinks” voice and music files for transfer between one electronic device to another whilst retaining CD quality audio
non-cellular:as used by CSR means an electronic device which uses Bluetooth but is not a cellular device
NFC or Near Field Communication:is a short-range high frequency wireless communication technology which enables the exchange of data between devices over a distance of about four centimetres. Its application includes secure payment transactions using the customers mobile phone or transfer of files for example photo images from a digital camera to a PC
ODM:or Original Design Manufacturer: a manufacturer that designs and manufactures equipment for another company who will, in turn sell this to the end-user
OEM:or Original Equipment Manufacturer: a manufacturer that sells equipment to retail and wholesale outlets
PC:personal computer
PDA:personal digital assistant: a pocket-sized personal computer
Personal Navigation Device or PND:is a portable electronic product which combines a positioning capability (such as GPS) and navigation functions and enables the user to find out where they
CSR plc Annual Report and Financial Statements 2009
are located and get directions to move from one place to another
package:the package of a semiconductor is the physical and electrical interface between the chip and the system in which it operates
playback:the characteristic of a device to be able to play selected music or video tracks which are stored on that device
product qualification:the approval of a product or process for use by an ODM or OEM
protocol:a method by which two dissimilar systems can communicate
RF:radio frequency: frequencies of electromagnetic waves between approximately 3 kHz and 300 GHz
ROM:read only memory
semiconductor:a material, typically crystalline, that can be altered to allow electrical current to flow or not flow in a pattern; common semiconductors are silicon, germanium and gallium-arsenide and the term is also used to apply to IC’s made from these materials
silicon:a semiconducting material used to make wafers, widely used in the semiconductor industry as the basic material for integrated circuits
short range:Bluetooth is principally used for communicating over ranges of up to ten metres
Smartphone: a generic name for a voice centric mobile phone that also offers advanced capabilities often using a computer like operating system to enable PC functionality
stereo headset:a mobile headset which connects to a mobile phone, PDA, MP3 player or other device using Bluetooth and sits on both ears of the user
SoC:System on chip is a technology that takes all the necessary electronic circuits and parts for a complete system and integrates them into a single circuit (Silicon chip)
software stack: is a layered set of software subsystems or components that are combined and integrated to provide a fully functional product or service with structured communication through the stack
software solution:a solution where instructions and data are read from memory (or memories) and then the instructions interpreted and executed by a microprocessor to modify the data in the intended way
Tier One:a description of a leading, normally global manufacturer that supplies products in high volume to end user markets
UWB:Ultra WideBand
urban canyon:is a built up urban environment similar to a natural canyon
which interrupts radio signals. It is caused by streets cutting through dense blocks of structures, especially skyscrapers or other tall buildings
VAM:value added manufacturers or sometimes, value added manufacturing where the value of gross output is greater than the value of intermediate inputs used in production
Wi-Fi:Wi-Fi short for “wireless fidelity” (also known as IEEE 802.1 1a/b/g) is an 1155 Mbs raw radio bit rate data centric wireless communication standard typically associated with wireless computer networks at home and in the office and public spaces
wafer:a disc made of a semiconducting material such as silicon, usually between 150mm (6’) and 300mm (12’) in diameter, in which integrated circuits are manufactured; a wafer may contain several thousand individual integrated circuits
WLCSP:Wafer Level Chip Scale Packaging: the technology of packaging a chip at the wafer level instead of the traditional process of assembling the package after the wafer has been diced into individual chips (see CSP)
yield:when used in connection with manufacturing, the ratio of the number of usable products to the total number of products on a wafer
CSR plc Annual Report and Financial Statements 2009
175
FORM 20-F CROSS REFERENCE GUIDE
The table below sets out the location in this document of the information required by Form 20-F under the rules and regulations of the United States Securities and Exchange Commission. This Annual Report on Form 20-F for the fiscal year ended 1 January 2010 has not been approved or disapproved by the SEC nor has the SEC passed judgment upon the adequacy or accuracy of this Annual Report on Form 20-F.
| | | | | | |
| Item | | Form 20-F caption | | Location in this document | | Page |
| 1 | | Identity of directors, senior management and advisers | | Not applicable | | – |
| 2 | | Offer statistics and expected timetable | | Not applicable | | – |
| 3 | | Key information | | | | |
| 3A | | Selected financial data | | Five year summary | | 156 |
| 3B | | Capitalisation and indebtedness | | Not applicable | | – |
| 3C | | Reasons for the offer and use of proceeds | | Not applicable | | – |
| 3D | | Risk factors | | Risk Factors | | 45 |
| 4 | | Information on the Company | | | | |
| 4A | | History and development of the company | | Business and Financial Review Business and Financial Review – Capital Expenditure Notes to the Consolidated Financial Statements – Note 15: Property, Plant and Equipment Notes to the Consolidated Financial Statements – Note 35: Acquisition of subsidiary Corporate and Share Information – History and Development Corporate and Share Information – Agent in the United States | | 8
27 121 144 157 160 |
| 4B | | Business overview | | Business and Financial Review – Introduction Business and Financial Review – Market Overview Corporate and Share Information – Seasonality Corporate and Share Information – Raw Materials Corporate and Share Information – Intellectual Property Corporate and Share Information – Governmental Regulation | | 8
13 158 158 158 158 |
| 4C | | Organisational structure | | Notes to the Consolidated Financial Statements – Note 42: Subsidiaries | | 151 |
| 4D | | Property, plant and equipment | | Business and Financial Review – Financial Position Business and Financial Review – Social Responsibility Notes to the Consolidated Financial Statements – Note 15: Property, Plant and Equipment Corporate and Share Information – Property | | 24
34 121 171 |
| 4A | | Unresolved staff comments | | Not applicable | | – |
| 5 | | Operating and financial review and prospects | | | | |
| 5A | | Operating results | | Business and Financial Review | | 8 |
| 5B | | Liquidity and capital resources | | Business and Financial Review – Liquidity and Capital Resources Notes to the Consolidated Financial Statements – Note 26: Notes to the Cash Flow Statement Notes to the Consolidated Financial Statements – Note 33: Financial Instruments | | 26
132 139 |
CSR plc Annual Report and Financial Statements 2009
| | | | | | |
| Item | | Form 20-F caption | | Location in this document | | Page |
| 5C | | Research and development, patents. Technology and resources and licences, etc | | Business and Financial Review – Research and development Notes to the Consolidated Financial Statements – Note 14: Other Intangible Assets Corporate and Share Information – Intellectual Property | | 20
120 158 |
| 5D | | Trend information | | Business and Financial Review | | 8 |
| 5E | | Off-balance sheet arrangements | | Business and Financial Review – Off-Balance Sheet Arrangements Notes to the Consolidated Financial Statements – Note 20: Obligations Under Finance Leases | | 29
126 |
| 5F | | Tabular disclosure of contractual obligations | | Business and Financial Review – Contractual Obligations and Commitments | | 29 |
| 5G | | Safe Harbour | | Not applicable | | – |
| 6 | | Directors, senior management and employees | | | | |
| 6A | | Directors and senior management | | Board of Directors | | 58 |
| 6B | | Compensation | | Remuneration Report1 Notes to the Consolidated Financial Statements – Note 34: Related Party Transactions | | 73
143 |
| 6C | | Board practices | | Board of Directors Corporate Governance Remuneration Report1 | | 58
61 73 |
| 6D | | Employees | | Business and Financial Review – Employees Notes to the Consolidated Financial Statements – Note 9: Staff Costs | | 37
115 |
| 6E | | Share ownership | | Remuneration Report1 Other Statutory Information – Directors’ interests in shares Notes to the Consolidated Financial Statements – Note 31: Share-Based Payments | | 73
88 135 |
| 7 | | Major shareholders and related party transactions | | | | |
| 7A | | Major shareholders | | Other Statutory Information – Substantial Shareholdings Corporate and Share Information – Major Shareholders | | 90
160 |
| 7B | | Related party transactions | | Notes to the Consolidated Financial Statements – Note 34: Related Party Transactions Notes to the Company Financial Statements –
Note 49: Related Party Transactions | | 143
155 |
| 7C | | Interests of experts and counsel | | Not applicable | | – |
| 8 | | Financial information | | | | |
| 8A | | Consolidated statements and other financial | | Business and Financial Review – Dividend Policy Report of the Independent Registered Public Accounting Firm2 Consolidated Financial Statements Notes to the Consolidated Financial Statements – Note 27: Contingent Liabilities | | 28
– 93 133 |
| 8B | | Significant changes | | Business and Financial Review – Significant Changes | | 29 |
| 9 | | The offer and listing | | | | |
| 9A | | Offer and listing details | | Corporate and Share Information – Market Prices | | 159 |
| 9B | | Plan of distribution | | Not applicable | | – |
CSR plc Annual Report and Financial Statements 2009
177
FORM 20-F CROSS REFERENCE GUIDE continued
| | | | | | |
| Item | | Form 20-F caption | | Location in this document | | Page |
| 9C | | Markets | | Corporate and Share Information – History and Development | | 157 |
| 9D | | Selling shareholders | | Not applicable | | – |
| 9E | | Dilution | | Not applicable | | – |
| 9F | | Expenses of the issue | | Not applicable | | – |
| 10 | | Additional information | | | | |
| 10A | | Share capital | | Not applicable | | – |
| 10B | | Memorandum and articles of association | | Corporate and Share Information – Memorandum and Articles of Association | | 160 |
| 10C | | Material contracts | | Corporate and Share Information – Material Contracts | | 165 |
| 10D | | Exchange controls | | Corporate and Share Information – Exchange Controls | | 165 |
| 10E | | Taxation | | Corporate and Share Information – Taxation (US Holders) | | 165 |
| 10F | | Dividends and paying agents | | Not applicable | | – |
| 10G | | Statement by experts | | Not applicable | | – |
| 10H | | Documents on display | | Corporate and Share Information – Documents on Display | | 160 |
| 10I | | Subsidiary information | | Not applicable | | – |
| 11 | | Quantitative and qualitative disclosures about market risk | | Notes to the Consolidated Financial Statements – Note 33: Financial Instruments | | 139 |
| 12 | | Description of securities other than equity securities | | Not applicable | | – |
| 13 | | Defaults, dividend arrearages and delinquencies about market risk | | Not applicable | | – |
| 14 | | Material modifications to the rights of security holders and use of proceeds | | Not applicable | | – |
| 15 | | Controls and procedures | | Corporate Governance – Internal control | | 69 |
| 16A | | Audit committee financial expert | | Corporate Governance – Audit Committee | | 66 |
| 16B | | Code of ethics | | Corporate Governance – Executive Ethics Policy | | 62 |
| 16C | | Principal accountant fees and services | | Corporate Governance – Interaction with the External Auditors Notes to the Consolidated Financial Statements – Note 8: Auditors’ remuneration | | 69
115 |
| 16D | | Exemptions from the listing standards for audit committees | | Not applicable | | – |
| 16E | | Purchase of equity securities by the issuer and affiliated purchasers | | Not applicable | | – |
| 16F | | Change in registrant’s certifying accountant | | Not applicable | | – |
| 16G | | Corporate governance | | Not applicable | | – |
| 17 | | Financial statements | | Not applicable | | – |
| 18 | | Financial statements | | Report of Independent Registered Public Accounting Firm2 Consolidated Financial Statements3 | | -
93 |
| 19 | | Exhibits | | Filed with the SEC | | – |
1 An analysis of the remuneration, interests in ordinary shares and options over ordinary shares of each of the Directors is presented in the Remuneration Report. For the purposes of Form 20-F, the sections of the Remuneration Report that are marked as “audited” are not required to be audited in accordance with PCAOB standards and are not considered to be audited in the Form 20-F.
2 Filed with the SEC as Exhibit 15.1.
3 For the purposes of the Form 20-F, the Independent Auditors’ Report to the Members of CSR plc on pages 91 to 92 of this annual report is not considered to be filed with the SEC.
CSR plc Annual Report and Financial Statements 2009
CAUTIONARY NOTE REGARDING FORWARD LOOKING STATEMENTS
This Annual Report does not constitute an invitation to underwrite, subscribe for, or otherwise acquire or dispose of any CSR plc shares.
This Annual Report contains statements that are “forward looking statements” in relation to the future financial and operating performance and outlook of CSR. These forward looking statements are made in reliance on the safe harbour provisions of the United States Private Securities Litigation Reform Act of 1995. Forward looking statements can be identified by words such as “believes”, “estimates”, “anticipates”, “expects”, “intends”, “may”, “will”, “plans”, “should”, “may” and other similar expressions, and include statements relating to, among other things, expected growth in 2010 and beyond, expected revenues, expected future design wins and increase in market share, the expected incorporation of the our products in those of our customers, the expectation of volume shipments of our products, opportunities in our industry and our ability to take advantage of those opportunities, the effect of our financial performance on our share price, the impact of government regulation, expected performance against adverse economic conditions, and other expectations and beliefs of our management.
All forward looking statements are based upon numerous assumptions regarding CSR’s business strategies and the environment in which CSR will operate and therefore involve a number of known and unknown risks, contingencies, uncertainties and other factors, many of which are beyond the control of CSR. Actual results and developments could differ materially from those expressed or implied by these forward looking statements as a result of numerous risks and uncertainties. These risks and uncertainties include, but are not limited to:
| | · | | a continuing or worsening economic downturn, which could reduce demand for consumer products; |
| | · | | risks associated with securing sufficient capacity from the third-parties that manufacture, assemble and test CSR’s products and other risks relating to CSR’s fabless business model; |
| | · | | continuing or worsening declines in the average selling prices of CSR’s products; |
| | · | | risks associated with existing or future litigation; |
| | · | | costs associated with the development of new products in response to market demand; |
| | · | | errors or failures in the hardware or software components of CSR’s products; |
| | · | | risks associated with acquiring and protecting intellectual property; |
| | · | | risks relating to forecasting consumer demand for and market acceptance of CSR’s products and the products that use CSR’s products; |
| | · | | the cyclicality of the semiconductor industry; |
| | · | | the potential for disruption in the supply of wafers or assembly or testing services due to changes in business conditions, natural disasters, terrorist activities, public health concerns or other factors; |
| | · | | CSR’s ability to manage past and future acquisitions; |
| | · | | CSR’s ability to attract and retain key personnel, including engineers and technical personnel; |
| | · | | the difficulty in predicting future results; and |
| | · | | other risks and uncertainties discussed elsewhere in this Annual Report, including, without limitation, under the heading “Risk Factors” on pages 45 to 57. |
Each forward looking statement speaks only as of the date hereof. CSR does not undertake to release publicly any updates or revisions to any forward looking statements contained herein, otherwise than required by law.
Past performance is no guide to future performance and persons needing advice should consult an independent financial adviser. This Annual Report has been drawn up and presented in accordance with and reliance upon applicable English company law and the liabilities of the directors in connection with this report shall be subject to the limitations and restrictions provided by such law.
CSR plc Annual Report and Financial Statements 2009
179

Mixed Sources
Product group from well-managed
forests, controlled sources and
recycled wood or fiber
www.fsc.org Cert no. SGS-COC-2842
(c) 1996 Forest Stewardship Council
Revive 50:50 Silk contains 50% recycled waste and 50% FSC
certified and ECF (Elemental Chlorine Free) virgin pulp.
This document is 100% Recyclable.

www.csr.com
CSR plc
Churchill House
Cambridge Business Park
Cowley Road
Cambridge
CB4 0WZ
SIGNATURES
The registrant hereby certifies that it meets all of the requirements for filing on Form 20-F and that it has duly caused and authorized the undersigned to sign this annual report on its behalf.
| | |
CSR plc |
| (Registrant) |
| |
| By: | | |
|
/s/ JOEPVAN BEURDEN
|
Name: | | Joep van Beurden |
Title: | | Chief Executive Officer |
|
/s/ WILL GARDINER
|
Name: | | Will Gardiner |
Title: | | Chief Financial Officer |
Date: 12 March 2010
Index to the Exhibits
| | | | |
Exhibit
No
| | Description
| | |
| | |
| 1.1 | | Memorandum of Association of CSR plc (incorporated by reference to Exhibit 3.1(i) to the Registration Statement on Form F-4 (Registration No. 333-159615) of CSR plc filed with the SEC on May 29, 2009) | | |
| | |
| 1.2 | | Articles of Association of CSR plc (incorporated by reference to Exhibit 3.1(ii) to the Registration Statement on Form F-4 (Registration No. 333-159615) of CSR plc filed with the SEC on May 29, 2009) | | |
| | |
| 4.1 | | XAP Technology Licence and XAP2 Development Agreement by and between Cambridge Consultants Limited and Cambridge Silicon Radio Limited (incorporated by reference to Exhibit 10.5 to the Registration Statement on Form F-4 (Registration No. 333-159615) of CSR plc filed with the SEC on May 29, 2009) | | |
| | |
| 4.2 | | Know-How and IPR Agreement by and between Cambridge Consultants Limited and Cambridge Silicon Radio Limited (incorporated by reference to Exhibit 10.6 to the Registration Statement on Form F-4 (Registration No. 333-159615) of CSR plc filed with the SEC on May 29, 2009) | | |
| | |
| 4.3 | | Lease dated September 17, 2001, by and between CSR and Trinity College Cambridge (incorporated by reference to Exhibit 10.7 to the Registration Statement on Form F-4 (Registration No. 333-159615) of CSR plc filed with the SEC on May 29, 2009) | | |
| | |
| 4.4 | | Lease dated September 29, 2004, by and between CSR and The Crown Estates (incorporated by reference to Exhibit 10.8 to the Registration Statement on Form F-4 (Registration No. 333-159615) of CSR plc filed with the SEC on May 29, 2009) | | |
| | |
| 4.5 | | Agreement and Plan of Merger, dated as of February 9, 2009, by and among SiRF Technology Holdings, Inc., Shannon Acquisition Sub, Inc., and CSR plc (incorporated by reference to Appendix C to the proxy statement/prospectus included in the Registration Statement on Form F-4 (Registration No. 333-159615) of CSR plc filed with the SEC on May 29, 2009) | | |
| | |
| 8 | | List of subsidiaries of CSR plc (incorporated by reference to Note 42 to the Consolidated Financial Statements of CSR plc included in this Annual Report on Form 20-F) | | |
| | |
| 12.1 | | Certification of Chief Executive Officer pursuant to Rule 13a-14(a)/15d-14(a) | | E-1 |
| | |
| 12.2 | | Certification of Chief Financial Officer pursuant to Rule 13a-14(a)/15d-14(a) | | E-2 |
| | |
| 13.1 | | Certification of Chief Executive Officer and Chief Financial Officer pursuant to 18 U.S.C. 1350 | | E-3 |
| | |
| 15.1 | | Report of Independent Registered Public Accounting Firm | | E-4 |
| | |
| 15.2 | | Consent of Independent Registered Public Accounting Firm | | E-5 |