UNITED STATES
SECURITIES AND EXCHANGE COMMISSION
Washington, D.C. 20549
FORM N-CSR
CERTIFIED SHAREHOLDER REPORT OF REGISTERED
MANAGEMENT INVESTMENT COMPANIES
Investment Company Act file number: 811-21934
RiverNorth Funds
(Exact name of registrant as specified in charter)
360 South Rosemary Avenue, Suite 1420
West Palm Beach, FL 33401
(Address of principal executive offices) (Zip code)
Marcus L. Collins, Esq.
RiverNorth Capital Management, LLC
360 South Rosemary Avenue, Suite 1420
West Palm Beach, FL 33401
(Name and address of agent for service)
Registrant's telephone number, including area code: 561-484-7185
Date of fiscal year end: 09/30
Date of reporting period: 09/30/2024
| Item 1. | Reports to Stockholders. |
RIVERNORTH CORE OPPORTUNITY FUND
Annual Shareholder Report - September 30, 2024
This annual shareholder report contains important information about RiverNorth Core Opportunity Fund - Class I for the period of October 1, 2023 to September 30, 2024.
You can find additional information about the Fund at https://www.rivernorth.com/investments/rncix-rncox/. You can also request this information by contacting us at 888.848.7569.
WHAT WERE THE FUND'S COST FOR THE LAST YEAR?
(based on a hypothetical $10,000 investment)
| CLASS NAME | COST OF A $10,000 INVESTMENT | COST PAID AS A PERCENTAGE OF A $10,000 INVESTMENT |
|---|
| RiverNorth Core Opportunity Fund - Class I | $163 | 1.58% |
HOW DID THE FUND PERFORM LAST YEAR?
For the fiscal year ended September 30, 2024, the Fund’s exposure to closed-end funds (CEFs) was the primary driver of returns. Deconstructing the Fund’s CEF portfolio further, exposure to the underlying net asset values (NAV) contributed the most to performance over the period, with CEF discount narrowing also contributing significant positive returns.
The Fund also experienced positive absolute contribution from its exposure to exchange traded funds , investment company debt and business development companies. However, these asset classes contributed negatively to performance on a relative basis when compared against the Fund’s primary benchmark.
CEF investor sentiment continues to improve, bolstered to some extent by the Federal Reserve's September interest rate cut, which was the first since the pandemic. While CEF discounts have moved towards longer-term averages, we believe there are still opportunities for further discount narrowing from here. To that end, we believe the Fund is positioned well to take advantage of CEF trading opportunities as they present themselves. Additionally, our view is that owning CEFs trading at a discount is an excellent source of incremental yield and potential capital appreciation, relative to owning the underlying assets directly.
HOW DID THE FUND PERFORM THE LAST 10 YEARS?
TOTAL RETURN BASED ON $100,000 INVESTMENT
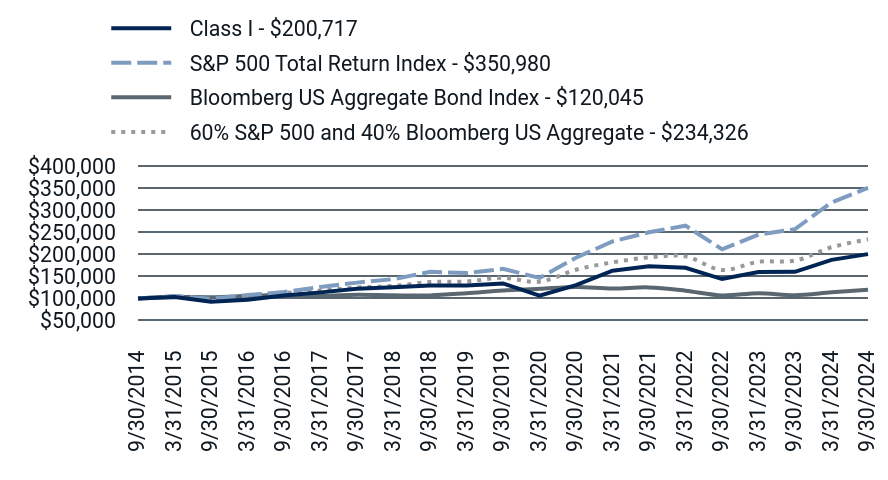
| Class I - $200,717 | S&P 500 Total Return Index - $350,980 | Bloomberg US Aggregate Bond Index - $120,045 | 60% S&P 500 and 40% Bloomberg US Aggregate - $234,326 |
|---|
| 9/30/2014 | $100,000 | $100,000 | $100,000 | $100,000 |
| 3/31/2015 | $103,232 | $105,930 | $103,430 | $105,022 |
| 9/30/2015 | $92,499 | $99,385 | $102,941 | $100,953 |
| 3/31/2016 | $97,175 | $107,818 | $105,457 | $107,220 |
| 9/30/2016 | $106,608 | $114,721 | $108,286 | $112,491 |
| 3/31/2017 | $113,928 | $126,333 | $105,922 | $118,220 |
| 9/30/2017 | $122,395 | $136,070 | $108,365 | $124,753 |
| 3/31/2018 | $125,363 | $144,010 | $107,196 | $128,634 |
| 9/30/2018 | $129,638 | $160,440 | $107,047 | $137,214 |
| 3/31/2019 | $129,266 | $157,686 | $111,999 | $138,648 |
| 9/30/2019 | $134,190 | $167,265 | $118,069 | $146,954 |
| 3/31/2020 | $106,509 | $146,682 | $122,005 | $138,106 |
| 9/30/2020 | $130,169 | $192,605 | $126,315 | $165,324 |
| 3/31/2021 | $162,959 | $229,340 | $122,872 | $181,898 |
| 9/30/2021 | $173,072 | $250,395 | $125,185 | $193,290 |
| 3/31/2022 | $169,797 | $265,223 | $117,770 | $195,541 |
| 9/30/2022 | $144,162 | $211,654 | $106,908 | $164,592 |
| 3/31/2023 | $160,011 | $244,725 | $112,136 | $183,312 |
| 9/30/2023 | $160,553 | $257,408 | $107,597 | $186,003 |
| 3/31/2024 | $187,755 | $317,852 | $114,041 | $216,251 |
| 9/30/2024 | $200,717 | $350,980 | $120,045 | $234,326 |
The chart above represents historical performance of a hypothetical investment of $100,000 in the Fund over the past ten years. Performance data quoted represents past performance and does not guarantee future results. Returns shown are total returns, which assume the reinvestment of dividends and capital gains. The table and graph presented above do not reflect the deduction of taxes a shareholder would pay on Fund distributions or the redemption of Fund shares.
LEVEL DISTRIBUTION INFORMATION
The Fund currently targets a level distribution set at 7.00% of NAV. For the fiscal year ending September 30, 2024, 0% of the total distributions paid was characterized as a return of capital.
AVERAGE ANNUAL TOTAL RETURNS
| RiverNorth Core Opportunity Fund | 1 Year | 5 Year | 10 Year |
|---|
| Class I | 25.02% | 8.39% | 7.22% |
| S&P 500 Total Return Index | 36.35% | 15.98% | 13.38% |
| Bloomberg US Aggregate Bond Index | 11.57% | 0.33% | 1.84% |
| 60% S&P 500 and 40% Bloomberg US Aggregate | 25.98% | 9.78% | 8.89% |
- Total Net Assets$45,657,824
- # of Portfolio Holdings44
- Portfolio Turnover Rate (Class I)41%
- Advisory Fees Paid$455,333
As of September 30, 2024. Past performance does not guarantee future results. Call 888.848.7569 for current month-end performance.
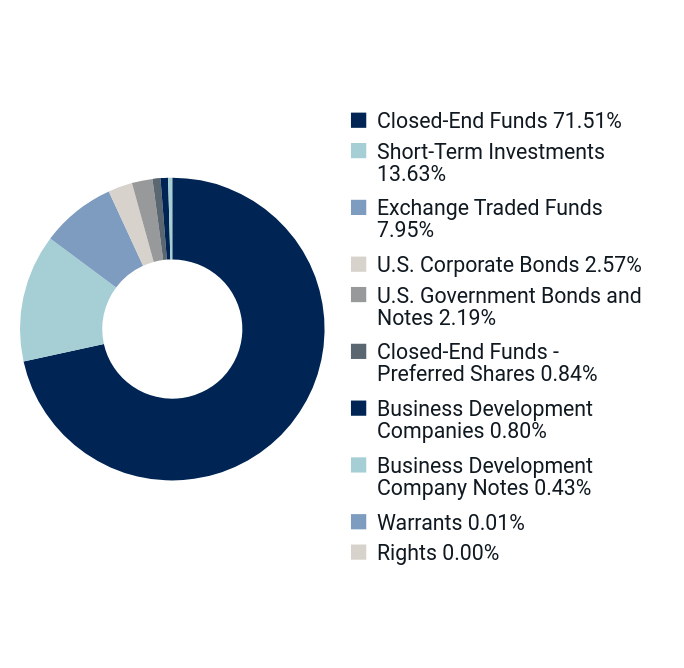
WHAT DID THE FUND INVEST IN?
INVESTMENT VEHICLE ALLOCATION
(percentages are based on total investments)
| Value | Value |
|---|
| Closed-End Funds | 71.51% |
| Short-Term Investments | 13.63% |
| Exchange Traded Funds | 7.95% |
| U.S. Corporate Bonds | 2.57% |
| U.S. Government Bonds and Notes | 2.19% |
| Closed-End Funds - Preferred Shares | 0.84% |
| Business Development Companies | 0.80% |
| Business Development Company Notes | 0.43% |
| Warrants | 0.01% |
| Rights | 0.00% |
(percentages are based on net assets)
| Value | Value |
|---|
| Fixed Income | 51.24% |
| Domestic Equity | 23.29% |
| Cash Equivalents | 16.70% |
| International Equity | 14.03% |
| Investment Co. Bonds | 3.01% |
| BDCs | 1.16% |
| SPACs | 0.51% |
| Alternatives | 0.44% |
There have been no material Fund changes during the reporting period.
Additional information about the Fund, including its prospectus, financial information, holdings, and proxy voting information, can be found by visiting https://www.rivernorth.com/investments/rncix-rncox/.
If you have consented to receive a single annual or semi-annual shareholder report at a shared address you may revoke this consent by calling the Transfer Agent 888.848.7569.
RIVERNORTH CORE OPPORTUNITY FUND
CLASS I : RNCIX
Distributor, ALPS Distributors, Inc.
Annual Shareholder Report - September 30, 2024
RIVERNORTH CORE OPPORTUNITY FUND
Annual Shareholder Report - September 30, 2024
This annual shareholder report contains important information about RiverNorth Core Opportunity Fund - Class R for the period of October 1, 2023 to September 30, 2024.
You can find additional information about the Fund at https://www.rivernorth.com/investments/rncix-rncox/. You can also request this information by contacting us at 888.848.7569.
WHAT WERE THE FUND'S COST FOR THE LAST YEAR?
(based on a hypothetical $10,000 investment)
| CLASS NAME | COST OF A $10,000 INVESTMENT | COST PAID AS A PERCENTAGE OF A $10,000 INVESTMENT |
|---|
| RiverNorth Core Opportunity Fund - Class R | $190 | 1.84% |
HOW DID THE FUND PERFORM LAST YEAR?
For the fiscal year ended September 30, 2024, the Fund’s exposure to closed-end funds (CEFs) was the primary driver of returns. Deconstructing the Fund’s CEF portfolio further, exposure to the underlying net asset values (NAV) contributed the most to performance over the period, with CEF discount narrowing also contributing significant positive returns.
The Fund also experienced positive absolute contribution from its exposure to exchange traded funds , investment company debt and business development companies. However, these asset classes contributed negatively to performance on a relative basis when compared against the Fund’s primary benchmark.
CEF investor sentiment continues to improve, bolstered to some extent by the Federal Reserve's September interest rate cut, which was the first since the pandemic. While CEF discounts have moved towards longer-term averages, we believe there are still opportunities for further discount narrowing from here. To that end, we believe the Fund is positioned well to take advantage of CEF trading opportunities as they present themselves. Additionally, our view is that owning CEFs trading at a discount is an excellent source of incremental yield and potential capital appreciation, relative to owning the underlying assets directly.
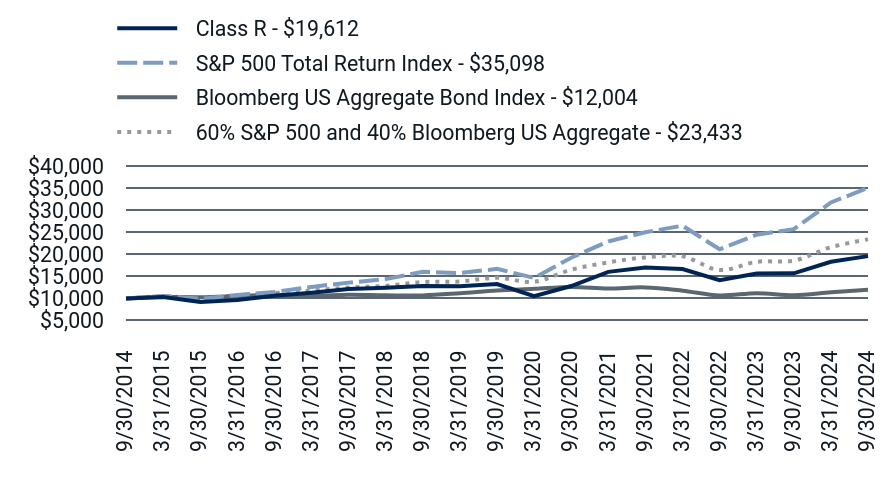
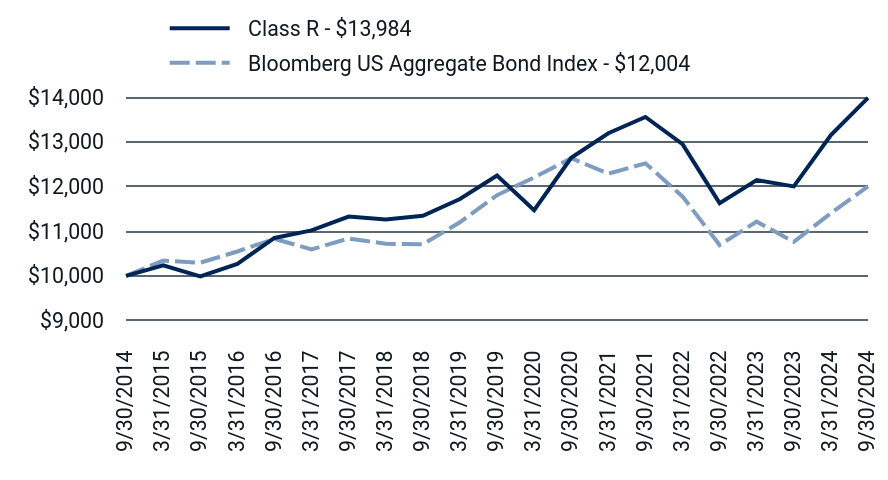
HOW DID THE FUND PERFORM THE LAST 10 YEARS?
TOTAL RETURN BASED ON $10,000 INVESTMENT
| Class R - $19,612 | S&P 500 Total Return Index - $35,098 | Bloomberg US Aggregate Bond Index - $12,004 | 60% S&P 500 and 40% Bloomberg US Aggregate - $23,433 |
|---|
| 9/30/2014 | $10,000 | $10,000 | $10,000 | $10,000 |
| 3/31/2015 | $10,316 | $10,593 | $10,343 | $10,502 |
| 9/30/2015 | $9,233 | $9,939 | $10,294 | $10,095 |
| 3/31/2016 | $9,688 | $10,782 | $10,546 | $10,722 |
| 9/30/2016 | $10,615 | $11,472 | $10,829 | $11,249 |
| 3/31/2017 | $11,329 | $12,633 | $10,592 | $11,822 |
| 9/30/2017 | $12,155 | $13,607 | $10,836 | $12,475 |
| 3/31/2018 | $12,443 | $14,401 | $10,720 | $12,863 |
| 9/30/2018 | $12,849 | $16,044 | $10,705 | $13,721 |
| 3/31/2019 | $12,794 | $15,769 | $11,200 | $13,865 |
| 9/30/2019 | $13,264 | $16,727 | $11,807 | $14,695 |
| 3/31/2020 | $10,518 | $14,668 | $12,201 | $13,811 |
| 9/30/2020 | $12,835 | $19,260 | $12,632 | $16,532 |
| 3/31/2021 | $16,043 | $22,934 | $12,287 | $18,190 |
| 9/30/2021 | $17,016 | $25,040 | $12,518 | $19,329 |
| 3/31/2022 | $16,677 | $26,522 | $11,777 | $19,554 |
| 9/30/2022 | $14,145 | $21,165 | $10,691 | $16,459 |
| 3/31/2023 | $15,678 | $24,472 | $11,214 | $18,331 |
| 9/30/2023 | $15,711 | $25,741 | $10,760 | $18,600 |
| 3/31/2024 | $18,346 | $31,785 | $11,404 | $21,625 |
| 9/30/2024 | $19,612 | $35,098 | $12,004 | $23,433 |
The chart above represents historical performance of a hypothetical investment of $10,000 in the Fund over the past ten years. Performance data quoted represents past performance and does not guarantee future results. Returns shown are total returns, which assume the reinvestment of dividends and capital gains. The table and graph presented above do not reflect the deduction of taxes a shareholder would pay on Fund distributions or the redemption of Fund shares.
LEVEL DISTRIBUTION INFORMATION
The Fund currently targets a level distribution set at 6.25% of NAV. For the fiscal year ending September 30, 2024, 0% of the total distributions paid was characterized as a return of capital.
AVERAGE ANNUAL TOTAL RETURNS
| RiverNorth Core Opportunity Fund | 1 Year | 5 Year | 10 Year |
|---|
| Class R | 24.83% | 8.14% | 6.97% |
| S&P 500 Total Return Index | 36.35% | 15.98% | 13.38% |
| Bloomberg US Aggregate Bond Index | 11.57% | 0.33% | 1.84% |
| 60% S&P 500 and 40% Bloomberg US Aggregate | 25.98% | 9.78% | 8.89% |
- Total Net Assets$45,657,824
- # of Portfolio Holdings44
- Portfolio Turnover Rate (Class R)41%
- Advisory Fees Paid$455,333
As of September 30, 2024. Past performance does not guarantee future results. Call 888.848.7569 for current month-end performance.
WHAT DID THE FUND INVEST IN?
INVESTMENT VEHICLE ALLOCATION
(percentages are based on total investments)
| Value | Value |
|---|
| Closed-End Funds | 71.51% |
| Short-Term Investments | 13.63% |
| Exchange Traded Funds | 7.95% |
| U.S. Corporate Bonds | 2.57% |
| U.S. Government Bonds and Notes | 2.19% |
| Closed-End Funds - Preferred Shares | 0.84% |
| Business Development Companies | 0.80% |
| Business Development Company Notes | 0.43% |
| Warrants | 0.01% |
| Rights | 0.00% |
(percentages are based on net assets)
| Value | Value |
|---|
| Fixed Income | 51.24% |
| Domestic Equity | 23.29% |
| Cash Equivalents | 16.70% |
| International Equity | 14.03% |
| Investment Co. Bonds | 3.01% |
| BDCs | 1.16% |
| SPACs | 0.51% |
| Alternatives | 0.44% |
There have been no material Fund changes during the reporting period.
Additional information about the Fund, including its prospectus, financial information, holdings, and proxy voting information, can be found by visiting https://www.rivernorth.com/investments/rncix-rncox/.
If you have consented to receive a single annual or semi-annual shareholder report at a shared address you may revoke this consent by calling the Transfer Agent 888.848.7569.
RIVERNORTH CORE OPPORTUNITY FUND
CLASS R : RNCOX
Distributor, ALPS Distributors, Inc.
Annual Shareholder Report - September 30, 2024
RIVERNORTH/DOUBLELINE STRATEGIC INCOME FUND
Annual Shareholder Report - September 30, 2024
This annual shareholder report contains important information about RiverNorth/DoubleLine Strategic Income Fund - Class I for the period of October 1, 2023 to September 30, 2024.
You can find additional information about the Fund at https://www.rivernorth.com/investments/rnsix-rndlx/. You can also request this information by contacting us at 888.848.7569.
WHAT WERE THE FUND'S COST FOR THE LAST YEAR?
(based on a hypothetical $10,000 investment)
| CLASS NAME | COST OF A $10,000 INVESTMENT | COST PAID AS A PERCENTAGE OF A $10,000 INVESTMENT |
|---|
| RiverNorth/DoubleLine Strategic Income Fund - Class I | $97 | 0.94% |
HOW DID THE FUND PERFORM LAST YEAR?
For the fiscal year ended September 30, 2024, the Fund’s exposure to the Tactical Closed-End Fund Income strategy, managed by RiverNorth Capital Management, LLC was the primary driver of returns. Looking within the strategy, exposure to closed-end fund ("CEF") net asset values combined with discount narrowing were the largest drivers of returns. The strategy’s exposure to investment company debt contributed positively to absolute returns, however it detracted on a relative basis as compared to the Fund’s primary benchmark.
The Core Fixed Income Strategy and the Opportunistic Income Strategy, both managed by DoubleLine Capital, LP, also contributed positively to returns relative to the Fund’s benchmark.
We believe each of these strategies has a compelling investment thesis. The Opportunistic Fixed Income strategy provides exposure to a diversified portfolio of traditional and bespoke credit assets overseen by what we believe to be is one of the top fixed income managers in the world. As CEF investor sentiment continues to improve, the Tactical Closed-End Fund Income strategy may be poised to benefit from further discount narrowing. The Core Fixed Income strategy provides exposure to a diversified portfolio of fixed income assets while also providing capital that can be rapidly deployed in the event of further capital market or interest rate volatility.
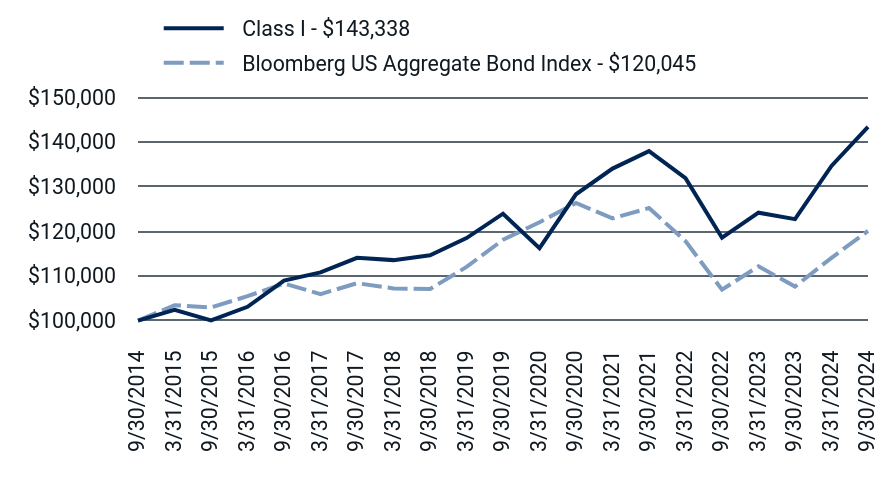
HOW DID THE FUND PERFORM THE LAST 10 YEARS?
TOTAL RETURN BASED ON $100,000 INVESTMENT
| Class I - $143,338 | Bloomberg US Aggregate Bond Index - $120,045 |
|---|
| 9/30/2014 | $100,000 | $100,000 |
| 3/31/2015 | $102,404 | $103,430 |
| 9/30/2015 | $100,036 | $102,941 |
| 3/31/2016 | $103,073 | $105,457 |
| 9/30/2016 | $108,941 | $108,286 |
| 3/31/2017 | $110,790 | $105,922 |
| 9/30/2017 | $114,031 | $108,365 |
| 3/31/2018 | $113,525 | $107,196 |
| 9/30/2018 | $114,627 | $107,047 |
| 3/31/2019 | $118,461 | $111,999 |
| 9/30/2019 | $123,911 | $118,069 |
| 3/31/2020 | $116,187 | $122,005 |
| 9/30/2020 | $128,262 | $126,315 |
| 3/31/2021 | $134,012 | $122,872 |
| 9/30/2021 | $137,901 | $125,185 |
| 3/31/2022 | $131,880 | $117,770 |
| 9/30/2022 | $118,544 | $106,908 |
| 3/31/2023 | $124,139 | $112,136 |
| 9/30/2023 | $122,694 | $107,597 |
| 3/31/2024 | $134,610 | $114,041 |
| 9/30/2024 | $143,338 | $120,045 |
The chart above represents historical performance of a hypothetical investment of $100,000 in the Fund over the past ten years. Performance data quoted represents past performance and does not guarantee future results. Returns shown are total returns, which assume the reinvestment of dividends and capital gains. The table and graph presented above do not reflect the deduction of taxes a shareholder would pay on Fund distributions or the redemption of Fund shares.
LEVEL DISTRIBUTION INFORMATION
The Fund currently targets a level distribution set at 6.50% of NAV. For the fiscal year ending September 30, 2024, 29% of the total distributions paid was characterized as a return of capital.
AVERAGE ANNUAL TOTAL RETURNS
| RiverNorth/DoubleLine Strategic Income Fund | 1 Year | 5 Year | 10 Year |
|---|
| Class I | 16.82% | 2.96% | 3.67% |
| Bloomberg US Aggregate Bond Index | 11.57% | 0.33% | 1.84% |
- Total Net Assets$1,279,994,692
- # of Portfolio Holdings1,266
- Portfolio Turnover Rate (Class I)84%
- Advisory Fees Paid$9,225,218
As of September 30, 2024. Past performance does not guarantee future results. Call 888.848.7569 for current month-end performance.
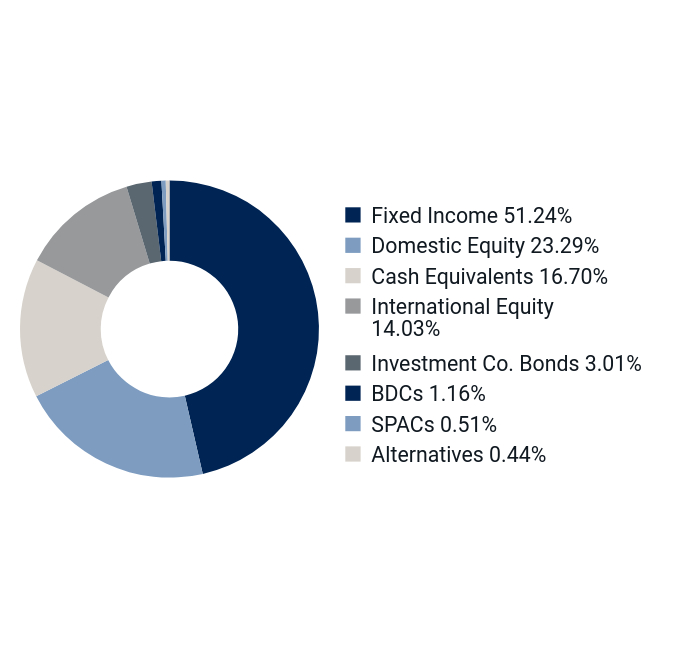
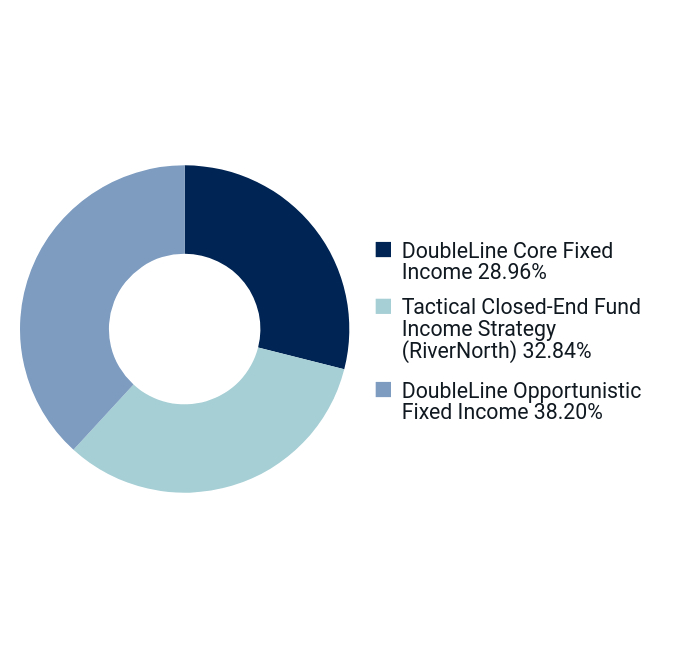
WHAT DID THE FUND INVEST IN?
(percentages are based on total investments)
| Value | Value |
|---|
| DoubleLine Core Fixed Income | 28.96% |
| Tactical Closed-End Fund Income Strategy (RiverNorth) | 32.84% |
| DoubleLine Opportunistic Fixed Income | 38.20% |
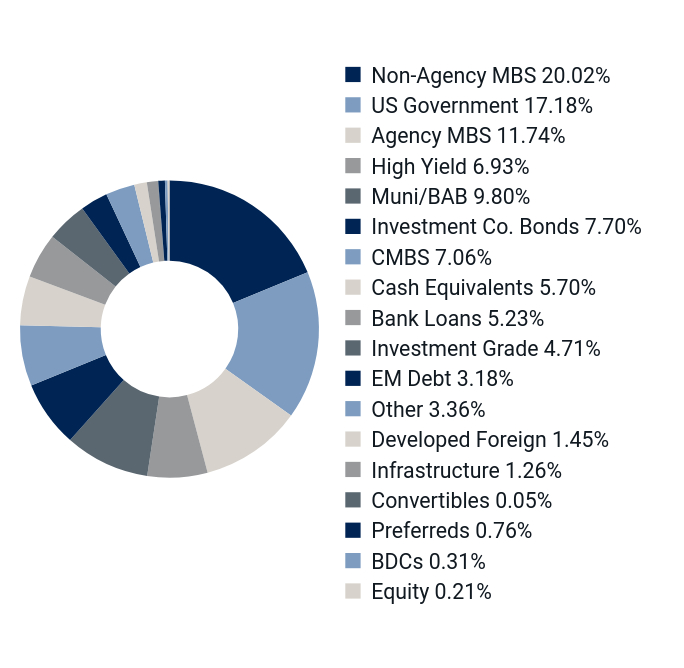
(percentages are based on net assets)
| Value | Value |
|---|
| Non-Agency MBS | 20.02% |
| US Government | 17.18% |
| Agency MBS | 11.74% |
| High Yield | 6.93% |
| Muni/BAB | 9.80% |
| Investment Co. Bonds | 7.70% |
| CMBS | 7.06% |
| Cash Equivalents | 5.70% |
| Bank Loans | 5.23% |
| Investment Grade | 4.71% |
| EM Debt | 3.18% |
| Other | 3.36% |
| Developed Foreign | 1.45% |
| Infrastructure | 1.26% |
| Convertibles | 0.05% |
| Preferreds | 0.76% |
| BDCs | 0.31% |
| Equity | 0.21% |
There have been no material Fund changes during the reporting period.
Additional information about the Fund, including its prospectus, financial information, holdings, and proxy voting information, can be found by visiting https://www.rivernorth.com/investments/rnsix-rndlx/.
If you have consented to receive a single annual or semi-annual shareholder report at a shared address you may revoke this consent by calling the Transfer Agent 888.848.7569.
RIVERNORTH/DOUBLELINE STRATEGIC INCOME FUND
CLASS I : RNSIX
Distributor, ALPS Distributors, Inc.
Annual Shareholder Report - September 30, 2024
RIVERNORTH/DOUBLELINE STRATEGIC INCOME FUND
Annual Shareholder Report - September 30, 2024
This annual shareholder report contains important information about RiverNorth/DoubleLine Strategic Income Fund - Class R for the period of October 1, 2023 to September 30, 2024.
You can find additional information about the Fund at https://www.rivernorth.com/investments/rnsix-rndlx/. You can also request this information by contacting us at 888.848.7569.
WHAT WERE THE FUND'S COST FOR THE LAST YEAR?
(based on a hypothetical $10,000 investment)
| CLASS NAME | COST OF A $10,000 INVESTMENT | COST PAID AS A PERCENTAGE OF A $10,000 INVESTMENT |
|---|
| RiverNorth/DoubleLine Strategic Income Fund - Class R | $123 | 1.19% |
HOW DID THE FUND PERFORM LAST YEAR?
For the fiscal year ended September 30, 2024, the Fund’s exposure to the Tactical Closed-End Fund Income strategy, managed by RiverNorth Capital Management, LLC was the primary driver of returns. Looking within the strategy, exposure to closed-end fund ("CEF") net asset values combined with discount narrowing were the largest drivers of returns. The strategy’s exposure to investment company debt contributed positively to absolute returns, however it detracted on a relative basis as compared to the Fund’s primary benchmark.
The Core Fixed Income Strategy and the Opportunistic Income Strategy, both managed by DoubleLine Capital, LP, also contributed positively to returns relative to the Fund’s benchmark.
We believe each of these strategies has a compelling investment thesis. The Opportunistic Fixed Income strategy provides exposure to a diversified portfolio of traditional and bespoke credit assets overseen by what we believe to be is one of the top fixed income managers in the world. As CEF investor sentiment continues to improve, the Tactical Closed-End Fund Income strategy may be poised to benefit from further discount narrowing. The Core Fixed Income strategy provides exposure to a diversified portfolio of fixed income assets while also providing capital that can be rapidly deployed in the event of further capital market or interest rate volatility.
HOW DID THE FUND PERFORM THE LAST 10 YEARS?
TOTAL RETURN BASED ON $10,000 INVESTMENT
| Class R - $13,984 | Bloomberg US Aggregate Bond Index - $12,004 |
|---|
| 9/30/2014 | $10,000 | $10,000 |
| 3/31/2015 | $10,237 | $10,343 |
| 9/30/2015 | $9,988 | $10,294 |
| 3/31/2016 | $10,268 | $10,546 |
| 9/30/2016 | $10,849 | $10,829 |
| 3/31/2017 | $11,019 | $10,592 |
| 9/30/2017 | $11,326 | $10,836 |
| 3/31/2018 | $11,262 | $10,720 |
| 9/30/2018 | $11,346 | $10,705 |
| 3/31/2019 | $11,721 | $11,200 |
| 9/30/2019 | $12,244 | $11,807 |
| 3/31/2020 | $11,468 | $12,201 |
| 9/30/2020 | $12,642 | $12,632 |
| 3/31/2021 | $13,191 | $12,287 |
| 9/30/2021 | $13,556 | $12,518 |
| 3/31/2022 | $12,949 | $11,777 |
| 9/30/2022 | $11,627 | $10,691 |
| 3/31/2023 | $12,145 | $11,214 |
| 9/30/2023 | $12,003 | $10,760 |
| 3/31/2024 | $13,149 | $11,404 |
| 9/30/2024 | $13,984 | $12,004 |
The chart above represents historical performance of a hypothetical investment of $10,000 in the Fund over the past ten years. Performance data quoted represents past performance and does not guarantee future results. Returns shown are total returns, which assume the reinvestment of dividends and capital gains. The table and graph presented above do not reflect the deduction of taxes a shareholder would pay on Fund distributions or the redemption of Fund shares.
LEVEL DISTRIBUTION INFORMATION
The Fund currently targets a level distribution set at 6.25% of NAV. For the fiscal year ending September 30, 2024, 29% of the total distributions paid was characterized as a return of capital.
AVERAGE ANNUAL TOTAL RETURNS
| RiverNorth/DoubleLine Strategic Income Fund | 1 Year | 5 Year | 10 Year |
|---|
| Class R | 16.50% | 2.69% | 3.41% |
| Bloomberg US Aggregate Bond Index | 11.57% | 0.33% | 1.84% |
- Total Net Assets$1,279,994,692
- # of Portfolio Holdings1,266
- Portfolio Turnover Rate (Class R)84%
- Advisory Fees Paid$9,225,218
As of September 30, 2024. Past performance does not guarantee future results. Call 888.848.7569 for current month-end performance.
WHAT DID THE FUND INVEST IN?
(percentages are based on total investments)
| Value | Value |
|---|
| DoubleLine Core Fixed Income | 28.96% |
| Tactical Closed-End Fund Income Strategy (RiverNorth) | 32.84% |
| DoubleLine Opportunistic Fixed Income | 38.20% |
(percentages are based on net assets)
| Value | Value |
|---|
| Non-Agency MBS | 20.02% |
| US Government | 17.18% |
| Agency MBS | 11.74% |
| High Yield | 6.93% |
| Muni/BAB | 9.80% |
| Investment Co. Bonds | 7.70% |
| CMBS | 7.06% |
| Cash Equivalents | 5.70% |
| Bank Loans | 5.23% |
| Investment Grade | 4.71% |
| EM Debt | 3.18% |
| Other | 3.36% |
| Developed Foreign | 1.45% |
| Infrastructure | 1.26% |
| Convertibles | 0.05% |
| Preferreds | 0.76% |
| BDCs | 0.31% |
| Equity | 0.21% |
There have been no material Fund changes during the reporting period.
Additional information about the Fund, including its prospectus, financial information, holdings, and proxy voting information, can be found by visiting https://www.rivernorth.com/investments/rnsix-rndlx/.
If you have consented to receive a single annual or semi-annual shareholder report at a shared address you may revoke this consent by calling the Transfer Agent 888.848.7569.
RIVERNORTH/DOUBLELINE STRATEGIC INCOME FUND
CLASS R : RNDLX
Distributor, ALPS Distributors, Inc.
Annual Shareholder Report - September 30, 2024
RIVERNORTH/OAKTREE HIGH INCOME FUND
Annual Shareholder Report - September 30, 2024
This annual shareholder report contains important information about RiverNorth/Oaktree High Income Fund - Class I for the period of October 1, 2023 to September 30, 2024.
You can find additional information about the Fund at https://www.rivernorth.com/investments/rnhix-rnotx/. You can also request this information by contacting us at 888.848.7569.
WHAT WERE THE FUND'S COST FOR THE LAST YEAR?
(based on a hypothetical $10,000 investment)
| CLASS NAME | COST OF A $10,000 INVESTMENT | COST PAID AS A PERCENTAGE OF A $10,000 INVESTMENT |
|---|
| RiverNorth/Oaktree High Income Fund - Class I | $138 | 1.35% |
HOW DID THE FUND PERFORM LAST YEAR?
For the fiscal year ended September 30, 2024, the Fund’s exposure to high yield bonds was the primary driver of returns. The Fund’s exposure to investment company debt also contributed positively to returns over the fiscal year. Trading activities within the RiverNorth Capital Management, LLC sleeve detracted from returns relative to the Fund’s primary benchmark for the fiscal year.
The Fund continues to offer investors access to Oaktree Fund Advisers, LLC, in our opinion one of the world’s top credit managers, while also providing a unique source of income and potential capital appreciation by overlaying opportunistic exposure to closed end funds, business development companies, and investment company debt.
HOW DID THE FUND PERFORM THE LAST 10 YEARS?
TOTAL RETURN BASED ON $100,000 INVESTMENT
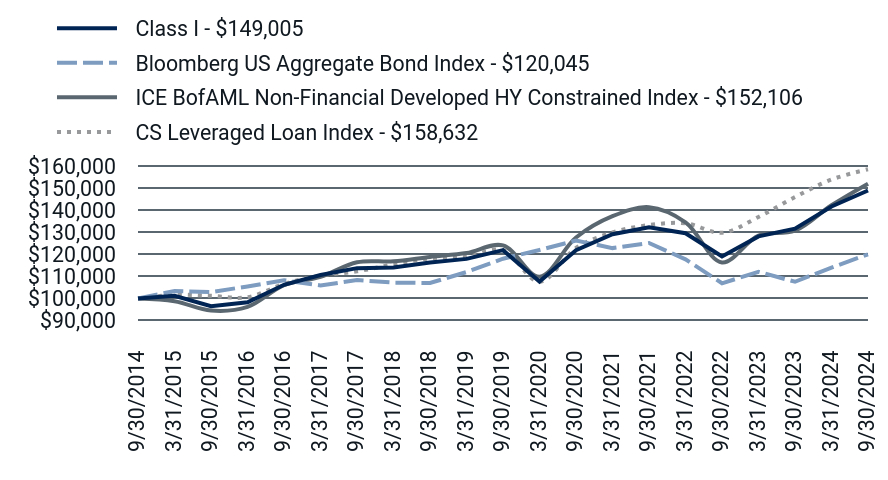
| Class I - $149,005 | Bloomberg US Aggregate Bond Index - $120,045 | ICE BofAML Non-Financial Developed HY Constrained Index - $152,106 | CS Leveraged Loan Index - $158,632 |
|---|
| 9/30/2014 | $100,000 | $100,000 | $100,000 | $100,000 |
| 3/31/2015 | $101,235 | $103,430 | $98,783 | $101,691 |
| 9/30/2015 | $96,497 | $102,941 | $94,521 | $101,233 |
| 3/31/2016 | $98,317 | $105,457 | $96,175 | $100,566 |
| 9/30/2016 | $106,230 | $108,286 | $106,025 | $106,622 |
| 3/31/2017 | $110,657 | $105,922 | $109,833 | $110,333 |
| 9/30/2017 | $113,780 | $108,365 | $116,444 | $112,339 |
| 3/31/2018 | $114,056 | $107,196 | $116,865 | $115,452 |
| 9/30/2018 | $116,306 | $107,047 | $118,881 | $118,228 |
| 3/31/2019 | $117,980 | $111,999 | $120,624 | $118,915 |
| 9/30/2019 | $121,944 | $118,069 | $124,087 | $121,909 |
| 3/31/2020 | $107,715 | $122,005 | $109,932 | $107,607 |
| 9/30/2020 | $121,921 | $126,315 | $127,671 | $122,927 |
| 3/31/2021 | $129,184 | $122,872 | $137,360 | $129,956 |
| 9/30/2021 | $132,349 | $125,185 | $141,418 | $133,324 |
| 3/31/2022 | $129,602 | $117,770 | $134,581 | $134,140 |
| 9/30/2022 | $119,069 | $106,908 | $116,358 | $129,829 |
| 3/31/2023 | $128,176 | $112,136 | $128,520 | $136,989 |
| 9/30/2023 | $131,681 | $107,597 | $130,782 | $146,024 |
| 3/31/2024 | $141,753 | $114,041 | $142,290 | $153,979 |
| 9/30/2024 | $149,005 | $120,045 | $152,106 | $158,632 |
The chart above represents historical performance of a hypothetical investment of $100,000 in the Fund over the past ten years. Performance data quoted represents past performance and does not guarantee future results. Returns shown are total returns, which assume the reinvestment of dividends and capital gains. As of September 2024, pursuant to the new regulatory requirements, the Bloomberg US Aggregate Bond Index replaced the prior index as the Fund's primary benchmark to represent a broad-based securities market index. The table and graph presented above do not reflect the deduction of taxes a shareholder would pay on Fund distributions or the redemption of Fund shares.
LEVEL DISTRIBUTION INFORMATION
The Fund currently targets a level distribution set at 7.25% of NAV. For the fiscal year ending September 30, 2024, 21% of the total distributions paid was characterized as a return of capital.
AVERAGE ANNUAL TOTAL RETURNS
| RiverNorth/Oaktree High Income Fund | 1 Year | 5 Year | 10 Year |
|---|
| Class I | 13.16% | 4.09% | 4.07% |
| Bloomberg US Aggregate Bond Index | 11.57% | 0.33% | 1.84% |
| ICE BofAML Non-Financial Developed HY Constrained Index | 16.30% | 4.16% | 4.28% |
| CS Leveraged Loan Index | 8.63% | 5.41% | 4.72% |
- Total Net Assets$55,809,203
- # of Portfolio Holdings438
- Portfolio Turnover Rate (Class I)57%
- Advisory Fees Paid$541,416
As of September 30, 2024. Past performance does not guarantee future results. Call 888.848.7569 for current month-end performance.
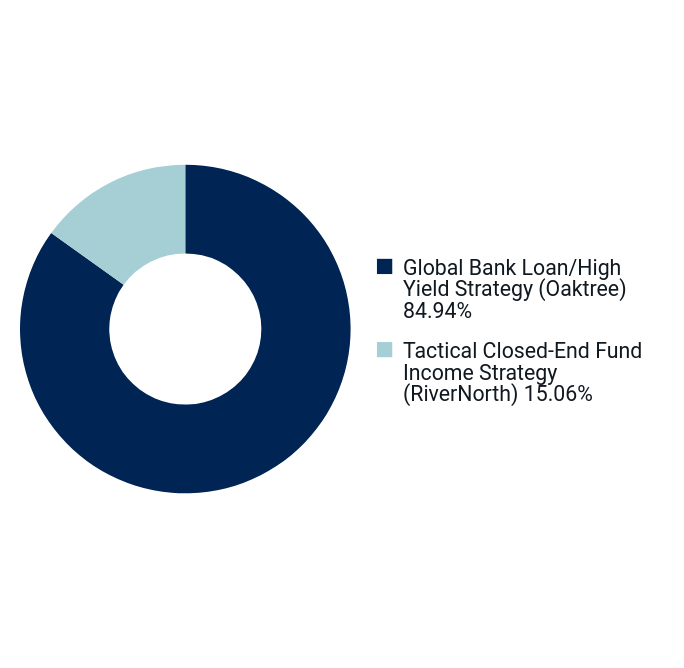
WHAT DID THE FUND INVEST IN?
(percentages are based on total investments)
| Value | Value |
|---|
| Global Bank Loan/High Yield Strategy (Oaktree) | 84.94% |
| Tactical Closed-End Fund Income Strategy (RiverNorth) | 15.06% |
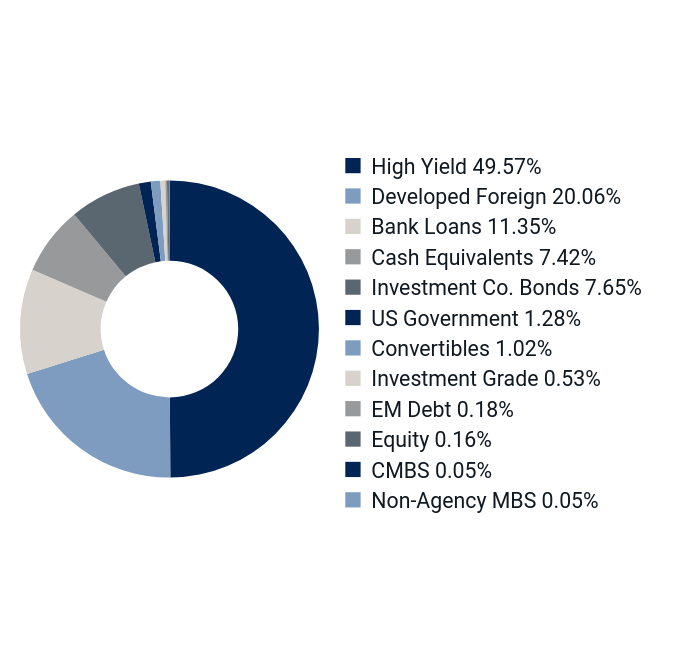
(percentages are based on net assets)
| Value | Value |
|---|
| High Yield | 49.57% |
| Developed Foreign | 20.06% |
| Bank Loans | 11.35% |
| Cash Equivalents | 7.42% |
| Investment Co. Bonds | 7.65% |
| US Government | 1.28% |
| Convertibles | 1.02% |
| Investment Grade | 0.53% |
| EM Debt | 0.18% |
| Equity | 0.16% |
| CMBS | 0.05% |
| Non-Agency MBS | 0.05% |
There have been no material Fund changes during the reporting period.
Additional information about the Fund, including its prospectus, financial information, holdings, and proxy voting information, can be found by visiting https://www.rivernorth.com/investments/rnhix-rnotx/.
If you have consented to receive a single annual or semi-annual shareholder report at a shared address you may revoke this consent by calling the Transfer Agent 888.848.7569.
RIVERNORTH/OAKTREE HIGH INCOME FUND
CLASS I : RNHIX
Distributor, ALPS Distributors, Inc.
Annual Shareholder Report - September 30, 2024
RIVERNORTH/OAKTREE HIGH INCOME FUND
Annual Shareholder Report - September 30, 2024
This annual shareholder report contains important information about RiverNorth/Oaktree High Income Fund - Class R for the period of October 1, 2023 to September 30, 2024.
You can find additional information about the Fund at https://www.rivernorth.com/investments/rnhix-rnotx/. You can also request this information by contacting us at 888.848.7569.
WHAT WERE THE FUND'S COST FOR THE LAST YEAR?
(based on a hypothetical $10,000 investment)
| CLASS NAME | COST OF A $10,000 INVESTMENT | COST PAID AS A PERCENTAGE OF A $10,000 INVESTMENT |
|---|
| RiverNorth/Oaktree High Income Fund - Class R | $164 | 1.60% |
HOW DID THE FUND PERFORM LAST YEAR?
For the fiscal year ended September 30, 2024, the Fund’s exposure to high yield bonds was the primary driver of returns. The Fund’s exposure to investment company debt also contributed positively to returns over the fiscal year. Trading activities within the RiverNorth Capital Management, LLC sleeve detracted from returns relative to the Fund’s primary benchmark for the fiscal year.
The Fund continues to offer investors access to Oaktree Fund Advisers, LLC, in our opinion one of the world’s top credit managers, while also providing a unique source of income and potential capital appreciation by overlaying opportunistic exposure to closed end funds, business development companies, and investment company debt.
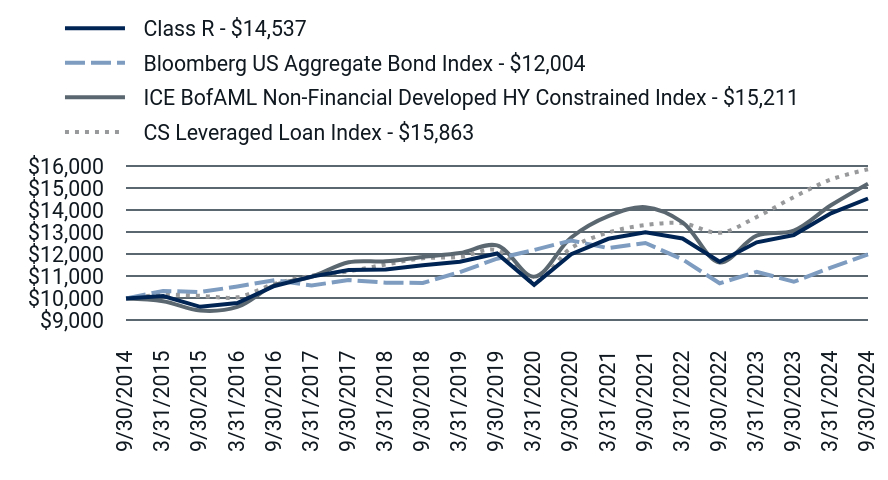
HOW DID THE FUND PERFORM THE LAST 10 YEARS?
TOTAL RETURN BASED ON $10,000 INVESTMENT
| Class R - $14,537 | Bloomberg US Aggregate Bond Index - $12,004 | ICE BofAML Non-Financial Developed HY Constrained Index - $15,211 | CS Leveraged Loan Index - $15,863 |
|---|
| 9/30/2014 | $10,000 | $10,000 | $10,000 | $10,000 |
| 3/31/2015 | $10,111 | $10,343 | $9,878 | $10,169 |
| 9/30/2015 | $9,624 | $10,294 | $9,452 | $10,123 |
| 3/31/2016 | $9,793 | $10,546 | $9,618 | $10,057 |
| 9/30/2016 | $10,570 | $10,829 | $10,602 | $10,662 |
| 3/31/2017 | $10,995 | $10,592 | $10,983 | $11,033 |
| 9/30/2017 | $11,292 | $10,836 | $11,644 | $11,234 |
| 3/31/2018 | $11,317 | $10,720 | $11,686 | $11,545 |
| 9/30/2018 | $11,514 | $10,705 | $11,888 | $11,823 |
| 3/31/2019 | $11,665 | $11,200 | $12,062 | $11,891 |
| 9/30/2019 | $12,042 | $11,807 | $12,409 | $12,191 |
| 3/31/2020 | $10,622 | $12,201 | $10,993 | $10,761 |
| 9/30/2020 | $12,010 | $12,632 | $12,767 | $12,293 |
| 3/31/2021 | $12,710 | $12,287 | $13,736 | $12,996 |
| 9/30/2021 | $13,008 | $12,518 | $14,142 | $13,332 |
| 3/31/2022 | $12,722 | $11,777 | $13,458 | $13,414 |
| 9/30/2022 | $11,672 | $10,691 | $11,636 | $12,983 |
| 3/31/2023 | $12,550 | $11,214 | $12,852 | $13,699 |
| 9/30/2023 | $12,878 | $10,760 | $13,078 | $14,602 |
| 3/31/2024 | $13,862 | $11,404 | $14,229 | $15,398 |
| 9/30/2024 | $14,537 | $12,004 | $15,211 | $15,863 |
The chart above represents historical performance of a hypothetical investment of $10,000 in the Fund over the past ten years. Performance data quoted represents past performance and does not guarantee future results. Returns shown are total returns, which assume the reinvestment of dividends and capital gains. As of September 2024, pursuant to the new regulatory requirements, the Bloomberg US Aggregate Bond Index replaced the prior index as the Fund's primary benchmark to represent a broad-based securities market index. The table and graph presented above do not reflect the deduction of taxes a shareholder would pay on Fund distributions or the redemption of Fund shares.
LEVEL DISTRIBUTION INFORMATION
The Fund currently targets a level distribution set at 6.50% of NAV. For the fiscal year ending September 30, 2024, 21% of the total distributions paid was characterized as a return of capital.
AVERAGE ANNUAL TOTAL RETURNS
| RiverNorth/Oaktree High Income Fund | 1 Year | 5 Year | 10 Year |
|---|
| Class R | 12.88% | 3.84% | 3.81% |
| Bloomberg US Aggregate Bond Index | 11.57% | 0.33% | 1.84% |
| ICE BofAML Non-Financial Developed HY Constrained Index | 16.30% | 4.16% | 4.28% |
| CS Leveraged Loan Index | 8.63% | 5.41% | 4.72% |
- Total Net Assets$55,809,203
- # of Portfolio Holdings438
- Portfolio Turnover Rate (Class R)57%
- Advisory Fees Paid$541,416
As of September 30, 2024. Past performance does not guarantee future results. Call 888.848.7569 for current month-end performance.
WHAT DID THE FUND INVEST IN?
(percentages are based on total investments)
| Value | Value |
|---|
| Global Bank Loan/High Yield Strategy (Oaktree) | 84.94% |
| Tactical Closed-End Fund Income Strategy (RiverNorth) | 15.06% |
(percentages are based on net assets)
| Value | Value |
|---|
| High Yield | 49.57% |
| Developed Foreign | 20.06% |
| Bank Loans | 11.35% |
| Cash Equivalents | 7.42% |
| Investment Co. Bonds | 7.65% |
| US Government | 1.28% |
| Convertibles | 1.02% |
| Investment Grade | 0.53% |
| EM Debt | 0.18% |
| Equity | 0.16% |
| CMBS | 0.05% |
| Non-Agency MBS | 0.05% |
There have been no material Fund changes during the reporting period.
Additional information about the Fund, including its prospectus, financial information, holdings, and proxy voting information, can be found by visiting https://www.rivernorth.com/investments/rnhix-rnotx/.
If you have consented to receive a single annual or semi-annual shareholder report at a shared address you may revoke this consent by calling the Transfer Agent 888.848.7569.
RIVERNORTH/OAKTREE HIGH INCOME FUND
CLASS R : RNOTX
Distributor, ALPS Distributors, Inc.
Annual Shareholder Report - September 30, 2024
| (a) | RiverNorth Funds (the “Registrant”), as of the end of the period covered by this report, has adopted a code of ethics that applies to the Registrant’s principal executive officer, principal financial officer, principal accounting officer or controller or any persons performing similar functions (“Officers”) on behalf of the Registrant. |
| (c) | During the period covered by this report, no amendments were made to the provisions of the code of ethics adopted in 2(a) above. |
| (d) | During the period covered by this report, no implicit or explicit waivers to the provisions of the code of ethics adopted in 2(a) above were granted. |
| (f) | The Registrant has included with this filing, pursuant to Item 19(a)(1), a copy of its code of ethics that applies to the Registrant’s principal executive officer, principal financial officer, principal accounting officer or controller, or persons performing similar functions, as an exhibit to its annual report on this Form N-CSR. |
| Item 3. | Audit Committee Financial Expert. |
The Registrant’s Board of Trustees has determined that the Registrant has as least one audit committee financial expert serving on its Audit Committee. The Board of Trustees has determined that J. Wayne Hutchens qualifies as the Registrant’s “audit committee financial expert.” Mr. Hutchens is “independent” as defined in paragraph (a)(2) of Item 3 to Form N-CSR.
| Item 4. | Principal Accountant Fees and Services. |
| (a) | Audit Fees. For the Registrant’s fiscal years ended September 30, 2024 and September 30, 2023, the aggregate fees billed for professional services rendered by Cohen & Company, Ltd. (“Cohen”) for the audit of the Registrant's annual financial statements or services that are normally provided by the accountant in connection with statutory and regulatory filings or engagements were $111,200 and $133,700, respectively. |
| (b) | Audit-Related Fees. For the Registrant’s fiscal years ended September 30, 2024 and September 30, 2023, the aggregate fees billed for assurance and related services by Cohen that are reasonably related to the performance of the audit of the Registrant's financial statements and are not reported under paragraph (a) of this Item were $2,500 and $1,665, respectively. These fees are related to auditor consents in connection with the Registrant’s annual registration statement update filing with the U.S. Securities and Exchange Commission. |
| (c) | Tax Fees. For the Registrant’s fiscal years ended September 30, 2024 and September 30, 2023, the aggregate fees billed for professional services rendered by Cohen for tax compliance, tax advice, and tax planning were $15,900 and $15,900, respectively. These fees are related to the preparation of tax returns. |
| (d) | All Other Fees. For the Registrant’s fiscal years ended September 30, 2024 and September 30, 2023, the aggregate fees billed for products and services provided by Cohen, other than the services reported in paragraphs (a) through (c) of this Item were $20,000 and $13,000, respectively. These fees are related to research regarding recognition and treatment of income. |
| (1) | Audit Committee’s Pre-Approval Policies. The Audit Committee Charter requires the Audit Committee to be responsible for the selection, retention or termination of auditors and, in connection therewith, to (i) evaluate the proposed fees and other compensation, if any, to be paid to the auditors, (ii) evaluate the independence of the auditors, (iii) pre-approve all audit services and, when appropriate, any non-audit services provided by the independent auditors to the Registrant, (iv) pre-approve, when appropriate, any non-audit services provided by the independent auditors to the Registrant’s investment adviser, or any entity controlling, controlled by, or under common control with the investment adviser and that provides ongoing services to the Registrant if the engagement relates directly to the operations and financial reporting of the Registrant, and (v) receive the auditors’ specific representations as to their independence. |
| (2) | Percentages of Services Approved by the Audit Committee pursuant to paragraph (c)(7)(i)(C) of Rule 2-01 of Regulation S-X. |
| | Registrant | | | |
| Audit-Related Fees: | | 0% | |
| | Tax Fees: | | 0% | |
| | All Other Fees: | | 0% | |
| (g) | The aggregate non-audit fees billed by the Registrant’s accountant for services rendered to the Registrant, and rendered to the Registrant’s investment adviser (not including any sub-adviser whose role is primarily portfolio management and is subcontracted with or overseen by another investment adviser), and any entity controlling, controlled by, or under common control with the adviser that provides ongoing services to the Registrant: |
| Fiscal Year | | Registrant | | | Adviser | |
| FY 2024 | | $ | 0 | | | $ | 0 | |
| FY 2023 | | $ | 0 | | | $ | 0 | |
| (h) | Not applicable to the Registrant. |
| (i) | Not applicable to the Registrant. |
| (j) | Not applicable to the Registrant. |
| Item 5. | Audit Committee of Listed Registrants. |
Not applicable to the Registrant.
| (a) | Schedule of Investments is included in the Financial Statements filed under Item 7(a) of this Form N-CSR. |
| (b) | Not applicable to the Registrant. |
| Item 7. | Financial Statements and Financial Highlights for Open-End Management Investment Companies. |
| RiverNorth Funds | Table of Contents |
| Schedule of Investments | |
| RiverNorth Core Opportunity Fund | 1 |
| RiverNorth/DoubleLine Strategic Income Fund | 5 |
| RiverNorth/Oaktree High Income Fund | 57 |
| Statement of Assets and Liabilities | 74 |
| Statement of Operations | 78 |
| Statements of Changes in Net Assets | |
| RiverNorth Core Opportunity Fund | 81 |
| RiverNorth/DoubleLine Strategic Income Fund | 83 |
| RiverNorth/Oaktree High Income Fund | 85 |
| Financial Highlights | 88 |
| Notes to Financial Statements and Financial Highlights | 111 |
| Report of Independent Registered Public Accounting Firm | 133 |
| Additional Information | 134 |
| RiverNorth Core Opportunity Fund | Schedule of Investments |
| Shares/Description | | | Value | |
| CLOSED-END FUNDS - 71.51% | | | |
| Great Britain - 9.94% | | | | |
| | 95,547 | | | Pershing Square Holdings Ltd. | | $ | 4,538,482 | |
| United States - 61.57% | | | | |
| | 100 | | | Advent Convertible and Income Fund | | | 1,174 | |
| | 11,192 | | | Alpine Global Dynamic Dividend Fund | | | 118,859 | |
| | 172,668 | | | Avenue Income Credit Strategies Fund | | | 1,143,064 | |
| | 212,623 | | | BlackRock Capital Allocation Term Trust | | | 3,497,648 | |
| | 240,856 | | | BlackRock ESG Capital Allocation Term Trust | | | 4,272,786 | |
| | 31,287 | | | BlackRock Health Sciences Term Trust | | | 495,586 | |
| | 53,617 | | | BlackRock Innovation and Growth Term Trust | | | 404,808 | |
| | 38,289 | | | BlackRock MuniHoldings New York Quality Fund, Inc. | | | 427,305 | |
| | 46,272 | | | BlackRock MuniYield New York Quality Fund, Inc. | | | 498,812 | |
| | 48,140 | | | BlackRock Resources & Commodities Strategy Trust | | | 462,144 | |
| | 61,198 | | | BlackRock Science and Technology Term Trust | | | 1,175,002 | |
| | 73,949 | | | Blackstone/GSO Senior Floating Rate Term Fund | | | 1,044,160 | |
| | 76,951 | | | Calamos Long/Short Equity & Dynamic Income Trust | | | 1,207,207 | |
| | 186,260 | | | Clough Global Equity Fund | | | 1,292,496 | |
| | 142,496 | | | Clough Global Opportunities Fund | | | 776,603 | |
| | 42,279 | | | First Trust High Yield Opportunities 2027 Term Fund | | | 639,259 | |
| | 70,439 | | | Flaherty & Crumrine Preferred and Income Opportunity Fund, Inc. | | | 662,831 | |
| | 52,716 | | | Nuveen AMT-Free Municipal Credit Income Fund | | | 705,867 | |
| | 86,410 | | | Nuveen AMT-Free Quality Municipal Income Fund | | | 1,034,328 | |
| | 60,333 | | | Nuveen Municipal Credit Income Fund | | | 790,362 | |
| | 182,948 | | | Nuveen Municipal Value Fund, Inc. | | | 1,650,191 | |
| | 42,806 | | | Nuveen Quality Municipal Income Fund | | | 529,938 | |
| | 80,000 | | | PIMCO High Income Fund | | | 400,000 | |
| | 1,676 | | | PIMCO Income Strategy Fund II | | | 12,771 | |
| | 213,261 | | | Saba Capital Income & Opportunities Fund II | | | 1,814,851 | |
| | 84,113 | | | Special Opportunities Fund, Inc. | | | 1,170,012 | |
| | 50,000 | | | Voya Emerging Markets High Income Dividend Equity Fund | | | 285,250 | |
| | 100 | | | Western Asset Global High Income Fund, Inc. | | | 694 | |
| | 180,960 | | | Western Asset Inflation-Linked Opportunities & Income Fund | | | 1,599,687 | |
| | | | | | | | | |
| TOTAL CLOSED-END FUNDS | | | | |
| (Cost $27,828,428) | | | 32,652,177 | |
| | | | | |
| CLOSED-END FUNDS - PREFERRED SHARES - 0.84% | | | | |
| United States - 0.84% | | | | |
| | 15,162 | | | XAI Octagon Floating Rate Alternative Income Trust, Series 2026, 6.500%, 03/31/2026 | | | 381,931 | |
| | | | | | | | | |
| TOTAL CLOSED-END FUNDS - PREFERRED SHARES | | | | |
| (Cost $378,878) | | | 381,931 | |
See Notes to Financial Statements and Financial Highlights.
| Annual Report | September 30, 2024 | 1 |
| RiverNorth Core Opportunity Fund | Schedule of Investments |
| Shares/Description | | Value | |
| BUSINESS DEVELOPMENT COMPANIES - 0.80% | | | |
| United States - 0.80% | | | | |
| 22,546 | | Oaktree Specialty Lending Corp. | | $ | 367,725 | |
| | | | | |
| TOTAL BUSINESS DEVELOPMENT COMPANIES | | | | |
| (Cost $369,929) | | | 367,725 | |
| | | | | |
| EXCHANGE TRADED FUNDS - 7.95% | | | | |
| United States - 7.95% | | | | |
| 44,975 | | Blackrock Flexible Income ETF | | | 2,407,512 | |
| 55,600 | | Invesco FTSE RAFI Emerging Markets ETF | | | 1,220,420 | |
| | | | | | | |
| TOTAL EXCHANGE TRADED FUNDS | | | | |
| (Cost $3,298,321) | | | 3,627,932 | |
| Principal Amount/Description | | Rate | | Maturity | | | Value | |
| BUSINESS DEVELOPMENT COMPANY NOTES - 0.43% | | | | | | |
| United States - 0.43% | | | | | | | | | | | | |
| $ | 200,000 | | MidCap Financial Investment Corp. | | | 5.25 | % | | | 03/03/2025 | | | | 198,720 | |
| | | | | | | | | | | | | | | |
| TOTAL BUSINESS DEVELOPMENT COMPANY NOTES | | | | | | | | | | | | |
| (Cost $198,393) | | | | | | | | | | | 198,720 | |
| | | | | | | | | | | | | | | |
| U.S. CORPORATE BONDS - 2.57% | | | | | | | | | | | | |
| Investment Companies - 2.08% | | | | | | | | | | | | |
| 249,936 | | Blue Owl Credit Income Corp. | | | 4.70 | % | | | 02/08/2027 | | | | 245,307 | |
| 500,000 | | Blue Owl Technology Finance Corp.(a) | | | 6.75 | % | | | 06/30/2025 | | | | 502,818 | |
| 200,000 | | Blue Owl Technology Finance Corp. II(a) | | | 6.75 | % | | | 04/04/2029 | | | | 201,020 | |
| | | | | | | | | | | | | | 949,145 | |
| Private Equity - 0.49% | | | | | | | | | | | | |
| 237,712 | | Hercules Capital, Inc. | | | 2.63 | % | | | 09/16/2026 | | | | 224,770 | |
| | | | | | | | | | | | | | | |
| TOTAL U.S. CORPORATE BONDS | | | | | | | | | | | | |
| (Cost $1,143,639) | | | | | | | | | | | 1,173,915 | |
See Notes to Financial Statements and Financial Highlights.
| 2 | (888) 848-7569 | www.rivernorth.com |
| RiverNorth Core Opportunity Fund | Schedule of Investments |
| Principal Amount/Description | | Rate | | | Maturity | | | Value | |
| U.S. GOVERNMENT BONDS AND NOTES - 2.19% | | | | | | |
| United States - 2.19% | | | | | | | | | | | | |
| $1,000,000 | | U.S. Treasury Notes | | | 4.25 | % | | | 12/31/2024 | | | $ | 998,921 | |
| | | | | | | | | | | | | |
| TOTAL U.S. GOVERNMENT BONDS AND NOTES | | | | | | | | | | | | |
| (Cost $999,474) | | | | | | | | | | | 998,921 | |
| | | | | | | | | | | | | |
| Shares/Description | | Value | |
| Rights - 0.00%(b) | | | |
| United States - 0.00%(b) | | | | |
| 100 | | Advent Convertible and Income Fund, Strike Price 0.01, Expires 10/17/2024 | | | 2 | |
| 102 | | Western Asset Global High Income Fund, Inc., Strike Price 0.01, Expires 10/10/2024 | | | 1 | |
| | | | | |
| TOTAL RIGHTS | | | | |
| (Cost $0) | | | 3 | |
| | | | | |
| Warrants - 0.01% | | | | |
| Hong Kong - 0.01% | | | | |
| 12,299 | | AGBA Group Holding, Ltd., Strike Price 11.50, Expires 03/15/2027 | | | 2,706 | |
| United States - 0.00%(b) | | | | |
| 10,113 | | Jaws Mustang Acquisition Corp., Strike Price 11.50, Expires 01/30/2026 | | | 233 | |
| | | | | |
| TOTAL WARRANTS | | | | |
| (Cost $15,126) | | | 2,939 | |
| | | | | |
| Short-Term Investments - 13.63% | | | | |
| Money Market Fund - 13.63% | | | | |
| 6,222,951 | | State Street Institutional Treasury Money Market Fund Premier Class (7 Day Yield 4.97%) | | | 6,222,951 | |
| | | | | | | |
| TOTAL SHORT-TERM INVESTMENTS | | | | |
| (Cost $6,222,951) | | | 6,222,951 | |
| | | | | | |
| TOTAL INVESTMENTS - 99.93% | | | | |
| (Cost $40,455,139) | | $ | 45,627,214 | |
| OTHER ASSETS IN EXCESS OF LIABILITIES - 0.07% | | | 30,610 | |
| NET ASSETS - 100.00% | | $ | 45,657,824 | |
See Notes to Financial Statements and Financial Highlights.
| Annual Report | September 30, 2024 | 3 |
| RiverNorth Core Opportunity Fund | Schedule of Investments |
| (a) | Security exempt from registration under Rule 144A of the Securities Act of 1933, as amended. These securities have been deemed liquid under procedures approved by the Fund's Board of Trustees and may normally be sold to qualified institutional buyers in transactions exempt from registration. Total fair value of Rule 144A securities amounts to $703,838, which represents approximately 1.54% of net assets as of September 30, 2024. |
See Notes to Financial Statements and Financial Highlights.
| 4 | (888) 848-7569 | www.rivernorth.com |
| RiverNorth/DoubleLine Strategic Income Fund | Schedule of Investments |
September 30, 2024
| Shares/Description | | Value | |
| CLOSED-END FUNDS - 17.09% | | | |
| United States - 17.09% | | | | |
| | 100 | | | Advent Convertible and Income Fund | | $ | 1,174 | |
| | 1,082,896 | | | Allspring Income Opportunities Fund | | | 7,721,048 | |
| | 167,483 | | | Barings Global Short Duration High Yield Fund | | | 2,542,392 | |
| | 182,026 | | | BlackRock MuniHoldings California Quality Fund, Inc. | | | 2,096,940 | |
| | 161,620 | | | BlackRock MuniHoldings New York Quality Fund, Inc. | | | 1,803,679 | |
| | 195,559 | | | BlackRock MuniYield New York Quality Fund, Inc. | | | 2,108,126 | |
| | 268,805 | | | Blackstone Long-Short Credit Income Fund | | | 3,438,016 | |
| | 781,248 | | | Blackstone Strategic Credit 2027 Term Fund | | | 9,624,975 | |
| | 159,606 | | | Blackstone/GSO Senior Floating Rate Term Fund | | | 2,253,637 | |
| | 581,087 | | | BNY Mellon Strategic Municipals, Inc. | | | 3,782,876 | |
| | 344,613 | | | BrandywineGLOBAL - Global Income Opportunities Fund, Inc. | | | 3,046,379 | |
| | 695,542 | | | First Trust High Yield Opportunities 2027 Term Fund | | | 10,516,595 | |
| | 31,569 | | | Invesco Dynamic Credit Opportunity Fund | | | 346,311 | |
| | 200,000 | | | John Hancock Investors Trust | | | 2,812,000 | |
| | 98,077 | | | Morgan Stanley Emerging Markets Domestic Debt Fund, Inc. | | | 494,308 | |
| | 1,173,103 | | | Nuveen AMT-Free Municipal Credit Income Fund | | | 15,707,849 | |
| | 1,575,017 | | | Nuveen AMT-Free Quality Municipal Income Fund | | | 18,852,954 | |
| | 725,930 | | | Nuveen California Quality Municipal Income Fund | | | 8,631,308 | |
| | 367,502 | | | Nuveen Municipal Credit Income Fund | | | 4,814,276 | |
| | 958,976 | | | Nuveen Municipal Value Fund, Inc. | | | 8,649,964 | |
| | 1,047,485 | | | Nuveen Quality Municipal Income Fund | | | 12,967,864 | |
| | 6,862 | | | PGIM Global High Yield Fund, Inc. | | | 87,696 | |
| | 641,078 | | | PGIM Short Duration High Yield Opportunities Fund | | | 10,718,824 | |
| | 3,386,841 | | | PIMCO High Income Fund | | | 16,934,205 | |
| | 1,248,835 | | | PIMCO Income Strategy Fund | | | 10,702,516 | |
| | 2,621,631 | | | PIMCO Income Strategy Fund II | | | 19,976,828 | |
| | 25,832 | | | Sound Point Meridian Capital, Inc. | | | 510,699 | |
| | 171,339 | | | The New America High Income Fund, Inc. | | | 1,427,254 | |
| | 1,350,440 | | | Western Asset Emerging Markets Debt Fund, Inc. | | | 13,747,479 | |
| | 1,625,993 | | | Western Asset High Income Opportunity Fund, Inc. | | | 6,585,272 | |
| | 1,800,000 | | | Western Asset Inflation-Linked Opportunities & Income Fund | | | 15,912,000 | |
| | | | | | | | | |
| TOTAL CLOSED-END FUNDS | | | | |
| (Cost $209,266,533) | | | 218,815,444 | |
| | | | | | | | | |
| CLOSED-END FUNDS - PREFERRED SHARES - 0.57% | | | | |
| United States - 0.57% | | | | |
| | 310,867 | | | Virtus Convertible & Income Fund, 5.625% (a) | | | 7,259,522 | |
| | | | | | | | | |
| TOTAL CLOSED-END FUNDS - PREFERRED SHARES | | | | |
| (Cost $7,645,140) | | | 7,259,522 | |
See Notes to Financial Statements and Financial Highlights.
| Annual Report | September 30, 2024 | 5 |
| RiverNorth/DoubleLine Strategic Income Fund | Schedule of Investments |
September 30, 2024
| Shares/Description | | Value | |
| BUSINESS DEVELOPMENT COMPANIES - 0.31% | | | |
| United States - 0.31% | | | | |
| | 245,862 | | | Oaktree Specialty Lending Corp. | | $ | 4,010,009 | |
| | | | | | | | | |
| TOTAL BUSINESS DEVELOPMENT COMPANIES | | | | |
| (Cost $3,934,767) | | | 4,010,009 | |
| | | | | |
| BUSINESS DEVELOPMENT COMPANIES - PREFERRED SHARES - 0.84% | | | | |
| United States - 0.84% | | | | |
| | 246,313 | | | Crescent Capital BDC, Inc., 5.000%, 05/25/2026 | | | 5,997,721 | |
| | 46,046 | | | Oxford Square Capital Corp., 6.250%, 04/30/2026 | | | 1,138,718 | |
| | 3,750,000 | | | PennantPark Floating Rate Capital, Ltd., 4.250%, 04/01/2026 | | | 3,572,730 | |
| | | | | | | | | |
| TOTAL BUSINESS DEVELOPMENT COMPANIES - PREFERRED SHARES | | | | |
| (Cost $11,016,005) | | | 10,709,169 | |
| | | | | |
| COMMON STOCKS - 0.00%(b) | | | | |
| Brazil - 0.00%(b) | | | | |
| | 1,051 | | | Oi SA(c) | | | 273 | |
| United States - 0.00%(b) | | | | |
| | 259,482 | | | Pershing Square Tontine Holdings(c)(d) | | | – | |
| | 11,202 | | | Riverbed Tech Class B-1 Partnership Units(c) | | | 1,459 | |
| | | | | | | | | |
| TOTAL COMMON STOCKS | | | | |
| (Cost $111,767) | | | 1,732 | |
| | | | | |
| OPEN-END FUNDS - 2.88% | | | | |
| United States - 2.88% | | | | |
| | 4,137,441 | | | RiverNorth/Oaktree High Income Fund, Class I(e) | | | 36,877,835 | |
| | | | | | | | | |
| TOTAL OPEN-END FUNDS | | | | |
| (Cost $38,513,528) | | | 36,877,835 | |
| | | | | |
| PREFERRED STOCKS - 0.19% | | | | |
| United States - 0.19% | | | | |
| | 100,000 | | | CION Investment Corp., 7.500%, 12/30/2029 | | | 2,500,000 | |
| | | | | | | | | |
| TOTAL PREFERRED STOCKS | | | | |
| (Cost $2,500,000) | | | 2,500,000 | |
See Notes to Financial Statements and Financial Highlights.
| 6 | (888) 848-7569 | www.rivernorth.com |
| RiverNorth/DoubleLine Strategic Income Fund | Schedule of Investments |
September 30, 2024
| Principal Amount/Description | | Rate | | | Maturity | | Value | |
| BUSINESS DEVELOPMENT COMPANY NOTES - 0.16% | | | | | | |
| United States - 0.16% | | | | | | | | | |
| $ | 2,300,000 | | | Golub Capital BDC, Inc. | | 2.05% | | | 02/15/2027 | | $ | 2,124,526 | |
| | | | | | | | | | | | | | |
| TOTAL BUSINESS DEVELOPMENT COMPANY NOTES | | | | | | | | | |
| (Cost $2,030,403) | | | | | | | | 2,124,526 | |
| | | | | | | | | | |
| FOREIGN CORPORATE BONDS - 2.20% | | | | | | | | | |
| Australia - 0.25% | | | | | | | | | | | | |
| | 1,000,000 | | | APA Infrastructure, Ltd.(f) | | 4.25% | | | 07/15/2027 | | | 1,000,268 | |
| | 220,000 | | | Atlassian Corp. | | 5.25% | | | 05/15/2029 | | | 227,566 | |
| | 265,000 | | | Commonwealth Bank of Australia(f) | | 4.32% | | | 01/10/2048 | | | 233,071 | |
| | 475,000 | | | National Australia Bank, Ltd.(f) | | 2.99% | | | 05/21/2031 | | | 422,737 | |
| | 340,000 | | | NBN Co., Ltd.(f) | | 1.45% | | | 05/05/2026 | | | 325,471 | |
| | 500,000 | | | Sydney Airport Finance Co. Pty, Ltd.(f) | | 3.38% | | | 04/30/2025 | | | 495,556 | |
| | 500,000 | | | Sydney Airport Finance Co. Pty, Ltd.(f) | | 3.63% | | | 04/28/2026 | | | 493,723 | |
| | | | | | | | | | | | | 3,198,392 | |
| Brazil - 0.10% | | | | | | | | | | | | |
| | | | | | | | | | | | | |
| | 200,000 | | | Banco do Brasil SA(a)(g) | | 6.25% | | | Perpetual Maturity | | | 203,259 | |
| | 200,000 | | | CSN Resources SA(g) | | 5.88% | | | 04/08/2032 | | | 170,561 | |
| | 165,630 | | | Guara Norte Sarl(g) | | 5.20% | | | 06/15/2034 | | | 157,884 | |
| | 236,654 | | | Oi SA(f)(h) | | 10.00% (13.50%) | | | 06/30/2027 | | | 205,889 | |
| | 524,745 | | | Oi SA(f)(h) | | 8.50% (8.50%) | | | 12/31/2028 | | | 52,474 | |
| | 207,737 | | | Prumo Participacoes e Investimentos S/A(g) | | 7.50% | | | 12/31/2031 | | | 208,761 | |
| | 700,000 | | | Unigel Luxembourg SA(g)(i) | | 8.75% | | | 10/01/2026 | | | 175,980 | |
| | 103,000 | | | Vale Overseas, Ltd. | | 6.40% | | | 06/28/2054 | | | 108,606 | |
| | | | | | | | | | | | | 1,283,414 | |
| Canada - 0.24% | | | | | | | | | | | | |
| | 13,000 | | | 1375209 BC, Ltd.(f) | | 9.00% | | | 01/30/2028 | | | 12,896 | |
| | 420,000 | | | Bank of Montreal(j) | | 3.80% | | | 12/15/2032 | | | 408,227 | |
| | 170,000 | | | Bausch + Lomb Corp.(f) | | 8.38% | | | 10/01/2028 | | | 179,987 | |
| | 50,000 | | | Bausch Health Cos., Inc.(f) | | 6.13% | | | 02/01/2027 | | | 45,204 | |
| | 4,000 | | | Bausch Health Cos., Inc.(f) | | 14.00% | | | 10/15/2030 | | | 3,657 | |
| | 95,000 | | | Bombardier, Inc.(f) | | 8.75% | | | 11/15/2030 | | | 104,436 | |
| | 25,000 | | | Bombardier, Inc.(f) | | 7.00% | | | 06/01/2032 | | | 26,179 | |
| | 1,000,000 | | | Canacol Energy, Ltd.(g) | | 5.75% | | | 11/24/2028 | | | 529,786 | |
| | 210,000 | | | CCL Industries, Inc.(f) | | 3.05% | | | 06/01/2030 | | | 192,792 | |
See Notes to Financial Statements and Financial Highlights.
| Annual Report | September 30, 2024 | 7 |
| RiverNorth/DoubleLine Strategic Income Fund | Schedule of Investments |
September 30, 2024
| Principal Amount/Description | | Rate | | | Maturity | | Value | |
| $ | 255,000 | | | Element Fleet Management Corp.(f) | | 6.32% | | | 12/04/2028 | | $ | 271,870 | |
| | 150,000 | | | Garda World Security Corp.(f) | | 6.00% | | | 06/01/2029 | | | 144,093 | |
| | 140,000 | | | Husky Injection Molding Systems, Ltd. / Titan Co.- Borrower LLC(f) | | 9.00% | | | 02/15/2029 | | | 146,267 | |
| | 60,000 | | | Kronos Acquisition Holdings, Inc.(f) | | 8.25% | | | 06/30/2031 | | | 60,302 | |
| | 70,000 | | | Mattamy Group Corp.(f) | | 4.63% | | | 03/01/2030 | | | 67,076 | |
| | 105,000 | | | Royal Bank of Canada | | 5.15% | | | 02/01/2034 | | | 109,238 | |
| | 750,000 | | | TransCanada PipeLines, Ltd. | | 4.63% | | | 03/01/2034 | | | 740,328 | |
| | | | | | | | | | | | | 3,042,338 | |
| Cayman Islands - 0.14% | | | | | | | | | |
| | 900,000 | | | Alpha Holding Escrow Shares(a)(d)(k) | | | | | Perpetual Maturity | | | 0 | |
| | 200,000 | | | Banco Mercantil del Norte SA/Grand Cayman(a)(g)(j) | | 7.63% | | | Perpetual Maturity | | | 201,626 | |
| | 126,736 | | | Bioceanico Sovereign Certificate, Ltd.(g)(l) | | 0.00% | | | 06/05/2034 | | | 99,813 | |
| | 200,000 | | | Cosan Overseas, Ltd.(a) | | 8.25% | | | Perpetual Maturity | | | 205,312 | |
| | 255,000 | | | Global Aircraft Leasing Co., Ltd.(f) | | 8.75% | | | 09/01/2027 | | | 259,081 | |
| | 93,324 | | | Interoceanica IV Finance, Ltd.(g)(l) | | 0.00% | | | 11/30/2025 | | | 89,124 | |
| | 200,000 | | | Itau Unibanco Holding SA Island(a)(g)(j) | | 5Y US TI + 3.22% | | | Perpetual Maturity | | | 195,261 | |
| | 126,438 | | | Lima Metro Line 2 Finance, Ltd.(f) | | 5.88% | | | 07/05/2034 | | | 128,540 | |
| | 252,875 | | | Lima Metro Line 2 Finance, Ltd.(g) | | 5.88% | | | 07/05/2034 | | | 257,080 | |
| | 320,014 | | | Rutas 2 & 7 Finance, Ltd.(g)(l) | | 0.00% | | | 09/30/2036 | | | 231,962 | |
| | 102,000 | | | Transocean Poseidon, Ltd.(f) | | 6.88% | | | 02/01/2027 | | | 102,112 | |
| | | | | | | | | | | | | 1,769,911 | |
| Chile - 0.18% | | | | | | | | | | | | |
| | 200,000 | | | CAP SA(g) | | 3.90% | | | 04/27/2031 | | | 164,500 | |
| | 197,619 | | | Chile Electricity PEC SpA(l)(g) | | 0.00% | | | 01/25/2028 | | | 163,036 | |
| | 900,000 | | | Empresa de Transporte de Pasajeros Metro SA(f) | | 5.00% | | | 01/25/2047 | | | 831,013 | |
| | 441,300 | | | GNL Quintero SA(g) | | 4.63% | | | 07/31/2029 | | | 439,429 | |
| | 750,000 | | | Transelec SA(g) | | 3.88% | | | 01/12/2029 | | | 722,727 | |
| | | | | | | | | | | | | 2,320,705 | |
| Colombia - 0.09% | | | | | | | | | |
| | 200,000 | | | Banco Davivienda SA(a)(f)(j) | | 10Y US TI + 5.10% | | | Perpetual Maturity | | | 171,659 | |
| | 300,000 | | | Bancolombia SA(j) | | 5Y US TI + 4.32% | | | 12/24/2034 | | | 322,282 | |
| | 500,000 | | | Ecopetrol SA | | 5.88% | | | 11/02/2051 | | | 363,786 | |
| | 200,000 | | | Empresas Publicas de Medellin ESP(g) | | 4.25% | | | 07/18/2029 | | | 183,110 | |
See Notes to Financial Statements and Financial Highlights.
| 8 | (888) 848-7569 | www.rivernorth.com |
| RiverNorth/DoubleLine Strategic Income Fund | Schedule of Investments |
September 30, 2024
| Principal Amount/Description | | Rate | | | Maturity | | Value | |
| $ | 171,860 | | | Fideicomiso PA Pacifico Tres(g) | | 8.25% | | | 01/15/2035 | | $ | 172,289 | |
| | | | | | | | | | | | | 1,213,126 | |
| France - 0.02% | | | | | | | | | | | | |
| | 265,000 | | | Credit Agricole SA(f)(j) | | 1D US SOFR + 1.69% | | | 01/10/2030 | | | 272,785 | |
| | | | | | | | | | | | | | |
| Great Britain - 0.16% | | | | | | | | | |
| | 313,000 | | | Barclays PLC(j) | | 1D US SOFR + 1.56% | | | 09/10/2030 | | | 315,669 | |
| | 655,000 | | | HSBC Holdings PLC(j) | | 3M SOFR + 1.64% | | | 09/12/2026 | | | 660,885 | |
| | 128,000 | | | Macquarie Airfinance Holdings, Ltd.(f) | | 6.40% | | | 03/26/2029 | | | 133,315 | |
| | 34,000 | | | Macquarie Airfinance Holdings, Ltd.(f) | | 5.15% | | | 03/17/2030 | | | 34,103 | |
| | 50,000 | | | Macquarie Airfinance Holdings, Ltd.(f) | | 6.50% | | | 03/26/2031 | | | 52,811 | |
| | 260,000 | | | NatWest Markets PLC(f) | | 5.41% | | | 05/17/2029 | | | 270,504 | |
| | 575,000 | | | Weir Group PLC(f) | | 2.20% | | | 05/13/2026 | | | 553,453 | |
| | | | | | | | | | | | | 2,020,740 | |
| Guatemala - 0.02% | | | | | | | | | | | | |
| | 300,000 | | | Banco Industrial SA/Guatemala(g)(j) | | 5Y US TI + 4.44% | | | 01/29/2031 | | | 296,064 | |
| | | | | | | | | | | | | | |
| India - 0.13% | | | | | | | | | | | | |
| | 332,000 | | | Adani International Container Terminal Pvt, Ltd.(g) | | 3.00% | | | 02/16/2031 | | | 294,534 | |
| | 200,000 | | | Adani Ports & Special Economic Zone, Ltd.(g) | | 4.38% | | | 07/03/2029 | | | 189,230 | |
| | 200,000 | | | Adani Transmission Step-One, Ltd.(g) | | 4.00% | | | 08/03/2026 | | | 194,126 | |
| | 152,000 | | | JSW Hydro Energy, Ltd.(g) | | 4.13% | | | 05/18/2031 | | | 138,929 | |
| | 200,000 | | | JSW Infrastructure, Ltd.(g) | | 4.95% | | | 01/21/2029 | | | 194,774 | |
| | 200,000 | | | Network i2i, Ltd.(a)(g)(j) | | 5Y US TI + 4.27% | | | Perpetual Maturity | | | 200,551 | |
| | 250,000 | | | Reliance Industries, Ltd.(g) | | 4.13% | | | 01/28/2025 | | | 249,247 | |
| | 188,000 | | | Vedanta Resources, Ltd.(g) | | 13.88% | | | 12/09/2028 | | | 192,926 | |
| | | | | | | | | | | | | 1,654,317 | |
| Indonesia - 0.05% | | | | | | | | | | | | |
| | 200,000 | | | Freeport Indonesia PT(g) | | 4.76% | | | 04/14/2027 | | | 201,651 | |
| | 200,000 | | | Indonesia Asahan Aluminium PT / Mineral Industri Indonesia Persero PT(g) | | 4.75% | | | 05/15/2025 | | | 199,643 | |
| | 200,000 | | | Pertamina Persero PT(g) | | 1.40% | | | 02/09/2026 | | | 191,681 | |
| | | | | | | | | | | | | 592,975 | |
See Notes to Financial Statements and Financial Highlights.
| Annual Report | September 30, 2024 | 9 |
| RiverNorth/DoubleLine Strategic Income Fund | Schedule of Investments |
September 30, 2024
| Principal Amount/Description | | Rate | | | Maturity | | Value | |
| Ireland - 0.18% | | | | | | | | |
| $ | 190,000 | | | AerCap Ireland Capital DAC / AerCap Global Aviation Trust | | 5.10% | | | 01/19/2029 | | $ | 194,271 | |
| | 300,000 | | | AerCap Ireland Capital DAC / AerCap Global Aviation Trust(j) | | 5Y US TI + 2.72% | | | 03/10/2055 | | | 311,142 | |
| | 340,000 | | | AIB Group PLC(f)(j) | | 1D US SOFR + 1.91% | | | 03/28/2035 | | | 358,595 | |
| | 239,000 | | | Avolon Holdings Funding, Ltd.(f) | | 5.75% | | | 03/01/2029 | | | 246,459 | |
| | 295,000 | | | Avolon Holdings Funding, Ltd.(f) | | 5.75% | | | 11/15/2029 | | | 304,580 | |
| | 120,000 | | | GGAM Finance, Ltd.(f) | | 6.88% | | | 04/15/2029 | | | 125,134 | |
| | 200,000 | | | Icon Investments Six DAC | | 5.85% | | | 05/08/2029 | | | 210,277 | |
| | 200,000 | | | Icon Investments Six DAC | | 6.00% | | | 05/08/2034 | | | 212,861 | |
| | 280,000 | | | Smurfit Kappa Treasury ULC(f) | | 5.20% | | | 01/15/2030 | | | 289,574 | |
| | | | | | | | | | | | | 2,252,893 | |
| Isle Of Man - 0.02% | | | | | | | | | |
| | 200,000 | | | Gold Fields Orogen Holdings BVI, Ltd.(g) | | 6.13% | | | 05/15/2029 | | | 209,997 | |
| | | | | | | | | | | | | |
| Jamaica - 0.00%(b) | | | | | | | | | | | | |
| | 36,968 | | | Digicel Group Holdings, Ltd.(f)(l) | | 0.00% | | | 12/31/2030 | | | 4,735 | |
| | 802 | | | Digicel Group Holdings, Ltd.(f)(l) | | 0.00% | | | 12/31/2030 | | | 793 | |
| | 97,752 | | | Digicel Group Holdings, Ltd.(f)(l) | | 0.00% | | | 12/31/2030 | | | 1,357 | |
| | | | | | | | | | | | | 6,885 | |
| Japan - 0.06% | | | | | | | | | | | | |
| | 265,000 | | | Mitsubishi UFJ Financial Group, Inc.(j) | | 1Y US TI + 1.00% | | | 04/17/2035 | | | 278,709 | |
| | 510,000 | | | Renesas Electronics Corp.(f) | | 2.17% | | | 11/25/2026 | | | 485,947 | |
| | | | | | | | | | | | | 764,656 | |
| Luxembourg - 0.06% | | | | | | | | | |
| | 142,000 | | | ArcelorMittal SA | | 6.00% | | | 06/17/2034 | | | 150,776 | |
| | 180,000 | | | Millicom International Cellular SA(g) | | 6.63% | | | 10/15/2026 | | | 180,167 | |
| | 400,000 | | | Simpar Europe SA(g) | | 5.20% | | | 01/26/2031 | | | 332,246 | |
| | 175,336 | | | Tierra Mojada Luxembourg II Sarl(g) | | 5.75% | | | 12/01/2040 | | | 166,654 | |
| | | | | | | | | | | | | 829,843 | |
| Mexico - 0.12% | | | | | | | | | |
| | 659,912 | | | Alpha Holding SA de CV(f)(i) | | 9.00% | | | 02/10/2025 | | | 3,610 | |
| | 188,546 | | | Alpha Holding SA de CV(i)(g) | | 9.00% | | | 02/10/2025 | | | 1,031 | |
| | 200,000 | | | Buffalo Energy Mexico Holdings / Buffalo Energy Infrastructure / Buffalo Energy(f) | | 7.88% | | | 02/15/2039 | | | 213,317 | |
| | 200,000 | | | Cemex SAB de CV(a)(g)(j) | | 5Y US TI + 4.53% | | | Perpetual Maturity | | | 197,126 | |
| | 200,000 | | | Comision Federal de Electricidad(f) | | 6.45% | | | 01/24/2035 | | | 199,450 | |
See Notes to Financial Statements and Financial Highlights.
| 10 | (888) 848-7569 | www.rivernorth.com |
| RiverNorth/DoubleLine Strategic Income Fund | Schedule of Investments |
September 30, 2024
| Principal Amount/Description | | Rate | | | Maturity | | | Value | |
| $ | 500,000 | | | Credito Real SAB de CV SOFOM ER(g)(i) | | 9.50% | | | 02/07/2026 | | | $ | 51,550 | |
| | 200,000 | | | Electricidad Firme de Mexico Holdings SA de CV(g) | | 4.90% | | | 11/20/2026 | | | | 194,854 | |
| | 200,000 | | | FIEMEX Energia - Banco Actinver SA Institucion de Banca Multiple(f) | | 7.25% | | | 01/31/2041 | | | | 208,890 | |
| | 600,000 | | | Mexarrend SAPI de CV(f)(i) | | 10.25% | | | 07/24/2024 | | | | 30,600 | |
| | 200,000 | | | Mexarrend SAPI de CV(g)(i) | | 10.25% | | | 07/24/2024 | | | | 10,200 | |
| | 120,969 | | | Mexico Generadora de Energia S de rl(g) | | 5.50% | | | 12/06/2032 | | | | 120,899 | |
| | 700,000 | | | Operadora de Servicios Mega SA de CV Sofom ER(f) | | 8.25% | | | 02/11/2025 | | | | 245,000 | |
| | 150,000 | | | Petroleos Mexicanos | | 6.75% | | | 09/21/2047 | | | | 107,575 | |
| | | | | | | | | | | | | | 1,584,102 | |
| Netherlands - 0.05% | | | | | | | | | | |
| | 300,000 | | | Braskem Netherlands Finance BV(g) | | 5Y US TI + 8.22% | | | 01/23/2081 | | | | 300,515 | |
| | 200,000 | | | MEGlobal BV(g) | | 4.25% | | | 11/03/2026 | | | | 197,811 | |
| | 157,660 | | | MV24 Capital BV(g) | | 6.75% | | | 06/01/2034 | | | | 154,276 | |
| | | | | | | | | | | | | | 652,602 | |
| Panama - 0.01% | | | | | | | | | | |
| | 200,000 | | | Empresa de Transmision Electrica SA(g) | | 5.13% | | | 05/02/2049 | | | | 158,066 | |
| | | | | | | | | | | | | | | |
| Paraguay - 0.01% | | | | | | | | | | |
| | 150,000 | | | Banco Continental SAECA(g) | | 2.75% | | | 12/10/2025 | | | | 145,472 | |
| | | | | | | | | | | | | | | |
| Peru - 0.12% | | | | | | | | | | |
| | 90,000 | | | Banco de Credito del Peru S.A.(g)(j) | | 5Y US TI + 3.13% | | | 07/01/2030 | | | | 87,976 | |
| | 150,000 | | | Banco de Credito del Peru S.A.(g)(j) | | 5Y US TI + 2.45% | | | 09/30/2031 | | | | 142,358 | |
| | 200,000 | | | Banco Internacional del Peru SAA Interbank(g) | | 1Y US TI + 3.71% | | | 07/08/2030 | | | | 196,876 | |
| | 200,000 | | | Cia de Minas Buenaventura SAA(g) | | 5.50% | | | 07/23/2026 | | | | 197,503 | |
| | 200,000 | | | InRetail Consumer(g) | | 3.25% | | | 03/22/2028 | | | | 187,744 | |
| | 200,000 | | | InRetail Shopping Malls(g) | | 5.75% | | | 04/03/2028 | | | | 201,560 | |
| | 200,000 | | | Intercorp Financial Services, Inc.(g) | | 4.13% | | | 10/19/2027 | | | | 193,414 | |
| | 200,000 | | | Orazul Energy Peru SA(g) | | 5.63% | | | 04/28/2027 | | | | 196,955 | |
| | 200,000 | | | Petroleos del Peru SA(g) | | 4.75% | | | 06/19/2032 | | | | 158,233 | |
| | | | | | | | | | | | | | 1,562,619 | |
| Singapore - 0.08% | | | | | | | | | | |
| | 200,000 | | | DBS Group Holdings, Ltd.(j) | | 5Y US TI + 1.10% | | | 03/10/2031 | | | | 192,324 | |
See Notes to Financial Statements and Financial Highlights.
| Annual Report | September 30, 2024 | 11 |
| RiverNorth/DoubleLine Strategic Income Fund | Schedule of Investments |
September 30, 2024
| Principal Amount/Description | | Rate | | | Maturity | | | Value | |
| $ | 200,000 | | | Medco Laurel Tree Pte, Ltd.(g) | | 6.95% | | | 11/12/2028 | | | $ | 200,211 | |
| | 200,000 | | | Oversea-Chinese Banking Corp., Ltd.(g)(j) | | 5Y US TI + 1.58% | | | 09/10/2030 | | | | 194,305 | |
| | 193,000 | | | Pfizer Investment Enterprises Pte, Ltd. | | 4.75% | | | 05/19/2033 | | | | 196,792 | |
| | 200,000 | | | United Overseas Bank, Ltd.(j) | | 5Y US TI + 1.75% | | | 03/16/2031 | | | | 191,736 | |
| | | | | | | | | | | | | | 975,368 | |
| Spain - 0.07% | | | | | | | | | | |
| | 250,000 | | | AL Candelaria -spain- SA(g) | | 5.75% | | | 06/15/2033 | | | | 204,787 | |
| | 400,000 | | | Banco Santander SA(j) | | 1Y US TI + 0.95% | | | 07/15/2028 | | | | 409,527 | |
| | 261,000 | | | CaixaBank SA(f)(j) | | 1D US SOFR + 2.26% | | | 06/15/2035 | | | | 277,489 | |
| | | | | | | | | | | | | | 891,803 | |
| Switzerland - 0.02% | | | | | | | | | | |
| | 200,000 | | | UBS Group AG(f)(j) | | | | | 09/06/2045 | | | | 204,730 | |
| | | | | | | | | | | | | | | |
| Vietnam - 0.02% | | | | | | | | | | |
| | 210,820 | | | Mong Duong Finance Holdings BV(g) | | 5.13% | | | 05/07/2029 | | | | 204,739 | |
| | | | | | | | | | | |
| TOTAL FOREIGN CORPORATE BONDS | | | | | | | | | | |
| (Cost $31,222,076) | | | | | | | | | 28,108,542 | |
| | | | | | | | | | | | | | | |
| U.S. CORPORATE BONDS - 11.29% | | | | | | | | | | |
| Advertising - 0.00%(b) | | | | | | | | | | |
| | 50,000 | | | Clear Channel Outdoor Holdings, Inc.(f) | | 7.50% | | | 06/01/2029 | | | | 43,106 | |
| | | | | | | | | | | | | | | |
| Aerospace/Defense - 0.03% | | | | | | | | | | |
| | 70,000 | | | AAR Escrow Issuer LLC(f) | | 6.75% | | | 03/15/2029 | | | | 72,862 | |
| | 99,000 | | | Howmet Aerospace, Inc. | | 4.85% | | | 10/15/2031 | | | | 101,117 | |
| | 265,000 | | | Northrop Grumman Corp. | | 5.20% | | | 06/01/2054 | | | | 270,087 | |
| | | | | | | | | | | | | | 444,066 | |
| Agriculture - 0.06% | | | | | | | | | | |
| | 237,000 | | | BAT Capital Corp. | | 4.54% | | | 08/15/2047 | | | | 200,318 | |
| | 340,000 | | | Bunge, Ltd. Finance Corp. | | 4.65% | | | 09/17/2034 | | | | 339,398 | |
| | 265,000 | | | Philip Morris International, Inc. | | 5.25% | | | 02/13/2034 | | | | 275,306 | |
| | | | | | | | | | | | | | 815,022 | |
| Airlines - 0.02% | | | | | | | | | | |
| | 70,000 | | | American Airlines, Inc.(f) | | 7.25% | | | 02/15/2028 | | | | 71,716 | |
| | 120,000 | | | American Airlines, Inc.(f) | | 8.50% | | | 05/15/2029 | | | | 127,397 | |
| | 80,000 | | | JetBlue Airways Corp. / JetBlue Loyalty LP(f) | | 9.88% | | | 09/20/2031 | | | | 84,343 | |
| | | | | | | | | | | | | | 283,456 | |
See Notes to Financial Statements and Financial Highlights.
| 12 | (888) 848-7569 | www.rivernorth.com |
| RiverNorth/DoubleLine Strategic Income Fund | Schedule of Investments |
September 30, 2024
| Principal Amount/Description | | Rate | | | Maturity | | | Value | |
| Auto Manufacturers - 0.10% | | | | | | | | | | |
| $ | 120,000 | | | Cummins, Inc. | | 5.45% | | | 02/20/2054 | | | $ | 127,039 | |
| | 320,000 | | | Ford Motor Co. | | 3.25% | | | 02/12/2032 | | | | 272,624 | |
| | 315,000 | | | General Motors Financial Co., Inc. | | 3.10% | | | 01/12/2032 | | | | 275,665 | |
| | 530,000 | | | Hyundai Capital America(f) | | 5.30% | | | 01/08/2029 | | | | 544,802 | |
| | | | | | | | | | | | | | 1,220,130 | |
| Auto Parts & Equipment - 0.02% | | | | | | | | | | |
| | 300,000 | | | ZF North America Capital, Inc.(f) | | 6.88% | | | 04/23/2032 | | | | 301,246 | |
| | | | | | | | | | | | | | | |
| Banks - 0.45% | | | | | | | | | | |
| | 205,000 | | | Bank of America Corp.(j) | | 1D US SOFR + 1.21% | | | 10/20/2032 | | | | 179,808 | |
| | 210,000 | | | Bank of America Corp.(j) | | 1D US SOFR + 1.65% | | | 01/23/2035 | | | | 220,917 | |
| | 590,000 | | | Bank of America Corp.(j) | | 5Y US TI + 2.48% | | | 09/21/2036 | | | | 498,035 | |
| | 239,000 | | | Bank of New York Mellon Corp.(j) | | 1D US SOFR + 1.23% | | | 07/22/2032 | | | | 247,377 | |
| | 120,000 | | | Citigroup, Inc.(j) | | 1D US SOFR + 1.28% | | | 02/24/2028 | | | | 116,647 | |
| | 280,000 | | | Citigroup, Inc.(j) | | 5Y US TI + 1.73% | | | 09/19/2039 | | | | 279,317 | |
| | 90,000 | | | Citizens Financial Group, Inc.(j) | | 1D US SOFR + 2.33% | | | 04/25/2035 | | | | 98,846 | |
| | 590,000 | | | Goldman Sachs Group, Inc.(j) | | 3M SOFR + 1.43% | | | 05/15/2026 | | | | 593,408 | |
| | 175,000 | | | Goldman Sachs Group, Inc.(j) | | 1D US SOFR + 0.82% | | | 09/10/2027 | | | | 174,875 | |
| | 259,000 | | | Goldman Sachs Group, Inc.(j) | | 1D US SOFR + 1.55% | | | 07/23/2035 | | | | 268,396 | |
| | 165,000 | | | JPMorgan Chase & Co.(j) | | 1D US SOFR + 0.92% | | | 02/24/2026 | | | | 163,393 | |
| | 85,000 | | | JPMorgan Chase & Co.(j) | | 1D US SOFR + 1.99% | | | 07/25/2028 | | | | 86,499 | |
| | 240,000 | | | JPMorgan Chase & Co.(j) | | 1D SOFR + 1.02% | | | 06/01/2029 | | | | 222,110 | |
| | 345,000 | | | JPMorgan Chase & Co.(j) | | 1D US SOFR + 2.04% | | | 04/22/2031 | | | | 313,511 | |
| | 290,000 | | | JPMorgan Chase & Co.(j) | | 3M SOFR + 1.25% | | | 04/22/2032 | | | | 258,760 | |
| | 290,000 | | | JPMorgan Chase & Co.(j) | | 1D US SOFR + 1.26% | | | 01/25/2033 | | | | 261,075 | |
| | 205,000 | | | Morgan Stanley(j) | | 1D US SOFR + 1.67% | | | 07/17/2026 | | | | 204,761 | |
| | 215,000 | | | Morgan Stanley(j) | | 1D US SOFR + 1.61% | | | 04/20/2028 | | | | 214,609 | |
| | 95,000 | | | Morgan Stanley(j) | | 1D US SOFR + 1.29% | | | 01/21/2033 | | | | 84,886 | |
| | 272,000 | | | Truist Financial Corp.(j) | | 1D US SOFR + 1.57% | | | 08/05/2032 | | | | 278,671 | |
See Notes to Financial Statements and Financial Highlights.
| Annual Report | September 30, 2024 | 13 |
| RiverNorth/DoubleLine Strategic Income Fund | Schedule of Investments |
September 30, 2024
| Principal Amount/Description | | Rate | | | Maturity | | | Value | |
| $ | 275,000 | | | Wells Fargo & Co.(j) | | 1D US SOFR + 1.98% | | | 07/25/2028 | | | $ | 278,274 | |
| | 270,000 | | | Wells Fargo & Co.(j) | | 1D US SOFR + 1.43% | | | 10/30/2030 | | | | 250,536 | |
| | 370,000 | | | Wells Fargo & Co.(j) | | 1D US SOFR + 2.06% | | | 10/23/2034 | | | | 413,608 | |
| | | | | | | | | | | | | | 5,708,319 | |
| Beverages - 0.02% | | | | | | | | | | |
| | 260,000 | | | Keurig Dr Pepper, Inc. | | 5.20% | | | 03/15/2031 | | | | 271,556 | |
| | | | | | | | | | | | | | | |
| Biotechnology - 0.07% | | | | | | | | | | |
| | 397,000 | | | Amgen, Inc. | | 5.75% | | | 03/02/2063 | | | | 419,378 | |
| | 150,000 | | | Gilead Sciences, Inc. | | 5.55% | | | 10/15/2053 | | | | 161,162 | |
| | 270,000 | | | Royalty Pharma PLC | | 5.40% | | | 09/02/2034 | | | | 277,094 | |
| | | | | | | | | | | | | | 857,634 | |
| Building Materials - 0.07% | | | | | | | | | | |
| | 150,000 | | | Builders FirstSource, Inc.(f) | | 6.38% | | | 03/01/2034 | | | | 155,940 | |
| | 120,000 | | | Cornerstone Building Brands, Inc.(f) | | 9.50% | | | 08/15/2029 | | | | 123,369 | |
| | 120,000 | | | EMRLD Borrower LP / Emerald Co.-Issuer, Inc.(f) | | 6.63% | | | 12/15/2030 | | | | 123,881 | |
| | 65,000 | | | EMRLD Borrower LP / Emerald Co.-Issuer, Inc.(f) | | 6.75% | | | 07/15/2031 | | | | 67,840 | |
| | 130,000 | | | Griffon Corp. | | 5.75% | | | 03/01/2028 | | | | 128,480 | |
| | 120,000 | | | Miter Brands Acquisition Holdco, Inc. / MIWD Borrower LLC(f) | | 6.75% | | | 04/01/2032 | | | | 124,470 | |
| | 125,000 | | | Owens Corning | | 5.70% | | | 06/15/2034 | | | | 132,780 | |
| | 60,000 | | | Standard Building Solutions, Inc.(f) | | 6.50% | | | 08/15/2032 | | | | 62,178 | |
| | | | | | | | | | | | | | 918,938 | |
| Chemicals - 0.08% | | | | | | | | | | |
| | 25,000 | | | Avient Corp.(f) | | 6.25% | | | 11/01/2031 | | | | 25,648 | |
| | 285,000 | | | CF Industries, Inc. | | 5.38% | | | 03/15/2044 | | | | 280,790 | |
| | 125,000 | | | Illuminate Buyer LLC / Illuminate Holdings IV, Inc.(f) | | 9.00% | | | 07/01/2028 | | | | 126,496 | |
| | 264,000 | | | LYB International Finance III LLC | | 5.50% | | | 03/01/2034 | | | | 274,790 | |
| | 250,000 | | | Mosaic Co. | | 5.38% | | | 11/15/2028 | | | | 259,134 | |
| | 75,000 | | | WR Grace Holdings LLC(f) | | 5.63% | | | 08/15/2029 | | | | 70,529 | |
| | | | | | | | | | | | | | 1,037,387 | |
| Commercial Services - 0.12% | | | | | | | | | | |
| | 155,000 | | | Allied Universal Holdco LLC(f) | | 7.88% | | | 02/15/2031 | | | | 158,464 | |
| | 70,000 | | | Allied Universal Holdco LLC / Allied Universal Finance Corp.(f) | | 9.75% | | | 07/15/2027 | | | | 70,217 | |
See Notes to Financial Statements and Financial Highlights.
| 14 | (888) 848-7569 | www.rivernorth.com |
| RiverNorth/DoubleLine Strategic Income Fund | Schedule of Investments |
September 30, 2024
| Principal Amount/Description | | Rate | | | Maturity | | | Value | |
| $ | 260,000 | | | Global Payments, Inc. | | 4.95% | | | 08/15/2027 | | | $ | 264,373 | |
| | 105,000 | | | Mavis Tire Express Services Topco Corp.(f) | | 6.50% | | | 05/15/2029 | | | | 100,982 | |
| | 273,000 | | | Quanta Services, Inc. | | 5.25% | | | 08/09/2034 | | | | 279,252 | |
| | 200,000 | | | Triton Container International, Ltd. / TAL International Container Corp. | | 3.25% | | | 03/15/2032 | | | | 173,008 | |
| | 267,000 | | | Verisk Analytics, Inc. | | 5.25% | | | 06/05/2034 | | | | 275,918 | |
| | 65,000 | | | VT Topco, Inc.(f) | | 8.50% | | | 08/15/2030 | | | | 69,416 | |
| | 75,000 | | | Wand NewCo 3, Inc.(f) | | 7.63% | | | 01/30/2032 | | | | 79,064 | |
| | 50,000 | | | WASH Multifamily Acquisition, Inc.(f) | | 5.75% | | | 04/15/2026 | | | | 49,774 | |
| | | | | | | | | | | | | | 1,520,468 | |
| Computers - 0.10% | | | | | | | | | | |
| | 75,000 | | | Amentum Escrow Corp.(f) | | 7.25% | | | 08/01/2032 | | | | 78,341 | |
| | 679,000 | | | Hewlett Packard Enterprise Co. | | 5.00% | | | 10/15/2034 | | | | 672,500 | |
| | 350,000 | | | Kyndryl Holdings, Inc. | | 4.10% | | | 10/15/2041 | | | | 282,352 | |
| | 249,000 | | | NetApp, Inc. | | 1.88% | | | 06/22/2025 | | | | 243,875 | |
| | | | | | | | | | | | | | 1,277,068 | |
| Distribution/Wholesale - 0.02% | | | | | | | | | | |
| | 180,000 | | | BCPE Empire Holdings, Inc.(f) | | 7.63% | | | 05/01/2027 | | | | 180,755 | |
| | 75,000 | | | Dealer Tire LLC / DT Issuer LLC(f) | | 8.00% | | | 02/01/2028 | | | | 74,727 | |
| | | | | | | | | | | | | | 255,482 | |
| Diversified Financial Services - 0.12% | | | | | | | | | | |
| | 415,000 | | | Aviation Capital Group LLC(f) | | 1.95% | | | 09/20/2026 | | | | 393,296 | |
| | 196,000 | | | Aviation Capital Group LLC(f) | | 5.38% | | | 07/15/2029 | | | | 200,314 | |
| | 160,000 | | | BlackRock Funding, Inc. | | 5.25% | | | 03/14/2054 | | | | 165,925 | |
| | 352,000 | | | BlackRock Funding, Inc. | | 5.35% | | | 01/08/2055 | | | | 370,832 | |
| | 140,000 | | | Nationstar Mortgage Holdings, Inc.(f) | | 5.75% | | | 11/15/2031 | | | | 137,296 | |
| | 150,000 | | | OneMain Finance Corp. | | 7.50% | | | 05/15/2031 | | | | 154,538 | |
| | 70,000 | | | PennyMac Financial Services, Inc.(f) | | 7.88% | | | 12/15/2029 | | | | 74,704 | |
| | | | | | | | | | | | | | 1,496,905 | |
| Electric - 0.52% | | | | | | | | | | |
| | 155,000 | | | AEP Texas, Inc. | | 5.45% | | | 05/15/2029 | | | | 161,741 | |
| | 55,000 | | | AEP Transmission Co. LLC | | 5.40% | | | 03/15/2053 | | | | 57,068 | |
| | 263,000 | | | Arizona Public Service Co. | | 5.70% | | | 08/15/2034 | | | | 277,796 | |
| | 261,000 | | | Black Hills Corp. | | 6.00% | | | 01/15/2035 | | | | 278,083 | |
| | 417,000 | | | DTE Energy Co. | | 5.85% | | | 06/01/2034 | | | | 447,816 | |
| | 254,000 | | | Duke Energy Corp. | | 5.45% | | | 06/15/2034 | | | | 265,239 | |
| | 325,000 | | | Duke Energy Corp. | | 3.95% | | | 08/15/2047 | | | | 264,323 | |
| | 85,000 | | | Duke Energy Corp. | | 5.00% | | | 08/15/2052 | | | | 80,556 | |
| | 130,000 | | | Entergy Arkansas LLC | | 5.75% | | | 06/01/2054 | | | | 140,240 | |
| | 133,000 | | | Entergy Corp.(j) | | 5Y US TI + 2.67% | | | 12/01/2054 | | | | 138,232 | |
| | 138,000 | | | Entergy Louisiana LLC | | 5.15% | | | 09/15/2034 | | | | 142,251 | |
See Notes to Financial Statements and Financial Highlights.
| Annual Report | September 30, 2024 | 15 |
| RiverNorth/DoubleLine Strategic Income Fund | Schedule of Investments |
September 30, 2024
| Principal Amount/Description | | Rate | | | Maturity | | | Value | |
| $ | 134,000 | | | Eversource Energy | | 5.50% | | | 01/01/2034 | | | $ | 139,182 | |
| | 1,000,000 | | | Exelon Corp. | | 4.05% | | | 04/15/2030 | | | | 985,039 | |
| | 75,000 | | | Lightning Power LLC(f) | | 7.25% | | | 08/15/2032 | | | | 78,930 | |
| | 750,000 | | | NextEra Energy Capital Holdings, Inc. | | 2.44% | | | 01/15/2032 | | | | 651,005 | |
| | 160,000 | | | NextEra Energy Capital Holdings, Inc. | | 5.55% | | | 03/15/2054 | | | | 167,316 | |
| | 59,000 | | | NextEra Energy Capital Holdings, Inc.(j) | | 5Y US TI + 2.46% | | | 06/15/2054 | | | | 63,814 | |
| | 160,000 | | | NRG Energy, Inc.(f) | | 2.00% | | | 12/02/2025 | | | | 154,428 | |
| | 242,000 | | | Pacific Gas and Electric Co. | | 6.95% | | | 03/15/2034 | | | | 275,223 | |
| | 625,000 | | | Pacific Gas and Electric Co. | | 6.75% | | | 01/15/2053 | | | | 713,128 | |
| | 60,000 | | | Pike Corp.(f) | | 8.63% | | | 01/31/2031 | | | | 64,228 | |
| | 85,000 | | | San Diego Gas & Electric Co. | | 5.35% | | | 04/01/2053 | | | | 87,383 | |
| | 265,000 | | | Southern California Edison Co. | | 5.45% | | | 06/01/2031 | | | | 280,515 | |
| | 280,000 | | | Southern Co.(j) | | 5Y US TI + 2.92% | | | 09/15/2051 | | | | 271,501 | |
| | 225,000 | | | Southwestern Electric Power Co. | | 3.25% | | | 11/01/2051 | | | | 155,981 | |
| | 99,000 | | | Virginia Electric and Power Co. | | 5.55% | | | 08/15/2054 | | | | 104,164 | |
| | 85,000 | | | Vistra Operations Co. LLC(f) | | 7.75% | | | 10/15/2031 | | | | 91,576 | |
| | 70,000 | | | Vistra Operations Co. LLC(f) | | 6.88% | | | 04/15/2032 | | | | 73,692 | |
| | | | | | | | | | | | | | 6,610,450 | |
| Electronics - 0.02% | | | | | | | | | | |
| | 220,000 | | | Arrow Electronics, Inc. | | 3.88% | | | 01/12/2028 | | | | 214,943 | |
| | | | | | | | | | | | | | | |
| Engineering & Construction - 0.03% | | | | | | | | | | |
| | 80,000 | | | Brand Industrial Services, Inc.(f) | | 10.38% | | | 08/01/2030 | | | | 85,768 | |
| | 185,000 | | | Jacobs Engineering Group, Inc. | | 5.90% | | | 03/01/2033 | | | | 194,219 | |
| | 90,000 | | | MasTec, Inc. | | 5.90% | | | 06/15/2029 | | | | 94,010 | |
| | | | | | | | | | | | | | 373,997 | |
| Entertainment - 0.05% | | | | | | | | | | |
| | 125,000 | | | Caesars Entertainment, Inc.(f) | | 6.50% | | | 02/15/2032 | | | | 129,380 | |
| | 135,000 | | | Light & Wonder International, Inc.(f) | | 7.25% | | | 11/15/2029 | | | | 139,774 | |
| | 105,000 | | | Midwest Gaming Borrower LLC / Midwest Gaming Finance Corp.(f) | | 4.88% | | | 05/01/2029 | | | | 100,788 | |
| | 100,000 | | | Scientific Games Holdings LP/Scientific Games US FinCo, Inc.(f) | | 6.63% | | | 03/01/2030 | | | | 99,309 | |
| | | | | | | | | | | | | | | |
| | 145,000 | | | Six Flags Entertainment Corp. /Six Flags Theme Parks, Inc.(f) | | 6.63% | | | 05/01/2032 | | | | 150,266 | |
| | | | | | | | | | | | | | 619,517 | |
| Environmental Control - 0.02% | | | | | | | | | | |
| | 70,000 | | | Madison IAQ LLC(f) | | 4.13% | | | 06/30/2028 | | | | 67,608 | |
| | 70,000 | | | Madison IAQ LLC(f) | | 5.88% | | | 06/30/2029 | | | | 68,215 | |
See Notes to Financial Statements and Financial Highlights.
| 16 | (888) 848-7569 | www.rivernorth.com |
| RiverNorth/DoubleLine Strategic Income Fund | Schedule of Investments |
September 30, 2024
| Principal Amount/Description | | Rate | | | Maturity | | | Value | |
| $ | 175,000 | | | Veralto Corp. | | 5.35% | | | 09/18/2028 | | | $ | 182,317 | |
| | | | | | | | | | | | | | 318,140 | |
| Food - 0.07% | | | | | | | | | | |
| | 140,000 | | | Campbell Soup Co. | | 5.40% | | | 03/21/2034 | | | | 146,865 | |
| | 274,000 | | | Kroger Co. | | 4.90% | | | 09/15/2031 | | | | 275,864 | |
| | 110,000 | | | Performance Food Group, Inc.(f) | | 6.13% | | | 09/15/2032 | | | | 112,542 | |
| | 100,000 | | | Post Holdings, Inc.(f) | | 6.38% | | | 03/01/2033 | | | | 101,882 | |
| | 105,000 | | | United Natural Foods, Inc.(f) | | 6.75% | | | 10/15/2028 | | | | 100,247 | |
| | 175,000 | | | US Foods, Inc.(f) | | 5.75% | | | 04/15/2033 | | | | 175,625 | |
| | | | | | | | | | | | | | 913,025 | |
| Gas - 0.02% | | | | | | | | | | |
| | 265,000 | | | NiSource, Inc. | | 5.35% | | | 04/01/2034 | | | | 275,284 | |
| | | | | | | | | | | | | | | |
| Hand/Machine Tools - 0.01% | | | | | | | | | | |
| | 105,000 | | | Regal Rexnord Corp. | | 6.05% | | | 02/15/2026 | | | | 106,665 | |
| | | | | | | | | | | | | | | |
| Healthcare-Products - 0.04% | | | | | | | | | | |
| | 100,000 | | | Medline Borrower LP(f) | | 5.25% | | | 10/01/2029 | | | | 98,192 | |
| | 70,000 | | | Sotera Health Holdings LLC(f) | | 7.38% | | | 06/01/2031 | | | | 72,783 | |
| | 274,000 | | | Zimmer Biomet Holdings, Inc. | | 5.20% | | | 09/15/2034 | | | | 279,145 | |
| | | | | | | | | | | | | | 450,120 | |
| Healthcare-Services - 0.27% | | | | | | | | | | |
| | 425,000 | | | Centene Corp. | | 2.50% | | | 03/01/2031 | | | | 365,660 | |
| | 90,000 | | | CHS/Community Health Systems, Inc.(f) | | 6.00% | | | 01/15/2029 | | | | 87,455 | |
| | 85,000 | | | Elevance Health, Inc. | | 4.55% | | | 05/15/2052 | | | | 75,915 | |
| | 65,000 | | | Fortrea Holdings, Inc.(f) | | 7.50% | | | 07/01/2030 | | | | 65,508 | |
| | 585,000 | | | HCA, Inc. | | 5.25% | | | 06/15/2049 | | | | 555,835 | |
| | 175,000 | | | IQVIA, Inc. | | 6.25% | | | 02/01/2029 | | | | 186,149 | |
| | 680,000 | | | Laboratory Corp. of America Holdings | | 4.80% | | | 10/01/2034 | | | | 672,389 | |
| | 130,000 | | | Legacy LifePoint Health LLC(f) | | 4.38% | | | 02/15/2027 | | | | 127,598 | |
| | 155,000 | | | LifePoint Health, Inc.(f) | | 10.00% | | | 06/01/2032 | | | | 170,596 | |
| | 276,000 | | | Quest Diagnostics, Inc. | | 5.00% | | | 12/15/2034 | | | | 279,643 | |
| | 100,000 | | | Tenet Healthcare Corp. | | 6.25% | | | 02/01/2027 | | | | 100,218 | |
| | 125,000 | | | Tenet Healthcare Corp. | | 6.13% | | | 06/15/2030 | | | | 127,199 | |
| | 305,000 | | | UnitedHealth Group, Inc. | | 5.05% | | | 04/15/2053 | | | | 303,140 | |
| | 90,000 | | | UnitedHealth Group, Inc. | | 4.95% | | | 05/15/2062 | | | | 87,125 | |
| | 300,000 | | | Universal Health Services, Inc. | | 4.63% | | | 10/15/2029 | | | | 298,248 | |
| | | | | | | | | | | | | | 3,502,678 | |
| Home Builders - 0.02% | | | | | | | | | | |
| | 297,000 | | | DR Horton, Inc. | | 5.00% | | | 10/15/2034 | | | | 301,278 | |
See Notes to Financial Statements and Financial Highlights.
| Annual Report | September 30, 2024 | 17 |
| RiverNorth/DoubleLine Strategic Income Fund | Schedule of Investments |
September 30, 2024
| Principal Amount/Description | | Rate | | | Maturity | | | Value | |
| Insurance - 0.20% | | | | | | | | | |
| $ | 95,000 | | | Alliant Holdings Intermediate LLC / Alliant Holdings Co.-Issuer(f) | | 6.75% | | | 10/15/2027 | | | $ | 94,719 | |
| | 75,000 | | | Alliant Holdings Intermediate LLC / Alliant Holdings Co.-Issuer(f) | | 6.50% | | | 10/01/2031 | | | | 75,880 | |
| | 112,000 | | | American National Group, Inc. | | 5.75% | | | 10/01/2029 | | | | 112,724 | |
| | 70,000 | | | AmWINS Group, Inc.(f) | | 4.88% | | | 06/30/2029 | | | | 67,179 | |
| | 219,000 | | | Athene Global Funding(f) | | 5.35% | | | 07/09/2027 | | | | 223,720 | |
| | 290,000 | | | Athene Holding, Ltd. | | 6.25% | | | 04/01/2054 | | | | 309,422 | |
| | 215,000 | | | Berkshire Hathaway Finance Corp. | | 2.85% | | | 10/15/2050 | | | | 151,265 | |
| | 110,000 | | | Berkshire Hathaway Finance Corp. | | 3.85% | | | 03/15/2052 | | | | 92,964 | |
| | 130,000 | | | Brighthouse Financial Global Funding(f) | | 2.00% | | | 06/28/2028 | | | | 117,774 | |
| | 268,000 | | | Brown & Brown, Inc. | | 5.65% | | | 06/11/2034 | | | | 281,320 | |
| | 90,000 | | | GTCR AP Finance, Inc.(f) | | 8.00% | | | 05/15/2027 | | | | 90,060 | |
| | 60,000 | | | HUB International, Ltd.(f) | | 7.25% | | | 06/15/2030 | | | | 62,562 | |
| | 100,000 | | | Markel Group, Inc. | | 6.00% | | | 05/16/2054 | | | | 106,466 | |
| | 285,000 | | | Massachusetts Mutual Life Insurance Co.(f) | | 3.20% | | | 12/01/2061 | | | | 189,378 | |
| | 100,000 | | | Panther Escrow Issuer LLC(f) | | 7.13% | | | 06/01/2031 | | | | 104,969 | |
| | 460,000 | | | Willis North America, Inc. | | 4.50% | | | 09/15/2028 | | | | 460,053 | |
| | | | | | | | | | | | | | 2,540,455 | |
| Internet - 0.12% | | | | | | | | | | |
| | 286,000 | | | Expedia Group, Inc. | | 3.80% | | | 02/15/2028 | | | | 280,703 | |
| | 300,000 | | | Meta Platforms, Inc. | | 4.45% | | | 08/15/2052 | | | | 276,869 | |
| | 107,000 | | | Netflix, Inc. | | 4.88% | | | 04/15/2028 | | | | 109,652 | |
| | 199,000 | | | Netflix, Inc. | | 5.40% | | | 08/15/2054 | | | | 210,837 | |
| | 314,000 | | | Uber Technologies, Inc.(f) | | 4.50% | | | 08/15/2029 | | | | 311,891 | |
| | 273,000 | | | Uber Technologies, Inc. | | 4.80% | | | 09/15/2034 | | | | 272,792 | |
| | 60,000 | | | Wayfair LLC(f) | | 7.25% | | | 10/31/2029 | | | | 61,618 | |
| | | | | | | | | | | | | | 1,524,362 | |
| Investment Companies - 6.32% | | | | | | | | | | |
| | 68,000 | | | Ares Capital Corp. | | 5.95% | | | 07/15/2029 | | | | 69,834 | |
| | 4,500,000 | | | BlackRock TCP Capital Corp. | | 6.95% | | | 05/30/2029 | | | | 4,589,426 | |
| | 1,000,000 | | | Blackstone Private Credit Fund | | 2.35% | | | 11/22/2024 | | | | 995,153 | |
| | 8,000,000 | | | Blackstone Private Credit Fund | | 2.63% | | | 12/15/2026 | | | | 7,567,398 | |
| | 6,800,000 | | | Blue Owl Capital Corp. | | 3.75% | | | 07/22/2025 | | | | 6,721,037 | |
| | 4,092,439 | | | Blue Owl Capital Corp. | | 2.88% | | | 06/11/2028 | | | | 3,751,074 | |
| | 667,000 | | | Blue Owl Capital Corp. II(f) | | 4.63% | | | 11/26/2024 | | | | 665,863 | |
| | 5,247,000 | | | Blue Owl Capital Corp. III | | 3.13% | | | 04/13/2027 | | | | 4,965,236 | |
| | 844 | | | Blue Owl Credit Income Corp.(f) | | 5.50% | | | 03/21/2025 | | | | 843 | |
| | 6,661,000 | | | Blue Owl Credit Income Corp. | | 5.50% | | | 03/21/2025 | | | | 6,656,456 | |
See Notes to Financial Statements and Financial Highlights.
| 18 | (888) 848-7569 | www.rivernorth.com |
| RiverNorth/DoubleLine Strategic Income Fund | Schedule of Investments |
| Principal Amount/Description | | Rate | | | Maturity | | | Value | |
| $ | 2,000,000 | | | Blue Owl Credit Income Corp. | | 4.70% | | | 02/08/2027 | | | $ | 1,962,955 | |
| | 3,482,180 | | | Blue Owl Credit Income Corp. | | 7.75% | | | 09/16/2027 | | | | 3,669,808 | |
| | 2,000,000 | | | Blue Owl Credit Income Corp. | | 7.95% | | | 06/13/2028 | | | | 2,137,857 | |
| | 7,015,000 | | | Blue Owl Technology Finance Corp.(f) | | 6.75% | | | 06/30/2025 | | | | 7,054,540 | |
| | 9,550,000 | | | Blue Owl Technology Finance Corp.(f) | | 4.75% | | | 12/15/2025 | | | | 9,425,679 | |
| | 1,500,000 | | | Franklin BSP Capital Corp.(f) | | 4.85% | | | 12/15/2024 | | | | 1,495,667 | |
| | 8,312,000 | | | New Mountain Finance Corp. | | 6.88% | | | 02/01/2029 | | | | 8,418,351 | |
| | 8,300,000 | | | Oaktree Specialty Lending Corp. | | 7.10% | | | 02/15/2029 | | | | 8,634,961 | |
| | 1,000,000 | | | Oaktree Strategic Credit Fund(f) | | 8.40% | | | 11/14/2028 | | | | 1,082,288 | |
| | 1,000,000 | | | Sixth Street Specialty Lending, Inc. | | 3.88% | | | 11/01/2024 | | | | 998,408 | |
| | | | | | | | | | | | | | 80,862,834 | |
| Leisure Time - 0.05% |
| | 140,000 | | | NCL Corp., Ltd.(f) | | 5.88% | | | 02/15/2027 | | | | 140,590 | |
| | 266,000 | | | Royal Caribbean Cruises, Ltd.(f) | | 5.38% | | | 07/15/2027 | | | | 268,561 | |
| | 50,000 | | | Royal Caribbean Cruises, Ltd.(f) | | 5.63% | | | 09/30/2031 | | | | 50,688 | |
| | 75,000 | | | Royal Caribbean Cruises, Ltd.(f) | | 6.25% | | | 03/15/2032 | | | | 77,847 | |
| | 90,000 | | | Viking Cruises, Ltd.(f) | | 9.13% | | | 07/15/2031 | | | | 98,481 | |
| | | | | | | | | | | | | | 636,167 | |
| Lodging - 0.07% |
| | 65,000 | | | Full House Resorts, Inc.(f) | | 8.25% | | | 02/15/2028 | | | | 65,144 | |
| | 269,000 | | | Hyatt Hotels Corp. | | 5.25% | | | 06/30/2029 | | | | 275,574 | |
| | 325,000 | | | Marriott International, Inc. | | 2.75% | | | 10/15/2033 | | | | 277,790 | |
| | 265,000 | | | Marriott International, Inc. | | 5.30% | | | 05/15/2034 | | | | 273,171 | |
| | | | | | | | | | | | | | 891,679 | |
| Machinery-Diversified - 0.02% |
| | 95,000 | | | AGCO Corp. | | 5.80% | | | 03/21/2034 | | | | 99,384 | |
| | 135,000 | | | CNH Industrial Capital LLC | | 5.10% | | | 04/20/2029 | | | | 139,019 | |
| | | | | | | | | | | | | | 238,403 | |
| Media - 0.07% |
| | 65,000 | | | CCO Holdings LLC / CCO Holdings Capital Corp.(f) | | 5.13% | | | 05/01/2027 | | | | 64,022 | |
| | 85,000 | | | CCO Holdings LLC / CCO Holdings Capital Corp.(f) | | 4.75% | | | 03/01/2030 | | | | 78,250 | |
| | 10,000 | | | CCO Holdings LLC / CCO Holdings Capital Corp.(f) | | 4.75% | | | 02/01/2032 | | | | 8,821 | |
| | 80,000 | | | CCO Holdings LLC / CCO Holdings Capital Corp.(f) | | 4.25% | | | 01/15/2034 | | | | 65,691 | |
| | 100,000 | | | Charter Communications Operating LLC / Charter Communications Operating Capital | | 6.10% | | | 06/01/2029 | | | | 103,540 | |
| | 135,000 | | | Directv Financing LLC / Directv Financing Co.-Obligor, Inc.(f) | | 5.88% | | | 08/15/2027 | | | | 132,642 | |
See Notes to Financial Statements and Financial Highlights.
| Annual Report | September 30, 2024 | 19 |
| RiverNorth/DoubleLine Strategic Income Fund | Schedule of Investments |
| | | | | | | | | | | |
| Principal Amount/Description | | Rate | | | Maturity | | | Value | |
| $ | 75,000 | | | DISH DBS Corp.(f) | | 5.75% | | | 12/01/2028 | | | $ | 65,670 | |
| | 60,000 | | | Gray Television, Inc.(f) | | 10.50% | | | 07/15/2029 | | | | 62,727 | |
| | 70,000 | | | McGraw-Hill Education, Inc.(f) | | 5.75% | | | 08/01/2028 | | | | 69,233 | |
| | 25,000 | | | McGraw-Hill Education, Inc.(f) | | 7.38% | | | 09/01/2031 | | | | 25,959 | |
| | 85,000 | | | News Corp.(f) | | 5.13% | | | 02/15/2032 | | | | 83,585 | |
| | 70,000 | | | Townsquare Media, Inc.(f) | | 6.88% | | | 02/01/2026 | | | | 69,910 | |
| | 55,000 | | | Univision Communications, Inc.(f) | | 7.38% | | | 06/30/2030 | | | | 53,275 | |
| | | | | | | | | | | | | | 883,325 | |
| Metal Fabricate/Hardware - 0.01% |
| | 100,000 | | | Advanced Drainage Systems, Inc.(f) | | 6.38% | | | 06/15/2030 | | | | 102,244 | |
| | | | | | | | | | | | | | | |
| Mining - 0.07% |
| | 50,000 | | | Freeport-McMoRan, Inc. | | 4.38% | | | 08/01/2028 | | | | 49,655 | |
| | 230,000 | | | Glencore Funding LLC(f) | | 1.63% | | | 04/27/2026 | | | | 220,805 | |
| | 504,000 | | | Glencore Funding LLC(f) | | 5.37% | | | 04/04/2029 | | | | 521,266 | |
| | 50,000 | | | Southern Copper Corp. | | 3.88% | | | 04/23/2025 | | | | 49,653 | |
| | | | | | | | | | | | | | 841,379 | |
| Oil & Gas - 0.23% |
| | 125,000 | | | Aethon United BR LP / Aethon United Finance Corp.(f) | | 7.50% | | | 10/01/2029 | | | | 126,745 | |
| | 260,000 | | | BP Capital Markets America, Inc. | | 4.89% | | | 09/11/2033 | | | | 264,648 | |
| | 267,000 | | | BP Capital Markets America, Inc. | | 5.23% | | | 11/17/2034 | | | | 278,091 | |
| | 85,000 | | | Civitas Resources, Inc.(f) | | 8.38% | | | 07/01/2028 | | | | 88,461 | |
| | 65,000 | | | CNX Resources Corp.(f) | | 6.00% | | | 01/15/2029 | | | | 65,404 | |
| | 277,000 | | | Devon Energy Corp. | | 5.75% | | | 09/15/2054 | | | | 269,809 | |
| | 240,000 | | | Exxon Mobil Corp. | | 4.23% | | | 03/19/2040 | | | | 224,811 | |
| | 125,000 | | | Gulfport Energy Corp.(f) | | 6.75% | | | 09/01/2029 | | | | 126,618 | |
| | 70,000 | | | Hilcorp Energy I LP / Hilcorp Finance Co.(f) | | 5.75% | | | 02/01/2029 | | | | 68,156 | |
| | 25,000 | | | Hilcorp Energy I LP / Hilcorp Finance Co.(f) | | 8.38% | | | 11/01/2033 | | | | 26,972 | |
| | 205,000 | | | Marathon Petroleum Corp. | | 5.13% | | | 12/15/2026 | | | | 208,332 | |
| | 100,000 | | | Matador Resources Co.(f) | | 6.50% | | | 04/15/2032 | | | | 99,926 | |
| | 750,000 | | | NiSource, Inc. | | 3.60% | | | 05/01/2030 | | | | 720,406 | |
| | 60,000 | | | Occidental Petroleum Corp. | | 5.38% | | | 01/01/2032 | | | | 60,873 | |
| | 65,000 | | | Permian Resources Operating LLC(f) | | 7.00% | | | 01/15/2032 | | | | 67,675 | |
| | 65,000 | | | Sitio Royalties Operating Partnership LP / Sitio Finance Corp.(f) | | 7.88% | | | 11/01/2028 | | | | 68,051 | |
| | 125,000 | | | SM Energy Co.(f) | | 7.00% | | | 08/01/2032 | | | | 125,569 | |
| | 55,000 | | | Transocean, Inc.(f) | | 8.00% | | | 02/01/2027 | | | | 55,010 | |
| | 50,000 | | | Vital Energy, Inc.(f) | | 7.88% | | | 04/15/2032 | | | | 48,473 | |
| | | | | | | | | | | | | | 2,994,030 | |
See Notes to Financial Statements and Financial Highlights.
| 20 | (888) 848-7569 | www.rivernorth.com |
| RiverNorth/DoubleLine Strategic Income Fund | Schedule of Investments |
| Principal Amount/Description | | Rate | | | Maturity | | | Value | |
| Oil & Gas Services - 0.05% |
| $ | 120,000 | | | Archrock Partners LP / Archrock Partners Finance Corp.(f) | | 6.63% | | | 09/01/2032 | | | $ | 123,144 | |
| | 110,000 | | | Halliburton Co. | | 4.85% | | | 11/15/2035 | | | | 109,883 | |
| | 120,000 | | | Kodiak Gas Services LLC(f) | | 7.25% | | | 02/15/2029 | | | | 124,282 | |
| | 215,000 | | | Schlumberger Holdings Corp.(f) | | 5.00% | | | 11/15/2029 | | | | 222,038 | |
| | 50,000 | | | Weatherford International, Ltd.(f) | | 8.63% | | | 04/30/2030 | | | | 52,137 | |
| | | | | | | | | | | | | | 631,484 | |
| Packaging & Containers - 0.07% |
| | 101,000 | | | Berry Global, Inc.(f) | | 4.88% | | | 07/15/2026 | | | | 100,931 | |
| | 150,000 | | | Berry Global, Inc.(f) | | 5.65% | | | 01/15/2034 | | | | 154,128 | |
| | 125,000 | | | Clydesdale Acquisition Holdings, Inc.(f) | | 6.88% | | | 01/15/2030 | | | | 127,810 | |
| | 48,000 | | | Packaging Corp. of America | | 3.00% | | | 12/15/2029 | | | | 45,303 | |
| | 70,000 | | | Pactiv Evergreen Group Issuer LLC / Pactiv Evergreen Group Issuer, Inc.(f) | | 4.38% | | | 10/15/2028 | | | | 67,115 | |
| | 90,000 | | | Sealed Air Corp./Sealed Air Corp US(f) | | 7.25% | | | 02/15/2031 | | | | 95,367 | |
| | 98,000 | | | Sonoco Products Co. | | 4.60% | | | 09/01/2029 | | | | 97,554 | |
| | 170,000 | | | Trident TPI Holdings, Inc.(f) | | 12.75% | | | 12/31/2028 | | | | 188,934 | |
| | | | | | | | | | | | | | 877,142 | |
| Pharmaceuticals - 0.10% |
| | 283,000 | | | AbbVie, Inc. | | 4.70% | | | 05/14/2045 | | | | 274,031 | |
| | 140,000 | | | AbbVie, Inc. | | 5.50% | | | 03/15/2064 | | | | 149,609 | |
| | 65,000 | | | AdaptHealth LLC(f) | | 5.13% | | | 03/01/2030 | | | | 60,894 | |
| | 260,000 | | | CVS Health Corp. | | 5.30% | | | 06/01/2033 | | | | 265,790 | |
| | 395,000 | | | CVS Health Corp. | | 5.88% | | | 06/01/2053 | | | | 402,246 | |
| | 70,000 | | | Owens & Minor, Inc.(f) | | 6.63% | | | 04/01/2030 | | | | 68,015 | |
| | | | | | | | | | | | | | 1,220,585 | |
| Pipelines - 0.42% |
| | 60,000 | | | Blue Racer Midstream LLC / Blue Racer Finance Corp.(f) | | 7.25% | | | 07/15/2032 | | | | 63,014 | |
| | 130,000 | | | Buckeye Partners LP(f) | | 6.88% | | | 07/01/2029 | | | | 133,305 | |
| | 265,000 | | | Cheniere Energy, Inc. | | 4.63% | | | 10/15/2028 | | | | 263,449 | |
| | 1,000,000 | | | Energy Transfer LP | | 3.90% | | | 07/15/2026 | | | | 991,064 | |
| | 310,000 | | | Energy Transfer LP | | 5.00% | | | 05/15/2044 | | | | 284,168 | |
| | 273,000 | | | Energy Transfer LP | | 5.95% | | | 05/15/2054 | | | | 279,622 | |
| | 135,000 | | | Energy Transfer LP(j) | | 5Y US TI + 2.83% | | | 10/01/2054 | | | | 138,152 | |
| | 415,000 | | | EnLink Midstream LLC | | 5.65% | | | 09/01/2034 | | | | 429,153 | |
| | 274,000 | | | Enterprise Products Operating LLC | | 5.55% | | | 02/16/2055 | | | | 283,254 | |
| | 115,000 | | | Harvest Midstream I LP(f) | | 7.50% | | | 05/15/2032 | | | | 121,057 | |
| | 433,000 | | | Kinder Morgan Energy Partners LP | | 6.95% | | | 01/15/2038 | | | | 492,332 | |
See Notes to Financial Statements and Financial Highlights.
| Annual Report | September 30, 2024 | 21 |
| RiverNorth/DoubleLine Strategic Income Fund | Schedule of Investments |
| Principal Amount/Description | | Rate | | | Maturity | | | Value | |
| $ | 267,000 | | | MPLX LP | | 5.50% | | | 06/01/2034 | | | $ | 274,432 | |
| | 95,000 | | | NGL Energy Operating LLC / NGL Energy Finance Corp.(f) | | 8.13% | | | 02/15/2029 | | | | 97,483 | |
| | 315,000 | | | NGPL PipeCo LLC(f) | | 3.25% | | | 07/15/2031 | | | | 280,336 | |
| | 140,000 | | | ONEOK, Inc. | | 3.40% | | | 09/01/2029 | | | | 133,194 | |
| | 125,000 | | | ONEOK, Inc. | | 6.63% | | | 09/01/2053 | | | | 138,798 | |
| | 205,000 | | | Sabine Pass Liquefaction LLC | | 5.00% | | | 03/15/2027 | | | | 207,725 | |
| | 51,000 | | | South Bow USA Infrastructure Holdings LLC(f) | | 4.91% | | | 09/01/2027 | | | | 51,403 | |
| | 60,000 | | | Tallgrass Energy Partners LP / Tallgrass Energy Finance Corp.(f) | | 7.38% | | | 02/15/2029 | | | | 60,724 | |
| | 59,000 | | | Targa Resources Corp. | | 5.50% | | | 02/15/2035 | | | | 60,787 | |
| | 100,000 | | | Venture Global LNG, Inc.(f) | | 8.13% | | | 06/01/2028 | | | | 104,319 | |
| | 65,000 | | | Venture Global LNG, Inc.(f) | | 8.38% | | | 06/01/2031 | | | | 68,679 | |
| | 65,000 | | | Venture Global LNG, Inc.(f) | | 9.88% | | | 02/01/2032 | | | | 72,268 | |
| | 355,000 | | | Williams Cos., Inc. | | 5.15% | | | 03/15/2034 | | | | 359,049 | |
| | | | | | | | | | | | | | 5,387,767 | |
| Real Estate - 0.00%(b) |
| | 70,000 | | | Anywhere Real Estate Group LLC / Anywhere Co.-Issuer Corp.(f) | | 7.00% | | | 04/15/2030 | | | | 65,094 | |
| | | | | | | | | | | | | | | |
| REITS - 0.32% |
| | 115,000 | | | Agree LP | | 2.60% | | | 06/15/2033 | | | | 95,923 | |
| | 245,000 | | | Alexandria Real Estate Equities, Inc. | | 3.00% | | | 05/18/2051 | | | | 163,751 | |
| | 60,000 | | | Alexandria Real Estate Equities, Inc. | | 5.15% | | | 04/15/2053 | | | | 57,470 | |
| | 420,000 | | | American Homes 4 Rent LP | | 5.50% | | | 02/01/2034 | | | | 433,985 | |
| | 110,000 | | | American Tower Corp. | | 5.55% | | | 07/15/2033 | | | | 115,336 | |
| | 220,000 | | | COPT Defense Properties LP | | 2.90% | | | 12/01/2033 | | | | 184,381 | |
| | 770,000 | | | Crown Castle, Inc. | | 3.65% | | | 09/01/2027 | | | | 754,931 | |
| | 264,000 | | | Equinix, Inc. | | 1.80% | | | 07/15/2027 | | | | 247,638 | |
| | 265,000 | | | Extra Space Storage LP | | 5.40% | | | 02/01/2034 | | | | 273,870 | |
| | 300,000 | | | Host Hotels & Resorts LP | | 2.90% | | | 12/15/2031 | | | | 264,140 | |
| | 270,000 | | | Host Hotels & Resorts LP | | 5.70% | | | 07/01/2034 | | | | 278,908 | |
| | 170,000 | | | Iron Mountain, Inc.(f) | | 7.00% | | | 02/15/2029 | | | | 177,331 | |
| | 175,000 | | | Park Intermediate Holdings LLC / PK Domestic Property LLC / PK Finance Co.-Issuer(f) | | 7.00% | | | 02/01/2030 | | | | 182,065 | |
| | 205,000 | | | Phillips Edison Grocery Center Operating Partnership I LP | | 5.75% | | | 07/15/2034 | | | | 214,233 | |
| | 130,000 | | | Sabra Health Care LP | | 3.20% | | | 12/01/2031 | | | | 114,485 | |
| | 320,000 | | | Sun Communities Operating LP | | 2.70% | | | 07/15/2031 | | | | 280,007 | |
See Notes to Financial Statements and Financial Highlights.
| 22 | (888) 848-7569 | www.rivernorth.com |
| RiverNorth/DoubleLine Strategic Income Fund | Schedule of Investments |
| Principal Amount/Description | | Rate | | | Maturity | | | Value | |
| $ | 280,000 | | | VICI Properties LP / VICI Note Co., Inc.(f) | | 4.63% | | | 12/01/2029 | | | $ | 274,915 | |
| | | | | | | | | | | | | | 4,113,369 | |
| Retail - 0.11% |
| | 50,000 | | | Carvana Co.(f)(h) | | 12.00% (12.00%) | | | 12/01/2028 | | | | 52,555 | |
| | 65,000 | | | Cougar JV Subsidiary LLC(f) | | 8.00% | | | 05/15/2032 | | | | 68,784 | |
| | 75,000 | | | Fertitta Entertainment LLC / Fertitta Entertainment Finance Co., Inc.(f) | | 6.75% | | | 01/15/2030 | | | | 69,923 | |
| | 275,000 | | | Genuine Parts Co. | | 4.95% | | | 08/15/2029 | | | | 279,837 | |
| | 70,000 | | | LBM Acquisition LLC(f) | | 6.25% | | | 01/15/2029 | | | | 66,256 | |
| | 160,000 | | | Lowe's Cos., Inc. | | 5.63% | | | 04/15/2053 | | | | 166,680 | |
| | 37,000 | | | Macy's Retail Holdings LLC(f) | | 5.88% | | | 04/01/2029 | | | | 36,564 | |
| | 300,000 | | | McDonald's Corp. | | 4.45% | | | 03/01/2047 | | | | 273,908 | |
| | 30,000 | | | Michaels Cos., Inc.(f) | | 5.25% | | | 05/01/2028 | | | | 22,173 | |
| | 25,000 | | | Michaels Cos., Inc.(f) | | 7.88% | | | 05/01/2029 | | | | 14,669 | |
| | 125,000 | | | O'Reilly Automotive, Inc. | | 5.75% | | | 11/20/2026 | | | | 128,905 | |
| | 138,000 | | | O'Reilly Automotive, Inc. | | 5.00% | | | 08/19/2034 | | | | 139,719 | |
| | 25,000 | | | Staples, Inc.(f) | | 10.75% | | | 09/01/2029 | | | | 24,289 | |
| | 95,000 | | | Victra Holdings LLC / Victra Finance Corp.(f) | | 8.75% | | | 09/15/2029 | | | | 99,830 | |
| | | | | | | | | | | | | | 1,444,092 | |
| Semiconductors - 0.13% |
| | 459,000 | | | Broadcom, Inc.(f) | | 3.42% | | | 04/15/2033 | | | | 417,199 | |
| | 335,000 | | | Broadcom, Inc.(f) | | 3.19% | | | 11/15/2036 | | | | 284,063 | |
| | 200,000 | | | Foundry JV Holdco LLC(f) | | 6.40% | | | 01/25/2038 | | | | 210,880 | |
| | 610,000 | | | Marvell Technology, Inc. | | 2.95% | | | 04/15/2031 | | | | 551,278 | |
| | 155,000 | | | Qorvo, Inc.(f) | | 3.38% | | | 04/01/2031 | | | | 138,939 | |
| | | | | | | | | | | | | | 1,602,359 | |
| Software - 0.15% |
| | 70,000 | | | AthenaHealth Group, Inc.(f) | | 6.50% | | | 02/15/2030 | | | | 67,297 | |
| | 131,000 | | | Cadence Design Systems, Inc. | | 4.70% | | | 09/10/2034 | | | | 131,868 | |
| | 90,000 | | | Central Parent LLC / CDK Global II LLC / CDK Financing Co., Inc.(f) | | 8.00% | | | 06/15/2029 | | | | 93,688 | |
| | 265,000 | | | Fiserv, Inc. | | 5.45% | | | 03/15/2034 | | | | 277,116 | |
| | 250,000 | | | Intuit, Inc. | | 5.50% | | | 09/15/2053 | | | | 268,903 | |
| | 145,000 | | | Oracle Corp. | | 6.25% | | | 11/09/2032 | | | | 160,494 | |
| | 95,000 | | | Oracle Corp. | | 3.80% | | | 11/15/2037 | | | | 84,097 | |
| | 525,000 | | | Take-Two Interactive Software, Inc. | | 4.95% | | | 03/28/2028 | | | | 535,783 | |
| | 60,000 | | | UKG, Inc.(f) | | 6.88% | | | 02/01/2031 | | | | 62,041 | |
| | 254,000 | | | Workday, Inc. | | 3.70% | | | 04/01/2029 | | | | 248,154 | |
| | | | | | | | | | | | | | 1,929,441 | |
| Telecommunications - 0.17% |
| | 500,000 | | | AT&T, Inc. | | 4.30% | | | 02/15/2030 | | | | 499,540 | |
See Notes to Financial Statements and Financial Highlights.
| Annual Report | September 30, 2024 | 23 |
| RiverNorth/DoubleLine Strategic Income Fund | Schedule of Investments |
| Principal Amount/Description | | Rate | | | Maturity | | | Value | |
| $ | 745,000 | | | AT&T, Inc. | | 3.50% | | | 09/15/2053 | | | $ | 547,773 | |
| | 90,000 | | | Consolidated Communications, Inc.(f) | | 5.00% | | | 10/01/2028 | | | | 82,921 | |
| | 30,000 | | | Frontier Communications Holdings LLC(f) | | 5.88% | | | 10/15/2027 | | | | 30,147 | |
| | 85,000 | | | Frontier Communications Holdings LLC(f) | | 5.00% | | | 05/01/2028 | | | | 84,298 | |
| | 65,000 | | | Frontier Communications Holdings LLC(f) | | 6.75% | | | 05/01/2029 | | | | 65,505 | |
| | 90,000 | | | Level 3 Financing, Inc.(f) | | 10.50% | | | 04/15/2029 | | | | 98,554 | |
| | 265,000 | | | Motorola Solutions, Inc. | | 5.40% | | | 04/15/2034 | | | | 276,700 | |
| | 265,000 | | | T-Mobile USA, Inc. | | 5.15% | | | 04/15/2034 | | | | 273,100 | |
| | 285,000 | | | T-Mobile USA, Inc. | | 3.40% | | | 10/15/2052 | | | | 208,783 | |
| | 35,000 | | | Windstream Escrow LLC / Windstream Escrow Finance Corp.(f) | | 8.25% | | | 10/01/2031 | | | | 35,628 | |
| | | | | | | | | | | | | | 2,202,949 | |
| Transportation - 0.21% |
| | 1,185,000 | | | Burlington Northern Santa Fe LLC | | 5.20% | | | 04/15/2054 | | | | 1,226,683 | |
| | 670,000 | | | CSX Corp. | | 3.80% | | | 11/01/2046 | | | | 561,472 | |
| | 130,000 | | | Genesee & Wyoming, Inc.(f) | | 6.25% | | | 04/15/2032 | | | | 133,848 | |
| | 500,000 | | | Union Pacific Corp. | | 3.70% | | | 03/01/2029 | | | | 494,727 | |
| | 125,000 | | | Watco Cos. LLC / Watco Finance Corp.(f) | | 7.13% | | | 08/01/2032 | | | | 130,391 | |
| | 135,000 | | | XPO, Inc.(f) | | 7.13% | | | 06/01/2031 | | | | 141,469 | |
| | | | | | | | | | | | | | 2,688,590 | |
| Trucking & Leasing - 0.05% |
| | 95,000 | | | Fortress Transportation and Infrastructure Investors LLC(f) | | 7.88% | | | 12/01/2030 | | | | 102,438 | |
| | 175,000 | | | Fortress Transportation and Infrastructure Investors LLC(f) | | 5.88% | | | 04/15/2033 | | | | 175,000 | |
| | 160,000 | | | Penske Truck Leasing Co. Lp / PTL Finance Corp.(f) | | 5.75% | | | 05/24/2026 | | | | 162,978 | |
| | 240,000 | | | Penske Truck Leasing Co. LP / PTL Finance Corp.(f) | | 4.20% | | | 04/01/2027 | | | | 238,869 | |
| | | | | | | | | | | | | | 679,285 | |
| | | | | | | | | | | | | | | |
| TOTAL U.S. CORPORATE BONDS |
| (Cost $142,052,727) | | | | | | 144,493,915 | |
See Notes to Financial Statements and Financial Highlights.
| 24 | (888) 848-7569 | www.rivernorth.com |
| RiverNorth/DoubleLine Strategic Income Fund | Schedule of Investments |
| Principal Amount/Description | | Rate | | | Maturity | | | Value | |
| FOREIGN GOVERNMENT BONDS AND NOTES, SUPRANATIONALS AND FOREIGN AGENCIES - 0.10% | |
| Colombia - 0.03% | | | | | | | | | | |
| $ | 600,000 | | | Colombia Government International Bond | | 4.13% | | | 05/15/2051 | | | $ | 380,203 | |
| Guatemala - 0.02% |
| | 300,000 | | | Guatemala Government Bond(g) | | 4.38% | | | 06/05/2027 | | | | 293,482 | |
| Mexico - 0.02% |
| | 200,000 | | | Mexico Government International Bond | | 6.34% | | | 05/04/2053 | | | | 199,346 | |
| Panama - 0.03% |
| | 200,000 | | | Panama Government International Bond | | 3.88% | | | 03/17/2028 | | | | 193,327 | |
| | 300,000 | | | Panama Government International Bond | | 3.87% | | | 07/23/2060 | | | | 189,735 | |
| |
| TOTAL FOREIGN GOVERNMENT BONDS AND NOTES, SUPRANATIONALS AND FOREIGN AGENCIES |
| (Cost $1,550,669) | | | | | | | 1,256,093 | |
| | | | | | | | | | | | | | | |
| BANK LOANS - 0.28%(j) |
| Luxembourg - 0.08% |
| | 1,094,935 | | | Travelport Finance Luxembourg SARL 1L, 2021, First Lien - Initial (Priority) Term Loan | | 3M SOFR + 8.26%, 1.00% Floor | | | 09/29/2028 | | | | 951,772 | |
| | | | | | | | | | | | | | | |
| Netherlands - 0.00%(b) |
| | 5,736 | | | Lealand Finance Company B.V., First Lien - Make-Whole Term Loan | | 1M SOFR + 3.00% | | | 06/30/2027 | | | | 3,083 | |
| | 84,216 | | | Lealand Finance Company B.V.,First Lien - Take-Back Term Loan | | 3M US L + 1.00% | | | 06/30/2025 | | | | 32,255 | |
| | | | | | | | | | | | | | 35,338 | |
| United States -0.20% |
| | 1,559,522 | | | Astra Acquisition Corp., Second Lien - Initial Term Loan | | 3M SOFR + 8.88% | | | 10/22/2029 | | | | 181,786 | |
| | 538,805 | | | Aveanna Healthcare LLC, Second Lien - Initial Term Loan(j) | | 3M SOFR + 7.00%, 0.50% Floor | | | 12/10/2029 | | | | 510,014 | |
| | 1,630,000 | | | Constant Contact, Inc., Second Lien - Initial Term Loan(j) | | 3M SOFR + 7.50%, 0.75% Floor | | | 02/12/2029 | | | | 1,507,750 | |
See Notes to Financial Statements and Financial Highlights.
| Annual Report | September 30, 2024 | 25 |
| RiverNorth/DoubleLine Strategic Income Fund | Schedule of Investments |
September 30, 2024
| Principal Amount/Description | | Rate | | | Maturity | | | Value | |
| $ | 425,469 | | | Zephyrus Capital Aviation Tl | | 1M US L + 4.61% | | | 10/15/2038 | | | $ | 404,128 | |
| | | | | | | | | | | | | | 2,603,678 | |
| TOTAL BANK LOANS | | | | | | | | | | |
| (Cost $5,237,632) | | | | | | | | | 3,590,788 | |
| | | | | | | | | | | | | | | |
| COLLATERALIZED LOAN OBLIGATIONS - 5.34% | | | | | | | | | | |
| Cayman Islands - 4.98% | | | | | | | | | | |
| | | | | AIMCO CLO | | | | | | | | | | |
| | 500,000 | | | Series 2018-AA(f)(j) | | 3M SOFR + 2.81% | | | 04/17/2031 | | | | 500,511 | |
| | | | | Apidos CLO XXIV | | | | | | | | | | |
| | 1,000,000 | | | Series 2018-24A(f)(j) | | 3M SOFR + 6.06% | | | 10/20/2030 | | | | 992,005 | |
| | | | | Bain Capital Credit CLO 2021-2, Ltd. | | | | | | | | | | |
| | 500,000 | | | Series 2021-2A(f)(j) | | 3M SOFR + 3.41% | | | 07/16/2034 | | | | 501,878 | |
| | | | | Bain Capital Credit CLO 2024-4, Ltd. | | | | | | | | | | |
| | 500,000 | | | Series 2024-4A(f)(j) | | 3M CME TERM SOFR + 3.10% | | | 10/23/2037 | | | | 505,763 | |
| | | | | Barings CLO, Ltd. | | | | | | | | | | |
| | 500,000 | | | Series 2018-4A(f)(j) | | 3M SOFR + 6.08% | | | 10/15/2030 | | | | 499,658 | |
| | | | | Barings CLO, Ltd. 2018-III | | | | | | | | | | |
| | 1,295,000 | | | Series 2018-3A(f)(j) | | 3M SOFR + 6.01% | | | 07/20/2029 | | | | 1,296,815 | |
| | | | | Barings CLO, Ltd. 2019-I | | | | | | | | | | |
| | 1,500,000 | | | Series 2021-1A(f)(j) | | 3M SOFR + 7.12% | | | 04/15/2035 | | | | 1,510,986 | |
| | | | | Barings CLO, Ltd. 2019-II | | | | | | | | | | |
| | 500,000 | | | Series 2021-2A(f)(j) | | 3M US L + 3.41% | | | 04/15/2036 | | | | 504,885 | |
| | | | | Beechwood Park CLO, Ltd. | | | | | | | | | | |
| | 500,000 | | | Series 2022-1A(f)(j) | | 3M SOFR + 6.50% | | | 01/17/2035 | | | | 499,529 | |
| | | | | BlueMountain CLO, Ltd. | | | | | | | | | | |
| | 500,000 | | | Series 2018-3A(f)(j) | | 3M SOFR + 2.86% | | | 04/20/2031 | | | | 492,181 | |
| | | | | BlueMountain Fuji US CLO II, Ltd. | | | | | | | | | | |
| | 1,000,000 | | | Series 2017-2A(f)(j) | | 3M SOFR + 3.26% | | | 10/20/2030 | | | | 988,443 | |
| | | | | Buttermilk Park CLO, Ltd. | | | | | | | | | | |
| | 1,000,000 | | | Series 2018-1A(f)(j) | | 3M SOFR + 6.01% | | | 10/15/2031 | | | | 996,133 | |
| | | | | Canyon Capital CLO 2016-2, Ltd. | | | | | | | | | | |
| | 500,000 | | | Series 2018-2A(f)(j) | | 3M SOFR + 3.41% | | | 10/15/2031 | | | | 504,021 | |
| | | | | Canyon Capital CLO 2017-1, Ltd. | | | | | | | | | | |
| | 500,000 | | | Series 2021-1A(f)(j) | | 3M SOFR + 3.26% | | | 07/15/2030 | | | | 499,273 | |
| | | | | Canyon Capital CLO, Ltd. | | | | | | | | | | |
| | 1,000,000 | | | Series 2018-1A(f)(j) | | 3M SOFR + 3.01% | | | 01/30/2031 | | | | 985,272 | |
| | 1,500,000 | | | Series 2018-1A(f)(j) | | 3M SOFR + 5.76% | | | 01/30/2031 | | | | 1,392,701 | |
| | 1,000,000 | | | Series 2018-1A(f)(j) | | 3M US L + 5.75% | | | 07/15/2031 | | | | 982,722 | |
| | 500,000 | | | Series 2018-1A(f)(j) | | 3M US L + 2.80% | | | 07/15/2031 | | | | 498,987 | |
See Notes to Financial Statements and Financial Highlights.
| 26 | (888) 848-7569 | www.rivernorth.com |
| RiverNorth/DoubleLine Strategic Income Fund | Schedule of Investments |
September 30, 2024
| Principal Amount/Description | | Rate | | | Maturity | | | Value | |
| | | | | Canyon CLO 2021-3, Ltd. | | | | | | | | | | |
| $ | 1,000,000 | | | Series 2021-3A(f)(j) | | 3M SOFR + 3.31% | | | 07/15/2034 | | | $ | 1,002,458 | |
| | | | | Canyon CLO 2021-4, Ltd. | | | | | | | | | | |
| | 1,000,000 | | | Series 2021-4A(f)(j) | | 3M SOFR + 6.56% | | | 10/15/2034 | | | | 1,003,484 | |
| | | | | Carlyle Global Market Strategies CLO 2016-3, Ltd. | | | | | | | | | | |
| | 1,000,000 | | | Series 2021-3A(f)(j) | | 3M US L + 3.30% | | | 07/20/2034 | | | | 1,005,591 | |
| | | | | Carlyle Global Market Strategies CLO, Ltd. | | | | | | | | | | |
| | 1,000,000 | | | Series 2018-2RA(f)(j) | | 3M SOFR + 5.61% | | | 05/15/2031 | | | | 965,360 | |
| | | | | Carlyle US CLO 2020-2, Ltd. | | | | | | | | | | |
| | 2,000,000 | | | Series 2021-2A(f)(j) | | 3M SOFR + 6.96% | | | 01/25/2035 | | | | 2,015,745 | |
| | | | | Carlyle US CLO 2021-1, Ltd. | | | | | | | | | | |
| | 500,000 | | | Series 2021-1A(f)(j) | | 3M SOFR + 6.26% | | | 04/15/2034 | | | | 501,488 | |
| | | | | Carlyle US CLO 2022-5, Ltd. | | | | | | | | | | |
| | 500,000 | | | Series 2024-5A(f)(j) | | 3M CME TERM SOFR + 3.15% | | | 10/15/2037 | | | | 500,000 | |
| | | | | Chenango Park CLO, Ltd. | | | | | | | | | | |
| | 500,000 | | | Series 2018-1A(f)(j) | | 3M SOFR + 3.26% | | | 04/15/2030 | | | | 503,489 | |
| | 1,000,000 | | | Series 2018-1A(f)(j) | | 3M SOFR + 6.06% | | | 04/15/2030 | | | | 979,738 | |
| | | | | Cook Park CLO, Ltd. | | | | | | | | | | |
| | 500,000 | | | Series 2018-1A(f)(j) | | 3M SOFR + 2.86% | | | 04/17/2030 | | | | 501,537 | |
| | | | | Crown Point CLO IV, Ltd. | | | | | | | | | | |
| | 500,000 | | | Series 2018-4A(f)(j) | | 3M SOFR + 2.16% | | | 04/20/2031 | | | | 500,869 | |
| | | | | Dryden 57 CLO, Ltd. | | | | | | | | | | |
| | 500,000 | | | Series 2018-57A(f)(j) | | 3M SOFR + 2.81% | | | 05/15/2031 | | | | 500,827 | |
| | | | | Elevation CLO 2021-14, Ltd. | | | | | | | | | | |
| | 500,000 | | | Series 2021-14A(f)(j) | | 3M SOFR + 2.56% | | | 10/20/2034 | | | | 500,538 | |
| | | | | Elmwood CLO IX, Ltd. | | | | | | | | | | |
| | 500,000 | | | Series 2021-2A(f)(j) | | 3M US L + 5.94% | | | 07/20/2034 | | | | 503,889 | |
| | | | | Galaxy XIX CLO, Ltd. | | | | | | | | | | |
| | 1,300,000 | | | Series 2017-19A(f)(j) | | 3M SOFR + 6.79% | | | 07/24/2030 | | | | 1,294,878 | |
| | | | | Goldentree Loan Management US CLO 3, Ltd. | | | | | | | | | | |
| | 500,000 | | | Series 2018-3A(f)(j) | | 3M SOFR + 3.11% | | | 04/20/2030 | | | | 501,820 | |
| | | | | Jamestown CLO XVIII, Ltd. | | | | | | | | | | |
| | 1,000,000 | | | Series 2024-18A(f)(j) | | | | | 07/25/2035 | | | | 1,000,000 | |
| | | | | Lewey Park CLO, Ltd. | | | | | | | | | | |
| | 500,000 | | | Series 2024-1A(f)(j) | | | | | 10/20/2037 | | | | 500,000 | |
| | | | | Marble Point CLO XII, Ltd. | | | | | | | | | | |
| | 500,000 | | | Series 2018-1A(f)(j) | | 3M SOFR + 3.26% | | | 07/16/2031 | | | | 499,800 | |
| | | | | Milos CLO, Ltd. | | | | | | | | | | |
| | 500,000 | | | Series 2020-1A(f)(j) | | 3M SOFR + 6.41% | | | 10/20/2030 | | | | 497,158 | |
| | | | | Myers Park CLO, Ltd. | | | | | | | | | | |
| | 1,000,000 | | | Series 2018-1A(f)(j) | | 3M SOFR + 5.76% | | | 10/20/2030 | | | | 1,001,279 | |
See Notes to Financial Statements and Financial Highlights.
| Annual Report | September 30, 2024 | 27 |
| RiverNorth/DoubleLine Strategic Income Fund | Schedule of Investments |
September 30, 2024
| Principal Amount/Description | | Rate | | | Maturity | | | Value | |
| | | | | Neuberger Berman Loan Advisers CLO 37, Ltd. | | | | | | | | | | |
| $ | 500,000 | | | Series 2021-37A(f)(j) | | 3M SOFR + 6.01% | | | 07/20/2031 | | | $ | 502,551 | |
| | | | | Neuberger Berman Loan Advisers CLO 42, Ltd. | | | | | | | | | | |
| | 500,000 | | | Series 2021-42A(f)(j) | | 3M SOFR + 6.21% | | | 07/16/2035 | | | | 503,389 | |
| | | | | Neuberger Berman Loan Advisers Clo 44, Ltd. | | | | | | | | | | |
| | 1,000,000 | | | Series 2021-44A(f)(j) | | 3M SOFR + 6.26% | | | 10/16/2034 | | | | 1,008,697 | |
| | | | | Point Au Roche Park CLO, Ltd. | | | | | | | | | | |
| | 500,000 | | | Series 2021-1A(f)(j) | | 3M US L + 6.13% | | | 07/20/2034 | | | | 503,415 | |
| | | | | Rockland Park CLO, Ltd. | | | | | | | | | | |
| | 500,000 | | | Series 2021-1A(f)(j) | | 3M US L + 6.25% | | | 04/20/2034 | | | | 502,070 | |
| | | | | Sound Point CLO XVIII, Ltd. | | | | | | | | | | |
| | 2,000,000 | | | Series 2018-4A(f)(j) | | 3M CME TERM SOFR + 2.76% | | | 01/21/2031 | | | | 1,964,528 | |
| | | | | Sound Point CLO XXIII | | | | | | | | | | |
| | 500,000 | | | Series 2021-2A(f)(j) | | 3M SOFR + 3.56% | | | 07/15/2034 | | | | 496,742 | |
| | | | | Sound Point CLO XXIV | | | | | | | | | | |
| | 1,375,000 | | | Series 2021-3A(f)(j) | | 3M SOFR + 6.98% | | | 10/25/2034 | | | | 1,149,602 | |
| | 500,000 | | | Series 2021-3A(f)(j) | | 3M CME TERM SOFR + 3.76% | | | 10/25/2034 | | | | 490,730 | |
| | | | | Sound Point CLO XXVI, Ltd. | | | | | | | | | | |
| | 500,000 | | | Series 2021-1A(f)(j) | | 3M US L + 3.35% | | | 07/20/2034 | | | | 497,098 | |
| | | | | Sound Point CLO XXVIII, Ltd. | | | | | | | | | | |
| | 1,000,000 | | | Series 2020-3A(f)(j) | | 3M US L + 6.90% | | | 01/25/2032 | | | | 1,004,031 | |
| | | | | Sound Point CLO XXXII, Ltd. | | | | | | | | | | |
| | 500,000 | | | Series 2021-4A(f)(j) | | 3M SOFR + 3.66% | | | 10/25/2034 | | | | 490,560 | |
| | 500,000 | | | Series 2021-4A(f)(j) | | 3M SOFR + 6.96% | | | 10/25/2034 | | | | 455,960 | |
| | | | | Stewart Park CLO, Ltd. | | | | | | | | | | |
| | 500,000 | | | Series 2018-1A(f)(j) | | 3M SOFR + 2.86% | | | 01/15/2030 | | | | 502,332 | |
| | | | | THL Credit Wind River 2017-1 CLO, Ltd. | | | | | | | | | | |
| | 1,400,000 | | | Series 2021-1A(f)(j) | | 3M US L + 3.91% | | | 04/18/2036 | | | | 1,389,058 | |
| | | | | THL Credit Wind River 2017-3 CLO, Ltd. | | | | | | | | | | |
| | 500,000 | | | Series 2021-3A(f)(j) | | 3M US L + 7.08% | | | 04/15/2035 | | | | 475,189 | |
| | | | | THL Credit Wind River 2019-1 CLO, Ltd. | | | | | | | | | | |
| | 1,150,000 | | | Series 2021-1A(f)(j) | | 3M SOFR + 3.71% | | | 07/20/2034 | | | | 1,120,795 | |
| | | | | THL Credit Wind River CLO, Ltd. | | | | | | | | | | |
| | 500,000 | | | Series 2018-1A(f)(j) | | 2.90% - 3M US L | | | 07/15/2030 | | | | 499,747 | |
| | 2,000,000 | | | Series 2018-1A(f)(j) | | 5.50% - 3M US L | | | 07/15/2030 | | | | 1,939,084 | |
| | 1,000,000 | | | Series 2018-1A(f)(j) | | 3M US L + 3.00% | | | 07/18/2031 | | | | 989,197 | |
| | 1,000,000 | | | Series 2018-2A(f)(j) | | 3M SOFR + 6.01% | | | 07/15/2030 | | | | 967,762 | |
| | 2,000,000 | | | Series 2018-3A(f)(j) | | 3M SOFR + 3.21% | | | 01/20/2031 | | | | 2,000,258 | |
See Notes to Financial Statements and Financial Highlights.
| 28 | (888) 848-7569 | www.rivernorth.com |
| RiverNorth/DoubleLine Strategic Income Fund | Schedule of Investments |
September 30, 2024
| Principal Amount/Description | | Rate | | | Maturity | | | Value | |
| $ | 1,000,000 | | | Series 2018-3A(f)(j) | | 3M SOFR + 6.48% | | | 10/22/2031 | | | $ | 839,041 | |
| | 1,500,000 | | | Series 2018-3A(f)(j) | | 3M SOFR + 3.66% | | | 10/22/2031 | | | | 1,489,084 | |
| | | | | Upland CLO, Ltd. | | | | | | | | | | |
| | 500,000 | | | Series 2018-1A(f)(j) | | 3M SOFR + 3.16% | | | 04/20/2031 | | | | 503,002 | |
| | | | | Vibrant Clo III, Ltd. | | | | | | | | | | |
| | 1,050,000 | | | Series 2018-3A(f)(j) | | 3M SOFR + 3.76% | | | 10/20/2031 | | | | 1,055,516 | |
| | | | | Vibrant CLO IV-R, Ltd. | | | | | | | | | | |
| | 1,000,000 | | | Series 2024-4RA(f)(j) | | | | | 10/20/2037 | | | | 1,000,000 | |
| | | | | Voya CLO 2017-2 | | | | | | | | | | |
| | 1,000,000 | | | Series 2017-2A(f)(j) | | 3M SOFR + 6.28% | | | 06/07/2030 | | | | 982,506 | |
| | | | | Voya CLO 2020-1, Ltd. | | | | | | | | | | |
| | 1,000,000 | | | Series 2021-1A(f)(j) | | 3M CME TERM SOFR + 6.61% | | | 07/16/2034 | | | | 1,001,498 | |
| | | | | Voya CLO, Ltd. | | | | | | | | | | |
| | 500,000 | | | Series 2018-1A(f)(j) | | 3M SOFR + 3.06% | | | 04/18/2031 | | | | 502,429 | |
| | 1,000,000 | | | Series 2018-2A(f)(j) | | 3M SOFR + 3.01% | | | 07/15/2031 | | | | 1,004,134 | |
| | 1,000,000 | | | Series 2018-2A(f)(j) | | 3M SOFR + 5.51% | | | 07/15/2031 | | | | 938,204 | |
| | 500,000 | | | Series 2018-3A(f)(j) | | 3M SOFR + 6.46% | | | 10/20/2031 | | | | 483,260 | |
| | 500,000 | | | Series 2018-4A(f)(j) | | 3M SOFR + 6.21% | | | 07/14/2031 | | | | 483,350 | |
| | | | | Wellfleet CLO 2021-1, Ltd. | | | | | | | | | | |
| | 1,000,000 | | | Series 2021-1A(f)(j) | | 3M CME TERM SOFR + 6.87% | | | 04/20/2034 | | | | 959,488 | |
| | | | | Wind River 2013-1 CLO, Ltd. | | | | | | | | | | |
| | 500,000 | | | Series 2017-1A(f)(j) | | 3M SOFR + 3.91% | | | 07/20/2030 | | | | 500,818 | |
| | | | | Wind River 2021-1 CLO, Ltd. | | | | | | | | | | |
| | 1,000,000 | | | Series 2024-1A(f)(j) | | 3M CME TERM SOFR + 3.95% | | | 07/20/2037 | | | | 999,949 | |
| | | | | Wind River 2021-2 CLO, Ltd. | | | | | | | | | | |
| | 500,000 | | | Series 2021-2A(f)(j) | | 3M SOFR + 6.69% | | | 07/20/2034 | | | | 459,828 | |
| | | | | Wind River 2021-3 CLO, Ltd. | | | | | | | | | | |
| | 750,000 | | | Series 2021-3A(f)(j) | | 3M CME TERM SOFR + 6.86% | | | 07/20/2033 | | | | 704,930 | |
| Jersey - 0.36% | | | | | | | | | | |
| | | | | Bain Capital Credit Clo 2019-4, Ltd. | | | | | | | | | | |
| | 500,000 | | | Series 2022-4A(f)(j) | | 3M SOFR + 3.63% | | | 04/23/2035 | | | | 500,502 | |
| | | | | Bain Capital Credit CLO 2022-3, Ltd. | | | | | | | | | | |
| | 1,000,000 | | | Series 2022-3A(f)(j) | | 3M SOFR + 7.35% | | | 07/17/2035 | | | | 992,769 | |
| | | | | Bain Capital Credit CLO 2023-3, Ltd. | | | | | | | | | | |
| | 500,000 | | | Series 2023-3A(f)(j) | | 3M SOFR + 5.25% | | | 07/24/2036 | | | | 514,947 | |
| | | | | Katayma CLO I, Ltd. | | | | | | | | | | |
| | 500,000 | | | Series 2023-1A(f)(j) | | 3M CME TERM SOFR + 5.25% | | | 10/20/2036 | | | | 513,034 | |
See Notes to Financial Statements and Financial Highlights.
| Annual Report | September 30, 2024 | 29 |
| RiverNorth/DoubleLine Strategic Income Fund | Schedule of Investments |
September 30, 2024
| Principal Amount/Description | | Rate | | | Maturity | | | Value | |
| | | | | Storm King Park CLO, Ltd. | | | | | | | | | | |
| $ | 1,000,000 | | | Series 2024-1A(f)(j) | | 3M CME TERM SOFR + 1.36% | | | 10/15/2037 | | | $ | 1,000,000 | |
| | | | | Voya CLO 2022-3, Ltd. | | | | | | | | | | |
| | 1,000,000 | | | Series 2023-3A(f)(j) | | 3M CME TERM SOFR + 4.50% | | | 10/20/2036 | | | | 1,019,341 | |
| | | | | | | | | | | |
| TOTAL COLLATERALIZED LOAN OBLIGATIONS | | | | | | | | | | |
| (Cost $68,183,125) | | | | | | | | | 68,332,136 | |
| | | | | | | | | | | | | | | |
| EQUITY - LINKED NOTES - 0.00%(b) | | | | | | | | | | |
| Spain – 0.00% | | | | | | | | | | |
| | 263,093 | | | Inverpamplona SA(d)(k) | | 0.00% | | | 12/30/2028 | | | | – | |
| | | | | | | | | | | | | | | |
| TOTAL EQUITY - LINKED NOTES | | | | | | | | | | |
| (Cost $11,250) | | | | | | | | | – | |
| | | | | | | | | | | | | | | |
| NON-AGENCY COLLATERALIZED MORTGAGE OBLIGATIONS - 18.42% | | | | | | | | | | |
| Bermuda - 0.13% | | | | | | | | | | |
| | | | | Shelter Growth CRE Issuer, Ltd. | | | | | | | | | | |
| | 1,050,000 | | | Series 2022-FL4(f)(j) | | 1M CME TERM SOFR + 4.01% | | | 01/19/2027 | | | | 1,053,772 | |
| | | | | Start, Ltd. | | | | | | | | | | |
| | 412,483 | | | Series 2018-1(f) | | 4.09% | | | 05/15/2025 | | | | 400,578 | |
| | | | | Textainer Marine Containers VII, Ltd. | | | | | | | | | | |
| | 248,000 | | | Series 2024-1A(f) | | 5.25% | | | 01/20/2036 | | | | 250,586 | |
| Cayman Islands - 3.49% | | | | | | | | | | |
| | | | | Arbor Realty Commercial Real Estate Notes, Ltd. | | | | | | | | | | |
| | 155,783 | | | Series 2021-FL3(f)(j) | | 1M CME TERM SOFR + 1.18% | | | 07/15/2026 | | | | 155,549 | |
| | 1,100,000 | | | Series 2022-FL1(f)(j) | | 30D US SOFR +2.30% | | | 01/15/2027 | | | | 1,082,065 | |
| | | | | AREIT | | | | | | | | | | |
| | 1,150,000 | | | Series 2022-CRE6(f)(j) | | 30D US SOFR +3.40% | | | 01/17/2025 | | | | 1,101,488 | |
| | | | | AREIT, Ltd. | | | | | | | | | | |
| | 220,000 | | | Series 2024-CRE9(f)(j) | | 1M CME TERM SOFR + 2.54% | | | 02/17/2029 | | | | 220,406 | |
| | 700,000 | | | Series 2024-CRE9(f)(j) | | 1M CME TERM SOFR + 4.29% | | | 02/17/2029 | | | | 698,941 | |
| | | | | BRSP, Ltd. | | | | | | | | | | |
| | 225,838 | | | Series 2021-FL1(f)(j) | | 1M CME TERM SOFR + 1.26% | | | 08/19/2038 | | | | 225,599 | |
See Notes to Financial Statements and Financial Highlights.
| 30 | (888) 848-7569 | www.rivernorth.com |
| RiverNorth/DoubleLine Strategic Income Fund | Schedule of Investments |
September 30, 2024
| Principal Amount/Description | | Rate | | | Maturity | | | Value | |
| | | | | BSPRT Issuer, Ltd. | | | | | | | | | | |
| $ | 1,200,000 | | | Series 2021-FL7(f)(j) | | 1M CME TERM SOFR + 3.51% | | | 12/15/2038 | | | $ | 1,175,174 | |
| | | | | Cathedral Lake VIII, Ltd. | | | | | | | | | | |
| | 1,000,000 | | | Series 2021-8A(f)(j) | | 3M SOFR + 2.88% | | | 01/20/2035 | | | | 1,005,072 | |
| | 1,000,000 | | | Series 2021-8A(f)(j) | | 3M SOFR + 3.68% | | | 01/20/2035 | | | | 1,006,787 | |
| | | | | CIFC Funding 2019-III, Ltd. | | | | | | | | | | |
| | 650,000 | | | Series 2021-3A(f)(j) | | 3M SOFR + 7.06% | | | 10/16/2034 | | | | 655,089 | |
| | | | | Dryden 38 Senior Loan Fund | | | | | | | | | | |
| | 1,000,000 | | | Series 2018-38A(f)(j) | | 3M SOFR + 5.86% | | | 07/15/2030 | | | | 934,728 | |
| | | | | Dryden 40 Senior Loan Fund | | | | | | | | | | |
| | 1,000,000 | | | Series 2018-40A(f)(j) | | 3M SOFR + 6.01% | | | 08/15/2031 | | | | 921,119 | |
| | 500,000 | | | Series 2018-40A(f)(j) | | 3M SOFR + 3.36% | | | 08/15/2031 | | | | 500,621 | |
| | | | | Dryden 45 Senior Loan Fund | | | | | | | | | | |
| | 1,250,000 | | | Series 2018-45A(f)(j) | | 3M CME TERM SOFR + 6.11% | | | 10/15/2030 | | | | 1,174,238 | |
| | | | | Greystone CRE Notes, Ltd. | | | | | | | | | | |
| | 284,237 | | | Series 2021-FL3(f)(j) | | 1M CME TERM SOFR + 1.13% | | | 07/15/2039 | | | | 283,074 | |
| | 950,000 | | | Series 2021-FL3(f)(j) | | 1M CME TERM SOFR + 2.31% | | | 07/15/2039 | | | | 933,117 | |
| | | | | HGI CRE CLO, Ltd. | | | | | | | | | | |
| | 1,000,000 | | | Series 2021-FL1(f)(j) | | 1M CME TERM SOFR + 2.46% | | | 06/16/2036 | | | | 951,283 | |
| | | | | Highbridge Loan Management 4-2014, Ltd. | | | | | | | | | | |
| | 500,000 | | | Series 2018-2014(f)(j) | | 3M SOFR + 5.81% | | | 01/28/2030 | | | | 502,577 | |
| | | | | Horizon Aircraft Finance IV, Ltd. | | | | | | | | | | |
| | 500,000 | | | Series 2024-1(f) | | 5.38% | | | 09/15/2031 | | | | 501,824 | |
| | | | | Kestrel Aircraft Funding, Ltd. | | | | | | | | | | |
| | 269,248 | | | Series 2018-1A(f) | | 4.25% | | | 10/15/2025 | | | | 259,328 | |
| | | | | LCM 28, Ltd. | | | | | | | | | | |
| | 1,000,000 | | | Series 2018-28A(f)(j) | | 3M SOFR + 6.01% | | | 10/20/2030 | | | | 805,455 | |
| | | | | LCM Loan Income Fund I Income Note Issuer, Ltd. | | | | | | | | | | |
| | 500,000 | | | Series 2018-27A(f)(j) | | 3M SOFR + 5.86% | | | 07/16/2031 | | | | 402,811 | |
| | | | | LCM XIV LP | | | | | | | | | | |
| | 1,000,000 | | | Series 2018-14A(f)(j) | | 3M SOFR + 3.01% | | | 07/20/2031 | | | | 999,948 | |
| | 750,000 | | | Series 2018-14A(f)(j) | | 3M SOFR + 5.76% | | | 07/20/2031 | | | | 571,660 | |
| | | | | LCM XVII LP | | | | | | | | | | |
| | 1,000,000 | | | Series 2018-17A(f)(j) | | 3M SOFR + 6.26% | | | 10/15/2031 | | | | 781,663 | |
| | | | | LoanCore Issuer, Ltd. | | | | | | | | | | |
| | 625,000 | | | Series 2021-CRE5(f)(j) | | 1M CME TERM SOFR + 2.46% | | | 07/15/2036 | | | | 615,608 | |
| | | | | MACH 1 Cayman, Ltd. | | | | | | | | | | |
| | 700,608 | | | Series 2019-1(f) | | 3.47% | | | 08/15/2026 | | | | 658,844 | |
See Notes to Financial Statements and Financial Highlights.
| Annual Report | September 30, 2024 | 31 |
| RiverNorth/DoubleLine Strategic Income Fund | Schedule of Investments |
September 30, 2024
| Principal Amount/Description | | Rate | | | Maturity | | | Value | |
| | | | | Madison Park Funding XLV, Ltd. | | | | | | | | | | |
| $ | 600,000 | | | Series 2021-45A(f)(j) | | 3M SOFR + 6.61% | | | 07/15/2034 | | | $ | 603,239 | |
| | | | | Madison Park Funding XXXVIII, Ltd. | | | | | | | | | | |
| | 1,000,000 | | | Series 2021-38A(f)(j) | | 3M SOFR + 6.26% | | | 07/17/2034 | | | | 1,001,474 | |
| | | | | Magnetite XXIX, Ltd. | | | | | | | | | | |
| | 500,000 | | | Series 2024-29A(f)(j) | | 3M CME TERM SOFR + 6.00% | | | 07/15/2037 | | | | 502,234 | |
| | | | | Magnetite Xxxiii, Ltd. | | | | | | | | | | |
| | 500,000 | | | Series 2024-33A(f)(j) | | 3M CME TERM SOFR + 3.00% | | | 10/20/2037 | | | | 500,000 | |
| | 1,000,000 | | | Series 2024-33A(f)(j) | | TSFR3M + 5.55% | | | 10/20/2037 | | | | 1,000,000 | |
| | | | | MF1, Ltd. | | | | | | | | | | |
| | 300,000 | | | Series 2021-FL7(f)(j) | | 1M CME TERM SOFR + 1.86% | | | 10/16/2036 | | | | 293,354 | |
| | | | | Octagon 59, Ltd. | | | | | | | | | | |
| | 500,000 | | | Series 2022-1A(f)(j) | | 3M CME TERM SOFR + 7.60% | | | 05/15/2035 | | | | 498,438 | |
| | | | | Octagon Investment Partners 26, Ltd. | | | | | | | | | | |
| | 1,000,000 | | | Series 2018-1A(f)(j) | | 3M SOFR + 8.35% | | | 07/15/2030 | | | | 662,901 | |
| | | | | Octagon Investment Partners 37, Ltd. | | | | | | | | | | |
| | 500,000 | | | Series 2018-2A(f)(j) | | 3M US L + 2.85% | | | 07/25/2030 | | | | 502,195 | |
| | | | | Octagon Investment Partners 40, Ltd. | | | | | | | | | | |
| | 500,000 | | | Series 2021-1A(f)(j) | | 3M SOFR + 7.26% | | | 01/20/2035 | | | | 469,813 | |
| | | | | Octagon Investment Partners 42, Ltd. | | | | | | | | | | |
| | 1,000,000 | | | Series 2024-3A(f)(j) | | 3M CME TERM SOFR + 7.53% | | | 07/15/2037 | | | | 999,552 | |
| | | | | Octagon Investment Partners 46, Ltd. | | | | | | | | | | |
| | 1,000,000 | | | Series 2021-2A(f)(j) | | 3M SOFR + 6.86% | | | 07/15/2036 | | | | 880,707 | |
| | | | | Octagon Investment Partners XVI, Ltd. | | | | | | | | | | |
| | 500,000 | | | Series 2018-1A(f)(j) | | 3M US L + 3.00% | | | 07/17/2030 | | | | 502,892 | |
| | 1,000,000 | | | Series 2018-1A(f)(j) | | 3M US L + 5.75% | | | 07/17/2030 | | | | 934,603 | |
| | | | | Octagon Investment Partners XXI, Ltd. | | | | | | | | | | |
| | 1,000,000 | | | Series 2019-1A(f)(j) | | 3M SOFR + 7.26% | | | 02/14/2031 | | | | 998,242 | |
| | | | | Octagon Investment Partners XXII, Ltd. | | | | | | | | | | |
| | 500,000 | | | Series 2018-1A(f)(j) | | 3M SOFR + 5.71% | | | 01/22/2030 | | | | 474,770 | |
| | | | | OHA Credit Funding 3, Ltd. | | | | | | | | | | |
| | 2,000,000 | | | Series 2021-3A(f)(j) | | 3M SOFR + 6.51% | | | 07/02/2035 | | | | 2,019,700 | |
See Notes to Financial Statements and Financial Highlights.
| 32 | (888) 848-7569 | www.rivernorth.com |
| RiverNorth/DoubleLine Strategic Income Fund | Schedule of Investments |
September 30, 2024
| Principal Amount/Description | | Rate | | | Maturity | | | Value | |
| | | | | OHA Credit Funding 5, Ltd. | | | | | | | | | | |
| $ | 2,000,000 | | | Series 2020-5A(f)(j) | | 3M SOFR + 6.51% | | | 04/18/2033 | | | $ | 2,014,960 | |
| | | | | RR 2, Ltd. | | | | | | | | | | |
| | 1,000,000 | | | Series 2021-2A(f)(j) | | 3M SOFR + 6.06% | | | 04/15/2036 | | | | 1,004,654 | |
| | | | | RR 6, Ltd. | | | | | | | | | | |
| | 1,000,000 | | | Series 2021-6A(f)(j) | | 3M SOFR + 6.11% | | | 04/15/2036 | | | | 991,117 | |
| | | | | Sapphire Aviation Finance I, Ltd. | | | | | | | | | | |
| | 533,397 | | | Series 2018-1A(f) | | 5.93% | | | 03/15/2025 | | | | 455,234 | |
| | | | | STWD, Ltd. | | | | | | | | | | |
| | 1,250,000 | | | Series 2019-FL1(f)(j) | | 1M CME TERM SOFR + 2.46% | | | 02/15/2025 | | | | 1,219,685 | |
| | 550,000 | | | Series 2021-FL2(f)(j) | | 1M CME TERM SOFR + 2.21% | | | 01/18/2026 | | | | 530,087 | |
| | | | | Thunderbolt II Aircraft Lease, Ltd. | | | | | | | | | | |
| | 4,464,286 | | | Series 2018-A(f)(m) | | 5.07% | | | 09/15/2038 | | | | 3,388,134 | |
| | | | | Trimaran Cavu 2019-1, Ltd. | | | | | | | | | | |
| | 1,700,000 | | | Series 2019-1A(f)(j) | | 3M SOFR + 4.41% | | | 07/20/2032 | | | | 1,687,177 | |
| | | | | TRTX Issuer, Ltd. | | | | | | | | | | |
| | 233,485 | | | Series 2021-FL4(f)(j) | | 1M SOFR + 1.31% | | | 03/15/2038 | | | | 232,856 | |
| | 1,160,000 | | | Series 2021-FL4(f)(j) | | 1M CME TERM SOFR + 2.51% | | | 03/15/2038 | | | | 1,140,263 | |
| United States - 14.80% | | | | | | | | | | |
| | | | | Aaset 2021-2 Trust | | | | | | | | | | |
| | 360,310 | | | Series 2021-2A(f) | | 3.54% | | | 12/15/2028 | | | | 326,770 | |
| | | | | AASET 2024-1 | | | | | | | | | | |
| | 491,713 | | | Series 2024-1A(f) | | 6.26% | | | 05/16/2031 | | | | 512,550 | |
| | 1,244,748 | | | Series 2024-1A(f) | | 6.90% | | | 05/16/2031 | | | | 1,275,278 | |
| | | | | ABFC Trust | | | | | | | | | | |
| | 2,396,269 | | | Series 2007-WMC1(j) | | 1M SOFR + 1.36% | | | 06/25/2037 | | | | 1,735,766 | |
| | | | | Alen Mortgage Trust | | | | | | | | | | |
| | 1,107,000 | | | Series 2021-ACEN(f)(j) | | 1M SOFR + 4.11% | | | 04/15/2026 | | | | 473,796 | |
| | | | | AMSR | | | | | | | | | | |
| | 5,100,000 | | | Series 2020-SFR3(f) | | 4.99% | | | 09/17/2025 | | | | 5,030,554 | |
| | 5,000,000 | | | Series 2021-SFR1(f) | | 4.61% | | | 06/17/2028 | | | | 4,612,268 | |
| | | | | BAMLL Commercial Mortgage Securities Trust | | | | | | | | | | |
| | 1,164,000 | | | Series 2013-WBRK(f)(j) | | 3.65% | | | 03/10/2025 | | | | 1,126,643 | |
| | | | | BANK | | | | | | | | | | |
| | 10,291,000 | | | Series 2018-BN12(f)(j)(n) | | 1.50% | | | 05/15/2061 | | | | 441,428 | |
| | 165,000 | | | Series 2022-BNK39(f) | | 2.50% | | | 01/15/2032 | | | | 106,415 | |
| | 660,000 | | | Series 2022-BNK39 | | 3.18% | | | 01/15/2032 | | | | 585,931 | |
| | | | | BANK 2019-BNK23 | | | | | | | | | | |
| | 330,000 | | | Series 2019-BN23 | | 2.92% | | | 12/15/2052 | | | | 305,117 | |
| | | | | BANK 2020-BNK27 | | | | | | | | | | |
| | 16,875,000 | | | Series 2020-BN27(f)(j)(n) | | 0.83% | | | 04/15/2030 | | | | 573,007 | |
See Notes to Financial Statements and Financial Highlights.
| Annual Report | September 30, 2024 | 33 |
| RiverNorth/DoubleLine Strategic Income Fund | Schedule of Investments |
September 30, 2024
| Principal Amount/Description | | Rate | | | Maturity | | | Value | |
| | | | BANK 2021-BNK35 | | | | | | | | | |
| $ | 316,000 | | | Series 2021-BN35 | | 2.29% | | | 07/15/2031 | | | $ | 275,141 | |
| | | | | BANK 2021-BNK37 | | | | | | | | | | |
| | 381,000 | | | Series 2021-BN37(j) | | 3.21% | | | 11/15/2031 | | | | 287,330 | |
| | | | | Bank of America Merrill Lynch Commercial Mortgage Trust 2016-UBS10 | | | | | | | | | | |
| | 1,090,000 | | | Series 2016-UB10(j) | | 4.99% | | | 05/15/2026 | | | | 1,045,407 | |
| | | | | BANK5 | | | | | | | | | | |
| | 306,000 | | | Series 2024-5YR9 | | 5.61% | | | 08/15/2029 | | | | 319,542 | |
| | | | | BBCMS Mortgage Trust | | | | | | | | | | |
| | 500,000 | | | Series 2018-C2(j) | | 5.13% | | | 12/15/2028 | | | | 458,299 | |
| | 519,000 | | | Series 2022-C17 | | 4.44% | | | 08/15/2032 | | | | 513,020 | |
| | 5,542,000 | | | Series 2024-5C27(f)(j)(n) | | 2.97% | | | 06/15/2029 | | | | 626,723 | |
| | 310,000 | | | Series 2024-5C29 | | 5.21% | | | 09/15/2029 | | | | 319,448 | |
| | 233,000 | | | Series 2024-5C29 | | 5.51% | | | 09/15/2029 | | | | 233,104 | |
| | 450,000 | | | Series 2024-5C29(f) | | 4.00% | | | 09/15/2029 | | | | 383,629 | |
| | | | | BBCMS Trust | | | | | | | | | | |
| | 3,000,000 | | | Series 2018-CBM(f)(j) | | 1M SOFR + 3.85% | | | 07/15/2037 | | | | 2,718,148 | |
| | | | | BDS LLC | | | | | | | | | | |
| | 300,000 | | | Series 2022-FL11(f)(j) | | 1M CME TERM SOFR + 2.35% | | | 03/19/2039 | | | | 301,035 | |
| | | | | Benchmark Mortgage Trust | | | | | | | | | | |
| | 8,655,786 | | | Series 2018-B2(j)(n) | | 0.59% | | | 01/15/2028 | | | | 99,254 | |
| | 600,000 | | | Series 2018-B2(j) | | 4.43% | | | 01/15/2028 | | | | 519,091 | |
| | 19,373,402 | | | Series 2018-B4(j)(n) | | 0.60% | | | 06/15/2028 | | | | 262,281 | |
| | 1,589,000 | | | Series 2018-B4(f)(j) | | 2.90% | | | 07/15/2028 | | | | 1,265,959 | |
| | 300,000 | | | Series 2019-B13 | | 2.70% | | | 08/15/2029 | | | | 276,808 | |
| | 1,130,000 | | | Series 2019-B9(j) | | 4.97% | | | 01/15/2029 | | | | 972,152 | |
| | 522,000 | | | Series 2020-B18(f) | | 4.14% | | | 08/15/2025 | | | | 495,032 | |
| | 1,510,000 | | | Series 2021-B31(f) | | 2.25% | | | 11/15/2031 | | | | 820,172 | |
| | 592,000 | | | Series 2022-B32(j) | | 3.53% | | | 01/15/2032 | | | | 514,300 | |
| | 1,200,000 | | | Series 2024-V10(f) | | 4.50% | | | 09/15/2029 | | | | 1,072,152 | |
| | 300,000 | | | Series 2024-V8 | | 5.71% | | | 05/15/2029 | | | | 314,171 | |
| | 250,000 | | | Series 2024-V8(f) | | 4.00% | | | 07/15/2029 | | | | 217,160 | |
| | 305,000 | | | Series 2024-V9 | | 5.60% | | | 08/15/2029 | | | | 317,605 | |
| | | | | BF Mortgage Trust | | | | | | | | | | |
| | 705,000 | | | Series 2019-NYT(f)(j) | | 1M SOFR + 3.05% | | | 12/15/2035 | | | | 489,073 | |
| | | | | Blackbird Capital II Aircraft Lease, Ltd. | | | | | | | | | | |
| | 1,079,787 | | | Series 2021-1A(f) | | 3.45% | | | 07/15/2028 | | | | 992,365 | |
| | 320,000 | | | BMARK 2024-V10 A3 | | | | | 10/15/2029 | | | | 329,844 | |
| | | | | BMO Mortgage Trust | | | | | | | | | | |
| | 7,951,000 | | | Series 2022-C1(f)(j)(n) | | 1.89% | | | 02/15/2032 | | | | 854,526 | |
| | 228,466 | | | Series 2023-C5 | | 5.74% | | | 02/15/2028 | | | | 231,345 | |
| | 309,000 | | | Series 2024-5C6 | | 5.32% | | | 09/15/2029 | | | | 318,479 | |
See Notes to Financial Statements and Financial Highlights.
| 34 | (888) 848-7569 | www.rivernorth.com |
| RiverNorth/DoubleLine Strategic Income Fund | Schedule of Investments |
September 30, 2024
| Principal Amount/Description | | Rate | | | Maturity | | | Value | |
| $ | 1,150,000 | | | Series 2024-5C6(f) | | 4.50% | | | 09/15/2029 | | | $ | 1,016,153 | |
| | 6,394,000 | | | Series 2024-C9(f)(j)(n) | | 2.10% | | | 07/15/2034 | | | | 893,441 | |
| | | | | BSPRT Issuer, Ltd. | | | | | | | | | | |
| | 300,000 | | | Series 2023-FL10(f)(j) | | 1M CME TERM SOFR + 3.27% | | | 08/15/2028 | | | | 299,107 | |
| | | | | Business Jet Securities 2024-2 LLC | | | | | | | | | | |
| | 1,250,000 | | | Series 2024-2A(f) | | 7.97% | | | 09/15/2030 | | | | 1,267,287 | |
| | | | | BX Commercial Mortgage Trust | | | | | | | | | | |
| | 1,000,000 | | | Series 2019-IMC(f)(j) | | 1M SOFR + 2.01% | | | 04/15/2034 | | | | 984,274 | |
| | | | | BX Trust | | | | | | | | | | |
| | 3,042,000 | | | Series 2019-OC11(f)(j) | | 4.08% | | | 12/09/2029 | | | | 2,749,276 | |
| | 370,000 | | | Series 2021-VIEW(f)(j) | | 1M CME TERM SOFR + 1.91% | | | 06/15/2023 | | | | 361,251 | |
| | 780,000 | | | Series 2021-VIEW(f)(j) | | 1M CME TERM SOFR + 3.01% | | | 06/15/2023 | | | | 751,219 | |
| | | | | Cantor Commercial Real Estate Lending | | | | | | | | | | |
| | 1,113,000 | | | Series 2019-CF1(f)(j) | | 4.12% | | | 04/15/2024 | | | | 444,431 | |
| | | | | Carbon Capital VI Commercial Mortgage Trust | | | | | | | | | | |
| | 995,228 | | | Series 2019-FL2(f)(j) | | 1M SOFR + 2.96% | | | 10/15/2035 | | | | 515,783 | |
| | | | | Carvana Auto Receivables Trust | | | | | | | | | | |
| | 5,300 | | | Series 2021-N1(f) | | 0.00% | | | 01/10/2028 | | | | 569,056 | |
| | | | | Cascade MH Asset Trust | | | | | | | | | | |
| | 4,601,000 | | | Series 2019-MH1(f)(j) | | 5.99% | | | 10/25/2024 | | | | 4,421,274 | |
| | | | | Castlelake Aircraft Securitization Trust | | | | | | | | | | |
| | 3,379,603 | | | Series 2018-1(f) | | 6.63% | | | 06/15/2043 | | | | 1,093,609 | |
| | | | | Castlelake Aircraft Structured Trust | | | | | | | | | | |
| | 2,750,000 | | | Series 2019-1A(f)(j) | | 0.00% | | | 04/15/2039 | | | | 114,125 | |
| | | | | Castlelake Aircraft Structured Trust 2021-1 | | | | | | | | | | |
| | 1,127,792 | | | Series 2021-1A(f) | | 7.00% | | | 10/15/2026 | | | | 1,045,337 | |
| | | | | CFCRE Commercial Mortgage Trust | | | | | | | | | | |
| | 432,966 | | | Series 2016-C6 | | 2.95% | | | 08/10/2026 | | | | 422,654 | |
| | 512,350 | | | CGCMT 2014-GC25 XA(n) | | | | | 10/10/2047 | | | | 8 | |
| | | | | Citigroup Commercial Mortgage Trust | | | | | | | | | | |
| | 866,000 | | | Series 2015-GC27(f)(j) | | 4.57% | | | 01/10/2025 | | | | 798,603 | |
| | 400,000 | | | Series 2015-GC31(j) | | 4.05% | | | 06/10/2025 | | | | 243,694 | |
| | 225,000 | | | Series 2019-GC41 | | 3.20% | | | 08/10/2029 | | | | 195,749 | |
| | 1,433,000 | | | Series 2020-555(f)(j) | | 3.62% | | | 12/10/2029 | | | | 1,102,853 | |
| | 546,000 | | | Series 2022-GC48(j) | | 4.74% | | | 05/15/2032 | | | | 545,834 | |
See Notes to Financial Statements and Financial Highlights.
| Annual Report | September 30, 2024 | 35 |
| RiverNorth/DoubleLine Strategic Income Fund | Schedule of Investments |
September 30, 2024
| Principal Amount/Description | | Rate | | | Maturity | | | Value | |
| | | | | Citigroup Mortgage Loan Trust | | | | | | | | | | |
| $ | 574,685 | | | Series 2006-WF1(m) | | 4.56% | | | 03/25/2036 | | | $ | 278,634 | |
| | | | | Cologix Data Centers US Issuer LLC | | | | | | | | | | |
| | 2,800,000 | | | Series 2021-1A(f) | | 5.99% | | | 12/28/2026 | | | | 2,629,046 | |
| | 2,142,532 | | | COMM 2015-CR22 XA(n) | | | | | 03/10/2048 | | | | 731 | |
| | | | | Commercial Mortgage Pass-Through Certificates | | | | | | | | | | |
| | 6,903,559 | | | Series 2014-UBS4(f) | | 3.75% | | | 08/10/2024 | | | | 222,927 | |
| | 11,000 | | | Series 2014-UBS4(f)(j) | | 0.00% | | | 08/10/2047 | | | | 1 | |
| | 3,983,859 | | | Series 2015-CR26(j)(n) | | 0.93% | | | 09/10/2025 | | | | 16,725 | |
| | | | | Compass Datacenters Issuer II LLC | | | | | | | | | | |
| | 500,000 | | | Series 2024-2A(f) | | 6.00% | | | 08/27/2029 | | | | 502,903 | |
| | | | | CSAB Mortgage-Backed Trust | | | | | | | | | | |
| | 8,781,274 | | | Series 2006-2(m) | | 6.20% | | | 09/25/2036 | | | | 595,030 | |
| | 116,697 | | | Series 2007-1(j) | | 5.90% | | | 05/25/2037 | | | | 26,651 | |
| | 3,252,620 | | | CSAIL 2015-C1 XA(n) | | | | | 04/15/2050 | | | | 1,715 | |
| | | | | CSAIL Commercial Mortgage Trust | | | | | | | | | | |
| | 490,000 | | | Series 2016-C6(j) | | 5.08% | | | 04/15/2026 | | | | 452,238 | |
| | 1,000,000 | | | Series 2019-C16(j) | | 4.24% | | | 06/15/2029 | | | | 886,976 | |
| | | | | CSMC | | | | | | | | | | |
| | 350,000 | | | Series 2021-B33(f)(j) | | 3.77% | | | 10/10/2031 | | | | 307,633 | |
| | | | | CSMC Trust | | | | | | | | | | |
| | 370,000 | | | Series 2017-PFHP(f)(j) | | 1M CME TERM SOFR + 1.00% | | | 12/15/2019 | | | | 357,072 | |
| | | | | DBJPM 16-C1 Mortgage Trust | | | | | | | | | | |
| | 1,309,000 | | | Series 2016-C1(j) | | 3.47% | | | 03/10/2026 | | | | 1,153,219 | |
| | | | | Del Amo Fashion Center Trust | | | | | | | | | | |
| | 150,000 | | | Series 2017-AMO(f)(j) | | 3.76% | | | 06/05/2027 | | | | 142,403 | |
| | | | | Diamond Infrastructure Funding LLC | | | | | | | | | | |
| | 2,000,000 | | | Series 2021-1A(f) | | 3.48% | | | 12/20/2026 | | | | 1,859,166 | |
| | | | | DOLP Trust | | | | | | | | | | |
| | 500,000 | | | Series 2021-NYC(f)(j) | | 3.70% | | | 05/10/2031 | | | | 398,211 | |
| | | | | Fannie Mae-Aces | | | | | | | | | | |
| | 22,667,940 | | | Series 2019-M12(j)(n) | | 0.68% | | | 06/25/2029 | | | | 347,141 | |
| | 14,031,656 | | | Series 2019-M24(j)(n) | | 1.27% | | | 03/25/2031 | | | | 729,744 | |
| | 35,600,848 | | | Series 2019-M7(j)(n) | | 0.44% | | | 04/25/2029 | | | | 448,403 | |
| | 27,398,337 | | | Series 2020-M10(j)(n) | | 0.82% | | | 12/25/2027 | | | | 319,109 | |
| | 47,281,262 | | | Series 2020-M10(j)(n) | | 0.99% | | | 07/25/2032 | | | | 1,951,057 | |
| | 13,134,734 | | | Series 2020-M13(j)(n) | | 1.30% | | | 09/25/2030 | | | | 544,116 | |
| | 344,237,669 | | | Series 2021-M17(j)(n) | | 0.16% | | | 07/25/2031 | | | | 1,342,286 | |
| | | | | FirstKey Homes | | | | | | | | | | |
| | 1,100,000 | | | Series 2020-SFR1(f) | | 4.28% | | | 09/17/2025 | | | | 1,080,104 | |
See Notes to Financial Statements and Financial Highlights.
| 36 | (888) 848-7569 | www.rivernorth.com |
| RiverNorth/DoubleLine Strategic Income Fund | Schedule of Investments |
September 30, 2024
| Principal Amount/Description | | Rate | | | Maturity | | | Value | |
| $ | 2,673,354 | | | Series 2022-SFR1(f) | | 4.15% | | | 05/17/2027 | | | $ | 2,650,464 | |
| | | | | FMC GMSR Issuer Trust | | | | | | | | | | |
| | 6,000,000 | | | Series 2021-GT1(f)(j) | | 4.36% | | | 07/25/2026 | | | | 5,517,381 | |
| | 5,000,000 | | | Series 2021-GT2(f)(j) | | 4.44% | | | 10/25/2026 | | | | 4,580,421 | |
| | 42,878,055 | | | FNA 2021-M23 X1(n) | | | | | 11/01/2031 | | | | 766,557 | |
| | | | | FREMF Mortgage Trust | | | | | | | | | | |
| | 890,367 | | | Series 2015-KF07(f)(j) | | 30D US SOFR +5.06% | | | 02/25/2025 | | | | 887,835 | |
| | 887,222 | | | Series 2016-KF25(f)(j) | | 30D US SOFR + 5.11% | | | 05/25/2024 | | | | 885,645 | |
| | 709,905 | | | Series 2018-KF56(f)(j) | | 30D US SOFR + 5.91% | | | 11/25/2028 | | | | 624,770 | |
| | 1,496,871 | | | Series 2019-KF71(f)(j) | | 30D US SOFR + 6.11% | | | 10/25/2029 | | | | 1,441,243 | |
| | | | | FRTKL | | | | | | | | | | |
| | 4,050,000 | | | Series 2021-SFR1(f) | | 4.11% | | | 09/17/2026 | | | | 3,747,230 | |
| | | | | Ginnie Mae Strip | | | | | | | | | | |
| | 6,975,993 | | | Series 2020-3(n) | | 1.40% | | | 09/16/2045 | | | | 448,187 | |
| | | | | Great Wolf Trust | | | | | | | | | | |
| | 820,000 | | | Series 2024-WOLF(f)(j) | | 1M CME TERM SOFR + 3.639% | | | 03/15/2029 | | | | 823,993 | |
| | | | | GS Mortgage Securities Corp. Trust | | | | | | | | | | |
| | 1,000,000 | | | Series 2018-RIVR(f)(j) | | 1M SOFR + 1.85% | | | 07/15/2035 | | | | 17,493 | |
| | 1,111,000 | | | Series 2021-ARDN(f)(j) | | 1M SOFR + 6.05% | | | 11/15/2026 | | | | 1,099,623 | |
| | | | | GS Mortgage Securities Trust | | | | | | | | | | |
| | 220,030 | | | Series 2011-GC5(f)(j)(n) | | 1.95% | | | 08/10/2044 | | | | 2 | |
| | 2,417,000 | | | Series 2014-GC26(f)(j) | | 4.65% | | | 11/10/2047 | | | | 1,488,147 | |
| | 1,110,000 | | | Series 2015-GC28(f)(j) | | 4.53% | | | 02/10/2048 | | | | 1,032,977 | |
| | 6,706,549 | | | Series 2015-GS1(j)(n) | | 0.77% | | | 11/10/2025 | | | | 38,633 | |
| | 828,000 | | | Series 2018-GS10(j) | | 4.51% | | | 07/10/2028 | | | | 752,675 | |
| | 1,954,000 | | | Series 2018-TWR(f)(j) | | 1M US L + 3.92% | | | 07/15/2031 | | | | 40,624 | |
| | 636,000 | | | Series 2020-GC45(j) | | 3.41% | | | 12/13/2029 | | | | 566,358 | |
| | | | | GSAA Home Equity Trust | | | | | | | | | | |
| | 1,798,721 | | | Series 2006-13(j) | | 6.04% | | | 07/25/2036 | | | | 539,420 | |
| | 437,374 | | | Series 2006-18(m) | | 6.18% | | | 11/25/2036 | | | | 108,424 | |
| | 134,941 | | | Series 2006-6(j) | | 5.69% | | | 03/25/2036 | | | | 38,462 | |
| | 788,116 | | | Series 2007-2(m) | | 6.60% | | | 03/25/2037 | | | | 183,066 | |
| | | | | GSCG Trust | | | | | | | | | | |
| | 675,000 | | | Series 2019-600C(f)(j) | | 3.99% | | | 09/06/2024 | | | | 3,354 | |
| | | | | Hardee's Funding LLC | | | | | | | | | | |
| | 940,000 | | | Series 2018-1A(f) | | 5.71% | | | 06/20/2028 | | | | 926,603 | |
| | | | | HIG RCP LLC | | | | | | | | | | |
| | 1,400,000 | | | Series 2023-FL1(f)(j) | | 1M CME TERM SOFR + 3.61% | | | 04/19/2028 | | | | 1,402,789 | |
See Notes to Financial Statements and Financial Highlights.
| Annual Report | September 30, 2024 | 37 |
| RiverNorth/DoubleLine Strategic Income Fund | Schedule of Investments |
September 30, 2024
| Principal Amount/Description | | Rate | | | Maturity | | | Value | |
| | | | | Hilton USA Trust | | | | | | | | | | |
| $ | 900,000 | | | Series 2016-SFP(f) | | 2.83% | | | 11/05/2035 | | | $ | 774,522 | |
| | | | | Houston Galleria Mall Trust | | | | | | | | | | |
| | 100,000 | | | Series 2015-HGLR(f) | | 3.98% | | | 03/05/2025 | | | | 97,154 | |
| | | | | HSI Asset Securitization Corp. Trust | | | | | | | | | | |
| | 5,400,211 | | | Series 2006-HE1(j) | | 1M SOFR + 0.39% | | | 10/25/2036 | | | | 1,544,936 | |
| | 1,162,428 | | | Series 2007-NC1(j) | | 1M SOFR + 0.29% | | | 04/25/2037 | | | | 792,282 | |
| | | | | HTL Commercial Mortgage Trust | | | | | | | | | | |
| | 300,000 | | | Series 2024-T53(f)(j) | | 6.07% | | | 05/10/2027 | | | | 306,871 | |
| | | | | ITE Rail Fund Levered LP | | | | | | | | | | |
| | 654,863 | | | Series 2021-3A(f) | | 2.21% | | | 06/28/2027 | | | | 612,626 | |
| | | | | J.P. Morgan Chase Commercial Mortgage Securities Trust | | | | | | | | | | |
| | 2,092,000 | | | Series 2018-AON(f)(j) | | 4.61% | | | 07/05/2031 | | | | 575,850 | |
| | 763,684 | | | Series 2019-MFP(f)(j) | | 1M CME TERM SOFR + 1.71% | | | 07/15/2021 | | | | 757,340 | |
| | | | | JP Morgan BB Commercial Mortgage Securities Trust | | | | | | | | | | |
| | 2,086,000 | | | Series 2014-C23(f)(j) | | 3.36% | | | 10/15/2024 | | | | 1,747,550 | |
| | 3,438,972 | | | Series 2015-C28(j)(n) | | 1.00% | | | 03/15/2025 | | | | 8,235 | |
| | 6,972,625 | | | Series 2015-C30(j)(n) | | 0.55% | | | 07/15/2025 | | | | 13,103 | |
| | 2,626,826 | | | Series 2015-C31(j)(n) | | 0.95% | | | 08/15/2025 | | | | 11,953 | |
| | | | | JP Morgan Chase Commercial Mortgage Securities Trust | | | | | | | | | | |
| | 235,000 | | | Series 2019-UES(f) | | 4.34% | | | 05/05/2032 | | | | 197,548 | |
| | 1,135,000 | | | Series 2019-UES(f)(j) | | 4.60% | | | 05/05/2032 | | | | 966,405 | |
| | | | | JP Morgan Mortgage Acquisition Corp. | | | | | | | | | | |
| | 162,885 | | | Series 2006-CH2(m) | | 5.46% | | | 09/25/2029 | | | | 99,264 | |
| | | | | JP Morgan Mortgage Acquisition Trust | | | | | | | | | | |
| | 3,287,589 | | | Series 2006-RM1(j) | | 1M SOFR + 0.59% | | | 08/25/2036 | | | | 1,474,574 | |
| | | | | JPMBB Commercial Mortgage Securities Trust | | | | | | | | | | |
| | 6,084,672 | | | Series 2014-C24(j)(n) | | 0.93% | | | 10/15/2024 | | | | 160 | |
| | | | | JPMCC Commercial Mortgage Securities Trust | | | | | | | | | | |
| | 486,000 | | | Series 2017-JP7(j) | | 3.74% | | | 07/15/2027 | | | | 392,575 | |
| | 781,000 | | | Series 2019-COR5 | | 3.87% | | | 05/13/2029 | | | | 682,885 | |
| | | | | Laurel Road Prime Student Loan Trust | | | | | | | | | | |
| | 12,485,627 | | | Series 2020-A(f) | | 0.00% | | | 11/25/2050 | | | | 1,126,803 | |
| | | | | Master Asset Backed Securities Trust | | | | | | | | | | |
| | 3,776,423 | | | Series 2006-NC3(j) | | 1M US L + 0.21% | | | 10/25/2036 | | | | 1,903,586 | |
See Notes to Financial Statements and Financial Highlights.
| 38 | (888) 848-7569 | www.rivernorth.com |
| RiverNorth/DoubleLine Strategic Income Fund | Schedule of Investments |
| Principal Amount/Description | | Rate | | | Maturity | | | Value | |
| | | | | Merrill Lynch Mortgage Investors Trust | | | | | | | | | | | |
| $ | 9,757,220 | | | Series 2006-RM3(j) | | 1M SOFR + 0.59% | | | | 06/25/2037 | | | $ | 2,136,208 | |
| | | | | MetroNet Infrastructure Issuer LLC | | | | | | | | | | | |
| | 1,000,000 | | | Series 2023-1A(f) | | 8.01% | | | | 02/20/2028 | | | | 1,031,856 | |
| | | | | MF1 | | | | | | | | | | | |
| | 1,000,000 | | | Series 2024-FL15(f)(j) | | 1M CME TERM SOFR + 4.04% | | | | 08/18/2041 | | | | 1,001,428 | |
| | | | | MF1 LLC | | | | | | | | | | | |
| | 300,000 | | | Series 2023-FL12(f)(j) | | 1M CME TERM SOFR + 3.18% | | | | 09/19/2028 | | | | 301,591 | |
| | 1,000,000 | | | Series 2023-FL12(f)(j) | | 1M CME TERM SOFR + 3.78% | | | | 10/19/2028 | | | | 1,001,915 | |
| | 1,200,000 | | | Series 2023-FL12(f)(j) | | 1M CME TERM SOFR + 5.27% | | | | 10/19/2028 | | | | 1,216,490 | |
| | 300,000 | | | Series 2024-FL14(f)(j) | | 1M CME TERM SOFR + 2.24% | | | | 03/19/2039 | | | | 301,047 | |
| | 1,350,000 | | | Series 2024-FL14(f)(j) | | 1M CME TERM SOFR + 4.84% | | | | 03/19/2039 | | | | 1,362,934 | |
| | 900,000 | | | Series 2024-FL14(f)(j) | | 1M CME TERM SOFR + 6.29% | | | | 03/19/2039 | | | | 908,695 | |
| | | | | MFT Trust | | | | | | | | | | | |
| | 2,010,000 | | | Series 2020-ABC(f)(j) | | 3.59% | | | | 02/10/2030 | | | | 794,422 | |
| | | | | Morgan Stanley Bank of America Merrill Lynch Trust | | | | | | | | | | | |
| | 822,000 | | | Series 2015-C21(j) | | 4.26% | | | | 02/15/2025 | | | | 736,651 | |
| | | | | Morgan Stanley Capital I Trust | | | | | | | | | | | |
| | 1,043,456 | | | Series 2016-UB11 XA(j)(n) | | 1.57% | | | | 08/15/2026 | | | | 20,869 | |
| | 1,117,000 | | | Series 2018-L1(j) | | 4.94% | | | | 10/15/2028 | | | | 1,046,936 | |
| | 750,000 | | | Series 2019-H7 | | 4.13% | | | | 07/15/2029 | | | | 681,280 | |
| | 400,000 | | | Series 2021-L6(j) | | 3.57% | | | | 07/15/2031 | | | | 324,342 | |
| | 10,249,000 | | | Series 2021-L7(f)(j)(n) | | 1.04% | | | | 10/15/2031 | | | | 562,670 | |
| | | | | Morgan Stanley Mortgage Loan Trust | | | | | | | | | | | |
| | 319,706 | | | Series 2007-3XS(m) | | 6.20% | | | | 01/25/2047 | | | | 117,037 | |
| | | | | Mosaic Solar Loan Trust | | | | | | | | | | | |
| | 45,571 | | | Series 2017-1A(f) | | 4.45% | | | | 06/20/2042 | | | | 44,662 | |
| | 205,451 | | | Series 2018-1A(f) | | 4.01% | | | | 08/20/2030 | | | | 195,459 | |
| | 311,356 | | | Series 2020-2A(f) | | 3.00% | | | | 06/20/2025 | | | | 288,111 | |
| | | | | MVW 2021-1W LLC | | | | | | | | | | | |
| | 344,682 | | | Series 2021-1WA(f) | | 1.94% | | | | 01/22/2041 | | | | 327,199 | |
| | 399,832 | | | Series 2021-1WA(f) | | 3.17% | | | | 01/22/2041 | | | | 376,805 | |
| | | | | Navient Private Education Refi Loan Trust | | | | | | | | | | | |
| | 344,653 | | | Series 2018-A(f) | | 3.68% | | | | 11/17/2025 | | | | 338,099 | |
See Notes to Financial Statements and Financial Highlights.
| Annual Report | September 30, 2024 | 39 |
| RiverNorth/DoubleLine Strategic Income Fund | Schedule of Investments |
| Principal Amount/Description | | Rate | | | Maturity | | | Value | |
| | | | | NJ Trust | | | | | | | | | | | |
| $ | 275,000 | | | Series 2023-GSP(f)(j) | | 6.70% | | | | 01/06/2029 | | | $ | 292,039 | |
| | | | | Pagaya AI Debt Selection Trust | | | | | | | | | | | |
| | 111,706 | | | Series 2021-2(f) | | 3.00% | | | | 01/25/2029 | | | | 110,061 | |
| | 2,000,000 | | | Series 2021-5(f) | | 0.00% | | | | 08/15/2029 | | | | 95,056 | |
| | | | | Pagaya AI Debt Trust | | | | | | | | | | | |
| | 1,249,989 | | | Series 2023-5(f) | | 9.10% | | | | 04/15/2031 | | | | 1,284,478 | |
| | | | | PAGAYA AI Debt Trust | | | | | | | | | | | |
| | 245,086 | | | Series 2022-2(f)(j) | | 6.10% | | | | 01/15/2030 | | | | 245,700 | |
| | | | | People's Choice Home Loan Securities Trust | | | | | | | | | | | |
| | 5,000,000 | | | Series 2005-4(j) | | 1M US L + 0.65% | | | | 12/25/2035 | | | | 3,431,813 | |
| | | | | PFP, Ltd. | | | | | | | | | | | |
| | 300,000 | | | Series 2024-11(f)(j) | | 1M CME TERM SOFR + 2.49% | | | | 08/17/2029 | | | | 300,524 | |
| | 600,000 | | | Series 2024-11(f)(j) | | 1M CME TERM SOFR + 2.99% | | | | 08/17/2029 | | | | 601,029 | |
| | | | | Progress Residential | | | | | | | | | | | |
| | 2,500,000 | | | Series 2021-SFR3(f) | | 4.75% | | | | 05/17/2026 | | | | 2,381,775 | |
| | | | | Progress Residential | | | | | | | | | | | |
| | 6,900,000 | | | Series 2021-SFR8(f) | | 4.01% | | | | 10/17/2026 | | | | 6,426,392 | |
| | 5,000,000 | | | Series 2024-SFR2(f)(j) | | 3.65% | | | | 04/17/2029 | | | | 4,523,035 | |
| | | | | Ready Capital Mortgage Financing LLC | | | | | | | | | | | |
| | 1,000,000 | | | Series 2021-FL6(f)(j) | | 1M CME TERM SOFR + 2.51% | | | | 07/25/2026 | | | | 993,066 | |
| | 1,000,000 | | | Series 2022-FL10(f)(j) | | 1M CME TERM SOFR + 4.27% | | | | 07/25/2027 | | | | 1,007,424 | |
| | 900,000 | | | Series 2023-FL12(f)(j) | | 1M CME TERM SOFR + 4.55% | | | | 04/25/2027 | | | | 897,672 | |
| | | | | Retained Vantage Data Centers Issuer LLC | | | | | | | | | | | |
| | 2,500,000 | | | Series 2023-1A(f) | | 5.75% | | | | 09/15/2028 | | | | 2,442,573 | |
| | | | | Sapphire Aviation Finance II, Ltd. | | | | | | | | | | | |
| | 301,560 | | | Series 2020-1A(f) | | 3.23% | | | | 03/15/2027 | | | | 286,438 | |
| | | | | Signal Rail I LLC | | | | | | | | | | | |
| | 441,486 | | | Series 2021-1(f) | | 2.23% | | | | 08/17/2028 | | | | 403,396 | |
| | | | | SLG Office Trust | | | | | | | | | | | |
| | 550,000 | | | Series 2021-OVA(f) | | 2.85% | | | | 07/15/2031 | | | | 446,223 | |
| | | | | SMB Private Education Loan Trust | | | | | | | | | | | |
| | 114,333 | | | Series 2018-B(f)(j) | | 1M SOFR + 0.83% | | | | 08/15/2027 | | | | 113,991 | |
| | 968 | | | Series 2021-A(f) | | 0.00% | | | | 01/15/2053 | | | | 1,833,150 | |
| | | | | Sofi Alternative Consumer Loan Program | | | | | | | | | | | |
| | 50,000 | | | Series 2021-2(f) | | 0.00% | | | | 08/15/2030 | | | | 216,586 | |
See Notes to Financial Statements and Financial Highlights.
| 40 | (888) 848-7569 | www.rivernorth.com |
| RiverNorth/DoubleLine Strategic Income Fund | Schedule of Investments |
| Principal Amount/Description | | Rate | | | Maturity | | | Value | |
| | | | | Sofi Professional Loan Program Trust | | | | | | | | | | | |
| $ | 80,000 | | | Series 2018-C(f) | | 0.00% | | | | 01/25/2048 | | | $ | 670,838 | |
| | | | | Sofi Professional Loan Program, LLC | | | | | | | | | | | |
| | 32,412 | | | Series 2018-A(f) | | 0.00% | | | | 02/25/2042 | | | | 256,428 | |
| | | | | SoFi Professional Loan Program, LLC | | | | | | | | | | | |
| | 300,000 | | | Series 2017-D(f) | | 3.61% | | | | 09/25/2040 | | | | 283,020 | |
| | | | | Sprite, Ltd. | | | | | | | | | | | |
| | 305,235 | | | Series 2021-1(f) | | 3.75% | | | | 10/15/2028 | | | | 295,602 | |
| | | | | STWD Mortgage Trust | | | | | | | | | | | |
| | 380,000 | | | Series 2021-HTS(f)(j) | | 1M CME TERM SOFR + 1.52% | | | | 04/15/2024 | | | | 375,032 | |
| | | | | Subway Funding LLC | | | | | | | | | | | |
| | 250,000 | | | Series 2024-1A(f) | | 6.51% | | | | 07/30/2034 | | | | 260,705 | |
| | | | | Sunnova Helios VII Issuer LLC | | | | | | | | | | | |
| | 1,031,716 | | | Series 2021-C(f) | | 2.63% | | | | 10/20/2028 | | | | 589,924 | |
| | | | | Sunnova Sol III Issuer LLC | | | | | | | | | | | |
| | 1,219,001 | | | Series 2021-1(f) | | 2.58% | | | | 04/30/2031 | | | | 992,619 | |
| | | | | Sunnova Sol Issuer LLC | | | | | | | | | | | |
| | 860,385 | | | Series 2020-1A(f) | | 3.35% | | | | 01/30/2030 | | | | 742,905 | |
| | | | | Switch ABS Issuer LLC | | | | | | | | | | | |
| | 1,000,000 | | | Series 2024-2A(f) | | 5.44% | | | | 06/25/2029 | | | | 1,014,656 | |
| | 1,000,000 | | | Series 2024-2A(f) | | 10.03% | | | | 06/25/2029 | | | | 1,050,285 | |
| | | | | TIF Funding II LLC | | | | | | | | | | | |
| | 283,000 | | | Series 2021-1A(f) | | 1.65% | | | | 02/20/2046 | | | | 254,327 | |
| | | | | Tricon Residential | | | | | | | | | | | |
| | 3,700,000 | | | Series 2021-SFR1(f) | | 4.13% | | | | 07/17/2026 | | | | 3,467,350 | |
| | | | | UBS Commercial Mortgage Trust | | | | | | | | | | | |
| | 31,908,500 | | | Series 2017-C3(j)(n) | | 0.54% | | | | 08/15/2050 | | | | 393,799 | |
| | 350,000 | | | Series 2017-C4(j) | | 4.24% | | | | 09/15/2027 | | | | 330,290 | |
| | 530,000 | | | Series 2018-C11(j) | | 4.71% | | | | 06/15/2028 | | | | 480,020 | |
| | 1,023,000 | | | Series 2018-C13(j) | | 5.13% | | | | 10/15/2028 | | | | 937,689 | |
| | 1,099,000 | | | Series 2018-C8(j) | | 4.84% | | | | 02/15/2028 | | | | 974,448 | |
| | | | | UBS-Barclays Commercial Mortgage Trust | | | | | | | | | | | |
| | 1,618,000 | | | Series 2013-C5(f)(j) | | 3.84% | | | | 03/10/2046 | | | | 1,229,280 | |
| | | | | Upstart Pass-Through Trust | | | | | | | | | | | |
| | 36,651 | | | Series 2021-ST1(f) | | 2.75% | | | | 02/20/2027 | | | | 36,250 | |
| | 88,308 | | | Series 2021-ST2(f) | | 2.50% | | | | 04/20/2027 | | | | 86,923 | |
| | | | | Upstart Securitization Trust | | | | | | | | | | | |
| | 2,000 | | | Series 2021-2 | | 0.00% | | | | 06/20/2031 | | | | 168,653 | |
| | 1,000,000 | | | Series 2021-4(f) | | 3.19% | | | | 03/20/2026 | | | | 956,060 | |
| | | | | US Auto Funding 2021-1 | | | | | | | | | | | |
| | 596,627 | | | Series 2021-1A(f) | | 2.20% | | | | 05/15/2026 | | | | 562,639 | |
See Notes to Financial Statements and Financial Highlights.
| Annual Report | September 30, 2024 | 41 |
| RiverNorth/DoubleLine Strategic Income Fund | Schedule of Investments |
| Principal Amount/Description | | Rate | | | Maturity | | | Value | |
| | | | | Vault DI Issuer LLC | | | | | | | | | | | |
| $ | 750,000 | | | Series 2021-1A(f) | | 2.80% | | | | 07/15/2026 | | | $ | 689,072 | |
| | | | | Velocity Commercial Capital Loan Trust | | | | | | | | | | | |
| | 175,999 | | | Series 2018-2(f)(j) | | 4.05% | | | | 09/25/2024 | | | | 171,167 | |
| | 398,183 | | | Series 2019-1(f)(j) | | 3.94% | | | | 01/25/2027 | | | | 369,848 | |
| | 213,848 | | | Series 2019-1(f)(j) | | 4.01% | | | | 07/25/2027 | | | | 193,426 | |
| | 163,975 | | | Series 2019-1(f)(j) | | 4.12% | | | | 11/25/2027 | | | | 145,251 | |
| | 1,315,113 | | | Series 2021-2(f)(j) | | 4.92% | | | | 12/25/2030 | | | | 940,807 | |
| | | | | VOLT XCVI LLC | | | | | | | | | | | |
| | 4,130,525 | | | Series 2021-NPL5(f)(m) | | 4.83% | | | | 03/27/2051 | | | | 4,026,907 | |
| | | | | Wachovia Bank Commercial Mortgage Trust | | | | | | | | | | | |
| | 745 | | | Series 2006-C29(j)(n) | | 0.49% | | | | 11/15/2048 | | | | 2 | |
| | | | | WAVE LLC | | | | | | | | | | | |
| | 1,250,085 | | | Series 2019-1(f) | | 6.41% | | | | 09/15/2044 | | | | 442,751 | |
| | | | | Wells Fargo Commercial Mortgage Trust | | | | | | | | | | | |
| | 1,245,000 | | | Series 2015-NXS4(j) | | 3.83% | | | | 11/15/2025 | | | | 1,151,958 | |
| | 1,000,000 | | | Series 2016-C33(f) | | 3.12% | | | | 03/15/2059 | | | | 840,950 | |
| | 5,628,945 | | | Series 2016-C37(f)(j)(n) | | 1.60% | | | | 12/15/2049 | | | | 164,139 | |
| | 1,100,000 | | | Series 2018-C45 | | 4.73% | | | | 06/15/2028 | | | | 1,036,345 | |
| | 134,000 | | | Series 2020-C55 | | 3.14% | | | | 02/15/2030 | | | | 119,261 | |
| | 830,000 | | | Series 2021-C61 | | 3.31% | | | | 07/15/2031 | | | | 682,019 | |
| | | | | WFRBS Commercial Mortgage Trust | | | | | | | | | | | |
| | 163,036 | | | Series 2013-C14 | | 3.49% | | | | 06/15/2046 | | | | 157,880 | |
| | | | | WF-RBS Commercial Mortgage Trust | | | | | | | | | | | |
| | 121,246 | | | Series 2014-C21(j)(n) | | 0.70% | | | | 08/15/2047 | | | | 2 | |
| | 600,534 | | | Series 2014-C22(j)(n) | | 0.63% | | | | 09/15/2057 | | | | 8 | |
| | | | | Willis Engine Structured Trust V | | | | | | | | | | | |
| | 760,445 | | | Series 2020-A(f) | | 3.23% | | | | 03/15/2028 | | | | 714,963 | |
| | | | | Willis Engine Structured Trust VI | | | | | | | | | | | |
| | 1,682,936 | | | Series 2021-A(f) | | 7.39% | | | | 05/15/2029 | | | | 1,655,210 | |
| | | | | | | | | | | | | | | | |
| TOTAL NON-AGENCY COLLATERALIZED MORTGAGE OBLIGATIONS | | | | | | | | | |
| (Cost $275,555,124) | | | | | | | | | | 235,773,095 | |
| | | | | | | | | | | | | | | | |
| U.S. GOVERNMENT BONDS AND NOTES -15.30% | | | | | | | | | |
| United States - 15.30% | | | | | | | | | | |
| | 5,000,000 | | | U.S. Treasury Bill(l) | | 0.00% | | | | 10/01/2024 | | | | 5,000,000 | |
| | 6,350,000 | | | U.S. Treasury Bonds | | 0.63% | | | | 05/15/2030 | | | | 5,393,655 | |
| | 11,850,000 | | | U.S. Treasury Bonds | | 0.88% | | | | 11/15/2030 | | | | 10,087,544 | |
| | 32,900,000 | | | U.S. Treasury Bonds | | 1.13% | | | | 05/15/2040 | | | | 21,748,057 | |
| | 9,100,000 | | | U.S. Treasury Bonds | | 1.13% | | | | 08/15/2040 | | | | 5,964,410 | |
See Notes to Financial Statements and Financial Highlights.
| 42 | (888) 848-7569 | www.rivernorth.com |
| RiverNorth/DoubleLine Strategic Income Fund | Schedule of Investments |
| Principal Amount/Description | | Rate | | | Maturity | | | Value | |
| $ | 11,400,000 | | | U.S. Treasury Bonds | | 1.88% | | | | 02/15/2041 | | | $ | 8,364,527 | |
| | 42,350,000 | | | U.S. Treasury Bonds | | 1.75% | | | | 08/15/2041 | | | | 30,044,513 | |
| | 27,400,000 | | | U.S. Treasury Bonds | | 1.25% | | | | 05/15/2050 | | | | 14,669,703 | |
| | 29,200,000 | | | U.S. Treasury Bonds | | 1.38% | | | | 08/15/2050 | | | | 16,094,219 | |
| | 16,400,000 | | | U.S. Treasury Bonds | | 1.88% | | | | 02/15/2051 | | | | 10,280,430 | |
| | 48,000,000 | | | U.S. Treasury Notes | | 0.75% | | | | 03/31/2026 | | | | 45,913,125 | |
| | 5,000,000 | | | U.S. Treasury Notes | | 4.38% | | | | 07/31/2026 | | | | 5,060,742 | |
| | 7,800,000 | | | U.S. Treasury Notes | | 0.75% | | | | 01/31/2028 | | | | 7,113,692 | |
| | 11,950,000 | | | U.S. Treasury Notes | | 0.63% | | | | 08/15/2030 | | | | 10,073,243 | |
| | | | | | | | | | | | | | | | |
| TOTAL U.S. GOVERNMENT BONDS AND NOTES | | | | | | | | | |
| (Cost $186,241,159) | | | | | | | | | | 195,807,860 | |
| | | | | | | | | | | | | | | | |
| MORTGAGE-BACKED SECURITIES - 3.61% | | | | | | | | | | | |
| United States - 3.61% | | | | | | | | | | | |
| | | | | Fannie Mae Pool | | | | | | | | | | | |
| | 1,621,046 | | | Series 2021- | | 2.00% | | | | 05/01/2051 | | | | 1,367,510 | |
| | 2,798,147 | | | Series 2021- | | 2.50% | | | | 08/01/2051 | | | | 2,457,700 | |
| | 2,472,574 | | | Series 2023- | | 2.50% | | | | 03/01/2052 | | | | 2,165,130 | |
| | 2,378,745 | | | Series 2023- | | 2.50% | | | | 04/01/2052 | | | | 2,076,862 | |
| | 1,333,536 | | | Series 2023- | | 6.00% | | | | 05/01/2053 | | | | 1,376,596 | |
| | 2,029,315 | | | Series 2023- | | 6.00% | | | | 10/01/2053 | | | | 2,098,240 | |
| | 1,844,581 | | | Series 2024- | | 5.50% | | | | 03/01/2054 | | | | 1,889,357 | |
| | 1,807,717 | | | Series 2024- | | 5.50% | | | | 06/01/2054 | | | | 1,857,679 | |
| | 1,419,313 | | | Series 2024- | | 6.00% | | | | 06/01/2054 | | | | 1,464,846 | |
| | | | | Freddie Mac Pool | | | | | | | | | | | |
| | 1,550,334 | | | Series 2021- | | 2.00% | | | | 05/01/2051 | | | | 1,289,635 | |
| | 2,526,319 | | | Series 2022- | | 3.00% | | | | 03/01/2052 | | | | 2,301,171 | |
| | 2,197,459 | | | Series 2022- | | 4.50% | | | | 09/01/2052 | | | | 2,162,197 | |
| | 911,160 | | | Series 2023- | | 2.00% | | | | 02/01/2052 | | | | 768,190 | |
| | 1,411,935 | | | Series 2023- | | 5.50% | | | | 04/01/2053 | | | | 1,455,344 | |
| | 1,500,098 | | | Series 2023- | | 5.00% | | | | 05/01/2053 | | | | 1,510,851 | |
| | 2,024,285 | | | Series 2023- | | 5.00% | | | | 06/01/2053 | | | | 2,054,663 | |
| | 1,867,932 | | | Series 2023- | | 5.00% | | | | 07/01/2053 | | | | 1,884,232 | |
| | 3,478,209 | | | Series 2023- | | 5.50% | | | | 08/01/2053 | | | | 3,549,361 | |
| | 1,371,981 | | | Series 2023- | | 6.00% | | | | 11/01/2053 | | | | 1,440,225 | |
| | 852,450 | | | Series 2024- | | 6.00% | | | | 02/01/2054 | | | | 894,854 | |
| | 2,097,636 | | | Series 2024- | | 5.50% | | | | 02/01/2054 | | | | 2,158,207 | |
| | 975,110 | | | Series 2024- | | 6.00% | | | | 04/01/2054 | | | | 1,007,666 | |
| | | | | Ginnie Mae I Pool | | | | | | | | | | | |
| | 2,843,035 | | | Series 2012- | | 3.50% | | | | 09/15/2042 | | | | 2,720,206 | |
| | | | | Ginnie Mae II Pool | | | | | | | | | | | |
| | 2,592,837 | | | Series 2021- | | 3.00% | | | | 11/20/2051 | | | | 2,350,832 | |
See Notes to Financial Statements and Financial Highlights.
| Annual Report | September 30, 2024 | 43 |
| RiverNorth/DoubleLine Strategic Income Fund | Schedule of Investments |
| Principal Amount/Description | | Rate | | | Maturity | | | Value | |
| $ | 2,124,153 | | | Series 2022- | | 3.00% | | | | 04/20/2052 | | | $ | 1,927,036 | |
| | | | | | | | | | | | | | | | |
| TOTAL MORTGAGE-BACKED SECURITIES | | | | | | | | | |
| (Cost $44,959,619) | | | | | | | | 46,228,590 | |
| | | | | | | | | | | | | | | | |
| U.S. GOVERNMENT / AGENCY MORTGAGE BACKED SECURITIES - 16.19% | | | | | | | |
| United States - 16.19% | | | | | | | | | | | |
| | | | | Alternative Loan Trust | | | | | | | | | | | |
| | 118,634 | | | Series 2005-20CB | | 5.50% | | | | 07/25/2035 | | | | 96,314 | |
| | 57,052 | | | Series 2005-54CB | | 5.50% | | | | 11/25/2035 | | | | 32,209 | |
| | 559,949 | | | Series 2005-85CB(j) | | 1M US L + 1.10% | | | | 02/25/2036 | | | | 434,670 | |
| | 118,252 | | | Series 2005-85CB(j) | | 21.63% - 3.67 x 1M US L | | | | 02/25/2036 | | | | 101,442 | |
| | 173,266 | | | Series 2005-86CB | | 5.50% | | | | 02/25/2036 | | | | 103,344 | |
| | 125,102 | | | Series 2005-9CB(j) | | 1M US L + 0.50% | | | | 05/25/2035 | | | | 108,321 | |
| | 222,181 | | | Series 2005-9CB(j)(n) | | 5.05% - 1M US L | | | | 05/25/2035 | | | | 9,254 | |
| | 1,008,886 | | | Series 2006-15CB | | 6.50% | | | | 06/25/2036 | | | | 474,523 | |
| | 97,003 | | | Series 2006-30T1 | | 6.25% | | | | 11/25/2036 | | | | 73,568 | |
| | 92,299 | | | Series 2006-32CB | | 5.50% | | | | 11/25/2036 | | | | 51,396 | |
| | 220,312 | | | Series 2006-36T2(j) | | 28.06% - 4.60 x 1M US L | | | | 12/25/2036 | | | | 173,324 | |
| | 799,829 | | | Series 2007-19 | | 6.00% | | | | 08/25/2037 | | | | 392,355 | |
| | 2,648,513 | | | Series 2007-20 | | 6.25% | | | | 08/25/2047 | | | | 1,402,099 | |
| | 744,415 | | | Series 2007-23CB(j) | | 1M US L + 0.50% | | | | 09/25/2037 | | | | 273,211 | |
| | 710,792 | | | Series 2007-23CB(j)(n) | | 6.39% - 1M SOFR | | | | 09/25/2037 | | | | 114,297 | |
| | | | | American Home Mortgage Investment Trust | | | | | | | | | | | |
| | 157,985 | | | Series 2007-A(f)(m) | | 6.60% | | | | 01/25/2037 | | | | 23,944 | |
| | | | | Banc of America Funding | | | | | | | | | | | |
| | 1,467,605 | | | Series 2014-R8(f)(j) | | 1M SOFR + 0.35% | | | | 12/26/2024 | | | | 1,203,365 | |
| | | | | Banc of America Funding Trust | | | | | | | | | | | |
| | 26,100 | | | Series 2006-2 | | 5.50% | | | | 03/25/2036 | | | | 25,787 | |
| | | | | BCAP, LLC Trust | | | | | | | | | | | |
| | 94,231 | | | Series 2007-AA2(j) | | 7.50% | | | | 04/25/2037 | | | | 49,956 | |
| | 61,137 | | | Series 2007-AA2 | | 6.00% | | | | 04/25/2037 | | | | 27,260 | |
| | 4,604,043 | | | Series 2010-RR6(f)(j) | | 7.04% | | | | 07/26/2036 | | | | 2,248,934 | |
| | | | | Bear Stearns ALT-A Trust | | | | | | | | | | | |
| | 676,609 | | | Series 2006-6(j) | | 4.58% | | | | 11/25/2036 | | | | 302,552 | |
| | | | | Bear Stearns Asset-Backed Securities Trust | | | | | | | | | | | |
| | 1,093,047 | | | Series 2006-AC1(m) | | 6.25% | | | | 02/25/2036 | | | | 514,933 | |
| | | | | Bear Stearns Structured Products, Inc. | | | | | | | | | | | |
| | 6,759,714 | | | Series 2008-R2(f)(j) | | 4.32% | | | | 06/25/2047 | | | | 5,803,535 | |
| | | | | Chase Mortgage Finance Trust | | | | | | | | | | | |
| | 3,088,952 | | | Series 2007-S2 | | 6.00% | | | | 03/25/2037 | | | | 1,713,679 | |
See Notes to Financial Statements and Financial Highlights.
| 44 | (888) 848-7569 | www.rivernorth.com |
| RiverNorth/DoubleLine Strategic Income Fund | Schedule of Investments |
| Principal Amount/Description | | Rate | | | Maturity | | | Value | |
| $ | 330,561 | | | Series 2007-S3 | | 5.50% | | | | 05/25/2037 | | | $ | 3 | |
| | 4,292,389 | | | Series 2007-S4 | | 6.00% | | | | 06/25/2037 | | | | 1,822,245 | |
| | | | | ChaseFlex Trust Series | | | | | | | | | | | |
| | 3,080,473 | | | Series 2007-M1(j) | | 1M SOFR + 0.34% | | | | 08/25/2037 | | | | 2,549,366 | |
| | | | | Citicorp Mortgage Securities Trust | | | | | | | | | | | |
| | 273,236 | | | Series 2007-1 | | 6.00% | | | | 01/25/2037 | | | | 250,812 | |
| | | | | Citigroup Mortgage Loan Trust | | | | | | | | | | | |
| | 65,737 | | | Series 2009-12(f) | | 5.50% | | | | 11/25/2035 | | | | 56,433 | |
| | 145,990 | | | Series 2009-4(f)(j) | | 5.48% | | | | 05/25/2035 | | | | 143,523 | |
| | | | | CitiMortgage Alternative Loan Trust | | | | | | | | | | | |
| | 283,648 | | | Series 2007-A1 | | 6.00% | | | | 01/25/2037 | | | | 254,118 | |
| | 55,874 | | | Series 2007-A1(j)(n) | | 5.40% - 1M US L | | | | 01/25/2037 | | | | 4,256 | |
| | 41,276 | | | Series 2007-A3(j) | | 6.00% | | | | 03/25/2037 | | | | 36,039 | |
| | 94,990 | | | Series 2007-A3(j)(n) | | 5.40% - 1M US L | | | | 03/25/2037 | | | | 7,164 | |
| | 288,996 | | | Series 2007-A6 | | 5.50% | | | | 06/25/2037 | | | | 243,360 | |
| | | | | Connecticut Avenue Securities Trust | | | | | | | | | | | |
| | 3,368,965 | | | Series 2019-R05(f)(j) | | 30D US SOFR + 4.21% | | | | 07/25/2039 | | | | 3,514,143 | |
| | 4,250,000 | | | Series 2022-R02(f)(j) | | 30D US SOFR + 7.65% | | | | 01/25/2027 | | | | 4,618,824 | |
| | 3,685,000 | | | Series 2022-R03(f)(j) | | 30D US SOFR + 9.85% | | | | 03/25/2042 | | | | 4,187,926 | |
| | 4,125,000 | | | Series 2023-R06(f)(j) | | 30D US SOFR + 3.90% | | | | 07/25/2043 | | | | 4,394,268 | |
| | 1,318,469 | | | Series 2024-R03(f)(j) | | 30D US SOFR + 1.15% | | | | 03/25/2044 | | | | 1,321,355 | |
| | 5,000,000 | | | Series 2024-R03(f)(j) | | 30D US SOFR + 2.80% | | | | 03/25/2044 | | | | 5,112,500 | |
| | 1,432,063 | | | Series 2024-R05(f)(j) | | 30D US SOFR + 1.00% | | | | 07/25/2044 | | | | 1,433,853 | |
| | | | | Countrywide Home Loan Mortgage Pass-Through Trust | | | | | | | | | | | |
| | 1,016,483 | | | Series 2005-HYB7(j) | | 4.48% | | | | 11/20/2035 | | | | 928,743 | |
| | 19,963 | | | Series 2005-J4 | | 5.50% | | | | 11/25/2035 | | | | 16,596 | |
| | 1,151,683 | | | Series 2006-18 | | 6.00% | | | | 12/25/2036 | | | | 649,052 | |
| | 128,881 | | | Series 2007-17 | | 6.00% | | | | 10/25/2037 | | | | 90,983 | |
| | 199,333 | | | Series 2007-3 | | 6.00% | | | | 04/25/2037 | | | | 98,127 | |
| | 219,846 | | | Series 2007-7 | | 5.75% | | | | 06/25/2037 | | | | 108,185 | |
| | | | | Credit Suisse First Boston Mortgage Securities Corp. | | | | | | | | | | | |
| | 38,628 | | | Series 2005-10 | | 5.50% | | | | 11/25/2035 | | | | 28,767 | |
| | 21,255 | | | Series 2005-8 | | 5.50% | | | | 08/25/2025 | | | | 15,642 | |
| | 4,004,551 | | | Series 2005-9 | | 6.00% | | | | 10/25/2035 | | | | 1,218,355 | |
See Notes to Financial Statements and Financial Highlights.
| Annual Report | September 30, 2024 | 45 |
| RiverNorth/DoubleLine Strategic Income Fund | Schedule of Investments |
| Principal Amount/Description | | Rate | | | Maturity | | | Value | |
| | | | | Credit Suisse Mortgage Capital Certificates | | | | | | | | | | | |
| $ | 1,717,596 | | | Series 2006-2 | | 5.75% | | | | 03/25/2036 | | | $ | 917,245 | |
| | | | | CSMC | | | | | | | | | | | |
| | 900,000 | | | Series 2021-NQM6(f)(j) | | 2.58% | | | | 07/25/2066 | | | | 670,513 | |
| | | | | CSMC Mortgage-Backed Trust | | | | | | | | | | | |
| | 143,575 | | | Series 2006-1 | | 6.00% | | | | 02/25/2036 | | | | 44,470 | |
| | 13,043 | | | Series 2006-4 | | 5.50% | | | | 03/25/2038 | | | | 7,742 | |
| | 787,357 | | | Series 2006-5 | | 6.25% | | | | 06/25/2036 | | | | 128,799 | |
| | 55,362 | | | Series 2006-9 | | 6.00% | | | | 11/25/2036 | | | | 32,169 | |
| | 3,643 | | | Series 2007-2 | | 5.00% | | | | 03/25/2037 | | | | 2,752 | |
| | | | | Deutsche Alt-A Securities, Inc. Mortgage Loan Trust | | | | | | | | | | | |
| | 167,122 | | | Series 2005-6(j)(n) | | 5.08% - 1M US L | | | | 12/25/2035 | | | | 10,970 | |
| | 73,325 | | | Series 2005-6(j) | | 1M US L + 1.40% | | | | 12/25/2035 | | | | 56,611 | |
| | | | | Deutsche Mortgage Securities, Inc. Mortgage Loan Trust | | | | | | | | | | | |
| | 87,131 | | | Series 2006-PR1(f)(j) | | 12.12% - 1M US L | | | | 04/15/2036 | | | | 79,285 | |
| | | | | Fannie Mae Interest Strip | | | | | | | | | | | |
| | 5,423,322 | | | Series 2014-419(n) | | 3.50% | | | | 04/25/2044 | | | | 800,005 | |
| | | | | Fannie Mae Pool | | | | | | | | | | | |
| | 3,734,171 | | | Series 2021- | | 3.00% | | | | 10/01/2046 | | | | 3,429,394 | |
| | 1,824,244 | | | Series 2021- | | 3.00% | | | | 12/01/2048 | | | | 1,666,294 | |
| | 3,065,091 | | | Series 2022- | | 3.50% | | | | 11/01/2050 | | | | 2,893,511 | |
| | 1,452,422 | | | Series 2022- | | 5.00% | | | | 07/01/2052 | | | | 1,454,029 | |
| | 3,000,000 | | | Series Pool #BL4424 | | 2.14% | | | | 10/01/2029 | | | | 2,759,415 | |
| | 3,000,000 | | | Series Pool #BL5156 | | 2.37% | | | | 12/01/2029 | | | | 2,771,046 | |
| | | | | Fannie Mae REMICS | | | | | | | | | | | |
| | 4,585,519 | | | Series 2014-1(j)(n) | | 5.79% - 30D US SOFR | | | | 02/25/2044 | | | | 596,677 | |
| | 5,183,671 | | | Series 2015-54(j)(n) | | 6.04% - 30D US SOFR | | | | 07/25/2045 | | | | 637,468 | |
| | 8,475,180 | | | Series 2020-74(j)(n) | | 4.10% - 30D US SOFR | | | | 10/25/2050 | | | | 524,601 | |
| | 17,551,635 | | | Series 2020-77(j)(n) | | 4.10% - 30D SOFR | | | | 11/25/2050 | | | | 1,002,828 | |
| | 2,069,643 | | | Series 2021-48(j)(n) | | 3.65% - 30D US SOFR | | | | 08/25/2051 | | | | 81,810 | |
| | 13,757,680 | | | Series 2021-56(n) | | 2.50% | | | | 09/25/2051 | | | | 1,685,501 | |
| | | | | Federal Home Loan Mortgage Corp. Pool | | | | | | | | | | | |
| | 93,502 | | | Series Pool #G01840 | | 5.00% | | | | 07/01/2035 | | | | 96,020 | |
| | 36,433 | | | Series Pool #G04817 | | 5.00% | | | | 09/01/2038 | | | | 37,587 | |
| | | | | Federal Home Loan Mortgage Corp. REMICS | | | | | | | | | | | |
| | 467,042 | | | Series 2003-2722(j) | | 9.89% - 1M US L | | | | 12/15/2033 | | | | 488,573 | |
| | 712,064 | | | Series 2006-3244(j)(n) | | 6.66% - 1M US L | | | | 11/15/2036 | | | | 79,226 | |
See Notes to Financial Statements and Financial Highlights.
| 46 | (888) 848-7569 | www.rivernorth.com |
| RiverNorth/DoubleLine Strategic Income Fund | Schedule of Investments |
| Principal Amount/Description | | Rate | | | Maturity | | | Value | |
| $ | 33,634 | | | Series 2007-3261(j)(n) | | 6.43% - 1M US L | | | | 01/15/2037 | | | $ | 3,531 | |
| | 72,984 | | | Series 2007-3262(j)(n) | | 6.40% - 1M US L | | | | 01/15/2037 | | | | 5,100 | |
| | 302,836 | | | Series 2007-3301(j)(n) | | 6.10% - 1M US L | | | | 04/15/2037 | | | | 28,099 | |
| | 215,850 | | | Series 2007-3303(j)(n) | | 6.10% - 1M US L | | | | 04/15/2037 | | | | 21,938 | |
| | 53,784 | | | Series 2007-3382(j)(n) | | 6.00% - 1M US L | | | | 11/15/2037 | | | | 4,221 | |
| | 189,987 | | | Series 2007-3384(j)(n) | | 6.31% - 1M US L | | | | 08/15/2036 | | | | 18,462 | |
| | 63,482 | | | Series 2007-3384(j)(n) | | 6.39% - 1M US L | | | | 11/15/2037 | | | | 4,492 | |
| | 21,725 | | | Series 2008-3417(j)(n) | | 6.18% - 1M US L | | | | 02/15/2038 | | | | 1,887 | |
| | 969,504 | | | Series 2008-3423(j)(n) | | 6.00% - 1M US L | | | | 03/15/2038 | | | | 2,612 | |
| | 71,021 | | | Series 2008-3423(j)(n) | | 5.65% - 1M US L | | | | 03/15/2038 | | | | 5,376 | |
| | 615,389 | | | Series 2009-3510(j)(n) | | 6.75% - 1M US L | | | | 02/15/2037 | | | | 58,382 | |
| | 187,837 | | | Series 2009-3523(j)(n) | | 6.00% - 1M US L | | | | 04/15/2039 | | | | 16,645 | |
| | 33,772 | | | Series 2009-3524(j)(n) | | 3.41% | | | | 06/15/2038 | | | | 32,216 | |
| | 3,073 | | | Series 2009-3549(j)(n) | | 5.80% - 1M US L | | | | 07/15/2039 | | | | 269 | |
| | 310,903 | | | Series 2009-3560(j)(n) | | 6.40% - 1M US L | | | | 11/15/2036 | | | | 18,620 | |
| | 126,562 | | | Series 2010-3641 | | 4.50% | | | | 03/15/2040 | | | | 128,286 | |
| | 186,143 | | | Series 2010-3726(j)(n) | | 6.05% - 1M US L | | | | 09/15/2040 | | | | 20,386 | |
| | 561,759 | | | Series 2010-3728(j)(n) | | 4.45% - 1M US L | | | | 09/15/2040 | | | | 19,230 | |
| | 208,548 | | | Series 2010-3779 | | 3.50% | | | | 12/15/2030 | | | | 206,099 | |
| | 42,966 | | | Series 2010-3779 | | 4.00% | | | | 12/15/2030 | | | | 43,069 | |
| | 27,133 | | | Series 2011-3786(j) | | 9.50% - 1M US L | | | | 01/15/2041 | | | | 22,609 | |
| | 392,962 | | | Series 2011-3815(j)(n) | | 5.85% - 1M US L | | | | 02/15/2041 | | | | 36,348 | |
| | 196,750 | | | Series 2011-3824(j)(n) | | 7.10% - 1M US L | | | | 08/15/2036 | | | | 25,025 | |
| | 302,749 | | | Series 2011-3864(j) | | 9.20% - 1M US L | | | | 05/15/2041 | | | | 256,707 | |
| | 214,176 | | | Series 2011-3872(j)(n) | | 5.95% - 1M US L | | | | 06/15/2041 | | | | 19,023 | |
| | 927,598 | | | Series 2011-3924(j)(n) | | 6.00% - 1M US L | | | | 09/15/2041 | | | | 67,164 | |
| | 1,325,271 | | | Series 2012-3(j)(n) | | 5.95% - 1M US L | | | | 02/25/2042 | | | | 154,186 | |
| | 647,440 | | | Series 2013-4170(j) | | 4.05% - 1M US L | | | | 01/15/2033 | | | | 585,789 | |
| | 2,097,207 | | | Series 2013-4239(l) | | 0.00% | | | | 07/15/2043 | | | | 1,274,166 | |
| | | | | Federal National Mortgage Association Pool | | | | | | | | | | | |
| | 24,657 | | | Series Pool #555743 | | 5.00% | | | | 09/01/2033 | | | | 25,020 | |
| | 29,911 | | | Series Pool #735382 | | 5.00% | | | | 04/01/2035 | | | | 30,680 | |
| | 83,797 | | | Series Pool #735383 | | 5.00% | | | | 04/01/2035 | | | | 85,953 | |
| | 52,976 | | | Series Pool #735484 | | 5.00% | | | | 05/01/2035 | | | | 54,337 | |
| | 16,717 | | | Series Pool #AH4437 | | 4.00% | | | | 01/01/2041 | | | | 16,246 | |
| | | | | Federal National Mortgage Association REMICS | | | | | | | | | | | |
| | 10,236 | | | Series 2004-46(j)(n) | | 6.00% - 1M US L | | | | 03/25/2034 | | | | 176 | |
| | 108,759 | | | Series 2006-101(j)(n) | | 6.47% - 30D US SOFR | | | | 10/25/2036 | | | | 12,936 | |
| | 314,516 | | | Series 2006-123(j)(n) | | 6.32% - 1M US L | | | | 01/25/2037 | | | | 37,379 | |
| | 1,338,143 | | | Series 2006-92(j)(n) | | 6.47% - 30D US SOFR | | | | 10/25/2036 | | | | 126,872 | |
| | 41,422 | | | Series 2007-102(j)(n) | | 6.40% - 1M US L | | | | 11/25/2037 | | | | 3,443 | |
| | 36,041 | | | Series 2007-108(j)(n) | | 6.36% - 1M US L | | | | 12/25/2037 | | | | 2,791 | |
See Notes to Financial Statements and Financial Highlights.
| Annual Report | September 30, 2024 | 47 |
| RiverNorth/DoubleLine Strategic Income Fund | Schedule of Investments |
| Principal Amount/Description | | Rate | | | Maturity | | | Value | |
| $ | 5,607 | | | Series 2007-30(j)(n) | | 6.11% - 1M US L | | | | 04/25/2037 | | | $ | 445 | |
| | 211,198 | | | Series 2007-38(j)(n) | | 6.08% - 1M US L | | | | 05/25/2037 | | | | 12,745 | |
| | 8,721 | | | Series 2007-51(j)(n) | | 6.10% - 1M US L | | | | 06/25/2037 | | | | 572 | |
| | 24,589 | | | Series 2007-53(j)(n) | | 6.10% - 1M US L | | | | 06/25/2037 | | | | 1,759 | |
| | 210,764 | | | Series 2007-57(j)(n) | | 6.62% - 1M US L | | | | 10/25/2036 | | | | 23,439 | |
| | 42,662 | | | Series 2007-68(j)(n) | | 6.65% - 1M US L | | | | 07/25/2037 | | | | 4,118 | |
| | 345,995 | | | Series 2008-3(j)(n) | | 6.46% - 1M US L | | | | 02/25/2038 | | | | 29,130 | |
| | 33,622 | | | Series 2008-56(j)(n) | | 6.06% - 1M US L | | | | 07/25/2038 | | | | 1,806 | |
| | 9,607 | | | Series 2008-81 | | 5.50% | | | | 09/25/2038 | | | | 9,925 | |
| | 99,455 | | | Series 2009-111 | | 5.00% | | | | 01/25/2040 | | | | 101,463 | |
| | 49,281 | | | Series 2009-111(j)(n) | | 6.25% - 1M US L | | | | 01/25/2040 | | | | 5,846 | |
| | 411,247 | | | Series 2009-12(j)(n) | | 6.60% - 1M US L | | | | 03/25/2036 | | | | 32,414 | |
| | 12,058 | | | Series 2009-28(j)(n) | | 6.00% - 1M US L | | | | 04/25/2037 | | | | 814 | |
| | 83,388 | | | Series 2009-41 | | 4.50% | | | | 06/25/2039 | | | | 83,376 | |
| | 34,269 | | | Series 2009-42(j)(n) | | 6.00% - 1M US L | | | | 06/25/2039 | | | | 2,638 | |
| | 67,960 | | | Series 2009-47(j)(n) | | 6.10% - 1M US L | | | | 07/25/2039 | | | | 4,615 | |
| | 27,068 | | | Series 2009-62(j)(n) | | 6.10% - 1M US L | | | | 08/25/2039 | | | | 985 | |
| | 29,685 | | | Series 2009-66(j)(n) | | 5.80% - 1M US L | | | | 02/25/2038 | | | | 2,482 | |
| | 22,873 | | | Series 2009-68(j)(n) | | 5.25% - 1M US L | | | | 09/25/2039 | | | | 1,576 | |
| | 65,297 | | | Series 2010-11(j)(n) | | 4.80% - 1M US L | | | | 02/25/2040 | | | | 4,899 | |
| | 14,350 | | | Series 2010-111(j)(n) | | 6.00% - 1M US L | | | | 10/25/2040 | | | | 986 | |
| | 62,279 | | | Series 2010-115(j)(n) | | 6.60% - 1M US L | | | | 11/25/2039 | | | | 6,408 | |
| | 783,389 | | | Series 2010-115(j)(n) | | 6.00% - 1M US L | | | | 10/25/2040 | | | | 80,429 | |
| | 1,847,444 | | | Series 2010-123(j)(n) | | 6.05% - 1M US L | | | | 11/25/2040 | | | | 195,078 | |
| | 313,690 | | | Series 2010-15(j)(n) | | 4.95% - 1M US L | | | | 03/25/2040 | | | | 15,091 | |
| | 20,265 | | | Series 2010-34(j)(n) | | 4.93% - 1M US L | | | | 04/25/2040 | | | | 933 | |
| | 22,392 | | | Series 2010-4(j)(n) | | 6.23% - 1M US L | | | | 02/25/2040 | | | | 1,930 | |
| | 33,243 | | | Series 2010-58(j) | | 12.47% - 1M US L | | | | 06/25/2040 | | | | 32,421 | |
| | 1,081,287 | | | Series 2010-75 | | 4.50% | | | | 07/25/2040 | | | | 1,075,303 | |
| | 15,812 | | | Series 2010-9(j)(n) | | 5.30% - 1M US L | | | | 02/25/2040 | | | | 1,013 | |
| | 83,699 | | | Series 2010-9(j)(n) | | 4.75% - 1M US L | | | | 02/25/2040 | | | | 4,345 | |
| | 4,645 | | | Series 2010-90(j)(n) | | 6.00% - 1M US L | | | | 08/25/2040 | | | | 442 | |
| | 53,280 | | | Series 2011-25 | | 3.00% | | | | 04/25/2026 | | | | 52,645 | |
| | 1,465,528 | | | Series 2012-106(j)(n) | | 6.16% - 1M US L | | | | 10/25/2042 | | | | 171,054 | |
| | 262,964 | | | Series 2012-124(j) | | 7.79% - 1M US L | | | | 11/25/2042 | | | | 202,708 | |
| | 95,753 | | | Series 2012-29(j)(n) | | 6.00% - 1M US L | | | | 04/25/2042 | | | | 9,055 | |
| | 273,920 | | | Series 2012-32(n) | | 5.00% | | | | 04/25/2042 | | | | 39,844 | |
| | 1,410,962 | | | Series 2012-65(j)(n) | | 5.98% - 1M US L | | | | 06/25/2042 | | | | 179,645 | |
| | 566,534 | | | Series 2018-21(l) | | 0.00% | | | | 04/25/2048 | | | | 444,527 | |
| | | | | First Horizon Alternative Mortgage Securities Trust | | | | | | | | | | | |
| | 453,005 | | | Series 2005-FA6 | | 5.50% | | | | 09/25/2035 | | | | 242,717 | |
| | | | | First Horizon Mortgage Pass-Through Trust | | | | | | | | | | | |
| | 434,522 | | | Series 2007-AR3(j) | | 5.06% | | | | 11/25/2037 | | | | 186,166 | |
See Notes to Financial Statements and Financial Highlights.
| 48 | (888) 848-7569 | www.rivernorth.com |
| RiverNorth/DoubleLine Strategic Income Fund | Schedule of Investments |
| Principal Amount/Description | | Rate | | | Maturity | | | Value | |
| | | | | Freddie Mac Pool | | | | | | | | | | | |
| $ | 3,479,937 | | | Series 2021- | | 2.00% | | | | 11/01/2050 | | | $ | 2,949,241 | |
| | 1,418,903 | | | Series 2022- | | 3.00% | | | | 03/01/2052 | | | | 1,287,558 | |
| | | | | Freddie Mac REMICS | | | | | | | | | | | |
| | 1,811,793 | | | Series 2011-3972(j)(n) | | 5.79% - 30D US SOFR | | | | 12/15/2041 | | | | 217,483 | |
| | 1,963,895 | | | Series 2020-5007(j)(n) | | 5.99% - 30D US SOFR | | | | 08/25/2050 | | | | 287,352 | |
| | 3,793,429 | | | Series 2020-5041(n) | | 2.00% | | | | 11/25/2050 | | | | 462,075 | |
| | 10,595,793 | | | Series 2020-5057(n) | | 3.00% | | | | 11/25/2050 | | | | 1,628,678 | |
| | 7,917,010 | | | Series 2021-5070(n) | | 3.50% | | | | 02/25/2051 | | | | 1,362,190 | |
| | 6,250,937 | | | Series 2021-5083 | | 2.50% | | | | 03/25/2051 | | | | 3,750,823 | |
| | | | | Freddie Mac STACR REMIC Trust | | | | | | | | | | | |
| | 4,300,000 | | | Series 2020-DNA6(f)(j) | | 30D US SOFR + 5.65% | | | | 12/25/2050 | | | | 4,891,987 | |
| | 2,500,000 | | | Series 2021-DNA1(f)(j) | | 30D US SOFR + 4.75% | | | | 01/25/2051 | | | | 2,690,482 | |
| | 2,750,000 | | | Series 2021-HQA2(f)(j) | | 30D US SOFR + 3.15% | | | | 12/25/2033 | | | | 3,044,794 | |
| | | | | Freddie Mac STACR REMIC Trust 2020-DNA2 | | | | | | | | | | | |
| | 3,000,000 | | | Series 2021-DNA2(f)(j) | | 30D US SOFR + 6.00% | | | | 08/25/2033 | | | | 3,563,231 | |
| | | | | GCAT | | | | | | | | | | | |
| | 1,500,000 | | | Series 2021-NQM4(f)(j) | | 2.47% | | | | 08/25/2025 | | | | 1,045,395 | |
| | | | | Ginnie Mae II Pool | | | | | | | | | | | |
| | 4,537,256 | | | Series 2021- | | 2.50% | | | | 10/20/2051 | | | | 3,977,116 | |
| | 1,366,377 | | | Series 2021- | | 2.50% | | | | 11/20/2051 | | | | 1,193,908 | |
| | | | | Government National Mortgage Association | | | | | | | | | | | |
| | 21,887 | | | Series 2004-83(j)(n) | | 6.08% - 1M US L | | | | 10/20/2034 | | | | 1,314 | |
| | 21,210 | | | Series 2008-6(j)(n) | | 6.46% - 1M US L | | | | 02/20/2038 | | | | 18 | |
| | 20,459 | | | Series 2008-67(j)(n) | | 6.00% - 1M US L | | | | 08/20/2038 | | | | 12 | |
| | 318,631 | | | Series 2008-69(j)(n) | | 7.63% - 1M US L | | | | 08/20/2038 | | | | 20,479 | |
| | 32,195 | | | Series 2009-10(j)(n) | | 6.65% - 1M US L | | | | 02/16/2039 | | | | 3,173 | |
| | 1,285,129 | | | Series 2009-58(j)(n) | | 6.25% - 1M US L | | | | 06/20/2039 | | | | 93,024 | |
| | 22,612 | | | Series 2009-6(j)(n) | | 5.95% - 1M US L | | | | 02/20/2038 | | | | 12 | |
| | 651,224 | | | Series 2009-75 | | 5.00% | | | | 09/20/2039 | | | | 658,293 | |
| | 1,548,953 | | | Series 2010-121(j)(n) | | 6.00% - 1M US L | | | | 09/20/2040 | | | | 161,469 | |
| | 23,137 | | | Series 2010-61(j)(n) | | 6.44% - 1M SOFR | | | | 09/20/2039 | | | | 1,407 | |
| | 668,395 | | | Series 2010-85(j) | | 1M SOFR + 0.67% | | | | 07/20/2040 | | | | 667,999 | |
| | 30,855 | | | Series 2010-98(j)(n) | | 5.38% | | | | 03/20/2039 | | | | 950 | |
| | 13,418,075 | | | Series 2010-H20(j)(n) | | 1.44% | | | | 10/20/2060 | | | | 346,613 | |
| | 215,574 | | | Series 2011-69(l) | | 0.00% | | | | 05/20/2041 | | | | 172,455 | |
| | 471,798 | | | Series 2011-71(j)(n) | | 5.40% - 1M US L | | | | 05/20/2041 | | | | 44,244 | |
| | 135,152 | | | Series 2011-72(j)(n) | | 6.15% - 1M US L | | | | 05/20/2041 | | | | 12,365 | |
See Notes to Financial Statements and Financial Highlights.
| Annual Report | September 30, 2024 | 49 |
| RiverNorth/DoubleLine Strategic Income Fund | Schedule of Investments |
| Principal Amount/Description | | Rate | | | Maturity | | | Value | |
| $ | 710,047 | | | Series 2011-89(j)(n) | | 5.45% - 1M US L | | | | 06/20/2041 | | | $ | 67,289 | |
| | 1,244,026 | | | Series 2013-113(j)(n) | | 6.25% - 1M US L | | | | 03/20/2043 | | | | 41,400 | |
| | 2,542,660 | | | Series 2013-122(j)(n) | | 6.10% - 1M US L | | | | 08/16/2043 | | | | 343,646 | |
| | 1,873,896 | | | Series 2013-148(j)(n) | | 5.68% - 1M US L | | | | 10/16/2043 | | | | 194,652 | |
| | 1,863,533 | | | Series 2013-186(j)(n) | | 6.25% - 1M US L | | | | 02/16/2043 | | | | 115,160 | |
| | 1,569,071 | | | Series 2014-156(j)(n) | | 6.25% - 1M US L | | | | 10/20/2044 | | | | 200,208 | |
| | 3,095,753 | | | Series 2014-4(j)(n) | | 6.10% - 1M US L | | | | 01/16/2044 | | | | 403,225 | |
| | 3,923,655 | | | Series 2014-41(j)(n) | | 5.99% - 1M SOFR | | | | 03/20/2044 | | | | 505,638 | |
| | 1,415,324 | | | Series 2014-5(j)(n) | | 6.15% - 1M US L | | | | 07/20/2043 | | | | 92,263 | |
| | 2,470,589 | | | Series 2014-95(j)(n) | | 6.25% - 1M US L | | | | 06/16/2044 | | | | 244,691 | |
| | 9,748,128 | | | Series 2016-162(j)(n) | | 0.79% | | | | 09/16/2058 | | | | 368,252 | |
| | 1,411,166 | | | Series 2016-89(j) | | 1M SOFR + 0.56% | | | | 07/20/2046 | | | | 1,399,733 | |
| | 10,869,361 | | | Series 2016-H21(j)(n) | | 1.90% | | | | 09/20/2066 | | | | 460,008 | |
| | 7,314,000 | | | Series 2018-19 | | 3.00% | | | | 02/20/2048 | | | | 6,235,632 | |
| | 4,112,471 | | | Series 2018-97(j)(n) | | 6.09% - 1M SOFR | | | | 07/20/2048 | | | | 561,548 | |
| | 446,993 | | | Series 2019-112(j) | | 1M SOFR + 0.51% | | | | 09/20/2049 | | | | 439,139 | |
| | 9,090,583 | | | Series 2019-22(j)(n) | | 5.49% - 1M SOFR | | | | 02/20/2045 | | | | 980,243 | |
| | 1,284,339 | | | Series 2019-90(j) | | 1M SOFR + 0.46% | | | | 07/20/2049 | | | | 1,258,989 | |
| | 4,081,391 | | | Series 2019-92(j)(n) | | 5.99% - 1M SOFR | | | | 07/20/2049 | | | | 524,833 | |
| | 17,611,222 | | | Series 2019-H10(j)(n) | | 0.68% | | | | 06/20/2069 | | | | 978,673 | |
| | 4,415,717 | | | Series 2019-H18(j)(n) | | 0.06% | | | | 11/20/2069 | | | | 281,488 | |
| | 8,405,641 | | | Series 2020-112(j)(n) | | 6.14% - 1M SOFR | | | | 08/20/2050 | | | | 1,105,330 | |
| | 11,810,332 | | | Series 2020-146(j)(n) | | 6.19% - 1M SOFR | | | | 10/20/2050 | | | | 1,871,354 | |
| | 15,314,463 | | | Series 2020-146(j)(n) | | 3.75% - 1M US L | | | | 10/20/2050 | | | | 658,790 | |
| | 11,123,763 | | | Series 2020-167(j)(n) | | 3.75% - 1M US L | | | | 11/20/2050 | | | | 396,257 | |
| | 17,194,152 | | | Series 2020-168(j)(n) | | 0.98% | | | | 12/16/2062 | | | | 1,253,502 | |
| | 4,125,217 | | | Series 2020-188(j)(n) | | 6.19% - 1M SOFR | | | | 11/20/2050 | | | | 618,033 | |
| | 15,833,861 | | | Series 2020-188(n) | | 2.50% | | | | 12/20/2050 | | | | 2,336,837 | |
| | 17,816,651 | | | Series 2020-191(n) | | 3.50% | | | | 12/20/2050 | | | | 3,363,728 | |
| | 18,189,449 | | | Series 2020-H18(j)(n) | | 1.36% | | | | 09/20/2070 | | | | 1,216,163 | |
| | 9,277,928 | | | Series 2021-1(j)(n) | | 6.19% - 1M SOFR | | | | 01/20/2051 | | | | 1,519,090 | |
| | 14,114,847 | | | Series 2021-1(n) | | 2.50% | | | | 01/20/2051 | | | | 1,910,620 | |
| | 9,250,852 | | | Series 2021-107(j)(n) | | 3.75% - 1M US L | | | | 06/20/2051 | | | | 479,932 | |
| | 1,431,168 | | | Series 2021-117(n) | | 3.50% | | | | 06/20/2051 | | | | 248,432 | |
| | 12,083,532 | | | Series 2021-160(n) | | 2.50% | | | | 06/20/2051 | | | | 1,358,475 | |
| | 1,668,063 | | | Series 2021-197(n) | | 3.50% | | | | 11/20/2051 | | | | 306,302 | |
| | 16,871,900 | | | Series 2021-52(j)(n) | | 0.72% | | | | 04/16/2063 | | | | 918,545 | |
| | 21,632,496 | | | Series 2021-59(j)(n) | | 2.60% - 30D US SOFR | | | | 04/20/2051 | | | | 291,632 | |
| | 12,114,155 | | | Series 2021-7(n) | | 2.50% | | | | 01/20/2051 | | | | 1,897,714 | |
| | 12,095,398 | | | Series 2021-76(n) | | 3.00% | | | | 08/20/2050 | | | | 2,020,674 | |
| | 14,302,703 | | | Series 2021-77(n) | | 2.50% | | | | 05/20/2051 | | | | 1,598,170 | |
| | 11,028,334 | | | Series 2021-77(j)(n) | | 3.75% - 1M US L | | | | 05/20/2051 | | | | 519,727 | |
| | 5,527,488 | | | Series 2021-89(j)(n) | | 3.75% - 1M US L | | | | 05/20/2051 | | | | 249,792 | |
| | 8,606,099 | | | Series 2021-97(j)(n) | | 3.75% - 1M US L | | | | 06/20/2051 | | | | 304,484 | |
| | 26,692,720 | | | Series 2021-97(j)(n) | | 3M US L + 2.44% | | | | 06/20/2051 | | | | 256,474 | |
See Notes to Financial Statements and Financial Highlights.
| 50 | (888) 848-7569 | www.rivernorth.com |
| RiverNorth/DoubleLine Strategic Income Fund | Schedule of Investments |
| Principal Amount/Description | | Rate | | | Maturity | | | Value | |
| $ | 12,816,327 | | | Series 2021-H08(j)(n) | | 0.13% | | | | 05/20/2071 | | | $ | 395,048 | |
| | 35,049,938 | | | Series 2022-1(j)(n) | | 2.65% - 30D US SOFR | | | | 01/20/2052 | | | | 478,800 | |
| | 22,154,858 | | | Series 2022-207(n) | | 3.00% | | | | 08/20/2051 | | | | 3,563,186 | |
| | 26,389,436 | | | Series 2022-48(j)(n) | | 0.71% | | | | 01/16/2064 | | | | 1,608,544 | |
| | 13,502,036 | | | Series 2022-83(n) | | 2.50% | | | | 11/20/2051 | | | | 1,910,165 | |
| | | | | GSR Mortgage Loan Trust | | | | | | | | | | | |
| | 885,959 | | | Series 2006-2F | | 5.25% | | | | 02/25/2036 | | | | 353,163 | |
| | 1,529,194 | | | Series 2007-2F | | 6.00% | | | | 03/25/2037 | | | | 818,981 | |
| | 665,952 | | | Series 2007-AR2(j) | | 4.35% | | | | 05/25/2037 | | | | 373,904 | |
| | | | | Impac CMB Trust | | | | | | | | | | | |
| | 73,573 | | | Series 2004-10(j) | | 1M SOFR + 0.81% | | | | 03/25/2035 | | | | 62,486 | |
| | | | | Imperial Fund Mortgage Trust | | | | | | | | | | | |
| | 1,000,000 | | | Series 2021-NQM4(f)(j) | | 3.45% | | | | 01/25/2057 | | | | 762,613 | |
| | | | | IndyMac IMJA Mortgage Loan Trust | | | | | | | | | | | |
| | 947,480 | | | Series 2007-A1 | | 6.00% | | | | 08/25/2037 | | | | 381,819 | |
| | | | | IndyMac IMSC Mortgage Loan Trust | | | | | | | | | | | |
| | 4,681,194 | | | Series 2007-F2 | | 6.50% | | | | 07/25/2037 | | | | 1,459,833 | |
| | | | | JP Morgan Alternative Loan Trust | | | | | | | | | | | |
| | 145,120 | | | Series 2005-S1 | | 6.00% | | | | 12/25/2035 | | | | 99,110 | |
| | 17,447 | | | Series 2006-S3(m) | | 6.62% | | | | 08/25/2036 | | | | 17,156 | |
| | | | | JP Morgan Mortgage Trust | | | | | | | | | | | |
| | 766,838 | | | Series 2007-S3 | | 6.00% | | | | 07/25/2037 | | | | 360,612 | |
| | | | | JP Morgan Resecuritization Trust | | | | | | | | | | | |
| | 470,476 | | | Series 2011-1(f)(j) | | 6.00% | | | | 06/26/2037 | | | | 391,194 | |
| | 1,795,236 | | | Series 2014-6(f)(j) | | 1M SOFR + 0.32% | | | | 07/27/2046 | | | | 1,759,822 | |
| | | | | Lehman Mortgage Trust | | | | | | | | | | | |
| | 369,731 | | | Series 2006-6 | | 5.50% | | | | 10/25/2036 | | | | 249,177 | |
| | 3,839,765 | | | Series 2006-7(j) | | 1M US L + 0.25% | | | | 11/25/2036 | | | | 215,702 | |
| | 3,839,765 | | | Series 2006-7(j)(n) | | 7.75% - 1M US L | | | | 11/25/2036 | | | | 265,759 | |
| | 1,169,712 | | | Series 2006-8(j) | | 1M US L + 0.42% | | | | 12/25/2036 | | | | 237,133 | |
| | 1,169,712 | | | Series 2006-8(j)(n) | | 6.47% - 1M SOFR | | | | 12/25/2036 | | | | 129,891 | |
| | | | | Merrill Lynch Alternative Note Asset Trust | | | | | | | | | | | |
| | 687,842 | | | Series 2007-F1 | | 6.00% | | | | 03/25/2037 | | | | 62,216 | |
| | | | | Morgan Stanley Mortgage Loan Trust | | | | | | | | | | | |
| | 906,912 | | | Series 2005-3AR(j) | | 5.56% | | | | 07/25/2035 | | | | 753,349 | |
| | 2,141,836 | | | Series 2006-11 | | 6.00% | | | | 08/25/2036 | | | | 1,312,898 | |
| | 2,406,276 | | | Series 2006-1AR(j) | | 1M SOFR + 0.39% | | | | 02/25/2036 | | | | 1,484,080 | |
| | 525,563 | | | Series 2006-7(j) | | 5.10% | | | | 06/25/2036 | | | | 289,313 | |
| | 601,343 | | | Series 2006-7 | | 6.00% | | | | 06/25/2036 | | | | 282,982 | |
See Notes to Financial Statements and Financial Highlights.
| Annual Report | September 30, 2024 | 51 |
| RiverNorth/DoubleLine Strategic Income Fund | Schedule of Investments |
September 30, 2024
| Principal Amount/Description | | Rate | | | Maturity | | | Value | |
| | | | | Nomura Asset Acceptance Corp. Alternative Loan Trust | | | | | | | | | | |
| $ | 918,617 | | | Series 2005-AP3(j) | | 5.32% | | | 08/25/2035 | | | $ | 409,841 | |
| | | | | PR Mortgage Loan Trust | | | | | | | | | | |
| | 5,531,910 | | | Series 2014-1(f)(j) | | 5.86% | | | 09/25/2047 | | | | 5,325,515 | |
| | | | | Prime Mortgage Trust | | | | | | | | | | |
| | 38,938 | | | Series 2006-DR1(f) | | 5.50% | | | 05/25/2035 | | | | 35,014 | |
| | | | | RBSGC Structured Trust | | | | | | | | | | |
| | 96,353 | | | Series 2008-B(f) | | 6.00% | | | 06/25/2037 | | | | 83,740 | |
| | | | | Residential Accredit Loans, Inc. | | | | | | | | | | |
| | 3,134,113 | | | Series 2006-QA5(j) | | 1M US L + 0.22% | | | 07/25/2036 | | | | 1,126,810 | |
| | 1,060,527 | | | Series 2006-QS10 | | 6.50% | | | 08/25/2036 | | | | 913,952 | |
| | 272,868 | | | Series 2006-QS6 | | 6.00% | | | 06/25/2036 | | | | 215,452 | |
| | 654,073 | | | Series 2006-QS7 | | 6.00% | | | 06/25/2036 | | | | 515,420 | |
| | 34,386 | | | Series 2006-QS7(j) | | 1M US L + 0.40% | | | 06/25/2036 | | | | 24,238 | |
| | 103,158 | | | Series 2006-QS7(j)(n) | | 5.60% - 1M US L | | | 06/25/2036 | | | | 8,014 | |
| | 45,060 | | | Series 2006-QS8(j) | | 1M US L + 0.45% | | | 08/25/2036 | | | | 32,856 | |
| | 135,180 | | | Series 2006-QS8(j)(n) | | 5.55% - 1M US L | | | 08/25/2036 | | | | 11,994 | |
| | 4,373 | | | Series 2007-QS6(j) | | 55.00% - 8.33 x 1M US L | | | 04/25/2037 | | | | 6,272 | |
| | 401,731 | | | Series 2007-QS9 | | 6.50% | | | 07/25/2037 | | | | 331,447 | |
| | 200,586 | | | Series 2008-QR1 | | 6.00% | | | 08/25/2036 | | | | 165,944 | |
| | | | | Residential Asset Securitization Trust | | | | | | | | | | |
| | 383,405 | | | Series 2006-A1 | | 6.00% | | | 04/25/2036 | | | | 177,943 | |
| | 861,241 | | | Series 2006-A2 | | 6.00% | | | 05/25/2036 | | | | 340,664 | |
| | 896,952 | | | Series 2006-A6 | | 6.50% | | | 07/25/2036 | | | | 259,095 | |
| | 243,132 | | | Series 2006-A8 | | 6.00% | | | 08/25/2036 | | | | 149,337 | |
| | 148,396 | | | Series 2006-A8 | | 6.50% | | | 08/25/2036 | | | | 44,812 | |
| | 314,081 | | | Series 2006-A8(j)(n) | | 5.90% - 1M US L | | | 08/25/2036 | | | | 30,956 | |
| | 1,331,051 | | | Series 2007-A1 | | 6.00% | | | 03/25/2037 | | | | 414,680 | |
| | 55,696 | | | Series 2007-A6 | | 6.00% | | | 06/25/2037 | | | | 29,765 | |
| | 2,534,789 | | | Series 2007-A7 | | 6.00% | | | 07/25/2037 | | | | 964,232 | |
| | | | | Residential Funding Mortgage Securities I Trust | | | | | | | | | | |
| | 336,038 | | | Series 2006-S3 | | 5.50% | | | 03/25/2036 | | | | 272,983 | |
| | 67,941 | | | Series 2006-S6 | | 6.00% | | | 07/25/2036 | | | | 59,234 | |
| | 186,823 | | | Series 2007-S3 | | 6.00% | | | 03/25/2037 | | | | 137,428 | |
| | 104,480 | | | Series 2007-S6 | | 6.00% | | | 06/25/2037 | | | | 81,882 | |
| | | | | Residential Mortgage Loan Trust | | | | | | | | | | |
| | 3,250,000 | | | Series 2020-1(f)(j) | | 4.67% | | | 01/26/2060 | | | | 3,052,585 | |
| | | | | Sequoia Mortgage Trust | | | | | | | | | | |
| | 853,726 | | | Series 2007-3(j) | | 4.66% | | | 07/20/2037 | | | | 652,135 | |
| | | | | Structured Asset Securities Corp. | | | | | | | | | | |
| | 120,614 | | | Series 2005-RF1(f)(j) | | 1M US L + 0.35% | | | 03/25/2035 | | | | 104,899 | |
| | 120,614 | | | Series 2005-RF1(f)(j)(n) | | 0.00% | | | 03/25/2035 | | | | 151 | |
See Notes to Financial Statements and Financial Highlights.
| 52 | (888) 848-7569 | www.rivernorth.com |
| RiverNorth/DoubleLine Strategic Income Fund | Schedule of Investments |
September 30, 2024
| Principal Amount/Description | | Rate | | | Maturity | | | Value | |
| | | | | TBW Mortgage-Backed Trust | | | | | | | | | | |
| $ | 1,391,146 | | | Series 2006-2 | | 7.00% | | | 07/25/2036 | | | $ | 222,338 | |
| | | | | Verus Securitization Trust | | | | | | | | | | |
| | 2,300,000 | | | Series 2019-INV3(f)(j) | | 3.28% | | | 11/25/2059 | | | | 2,210,239 | |
| | 1,500,000 | | | Series 2021-4(f)(j) | | 2.20% | | | 07/25/2066 | | | | 1,099,520 | |
| | 1,400,000 | | | Series 2021-6(f)(j) | | 4.05% | | | 10/25/2066 | | | | 1,176,747 | |
| | 2,000,000 | | | Series 2021-7(f)(j) | | 4.19% | | | 10/25/2066 | | | | 1,535,691 | |
| | 7,706,000 | | | Series 2022-4(f)(j) | | 4.78% | | | 04/25/2067 | | | | 6,862,809 | |
| | 1,369,315 | | | Series 2023-3(f)(m) | | 6.44% | | | 03/25/2068 | | | | 1,385,971 | |
| | | | | Wachovia Mortgage Loan Trust, LLC Series Trust | | | | | | | | | | |
| | 43,389 | | | Series 2005-B(j) | | 6.24% | | | 10/20/2035 | | | | 41,901 | |
| | | | | Washington Mutual Alternative Mortgage Pass-Through Certificates | | | | | | | | | | |
| | 34,349 | | | Series 2005-9 | | 5.50% | | | 11/25/2035 | | | | 27,431 | |
| | 292,860 | | | Series 2006-5 | | 6.00% | | | 07/25/2036 | | | | 212,690 | |
| | | | | Washington Mutual Mortgage Pass-Through Certificates Trust | | | | | | | | | | |
| | 455,506 | | | Series 2006-2 | | 6.00% | | | 03/25/2036 | | | | 445,440 | |
| | | | | Wells Fargo Alternative Loan Trust | | | | | | | | | | |
| | 182,334 | | | Series 2007-PA2(j) | | 1M US L + 0.43% | | | 06/25/2037 | | | | 148,973 | |
| | 182,333 | | | Series 2007-PA2(j)(n) | | 6.07% - 1M US L | | | 06/25/2037 | | | | 22,480 | |
| | 100,381 | | | Series 2007-PA3 | | 5.75% | | | 07/25/2037 | | | | 86,490 | |
| | 213,005 | | | Series 2007-PA3 | | 6.25% | | | 07/25/2037 | | | | 187,592 | |
| | | | | | | | | | | | | | | |
| TOTAL U.S. GOVERNMENT / AGENCY MORTGAGE BACKED SECURITIES | | | | | | | | | | |
| (Cost $279,665,731) | | | | | | | | | 207,214,453 | |
| Shares/Description | | Value | |
| Rights - 0.00%(b) | | | |
| United States - 0.00%(b) | | | | |
| | 100 | | Advent Convertible and Income Fund, Strike Price 0.01, Expires 10/17/2024 | | | 3 | |
| | | | | | | | |
| TOTAL RIGHTS | | | | | | |
| (Cost $0) | | | | | 3 | |
See Notes to Financial Statements and Financial Highlights.
| Annual Report | September 30, 2024 | 53 |
| RiverNorth/DoubleLine Strategic Income Fund | Schedule of Investments |
September 30, 2024
| Shares/Description | | Value | |
| Warrants - 0.00%(b) | | | |
| United States - 0.00%(b) | | | | |
| | 64,870 | | PERSHING SQUARE SPARC HOLDINGS, Strike Price 0.01, Expires 12/31/2049(d) | | $ | – | |
| | | | | | | | |
| TOTAL WARRANTS | | | | |
| (Cost $0) | | | – | |
| | | | | | | | |
| Short-Term Investments - 5.30% | | | | |
| Money Market Fund - 5.30% | | | | |
| | 67,793,779 | | State Street Institutional Treasury Money Market Fund Premier Class (7 Day Yield 4.97%) | | | 67,793,779 | |
| | | | | | | | |
| TOTAL SHORT-TERM INVESTMENTS | | | | |
| (Cost $67,793,779) | | | 67,793,779 | |
| | | | | |
| TOTAL INVESTMENTS - 100.07% | | | | |
| (Cost $1,377,491,034) | | $ | 1,280,897,491 | |
| LIABILITIES IN EXCESS OF OTHER ASSETS - (0.07)% | | | (902,799 | ) |
| NET ASSETS - 100.00% | | $ | 1,279,994,692 | |
Investment Abbreviations:
LIBOR - London Interbank Offered Rate
LLC - Limited Liability Company
LP - Limited Partnership
SOFR - Secured Overnight Financing Rate Data
TI - Treasury Index
Rates:
1M US L - 1 Month LIBOR as of September 30, 2024 was 4.96%
3M US L - 3 Month LIBOR as of September 30, 2024 was 4.85%
1D SOFR - 1 Day SOFR as of September 30, 2024 was 4.96%
30D SOFR - 30 Day SOFR as of September 30, 2024 was 5.16%
1M SOFR - 1 Month SOFR as of September 30, 2024 was 4.85%
3M SOFR - 3 Month SOFR as of September 30, 2024 was 4.59%
1Y US TI - 1 Year TI as of September 30, 2024 was 3.98%
5Y US TI - 5 Year TI as of September 30, 2024 was 3.58%
10Y US TI - 10 Year TI as of September 30, 2024 was 3.81%
See Notes to Financial Statements and Financial Highlights.
| 54 | (888) 848-7569 | www.rivernorth.com |
| RiverNorth/DoubleLine Strategic Income Fund | Schedule of Investments |
September 30, 2024
| (a) | Security has no contractual maturity date, is not redeemable and contractually pays an indefinite stream of interest. |
| (c) | Non-income producing security. |
| (d) | The Level 3 assets were a result of unavailable quoted prices from an active market or the unavailability of other significant observable inputs. |
| (e) | Affiliated company. See Notes to Financial Statements. |
| (f) | Security exempt from registration under Rule 144A of the Securities Act of 1933, as amended. These securities have been deemed liquid under procedures approved by the Fund's Board of Trustees (the “Board”) and may normally be sold to qualified institutional buyers in transactions exempt from registration. Total fair value of Rule 144A securities amounts to $381,380,269, which represents approximately 29.80% of net assets as of September 30, 2024. |
| (g) | Securities were purchased pursuant to Regulation S under the Securities Act of 1933, as amended, which exempts securities offered and sold outside of the United States from registration. Such securities cannot be sold in the United States without either an effective registration statement filed pursuant to the Securities Act of 1933, as amended, or pursuant to an exemption from registration. These securities have been deemed liquid under procedures approved by the Fund's Board. As of September 30, 2024, the aggregate fair value of those securities was $11,990,551, representing 0.94% of net assets. |
| (h) | Pay-in-kind securities. Rate paid in-kind is shown in parenthesis. |
| (i) | Security is currently in default. |
| (j) | Variable rate investment. Interest rates reset periodically. Interest rate shown reflects the rate in effect at September 30, 2024. For securities based on a published reference rate and spread, the reference rate and spread are indicated in the description above. Certain variable rate securities are not based on a published reference rate and spread but are determined by the issuer or agent and are based on current market conditions. These securities do not indicate a reference rate and spread in their description above. |
| (k) | Security does not have a market value or rate. Security will not be entitled to distributions in respect of principal or interest other than excess interest paid with respect to the mortgage loans. |
| (l) | Issued with a zero coupon. Income is recognized through the accretion of discount. |
| (m) | Step up bond. Coupon changes periodically based upon a predetermined schedule. Interest rate disclosed is that which is in effect at September 30, 2024. |
| (n) | Interest only securities. |
Futures Contracts:
| Description | | Contracts | | | Expiration Date | | Notional Value | | | Value and
Unrealized
Appreciation/
(Depreciation) | |
| US 2Yr Note Future | | | 30 | | | December 2024 | | $ | 6,247,266 | | | $ | 12,308 | |
| US T-Bond Future | | | 8 | | | December 2024 | | | 993,500 | | | | 420 | |
| | | | | | | | | $ | 7,240,766 | | | $ | 12,728 | |
See Notes to Financial Statements and Financial Highlights.
| Annual Report | September 30, 2024 | 55 |
| RiverNorth/DoubleLine Strategic Income Fund | Schedule of Investments |
September 30, 2024
Futures Contracts Sold:
| Description | | | Contracts (Short) | | | Expiration Date | | | Notional Value | | | | Value and
Unrealized
Appreciation/
(Depreciation) | |
| Ultra 10-Yr U.S. Treasury Note Futures | | | (110) | | | December 2024 | | $ | 13,012,657 | | | $ | (24,302 | ) |
| US Ultra T-Bond | | | (45) | | | December 2024 | | | 5,989,219 | | | | 4,119 | |
| | | | | | | | | $ | 19,001,876 | | | $ | (20,183 | ) |
See Notes to Financial Statements and Financial Highlights.
| 56 | (888) 848-7569 | www.rivernorth.com |
| RiverNorth/Oaktree High Income Fund | Schedule of Investments |
| Shares/Description | | Value | |
| CLOSED-END FUNDS - 1.71% | | | |
| United States - 1.71% | | | | |
| 58,172 | | | Avenue Income Credit Strategies Fund | | $ | 385,099 | |
| 64,315 | | | Western Asset Inflation-Linked Opportunities & Income Fund | | | 568,544 | |
| | | | | | | | |
| TOTAL CLOSED-END FUNDS | | | | |
| (Cost $980,663) | | | 953,643 | |
| | | | | | | | |
| COMMON STOCKS - 0.16% | | | | |
| United States - 0.16% | | | | |
| 3,304 | | | PHI Group, Inc.(a)(b) | | | 88,812 | |
| 6 | | | Toys R Us Propco Equity(b) | | | 33 | |
| | | | | | | | |
| TOTAL COMMON STOCKS | | | | |
| (Cost $65,834) | | | 88,845 | |
| Principal Amount/Description | | Rate | | Maturity | | | Value | |
| BANK LOANS - 11.18%(c) | | | | | | |
| Great Britain - 0.67% | | | | | | | | | | |
| $ | 244,375 | | | City Football Group, Ltd., First Lien | | 1M SOFR + 3.00%, 0.50% Floor | | | 07/22/2030 | | | | 243,764 | |
| | 130,604 | | | Osmosis Buyer, Ltd., First Lien - Initial B Term Loan | | 3M US L + 2.75%, 0.50% Floor | | | 06/16/2028 | | | | 130,598 | |
| | | | | | | | | | | | | | 374,362 | |
| Luxembourg - 0.44% | | | | | | | | | | |
| | 240,584 | | | Wave Distribution Holdings LLC, First Lien - Dollar Tranche Term Loan | | 1M SOFR + 3.50% | | | 03/05/2027 | | | | 241,438 | |
| | | | | | | | | | | | | | | |
| United States - 10.07% | | | | | | | | | | |
| | 36,396 | | | Adtalem Global Education, Inc., First Lien | | 6M CME TERM + 2.75%, 0.75% Floor | | | 08/14/2028 | | | | 36,470 | |
| | 48,564 | | | Advantage Sales & Marketing, Inc., First Lien | | 3M SOFR + 4.25%, 0.75% Floor | | | 10/28/2027 | | | | 47,267 | |
| | 121,250 | | | Allied Universal Holdco LLC, First Lien - Initial U.S. Dollar Term Loan | | 1M US L + 3.75%, 0.50% Floor | | | 05/15/2028 | | | | 120,204 | |
| | 78,435 | | | American Auto Auction Group, LLC, First Lien | | 3M SOFR + 5.00% | | | 12/30/2027 | | | | 78,877 | |
| | 8,672 | | | American Rock Salt 9/24 | | 6M CME TERM + 7.00% | | | 09/06/2028 | | | | 8,672 | |
| | 51,278 | | | American Rock Salt Company LLC, First Lien - Initial Term Loan | | 3M US L + 3.25%, 0.75% Floor | | | 06/09/2028 | | | | 42,381 | |
| | 42,808 | | | Ankura Consulting Group LLC, First Lien | | 3M SOFR + 4.25%, 0.75% Floor | | | 03/17/2028 | | | | 42,996 | |
| | 134,121 | | | ARAGORN PARENT CORPORATION, TL | | 1M SOFR + 4.25% | | | 06/15/2028 | | | | 134,791 | |
See Notes to Financial Statements and Financial Highlights.
| Annual Report | September 30, 2024 | 57 |
| RiverNorth/Oaktree High Income Fund | Schedule of Investments |
| Principal Amount/Description | | Rate | | Maturity | | | Value | |
| $ | 27,275 | | | ASP Blade Holdings, Inc. TLB 1L | | 3M SOFR + 4.00% | | | 10/07/2028 | | | $ | 20,286 | |
| | 219,563 | | | Astoria Energy LLC, First Lien - B Advance (2020) Term Loan | | 3M US L + 4.25%, 1.00% Floor | | | 12/10/2027 | | | | 220,488 | |
| | 137,433 | | | Asurion LLC, First Lien - New B-8 Term Loan | | 3M SOFR + 3.25% | | | 12/23/2026 | | | | 137,478 | |
| | 155,057 | | | BCP Renaissance Parent LLC, First Lien | | 3M SOFR + 3.25%, 1.00% Floor | | | 10/31/2028 | | | | 155,250 | |
| | 69,004 | | | BCPE North Star US Holdco 2, Inc., First Lien - Initial Term Loan | | 3M US L + 3.75%, 0.75% Floor | | | 06/09/2028 | | | | 65,489 | |
| | 97,750 | | | Bengal Debt Merger Sub, LLC, First Lien | | 3M SOFR + 3.25% | | | 01/19/2029 | | | | 80,339 | |
| | 25,000 | | | Bengal Debt Merger Sub, LLC, Second Lien | | 3M SOFR + 6.00% | | | 01/18/2030 | | | | 15,548 | |
| | 19,763 | | | Carnival Corp., First Lien | | 1M SOFR + 2.75%, 0.75% Floor | | | 10/18/2028 | | | | 19,827 | |
| | 172,113 | | | Charter Next Generation, Inc., First Lien | | 1M SOFR + 3.25%, 0.75% Floor | | | 12/01/2027 | | | | 172,346 | |
| | 121,250 | | | Consilio/Skopima 5/21 Cov-Lite TLB | | 3M SOFR + 4.00% | | | 05/12/2028 | | | | 121,212 | |
| | 22,297 | | | CPV Maryland LLC, First Lien - B Advance Term Loan | | 3M US L + 5.25%, 1.00% Floor | | | 05/11/2028 | | | | 22,436 | |
| | 132,647 | | | CQP Holdco LP, First Lien | | 3M SOFR + 2.25%, 0.50% Floor | | | 12/31/2030 | | | | 132,678 | |
| | 27,617 | | | Directv Financing LLC, First Lien | | 1M SOFR + 5.25%, 0.75% Floor | | | 08/02/2027 | | | | 27,237 | |
| | 242,500 | | | DRW Holdings LLC, First Lien | | 3M SOFR + 3.50% | | | 06/26/2031 | | | | 242,689 | |
| | 84,214 | | | EG America LLC, First Lien | | 3M SOFR + 5.50%, 0.50% Floor | | | 02/07/2028 | | | | 84,284 | |
| | 76,050 | | | Electron BidCo, Inc. TL 1L | | 1M SOFR + 3.00% | | | 10/07/2028 | | | | 76,240 | |
| | 146,250 | | | Fertitta Entertainment, LLC, First Lien | | 1M SOFR + 3.75% | | | 01/13/2029 | | | | 146,012 | |
| | 235,223 | | | Flynn Restaurant Group LP, First Lien | | 1M SOFR + 4.25%, 0.50% Floor | | | 12/04/2028 | | | | 236,291 | |
| | 240,681 | | | Great Outdoors Group LLC, First Lien | | 1M SOFR + 3.75%, 0.75% Floor | | | 03/06/2028 | | | | 240,957 | |
| | 147,000 | | | Houghton Mifflin Harcrt Co Tl 1L | | 1M SOFR + 5.25% | | | 04/04/2029 | | | | 143,365 | |
| | 60,795 | | | Hudson River Trading LLC, First Lien | | 1M US L + 3.00% | | | 03/20/2028 | | | | 60,800 | |
| | 61,583 | | | Hunter Douglas, Inc., First Lien | | 3M SOFR + 3.50% | | | 02/09/2029 | | | | 61,236 | |
| | 241,934 | | | IRB Holding Corp., First Lien | | 1M SOFR + 2.75%, 0.75% Floor | | | 12/15/2027 | | | | 241,900 | |
| | 44,505 | | | Majordrive Holdings IV LLC, First Lien - Initial Term Loan | | 3M US L + 3.75%, 0.50% Floor | | | 06/01/2028 | | | | 44,672 | |
| | 57,968 | | | McAfee Corp., First Lien | | 1M SOFR + 3.25%, 0.50% Floor | | | 03/01/2029 | | | | 57,836 | |
| | 34,054 | | | Merion Rose Merger Sub, Inc., First Lien | | 3M SOFR + 4.00% | | | 12/08/2028 | | | | 31,397 | |
| | 196,706 | | | Natgasoline LLC, First Lien - Initial Term Loan | | 1M SOFR + 3.625% | | | 11/14/2025 | | | | 195,723 | |
| | 48,158 | | | Oryx Midstream Services Permian Basin LLC, First Lien | | 1M SOFR + 3.00%, 0.50% Floor | | | 10/05/2028 | | | | 48,232 | |
See Notes to Financial Statements and Financial Highlights.
| 58 | (888) 848-7569 | www.rivernorth.com |
| RiverNorth/Oaktree High Income Fund | Schedule of Investments |
| Principal Amount/Description | | Rate | | Maturity | | | Value | |
| $ | 93,100 | | | PMHC II, INC.TLB 1L | | 3M SOFR + 4.25% | | | 04/21/2029 | | | $ | 91,014 | |
| | 53,625 | | | Restaurant Technologies, Inc. TLB 1L | | 3M SOFR + 4.25% | | | 03/17/2029 | | | | 50,991 | |
| | 39,595 | | | SCIH Salt Holdings, Inc., First Lien - Incremental B-1 Term Loan | | 3M US L + 3.50%, 0.75% Floor | | | 03/16/2027 | | | | 39,638 | |
| | 145,525 | | | SeaWorld Parks & Entertainment, Inc., First Lien | | 1M SOFR + 2.50%, 0.50% Floor | | | 08/25/2028 | | | | 145,404 | |
| | 40,361 | | | Secure Acquisition, Inc. | | 1M SOFR + 4.25% | | | 12/15/2028 | | | | 40,488 | |
| | 42,686 | | | SM Wellness Holdings, Inc., First Lien - Initial Term Loan | | 3M US L + 3.75%, 0.75% Floor | | | 04/17/2028 | | | | 42,339 | |
| | 134,928 | | | Spin Holdco, Inc., First Lien - Initial Term Loan | | 1M US L + 3.50%, 0.75% Floor | | | 03/04/2028 | | | | 118,709 | |
| | 87,188 | | | SPX FLOW, Inc., First Lien | | 1M SOFR + 3.50%, 0.50% Floor | | | 04/05/2029 | | | | 87,397 | |
| | 235,847 | | | STUBHUB HLDGS INC, TL | | 1M SOFR + 4.75% | | | 03/12/2030 | | | | 236,043 | |
| | 94,534 | | | Tiger Acquisition LLC, First Lien - Initial Term Loan | | L + 3.25%, 0.50% Floor | | | 06/01/2028 | | | | 94,203 | |
| | 70,700 | | | Triton Water Holdings, Inc., First Lien - Initial Term Loan | | 3M SOFR + 3.25%, 0.50% Floor | | | 03/31/2028 | | | | 70,658 | |
| | 186,021 | | | UKG, Inc., First Lien | | 3M SOFR + 3.25% | | | 02/10/2031 | | | | 186,254 | |
| | 199,200 | | | University Support Services LLC, First Lien | | 1M SOFR + 2.75%, 0.50% Floor | | | 02/12/2029 | | | | 198,857 | |
| | 43,875 | | | Univision Communications, Inc., First Lien - B Term Loan | | 3M US L + 4.00%, 0.75% Floor | | | 01/31/2029 | | | | 42,888 | |
| | 63,213 | | | W. R. Grace Holdings LLC, First Lien - Initial Term Loan | | L + 3.75%, 0.50% Floor | | | 09/22/2028 | | | | 63,450 | |
| | 220,357 | | | Wec US Holdings, Ltd., First Lien | | 1M SOFR + 2.75% | | | 01/27/2031 | | | | 220,557 | |
| | 80,930 | | | Whatabrands LLC, First Lien | | 1M SOFR + 2.75%, 0.50% Floor | | | 08/03/2028 | | | | 80,903 | |
| | 196,655 | | | William Morris Endeavor Entertainment LLC, First Lien - B-1 Term Loan | | 1M SOFR + 2.75% | | | 05/19/2025 | | | | 197,023 | |
| | | | | | | | | | | | | | | |
| | | | | | | | | | | | | | 5,620,722 | |
| | | | | | | | | | | | | | | |
| TOTAL BANK LOANS | | | | | | | | | | |
| (Cost $6,277,338) | | | | | | | | | 6,236,522 | |
| | | | | | | | | | | | | | | |
| HIGH YIELD DEBT- 78.08% | | | | | | | | | | |
| Australia - 0.34% | | | | | | | | | | |
| | 20,000 | | | Mineral Resources, Ltd.(d) | | 9.25% | | | 10/01/2028 | | | | 21,321 | |
| | 60,000 | | | Mineral Resources, Ltd.(d) | | 8.50% | | | 05/01/2030 | | | | 62,572 | |
| | 115,000 | | | Nufarm Australia, Ltd. / Nufarm Americas, Inc.(d) | | 5.00% | | | 01/27/2030 | | | | 106,809 | |
| | | | | | | | | | | | | | 190,702 | |
See Notes to Financial Statements and Financial Highlights.
| Annual Report | September 30, 2024 | 59 |
| RiverNorth/Oaktree High Income Fund | Schedule of Investments |
| Principal Amount/Description | | Rate | | Maturity | | | Value | |
| Belgium - 0.23% | | | | | | | | | |
| $ | 115,000 | | | Ontex Group NV | | 3.50% | | | 07/15/2026 | | | $ | 127,140 | |
| | | | | | | | | | | | | | | |
| Canada - 2.79% | | | | | | | | | | |
| | 90,000 | | | Bausch Health Cos., Inc.(d) | | 6.13% | | | 02/01/2027 | | | | 81,368 | |
| | 65,000 | | | Bausch Health Cos., Inc.(d) | | 4.88% | | | 06/01/2028 | | | | 50,927 | |
| | 100,000 | | | Bombardier, Inc.(d) | | 6.00% | | | 02/15/2028 | | | | 100,744 | |
| | 90,000 | | | Bombardier, Inc.(d) | | 8.75% | | | 11/15/2030 | | | | 98,939 | |
| | 30,000 | | | Bombardier, Inc.(d) | | 7.25% | | | 07/01/2031 | | | | 31,753 | |
| | 90,000 | | | Bombardier, Inc.(d) | | 7.00% | | | 06/01/2032 | | | | 94,247 | |
| | 110,000 | | | Cascades, Inc./Cascades USA, Inc.(d) | | 5.38% | | | 01/15/2028 | | | | 107,647 | |
| | 115,000 | | | Dye & Durham, Ltd.(d) | | 8.63% | | | 04/15/2029 | | | | 121,757 | |
| | 80,000 | | | Empire Communities Corp.(d) | | 9.75% | | | 05/01/2029 | | | | 85,516 | |
| | 180,000 | | | goeasy, Ltd.(d) | | 9.25% | | | 12/01/2028 | | | | 193,953 | |
| | 15,000 | | | goeasy, Ltd.(d) | | 7.63% | | | 07/01/2029 | | | | 15,555 | |
| | 95,000 | | | Husky Injection Molding Systems, Ltd. / Titan Co.-Borrower LLC(d) | | 9.00% | | | 02/15/2029 | | | | 99,252 | |
| | 105,000 | | | Intelligent Packaging, Ltd. Finco, Inc. / Intelligent Packaging Ltd Co.-Issuer LLC(d) | | 6.00% | | | 09/15/2028 | | | | 104,372 | |
| | 110,000 | | | Mercer International, Inc. | | 5.13% | | | 02/01/2029 | | | | 93,960 | |
| | 70,000 | | | Northriver Midstream Finance LP(d) | | 5.63% | | | 02/15/2026 | | | | 69,854 | |
| | 20,000 | | | Open Text Corp.(d) | | 6.90% | | | 12/01/2027 | | | | 21,111 | |
| | 38,000 | | | Precision Drilling Corp.(d) | | 7.13% | | | 01/15/2026 | | | | 38,105 | |
| | 25,000 | | | Precision Drilling Corp.(d) | | 6.88% | | | 01/15/2029 | | | | 24,969 | |
| | 127,000 | | | Saturn Oil & Gas, Inc.(d) | | 9.63% | | | 06/15/2029 | | | | 125,584 | |
| | | | | | | | | | | | | | 1,559,613 | |
| France - 1.78% | | | | | | | | | | |
| | 100,000 | | | Altice France SA(e) | | 4.13% | | | 01/15/2029 | | | | 78,278 | |
| | 55,000 | | | Altice France SA(d) | | 5.13% | | | 07/15/2029 | | | | 38,728 | |
| | 100,000 | | | Altice France SA(d) | | 4.25% | | | 10/15/2029 | | | | 78,262 | |
| | 100,000 | | | Banijay Entertainment SAS(d) | | 7.00% | | | 05/01/2029 | | | | 117,297 | |
| | 65,000 | | | Constellium SE(d) | | 6.38% | | | 08/15/2032 | | | | 66,770 | |
| | 255,000 | | | Iliad Holding SASU(d) | | 5.63% | | | 10/15/2028 | | | | 289,353 | |
| | 100,000 | | | Loxam SAS(e) | | 6.38% | | | 05/31/2029 | | | | 116,506 | |
| | 100,000 | | | Nova Alexandre III SAS(c)(e) | | 3M EUR L + 5.25% | | | 07/15/2029 | | | | 109,298 | |
| | 95,000 | | | Vallourec SACA(d) | | 7.50% | | | 04/15/2032 | | | | 100,892 | |
| | | | | | | | | | | | | | 995,384 | |
| Germany - 1.52% | | | | | | | | | | |
| | 200,000 | | | Cheplapharm Arzneimittel GmbH(e) | | 7.50% | | | 05/15/2030 | | | | 235,150 | |
| | 100,000 | | | IHO Verwaltungs GmbH(d)(f) | | 8.75% (9.50%) | | | 05/15/2028 | | | | 117,105 | |
| | 100,000 | | | Nidda Healthcare Holding GmbH(e) | | 7.50% | | | 08/21/2026 | | | | 115,287 | |
| | 96,712 | | | Techem Verwaltungsgesellschaft 674 mbH(e) | | 6.00% | | | 07/30/2026 | | | | 107,987 | |
| | 120,000 | | | TUI AG(e) | | 5.88% | | | 03/15/2029 | | | | 139,464 | |
See Notes to Financial Statements and Financial Highlights.
| 60 | (888) 848-7569 | www.rivernorth.com |
| RiverNorth/Oaktree High Income Fund | Schedule of Investments |
| Principal Amount/Description | | Rate | | Maturity | | | Value | |
| $ | 115,000 | | | TUI Cruises GmbH(d) | | 6.25% | | | 04/15/2029 | | | $ | 134,971 | |
| | | | | | | | | | | | | | 849,964 | |
| Great Britain - 2.59% | | | | | | | | | | |
| | 125,000 | | | Ardonagh Finco, Ltd.(e) | | 6.88% | | | 02/15/2031 | | | | 141,622 | |
| | 160,000 | | | Aston Martin Capital Holdings, Ltd.(d) | | 10.00% | | | 03/31/2029 | | | | 157,152 | |
| | 100,000 | | | B&M European Value Retail SA | | 8.13% | | | 11/15/2030 | | | | 143,682 | |
| | 100,000 | | | CD&R Firefly Bidco PLC(d) | | 8.63% | | | 04/30/2029 | | | | 138,746 | |
| | 105,000 | | | Heathrow Finance PLC | | 6.63% | | | 03/01/2031 | | | | 140,725 | |
| | 95,000 | | | Howden UK Refinance PLC / Howden UK Refinance 2 PLC / Howden US Refinance LLC(d) | | 8.13% | | | 02/15/2032 | | | | 97,739 | |
| | 100,000 | | | Pinnacle Bidco PLC(e) | | 10.00% | | | 10/11/2028 | | | | 142,803 | |
| | 110,000 | | | RAC Bond Co. PLC(e) | | 5.25% | | | 11/04/2027 | | | | 144,446 | |
| | 225,000 | | | Vmed O2 UK Financing I PLC(d) | | 4.75% | | | 07/15/2031 | | | | 200,505 | |
| | 150,000 | | | Vodafone Group PLC(c) | | 5Y US TI + 2.767% | | | 06/04/2081 | | | | 136,146 | |
| | | | | | | | | | | | | | 1,443,566 | |
| Hong Kong - 0.43% | | | | | | | | | | |
| | 250,000 | | | Seaspan Corp.(d) | | 5.50% | | | 08/01/2029 | | | | 238,335 | |
| | | | | | | | | | | | | | | |
| Ireland - 1.03% | | | | | | | | | | |
| | 55,000 | | | Adient Global Holdings, Ltd.(d) | | 7.00% | | | 04/15/2028 | | | | 56,699 | |
| | 75,000 | | | Adient Global Holdings, Ltd.(d) | | 8.25% | | | 04/15/2031 | | | | 79,659 | |
| | 200,000 | | | Ardagh Packaging Finance PLC / Ardagh Holdings USA, Inc.(e) | | 2.13% | | | 08/15/2026 | | | | 193,037 | |
| | 100,000 | | | Virgin Media Vendor Financing Notes III DAC(e) | | 4.88% | | | 07/15/2028 | | | | 123,842 | |
| | 100,000 | | | Virgin Media Vendor Financing Notes III DAC(d) | | 4.88% | | | 07/15/2028 | | | | 123,842 | |
| | | | | | | | | | | | | | 577,079 | |
| Italy - 2.47% | | | | | | | | | | |
| | 100,000 | | | Cedacri Mergeco SPA(c)(d) | | 3M EUR L + 4.625% | | | 05/15/2028 | | | | 111,312 | |
| | 110,000 | | | Cerved Group SpA(c)(e) | | 3M EUR L + 5.25% | | | 02/15/2029 | | | | 119,523 | |
| | 100,000 | | | Engineering - Ingegneria Informatica - SpA(e) | | 5.88% | | | 09/30/2026 | | | | 109,562 | |
| | 115,000 | | | Fiber Bidco Spa(c)(e) | | 3M EUR L + 4.00% | | | 01/15/2030 | | | | 129,014 | |
| | 100,000 | | | Guala Closures SpA(e) | | 3.25% | | | 06/15/2028 | | | | 105,346 | |
| | 100,000 | | | IMA Industria Macchine Automatiche SpA(c)(d) | | 3M EUR L + 3.75% | | | 04/15/2029 | | | | 112,726 | |
| | 118,967 | | | Inter Media and Communication SpA(e) | | 6.75% | | | 02/09/2027 | | | | 134,587 | |
| | 100,000 | | | Mooney Group SpA(c)(e) | | 3M EUR L + 3.875% | | | 12/17/2026 | | | | 111,184 | |
| | 115,000 | | | Neopharmed Gentili SPA(d) | | 7.13% | | | 04/08/2030 | | | | 133,375 | |
| | 167,000 | | | Optics Bidco SpA(d) | | 6.38% | | | 11/15/2033 | | | | 174,061 | |
| | 125,000 | | | Shiba Bidco SpA | | 4.50% | | | 10/31/2028 | | | | 134,895 | |
| | | | | | | | | | | | | | 1,375,585 | |
See Notes to Financial Statements and Financial Highlights.
| Annual Report | September 30, 2024 | 61 |
| RiverNorth/Oaktree High Income Fund | Schedule of Investments |
| Principal Amount/Description | | Rate | | | Maturity | | | Value | |
| Luxembourg - 3.60% | | | | | | | | | |
| $ | 200,000 | | | Allied Universal Holdco LLC/Allied Universal Finance Corp./Atlas Luxco 4 Sarl(d) | | 4.63% | | | 06/01/2028 | | | $ | 188,213 | |
| | 100,000 | | | Allied Universal Holdco LLC/Allied Universal Finance Corp./Atlas Luxco 4 Sarl(e) | | 3.63% | | | 06/01/2028 | | | | 105,123 | |
| | 100,000 | | | Altice Financing SA(e) | | 4.25% | | | 08/15/2029 | | | | 89,695 | |
| | 100,000 | | | Altice Financing SA(d) | | 4.25% | | | 08/15/2029 | | | | 89,696 | |
| | 100,000 | | | Cirsa Finance International Sarl(d) | | 6.50% | | | 03/15/2029 | | | | 116,720 | |
| | 120,000 | | | Connect Finco SARL / Connect US Finco LLC(d) | | 9.00% | | | 09/15/2029 | | | | 116,278 | |
| | 115,000 | | | Dana Financing Luxembourg Sarl(e) | | 8.50% | | | 07/15/2031 | | | | 136,588 | |
| | 100,000 | | | Eurofins Scientific SE(c)(g) | | 3M EUR L + 2.667% | | | Perpetual Maturity | | | | 109,311 | |
| | 100,000 | | | Eurofins Scientific SE(c)(g) | | 3M EUR L + 4.241% | | | Perpetual Maturity | | | | 118,146 | |
| | 105,000 | | | Intelsat Jackson Holdings SA(d) | | 6.50% | | | 03/15/2030 | | | | 100,724 | |
| | 200,000 | | | ION Trading Technologies Sarl(d) | | 5.75% | | | 05/15/2028 | | | | 187,085 | |
| | 120,000 | | | Loarre Investments Sarl(e) | | 6.50% | | | 05/15/2029 | | | | 139,379 | |
| | 120,000 | | | Rossini Sarl(e) | | 6.75% | | | 12/31/2029 | | | | 140,691 | |
| | 100,000 | | | Sani/Ikos Financial Holdings 1 Sarl(d) | | 7.25% | | | 07/31/2030 | | | | 114,502 | |
| | 205,000 | | | Summer BC Holdco B SARL(e) | | 5.75% | | | 10/31/2026 | | | | 228,453 | |
| | 28,000 | | | Telecom Italia Capital SA | | 6.38% | | | 11/15/2033 | | | | 28,886 | |
| | | | | | | | | | | | | | 2,009,490 | |
| Netherlands - 2.65% | | | | | | | | | | |
| | 125,000 | | | Boels Topholding BV(e) | | 5.75% | | | 05/15/2030 | | | | 143,694 | |
| | 125,000 | | | Boost Newco Borrower LLC/GTCR W Dutch Finance Sub BV(d) | | 8.50% | | | 01/15/2031 | | | | 181,259 | |
| | 130,000 | | | Energizer Gamma Acquisition BV(e) | | 3.50% | | | 06/30/2029 | | | | 136,843 | |
| | 100,000 | | | Odido Group Holding BV(e) | | 5.50% | | | 01/15/2030 | | | | 109,090 | |
| | 125,000 | | | Odido Holding BV(d) | | 3.75% | | | 01/15/2029 | | | | 136,796 | |
| | 115,000 | | | OI European Group BV(d) | | 5.25% | | | 06/01/2029 | | | | 130,970 | |
| | 120,000 | | | Q-Park Holding I BV(d) | | 5.13% | | | 02/15/2030 | | | | 136,478 | |
| | 200,000 | | | Sunrise FinCo I BV(d) | | 4.88% | | | 07/15/2031 | | | | 189,406 | |
| | 100,000 | | | Telefonica Europe BV(c)(g) | | 8Y EUR SWAP + 3.615% | | | Perpetual Maturity | | | | 122,933 | |
| | 200,000 | | | Ziggo BV(d) | | 4.88% | | | 01/15/2030 | | | | 190,262 | |
| | | | | | | | | | | | | | 1,477,731 | |
| Spain - 0.36% | | | | | | | | | |
| | 180,000 | | | Kaixo Bondco Telecom SA(e) | | 5.13% | | | 09/30/2029 | | | | 200,799 | |
| | | | | | | | | | | | | | | |
| Sweden - 0.90% | | | | | | | | | | |
| | 135,000 | | | Castellum AB(c)(g) | | 3.454% - 5Y EUR SWAP | | | Perpetual Maturity | | | | 144,130 | |
See Notes to Financial Statements and Financial Highlights.
| 62 | (888) 848-7569 | www.rivernorth.com |
| RiverNorth/Oaktree High Income Fund | Schedule of Investments |
| Principal Amount/Description | | Rate | | | Maturity | | | Value | |
| $ | 140,000 | | | Heimstaden Bostad AB(c)(g) | | 3.904% - 5Y EUR SWAP | | | Perpetual Maturity | | | $ | 137,646 | |
| | 200,000 | | | Verisure Midholding AB(e) | | 5.25% | | | 02/15/2029 | | | | 221,372 | |
| | | | | | | | | | | | | | 503,148 | |
| United States - 57.39% | | | | | | | | | | |
| | 40,000 | | | Academy, Ltd.(d) | | 6.00% | | | 11/15/2027 | | | | 40,138 | |
| | 95,000 | | | ACCO Brands Corp.(d) | | 4.25% | | | 03/15/2029 | | | | 89,026 | |
| | 105,000 | | | Acuris Finance US, Inc. / Acuris Finance SARL(d) | | 5.00% | | | 05/01/2028 | | | | 96,259 | |
| | 80,000 | | | Aethon United BR LP / Aethon United Finance Corp.(d) | | 7.50% | | | 10/01/2029 | | | | 81,117 | |
| | 160,000 | | | Alliant Holdings Intermediate LLC /Alliant Holdings Co.-Issuer(d) | | 6.75% | | | 04/15/2028 | | | | 162,710 | |
| | 25,000 | | | Alliant Holdings Intermediate LLC /Alliant Holdings Co.-Issuer(d) | | 7.00% | | | 01/15/2031 | | | | 25,709 | |
| | 75,000 | | | Allied Universal Holdco LLC(d) | | 7.88% | | | 02/15/2031 | | | | 76,676 | |
| | 70,000 | | | Alpha Generation LLC(d) | | 6.75% | | | 10/15/2032 | | | | 71,031 | |
| | 95,000 | | | AMC Networks, Inc.(d) | | 10.25% | | | 01/15/2029 | | | | 97,710 | |
| | 125,000 | | | AMC Networks, Inc. | | 4.25% | | | 02/15/2029 | | | | 90,520 | |
| | 130,000 | | | Amer Sports Co.(d) | | 6.75% | | | 02/16/2031 | | | | 133,383 | |
| | 50,000 | | | American Airlines, Inc.(d) | | 7.25% | | | 02/15/2028 | | | | 51,226 | |
| | 90,000 | | | American Axle & Manufacturing, Inc. | | 5.00% | | | 10/01/2029 | | | | 82,717 | |
| | 185,000 | | | AmeriGas Partners LP / AmeriGas Finance Corp.(d) | | 9.38% | | | 06/01/2028 | | | | 194,432 | |
| | 65,000 | | | Anywhere Real Estate Group LLC /Anywhere Co.-Issuer Corp.(d) | | 7.00% | | | 04/15/2030 | | | | 60,444 | |
| | 235,000 | | | Anywhere Real Estate Group LLC /Realogy Co.-Issuer Corp. | | 0.25% | | | 06/15/2026 | | | | 206,154 | |
| | 15,000 | | | Anywhere Real Estate Group LLC /Realogy Co.-Issuer Corp.(d) | | 5.75% | | | 01/15/2029 | | | | 12,528 | |
| | 65,000 | | | APX Group, Inc.(d) | | 5.75% | | | 07/15/2029 | | | | 64,420 | |
| | 235,000 | | | Arches Buyer, Inc.(d) | | 4.25% | | | 06/01/2028 | | | | 216,459 | |
| | 17,000 | | | Archrock Partners LP / Archrock Partners Finance Corp.(d) | | 6.88% | | | 04/01/2027 | | | | 17,067 | |
| | 75,000 | | | Archrock Partners LP / Archrock Partners Finance Corp.(d) | | 6.25% | | | 04/01/2028 | | | | 75,432 | |
| | 65,000 | | | Arsenal AIC Parent LLC(d) | | 8.00% | | | 10/01/2030 | | | | 69,832 | |
| | 55,000 | | | Artera Services LLC(d) | | 8.50% | | | 02/15/2031 | | | | 54,500 | |
| | 75,000 | | | Ascent Resources Utica Holdings LLC /ARU Finance Corp.(d) | | 7.00% | | | 11/01/2026 | | | | 75,127 | |
| | 175,000 | | | ASP Unifrax Holdings, Inc.(d) | | 5.25% | | | 09/30/2028 | | | | 87,477 | |
| | 135,000 | | | AssuredPartners, Inc.(d) | | 7.50% | | | 02/15/2032 | | | | 138,863 | |
| | 100,000 | | | AT&T, Inc.(c)(g) | | | | | Perpetual Maturity | | | | 110,395 | |
| | 75,000 | | | AthenaHealth Group, Inc.(d) | | 6.50% | | | 02/15/2030 | | | | 72,104 | |
| | 85,000 | | | Avient Corp.(d) | | 7.13% | | | 08/01/2030 | | | | 88,707 | |
See Notes to Financial Statements and Financial Highlights.
| Annual Report | September 30, 2024 | 63 |
| RiverNorth/Oaktree High Income Fund | Schedule of Investments |
| Principal Amount/Description | | Rate | | Maturity | | | Value | |
| $ | 70,000 | | | B&G Foods, Inc. | | 5.25% | | | 09/15/2027 | | | $ | 67,335 | |
| | 140,000 | | | B&G Foods, Inc.(d) | | 8.00% | | | 09/15/2028 | | | | 146,622 | |
| | 145,000 | | | BellRing Brands, Inc.(d) | | 7.00% | | | 03/15/2030 | | | | 151,897 | |
| | 60,000 | | | Big River Steel LLC / BRS Finance Corp.(d) | | 6.63% | | | 01/31/2029 | | | | 60,841 | |
| | 240,000 | | | Block Communications, Inc.(d) | | 4.88% | | | 03/01/2028 | | | | 226,714 | |
| | 165,000 | | | Bloomin' Brands, Inc. / OSI Restaurant Partners LLC(d) | | 5.13% | | | 04/15/2029 | | | | 154,647 | |
| | 500,000 | | | Blue Owl Capital Corp. | | 3.75% | | | 07/22/2025 | | | | 494,194 | |
| | 1,242,000 | | | Blue Owl Capital Corp. III | | 3.13% | | | 04/13/2027 | | | | 1,175,305 | |
| | 200,000 | | | Blue Owl Credit Income Corp. | | 5.50% | | | 03/21/2025 | | | | 199,864 | |
| | 105,000 | | | Blue Racer Midstream LLC / Blue Racer Finance
Corp.(d) | | 7.00% | | | 07/15/2029 | | | | 109,244 | |
| | 60,000 | | | Blue Racer Midstream LLC / Blue Racer Finance
Corp.(d) | | 7.25% | | | 07/15/2032 | | | | 63,014 | |
| | 220,000 | | | BlueLinx Holdings, Inc.(d) | | 6.00% | | | 11/15/2029 | | | | 212,069 | |
| | 55,000 | | | Boost Newco Borrower LLC(d) | | 7.50% | | | 01/15/2031 | | | | 59,063 | |
| | 279,390 | | | Borr IHC, Ltd. / Borr Finance LLC(d) | | 10.00% | | | 11/15/2028 | | | | 290,504 | |
| | 105,000 | | | Brinker International, Inc.(d) | | 8.25% | | | 07/15/2030 | | | | 112,911 | |
| | 45,000 | | | Buckeye Partners LP(d) | | 4.50% | | | 03/01/2028 | | | | 43,678 | |
| | 105,000 | | | Buckeye Partners LP(d) | | 6.88% | | | 07/01/2029 | | | | 107,669 | |
| | 175,000 | | | Cable One, Inc.(h) | | 0.00% | | | 03/15/2026 | | | | 161,000 | |
| | 70,000 | | | Cablevision Lightpath LLC(d) | | 3.88% | | | 09/15/2027 | | | | 66,899 | |
| | 172,000 | | | Cablevision Lightpath LLC(d) | | 5.63% | | | 09/15/2028 | | | | 161,691 | |
| | 125,000 | | | Calpine Corp.(d) | | 5.00% | | | 02/01/2031 | | | | 121,137 | |
| | 205,000 | | | Carnival Corp.(d) | | 6.00% | | | 05/01/2029 | | | | 207,834 | |
| | 330,000 | | | Carnival Corp.(d) | | 10.50% | | | 06/01/2030 | | | | 358,507 | |
| | 50,000 | | | CCO Holdings LLC / CCO Holdings Capital Corp.(d) | | 5.50% | | | 05/01/2026 | | | | 49,940 | |
| | 175,000 | | | CCO Holdings LLC / CCO Holdings Capital Corp.(d) | | 6.38% | | | 09/01/2029 | | | | 175,330 | |
| | 120,000 | | | CCO Holdings LLC / CCO Holdings Capital Corp.(d) | | 4.75% | | | 03/01/2030 | | | | 110,470 | |
| | 250,000 | | | CCO Holdings LLC / CCO Holdings Capital Corp.(d) | | 4.50% | | | 06/01/2033 | | | | 212,507 | |
| | 135,000 | | | CCO Holdings LLC / CCO Holdings Capital Corp.(d) | | 4.25% | | | 01/15/2034 | | | | 110,855 | |
| | 130,000 | | | Cedar Fair LP / Canada's Wonderland Co./ Magnum Management Corp. /Millennium Op | | 5.25% | | | 07/15/2029 | | | | 127,824 | |
| | 75,000 | | | Chart Industries, Inc.(d) | | 7.50% | | | 01/01/2030 | | | | 79,138 | |
| | 35,000 | | | Chart Industries, Inc.(d) | | 9.50% | | | 01/01/2031 | | | | 38,181 | |
| | 40,000 | | | CHS/Community Health Systems, Inc.(d) | | 6.00% | | | 01/15/2029 | | | | 38,869 | |
| | 165,000 | | | CHS/Community Health Systems, Inc.(d) | | 5.25% | | | 05/15/2030 | | | | 151,986 | |
| | 170,000 | | | CHS/Community Health Systems, Inc.(d) | | 10.88% | | | 01/15/2032 | | | | 187,550 | |
| | 10,000 | | | Churchill Downs, Inc.(d) | | 4.75% | | | 01/15/2028 | | | | 9,812 | |
See Notes to Financial Statements and Financial Highlights.
| 64 | (888) 848-7569 | www.rivernorth.com |
| RiverNorth/Oaktree High Income Fund | Schedule of Investments |
September 30, 2024
| Principal Amount/Description | | Rate | | | Maturity | | | Value | |
| $ | 55,000 | | | Churchill Downs, Inc.(d) | | 5.75% | | | 04/01/2030 | | | $ | 55,100 | |
| | 100,000 | | | Churchill Downs, Inc.(d) | | 6.75% | | | 05/01/2031 | | | | 103,391 | |
| | 35,000 | | | CITGO Petroleum Corp.(d) | | 6.38% | | | 06/15/2026 | | | | 35,084 | |
| | 95,000 | | | Clear Channel Outdoor Holdings, Inc.(d) | | 5.13% | | | 08/15/2027 | | | | 93,463 | |
| | 60,000 | | | Clear Channel Outdoor Holdings, Inc.(d) | | 9.00% | | | 09/15/2028 | | | | 63,834 | |
| | 65,000 | | | Clear Channel Outdoor Holdings, Inc.(d) | | 7.88% | | | 04/01/2030 | | | | 68,025 | |
| | 280,000 | | | Cleveland-Cliffs, Inc.(d) | | 7.00% | | | 03/15/2032 | | | | 283,427 | |
| | 275,000 | | | Cloud Software Group, Inc.(d) | | 6.50% | | | 03/31/2029 | | | | 273,848 | |
| | 160,000 | | | Cloud Software Group, Inc.(d) | | 8.25% | | | 06/30/2032 | | | | 167,377 | |
| | 85,000 | | | Clydesdale Acquisition Holdings, Inc.(d) | | 6.63% | | | 04/15/2029 | | | | 85,886 | |
| | 35,000 | | | Clydesdale Acquisition Holdings, Inc.(d) | | 6.88% | | | 01/15/2030 | | | | 35,787 | |
| | 70,000 | | | Cogent Communications Group LLC(d) | | 7.00% | | | 06/15/2027 | | | | 71,291 | |
| | 150,000 | | | Cogent Communications Group, Inc. / Cogent Communications Finance, Inc.(d) | | 7.00% | | | 06/15/2027 | | | | 152,577 | |
| | 25,000 | | | CommScope LLC(d) | | 7.13% | | | 07/01/2028 | | | | 20,755 | |
| | 108,000 | | | CommScope LLC(d) | | 4.75% | | | 09/01/2029 | | | | 90,855 | |
| | 145,000 | | | Compass Group Diversified Holdings LLC(d) | | 5.25% | | | 04/15/2029 | | | | 140,992 | |
| | 90,000 | | | Comstock Resources, Inc.(d) | | 6.75% | | | 03/01/2029 | | | | 87,665 | |
| | 70,000 | | | Comstock Resources, Inc.(d) | | 5.88% | | | 01/15/2030 | | | | 65,503 | |
| | 105,000 | | | Consolidated Communications, Inc.(d) | | 5.00% | | | 10/01/2028 | | | | 96,742 | |
| | 65,000 | | | Coty, Inc./HFC Prestige Products Inc/HFC Prestige International US LLC(d) | | 6.63% | | | 07/15/2030 | | | | 67,598 | |
| | 150,000 | | | Cougar JV Subsidiary LLC(d) | | 8.00% | | | 05/15/2032 | | | | 158,734 | |
| | 250,000 | | | CQP Holdco LP / BIP-V Chinook Holdco LLC(d) | | 7.50% | | | 12/15/2033 | | | | 271,446 | |
| | 115,000 | | | Crocs, Inc.(d) | | 4.25% | | | 03/15/2029 | | | | 108,835 | |
| | 75,000 | | | CSC Holdings LLC(d) | | 5.50% | | | 04/15/2027 | | | | 66,025 | |
| | 115,000 | | | CSC Holdings LLC(d) | | 5.75% | | | 01/15/2030 | | | | 59,629 | |
| | 25,000 | | | CSC Holdings LLC(d) | | 5.00% | | | 11/15/2031 | | | | 12,373 | |
| | 110,000 | | | Cushman & Wakefield US Borrower LLC(d) | | 8.88% | | | 09/01/2031 | | | | 120,195 | |
| | 145,000 | | | CVR Energy, Inc.(d) | | 5.75% | | | 02/15/2028 | | | | 136,289 | |
| | 20,000 | | | Dana, Inc. | | 5.38% | | | 11/15/2027 | | | | 19,876 | |
| | 30,000 | | | Dana, Inc. | | 4.25% | | | 09/01/2030 | | | | 26,960 | |
| | 195,000 | | | Directv Financing LLC / Directv Financing Co.-Obligor, Inc.(d) | | 5.88% | | | 08/15/2027 | | | | 191,595 | |
| | 65,000 | | | Elastic NV(d) | | 4.13% | | | 07/15/2029 | | | | 60,793 | |
| | 100,000 | | | EMRLD Borrower LP / Emerald Co.- Issuer, Inc.(d) | | 6.38% | | | 12/15/2030 | | | | 117,100 | |
| | 85,000 | | | Endo Finance Holdings, Inc.(d) | | 8.50% | | | 04/15/2031 | | | | 91,187 | |
| | 45,000 | | | EnerSys(d) | | 6.63% | | | 01/15/2032 | | | | 46,600 | |
| | 265,000 | | | EnLink Midstream Partners LP | | 5.05% | | | 04/01/2045 | | | | 238,571 | |
| | 180,000 | | | EQM Midstream Partners LP(d) | | 4.75% | | | 01/15/2031 | | | | 174,414 | |
| | 275,000 | | | EquipmentShare.com, Inc.(d) | | 9.00% | | | 05/15/2028 | | | | 287,519 | |
See Notes to Financial Statements and Financial Highlights.
| Annual Report | September 30, 2024 | 65 |
| RiverNorth/Oaktree High Income Fund | Schedule of Investments |
September 30, 2024
| Principal Amount/Description | | Rate | | | Maturity | | | Value | |
| $ | 65,000 | | | EquipmentShare.com, Inc.(d) | | 8.00% | | | 03/15/2033 | | | $ | 66,593 | |
| | 50,000 | | | Fertitta Entertainment LLC / Fertitta Entertainment Finance Co., Inc.(d) | | 4.63% | | | 01/15/2029 | | | | 47,779 | |
| | 50,000 | | | Fertitta Entertainment LLC / Fertitta Entertainment Finance Co., Inc.(d) | | 6.75% | | | 01/15/2030 | | | | 46,616 | |
| | 90,000 | | | Fiesta Purchaser, Inc.(d) | | 7.88% | | | 03/01/2031 | | | | 95,569 | |
| | 70,000 | | | Fiesta Purchaser, Inc.(d) | | 9.63% | | | 09/15/2032 | | | | 72,635 | |
| | 10,000 | | | FirstCash, Inc.(d) | | 4.63% | | | 09/01/2028 | | | | 9,663 | |
| | 170,000 | | | FirstCash, Inc.(d) | | 5.63% | | | 01/01/2030 | | | | 168,588 | |
| | 100,000 | | | Fortress Intermediate 3, Inc.(d) | | 7.50% | | | 06/01/2031 | | | | 105,628 | |
| | 200,000 | | | Fortress Transportation and Infrastructure Investors LLC(d) | | 5.50% | | | 05/01/2028 | | | | 199,345 | |
| | 23,000 | | | Fortress Transportation and Infrastructure Investors LLC(d) | | 7.88% | | | 12/01/2030 | | | | 24,801 | |
| | 500,000 | | | Franklin BSP Capital Corp.(d) | | 4.85% | | | 12/15/2024 | | | | 498,556 | |
| | 672,860 | | | Franklin BSP Capital Corp. | | 3.25% | | | 03/30/2026 | | | | 651,261 | |
| | 15,000 | | | Freedom Mortgage Corp.(d) | | 12.00% | | | 10/01/2028 | | | | 16,399 | |
| | 35,000 | | | Freedom Mortgage Corp.(d) | | 12.25% | | | 10/01/2030 | | | | 39,230 | |
| | 70,000 | | | Freedom Mortgage Holdings LLC(d) | | 9.13% | | | 05/15/2031 | | | | 72,055 | |
| | 10,000 | | | Frontier Communications Holdings LLC(d) | | 5.00% | | | 05/01/2028 | | | | 9,918 | |
| | 20,000 | | | Frontier Communications Holdings LLC(d) | | 8.75% | | | 05/15/2030 | | | | 21,330 | |
| | 1,000,000 | | | FS KKR Capital Corp. | | 4.13% | | | 02/01/2025 | | | | 994,191 | |
| | 35,000 | | | Go Daddy Operating Co. LLC / GD Finance Co, Inc.(d) | | 5.25% | | | 12/01/2027 | | | | 34,900 | |
| | 34,000 | | | Goodyear Tire & Rubber Co. | | 9.50% | | | 05/31/2025 | | | | 34,158 | |
| | 130,000 | | | Graham Packaging Co., Inc.(d) | | 7.13% | | | 08/15/2028 | | | | 128,850 | |
| | 115,000 | | | Great Lakes Dredge & Dock Corp.(d) | | 5.25% | | | 06/01/2029 | | | | 107,009 | |
| | 120,000 | | | Greystar Real Estate Partners LLC(d) | | 7.75% | | | 09/01/2030 | | | | 127,545 | |
| | 90,000 | | | Gulfport Energy Corp.(d) | | 6.75% | | | 09/01/2029 | | | | 91,165 | |
| | 30,000 | | | Hanesbrands, Inc.(d) | | 4.88% | | | 05/15/2026 | | | | 29,765 | |
| | 140,000 | | | Hanesbrands, Inc.(d) | | 9.00% | | | 02/15/2031 | | | | 151,248 | |
| | 5,000 | | | HAT Holdings I LLC / HAT Holdings II LLC(d) | | 3.75% | | | 09/15/2030 | | | | 4,519 | |
| | 1,782 | | | Hawaiian Brand Intellectual Property, Ltd. / HawaiianMiles Loyalty, Ltd.(d) | | 5.75% | | | 01/20/2026 | | | | 1,679 | |
| | 130,000 | | | Helios Software Holdings, Inc. / ION Corporate Solutions Finance Sarl(d) | | 8.75% | | | 05/01/2029 | | | | 132,999 | |
| | 115,000 | | | Helios Software Holdings, Inc. / ION Corporate Solutions Finance Sarl(d) | | 7.88% | | | 05/01/2029 | | | | 130,417 | |
| | 170,000 | | | Hilton Grand Vacations Borrower Escrow LLC / Hilton Grand Vacations Borrower Esc(d) | | 5.00% | | | 06/01/2029 | | | | 161,634 | |
| | 30,000 | | | HLF Financing Sarl LLC / Herbalife International, Inc.(d) | | 12.25% | | | 04/15/2029 | | | | 29,935 | |
| | 135,000 | | | HLF Financing Sarl LLC / Herbalife International, Inc.(d) | | 4.88% | | | 06/01/2029 | | | | 85,614 | |
See Notes to Financial Statements and Financial Highlights.
| 66 | (888) 848-7569 | www.rivernorth.com |
| RiverNorth/Oaktree High Income Fund | Schedule of Investments |
September 30, 2024
| Principal Amount/Description | | Rate | | | Maturity | | | Value | |
| $ | 80,000 | | | Howard Midstream Energy Partners LLC(d) | | 8.88% | | | 07/15/2028 | | | $ | 84,914 | |
| | 45,000 | | | HUB International, Ltd.(d) | | 5.63% | | | 12/01/2029 | | | | 44,174 | |
| | 80,000 | | | HUB International, Ltd.(d) | | 7.25% | | | 06/15/2030 | | | | 83,417 | |
| | 255,000 | | | Hunt Companies, Inc.(d) | | 5.25% | | | 04/15/2029 | | | | 246,938 | |
| | 145,000 | | | Imola Merger Corp.(d) | | 4.75% | | | 05/15/2029 | | | | 141,615 | |
| | 15,000 | | | Iron Mountain, Inc.(d) | | 5.00% | | | 07/15/2028 | | | | 14,816 | |
| | 55,000 | | | Iron Mountain, Inc.(d) | | 7.00% | | | 02/15/2029 | | | | 57,372 | |
| | 55,000 | | | Iron Mountain, Inc.(d) | | 5.25% | | | 07/15/2030 | | | | 54,351 | |
| | 135,000 | | | JB Poindexter & Co., Inc.(d) | | 8.75% | | | 12/15/2031 | | | | 142,899 | |
| | 105,000 | | | JELD-WEN, Inc.(d) | | 7.00% | | | 09/01/2032 | | | | 106,204 | |
| | 20,000 | | | JetBlue Airways Corp. | | 0.50% | | | 04/01/2026 | | | | 18,450 | |
| | 310,000 | | | Kennedy-Wilson, Inc. | | 4.75% | | | 02/01/2030 | | | | 281,397 | |
| | 90,000 | | | Kennedy-Wilson, Inc. | | 5.00% | | | 03/01/2031 | | | | 80,869 | |
| | 145,000 | | | Kinetik Holdings LP(d) | | 6.63% | | | 12/15/2028 | | | | 150,607 | |
| | 55,000 | | | Kinetik Holdings LP(d) | | 5.88% | | | 06/15/2030 | | | | 55,419 | |
| | 130,000 | | | Kodiak Gas Services LLC(d) | | 7.25% | | | 02/15/2029 | | | | 134,639 | |
| | 115,000 | | | Kraken Oil & Gas Partners LLC(d) | | 7.63% | | | 08/15/2029 | | | | 114,949 | |
| | 50,000 | | | LABL, Inc.(d) | | 5.88% | | | 11/01/2028 | | | | 46,921 | |
| | 155,000 | | | LCM Investments Holdings II LLC(d) | | 8.25% | | | 08/01/2031 | | | | 164,708 | |
| | 20,000 | | | Level 3 Financing, Inc.(d) | | 4.63% | | | 09/15/2027 | | | | 17,715 | |
| | 15,000 | | | Level 3 Financing, Inc.(d) | | 4.25% | | | 07/01/2028 | | | | 12,000 | |
| | 60,000 | | | Level 3 Financing, Inc.(d) | | 3.63% | | | 01/15/2029 | | | | 42,150 | |
| | 140,000 | | | Level 3 Financing, Inc.(d) | | 3.75% | | | 07/15/2029 | | | | 95,900 | |
| | 185,000 | | | LFS Topco LLC(d) | | 5.88% | | | 10/15/2026 | | | | 174,185 | |
| | 130,000 | | | Lightning Power LLC(d) | | 7.25% | | | 08/15/2032 | | | | 136,812 | |
| | 135,000 | | | Madison IAQ LLC(d) | | 5.88% | | | 06/30/2029 | | | | 131,559 | |
| | 50,000 | | | Marriott Ownership Resorts, Inc. | | 4.75% | | | 01/15/2028 | | | | 48,080 | |
| | 215,000 | | | Marriott Ownership Resorts, Inc.(d) | | 4.50% | | | 06/15/2029 | | | | 202,401 | |
| | 110,000 | | | Masterbrand, Inc.(d) | | 7.00% | | | 07/15/2032 | | | | 115,370 | |
| | 110,000 | | | Matador Resources Co.(d) | | 6.88% | | | 04/15/2028 | | | | 111,971 | |
| | 25,000 | | | Matador Resources Co.(d) | | 6.50% | | | 04/15/2032 | | | | 24,981 | |
| | 75,000 | | | Mativ Holdings, Inc.(d) | | 8.00% | | | 10/01/2029 | | | | 76,644 | |
| | 110,000 | | | Medline Borrower LP(d) | | 5.25% | | | 10/01/2029 | | | | 108,011 | |
| | 60,000 | | | Mercer International, Inc. | | 5.50% | | | 01/15/2026 | | | | 58,950 | |
| | 55,000 | | | MPH Acquisition Holdings LLC(d) | | 5.50% | | | 09/01/2028 | | | | 39,710 | |
| | 135,000 | | | Nabors Industries, Inc.(d) | | 9.13% | | | 01/31/2030 | | | | 139,345 | |
| | 100,000 | | | Nabors Industries, Inc.(d) | | 8.88% | | | 08/15/2031 | | | | 95,216 | |
| | 30,000 | | | Nabors Industries, Ltd.(d) | | 7.50% | | | 01/15/2028 | | | | 28,154 | |
| | 20,000 | | | Nationstar Mortgage Holdings, Inc.(d) | | 7.13% | | | 02/01/2032 | | | | 20,904 | |
| | 150,000 | | | NCL Corp., Ltd.(d) | | 8.13% | | | 01/15/2029 | | | | 160,533 | |
| | 80,000 | | | NCL Corp., Ltd.(d) | | 7.75% | | | 02/15/2029 | | | | 85,786 | |
| | 115,000 | | | NCR Atleos Corp.(d) | | 9.50% | | | 04/01/2029 | | | | 126,692 | |
| | 34,000 | | | NCR Voyix Corp.(d) | | 5.13% | | | 04/15/2029 | | | | 33,300 | |
| | 245,000 | | | Necessity Retail REIT, Inc. / American Finance Operating Partner LP(d) | | 4.50% | | | 09/30/2028 | | | | 230,136 | |
See Notes to Financial Statements and Financial Highlights.
| Annual Report | September 30, 2024 | 67 |
| RiverNorth/Oaktree High Income Fund | Schedule of Investments |
September 30, 2024
| Principal Amount/Description | | Rate | | | Maturity | | | Value | |
| $ | 35,000 | | | New Enterprise Stone & Lime Co., Inc.(d) | | 9.75% | | | 07/15/2028 | | | $ | 35,786 | |
| | 135,000 | | | New Enterprise Stone & Lime Co., Inc.(d) | | 5.25% | | | 07/15/2028 | | | | 131,953 | |
| | 105,000 | | | NextEra Energy Operating Partners LP(d) | | 7.25% | | | 01/15/2029 | | | | 110,794 | |
| | 130,000 | | | NextEra Energy Partners LP(d)(h) | | 0.00% | | | 11/15/2025 | | | | 121,907 | |
| | 150,000 | | | NGL Energy Operating LLC / NGL Energy Finance Corp.(d) | | 8.13% | | | 02/15/2029 | | | | 153,921 | |
| | 45,000 | | | NGL Energy Operating LLC / NGL Energy Finance Corp.(d) | | 8.38% | | | 02/15/2032 | | | | 46,409 | |
| | 25,000 | | | Northern Oil & Gas, Inc.(d) | | 8.13% | | | 03/01/2028 | | | | 25,202 | |
| | 105,000 | | | Northern Oil & Gas, Inc.(d) | | 8.75% | | | 06/15/2031 | | | | 109,543 | |
| | 260,000 | | | NRG Energy, Inc.(d) | | 3.63% | | | 02/15/2031 | | | | 235,841 | |
| | 5,000 | | | NuStar Logistics LP | | 6.00% | | | 06/01/2026 | | | | 5,034 | |
| | 28,000 | | | NuStar Logistics LP | | 6.38% | | | 10/01/2030 | | | | 29,073 | |
| | 20,000 | | | Oceaneering International, Inc. | | 6.00% | | | 02/01/2028 | | | | 20,054 | |
| | 155,000 | | | Oceaneering International, Inc. | | 6.00% | | | 02/01/2028 | | | | 155,421 | |
| | 115,000 | | | Olympus Water US Holding Corp.(d) | | 4.25% | | | 10/01/2028 | | | | 109,918 | |
| | 25,000 | | | Olympus Water US Holding Corp.(d) | | 9.75% | | | 11/15/2028 | | | | 26,713 | |
| | 115,000 | | | Olympus Water US Holding Corp.(e) | | 9.63% | | | 11/15/2028 | | | | 137,674 | |
| | 40,000 | | | Olympus Water US Holding Corp.(d) | | 6.25% | | | 10/01/2029 | | | | 38,753 | |
| | 120,000 | | | Olympus Water US Holding Corp.(d) | | 7.25% | | | 06/15/2031 | | | | 124,985 | |
| | 40,000 | | | OneMain Finance Corp. | | 7.88% | | | 03/15/2030 | | | | 41,852 | |
| | 20,000 | | | OneMain Finance Corp. | | 7.13% | | | 11/15/2031 | | | | 20,255 | |
| | 210,000 | | | Open Text Holdings, Inc.(d) | | 4.13% | | | 02/15/2030 | | | | 197,332 | |
| | 225,000 | | | Organon & Co. / Organon Foreign Debt Co-Issuer BV(d) | | 5.13% | | | 04/30/2031 | | | | 212,126 | |
| | 60,000 | | | Organon & Co. / Organon Foreign Debt Co-Issuer BV(d) | | 7.88% | | | 05/15/2034 | | | | 63,642 | |
| | 20,000 | | | Outfront Media Capital LLC / Outfront Media Capital Corp.(d) | | 5.00% | | | 08/15/2027 | | | | 19,902 | |
| | 25,000 | | | Owens & Minor, Inc.(d) | | 4.50% | | | 03/31/2029 | | | | 22,632 | |
| | 76,000 | | | Owens & Minor, Inc.(d) | | 6.63% | | | 04/01/2030 | | | | 73,845 | |
| | 25,000 | | | Owens-Brockway Glass Container, Inc.(d) | | 7.25% | | | 05/15/2031 | | | | 25,715 | |
| | 200,000 | | | Owens-Brockway Glass Container, Inc.(d) | | 7.38% | | | 06/01/2032 | | | | 204,505 | |
| | 140,000 | | | Panther Escrow Issuer LLC(d) | | 7.13% | | | 06/01/2031 | | | | 146,957 | |
| | 55,000 | | | Park Intermediate Holdings LLC / PK Domestic Property LLC / PK Finance Co.-Issuer(d) | | 5.88% | | | 10/01/2028 | | | | 54,958 | |
| | 170,000 | | | Park Intermediate Holdings LLC / PK Domestic Property LLC / PK Finance Co.-Issuer(d) | | 4.88% | | | 05/15/2029 | | | | 165,104 | |
| | 45,000 | | | Park Intermediate Holdings LLC / PK Domestic Property LLC / PK Finance Co.-Issuer(d) | | 7.00% | | | 02/01/2030 | | | | 46,817 | |
| | 70,000 | | | Pebblebrook Hotel Trust | | 1.75% | | | 12/15/2026 | | | | 64,540 | |
| | 145,000 | | | Pediatrix Medical Group, Inc.(d) | | 5.38% | | | 02/15/2030 | | | | 140,556 | |
| | 35,000 | | | Permian Resources Operating LLC(d) | | 5.88% | | | 07/01/2029 | | | | 34,997 | |
See Notes to Financial Statements and Financial Highlights.
| 68 | (888) 848-7569 | www.rivernorth.com |
| RiverNorth/Oaktree High Income Fund | Schedule of Investments |
September 30, 2024
| Principal Amount/Description | | Rate | | | Maturity | | | Value | |
| $ | 75,000 | | | Phinia, Inc.(d) | | 6.75% | | | 04/15/2029 | | | $ | 77,494 | |
| | 165,000 | | | Pike Corp.(d) | | 8.63% | | | 01/31/2031 | | | | 176,627 | |
| | 245,000 | | | Prime Security Services Borrower LLC / Prime Finance, Inc.(d) | | 6.25% | | | 01/15/2028 | | | | 245,251 | |
| | 176,000 | | | QVC, Inc.(d) | | 6.88% | | | 04/15/2029 | | | | 146,401 | |
| | 100,000 | | | Railworks Holdings LP / Railworks Rally, Inc.(d) | | 8.25% | | | 11/15/2028 | | | | 103,530 | |
| | 100,000 | | | RAY Financing LLC(d) | | 6.50% | | | 07/15/2031 | | | | 114,529 | |
| | 145,000 | | | RHP HOTEL PPTY RHP 6 1/2 04/01/32 | | | | | 04/01/2032 | | | | 149,957 | |
| | 120,000 | | | RHP Hotel Properties LP / RHP Finance Corp.(d) | | 7.25% | | | 07/15/2028 | | | | 125,672 | |
| | 40,000 | | | RLJ Lodging Trust LP(d) | | 4.00% | | | 09/15/2029 | | | | 36,855 | |
| | 75,000 | | | Rocket Mortgage LLC / Rocket Mortgage Co.-Issuer, Inc.(d) | | 4.00% | | | 10/15/2033 | | | | 67,060 | |
| | 115,000 | | | Rocket Software, Inc.(d) | | 9.00% | | | 11/28/2028 | | | | 120,108 | |
| | 135,000 | | | Royal Caribbean Cruises, Ltd.(d) | | 6.25% | | | 03/15/2032 | | | | 140,125 | |
| | 170,000 | | | Sally Holdings LLC / Sally Capital, Inc. | | 6.75% | | | 03/01/2032 | | | | 174,756 | |
| | 100,000 | | | SCIL IV LLC / SCIL USA Holdings LLC(d) | | 5.38% | | | 11/01/2026 | | | | 98,850 | |
| | 98,000 | | | Sealed Air Corp./Sealed Air Corp US(d) | | 7.25% | | | 02/15/2031 | | | | 103,845 | |
| | 141,000 | | | Service Properties Trust(d) | | 8.63% | | | 11/15/2031 | | | | 153,450 | |
| | 165,000 | | | Service Properties Trust | | 8.88% | | | 06/15/2032 | | | | 157,751 | |
| | 85,000 | | | Sirius XM Radio, Inc.(d) | | 5.50% | | | 07/01/2029 | | | | 83,106 | |
| | 245,000 | | | Sirius XM Radio, Inc.(d) | | 4.13% | | | 07/01/2030 | | | | 222,355 | |
| | 40,000 | | | Sirius XM Radio, Inc.(d) | | 3.88% | | | 09/01/2031 | | | | 34,883 | |
| | 80,000 | | | Six Flags Entertainment Corp.(d) | | 5.50% | | | 04/15/2027 | | | | 79,557 | |
| | 95,000 | | | Six Flags Entertainment Corp.(d) | | 7.25% | | | 05/15/2031 | | | | 98,462 | |
| | 70,000 | | | Sotera Health Holdings LLC(d) | | 7.38% | | | 06/01/2031 | | | | 72,783 | |
| | 22,000 | | | Spectrum Brands, Inc.(d) | | 3.88% | | | 03/15/2031 | | | | 19,371 | |
| | 40,000 | | | Standard Industries, Inc.(d) | | 5.00% | | | 02/15/2027 | | | | 39,695 | |
| | 85,000 | | | Standard Industries, Inc.(d) | | 4.75% | | | 01/15/2028 | | | | 83,330 | |
| | 115,000 | | | Summit Materials LLC / Summit Materials Finance Corp.(d) | | 7.25% | | | 01/15/2031 | | | | 121,932 | |
| | 140,000 | | | Sunoco LP(d) | | 7.25% | | | 05/01/2032 | | | | 148,517 | |
| | 115,000 | | | Talen Energy Supply LLC(d) | | 8.63% | | | 06/01/2030 | | | | 125,426 | |
| | 135,000 | | | TMS International Corp.(d) | | 6.25% | | | 04/15/2029 | | | | 128,690 | |
| | 70,000 | | | TransDigm, Inc. | | 4.63% | | | 01/15/2029 | | | | 67,658 | |
| | 95,000 | | | UKG, Inc.(d) | | 6.88% | | | 02/01/2031 | | | | 98,232 | |
| | 115,000 | | | Univision Communications, Inc.(d) | | 6.63% | | | 06/01/2027 | | | | 115,452 | |
| | 10,000 | | | Univision Communications, Inc.(d) | | 7.38% | | | 06/30/2030 | | | | 9,686 | |
| | 95,000 | | | US Foods, Inc.(d) | | 7.25% | | | 01/15/2032 | | | | 100,662 | |
| | 30,000 | | | USA Compression Partners LP / USA Compression Finance Corp. | | 6.88% | | | 09/01/2027 | | | | 30,277 | |
| | 195,000 | | | USA Compression Partners LP / USA Compression Finance Corp.(d) | | 7.13% | | | 03/15/2029 | | | | 200,995 | |
| | 135,000 | | | Velocity Vehicle Group LLC(d) | | 8.00% | | | 06/01/2029 | | | | 140,688 | |
| | 90,000 | | | Venture Global LNG, Inc.(d) | | 8.13% | | | 06/01/2028 | | | | 93,887 | |
See Notes to Financial Statements and Financial Highlights.
| Annual Report | September 30, 2024 | 69 |
| RiverNorth/Oaktree High Income Fund | Schedule of Investments |
September 30, 2024
| Principal Amount/Description | | Rate | | | Maturity | | | Value | |
| $ | 110,000 | | | Venture Global LNG, Inc.(d) | | 9.50% | | | 02/01/2029 | | | $ | 123,984 | |
| | 100,000 | | | Venture Global LNG, Inc.(d) | | 7.00% | | | 01/15/2030 | | | | 102,236 | |
| | 325,000 | | | Venture Global LNG, Inc.(d) | | 8.38% | | | 06/01/2031 | | | | 343,397 | |
| | 65,000 | | | Vistra Operations Co. LLC(d) | | 5.00% | | | 07/31/2027 | | | | 64,734 | |
| | 40,000 | | | Vistra Operations Co. LLC(d) | | 7.75% | | | 10/15/2031 | | | | 43,094 | |
| | 140,000 | | | Vistra Operations Co. LLC(d) | | 6.88% | | | 04/15/2032 | | | | 147,385 | |
| | 175,000 | | | Vital Energy, Inc.(d) | | 7.88% | | | 04/15/2032 | | | | 169,654 | |
| | 40,000 | | | Walgreens Boots Alliance, Inc. | | 8.13% | | | 08/15/2029 | | | | 39,964 | |
| | 65,000 | | | Walgreens Boots Alliance, Inc. | | 4.10% | | | 04/15/2050 | | | | 42,789 | |
| | 65,000 | | | Wand NewCo 3, Inc.(d) | | 7.63% | | | 01/30/2032 | | | | 68,522 | |
| | 245,000 | | | WASH Multifamily Acquisition, Inc.(d) | | 5.75% | | | 04/15/2026 | | | | 243,892 | |
| | 50,000 | | | Weatherford International, Ltd.(d) | | 8.63% | | | 04/30/2030 | | | | 52,137 | |
| | 120,000 | | | Weekley Homes LLC / Weekley Finance Corp.(d) | | 4.88% | | | 09/15/2028 | | | | 116,949 | |
| | 110,000 | | | WESCO Distribution, Inc.(d) | | 6.63% | | | 03/15/2032 | | | | 114,714 | |
| | 180,000 | | | Western Midstream Operating LP | | 5.50% | | | 08/15/2048 | | | | 167,155 | |
| | 70,000 | | | Williams Scotsman, Inc.(d) | | 7.38% | | | 10/01/2031 | | | | 74,031 | |
| | 110,000 | | | Windsor Holdings III LLC(d) | | 8.50% | | | 06/15/2030 | | | | 117,802 | |
| | 95,000 | | | WR Grace Holdings LLC(d) | | 4.88% | | | 06/15/2027 | | | | 93,731 | |
| | 175,000 | | | WR Grace Holdings LLC(d) | | 5.63% | | | 08/15/2029 | | | | 164,568 | |
| | 70,000 | | | Wynn Resorts Finance LLC / Wynn Resorts Capital Corp.(d) | | 5.13% | | | 10/01/2029 | | | | 69,203 | |
| | 55,000 | | | Wynn Resorts Finance LLC / Wynn Resorts Capital Corp.(d) | | 7.13% | | | 02/15/2031 | | | | 59,374 | |
| | 340,000 | | | Zayo Group Holdings, Inc.(d) | | 4.00% | | | 03/01/2027 | | | | 304,423 | |
| | 35,000 | | | ZF North America Capital, Inc.(d) | | 6.88% | | | 04/14/2028 | | | | 35,359 | |
| | 35,000 | | | ZF North America Capital, Inc.(d) | | 7.13% | | | 04/14/2030 | | | | 36,308 | |
| | 115,000 | | | ZipRecruiter, Inc.(d) | | 5.00% | | | 01/15/2030 | | | | 104,167 | |
| | | | | | | | | | | | | | 32,029,556 | |
| | | | | | | | | | | | | | | |
| TOTAL HIGH YIELD DEBT | | | | | | | | | | |
| (Cost $42,486,461) | | | | | | | | | 43,578,092 | |
| | | | | | | | | | | | | | | |
| BUSINESS DEVELOPMENT COMPANY NOTES - 0.51% | | | | | | | | | | |
| United States - 0.51% | | | | | | | | | | |
| | | | | | | | | | | | | | | |
| | 3,018 | | | MidCap Financial Investment Corp. | | 8.00% | | | 12/15/2028 | | | | 77,321 | |
| | 210,000 | | | MidCap Financial Investment Corp. | | 5.25% | | | 03/03/2025 | | | | 208,656 | |
| | | | | | | | | | | | | | | |
| TOTAL BUSINESS DEVELOPMENT COMPANY NOTES | | | | | | | | | | |
| (Cost $284,988) | | | | | | | | | 285,977 | |
See Notes to Financial Statements and Financial Highlights.
| 70 | (888) 848-7569 | www.rivernorth.com |
| RiverNorth/Oaktree High Income Fund | Schedule of Investments |
September 30, 2024
| Shares/Description | | Value | |
| WARRANTS - 0.01%(b) | | | |
| United States - 0.01% | | | | |
| | 11 | | Toys R Us Propco Warrant, Strike Price 0.01, Expires 12/31/2049(a) | | $ | – | |
| | 237 | | Windstream Holdings Inc - Pvt Warrant, Strike Price 0.01, Expires 12/31/2049 | | | 4,799 | |
| | | | | | | |
| TOTAL WARRANTS | | | | |
| (Cost $105,685) | | | 4,799 | |
| | | | | | | |
| SHORT-TERM INVESTMENTS - 6.51% | | | | |
| Money Market Fund - 6.51% | | | | |
| | 3,634,120 | | State Street Institutional Treasury Money Market Fund Premier Class (7 Day Yield 4.97%) | | | 3,634,120 | |
| | | | | | | |
| TOTAL SHORT-TERM INVESTMENTS | | | | |
| (Cost $3,634,120) | | | 3,634,120 | |
| | | | | | | |
| TOTAL INVESTMENTS - 98.16% | | | | |
| (Cost $53,835,088) | | $ | 54,781,998 | |
| OTHER ASSETS IN EXCESS OF LIABILITIES - 1.84% | | | 1,027,205 | |
| NET ASSETS - 100.00% | | $ | 55,809,203 | |
Investment Abbreviations:
EURIBOR - Euro Interbank Offered Rate
LIBOR - London Interbank Offered Rate
LLC - Limited Liability Company
LP - Limited Partnership
PLC - Public Limited Company
Rates:
1M US L - 1 Month LIBOR as of September 30, 2024 was 4.96%
3M US L - 3 Month LIBOR as of September 30, 2024 was 4.85%
6M US L - 6 Month LIBOR as of September 30, 2024 was 4.68%
3M EUR L - 3 Month EURIBOR as of September 30, 2024 was 3.28%
6M EUR L - 6 Month EURIBOR as of September 30, 2024 was 3.11%
5Y EUR SWAP - 5 Year Euro ICE Swap Rate as of September 30, 2024 was 2.87%
See Notes to Financial Statements and Financial Highlights.
| Annual Report | September 30, 2024 | 71 |
| RiverNorth/Oaktree High Income Fund | Schedule of Investments |
September 30, 2024
| (a) | The Level 3 assets were a result of unavailable quoted prices from an active market or the unavailability of other significant observable inputs. |
| (b) | Non-income producing security. |
| (c) | Variable rate investment. Interest rates reset periodically. Interest rate shown reflects the rate in effect at September 30, 2024. For securities based on a published reference rate and spread, the reference rate and spread are indicated in the description above. Certain variable rate securities are not based on a published reference rate and spread but are determined by the issuer or agent and are based on current market conditions. These securities do not indicate a reference rate and spread in their description above. |
| (d) | Security exempt from registration under Rule 144A of the Securities Act of 1933, as amended. These securities have been deemed liquid under procedures approved by the Fund's Board of Trustees (the “Board”) and may normally be sold to qualified institutional buyers in transactions exempt from registration. Total fair value of Rule 144A securities amounts to $31,659,548, which represents approximately 56.73% of net assets as of September 30, 2024. |
| (e) | Securities were purchased pursuant to Regulation S under the Securities Act of 1933, as amended, which exempts securities offered and sold outside of the United States from registration. Such securities cannot be sold in the United States without either an effective registration statement filed pursuant to the Securities Act of 1933, as amended, or pursuant to an exemption from registration. These securities have been deemed liquid under procedures approved by the Fund's Board. As of September 30, 2024, the aggregate fair value of those securities was $4,146,338, representing 7.43% of net assets. |
| (f) | Pay-in-kind securities. Rate paid in-kind is shown in parenthesis. |
| (g) | Security has no contractual maturity date, is not redeemable and contractually pays an indefinite stream of interest. |
| (h) | Issued with a zero coupon. Income is recognized through the accretion of discount. |
See Notes to Financial Statements and Financial Highlights.
| 72 | (888) 848-7569 | www.rivernorth.com |
| RiverNorth/Oaktree High Income Fund | Schedule of Investments |
September 30, 2024
OUTSTANDING FORWARD FOREIGN CURRENCY CONTRACTS
| Counterparty | | Settlement Date | | Fund Receiving | | | U.S. $ Value at September 30, 2024 | | | Fund Delivering | | | U.S. $ Value at September 30, 2024 | | | Unrealized Appreciation/ (Depreciation) | |
| State Street Corporation | | 10/4/2024 | | EUR | | | | 100,191 | | | USD | | | | 99,971 | | | $ | 220 | |
| State Street Corporation | | 10/4/2024 | | USD | | | | 12,628 | | | GBP | | | | 12,614 | | | | 14 | |
| | | | | | | | | | | | | | | | | | | $ | 234 | |
| State Street Corporation | | 10/4/2024 | | USD | | | | 6,975,650 | | | EUR | | | | 7,015,718 | | | $ | (40,068 | ) |
| State Street Corporation | | 10/4/2024 | | USD | | | | 1,139,645 | | | GBP | | | | 1,160,374 | | | | (20,729 | ) |
| State Street Corporation | | 10/4/2024 | | USD | | | | 53,259 | | | EUR | | | | 53,286 | | | | (27 | ) |
| | | | | | | | | | | | | | | | | | | $ | (60,824 | ) |
See Notes to Financial Statements and Financial Highlights.
| Annual Report | September 30, 2024 | 73 |
| RiverNorth Core Opportunity Fund | |
| Statement of Assets and Liabilities | September 30, 2024 |
| ASSETS: | | | |
| Investment in securities: | | | | |
| At cost | | $ | 40,455,139 | |
| At value | | $ | 45,627,214 | |
| | | | | |
| Cash | | | 2,494 | |
| Foreign currency, at value (Cost $278) | | | 298 | |
| Interest receivable | | | 71,276 | |
| Dividends receivable | | | 32,459 | |
| Receivable for fund investments sold | | | 15,008 | |
| Receivable for fund shares sold | | | 9,729 | |
| Prepaid expenses and other assets | | | 5,725 | |
| Total Assets | | | 45,764,203 | |
| LIABILITIES: | | | | |
| Payable for fund shares redeemed | | | 10,665 | |
| Payable to Adviser | | | 37,177 | |
| Payable for fund accounting and administration fees | | | 5,083 | |
| Accrued 12b-1 fees - Class R Shares | | | 3,306 | |
| Payable for custodian fees | | | 873 | |
| Payable for audit fees | | | 27,634 | |
| Payable to transfer agent | | | 5,323 | |
| Loan facility fee payable | | | 2,213 | |
| Other accrued expenses | | | 14,105 | |
| Total Liabilities | | | 106,379 | |
| Net Assets | | $ | 45,657,824 | |
| NET ASSETS CONSIST OF: | | | | |
| Paid-in capital | | $ | 44,854,391 | |
| Total distributable earnings | | | 803,433 | |
| Net Assets | | $ | 45,657,824 | |
| PRICING OF SHARES: | | | | |
| Class I Shares | | | | |
| Net Assets | | $ | 29,522,992 | |
| Shares of common stock outstanding | | | | |
| (unlimited number of shares, no par value) | | | 3,828,086 | |
| Net Asset Value Per Share, Offering and Redemption Price Per Share | | $ | 7.71 | |
| Class R Shares | | | | |
| Net Assets | | $ | 16,134,832 | |
| Shares of common stock outstanding | | | | |
| (unlimited number of shares, no par value) | | | 2,088,639 | |
| Net Asset Value Per Share, Offering and Redemption Price Per Share | | $ | 7.73 | |
See Notes to Financial Statements and Financial Highlights.
| 74 | (888) 848-7569 | www.rivernorth.com |
| RiverNorth/DoubleLine Strategic Income Fund | |
| Statement of Assets and Liabilities | September 30, 2024 |
| ASSETS: | | | |
| Investment in securities: | | | | |
| At cost | | $ | 1,338,977,506 | |
| At value | | $ | 1,244,019,656 | |
| Investment in affiliates: | | | | |
| At cost | | | 38,513,528 | |
| At value | | | 36,877,835 | |
| Cash | | | 8,986 | |
| Foreign currency, at value (Cost $519) | | | 532 | |
| Interest receivable | | | 7,671,721 | |
| Receivable for fund shares sold | | | 1,680,336 | |
| Receivable for fund investments sold | | | 1,677,939 | |
| Dividends receivable | | | 1,193,143 | |
| Deposits with broker for futures contracts | | | 517,933 | |
| Variation margin receivable | | | 75,125 | |
| Prepaid expenses and other assets | | | 19,773 | |
| Total Assets | | | 1,293,742,979 | |
| LIABILITIES: | | | | |
| Payable for fund investments purchased | | | 6,334,718 | |
| Payable for fund shares redeemed | | | 6,185,427 | |
| Payable to Adviser | | | 767,287 | |
| Payable for fund accounting and administration fees | | | 147,445 | |
| Accrued 12b-1 fees - Class R Shares | | | 11,592 | |
| Payable for custodian fees | | | 13,572 | |
| Payable for audit fees | | | 63,349 | |
| Payable to transfer agent | | | 23,051 | |
| Loan facility fee payable | | | 58,414 | |
| Other accrued expenses | | | 143,432 | |
| Total Liabilities | | | 13,748,287 | |
| Commitments and Contingencies (Note 5) | | | | |
| Net Assets | | $ | 1,279,994,692 | |
| NET ASSETS CONSIST OF: | | | | |
| Paid-in capital | | $ | 1,550,695,145 | |
| Total distributable earnings/(accumulated deficit) | | | (270,700,453 | ) |
| Net Assets | | $ | 1,279,994,692 | |
See Notes to Financial Statements and Financial Highlights.
| Annual Report | September 30, 2024 | 75 |
| RiverNorth/DoubleLine Strategic Income Fund | |
| Statement of Assets and Liabilities | September 30, 2024 |
| PRICING OF SHARES: | | | |
| Class I Shares | | | |
| Net Assets | | $ | 1,223,115,400 | |
| Shares of common stock outstanding | | | | |
| (unlimited number of shares, no par value) | | | 135,134,273 | |
| Net Asset Value Per Share, Offering and Redemption Price Per Share | | $ | 9.05 | |
| Class R Shares | | | | |
| Net Assets | | $ | 56,879,292 | |
| Shares of common stock outstanding | | | | |
| (unlimited number of shares, no par value) | | | 6,270,098 | |
| Net Asset Value Per Share, Offering and Redemption Price Per Share | | $ | 9.07 | |
See Notes to Financial Statements and Financial Highlights.
| 76 | (888) 848-7569 | www.rivernorth.com |
| RiverNorth/Oaktree High Income Fund | |
| Statement of Assets and Liabilities | September 30, 2024 |
| ASSETS: | | | |
| Investment in securities: | | | | |
| At cost | | $ | 53,835,088 | |
| At value | | $ | 54,781,998 | |
| | | | | |
| Cash | | | 259,982 | |
| Foreign currency, at value (Cost $95,609) | | | 95,835 | |
| Interest receivable | | | 786,600 | |
| Receivable for fund investments sold | | | 362,241 | |
| Receivable for fund shares sold | | | 780 | |
| Unrealized appreciation on forward foreign currency contracts | | | 234 | |
| Prepaid expenses and other assets | | | 2,423 | |
| Total Assets | | | 56,290,093 | |
| LIABILITIES: | | | | |
| Payable for fund investments purchased | | | 314,946 | |
| Payable for fund shares redeemed | | | 3,750 | |
| Unrealized depreciation on forward foreign currency contracts | | | 60,824 | |
| Payable to Adviser | | | 22,028 | |
| Payable for fund accounting and administration fees | | | 29,816 | |
| Accrued 12b-1 fees - Class R Shares | | | 806 | |
| Payable for custodian fees | | | 3,389 | |
| Payable for audit fees | | | 27,773 | |
| Payable to transfer agent | | | 3,516 | |
| Loan facility fee payable | | | 2,567 | |
| Other accrued expenses | | | 11,475 | |
| Total Liabilities | | | 480,890 | |
| Commitments and Contingencies (Note 5) | | | | |
| Net Assets | | $ | 55,809,203 | |
| NET ASSETS CONSIST OF: | | | | |
| Paid-in capital | | $ | 61,918,501 | |
| Total distributable earnings/(accumulated deficit) | | | (6,109,298 | ) |
| Net Assets | | $ | 55,809,203 | |
| PRICING OF SHARES: | | | | |
| Class I Shares | | | | |
| Net Assets | | $ | 51,793,445 | |
| Shares of common stock outstanding | | | | |
| (unlimited number of shares, no par value) | | | 5,811,101 | |
| Net Asset Value Per Share, Offering and Redemption Price Per Share | | $ | 8.91 | |
| Class R Shares | | | | |
| Net Assets | | $ | 4,015,758 | |
| Shares of common stock outstanding | | | | |
| (unlimited number of shares, no par value) | | | 450,990 | |
| Net Asset Value Per Share, Offering and Redemption Price Per Share | | $ | 8.90 | |
See Notes to Financial Statements and Financial Highlights.
| Annual Report | September 30, 2024 | 77 |
| RiverNorth Core Opportunity Fund | |
| Statement of Operations | For the Year Ended September 30, 2024 |
| INVESTMENT INCOME: | | | |
| Dividend income | | $ | 1,794,965 | |
| Interest income | | | 160,053 | |
| Total Investment Income | | | 1,955,018 | |
| | | | | |
| EXPENSES: | | | | |
| Investment Adviser fee | | | 455,333 | |
| Transfer agent expenses | | | 55,172 | |
| Registration expenses | | | 54,735 | |
| Accounting and administration fee | | | 49,079 | |
| 12b-1 fees - Class R Shares | | | 42,212 | |
| Audit expenses | | | 31,517 | |
| Compliance expense | | | 22,822 | |
| Printing expenses | | | 15,271 | |
| Legal expenses | | | 9,362 | |
| Facility loan fees | | | 7,210 | |
| Trustee expenses | | | 5,340 | |
| Custodian expenses | | | 2,939 | |
| Insurance expenses | | | 681 | |
| Miscellaneous expenses | | | 12,160 | |
| Total Expenses | | | 763,833 | |
| Net Investment Income | | | 1,191,185 | |
| | | | | |
| REALIZED AND UNREALIZED GAIN/(LOSS): | | | | |
| Net realized gain/(loss) on: | | | | |
| Investments | | | 1,118,215 | |
| Net realized gain | | | 1,118,215 | |
| Long-term capital gain distributions from other investment companies | | | 7,043 | |
| Net change in unrealized appreciation/depreciation on: | | | | |
| Investments | | | 7,775,905 | |
| Translation of assets and liabilities denominated in foreign currencies | | | 15 | |
| Net change in unrealized appreciation/depreciation | | | 7,775,920 | |
| Net Realized and Unrealized Gain on Investments | | | 8,901,178 | |
| Net Increase in Net Assets Resulting from Operations | | $ | 10,092,363 | |
See Notes to Financial Statements and Financial Highlights.
| 78 | (888) 848-7569 | www.rivernorth.com |
| RiverNorth/DoubleLine Strategic Income Fund | |
| Statement of Operations | For the Year Ended September 30, 2024 |
| INVESTMENT INCOME: | | | |
| Dividend income | | $ | 22,925,529 | |
| Dividend income from affiliated securities | | | 2,381,149 | |
| Interest income | | | 40,909,636 | |
| Other income | | | 95,699 | |
| Foreign taxes withheld | | | (1,694 | ) |
| Total Investment Income | | | 66,310,319 | |
| | | | | |
| EXPENSES: | | | | |
| Investment Adviser fee | | | 9,225,218 | |
| Accounting and administration fee | | | 1,194,239 | |
| Facility loan fees | | | 234,894 | |
| Legal expenses | | | 208,055 | |
| Transfer agent expenses | | | 150,367 | |
| Trustee expenses | | | 144,348 | |
| Registration expenses | | | 141,099 | |
| Compliance expense | | | 136,895 | |
| 12b-1 fees - Class R Shares | | | 136,738 | |
| Printing expenses | | | 113,125 | |
| Custodian expenses | | | 58,463 | |
| Audit expenses | | | 29,175 | |
| Insurance expenses | | | 22,673 | |
| Miscellaneous expenses | | | 84,944 | |
| Total expenses | | | 11,880,233 | |
| Less fees waived/reimbursed by Investment Adviser: | | | (201,907 | ) |
| Net Expenses | | | 11,678,326 | |
| Net Investment Income | | | 54,631,993 | |
| | | | | |
| REALIZED AND UNREALIZED GAIN/(LOSS): | | | | |
| Net realized gain/(loss) on: | | | | |
| Investments | | | (47,118,801 | ) |
| Futures Contracts | | | 748,717 | |
| Net realized loss | | | (46,370,084 | ) |
| Net change in unrealized appreciation/depreciation on: | | | | |
| Investments | | | 177,825,821 | |
| Affiliated Investments | | | 2,863,278 | |
| Futures Contracts | | | 1,083,209 | |
| Translation of assets and liabilities denominated in foreign currencies | | | 19 | |
| Net change in unrealized appreciation/depreciation | | | 181,772,327 | |
| Net Realized and Unrealized Gain on Investments | | | 135,402,243 | |
| Net Increase in Net Assets Resulting from Operations | | $ | 190,034,236 | |
See Notes to Financial Statements and Financial Highlights.
| Annual Report | September 30, 2024 | 79 |
| RiverNorth/Oaktree High Income Fund | |
| Statement of Operations | For the Year Ended September 30, 2024 |
| INVESTMENT INCOME: | | | |
| Dividend income | | $ | 330,616 | |
| Interest income | | | 3,607,769 | |
| Other income | | | 14,418 | |
| Foreign taxes withheld | | | 18 | |
| Total Investment Income | | | 3,952,821 | |
| | | | | |
| EXPENSES: | | | | |
| Investment Adviser fee | | | 541,416 | |
| Accounting and administration fee | | | 149,919 | |
| Transfer agent expenses | | | 40,868 | |
| Registration expenses | | | 40,322 | |
| Audit expenses | | | 31,562 | |
| Compliance expense | | | 23,584 | |
| Custodian expenses | | | 12,909 | |
| Printing expenses | | | 11,992 | |
| Legal expenses | | | 9,907 | |
| 12b-1 fees - Class R Shares | | | 9,472 | |
| Facility loan fees | | | 9,351 | |
| Trustee expenses | | | 6,334 | |
| Insurance expenses | | | 580 | |
| Miscellaneous expenses | | | 10,847 | |
| Total expenses | | | 899,063 | |
| Less fees waived/reimbursed by Investment Adviser: | | | – | |
| Class I Shares | | | (147,345 | ) |
| Class R Shares | | | (11,201 | ) |
| Net Expenses | | | 740,517 | |
| Net Investment Income | | | 3,212,304 | |
| | | | | |
| REALIZED AND UNREALIZED GAIN/(LOSS): | | | | |
| Net realized gain/(loss) on: | | | | |
| Investments | | | (359,513 | ) |
| Forward foreign currency contracts | | | (143,277 | ) |
| Translation of assets and liabilities denominated in foreign currencies | | | 6,163 | |
| Net realized loss | | | (496,627 | ) |
| Net change in unrealized appreciation/depreciation on: | | | | |
| Investments | | | 4,172,986 | |
| Forward foreign currency contracts | | | (179,185 | ) |
| Translation of assets and liabilities denominated in foreign currencies | | | 3,396 | |
| Net change in unrealized appreciation/depreciation | | | 3,997,197 | |
| Net Realized and Unrealized Gain on Investments, translation of assets and liabilities denominated in foreign currencies and forward foreign currency contracts | | | 3,500,570 | |
| Net Increase in Net Assets Resulting from Operations | | $ | 6,712,874 | |
See Notes to Financial Statements and Financial Highlights.
| 80 | (888) 848-7569 | www.rivernorth.com |
| RiverNorth Core Opportunity Fund |
| Statements of Changes in Net Assets |
| | | For the Year Ended September 30, 2024 | | | For the Year Ended September 30, 2023 | |
| NET INCREASE/(DECREASE) IN NET ASSETS FROM OPERATIONS: | | | | | | | | |
| Net investment income | | $ | 1,191,185 | | | $ | 2,129,229 | |
| Net realized gain/(loss) | | | 1,118,215 | | | | (2,392,542 | ) |
| Long-term capital gains from other investment companies | | | 7,043 | | | | 270,808 | |
| Net change in unrealized appreciation/depreciation on investments | | | 7,775,920 | | | | 4,958,382 | |
| Net increase in net assets resulting from operations | | | 10,092,363 | | | | 4,965,877 | |
| | | | | | | | | |
| DISTRIBUTIONS TO SHAREHOLDERS: | | | | | | | | |
| Class I shares | | | (1,512,964 | ) | | | (1,233,587 | ) |
| Class R shares | | | (838,913 | ) | | | (733,413 | ) |
| From tax return of capital | | | | | | | | |
| Class I shares | | | – | | | | (91,455 | ) |
| Class R shares | | | – | | | | (54,374 | ) |
| Net decrease in net assets from distributions to shareholders | | | (2,351,877 | ) | | | (2,112,829 | ) |
| | | | | | | | | |
| CAPITAL SHARE TRANSACTIONS: | | | | | | | | |
| Class I Shares | | | | | | | | |
| Proceeds from shares sold | | | 2,025,510 | | | | 2,173,544 | |
| Reinvestment of distributions | | | 1,385,727 | | | | 1,200,482 | |
| Cost of shares redeemed | | | (5,391,971 | ) | | | (5,643,870 | ) |
| Net decrease in net assets from capital share transactions | | | (1,980,734 | ) | | | (2,269,844 | ) |
| Class R Shares | | | | | | | | |
| Proceeds from shares sold | | | 260,679 | | | | 214,048 | |
| Reinvestment of distributions | | | 830,330 | | | | 777,524 | |
| Cost of shares redeemed | | | (4,411,797 | ) | | | (2,931,654 | ) |
| Net decrease in net assets from capital share transactions | | | (3,320,788 | ) | | | (1,940,082 | ) |
| Net Increase/(Decrease) in Net Assets | | | 2,438,964 | | | | (1,356,878 | ) |
| | | | | | | | | |
| NET ASSETS: | | | | | | | | |
| Beginning of year | | $ | 43,218,860 | | | $ | 44,575,738 | |
| End of year | | $ | 45,657,824 | | | $ | 43,218,860 | |
See Notes to Financial Statements and Financial Highlights.
| Annual Report | September 30, 2024 | 81 |
| RiverNorth Core Opportunity Fund |
| Statements of Changes in Net Assets |
| | | For the Year Ended September 30, 2024 | | | For the Year Ended September 30, 2023 | |
| OTHER INFORMATION: | | | | | | | | |
| Share Transactions: | | | | | | | | |
| Class I Shares | | | | | | | | |
| Shares sold | | | 285,587 | | | | 328,036 | |
| Shares issued in reinvestment of distributions | | | 190,089 | | | | 182,130 | |
| Shares redeemed | | | (747,875 | ) | | | (853,125 | ) |
| Net decrease from share transactions | | | (272,199 | ) | | | (342,959 | ) |
| | | | | | | | | |
| Class R Shares | | | | | | | | |
| Shares sold | | | 36,705 | | | | 32,067 | |
| Shares issued in reinvestment of distributions | | | 113,920 | | | | 117,778 | |
| Shares redeemed | | | (604,103 | ) | | | (442,877 | ) |
| Net decrease from share transactions | | | (453,478 | ) | | | (293,032 | ) |
See Notes to Financial Statements and Financial Highlights.
| 82 | (888) 848-7569 | www.rivernorth.com |
| RiverNorth/DoubleLine Strategic Income Fund |
| Statements of Changes in Net Assets |
| | | For the Year Ended September 30, 2024 | | | For the Year Ended September 30, 2023 | |
| NET INCREASE/(DECREASE) IN NET ASSETS FROM OPERATIONS: | | | | | | | | |
| Net investment income | | $ | 54,631,993 | | | $ | 66,387,213 | |
| Net realized loss | | | (46,370,084 | ) | | | (79,834,846 | ) |
| Long-term capital gains from other investment companies | | | – | | | | 132,834 | |
| Net change in unrealized appreciation/depreciation on investments | | | 181,772,327 | | | | 53,538,659 | |
| Net increase in net assets resulting from operations | | | 190,034,236 | | | | 40,223,860 | |
| | | | | | | | | |
| DISTRIBUTIONS TO SHAREHOLDERS: | | | | | | | | |
| Class I shares | | | (50,340,006 | ) | | | (7,850,065 | ) |
| Class R shares | | | (2,244,260 | ) | | | (398,363 | ) |
| From tax return of capital | | | | | | | | |
| Class I shares | | | (20,751,276 | ) | | | (74,152,295 | ) |
| Class R shares | | | (925,134 | ) | | | (3,762,969 | ) |
| Net decrease in net assets from distributions to shareholders | | | (74,260,676 | ) | | | (86,163,692 | ) |
| | | | | | | | | |
| CAPITAL SHARE TRANSACTIONS: | | | | | | | | |
| Class I Shares | | | | | | | | |
| Proceeds from shares sold | | | 409,004,876 | | | | 490,566,723 | |
| Reinvestment of distributions | | | 58,872,004 | | | | 67,534,846 | |
| Cost of shares redeemed | | | (521,923,520 | ) | | | (615,512,582 | ) |
| Net decrease in net assets from capital share transactions | | | (54,046,640 | ) | | | (57,411,013 | ) |
| Class R Shares | | | | | | | | |
| Proceeds from shares sold | | | 17,638,577 | | | | 11,801,009 | |
| Reinvestment of distributions | | | 3,027,646 | | | | 4,040,154 | |
| Cost of shares redeemed | | | (28,045,803 | ) | | | (25,210,864 | ) |
| Net decrease in net assets from capital share transactions | | | (7,379,580 | ) | | | (9,369,701 | ) |
| Net Increase/(Decrease) in Net Assets | | | 54,347,340 | | | | (112,720,546 | ) |
| | | | | | | | | |
| NET ASSETS: | | | | | | | | |
| Beginning of year | | $ | 1,225,647,352 | | | $ | 1,338,367,898 | |
| End of year | | $ | 1,279,994,692 | | | $ | 1,225,647,352 | |
See Notes to Financial Statements and Financial Highlights.
| Annual Report | September 30, 2024 | 83 |
| RiverNorth/DoubleLine Strategic Income Fund |
| Statements of Changes in Net Assets |
| | | For the Year Ended September 30, 2024 | | | For the Year Ended September 30, 2023 | |
| OTHER INFORMATION: | | | | | | | | |
| Share Transactions: | | | | | | | | |
| Class I Shares | | | | | | | | |
| Shares sold | | | 47,481,336 | | | | 57,165,416 | |
| Shares issued in reinvestment of distributions | | | 6,776,917 | | | | 7,972,440 | |
| Shares redeemed | | | (60,912,349 | ) | | | (72,274,751 | ) |
| Net decrease from share transactions | | | (6,654,096 | ) | | | (7,136,895 | ) |
| | | | | | | | | |
| Class R Shares | | | | | | | | |
| Shares sold | | | 2,012,138 | | | | 1,375,355 | |
| Shares issued in reinvestment of distributions | | | 347,941 | | | | 476,071 | |
| Shares redeemed | | | (3,239,310 | ) | | | (2,952,110 | ) |
| Net decrease from share transactions | | | (879,231 | ) | | | (1,100,684 | ) |
See Notes to Financial Statements and Financial Highlights.
| 84 | (888) 848-7569 | www.rivernorth.com |
RiverNorth/Oaktree High Income Fund
Statements of Changes in Net Assets
| | | For the Year Ended September 30, 2024 | | | For the Year Ended September 30, 2023 | |
| NET INCREASE/(DECREASE) IN NET ASSETS FROM OPERATIONS: | | | | | | | | |
| Net investment income | | $ | 3,212,304 | | | $ | 3,197,007 | |
| Net realized loss | | | (496,627 | ) | | | (1,063,761 | ) |
| Net change in unrealized appreciation/depreciation | | | 3,997,197 | | | | 3,110,230 | |
| Net increase in net assets resulting from operations | | | 6,712,874 | | | | 5,243,476 | |
| | | | | | | | | |
| DISTRIBUTIONS TO SHAREHOLDERS: | | | | | | | | |
| Class I Shares | | | (2,698,026 | ) | | | (3,796,566 | ) |
| Class R Shares | | | (195,771 | ) | | | (279,109 | ) |
| From tax return of capital | | | | | | | | |
| Class I Shares | | | (734,921 | ) | | | (101,347 | ) |
| Class R Shares | | | (54,197 | ) | | | (7,451 | ) |
| Net decrease in net assets from distributions to shareholders | | | (3,682,915 | ) | | | (4,184,473 | ) |
| | | | | | | | | |
| CAPITAL SHARE TRANSACTIONS: | | | | | | | | |
| Class I Shares | | | | | | | | |
| Proceeds from shares sold | | | 1,231,613 | | | | 16,237,099 | |
| Reinvestment of distributions | | | 3,432,207 | | | | 3,897,073 | |
| Cost of shares redeemed | | | (5,170,779 | ) | | | (15,868,053 | ) |
| Net increase/(decrease) in net assets from capital share transactions | | | (506,959 | ) | | | 4,266,119 | |
| | | | | | | | | |
| Class R Shares | | | | | | | | |
| Proceeds from shares sold | | | 653,125 | | | | 1,130,279 | |
| Reinvestment of distributions | | | 249,143 | | | | 285,386 | |
| Cost of shares redeemed | | | (705,799 | ) | | | (1,718,999 | ) |
| Net increase/(decrease) in net assets from capital share transactions | | | 196,469 | | | | (303,334 | ) |
| | | | | | | | | |
| Net Increase in Net Assets | | | 2,719,469 | | | | 5,021,788 | |
| | | | | | | | | |
| NET ASSETS: | | | | | | | | |
| Beginning of year | | $ | 53,089,734 | | | $ | 48,067,946 | |
| End of year | | $ | 55,809,203 | | | $ | 53,089,734 | |
See Notes to Financial Statements and Financial Highlights.
| Annual Report | September 30, 2024 | 85 |
RiverNorth/Oaktree High Income Fund
Statements of Changes in Net Assets
| | | For the Year Ended September 30, 2024 | | | For the Year Ended September 30, 2023 | |
| OTHER INFORMATION: | | | | | | | | |
| Share Transactions: | | | | | | | | |
| Class I Shares | | | | | | | | |
| Shares sold | | | 141,620 | | | | 1,938,095 | |
| Shares issued in reinvestment of distributions | | | 393,377 | | | | 464,347 | |
| Shares redeemed | | | (592,493 | ) | | | (1,887,488 | ) |
| Net increase/(decrease) from share transactions | | | (57,496 | ) | | | 514,954 | |
| | | | | | | | | |
| Class R Shares | | | | | | | | |
| Shares sold | | | 74,812 | | | | 133,097 | |
| Shares issued in reinvestment of distributions | | | 28,575 | | | | 34,069 | |
| Shares redeemed | | | (81,561 | ) | | | (203,856 | ) |
| Net increase/(decrease) from share transactions | | | 21,826 | | | | (36,690 | ) |
See Notes to Financial Statements and Financial Highlights.
| 86 | (888) 848-7569 | www.rivernorth.com |
Intentionally Left Blank
See Notes to Financial Statements and Financial Highlights.
| Annual Report | September 30, 2024 | 87 |
| RiverNorth Core Opportunity Fund | Class I |
Financial Highlights
| Net asset value - beginning of period |
| Income/(Loss) from investment operations: |
| Net investment income(a) |
| Net realized and unrealized gain/(loss) on investments |
| Total income/(loss) from investment operations |
| Less distributions: |
| From net investment income |
| From net realized gain on investments |
| From tax return of capital |
| Total distributions |
| Paid-in capital from redemption fees(a) |
| Net increase/(decrease) in net asset value |
| Net asset value - end of period |
| Total Return(b) |
| Ratios/Supplemental Data: |
| Net assets, end of period (in thousands) |
| Ratios to Average Net Assets (including interest expense): |
| |
| Ratio of expenses to average net assets excluding fee waivers and reimbursements(c) |
| |
| Ratio of expenses to average net assets including fee waivers and reimbursements(c) |
| Ratio of net investment income to average net assets excluding fee waivers and reimbursements(c) |
| Ratio of net investment income to average net assets including fee waivers and reimbursements(c) |
| Ratios to Average Net Assets (excluding interest expense): |
| |
| Ratio of expenses to average net assets excluding fee waivers and reimbursements(c) |
| |
| Ratio of expenses to average net assets including fee waivers and reimbursements(c) |
| Ratio of net investment income to average net assets excluding fee waivers and reimbursements(c) |
| Ratio of net investment income to average net assets including fee waivers and reimbursements(c) |
| Portfolio turnover rate |
See Notes to Financial Statements and Financial Highlights.
| 88 | (888) 848-7569 | www.rivernorth.com |
For a share outstanding throughout the periods presented
For the
Year Ended
September 30, 2024 | | | For the
Year Ended
September 30, 2023 | | | For the
Year Ended
September 30, 2022 | | | For the
Year Ended
September 30, 2021 | | | For the
Year Ended
September 30, 2020 | |
| $ | 6.50 | | | $ | 6.12 | | | $ | 9.30 | | | $ | 7.43 | | | $ | 8.05 | |
| | | | | | | | | | | | | | | | | | | |
| | 0.20 | | | | 0.31 | | | | 0.17 | | | | 0.28 | | | | 0.16 | |
| | 1.39 | | | | 0.38 | | | | (1.40 | ) | | | 2.11 | | | | (0.41 | ) |
| | 1.59 | | | | 0.69 | | | | (1.23 | ) | | | 2.39 | | | | (0.25 | ) |
| | | | | | | | | | | | | | | | | | | |
| | (0.38 | ) | | | (0.29 | ) | | | (0.28 | ) | | | (0.39 | ) | | | (0.19 | ) |
| | – | | | | – | | | | (1.61 | ) | | | (0.13 | ) | | | (0.18 | ) |
| | – | | | | (0.02 | ) | | | (0.06 | ) | | | – | | | | – | |
| | (0.38 | ) | | | (0.31 | ) | | | (1.95 | ) | | | (0.52 | ) | | | (0.37 | ) |
| | – | | | | – | | | | – | | | | – | | | | – | |
| | 1.21 | | | | 0.38 | | | | (3.18 | ) | | | 1.87 | | | | (0.62 | ) |
| $ | 7.71 | | | $ | 6.50 | | | $ | 6.12 | | | $ | 9.30 | | | $ | 7.43 | |
| | 25.02 | % | | | 11.37 | % | | | (16.70 | %) | | | 32.96 | % | | | (3.00 | %) |
| | | | | | | | | | | | | | | | | | | |
| $ | 29,523 | | | $ | 26,662 | | | $ | 27,196 | | | $ | 54,868 | | | $ | 49,994 | |
| | | | | | | | | | | | | | | | | | | |
| | N/A | | | | N/A | | | | N/A | | | | N/A | | | | N/A | |
| | | | | | | | | | | | | | | | | | | |
| | N/A | | | | N/A | | | | N/A | | | | N/A | | | | N/A | |
| | | | | | | | | | | | | | | | | | | |
| | N/A | | | | N/A | | | | N/A | | | | N/A | | | | N/A | |
| | | | | | | | | | | | | | | | | | | |
| | N/A | | | | N/A | | | | N/A | | | | N/A | | | | N/A | |
| | | | | | | | | | | | | | | | | | | |
| | 1.58 | % | | | 1.49 | % | | | 1.39 | % | | | 1.33 | % | | | 1.29 | % |
| | | | | | | | | | | | | | | | | | | |
| | 1.58 | % | | | 1.49 | % | | | 1.39 | % | | | 1.33 | % | | | 1.29 | % |
| | | | | | | | | | | | | | | | | | | |
| | 2.72 | % | | | 4.75 | % | | | 2.17 | % | | | 3.19 | % | | | 2.10 | % |
| | | | | | | | | | | | | | | | | | | |
| | 2.72 | % | | | 4.75 | % | | | 2.17 | % | | | 3.19 | % | | | 2.10 | % |
| | 41 | % | | | 60 | % | | | 106 | % | | | 182 | % | | | 110 | % |
See Notes to Financial Statements and Financial Highlights
| Annual Report | September 30, 2024 | 89 |
| RiverNorth Core Opportunity Fund | Class I |
| Financial Highlights | For a share outstanding throughout the periods presented |
| (a) | Based on average shares outstanding during the period. |
| (b) | Total return in the above table represents the rate that the investor would have earned or lost on an investment in the Fund, assuming reinvestment of dividends. |
| (c) | The ratios exclude the impact of expenses of the underlying funds in which the Fund invests as represented in the Schedule of Investments. |
See Notes to Financial Statements and Financial Highlights.
| 90 | (888) 848-7569 | www.rivernorth.com |
Intentionally Left Blank
| RiverNorth Core Opportunity Fund | Class R |
Financial Highlights
| Net asset value - beginning of period |
| Income/(Loss) from investment operations: |
| Net investment income(a) |
| Net realized and unrealized gain/(loss) on investments |
| Total income/(loss) from investment operations |
| Less distributions: |
| From net investment income |
| From net realized gain on investments |
| From tax return of capital |
| Total distributions |
| Paid-in capital from redemption fees(a) |
| Net increase/ (decrease) in net asset value |
| Net asset value - end of period |
| Total Return(b) |
| Ratios/Supplemental Data: |
| Net assets, end of period (in thousands) |
| Ratios to Average Net Assets (including interest expense): |
| Ratio of expenses to average net assets excluding fee waivers and reimbursements(c) |
| Ratio of expenses to average net assets including fee waivers and reimbursements(c) |
| Ratio of net investment income to average net assets excluding fee waivers and reimbursements(c) |
| |
| Ratio of net investment income to average net assets including fee waivers and reimbursements(c) |
| Ratios to Average Net Assets (excluding interest expense): |
| Ratio of expenses to average net assets excluding fee waivers and reimbursements(c) |
| Ratio of expenses to average net assets including fee waivers and reimbursements(c) |
| Ratio of net investment income to average net assets excluding fee waivers and reimbursements(c) |
| Ratio of net investment income to average net assets including fee waivers and reimbursements(c) |
| Portfolio turnover rate |
See Notes to Financial Statements and Financial Highlights.
| 92 | (888) 848-7569 | www.rivernorth.com |
For a share outstanding throughout the periods presented
For the
Year Ended
September 30, 2024 | | | For the
Year Ended
September 30, 2023 | | | For the
Year Ended
September 30, 2022 | | | For the
Year Ended
September 30, 2021 | | | For the
Year Ended
September 30, 2020 | |
| $ | 6.51 | | | $ | 6.13 | | | $ | 9.31 | | | $ | 7.44 | | | $ | 8.06 | |
| | | | | | | | | | | | | | | | | | | |
| | 0.18 | | | | 0.30 | | | | 0.14 | | | | 0.25 | | | | 0.15 | |
| | 1.41 | | | | 0.38 | | | | (1.39 | ) | | | 2.12 | | | | (0.42 | ) |
| | 1.59 | | | | 0.68 | | | | (1.25 | ) | | | 2.37 | | | | (0.27 | ) |
| | | | | | | | | | | | | | | | | | | |
| | (0.37 | ) | | | (0.28 | ) | | | (0.26 | ) | | | (0.37 | ) | | | (0.18 | ) |
| | – | | | | – | | | | (1.61 | ) | | | (0.13 | ) | | | (0.17 | ) |
| | – | | | | (0.02 | ) | | | (0.06 | ) | | | – | | | | – | |
| | (0.37 | ) | | | (0.30 | ) | | | (1.93 | ) | | | (0.50 | ) | | | (0.35 | ) |
| | – | | | | – | | | | – | | | | – | | | | – | |
| | 1.22 | | | | 0.38 | | | | (3.18 | ) | | | 1.87 | | | | (0.62 | ) |
| $ | 7.73 | | | $ | 6.51 | | | $ | 6.13 | | | $ | 9.31 | | | $ | 7.44 | |
| | 24.83 | % | | | 11.07 | % | | | (16.88 | %) | | | 32.58 | % | | | (3.24 | %) |
| | | | | | | | | | | | | | | | | | | |
| $ | 16,135 | | | $ | 16,557 | | | $ | 17,380 | | | $ | 25,705 | | | $ | 27,213 | |
| | | | | | | | | | | | | | | | | | | |
| | N/A | | | | N/A | | | | N/A | | | | N/A | | | | N/A | |
| | N/A | | | | N/A | | | | N/A | | | | N/A | | | | N/A | |
| | | | | | | | | | | | | | | | | | | |
| | N/A | | | | N/A | | | | N/A | | | | N/A | | | | N/A | |
| | | | | | | | | | | | | | | | | | | |
| | N/A | | | | N/A | | | | N/A | | | | N/A | | | | N/A | |
| | | | | | | | | | | | | | | | | | | |
| | 1.84 | % | | | 1.74 | % | | | 1.64 | % | | | 1.58 | % | | | 1.54 | % |
| | 1.84 | % | | | 1.74 | % | | | 1.64 | % | | | 1.58 | % | | | 1.54 | % |
| | | | | | | | | | | | | | | | | | | |
| | 2.45 | % | | | 4.51 | % | | | 1.86 | % | | | 2.88 | % | | | 1.93 | % |
| | | | | | | | | | | | | | | | | | | |
| | 2.45 | % | | | 4.51 | % | | | 1.86 | % | | | 2.88 | % | | | 1.93 | % |
| | 41 | % | | | 60 | % | | | 106 | % | | | 182 | % | | | 110 | % |
See Notes to Financial Statements and Financial Highlights.
| Annual Report | September 30, 2024 | 93 |
| RiverNorth Core Opportunity Fund | Class R |
| Financial Highlights | For a share outstanding throughout the periods presented |
| (a) | Based on average shares outstanding during the period. |
| (b) | Total return in the above table represents the rate that the investor would have earned or lost on an investment in the Fund, assuming reinvestment of dividends. |
| (c) | The ratios exclude the impact of expenses of the underlying funds in which the Fund invests as represented in the Schedule of Investments. |
See Notes to Financial Statements and Financial Highlights.
| 94 | (888) 848-7569 | www.rivernorth.com |
Intentionally Left Blank
| RiverNorth/DoubleLine Strategic Income Fund | Class I |
Financial Highlights
| Net asset value - beginning of period |
| Income/(loss) from investment operations: |
| Net investment income(a) |
| Net realized and unrealized gain/(loss) on investments |
| Total income/(loss) from investment operations |
| |
| Less distributions: |
| From net investment income |
| From tax return of capital |
| Total distributions |
| Paid-in capital from redemption fees(a) |
| Net increase/(decrease) in net asset value |
| Net asset value - end of period |
| |
| Total Return(b) |
| |
| Ratios/Supplemental Data: |
| Net assets, end of period (in thousands) |
| Ratios to Average Net Assets (including interest expense): |
| Ratio of expenses to average net assets excluding fee waivers and reimbursements(c) |
| Ratio of expenses to average net assets including fee waivers and reimbursements(c) |
| |
| Ratio of net investment income to average net assets excluding fee waivers and reimbursements(c) |
| |
| Ratio of net investment income to average net assets including fee waivers and reimbursements(c) |
| Ratios to Average Net Assets (excluding interest expense): |
| Ratio of expenses to average net assets excluding fee waivers and reimbursements(c) |
| Ratio of expenses to average net assets including fee waivers and reimbursements(c) |
| |
| Ratio of net investment income to average net assets excluding fee waivers and reimbursements(c) |
| |
| Ratio of net investment income to average net assets including fee waivers and reimbursements(c) |
| Portfolio turnover rate |
See Notes to Financial Statements and Financial Highlights.
| 96 | (888) 848-7569 | www.rivernorth.com |
For a share outstanding throughout the periods presented
For the
Year Ended
September 30,
2024 | | | For the
Year Ended
September 30,
2023 | | | For the
Year Ended
September 30,
2022 | | | For the
Year Ended
September 30,
2021 | | | For the
Year Ended
September 30,
2020 | |
| $ | 8.23 | | | $ | 8.51 | | | $ | 10.52 | | | $ | 10.20 | | | $ | 10.33 | |
| | | | | | | | | | | | | | | | | | | |
| | 0.39 | | | | 0.44 | | | | 0.21 | | | | 0.38 | | | | 0.45 | |
| | 0.96 | | | | (0.14 | ) | | | (1.64 | ) | | | 0.38 | | | | (0.10 | ) |
| | 1.35 | | | | 0.30 | | | | (1.43 | ) | | | 0.76 | | | | 0.35 | |
| | | | | | | | | | | | | | | | | | | |
| | (0.37 | ) | | | (0.06 | ) | | | (0.58 | ) | | | (0.44 | ) | | | (0.46 | ) |
| | (0.16 | ) | | | (0.52 | ) | | | – | | | | – | | | | (0.02 | ) |
| | (0.53 | ) | | | (0.58 | ) | | | (0.58 | ) | | | (0.44 | ) | | | (0.48 | ) |
| | – | | | | – | | | | – | | | | – | | | | – | |
| | 0.82 | | | | (0.28 | ) | | | (2.01 | ) | | | 0.32 | | | | (0.13 | ) |
| $ | 9.05 | | | $ | 8.23 | | | $ | 8.51 | | | $ | 10.52 | | | $ | 10.20 | |
| | | | | | | | | | | | | | | | | | | |
| | 16.82 | % | | | 3.50 | % | | | (14.04 | %) | | | 7.52 | % | | | 3.51 | % |
| | | | | | | | | | | | | | | | | | | |
| $ | 1,223,115 | | | $ | 1,166,687 | | | $ | 1,267,978 | | | $ | 1,894,398 | | | $ | 1,686,872 | |
| | | | | | | | | | | | | | | | | | | |
| | N/A | | | | N/A | | | | N/A | | | | N/A | | | | N/A | |
| | N/A | | | | N/A | | | | N/A | | | | N/A | | | | N/A | |
| | | | | | | | | | | | | | | | | | | |
| | N/A | | | | N/A | | | | N/A | | | | N/A | | | | N/A | |
| | | | | | | | | | | | | | | | | | | |
| | N/A | | | | N/A | | | | N/A | | | | N/A | | | | N/A | |
| | | | | | | | | | | | | | | | | | | |
| | 0.95 | % | | | 0.91 | % | | | 0.88 | % | | | 0.87 | % | | | 0.87 | % |
| | 0.94 | % | | | 0.90 | % | | | 0.87 | % | | | 0.86 | % | | | 0.87 | % |
| | | | | | | | | | | | | | | | | | | |
| | 4.44 | % | | | 5.18 | % | | | 2.10 | % | | | 3.66 | % | | | 4.42 | % |
| | | | | | | | | | | | | | | | | | | |
| | 4.45 | % | | | 5.18 | % | | | 2.10 | % | | | 3.66 | % | | | 4.42 | % |
| | 84 | % | | | 68 | % | | | 104 | % | | | 100 | % | | | 81 | % |
See Notes to Financial Statements and Financial Highlights.
| Annual Report | September 30, 2024 | 97 |
| RiverNorth/DoubleLine Strategic Income Fund | Class I |
| Financial Highlights | For a share outstanding throughout the periods presented |
| (a) | Based on average shares outstanding during the period. |
| (b) | Total return in the above table represents the rate that the investor would have earned or lost on an investment in the Fund, assuming reinvestment of dividends. |
| (c) | The ratios exclude the impact of expenses of the underlying funds in which the Fund invests as represented in the Schedule of Investments. |
See Notes to Financial Statements and Financial Highlights.
| 98 | (888) 848-7569 | www.rivernorth.com |
Intentionally Left Blank
| RiverNorth/DoubleLine Strategic Income Fund | Class R |
| Net asset value - beginning of period |
| Income/(loss) from investment operations: |
| Net investment income(a) |
| Net realized and unrealized gain/(loss) on investments |
| Total income/(loss) from investment operations |
| |
| Less distributions: |
| From net investment income |
| From tax return of capital |
| Total distributions |
| Paid-in capital from redemption fees(a) |
| Net increase/(decrease) in net asset value |
| Net asset value - end of period |
| |
| Total Return(b) |
| |
| Ratios/Supplemental Data: |
| Net assets, end of period (in thousands) |
| Ratios to Average Net Assets (including interest expense): |
| Ratio of expenses to average net assets excluding fee waivers and reimbursements(c) |
| Ratio of expenses to average net assets including fee waivers and reimbursements(c) |
| |
| Ratio of net investment income to average net assets excluding fee waivers and reimbursements(c) |
| |
| Ratio of net investment income to average net assets including fee waivers and reimbursements(c) |
| Ratios to Average Net Assets (excluding interest expense): |
| Ratio of expenses to average net assets excluding fee waivers and reimbursements(c) |
| Ratio of expenses to average net assets including fee waivers and reimbursements(c) |
| |
| Ratio of net investment income to average net assets excluding fee waivers and reimbursements(c) |
| |
| Ratio of net investment income to average net assets including fee waivers and reimbursements(c) |
| Portfolio turnover rate |
See Notes to Financial Statements and Financial Highlights.
| 100 | (888) 848-7569 | www.rivernorth.com |
For a share outstanding throughout the periods presented
| For the | | | For the | | | For the | | | For the | | | For the | |
| Year Ended | | | Year Ended | | | Year Ended | | | Year Ended | | | Year Ended | |
| September 30, | | | September 30, | | | September 30, | | | September 30, | | | September 30, | |
| 2024 | | | 2023 | | | 2022 | | | 2021 | | | 2020 | |
| $ | 8.25 | | | $ | 8.53 | | | $ | 10.54 | | | $ | 10.22 | | | $ | 10.35 | |
| | | | | | | | | | | | | | | | | | | |
| | 0.36 | | | | 0.38 | | | | 0.17 | | | | 0.36 | | | | 0.43 | |
| | 0.97 | | | | (0.10 | ) | | | (1.63 | ) | | | 0.37 | | | | (0.10 | ) |
| | 1.33 | | | | 0.28 | | | | (1.46 | ) | | | 0.73 | | | | 0.33 | |
| | | | | | | | | | | | | | | | | | | |
| | (0.36 | ) | | | (0.06 | ) | | | (0.55 | ) | | | (0.41 | ) | | | (0.44 | ) |
| | (0.15 | ) | | | (0.50 | ) | | | – | | | | – | | | | (0.02 | ) |
| | (0.51 | ) | | | (0.56 | ) | | | (0.55 | ) | | | (0.41 | ) | | | (0.46 | ) |
| | – | | | | – | | | | – | | | | – | | | | – | |
| | 0.82 | | | | (0.28 | ) | | | (2.01 | ) | | | 0.32 | | | | (0.13 | ) |
| $ | 9.07 | | | $ | 8.25 | | | $ | 8.53 | | | $ | 10.54 | | | $ | 10.22 | |
| | | | | | | | | | | | | | | | | | | |
| | 16.50 | % | | | 3.24 | % | | | (14.23 | %) | | | 7.23 | % | | | 3.24 | % |
| | | | | | | | | | | | | | | | | | | |
| $ | 56,879 | | | $ | 58,961 | | | $ | 70,390 | | | $ | 140,863 | | | $ | 129,355 | |
| | | | | | | | | | | | | | | | | | | |
| | N/A | | | | N/A | | | | N/A | | | | N/A | | | | N/A | |
| | N/A | | | | N/A | | | | N/A | | | | N/A | | | | N/A | |
| | | | | | | | | | | | | | | | | | | |
| | N/A | | | | N/A | | | | N/A | | | | N/A | | | | N/A | |
| | | | | | | | | | | | | | | | | | | |
| | N/A | | | | N/A | | | | N/A | | | | N/A | | | | N/A | |
| | | | | | | | | | | | | | | | | | | |
| | 1.20 | % | | | 1.17 | % | | | 1.13 | % | | | 1.12 | % | | | 1.12 | % |
| | 1.19 | % | | | 1.15 | % | | | 1.12 | % | | | 1.11 | % | | | 1.12 | % |
| | | | | | | | | | | | | | | | | | | |
| | 4.14 | % | | | 4.47 | % | | | 1.67 | % | | | 3.41 | % | | | 4.18 | % |
| | | | | | | | | | | | | | | | | | | |
| | 4.16 | % | | | 4.47 | % | | | 1.67 | % | | | 3.42 | % | | | 4.18 | % |
| | 84 | % | | | 68 | % | | | 104 | % | | | 100 | % | | | 81 | % |
See Notes to Financial Statements and Financial Highlights.
| Annual Report | September 30, 2024 | 101 |
| RiverNorth/DoubleLine Strategic Income Fund | Class R |
| Financial Highlights | For a share outstanding throughout the periods presented |
| (a) | Based on average shares outstanding during the period. |
| (b) | Total return in the above table represents the rate that the investor would have earned or lost on an investment in the Fund, assuming reinvestment of dividends. |
| (c) | The ratios exclude the impact of expenses of the underlying funds in which the Fund invests as represented in the Schedule of Investments. |
See Notes to Financial Statements and Financial Highlights.
| 102 | (888) 848-7569 | www.rivernorth.com |
Intentionally Left Blank
| RiverNorth/Oaktree High Income Fund | Class I |
| Net asset value - beginning of period |
| Income/(loss) from investment operations: |
| Net investment income(a) |
| Net realized and unrealized gain/(loss) on investments |
| Total income/(loss) from investment operations |
| |
| Less distributions: |
| From net investment income |
| From tax return of capital |
| Total distributions |
| Paid-in capital from redemption fees(a) |
| Net increase/(decrease) in net asset value |
| Net asset value - end of period |
| |
| Total Return(b) |
| |
| Supplemental Data: |
| Net assets, end of period (in thousands) |
| Ratios to Average Net Assets (including interest expense) |
| Ratio of expenses to average net assets excluding fee waivers and reimbursements(c) |
| Ratio of expenses to average net assets including fee waivers and reimbursements(c) |
| |
| Ratio of net investment income to average net assets excluding fee waivers and reimbursements(c) |
| |
| Ratio of net investment income to average net assets including fee waivers and reimbursements(c) |
| |
| Ratios to Average Net Assets (excluding interest expense) |
| Ratio of expenses to average net assets excluding fee waivers and reimbursements(c) |
| Ratio of expenses to average net assets including fee waivers and reimbursements(c) |
| |
| Ratio of net investment income to average net assets excluding fee waivers and reimbursements(c) |
| |
| Ratio of net investment income to average net assets including fee waivers and reimbursements(c) |
| Portfolio turnover rate |
|
See Notes to Financial Statements and Financial Highlights.
| 104 | (888) 848-7569 | www.rivernorth.com |
For a share outstanding throughout the periods presented
| For the | | | For the | | | For the | | | For the | | | For the | |
| Year Ended | | | Year Ended | | | Year Ended | | | Year Ended | | | Year Ended | |
September 30, 2024 | | | September 30, 2023 | | | September 30, 2022 | | | September 30, 2021 | | | September 30, 2020 | |
| $ | 8.43 | | | $ | 8.26 | | | $ | 9.53 | | | $ | 9.09 | | | $ | 9.55 | |
| | | | | | | | | | | | | | | | | | | |
| | 0.52 | | | | 0.50 | | | | 0.33 | | | | 0.33 | | | | 0.34 | |
| | 0.56 | | | | 0.35 | | | | (1.27 | ) | | | 0.44 | | | | (0.35 | ) |
| | 1.08 | | | | 0.85 | | | | (0.94 | ) | | | 0.77 | | | | (0.01 | ) |
| | | | | | | | | | | | | | | | | | | |
| | (0.47 | ) | | | (0.66 | ) | | | (0.33 | ) | | | (0.33 | ) | | | (0.37 | ) |
| | (0.13 | ) | | | (0.02 | ) | | | – | | | | – | | | | (0.08 | ) |
| | (0.60 | ) | | | (0.68 | ) | | | (0.33 | ) | | | (0.33 | ) | | | (0.45 | ) |
| | – | | | | – | | | | – | | | | – | | | | – | |
| | 0.48 | | | | 0.17 | | | | (1.27 | ) | | | 0.44 | | | | (0.46 | ) |
| $ | 8.91 | | | $ | 8.43 | | | $ | 8.26 | | | $ | 9.53 | | | $ | 9.09 | |
| | | | | | | | | | | | | | | | | | | |
| | 13.16 | % | | | 10.59 | % | | | (10.03 | %) | | | 8.55 | % | | | (0.02 | %) |
| | | | | | | | | | | | | | | | | | | |
| $ | 51,793 | | | $ | 49,475 | | | $ | 44,223 | | | $ | 41,386 | | | $ | 40,375 | |
| | | | | | | | | | | | | | | | | | | |
| | 1.64 | % | | | 1.57 | % | | | 1.62 | % | | | 1.75 | % | | | N/A | |
| | 1.35 | % | | | 1.35 | % | | | 1.35 | % | | | 1.35 | % | | | N/A | |
| | | | | | | | | | | | | | | | | | | |
| | 5.66 | % | | | 5.72 | % | | | 3.38 | % | | | 3.07 | % | | | N/A | |
| | | | | | | | | | | | | | | | | | | |
| | 5.95 | % | | | 5.94 | % | | | 3.65 | % | | | 3.47 | % | | | N/A | |
| | | | | | | | | | | | | | | | | | | |
| | 1.64 | % | | | 1.57 | % | | | 1.62 | % | | | 1.75 | % | | | 1.69 | % |
| | 1.35 | % | | | 1.35 | % | | | 1.35 | % | | | 1.35 | % | | | 1.35 | % |
| | | | | | | | | | | | | | | | | | | |
| | 5.66 | % | | | 5.72 | % | | | 3.38 | % | | | 3.07 | % | | | 3.43 | % |
| | | | | | | | | | | | | | | | | | | |
| | 5.95 | % | | | 5.94 | % | | | 3.65 | % | | | 3.47 | % | | | 3.78 | % |
| | 57 | % | | | 75 | % | | | 57 | % | | | 72 | % | | | 80 | % |
See Notes to Financial Statements and Financial Highlights.
| Annual Report | September 30, 2024 | 105 |
| RiverNorth/Oaktree High Income Fund | Class I |
| Financial Highlights | For a share outstanding throughout the periods presented |
| (a) | Based on average shares outstanding during the period. |
| (b) | Total return in the above table represents the rate that the investor would have earned or lost on an investment in the Fund, assuming reinvestment of dividends. |
| (c) | The ratios exclude the impact of expenses of the underlying funds in which the Fund invests as represented in the Schedule of Investments. |
See Notes to Financial Statements and Financial Highlights.
| 106 | (888) 848-7569 | www.rivernorth.com |
Intentionally Left Blank
| RiverNorth/Oaktree High Income Fund | Class R |
| Net asset value - beginning of period |
| Income/(loss) from investment operations: |
| Net investment income(a) |
| Net realized and unrealized gain/(loss) on investments |
| Total income/(loss) from investment operations |
| |
| Less distributions: |
| From net investment income |
| From tax return of capital |
| Total distributions |
| Paid-in capital from redemption fees(a) |
| Net increase/(decrease) in net asset value |
| Net asset value - end of period |
| |
| Total Return(b) |
| |
| Supplemental Data: |
| Net assets, end of period (in thousands) |
| Ratios to Average Net Assets (including interest expense) |
| Ratio of expenses to average net assets excluding fee waivers and reimbursements(c) |
| Ratio of expenses to average net assets including fee waivers and reimbursements(c) |
| |
| Ratio of net investment income to average net assets excluding fee waivers and reimbursements(c) |
| |
| Ratio of net investment income to average net assets including fee waivers and reimbursements(c) |
| |
| Ratios to Average Net Assets (excluding interest expense) |
| Ratio of expenses to average net assets excluding fee waivers and reimbursements(c) |
| Ratio of expenses to average net assets including fee waivers and reimbursements(c) |
| |
| Ratio of net investment income to average net assets excluding fee waivers and reimbursements(c) |
| |
| Ratio of net investment income to average net assets including fee waivers and reimbursements(c) |
| Portfolio turnover rate |
|
See Notes to Financial Statements and Financial Highlights.
| 108 | (888) 848-7569 | www.rivernorth.com |
For a share outstanding throughout the periods presented
| For the | | | For the | | | For the | | | For the | | | For the | |
| Year Ended | | | Year Ended | | | Year Ended | | | Year Ended | | | Year Ended | |
September 30, 2024 | | | September 30, 2023 | | | September 30, 2022 | | | September 30, 2021 | | | September 30, 2020 | |
| $ | 8.42 | | | $ | 8.25 | | | $ | 9.52 | | | $ | 9.08 | | | $ | 9.54 | |
| | | | | | | | | | | | | | | | | | | |
| | 0.50 | | | | 0.48 | | | | 0.31 | | | | 0.30 | | | | 0.32 | |
| | 0.55 | | | | 0.35 | | | | (1.27 | ) | | | 0.45 | | | | (0.36 | ) |
| | 1.05 | | | | 0.83 | | | | (0.96 | ) | | | 0.75 | | | | (0.04 | ) |
| | | | | | | | | | | | | | | | | | | |
| | | | | | | | | | | | | | | | | | | |
| | (0.45 | ) | | | (0.64 | ) | | | (0.31 | ) | | | (0.31 | ) | | | (0.35 | ) |
| | (0.12 | ) | | | (0.02 | ) | | | – | | | | – | | | | (0.07 | ) |
| | (0.57 | ) | | | (0.66 | ) | | | (0.31 | ) | | | (0.31 | ) | | | (0.42 | ) |
| | – | | | | – | | | | – | | | | – | | | | – | |
| | 0.48 | | | | 0.17 | | | | (1.27 | ) | | | 0.44 | | | | (0.46 | ) |
| $ | 8.90 | | | $ | 8.42 | | | $ | 8.25 | | | $ | 9.52 | | | $ | 9.08 | |
| | | | | | | | | | | | | | | | | | | |
| | 12.88 | % | | | 10.33 | % | | | (10.27 | %) | | | 8.31 | % | | | (0.27 | %) |
| | | | | | | | | | | | | | | | | | | |
| $ | 4,016 | | | $ | 3,615 | | | $ | 3,845 | | | $ | 4,548 | | | $ | 4,989 | |
| | | | | | | | | | | | | | | | | | | |
| | 1.90 | % | | | 1.82 | % | | | 1.88 | % | | | 2.00 | % | | | N/A | |
| | 1.60 | % | | | 1.60 | % | | | 1.60 | % | | | 1.60 | % | | | N/A | |
| | | | | | | | | | | | | | | | | | | |
| | 5.41 | % | | | 5.46 | % | | | 3.10 | % | | | 2.83 | % | | | N/A | |
| | | | | | | | | | | | | | | | | | | |
| | 5.71 | % | | | 5.69 | % | | | 3.37 | % | | | 3.22 | % | | | N/A | |
| | | | | | | | | | | | | | | | | | | |
| | 1.90 | % | | | 1.82 | % | | | 1.88 | % | | | 2.00 | % | | | 1.95 | % |
| | 1.60 | % | | | 1.60 | % | | | 1.60 | % | | | 1.60 | % | | | 1.60 | % |
| | | | | | | | | | | | | | | | | | | |
| | 5.41 | % | | | 5.46 | % | | | 3.10 | % | | | 2.83 | % | | | 3.19 | % |
| | | | | | | | | | | | | | | | | | | |
| | 5.71 | % | | | 5.69 | % | | | 3.37 | % | | | 3.22 | % | | | 3.53 | % |
| | 57 | % | | | 75 | % | | | 57 | % | | | 72 | % | | | 80 | % |
See Notes to Financial Statements and Financial Highlights.
| Annual Report | September 30, 2024 | 109 |
| RiverNorth/Oaktree High Income Fund | Class R |
| Financial Highlights | For a share outstanding throughout the periods presented |
| (a) | Based on average shares outstanding during the period. |
| (b) | Total return in the above table represents the rate that the investor would have earned or lost on an investment in the Fund, assuming reinvestment of dividends. |
| (c) | The ratios exclude the impact of expenses of the underlying funds in which the Fund invests as represented in the Schedule of Investments. |
See Notes to Financial Statements and Financial Highlights.
| 110 | (888) 848-7569 | www.rivernorth.com |
| RiverNorth Funds | Notes to Financial Statements and Financial Highlights |
September 30, 2024
1. ORGANIZATION
The RiverNorth Funds (the “Trust” or “Funds”) was established under the laws of Ohio by an Agreement and Declaration of Trust dated July 18, 2006 (the “Trust Agreement”). The Trust is an open-end management investment company registered under the Investment Company Act of 1940, as amended (the “1940 Act”). The Trust Agreement permits the Board of Trustees of the Trust (the “Board” or “Trustees”) to authorize and issue an unlimited number of shares of beneficial interest of a separate series without par value. All classes of shares for each of the Funds have identical rights to earnings, assets and voting privileges, except for class-specific expenses and exclusive rights to vote on matters affecting only individual classes. The Funds are considered investment companies and therefore follow the investment company accounting and reporting guidance of the Financial Accounting Standards Board (“FASB”) Accounting Standards Codification Topic 946 Financial Services Investment Companies.
The RiverNorth Core Opportunity Fund (the “Core Opportunity Fund”) was organized as a diversified series of the Trust on July 18, 2006 and commenced investment operations on December 27, 2006. The Core Opportunity Fund offers two classes of shares, Class I Shares (inception date of August 11, 2014) and Class R Shares (inception date of December 27, 2006). The investment adviser to the Core Opportunity Fund is RiverNorth Capital Management, LLC ("RiverNorth" or the “Adviser”). The investment objective of the Core Opportunity Fund is to seek long-term capital appreciation and income.
The RiverNorth/DoubleLine Strategic Income Fund (the “Strategic Income Fund”) is a diversified series of the Trust and commenced investment operations on December 30, 2010. The Strategic Income Fund offers two classes of shares, Class I Shares and Class R Shares. The investment adviser to the Strategic Income Fund is RiverNorth. The Strategic Income Fund’s sub-adviser is DoubleLine Capital, LP (“DoubleLine”). The investment objective of the Strategic Income Fund is current income and overall total return.
The RiverNorth/Oaktree High Income Fund (the “High Income Fund”) is a diversified series of the Trust and commenced investment operations on December 28, 2012. The High Income Fund offers two classes of shares, Class I Shares and Class R Shares. The investment adviser to the High Income Fund is RiverNorth. The High Income Fund’s sub-adviser is Oaktree Fund Advisors, LLC (“Oaktree Capital,” and with DoubleLine, each a “Sub-Adviser” or collectively, the “Sub-Advisers”). Effective August 10, 2021, as part of an internal corporate reorganization, Oaktree Capital Management, L.P., the Fund’s previous sub-adviser, transferred its sub-advisory agreement with the High Income Fund to Oaktree Capital. The investment objective of the High Income Fund is overall total return consisting of long-term capital appreciation and income.
2. SIGNIFICANT ACCOUNTING POLICIES
The following is a summary of significant accounting policies followed by the Funds. These policies are in conformity with generally accepted accounting principles in the United States of America (“GAAP”). The financial statements and financial highlights are prepared in accordance with GAAP, which requires management to make estimates and assumptions that affect the reported amounts and disclosures, including the disclosure of contingent assets and liabilities, in the financial statements and financial highlights during the reporting period. Management believes the estimates and security valuations are appropriate; however, actual results may differ from those estimates, and the security valuations reflected in the financial statements and financial highlights may differ from the value the Funds ultimately realize upon sale of the securities. The financial statements and financial highlights have been prepared as of the close of the New York Stock Exchange (“NYSE” or the "Exchange") on September 30, 2024.
| Annual Report | September 30, 2024 | 111 |
| RiverNorth Funds | Notes to Financial Statements and Financial Highlights |
September 30, 2024
Security Valuation: The Funds’ assets and other financial instruments are recorded at their estimated fair value as described in Note 3.
Security Transactions and Related Income: The Funds follow industry practice and record security transactions on the trade date basis. The specific identification method is used for determining gains or losses for financial statements and financial highlights, and income tax purposes. Dividend income is recorded on the ex-dividend date or for certain foreign securities, when the information becomes available to the Funds, and interest income and expenses are recorded on an accrual basis. Discounts and premiums on securities purchased are amortized or accreted using the effective interest method. Withholding taxes on foreign dividends have been provided for in accordance with the Funds’ understanding of the applicable country’s tax rules and rates. The ability of issuers of debt securities held by the Funds to meet their obligations may be affected by economic and political developments in a specific country or region. Settlement on bank loans transactions may be in excess of seven business days. Interest only stripped mortgage backed securities ("IO Strips") are securities that receive only interest payments from a pool of mortgage loans. Little to no principal will be received by the Funds upon maturity of an IO Strip. Periodic adjustments are recorded to reduce the cost of the security until maturity, which are included in interest income.
Foreign Currency Translation: The books and records of the Funds are maintained in U.S. dollars. Investment valuations and other assets and liabilities initially expressed in foreign currencies are converted each business day into U.S. dollars based upon current exchange rates. Prevailing foreign exchange rates may generally be obtained at the close of the NYSE (normally, 4:00 p.m. Eastern Time). The portion of realized and unrealized gains or losses on investments due to fluctuations in foreign currency exchange rates is not separately disclosed and is included in realized and unrealized gains or losses on investments, when applicable.
Foreign Securities: The Funds may directly purchase securities of foreign issuers. Investing in securities of foreign issuers involves special risks not typically associated with investing in securities of U.S. issuers. The risks include possible revaluation of currencies, the ability to repatriate funds, less complete financial information about companies and possible future adverse political and economic developments. Moreover, securities of many foreign issuers and their markets may be less liquid and their prices more volatile than those of securities of comparable U.S. issuers.
Certain foreign countries impose a capital gains tax which is accrued by the Funds based on the unrealized appreciation, if any, on affected securities. Any accrual would reduce a Fund’s net asset value ("NAV"). The tax is paid when the gain is realized and is included in capital gains tax in the Statements of Operations. During the year ended September 30, 2024, no foreign capital gains tax was accrued or paid by the Funds.
| 112 | (888) 848-7569 | www.rivernorth.com |
| RiverNorth Funds | Notes to Financial Statements and Financial Highlights |
September 30, 2024
Other: The Funds hold certain investments which pay dividends to their shareholders based upon available funds from operations. It is possible for these dividends to exceed the underlying investments’ taxable earnings and profits resulting in the excess portion of such dividends being designated as a return of capital. Distributions received from investments in securities that represent a return of capital or capital gains are recorded as a reduction of the cost of investments or as a realized gain, respectively.
Principal Investment Risks: All mutual funds carry a certain amount of risk. For more information on the related risks of investing in the Funds, please refer to the prospectus of each Fund.
Share Valuation: The NAV is generally calculated as of the close of trading on the NYSE (normally 4:00 p.m. Eastern Time) every day the Exchange is open. The NAV is calculated by taking the total value of each Fund’s or class’s assets, subtracting its liabilities, and then dividing by the total number of shares outstanding, rounded to the nearest cent. The offering price and redemption price per share is equal to the NAV per share.
Expenses: Some expenses of the Trust can be directly attributed to a Fund or a Fund specific share class. Expenses which cannot be directly attributed are apportioned among all Funds and Fund classes in the Trust based on average net assets or another method approved by the Board.
Federal Income Taxes: The Funds make no provision for federal income tax. Each Fund intends to qualify each year as a “regulated investment company” under subchapter M of the Internal Revenue Code of 1986, as amended (the "Code"), by distributing substantially all of its taxable income. If the required amount of net investment income is not distributed, the Funds could incur a tax expense.
As of and during the year ended September 30, 2024, the Funds did not have a liability for any unrecognized tax benefits. The Funds file U.S. federal, state, and local tax returns as required. The Funds’ tax returns are subject to examination by the relevant tax authorities until expiration of the applicable statute of limitations which is generally three years after the filing of the tax return for federal purposes and four years for most state returns. Tax returns for open years have incorporated no uncertain tax positions that require a provision for income taxes.
The Funds recognize interest and penalties, if any, related to unrecognized tax benefits as income tax expenses in the Statements of Operations. During the year ended September 30, 2024, the Funds did not incur any interest or penalties.
Distributions to Shareholders: Distributions to shareholders, which are determined in accordance with income tax regulations, are recorded on the ex-dividend date. The treatment for financial reporting purposes of distributions made to shareholders during the year from net investment income or net realized capital gains may differ from their ultimate treatment for federal income tax purposes. These differences are caused primarily by differences in the timing of recognition of certain components of income, expense, or realized capital gain for federal income tax purposes. Where such differences are permanent in nature, they are reclassified in the components of the net assets based on their ultimate characterization for federal income tax purposes. Any such reclassification will have no effect on net assets, results of operations or net asset values per share of the Funds.
| Annual Report | September 30, 2024 | 113 |
| RiverNorth Funds | Notes to Financial Statements and Financial Highlights |
September 30, 2024
3. SECURITIES VALUATION AND FAIR VALUE MEASUREMENTS
The Funds value their investments at fair value. Fair value is defined as the price that a Fund might reasonably expect to receive upon selling an investment in a timely transaction to an independent buyer in the principal or most advantageous market of the investment. GAAP establishes a three-tier hierarchy to maximize the use of observable market data and minimize the use of unobservable inputs and to establish classification of fair value measurements for disclosure purposes.
Inputs refer broadly to the assumptions that market participants would use in pricing the asset or liability, including assumptions about risk. For example, the risk inherent in a particular valuation technique used to measure fair value including using such a pricing model and/or the risk inherent in the inputs to the valuation technique. Inputs may be observable or unobservable. Observable inputs are inputs that reflect the assumptions market participants would use in pricing the asset or liability developed based on market data obtained from sources independent of the reporting entity. Unobservable inputs are inputs that reflect the reporting entity’s own assumptions about the assumptions market participants would use in pricing the asset or liability developed based on the best information available in the circumstances.
Various inputs are used in determining the value of the Funds’ investments. These inputs are summarized in the three broad levels listed below.
| ● | Level 1 – Unadjusted quoted prices in active markets for identical, unrestricted assets or liabilities that a Fund has the ability to access at the measurement date; |
| ● | Level 2 – Quoted prices which are not active, quoted prices for similar assets or liabilities in active markets or inputs other than quoted prices that are observable (either directly or indirectly) for substantially the full term of the asset or liability; and |
| ● | Level 3 – Significant unobservable prices or inputs (including the Funds’ own assumptions in determining the fair value of investments) where there is little or no market activity for the asset or liability at the measurement date. |
The inputs used to measure fair value may fall into different levels of the fair value hierarchy. In such cases, for disclosure purposes, the level in the fair value hierarchy within which the fair value measurement falls in its entirety is determined based on the lowest level input that is significant to the fair value measurement in its entirety.
Effective September 8, 2022, and pursuant to the requirements of Rule 2a-5 under the 1940 Act, the Board approved updated valuation procedures for the Funds and designated the Adviser as the Funds’ valuation designee to make all fair valuation determinations with respect to the Funds’ portfolio investments, subject to the Board's oversight.
Equity securities, including common stocks, warrants, closed-end funds, exchange traded funds, preferred stocks, and business development companies, are generally valued by using market quotations, but may be valued on the basis of prices furnished by a pricing service when the Adviser believes such prices more accurately reflect the fair market value of such securities. Securities that are traded on any stock exchange are generally valued by the pricing service at the last quoted sale price. Lacking a last sale price, an exchange traded security is generally valued by the pricing service at its last bid price. Securities traded in the NASDAQ over-the-counter market are generally valued by the pricing service at the NASDAQ Official Closing Price. When using the market quotations or close prices provided by the pricing service and when the market is considered active, the security will be classified as a Level 1 security. Sometimes, an equity security owned by the Funds will be valued by the pricing service with factors other than market quotations or when the market is considered inactive. When this happens, the security will be classified as a Level 2 security. When market quotations are not readily available, when the Adviser determines that the market quotation or the price provided by the pricing service does not accurately reflect the current fair value, or when restricted or illiquid securities are being valued, such securities are valued as determined in good faith by the Adviser in conformity with guidelines adopted by and subject to review by the Board. These securities will be categorized as Level 3 securities.
| 114 | (888) 848-7569 | www.rivernorth.com |
| RiverNorth Funds | Notes to Financial Statements and Financial Highlights |
September 30, 2024
Futures contracts are normally valued at the final settlement price or official closing price provided by independent pricing services. These securities will be categorized as Level 1 securities.
Investments in mutual funds, including short-term investments and open-end funds, are generally priced at the ending NAV provided by the service agent of the funds. These securities will be categorized as Level 1 securities.
Domestic and foreign fixed income securities, including foreign and U.S. corporate bonds, U.S. government bonds and notes, foreign government bonds and notes, supranationals and foreign agencies, non-agency collateralized mortgage obligations, U.S. government/agency mortgage backed securities, business development companies-preferred shares and notes, bank loans, collateralized loan obligations, equity-linked notes, mortgage-backed securities, and high yield debt, as well as non-exchange traded derivatives, including forward foreign currency contracts, are normally valued on the basis of quotes obtained from brokers and dealers or independent pricing services. Foreign currency positions, including forward foreign currency contracts, are priced at the mean between the closing bid and asked prices at 4:00 p.m. Eastern Time. Prices obtained from independent pricing services typically use information provided by market makers or estimates of market values obtained from yield data relating to investments or securities with similar characteristics. Data used to establish quotes includes analysis of cash flows, pre-payment speeds, default rates, delinquency assumptions and assumptions regarding collateral and loss assumptions. These securities will be classified as Level 2 securities.
Short-term investments in fixed income securities, with maturities of less than 60 days when acquired, or which subsequently are within 60 days of maturity, are valued by using the amortized cost method of valuation, which the Board has determined will represent fair value. These securities will be classified as Level 2 securities.
In accordance with the Funds’ good faith pricing guidelines, the Adviser is required to consider all appropriate factors relevant to the value of securities for which it has determined other pricing sources are not available or reliable as described above. No single standard exists for determining fair value, because fair value depends upon the circumstances of each individual case. As a general principle, the current fair value of an issue of securities being valued by the Adviser would appear to be the amount which the owner might reasonably expect to receive for them upon their current sale. Methods which are in accordance with this principle may, for example, be based on (i) a multiple of earnings; (ii) discounted cash flow models; (iii) weighted average cost or weighted average price; (iv) a discount from market of a similar freely traded security (including a derivative security or a basket of securities traded on other markets, exchanges or among dealers); or (v) yield to maturity with respect to debt issues, or a combination of these and other methods. Good faith pricing is permitted if, in the Adviser’s opinion, the validity of market quotations appears to be questionable based on factors such as evidence of a thin market in the security based on a small number of quotations, a significant event occurs after the close of a market but before a Fund’s NAV calculation that may affect a security’s value, or the Adviser is aware of any other data that calls into question the reliability of market quotations.
| Annual Report | September 30, 2024 | 115 |
| RiverNorth Funds | Notes to Financial Statements and Financial Highlights |
September 30, 2024
Good faith pricing may also be used in instances when the bonds in which the Funds invest default or otherwise cease to have market quotations readily available. Investments in foreign securities, junk bonds, or other thinly traded securities are more likely to trigger good faith pricing than other securities.
The following is a summary of the inputs used at September 30, 2024 in valuing the Funds’ assets and liabilities:
Core Opportunity Fund
| | | Valuation Inputs | | | | |
| Investments in Securities at Value* | | Level 1 | | | Level 2 | | | Level 3 | | | Total | |
| Closed-End Funds | | $ | 32,652,177 | | | $ | – | | | $ | – | | | $ | 32,652,177 | |
| Closed-End Funds - Preferred Shares | | | 381,931 | | | | – | | | | – | | | | 381,931 | |
| Business Development Companies | | | 367,725 | | | | – | | | | – | | | | 367,725 | |
| Exchange Traded Funds | | | 3,627,932 | | | | – | | | | – | | | | 3,627,932 | |
| Business Development Company Notes | | | – | | | | 198,720 | | | | – | | | | 198,720 | |
| U.S. Corporate Bonds | | | – | | | | 1,173,915 | | | | – | | | | 1,173,915 | |
| U.S. Government Bonds and Notes | | | – | | | | 998,921 | | | | – | | | | 998,921 | |
| Rights | | | 3 | | | | – | | | | – | | | | 3 | |
| Warrants | | | 2,939 | | | | – | | | | – | | | | 2,939 | |
| Short-Term Investments | | | 6,222,951 | | | | – | | | | – | | | | 6,222,951 | |
| Total | | $ | 43,255,658 | | | $ | 2,371,556 | | | $ | – | | | $ | 45,627,214 | |
| 116 | (888) 848-7569 | www.rivernorth.com |
| RiverNorth Funds | Notes to Financial Statements and Financial Highlights |
September 30, 2024
Strategic Income Fund
| | | Valuation Inputs | | | | |
| Investments in Securities at Value* | | Level 1 | | | Level 2 | | | Level 3 | | | Total | |
| Closed-End Funds | | $ | 218,815,444 | | | $ | – | | | $ | – | | | $ | 218,815,444 | |
| Closed-End Funds - Preferred Shares | | | 7,259,522 | | | $ | – | | | | – | | | | 7,259,522 | |
| Business Development Companies | | | 4,010,009 | | | | – | | | | – | | | | 4,010,009 | |
| Business Development Companies - Preferred Shares | | | 7,136,439 | | | | 3,572,730 | | | | – | | | | 10,709,169 | |
| Common Stocks | | | – | | | | 1,732 | | | | – | *** | | | 1,732 | |
| Open-End Funds | | | 36,877,835 | | | | – | | | | – | | | | 36,877,835 | |
| Preferred Stocks | | | – | | | | 2,500,000 | | | | – | | | | 2,500,000 | |
| Business Development Company Notes | | | – | | | | 2,124,526 | | | | – | | | | 2,124,526 | |
| Foreign Corporate Bonds | | | – | | | | 28,108,542 | | | | – | | | | 28,108,542 | |
| U.S. Corporate Bonds | | | – | | | | 144,493,915 | | | | – | | | | 144,493,915 | |
| Foreign Government Bonds and Notes, Supranationals and Foreign Agencies | | | – | | | | 1,256,093 | | | | – | | | | 1,256,093 | |
| Bank Loans | | | – | | | | 3,590,788 | | | | – | | | | 3,590,788 | |
| Collateralized Loan Obligations | | | – | | | | 68,332,136 | | | | – | | | | 68,332,136 | |
| Equity - Linked Notes | | | – | | | | – | | | | – | *** | | | – | |
| Non-Agency Collateralized Mortgage Obligations | | | – | | | | 235,773,095 | | | | – | | | | 235,773,095 | |
| U.S. Government Bonds and Notes | | | – | | | | 195,807,860 | | | | – | | | | 195,807,860 | |
| Rights | | | 3 | | | | – | | | | – | | | | 3 | |
| Mortgage-Backed Securities | | | – | | | | 46,228,590 | | | | – | | | | 46,228,590 | |
| U.S. Government / Agency Mortgage Backed Securities | | | – | | | | 207,214,453 | | | | – | | | | 207,214,453 | |
| Warrants | | | – | | | | – | | | | – | *** | | | – | |
| Short-Term Investments | | | 67,793,779 | | | | – | | | | – | | | | 67,793,779 | |
| Total | | $ | 341,893,031 | | | $ | 939,004,460 | | | $ | – | | | $ | 1,280,897,491 | |
| | | Valuation Inputs | | | | |
| Other Financial Instruments** | | Level 1 | | | Level 2 | | | Level 3 | | | Total | |
| Assets | | | | | | | | | | | | |
| Future Contracts | | $ | 12,728 | | | $ | – | | | $ | – | | | $ | 12,728 | |
| Liabilities | | | | | | | | | | | | | | | | |
| Future Contracts | | $ | (20,183 | ) | | $ | – | | | $ | – | | | $ | (20,183 | ) |
| Total | | $ | (7,455 | ) | | $ | – | | | $ | – | | | $ | (7,455 | ) |
| Annual Report | September 30, 2024 | 117 |
| RiverNorth Funds | Notes to Financial Statements and Financial Highlights |
September 30, 2024
High Income Fund
| | | Valuation Inputs | | | | |
| Investments in Securities at Value* | | Level 1 | | | Level 2 | | | Level 3 | | | Total | |
| Business Development Company Notes | | $ | 77,321 | | | $ | 208,656 | | | $ | – | | | $ | 285,977 | |
| Closed-End Funds | | | 953,643 | | | | – | | | | – | | | | 953,643 | |
| Common Stocks | | | – | | | | 33 | | | | 88,812 | | | | 88,845 | |
| Bank Loans | | | – | | | | 6,236,522 | | | | – | | | | 6,236,522 | |
| High Yield Debt | | | – | | | | 43,578,092 | | | | – | | | | 43,578,092 | |
| Warrants | | | – | | | | 4,799 | | | | – | *** | | | 4,799 | |
| Short-Term Investments | | | 3,634,120 | | | | – | | | | – | | | | 3,634,120 | |
| Total | | $ | 4,665,084 | | | $ | 50,028,102 | | | $ | 88,812 | | | $ | 54,781,998 | |
| | | Valuation Inputs | | | | |
| Other Financial Instruments** | | Level 1 | | | Level 2 | | | Level 3 | | | Total | |
| Assets | | | | | | | | | | | | |
| Forward Foreign Currency Contracts | | $ | – | | | $ | 234 | | | $ | – | | | $ | 234 | |
| Liabilities | | | | | | | | | | | | | | | | |
| Forward Foreign Currency Contracts | | $ | – | | | $ | (60,824 | ) | | $ | – | | | $ | (60,824 | ) |
| Total | | $ | – | | | $ | (60,590 | ) | | $ | – | | | $ | (60,590 | ) |
| * | Refer to each Fund’s Schedule of Investments for a listing of securities by type. |
| ** | Other financial instruments are derivative instruments reflected in the Summary of Investments. Futures contracts are reported at their unrealized appreciation/depreciation. |
| *** | Level 3 security has no value. |
The changes of the fair value of investments for which the Funds have used Level 3 inputs to determine the fair value are as follows:
| Asset Type | | Balance as of September 30, 2023 | | | Accrued Discount/ premium | | | Return of Capital | | | Realized Gain/ (Loss) | | | Change in Unrealized Appreciation/ Depreciation | | | Purchases | | | Sales Proceeds | | | Transfer into Level 3 | | | Transfer Out of Level 3 | | | Balance as of September 30, 2024 | | | Net change in unrealized appreciation/ (depreciation) included in the Statements of Operations attributable to Level 3 investments held at September 30, 2024 | |
| High Income Fund | | | | | | | | | | | | | | | | | | | | | | | |
| Common Stocks | | $ | 85,342 | | | $ | – | | | $ | – | | | $ | – | | | $ | 3,470 | | | $ | – | | | $ | – | | | $ | – | | | $ | – | | | $ | 88,812 | | | $ | 3,470 | |
| | | $ | 85,342 | | | $ | – | | | $ | – | | | $ | – | | | $ | 3,470 | | | $ | – | | | $ | – | | | $ | – | | | $ | – | | | $ | 88,812 | | | $ | 3,470 | |
| 118 | (888) 848-7569 | www.rivernorth.com |
| RiverNorth Funds | Notes to Financial Statements and Financial Highlights |
September 30, 2024
The table below provides additional information about the Level 3 Fair Value Measurements as of September 30, 2024:
Quantitative Information about Level 3 Fair Value Measurements
High Income Fund
| Asset Class | | Fair Value (USD) | | | Valuation
Technique | | Unobservable Inputs(a) | | Value/Range
(Weighted Average) | |
| Common Stocks | | $ | 88,812 | | | Market Comparable Companies | | EBITDA Multiple | | | 5.5x-6.5x (6.0x) | |
| (a) | A change to the unobservable input may result in a significant change to the value of the investment as follows: |
| Unobservable Inputs | Impact to Value if Input Increases | Impact to Value if Input Decreases |
| EBITDA Multiple | Increase | Decrease |
4. DERIVATIVE FINANCIAL INSTRUMENTS
The following discloses the Funds’ use of derivative instruments. The Funds’ investment objectives not only permit the Funds to purchase investment securities; they also allow the Funds to enter into various types of derivative contracts such as futures and forward foreign currency contracts. In doing so, the Funds will employ strategies in differing combinations to permit them to increase, decrease, or change the level or types of exposure to market factors. Central to those strategies are features inherent to derivatives that make them more attractive for this purpose than equity or debt securities; they require little or no initial cash investment, they can focus exposure on only certain selected risk factors, and they may not require the ultimate receipt or delivery of the underlying security (or securities) to the contract. This may allow the Funds to pursue their objectives more quickly and efficiently than if they were to make direct purchases or sales of securities capable of affecting a similar response to market factors.
Market Risk Factors: In pursuit of their investment objectives, the Funds may seek to use derivatives to increase or decrease their exposure to the following market risk factors:
Foreign Exchange Rate Risk: Foreign exchange rate risk relates to the change in the U.S. dollar value of a security held that is denominated in a foreign currency. The value of a foreign currency denominated security will decrease as the dollar appreciates against the currency, while the value of the foreign currency denominated security will increase as the dollar depreciates against the currency.
| Annual Report | September 30, 2024 | 119 |
| RiverNorth Funds | Notes to Financial Statements and Financial Highlights |
September 30, 2024
Risk of Investing in Derivatives
The Funds’ use of derivatives can result in losses due to unanticipated changes in the market risk factors and the overall market. Derivatives may have little or no initial cash investment relative to their market value exposure and therefore can produce significant gains or losses in excess of their cost. This use of embedded leverage allows the Funds to increase their market value exposure relative to their net assets and can substantially increase the volatility of the Funds’ performance.
Additional associated risks from investing in derivatives also exist and potentially could have significant effects on the valuation of the derivative and the Funds. Typically, the associated risks are not the risks that the Funds are attempting to increase or decrease exposure to, per their investment objectives, but are the additional risks from investing in derivatives.
In the ordinary course of business, the Funds may enter into transactions subject to enforceable International Swaps and Derivatives Association, Inc. (ISDA) master agreements or other similar arrangements (“netting agreements”). Generally, the right to offset in netting agreements allows each Fund to offset certain securities and derivatives with a specific counterparty, when applicable, as well as any collateral received or delivered to that counterparty based on the terms of the agreements.
Examples of these associated risks are liquidity risk, which is the risk that the Funds will not be able to sell the derivative in the open market in a timely manner, and counterparty credit risk, which is the risk that the counterparty will not fulfill its obligation to the Funds.
Futures
The Funds may invest in futures contracts in accordance with their investment objectives. The Funds may do so for a variety of reasons including for cash management, hedging or non-hedging purposes in an attempt to achieve the Funds’ investment objective. A futures contract provides for the future sale by one party and purchase by another party of a specified quantity of the security or other financial instrument at a specified price and time. A futures contract on an index is an agreement pursuant to which two parties agree to take or make delivery of an amount of cash equal to the difference between the value of the index at the close of the last trading day of the contract and the price at which the index contract was originally written. Futures transactions may result in losses in excess of the amount invested in the futures contract. There can be no guarantee that there will be a correlation between price movements in the hedging vehicle and in the portfolio securities being hedged. An incorrect correlation could result in a loss on both the hedged securities in a fund and the hedging vehicle so that the portfolio return might have been greater had hedging not been attempted. There can be no assurance that a liquid market will exist at a time when a fund seeks to close out a futures contract or a futures option position. Lack of a liquid market for any reason may prevent a fund from liquidating an unfavorable position, and the fund would remain obligated to meet margin requirements until the position is closed. In addition, a fund could be exposed to risk if the counterparties to the contracts are unable to meet the terms of their contracts. With exchange-traded futures, there is minimal counterparty credit risk to the Funds since futures are exchange-traded and the exchange’s clearinghouse, as counterparty to all exchange-traded futures, guarantees the futures against default. The Funds are party to certain enforceable master netting arrangements, which provide for the right of offset under certain circumstances, such as the event of default.
| 120 | (888) 848-7569 | www.rivernorth.com |
| RiverNorth Funds | Notes to Financial Statements and Financial Highlights |
September 30, 2024
When a purchase or sale of a futures contract is made by a fund, the fund is required to deposit with its custodian (or broker, if legally permitted) a specified amount of liquid assets (“initial margin”). The margin required for a futures contract is set by the exchange on which the contract is traded and may be modified during the term of the contract. The initial margin is in the nature of a performance bond or good faith deposit on the futures contract that is returned to the Funds upon termination of the contract, assuming all contractual obligations have been satisfied. These amounts are included in Deposits with broker for futures contracts on the Statement of Assets and Liabilities. Each day the Funds may pay or receive cash, called “variation margin,” equal to the daily change in value of the futures contract. Such payments or receipts are recorded for financial statement purposes as unrealized gains or losses by the Funds. Variation margin does not represent a borrowing or loan by the Funds but instead is a settlement between the Funds and the broker of the amount one would owe the other if the futures contract expired. When the contract is closed, the Funds record a realized gain or loss equal to the difference between the value of the contract at the time it was opened and the value at the time it was closed.
Forward Foreign Currency Contracts
The Funds may engage in currency transactions with counterparties to hedge the value of portfolio securities denominated in particular currencies against fluctuations in relative value, to gain or reduce exposure to certain currencies, or to generate income or gains. A forward foreign currency contract is an agreement between two parties to buy and sell a currency at a set price on a future date. During the year ended September 30, 2024, the High Income Fund engaged in forward foreign currency contracts. The contracts are marked-to-market daily and the change in value is recorded by the High Income Fund as an unrealized gain or loss. When a forward foreign currency contract is extinguished, through either delivery or offset by entering into another forward foreign currency contract, the High Income Fund records a realized gain or loss equal to the difference between the value of the contract at the time it was opened and the value of the contract at the time it was extinguished.
Forward foreign currency contracts involve elements of market risk in excess of the amounts reflected in the Statement of Assets and Liabilities. The High Income Fund bears the risk of an unfavorable change in the foreign exchange rate underlying the forward foreign currency contract. Risks may also arise upon entering into these contracts from the potential inability of the counterparties to meet the terms of their contracts.
| Annual Report | September 30, 2024 | 121 |
| RiverNorth Funds | Notes to Financial Statements and Financial Highlights |
September 30, 2024
The effect of derivatives instruments on each Fund's Statement of Assets and Liabilities as of September 30, 2024:
| | | | | | Asset Derivatives | |
| Fund | | | Risk Exposure | | Statement of Assets
and Liabilities Location | | Fair Value | |
| High Income Fund | | | Foreign exchange rate risk (Forward foreign currency contracts) | | Unrealized appreciation on forward foreign currency contracts | | $ | 234 | |
| Strategic Income Fund | | | Interest rate risk (Future contracts)* | | Variation margin receivable | | $ | 12,728 | |
| | | | | | Liabilities Derivatives | |
| Fund | | | Risk Exposure | | Statement of Assets and Liabilities Location | | Fair Value | |
| High Income Fund | | | Foreign exchange rate risk (Forward foreign currency contracts) | | Unrealized depreciation on forward foreign currency contracts | | $ | (60,824 | ) |
| Strategic Income Fund | | | Interest rate risk (Future contracts)* | | Variation margin receivable | | $ | (20,183 | ) |
| * | Fair Value represents the cumulative unrealized appreciation (depreciation) on open futures contracts as reported in the Fund’s Schedule of Investments. Only the variation margin on open futures contracts is reported within the Statement of Assets and Liabilities as variation margin receivable. |
| 122 | (888) 848-7569 | www.rivernorth.com |
| RiverNorth Funds | Notes to Financial Statements and Financial Highlights |
September 30, 2024
The effect of derivatives instruments on each Fund's Statement of Operations for the year ended September 30, 2024:
| Fund | | | Risk Exposure | | Statement of
Operations Location | | Realized
Gain/(Loss)
on
Derivatives
Recognized
in Income | | | Change in
Unrealized
Appreciation/
Depreciation
on Derivatives
Recognized
in Income | |
| High Income Fund | | | Foreign exchange rate risk (Forward foreign currency contracts) | | Net realized gain/(loss) on Forward Foreign Currency Contracts/ Net change in unrealized appreciation/depreciation on Forward Foreign Currency Contracts | | $ | (143,277 | ) | | $ | (179,185 | ) |
| Strategic Income Fund | | | Interest rate risk (Future contracts) | | Net realized gain/(loss) on Futures Contracts / Net change in unrealized appreciation/depreciation on Futures Contracts | | $ | 748,717 | | | $ | 1,083,209 | |
The derivative financial instruments’ average monthly notional amount during the year ended September 30, 2024, is noted below.
| Fund | | | Average Monthly
Notional Amount of
Futures Contracts | | | Average Monthly
Notional of Futures
Contracts Sold | | | Average Monthly
Notional Amount of
Forward Foreign
Currency Contracts | |
| High Income Fund | | | $ | – | | | $ | – | | | $ | 7,164,260 | |
| Strategic Income Fund | | | $ | 29,493,457 | | | $ | 9,421,607 | | | $ | – | |
Offsetting Arrangements: Certain derivative contracts are executed under standardized netting agreements. A derivative netting arrangement creates an enforceable right of set-off that becomes effective, and affects the realization of settlement on individual assets, liabilities and collateral amounts, only following a specified event of default or early termination. Default events may include the failure to make payments or deliver securities timely, material adverse changes in financial condition or insolvency, the breach of minimum regulatory capital requirements, or loss of license, charter or other legal authorization necessary to perform under the contract. These agreements mitigate counterparty credit risk by providing for a single net settlement with a counterparty of all financial transactions covered by the agreement in an event of default as defined under such agreement.
| Annual Report | September 30, 2024 | 123 |
| RiverNorth Funds | Notes to Financial Statements and Financial Highlights |
September 30, 2024
The following table presents derivative financial instruments that are subject to enforceable netting arrangements, collateral arrangements or other similar agreements as of September 30, 2024.
Offsetting of Derivatives Asset
| | | | | | | | | | | | Gross Amounts Not Offset in the Statements of Assets and Liabilities | |
| | | Gross Amounts of Recognized Assets | | | Gross Amounts Offset in the Statements of Assets and Liabilities | | | Net Amounts Presented in the Statements of Assets and Liabilities | | | Financial Instruments Available for Offset(a) | | | Cash Collateral Received(a) | | | Net Amount | |
| High Income Fund | | | | | | | | |
| Forward Foreign Currency Contracts | | $ | 234 | | | $ | – | | | $ | 234 | | | $ | (234 | ) | | $ | – | | | $ | – | |
| Total | | $ | 234 | | | $ | – | | | $ | 234 | | | $ | (234 | ) | | $ | – | | | $ | – | |
Offsetting of Derivatives Liability
| | | | | | | | | | | | Gross Amounts Not Offset in the Statement of Assets and Liabilities | |
| | | Gross Amounts of Recognized Liabilities | | | Gross Amounts Offset in the Statement of Assets and Liabilities | | | Net Amounts Presented in the Statement of Assets and Liabilities | | | Financial Instruments Available for Offset(a) | | | Cash Collateral Pledged(a) | | | Net Amount | |
| High Income Fund | | | | | | | | |
| Forward Foreign Currency Contracts | | $ | 60,824 | | | $ | – | | | $ | 60,824 | | | $ | (234 | ) | | $ | – | | | $ | 60,590 | |
| Total | | $ | 60,824 | | | $ | – | | | $ | 60,824 | | | $ | (234 | ) | | $ | – | | | $ | 60,590 | |
| (a) | These amounts are limited to the derivatives asset/liability balance and, accordingly, do not include excess collateral received/pledged. |
| 124 | (888) 848-7569 | www.rivernorth.com |
| RiverNorth Funds | Notes to Financial Statements and Financial Highlights |
September 30, 2024
5. LOAN PARTICIPATIONS AND ASSIGNMENTS
The Strategic Income Fund and High Income Fund may each invest in direct debt instruments which are interests in amounts owed to lenders or lending syndicates by corporate, governmental, or other borrowers. The Strategic Income Fund and High Income Fund will normally invest in corporate debt issuers in North America and Europe. The Strategic Income Fund’s and High Income Fund’s investments in loans may be in the form of participations in loans or assignments of all or a portion of loans from third parties. A loan is often administered by a bank or other financial institution (the “lender”) that acts as agent for all holders. The agent administers the terms of the loan, as specified in the loan agreement. The Strategic Income Fund and High Income Fund may each invest in multiple series or tranches of a loan, which may have varying terms and carry different associated risks. The Strategic Income Fund and High Income Fund will generally purchase assignments of these loans, in which case they will typically become lenders for purposes of the relevant loan agreement with direct contractual rights against the borrower, including the right to receive payments of principal and interest. When purchasing participation interests in a loan, the Strategic Income Fund and High Income Fund generally have no right to enforce compliance with the terms of the loan agreement with the borrower. As a result, the Strategic Income Fund and High Income Fund may each be subject to the credit risk of both the borrower and the lender that is selling the loan agreement. The Strategic Income Fund and High Income Fund may each enter into unfunded loan commitments, which are contractual obligations for future funding. Unfunded loan commitments represent a future obligation in full, even though a percentage of the notional loan amounts may not be utilized by the borrower. When investing in a loan participation, the Strategic Income Fund and High Income Fund have the right to receive payments of principal, interest and any fees to which they are entitled only from the lender selling the loan agreement and only upon receipt of payments by the lender from the borrower. The Strategic Income Fund and High Income Fund may each receive a commitment fee based on the undrawn portion of the underlying line of credit portion of a floating rate loan. In certain circumstances, the Strategic Income Fund and High Income Fund may each receive a penalty fee upon the prepayment of a floating rate loan by a borrower. Fees earned are recorded as a component of interest income or interest expense, respectively, on the Statements of Operations.
As of September 30, 2024, the Funds had the following unfunded loan commitments outstanding, as detailed below:
| Fund | | Borrower | | Amount | |
RiverNorth/Oaktree High Income Fund | | American Rock Salt Company LLC, First Lien - Initial Term Loan | | $ | 9,375 | |
| RiverNorth/Oaktree High Income Fund | | ASP Unifrax | | | 116,000 | |
| | | | | $ | 125,375 | |
The Funds may commit to an investment that has yet to fund because the applicable deal has not closed. Additionally, the Adviser or its affiliates may commit to an investment that it intends to allocate to the Funds for which certain terms are not yet finalized at the time of the commitment and as such the Fund’s allocation may change prior to the date of funding. In this regard, a Fund may have to fund additional commitments in the future that it is currently not obligated to fund. Such investments are not included in the unfunded commitments outstanding table above.
| Annual Report | September 30, 2024 | 125 |
| RiverNorth Funds | Notes to Financial Statements and Financial Highlights |
September 30, 2024
6. ADVISORY FEES, TRUSTEE FEES AND OTHER AGREEMENTS
The Adviser serves as the investment adviser to the Funds. Under the terms of the management agreement (the “Agreement”), the Adviser, subject to the supervision of the Board, provides or arranges to be provided to the Funds such investment advice as it deems advisable and will furnish or arrange to be furnished a continuous investment program for the Funds consistent with the Funds’ investment objectives and policies. As compensation for its management services, the Funds are obligated to pay the Adviser a fee computed and accrued daily and paid monthly in arrears at an annual rate of the average daily net assets of the Funds.
The following table reflects the Funds’ contractual management fee rates (expressed as an annual rate).
| Fund | Contractual Management Fee |
| Core Opportunity Fund | 1.00% |
| Strategic Income Fund | 0.75% |
| High Income Fund | 1.00% |
For the year ended September 30, 2024, the Adviser earned fees of $455,333, $9,225,218, and $541,416, for the Core Opportunity Fund, the Strategic Income Fund, and the High Income Fund, respectively. Of those advisor fees, $37,177, $767,287, and $22,028 remained payable for the Core Opportunity Fund, the Strategic Income Fund, and the High Income Fund, respectively, as of September 30, 2024. The Adviser has contractually agreed to waive the High Income Fund’s management fees and/or reimburse expenses (excluding brokerage fees and commissions; borrowing costs such as (a) interest and (b) dividends on securities sold short; taxes; indirect expenses incurred by the underlying funds in which the Fund invests; and extraordinary expenses) of the High Income Fund until at least January 31, 2025 in order to maintain the Total Annual Fund Operating Expenses After Fee Deferral and/or Reimbursement at 1.60% and 1.35% for the Class R shares and Class I shares, respectively. This agreement may be terminated by the Board on 60 days’ written notice to the Adviser. Any waiver or reimbursement is subject to repayment by the High Income Fund within three years following the fiscal year in which the expenses occurred if the Fund is able to make the repayment without exceeding its current expense limitation and the repayment is approved by the Board. The recoupment period is limited to three years from the time the expenses were waived or incurred, and such recoupment is limited to the lesser of (i) the expense cap in effect at the time of the waiver, and (ii) the expense cap in effect at the time of recapture.
For the year ended September 30, 2024, reimbursed expenses for the High Income Fund subject to potential recovery by year of expiration are as follows:
| | | Expiring September 30, |
| | | 2025 | | | 2026 | | | 2027 | |
| High Income Fund | | | | | | | | | |
| Class I | | $ | 111,424 | | | $ | 109,573 | | | $ | 147,345 | |
| Class R | | $ | 11,927 | | | $ | 8,271 | | | $ | 11,201 | |
| Total | | $ | 123,351 | | | $ | 117,844 | | | $ | 158,546 | |
| 126 | (888) 848-7569 | www.rivernorth.com |
| RiverNorth Funds | Notes to Financial Statements and Financial Highlights |
September 30, 2024
The Adviser has contractually agreed to waive fees and/or reimburse certain expenses in an amount equal to the sum of any acquired fund fees and expenses, if any, incurred by the Strategic Income Fund that are attributable to the Strategic Income Fund’s investment in acquired funds managed by the Adviser or an investment adviser controlling, controlled by, or under common control with the Adviser until at least January 31, 2025. This contractual agreement will continue automatically for successive annual periods unless terminated by the Fund's Board of Trustees on 60 days' written notice to the Adviser.
For the year ended September 30, 2024, the Adviser waived $201,907 in affiliated management fees attributable to the Strategic Income Fund related to the Fund's investment in an affiliated fund, the High Income Fund. The Investment Adviser Fee disclosed on the Strategic Income Fund's Statement of Operations is reflective of this waiver of affiliated management fees. The waived fees are not subject to recoupment by the Adviser.
DoubleLine is the investment sub-adviser to the Strategic Income Fund. Oaktree Capital is the investment sub-adviser to the High Income Fund. Under the terms of the sub-advisory agreements, the Sub-Advisers, subject to the supervision of the Adviser and the Board of Trustees, provide to the Strategic Income Fund and the High Income Fund such investment advice as deemed advisable and will furnish a continuous investment program for the portion of assets managed in the respective Fund consistent with the respective Fund's investment objective and policies. As compensation for its sub-advisory services, the Adviser, out of its own fee, is obligated to pay each Sub-Adviser a fee computed and accrued daily and paid monthly in arrears based on an annual rate of the average daily net assets of the Strategic Income Fund and the High Income Fund.
ALPS Fund Services, Inc. (“ALPS”) provides the Funds with fund administration and fund accounting services. ALPS also serves as transfer agent, dividend paying and shareholder servicing agent for the Funds (“Transfer Agent”). ALPS receives an annual fee based on the Funds' average daily net assets, subject to certain minimums.
State Street Bank & Trust, Co. serves as the Funds’ custodian.
The Funds have adopted a plan pursuant to Rule 12b-1 under the 1940 Act (the “Plan”). The Plan permits the Funds to pay the Adviser for distribution and promotion expenses related to marketing shares of the Funds. The amount payable annually by the Class R shares of the Core Opportunity Fund, the Class R Shares of the Strategic Income Fund, and the Class R Shares of the High Income Fund is 0.25% of the average daily net assets. The expenses of the Funds’ Plan are reflected as 12b-1 fees in the Statements of Operations.
The Funds have entered into a Distribution Agreement with ALPS Distributors, Inc., an affiliate of ALPS, to provide distribution services to the Funds. The Distributor serves as underwriter/distributor of shares of the Funds.
Trustees who are “interested persons” of the Trust receive no salary or fees from the Trust. Each Trustee who is not an “interested person” receives a fee of $28,000 per year, plus $2,000 per meeting and $1,500 per special meeting attended from the Trust. In addition, the lead Independent Director receives $1,333 annually, the Chair of the Audit Committee receives $1,111 annually and the Chair of the Nominating and Corporate Governance Committee receives $667 annually. The Trust reimburses each Trustee and Officer for his or her travel and other expenses relating to attendance at such meetings.
| Annual Report | September 30, 2024 | 127 |
| RiverNorth Funds | Notes to Financial Statements and Financial Highlights |
September 30, 2024
A Trustee and certain Officers of the Trust are also employees of the Adviser, the Distributor or ALPS.
The Trust's officers receive no compensation directly from the Trust for performing the duties of their offices. The Trust's Chief Compliance Officer ("CCO") provides compliance services to the Trust and is also an employee and CCO of the Adviser. The CCO receives compensation directly from the Adviser for his compliance services. The Trust reimburses the Adviser for certain compliance costs related to the Funds, inclusive of a portion of the CCO's compensation. The expenses of the CCO are reflected as Compliance expenses in the Statements of Operations.
7. TAX BASIS INFORMATION
Tax Basis of Distributions to Shareholders: The character of distributions made during the year from net investment income or net realized gains may differ from its ultimate characterization for federal income tax purposes. Also, due to the timing of dividend distributions, the fiscal year in which amounts are distributed may differ from the fiscal year in which the income or realized gain were recorded by a Fund.
The tax character of distributions paid by the Funds during the fiscal year ended September 30, 2024, was as follows:
| | | Ordinary Income | | | Tax-Exempt Income | | | Distributions paid from Long-Term Capital Gain | | | Return of Capital | | | Total | |
| Core Opportunity Fund | | $ | 2,254,209 | | | $ | 97,668 | | | $ | – | | | $ | – | | | $ | 2,351,877 | |
| Strategic Income Fund | | | 52,584,266 | | | | – | | | | – | | | | 21,676,410 | | | | 74,260,676 | |
| High Income Fund | | | 2,893,797 | | | | – | | | | – | | | | 789,118 | | | | 3,682,915 | |
The tax character of distributions paid by the Funds during the fiscal year ended September 30, 2023, was as follows:
| | | Ordinary Income | | | Tax-Exempt Income | | | Distributions paid from Long-Term Capital Gain | | | Return of Capital | | | Total | |
| Core Opportunity Fund | | $ | 1,963,656 | | | $ | 3,344 | | | $ | – | | | $ | 145,829 | | | $ | 2,112,829 | |
| Strategic Income Fund | | | 8,248,428 | | | | – | | | | – | | | | 77,915,264 | | | | 86,163,692 | |
| High Income Fund | | | 4,075,675 | | | | – | | | | – | | | | 108,798 | | | | 4,184,473 | |
| 128 | (888) 848-7569 | www.rivernorth.com |
| RiverNorth Funds | Notes to Financial Statements and Financial Highlights |
September 30, 2024
Components of Distributable Earnings / (Accumulated Deficit) on a Tax Basis: The tax components of distributable earnings / (accumulated deficit) are determined in accordance with income tax regulations which may differ from the composition of net assets reported under GAAP. Accordingly, for the year ended September 30, 2024, certain differences were reclassified. The amounts reclassified did not affect net assets. The reclassifications were as follows:
| | | Paid-in Capital | | | Total Distributable Earnings / (Accumulated Deficit) | |
| Core Opportunity Fund | | $ | (289,113 | ) | | $ | 289,113 | |
| Strategic Income Fund | | | (8,831,531 | ) | | | 8,831,531 | |
| High Income Fund | | | (30,809 | ) | | | 30,809 | |
At September 30, 2024, the components of distributable earnings / (accumulated deficit) on a tax basis for the Funds were as follows:
| | | Undistributed Ordinary Income | | | Accumulated Capital and Other Losses | | | Net Unrealized Appreciation/ (Depreciation) | | | Other Cumulative Effect of Timing Differences | | | Total | |
| Core Opportunity Fund | | $ | 294,371 | | | $ | (2,872,252 | ) | | $ | 3,381,314 | | | $ | – | | | $ | 803,433 | |
| Strategic Income Fund | | | – | | | | (185,507,111 | ) | | | (85,193,342 | ) | | | – | | | | (270,700,453 | ) |
| High Income Fund | | | – | | | | (6,640,626 | ) | | | 921,657 | | | | (390,329 | ) | | | (6,109,298 | ) |
Capital Losses: As of September 30, 2024, the following Funds had capital loss carryforwards which may reduce the applicable Fund’s taxable income arising from future net realized gains on investments, if any, to the extent permitted by the Code and thus may reduce the amount of the distributions to shareholders which would otherwise be necessary to relieve the Funds of any liability for federal tax pursuant to the Code. The capital loss carryforwards may be carried forward indefinitely.
Capital losses carried forward were as follows:
| Fund | | Non-Expiring Short- Term | | | Non-Expiring Long- Term | |
| Core Opportunity Fund | | $ | 1,610,695 | | | $ | 1,261,557 | |
| Strategic Income Fund | | | 54,423,518 | | | | 131,083,593 | |
| High Income Fund | | | 940,123 | | | | 5,700,503 | |
The Core Opportunity Fund used capital loss carryovers during year ended September 30, 2024 in the amount of $1,005,479.
| Annual Report | September 30, 2024 | 129 |
| RiverNorth Funds | Notes to Financial Statements and Financial Highlights |
September 30, 2024
Unrealized Appreciation and Depreciation on Investments: The amount of net unrealized appreciation/(depreciation) and the cost of investment securities for tax purposes, including short-term securities at September 30, 2024, were as follows:
| Fund | | Gross Appreciation (excess of value over tax) | | | Gross Depreciation (excess of tax cost over value) | | | Net Appreciation on Foreign Currency and Derivatives | | | Net Unrealized Appreciation/ (Depreciation) | | | Cost of Investments for Income Tax Purposes | |
| Core Opportunity Fund* | | $ | 4,256,381 | | | $ | (875,088 | ) | | $ | 21 | | | $ | 3,381,314 | | | $ | 42,245,921 | |
| Strategic Income Fund* | | | 66,376,408 | | | | (151,569,763 | ) | | | 13 | | | | (85,193,342 | ) | | | 1,366,090,847 | |
| High Income Fund* | | | 1,817,295 | | | | (898,401 | ) | | | 2,763 | | | | 921,657 | | | | 53,863,105 | |
| * | The difference between book and tax basis unrealized appreciation/(depreciation) for the Funds is attributable primarily to passive foreign investment companies, wash sales, forward contract mark to market, tax treatment of premium amortization, the tax treatment of interest only securities, and tax treatment of certain other investments. |
The High Income Fund elects to defer to the period ending September 30, 2025, late year ordinary losses in the amount of $390,329.
8. INVESTMENT TRANSACTIONS
Investment transactions for the year ended September 30, 2024, excluding U.S. government obligations and short-term investments, were as follows:
| Fund | | Purchases of Securities | | | Proceeds from Sales of Securities | |
| Core Opportunity Fund | | $ | 17,563,007 | | | $ | 24,553,968 | |
| Strategic Income Fund | | | 364,801,533 | | | | 453,155,672 | |
| High Income Fund | | | 29,561,954 | | | | 33,588,784 | |
Investment Transactions in long term U.S. Government Obligations for the year ended September 30, 2024 were as follows:
| | | Purchases of Securities | | | Proceeds from Sales of Securities | |
| Core Opportunity Fund | | $ | – | | | $ | 1,162,597 | |
| Strategic Income Fund | | | 629,824,580 | | | | 630,904,244 | |
9. INVESTMENTS IN AFFILIATED COMPANIES
The Funds may invest in certain securities that are considered securities issued by affiliated companies. As defined by the 1940 Act, an affiliated person, including an affiliated company, is one in which a Fund owns 5% or more of the outstanding voting securities, or a company which is under common ownership or control with the Fund. The purchases, sales, dividend income, capital gains, shares and value of investment in affiliated companies for the year ended September 30, 2024 were as follows:
| 130 | (888) 848-7569 | www.rivernorth.com |
| RiverNorth Funds | Notes to Financial Statements and Financial Highlights |
September 30, 2024
Strategic Income Fund
| Security Name | | Market Value as of October 1, 2023 | | | Purchases | | | Sales | | | Change in Unrealized Gain (Loss) | | | Return of Capital | | | Realized Gain/Loss | | | Market Value as of September 30, 2024 | | | Share Balance as of September 30, 2024 | | | Dividends | |
| RiverNorth/Oaktree High Income Fund – Class I | | $ | 32,574,784 | | | $ | 2,381,117 | | | $ | – | | | $ | 2,863,278 | | | $ | (941,344 | ) | | $ | – | | | $ | 36,877,835 | | | | 4,137,441 | | | $ | 2,381,149 | |
| | | $ | 32,574,784 | | | $ | 2,381,117 | | | $ | – | | | $ | 2,863,278 | | | $ | (941,344 | ) | | $ | – | | | $ | 36,877,835 | | | | 4,137,441 | | | $ | 2,381,149 | |
10. REVOLVING LINE OF CREDIT
On April 8, 2014, the Funds entered into a $100,000,000 committed, unsecured Revolving Credit Agreement with State Street Bank & Trust, Co. The Revolving Credit Agreement was most recently amended on March 26, 2024. The Revolving Credit Agreement expires on March 25, 2025. Borrowings under this arrangement bear interest at the higher of the Federal Funds Rate and the Overnight Bank Funding Rate in effect on the day the loan is made plus 1.25%, which was 6.08% at September 30, 2024. For the year ended September 30, 2024, the Funds paid a facility fee on unloaned balances equal to the product of $100,000,000 less the principal amount of loans outstanding and 0.25%.
For the year ended September 30, 2024, Core Opportunity Fund, Strategic Income Fund and High Income Fund had no borrowings under the Revolving Credit Agreement.
11. BENEFICIAL OWNERSHIP
On September 30, 2024, there were an unlimited number of no par value shares of beneficial interest authorized for each Fund. Transactions in shares of beneficial interest are shown in the Statements of Changes in Net Assets.
The beneficial ownership, either directly or indirectly, of more than 25% of the voting securities of a fund creates a presumption of control of the fund, under Section 2(a)(9) of the 1940 Act. Beneficial owners owning more than 25% of the voting securities for the benefit of their customers of each class of each Fund, as of September 30, 2024, are listed below:
| Fund | Shareholder Name | Percentage Interest |
| Core Opportunity Fund – Class I | Pershing | 46.57% |
| Core Opportunity Fund – Class R | Charles Schwab & Company, Inc. | 51.79% |
| Core Opportunity Fund – Class R | National Financial Services, LLC | 27.49% |
| Strategic Income Fund – Class I | Charles Schwab & Company, Inc. | 69.65% |
| Strategic Income Fund – Class R | Charles Schwab & Company, Inc. | 45.41% |
| High Income Fund – Class I | RiverNorth/DoubleLine Strategic Income Fund | 71.20% |
| High Income Fund – Class R | Charles Schwab & Company, Inc. | 89.47% |
| Annual Report | September 30, 2024 | | 131 |
| RiverNorth Funds | Notes to Financial Statements and Financial Highlights |
September 30, 2024
12. INDEMNIFICATIONS
Under the Trust’s organizational documents, its officers and Trustees are indemnified against certain liability arising out of the performance of their duties to the Trust. Additionally, in the normal course of business, the Trust enters into contracts with service providers that may contain general indemnification clauses. The Trust’s maximum exposure under these arrangements is unknown, as this would involve future claims that may be made against the Trust that have not yet occurred.
13. SUBSEQUENT EVENTS
The Trust has performed an evaluation of subsequent events through the date the financial statements and financial highlights were issued and has determined that no additional items require recognition or disclosure.
| 132 | (888) 848-7569 | www.rivernorth.com |
| RiverNorth Funds | Report of Independent Registered Public Accounting Firm |
September 30, 2024
To the Shareholders and Board of Trustees of
RiverNorth Funds
Opinion on the Financial Statements
We have audited the accompanying statements of assets and liabilities, including the schedules of investments, of RiverNorth Funds, comprising RiverNorth Core Opportunity Fund, RiverNorth/DoubleLine Strategic Income Fund, and RiverNorth/Oaktree High Income Fund (the “Funds”) as of September 30, 2024, the related statements of operations for the year then ended, the statements of changes in net assets for each of the two years in the period then ended, the financial highlights for each of the five years in the period then ended, and the related notes (collectively referred to as the “financial statements”). In our opinion, the financial statements present fairly, in all material respects, the financial position of each of the Funds as of September 30, 2024, the results of their operations for the year then ended, the changes in net assets for each of the two years in the period then ended, and the financial highlights for each of the five years in the period then ended, in conformity with accounting principles generally accepted in the United States of America.
Basis for Opinion
These financial statements are the responsibility of the Funds’ management. Our responsibility is to express an opinion on the Funds’ financial statements based on our audits. We are a public accounting firm registered with the Public Company Accounting Oversight Board (United States) (“PCAOB”) and are required to be independent with respect to the Funds in accordance with the U.S. federal securities laws and the applicable rules and regulations of the Securities and Exchange Commission and the PCAOB.
We conducted our audits in accordance with the standards of the PCAOB. Those standards require that we plan and perform the audit to obtain reasonable assurance about whether the financial statements are free of material misstatement whether due to error or fraud.
Our audits included performing procedures to assess the risks of material misstatement of the financial statements, whether due to error or fraud, and performing procedures that respond to those risks. Such procedures included examining, on a test basis, evidence regarding the amounts and disclosures in the financial statements. Our procedures included confirmation of securities owned as of September 30, 2024, by correspondence with the custodian, agent banks, and brokers; when replies were not received from agent banks or brokers, we performed other auditing procedures. Our audits also included evaluating the accounting principles used and significant estimates made by management, as well as evaluating the overall presentation of the financial statements. We believe that our audits provide a reasonable basis for our opinion.
We have served as the auditor of one or more of RiverNorth Capital Management, LLC’s investment companies since 2006.

COHEN & COMPANY, LTD.
Cleveland, Ohio
November 27, 2024
| Annual Report | September 30, 2024 | 133 |
| RiverNorth Funds | Additional Information |
September 30, 2024 (Unaudited)
PROXY VOTING GUIDELINES
A description of the policies and procedures that the Funds used to determine how to vote proxies relating to portfolio securities and information regarding how the Funds voted proxies during the most recent 12-month period ended June 30, are available without charge upon request by (1) calling the Funds at (888) 848-7569 and (2) from Form N-PX filed by the Funds with the Securities and Exchange Commission (“SEC”) on the SEC’s website at www.sec.gov.
PORTFOLIO HOLDINGS DISCLOSURE POLICY
The Funds file a complete schedule of investments with the SEC for the first and third quarter of each fiscal year on Part F of N-PORT. The Funds’ first and third fiscal quarters end on December 31 and June 30. The Form N-PORT must be made within 60 days of the end of the quarter. The Funds’ Form N-PORT is available on the SEC’s website at www.sec.gov. You may also obtain copies by calling the Funds at 1-888-848-7569 or on the Funds' website, www.rivernorth.com.
UNAUDITED TAX INFORMATION
The RiverNorth Core Opportunity Fund designated the following for federal income tax purposes for the year ended September 30, 2024:
| | | Foreign Taxes Paid | | | Foreign Source Income | |
| RiverNorth Core Opportunity Fund | | $ | 6,132 | | | $ | 92,510 | |
| | | Tax-Exempt Percentage |
| RiverNorth Core Opportunity Fund | | 4.15% |
Of the distributions paid by the Funds from ordinary income for the calendar year ended December 31, 2023, the following percentages met the requirements to be treated as qualifying for the corporate dividends received deduction and qualified dividend income:
| | Dividend Received Deduction | Qualified Dividend Income |
| RiverNorth Core Opportunity Fund | 27.95% | | 28.20% | |
| RiverNorth/DoubleLine Strategic Income Fund | 0.00% | | 0.00% | |
| RiverNorth/Oaktree High Income Fund | 1.46% | | 1.67% | |
The percentage of the total ordinary distributions paid during the calendar year ended December 31, 2023, that qualify as 163(j) interest dividends:
| | 163(j) Percentage |
| RiverNorth Core Opportunity Fund | 19.43% | |
| RiverNorth/DoubleLine Strategic Income Fund | 0.00% | |
| RiverNorth/Oaktree High Income Fund | 82.86% | |
| 134 | (888) 848-7569 | www.rivernorth.com |
| RiverNorth Funds | Additional Information |
September 30, 2024 (Unaudited)
In early 2024, if applicable, shareholders of record received this information for the distributions paid to them by the Funds during the calendar year 2023 via Form 1099. The Funds will notify shareholders in early 2025 of amounts paid to them by the Funds, if any, during the calendar year 2024.
Pursuant to Section 852(b)(3) of the Internal Revenue Code, RiverNorth Core Opportunity Fund designated $0 as long-term capital gain dividends.
| Annual Report | September 30, 2024 | 135 |
RiverNorth Funds
RiverNorth Core Opportunity Fund
RiverNorth/DoubleLine Strategic Income Fund
RiverNorth/Oaktree High Income Fund
Board of Trustees
Patrick W. Galley, CFA, Chairman
Jerry R. Raio
David M. Swanson
John K. Carter
J. Wayne Hutchens
Investment Adviser
RiverNorth Capital Management, LLC
Sub Advisers
DoubleLine Capital LP
Oaktree Fund Advisors, LLC
Transfer Agent, Administrator and
Dividend Disbursing Agent
ALPS Fund Services, Inc.
Distributor
ALPS Distributors, Inc.
Custodian
State Street Bank & Trust, Co.
Independent Registered
Public Accounting Firm
Cohen & Company, Ltd.
This report is provided for the general information of the shareholders of the RiverNorth Funds. This report is not intended for distribution to prospective investors in the Funds, unless preceded or accompanied by an effective prospectus.
| (b) | The Registrant’s Financial Highlights are included as part of the Financial Statements filed under Item 7(a) of this Form N-CSR. |
| Item 8. | Changes in and Disagreements with Accountants for Open-End Management Investment Companies. |
Not applicable during the period covered by this report.
| Item 9. | Proxy Disclosures for Open-End Management Investment Companies. |
Not applicable during the period covered by this report.
| Item 10. | Remuneration Paid to Directors, Officers, and Others of Open-End Management Investment Companies. |
Remuneration Paid to Directors, Officers, and Others is included as part of the Financial Statements filed under Item 7(a) of this Form N-CSR.
| Item 11. | Statement Regarding Basis for Approval of Investment Advisory Contract. |
Not applicable during the period covered by this report.
| Item 12. | Disclosure of Proxy Voting Policies and Procedures for Closed-End Management Investment Companies. |
Not applicable to the Registrant.
| Item 13. | Portfolio Managers of Closed-End Management Investment Companies. |
Not applicable to the Registrant.
| Item 14. | Purchases of Equity Securities by Closed-End Management Investment Company and Affiliated Purchasers. |
Not applicable to the Registrant.
| Item 15. | Submission of Matters to a Vote of Security Holders. |
The Registrant has not adopted procedures by which shareholders may recommend nominees to the Registrant’s Board of Trustees.
| Item 16. | Controls and Procedures. |
| (a) | The Registrant’s principal executive officer and principal financial officer have concluded that the Registrant’s disclosure controls and procedures (as defined in Rule 30a-3(c) under the Investment Company Act of 1940, as amended (the “1940 Act”)) are effective based on their evaluation of these controls and procedures, required by Rule 30a-3(b) under the 1940 Act and Rule 13a-15(b) under the Securities Exchange Act of 1934, as of a date within 90 days of the filing date of this document. |
| (b) | There were no significant changes in the Registrant’s internal control over financial reporting (as defined in Rule 30a-3(d) under the 1940 Act) during the period covered by this report that has materially affected, or is reasonably likely to materially affect, the Registrant’s internal control over financial reporting. |
| Item 17. | Disclosure of Securities Lending Activities for Closed-End Management Investment Companies. |
Not applicable to the Registrant.
| Item 18. | Recovery of Erroneously Awarded Compensation. |
| (a)(2) | Not applicable to the Registrant. |
SIGNATURES
Pursuant to the requirements of the Securities Exchange Act of 1934 and the Investment Company Act of 1940, the Registrant has duly caused this report to be signed on its behalf by the undersigned, thereunto duly authorized.
Registrant: RiverNorth Funds
| By: | /s/ Patrick W. Galley | |
| Name: | Patrick W. Galley | |
| Title: | President and Principal Executive Officer | |
| | | |
| Date: | December 6, 2024 | |
Pursuant to the requirements of the Securities Exchange Act of 1934 and the Investment Company Act of 1940, this report has been signed below by the following persons on behalf of the Registrant and in the capacities and on the dates indicated.
| By: | /s/ Patrick W. Galley | |
| Name: | Patrick W. Galley | |
| Title: | President and Principal Executive Officer | |
| | | |
| Date: | December 6, 2024 | |
| By: | /s/ Jonathan M. Mohrhardt | |
| Name: | Jonathan M. Mohrhardt | |
| Title: | Treasurer and Chief Financial Officer | |
| | | |
| Date: | December 6, 2024 | |