UNITED STATES
SECURITIES AND EXCHANGE COMMISSION
Washington, D.C. 20549
FORM N-CSR
CERTIFIED SHAREHOLDER REPORT OF REGISTERED
MANAGEMENT INVESTMENT COMPANIES
Investment Company Act file number: 811-21934
RiverNorth Funds
(Exact name of registrant as specified in charter)
433 W. Van Buren Street, 1150-E
Chicago, IL 60607
(Address of principal executive offices) (Zip code)
Marc L. Collins
433 W. Van Buren Street, 1150-E
Chicago, IL 60607
(Name and address of agent for service)
Registrant's telephone number, including area code: 312-832-1440
Date of fiscal year end: 09/30
Date of reporting period: 09/30/2021
| Item 1. | Reports to Stockholders. |

| RiverNorth Funds | Table of Contents |
| Shareholder Letter | 2 |
| Opportunistic Closed-End Fund Strategies | |
| Portfolio Update | 4 |
| RiverNorth Core Opportunity Fund | 6 |
| RiverNorth/DoubleLine Strategic Income Fund | 11 |
| RiverNorth/Oaktree High Income Fund | 16 |
| RiverNorth Funds Schedule of Investments and Financial Statements | |
| Disclosure of Fund Expenses | 24 |
| Schedule of Investments | |
| RiverNorth Core Opportunity Fund | 26 |
| RiverNorth/DoubleLine Strategic Income Fund | 30 |
| RiverNorth/Oaktree High Income Fund | 85 |
| Statement of Assets and Liabilities | |
| RiverNorth Core Opportunity Fund | 103 |
| RiverNorth/DoubleLine Strategic Income Fund | 104 |
| RiverNorth/Oaktree High Income Fund | 105 |
| Statement of Operations | |
| RiverNorth Core Opportunity Fund | 107 |
| RiverNorth/DoubleLine Strategic Income Fund | 108 |
| RiverNorth/Oaktree High Income Fund | 109 |
| Statements of Changes in Net Assets | |
| RiverNorth Core Opportunity Fund | 110 |
| RiverNorth/DoubleLine Strategic Income Fund | 112 |
| RiverNorth/Oaktree High Income Fund | 114 |
| Financial Highlights | |
| RiverNorth Core Opportunity Fund | 116 |
| RiverNorth/DoubleLine Strategic Income Fund | 124 |
| RiverNorth/Oaktree High Income Fund | 132 |
| Notes to Financial Statements | 139 |
| Report of Independent Registered Public Accounting Firm | 161 |
| Additional Information | 162 |
| Liquidity Risk Management Program | 166 |
| Trustees & Officers | 167 |
| RiverNorth Funds | Shareholder Letter |
September 30, 2021 (Unaudited)
Dear Fellow Shareholders,
RiverNorth Capital Management, LLC's ("RiverNorth") area of focus is across four specialty asset classes: Closed-End Funds (CEFs), Business Development Companies (BDCs), Special Purpose Acquisition Companies (SPACs), and Investment Company Debt (debt securities issued by registered investment companies such as CEFs and BDCs, abbreviated as ICD).
As one of the largest institutional investors in CEFs and BDCs, RiverNorth thrives on discount volatility in these assets. Our opportunistic investment strategies are structured in a way to increase CEF/BDC exposure as discounts widen and decrease CEF/BDC exposure when discounts narrow. Because these securities are mostly owned by retail investors, the discount/premium swings, that may be motivated by fear and greed, can be drastic at times. As the economy and capital markets have continued to rebound from the pandemic-driven lows, CEFs and BDCs have experienced very strong performance. This strong performance has come from a combination of net asset value (NAV) gains and significant discount narrowing. Except for commodity CEFs, every CEF peer group we track delivered a positive return over the past 12 months ended September 30, 2021. The CEF initial public offering (IPO) market has also remained open and is experiencing robust growth. It is possible that calendar year 2021 will be the best year since 2007 based on IPO assets.
SPACs were very popular into the first quarter of 2021. Acquisition announcements were being well received by the market and investor demand had skyrocketed. SPAC IPOs raised more capital in the first quarter of 2021 than they had in the previous ten years combined. By the second quarter, investor enthusiasm had cooled off considerably, and that trend continued through the end of the fiscal year ended September 30, 2021. In early 2021, high investor demand led to sponsors getting much better terms than had been normal in the past. During Q3 2021, the situation completely reversed. Investor demand for SPACs has gone down while many sponsors still wanted to go forward with their IPOs. To induce investors into buying shares, sponsors have had to be much more generous, and as a result, we are seeing the best IPO terms for investors since RiverNorth started buying SPACs in 2016. As the SPAC market has weakened, we have been active buyers.
Spreads for ICD have also narrowed considerably from pandemic levels. Notwithstanding tighter spreads, we still believe these yields, when considering the duration and credit risk, are relatively attractive vs. investment grade corporate debt. We are finding good opportunities in the smaller, off-the-run, and/or non-rated deals, where spreads are meaningfully wider.
Looking forward, we believe RiverNorth is well-positioned to capitalize on future volatility and opportunities within the CEF, BDC, ICD and SPAC markets. The fourth quarter typically provides trading opportunity as other investors reposition their CEF portfolios. Recently, investors have been selling longer duration assets in response to inflation concerns. This may give us the chance to add some additional exposure on weakness.
| 2 | (888) 848-7569 | www.rivernorth.com |
| RiverNorth Funds | Shareholder Letter |
September 30, 2021 (Unaudited)
We are pleased to provide you with the 2021 Annual Report for the RiverNorth Funds. The report reviews our three opportunistic closed-end strategies: the RiverNorth Core Opportunity Fund (RNCIX/RNCOX), the RiverNorth/DoubleLine Strategic Income Fund (RNSIX/RNDLX), and the RiverNorth/Oaktree High Income Fund (RNHIX/RNOTX).
Please visit www.rivernorth.com for additional information.
We thank you for your investment and trust in managing your assets.
Respectfully,
Patrick W. Galley, CFA
President and Chief Investment Officer
RiverNorth Funds
Opinions and estimates offered constitute our judgement and are subject to change.
Definitions:
Closed-End Fund – A closed-end fund is a portfolio of pooled assets that raises a fixed amount of capital through an initial public offering (IPO) and then lists shares for trade on a stock exchange.
Market Price – The market price at which a closed-end fund trades often varies from its NAV. Some funds have market prices below their NAVs, referred to as a discount. Conversely, some funds have market prices above their NAVs, referred to as a premium.
| Annual Report | September 30, 2021 | 3 |
| RiverNorth Funds | Portfolio Update |
September 30, 2021 (Unaudited)
Closed-End Fund Market Overview
In the past twelve months, the average closed-end fund (CEF) reported a market price total return of 28.3%. The peer group index returns for equity1, taxable bond1 and municipal bond funds1 were 46.7%, 23.5%, 13.3%, respectively.
These returns reflect the continuation of the strong economic and capital markets recovery from the pandemic-driven lows of early 2020.
On September 30, 2021, the average CEF discount was 2.28%. Going back to the end of 19962, this places us in the 19th percentile of widest discounts (i.e., the average discount has been wider on 81% of the trading days since 1996). As a point of reference, in March 20202, when discounts bottomed around 20%, the market was in the 99th percentile of widest discounts.
We believe that CEF discounts are one measure of investor sentiment towards financial assets. Narrow CEF discounts combined with low interest rates, tight credit spreads, equity market indices at/near all-time highs and relatively subdued market volatility demonstrates that investors are generally comfortable with owning risk assets. However, with the recent uptick in interest rates, we have seen more volatility in the markets.
Leveraged CEFs continue to benefit from low borrowing costs. On September 30, 2021, the 1-week Security Industry and Financial Market Assoc. Index (SIFMA) and 1-month London Interbank Offered Rate (LIBOR) rates were at 0.05% and 0.08%, respectively. At the same time, the yield curve has steepened and therefore earnings power has improved. As of September 30, 2021, the average CEF distribution yield is 6.3%.
Attractive and stable distribution yields, strong recent performance, and the continuation of shareholder activism may cause discounts to narrow further. Of course, any significant and prolonged volatility in the capital markets would likely have the opposite effect as CEF market prices are generally correlated to the performance of risk assets.
| (1) | Source: RiverNorth. Derived from Morningstar and Bloomberg data. |
| (2 | Source: RiverNorth; Morningstar, Inc. |
| 4 | (888) 848-7569 | www.rivernorth.com |
| RiverNorth Funds | Portfolio Update |
September 30, 2021 (Unaudited)
Definitions:
Equity Closed-End Funds – Domestic equity closed-end funds are defined as funds investing their assets primarily in U.S. equity securities; generally, these funds are seeking long-term capital appreciation rather than income.
London Interbank Offered Rate (LIBOR) – LIBOR is a benchmark interest rate at which major global banks lend to one another in the international interbank market for short-term loans.
Municipal Bond Closed-End Funds – Municipal bond closed-end funds are defined as funds that invest in a diversified portfolio of investment grade municipal bonds in a variety of sectors and States.
SIFMA (Security Industry/Financial Market Assoc.) Index – SIFMA is a 7-day high-grade market index comprised of tax-exempt Variable Rate Demand Obligations (VRDOs) with certain characteristics. The Index is calculated and published by Bloomberg. The indexes cannot be invested in directly and do not reflect fees and expenses.
Taxable Bond Closed-End Funds – Taxable bond closed-end funds are defined as funds that invest in debt securities whose return is subject to taxes at the local, state or federal level, or some combination thereof.
Yield – Yield is the income return on an investment. This refers to the interest or dividends received from a security and is usually expressed annually as a percentage based on the investment's cost, its current market value or its face value.
Yield Curve - A yield curve is a line that plots yields (interest rates) of bonds having equal credit quality but differing maturity dates. The slope of the yield curve gives an idea of future interest rate changes and economic activity.
| Annual Report | September 30, 2021 | 5 |
| RiverNorth Funds | Portfolio Update |
September 30, 2021 (Unaudited)
RiverNorth Core Opportunity Fund
What is the Fund's investment strategy?
The RiverNorth Core Opportunity Fund (the “Fund”) opportunistically allocates its assets to four niche asset classes: closed-end funds (CEFs), special purpose acquisition companies (SPACs), business development companies (BDCs), and investment company debt (ICD). The Fund also allocates to exchange-traded funds (ETFs) and cash/equivalents to preserve fund level liquidity, while providing a source of dry powder to take advantage of tactical allocation opportunities.
How did the RiverNorth Core Opportunity Fund perform relative to its benchmark during the reporting period?
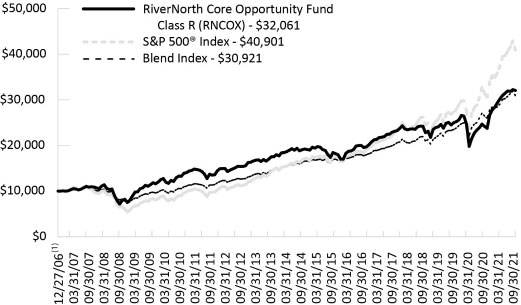
For the twelve-month period ended September 30, 2021, the Class I share (symbol: RNCIX) returned 32.96% and the Class R share (symbol: RNCOX) returned 32.58%. These returns compare to the S&P 500 Total Return Index of 30.00%, the Bloomberg Barclays U.S. Aggregate Bond Index return of -0.90%, and the Morningstar U.S. Fund Allocation Category average return of 19.82%.
Comparison of a $10,000 Investment in the RiverNorth Core Opportunity Fund Class R, the Blend Index, and the S&P 500® Index.
| 6 | (888) 848-7569 | www.rivernorth.com |
| RiverNorth Funds | Portfolio Update |
September 30, 2021 (Unaudited)
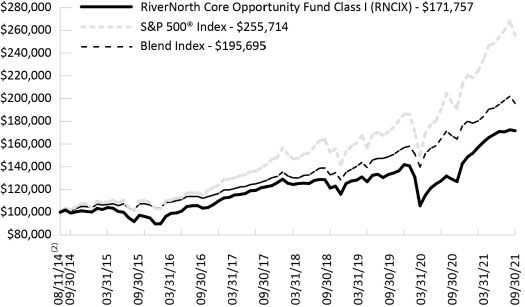
Comparison of a $100,000 Investment in the RiverNorth Core Opportunity Fund Class I, the Blend Index, and the S&P 500® Index.
| Average Annual Total Returns for Periods Ended September 30, 2021 | | |
| | 1-Year | 3-Year | 5-Year | 10 Year | Since
Inception(1)(2) |
RiverNorth Core Opportunity Fund – Class I (RNCIX)(3) | 32.96% | 10.11% | 10.18% | 9.92% | 8.48% |
RiverNorth Core Opportunity Fund – Class R (RNCOX) | 32.58% | 9.82% | 9.90% | 9.65% | 8.21% |
| Blend Index(4) | 16.92% | 12.10% | 11.43% | 11.24% | 7.95% |
| S&P 500® Index(4) | 30.00% | 15.99% | 16.90% | 16.63% | 10.01% |
| (1) | Inception date of Class R is December 27, 2006. |
| (2) | Inception date of Class I is August 11, 2014. |
| (3) | In presenting performance information for the newer Institutional share class of the Fund, the Fund includes, for periods prior to the offering of the Institutional share class, the operating expense ratio and performance of the Fund’s Retail share class, adjusted to reflect the class-related operating expenses of the Institutional share class. Actual expense differentials across classes will vary over time. The performance of the Fund’s newer Institutional share class would have been substantially similar to the performance of the Fund’s Retail share class because both share classes of the Fund are invested in the same portfolio of securities and would have differed only to the extent that the classes do not have the same expenses (although differences in expenses between share classes may change over time). |
| Annual Report | September 30, 2021 | 7 |
| RiverNorth Funds | Portfolio Update |
September 30, 2021 (Unaudited)
| (4) | Blend Index consists of 60% S&P 500® Index and 40% Bloomberg Barclays Capital U.S. Aggregate Bond Index. S&P 500® Index is a capitalization-weighted index of 500 stocks. The Bloomberg Barclays Capital U.S. Aggregate Bond Index is an unmanaged index of investment-grade fixed-rate debt issues with maturities of at least one year. This unmanaged index does not reflect fees and expenses. The S&P 500® and Blend Indices are indices only and cannot be invested in directly. |
Performance data quoted represents past performance, which is not a guarantee of future results. Current performance may be lower or higher than the performance quoted. The principal value and investment return of an investment will fluctuate so that your shares, when redeemed, may be worth more or less than their original cost. You can obtain performance data current to the most recent month end by calling (888) 848-7569 or visiting www.rivernorth.com. Total return measures net investment income and capital gain or loss from portfolio investments. All performance shown assumes reinvestment of dividends and capital gains distributions and does not reflect the deduction of taxes that a shareholder would pay on fund distributions or the redemption of fund shares.
The Total Annual Fund Operating Expense for the Fund as disclosed in the prospectus dated January 28, 2021: 2.69% (RNCIX); 2.94% (RNCOX). In presenting expense information for the newer Institutional share class of the Fund, the Fund includes, for periods prior to the offering of the Institutional share class, the operating expense ratio of the Fund’s Retail share class, adjusted to reflect the class-related operating expenses of the Institutional share class. Actual expense differentials across share classes will vary over time. The annualized net expense ratio in this annual report dated September 30, 2021 is 1.33% (RNCIX); 1.58% (RNCOX). The expense ratio as disclosed in the Fund’s annual report dated September 30, 2021 only includes the direct expenses paid by shareholders from their investment. The expense ratio as disclosed in the Fund’s prospectus dated January 28, 2021 is required to include the indirect expenses of investing in underlying funds.
What contributing factors were responsible for the RiverNorth Core Opportunity Fund's relative performance during the period?
Each of the niche asset classes referenced above contributed positively to Fund performance over the period. The most significant contributing factor was the Fund’s exposure to CEFs as net asset value (NAV) performance was strong, and discounts narrowed substantially. Within the CEF portfolio, equity CEFs (U.S. and global) were the strongest contributors to performance while commodity CEFs detracted over the period.
How was the RiverNorth Core Opportunity Fund positioned at the end of September 2021?
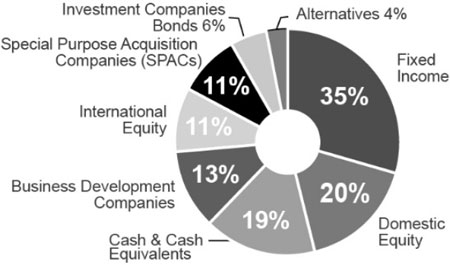
We have allocated 58.67% of the portfolio to CEFs, 9.72% to SPACs, 6.51% to BDCs, and 6.22% to ICD. Additionally, we have 17.26% of the portfolio in cash and 1.06% in ETFs.
Over the past year, we’ve decreased our exposure to CEFs, while increasing our exposure to SPACs and cash. Our allocation to BDCs and ICD was relatively unchanged.
| 8 | (888) 848-7569 | www.rivernorth.com |
| RiverNorth Funds | Portfolio Update |
September 30, 2021 (Unaudited)
Investment Vehicle Allocation(1) (percentages are based on net assets)

Asset Class Allocation(1) (percentages are based on net assets)
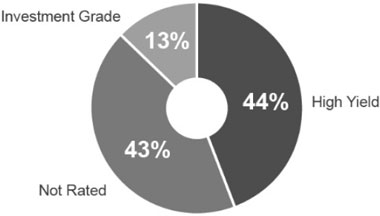
Fixed Income Allocation(1)(2) (percentages are based on net assets)
Portfolio detail statistics are estimates made by the adviser and are subject to change.
| (1) | Convertible Security Risk – the market value of convertible securities adjusts with interest rates and the value of the underlying stock. Exchange Traded Note Risk – exchange traded notes represent unsecured debt of the issuer and may be influenced by interest rates, credit ratings of the issuer or changes in value of the reference index. Fixed Income Risk – the market value of fixed income securities adjusts with interest rates and the securities are subject to issuer default. Foreign/Emerging Market Risk – foreign securities may be subject to inefficient or volatile markets, different regulatory regimes or different tax policies. These risks may be enhanced in emerging markets. Management Risk – there is no guarantee that the adviser’s investment decisions will produce the desired results. Large Shareholder Purchase and Redemption Risk – The Fund may experience adverse effects when certain large shareholders purchase or redeem large amounts of shares of the Fund. Market Risk – economic conditions, interest rates and political events may affect the securities markets. REIT Risk – the value of REITs changes with the value of the underlying properties and changes in interest rates and are subject to additional fees. Security Risk – The value of the Fund may decrease in response to the activities and financial prospects of individual securities in the Fund’s portfolio. Short Sale Risk – short positions are speculative, are subject to transaction costs and are riskier than long positions in securities. Small-Cap Risk – small cap companies are more susceptible to failure, are often thinly traded and have more volatile stock prices. Structured Notes Risk – because of the imbedded derivative feature, structured notes are subject to more risk than investing in a simple note or bond. Swap Risk – swap agreements are subject to counterparty default risk and may not perform as intended. Underlying Fund Risk – underlying funds have additional fees, may utilize leverage, may not correlate to an intended index and may trade at a discount to their net asset values. |
| Annual Report | September 30, 2021 | 9 |
| RiverNorth Funds | Portfolio Update |
September 30, 2021 (Unaudited)
| (2) | Credit quality allocation reflects a fixed-income portfolio weighted average of the credit breakdown of each CEF as provided by the adviser of said CEF. If a credit breakdown is not provided by the adviser, Bloomberg is used. Investment grade refers to a bond rated BBB- or higher by Standard & Poor’s or Baa3 or higher by Moody’s. High yield refers to a bond rate lower than investment grade. For more information about securities ratings, please see the Fund’s Statement of Additional information at www.rivernorth.com. |
| 10 | (888) 848-7569 | www.rivernorth.com |
| RiverNorth Funds | Portfolio Update |
September 30, 2021 (Unaudited)
RiverNorth/DoubleLine Strategic Income Fund
What is the Fund's investment strategy?
The RiverNorth/DoubleLine Strategic Income ("the Fund") invests in a broad range of fixed income securities of U.S. and foreign issuers, including closed-end funds ("CEFs").
Assets of the Fund are tactically managed across three strategies (or sleeves). RiverNorth Capital Management, LLC (“RiverNorth”) oversees the strategy weights and manages the Tactical Closed-End Fund Income Strategy. The RiverNorth strategy provides diversified exposure to the fixed income market through opportunistic investments in closed-end bond funds, and business development companies (BDC). Sector allocations are based on RiverNorth's assessment of relative value among asset classes and CEFs. Jeffrey Gundlach, CEO and CIO of DoubleLine Capital, LP (“DoubleLine”), and his team oversee the Opportunistic Income and Core Fixed Income Strategies. The Opportunistic Income Strategy seeks to achieve positive absolute returns and is managed without duration constraints. The Core Fixed Income Strategy incorporates an active asset allocation approach in an effort to mitigate risk and achieve the highest possible risk-adjusted returns.
How did the RiverNorth/DoubleLine Strategic Income Fund perform relative to its benchmark during the reporting period?
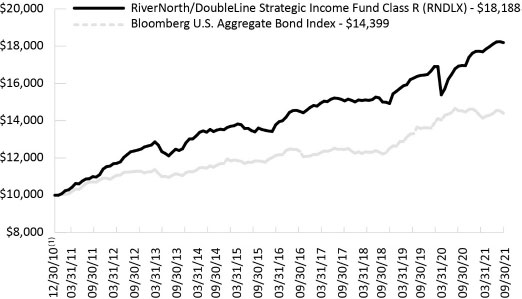
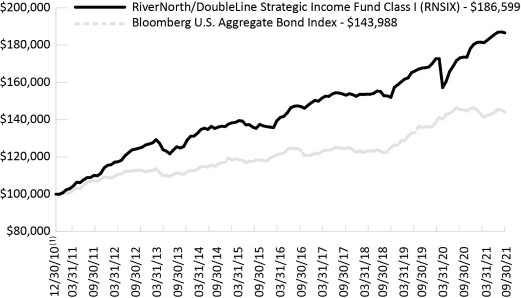
For the twelve-month period ended September 30, 2021, the Class I share (symbol: RNSIX) returned 7.52% and the Class R share (symbol: RNDLX) returned 7.23%. The Bloomberg Barclays Capital U.S. Aggregate Bond Index returned -0.90%, during the same period.
Comparison of a $10,000 Investment in the RiverNorth/DoubleLine Strategic Income Fund Class R and the Barclays Capital U.S. Aggregate Bond Index
| Annual Report | September 30, 2021 | 11 |
| RiverNorth Funds | Portfolio Update |
September 30, 2021 (Unaudited)
Comparison of a $100,000 Investment in the RiverNorth/DoubleLine Strategic Income Fund Class I and the Barclays Capital U.S. Aggregate Bond Index
| Average Annual Total Returns for Periods Ended September 30, 2021 |
| | 1-Year | 3-Year | 5-Year | 10 Year | Since
Inception(1) |
RiverNorth/DoubleLine Strategic Income Fund – Class I (RNSIX) | 7.52% | 6.36% | 4.83% | 5.53% | 5.97% |
RiverNorth/DoubleLine Strategic Income Fund – Class R (RNDLX) | 7.23% | 6.11% | 4.56% | 5.26% | 5.72% |
Bloomberg Barclays Capital U.S. Aggregate Bond Index(2) | -0.90% | 5.36% | 2.94% | 3.01% | 3.45% |
| (1) | Inception date is December 30, 2010. |
| (2) | The Bloomberg Barclays Capital U.S. Aggregate Bond Index is an unmanaged index of investment-grade fixed-rate debt issues with maturities of at least one year. The index cannot be invested in directly and does not reflect fees and expenses. |
Performance data quoted represents past performance, which is not a guarantee of future results. Current performance may be lower or higher than the performance quoted. The principal value and investment return of an investment will fluctuate so that your shares, when redeemed, may be worth more or less than their original cost. You can obtain performance data current to the most recent month end by calling (888) 848-7569 or visiting www.rivernorth.com. Total return measures net investment income and capital gain or loss from portfolio investments. All performance shown assumes reinvestment of dividends and capital gains distributions and does not reflect the deduction of taxes that a shareholder would pay on fund distributions or the redemption of fund shares.
| 12 | (888) 848-7569 | www.rivernorth.com |
| RiverNorth Funds | Portfolio Update |
September 30, 2021 (Unaudited)
The Total Annual Fund Operating Expense for the Fund as disclosed in the prospectus dated January 28, 2021: 1.39% (RNSIX); 1.64% (RNDLX). The annualized net expense ratio in this annual report dated September 30, 2021 is 0.86% (RNSIX) and 1.11% (RNDLX). The expense ratio as disclosed in the Fund’s annual report dated September 30, 2021 only includes the direct expenses paid by shareholders from their investment. The expense ratio as disclosed in the Fund’s prospectus dated January 28, 2021 is required to include the indirect expenses of investing in underlying funds.
What contributing factors were responsible for the RiverNorth/DoubleLine Strategic Income Fund's relative performance during the period?
RiverNorth Tactical Closed-End Fund Income Sleeve
Each of the sleeve’s asset classes contributed positively to Fund performance over the period. The most significant contributing factor was the Fund’s exposure to CEFs as NAV performance was strong, and discounts narrowed substantially. Within the CEF portfolio, senior loan and high yield CEFs were the strongest contributors to performance while preferred CEFs had a relatively small impact.
DoubleLine Opportunistic Income Sleeve
For the 12-month period ended September 30, 2021, the portfolio materially outperformed the Bloomberg Barclays U.S. Aggregate Bond Index return of -0.90%. Outperformance was driven by asset allocation as the portfolio was overweight subordinated credit during an environment where risk taking was rewarded. Top contributors to outperformance included asset-backed securities (ABS), non-agency mortgage-backed securities (MBS), and commercial MBS. These sectors were among the hardest hit during the initial stages of the pandemic and thus stood the most to gain from the robust economic recovery that occurred over the past year. Corporate related sectors such as bank loans, collateralized loan obligations (CLOs), and emerging market debt also outperformed as corporate earnings rebounded sharply and defaults were minimal over the period. Agency residential mortgage-backed securities (RMBS) was the only sector with negative returns during the period driven by price declines as interest rates increased.
DoubleLine Core Fixed Income Sleeve
For the 12-month period ended September 30, 2021, the portfolio outperformed the Bloomberg Barclays U.S. Aggregate Bond Index return of -0.90%. Relative outperformance was driven primarily by asset allocation as the portfolio was overweight credit during an environment where risk assets outperformed. Corporate related sectors such as high yield, CLOs, and emerging market debt were the top performers over the year as corporate earnings rebounded sharply and minimal defaults occurred. Securitized credit sectors such as non-agency MBS, commercial MBS, and ABS also contributed to outperformance and benefitted from the global economic recovery. U.S. Treasuries and Agency RMBS were the only sectors with negative returns as they experienced price declines related to the increase in interest rates that occurred during the year.
How was the RiverNorth/DoubleLine Strategic Income Fund positioned at the end of September 2021?
We have allocated 31.58%, 32.97% and 35.45% to the Tactical CEF Income, Core Fixed Income, and Opportunistic Income sleeves, respectively. Compared to one year ago, the Fund reduced its exposure to the Tactical CEF Income sleeve in favor of a higher allocation to the Core Fixed Income sleeve. The allocation to the Opportunistic Income sleeve was relatively flat year-over year.
| Annual Report | September 30, 2021 | 13 |
| RiverNorth Funds | Portfolio Update |
September 30, 2021 (Unaudited)
Strategy (“Sleeve”) Allocation

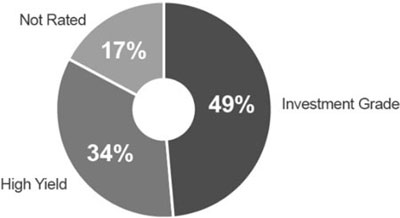
Credit Quality Distribution(1)(2) (percentages are based on net assets)
Sector Breakdown(1) (percentages are based on net assets)
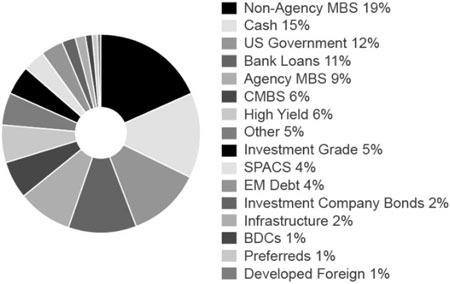
The allocation does not add up to 100% as it reflects the estimated leverage utilized by the underlying funds.
Portfolio detail statistics are estimates made by the adviser and are subject to change.
| 14 | (888) 848-7569 | www.rivernorth.com |
| RiverNorth Funds | Portfolio Update |
September 30, 2021 (Unaudited)
| (1) | Asset-Backed Security Risk – the risk that the value of the underlying assets will impair the value of the security. Borrowing Risk – borrowings increase fund expenses and are subject to repayment, possibly at inopportune times. Convertible Security Risk – the market value of convertible securities adjusts with interest rates and the value of the underlying stock. Defaulted Securities Risk – defaulted securities carry the risk of uncertainty of repayment. Derivatives Risk – derivatives are subject to counterparty risk. Exchange Traded Note Risk – exchange traded notes represent unsecured debt of the issuer and may be influenced by interest rates, credit ratings of the issuer or changes in value of the reference index. Fixed Income Risk – the market value of fixed income securities adjusts with interest rates and the securities are subject to issuer default. Foreign/Emerging Market Risk – foreign securities may be subject to inefficient or volatile markets, different regulatory regimes or different tax policies. These risks may be enhanced in emerging markets. Liquidity Risk – illiquid investments may be difficult or impossible to sell. Large Shareholder Purchase and Redemption Risk – The Fund may experience adverse effects when certain large shareholders purchase or redeem large amounts of shares of the Fund. Management Risk – there is no guarantee that the adviser’s or sub-adviser’s investment decisions will produce the desired results. Market Risk – economic conditions, interest rates and political events may affect the securities markets. Mortgage-Backed Security Risk – mortgage backed securities are subject to credit risk, pre-payment risk and devaluation of the underlying collateral. Portfolio Turnover Risk – increased portfolio turnover results in higher brokerage expenses and may impact the tax status of distributions. Rating Agency Risk – rating agencies may change their ratings or ratings may not accurately reflect a debt issuer’s creditworthiness. REIT Risk – the value of REITs changes with the value of the underlying properties and changes in interest rates and are subject to additional fees. Security Risk –The value of the Fund may decrease in response to the activities and financial prospects of individual securities in the Fund’s portfolio. Structured Notes Risk – because of the imbedded derivative feature, structured notes are subject to more risk than investing in a simple note or bond. Swap Risk – swap agreements are subject to counterparty default risk and may not perform as intended. Underlying Fund Risk – underlying funds have additional fees, may utilize leverage, may not correlate to an intended index and may trade at a discount to their net asset values. |
| (2) | For the sleeve managed by RiverNorth, credit quality allocation reflects a fixed-income portfolio weighted average of the credit breakdown of each CEF as provided by the advisor of said CEF. If a credit breakdown is not provided by the advisor, Bloomberg is used. For the sleeves managed by DoubleLine, credit quality allocation is determined from the highest available credit rating from any Nationally Recognized Statistical Rating Organization (S&P, Moody’s and Fitch). Investment grade refers to a bond rated BBB- or higher by Standard & Poor’s or Baa3 or higher by Moody’s. High yield refers to a bond rated lower than investment grade. For more information about securities ratings, please see the Fund’s Statement of Additional Information at www.rivernorth.com. |
| Annual Report | September 30, 2021 | 15 |
| RiverNorth Funds | Portfolio Update |
September 30, 2021 (Unaudited)
RiverNorth/Oaktree High Income Fund
What is the Fund's investment strategy?
The RiverNorth/Oaktree High Income Fund ("the Fund") invests in a broad range of income producing securities including both fixed income and equity securities.
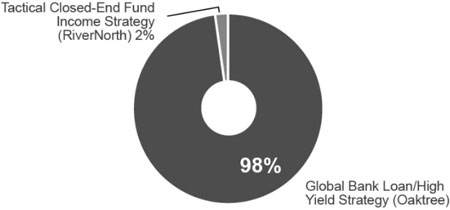
Assets of the Fund are tactically managed across three income strategies (or sleeves). RiverNorth Capital Management, LLC (“RiverNorth”) manages the Tactical Closed-End Fund Strategy. This strategy is designed to provide diversified fixed income and equity income exposure through opportunistic investments in closed-end funds ("CEFs"). Oaktree Capital Management, LP ("Oaktree") manages the High Yield Bond and Senior Loan Strategies on a global basis. Oaktree will tactically manage the allocation between the High Yield Bond and Senior Loan Strategies based both on market opportunities and the risk and reward trade-offs between the two asset classes.
How did the RiverNorth/Oaktree High Income Fund perform relative to its benchmark during the reporting period?
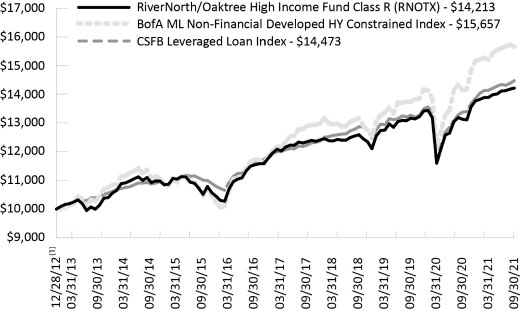
For the 12-month period ended September 30, 2021, the Class I share (symbol: RNHIX) returned 8.55% and the Class R share (symbol: RNOTX) returned 8.31%. The ICE Bank of America Merrill Lynch Non-Financial Developed High Yield Constrained Index (the "BofA Non-Financial Developed HY Constrained Index") and CSFB Leveraged Loan Index returned 10.77% and 8.24%, respectively, during the same period.
Comparison of a $10,000 Investment in the RiverNorth/Oaktree High Income Fund Class R, BofA ML Non-Financial Developed HY Constrained Index and the CSFB Leveraged Loan Index
| 16 | (888) 848-7569 | www.rivernorth.com |
| RiverNorth Funds | Portfolio Update |
September 30, 2021 (Unaudited)
Comparison of a $100,000 Investment in the RiverNorth/Oaktree High Income Fund Class I, BofA ML Non-Financial Developed HY Constrained Index and the CSFB Leveraged Loan Index
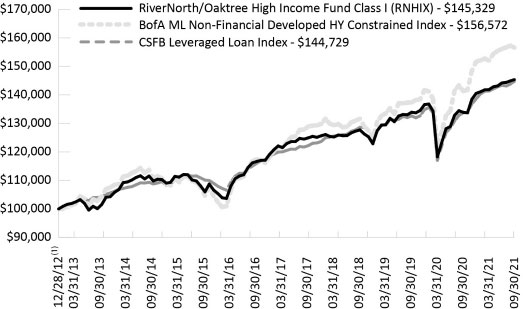
Average Annual Total Returns for the Period Ended September 30, 2021
| | 1-Year | 3-Year | 5-Year | Since
Inception(1) |
RiverNorth/Oaktree High Income Fund – Class I (RNHIX) | 8.55% | 4.40% | 4.49% | 4.36% |
RiverNorth/Oaktree High Income Fund – Class R (RNOTX) | 8.31% | 4.15% | 4.24% | 4.10% |
| BofA ML Non-Financial Developed HY Constrained Index(2) | 10.77% | 5.96% | 5.93% | 5.25% |
| CSFB Leveraged Loan Index(2) | 8.24% | 4.02% | 4.53% | 4.31% |
| (1) | Inception date is December 28, 2012. |
| (2) | The BofA ML Non-Financial Developed Markets HY Constrained Index contains all securities in the BofA Merrill Lynch Global High Yield Index from developed markets countries but caps issuer exposure at 2%. Developed markets is defined as an FX-G10 member, a Western European nation, or a territory of the U.S. or a Western European nation. The BofA ML Non-Financial Developed Markets HY Constrained Index tracks the performance of USD, CAD, GBP and EUR denominated below investment grade corporate debt publicly issued in the major domestic or Eurobond markets. Qualifying securities must have a below investment grade rating (based on an average of Moody’s, S&P and Fitch). The CSFB Leveraged Loan Index tracks the investable market of the U.S. dollar denominated leveraged loan market. It consists of issues rated “5B” or lower, meaning that the highest rated issues included in this index are Moody’s/S&P ratings of Baa1/BB+ or Ba1/BBB+. All loans are funded term loans with a tenor of at least one year and are made by issuers domiciled in developed countries. The BofA ML Non-Financial Developed Markets HY Constrained and the CSFB Leveraged Loan Indices are indices only and cannot be invested in directly. |
| Annual Report | September 30, 2021 | 17 |
| RiverNorth Funds | Portfolio Update |
September 30, 2021 (Unaudited)
Performance data quoted represents past performance, which is not a guarantee of future results. Current performance may be lower or higher than the performance quoted. The principal value and investment return of an investment will fluctuate so that your shares, when redeemed, may be worth more or less than their original cost. You can obtain performance data current to the most recent month end by calling (888) 848-7569 or visiting www.rivernorth.com. Total return measures net investment income and capital gain or loss from portfolio investments. All performance shown assumes reinvestment of dividends and capital gains distributions and does not reflect the deduction of taxes that a shareholder would pay on fund distributions or the redemption of fund shares.
The Total Annual Operating Expense for the Fund as disclosed in the prospectus dated January 28, 2021: 1.68% (RNHIX); 1.93% (RNOTX). The adviser has contractually agreed to defer the collection of fees and/or reimburse expenses, but only to the extent necessary to limit Total Annual Fund Operating Expenses (excluding brokerage fees and commissions; borrowing costs, such as (a) interest and (b) dividends on securities sold short; taxes; indirect expenses incurred by the underlying funds in which the Fund invests; and extraordinary expenses) to 1.35% (RNHIX) and 1.60% (RNOTX) of the average daily net assets of the Fund through January 31, 2021. The annualized net expense ratio in this annual report dated September 30, 2021 is 1.35% (RNHIX) and 1.60% (RNOTX). The expense ratio as disclosed in the Fund’s annual report dated September 30, 2021 only includes the direct expenses paid by shareholders from their investment. The expense ratio as disclosed in the Fund’s prospectus dated January 28, 2021 is required to include the indirect expenses of investing in underlying funds.
What contributing factors were responsible for the RiverNorth/Oaktree High Income Fund's relative performance during the period?
RiverNorth Tactical Closed-End Fund Sleeve
The most significant contributing factor was the Fund’s exposure to high yield CEFs as NAV performance was strong, and discounts narrowed substantially. Conversely, the Fund’s exposure to BDCs had a relatively small impact on performance over the period.
Oaktree High Yield Bond & Senior Loan Sleeve
The portfolio generated a positive return over the twelve-month period.
The re-opening of the global economy, together with expansive monetary and fiscal policies, pushed risk assets higher over the trailing 12-month period. The S&P 500 was up an astounding 30%. High yield bonds and senior loans couldn’t quite keep pace with stocks but produced strong absolute returns over the period. Forward currency contracts had minimal impact on performance.
As we start the fourth quarter of 2021, credit fundamentals remain sound. In fact, there were no high yield bond defaults in the third quarter of 2021 and as of September 30, 2021, there were just a tiny number of bonds trading at or below 70% of par (an indicator of credit weakness).
The portfolio didn’t experience any defaults over the trailing twelve-month period.
There are plenty of risks to consider, including the Delta variant, rising prices and inflation. We certainly recognize that higher Treasury yields could penalize returns for all fixed income asset categories, including high yield bonds. Fortunately, high yield bonds have a moderate duration given their higher coupons and intermediate maturities. That makes them less correlated to treasuries and better positioned to hold up better in a rising rate environment than longer duration investment grade bonds.
| 18 | (888) 848-7569 | www.rivernorth.com |
| RiverNorth Funds | Portfolio Update |
September 30, 2021 (Unaudited)
For senior loans, while activity in the loan primary market is on track to set an annual record, the supply has been unable to match the tremendous demand from CLOs and retail investors. The spike in interest rates late in the quarter made floating-rate assets more attractive, buoying loan prices. At the end of September 2021, 32% of all loans were trading above par compared to 27% as of June 30, 2021. With most loans trading at or near par, we expect to earn a coupon-like return in the near to medium term, which bodes well for the Fund’s relative performance for the remainder of the year.
How was the RiverNorth/Oaktree High Income Fund positioned at the end of September 2021?
We have allocated 1.62% and 98.38% to the RiverNorth Tactical CEF Income and Oaktree High Yield Bond/Senior Loan sleeves, respectively. The CEF sleeve is primarily invested in the common shares of high yield CEFs.
Oaktree High Yield Bond & Senior Loan Sleeve
At the end of September 2021, the portfolio remained broadly diversified. Roughly 75% of the global portfolio was allocated to North America, with the balance invested in Europe. In terms of Industry exposure, Hotels, Restaurants & Leisure (7.4%) and Diversified Telecommunication Services (7.4%) represented the two largest sectors in the portfolio.
We are keeping our duration in check to ensure that the portfolio will not be disproportionately impacted if interest rates rise. Specifically, we have been monitoring our exposure to low coupon/longer duration bonds, which could prove quite vulnerable to rising rates.
Strategy Allocation
| Annual Report | September 30, 2021 | 19 |
| RiverNorth Funds | Portfolio Update |
September 30, 2021 (Unaudited)
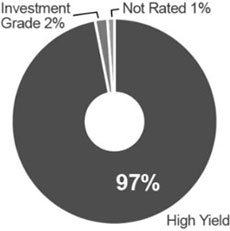
Credit Quality Distribution(1)(2) (percentages are based on net assets)
Sector Breakdown(1) (percentages are based on net assets)

The allocation does not add up to 100% as it reflects the leverage utilized by the underlying funds.
| (1) | Borrowing Risk – borrowings increase fund expenses and are subject to repayment, possibly at inopportune times. Closed- End Fund Risk – closed-end funds are exchange traded, may trade at a discount to their net asset values and may deploy leverage. Convertible Security Risk – the market value of convertible securities adjusts with interest rates and the value of the underlying stock. Credit Derivatives Risk – the use of credit derivatives is highly specialized, involves default, counterparty and liquidity risks and may not perfectly correlate to the underlying asset or liability being hedged. Currency Risk – foreign currencies will rise or decline relative to the U.S. dollar. Distressed and Defaulted Securities Risk – defaulted securities carry the risk of uncertainty of repayment. Equity Risk – equity securities may experience volatility and the value of equity securities may move in opposite directions from each other and from other equity markets generally. Fixed Income Risk – the market value of fixed income securities adjusts with interest rates and the securities are subject to issuer default. Foreign/Emerging Market Risk – foreign securities may be subject to inefficient or volatile markets, different regulatory regimes or different tax policies. These risks may be enhanced in emerging markets. Floating Interest Rate Risk – loans pay interest based on the London Interbank Offered Rate (LIBOR) and a decline in LIBOR could negatively impact the Fund’s return. Investment Style Risk – investment strategies may come in and out of favor with investors and may underperform or outperform at times. Large Shareholder Purchase and Redemption Risk – The Fund may experience adverse effects when certain large shareholders purchase or redeem large amounts of shares of the Fund. Loans Risk – loans may be unrated or rated below investment grade and the pledged collateral may lose value. Secondary trading in loans is not fully-developed and may result in illiquidity. Management Risk – there is no guarantee that the adviser’s or sub-adviser’s investment decisions will produce the desired results. Market Risk – economic conditions, interest rates and political events may affect the securities markets. Portfolio Turnover Risk – increased portfolio turnover results in higher brokerage expenses and may impact the tax status of distributions. Preferred Stock Risk – preferred stocks generally pay dividends, but may be less liquid than common stocks, have less priority than debt instruments and may be subject to redemption by the issuer. Security Risk – the value of the Fund may increase or decrease in response to the prospects of the issuers of securities and loans held in the Fund. Swap Risk – swap agreements are subject to counterparty default risk and may not perform as intended. Underlying Fund Risk – underlying funds have additional fees, may utilize leverage, may not correlate to an intended index and may trade at a discount to their net asset values. Valuation Risk – Loans and fixed-income securities are traded “over the counter” and because there is no centralized information regarding trading, the valuation of loans and fixed-income securities may vary. |
| 20 | (888) 848-7569 | www.rivernorth.com |
| RiverNorth Funds | Portfolio Update |
September 30, 2021 (Unaudited)
| (2) | For the sleeve managed by RiverNorth, credit quality allocation reflects a fixed-income portfolio weighted average of the credit breakdown of each CEF as provided by the advisor of said CEF. If a credit breakdown is not provided by the advisor, Bloomberg is used. For the sleeves managed by Oaktree, the sub-adviser uses a proprietary credit scoring matrix to rank potential investments. This process offers a systematic way of reviewing the key quantitative and qualitative variables impacting credit quality for each investment. Investment grade refers to a bond rated BBB- or higher by Standard & Poor’s or Baa3 or higher by Moody’s. High yield refers to a bond rated lower than investment grade. For more information about securities ratings, please see the Fund’s Statement of Additional Information at www.rivernorth.com. |
Definitions:
Agency Mortgage-Backed Securities (Agency MBS) – Agency MBS are mortgage-backed securities issued by government-sponsored enterprises such as Government National Mortgage Association (GNMA or Ginnie Mae), Federal National Mortgage Association (FNMA or Fannie Mae) or Federal Home Loan Mortgage Corporation (Freddie Mac).
Basis Point (bps) – A common unit of measure for interest rates and other percentages in finance. One basis point is equal to 1/100th of 1%, or 0.01% (0.0001), and is used to denote the percentage change in a financial instrument.
Bloomberg Barclays U.S. Aggregate Bond Index – The Bloomberg Barclays U.S. Aggregate Bond Index is an unmanaged index of investment-grade fixed-rate debt issues with maturities of at least one year. The index cannot be invested in directly and does not reflect fees and expenses.
BofA Merrill Lynch Developed Markets High Yield Constrained Index – The BofA Merrill Lynch Developed Markets High Yield Constrained Index contains all securities in the BofA Merrill Lynch Global High Yield index from developed markets countries but cap issuer exposure at 2%. Developed markets is defined as an FX-G10 member, a Western European nation, or a territory of the U.S. or a Western European nation. The index tracks the performance of USD, CAD, GBP and EUR denominated below investment grade corporate debt publicly issued in the major domestic or Eurobond markets. Qualifying securities must have a below investment grade rating (based on an average of Moody's, S&P and Fitch). The index cannot be invested in directly and does not reflect fees and expenses.
| Annual Report | September 30, 2021 | 21 |
| RiverNorth Funds | Portfolio Update |
September 30, 2021 (Unaudited)
Business Development Company (BDC) – A Business Development Company (BDC) is an organization that invests in small- and medium-sized companies as well as distressed companies. A BDC helps the small- and medium-sized firms grow in the initial stages of their development.
Collateralized Loan Obligation (CLO) – A CLO is a security backed by a pool of debt, often low-rated corporate loans. The investor receives scheduled debt payments from the underlying loans but assumes most of the risk in the event that borrowers default.
Commercial Mortgage-Backed Securities (CMBS) – Commercial mortgage-backed securities (CMBS) are fixed-income investment products that are backed by mortgages on commercial properties rather than residential real estate.
Coupon – A coupon is the annual interest rate paid on a bond, expressed as a percentage of the face value.
CSFB Leveraged Loan Index – The CSFB Leveraged Loan Index tracks the investable market of the U.S. dollar denominated leveraged loan market. It consists of issues rated "5B" or lower, meaning that the highest rated issues included in this index are Moody's/S&P ratings of Baa1/BB+ or Ba1/BBB+. All loans are funded term loans with a tenor of at least one year and are made by issuers domiciled in developed countries. The index cannot be invested in directly and does not reflect fees and expenses.
Dry Powder – Dry Powder is an informal term that refers to highly liquid securities, cash reserves and any other security that can be converted to cash right away to meet debt obligations, cover operational expenses or invest in opportunities.
Floating Rate Coupons – Floating rate coupons are derived from financial instruments paying a variable or floating interest rate.
Inverse-Floater Securities – An inverse-floater is a bond or other type of debt whose coupon rate has an inverse relationship to a benchmark rate. An inverse floater adjusts its coupon payment as the interest rate changes.
Inverse-Interest Only Securities (Inverse IOs) – Inverse IOs are interest only securities that pay a coupon inversely related to market rates (i.e., it moves in the opposite direction of interest rates).
Mezzanine Debt – Mezzanine debt has embedded equity instruments attached, often known as warrants, which increase the value of the subordinated debt and allow greater flexibility when dealing with bondholders.
Morningstar U.S. Fund Allocation Category – The Morningstar U.S. Fund Allocation Category - 50% to 70% Equity. Funds in allocation categories seek to provide both income and capital appreciation by investing in multiple asset classes, including stocks, bonds, and cash. These portfolios are dominated by domestic holdings and have equity exposures between 50% and 70%.
| 22 | (888) 848-7569 | www.rivernorth.com |
| RiverNorth Funds | Portfolio Update |
September 30, 2021 (Unaudited)
Mortgage-Backed Securities (MBS) – MBS are asset-backed securities that are secured by a mortgage or collection of mortgages.
Non-Agency Residential Mortgage-Backed Securities (Non-Agency RMBS) – Non-Agency RMBS are mortgage-backed securities sponsored by private companies other than the government sponsored enterprises such as Fannie Mae, Ginnie Mae, or Freddie Mac.
Par – Par value, also known as nominal value, is the face value of a bond or the stock value stated in the corporate charter.
Residential Mortgage-Backed securities (RMBS) – RMBS are a type of mortgage-backed debt obligation whose cash flows come from residential debt, such as mortgages, home-equity loans and subprime mortgages.
Special Purpose Acquisition Company (SPAC) – A SPAC is a company with no commercial operations that is formed strictly to raise capital through an initial public offering (IPO) for the purpose of acquiring an existing company.
| Annual Report | September 30, 2021 | 23 |
| RiverNorth Funds | Disclosure of Fund Expenses |
September 30, 2021 (Unaudited)
Expense Example
As a shareholder of the RiverNorth Funds (the "Trust" or "Funds"), you incur two types of costs:
(1) transaction costs; and (2) ongoing costs, including management fees, distribution and service (12b-1) fees and other Fund expenses. This example is intended to help you understand your ongoing costs (in dollars) of investing in the Funds and to compare these costs with the ongoing costs of investing in other mutual funds. The Example is based on an investment of $1,000 invested at the beginning of the period, April 1, 2021, and held for the six months ended September 30, 2021.
Actual Expenses
The first line of the table below provides information about actual account values and actual expenses. You may use the information in this line, together with the amount you invested, to estimate the expenses that you paid over the period. Simply divide your variable account value by $1,000 (for example, an $8,600 account value divided by $1,000 = 8.6), then multiply the result by the number in the first line under the heading entitled “Expenses Paid During Period” to estimate the expenses you paid on your account during this period.
Hypothetical Example for Comparison Purposes
The second line of the table below provides information about hypothetical account values and hypothetical expenses based on each Fund’s actual expense ratio and an assumed rate of return of 5% per year before expenses, which is not each Fund’s actual return. The hypothetical account values and expenses may not be used to estimate the actual ending account balance or expenses you paid for the period. You may use this information to compare the ongoing costs of investing in each Fund and other funds. To do so, compare these 5% hypothetical examples with the 5% hypothetical examples that appear in the shareholder reports of other funds.
Please note that the expenses shown in the table below are meant to highlight your ongoing costs only and do not reflect any transactional costs, such as redemption fees. Therefore, the second line for each share class of each Fund within the table is useful in comparing ongoing costs only, and will not help you determine the relative total costs of owning different funds. If these transactional costs were included, your costs would have been higher.
| 24 | (888) 848-7569 | www.rivernorth.com |
| RiverNorth Funds | Disclosure of Fund Expenses |
September 30, 2021 (Unaudited)
| | Beginning
Account Value
04/01/2021 | Ending
Account Value
09/30/2021 |
Expense
Ratio(a) | Expenses
Paid During
Period(b) |
| RiverNorth Core Opportunity Fund | | | |
| Class I Shares | | | | |
| Actual | $1,000.00 | $1,062.10 | 1.33% | $6.88 |
| Hypothetical (5% return before expenses) | $1,000.00 | $1,018.40 | 1.33% | $6.73 |
| Class R Shares | | | | |
| Actual | $1,000.00 | $1,060.70 | 1.58% | $8.16 |
| Hypothetical (5% return before expenses) | $1,000.00 | $1,017.15 | 1.58% | $7.99 |
| RiverNorth/DoubleLine Strategic Income Fund | | | |
| Class I Shares | | | | |
| Actual | $1,000.00 | $1,029.00 | 0.86% | $4.37 |
| Hypothetical (5% return before expenses) | $1,000.00 | $1,020.76 | 0.86% | $4.36 |
| Class R Shares | | | | |
| Actual | $1,000.00 | $1,027.70 | 1.11% | $5.64 |
| Hypothetical (5% return before expenses) | $1,000.00 | $1,019.50 | 1.11% | $5.62 |
| RiverNorth/Oaktree High Income Fund | | | |
| Class I Shares | | | | |
| Actual | $1,000.00 | $1,024.50 | 1.35% | $6.85 |
| Hypothetical (5% return before expenses) | $1,000.00 | $1,018.30 | 1.35% | $6.83 |
| Class R Shares | | | | |
| Actual | $1,000.00 | $1,023.40 | 1.60% | $8.12 |
| Hypothetical (5% return before expenses) | $1,000.00 | $1,017.05 | 1.60% | $8.09 |
| (a) | Annualized, based on the Fund's most recent fiscal half-year expenses. |
| (b) | Expenses are equal to the Fund's annualized expense ratio multiplied by the average account value over the period, multiplied by the number of days in the most recent fiscal half year (183), then divided by 365. Note this expense example is typically based on a six-month period. |
| Annual Report | September 30, 2021 | 25 |
RiverNorth Core Opportunity Fund | Schedule of Investments |
Shares/Description | Value | |
CLOSED-END FUNDS - 58.39% | | | |
383,467 | | Aberdeen Emerging Markets Equity Income Fund, Inc. | | $ | 3,190,445 | |
6,696 | | Barings Global Short Duration High Yield Fund | | | 114,502 | |
195,497 | | BlackRock 2022 Global Income Opportunity Trust | | | 1,020,494 | |
56,482 | | Blackrock Capital Allocation Trust | | | 1,140,936 | |
7,395 | | Blackrock Health Sciences Trust II | | | 199,517 | |
44,235 | | BlackRock Innovation & Growth Trust | | | 800,654 | |
38,867 | | Blackrock Science & Technology Trust | | | 2,027,303 | |
29,451 | | Blackstone Strategic Credit Fund | | | 407,896 | |
260,650 | | BrandywineGLOBAL - Global Income Opportunities Fund, Inc. | | | 3,263,338 | |
103,401 | | Calamos Long/Short Equity & Dynamic Income Trust | | | 2,104,210 | |
26,257 | | First Eagle Senior Loan Fund | | | 28,095 | |
56,645 | | First Trust Dynamic Europe Equity Income Fund | | | 730,154 | |
97,153 | | First Trust Energy Infrastructure Fund | | | 1,238,701 | |
116,958 | | First Trust MLP and Energy Income Fund | | | 842,098 | |
311,341 | | First Trust New Opportunities MLP & Energy Fund | | | 1,768,417 | |
26,500 | | First Trust Senior Floating Rate 2022 Target Term Fund | | | 255,460 | |
180,976 | | GDL Fund | | | 1,625,164 | |
540,375 | | Invesco Senior Income Trust | | | 2,404,669 | |
14,030 | | Ivy High Income Opportunities Fund | | | 191,790 | |
15,116 | | LMP Capital and Income Fund, Inc. | | | 207,996 | |
38,020 | | Macquarie Global Infrastructure Total Return Fund, Inc. | | | 886,246 | |
42,189 | | Morgan Stanley Emerging Markets Debt Fund, Inc. | | | 384,342 | |
137,854 | | Morgan Stanley Emerging Markets Domestic Debt Fund, Inc. | | | 806,446 | |
112,394 | | NexPoint Credit Strategies Fund | | | 1,563,401 | |
439,479 | | Nuveen Credit Strategies Income Fund | | | 2,882,982 | |
57,125 | | Nuveen Floating Rate Income Opportunity Fund | | | 570,108 | |
449,438 | | Nuveen High Income November 2021 Target Term Fund | | | 4,215,728 | |
31,997 | | Nuveen Mortgage Opportunity Term Fund | | | 663,938 | |
112,903 | | Pershing Square Holdings Ltd. | | | 4,075,798 | |
19,267 | | PIMCO Dynamic Credit Income Fund | | | 407,112 | |
108,873 | | Special Opportunities Fund, Inc. | | | 1,673,378 | |
242,778 | | Sprott Focus Trust, Inc. | | | 2,012,630 | |
170,242 | | Sprott Physical Gold and Silver Trust(a) | | | 2,916,245 | |
81,696 | | Western Asset High Income Opportunity Fund, Inc. | | | 424,002 | |
| | | | | | | |
TOTAL CLOSED-END FUNDS | | | |
(Cost $43,844,061) | | 47,044,195 | |
| | | | |
BUSINESS DEVELOPMENT COMPANIES - 6.48% | | | |
218,512 | | Barings BDC, Inc. | | | 2,408,002 | |
188,777 | | First Eagle Alternative Capital BDC, Inc. | | | 832,507 | |
See Notes to Financial Statements. | |
26 | (888) 848-7569 | www.rivernorth.com |
RiverNorth Core Opportunity Fund | Schedule of Investments |
| September 30, 2021 |
Shares/Description | Value | |
280,706 | | Oaktree Specialty Lending Corp. | | $ | 1,981,784 | |
| | | | | | | |
TOTAL BUSINESS DEVELOPMENT COMPANIES | | | |
(Cost $4,841,292) | | 5,222,293 | |
| | | | |
SPECIAL PURPOSE ACQUISITION COMPANIES - 9.48% | | | |
13,110 | | Agba Acquisition, Ltd.(a) | | | 142,637 | |
3,099 | | Apollo Strategic Growth Capital II(a) | | | 30,835 | |
35,123 | | Ares Acquisition Corp.(a) | | | 342,099 | |
20,156 | | Austerlitz Acquisition Corp. I(a) | | | 200,351 | |
70,128 | | Austerlitz Acquisition Corp. II(a) | | | 683,748 | |
50,000 | | CC Neuberger Principal Holdings II, Class A(a) | | | 491,000 | |
40,000 | | CC Neuberger Principal Holdings III(a) | | | 390,800 | |
40,405 | | Churchill Capital Corp. VI(a) | | | 394,757 | |
40,843 | | Churchill Capital Corp. VII(a) | | | 396,994 | |
900 | | Compute Health Acquisition Corp.(a) | | | 9,009 | |
56,000 | | Conx Corp., Class A(a) | | | 548,800 | |
42,000 | | Fortress Value Acquisition Corp. IV(a) | | | 409,080 | |
41,800 | | Gores Guggenheim, Inc.(a) | | | 427,196 | |
35,400 | | Gores Holdings VII, Inc.(a) | | | 348,690 | |
65,455 | | Jaws Mustang Acquisition Corp.(a) | | | 638,842 | |
20,514 | | Khosla Ventures Acquisition Co. III(a) | | | 201,037 | |
45,258 | | KKR Acquisition Holdings I Corp.(a) | | | 441,266 | |
21,214 | | Landcadia Holdings IV, Inc.(a) | | | 211,716 | |
12,447 | | Lazard Growth Acquisition Corp. I(a) | | | 122,976 | |
22,145 | | Longview Acquisition Corp. II(a) | | | 219,014 | |
10,753 | | Merida Merger Corp. I(a) | | | 107,422 | |
35,400 | | Reinvent Technology Partners Y(a) | | | 351,522 | |
20,984 | | Spartan Acquisition Corp. III, Class A(a) | | | 207,322 | |
32,700 | | Tishman Speyer Innovation Corp. II(a) | | | 320,460 | |
| | | | | | | |
TOTAL SPECIAL PURPOSE ACQUISITION COMPANIES | | | |
(Cost $7,578,497) | | 7,637,573 | |
| | | | |
EXCHANGE TRADED FUNDS - 1.05% | | | |
37,953 | | Invesco FTSE RAFI Emerging Markets Portfolio | | | 847,870 | |
| | | | | | | |
TOTAL EXCHANGE TRADED FUNDS | | | |
(Cost $682,207) | | 847,870 | |
See Notes to Financial Statements. | |
Annual Report | September 30, 2021 | 27 |
RiverNorth Core Opportunity Fund | Schedule of Investments |
| Shares/Description | Value | |
| PREFERRED STOCKS - 0.50% | | | |
| 15,162 | | XAI Octagon Floating Rate Alternative Income Term Trust, Series 2026, 6.500%, 03/31/2026 | $ | 400,201 | |
| | | | | | |
| TOTAL PREFERRED STOCKS | | | |
| (Cost $378,879) | | 400,201 | |
| Shares/Principal Amount/Description | | | Rate | | | Maturity | | | Value | |
| BUSINESS DEVELOPMENT COMPANY NOTES - 3.77% United States - 3.77% | | | | | |
| | 49,778 | | | First Eagle Alternative Capital BDC, Inc. | | | 5.00% | | | | 05/25/2026 | | | | 1,256,895 | |
| $ | 1,220,000 | | | PennantPark Floating Rate Capital, Ltd. | | | 4.25% | | | | 04/01/2026 | | | | 1,232,337 | |
| | 21,578 | | | PennantPark Investment Corp. | | | 5.50% | | | | 10/15/2024 | | | | 546,571 | |
| | | | | | | | | | | | | | | | | |
| TOTAL BUSINESS DEVELOPMENT COMPANY NOTES (Cost $3,005,096) | | | | | | | | | | | 3,035,803 | |
| Principal Amount/Description | | | Rate | | | Maturity | | | Value | |
CONVERTIBLE CORPORATE BONDS - 2.43% | | | | | | | | | |
| $ | 848,323 | | | BlackRock Capital Investment Corp. | | | 5.00% | | | | 06/15/2022 | | | | 859,973 | |
| | 190,456 | | | BlackRock TCP Capital Corp. | | | 4.63% | | | | 03/01/2022 | | | | 193,772 | |
| | 852,978 | | | New Mountain Finance Corp. | | | 5.75% | | | | 08/15/2023 | | | | 901,128 | |
| | | | | | | | | | | | | | | | | |
TOTAL CONVERTIBLE CORPORATE BONDS | | | | | | | | | | | | |
(Cost $1,748,771) | | | | | | | | | | | 1,954,873 | |
| Shares/Description | | | Value | |
Rights - 0.00%(a)(b) | | |
| | 13,110 | | | Agba Acquisition, Ltd., Strike Price 11.50, Expires 12/31/2049 | | | 3,320 | |
| | | | | | | | | |
TOTAL RIGHTS | | | | |
(Cost $2,960) | | | 3,320 | |
| | | | | |
Warrants - 0.19%(a) | | | | |
| | 13,110 | | | Agba Acquisition, Ltd., Strike Price 11.50, Expires 05/10/2024 | | | 2,871 | |
| | 10,614 | | | AgileThought, Inc., Strike Price 11.50, Expires 08/23/2026 | | | 11,144 | |
| | 7,024 | | | Ares Acquisition Corp., Strike Price 11.50, Expires 12/31/2027 | | | 5,970 | |
| | 5,039 | | | Austerlitz Acquisition Corp. I, Strike Price 11.50, Expires 02/19/2026 | | | 8,516 | |
| | 5,032 | | | Austerlitz Acquisition Corp. II, Strike Price 11.50, Expires 12/31/2027 | | | 5,284 | |
| | 8,081 | | | Churchill Capital Corp. VI, Strike Price 11.50, Expires 12/31/2027 | | | 9,697 | |
| | 8,168 | | | Churchill Capital Corp. VII, Strike Price 11.50, Expires 02/29/2028 | | | 7,515 | |
| | 18,643 | | | Ensysce Biosciences, Inc., Strike Price 11.50, Expires 02/01/2026 | | | 6,339 | |
See Notes to Financial Statements. | |
28 | (888) 848-7569 | www.rivernorth.com |
RiverNorth Core Opportunity Fund | Schedule of Investments |
Shares/Description | Value | |
5,250 | | Fortress Value Acquisition Corp. IV, Strike Price 11.50, Expires 03/18/2028 | | $ | 4,252 | |
7,314 | | Ginkgo Bioworks Holdings, Inc., Strike Price 11.50, Expires 12/31/2027 | | | 24,794 | |
8,360 | | Gores Guggenheim, Inc., Strike Price 11.50, Expires 12/31/2027 | | | 17,389 | |
4,425 | | Gores Holdings VII, Inc., Strike Price 11.50, Expires 12/31/2027 | | | 5,221 | |
3,290 | | Jasper Therapeutics, Inc., Strike Price 11.50, Expires 12/01/2026 | | | 4,869 | |
10,113 | | Jaws Mustang Acquisition Corp., Strike Price 11.50, Expires 01/30/2026 | | | 11,630 | |
5,064 | | KKR Acquisition Holdings I Corp., Strike Price 11.50, Expires 12/31/2027 | | | 4,861 | |
4,429 | | Longview Acquisition Corp. II, Strike Price 11.50, Expires 05/10/2026 | | | 5,717 | |
5,376 | | Merida Merger Corp. I, Strike Price 11.50, Expires 11/07/2026 | | | 6,182 | |
4,425 | | Reinvent Technology Partners Y, Strike Price 11.50, Expires 12/31/2028 | | | 6,638 | |
6,540 | | Tishman Speyer Innovation Corp. II, Strike Price 11.50, Expires 12/31/2027 | | | 5,494 | |
| | | | | | | |
TOTAL WARRANTS | | | |
(Cost $148,587) | | 154,383 | |
| | | | |
SHORT-TERM INVESTMENTS - 17.33% | | | |
Money Market Fund - 17.33% | | | |
13,965,438 | | State Street Institutional Trust (7 Day Yield 0.01%) | | | 13,965,438 | |
| | | | | | | |
TOTAL SHORT-TERM INVESTMENTS | | | |
(Cost $13,965,438) | | 13,965,438 | |
| | | | |
TOTAL INVESTMENTS - 99.62% | | | |
(Cost $76,195,788) | $ | 80,265,949 | |
OTHER ASSETS IN EXCESS OF LIABILITIES - 0.38% | | 306,581 | |
NET ASSETS - 100.00% | $ | 80,572,530 | |
(a) | Non-income producing security. |
(b) | Less than 0.005%. |
See Notes to Financial Statements. | |
Annual Report | September 30, 2021 | 29 |
RiverNorth/DoubleLine Strategic Income Fund | Schedule of Investments |
| September 30, 2021 |
Shares/Description | | Value | |
CLOSED-END FUNDS - 10.93% | | | | |
| 751,527 | | | AllianceBernstein Global High Income Fund, Inc. | | $ | 9,221,236 | |
| 486,456 | | | BlackRock Floating Rate Income Strategies Fund, Inc. | | | 6,499,052 | |
| 1,000,932 | | | Blackstone Strategic Credit Fund | | | 13,862,908 | |
| 1,320,021 | | | BrandywineGLOBAL - Global Income Opportunities Fund, Inc. | | | 16,526,663 | |
| 274,705 | | | Cohen & Steers Tax-Advantaged Preferred Securities & Income Fund | | | 6,873,119 | |
| 1,048,094 | | | First Trust Senior Floating Rate 2022 Target Term Fund | | | 10,103,626 | |
| 1,412,439 | | | Invesco Dynamic Credit Opportunities Fund | | | 16,525,536 | |
| 2,596,003 | | | Invesco Senior Income Trust | | | 11,552,213 | |
| 258,130 | | | Morgan Stanley Emerging Markets Debt Fund, Inc. | | | 2,351,564 | |
| 1,449,660 | | | Morgan Stanley Emerging Markets Domestic Debt Fund, Inc. | | | 8,480,511 | |
| 2,749,690 | | | Nuveen Credit Strategies Income Fund | | | 18,037,966 | |
| 855,996 | | | Nuveen Floating Rate Income Fund | | | 8,619,880 | |
| 965,801 | | | Nuveen Floating Rate Income Opportunity Fund | | | 9,638,694 | |
| 80,898 | | | Nuveen Global High Income Fund | | | 1,299,222 | |
| 534,635 | | | Nuveen High Income November 2021 Target Term Fund | | | 5,014,876 | |
| 1,085,093 | | | Nuveen Senior Income Fund | | | 6,347,794 | |
| 730,650 | | | PGIM Global High Yield Fund, Inc. | | | 11,252,010 | |
| 536,285 | | | PGIM High Yield Bond Fund, Inc. | | | 8,709,269 | |
| 22,678 | | | PGIM Short Duration High Yield Opportunities Fund | | | 425,666 | |
| 331,750 | | | Virtus AllianzGI Diversified Income & Convertible Fund | | | 8,804,645 | |
| 3,277,776 | | | Western Asset High Income Opportunity Fund, Inc. | | | 17,011,658 | |
| 1,908,270 | | | Western Asset Inflation-Linked Opportunities & Income Fund | | | 25,360,908 | |
| | | | | | | | |
TOTAL CLOSED-END FUNDS | | | | |
(Cost $204,278,093) | | | 222,519,016 | |
| | | | | | | | |
BUSINESS DEVELOPMENT COMPANIES - 0.52% | | | | |
| 954,901 | | | Barings BDC, Inc. | | | 10,523,009 | |
| | | | | | | | |
TOTAL BUSINESS DEVELOPMENT COMPANIES | | | | |
(Cost $9,851,354) | | | 10,523,009 | |
| | | | | | | | |
SPECIAL PURPOSE ACQUISITION COMPANIES - 3.96% | | | | |
| 200,000 | | | Apollo Strategic Growth Capital II(a) | | | 1,954,000 | |
| 517,200 | | | Ares Acquisition Corp.(a) | | | 5,037,528 | |
| 860,755 | | | Austerlitz Acquisition Corp. II(a) | | | 8,392,361 | |
| 800,000 | | | CC Neuberger Principal Holdings II, Class A(a) | | | 7,856,000 | |
| 135,000 | | | CC Neuberger Principal Holdings III(a) | | | 1,318,950 | |
| 200,000 | | | Churchill Capital Corp. V(a) | | | 1,956,000 | |
| 300,000 | | | Churchill Capital Corp. VI(a) | | | 2,931,000 | |
| 550,000 | | | Churchill Capital Corp. VII(a) | | | 5,346,000 | |
| 350,000 | | | Compute Health Acquisition Corp.(a) | | | 3,419,500 | |
| 350,000 | | | Conx Corp., Class A(a) | | | 3,430,000 | |
See Notes to Financial Statements. | |
30 | (888) 848-7569 | www.rivernorth.com |
RiverNorth/DoubleLine Strategic Income Fund | Schedule of Investments |
| September 30, 2021 |
Shares/Description | | Value | |
350,000 | | | Far Peak Acquisition Corp.(a) | | | $ | 3,482,500 | |
12,164 | | | Frontera Energy Corp.(a) | | | | 72,741 | |
50,000 | | | FTAC Hera Acquisition Corp.(a) | | | | 487,000 | |
200,000 | | | Gores Guggenheim, Inc.(a) | | | | 2,044,000 | |
664,046 | | | Jaws Mustang Acquisition Corp.(a) | | | | 6,481,089 | |
361,160 | | | KKR Acquisition Holdings I Corp.(a) | | | | 3,521,310 | |
500,000 | | | Lazard Growth Acquisition Corp. I(a) | | | | 4,865,000 | |
31,580 | | | McDermott International, Ltd.(a) | | | | 12,632 | |
153,882 | | | Pershing Square Tontine Holdings, Ltd.(a) | | | | 3,031,475 | |
275,000 | | | RedBall Acquisition Corp.(a) | | | | 2,706,000 | |
625,000 | | | Social Capital Hedosophia Holdings Corp. VI(a) | | | | 6,343,750 | |
250,000 | | | SVF Investment Corp.(a) | | | | 2,440,000 | |
350,000 | | | Trebia Acquisition Corp.(a) | | | | 3,468,500 | |
| | | | | | | | |
TOTAL SPECIAL PURPOSE ACQUISITION COMPANIES | | | | | |
(Cost $81,604,556) | | | | 80,597,336 | |
| | | | | | | | |
OPEN-END FUNDS - 1.61% | | | | | |
3,435,936 | | | RiverNorth/Oaktree High Income Fund, Class I(b) | | | | 32,734,160 | |
| | | | | | | | |
TOTAL OPEN-END FUNDS | | | | | |
(Cost $32,384,291) | | | | 32,734,160 | |
Shares/Principal Amount/Description | | | Rate | | Maturity | | | Value | |
BUSINESS DEVELOPMENT COMPANY NOTES - 1.15% | | | | | | | | | | | | | |
United States - 1.15% | | | | | | | | | | | | | |
241,858 | | | First Eagle Alternative Capital BDC, Inc. | | | | 6.13 | % | | | 10/30/2023 | | | | 6,080,310 | |
246,313 | | | First Eagle Alternative Capital BDC, Inc. | | | | 5.00 | % | | | 05/25/2026 | | | | 6,219,403 | |
32,069 | | | Oxford Square Capital Corp. | | | | 6.50 | % | | | 03/30/2024 | | | | 809,742 | |
49,593 | | | Oxford Square Capital Corp. | | | | 6.25 | % | | | 04/30/2026 | | | | 1,261,646 | |
$ | 3,000,000 | | | PennantPark Floating Rate Capital, Ltd. | | | | 4.25 | % | | | 04/01/2026 | | | | 3,030,338 | |
233,620 | | | PennantPark Investment Corp. | | | | 5.50 | % | | | 10/15/2024 | | | | 5,917,595 | |
| | | | | | | | | | | | | | | | |
TOTAL BUSINESS DEVELOPMENT COMPANY NOTES | | | | | | | | | | | | | |
(Cost $22,730,914) | | | | | | | | | | | | 23,319,034 | |
Principal Amount/Description | | Rate | Maturity | | | Value | |
FOREIGN CORPORATE BONDS - 4.45% | | | | | | | | | | | | |
Argentina - 0.07% | | | | | | | | | | | | |
$ | 150,000 | | | AES Argentina Generacion SA(c) | | | 7.75 | % | | | 02/02/2024 | | | $ | 133,688 | |
See Notes to Financial Statements. | |
Annual Report | September 30, 2021 | 31 |
RiverNorth/DoubleLine Strategic Income Fund | Schedule of Investments |
| September 30, 2021 |
Principal Amount/Description | | | Rate | | Maturity | | | Value | |
$ | 600,000 | | | Banco Macro SA(c)(d) | | | 6.75% | | | 11/04/2026 | | | $ | 517,734 | |
| 150,000 | | | Pampa Energia SA(e) | | | 9.13% | | | 04/15/2029 | | | | 140,126 | |
| 450,000 | | | Pampa Energia SA(c) | | | 9.13% | | | 04/15/2029 | | | | 420,379 | |
| 575,629 | | | Stoneway Capital Corp.(c)(f) | | | 10.00% | | | 03/01/2027 | | | | 152,547 | |
| | | | | | | | | | | | | | 1,364,474 | |
Australia - 0.29% | | | | | | | | | | | |
| 1,000,000 | | | APT Pipelines, Ltd.(e) | | | 4.25% | | | 07/15/2027 | | | | 1,136,559 | |
| 990,000 | | | Australia & New Zealand Banking Group, Ltd.(d)(e) | | | 5Y US TI + 1.70% | | | 11/25/2035 | | | | 961,796 | |
| 675,000 | | | Commonwealth Bank of Australia(e) | | | 4.32% | | | 01/10/2048 | | | | 798,599 | |
| 680,000 | | | Macquarie Group, Ltd.(d)(e) | | | 3M US L + 1.33% | | | 03/27/2024 | | | | 714,490 | |
| 370,000 | | | Macquarie Group, Ltd.(d)(e) | | | 1D SOFR + 0.91% | | | 09/23/2027 | | | | 368,373 | |
| 475,000 | | | National Australia Bank, Ltd.(e) | | | 2.99% | | | 05/21/2031 | | | | 481,018 | |
| 340,000 | | | NBN Co., Ltd.(e) | | | 1.45% | | | 05/05/2026 | | | | 338,814 | |
| 500,000 | | | Sydney Airport Finance Co. Pty, Ltd.(e) | | | 3.38% | | | 04/30/2025 | | | | 530,790 | |
| 500,000 | | | Sydney Airport Finance Co. Pty, Ltd.(e) | | | 3.63% | | | 04/28/2026 | | | | 537,671 | |
| | | | | | | | | | | | | | 5,868,110 | |
Bermuda - 0.02% | | | | | | | | | | | |
| 300,000 | | | Investment Energy Resources, Ltd.(e) | | | 6.25% | | | 04/26/2029 | | | | 324,375 | |
| | | | | | | | | | | | | | | |
Brazil - 0.09% | | | | | | | | | | | |
| 200,000 | | | Banco do Estado do Rio Grande do Sul SA(d)(e) | | | 5Y US TI + 4.93% | | | 01/28/2031 | | | | 200,284 | |
| 400,000 | | | Nexa Resources SA(c) | | | 5.38% | | | 05/04/2027 | | | | 420,504 | |
| 950,000 | | | Oi SA(g) | | | 10.00% (10.00%) | | | 07/27/2025 | | | | 892,952 | |
| 300,000 | | | Unigel Luxembourg SA(c) | | | 8.75% | | | 10/01/2026 | | | | 322,863 | |
| | | | | | | | | | | | | | 1,836,603 | |
British Virgin Islands - 0.07% | | | | | | | | | | | |
| 1,500,000 | | | TSMC Global, Ltd.(e) | | | 1.25% | | | 04/23/2026 | | | | 1,486,000 | |
| | | | | | | | | | | | | | | |
Canada - 0.43% | | | | | | | | | | | |
| 530,000 | | | Bank of Montreal(d) | | | 3.80% | | | 12/15/2032 | | | | 581,112 | |
| 270,000 | | | CCL Industries, Inc.(e) | | | 3.05% | | | 06/01/2030 | | | | 283,269 | |
| 245,000 | | | CI Financial Corp. | | | 4.10% | | | 06/15/2051 | | | | 263,866 | |
| 220,000 | | | Eldorado Gold Corp.(e) | | | 6.25% | | | 09/01/2029 | | | | 218,338 | |
| 350,000 | | | Enbridge, Inc. | | | 3.40% | | | 08/01/2051 | | | | 353,382 | |
| 850,000 | | | Frontera Energy Corp.(e) | | | 7.88% | | | 06/21/2028 | | | | 825,562 | |
| 225,000 | | | Garda World Security Corp.(e) | | | 6.00% | | | 06/01/2029 | | | | 220,762 | |
| 200,000 | | | GFL Environmental, Inc.(e) | | | 4.00% | | | 08/01/2028 | | | | 198,750 | |
| 600,000 | | | Gran Tierra Energy, Inc.(e) | | | 7.75% | | | 05/23/2027 | | | | 520,884 | |
| 160,000 | | | Kronos Acquisition Holdings, Inc. / KIK Custom Products, Inc.(e) | | | 5.00% | | | 12/31/2026 | | | | 160,000 | |
See Notes to Financial Statements. | |
32 | (888) 848-7569 | www.rivernorth.com |
RiverNorth/DoubleLine Strategic Income Fund | Schedule of Investments |
| September 30, 2021 |
Principal Amount/Description | | Rate | | Maturity | | | Value | |
$ | 1,430,000 | | | Kronos Acquisition Holdings, Inc. / KIK Custom Products, Inc.(e) | | | 7.00% | | | 12/31/2027 | | | $ | 1,372,586 | |
| 205,000 | | | Mattamy Group Corp.(e) | | | 4.63% | | | 03/01/2030 | | | | 209,832 | |
| 160,000 | | | MEG Energy Corp.(e) | | | 7.13% | | | 02/01/2027 | | | | 168,192 | |
| 25,000 | | | MEG Energy Corp.(e) | | | 5.88% | | | 02/01/2029 | | | | 25,605 | |
| 745,000 | | | Nutrien, Ltd. | | | 4.20% | | | 04/01/2029 | | | | 849,018 | |
| 185,000 | | | Parkland Corp.(e) | | | 5.88% | | | 07/15/2027 | | | | 196,331 | |
| 155,000 | | | Parkland Corp.(e) | | | 4.50% | | | 10/01/2029 | | | | 157,302 | |
| 420,000 | | | Superior Plus LP / Superior General Partner, Inc.(e) | | | 4.50% | | | 03/15/2029 | | | | 434,175 | |
| 240,000 | | | Telesat Canada / Telesat LLC(e) | | | 5.63% | | | 12/06/2026 | | | | 230,708 | |
| 496,000 | | | Tervita Corp.(e) | | | 11.00% | | | 12/01/2025 | | | | 562,094 | |
| 750,000 | | | TransCanada PipeLines, Ltd. | | | 4.25% | | | 05/15/2028 | | | | 854,430 | |
| | | | | | | | | | | | | | 8,686,198 | |
Cayman Islands - 0.24% | | | | | | | | | | | |
| 200,000 | | | Banco Mercantil del Norte SA/Grand Cayman(d)(e)(h) | | | 7.50% | | | 06/27/2029 | | | | 223,280 | |
| 200,000 | | | Banco Mercantil del Norte SA/Grand Cayman(c)(d)(h) | | | 7.63% | | | 01/10/2028 | | | | 223,325 | |
| 300,000 | | | Banco Mercantil del Norte SA/Grand Cayman(d)(h) | | | 10Y US TI + 5.47% | | | 06/27/2029 | | | | 334,920 | |
| 500,000 | | | CK Hutchison Capital Securities 17, Ltd.(c)(d)(h) | | | 4.00% | | | 05/12/2022 | | | | 507,995 | |
| 166,440 | | | Global Aircraft Leasing Co., Ltd.(e)(g) | | | 6.50% (7.25%) | | | 09/15/2024 | | | | 163,735 | |
| 624,000 | | | Gran Tierra Energy International Holdings, Ltd. | | | 6.25% | | | 02/15/2025 | | | | 540,787 | |
| 590,824 | | | Interoceanica IV Finance, Ltd.(i) | | | 0.00% | | | 11/30/2025 | | | | 553,159 | |
| 400,000 | | | Itau Unibanco Holding SA Island(d)(e)(h) | | | 4.63% | | | 02/27/2025 | | | | 382,912 | |
| 200,000 | | | Itau Unibanco Holding SA Island(c)(d) | | | 5Y US TI + 3.88% | | | 04/15/2031 | | | | 194,155 | |
| 200,000 | | | Itau Unibanco Holding SA Island(c)(d)(h) | | | 5Y US TI + 6.13% | | | 12/12/2022 | | | | 202,017 | |
| 950,000 | | | Itau Unibanco Holding SA Island(c)(d)(h) | | | 5Y US TI + 4.63% | | | 02/27/2025 | | | | 909,416 | |
| 152,069 | | | Lima Metro Line 2 Finance, Ltd.(e) | | | 5.88% | | | 07/05/2034 | | | | 178,184 | |
| 200,000 | | | SA Global Sukuk, Ltd.(e) | | | 2.69% | | | 06/17/2031 | | | | 202,083 | |
| 260,000 | | | Transocean Poseidon, Ltd.(e) | | | 6.88% | | | 02/01/2027 | | | | 259,104 | |
| | | | | | | | | | | | | | 4,875,072 | |
Chile - 0.30% | | | | | | | | | | | |
| 600,000 | | | AES Andes SA(d)(e) | | | 6.35% | | | 10/07/2079 | | | | 635,799 | |
| 500,000 | | | AES Andes SA | | | 7.13% | | | 03/26/2079 | | | | 531,540 | |
| 400,000 | | | AES Andes SA(c)(d) | | | 6.35% | | | 10/07/2079 | | | | 423,866 | |
| 200,000 | | | Antofagasta PLC(c) | | | 2.38% | | | 10/14/2030 | | | | 193,252 | |
| 200,000 | | | CAP SA(e) | | | 3.90% | | | 04/27/2031 | | | | 195,750 | |
See Notes to Financial Statements. | |
Annual Report | September 30, 2021 | 33 |
RiverNorth/DoubleLine Strategic Income Fund | Schedule of Investments |
| September 30, 2021 |
Principal Amount/Description | | Rate | | Maturity | | | Value | |
$ | 900,000 | | | Empresa de Transporte de Pasajeros Metro SA(e) | | | 5.00% | | | 01/25/2047 | | | $ | 1,078,326 | |
| 340,720 | | | Empresa Electrica Cochrane SpA(c) | | | 5.50% | | | 05/14/2027 | | | | 349,727 | |
| 600,000 | | | Geopark, Ltd. | | | 6.50% | | | 09/21/2024 | | | | 616,635 | |
| 423,540 | | | GNL Quintero SA(c) | | | 4.63% | | | 07/31/2029 | | | | 459,016 | |
| 1,000,000 | | | Guacolda Energia SA(c) | | | 4.56% | | | 04/30/2025 | | | | 663,760 | |
| 750,000 | | | Transelec SA(c) | | | 3.88% | | | 01/12/2029 | | | | 814,680 | |
| 200,000 | | | VTR Finance NV(c) | | | 6.38% | | | 07/15/2028 | | | | 215,873 | |
| | | | | | | | | | | | | | 6,178,224 | |
| China - 0.16% | | | | | | | | | | | |
| 300,000 | | | Agile Group Holdings, Ltd.(h) | | | 7.88% | | | 07/31/2024 | | | | 273,375 | |
| 495,000 | | | Agile Group Holdings, Ltd.(d)(h) | | | 7.75% | | | 05/25/2025 | | | | 447,301 | |
| 200,000 | | | Agile Group Holdings, Ltd.(d)(h) | | | 6.88% | | | 03/07/2023 | | | | 182,176 | |
| 200,000 | | | Baidu, Inc. | | | 3.43% | | | 04/07/2030 | | | | 212,336 | |
| 200,000 | | | Central China Real Estate, Ltd. | | | 7.25% | | | 04/24/2023 | | | | 133,000 | |
| 700,000 | | | Central China Real Estate, Ltd. | | | 7.25% | | | 07/16/2024 | | | | 431,043 | |
| 200,000 | | | Logan Group Co., Ltd.(d)(h) | | | 5Y US TI + 6.00% | | | 05/31/2022 | | | | 197,060 | |
| 400,000 | | | Ronshine China Holdings, Ltd. | | | 7.35% | | | 12/15/2023 | | | | 288,531 | |
| 600,000 | | | Ronshine China Holdings, Ltd. | | | 6.75% | | | 08/05/2024 | | | | 409,429 | |
| 350,000 | | | Yuzhou Group Holdings Co., Ltd. | | | 8.30% | | | 05/27/2025 | | | | 258,298 | |
| 600,000 | | | Yuzhou Group Holdings Co., Ltd. | | | 7.38% | | | 01/13/2026 | | | | 398,396 | |
| | | | | | | | | | | | | | 3,230,945 | |
| Colombia - 0.22% | | | | | | | | | | | |
| | | | | | | | | | | | | | | |
| 23,333 | | | Alpha Capital SAS / AlphaDebit S.A. de C.V(e)(g) | | | 10.00% (0.00%) | | | 02/01/2022 | | | | 23,333 | |
| 450,000 | | | Banco Davivienda SA(d)(e)(h) | | | 10Y US TI + 5.10% | | | 04/22/2031 | | | | 480,958 | |
| 650,000 | | | Banco GNB Sudameris SA(d)(e) | | | 5Y US TI + 6.66% | | | 04/16/2031 | | | | 663,780 | |
| 391,000 | | | Banco GNB Sudameris SA(c)(d) | | | 5Y US TI + 4.56% | | | 04/03/2027 | | | | 390,982 | |
| 350,000 | | | Credivalores-Crediservicios SAS(e) | | | 8.88% | | | 02/07/2025 | | | | 286,680 | |
| 200,000 | | | Credivalores-Crediservicios SAS(c) | | | 9.75% | | | 07/27/2022 | | | | 189,475 | |
| 400,000 | | | Credivalores-Crediservicios SAS(c) | | | 8.88% | | | 02/07/2025 | | | | 327,634 | |
| | | | | | | | | | | | | | | |
| 400,000 | | | Empresas Publicas de Medellin ESP(c) | | | 4.25% | | | 07/18/2029 | | | | 398,800 | |
| 700,000 | | | Empresas Publicas de Medellin ESP(c) | | | 4.38% | | | 02/15/2031 | | | | 693,245 | |
| 150,000 | | | Gilex Holding SARL(e) | | | 8.50% | | | 05/02/2023 | | | | 153,027 | |
| 750,000 | | | Gilex Holding SARL | | | 8.50% | | | 05/02/2023 | | | | 765,135 | |
| 200,000 | | | Oleoducto Central SA(c) | | | 4.00% | | | 07/14/2027 | | | | 206,250 | |
| | | | | | | | | | | | | | 4,579,299 | |
| Cyprus - 0.03% | | | | | | | | | | |
| 600,000 | | | Interpipe Holdings PLC(e) | | | 8.38% | | | 05/13/2026 | | | | 591,717 | |
| France - 0.05% | | | | | | | | | | | |
| 725,000 | | | BNP Paribas SA(d)(e) | | | 1D SOFR + 1.51% | | | 01/13/2031 | | | | 759,917 | |
| 340,000 | | | BPCE SA(e) | | | 1.00% | | | 01/20/2026 | | | | 334,675 | |
| | | | | | | | | | | | | | 1,094,592 | |
See Notes to Financial Statements. | |
34 | (888) 848-7569 | www.rivernorth.com |
RiverNorth/DoubleLine Strategic Income Fund | Schedule of Investments |
Principal Amount/Description | | Rate | | Maturity | | | Value | |
Great Britain - 0.29% | | | | | | | | |
$ | 710,000 | | | Anglo American Capital PLC(e) | | 4.50% | | 03/15/2028 | | $ | 801,172 | |
| 765,000 | | | Barclays PLC(d) | | 3M US L + 1.38% | | 05/16/2024 | | | 778,383 | |
| 430,000 | | | Credit Agricole SA/London(e) | | 3.75% | | 04/24/2023 | | | 452,390 | |
| 930,000 | | | HSBC Holdings PLC(d) | | 3M US L + 1.38% | | 09/12/2026 | | | 960,603 | |
| 730,000 | | | Lloyds Banking Group PLC(d) | | 3M US L + 1.21% | | 11/07/2028 | | | 795,120 | |
| 535,000 | | | NatWest Markets PLC(e) | | 0.80% | | 08/12/2024 | | | 534,019 | |
| 500,000 | | | Tullow Oil PLC(e) | | 10.25% | | 05/15/2026 | | | 522,755 | |
| 450,000 | | | Vedanta Resources Finance II PLC(e) | | 9.25% | | 04/23/2026 | | | 429,374 | |
| 200,000 | | | Vedanta Resources Finance II PLC(c) | | 9.25% | | 04/23/2026 | | | 190,833 | |
| 480,000 | | | Weir Group PLC(e) | | 2.20% | | 05/13/2026 | | | 484,993 | |
| | | | | | | | | | | 5,949,642 | |
Hong Kong - 0.07% | | | | | | | | |
| 200,000 | | | Bangkok Bank PCL(d)(h) | | 5Y US TI + 4.73% | | 09/23/2025 | | | 208,250 | |
| 200,000 | | | Kasikornbank PCL(d)(h) | | 5Y US TI + 4.94% | | 10/14/2025 | | | 210,114 | |
| 400,000 | | | RKP Overseas Finance, Ltd.(h) | | 7.75% | | 11/18/2024 | | | 373,758 | |
| 600,000 | | | RKP Overseas Finance, Ltd.(h) | | 7.95% | | 02/17/2022 | | | 562,902 | |
| | | | | | | | | | | 1,355,024 | |
India - 0.10% | | | | | | | | |
| 200,000 | | | Adani International Container Terminal Pvt, Ltd.(c) | | 3.00% | | 02/16/2031 | | | 194,366 | |
| 200,000 | | | Adani Ports & Special Economic Zone, Ltd.(c) | | 4.38% | | 07/03/2029 | | | 210,540 | |
| 500,000 | | | Adani Ports & Special Economic Zone, Ltd. | | 3.10% | | 02/02/2031 | | | 478,509 | |
| 200,000 | | | JSW Hydro Energy, Ltd.(e) | | 4.13% | | 05/18/2031 | | | 198,908 | |
| 400,000 | | | Reliance Industries, Ltd.(c) | | 5.40% | | 02/14/2022 | | | 406,601 | |
| 200,000 | | | UltraTech Cement, Ltd.(c) | | 2.80% | | 02/16/2031 | | | 192,797 | |
| 400,000 | | | Vedanta Resources, Ltd.(c) | | 6.13% | | 08/09/2024 | | | 359,684 | |
| | | | | | | | | | | 2,041,405 | |
Indonesia - 0.06% | | | | | | | | |
| 500,000 | | | ABM Investama Tbk PT(e) | | 9.50% | | 08/05/2026 | | | 480,000 | |
| 300,000 | | | Pertamina Persero PT(c) | | 4.15% | | 02/25/2060 | | | 297,536 | |
| 500,000 | | | Perusahaan Perseroan Persero PT Perusahaan Listrik Negara(c) | | 5.50% | | 11/22/2021 | | | 502,830 | |
| | | | | | | | | | | 1,280,366 | |
Ireland - 0.03% | | | | | | | | |
| 575,000 | | | Avolon Holdings Funding, Ltd.(e) | | 3.25% | | 02/15/2027 | | | 593,307 | |
Israel - 0.05% | | | | | | | | |
| 900,000 | | | Israel Electric Corp., Ltd.(e) | | 5.00% | | 11/12/2024 | | | 999,144 | |
See Notes to Financial Statements. |
Annual Report | September 30, 2021 | 35 |
RiverNorth/DoubleLine Strategic Income Fund | Schedule of Investments |
Principal Amount/Description | | Rate | | Maturity | | | Value | |
Jamaica - 0.00%(j) | | | | | | | | |
$ | 65,316 | | | Digicel Group Holdings, Ltd.(e)(g) | | 8.00% (8.00%) | | 04/01/2025 | | $ | 58,240 | |
Japan - 0.04% | | | | | | | | | | | |
| 770,000 | | | Mitsubishi UFJ Financial Group, Inc. | | 1.41% | | 07/17/2025 | | | 774,774 | |
Luxembourg - 0.08% | | | | | | | | |
| 150,000 | | | Atento Luxco 1 SA(e) | | 8.00% | | 02/10/2026 | | | 164,442 | |
| 95,000 | | | Endo Luxembourg Finance Co. I SARL / Endo US, Inc.(e) | | 6.13% | | 04/01/2029 | | | 95,129 | |
| 700,000 | | | FS Luxembourg SARL(e) | | 10.00% | | 12/15/2025 | | | 770,315 | |
| 400,000 | | | JBS Finance Luxembourg Sarl(e) | | 3.63% | | 01/15/2032 | | | 408,004 | |
| 270,000 | | | Millicom International Cellular SA(c) | | 6.25% | | 03/25/2029 | | | 295,987 | |
| | | | | | | | | | | 1,733,877 | |
Malaysia - 0.07% | | | | | | | | |
| 400,000 | | | Malayan Banking Bhd(d) | | 3.91% | | 10/29/2026 | | | 401,616 | |
| 800,000 | | | Petronas Capital, Ltd.(e) | | 2.48% | | 01/28/2032 | | | 796,905 | |
| 200,000 | | | TNB Global Ventures Capital Bhd | | 3.24% | | 10/19/2026 | | | 212,804 | |
| | | | | | | | | | | 1,411,325 | |
Mexico - 0.34% | | | | | | | | |
| 700,000 | | | Alpha Holding SA de CV(e) | | 9.00% | | 02/10/2025 | | | 103,250 | |
| 200,000 | | | Alpha Holding SA de CV(c) | | 9.00% | | 02/10/2025 | | | 29,500 | |
| 500,000 | | | Banco Santander Mexico SA Institucion de Banca Multiple Grupo Financiero Santand(d)(h) | | 8.50% | | 01/20/2022 | | | 513,125 | |
| 200,000 | | | BBVA Bancomer SA(c)(d) | | 5.13% | | 01/18/2033 | | | 208,779 | |
| 300,000 | | | Braskem Idesa SAPI(c) | | 7.45% | | 11/15/2029 | | | 318,556 | |
| 500,000 | | | Credito Real SAB de CV SOFOM ER(c) | | 9.50% | | 02/07/2026 | | | 459,713 | |
| 950,000 | | | Credito Real SAB de CV SOFOM ER(c)(d)(h) | | 9.13% | | 11/29/2022 | | | 686,660 | |
| 350,000 | | | Grupo Axo SAPI de CV(e) | | 5.75% | | 06/08/2026 | | | 359,273 | |
| 800,000 | | | Mexarrend SAPI de CV(e) | | 10.25% | | 07/24/2024 | | | 767,300 | |
| 200,000 | | | Mexarrend SAPI de CV(c) | | 10.25% | | 07/24/2024 | | | 191,825 | |
| 700,000 | | | Operadora de Servicios Mega SA de CV Sofom ER(e) | | 8.25% | | 02/11/2025 | | | 706,443 | |
| 750,000 | | | Petroleos Mexicanos | | 6.38% | | 01/23/2045 | | | 638,854 | |
| 350,000 | | | Petroleos Mexicanos | | 6.75% | | 09/21/2047 | | | 305,795 | |
| 400,000 | | | Sixsigma Networks Mexico SA de CV | | 7.50% | | 05/02/2025 | | | 389,658 | |
| 200,000 | | | TV Azteca SAB de CV(f) | | 8.25% | | 08/09/2024 | | | 120,500 | |
| 200,000 | | | Unifin Financiera SAB de CV(c) | | 7.38% | | 02/12/2026 | | | 190,916 | |
| 1,200,000 | | | Unifin Financiera SAB de CV(c)(d)(h) | | 8.88% | | 01/29/2025 | | | 916,584 | |
| | | | | | | | | | | 6,906,731 | |
See Notes to Financial Statements.
36 | (888) 848-7569 | www.rivernorth.com |
RiverNorth/DoubleLine Strategic Income Fund | Schedule of Investments |
Principal Amount/Description | | Rate | | Maturity | | | Value | |
Netherlands - 0.31% | | | | | | | | |
$ | 700,000 | | | Braskem Netherlands Finance BV | | 5.88% | | 01/31/2050 | | $ | 797,125 | |
| 185,000 | | | Diamond BC BV(e) | | 4.63% | | 10/01/2029 | | | 188,009 | |
| 400,000 | | | Equate Petrochemical BV(c) | | 2.63% | | 04/28/2028 | | | 403,249 | |
| 650,000 | | | Jababeka International BV(c) | | 6.50% | | 10/05/2023 | | | 629,546 | |
| 400,000 | | | Metinvest BV(c) | | 7.75% | | 10/17/2029 | | | 434,696 | |
| 200,000 | | | Minejesa Capital BV | | 4.63% | | 08/10/2030 | | | 207,672 | |
| 1,200,000 | | | Minejesa Capital BV | | 5.63% | | 08/10/2037 | | | 1,269,300 | |
| 500,000 | | | NGD Holdings BV | | 6.75% | | 12/31/2026 | | | 485,850 | |
| 420,000 | | | NXP BV / NXP Funding LLC / NXP USA, Inc.(e) | | 3.88% | | 06/18/2026 | | | 462,938 | |
| 600,000 | | | Petrobras Global Finance BV | | 6.90% | | 03/19/2049 | | | 669,165 | |
| 200,000 | | | Petrobras Global Finance BV | | 6.75% | | 06/03/2050 | | | 217,715 | |
| 600,000 | | | Petrobras Global Finance BV | | 5.50% | | 06/10/2051 | | | 559,350 | |
| | | | | | | | | | | 6,324,615 | |
Panama - 0.11% | | | | | | | | |
| 200,000 | | | AES Panama Generation Holdings SRL(e) | | 4.38% | | 05/31/2030 | | | 206,450 | |
| 200,000 | | | AES Panama Generation Holdings SRL(c) | | 4.38% | | 05/31/2030 | | | 206,450 | |
| 400,000 | | | Banco General SA(d)(e)(h) | | 10Y US TI + 3.67% | | 05/07/2031 | | | 405,004 | |
| 200,000 | | | Multibank, Inc.(c) | | 4.38% | | 11/09/2022 | | | 203,552 | |
| 887,374 | | | UEP Penonome II SA(e) | | 6.50% | | 10/01/2038 | | | 929,098 | |
| 197,194 | | | UEP Penonome II SA(c) | | 6.50% | | 10/01/2038 | | | 206,466 | |
| | | | | | | | | | | 2,157,020 | |
Paraguay - 0.04% | | | | | | | | |
| 700,000 | | | Frigorifico Concepcion SA(e) | | 7.70% | | 07/21/2028 | | | 725,536 | |
Peru - 0.24% | | | | | | | | |
| 400,000 | | | Banco de Credito del Peru(c)(d) | | 5Y US TI + 3.13% | | 07/01/2030 | | | 396,500 | |
| 750,000 | | | Banco Internacional del Peru SAA Interbank(d) | | 1Y US TI + 3.71% | | 07/08/2030 | | | 751,388 | |
| 300,000 | | | Camposol SA(e) | | 6.00% | | 02/03/2027 | | | 310,275 | |
| 600,000 | | | Camposol SA(c) | | 6.00% | | 02/03/2027 | | | 620,550 | |
| 500,000 | | | Cia de Minas Buenaventura SAA(e) | | 5.50% | | 07/23/2026 | | | 494,965 | |
| 600,000 | | | Hunt Oil Co. of Peru LLC Sucursal Del Peru(c) | | 6.38% | | 06/01/2028 | | | 603,408 | |
| 500,000 | | | Inkia Energy, Ltd.(c) | | 5.88% | | 11/09/2027 | | | 521,075 | |
| 1,450,000 | | | Peru LNG Srl(c) | | 5.38% | | 03/22/2030 | | | 1,177,204 | |
| | | | | | | | | | | 4,875,365 | |
Singapore - 0.35% | | | | | | | | |
| 715,000 | | | BOC Aviation, Ltd.(d)(e) | | 3M US L + 1.13% | | 09/26/2023 | | | 717,520 | |
| 200,000 | | | DBS Group Holdings, Ltd.(d) | | 5Y US TI + 1.82% | | 03/10/2031 | | | 199,203 | |
| 200,000 | | | DBS Group Holdings, Ltd.(d)(h) | | 5Y US TI + 1.92% | | 02/27/2025 | | | 205,614 | |
| 400,000 | | | Indika Energy Capital III Pte, Ltd.(c) | | 5.88% | | 11/09/2024 | | | 403,768 | |
| 200,000 | | | Medco Bell Pte, Ltd.(e) | | 6.38% | | 01/30/2027 | | | 202,004 | |
See Notes to Financial Statements. |
Annual Report | September 30, 2021 | 37 |
RiverNorth/DoubleLine Strategic Income Fund | Schedule of Investments |
Principal Amount/Description | | Rate | | Maturity | | | Value | |
$ | 200,000 | | | ONGC Videsh Vankorneft Pte, Ltd. | | 3.75% | | 07/27/2026 | | $ | 211,234 | |
| 700,000 | | | Oversea-Chinese Banking Corp., Ltd.(d)(e) | | 5Y US TI + 1.58% | | 09/10/2030 | | | 698,901 | |
| 700,000 | | | PSA Treasury Pte, Ltd. | | 2.25% | | 04/30/2030 | | | 715,181 | |
| 200,000 | | | PSA Treasury Pte, Ltd. | | 2.13% | | 09/05/2029 | | | 202,296 | |
| 600,000 | | | Singtel Group Treasury | | 1.88% | | 06/10/2030 | | | 589,096 | |
| 800,000 | | | TBLA International Pte, Ltd. | | 7.00% | | 01/24/2023 | | | 783,524 | |
| 350,000 | | | Temasek Financial I, Ltd.(e) | | 1.00% | | 10/06/2030 | | | 325,977 | |
| 250,000 | | | Temasek Financial I, Ltd.(c) | | 1.00% | | 10/06/2030 | | | 232,840 | |
| 400,000 | | | Theta Capital Pte, Ltd. | | 8.13% | | 01/22/2025 | | | 416,944 | |
| 500,000 | | | Theta Capital Pte, Ltd. | | 6.75% | | 10/31/2026 | | | 494,990 | |
| 700,000 | | | United Overseas Bank, Ltd.(d) | | 5Y US TI + 1.75% | | 03/16/2031 | | | 695,152 | |
| | | | | | | | | | | 7,094,244 | |
South Korea - 0.13% | | | | | | | | |
| 200,000 | | | Korea East-West Power Co., Ltd.(e) | | 1.75% | | 05/06/2025 | | | 203,521 | |
| 400,000 | | | Korea East-West Power Co., Ltd. | | 1.75% | | 05/06/2025 | | | 407,042 | |
| 500,000 | | | Korea Electric Power Corp.(c) | | 1.13% | | 06/15/2025 | | | 497,775 | |
| 400,000 | | | Korea Hydro & Nuclear Power Co., Ltd.(e) | | 1.25% | | 04/27/2026 | | | 396,792 | |
| 200,000 | | | KT Corp. | | 1.00% | | 09/01/2025 | | | 197,771 | |
| 200,000 | | | KT Corp.(c) | | 2.50% | | 07/18/2026 | | | 209,457 | |
| 200,000 | | | LG Chem, Ltd.(e) | | 2.38% | | 07/07/2031 | | | 197,176 | |
| 200,000 | | | NongHyup Bank(e) | | 1.25% | | 07/20/2025 | | | 199,385 | |
| 200,000 | | | POSCO | | 2.38% | | 01/17/2023 | | | 204,102 | |
| 200,000 | | | Shinhan Financial Group Co., Ltd.(d)(e)(h) | | 5Y US TI + 2.06% | | 05/12/2026 | | | 198,758 | |
| | | | | | | | | | | 2,711,779 | |
Spain - 0.07% | | | | | | | | |
| 700,000 | | | AES Andres BV(e) | | 5.70% | | 05/04/2028 | | | 723,551 | |
| 250,000 | | | AI Candelaria Spain SLU(e) | | 5.75% | | 06/15/2033 | | | 248,874 | |
| 550,000 | | | AI Candelaria Spain SLU(c) | | 5.75% | | 06/15/2033 | | | 547,522 | |
| | | | | | | | | | | 1,519,947 | |
Switzerland - 0.04% | | | | | | | | |
| 865,000 | | | Credit Suisse Group AG(d)(e) | | 1D SOFR + 0.98% | | 02/02/2027 | | | 846,192 | |
Thailand - 0.01% | | | | | | | | |
| 200,000 | | | PTTEP Treasury Center Co., Ltd.(e) | | 2.59% | | 06/10/2027 | | | 207,308 | |
Trinidad and Tobago - 0.01% | | | | | | | | |
| 200,000 | | | Telecommunications Services of Trinidad & Tobago, Ltd.(c) | | 8.88% | | 10/18/2029 | | | 213,901 | |
See Notes to Financial Statements.
38 | (888) 848-7569 | www.rivernorth.com |
RiverNorth/DoubleLine Strategic Income Fund | Schedule of Investments |
Principal Amount/Description | | Rate | | Maturity | | | Value | |
United Arab Emirates - 0.04% | | | | | | | | |
$ | 300,000 | | | Galaxy Pipeline Assets Bidco, Ltd.(e) | | 2.16% | | 03/31/2034 | | $ | 295,282 | |
| 500,000 | | | Galaxy Pipeline Assets Bidco, Ltd.(c) | | 2.63% | | 03/31/2036 | | | 493,400 | |
| | | | | | | | | | | 788,682 | |
TOTAL FOREIGN CORPORATE BONDS | | | | | | | | |
(Cost $91,059,536) | | | | | | | 90,684,033 | |
Principal Amount/Description | | Rate | | Maturity | | | Value | |
U.S. CORPORATE BONDS - 7.10% | | | | | | | | |
Advertising - 0.05% | | | | | | | | |
| 130,000 | | | Clear Channel Outdoor Holdings, Inc.(e) | | 7.50% | | 06/01/2029 | | | 135,362 | |
| 535,000 | | | Interpublic Group of Cos., Inc. | | 5.40% | | 10/01/2048 | | | 721,942 | |
| 185,000 | | | Omnicom Group, Inc. | | 2.60% | | 08/01/2031 | | | 188,248 | |
| | | | | | | | | | | 1,045,552 | |
Aerospace/Defense - 0.17% | | | | | | | | |
| 445,000 | | | Boeing Co. | | 2.95% | | 02/01/2030 | | | 454,027 | |
| 525,000 | | | Northrop Grumman Corp. | | 5.15% | | 05/01/2040 | | | 684,418 | |
| 420,000 | | | Teledyne Technologies, Inc. | | 2.25% | | 04/01/2028 | | | 428,017 | |
| 30,000 | | | TransDigm, Inc.(e) | | 8.00% | | 12/15/2025 | | | 32,025 | |
| 220,000 | | | TransDigm, Inc.(e) | | 6.25% | | 03/15/2026 | | | 229,625 | |
| 135,000 | | | TransDigm, Inc. | | 5.50% | | 11/15/2027 | | | 138,890 | |
| 1,115,000 | | | Triumph Group, Inc.(e) | | 6.25% | | 09/15/2024 | | | 1,116,098 | |
| 390,000 | | | Triumph Group, Inc. | | 7.75% | | 08/15/2025 | | | 386,309 | |
| | | | | | | | | | | 3,469,409 | |
Agriculture - 0.08% | | | | | | | | |
| 890,000 | | | BAT Capital Corp. | | 3.46% | | 09/06/2029 | | | 937,999 | |
| 420,000 | | | Bunge, Ltd. Finance Corp. | | 2.75% | | 05/14/2031 | | | 425,879 | |
| 321,693 | | | Pyxus Holdings, Inc. | | 10.00% | | 08/24/2024 | | | 280,524 | |
| | | | | | | | | | | 1,644,402 | |
Airlines - 0.09% | | | | | | | | |
| 660,000 | | | American Airlines, Inc./AAdvantage Loyalty IP, Ltd.(e) | | 5.75% | | 04/20/2029 | | | 711,975 | |
| 425,000 | | | Southwest Airlines Co. | | 4.75% | | 05/04/2023 | | | 452,549 | |
| 210,069 | | | United Airlines 2016-1 Class B Pass Through Trust | | 3.65% | | 01/07/2026 | | | 209,623 | |
| 355,000 | | | United Airlines, Inc.(e) | | 4.63% | | 04/15/2029 | | | 367,318 | |
| | | | | | | | | | | 1,741,465 | |
Auto Manufacturers - 0.16% | | | | | | | | |
| 650,000 | | | Ford Motor Credit Co. LLC(d) | | 3M US L + 1.24% | | 02/15/2023 | | | 647,723 | |
| 1,200,000 | | | General Motors Financial Co., Inc.(d) | | 3M US L + 0.99% | | 01/05/2023 | | | 1,212,021 | |
| 25,000 | | | General Motors Financial Co., Inc. | | 3.95% | | 04/13/2024 | | | 26,726 | |
See Notes to Financial Statements. |
Annual Report | September 30, 2021 | 39 |
RiverNorth/DoubleLine Strategic Income Fund | Schedule of Investments |
| September 30, 2021 |
Principal Amount/Description | | Rate | | | Maturity | | | Value |
$ | 705,000 | | | Hyundai Capital America(e) | | | | 2.65% | | | | 02/10/2025 | | | $ | 732,648 | |
165,000 | | | Hyundai Capital America(e) | | | | 1.80% | | | | 10/15/2025 | | | | 166,692 | |
355,000 | | | Volkswagen Group of America Finance LLC(e) | | | | 4.25% | | | | 11/13/2023 | | | | 380,831 | |
| | | | | | | | | | | | | | | 3,166,641 | |
Auto Parts & Equipment - 0.14% | | | | | | | | | | | | | |
275,000 | | | American Axle & Manufacturing, Inc. | | | | 5.00% | | | | 10/01/2029 | | | | 267,987 | |
94,000 | | | Clarios Global LP / Clarios US Finance Co.(e) | | | | 6.25% | | | | 05/15/2026 | | | | 98,879 | |
1,005,000 | | | Dealer Tire LLC / DT Issuer LLC(e) | | | | 8.00% | | | | 02/01/2028 | | | | 1,053,795 | |
200,000 | | | Goodyear Tire & Rubber Co.(e) | | | | 5.25% | | | | 07/15/2031 | | | | 213,250 | |
1,179,000 | | | Wheel Pros, Inc.(e) | | | | 6.50% | | | | 05/15/2029 | | | | 1,142,162 | |
| | | | | | | | | | | | | | | 2,776,073 | |
Banks - 0.32% | | | | | | | | | | | | | |
310,000 | | | Bank of America Corp.(d) | | | | 1D SOFR + 1.73% | | | | 07/22/2027 | | | | 311,481 | |
800,000 | | | Bank of America Corp.(d) | | | | 5Y US TI + 2.48% | | | | 09/21/2036 | | | | 784,543 | |
965,000 | | | Citigroup, Inc.(d) | | | | 3M US L + 1.10% | | | | 05/17/2024 | | | | 980,057 | |
995,000 | | | Goldman Sachs Group, Inc.(d) | | | | 3M US L + 1.17% | | | | 05/15/2026 | | | | 1,020,831 | |
315,000 | | | Goldman Sachs Group, Inc.(d) | | | | 1D SOFR + 0.82% | | | | 09/10/2027 | | | | 315,746 | |
320,000 | | | JPMorgan Chase & Co.(d) | | | | 1D SOFR + 1.02% | | | | 06/01/2029 | | | | 320,917 | |
500,000 | | | JPMorgan Chase & Co.(d) | | | | 1D SOFR + 2.04% | | | | 04/22/2031 | | | | 510,391 | |
350,000 | | | JPMorgan Chase & Co.(d) | | | | 1D SOFR + 1.25% | | | | 04/22/2032 | | | | 355,114 | |
295,000 | | | Morgan Stanley(d) | | | | 1D SOFR + 0.53% | | | | 05/30/2025 | | | | 294,195 | |
810,000 | | | Morgan Stanley(d) | | | | 1D SOFR + 2.48% | | | | 09/16/2036 | | | | 793,199 | |
370,000 | | | Wells Fargo & Co.(d) | | | | 3M US L + 1.17% | | | | 06/17/2027 | | | | 397,346 | |
390,000 | | | Wells Fargo & Co.(d) | | | | 1D US SOFR + 1.43% | | | | 10/30/2030 | | | | 407,518 | |
| | | | | | | | | | | | | | | 6,491,338 | |
Beverages - 0.17% | | | | | | | | | | | | | |
785,000 | | | Anheuser-Busch InBev Worldwide, Inc. | | | | 4.60% | | | | 04/15/2048 | | | | 938,875 | |
250,000 | | | Constellation Brands, Inc. | | | | 3.15% | | | | 08/01/2029 | | | | 267,508 | |
135,000 | | | Constellation Brands, Inc. | | | | 2.88% | | | | 05/01/2030 | | | | 140,595 | |
400,000 | | | Keurig Dr Pepper, Inc. | | | | 3.80% | | | | 05/01/2050 | | | | 448,993 | |
150,000 | | | Primo Water Holdings, Inc.(e) | | | | 4.38% | | | | 04/30/2029 | | | | 149,791 | |
1,450,000 | | | Triton Water Holdings, Inc.(e) | | | | 6.25% | | | | 04/01/2029 | | | | 1,475,375 | |
| | | | | | | | | | | | | | | 3,421,137 | |
Biotechnology - 0.04% | | | | | | | | | | | | | |
340,000 | | | Illumina, Inc. | | | | 0.55% | | | | 03/23/2023 | | | | 340,094 | |
425,000 | | | Royalty Pharma PLC | | | | 3.30% | | | | 09/02/2040 | | | | 424,351 | |
| | | | | | | | | | | | | | | 764,445 | |
Building Materials - 0.06% | | | | | | | | | | | | | |
220,000 | | | Builders FirstSource, Inc.(e) | | | | 4.25% | | | | 02/01/2032 | | | | 225,225 | |
460,000 | | | Carrier Global Corp. | | | | 3.38% | | | | 04/05/2040 | | | | 483,307 | |
130,000 | | | Griffon Corp. | | | | 5.75% | | | | 03/01/2028 | | | | 136,662 | |
See Notes to Financial Statements. | |
40 | (888) 848-7569 | www.rivernorth.com |
RiverNorth/DoubleLine Strategic Income Fund | Schedule of Investments |
| September 30, 2021 |
| | |
Principal Amount/Description | | Rate | | | Maturity | | | Value |
$ | 375,000 | | | Owens Corning | | | | 4.40% | | | | 01/30/2048 | | | $ | 439,662 | |
| | | | | | | | | | | | | | | 1,284,856 | |
Chemicals - 0.08% | | | | | | | | | | | | | |
100,000 | | | CVR Partners LP / CVR Nitrogen Finance Corp.(e) | | | | 6.13% | | | | 06/15/2028 | | | | 105,000 | |
780,000 | | | Illuminate Buyer LLC / Illuminate Holdings IV, Inc.(e) | | | | 9.00% | | | | 07/01/2028 | | | | 860,976 | |
215,000 | | | Kraton Polymers LLC / Kraton Polymers Capital Corp.(e) | | | | 4.25% | | | | 12/15/2025 | | | | 224,944 | |
45,000 | | | SCIH Salt Holdings, Inc.(e) | | | | 6.63% | | | | 05/01/2029 | | | | 43,257 | |
130,000 | | | Unifrax Escrow Issuer Corp.(e) | | | | 7.50% | | | | 09/30/2029 | | | | 133,382 | |
190,000 | | | WR Grace Holdings LLC(e) | | | | 5.63% | | | | 08/15/2029 | | | | 196,177 | |
| | | | | | | | | | | | | | | 1,563,736 | |
Coal - 0.01% | | | | | | | | | | | | | |
47,492 | | | Peabody Energy Corp.(e)(g) | | | | 8.50% (8.50%) | | | | 12/31/2024 | | | | 42,030 | |
180,000 | | | SunCoke Energy, Inc.(e) | | | | 4.88% | | | | 06/30/2029 | | | | 179,550 | |
| | | | | | | | | | | | | | | 221,580 | |
Commercial Services - 0.08% | | | | | | | | | | | | | |
90,000 | | | Allied Universal Holdco LLC / Allied Universal Finance Corp.(e) | | | | 6.63% | | | | 07/15/2026 | | | | 95,268 | |
175,000 | | | Allied Universal Holdco LLC / Allied Universal Finance Corp.(e) | | | | 9.75% | | | | 07/15/2027 | | | | 190,614 | |
145,000 | | | Metis Merger Sub LLC(e) | | | | 6.50% | | | | 05/15/2029 | | | | 141,197 | |
120,000 | | | NESCO Holdings II, Inc.(e) | | | | 5.50% | | | | 04/15/2029 | | | | 124,614 | |
335,000 | | | Sabre GLBL, Inc.(e) | | | | 7.38% | | | | 09/01/2025 | | | | 357,462 | |
175,000 | | | Triton Container International, Ltd.(e) | | | | 1.15% | | | | 06/07/2024 | | | | 174,779 | |
510,000 | | | WASH Multifamily Acquisition, Inc.(e) | | | | 5.75% | | | | 04/15/2026 | | | | 533,192 | |
| | | | | | | | | | | | | | | 1,617,126 | |
Computers - 0.16% | | | | | | | | | | | | | |
700,000 | | | Austin BidCo, Inc.(e) | | | | 7.13% | | | | 12/15/2028 | | | | 706,213 | |
770,000 | | | Dell International LLC / EMC Corp. | | | | 5.30% | | | | 10/01/2029 | | | | 931,693 | |
780,000 | | | Flexential Intermediate Corp.(e) | | | | 11.25% | | | | 08/01/2024 | | | | 845,621 | |
460,000 | | | Fortinet, Inc. | | | | 1.00% | | | | 03/15/2026 | | | | 453,452 | |
405,000 | | | NetApp, Inc. | | | | 1.88% | | | | 06/22/2025 | | | | 415,108 | |
| | | | | | | | | | | | | | | 3,352,087 | |
Containers and Packaging - 0.02% | | | | | | | | | | | | | |
400,000 | | | Packaging Corp. of America | | | | 3.40% | | | | 12/15/2027 | | | | 436,720 | |
| | | | | | | | | | | | | | |
Cosmetics/Personal Care - 0.01% | | | | | | | | | | | | | |
125,000 | | | Coty, Inc.(e) | | | | 6.50% | | | | 04/15/2026 | | | | 128,238 | |
See Notes to Financial Statements. | |
Annual Report | September 30, 2021 | 41 |
RiverNorth/DoubleLine Strategic Income Fund | Schedule of Investments |
| September 30, 2021 |
| | |
Principal Amount/Description | | Rate | | | Maturity | | | Value |
$ | 130,000 | | | Coty, Inc.(e) | | | | 5.00% | | | | 04/15/2026 | | | $ | 132,964 | |
| | | | | | | | | | | | | | | 261,202 | |
Distribution/Wholesale - 0.01% | | | | | | | | | | | | | |
193,000 | | | Wolverine Escrow LLC(e) | | | | 9.00% | | | | 11/15/2026 | | | | 178,525 | |
| | | | | | | | | | | | | | |
Diversified Financial Services - 0.32% | | | | | | | | | | | | | |
270,000 | | | Air Lease Corp. | | | | 1.88% | | | | 08/15/2026 | | | | 269,199 | |
835,000 | | | Air Methods Corp.(e) | | | | 8.00% | | | | 05/15/2025 | | | | 798,782 | |
440,000 | | | Aircastle, Ltd.(e) | | | | 2.85% | | | | 01/26/2028 | | | | 445,918 | |
735,000 | | | Aviation Capital Group LLC(e) | | | | 1.95% | | | | 09/20/2026 | | | | 727,516 | |
240,000 | | | Blackstone Private Credit Fund(e) | | �� | | 2.63% | | | | 12/15/2026 | | | | 239,361 | |
55,000 | | | Coinbase Global, Inc.(e) | | | | 3.63% | | | | 10/01/2031 | | | | 52,353 | |
1,055,000 | | | Discover Financial Services | | | | 4.10% | | | | 02/09/2027 | | | | 1,175,909 | |
280,000 | | | Nationstar Mortgage Holdings, Inc.(e) | | | | 5.50% | | | | 08/15/2028 | | | | 288,779 | |
95,000 | | | Navient Corp. | | | | 5.00% | | | | 03/15/2027 | | | | 97,969 | |
120,000 | | | NFP Corp.(e) | | | | 6.88% | | | | 08/15/2028 | | | | 122,689 | |
245,000 | | | OneMain Finance Corp. | | | | 6.63% | | | | 01/15/2028 | | | | 282,056 | |
305,000 | | | PennyMac Financial Services, Inc.(e) | | | | 4.25% | | | | 02/15/2029 | | | | 290,836 | |
740,000 | | | Synchrony Financial | | | | 3.95% | | | | 12/01/2027 | | | | 816,860 | |
925,000 | | | Western Union Co. | | | | 2.75% | | | | 03/15/2031 | | | | 927,331 | |
| | | | | | | | | | | | | | | 6,535,558 | |
Electric - 0.52% | | | | | | | | | | | | | |
155,000 | | | Calpine Corp.(e) | | | | 5.13% | | | | 03/15/2028 | | | | 157,167 | |
35,000 | | | Calpine Corp.(e) | | | | 4.63% | | | | 02/01/2029 | | | | 34,519 | |
580,000 | | | Duke Energy Corp. | | | | 3.95% | | | | 08/15/2047 | | | | 641,446 | |
175,000 | | | Entergy Corp. | | | | 2.80% | | | | 06/15/2030 | | | | 180,712 | |
475,000 | | | Eversource Energy | | | | 1.65% | | | | 08/15/2030 | | | | 451,704 | |
1,000,000 | | | Exelon Corp. | | | | 4.05% | | | | 04/15/2030 | | | | 1,133,954 | |
485,000 | | | General Electric Co. | | | | 5.88% | | | | 01/14/2038 | | | | 655,874 | |
420,000 | | | Georgia Power Co. | | | | 2.20% | | | | 09/15/2024 | | | | 436,640 | |
760,000 | | | Georgia Power Co. | | | | 3.25% | | | | 03/15/2051 | | | | 766,110 | |
1,100,000 | | | ITC Holdings Corp. | | | | 3.25% | | | | 06/30/2026 | | | | 1,187,716 | |
275,000 | | | Monongahela Power Co.(e) | | | | 5.40% | | | | 12/15/2043 | | | | 359,486 | |
300,000 | | | NextEra Energy Capital Holdings, Inc. | | | | 3.55% | | | | 05/01/2027 | | | | 329,325 | |
750,000 | | | NextEra Energy Capital Holdings, Inc. | | | | 2.25% | | | | 06/01/2030 | | | | 754,797 | |
215,000 | | | NRG Energy, Inc.(e) | | | | 2.00% | | | | 12/02/2025 | | | | 218,707 | |
215,000 | | | NRG Energy, Inc.(e) | | | | 3.63% | | | | 02/15/2031 | | | | 211,452 | |
375,000 | | | Pacific Gas and Electric Co. | | | | 1.37% | | | | 03/10/2023 | | | | 373,774 | |
465,000 | | | Pacific Gas and Electric Co. | | | | 2.50% | | | | 02/01/2031 | | | | 442,953 | |
65,000 | | | PG&E Corp. | | | | 5.00% | | | | 07/01/2028 | | | | 66,300 | |
320,000 | | | Pike Corp.(e) | | | | 5.50% | | | | 09/01/2028 | | | | 326,523 | |
445,000 | | | PSEG Power LLC | | | | 3.85% | | | | 06/01/2023 | | | | 468,260 | |
See Notes to Financial Statements. | |
42 | (888) 848-7569 | www.rivernorth.com |
RiverNorth/DoubleLine Strategic Income Fund | Schedule of Investments |
Principal Amount/Description | | Rate | | | Maturity | | | Value |
$ | 270,000 | | | Southern Co.(d) | | | | 5Y US TI + 2.915% | | | | 09/15/2051 | | | $ | 275,751 | |
1,000,000 | | | Virginia Electric and Power Co. | | | | 3.50% | | | | 03/15/2027 | | | | 1,104,360 | |
| | | | | | | | | | | | | | | 10,577,530 | |
Electrical Components & Equipment - 0.01% | | | | | | | | | | | | | |
175,000 | | | Energizer Holdings, Inc.(e) | | | | 4.75% | | | | 06/15/2028 | | | | 178,245 | |
| | | | | | | | | | | | | | |
Electronics - 0.03% | | | | | | | | | | | | | |
365,000 | | | Arrow Electronics, Inc. | | | | 3.88% | | | | 01/12/2028 | | | | 394,635 | |
185,000 | | | Vontier Corp.(e) | | | | 2.40% | | | | 04/01/2028 | | | | 182,690 | |
| | | | | | | | | | | | | | | 577,325 | |
Entertainment - 0.19% | | | | | | | | | | | | | |
120,000 | | | Bally’s Corp.(e) | | | | 6.75% | | | | 06/01/2027 | | | | 130,800 | |
700,000 | | | Boyne USA, Inc.(e) | | | | 4.75% | | | | 05/15/2029 | | | | 723,625 | |
160,000 | | | Caesars Entertainment, Inc.(e) | | | | 6.25% | | | | 07/01/2025 | | | | 168,641 | |
665,000 | | | Cedar Fair LP | | | | 5.25% | | | | 07/15/2029 | | | | 682,829 | |
135,000 | | | Lions Gate Capital Holdings LLC(e) | | | | 5.50% | | | | 04/15/2029 | | | | 139,728 | |
150,000 | | | Live Nation Entertainment, Inc.(e) | | | | 6.50% | | | | 05/15/2027 | | | | 165,187 | |
235,000 | | | Live Nation Entertainment, Inc.(e) | | | | 4.75% | | | | 10/15/2027 | | | | 239,112 | |
130,000 | | | Midwest Gaming Borrower LLC / Midwest Gaming Finance Corp.(e) | | | | 4.88% | | | | 05/01/2029 | | | | 132,600 | |
660,000 | | | Premier Entertainment Sub LLC(e) | | | | 5.63% | | | | 09/01/2029 | | | | 667,475 | |
570,000 | | | Premier Entertainment Sub LLC(e) | | | | 5.88% | | | | 09/01/2031 | | | | 576,664 | |
135,000 | | | Scientific Games International, Inc.(e) | | | | 7.25% | | | | 11/15/2029 | | | | 151,860 | |
| | | | | | | | | | | | | | | 3,778,521 | |
Environmental Control - 0.02% | | | | | | | | | | | | | |
180,000 | | | Madison IAQ LLC(e) | | | | 4.13% | | | | 06/30/2028 | | | | 180,227 | |
145,000 | | | Madison IAQ LLC(e) | | | | 5.88% | | | | 06/30/2029 | | | | 146,277 | |
| | | | | | | | | | | | | | | 326,504 | |
Food - 0.17% | | | | | | | | | | | | | |
80,000 | | | B&G Foods, Inc. | | | | 5.25% | | | | 09/15/2027 | | | | 83,550 | |
255,000 | | | Flowers Foods, Inc. | | | | 2.40% | | | | 03/15/2031 | | | | 255,159 | |
75,000 | | | Kraft Heinz Foods Co. | | | | 5.00% | | | | 07/15/2035 | | | | 92,322 | |
205,000 | | | Kraft Heinz Foods Co. | | | | 5.20% | | | | 07/15/2045 | | | | 257,200 | |
320,000 | | | Mondelez International, Inc. | | | | 1.88% | | | | 10/15/2032 | | | | 307,475 | |
160,000 | | | Performance Food Group, Inc.(e) | | | | 5.50% | | | | 10/15/2027 | | | | 167,730 | |
140,000 | | | Performance Food Group, Inc.(e) | | | | 4.25% | | | | 08/01/2029 | | | | 140,526 | |
130,000 | | | Pilgrim’s Pride Corp.(e) | | | | 5.88% | | | | 09/30/2027 | | | | 138,385 | |
180,000 | | | Post Holdings, Inc.(e) | | | | 4.63% | | | | 04/15/2030 | | | | 181,616 | |
754,000 | | | Smithfield Foods, Inc.(e) | | | | 4.25% | | | | 02/01/2027 | | | | 824,980 | |
690,000 | | | Sysco Corp. | | | | 3.30% | | | | 02/15/2050 | | | | 708,070 | |
270,000 | | | United Natural Foods, Inc.(e) | | | | 6.75% | | | | 10/15/2028 | | | | 292,613 | |
25,000 | | | US Foods, Inc.(e) | | | | 6.25% | | | | 04/15/2025 | | | | 26,255 | |
| | | | | | | | | | | | | | | 3,475,881 | |
See Notes to Financial Statements. | |
Annual Report | September 30, 2021 | 43 |
RiverNorth/DoubleLine Strategic Income Fund | Schedule of Investments |
Principal Amount/Description | | Rate | | | Maturity | | | Value |
Food Service - 0.03% | | | | | | | | | | | | | |
$ | 585,000 | | | TKC Holdings, Inc.(e) | | | | 10.50% | | | | 05/15/2029 | | | $ | 642,198 | |
| | | | | | | | | | | | | | |
Healthcare-Products - 0.01% | | | | | | | | | | | | | |
55,000 | | | Mozart Debt Merger Sub, Inc.(e) Ortho-Clinical Diagnostics, Inc. / | | | | 5.25% | | | | 10/01/2029 | | | | 55,722 | |
120,000 | | | Ortho-Clinical Diagnostics SA(e) | | | | 7.25% | | | | 02/01/2028 | | | | 128,609 | |
| | | | | | | | | | | | | | | 184,331 | |
Healthcare-Services - 0.23% | | | | | | | | | | | | | |
390,000 | | | Anthem, Inc. | | | | 2.38% | | | | 01/15/2025 | | | | 406,478 | |
85,000 | | | Centene Corp. | | | | 3.00% | | | | 10/15/2030 | | | | 87,231 | |
775,000 | | | Centene Corp. | | | | 2.50% | | | | 03/01/2031 | | | | 765,312 | |
155,000 | | | CHS/Community Health Systems, Inc.(e) | | | | 6.00% | | | | 01/15/2029 | | | | 164,494 | |
600,000 | | | CHS/Community Health Systems, Inc.(e) | | | | 6.88% | | | | 04/15/2029 | | | | 602,241 | |
370,000 | | | HCA, Inc. | | | | 4.13% | | | | 06/15/2029 | | | | 413,588 | |
260,000 | | | Health Care Service Corp. A Mutual Legal Reserve Co.(e) | | | | 3.20% | | | | 06/01/2050 | | | | 267,737 | |
85,000 | | | Legacy LifePoint Health LLC(e) | | | | 6.75% | | | | 04/15/2025 | | | | 89,429 | |
205,000 | | | Legacy LifePoint Health LLC(e) | | | | 4.38% | | | | 02/15/2027 | | | | 204,744 | |
975,000 | | | Radiology Partners, Inc.(e) | | | | 9.25% | | | | 02/01/2028 | | | | 1,050,129 | |
160,000 | | | RP Escrow Issuer LLC(e) | | | | 5.25% | | | | 12/15/2025 | | | | 164,809 | |
155,000 | | | Select Medical Corp.(e) | | | | 6.25% | | | | 08/15/2026 | | | | 163,192 | |
190,000 | | | Tenet Healthcare Corp.(e) | | | | 6.13% | | | | 10/01/2028 | | | | 199,834 | |
| | | | | | | | | | | | | | | 4,579,218 | |
Housewares - 0.05% | | | | | | | | | | | | | |
1,060,000 | | | SWF Escrow Issuer Corp.(e) | | | | 6.50% | | | | 10/01/2029 | | | | 1,034,083 | |
| | | | | | | | | | | | | | |
Insurance - 0.17% | | | | | | | | | | | | | |
200,000 | | | Acrisure LLC / Acrisure Finance, Inc.(e) | | | | 4.25% | | | | 02/15/2029 | | | | 198,013 | |
130,000 | | | Alliant Holdings Intermediate LLC / Alliant Holdings Co.-Issuer(e) | | | | 6.75% | | | | 10/15/2027 | | | | 134,723 | |
140,000 | | | AmWINS Group, Inc.(e) | | | | 4.88% | | | | 06/30/2029 | | | | 142,142 | |
865,000 | | | Athene Global Funding(d)(e) | | | | 1D SOFR + 0.56% | | | | 08/19/2024 | | | | 866,652 | |
200,000 | | | Berkshire Hathaway Finance Corp. | | | | 2.85% | | | | 10/15/2050 | | | | 197,368 | |
150,000 | | | Brighthouse Financial Global Funding(e) | | | | 1.00% | | | | 04/12/2024 | | | | 150,797 | |
260,000 | | | Brighthouse Financial Global Funding(e) | | | | 2.00% | | | | 06/28/2028 | | | | 259,125 | |
220,000 | | | First American Financial Corp. | | | | 2.40% | | | | 08/15/2031 | | | | 214,526 | |
160,000 | | | GTCR AP Finance, Inc.(e) | | | | 8.00% | | | | 05/15/2027 | | | | 169,050 | |
340,000 | | | Prudential Financial, Inc. | | | | 3.91% | | | | 12/07/2047 | | | | 394,707 | |
See Notes to Financial Statements. | |
44 | (888) 848-7569 | www.rivernorth.com |
RiverNorth/DoubleLine Strategic Income Fund | Schedule of Investments |
| September 30, 2021 |
Principal Amount/Description | Rate | Maturity | | Value |
$ | 665,000 | | Willis North America, Inc. | 4.50% | 09/15/2028 | | $ | 762,372 |
| | | | | | | | 3,489,475 |
Internet - 0.14% | | | | | |
| 1,645,000 | | Endure Digital, Inc.(e) | 6.00% | 02/15/2029 | | | 1,565,176 |
| 400,000 | | Expedia Group, Inc. | 3.80% | 02/15/2028 | | | 434,445 |
| 140,000 | | Expedia Group, Inc. | 2.95% | 03/15/2031 | | | 141,592 |
| 125,000 | | Uber Technologies, Inc.(e) | 7.50% | 09/15/2027 | | | 136,641 |
| 500,000 | | Uber Technologies, Inc.(e) | 6.25% | 01/15/2028 | | | 536,875 |
| 135,000 | | Uber Technologies, Inc.(e) | 4.50% | 08/15/2029 | | | 136,181 |
| | | | | | | | 2,950,910 |
Investment Companies - 0.59% | | | | | |
| 455,000 | | Ares Capital Corp. | 2.15% | 07/15/2026 | | | 456,448 |
| 175,000 | | Ares Capital Corp. | 2.88% | 06/15/2028 | | | 177,405 |
| 375,000 | | Blackstone Secured Lending Fund(e) | 2.85% | 09/30/2028 | | | 372,737 |
| 5,000,000 | | Business Development Corp. of America(e) | 5.38% | 05/30/2023 | | | 5,251,027 |
| 5,000,000 | | FS KKR Capital Corp. | 4.75% | 05/15/2022 | | | 5,110,388 |
| 180,000 | | Icahn Enterprises LP / Icahn Enterprises Finance Corp. | 5.25% | 05/15/2027 | | | 186,975 |
| 445,000 | | Owl Rock Capital Corp. | 2.63% | 01/15/2027 | | | 446,088 |
| | | | | | | | 12,001,068 |
Leisure Time - 0.07% | | | | | |
| 280,000 | | Carlson Travel, Inc.(e) | 6.75% | 12/15/2025 | | | 250,611 |
| 135,000 | | Carnival Corp.(e) | 7.63% | 03/01/2026 | | | 144,281 |
| 685,000 | | Carnival Corp.(e) | 5.75% | 03/01/2027 | | | 708,975 |
| 55,000 | | Viking Cruises, Ltd.(e) | 13.00% | 05/15/2025 | | | 63,388 |
| 340,000 | | Viking Cruises, Ltd.(e) | 5.88% | 09/15/2027 | | | 329,572 |
| | | | | | | | 1,496,827 |
Lodging - 0.07% | | | | | |
| 275,000 | | Boyd Gaming Corp.(e) | 4.75% | 06/15/2031 | | | 283,937 |
| 410,000 | | Marriott International, Inc. | 3.13% | 06/15/2026 | | | 438,792 |
| 415,000 | | Marriott International, Inc. | 2.75% | 10/15/2033 | | | 406,045 |
| 185,000 | | MGM Resorts International | 6.75% | 05/01/2025 | | | 195,175 |
| | | | | | | | 1,323,949 |
Machinery-Diversified - 0.02% | | | | | |
| 440,000 | | Flowserve Corp. | 2.80% | 01/15/2032 | | | 435,904 |
Media - 0.20% | | | | | |
| 135,000 | | CCO Holdings LLC / CCO Holdings Capital Corp.(e) | 4.25% | 01/15/2034 | | | 133,903 |
| 970,000 | | Cengage Learning, Inc.(e) | 9.50% | 06/15/2024 | | | 994,153 |
| 405,000 | | Charter Communications Operating LLC / Charter Communications Operating Capital | 4.91% | 07/23/2025 | | | 455,665 |
See Notes to Financial Statements. | |
Annual Report | September 30, 2021 | 45 |
RiverNorth/DoubleLine Strategic Income Fund | Schedule of Investments |
| September 30, 2021 |
Principal Amount/Description | Rate | Maturity | | Value |
$ | 350,000 | | Charter Communications Operating LLC / Charter Communications Operating Capital | 3.50% | 03/01/2042 | | $ | 342,811 |
| 300,000 | | Comcast Corp. | 3.95% | 10/15/2025 | | | 332,940 |
| 420,000 | | Comcast Corp. | 3.40% | 04/01/2030 | | | 462,791 |
| 70,000 | | Diamond Sports Group LLC / Diamond Sports Finance Co.(e) | 5.38% | 08/15/2026 | | | 46,288 |
| 120,000 | | DIRECTV Holdings LLC / DIRECTV Financing Co., Inc.(e) | 5.88% | 08/15/2027 | | | 125,400 |
| 130,000 | | DISH DBS Corp. | 5.13% | 06/01/2029 | | | 127,549 |
| 130,000 | | GCI LLC(e) | 4.75% | 10/15/2028 | | | 136,640 |
| 35,000 | | iHeartCommunications, Inc. | 8.38% | 05/01/2027 | | | 37,450 |
| 365,000 | | Mav Acquisition Corp.(e) | 5.75% | 08/01/2028 | | | 359,133 |
| 90,000 | | Nexstar Media, Inc.(e) | 5.63% | 07/15/2027 | | | 95,330 |
| 110,000 | | Radiate Holdco LLC / Radiate Finance, Inc.(e) | 4.50% | 09/15/2026 | | | 113,713 |
| 190,000 | | Scripps Escrow, Inc.(e) | 5.88% | 07/15/2027 | | | 195,260 |
| 130,000 | | Univision Communications, Inc.(e) | 4.50% | 05/01/2029 | | | 132,275 |
| | | | | | | | 4,091,301 |
Mining - 0.04% | | | | | |
| 220,000 | | Arconic Corp.(e) | 6.13% | 02/15/2028 | | | 233,479 |
| 415,000 | | Glencore Funding LLC(e) | 1.63% | 04/27/2026 | | | 413,274 |
| 275,000 | | Glencore Funding LLC(e) | 3.38% | 09/23/2051 | | | 261,844 |
| | | | | | | | 908,597 |
Miscellaneous Manufacturing - 0.01% | | | | | |
| 195,000 | | General Electric Co. | 6.88% | 01/10/2039 | | | 290,971 |
Oil & Gas - 0.49% | | | | | |
| 50,000 | | Apache Corp. | 4.63% | 11/15/2025 | | | 53,812 |
| 95,000 | | Apache Corp. | 4.38% | 10/15/2028 | | | 102,837 |
| 305,000 | | BP Capital Markets America, Inc. | 2.94% | 06/04/2051 | | | 288,888 |
| 410,000 | | BP Capital Markets America, Inc. | 3.00% | 03/17/2052 | | | 392,563 |
| 655,000 | | Brooklyn Union Gas Co.(e) | 4.49% | 03/04/2049 | | | 765,973 |
| 165,000 | | Chesapeake Energy Corp.(e) | 5.88% | 02/01/2029 | | | 176,501 |
| 105,000 | | CNX Resources Corp.(e) | 6.00% | 01/15/2029 | | | 111,169 |
| 195,000 | | Diamondback Energy, Inc. | 2.88% | 12/01/2024 | | | 204,820 |
| 480,000 | | East Ohio Gas Co.(e) | 3.00% | 06/15/2050 | | | 472,191 |
| 85,000 | | EQT Corp. | 7.50% | 02/01/2030 | | | 109,518 |
| 420,000 | | Exxon Mobil Corp. | 4.23% | 03/19/2040 | | | 499,056 |
| 260,000 | | Halliburton Co. | 2.92% | 03/01/2030 | | | 269,077 |
| 155,000 | | Halliburton Co. | 5.00% | 11/15/2045 | | | 186,012 |
| 140,000 | | Hilcorp Energy I LP / Hilcorp Finance Co.(e) | 6.25% | 11/01/2028 | | | 145,335 |
| 80,000 | | Hilcorp Energy I LP / Hilcorp Finance Co.(e) | 5.75% | 02/01/2029 | | | 82,300 |
See Notes to Financial Statements. | |
46 | (888) 848-7569 | www.rivernorth.com |
RiverNorth/DoubleLine Strategic Income Fund | Schedule of Investments |
| September 30, 2021 |
Principal Amount/Description | Rate | Maturity | | Value |
$ | 800,000 | | Kosmos Energy, Ltd.(c) | 7.13% | 04/04/2026 | | $ | 785,756 |
| 705,000 | | Marathon Petroleum Corp. | 5.13% | 12/15/2026 | | | 820,185 |
| 750,000 | | NiSource, Inc. | 3.60% | 05/01/2030 | | | 822,766 |
| 75,000 | | Occidental Petroleum Corp. | 8.00% | 07/15/2025 | | | 89,694 |
| 115,000 | | Occidental Petroleum Corp. | 6.63% | 09/01/2030 | | | 141,881 |
| 130,000 | | Occidental Petroleum Corp. | 6.13% | 01/01/2031 | | | 156,224 |
| 95,000 | | Occidental Petroleum Corp. | 6.45% | 09/15/2036 | | | 119,641 |
| 85,000 | | Ovintiv Exploration, Inc. | 7.38% | 11/01/2031 | | | 115,469 |
| 160,000 | | Patterson-UTI Energy, Inc. | 3.95% | 02/01/2028 | | | 160,881 |
| 760,000 | | PBF Holding Co. LLC / PBF Finance Corp.(e) | 9.25% | 05/15/2025 | | | 721,137 |
| 645,000 | | Pioneer Natural Resources Co. | 1.90% | 08/15/2030 | | | 617,642 |
| 700,000 | | SierraCol Energy Andina LLC(e) | 6.00% | 06/15/2028 | | | 685,346 |
| 140,000 | | Southwestern Energy Co.(e) | 5.38% | 02/01/2029 | | | 149,948 |
| 110,000 | | Sunoco LP / Sunoco Finance Corp. | 6.00% | 04/15/2027 | | | 114,675 |
| 215,000 | | Sunoco LP / Sunoco Finance Corp. | 4.50% | 05/15/2029 | | | 218,337 |
| 61,000 | | Transocean, Inc.(e) | 11.50% | 01/30/2027 | | | 62,930 |
| 220,000 | | USA Compression Partners LP / USA Compression Finance Corp. | 6.88% | 09/01/2027 | | | 233,223 |
| | | | | | | | 9,875,787 |
Oil & Gas Services - 0.01% | | | | | |
| 150,000 | | Weatherford International, Ltd.(e) | 6.50% | 09/15/2028 | | | 154,688 |
Packaging & Containers - 0.06% | | | | | |
| 260,000 | | Berry Global, Inc.(e) | 1.65% | 01/15/2027 | | | 257,052 |
| 185,000 | | Silgan Holdings, Inc. | 4.13% | 02/01/2028 | | | 190,319 |
| 736,000 | | WRKCo, Inc. | 3.75% | 03/15/2025 | | | 796,872 |
| | | | | | | | 1,244,243 |
Pharmaceuticals - 0.17% | | | | | |
| 770,000 | | AbbVie, Inc. | 4.70% | 05/14/2045 | | | 951,213 |
| 230,000 | | Bausch Health Cos., Inc.(e) | 6.25% | 02/15/2029 | | | 227,916 |
| 690,000 | | Bristol-Myers Squibb Co. | 4.35% | 11/15/2047 | | | 866,622 |
| 545,000 | | Cigna Corp. | 4.90% | 12/15/2048 | | | 697,647 |
| 390,000 | | CVS Health Corp. | 5.05% | 03/25/2048 | | | 502,889 |
| 215,000 | | Viatris, Inc.(e) | 1.65% | 06/22/2025 | | | 217,264 |
| | | | | | | | 3,463,551 |
Pipelines - 0.36% | | | | | |
| 73,000 | | Antero Midstream Partners LP / Antero Midstream Finance Corp.(e) | 5.75% | 03/01/2027 | | | 75,504 |
| 200,000 | | Enable Midstream Partners LP | 4.40% | 03/15/2027 | | | 221,705 |
| 375,000 | | Enable Midstream Partners LP | 5.00% | 05/15/2044 | | | 411,858 |
| 360,000 | | Energy Transfer LP | 4.75% | 01/15/2026 | | | 402,551 |
| 1,000,000 | | Energy Transfer LP | 3.90% | 07/15/2026 | | | 1,092,541 |
| 220,000 | | EQM Midstream Partners LP(e) | 4.75% | 01/15/2031 | | | 229,079 |
See Notes to Financial Statements. | |
Annual Report | September 30, 2021 | 47 |
RiverNorth/DoubleLine Strategic Income Fund | Schedule of Investments |
| September 30, 2021 |
Principal Amount/Description | Rate | Maturity | | Value |
$ | 320,000 | | Hess Midstream Operations LP(e) | 5.13% | 06/15/2028 | | $ | 334,656 |
| 275,000 | | Hess Midstream Operations LP(e) | 4.25% | 02/15/2030 | | | 278,437 |
| 548,000 | | Kinder Morgan Energy Partners LP | 6.95% | 01/15/2038 | | | 777,689 |
| 1,925,000 | | NGL Energy Operating LLC / NGL Energy Finance Corp.(e) | 7.50% | 02/01/2026 | | | 1,963,837 |
| 135,000 | | NGPL PipeCo LLC(e) | 3.25% | 07/15/2031 | | | 138,423 |
| 270,000 | | NuStar Logistics LP | 6.38% | 10/01/2030 | | | 297,338 |
| 180,000 | | ONEOK, Inc. | 3.40% | 09/01/2029 | | | 192,074 |
| 335,000 | | Sabine Pass Liquefaction LLC | 5.00% | 03/15/2027 | | | 385,334 |
| 170,000 | | Targa Resources Partners LP / Targa Resources Partners Finance Corp. | 5.50% | 03/01/2030 | | | 186,097 |
| 220,000 | | Venture Global Calcasieu Pass LLC(e) | 4.13% | 08/15/2031 | | | 229,625 |
| 120,000 | | Western Midstream Operating LP | 4.35% | 02/01/2025 | | | 126,775 |
| | | | | | | | 7,343,523 |
Real Estate - 0.01% | | | | | |
| 110,000 | | Realogy Group LLC / Realogy Co.- Issuer Corp.(e) | 5.75% | 01/15/2029 | | | 114,249 |
REITS - 0.42% | | | | | |
| 165,000 | | Agree LP | 2.60% | 06/15/2033 | | | 163,420 |
| 295,000 | | Alexandria Real Estate Equities, Inc. | 3.00% | 05/18/2051 | | | 287,589 |
| 840,000 | | American Tower Corp. | 3.60% | 01/15/2028 | | | 915,204 |
| 525,000 | | Boston Properties LP | 3.40% | 06/21/2029 | | | 569,064 |
| 800,000 | | Crown Castle International Corp. | 3.70% | 06/15/2026 | | | 873,700 |
| 515,000 | | Crown Castle International Corp. | 3.65% | 09/01/2027 | | | 566,619 |
| 560,000 | | Crown Castle International Corp. | 3.30% | 07/01/2030 | | | 597,224 |
| 470,000 | | Equinix, Inc. | 1.80% | 07/15/2027 | | | 472,663 |
| 1,000,000 | | Equinix, Inc. | 2.15% | 07/15/2030 | | | 981,451 |
| 250,000 | | Iron Mountain, Inc.(e) | 4.50% | 02/15/2031 | | | 253,887 |
| 260,000 | | Lexington Realty Trust | 2.38% | 10/01/2031 | | | 252,411 |
| 190,000 | | National Retail Properties, Inc. | 2.50% | 04/15/2030 | | | 192,761 |
| 80,000 | | Office Properties Income Trust | 2.65% | 06/15/2026 | | | 80,748 |
| 355,000 | | Office Properties Income Trust | 2.40% | 02/01/2027 | | | 351,046 |
| 140,000 | | Park Intermediate Holdings LLC / PK Domestic Property LLC / PK Finance Co.-Issuer(e) | 4.88% | 05/15/2029 | | | 144,267 |
| 80,000 | | Realogy Group LLC / Realogy Co.- Issuer Corp.(e) | 7.63% | 06/15/2025 | | | 85,536 |
| 90,000 | | Sabra Health Care LP | 3.20% | 12/01/2031 | | | 88,255 |
| 395,000 | | Simon Property Group LP | 2.45% | 09/13/2029 | | | 403,732 |
| 595,000 | | Uniti Group LP / Uniti Group Finance, Inc. / CSL Capital LLC(e) | 6.50% | 02/15/2029 | | | 612,850 |
See Notes to Financial Statements. | |
48 | (888) 848-7569 | www.rivernorth.com |
RiverNorth/DoubleLine Strategic Income Fund | Schedule of Investments |
| September 30, 2021 |
Principal Amount/Description | Rate | Maturity | | Value |
$ | 135,000 | | Vornado Realty LP | 2.15% | 06/01/2026 | | $ | 137,200 |
| 455,000 | | Welltower, Inc. | 2.80% | 06/01/2031 | | | 469,040 |
| | | | | | | | 8,498,667 |
Retail - 0.22% | | | | | |
| 230,000 | | Academy, Ltd.(e) | 6.00% | 11/15/2027 | | | 248,688 |
| 85,000 | | Ambience Merger Sub, Inc.(e) | 7.13% | 07/15/2029 | | | 84,363 |
| 745,000 | | Dollar Tree, Inc. | 4.00% | 05/15/2025 | | | 815,717 |
| 120,000 | | Ferrellgas LP / Ferrellgas Finance Corp.(e) | 5.38% | 04/01/2026 | | | 117,452 |
| 235,000 | | Golden Nugget, Inc.(e) | 6.75% | 10/15/2024 | | | 235,599 |
| 370,000 | | McDonald’s Corp. | 3.60% | 07/01/2030 | | | 411,807 |
| 370,000 | | McDonald’s Corp. | 4.45% | 03/01/2047 | | | 451,994 |
| 190,000 | | Park River Holdings, Inc.(e) | 5.63% | 02/01/2029 | | | 184,345 |
| 945,000 | | PetSmart, Inc. / PetSmart Finance Corp.(e) | 7.75% | 02/15/2029 | | | 1,032,464 |
| 190,000 | | SRS Distribution, Inc.(e) | 4.63% | 07/01/2028 | | | 194,076 |
| 115,000 | | Staples, Inc.(e) | 7.50% | 04/15/2026 | | | 116,783 |
| 195,000 | | Suburban Propane Partners LP/Suburban Energy Finance Corp.(e) | 5.00% | 06/01/2031 | | | 202,556 |
| 365,000 | | Victoria’s Secret & Co.(e) | 4.63% | 07/15/2029 | | | 372,473 |
| | | | | | | | 4,468,317 |
Semiconductors - 0.07% | | | | | |
| 669,000 | | Broadcom, Inc.(e) | 3.42% | 04/15/2033 | | | 693,081 |
| 745,000 | | Marvell Technology, Inc.(e) | 4.20% | 06/22/2023 | | | 786,874 |
| | | | | | | | 1,479,955 |
Software - 0.18% | | | | | |
| 515,000 | | Activision Blizzard, Inc. | 1.35% | 09/15/2030 | | | 477,892 |
| 1,550,000 | | Castle US Holding Corp.(e) | 9.50% | 02/15/2028 | | | 1,628,322 |
| 175,000 | | Clarivate Science Holdings Corp.(e) | 4.88% | 07/01/2029 | | | 175,560 |
| 535,000 | | Oracle Corp. | 3.85% | 04/01/2060 | | | 544,892 |
| 945,000 | | Roper Technologies, Inc. | 1.75% | 02/15/2031 | | | 901,911 |
| | | | | | | | 3,728,577 |
Special Purpose Banks - 0.00%(j) | | | | | |
| 47,000 | | Caesars Resort Collection LLC / CRC Finco, Inc.(e) | 5.25% | 10/15/2025 | | | 47,698 |
Telecommunications - 0.45% | | | | | |
| 500,000 | | AT&T, Inc. | 4.30% | 02/15/2030 | | | 574,078 |
| 205,000 | | AT&T, Inc. | 2.75% | 06/01/2031 | | | 210,659 |
| 1,395,000 | | AT&T, Inc. | 3.50% | 09/15/2053 | | | 1,383,401 |
| 185,000 | | Avaya, Inc.(e) | 6.13% | 09/15/2028 | | | 194,753 |
| 175,000 | | CommScope, Inc.(e) | 4.75% | 09/01/2029 | | | 175,000 |
| 1,675,000 | | Embarq Corp Eq 7.995 06/01/36 | 8.00% | 06/01/2036 | | | 1,798,958 |
| 45,000 | | Frontier Communications Holdings LLC(e) | 5.88% | 10/15/2027 | | | 47,869 |
See Notes to Financial Statements. | |
Annual Report | September 30, 2021 | 49 |
RiverNorth/DoubleLine Strategic Income Fund | Schedule of Investments |
| September 30, 2021 |
Principal Amount/Description | | Rate | | | Maturity | | | Value | |
$ | 85,000 | | | Frontier Communications Holdings LLC(e) | | 5.00% | | | 05/01/2028 | | | $ | 89,356 | |
| 315,000 | | | Frontier Communications Holdings LLC(e) | | 6.75% | | | 05/01/2029 | | | | 332,402 | |
| 80,000 | | | GTT Communications, Inc.(e) | | 7.88% | | | 12/31/2024 | | | | 8,800 | |
| 1,100,000 | | | Intelsat Jackson Holdings SA(e)(f) | | 8.50% | | | 10/15/2024 | | | | 628,859 | |
| 160,000 | | | Lumen Technologies, Inc.(e) | | 5.13% | | | 12/15/2026 | | | | 166,200 | |
| 145,000 | | | Lumen Technologies, Inc.(e) | | 4.00% | | | 02/15/2027 | | | | 148,342 | |
| 365,000 | | | T-Mobile USA, Inc. | | 2.25% | | | 02/15/2026 | | | | 369,563 | |
| 125,000 | | | T-Mobile USA, Inc. | | 3.38% | | | 04/15/2029 | | | | 130,563 | |
| 25,000 | | | T-Mobile USA, Inc.(e) | | 3.38% | | | 04/15/2029 | | | | 26,113 | |
| 1,000,000 | | | T-Mobile USA, Inc. | | 3.88% | | | 04/15/2030 | | | | 1,104,694 | |
| 50,000 | | | T-Mobile USA, Inc. | | 2.88% | | | 02/15/2031 | | | | 50,488 | |
| 365,000 | | | T-Mobile USA, Inc.(e) | | 3.40% | | | 10/15/2052 | | | | 356,706 | |
| 500,000 | | | Verizon Communications, Inc. | | 3.15% | | | 03/22/2030 | | | | 535,005 | |
| 670,000 | | | Verizon Communications, Inc. | | 4.40% | | | 11/01/2034 | | | | 794,272 | |
| 45,000 | | | Verizon Communications, Inc. | | 2.65% | | | 11/20/2040 | | | | 42,339 | |
| | | | | | | | | | | | | 9,168,420 | |
Transportation - 0.10% | | | | | | | | |
| 850,000 | | | CSX Corp. | | 3.80% | | | 11/01/2046 | | | | 962,808 | |
| 345,000 | | | FedEx Corp. | | 4.75% | | | 11/15/2045 | | | | 421,349 | |
| 170,000 | | | First Student Bidco, Inc.(e) | | 4.00% | | | 07/31/2029 | | | | 167,875 | |
| 500,000 | | | Union Pacific Corp. | | 3.70% | | | 03/01/2029 | | | | 558,504 | |
| | | | | | | | | | | | | 2,110,536 | |
Trucking & Leasing - 0.02% | | | | | | | | |
| 380,000 | | | Penske Truck Leasing Co. LP / PTL Finance Corp.(e) | | 4.20% | | | 04/01/2027 | | | | 428,752 | |
TOTAL U.S. CORPORATE BONDS | | | | | | | | |
(Cost $140,813,794) | | | | | | | 144,441,653 | |
Principal Amount/Description | | Rate | | | Maturity | | | Value | |
CONVERTIBLE CORPORATE BONDS - 0.83% | | | | | | | | |
| 2,036,407 | | | BlackRock Capital Investment Corp. | | 5.00% | | | 06/15/2022 | | | | 2,064,374 | |
| 6,854,823 | | | BlackRock TCP Capital Corp. | | 4.63% | | | 03/01/2022 | | | | 6,974,187 | |
| 96,925 | | | Digicel Group Holdings, Ltd.(e)(g)(h) | | 5.09% (7.00%) | | | 12/10/2021 | | | | 79,693 | |
| 1,422,000 | | | Goldman Sachs BDC, Inc. | | 4.50% | | | 04/01/2022 | | | | 1,450,412 | |
| 6,000,000 | | | New Mountain Finance Corp. | | 5.75% | | | 08/15/2023 | | | | 6,338,693 | |
TOTAL CONVERTIBLE CORPORATE BONDS | | | | | | | | |
(Cost $16,062,199) | | | | | | | 16,907,359 | |
See Notes to Financial Statements. | |
50 | (888) 848-7569 | www.rivernorth.com |
RiverNorth/DoubleLine Strategic Income Fund | Schedule of Investments |
| September 30, 2021 |
| Principal Amount/Description | | Rate | | | Maturity | | | Value | |
| FOREIGN GOVERNMENT BONDS AND NOTES, SUPRANATIONALS AND FOREIGN AGENCIES - 0.93% | |
| $ | 450,000 | | | Abu Dhabi Government International Bond(c) | | 1.70% | | | 03/02/2031 | | | $ | 435,134 | |
| | 300,000 | | | Abu Dhabi Government International Bond(c) | | 3.13% | | | 09/30/2049 | | | | 301,926 | |
| | 200,000 | | | Brazilian Government International Bond | | 3.75% | | | 09/12/2031 | | | | 190,000 | |
| | 200,000 | | | Brazilian Government International Bond | | 5.00% | | | 01/27/2045 | | | | 187,144 | |
| | 400,000 | | | Brazilian Government International Bond | | 5.63% | | | 02/21/2047 | | | | 401,680 | |
| | 850,000 | | | Brazilian Government International Bond | | 4.75% | | | 01/14/2050 | | | | 754,605 | |
| | 200,000 | | | Chile Government International Bond | | 2.55% | | | 01/27/2032 | | | | 198,666 | |
| | 300,000 | | | Chile Government International Bond | | 3.50% | | | 01/25/2050 | | | | 300,488 | |
| | 700,000 | | | Chile Government International Bond | | 3.10% | | | 01/22/2061 | | | | 632,772 | |
| | 600,000 | | | Colombia Government International Bond | | 3.25% | | | 04/22/2032 | | | | 561,012 | |
| | 1,100,000 | | | Colombia Government International Bond | | 5.00% | | | 06/15/2045 | | | | 1,076,229 | |
| | 600,000 | | | Colombia Government International Bond | | 4.13% | | | 05/15/2051 | | | | 516,972 | |
| | 600,000 | | | Dominican Republic International Bond(e) | | 6.40% | | | 06/05/2049 | | | | 636,606 | |
| | 200,000 | | | El Salvador Government International Bond(c) | | 7.13% | | | 01/20/2050 | | | | 138,502 | |
| | 600,000 | | | Export Import Bank of Thailand(d) | | 3M US L + 0.90% | | | 11/20/2023 | | | | 605,421 | |
| | 200,000 | | | Indonesia Government International Bond | | 4.35% | | | 01/11/2048 | | | | 223,212 | |
| | 500,000 | | | Indonesia Government International Bond | | 3.70% | | | 10/30/2049 | | | | 508,988 | |
| | 300,000 | | | Instituto Costarricense de Electricidad(e) | | 6.75% | | | 10/07/2031 | | | | 297,321 | |
| | 200,000 | | | Korea Development Bank | | 1.00% | | | 09/09/2026 | | | | 197,880 | |
| | 200,000 | | | Korea Development Bank | | 1.63% | | | 01/19/2031 | | | | 196,847 | |
| | 500,000 | | | Malaysia Wakala Sukuk Bhd(e) | | 2.07% | | | 04/28/2031 | | | | 497,199 | |
| | 250,000 | | | Malaysia Wakala Sukuk Bhd(c) | | 2.07% | | | 04/28/2031 | | | | 248,600 | |
| | 1,075,000 | | | Mexico Government International Bond | | 3.75% | | | 01/11/2028 | | | | 1,170,970 | |
| | 500,000 | | | Mexico Government International Bond | | 2.66% | | | 05/24/2031 | | | | 483,615 | |
See Notes to Financial Statements. | |
Annual Report | September 30, 2021 | 51 |
RiverNorth/DoubleLine Strategic Income Fund | Schedule of Investments |
| September 30, 2021 |
| Principal Amount/Description | | Rate | | | Maturity | | | Value | |
| $ | 550,000 | | | Mexico Government International Bond | | 4.28% | | | 08/14/2041 | | | $ | 562,540 | |
| | 750,000 | | | Mexico Government International Bond | | 4.60% | | | 02/10/2048 | | | | 775,579 | |
| | 500,000 | | | Mexico Government International Bond | | 4.50% | | | 01/31/2050 | | | | 512,600 | |
| | 400,000 | | | Mexico Government International Bond | | 3.77% | | | 05/24/2061 | | | | 355,934 | |
| | 400,000 | | | Panama Government International Bond | | 2.25% | | | 09/29/2032 | | | | 377,328 | |
| | 900,000 | | | Panama Government International Bond | | 3.87% | | | 07/23/2060 | | | | 883,503 | |
| | 300,000 | | | Perusahaan Penerbit SBSN Indonesia III(e) | | 2.55% | | | 06/09/2031 | | | | 304,944 | |
| | 400,000 | | | Perusahaan Penerbit SBSN Indonesia III(c) | | 3.80% | | | 06/23/2050 | | | | 407,780 | |
| | 600,000 | | | Peruvian Government International Bond | | 3.30% | | | 03/11/2041 | | | | 583,770 | |
| | 200,000 | | | Philippine Government International Bond | | 2.46% | | | 05/05/2030 | | | | 204,661 | |
| | 350,000 | | | Philippine Government International Bond | | 1.65% | | | 06/10/2031 | | | | 333,869 | |
| | 550,000 | | | Philippine Government International Bond | | 3.70% | | | 03/01/2041 | | | | 583,534 | |
| | 200,000 | | | Philippine Government International Bond | | 3.70% | | | 02/02/2042 | | | | 212,369 | |
| | 400,000 | | | Saudi Government International Bond(e) | | 2.90% | | | 10/22/2025 | | | | 426,106 | |
| | 500,000 | | | Saudi Government International Bond(c) | | 2.25% | | | 02/02/2033 | | | | 487,128 | |
| | 350,000 | | | Saudi Government International Bond(c) | | 3.75% | | | 01/21/2055 | | | | 366,187 | |
| | 200,000 | | | Saudi Government International Bond(c) | | 3.45% | | | 02/02/2061 | | | | 196,781 | |
| | 400,000 | | | Ukraine Government International Bond(c) | | 7.25% | | | 03/15/2033 | | | | 406,309 | |
| | 200,000 | | | Ukraine Government International Bond(c) | | 7.25% | | | 03/15/2033 | | | | 203,154 | |
| TOTAL FOREIGN GOVERNMENT BONDS AND NOTES, SUPRANATIONALS AND FOREIGN AGENCIES | |
| (Cost $19,122,058) | | | | | | | | | 18,945,865 | |
See Notes to Financial Statements. | |
52 | (888) 848-7569 | www.rivernorth.com |
RiverNorth/DoubleLine Strategic Income Fund | Schedule of Investments |
| September 30, 2021 |
| Principal Amount/Description | | Rate | | | Maturity | | | Value | |
| BANK LOANS - 2.25%(d) | | | | | | | | | | |
| Canada - 0.03% | | | | | | | | | | |
| $ | 530,000 | | | Air Canada, First Lien - B Term Loan | | L + 3.50%, 0.75% Floor | | | 08/11/2028 | | | $ | 532,870 | |
| Cayman Islands - 0.05% | | | | | | | | | | |
| | 1,029,800 | | | Grab Holdings, Inc., First Lien - Initial Term Loan | | 6M US L + 4.50%, 1.00% Floor | | | 01/29/2026 | | | | 1,043,528 | |
| Ireland - 0.03% | | | | | | | | | | |
| | 680,000 | | | ION Trading Finance, Ltd., First Lien - Initial Dollar (2021) Term Loan | | 3M US L + 4.75% | | | 04/01/2028 | | | | 682,214 | |
| Luxembourg - 0.16% | | | | | | | | | | |
| | 705,000 | | | Curium BidCo SARL, Second Lien Term Loan | | 3M US L + 7.75% | | | 10/27/2028 | | | | 716,900 | |
| | 2,133,365 | | | Travelport Finance Luxembourg SARL 1L, 2021, First Lien - Initial (Priority) Term Loan(o) | | 3M US L + 8.75%, 1.00% Floor | | | 02/28/2025 | | | | 2,218,316 | |
| | 336,703 | | | Travelport Finance S.a r.l., First Lien - 2021 Consented Term Loan | | 3M US L + 6.75% | | | 05/29/2026 | | | | 290,827 | |
| | | | | | | | | | | | | | 3,226,043 | |
| Netherlands - 0.05% | | | | | | | | | | |
| | 1,242,046 | | | Bright Bidco B.V., First Lien - 2018 Refinancing B Term Loan | | 6M US L + 3.50%, 1.00% Floor | | | 06/30/2024 | | | | 992,861 | |
| | 5,736 | | | Lealand Finance Company B.V., First Lien - Make-Whole Term Loan | | 3M US L + 3.00% | | | 06/28/2024 | | | | 3,441 | |
| | 73,439 | | | Lealand Finance Company B.V., First Lien - Take-Back Term Loan | | 3M US L + 4.00% | | | 06/30/2025 | | | | 33,709 | |
| | | | | | | | | | | | | | 1,030,011 | |
| United States - 1.93% | | | | | | | | | | |
| | 405,000 | | | AAdvantage Loyality IP, Ltd., First Lien - Initial Term Loan | | 3M US L + 3.00%, 0.75% Floor | | | 04/20/2028 | | | | 419,258 | |
| | 325,000 | | | Aegion Corp., First Lien - Initial Term Loan | | 3M US L + 4.75%, 0.75% Floor | | | 05/17/2028 | | | | 327,844 | |
| | 1,250,875 | | | Air Methods Corp., First Lien - Initial Term Loan | | 3M US L + 3.50%, 1.00% Floor | | | 04/22/2024 | | | | 1,242,663 | |
| | 1,192,533 | | | American Tire Distributors, Inc., First Lien - Initial Term Loan | | 1M US L + 7.50%, 1.00% Floor | | | 09/02/2024 | | | | 1,193,934 | |
| | 1,975,000 | | | Applied Systems, Inc., Second Lien - 2021 Term Loan | | 3M US L + 5.50%, 0.75% Floor | | | 09/19/2025 | | | | 2,007,795 | |
See Notes to Financial Statements. | |
Annual Report | September 30, 2021 | 53 |
RiverNorth/DoubleLine Strategic Income Fund | Schedule of Investments |
| September 30, 2021 |
Principal Amount/Description | | Rate | | | Maturity | | Value | |
$ | 295,000 | | | Asurion LLC, Second Lien - New B-3 Term Loan | | 1M US L + 5.25% | | | 01/31/2028 | | | $ | 294,509 | |
| 1,546,125 | | | Atlas Purchaser, Inc., First Lien - Initial Term Loan | | 3M US L + 3.00%, 0.75% Floor | | | 05/08/2028 | | | | 1,529,373 | |
| 200,000 | | | Blackhawk Network Holdings, Inc., Second Lien | | 1M US L + 7.00% | | | 06/15/2026 | | | | 199,333 | |
| 735,000 | | | Cengage Learning, Inc., First Lien - B Term Loan | | 3M US L + 5.00% | | | 06/29/2026 | | | | 740,722 | |
| 240,878 | | | ClubCorp Holdings, Inc., First Lien - B Term Loan | | 3M US L + 2.75% | | | 09/18/2024 | | | | 226,961 | |
| 2,350,000 | | | Constant Contact, Inc., Second Lien - Initial Term Loan | | 3M US L + 7.50%, 0.75% Floor | | | 02/12/2029 | | | | 2,326,500 | |
| 2,197,416 | | | Cvent, Inc., First Lien Term Loan | | 3M US L + 3.75% | | | 11/29/2024 | | | | 2,191,757 | |
| 905,000 | | | DCert Buyer, Inc., Second Lien - First Amendment Refinancing Term Loan | | 1M US L + 7.00% | | | 02/19/2029 | | | | 915,462 | |
| 760,000 | | | DG Investment Intermediate Holdings 2, Inc., Second Lien - Initial Term Loan | | 1M US L + 6.75%, 0.75% Floor | | | 03/30/2029 | | | | 765,700 | |
| 1,410,000 | | | DIRECTV Financing LLC, First Lien - Closing Date Term Loan | | 3M US L + 5.00%, 0.75% Floor | | | 08/02/2027 | | | | 1,412,496 | |
| 1,719,700 | | | Envision Healthcare Corp., First Lien - Initial Term Loan(o) | | 1M US L + 3.75% | | | 10/10/2025 | | | | 1,535,520 | |
| 1,475,000 | | | Envision Healthcare Corp., First Lien - Series 2020 New Term Loan(o) | | 1M US L + 3.75%, 1.00% Floor | | | 10/10/2025 | | | | 1,254,974 | |
| 1,761,840 | | | Flexistential, First Lien - Initial Term Loan | | 1M US L + 3.50% | | | 08/01/2024 | | | | 1,644,017 | |
| 450,799 | | | Forterra Finance LLC, First Lien - Replacement Term Loan | | 1M US L + 3.00%, 1.00% Floor | | | 10/25/2023 | | | | 451,081 | |
| 1,370,738 | | | Gainwell Acquisition Corp., First Lien - B Term Loan | | 3M US L + 4.00%, 0.75% Floor | | | 10/01/2027 | | | | 1,375,878 | |
| 450,636 | | | Global Medical Response, Inc., First Lien - 2018 New Term Loan | | 3M US L + 4.25%, 1.00% Floor | | | 03/14/2025 | | | | 452,946 | |
| 400,000 | | | Gogo Intermediate Holdings LLC, First Lien - Initial Term Loan | | 3M US L + 3.75%, 0.75% Floor | | | 04/30/2028 | | | | 401,042 | |
| 990,969 | | | Gulf Finance LLC, First Lien - Tranche B Term Loan | | 1M US L + 5.25%, 1.00% Floor | | | 08/25/2023 | | | | 955,354 | |
| 453,862 | | | Ivanti Software, Inc., First Lien - Initial Term Loan | | 1M US L + 3.00%, 1.00% Floor | | | 12/01/2027 | | | | 455,955 | |
| 400,000 | | | Kenan Advantage Group, Inc, Second Lien - Initial Term Loan | | 1M US L + 7.25%, 0.75% Floor | | | 08/18/2027 | | | | 397,500 | |
| 1,126,942 | | | Minotaur Acquisition, Inc., First Lien - B Term Loan | | 3M US L + 4.75% | | | 03/27/2026 | | | | 1,122,812 | |
See Notes to Financial Statements. | |
54 | (888) 848-7569 | www.rivernorth.com |
RiverNorth/DoubleLine Strategic Income Fund | Schedule of Investments |
September 30, 2021
Principal Amount/Description | | Rate | | | Maturity | | Value |
$ | 488,934 | | | Misys, Ltd., First Lien - Dollar Term Loan | | | 3M US L + 3.50%, 1.00% Floor | | | | 06/13/2024 | | | $ | 485,690 | |
| 705,000 | | | Misys, Ltd., Second Lien - Dollar Term Loan | | | 3M US L + 7.25%, 1.00% Floor | | | | 06/13/2025 | | | | 710,608 | |
| 1,135,000 | | | Mitchell International, Inc., Second Lien - Initial Term Loan | | | 1M US L + 7.25% | | | | 12/01/2025 | | | | 1,136,827 | |
| 468,001 | | | MLN US HoldCo LLC, First Lien - B Term Loan | | | 1M US L + 4.50% | | | | 11/30/2025 | | | | 426,927 | |
| 43,906 | | | OneDigital Borrower LLC, First Lien - Delayed Draw Term Loan(o) | | | 3M US L + 5.25%, 0.75% Floor | | | | 11/16/2027 | | | | 44,144 | |
| 1,354,666 | | | OneDigital Borrower LLC, First Lien - Initial Term Loan | | | 3M US L + 4.50%, 0.75% Floor | | | | 11/16/2027 | | | | 1,362,009 | |
| 1,278,575 | | | Riverbed Technology, Inc., First Lien - 2020 Extension Term Loan | | | 3M US L + 6.00%, 1.00% Floor | | | | 12/31/2025 | | | | 1,150,717 | |
| 230,000 | | | Solenis Holdings LLC, Second Lien - Initial Term Loan | | | 1M US L + 8.50% | | | | 06/26/2026 | | | | 230,432 | |
| 620,000 | | | Sweetwater Borrower, LLC, First Lien - Initial Term Loan | | | 3M US L + 4.75% | | | | 08/03/2028 | | | | 619,613 | |
| 977,141 | | | Team Health Holdings, Inc., First Lien - Initial Term Loan | | | 1M US L + 2.75%, 1.00% Floor | | | | 02/06/2024 | | | | 955,155 | |
| 680,000 | | | TIBCO Software, Inc., Second Lien | | | 1M US L + 7.25% | | | | 03/03/2028 | | | | 688,670 | |
| 1,762,605 | | | Travel Leaders Group LLC, First Lien - 2018 Refinancing Term Loan | | | 1M US L + 4.00% | | | | 01/25/2024 | | | | 1,654,645 | |
| 1,741,234 | | | Vantage Specialty Chemicals, Inc., First Lien - Closing Date Term Loan | | | 3M US L + 3.50%, 1.00% Floor | | | | 10/28/2024 | | | | 1,711,668 | |
| 690,000 | | | Viad Corp, First Lien - Initial Term Loan | | | 3M US L + 5.00%, 0.50% Floor | | | | 07/30/2028 | | | | 690,000 | |
| 1,573,595 | | | WaterBridge Midstream Operating LLC, First Lien - Initial Term Loan(o) | | | 3M US L + 5.75%, 1.00% Floor | | | | 06/22/2026 | | | | 1,537,064 | |
| | | | | | | | | | | | | | | 39,245,555 | |
| | | | | | | | | | | | | | | | |
TOTAL BANK LOANS | | | | | | | | | | | | |
(Cost $44,574,210) | | | | | | | | | | 45,760,221 | |
| | | | | | | | | | | | | | | | |
COLLATERALIZED LOAN OBLIGATIONS - 3.34% | | | | | | | |
| | | | Adams Mill CLO, Ltd. | | | | | | | | | | | | |
| 500,000 | | | Series 2014-1A(d)(e) | | | 3M US L + 3.50% | | | | 07/15/2026 | | | | 501,957 | |
| | | | AIMCO CLO | | | | | | | | | | | | |
| 500,000 | | | Series 2018-AA(d)(e) | | | 3M US L + 2.55% | | | | 04/17/2031 | | | | 493,823 | |
See Notes to Financial Statements. | |
Annual Report | September 30, 2021 | 55 |
RiverNorth/DoubleLine Strategic Income Fund | Schedule of Investments |
September 30, 2021
Principal Amount/Description | | Rate | | | Maturity | | Value |
| | | | AIMCO CLO 10, Ltd. | | | | | | | | | | | | |
$ | 1,000,000 | | | Series 2021-10A(d)(e) | | | 3M US L + 2.90% | | | | 07/22/2032 | | | $ | 999,994 | |
| | | | Apidos CLO XII | | | | | | | | | | | | |
| 500,000 | | | Series 2018-12A(d)(e) | | | 3M US L + 2.60% | | | | 04/15/2031 | | | | 485,989 | |
| | | | Apidos CLO XX | | | | | | | | | | | | |
| 500,000 | | | Series 2018-20A(d)(e) | | | 3M US L + 2.95% | | | | 07/16/2031 | | | | 496,221 | |
| | | | Apidos CLO XXI | | | | | | | | | | | | |
| 500,000 | | | Series 2018-21A(d)(e) | | | 3M US L + 2.45% | | | | 07/18/2027 | | | | 501,544 | |
| 1,000,000 | | | Series 2018-21A(d)(e) | | | 3M US L + 8.25% | | | | 07/18/2027 | | | | 993,153 | |
| | | | Apidos CLO XXIV | | | | | | | | | | | | |
| 1,000,000 | | | Series 2018-24A(d)(e) | | | 3M US L + 5.80% | | | | 10/20/2030 | | | | 952,598 | |
| | | | Babson CLO, Ltd. | | | | | | | | | | | | |
| 500,000 | | | Series 2018-IA(d)(e) | | | 3M US L + 2.60% | | | | 01/20/2031 | | | | 495,382 | |
| | | | Bain Capital Credit CLO 2017-2, Ltd. | | | | | | | | | | | | |
| 500,000 | | | Series 2021-2A(d)(e) | | | 3M US L + 6.50% | | | | 07/25/2034 | | | | 495,165 | |
| 1,000,000 | | | Series 2021-2A(d)(e) | | | 3M US L + 3.10% | | | | 07/25/2034 | | | | 1,005,507 | |
| | | | Barings CLO, Ltd. | | | | | | | | | | | | |
| 500,000 | | | Series 2017-1A(d)(e) | | | 3M US L + 3.60% | | | | 07/18/2029 | | | | 501,235 | |
| 500,000 | | | Series 2018-4A(d)(e) | | | 3M US L + 5.82% | | | | 10/15/2030 | | | | 500,042 | |
| | | | Barings CLO, Ltd. 2019-I | | | | | | | | | | | | |
| 1,500,000 | | | Series 2021-1A(d)(e) | | | 3M US L + 6.86% | | | | 04/15/2036 | | | | 1,502,472 | |
| | | | Barings CLO, Ltd. 2019-II | | | | | | | | | | | | |
| 500,000 | | | Series 2021-2A(d)(e) | | | 3M US L + 3.41% | | | | 04/15/2036 | | | | 502,097 | |
| | | | Barings CLO, Ltd. 2021-II | | | | | | | | | | | | |
| 500,000 | | | Series 2021-2A(d)(e) | | | 3M US L + 3.15% | | | | 07/15/2034 | | | | 500,023 | |
| | | | Beechwood Park CLO, Ltd. | | | | | | | | | | | | |
| 500,000 | | | Series 2019-1A(d)(e) | | | 3M US L + 7.50% | | | | 01/17/2033 | | | | 504,435 | |
| | | | BlueMountain CLO, Ltd. | | | | | | | | | | | | |
| 500,000 | | | Series 2018-3A(d)(e) | | | 3M US L + 2.60% | | | | 04/20/2031 | | | | 467,472 | |
| | | | BlueMountain Fuji US CLO II, Ltd. | | | | | | | | | | | | |
| 1,000,000 | | | Series 2017-2A(d)(e) | | | 3M US L + 3.00% | | | | 10/20/2030 | | | | 990,012 | |
| | | | Buttermilk Park CLO, Ltd. | | | | | | | | | | | | |
| 1,000,000 | | | Series 2018-1A(d)(e) | | | 3M US L + 5.75% | | | | 10/15/2031 | | | | 990,727 | |
| | | | Canyon Capital CLO 2016-2, Ltd. | | | | | | | | | | | | |
| 500,000 | | | Series 2018-2A(d)(e) | | | 3M US L + 3.15% | | | | 10/15/2031 | | | | 500,087 | |
| | | | Canyon Capital CLO 2017-1, Ltd. | | | | | | | | | | | | |
| 500,000 | | | Series 2021-1A(d)(e) | | | 3M US L + 3.00% | | | | 07/15/2030 | | | | 498,873 | |
| | | | Canyon Capital CLO 2019-1, Ltd. | | | | | | | | | | | | |
| 500,000 | | | Series 2021-1A(d)(e) | | | 3M US L + 7.09% | | | | 04/15/2032 | | | | 499,629 | |
| | | | Canyon Capital CLO 2021-2, Ltd. | | | | | | | | | | | | |
| 1,250,000 | | | Series 2021-2A(d)(e) | | | 3M US L + 3.35% | | | | 04/15/2034 | | | | 1,252,727 | |
| | | | Canyon Capital CLO, Ltd. | | | | | | | | | | | | |
| 1,000,000 | | | Series 2018-1A(d)(e) | | | 3M US L + 2.75% | | | | 01/30/2031 | | | | 960,321 | |
| 1,500,000 | | | Series 2018-1A(d)(e) | | | 3M US L + 5.50% | | | | 01/30/2031 | | | | 1,389,276 | |
| 1,000,000 | | | Series 2018-1A(d)(e) | | | 3M US L + 5.75% | | | | 07/15/2031 | | | | 963,060 | |
| 500,000 | | | Series 2018-1A(d)(e) | | | 3M US L + 2.80% | | | | 07/15/2031 | | | | 497,618 | |
See Notes to Financial Statements. | |
56 | (888) 848-7569 | www.rivernorth.com |
RiverNorth/DoubleLine Strategic Income Fund | Schedule of Investments |
September 30, 2021
Principal Amount/Description | | Rate | | | Maturity | | Value |
$ | 500,000 | | | Series 2018-1RA(d)(e) | | | 3M US L + 3.00% | | | | 07/15/2030 | | | $ | 501,250 | |
| | | | Canyon CLO 2021-3, Ltd. | | | | | | | | | | | | |
| 1,000,000 | | | Series 2021-3A(d)(e) | | | 3M US L + 3.05% | | | | 07/15/2034 | | | | 998,907 | |
| | | | Canyon CLO 2021-4, Ltd. | | | | | | | | | | | | |
| 1,000,000 | | | Series 2021-4A(d)(e) | | | 3M US L + 6.30% | | | | 10/15/2034 | | | | 1,000,000 | |
| | | | Canyon CLO, Ltd. | | | | | | | | | | | | |
| 500,000 | | | Series 2018-1A(d)(e) | | | 3M US L + 2.90% | | | | 07/15/2031 | | | | 493,751 | |
| | | | Carlyle Global Market Strategies CLO 2016-3, Ltd. | | | | | | | | | | | | |
| 1,000,000 | | | Series 2021-3A(d)(e) | | | 3M US L + 3.30% | | | | 07/20/2034 | | | | 1,003,806 | |
| | | | Carlyle Global Market Strategies CLO, Ltd. | | | | | | | | | | | | |
| 1,000,000 | | | Series 2018-2RA(d)(e) | | | 3M US L + 5.35% | | | | 05/15/2031 | | | | 920,368 | |
| 500,000 | | | Series 2018-3A(d)(e) | | | 3M US L + 2.85% | | | | 07/28/2028 | | | | 498,981 | |
| | | | Carlyle US CLO 2021-1, Ltd. | | | | | | | | | | | | |
| 500,000 | | | Series 2021-1A(d)(e) | | | 3M US L + 6.00% | | | | 04/15/2034 | | | | 495,269 | |
| | | | Chenango Park CLO, Ltd. | | | | | | | | | | | | |
| 500,000 | | | Series 2018-1A(d)(e) | | | 3M US L + 3.00% | | | | 04/15/2030 | | | | 494,702 | |
| 1,000,000 | | | Series 2018-1A(d)(e) | | | 3M US L + 5.80% | | | | 04/15/2030 | | | | 987,538 | |
| | | | Cook Park CLO, Ltd. | | | | | | | | | | | | |
| 500,000 | | | Series 2018-1A(d)(e) | | | 3M US L + 2.60% | | | | 04/17/2030 | | | | 499,538 | |
| | | | Crown Point CLO IV, Ltd. | | | | | | | | | | | | |
| 500,000 | | | Series 2018-4A(d)(e) | | | 3M US L + 1.90% | | | | 04/20/2031 | | | | 495,670 | |
| | | | Dorchester Park CLO DAC | | | | | | | | | | | | |
| 500,000 | | | Series 2018-1A(d)(e) | | | 3M US L + 2.40% | | | | 04/20/2028 | | | | 501,872 | |
| 875,000 | | | Series 2018-1A(d)(e) | | | 3M US L + 5.00% | | | | 04/20/2028 | | | | 876,531 | |
| | | | Dryden 57 CLO, Ltd. | | | | | | | | | | | | |
| 500,000 | | | Series 2018-57A(d)(e) | | | 3M US L + 2.55% | | | | 05/15/2031 | | | | 490,165 | |
| | | | Dryden 60 CLO, Ltd. | | | | | | | | | | | | |
| 1,000,000 | | | Series 2018-60A(d)(e) | | | 3M US L + 3.00% | | | | 07/15/2031 | | | | 1,003,756 | |
| | | | Elmwood CLO IX, Ltd. | | | | | | | | | | | | |
| 500,000 | | | Series 2021-2A(d)(e) | | | 3M US L + 2.94% | | | | 07/20/2034 | | | | 499,979 | |
| 500,000 | | | Series 2021-2A(d)(e) | | | 3M US L + 5.94% | | | | 07/20/2034 | | | | 499,880 | |
| | | | Fillmore Park CLO, Ltd. | | | | | | | | | | | | |
| 500,000 | | | Series 2018-1A(d)(e) | | | 3M US L + 2.90% | | | | 07/15/2030 | | | | 498,910 | |
| 1,000,000 | | | Series 2018-1A(d)(e) | | | 3M US L + 5.40% | | | | 07/15/2030 | | | | 979,826 | |
| | | | Gilbert Park CLO, Ltd. | | | | | | | | | | | | |
| 1,000,000 | | | Series 2017-1A(d)(e) | | | 3M US L + 6.40% | | | | 10/15/2030 | | | | 1,005,272 | |
| | | | Goldentree Loan Management US CLO, Ltd. | | | | | | | | | | | | |
| 1,000,000 | | | Series 2018-3A(d)(e) | | | 3M US L + 2.85% | | | | 04/20/2030 | | | | 995,282 | |
| | | | KVK CLO 2018-1, Ltd. | | | | | | | | | | | | |
| 500,000 | | | Series 2018-1A(d)(e) | | | 3M US L + 3.00% | | | | 05/20/2029 | | | | 500,191 | |
| | | | Milos CLO, Ltd. | | | | | | | | | | | | |
| 500,000 | | | Series 2020-1A(d)(e) | | | 3M US L + 6.15% | | | | 10/20/2030 | | | | 501,265 | |
| | | | Myers Park CLO, Ltd. | | | | | | | | | | | | |
| 500,000 | | | Series 2018-1A(d)(e) | | | 3M US L + 3.05% | | | | 10/20/2030 | | | | 502,506 | |
See Notes to Financial Statements. | |
Annual Report | September 30, 2021 | 57 |
RiverNorth/DoubleLine Strategic Income Fund | Schedule of Investments |
September 30, 2021
Principal Amount/Description | | Rate | | | Maturity | | Value |
$ | 1,000,000 | | | Series 2018-1A(d)(e) | | | 3M US L + 5.50% | | | | 10/20/2030 | | | $ | 987,403 | |
| | | | Neuberger Berman CLO XXIII, Ltd. | | | | | | | | | | | | |
| 1,000,000 | | | Series 2018-23A(d)(e) | | | 3M US L + 5.75% | | | | 10/17/2027 | | | | 995,542 | |
| | | | Neuberger Berman Loan Advisers CLO 37, Ltd. | | | | | | | | | | | | |
| 500,000 | | | Series 2021-37A(d)(e) | | | 3M US L + 5.75% | | | | 07/20/2031 | | | | 499,984 | |
| | | | Neuberger Berman Loan Advisers CLO 42, Ltd. | | | | | | | | | | | | |
| 500,000 | | | Series 2021-42A(d)(e) | | | 3M US L + 5.95% | | | | 07/16/2035 | | | | 499,980 | |
| | | | Neuberger Berman Loan Advisers Clo 44, Ltd. | | | | | | | | | | | | |
| 1,000,000 | | | Series 2021-44A(d)(e) | | | 3M US L + 6.00% | | | | 10/16/2034 | | | | 1,000,000 | |
| | | | Point Au Roche Park CLO, Ltd. | | | | | | | | | | | | |
| 500,000 | | | Series 2021-1A(d)(e) | | | 3M US L + 6.13% | | | | 07/20/2034 | | | | 499,918 | |
| | | | PPM CLO 3, Ltd. | | | | | | | | | | | | |
| 1,000,000 | | | Series 2021-3A(d)(e) | | | 3M US L + 3.20% | | | | 04/17/2034 | | | | 1,002,221 | |
| | | | Rockland Park CLO, Ltd. | | | | | | | | | | | | |
| 500,000 | | | Series 2021-1A(d)(e) | | | 3M US L + 6.25% | | | | 04/20/2034 | | | | 499,970 | |
| | | | Sound Point CLO XXIII | | | | | | | | | | | | |
| 500,000 | | | Series 2021-2A(d)(e) | | | 3M US L + 3.30% | | | | 07/15/2034 | | | | 503,210 | |
| | | | Sound Point CLO XXIV | | | | | | | | | | | | |
| 1,375,000 | | | Series 2019-3A(d)(e) | | | 3M US L + 7.31% | | | | 10/25/2032 | | | | 1,382,448 | |
| | | | Sound Point CLO XXVI, Ltd. | | | | | | | | | | | | |
| 500,000 | | | Series 2021-1A(d)(e) | | | 3M US L + 3.35% | | | | 07/20/2034 | | | | 503,360 | |
| | | | Sound Point CLO XXVIII, Ltd. | | | | | | | | | | | | |
| 1,000,000 | | | Series 2020-3A(d)(e) | | | 3M US L + 6.90% | | | | 01/25/2032 | | | | 1,006,181 | |
| | | | Stewart Park CLO, Ltd. | | | | | | | | | | | | |
| 500,000 | | | Series 2018-1A(d)(e) | | | 3M US L + 2.60% | | | | 01/15/2030 | | | | 496,119 | |
| | | | Symphony CLO XVII, Ltd. | | | | | | | | | | | | |
| 1,500,000 | | | Series 2018-17A(d)(e) | | | 3M US L + 2.65% | | | | 04/15/2028 | | | | 1,500,429 | |
| | | | Thayer Park CLO, Ltd. | | | | | | | | | | | | |
| 500,000 | | | Series 2021-1A(d)(e) | | | 3M US L + 6.25% | | | | 04/20/2034 | | | | 497,267 | |
| | | | THL Credit Wind River 2017-1 CLO, Ltd. | | | | | | | | | | | | |
| 500,000 | | | Series 2021-1A(d)(e) | | | 3M US L + 3.91% | | | | 04/18/2036 | | | | 495,290 | |
| | | | THL Credit Wind River 2017-3 CLO, Ltd. | | | | | | | | | | | | |
| 750,000 | | | Series 2021-3A(d)(e) | | | 3M US L + 3.88% | | | | 04/15/2035 | | | | 757,970 | |
| 500,000 | | | Series 2021-3A(d)(e) | | | 3M US L + 7.08% | | | | 04/15/2035 | | | | 500,516 | |
| | | | THL Credit Wind River CLO, Ltd. | | | | | | | | | | | | |
| 500,000 | | | Series 2018-1A(d)(e) | | | 2.90% - 3M US L | | | | 07/15/2030 | | | | 484,807 | |
| 2,000,000 | | | Series 2018-1A(d)(e) | | | 5.50% - 3M US L | | | | 07/15/2030 | | | | 1,941,251 | |
| 1,000,000 | | | Series 2018-1A(d)(e) | | | 3M US L + 3.00% | | | | 07/18/2031 | | | | 973,750 | |
| 1,000,000 | | | Series 2018-2A(d)(e) | | | 3M US L + 5.75% | | | | 07/15/2030 | | | | 968,596 | |
| 1,000,000 | | | Series 2018-3A(d)(e) | | | 3M US L + 6.22% | | | | 10/22/2031 | | | | 937,442 | |
| | | | Tryon Park CLO, Ltd. | | | | | | | | | | | | |
| 1,000,000 | | | Series 2018-1A(d)(e) | | | 3M US L + 5.95% | | | | 04/15/2029 | | | | 1,002,958 | |
See Notes to Financial Statements. | |
58 | (888) 848-7569 | www.rivernorth.com |
RiverNorth/DoubleLine Strategic Income Fund | Schedule of Investments |
September 30, 2021
Principal Amount/Description | | Rate | | | Maturity | | Value |
| | | | Upland CLO, Ltd. | | | | | | | | | | | | |
$ | 500,000 | | | Series 2018-1A(d)(e) | | | 3M US L + 2.90% | | | | 04/20/2031 | | | $ | 498,262 | |
| | | | Venture XX CLO, Ltd. | | | | | | | | | | | | |
| 1,000,000 | | | Series 2017-20A(d)(e) | | | 3M US L + 1.90% | | | | 04/15/2027 | | | | 1,002,678 | |
| | | | VERDE CLO, Ltd. | | | | | | | | | | | | |
| 1,000,000 | | | Series 2021-1A(d)(e) | | | 3M US L + 3.25% | | | | 04/15/2032 | | | | 1,001,511 | |
| | | | VOYA CLO 2017-2 | | | | | | | | | | | | |
| 1,000,000 | | | Series 2017-2A(d)(e) | | | 3M US L + 6.02% | | | | 06/07/2030 | | | | 982,515 | |
| | | | Voya CLO, Ltd. | | | | | | | | | | | | |
| 500,000 | | | Series 2018-1A(d)(e) | | | 3M US L + 2.80% | | | | 04/18/2031 | | | | 486,792 | |
| 1,000,000 | | | Series 2018-2A(d)(e) | | | 3M US L + 2.75% | | | | 07/15/2031 | | | | 983,021 | |
| 1,000,000 | | | Series 2018-2A(d)(e) | | | 3M US L + 5.25% | | | | 07/15/2031 | | | | 948,448 | |
| 500,000 | | | Series 2018-3A(d)(e) | | | 3M US L + 6.20% | | | | 10/20/2031 | | | | 467,720 | |
| 500,000 | | | Series 2018-4A(d)(e) | | | 3M US L + 5.95% | | | | 07/14/2031 | | | | 466,250 | |
| | | | Webster Park CLO, Ltd. | | | | | | | | | | | | |
| 1,000,000 | | | Series 2018-1A(d)(e) | | | 5.50% - 3M US L | | | | 07/20/2030 | | | | 992,847 | |
| | | | Wind River 2013-1 CLO, Ltd. | | | | | | | | | | | | |
| 500,000 | | | Series 2017-1A(d)(e) | | | 3M US L + 3.65% | | | | 07/20/2030 | | | | 501,155 | |
| | | | Wind River 2014-3 CLO, Ltd. | | | | | | | | | | | | |
| 1,500,000 | | | Series 2018-3A(d)(e) | | | 3M US L + 3.40% | | | | 10/22/2031 | | | | 1,471,882 | |
| | | | Wind River 2021-2 CLO, Ltd. | | | | | | | | | | | | |
| 500,000 | | | Series 2021-2A(d)(e) | | | 3M US L + 6.43% | | | | 07/20/2034 | | | | 497,941 | |
| | | | | | | | | | | | | | | | |
| TOTAL COLLATERALIZED LOAN OBLIGATIONS | | | | | | | |
| (Cost $68,266,179) | | | | | | | | | | 67,924,288 | |
| | | | | | | | | | | | | | | | |
| EQUITY - LINKED NOTES - 0.00% | | | | | | | | | | | |
| 263,093 | | | Inverpamplona SA(i)(k)(l) | | | 0.00% | | | | 12/30/2028 | | | | – | |
| | | | | | | | | | | | | | | | |
| TOTAL EQUITY - LINKED NOTES | | | | | | | | | | | |
(Cost $11,250) | | | | | | | | | | | – | |
| | | | | | | | | | | | | | | | |
| NON-AGENCY COLLATERALIZED MORTGAGE OBLIGATIONS - 23.50% | | | | |
| | | | Aaset Trust | | | | | | | | | | | | |
| 420,498 | | | Series 2019-2(e) | | | 3.38% | | | | 10/16/2026 | | | | 409,680 | |
| | | | AASET, Ltd. | | | | | | | | | | | | |
| 487,467 | | | Series 2018-1A(e) | | | 3.84% | | | | 09/16/2023 | | | | 474,756 | |
| | | | ABFC Trust | | | | | | | | | | | | |
| 3,035,289 | | | Series 2007-WMC1(d) | | | 1M US L + 1.25% | | | | 06/25/2037 | | | | 2,715,410 | |
| | | | Accredited Mortgage Loan Trust | | | | | | | | | | | | |
| 20,585,000 | | | Series 2006-2(d) | | | 1M US L + 0.29% | | | | 09/25/2036 | | | | 18,042,456 | |
| | | | Adjustable Rate Mortgage Trust | | | | | | | | | | | | |
| 2,527,804 | | | Series 2005-10(d) | | | 2.63% | | | | 01/25/2036 | | | | 2,295,745 | |
| | | | Affirm Asset Securitization Trust | | | | | | | | | | | | |
| 1,750,000 | | | Series 2020-A(e) | | | 6.23% | | | | 10/17/2022 | | | | 1,793,230 | |
See Notes to Financial Statements. | |
Annual Report | September 30, 2021 | 59 |
RiverNorth/DoubleLine Strategic Income Fund | Schedule of Investments |
September 30, 2021
Principal Amount/Description | | Rate | | | Maturity | | Value |
| | | | Alen Mortgage Trust | | | | | | | | | | | | |
$ | 1,107,000 | | | Series 2021-ACEN(d)(e) | | | 1M US L + 4.00% | | | | 04/15/2026 | | | $ | 1,118,181 | |
| | | | Alternative Loan Trust | | | | | | | | | | | | |
| 185,049 | | | Series 2005-20CB | | | 5.50% | | | | 07/25/2035 | | | | 175,168 | |
| 71,605 | | | Series 2005-54CB | | | 5.50% | | | | 11/25/2035 | | | | 53,899 | |
| 820,693 | | | Series 2005-85CB(d) | | | 1M US L + 1.10% | | | | 02/25/2036 | | | | 699,137 | |
| | | | | | | 21.63% - 3.67x | | | | | | | | | |
| 173,317 | | | Series 2005-85CB(d) | | | 1M US L | | | | 02/25/2036 | | | | 215,527 | |
| 219,024 | | | Series 2005-86CB | | | 5.50% | | | | 02/25/2036 | | | | 174,454 | |
| 200,333 | | | Series 2005-9CB(d) | | | 1M US L + 0.50% | | | | 05/25/2035 | | | | 186,733 | |
| 355,792 | | | Series 2005-9CB(d)(m) | | | 5.05% - 1M US L | | | | 05/25/2035 | | | | 35,273 | |
| 1,146,469 | | | Series 2006-15CB | | | 6.50% | | | | 06/25/2036 | | | | 835,541 | |
| 129,759 | | | Series 2006-30T1 | | | 6.25% | | | | 11/25/2036 | | | | 118,102 | |
| 112,114 | | | Series 2006-32CB | | | 5.50% | | | | 11/25/2036 | | | | 85,079 | |
| | | | | | | 28.06% - 4.6 x 1M | | | | | | | | | |
| 269,123 | | | Series 2006-36T2(d) | | | US L | | | | 12/25/2036 | | | | 410,696 | |
| 879,589 | | | Series 2007-19 | | | 6.00% | | | | 08/25/2037 | | | | 628,755 | |
| 2,960,514 | | | Series 2007-20 | | | 6.25% | | | | 08/25/2047 | | | | 2,266,428 | |
| 858,500 | | | Series 2007-23CB(d) | | | 1M US L + 0.50% | | | | 09/25/2037 | | | | 435,152 | |
| 819,724 | | | Series 2007-23CB(d)(m) | | | 6.50% - 1M US L | | | | 09/25/2037 | | | | 260,805 | |
| | | | American Home Mortgage Investment Trust | | | | | | | | | | | | |
| 160,812 | | | Series 2007-A(e)(n) | | | 6.60% | | | | 01/25/2037 | | | | 51,085 | |
| | | | AMSR | | | | | | | | | | | | |
| 5,100,000 | | | Series 2020-SFR3(e) | | | 4.99% | | | | 09/17/2025 | | | | 5,279,761 | |
| 5,000,000 | | | Series 2021-SFR1(d)(e) | | | 4.61% | | | | 06/17/2028 | | | | 5,153,188 | |
| | | | Arbor Realty Commercial Real Estate Notes, Ltd. | | | | | | | | | | | | |
| 800,000 | | | Series 2021-FL2(d)(e) | | | 1M US L + 1.60% | | | | 04/15/2026 | | | | 803,300 | |
| 800,000 | | | Series 2021-FL2(d)(e) | | | 1M US L + 1.95% | | | | 07/15/2026 | | | | 803,550 | |
| | | | AREIT Trust | | | | | | | | | | | | |
| 1,265,000 | | | Series 2019-CRE3(d)(e) | | | 30D SOFR + 2.76% | | | | 09/16/2036 | | | | 1,254,280 | |
| | | | Atlas Senior Loan Fund X, Ltd. | | | | | | | | | | | | |
| 491,101 | | | Series 2018-10A(d)(e) | | | 3M US L + 1.09% | | | | 01/15/2031 | | | | 491,341 | |
| | | | Atrium Hotel Portfolio Trust | | | | | | | | | | | | |
| 1,309,000 | | | Series 2018-ATRM(d)(e) | | | 1M US L + 3.40% | | | | 06/15/2035 | | | | 1,285,523 | |
| | | | Atrium IX | | | | | | | | | | | | |
| 500,000 | | | Series 2017-9A(d)(e) | | | 3M US L + 3.60% | | | | 05/28/2030 | | | | 500,593 | |
| | | | Atrium XIII | | | | | | | | | | | | |
| 1,000,000 | | | Series 2017-13A(d)(e) | | | 3M US L + 6.05% | | | | 11/21/2030 | | | | 984,028 | |
| | | | Atrium XIV LLC | | | | | | | | | | | | |
| 1,000,000 | | | Series 2018-14A(d)(e) | | | 3M US L + 5.65% | | | | 08/23/2030 | | | | 992,736 | |
| | | | Atrium XV | | | | | | | | | | | | |
| 1,000,000 | | | Series 2018-15A(d)(e) | | | 3M US L + 3.00% | | | | 01/23/2031 | | | | 1,001,237 | |
| | | | BAMLL Commercial Mortgage Securities Trust | | | | | | | | | | | | |
| 683,000 | | | Series 2019-AHT(d)(e) | | | 2.57% | | | | 03/15/2034 | | | | 682,277 | |
See Notes to Financial Statements. | |
60 | (888) 848-7569 | www.rivernorth.com |
RiverNorth/DoubleLine Strategic Income Fund | Schedule of Investments |
September 30, 2021
Principal Amount/Description | | Rate | | | Maturity | | Value |
| | | | Banc of America Commercial Mortgage Trust | | | | | | | | | | | | |
$ | 600,000 | | | Series 2015-UBS7(d) | | | 4.50% | | | | 09/15/2025 | | | $ | 628,798 | |
| | | | Banc of America Commercial Mortgage Trust 2016-UBS10 | | | | | | | | | | | | |
| 1,045,000 | | | Series 2016-UB10(d) | | | 5.02% | | | | 05/15/2026 | | | | 1,137,654 | |
| | | | Banc of America Funding Trust | | | | | | | | | | | | |
| 128,463 | | | Series 2006-2 | | | 5.50% | | | | 03/25/2036 | | | | 132,701 | |
| 2,825,733 | | | Series 2010-R5(d)(e) | | | 6.00% | | | | 10/26/2037 | | | | 2,647,254 | |
| | | | Bancorp Commercial Mortgage Trust | | | | | | | | | | | | |
| 547,408 | | | Series 2019-CRE5(d)(e) | | | 1M US L + 1.50% | | | | 01/15/2022 | | | | 547,588 | |
| 1,312,000 | | | Series 2019-CRE5(d)(e) | | | 1M US L + 2.35% | | | | 03/17/2036 | | | | 1,310,493 | |
| | | | BANK | | | | | | | | | | | | |
| 200,000 | | | Series 2017-BNK5(d) | | | 4.40% | | | | 06/15/2027 | | | | 214,674 | |
| 463,000 | | | Series 2018-BN10(d) | | | 4.08% | | | | 01/15/2028 | | | | 511,974 | |
| 10,291,000 | | | Series 2018-BN12(d)(e)(m) | | | 1.50% | | | | 05/15/2061 | | | | 804,376 | |
| | | | BANK 2020-BNK27 | | | | | | | | | | | | |
| 16,875,000 | | | Series 2020-BN27(d)(e)(m) | | | 0.83% | | | | 04/15/2030 | | | | 912,279 | |
| | | | BANK 2021-BNK32 | | | | | | | | | | | | |
| 10,640,773 | | | Series 2021-BN32(d)(m) | | | 0.89% | | | | 04/15/2054 | | | | 626,168 | |
| | | | BBCMS Trust | | | | | | | | | | | | |
| 3,000,000 | | | Series 2018-CBM(d)(e) | | | 1M US L + 3.55% | | | | 07/15/2037 | | | | 2,983,439 | |
| | | | BCAP, LLC Trust | | | | | | | | | | | | |
| 110,098 | | | Series 2007-AA2(d) | | | 7.50% | | | | 04/25/2037 | | | | 80,328 | |
| 71,433 | | | Series 2007-AA2 | | | 6.00% | | | | 04/25/2037 | | | | 50,433 | |
| 5,382,263 | | | Series 2010-RR6(d)(e) | | | 8.42% | | | | 07/26/2036 | | | | 3,847,061 | |
| | | | Bear Stearns ALT-A Trust | | | | | | | | | | | | |
| 7,272,505 | | | Series 2006-3(d) | | | 2.68% | | | | 05/25/2036 | | | | 6,211,192 | |
| 867,545 | | | Series 2006-6(d) | | | 3.25% | | | | 11/25/2036 | | | | 594,339 | |
| | | | Bear Stearns Asset-Backed Securities Trust | | | | | | | | | | | | |
| 1,807,483 | | | Series 2006-AC1(n) | | | 6.25% | | | | 02/25/2036 | | | | 1,209,724 | |
| | | | Bellemeade Real Estate, Ltd. | | | | | | | | | | | | |
| 1,469,148 | | | Series 2019-2A(d)(e) | | | 1M US L + 1.45% | | | | 04/25/2029 | | | | 1,469,366 | |
| | | | Benchmark Mortgage Trust | | | | | | | | | | | | |
| 12,430,439 | | | Series 2018-B2(d)(m) | | | 0.55% | | | | 01/15/2028 | | | | 240,477 | |
| 600,000 | | | Series 2018-B2(d) | | | 4.34% | | | | 01/15/2028 | | | | 652,519 | |
| 22,260,588 | | | Series 2018-B4(d)(m) | | | 0.67% | | | | 06/15/2028 | | | | 567,427 | |
| 1,589,000 | | | Series 2018-B4(d)(e) | | | 2.96% | | | | 07/17/2051 | | | | 1,468,312 | |
| 954,000 | | | Series 2020-B17(d) | | | 3.37% | | | | 03/15/2030 | | | | 986,549 | |
| 522,000 | | | Series 2020-B18(e) | | | 4.14% | | | | 08/15/2025 | | | | 529,224 | |
| 8,327,567 | | | Series 2021-B28(d)(m) | | | 1.41% | | | | 08/15/2031 | | | | 819,384 | |
| | | | BF Mortgage Trust | | | | | | | | | | | | |
| 705,000 | | | Series 2019-NYT(d)(e) | | | 1M US L + 3.00% | | | | 12/15/2035 | | | | 695,550 | |
| | | | BHP Trust | | | | | | | | | | | | |
| 532,700 | | | Series 2019-BXHP(d)(e) | | | 1M US L + 2.57% | | | | 08/15/2021 | | | | 531,642 | |
See Notes to Financial Statements. | |
Annual Report | September 30, 2021 | 61 |
RiverNorth/DoubleLine Strategic Income Fund | Schedule of Investments |
September 30, 2021
Principal Amount/Description | | Rate | | | Maturity | | Value |
| | | | Blackbird Capital Aircraft | | | | | | | | | | | | |
$ | 1,492,188 | | | Series 2021-1A(e) | | | 3.45% | | | | 07/15/2028 | | | $ | 1,505,281 | |
| | | | BSPRT Issuer, Ltd. | | | | | | | | | | | | |
| 650,000 | | | Series 2021-FL6(d)(e) | | | 1M US L + 1.10% | | | | 03/15/2036 | | | | 650,975 | |
| | | | BX Commercial Mortgage Trust | | | | | | | | | | | | |
| 834,000 | | | Series 2021-VOLT(d)(e) | | | 1M US L + 2.40% | | | | 09/15/2023 | | | | 837,306 | |
| | | | BX Trust | | | | | | | | | | | | |
| 636,000 | | | Series 2019-OC11(d)(e) | | | 4.08% | | | | 12/09/2029 | | | | 674,380 | |
| 2,964,000 | | | Series 2019-OC11(d)(e) | | | 4.08% | | | | 12/06/2041 | | | | 3,064,219 | |
| | | | Cantor Commercial Real Estate Lending | | | | | | | | | | | | |
| 1,113,000 | | | Series 2019-CF1(d)(e) | | | 4.12% | | | | 04/15/2024 | | | | 1,089,497 | |
| | | | Carbon Capital VI Commercial Mortgage Trust | | | | | | | | | | | | |
| 680,000 | | | Series 2019-FL2(d)(e) | | | 1M US L + 2.85% | | | | 11/15/2021 | | | | 655,723 | |
| | | | Carvana Auto Receivables Trust | | | | | | | | | | | | |
| 5,300 | | | Series 2021-N1(e)(i) | | | 0.00% | | | | 01/10/2028 | | | | 2,796,078 | |
| 5,250 | | | Series 2021-N2(e)(i) | | | 0.00% | | | | 03/10/2028 | | | | 3,358,049 | |
| | | | Cascade MH Asset Trust | | | | | | | | | | | | |
| 4,601,000 | | | Series 2019-MH1(d)(e) | | | 5.99% | | | | 10/25/2024 | | | | 4,769,501 | |
| | | | Castlelake Aircraft Securitization Trust | | | | | | | | | | | | |
| 3,236,825 | | | Series 2018-1(e) | | | 6.63% | | | | 06/15/2043 | | | | 2,551,320 | |
| | | | Castlelake Aircraft Structured Trust | | | | | | | | | | | | |
| 557,035 | | | Series 2019-1A(e) | | | 3.97% | | | | 04/15/2026 | | | | 562,607 | |
| 2,750,000 | | | Series 2019-1A(e)(i) | | | 0.00% | | | | 04/15/2039 | | | | 852,500 | |
| | | | CD Mortgage Trust | | | | | | | | | | | | |
| 750,000 | | | Series 2017-CD4(d) | | | 4.35% | | | | 04/10/2027 | | | | 807,363 | |
| | | | CF Trust | | | | | | | | | | | | |
| 1,518,000 | | | Series 2019-MF1(d)(e) | | | 1M US L + 2.95% | | | | 11/15/2021 | | | | 1,510,871 | |
| | | | Chase Mortgage Finance Trust | | | | | | | | | | | | |
| 10,551,939 | | | Series 2007-S2 | | | 6.00% | | | | 03/25/2037 | | | | 7,404,773 | |
| 368,066 | | | Series 2007-S3 | | | 5.50% | | | | 05/25/2037 | | | | 108,256 | |
| | | | CIFC Funding, Ltd. | | | | | | | | | | | | |
| 850,000 | | | Series 2021-1A(d)(e) | | | 3M US L + 6.00% | | | | 04/25/2033 | | | | 843,749 | |
| 500,000 | | | Series 2021-4A(d)(e) | | | 3M US L + 2.85% | | | | 07/15/2033 | | | | 499,996 | |
| 500,000 | | | Series 2021-4A(d)(e) | | | 3M US L + 5.95% | | | | 07/15/2033 | | | | 500,050 | |
| 2,500,000 | | | Series 2021-5A(d)(e) | | | 3M US L + 6.50% | | | | 07/15/2034 | | | | 2,499,533 | |
| | | | Citicorp Mortgage Securities Trust | | | | | | | | | | | | |
| 370,881 | | | Series 2007-1 | | | 6.00% | | | | 01/25/2037 | | | | 374,853 | |
| | | | Citigroup Commercial Mortgage Trust | | | | | | | | | | | | |
| 3,516,667 | | | Series 2014-GC25(d)(m) | | | 0.96% | | | | 10/10/2047 | | | | 86,421 | |
| 866,000 | | | Series 2015-GC27(d)(e) | | | 4.42% | | | | 02/12/2048 | | | | 856,213 | |
| 400,000 | | | Series 2015-GC31(d) | | | 4.05% | | | | 06/10/2025 | | | | 417,462 | |
See Notes to Financial Statements. | |
62 | (888) 848-7569 | www.rivernorth.com |
RiverNorth/DoubleLine Strategic Income Fund | Schedule of Investments |
September 30, 2021
Principal Amount/Description | | Rate | | | Maturity | | Value |
$ | 344,000 | | | Series 2016-GC36(e) | | | 2.85% | | | | 02/12/2049 | | | $ | 246,461 | |
| 464,000 | | | Series 2017-C4(d) | | | 4.10% | | | | 10/12/2027 | | | | 504,842 | |
| 463,000 | | | Series 2018-B2(d) | | | 4.28% | | | | 03/10/2028 | | | | 511,862 | |
| 520,000 | | | Series 2019-GC41 | | | 3.20% | | | | 08/10/2029 | | | | 549,426 | |
| 1,000,000 | | | Series 2019-SMRT(d)(e) | | | 4.75% | | | | 01/10/2036 | | | | 1,048,725 | |
| 1,433,000 | | | Series 2020-555(d)(e) | | | 3.62% | | | | 12/12/2041 | | | | 1,150,694 | |
| 1,000,000 | | | Series 2020-GC46(e) | | | 2.60% | | | | 02/15/2030 | | | | 816,341 | |
| | | | Citigroup Mortgage Loan Trust | | | | | | | | | | | | |
| 685,423 | | | Series 2006-WF1(n) | | | 4.86% | | | | 03/25/2036 | | | | 415,594 | |
| 1,045,654 | | | Series 2007-OPX1(n) | | | 6.33% | | | | 01/25/2037 | | | | 521,064 | |
| | | | CitiMortgage Alternative Loan Trust | | | | | | | | | | | | |
| 405,493 | | | Series 2007-A1 | | | 6.00% | | | | 01/25/2037 | | | | 405,457 | |
| 79,871 | | | Series 2007-A1(d)(m) | | | 5.40% - 1M US L | | | | 01/25/2037 | | | | 13,223 | |
| 58,136 | | | Series 2007-A3(d) | | | 6.00% | | | | 03/25/2037 | | | | 60,005 | |
| 133,788 | | | Series 2007-A3(d)(m) | | | 5.40% - 1M US L | | | | 03/25/2037 | | | | 22,449 | |
| 422,285 | | | Series 2007-A6 | | | 5.50% | | | | 06/25/2037 | | | | 399,389 | |
| | | | CLNC, Ltd. | | | | | | | | | | | | |
| | | | | | | 30D US SOFR + | | | | | | | | | |
| 1,037,000 | | | Series 2019-FL1(d)(e) | | | 1.66448% | | | | 12/19/2025 | | | | 1,039,540 | |
| | | | COMM 2014-CCRE16 Mortgage Trust | | | | | | | | | | | | |
| 1,100,000 | | | Series 2014-CR16(d) | | | 5.08% | | | | 04/10/2024 | | | | 1,161,548 | |
| | | | COMM Mortgage Trust | | | | | | | | | | | | |
| 887,000 | | | Series 2013-CR11(d) | | | 5.11% | | | | 09/10/2023 | | | | 952,051 | |
| | | | Commercial Mortgage Pass- Through Certificates | | | | | | | | | | | | |
| 242,400 | | | Series 2014-CR19(d) | | | 4.70% | | | | 08/10/2024 | | | | 254,889 | |
| 604,000 | | | Series 2014-CR20(d) | | | 4.50% | | | | 10/10/2024 | | | | 624,906 | |
| 8,643,268 | | | Series 2014-UBS4(e) | | | 3.75% | | | | 08/10/2024 | | | | 1,171,362 | |
| 11,000 | | | Series 2014-UBS4(d)(e)(i) | | | 0.00% | | | | 08/10/2047 | | | | 1 | |
| 3,160,620 | | | Series 2015-CR22(d)(m) | | | 0.89% | | | | 03/10/2025 | | | | 70,028 | |
| 916,000 | | | Series 2015-CR25(d) | | | 4.53% | | | | 08/12/2048 | | | | 980,237 | |
| 4,498,982 | | | Series 2015-CR26(d)(m) | | | 0.93% | | | | 09/10/2025 | | | | 140,235 | |
| 419,000 | | | Series 2015-LC23(d) | | | 4.62% | | | | 10/10/2025 | | | | 449,833 | |
| | | | CORE Mortgage Trust | | | | | | | | | | | | |
| 432,000 | | | Series 2019-CORE(d)(e) | | | 1M US L + 1.90% | | | | 12/15/2031 | | | | 430,420 | |
| 432,000 | | | Series 2019-CORE(d)(e) | | | 1M US L + 2.35% | | | | 12/15/2031 | | | | 425,224 | |
| | | | Countrywide Home Loan Mortgage Pass-Through Trust | | | | | | | | | | | | |
| 1,686,627 | | | Series 2005-HYB7(d) | | | 2.74% | | | | 11/20/2035 | | | | 1,570,242 | |
| 26,568 | | | Series 2005-J4 | | | 5.50% | | | | 11/25/2035 | | | | 25,672 | |
| 1,394,665 | | | Series 2006-18 | | | 6.00% | | | | 12/25/2036 | | | | 1,068,105 | |
| 190,481 | | | Series 2007-17 | | | 6.00% | | | | 10/25/2037 | | | | 175,368 | |
| 242,525 | | | Series 2007-3 | | | 6.00% | | | | 04/25/2037 | | | | 175,340 | |
| 260,366 | | | Series 2007-7 | | | 5.75% | | | | 06/25/2037 | | | | 186,762 | |
See Notes to Financial Statements. | |
Annual Report | September 30, 2021 | 63 |
| RiverNorth/DoubleLine Strategic Income Fund | Schedule of Investments |
September 30, 2021
| Principal Amount/Description | | Rate | | | Maturity | | | Value | |
| | | | | Credit Suisse First Boston Mortgage Securities Corp. | | | | | | | | | | |
| $ | 55,516 | | | Series 2005-10 | | 5.50% | | | 11/25/2035 | | | $ | 51,083 | |
| | 50,388 | | | Series 2005-8 | | 5.50% | | | 08/25/2025 | | | | 48,719 | |
| | 4,040,606 | | | Series 2005-9 | | 6.00% | | | 10/25/2035 | | | | 1,766,151 | |
| | | | | Credit Suisse Mortgage Capital Certificates | | | | | | | | | | |
| | 2,187,900 | | | Series 2006-2 | | 5.75% | | | 03/25/2036 | | | | 1,576,335 | �� |
| | | | | CSAB Mortgage-Backed Trust | | | | | | | | | | |
| | 8,781,274 | | | Series 2006-2(n) | | 6.20% | | | 09/25/2036 | | | | 1,291,572 | |
| | 135,161 | | | Series 2007-1(d) | | 5.90% | | | 05/25/2037 | | | | 49,695 | |
| | | | | CSAIL Commercial Mortgage Trust | | | | | | | | | | |
| | 5,134,448 | | | Series 2015-C1(d)(m) | | 0.97% | | | 01/15/2025 | | | | 115,173 | |
| | 419,000 | | | Series 2015-C4(d) | | 4.71% | | | 11/15/2025 | | | | 446,641 | |
| | 490,000 | | | Series 2016-C6(d) | | 5.09% | | | 04/15/2026 | | | | 520,681 | |
| | 1,362,000 | | | Series 2016-C6(d)(e) | | 5.09% | | | 01/15/2049 | | | | 1,224,522 | |
| | 214,000 | | | Series 2018-C14(d) | | 5.05% | | | 10/15/2028 | | | | 237,267 | |
| | | | | CSMC Mortgage-Backed Trust | | | | | | | | | | |
| | 160,160 | | | Series 2006-1 | | 6.00% | | | 02/25/2036 | | | | 82,053 | |
| | 20,824 | | | Series 2006-4 | | 5.50% | | | 10/31/2021 | | | | 18,532 | |
| | 788,967 | | | Series 2006-5 | | 6.25% | | | 06/25/2036 | | | | 269,403 | |
| | 73,501 | | | Series 2006-9 | | 6.00% | | | 11/25/2036 | | | | 59,632 | |
| | 6,018 | | | Series 2007-2 | | 5.00% | | | 03/25/2037 | | | | 5,699 | |
| | 492,505 | | | Series 2007-3(d) | | 5.84% | | | 04/25/2037 | | | | 180,764 | |
| | 253,000 | | | Series 2017-CHOP(d)(e) | | 1M US L + 1.90% | | | 07/15/2032 | | | | 249,506 | |
| | 223,000 | | | Series 2017-CHOP(d)(e) | | 1M US L + 3.30% | | | 07/15/2032 | | | | 213,942 | |
| | | | | DataBank Issuer | | | | | | | | | | |
| | 636,000 | | | Series 2021-1A(e) | | 2.65% | | | 02/25/2026 | | | | 647,211 | |
| | | | | DB Master Finance LLC | | | | | | | | | | |
| | 980,000 | | | Series 2019-1A(e) | | 3.79% | | | 02/20/2024 | | | | 988,820 | |
| | | | | DBGS Mortgage Trust | | | | | | | | | | |
| | 861,313 | | | Series 2018-BIOD(d)(e) | | 1M US L + 2.00% | | | 05/15/2035 | | | | 863,327 | |
| | | | | DBJPM 16-C1 Mortgage Trust | | | | | | | | | | |
| | 1,309,000 | | | Series 2016-C1(d) | | 3.33% | | | 05/12/2049 | | | | 1,270,252 | |
| | | | | Deutsche Alt-A Securities, Inc. Mortgage Loan Trust | | | | | | | | | | |
| | 218,983 | | | Series 2005-6(d)(m) | | 5.08% - 1M US L | | | 12/25/2035 | | | | 35,438 | |
| | 96,021 | | | Series 2005-6(d) | | 1M US L + 1.40% | | | 12/25/2035 | | | | 74,178 | |
| | | | | Deutsche Mortgage Securities, Inc. Mortgage Loan Trust | | | | | | | | | | |
| | 135,330 | | | Series 2006-PR1(d)(e) | | 12.12% - 1M US L | | | 04/15/2036 | | | | 142,808 | |
| | | | | Diamond Infrastructure Funding LLC | | | | | | | | | | |
| | 1,000,000 | | | Series 2021-1A(e) | | 2.36% | | | 12/20/2026 | | | | 990,682 | |
| | 2,000,000 | | | Series 2021-1A(e) | | 3.48% | | | 12/20/2026 | | | | 2,005,459 | |
See Notes to Financial Statements.
| 64 | (888) 848-7569 | www.rivernorth.com |
| RiverNorth/DoubleLine Strategic Income Fund | Schedule of Investments |
September 30, 2021
| Principal Amount/Description | | Rate | | | Maturity | | | Value | |
| | | | | DOLP Trust | | | | | | | | | | |
| $ | 1,000,000 | | | Series 2021-NYC(d)(e) | | 3.70% | | | 05/10/2031 | | | $ | 1,017,974 | |
| | | | | Dryden 38 Senior Loan Fund | | | | | | | | | | |
| | 1,000,000 | | | Series 2018-38A(d)(e) | | 3M US L + 5.60% | | | 07/15/2030 | | | | 970,757 | |
| | | | | Dryden 40 Senior Loan Fund | | | | | | | | | | |
| | 1,000,000 | | | Series 2018-40A(d)(e) | | 3M US L + 5.75% | | | 08/15/2031 | | | | 987,500 | |
| | 500,000 | | | Series 2018-40A(d)(e) | | 3M US L + 3.10% | | | 08/15/2031 | | | | 499,625 | |
| | | | | Dryden 42 Senior Loan Fund | | | | | | | | | | |
| | 500,000 | | | Series 2018-42A(d)(e) | | 3M US L + 2.93% | | | 07/15/2030 | | | | 499,801 | |
| | | | | Fannie Mae-Aces | | | | | | | | | | |
| | 24,934,361 | | | Series 2019-M12(d)(m) | | 0.70% | | | 06/25/2029 | | | | 1,237,323 | |
| | 16,976,399 | | | Series 2019-M24(d)(m) | | 1.15% | | | 03/25/2031 | | | | 1,512,044 | |
| | 49,000,956 | | | Series 2019-M7(d)(m) | | 0.35% | | | 04/25/2029 | | | | 1,605,506 | |
| | 56,108,313 | | | Series 2020-M10(d)(m) | | 0.82% | | | 12/25/2027 | | | | 2,155,664 | |
| | 56,785,652 | | | Series 2020-M10(d)(m) | | 0.87% | | | 07/25/2032 | | | | 4,107,749 | |
| | 17,059,813 | | | Series 2020-M13(d)(m) | | 1.30% | | | 09/25/2030 | | | | 1,415,040 | |
| | | | | First Horizon Alternative Mortgage Securities Trust | | | | | | | | | | |
| | 628,232 | | | Series 2005-FA6 | | 5.50% | | | 09/25/2035 | | | | 508,640 | |
| | 115,564 | | | Series 2007-FA2 | | 6.00% | | | 04/25/2037 | | | | 65,607 | |
| | | | | First Horizon Mortgage Pass- Through Trust | | | | | | | | | | |
| | 721,689 | | | Series 2007-AR3(d) | | 2.76% | | | 11/25/2037 | | | | 502,876 | |
| | | | | FirstKey Homes | | | | | | | | | | |
| | 1,100,000 | | | Series 2020-SFR1(e) | | 4.28% | | | 08/19/2037 | | | | 1,131,781 | |
| | | | | Fontainebleau Miami Beach Trust | | | | | | | | | | |
| | 492,000 | | | Series 2019-FBLU(d)(e) | | 3.96% | | | 12/10/2024 | | | | 501,950 | |
| | 1,656,000 | | | Series 2019-FBLU(d)(e) | | 3.96% | | | 12/12/2036 | | | | 1,616,078 | |
| | | | | FREMF Mortgage Trust | | | | | | | | | | |
| | 890,367 | | | Series 2015-KF07(d)(e) | | 1M US L + 4.95% | | | 02/25/2025 | | | | 894,906 | |
| | 753,922 | | | Series 2015-KF09(d)(e) | | 1M US L + 5.35% | | | 05/25/2022 | | | | 754,360 | |
| | 1,000,094 | | | Series 2016-KF19(d)(e) | | 1M US L + 5.50% | | | 06/25/2023 | | | | 1,002,579 | |
| | 999,779 | | | Series 2016-KF22(d)(e) | | 1M US L + 5.05% | | | 07/25/2023 | | | | 1,011,171 | |
| | 887,222 | | | Series 2016-KF25(d)(e) | | 1M US L + 5.00% | | | 10/25/2023 | | | | 889,149 | |
| | 825,000 | | | Series 2018-K74(d)(e) | | 4.23% | | | 02/25/2028 | | | | 895,599 | |
| | 2,252,869 | | | Series 2018-KF56(d)(e) | | 1M US L + 5.80% | | | 11/25/2028 | | | | 2,276,987 | |
| | 820,000 | | | Series 2019-K736(d)(e) | | 3.88% | | | 07/25/2026 | | | | 873,796 | |
| | | | | FRTKL | | | | | | | | | | |
| | 4,050,000 | | | Series 2021-SFR1(e) | | 4.11% | | | 09/17/2026 | | | | 4,078,427 | |
| | | | | GAIA Aviation, Ltd. | | | | | | | | | | |
| | 495,472 | | | Series 2019-1(e)(n) | | 3.97% | | | 12/15/2026 | | | | 494,004 | |
| | 400,925 | | | Series 2019-1(e)(n) | | 7.00% | | | 12/15/2026 | | | | 324,171 | |
| | | | | Ginnie Mae Strip | | | | | | | | | | |
| | 7,555,999 | | | Series 2020-3(m) | | 1.40% | | | 09/16/2045 | | | | 666,039 | |
| | | | | Government National Mortgage Association | | | | | | | | | | |
| | 22,903,208 | | | Series 2016-162(d)(m) | | 0.82% | | | 09/16/2058 | | | | 1,127,516 | |
See Notes to Financial Statements.
| Annual Report | September 30, 2021 | 65 |
| RiverNorth/DoubleLine Strategic Income Fund | Schedule of Investments |
| September 30, 2021 |
| Principal Amount/Description | | Rate | | | Maturity | | | Value | |
| $ | 19,140,233 | | | Series 2020-168(d)(m) | | 0.99% | | | 12/16/2062 | | | $ | 1,590,781 | |
| | 2,649,000 | | | Series 2021-164(d)(m) | | 0.97% | | | 10/16/2063 | | | | 235,336 | |
| | 21,018,699 | | | Series 2021-52(d)(m) | | 0.85% | | | 04/16/2063 | | | | 1,627,505 | |
| | | | | Great Wolf Trust | | | | | | | | | | |
| | 3,084,000 | | | Series 2019-WOLF(d)(e) | | 1M US L + 3.13% | | | 12/15/2036 | | | | 3,030,767 | |
| | | | | GS Mortgage Securities Corp. Trust | | | | | | | | | | |
| | 1,000,000 | | | Series 2018-RIVR(d)(e) | | 1M US L + 1.55% | | | 07/15/2035 | | | | 946,857 | |
| | | | | GS Mortgage Securities Corportation Trust | | | | | | | | | | |
| | 691,000 | | | Series 2021-IP(d)(e) | | 1M US L + 2.10% | | | 10/15/2023 | | | | 692,719 | |
| | 691,000 | | | Series 2021-IP(d)(e) | | 1M US L + 3.55% | | | 10/15/2023 | | | | 692,719 | |
| | | | | GS Mortgage Securities Trust | | | | | | | | | | |
| | 13,162 | | | Series 2011-GC3(d)(e)(m) | | 0.29% | | | 03/10/2044 | | | | 0 | |
| | 404,683 | | | Series 2011-GC5(d)(e)(m) | | 0.00% | | | 08/10/2044 | | | | 4 | |
| | 3,538,000 | | | Series 2014-GC26(d)(e) | | 4.51% | | | 11/10/2047 | | | | 2,411,138 | |
| | 1,110,000 | | | Series 2015-GC28(d)(e) | | 4.46% | | | 02/10/2048 | | | | 1,123,197 | |
| | 7,081,444 | | | Series 2015-GS1(d)(m) | | 0.77% | | | 11/10/2025 | | | | 201,152 | |
| | 260,000 | | | Series 2016-GS2(d) | | 3.76% | | | 04/10/2026 | | | | 277,860 | |
| | 1,954,000 | | | Series 2018-TWR(d)(e) | | 1M US L + 3.92% | | | 07/15/2031 | | | | 1,796,885 | |
| | 636,000 | | | Series 2020-GC45(d) | | 3.41% | | | 12/13/2029 | | | | 677,885 | |
| | | | | GSAA Home Equity Trust | | | | | | | | | | |
| | 2,066,678 | | | Series 2006-13(d) | | 6.04% | | | 07/25/2036 | | | | 898,016 | |
| | 486,878 | | | Series 2006-18(n) | | 6.18% | | | 11/25/2036 | | | | 181,642 | |
| | 152,088 | | | Series 2006-6(d) | | 5.69% | | | 03/25/2036 | | | | 62,900 | |
| | 864,305 | | | Series 2007-2(n) | | 6.60% | | | 03/25/2037 | | | | 297,125 | |
| | | | | GSCG Trust | | | | | | | | | | |
| | 1,303,000 | | | Series 2019-600C(d)(e) | | 3.99% | | | 09/06/2024 | | | | 1,250,183 | |
| | | | | GSR Mortgage Loan Trust | | | | | | | | | | |
| | 1,036,882 | | | Series 2006-2F | | 5.25% | | | 02/25/2036 | | | | 636,210 | |
| | 30,771 | | | Series 2007-2F | | 5.75% | | | 02/25/2037 | | | | 471,886 | |
| | 1,882,958 | | | Series 2007-2F | | 6.00% | | | 03/25/2037 | | | | 1,375,297 | |
| | 828,406 | | | Series 2007-AR2(d) | | 2.84% | | | 05/25/2037 | | | | 630,483 | |
| | | | | Halcyon Loan Advisors Funding, Ltd. | | | | | | | | | | |
| | 94,581 | | | Series 2013-2A(d)(e) | | 3M US L + 2.70% | | | 08/01/2025 | | | | 94,842 | |
| | | | | Hardee's Funding LLC | | | | | | | | | | |
| | 970,000 | | | Series 2018-1A(e) | | 5.71% | | | 06/20/2028 | | | | 1,089,427 | |
| | | | | Hawaii Hotel Trust | | | | | | | | | | |
| | 1,391,000 | | | Series 2019-MAUI(d)(e) | | 1M US L + 2.75% | | | 05/15/2038 | | | | 1,389,984 | |
| | | | | Hayfin Kingsland X, Ltd. | | | | | | | | | | |
| | 500,000 | | | Series 2021-1A(d)(e) | | 3M US L + 1.85% | | | 04/28/2031 | | | | 500,059 | |
| | | | | Highbridge Loan Management 3- 2014 | | | | | | | | | | |
| | 500,000 | | | Series 2017-2014(d)(e) | | 3M US L + 3.60% | | | 07/18/2029 | | | | 497,105 | |
See Notes to Financial Statements.
| 66 | (888) 848-7569 | www.rivernorth.com |
| RiverNorth/DoubleLine Strategic Income Fund | Schedule of Investments |
September 30, 2021
| Principal Amount/Description | | Rate | | | Maturity | | | Value | |
| | | | | Highbridge Loan Management 4- 2014, Ltd. | | | | | | | | | | |
| $ | 500,000 | | | Series 2018-2014(d)(e) | | 3M US L + 5.55% | | | 01/28/2030 | | | $ | 485,039 | |
| | | | | Highbridge Loan Management, Ltd. | | | | | | | | | | |
| | 500,000 | | | Series 2017-2A(d)(e) | | 3M US L + 6.60% | | | 10/20/2029 | | | | 493,384 | |
| | 2,000,000 | | | Series 2018-2015(d)(e) | | 3M US L + 5.10% | | | 02/05/2031 | | | | 1,875,000 | |
| | 500,000 | | | Series 2018-2016(d)(e) | | 3M US L + 2.90% | | | 07/20/2030 | | | | 488,074 | |
| | | | | Horizon Aircraft Finance III, Ltd. | | | | | | | | | | |
| | 922,221 | | | Series 2019-2(e) | | 3.43% | | | 11/15/2026 | | | | 922,354 | |
| | | | | HPLY Trust | | | | | | | | | | |
| | 567,847 | | | Series 2019-HIT(d)(e) | | 1M US L + 3.15% | | | 11/15/2021 | | | | 560,008 | |
| | 1,131,627 | | | Series 2019-HIT(d)(e) | | 1M US L + 3.90% | | | 11/17/2036 | | | | 1,104,227 | |
| | | | | HSI Asset Securitization Corp. Trust | | | | | | | | | | |
| | 8,739,315 | | | Series 2006-HE1(d) | | 1M US L + 0.28% | | | 10/25/2036 | | | | 3,783,719 | |
| | 1,458,505 | | | Series 2007-NC1(d) | | 1M US L + 0.18% | | | 04/25/2037 | | | | 1,166,617 | |
| | | | | IndyMac IMJA Mortgage Loan Trust | | | | | | | | | | |
| | 1,044,835 | | | Series 2007-A1 | | 6.00% | | | 08/25/2037 | | | | 606,895 | |
| | | | | IndyMac IMSC Mortgage Loan Trust | | | | | | | | | | |
| | 4,662,276 | | | Series 2007-F2 | | 6.50% | | | 07/25/2037 | | | | 2,344,870 | |
| | | | | IndyMac Index Mortgage Loan Trust | | | | | | | | | | |
| | 1,732,573 | | | Series 2006-AR25(d) | | 2.93% | | | 09/25/2036 | | | | 1,749,403 | |
| | | | | Invitation Homes | | | | | | | | | | |
| | 994,857 | | | Series 2018-SFR1(d)(e) | | 1M US L + 1.25% | | | 03/17/2037 | | | | 997,799 | |
| | | | | ITE Rail Fund Levered LP | | | | | | | | | | |
| | 971,270 | | | Series 2021-1A(e) | | 2.25% | | | 02/28/2051 | | | | 978,554 | |
| | | | | JOL Air, Ltd. | | | | | | | | | | |
| | 839,893 | | | Series 2019-1(e) | | 3.97% | | | 04/15/2026 | | | | 836,015 | |
| | | | | JP Morgan Alternative Loan Trust | | | | | | | | | | |
| | 203,065 | | | Series 2005-S1 | | 6.00% | | | 12/25/2035 | | | | 183,371 | |
| | 62,172 | | | Series 2006-S3(n) | | 6.62% | | | 08/25/2036 | | | | 62,482 | |
| | | | | JP Morgan BB Commercial Mortgage Securities Trust | | | | | | | | | | |
| | 400,000 | | | Series 2014-C21(d) | | 4.80% | | | 07/15/2024 | | | | 420,825 | |
| | 2,086,000 | | | Series 2014-C23(d)(e) | | 3.36% | | | 11/18/2048 | | | | 1,639,327 | |
| | 388,000 | | | Series 2014-C26(d) | | 4.52% | | | 12/15/2024 | | | | 402,900 | |
| | 4,401,760 | | | Series 2015-C28(d)(m) | | 1.10% | | | 03/15/2025 | | | | 113,627 | |
| | 542,000 | | | Series 2015-C28 | | 3.99% | | | 10/19/2048 | | | | 560,109 | |
| | 8,581,914 | | | Series 2015-C30(d)(m) | | 0.64% | | | 07/15/2025 | | | | 142,658 | |
| | 3,357,436 | | | Series 2015-C31(d)(m) | | 0.98% | | | 08/15/2025 | | | | 94,786 | |
| | | | | JP Morgan Chase Commercial Mortgage Securities Corp. | | | | | | | | | | |
| | 2,092,000 | | | Series 2018-AON(d)(e) | | 4.61% | | | 07/05/2023 | | | | 2,125,474 | |
See Notes to Financial Statements.
| Annual Report | September 30, 2021 | 67 |
| RiverNorth/DoubleLine Strategic Income Fund | Schedule of Investments |
September 30, 2021
| Principal Amount/Description | | Rate | | | Maturity | | | Value | |
| | | | | JP Morgan Chase Commercial Mortgage Securities Trust | | | | | | | | | | |
| $ | 4,911 | | | Series 2006-LDP8(d)(m) | | 0.23% | | | 05/15/2045 | | | $ | 0 | |
| | 1,157,000 | | | Series 2011-C3(d)(e) | | 5.71% | | | 02/15/2046 | | | | 439,283 | |
| | 2,154,134 | | | Series 2012-C8(d)(m) | | 1.88% | | | 09/15/2022 | | | | 18,737 | |
| | 1,010,000 | | | Series 2018-WPT(d)(e) | | 5.54% | | | 07/05/2023 | | | | 1,033,181 | |
| | 704,000 | | | Series 2019-MFP(d)(e) | | 1M US L + 3.00% | | | 07/15/2036 | | | | 694,858 | |
| | 235,000 | | | Series 2019-UES(e) | | 4.34% | | | 05/05/2032 | | | | 238,116 | |
| | 1,135,000 | | | Series 2019-UES(d)(e) | | 4.45% | | | 05/05/2032 | | | | 1,076,700 | |
| | 915,000 | | | Series 2021-MHC(d)(e) | | 1M US L + 2.45% | | | 04/15/2026 | | | | 918,558 | |
| | | | | JP Morgan Mortgage Acquisition Corp. | | | | | | | | | | |
| | 3,900,000 | | | Series 2005-WMC1(d) | | 1M US L + 0.90% | | | 09/25/2035 | | | | 3,790,886 | |
| | 219,269 | | | Series 2006-CH2(n) | | 5.46% | | | 09/25/2029 | | | | 170,754 | |
| | | | | JP Morgan Mortgage Acquisition Trust | | | | | | | | | | |
| | 3,807,125 | | | Series 2006-RM1(d) | | 1M US L + 0.48% | | | 08/25/2036 | | | | 2,307,799 | |
| | | | | JP Morgan Mortgage Trust | | | | | | | | | | |
| | 892,655 | | | Series 2007-S3 | | 6.00% | | | 07/25/2037 | | | | 648,825 | |
| | | | | JP Morgan Resecuritization Trust | | | | | | | | | | |
| | 684,589 | | | Series 2011-1(d)(e) | | 6.00% | | | 06/26/2037 | | | | 641,920 | |
| | | | | JPMBB Commercial Mortgage Securities Trust | | | | | | | | | | |
| | 1,000,000 | | | Series 2013-C12(d) | | 4.24% | | | 06/15/2023 | | | | 1,035,550 | |
| | 18,681,038 | | | Series 2014-C24(d)(m) | | 1.05% | | | 09/17/2047 | | | | 376,929 | |
| | 1,110,000 | | | Series 2014-C26(d)(e) | | 4.02% | | | 12/15/2024 | | | | 1,092,327 | |
| | 519,000 | | | Series 2015-C27(d) | | 4.44% | | | 02/15/2025 | | | | 533,098 | |
| | | | | JPMCC Commercial Mortgage Securities Trust | | | | | | | | | | |
| | 486,000 | | | Series 2017-JP7(d) | | 3.79% | | | 07/15/2027 | | | | 512,175 | |
| | | | | JPMDB Commercial Mortgage Securities Trust | | | | | | | | | | |
| | 421,000 | | | Series 2020-COR7(d) | | 3.85% | | | 03/13/2030 | | | | 447,277 | |
| | | | | Kestrel Aircraft Funding, Ltd. | | | | | | | | | | |
| | 504,572 | | | Series 2018-1A(e) | | 4.25% | | | 10/15/2025 | | | | 498,415 | |
| | | | | Laurel Road Prime Student Loan Trust | | | | | | | | | | |
| | 29,715,495 | | | Series 2020-A(e)(i) | | 0.00% | | | 11/25/2050 | | | | 2,493,962 | |
| | | | | LB-UBS Commercial Mortgage Trust | | | | | | | | | | |
| | 164,992 | | | Series 2006-C7(d)(e)(m) | | 0.53% | | | 11/15/2038 | | | | 20 | |
| | | | | LCM 28, Ltd. | | | | | | | | | | |
| | 1,000,000 | | | Series 2018-28A(d)(e) | | 3M US L + 5.75% | | | 10/20/2030 | | | | 963,440 | |
| | | | | LCM Loan Income Fund I Income Note Issuer, Ltd. | | | | | | | | | | |
| | 500,000 | | | Series 2018-27A(d)(e) | | 3M US L + 5.60% | | | 07/16/2031 | | | | 465,867 | |
See Notes to Financial Statements.
| 68 | (888) 848-7569 | www.rivernorth.com |
| RiverNorth/DoubleLine Strategic Income Fund | Schedule of Investments |
September 30, 2021
| Principal Amount/Description | | Rate | | | Maturity | | | Value | |
| | | | | LCM XIV LP | | | | | | | | | | |
| $ | 1,000,000 | | | Series 2018-14A(d)(e) | | 3M US L + 2.75% | | | 07/20/2031 | | | $ | 971,773 | |
| | 750,000 | | | Series 2018-14A(d)(e) | | 3M US L + 5.50% | | | 07/20/2031 | | | | 690,000 | |
| | | | | LCM XVII LP | | | | | | | | | | |
| | 1,000,000 | | | Series 2018-17A(d)(e) | | 3M US L + 6.00% | | | 10/15/2031 | | | | 923,758 | |
| | | | | LCM XX LP | | | | | | | | | | |
| | 1,000,000 | | | Series 2018-20A(d)(e) | | 3M US L + 5.45% | | | 10/20/2027 | | | | 995,235 | |
| | | | | Legacy Mortgage Asset Trust | | | | | | | | | | |
| | 4,000,000 | | | Series 2019-GS2(e)(n) | | 4.25% | | | 01/25/2059 | | | | 4,004,047 | |
| | 13,400,000 | | | Series 2019-GS3(e)(n) | | 4.25% | | | 04/25/2059 | | | | 13,437,273 | |
| | 4,300,000 | | | Series 2019-GS4(e)(n) | | 4.25% | | | 05/25/2059 | | | | 4,305,604 | |
| | | | | Lehman Mortgage Trust | | | | | | | | | | |
| | 451,485 | | | Series 2006-6 | | 5.50% | | | 10/25/2036 | | | | 392,993 | |
| | 3,848,688 | | | Series 2006-7(d)(m) | | 1M US L + 0.25% | | | 11/25/2036 | | | | 137,330 | |
| | 3,848,688 | | | Series 2006-7(d)(m) | | 7.75% - 1M US L | | | 11/25/2036 | | | | 778,247 | |
| | 1,242,159 | | | Series 2006-8(d)(m) | | 1M US L + 0.42% | | | 12/25/2036 | | | | 261,400 | |
| | 1,242,159 | | | Series 2006-8(d)(m) | | 6.58% - 1M US L | | | 12/25/2036 | | | | 303,923 | |
| | 265,847 | | | Series 2007-10 | | 6.50% | | | 01/25/2038 | | | | 125,020 | |
| | | | | Lendingpoint Asset Securitization Trust | | | | | | | | | | |
| | 274,166 | | | Series 2019-1(e) | | 4.50% | | | 12/15/2021 | | | | 274,640 | |
| | | | | MACH 1 Cayman, Ltd. | | | | | | | | | | |
| | 1,194,703 | | | Series 2019-1(e) | | 3.47% | | | 08/15/2026 | | | | 1,198,241 | |
| | | | | Madison Park Funding XIV, Ltd. | | | | | | | | | | |
| | 1,000,000 | | | Series 2018-14A(d)(e) | | 3M US L + 2.95% | | | 10/22/2030 | | | | 999,063 | |
| | 1,000,000 | | | Series 2018-14A(d)(e) | | 3M US L + 5.80% | | | 10/22/2030 | | | | 978,750 | |
| | | | | Madison Park Funding XLV, Ltd. | | | | | | | | | | |
| | 1,000,000 | | | Series 2021-45A(d)(e) | | 3M US L + 3.15% | | | 07/15/2034 | | | | 999,993 | |
| | | | | Madison Park Funding XXVI, Ltd. | | | | | | | | | | |
| | 500,000 | | | Series 2017-26A(d)(e) | | 3M US L + 6.50% | | | 07/29/2030 | | | | 498,011 | |
| | | | | Madison Park Funding XXXVIII, Ltd. | | | | | | | | | | |
| | 500,000 | | | Series 2021-38A(d)(e) | | 3M US L + 6.00% | | | 07/17/2034 | | | | 499,938 | |
| | | | | Master Asset Backed Securities Trust | | | | | | | | | | |
| | 4,683,445 | | | Series 2006-NC3(d) | | 1M US L + 0.21% | | | 10/25/2036 | | | | 3,180,542 | |
| | | | | MBRT | | | | | | | | | | |
| | 584,000 | | | Series 2019-MBR(d)(e) | | 1M US L + 2.55% | | | 11/25/2021 | | | | 583,778 | |
| | 1,406,000 | | | Series 2019-MBR(d)(e) | | 1M US L + 2.90% | | | 11/25/2021 | | | | 1,402,340 | |
| | | | | Merrill Lynch Alternative Note Asset Trust | | | | | | | | | | |
| | 686,554 | | | Series 2007-F1 | | 6.00% | | | 03/25/2037 | | | | 107,548 | |
| | | | | Merrill Lynch Mortgage Investors Trust | | | | | | | | | | |
| | 10,400,683 | | | Series 2006-RM3(d) | | 1M US L + 0.48% | | | 06/25/2037 | | | | 3,195,582 | |
| | | | | MFT Trust | | | | | | | | | | |
| | 2,010,000 | | | Series 2020-ABC(d)(e) | | 3.48% | | | 02/10/2030 | | | | 1,832,724 | |
See Notes to Financial Statements.
| Annual Report | September 30, 2021 | 69 |
| RiverNorth/DoubleLine Strategic Income Fund | Schedule of Investments |
September 30, 2021
| Principal Amount/Description | | Rate | | Maturity | | Value | |
| | | | | MHC Commercial Mortgage Trust | | | | | | | | |
| $ | 675,000 | | | Series 2021-MHC(d)(e) | | 1M US L + 2.60% | | 04/15/2026 | | $ | 676,708 | |
| | | | | MKT Mortgage Trust | | | | | | | | |
| | 250,000 | | | Series 2020-525M(d)(e) | | 2.94% | | 02/12/2030 | | | 233,669 | |
| | | | | Morgan Stanley Bank of America Merrill Lynch Trust | | | | | | | | |
| | 2,891,189 | | | Series 2012-C5(d)(e)(m) | | 1.53% | | 07/15/2022 | | | 15,427 | |
| | 602,000 | | | Series 2015-C20(d) | | 4.60% | | 01/15/2025 | | | 629,070 | |
| | 822,000 | | | Series 2015-C21(d) | | 4.28% | | 02/15/2025 | | | 817,770 | |
| | 350,000 | | | Series 2015-C27(d) | | 4.66% | | 11/15/2025 | | | 364,269 | |
| | 1,100,000 | | | Series 2017-C34(e) | | 2.70% | | 10/15/2027 | | | 982,217 | |
| | | | | Morgan Stanley Capital I | | | | | | | | |
| | 858,000 | | | Series 2017-HR2(d) | | 4.36% | | 12/15/2027 | | | 930,009 | |
| | | | | Morgan Stanley Capital I Trust | | | | | | | | |
| | 600,000 | | | Series 2012-C4(d)(e) | | 5.54% | | 03/15/2022 | | | 599,683 | |
| | 1,260,477 | | | Series 2016-UB11 XA(d)(m) | | 1.63% | | 08/15/2026 | | | 69,728 | |
| | 576,000 | | | Series 2017-CLS(d)(e) | | 1M US L + 2.60% | | 11/15/2034 | | | 576,742 | |
| | 765,000 | | | Series 2018-H4(e) | | 3.00% | | 12/15/2028 | | | 683,962 | |
| | 1,000,000 | | | Series 2018-SUN(d)(e) | | 1M US L + 3.05% | | 07/15/2035 | | | 995,550 | |
| | 750,000 | | | Series 2019-H7 | | 4.13% | | 07/15/2029 | | | 793,129 | |
| | 826,000 | | | Series 2021-L6(d) | | 3.58% | | 07/15/2031 | | | 852,394 | |
| | | | | Morgan Stanley Mortgage Loan Trust | | | | | | | | |
| | 1,469,362 | | | Series 2005-3AR(d) | | 2.36% | | 07/25/2035 | | | 1,386,006 | |
| | 2,857,901 | | | Series 2006-11 | | 6.00% | | 08/25/2036 | | | 2,483,563 | |
| | 716,212 | | | Series 2006-7(d) | | 5.10% | | 06/25/2036 | | | 580,648 | |
| | 796,595 | | | Series 2006-7 | | 6.00% | | 06/25/2036 | | | 597,951 | |
| | 367,467 | | | Series 2007-3XS(n) | | 5.70% | | 01/25/2047 | | | 193,109 | |
| | | | | Morgan Stanley Re-REMIC Trust | | | | | | | | |
| | 118,698 | | | Series 2011-R1(d)(e) | | 5.94% | | 02/26/2037 | | | 122,353 | |
| | | | | Mosaic Solar Loan Trust | | | | | | | | |
| | 88,877 | | | Series 2017-1A(e) | | 4.45% | | 06/20/2042 | | | 94,717 | |
| | 357,680 | | | Series 2018-1A(e) | | 4.01% | | 08/20/2030 | | | 384,255 | |
| | 1,752,993 | | | Series 2020-1A(e)(i) | | 0.00% | | 04/20/2046 | | | 1,579,596 | |
| | 716,816 | | | Series 2020-2A(e) | | 3.00% | | 06/20/2025 | | | 728,520 | |
| | | | | MSCG Trust | | | | | | | | |
| | 1,918,000 | | | Series 2018-SELF(d)(e) | | 1M US L + 3.05% | | 10/15/2037 | | | 1,923,510 | |
| | | | | MVW 2021-1W LLC | | | | | | | | |
| | 1,150,050 | | | Series 2021-1WA(e) | | 1.94% | | 01/22/2041 | | | 1,157,820 | |
| | 1,334,058 | | | Series 2021-1WA(e) | | 3.17% | | 01/22/2041 | | | 1,339,379 | |
| | | | | Navient Private Education Refi Loan Trust | | | | | | | | |
| | 500,000 | | | Series 2018-A(e) | | 3.68% | | 11/17/2025 | | | 511,910 | |
| | | | | Nomura Asset Acceptance Corp. Alternative Loan Trust | | | | | | | | |
| | 1,055,897 | | | Series 2005-AP3(d) | | 5.32% | | 08/25/2035 | | | 689,580 | |
See Notes to Financial Statements.
| 70 | (888) 848-7569 | www.rivernorth.com |
| RiverNorth/DoubleLine Strategic Income Fund | Schedule of Investments |
September 30, 2021
| Principal Amount/Description | | Rate | | Maturity | | Value | |
| | | | | Octagon Investment Partners 20-R, Ltd. | | | | | | | | |
| $ | 1,500,000 | | | Series 2019-4A(d)(e) | | 3M US L + 6.80% | | 05/12/2031 | | $ | 1,492,925 | |
| | | | | Octagon Investment Partners 26, Ltd. | | | | | | | | |
| | 1,000,000 | | | Series 2018-1A(d)(e) | | 3M US L + 8.09% | | 07/15/2030 | | | 932,783 | |
| | | | | Octagon Investment Partners 29, Ltd. | | | | | | | | |
| | 2,000,000 | | | Series 2020-1A(d)(e) | | 3M US L + 7.25% | | 01/24/2033 | | | 2,006,714 | |
| | | | | Octagon Investment Partners 37, Ltd. | | | | | | | | |
| | 500,000 | | | Series 2018-2A(d)(e) | | 3M US L + 2.85% | | 07/25/2030 | | | 496,431 | |
| | | | | Octagon Investment Partners 40, Ltd. | | | | | | | | |
| | 500,000 | | | Series 2019-1A(d)(e) | | 3M US L + 6.46% | | 04/20/2031 | | | 500,833 | |
| | | | | Octagon Investment Partners 42, Ltd. | | | | | | | | |
| | 1,000,000 | | | Series 2021-3A(d)(e) | | 3M US L + 6.75% | | 07/15/2034 | | | 1,000,137 | |
| | | | | Octagon Investment Partners 46, Ltd. | | | | | | | | |
| | 1,000,000 | | | Series 2021-2A(d)(e) | | 3M US L + 6.60% | | 07/15/2036 | | | 1,000,096 | |
| | | | | Octagon Investment Partners 49, Ltd. | | | | | | | | |
| | 625,000 | | | Series 2021-5A(d)(e) | | 3M US L + 6.75% | | 01/15/2033 | | | 628,319 | |
| | | | | Octagon Investment Partners XVI, Ltd. | | | | | | | | |
| | 500,000 | | | Series 2018-1A(d)(e) | | 3M US L + 3.00% | | 07/17/2030 | | | 498,080 | |
| | 1,000,000 | | | Series 2018-1A(d)(e) | | 3M US L + 5.75% | | 07/17/2030 | | | 984,725 | |
| | | | | Octagon Investment Partners XXI, Ltd. | | | | | | | | |
| | 1,000,000 | | | Series 2019-1A(d)(e) | | 3M US L + 7.00% | | 02/14/2031 | | | 1,004,921 | |
| | | | | Octagon Investment Partners XXII, Ltd. | | | | | | | | |
| | 970,000 | | | Series 2018-1A(d)(e) | | 3M US L + 1.90% | | 01/22/2030 | | | 968,060 | |
| | 500,000 | | | Series 2018-1A(d)(e) | | 3M US L + 5.45% | | 01/22/2030 | | | 474,207 | |
| | | | | OHA Credit Funding 1, Ltd. | | | | | | | | |
| | 500,000 | | | Series 2018-1A(d)(e) | | 3M US L + 3.05% | | 10/20/2030 | | | 497,857 | |
| | | | | OHA Credit Funding 3, Ltd. | | | | | | | | |
| | 1,000,000 | | | Series 2021-3A(d)(e) | | 3M US L + 2.90% | | 07/02/2035 | | | 999,989 | |
| | 2,000,000 | | | Series 2021-3A(d)(e) | | 3M US L + 6.25% | | 07/02/2035 | | | 2,000,214 | |
| | | | | OHA Credit Funding 5, Ltd. | | | | | | | | |
| | 2,000,000 | | | Series 2020-5A(d)(e) | | 3M US L + 6.25% | | 04/18/2033 | | | 2,007,593 | |
| | | | | OHA Credit Funding 9, Ltd. | | | | | | | | |
| | 500,000 | | | Series 2021-9A(d)(e) | | 3M US L + 2.94% | | 07/19/2035 | | | 500,003 | |
| | | | �� | One Market Plaza Trust | | | | | | | | |
| | 688,000 | | | Series 2017-1MKT(e) | | 4.14% | | 02/10/2032 | | | 696,154 | |
See Notes to Financial Statements.
| Annual Report | September 30, 2021 | 71 |
| RiverNorth/DoubleLine Strategic Income Fund | Schedule of Investments |
September 30, 2021
| Principal Amount/Description | | Rate | | Maturity | | Value | |
| | | | | Pagaya AI Debt Selection Trust | | | | | | | | |
| $ | 2,500,000 | | | Series 2020-3(e) | | 6.43% | | 05/17/2027 | | $ | 2,619,903 | |
| | 1,317,218 | | | Series 2021-2(e) | | 3.00% | | 01/25/2029 | | | 1,327,968 | |
| | | | | Park Place Securities, Inc. Asset-Backed Pass-Through Certificates Series 2005-WCW | | | | | | | | |
| | 5,000,000 | | | Series 2005-WCW2(d) | | 1M US L + 0.98% | | 07/25/2035 | | | 4,882,659 | |
| | | | | People's Choice Home Loan Securities Trust | | | | | | | | |
| | 5,000,000 | | | Series 2005-4(d) | | 1M US L + 0.65% | | 12/25/2035 | | | 3,521,355 | |
| | | | | PFP, Ltd. | | | | | | | | |
| | 624,000 | | | Series 2019-5(d)(e) | | 1M US L + 2.00% | | 03/14/2022 | | | 626,184 | |
| | | | | PR Mortgage Loan Trust | | | | | | | | |
| | 8,488,436 | | | Series 2014-1(d)(e) | | 5.90% | | 10/25/2049 | | | 8,469,005 | |
| | | | | Pretium Mortgage Credit Partners I LLC | | | | | | | | |
| | 542,541 | | | Series 2020-NPL3(e)(n) | | 3.11% | | 10/27/2023 | | | 543,266 | |
| | | | | Prime Mortgage Trust | | | | | | | | |
| | 5,179 | | | Series 2006-1 | | 5.50% | | 06/25/2036 | | | 5,190 | |
| | 64,826 | | | Series 2006-DR1(e) | | 5.50% | | 05/25/2035 | | | 62,862 | |
| | | | | Primose Funding LLC | | | | | | | | |
| | 982,500 | | | Series 2019-1A(e) | | 4.48% | | 07/30/2026 | | | 1,030,662 | |
| | | | | Progress Residential | | | | | | | | |
| | 2,500,000 | | | Series 2021-SFR3(e) | | 4.75% | | 05/17/2026 | | | 2,520,440 | |
| | | | | Progress Residential | | | | | | | | |
| | 6,900,000 | | | Series 2021-SFR8(e) | | 4.01% | | 10/17/2026 | | | 6,948,362 | |
| | | | | RBSGC Structured Trust | | | | | | | | |
| | 140,793 | | | Series 2008-B(e) | | 6.00% | | 06/25/2037 | | | 140,533 | |
| | | | | Residential Accredit Loans, Inc. | | | | | | | | |
| | 3,597,764 | | | Series 2006-QA5(d) | | 1M US L + 0.22% | | 07/25/2036 | | | 1,940,707 | |
| | 1,681,388 | | | Series 2006-QS10 | | 6.50% | | 08/25/2036 | | | 1,703,191 | |
| | 401,395 | | | Series 2006-QS6 | | 6.00% | | 06/25/2036 | | | 385,551 | |
| | 1,034,274 | | | Series 2006-QS7 | | 6.00% | | 06/25/2036 | | | 971,525 | |
| | 54,374 | | | Series 2006-QS7(d) | | 1M US L + 0.40% | | 06/25/2036 | | | 38,840 | |
| | 163,310 | | | Series 2006-QS7(d)(m) | | 5.60% -1M US L | | 06/25/2036 | | | 24,196 | |
| | 67,382 | | | Series 2006-QS8(d) | | 1M US L + 0.45% | | 08/25/2036 | | | 49,282 | |
| | 202,146 | | | Series 2006-QS8(d)(m) | | 5.55% -1M US L | | 08/25/2036 | | | 28,666 | |
| | | | | | | 55.00% - 8.33 x | | | | | | |
| | 6,314 | | | Series 2007-QS6(d) | | 1M US L | | 04/25/2037 | | | 11,038 | |
| | 574,299 | | | Series 2007-QS9 | | 6.50% | | 07/25/2037 | | | 568,249 | |
| | 297,757 | | | Series 2008-QR1 | | 6.00% | | 08/25/2036 | | | 256,497 | |
| | | | | Residential Asset Securitization Trust | | | | | | | | |
| | 424,114 | | | Series 2006-A1 | | 6.00% | | 04/25/2036 | | | 287,264 | |
| | 879,566 | | | Series 2006-A2 | | 6.00% | | 05/25/2036 | | | 543,523 | |
| | 885,215 | | | Series 2006-A6 | | 6.50% | | 07/25/2036 | | | 415,815 | |
| | 268,152 | | | Series 2006-A8 | | 6.00% | | 08/25/2036 | | | 229,729 | |
See Notes to Financial Statements.
| 72 | (888) 848-7569 | www.rivernorth.com |
| RiverNorth/DoubleLine Strategic Income Fund | Schedule of Investments |
September 30, 2021
| Principal Amount/Description | | Rate | | Maturity | | Value | |
| $ | 151,023 | | | Series 2006-A8 | | 6.50% | | 08/25/2036 | | $ | 68,674 | |
| | 316,498 | | | Series 2006-A8(d)(m) | | 5.90% -1M US L | | 08/25/2036 | | | 80,828 | |
| | 1,387,963 | | | Series 2007-A1 | | 6.00% | | 03/25/2037 | | | 750,849 | |
| | 65,665 | | | Series 2007-A6 | | 6.00% | | 06/25/2037 | | | 53,296 | |
| | 2,595,208 | | | Series 2007-A7 | | 6.00% | | 07/25/2037 | | | 1,489,304 | |
| | | | | Residential Funding Mortgage Securities I Trust | | | | | | | | |
| | 539,629 | | | Series 2006-S3 | | 5.50% | | 03/25/2036 | | | 516,449 | |
| | 100,968 | | | Series 2006-S6 | | 6.00% | | 07/25/2036 | | | 99,924 | |
| | 261,103 | | | Series 2007-S3 | | 6.00% | | 03/25/2037 | | | 233,765 | |
| | 150,553 | | | Series 2007-S6 | | 6.00% | | 06/25/2037 | | | 153,594 | |
| | | | | RR 2, Ltd. | | | | | | | | |
| | 1,000,000 | | | Series 2021-2A(d)(e) | | 3M US L + 5.80% | | 04/15/2036 | | | 988,079 | |
| | | | | RR 6, Ltd. | | | | | | | | |
| | 1,000,000 | | | Series 2021-6A(d)(e) | | 3M US L + 5.85% | | 04/15/2036 | | | 988,974 | |
| | | | | Sapphire Aviation Finance I, Ltd. | | | | | | | | |
| | 2,268,170 | | | Series 2018-1A(e) | | 5.93% | | 03/15/2025 | | | 1,987,153 | |
| | | | | Sapphire Aviation Finance II, Ltd. | | | | | | | | |
| | 423,336 | | | Series 2020-1A(e) | | 3.23% | | 03/15/2027 | | | 419,734 | |
| | | | | Sequoia Mortgage Trust | | | | | | | | |
| | 1,348,001 | | | Series 2007-3(d) | | 2.78% | | 07/20/2037 | | | 1,237,219 | |
| | | | | SG Commercial Mortgage Securities Trust | | | | | | | | |
| | 1,854,000 | | | Series 2016-C5 | | 3.93% | | 06/10/2026 | | | 1,941,964 | |
| | | | | Signal Rail I LLC | | | | | | | | |
| | 498,349 | | | Series 2021-1(e) | | 2.23% | | 08/17/2051 | | | 498,368 | |
| | | | | S-Jets, Ltd. | | | | | | | | |
| | 1,033,088 | | | Series 2017-1(e) | | 3.97% | | 08/15/2025 | | | 1,028,957 | |
| | | | | SLG Office Trust | | | | | | | | |
| | 1,100,000 | | | Series 2021-OVA(e) | | 2.85% | | 07/15/2031 | | | 1,043,158 | |
| | | | | SMB Private Education Loan Trust | | | | | | | | |
| | 342,023 | | | Series 2018-B(d)(e) | | 1M US L + 0.72% | | 08/15/2027 | | | 343,734 | |
| | 968 | | | Series 2021-A(e) | | 0.00% | | 01/15/2053 | | | 3,048,914 | |
| | | | | Sofi Alternative Consumer Loan Program | | | | | | | | |
| | 50,000 | | | Series 2021-2(e) | | 0.00% | | 12/31/2049 | | | 3,137,857 | |
| | | | | Sofi Professional Loan Program Trust | | | | | | | | |
| | 80,000 | | | Series 2018-C(e) | | 0.00% | | 01/25/2048 | | | 1,851,122 | |
| | | | | SoFi Professional Loan Program Trust | | | | | | | | |
| | 50,000 | | | Series 2020-A(e) | | 0.00% | | 05/15/2046 | | | 2,376,517 | |
| | | | | Sofi Professional Loan Program, LLC | | | | | | | | |
| | 32,412 | | | Series 2018-A(e) | | 0.00% | | 02/25/2042 | | | 994,884 | |
See Notes to Financial Statements.
| Annual Report | September 30, 2021 | 73 |
| RiverNorth/DoubleLine Strategic Income Fund | Schedule of Investments |
September 30, 2021
| Principal Amount/Description | | Rate | | Maturity | | Value | |
| | | | | SoFi Professional Loan Program, LLC | | | | | | | | |
| $ | 300,000 | | | Series 2017-D(e) | | 3.61% | | 09/25/2040 | | $ | 313,735 | |
| | 56,034 | | | Series 2019-B | | 0.00% | | 08/17/2048 | | | 1,033,841 | |
| | | | | Sprite, Ltd. | | | | | | | | |
| | 313,301 | | | Series 2017-1(e) | | 4.25% | | 12/15/2024 | | | 312,803 | |
| | | | | Stack Infrastructure Issuer LLC | | | | | | | | |
| | 974,167 | | | Series 2019-1A(e) | | 4.54% | | 02/26/2024 | | | 1,025,551 | |
| | 750,000 | | | Series 2019-2A(e) | | 3.08% | | 10/25/2024 | | | 770,885 | |
| | | | | Start, Ltd. | | | | | | | | |
| | 655,939 | | | Series 2018-1(e) | | 4.09% | | 05/15/2025 | | | 656,609 | |
| | 755,763 | | | Series 2019-1(e) | | 4.09% | | 03/15/2026 | | | 758,393 | |
| | | | | Structured Adjustable Rate Mortgage Loan Trust | | | | | | | | |
| | 655,162 | | | Series 2005-15(d) | | 2.96% | | 07/25/2035 | | | 493,495 | |
| | | | | Structured Asset Securities Corp. | | | | | | | | |
| | 173,342 | | | Series 2005-RF1(d)(e) | | 1M US L + 0.35% | | 03/25/2035 | | | 163,816 | |
| | 173,342 | | | Series 2005-RF1(d)(e)(m) | | 4.54% | | 03/25/2035 | | | 23,235 | |
| | | | | Sunnova Sol III Issuer LLC | | | | | | | | |
| | 1,482,313 | | | Series 2021-1(e) | | 2.58% | | 04/30/2031 | | | 1,482,295 | |
| | | | | Sunnova Sol Issuer LLC | | | | | | | | |
| | 962,432 | | | Series 2020-1A(e) | | 3.35% | | 01/30/2030 | | | 1,001,421 | |
| | | | | Sunrun Atlas Issuer LLC | | | | | | | | |
| | 1,194,252 | | | Series 2019-2(e) | | 3.61% | | 10/30/2027 | | | 1,272,022 | |
| | | | | TBW Mortgage-Backed Trust | | | | | | | | |
| | 1,396,019 | | | Series 2006-2 | | 7.00% | | 07/25/2036 | | | 382,917 | |
| | | | | Thunderbolt Aircraft Lease, Ltd. | | | | | | | | |
| | 1,788,268 | | | Series 2017-A(e)(n) | | 4.21% | | 04/15/2024 | | | 1,789,234 | |
| | | | | Thunderbolt II Aircraft Lease, Ltd. | | | | | | | | |
| | 4,464,286 | | | Series 2018-A(e)(n) | | 5.07% | | 09/15/2038 | | | 4,142,745 | |
| | | | | TIF Funding II LLC | | | | | | | | |
| | 379,333 | | | Series 2021-1A(e) | | 1.65% | | 02/20/2046 | | | 372,144 | |
| | | | | Towd Point Mortgage Trust | | | | | | | | |
| | 1,038,907 | | | Series 2019-SJ2(d)(e) | | 4.25% | | 11/25/2058 | | | 1,039,365 | |
| | | | | TPGI Trust | | | | | | | | |
| | 800,000 | | | Series 2021-DGWD(d)(e) | | 1M US L + 3.85% | | 06/15/2026 | | | 803,153 | |
| | | | | Trimaran Cavu 2019-1, Ltd. | | | | | | | | |
| | 1,700,000 | | | Series 2019-1A(d)(e) | | 3M US L + 4.15% | | 07/20/2032 | | | 1,719,092 | |
| | | | | TRP - TRIP Rail Master Funding LLC | | | | | | | | |
| | 991,292 | | | Series 2021-2(e) | | 2.15% | | 06/17/2027 | | | 1,000,724 | |
| | | | | TTAN | | | | | | | | |
| | 743,000 | | | Series 2021-MHC(d)(e) | | 1M US L + 2.90% | | 03/15/2026 | | | 745,438 | |
| | | | | UBS Commercial Mortgage Trust | | | | | | | | |
| | 31,908,500 | | | Series 2017-C3(d)(m) | | 0.48% | | 08/15/2050 | | | 854,111 | |
| | 650,000 | | | Series 2017-C4(d) | | 4.24% | | 09/15/2027 | | | 696,462 | |
| | 464,000 | | | Series 2017-C6(d) | | 4.15% | | 12/15/2027 | | | 510,075 | |
See Notes to Financial Statements.
| 74 | (888) 848-7569 | www.rivernorth.com |
| RiverNorth/DoubleLine Strategic Income Fund | Schedule of Investments |
September 30, 2021
| Principal Amount/Description | | Rate | | Maturity | | Value | |
| $ | 751,000 | | | Series 2017-C6(d) | | 4.59% | | 12/15/2027 | | $ | 821,789 | |
| | 520,000 | | | Series 2018-C10(d) | | 5.26% | | 05/15/2028 | | | 568,970 | |
| | 928,000 | | | Series 2018-C9(d) | | 5.04% | | 03/15/2028 | | | 1,021,810 | |
| | | | | UBS-Barclays Commercial Mortgage Trust | | | | | | | | |
| | 1,993,000 | | | Series 2013-C5(d)(e) | | 4.08% | | 03/12/2046 | | | 1,828,159 | |
| | | | | Upstart Pass-Through Trust | | | | | | | | |
| | 394,303 | | | Series 2021-ST1(e) | | 2.75% | | 02/20/2027 | | | 397,644 | |
| | 829,899 | | | Series 2021-ST2(e) | | 2.50% | | 04/20/2027 | | | 841,124 | |
| | | | | Upstart Securitization Trust | | | | | | | | |
| | 250,000 | | | Series 2020-3(e) | | 3.01% | | 11/20/2030 | | | 255,568 | |
| | 2,000 | | | Series 2021-2 | | 0.00% | | 06/20/2031 | | | 1,673,611 | |
| | | | | US Auto Funding 2021-1 | | | | | | | | |
| | 1,125,000 | | | Series 2021-1A(e) | | 2.20% | | 05/15/2026 | | | 1,122,319 | |
| | | | | USQ Rail II LLC | | | | | | | | |
| | 741,187 | | | Series 2021-3(e) | | 2.21% | | 06/28/2027 | | | 746,882 | |
| | | | | Vault DI Issuer LLC | | | | | | | | |
| | 750,000 | | | Series 2021-1A(e) | | 2.80% | | 07/15/2026 | | | 752,800 | |
| | | | | VB-S1 Issuer LLC | | | | | | | | |
| | 500,000 | | | Series 2020-1A(e) | | 3.03% | | 06/15/2025 | | | 521,874 | |
| | | | | VCC | | | | | | | | |
| | 3,183,977 | | | Series 2020-MC1(d)(e) | | 4.50% | | 06/25/2045 | | | 3,187,294 | |
| | | | | Velocity Commercial Capital Loan Trust | | | | | | | | |
| | 447,947 | | | Series 2018-2(d)(e) | | 4.05% | | 09/25/2024 | | | 464,413 | |
| | 916,797 | | | Series 2019-1(d)(e) | | 3.94% | | 01/25/2027 | | | 952,925 | |
| | 396,604 | | | Series 2019-1(d)(e) | | 4.01% | | 07/25/2027 | | | 405,267 | |
| | 326,137 | | | Series 2019-1(d)(e) | | 4.12% | | 11/25/2027 | | | 331,728 | |
| | 1,406,099 | | | Series 2021-2(d)(e) | | 4.92% | | 12/25/2030 | | | 1,396,447 | |
| | | | | VOLT XCIV LLC | | | | | | | | |
| | 1,011,155 | | | Series 2021-NPL3(e)(n) | | 2.24% | | 01/25/2024 | | | 1,013,095 | |
| | | | | VOLT XCVI LLC | | | | | | | | |
| | 4,000,000 | | | Series 2021-NPL5(e) | | 4.83% | | 03/27/2051 | | | 4,003,140 | |
| | | | | Wachovia Bank Commercial Mortgage Trust | | | | | | | | |
| | 36,574 | | | Series 2006-C29(d)(m) | | 0.45% | | 11/15/2048 | | | 0 | |
| | | | | Wachovia Mortgage Loan Trust, LLC Series Trust | | | | | | | | |
| | 275,608 | | | Series 2005-B(d) | | 2.31% | | 10/20/2035 | | | 266,690 | |
| | | | | Washington Mutual Alternative Mortgage Pass-Through Certificates | | | | | | | | |
| | 43,900 | | | Series 2005-9 | | 5.50% | | 11/25/2035 | | | 41,014 | |
| | 372,030 | | | Series 2006-5 | | 6.00% | | 07/25/2036 | | | 323,927 | |
See Notes to Financial Statements.
| Annual Report | September 30, 2021 | 75 |
| RiverNorth/DoubleLine Strategic Income Fund | Schedule of Investments |
September 30, 2021
| Principal Amount/Description | | Rate | | Maturity | | Value | |
| | | | | Washington Mutual Mortgage Pass-Through Certificates Trust | | | | | | | | |
| $ | 666,694 | | | Series 2006-2 | | 6.00% | | 03/25/2036 | | $ | 688,880 | |
| | | | | WAVE LLC | | | | | | | | |
| | 898,173 | | | Series 2019-1(e) | | 3.60% | | 09/15/2027 | | | 898,754 | |
| | 1,031,830 | | | Series 2019-1(e) | | 7.00% | | 09/15/2044 | | | 837,087 | |
| | | | | Wells Fargo Alternative Loan Trust | | | | | | | | |
| | 303,389 | | | Series 2007-PA2(d) | | 1M US L + 0.43% | | 06/25/2037 | | | 245,197 | |
| | 302,076 | | | Series 2007-PA2(d)(m) | | 6.07% -1M US L | | 06/25/2037 | | | 34,617 | |
| | 146,892 | | | Series 2007-PA3 | | 5.75% | | 07/25/2037 | | | 149,050 | |
| | 408,648 | | | Series 2007-PA3 | | 6.25% | | 07/25/2037 | | | 410,723 | |
| | | | | Wells Fargo Commercial Mortgage Trust | | | | | | | | |
| | 1,895,000 | | | Series 2015-C28(d) | | 4.23% | | 05/15/2025 | | | 1,874,373 | |
| | 520,000 | | | Series 2015-NXS4(d) | | 4.85% | | 11/15/2025 | | | 566,046 | |
| | 1,245,000 | | | Series 2015-NXS4(d) | | 3.85% | | 11/15/2025 | | | 1,247,839 | |
| | 1,000,000 | | | Series 2016-C33(e) | | 3.12% | | 03/15/2059 | | | 950,355 | |
| | 5,628,945 | | | Series 2016-C37(d)(e)(m) | | 1.60% | | 12/15/2049 | | | 345,373 | |
| | 550,000 | | | Series 2016-LC24 | | 3.62% | | 09/15/2026 | | | 582,927 | |
| | 695,000 | | | Series 2016-LC25(d) | | 4.56% | | 11/15/2026 | | | 758,503 | |
| | 356,000 | | | Series 2016-NXS6 | | 3.81% | | 11/15/2049 | | | 378,268 | |
| | 518,000 | | | Series 2018-C45 | | 4.73% | | 06/15/2028 | | | 571,223 | |
| | 523,000 | | | Series 2018-C47(d) | | 5.10% | | 10/15/2028 | | | 558,052 | |
| | 436,000 | | | Series 2018-C48(d) | | 5.29% | | 12/15/2028 | | | 490,180 | |
| | 613,000 | | | Series 2020-C55 | | 3.14% | | 02/15/2030 | | | 640,319 | |
| | 6,262,411 | | | Series 2021-C59(d)(m) | | 1.69% | | 04/15/2054 | | | 720,212 | |
| | | | | WF-RBS Commercial Mortgage Trust | | | | | | | | |
| | 1,867,305 | | | Series 2012-C9(d)(e)(m) | | 2.02% | | 11/15/2045 | | | 21,985 | |
| | 3,306,225 | | | Series 2014-C21(d)(m) | | 1.17% | | 08/15/2047 | | | 77,364 | |
| | 3,977,277 | | | Series 2014-C22(d)(m) | | 0.94% | | 09/15/2057 | | | 75,385 | |
| | 636,000 | | | Series 2014-C23(d)(e) | | 4.15% | | 10/15/2057 | | | 637,192 | |
| | | | | Willis Engine Structured Trust V | | | | | | | | |
| | 913,733 | | | Series 2020-A(e) | | 3.23% | | 03/15/2028 | | | 911,353 | |
| | | | | Willis Engine Structured Trust VI | | | | | | | | |
| | 2,855,585 | | | Series 2021-A(e) | | 7.39% | | 05/15/2046 | | | 2,850,236 | |
| | 1,992,251 | | | Zephyrus Capital Aviation Tl(d) | | 1M US L + 4.61% | | 10/15/2038 | | | 1,979,931 | |
| | | | | | | | | | | | | |
| TOTAL NON-AGENCY COLLATERALIZED MORTGAGE OBLIGATIONS |
| (Cost $494,796,231) | | | | | | | 478,284,916 | |
| | | | | | | | | | | | | |
| U.S. GOVERNMENT BONDS AND NOTES-10.96% |
| | 2,495,000 | | | U.S. Treasury Bonds | | 1.25% | | 08/15/2031 | | | 2,434,769 | |
| | 10,220,000 | | | U.S. Treasury Bonds | | 2.25% | | 05/15/2041 | | | 10,630,397 | |
See Notes to Financial Statements.
| 76 | (888) 848-7569 | www.rivernorth.com |
| RiverNorth/DoubleLine Strategic Income Fund | Schedule of Investments |
September 30, 2021
| Principal Amount/Description | | Rate | | Maturity | | Value | |
| $ | 540,000 | | | U.S. Treasury Bonds | | 2.75% | | 11/15/2042 | | $ | 607,437 | |
| | 5,580,000 | | | U.S. Treasury Bonds | | 2.75% | | 11/15/2047 | | | 6,341,583 | |
| | 9,900,000 | | | U.S. Treasury Bonds | | 1.25% | | 05/15/2050 | | | 8,102,144 | |
| | 58,500,000 | | | U.S. Treasury Bonds | | 1.63% | | 11/15/2050 | | | 52,574,590 | |
| | 9,060,000 | | | U.S. Treasury Bonds | | 2.00% | | 08/15/2051 | | | 8,901,450 | |
| | 4,080,000 | | | U.S. Treasury Bonds | | 4.75% | | 02/15/2037 | | | 5,760,131 | |
| | 18,000,000 | | | U.S. Treasury Notes | | 0.13% | | 10/31/2022 | | | 18,005,625 | |
| | 12,400,000 | | | U.S. Treasury Notes | | 0.13% | | 12/31/2022 | | | 12,398,547 | |
| | 11,290,000 | | | U.S. Treasury Notes | | 0.25% | | 09/30/2023 | | | 11,281,841 | |
| | 1,550,000 | | | U.S. Treasury Notes | | 0.25% | | 11/15/2023 | | | 1,548,123 | |
| | 9,110,000 | | | U.S. Treasury Notes | | 0.13% | | 01/15/2024 | | | 9,063,027 | |
| | 22,585,000 | | | U.S. Treasury Notes | | 0.38% | | 09/15/2024 | | | 22,489,720 | |
| | 9,370,000 | | | U.S. Treasury Notes | | 1.50% | | 11/30/2024 | | | 9,646,342 | |
| | 8,480,000 | | | U.S. Treasury Notes | | 0.38% | | 11/30/2025 | | | 8,320,006 | |
| | 1,220,000 | | | U.S. Treasury Notes | | 0.75% | | 03/31/2026 | | | 1,211,612 | |
| | 12,060,000 | | | U.S. Treasury Notes | | 0.88% | | 09/30/2026 | | | 11,995,931 | |
| | 10,150,000 | | | U.S. Treasury Notes | | 0.50% | | 06/30/2027 | | | 9,800,301 | |
| | 11,990,000 | | | U.S. Treasury Notes | | 1.25% | | 09/30/2028 | | | 11,940,354 | |
| | | | | | | | | | | | | |
| TOTAL U.S. GOVERNMENT BONDS AND NOTES | | | | | | | | |
| (Cost $226,531,475) | | | | | | | 223,053,930 | |
| | | | | | | | | | | | | |
| MUNICIPAL BONDS - 0.01% | | | | | | | | |
| | 165,000 | | | State of California, General Obligation Bonds | | 7.55% | | 04/01/2039 | | | 278,356 | |
| | | | | | | | | | | | | |
| TOTAL MUNICIPAL BONDS | | | | | | | | |
| (Cost $236,782) | | | | | | | 278,356 | |
| | | | | | | | | | | | | |
| U.S. GOVERNMENT / AGENCY MORTGAGE BACKED SECURITIES -14.18% |
| | | | | Banc of America Funding | | | | | | | | |
| | 2,445,730 | | | Series 2007-A(d) | | 1M US L + 0.42% | | 02/20/2047 | | | 2,333,313 | |
| | 2,027,156 | | | Banc of America Funding | | | | | | | | |
| | | | | Series 2014-R8(d)(e) | | 1M US L + 0.24% | | 12/26/2024 | | | 2,012,372 | |
| | | | | Bear Stearns Structured Products, Inc. | | | | | | | | |
| | 8,249,695 | | | Series 2008-R2(d)(e) | | 2.82% | | 06/25/2047 | | | 7,280,885 | |
| | | | | Chase Mortgage Finance Trust | | | | | | | | |
| | 4,669,401 | | | Series 2007-S4 | | 6.00% | | 06/25/2037 | | | 3,025,073 | |
| | | | | ChaseFlex Trust Series | | | | | | | | |
| | 4,426,840 | | | Series 2007-M1(d) | | 1M US L + 0.23% | | 08/25/2037 | | | 3,661,150 | |
| | | | | Citigroup Mortgage Loan Trust | | | | | | | | |
| | 120,276 | | | Series 2009-12(e) | | 5.50% | | 11/25/2035 | | | 113,327 | |
| | 420,664 | | | Series 2009-4(d)(e) | | 5.48% | | 05/25/2035 | | | 426,161 | |
See Notes to Financial Statements.
| Annual Report | September 30, 2021 | 77 |
| RiverNorth/DoubleLine Strategic Income Fund | Schedule of Investments |
September 30, 2021
| Principal Amount/Description | | Rate | | Maturity | | Value | |
| | | | | Connecticut Avenue Securities Trust | | | | | | | | |
| $ | 5,000,000 | | | Series 2019-R05(d)(e) | | 1M US L + 4.10% | | 07/25/2039 | | $ | 5,085,233 | |
| | | | | CSMC | | | | | | | | |
| | 900,000 | | | Series 2021-NQM6(d)(e) | | 2.58% | | 07/25/2066 | | | 906,566 | |
| | | | | Deephaven Residential Mortgage Trust | | | | | | | | |
| | 6,613,000 | | | Series 2020-1(d)(e) | | 3.66% | | 03/25/2024 | | | 6,632,926 | |
| | 4,000,000 | | | Series 2020-1(d)(e) | | 4.54% | | 03/25/2024 | | | 4,031,279 | |
| | | | | Fannie Mae Interest Strip | | | | | | | | |
| | 8,364,814 | | | Series 2014-419(m) | | 3.50% | | 04/25/2044 | | | 1,176,472 | |
| | | | | Fannie Mae Pool | | | | | | | | |
| | 3,000,000 | | | Series 2018 | | 3.50% | | 04/01/2030 | | | 3,394,596 | |
| | 4,677,805 | | | Series 2020- | | 2.00% | | 01/01/2051 | | | 4,695,368 | |
| | 6,418,897 | | | Series 2021- | | 2.00% | | 02/01/2051 | | | 6,498,734 | |
| | 11,487,390 | | | Series 2021- | | 2.50% | | 09/01/2051 | | | 12,038,164 | |
| | 3,000,000 | | | Series Pool #BL4424 | | 2.14% | | 10/01/2029 | | | 3,125,382 | |
| | 3,000,000 | | | Series Pool #BL5156 | | 2.37% | | 12/01/2029 | | | 3,175,915 | |
| | | | | Fannie Mae REMICS | | | | | | | | |
| | 7,820,294 | | | Series 2014-1(d)(m) | | 5.90% - 1M US L | | 02/25/2044 | | | 1,483,798 | |
| | 8,953,344 | | | Series 2015-54(d)(m) | | 6.15% - S L+ 1M US L | | 07/25/2045 | | | 1,750,196 | |
| | 3,142,018 | | | Series 2020-45 | | 3.00% | | 07/25/2040 | | | 3,292,922 | |
| | 10,652,829 | | | Series 2020-74(d)(m) | | 4.10% - 30D SOFR | | 10/25/2050 | | | 1,493,216 | |
| | 22,029,419 | | | Series 2020-77(d)(m) | | 4.10% - 30D SOFR | | 11/25/2050 | | | 3,217,668 | |
| | | | | Federal Home Loan Mortgage Corp. Pool | | | | | | | | |
| | 165,043 | | | Series Pool #G01840 | | 5.00% | | 07/01/2035 | | | 188,536 | |
| | 60,057 | | | Series Pool #G04817 | | 5.00% | | 09/01/2038 | | | 68,711 | |
| | | | | Federal Home Loan Mortgage Corp. REMICS | | | | | | | | |
| | 810,104 | | | Series 2003-2722(d) | | 9.89% - 1M US L | | 12/15/2033 | | | 993,952 | |
| | 152,162 | | | Series 2005-R003 | | 5.50% | | 10/15/2035 | | | 174,882 | |
| | 1,179,673 | | | Series 2006-3244(d)(m) | | 6.66% - 1M US L | | 11/15/2036 | | | 266,232 | |
| | 58,771 | | | Series 2007-3261(d)(m) | | 6.43% - 1M US L | | 01/15/2037 | | | 11,700 | |
| | 115,674 | | | Series 2007-3262(d)(m) | | 6.40% - 1M US L | | 01/15/2037 | | | 15,035 | |
| | 516,505 | | | Series 2007-3301(d)(m) | | 6.10% - 1M US L | | 04/15/2037 | | | 87,233 | |
| | 378,810 | | | Series 2007-3303(d)(m) | | 6.10% - 1M US L | | 04/15/2037 | | | 74,064 | |
| | 107,686 | | | Series 2007-3382(d)(m) | | 6.00% - 1M US L | | 11/15/2037 | | | 14,811 | |
| | 306,655 | | | Series 2007-3384(d)(m) | | 6.31% - 1M US L | | 08/15/2036 | | | 66,294 | |
| | 102,363 | | | Series 2007-3384(d)(m) | | 6.39% - 1M US L | | 11/15/2037 | | | 13,032 | |
| | 99,834 | | | Series 2008-3417(d)(m) | | 6.18% - 1M US L | | 02/15/2038 | | | 12,299 | |
| | 144,570 | | | Series 2008-3423(d)(m) | | 5.65% - 1M US L | | 03/15/2038 | | | 18,386 | |
| | 2,592,624 | | | Series 2008-3423(d)(m) | | 6.00% - 1M US L | | 03/15/2038 | | | 22,460 | |
| | 1,269,336 | | | Series 2009-3510(d) | | 6.75% - 1M US L | | 02/15/2037 | | | 210,307 | |
| | 321,450 | | | Series 2009-3523(d)(m) | | 6.00% - 1M US L | | 04/15/2039 | | | 52,377 | |
| | 57,603 | | | Series 2009-3524 | | 3.41% | | 06/15/2038 | | | 61,165 | |
| | 8,790 | | | Series 2009-3549(d)(m) | | 5.80% - 1M US L | | 07/15/2039 | | | 1,215 | |
See Notes to Financial Statements.
| 78 | (888) 848-7569 | www.rivernorth.com |
| RiverNorth/DoubleLine Strategic Income Fund | Schedule of Investments |
September 30, 2021
| Principal Amount/Description | | Rate | | Maturity | | Value | |
| $ | 646,694 | | | Series 2009-3560(d) | | 6.40% -1M US L | | 11/15/2036 | | $ | 91,849 | |
| | 214,896 | | | Series 2010-3641 | | 4.50% | | 03/15/2040 | | | 242,374 | |
| | 310,363 | | | Series 2010-3726(d)(m) | | 6.05% -1M US L | | 09/15/2040 | | | 56,492 | |
| | 1,115,686 | | | Series 2010-3728(d)(m) | | 4.45% -1M US L | | 09/15/2040 | | | 139,167 | |
| | 90,290 | | | Series 2010-3779 | | 4.00% | | 12/15/2030 | | | 98,407 | |
| | 472,434 | | | Series 2010-3779 | | 3.50% | | 12/15/2030 | | | 508,294 | |
| | 301,392 | | | Series 2010-3779 | | 4.50% | | 12/15/2040 | | | 331,288 | |
| | 37,764 | | | Series 2011-3786(d) | | 9.50% -1M US L | | 01/15/2041 | | | 39,523 | |
| | 5,672 | | | Series 2011-3798(d) | | 9.50% -1M US L | | 11/15/2040 | | | 5,826 | |
| | 294,715 | | | Series 2011-3808 | | 3.50% | | 02/15/2031 | | | 315,107 | |
| | 23,280 | | | Series 2011-3809(d) | | 9.50% -1M US L | | 02/15/2041 | | | 26,985 | |
| | 629,771 | | | Series 2011-3815(d)(m) | | 5.85% -1M US L | | 02/15/2041 | | | 117,560 | |
| | 247,808 | | | Series 2011-3824 | | 3.50% | | 03/15/2031 | | | 266,580 | |
| | 328,945 | | | Series 2011-3824(d) | | 7.10% -1M US L | | 08/15/2036 | | | 71,649 | |
| | 363,752 | | | Series 2011-3863 | | 5.50% | | 08/15/2034 | | | 414,654 | |
| | 393,383 | | | Series 2011-3864(d) | | 9.20% -1M US L | | 05/15/2041 | | | 425,321 | |
| | 401,918 | | | Series 2011-3871 | | 5.50% | | 06/15/2041 | | | 463,616 | |
| | 383,001 | | | Series 2011-3872(d)(m) | | 5.95% -1M US L | | 06/15/2041 | | | 62,054 | |
| | 2,737,190 | | | Series 2011-3910 | | 5.00% | | 08/15/2041 | | | 3,105,373 | |
| | 1,825,969 | | | Series 2011-3924(d)(m) | | 6.00% -1M US L | | 09/15/2041 | | | 271,063 | |
| | 2,179,648 | | | Series 2012-3(d)(m) | | 5.95% -1M US L | | 02/25/2042 | | | 417,750 | |
| | 1,624,511 | | | Series 2013-4170(d) | | 4.05% -1M US L | | 01/15/2033 | | | 1,669,199 | |
| | 11,059,171 | | | Series 2013-4218 | | 2.50% | | 02/15/2043 | | | 11,033,931 | |
| | 2,589,742 | | | Series 2013-4239(i) | | 0.00% | | 07/15/2043 | | | 2,166,310 | |
| | 4,366,111 | | | Series 2014-4413 | | 3.50% | | 11/15/2044 | | | 4,555,692 | |
| | 3,654,158 | | | Series 2015-4434 | | 3.00% | | 02/15/2045 | | | 3,895,532 | |
| | 3,536,100 | | | Series 2015-4440 | | 2.50% | | 02/15/2045 | | | 3,626,239 | |
| | | | | Federal National Mortgage Association Pool | | | | | | | | |
| | 46,096 | | | Series Pool #555743 | | 5.00% | | 09/01/2033 | | | 52,395 | |
| | 54,160 | | | Series Pool #735382 | | 5.00% | | 04/01/2035 | | | 61,745 | |
| | 150,976 | | | Series Pool #735383 | | 5.00% | | 04/01/2035 | | | 171,990 | |
| | 96,370 | | | Series Pool #735484 | | 5.00% | | 05/01/2035 | | | 109,823 | |
| | 23,150 | | | Series Pool #AH4437 | | 4.00% | | 01/01/2041 | | | 24,415 | |
| | | | | Federal National Mortgage Association REMICS | | | | | | | | |
| | 47,448 | | | Series 2004-46(d)(m) | | 6.00% -1M US L | | 03/25/2034 | | | 4,031 | |
| | 192,228 | | | Series 2006-101(d)(m) | | 6.58% -1M US L | | 10/25/2036 | | | 37,502 | |
| | 549,406 | | | Series 2006-123(d)(m) | | 6.32% -1M US L | | 01/25/2037 | | | 110,148 | |
| | 2,601,253 | | | Series 2006-92(d)(m) | | 6.58% -1M US L | | 10/25/2036 | | | 493,693 | |
| | 71,277 | | | Series 2007-102(d)(m) | | 6.40% -1M US L | | 11/25/2037 | | | 12,411 | |
| | 61,495 | | | Series 2007-108(d)(m) | | 6.36% -1M US L | | 12/25/2037 | | | 8,194 | |
| | 13,715 | | | Series 2007-30(d)(m) | | 6.11% -1M US L | | 04/25/2037 | | | 1,958 | |
| | 336,600 | | | Series 2007-38(d)(m) | | 6.08% -1M US L | | 05/25/2037 | | | 28,144 | |
| | 10,370 | | | Series 2007-51(d)(m) | | 6.10% -1M US L | | 06/25/2037 | | | 1,412 | |
| | 34,424 | | | Series 2007-53(d)(m) | | 6.10% -1M US L | | 06/25/2037 | | | 3,063 | |
| | 373,434 | | | Series 2007-57(d)(m) | | 6.62% -1M US L | | 10/25/2036 | | | 65,938 | |
See Notes to Financial Statements.
| Annual Report | September 30, 2021 | 79 |
| RiverNorth/DoubleLine Strategic Income Fund | Schedule of Investments |
September 30, 2021
| Principal Amount/Description | | Rate | | Maturity | | Value | |
| $ | 80,675 | | | Series 2007-68(d)(m) | | 6.65% -1M US L | | 07/25/2037 | | $ | 13,076 | |
| | 430,769 | | | Series 2008-3(d)(m) | | 6.46% -1M US L | | 02/25/2038 | | | 88,719 | |
| | 88,985 | | | Series 2008-56(d)(m) | | 6.06% -1M US L | | 07/25/2038 | | | 11,847 | |
| | 25,779 | | | Series 2008-81 | | 5.50% | | 09/25/2038 | | | 29,189 | |
| | 171,507 | | | Series 2009-111 | | 5.00% | | 01/25/2040 | | | 194,420 | |
| | 91,522 | | | Series 2009-111(d)(m) | | 6.25% -1M US L | | 01/25/2040 | | | 16,493 | |
| | 764,011 | | | Series 2009-12(d)(m) | | 6.60% -1M US L | | 03/25/2036 | | | 121,193 | |
| | 22,073 | | | Series 2009-28(d)(m) | | 6.00% -1M US L | | 04/25/2037 | | | 3,255 | |
| | 207,172 | | | Series 2009-41 | | 4.50% | | 06/25/2039 | | | 224,478 | |
| | 59,890 | | | Series 2009-42(d)(m) | | 6.00% -1M US L | | 06/25/2039 | | | 8,408 | |
| | 119,583 | | | Series 2009-47(d)(m) | | 6.10% -1M US L | | 07/25/2039 | | | 13,880 | |
| | 55,778 | | | Series 2009-62(d)(m) | | 6.10% -1M US L | | 08/25/2039 | | | 5,976 | |
| | 50,035 | | | Series 2009-66(d)(m) | | 5.80% -1M US L | | 02/25/2038 | | | 6,801 | |
| | 33,669 | | | Series 2009-68(d)(m) | | 5.25% -1M US L | | 09/25/2039 | | | 3,819 | |
| | 112,929 | | | Series 2010-11(d)(m) | | 4.80% -1M US L | | 02/25/2040 | | | 12,687 | |
| | 21,043 | | | Series 2010-111(d)(m) | | 6.00% -1M US L | | 10/25/2040 | | | 2,981 | |
| | 57,794 | | | Series 2010-112 | | 4.00% | | 10/25/2040 | | | 60,411 | |
| | 98,193 | | | Series 2010-115(d) | | 6.60% -1M US L | | 11/25/2039 | | | 17,919 | |
| | 1,344,516 | | | Series 2010-115(d)(m) | | 6.00% -1M US L | | 10/25/2040 | | | 257,032 | |
| | 3,065,025 | | | Series 2010-123(d)(m) | | 6.05% -1M US L | | 11/25/2040 | | | 589,497 | |
| | 514,066 | | | Series 2010-15(d)(m) | | 4.95% -1M US L | | 03/25/2040 | | | 71,436 | |
| | 38,491 | | | Series 2010-34(d)(m) | | 4.93% -1M US L | | 04/25/2040 | | | 4,425 | |
| | 44,712 | | | Series 2010-4(d)(m) | | 6.23% -1M US L | | 02/25/2040 | | | 7,028 | |
| | 50,191 | | | Series 2010-58(d) | | 12.47% -1M US L | | 06/25/2040 | | | 55,934 | |
| | 1,807,634 | | | Series 2010-75 | | 4.50% | | 07/25/2040 | | | 2,009,541 | |
| | 155,868 | | | Series 2010-9(d)(m) | | 4.75% -1M US L | | 02/25/2040 | | | 14,673 | |
| | 38,333 | | | Series 2010-9(d)(m) | | 5.30% -1M US L | | 02/25/2040 | | | 4,704 | |
| | 7,363 | | | Series 2010-90(d)(m) | | 6.00% -1M US L | | 08/25/2040 | | | 1,007 | |
| | 225,844 | | | Series 2011-16 | | 3.50% | | 03/25/2031 | | | 242,689 | |
| | 328,658 | | | Series 2011-25 | | 3.00% | | 04/25/2026 | | | 341,907 | |
| | 255,702 | | | Series 2011-29 | | 3.50% | | 04/25/2031 | | | 272,572 | |
| | 91,990 | | | Series 2011-5(d)(m) | | 6.40% -1M US L | | 11/25/2040 | | | 3,950 | |
| | 2,524,376 | | | Series 2012-106(d)(m) | | 6.16% -1M US L | | 10/25/2042 | | | 490,360 | |
| | 384,746 | | | Series 2012-124(d) | | 7.79% -1M US L | | 11/25/2042 | | | 377,951 | |
| | 151,644 | | | Series 2012-29(d)(m) | | 6.00% -1M US L | | 04/25/2042 | | | 23,029 | |
| | 464,007 | | | Series 2012-32(m) | | 5.00% | | 04/25/2042 | | | 72,896 | |
| | 2,227,430 | | | Series 2012-65(d)(m) | | 5.98% -1M US L | | 06/25/2042 | | | 379,899 | |
| | 997,399 | | | Series 2018-21(i) | | 0.00% | | 04/25/2048 | | | 924,505 | |
| | | | | FMC GMSR Issuer Trust | | | | | | | | |
| | 5,000,000 | | | Series 2019-GT2(d)(e) | | 4.72% | | 09/25/2024 | | | 4,950,369 | |
| | 6,000,000 | | | Series 2021-GT1(d)(e) | | 4.36% | | 07/25/2026 | | | 6,002,069 | |
| | | | | Freddie Mac Pool | | | | | | | | |
| | 3,932,846 | | | Series 2021- | | 1.50% | | 03/01/2036 | | | 3,974,230 | |
| | 9,958,123 | | | Series 2021- | | 2.00% | | 08/01/2041 | | | 10,136,885 | |
| | 6,676,252 | | | Series 2021- | | 2.00% | | 09/01/2051 | | | 6,701,319 | |
| | 5,000,000 | | | Series 2021- | | 3.00% | | 10/01/2051 | | | 5,263,106 | |
See Notes to Financial Statements.
| 80 | (888) 848-7569 | www.rivernorth.com |
| RiverNorth/DoubleLine Strategic Income Fund | Schedule of Investments |
September 30, 2021
| Principal Amount/Description | | Rate | | Maturity | | Value | |
| | | | | Freddie Mac REMICS | | | | | | | | |
| $ | 3,273,068 | | | Series 2011-3972(d)(m) | | 5.90% -1M US L | | 12/15/2041 | | $ | 517,201 | |
| | 2,834,736 | | | Series 2020-5007(d)(m) | | 6.10% -1M US L | | 08/25/2050 | | | 649,674 | |
| | 4,854,261 | | | Series 2020-5041(m) | | 2.00% | | 11/25/2050 | | | 419,678 | |
| | 12,277,752 | | | Series 2021-5070(m) | | 3.50% | | 02/25/2051 | | | 1,803,818 | |
| | | | | GCAT | | | | | | | | |
| | 1,500,000 | | | Series 2021-NQM4(d)(e) | | 2.47% | | 08/25/2025 | | | 1,502,759 | |
| | | | | Government National Mortgage Association | | | | | | | | |
| | 39,341 | | | Series 2004-83(d)(m) | | 6.08% -1M US L | | 10/20/2034 | | | 6,557 | |
| | 33,668 | | | Series 2008-6(d)(m) | | 6.46% -1M US L | | 02/20/2038 | | | 4,194 | |
| | 32,648 | | | Series 2008-67(d)(m) | | 6.00% -1M US L | | 08/20/2038 | | | 3,828 | |
| | 510,751 | | | Series 2008-69(d)(m) | | 7.63% -1M US L | | 08/20/2038 | | | 104,762 | |
| | 50,024 | | | Series 2009-10(d)(m) | | 6.65% -1M US L | | 02/16/2039 | | | 9,347 | |
| | 553,513 | | | Series 2009-35 | | 4.50% | | 05/20/2039 | | | 603,861 | |
| | 2,301,880 | | | Series 2009-58(d)(m) | | 6.25% -1M US L | | 06/20/2039 | | | 311,467 | |
| | 35,893 | | | Series 2009-6(d)(m) | | 5.95% -1M US L | | 02/20/2038 | | | 3,507 | |
| | 1,066,576 | | | Series 2009-75 | | 5.00% | | 09/20/2039 | | | 1,205,390 | |
| | 2,508,688 | | | Series 2010-121(d)(m) | | 6.00% -1M US L | | 09/20/2040 | | | 450,255 | |
| | 44,088 | | | Series 2010-61(d)(m) | | 6.55% -1M US L | | 09/20/2039 | | | 7,124 | |
| | 77,481 | | | Series 2010-98(d) | | 5.62% | | 03/20/2039 | | | 7,014 | |
| | 326,013 | | | Series 2011-69 | | 0.00% | | 05/20/2041 | | | 305,355 | |
| | 1,055,530 | | | Series 2011-71 | | 4.50% | | 02/20/2041 | | | 1,170,607 | |
| | 739,276 | | | Series 2011-71(d)(m) | | 5.40% -1M US L | | 05/20/2041 | | | 113,703 | |
| | 240,153 | | | Series 2011-72(d)(m) | | 6.15% -1M US L | | 05/20/2041 | | | 48,986 | |
| | 1,157,012 | | | Series 2011-89(d)(m) | | 5.45% -1M US L | | 06/20/2041 | | | 178,587 | |
| | 2,651,295 | | | Series 2013-113(d)(m) | | 6.25% -1M US L | | 03/20/2043 | | | 239,693 | |
| | 4,140,646 | | | Series 2013-122(d)(m) | | 6.10% -1M US L | | 08/16/2043 | | | 679,640 | |
| | 2,996,688 | | | Series 2013-148(d)(m) | | 5.68% -1M US L | | 10/16/2043 | | | 673,241 | |
| | 3,971,575 | | | Series 2013-186(d)(m) | | 6.25% -1M US L | | 02/16/2043 | | | 499,350 | |
| | 2,611,984 | | | Series 2014-156(d)(m) | | 6.25% -1M US L | | 10/20/2044 | | | 553,333 | |
| | 5,132,547 | | | Series 2014-4(d)(m) | | 6.10% -1M US L | | 01/16/2044 | | | 938,248 | |
| | 6,430,496 | | | Series 2014-41(d)(m) | | 6.10% -1M US L | | 03/20/2044 | | | 1,371,610 | |
| | 3,026,329 | | | Series 2014-5(d)(m) | | 6.15% -1M US L | | 07/20/2043 | | | 348,591 | |
| | 4,184,003 | | | Series 2014-95(d)(m) | | 6.25% -1M US L | | 06/16/2044 | | | 733,188 | |
| | 9,991,730 | | | Series 2015-80(d)(m) | | 6.25% -1M US L | | 06/20/2045 | | | 2,362,703 | |
| | 8,400,302 | | | Series 2018-97(d)(m) | | 6.20% -1M US L | | 07/20/2048 | | | 1,245,771 | |
| | 14,564,819 | | | Series 2019-22(d)(m) | | 5.60% -1M US L | | 02/20/2045 | | | 2,601,147 | |
| | 8,025,588 | | | Series 2019-92(d)(m) | | 6.10% -1M US L | | 07/20/2049 | | | 1,196,268 | |
| | 13,362,312 | | | Series 2020-112(d)(m) | | 6.25% -1M US L | | 08/20/2050 | | | 2,436,278 | |
| | 8,902,859 | | | Series 2020-133(d)(m) | | 6.25% -30D SOFR | | 09/20/2050 | | | 2,143,625 | |
| | 20,673,412 | | | Series 2020-146(d)(m) | | 3.75% -1M US L | | 10/20/2050 | | | 2,713,431 | |
| | 17,678,131 | | | Series 2020-146(d)(m) | | 6.30% -1M US L | | 10/20/2050 | | | 3,000,880 | |
| | 19,325,976 | | | Series 2020-167(d)(m) | | 3.75% -1M US L | | 11/20/2050 | | | 2,057,306 | |
| | 9,478,630 | | | Series 2020-175(d)(m) | | 6.30% -1M US L | | 11/20/2050 | | | 2,070,207 | |
| | 6,006,438 | | | Series 2020-188(d) | | 6.30% -1M US L | | 11/20/2050 | | | 1,643,181 | |
| | 15,111,991 | | | Series 2020-47(d)(m) | | 6.00% -1M US L | | 05/20/2044 | | | 2,640,160 | |
See Notes to Financial Statements.
| Annual Report | September 30, 2021 | 81 |
| RiverNorth/DoubleLine Strategic Income Fund | Schedule of Investments |
September 30, 2021
| Principal Amount/Description | | Rate | | Maturity | | Value | |
| $ | 14,314,556 | | | Series 2021-1(d)(m) | | 6.30% -1M US L | | 01/20/2051 | | $ | 3,027,390 | |
| | 11,419,139 | | | Series 2021-107(d)(m) | | 3.75% -1M US L | | 06/20/2051 | | | 1,610,006 | |
| | 31,328,654 | | | Series 2021-59(d)(m) | | 2.60% -30D SOFR | | 04/20/2051 | | | 2,245,600 | |
| | 15,632,779 | | | Series 2021-77(d)(m) | | 3.75% -1M US L | | 05/20/2051 | | | 1,781,096 | |
| | 7,545,827 | | | Series 2021-89(d)(m) | | 3.75% -1M US L | | 05/20/2051 | | | 1,033,541 | |
| | 12,318,670 | | | Series 2021-97(d)(m) | | 3.75% -1M US L | | 06/20/2051 | | | 1,735,617 | |
| | 37,647,023 | | | Series 2021-97(d)(m) | | 3M US L + 2.44% | | 06/20/2051 | | | 2,414,029 | |
| | | | | Homeward Opportunities Fund Trust | | | | | | | | |
| | 995,691 | | | Series 2020-BPL1(e)(n) | | 5.44% | | 08/25/2025 | | | 1,023,968 | |
| | | | | Impac CMB Trust | | | | | | | | |
| | 137,324 | | | Series 2004-10(d) | | 1M US L + 0.70% | | 03/25/2035 | | | 126,575 | |
| | | | | JP Morgan Resecuritization Trust | | | | | | | | |
| | 2,673,391 | | | Series 2014-6(d)(e) | | 1M US L + 0.21% | | 07/27/2046 | | | 2,607,296 | |
| | | | | Legacy Mortgage Asset Trust | | | | | | | | |
| | 13,310,000 | | | Series 2019-GS7(e)(n) | | 4.50% | | 11/25/2059 | | | 13,378,714 | |
| | | | | LHOME Mortgage Trust | | | | | | | | |
| | 4,250,000 | | | Series 2020-RTL1(e)(n) | | 3.72% | | 10/25/2022 | | | 4,281,489 | |
| | 3,750,000 | | | Series 2020-RTL1(e)(n) | | 4.95% | | 10/25/2022 | | | 3,787,050 | |
| | 1,300,000 | | | Series 2021-RTL1(d)(e) | | 2.09% | | 09/25/2026 | | | 1,298,688 | |
| | 4,400,000 | | | Series 2021-RTL1(d)(e) | | 4.46% | | 09/25/2026 | | | 4,374,894 | |
| | 1,500,000 | | | Series 2021-RTL2(e) | | 4.61% | | 01/25/2024 | | | 1,510,400 | |
| | | | | Mello Warehouse Securitization Trust | | | | | | | | |
| | 5,680,000 | | | Series 2019-2(d)(e) | | 1M US L + 3.25% | | 11/25/2052 | | | 5,686,106 | |
| | | | | Morgan Stanley Mortgage Loan Trust | | | | | | | | |
| | 3,084,010 | | | Series 2006-1AR(d) | | 1M US L + 0.28% | | 02/25/2036 | | | 2,260,860 | |
| | | | | Morgan Stanley Residential Mortgage Loan Trust | | | | | | | | |
| | 456,440 | | | Series 2020-RPL1(d)(e) | | 2.69% | | 10/25/2023 | | | 461,983 | |
| | | | | NewRez Warehouse Securitization Trust | | | | | | | | |
| | 4,550,000 | | | Series 2021-1(d)(e) | | 1M US L + 5.25% | | 05/25/2055 | | | 4,559,428 | |
| | | | | PRPM LLC | | | | | | | | |
| | 3,400,000 | | | Series 2020-3(e)(n) | | 5.07% | | 09/25/2025 | | | 3,421,620 | |
| | 1,995,292 | | | Series 2021-2(d)(e) | | 2.12% | | 03/25/2024 | | | 2,000,253 | |
| | | | | Residential Mortgage Loan Trust | | | | | | | | |
| | 3,250,000 | | | Series 2020-1(d)(e) | | 4.67% | | 02/25/2024 | | | 3,316,477 | |
| | | | | Toorak Mortgage Corp., Ltd. | | | | | | | | |
| | 3,500,000 | | | Series 2019-2(n) | | 4.21% | | 09/25/2022 | | | 3,519,674 | |
| | 9,000,000 | | | Series 2021-1(e)(n) | | 2.24% | | 07/25/2023 | | | 9,013,615 | |
| | | | | Verus Securitization Trust | | | | | | | | |
| | 2,300,000 | | | Series 2019-INV3(d)(e) | | 3.28% | | 11/25/2059 | | | 2,340,125 | |
See Notes to Financial Statements.
| 82 | (888) 848-7569 | www.rivernorth.com |
| RiverNorth/DoubleLine Strategic Income Fund | Schedule of Investments |
September 30, 2021
| Principal Amount/Description | Rate | | Maturity | | Value | |
| $ | 1,500,000 | | | Series 2021-4(d)(e) | | 2.20% | | 07/25/2066 | | $ | 1,495,269 | |
| | | | | | | | | | | | |
| TOTAL U.S. GOVERNMENT / AGENCY MORTGAGE BACKED SECURITIES |
| (Cost $356,176,655) | | | | | | | 288,703,957 | |
| Shares/Description | | Value | |
| Warrants - 0.00%(a)(j) | | | | |
| | 219,520 | | | Oas SA, Strike Price 1.00, Expires 05/16/2039(l) | | | 0 | |
| | | | | | | | | |
| TOTAL WARRANTS | | | | |
| (Cost $0) | | | 0 | |
| | | | | | | | | |
| SHORT-TERM INVESTMENTS -14.68% | | | | |
| Money Market Fund - 14.68% | | | | |
| | 298,707,883 | | | State Street Institutional Trust (7 Day Yield 0.01%) | | | 298,707,883 | |
| | | | | | | | | |
| TOTAL SHORT-TERM INVESTMENTS | | | | |
| (Cost $298,707,883) | | | 298,707,883 | |
| | | | | | | | |
| TOTAL INVESTMENTS - 100.40% | | | | |
| (Cost $2,107,207,460) | | $ | 2,043,385,016 | |
| LIABILITIES IN EXCESS OF OTHER ASSETS - (0.40)% | | | (8,124,273 | ) |
| NET ASSETS - 100.00% | | $ | 2,035,260,743 | |
Investment Abbreviations:
LIBOR - London Interbank Offered Rate
LLC - Limited Liability Company
LP - Limited Partnership
SOFR - Secured Overnight Financing Rate Data
TI - Treasury Index
Libor Rates:
1M US L - 1 Month LIBOR as of September 30, 2021 was 0.08%
3M US L - 3 Month LIBOR as of September 30, 2021 was 0.13%
6M US L - 6 Month LIBOR as of September 30, 2021 was 0.16%
1D SOFR - 1 Day SOFR as of September 30, 2021 was 0.05%
30D SOFR - 30 Day SOFR as of September 30, 2021 was 0.03%
1Y US TI - 1 Year TI as of September 30, 2021 was 0.09%
5Y US TI - 5 Year TI as of September 30, 2021 was 0.89%
10Y US TI - 10 Year TI as of September 30, 2021 was 1.48%
| (a) | Non-income producing security. |
| (b) | Affiliated company. See Note 9 to Notes to Financial Statements. |
See Notes to Financial Statements.
| Annual Report | September 30, 2021 | 83 |
| RiverNorth/DoubleLine Strategic Income Fund | Schedule of Investments |
September 30, 2021
| (c) | Securities were purchased pursuant to Regulation S under the Securities Act of 1933, which exempts securities offered and sold outside of the United States from registration. Such securities cannot be sold in the United States without either an effective registration statement filed pursuant to the Securities Act of 1933, or pursuant to an exemption from registration. These securities have been deemed liquid under procedures approved by the Fund's Board of Trustees (the “Board”). As of September 30, 2021, the aggregate fair value of those securities was $26,603,822, representing 1.31% of net assets. |
| (d) | Variable rate investment. Interest rates reset periodically. Interest rate shown reflects the rate in effect at September 30, 2021. For securities based on a published reference rate and spread, the reference rate and spread are indicated in the description above. Certain variable rate securities are not based on a published reference rate and spread but are determined by the issuer or agent and are based on current market conditions. These securities do not indicate a reference rate and spread in their description above. |
| (e) | Security exempt from registration under Rule 144A of the Securities Act of 1933. These securities have been deemed liquid under procedures approved by the Board and may normally be sold to qualified institutional buyers in transactions exempt from registration. Total fair value of Rule 144A securities amounts to $571,546,720, which represents approximately 28.08% of net assets as of September 30, 2021. |
| (f) | Security is currently in default. |
| (g) | Pay-in-kind securities. Rate paid in-kind is shown in parenthesis. |
| (h) | Security has no contractual maturity date, is not redeemable and contractually pays an indefinite stream of interest. The date disclosed represents the next call date, if applicable. |
| (i) | Issued with a zero coupon. Income is recognized through the accretion of discount. |
| (k) | Security does not have a market value or rate. Security will not be entitled to distributions in respect of principal or interest other than excess interest paid with respect to the mortgage loans. |
| (l) | The Level 3 assets were a result of unavailable quoted prices from an active market or the unavailability of other significant observable inputs. |
| (m) | Interest only securities. |
| (n) | Step up bond. Coupon changes periodically based upon a predetermined schedule. Interest rate disclosed is that which is in effect at September 30, 2021. |
| (o) | All or a portion of this position has not settled as of June 30, 2021. The interest rate shown represents the stated spread over the London Interbank Offered Rate (“LIBOR” or “L”) or the Euro Interbank Offered Rate (“EURIBOR” or “E”) or the applicable LIBOR/EURIBOR floor; the Fund will not accrue interest until the settlement date, at which point LIBOR/EURIBOR will be established. |
See Notes to Financial Statements.
| 84 | (888) 848-7569 | www.rivernorth.com |
| RiverNorth/Oaktree High Income Fund | Schedule of Investments |
September 30, 2021
| Shares/Description | | Value | |
| CLOSED-END FUNDS - 0.63% | | | | |
| | 56,016 | | | Western Asset High Income Opportunity Fund, Inc. | | $ | 290,723 | |
| | | | | | | | | |
| TOTAL CLOSED-END FUNDS | | | | |
| (Cost $266,222) | | | 290,723 | |
| | | | | | | | | |
| COMMON STOCKS - 0.17% | | | | |
| | 947 | | | DBI Investors, Inc.(a)(b) | | | 455 | |
| | 2,509 | | | PHI Group, Inc.(a)(b) | | | 57,180 | |
| | 795 | | | Phi, Inc.(a)(b) | | | 18,118 | |
| | 6 | | | Toys R Us Propco Equity(b) | | | 150 | |
| | | | | | | | | |
| TOTAL COMMON STOCKS | | | | |
| (Cost $213,399) | | | 75,903 | |
| | | | | | | | | |
| PREFERRED STOCKS - 0.25% | | | | |
| | 116 | | | DBI Investors Inc., (10.000%)(a)(c)(d) | | | 22 | |
| | 117 | | | Sequa Corp., 7.000%(a)(d) | | | 117,000 | |
| | | | | | | | | |
| TOTAL PREFERRED STOCKS | | | | |
| (Cost $128,040) | | | 117,022 | |
| Principal Amount/Description | | Rate | | Maturity | | Value | |
| BANK LOANS - 34.84%(e) | | | | | | | |
| Canada - 0.06% | | | | | | | |
| $ | 26,635 | | | APLP Holdings LP, First Lien -B Term Loan | | 3M US L + 3.75%, 1.00% Floor | | 05/14/2027 | | | 26,818 | |
| | | | | | | | | | | | | |
| France - 0.41% | | | | | | | | |
| | 191,500 | | | Numericable U.S. LLC, First Lien -USD TLB-11 Term Loan | | 3M US L + 2.75% | | 07/31/2025 | | | 188,848 | |
| | | | | | | | | | | | | |
| Germany - 0.84% | | | | | | | | |
| | 157,130 | | | CTC AcquiCo GmbH, First Lien - Facility B2 Term Loan | | 3M US L + 2.75% | | 03/07/2025 | | | 156,050 | |
| | 228,834 | | | Springer Nature Deutschland GmbH, First Lien - Initial B18 Term Loan | | 1M US L + 3.00%, 0.75% Floor | | 08/14/2026 | | | 229,080 | |
| | | | | | | | | | | | 385,130 | |
| Great Britain - 2.81% |
| | 250,000 | | | City Football Group Limited, TL | | L + 4.00% | | 07/09/2028 | | | 249,688 | |
| | 145,127 | | | EG Group, Ltd., First Lien -Additional Facility Term Loan | | 3M US L + 4.00% | | 02/07/2025 | | | 144,889 | |
| | 30,000 | | | Entain Holdings (Gibraltar) Limited, TLB | | 3M US L + 2.50% | | 03/29/2027 | | | 30,010 | |
See Notes to Financial Statements.
| Annual Report | September 30, 2021 | 85 |
| RiverNorth/Oaktree High Income Fund | Schedule of Investments |
September 30, 2021
| Principal Amount/Description | | Rate | | Maturity | | Value | |
| $ | 247,500 | | | Froneri International, Ltd., First Lien - Facility B2 Term Loan | | 1M US L + 2.25% | | 01/29/2027 | | $ | 245,011 | |
| | 300,000 | | | Genesis Care Finance Pty, Ltd., First Lien - Facility B2 Term Loan | | 3M EUR L + 3.50% | | 10/30/2025 | | | 345,952 | |
| | 181,182 | | | Lernen Bidco, Ltd., First Lien -Facility B1 (EUR) Term Loan | | L + 4.25% | | 10/24/2025 | | | 208,512 | |
| | 33,000 | | | Osmosis Buyer, Ltd., First Lien -Initial B Term Loan | | 3M US L + 2.75%, 0.50% Floor | | 06/17/2028 | | | 33,144 | |
| | 33,000 | | | Paysafe Group Holdings II, Ltd., First Lien - Facility B1 Term Loan | | 3M US L + 3.25%, 0.50% Floor | | 06/10/2028 | | | 32,703 | |
| | | | | | | | | | | | 1,289,909 | |
| Luxembourg - 1.09% |
| | 144,375 | | | Altice Financing S.A., First Lien - October 2017 USD Term Loan | | 3M US L + 2.75% | | 01/31/2026 | | | 142,173 | |
| | 88,060 | | | Icon Public, Ltd. Company, First Lien - Lux Term Loan | | L + 2.50%, 0.50% Floor | | 07/01/2028 | | | 88,451 | |
| | 21,940 | | | Icon Public, Ltd. Company, First Lien - U.S. Term Loan | | L + 2.50%, 0.50% Floor | | 07/03/2028 | | | 22,038 | |
| | 248,744 | | | Surf Holdings S.a r.l., First Lien -Dollar Tranche Term Loan | | 3M US L + 3.50% | | 03/05/2027 | | | 247,741 | |
| | | | | | | | | | | | 500,403 | |
| Netherlands - 1.63% |
| | 96,000 | | | Flutter Entertainment plc, First Lien - USD Term Loan | | 3M US L + 2.25% | | 07/21/2026 | | | 95,792 | |
| | 283,418 | | | Peer Holding III B.V., First Lien - Facility B Term Loan | | 3M EUR L + 3.00% | | 03/07/2025 | | | 326,860 | |
| | 250,000 | | | Sigma Holdco B.V., First Lien -Facility B4 (GBP) Term Loan | | 6M US L + 4.00% | | 07/02/2025 | | | 327,305 | |
| | | | | | | | | | | | 749,957 | |
| United States - 28.00% |
| | 235,082 | | | Access CIG LLC, First Lien -B Term Loan | | 3M US L + 3.75% | | 02/27/2025 | | | 234,225 | |
| | 125,000 | | | Adtalem Global Education, Inc., First Lien - B Term Loan | | 3M US L + 3.00%, 0.75% Floor | | 08/12/2028 | | | 125,328 | |
| | 125,000 | | | Allied Universal Holdco LLC, First Lien - Initial U.S. Dollar Term Loan | | 1M US L + 3.75%, 0.50% Floor | | 05/12/2028 | | | 125,248 | |
| | 53,000 | | | American Rock Salt Company LLC, First Lien - Initial Term Loan | | 3M US L + 3.25%, 0.75% Floor | | 06/09/2028 | | | 53,349 | |
| | 44,000 | | | Ankura Consulting Group LLC, First Lien - Closing Date Term Loan | | 3M US L + 4.00%, 0.75% Floor | | 03/17/2028 | | | 44,220 | |
| | 55,000 | | | Artera Services, LLC, TL | | L + 3.50%, 1.00% Floor | | 03/06/2025 | | | 54,794 | |
| | 246,875 | | | AssuredPartners, Inc., First Lien | | 1M US L + 3.50%, 0.50% Floor | | 02/13/2027 | | | 247,122 | |
| | 247,704 | | | Astoria Energy LLC, First Lien -B Advance (2020) Term Loan | | 3M US L + 4.25%, 1.00% Floor | | 12/10/2027 | | | 248,865 | |
See Notes to Financial Statements.
| 86 | (888) 848-7569 | www.rivernorth.com |
| RiverNorth/Oaktree High Income Fund | Schedule of Investments |
September 30, 2021
| Principal Amount/Description | | Rate | | Maturity | | Value | |
| $ | 141,706 | | | Asurion LLC, First Lien -New B-8 Term Loan | | 1M US L + 3.25% | | 12/23/2026 | | $ | 139,782 | |
| | 18,000 | | | Atlas Purchaser, Inc., First Lien -Initial Term Loan | | 3M US L + 3.00%, 0.75% Floor | | 05/08/2028 | | | 17,805 | |
| | 100,000 | | | Azalea TopCo, Inc., First Lien | | 3M US L + 4.00%, 0.75% Floor | | 07/24/2026 | | | 100,459 | |
| | 168,979 | | | BCP Renaissance Parent LLC, First Lien - Initial Term Loan | | 3M US L + 3.50%, 1.00% Floor | | 10/31/2024 | | | 167,839 | |
| | 7,105 | | | BCPE North Star US Holdco 2, Inc., First Lien | | 3M US L + 3.75%, 0.75% Floor | | 06/10/2028 | | | 7,107 | |
| | 37,895 | | | BCPE North Star US Holdco 2, Inc., First Lien - Initial Term Loan | | 3M US L + 3.75%, 0.75% Floor | | 06/09/2028 | | | 37,902 | |
| | 243,125 | | | Bracket Intermediate Holding Corp., First Lien - Initial Term Loan | | 3M US L + 4.25% | | 09/05/2025 | | | 243,023 | |
| | 243,775 | | | Brookfield WEC Holdings, Inc., First Lien - Initial (2021) Term Loan | | 3M US L + 2.75%, 0.50% Floor | | 08/01/2025 | | | 242,362 | |
| | 248,750 | | | Calpine Corp., First Lien -2020 Term Loan | | 1M US L + 2.50% | | 12/16/2027 | | | 248,470 | |
| | 234,250 | | | Camelot U.S. Acquisition 1 Co., First Lien - Initial Term Loan | | 1M US L + 3.00% | | 10/30/2026 | | | 233,933 | |
| | 24,938 | | | Carnival Corp., First Lien -Initial Advance Term Loan | | 3M US L + 7.50%, 0.75% Floor | | 06/30/2025 | | | 24,852 | |
| | 177,464 | | | Charter Next Generation, Inc., First Lien - Initial (2021) Term Loan | | 1M US L + 3.75%, 0.75% Floor | | 12/01/2027 | | | 178,060 | |
| | 247,468 | | | CITGO Petroleum Corp., First Lien -2019 Incremental B Term Loan | | 3M US L + 6.25%, 1.00% Floor | | 03/28/2024 | | | 248,294 | |
| | 19,000 | | | CP Iris Holdco I, Inc., First Lien | | L + 3.75%, 0.50% Floor | | 09/21/2028 | | | 19,012 | |
| | 28,000 | | | CPV Maryland LLC, First Lien -B Advance Term Loan | | 3M US L + 5.25%, 1.00% Floor | | 05/11/2028 | | | 27,300 | |
| | 150,000 | | | CQP Holdco LP TLB | | 3M US L + 4.00% | | 06/05/2028 | | | 149,719 | |
| | 77,000 | | | DIRECTV Financing LLC, First Lien -Closing Date Term Loan | | 3M US L + 5.00%, 0.75% Floor | | 08/02/2027 | | | 77,136 | |
| | 250,000 | | | DRW Holdings LLC, First Lien -Initial Term Loan | | 1M US L + 3.75% | | 03/01/2028 | | | 249,531 | |
| | 50,000 | | | Employbridge Holding Company, TLB | | L + 5.50% | | 07/14/2028 | | | 49,800 | |
| | 242,500 | | | Flynn Restaurant Group LP, First Lien - Initial Term Loan | | 1M US L + 3.50% | | 06/27/2025 | | | 240,348 | |
| | 125,000 | | | Flynn Restaurant Group LP, Second Lien - Initial Term Loan | | 1M US L + 7.00% | | 06/29/2026 | | | 123,750 | |
| | 49,872 | | | Generate Life Sciences, Inc., First Lien - Initial Term Loan | | 3M US L + 4.00% | | 08/06/2025 | | | 49,747 | |
| | 248,750 | | | Great Outdoors Group LLC, First Lien -B-1 Term Loan | | 3M US L + 4.50%, 0.75% Floor | | 03/06/2028 | | | 250,087 | |
| | 248,750 | | | Greeneden U.S. Holdings I LLC, First Lien - Initial Dollar (2020) Term Loan | | 1M US L + 4.00%, 0.75% Floor | | 12/01/2027 | | | 249,883 | |
See Notes to Financial Statements.
| Annual Report | September 30, 2021 | 87 |
| RiverNorth/Oaktree High Income Fund | Schedule of Investments |
September 30, 2021
| Principal Amount/Description | Rate | | Maturity | | Value | |
| $ | 246,358 | | | Harbor Freight Tools USA, Inc., First Lien - Initial (2021) Term Loan | | L + 2.75%, 0.50% Floor | | 10/19/2027 | | $ | 246,523 | |
| | 62,843 | | | Hudson River Trading LLC, First Lien | | 1M US L + 3.00% | | 03/20/2028 | | | 62,573 | |
| | 248,750 | | | IRB Holding Corp., First Lien -Fourth Amendment Incremental Term Loan | | 3M US L + 3.25%, 1.00% Floor | | 12/15/2027 | | | 249,430 | |
| | 249,375 | | | Ivanti Software, Inc., First Lien -Initial Term Loan | | 1M US L + 3.00%, 1.00% Floor | | 12/01/2027 | | | 250,525 | |
| | 110,359 | | | KUEHG Corp, First Lien -B-3 Term Loan | | 3M US L + 3.75%, 1.00% Floor | | 02/21/2025 | | | 109,524 | |
| | 130,582 | | | Life Time, Inc., First Lien -2021 Refinancing Term Loan | | 3M US L + 4.75%, 1.00% Floor | | 12/16/2024 | | | 131,752 | |
| | 232,196 | | | LMBE-MC Holdco II LLC, First Lien(i) | | 3M US L + 4.00%, 1.00% Floor | | 12/03/2025 | | | 223,198 | |
| | 248,750 | | | LogMeIn, Inc., First Lien -Initial Term Loan | | 1M US L + 4.75% | | 08/31/2027 | | | 248,925 | |
| | 37,500 | | | LTI Holdings, Inc., First Lien | | L + 4.75% | | 07/24/2026 | | | 37,453 | |
| | 62,500 | | | LTI Holdings, Inc., First Lien -Second Amendment Additional Term Loan | | 3M US L + 4.00% | | 07/24/2026 | | | 62,422 | |
| | 245,633 | | | Lumen Technologies, Inc., First Lien - B Term Loan | | 1M US L + 2.25% | | 03/15/2027 | | | 243,296 | |
| | 46,000 | | | Majordrive Holdings IV LLC, First Lien - Initial Term Loan | | 3M US L + 3.75%, 0.50% Floor | | 06/01/2028 | | | 46,151 | |
| | 55,827 | | | Marcel LUX IV S.a.r.l., First Lien -Original Facility Term Loan | | 1M US L + 4.00%, 0.75% Floor | | 12/31/2027 | | | 55,827 | |
| | 250,000 | | | Mileage Plus Holdings LLC, First Lien -Initial Term Loan | | 3M US L + 5.25%, 1.00% Floor | | 06/21/2027 | | | 265,860 | |
| | 240,665 | | | Natgasoline LLC, First Lien -Initial Term Loan | | 3M US L + 3.50% | | 11/14/2025 | | | 240,965 | |
| | 245,253 | | | Olaplex, Inc., First Lien -Initial Term Loan | | 3M US L + 6.50%, 1.00% Floor | | 01/08/2026 | | | 243,413 | |
| | 91,205 | | | Onvoy LLC, First Lien -Initial Term Loan | | 3M US L + 4.50%, 1.00% Floor | | 02/10/2024 | | | 91,238 | |
| | 50,000 | | | Oryx Midstream Services Permian Basin LLC, TLB | | L + 3.25%, 0.50% Floor | | 09/30/2028 | | | 49,750 | |
| | 248,750 | | | Pactiv Evergreen, Inc., First Lien - Tranche B-2 U.S. Term Loan(i) | | 1M US L + 3.25% | | 02/05/2026 | | | 247,351 | |
| | 69,000 | | | Parexel International Corp., First Lien | | 6M US L + 3.75%, 0.50% Floor | | 08/11/2028 | | | 69,097 | |
| | 99,494 | | | PetVet Care Centers LLC, First Lien -2021 Replacement Term Loan | | 3M US L + 3.50%, 0.75% Floor | | 02/14/2025 | | | 99,649 | |
| | 33,000 | | | Polaris Newco LLC, First Lien -Dollar Term Loan | | L + 4.00%, 0.50% Floor | | 06/04/2028 | | | 33,110 | |
| | 248,729 | | | ProAmpac PG Borrower LLC, First Lien - 2020-1 Term Loan | | 3M US L + 3.75%, 0.75% Floor | | 11/03/2025 | | | 249,506 | |
| | 55,000 | | | Proofpoint, Inc., First Lien -Initial Term Loan | | L + 3.25%, 0.50% Floor | | 06/10/2028 | | | 54,780 | |
See Notes to Financial Statements.
| 88 | (888) 848-7569 | www.rivernorth.com |
| RiverNorth/Oaktree High Income Fund | Schedule of Investments |
September 30, 2021
| Principal Amount/Description | Rate | | Maturity | | Value | |
| $ | 225,782 | | | ProQuest LLC, First Lien -Initial Term Loan | | 1M US L + 3.25% | | 10/23/2026 | | $ | 225,832 | |
| | 246,250 | | | Pug LLC, First Lien -USD B Term Loan | | 1M US L + 3.50% | | 02/12/2027 | | | 241,222 | |
| | 100,000 | | | QUIKRETE Holdings, Inc., First Lien - B-1 Fourth Amendment Term Loan | | 1M US L + 3.00% | | 02/21/2028 | | | 99,819 | |
| | 48,878 | | | Rackspace Technology Global, Inc., First Lien - 2021 B Term Loan | | 3M US L + 2.75%, 0.75% Floor | | 02/15/2028 | | | 48,578 | |
| | 235,231 | | | Recorded Books, Inc., First Lien -2021 Replacement Term Loan | | 3M US L + 2.75% | | 08/29/2025 | | | 235,782 | |
| | 41,220 | | | SCIH Salt Holdings, Inc., First Lien - Incremental B-1 Term Loan | | 3M US L + 3.50%, 0.75% Floor | | 03/16/2027 | | | 41,320 | |
| | 150,000 | | | Seaworld Parks & Entertainment, Inc., First Lien - B Term Loan | | L + 3.00%, 0.50% Floor | | 08/25/2028 | | | 149,720 | |
| | 220,338 | | | Shearer's Foods LLC, First Lien | | 3M US L + 3.50%, 0.75% Floor | | 09/23/2027 | | | 220,338 | |
| | 3,385 | | | SM Wellness Holdings, Inc., First Lien | | 3M US L + 2.375%, 1.00% Floor | | 04/15/2028 | | | 3,385 | |
| | 40,615 | | | SM Wellness Holdings, Inc., First Lien - Initial Term Loan | | 3M US L + 3.75%, 0.75% Floor | | 04/17/2028 | | | 40,615 | |
| | 250,000 | | | Sotera Health Holdings LLC, First Lien - Refinancing Term Loan | | 3M US L + 3.25%, 0.50% Floor | | 12/11/2026 | | | 249,584 | |
| | 149,625 | | | Spin Holdco, Inc., First Lien -Initial Term Loan | | 1M US L + 3.50%, 0.75% Floor | | 03/04/2028 | | | 150,212 | |
| | 213,103 | | | St. George's University Scholastic Services LLC, First Lien | | 3M US L + 3.25% | | 07/17/2025 | | | 213,103 | |
| | 75,000 | | | Standard Industries, Inc., First Lien -Initial Term Loan | | 3M US L + 2.50%, 0.50% Floor | | 09/22/2028 | | | 75,161 | |
| | 35,000 | | | Sylvamo Corporation, TLB | | L + 5.00% | | 08/18/2028 | | | 34,956 | |
| | 100,000 | | | Tiger Acquisition LLC, First Lien -Initial Term Loan | | L + 3.25%, 0.50% Floor | | 06/01/2028 | | | 99,766 | |
| | 29,000 | | | Tivity Health, Inc., TLB | | L + 4.25% | | 06/24/2028 | | | 29,025 | |
| | 43,000 | | | Triton Water Holdings, Inc., First Lien - Initial Term Loan | | 3M US L + 3.50%, 0.50% Floor | | 03/31/2028 | | | 42,997 | |
| | 248,705 | | | U.S. Anesthesia Partners, Inc., First Lien - Initial Term Loan | | 3M US L + 3.00%, 1.00% Floor | | 06/23/2024 | | | 249,024 | |
| | 273,590 | | | Uber Technologies, Inc., First Lien - 2021 Incremental Term Loan | | 1M US L + 3.50% | | 04/04/2025 | | | 274,026 | |
| | 228,551 | | | UFC Holdings LLC, First Lien | | 3M US L + 2.75%, 0.75% Floor | | 04/29/2026 | | | 228,281 | |
| | 248,128 | | | UKG, Inc., First Lien -2021 Incremental Term Loan | | 3M US L + 4.00%, 0.75% Floor | | 05/04/2026 | | | 248,944 | |
| | 49,875 | | | United AirLines, Inc., First Lien -Class B Term Loan | | 3M US L + 3.75%, 0.75% Floor | | 04/21/2028 | | | 50,331 | |
| | 45,000 | | | Univision Communications, Inc., First Lien - B Term Loan | | 3M US L + 4.00%, 0.75% Floor | | 05/05/2028 | | | 44,992 | |
See Notes to Financial Statements.
| Annual Report | September 30, 2021 | 89 |
RiverNorth/Oaktree High Income Fund | Schedule of Investments |
| September 30, 2021 |
Principal Amount/Description | | Rate | | | Maturity | | | Value | |
$ | 250,000 | | | Verscend Holding Corp., First Lien -B- 1 Term Loan | | 1M US L + 4.00% | | | | 08/27/2025 | | | $ | 250,676 | |
300,000 | | | Virgin Media Bristol LLC, First Lien - Facility Q Term Loan(i) | | 3M US L + 3.50% | | | | 01/31/2029 | | | | 300,458 | |
65,000 | | | W. R. Grace Holdings LLC, First Lien - Initial Term Loan | | L + 3.75%, 0.50% Floor | | | | 09/22/2028 | | | | 65,315 | |
83,000 | | | Whatabrands LLC, First Lien -Initial B Term Loan | | 1M US L + 3.25%, 0.50% Floor | | | | 08/03/2028 | | | | 83,019 | |
247,999 | | | William Morris Endeavor Entertainment LLC, First Lien - B-1 Term Loan | | 1M US L + 2.75% | | | | 05/18/2025 | | | | 243,682 | |
371,242 | | | Windstream Services II LLC, First Lien - Initial Term Loan | | 1M US L + 6.25%, 1.00% Floor | | | | 09/21/2027 | | | | 373,516 | |
130,309 | | | YI LLC, First Lien - Initial Term Loan | | 1M US L + 4.00%, 1.00% Floor | | | | 11/07/2024 | | | | 128,354 | |
| | | | | | | | | | | | | 12,863,703 | |
TOTAL BANK LOANS | | | | | | | | | | | |
(Cost $15,948,740) | | | | | | | | | | 16,004,768 | |
| | | | | | | | | | | | |
HIGH YIELD DEBT- 61.35% | | | | | | | | | | | |
Australia - 0.36% | | | | | | | | | | | |
40,000 | | | Mineral Resources, Ltd.(f) | | 8.13% | | | | 05/01/2027 | | | | 43,496 | |
120,000 | | | Nufarm Australia, Ltd. / Nufarm Americas, Inc.(f) | | 5.75% | | | | 04/30/2026 | | | | 123,300 | |
| | | | | | | | | | | | | 166,796 | |
Canada - 3.04% | | | | | | | | | | | |
80,000 | | | Bombardier, Inc.(f) | | 7.50% | | | | 03/15/2025 | | | | 81,800 | |
80,000 | | | Bombardier, Inc.(f) | | 7.13% | | | | 06/15/2026 | | | | 84,100 | |
45,000 | | | Bombardier, Inc.(f) | | 6.00% | | | | 02/15/2028 | | | | 45,567 | |
35,000 | | | Cascades, Inc./Cascades USA, Inc.(f) | | 5.13% | | | | 01/15/2026 | | | | 37,271 | |
110,000 | | | Cascades, Inc./Cascades USA, Inc.(f) | | 5.38% | | | | 01/15/2028 | | | | 115,777 | |
75,000 | | | Eldorado Gold Corp.(f) | | 6.25% | | | | 09/01/2029 | | | | 74,433 | |
70,000 | | | Empire Communities Corp.(f) | | 7.00% | | | | 12/15/2025 | | | | 73,237 | |
20,000 | | | First Quantum Minerals, Ltd.(f) | | 7.25% | | | | 04/01/2023 | | | | 20,375 | |
25,000 | | | First Quantum Minerals, Ltd.(f) | | 6.50% | | | | 03/01/2024 | | | | 25,344 | |
85,000 | | | GFL Environmental, Inc.(f) | | 5.13% | | | | 12/15/2026 | | | | 89,366 | |
35,000 | | | GFL Environmental, Inc.(f) | | 4.75% | | | | 06/15/2029 | | | | 36,006 | |
70,000 | | | GFL Environmental, Inc.(f) | | 4.38% | | | | 08/15/2029 | | | | 70,787 | |
150,000 | | | goeasy, Ltd.(f) | | 4.38% | | | | 05/01/2026 | | | | 154,313 | |
105,000 | | | Intelligent Packaging, Ltd. Finco, Inc. / Intelligent Packaging Ltd Co.-Issuer LLC(f) | | 6.00% | | | | 09/15/2028 | | | | 110,198 | |
50,000 | | | Intertape Polymer Group, Inc.(f) | | 4.38% | | | | 06/15/2029 | | | | 50,893 | |
45,000 | | | MEG Energy Corp.(f) | | 7.13% | | | | 02/01/2027 | | | | 47,304 | |
110,000 | | | Mercer International, Inc. | | 5.13% | | | | 02/01/2029 | | | | 112,475 | |
See Notes to Financial Statements. | |
90 | (888) 848-7569 | www.rivernorth.com |
RiverNorth/Oaktree High Income Fund | Schedule of Investments |
| September 30, 2021 |
Principal Amount/Description | | Rate | | | Maturity | | | Value | |
$ | 60,000 | | | Precision Drilling Corp.(f) | | 7.13% | | | | 01/15/2026 | | | $ | 61,748 | |
25,000 | | | Precision Drilling Corp.(f) | | 6.88% | | | | 01/15/2029 | | | | 26,150 | |
80,000 | | | Strathcona Resources, Ltd.(f) | | 6.88% | | | | 08/01/2026 | | | | 79,386 | |
| | | | | | | | | | | | | 1,396,530 | |
France - 1.98% | | | | | | | | | | | |
100,000 | | | Afflelou SAS | | 4.25% | | | | 05/19/2026 | | | | 119,234 | |
120,000 | | | Altice France SA(f) | | 5.50% | | | | 01/15/2028 | | | | 122,192 | |
55,000 | | | Altice France SA(f) | | 5.13% | | | | 07/15/2029 | | | | 54,002 | |
100,000 | | | Altice France SA(f) | | 4.25% | | | | 10/15/2029 | | | | 114,581 | |
100,000 | | | Banijay Entertainment SASU(f) | | 3.50% | | | | 03/01/2025 | | | | 117,315 | |
100,000 | | | Chrome Bidco SASU(f) | | 3.50% | | | | 05/31/2028 | | | | 118,658 | |
100,000 | | | Electricite de France SA(d)(e) | | 6.00% | | | | 01/29/2026 | | | | 149,138 | |
100,000 | | | Kapla Holding SAS | | 3.38% | | | | 12/15/2026 | | | | 116,543 | |
| | | | | | | | | | | | | 911,663 | |
Germany - 1.86% | | | | | | | | | | | |
100,000 | | | Cheplapharm Arzneimittel GmbH | | 4.38% | | | | 01/15/2028 | | | | 120,688 | |
100,000 | | | Gruenenthal GmbH(f) | | 4.13% | | | | 05/15/2028 | | | | 121,645 | |
100,000 | | | IHO Verwaltungs GmbH(c)(g) | | 3.75% (4.50%) | | | | 09/15/2026 | | | | 118,061 | |
120,000 | | | Nidda Healthcare Holding GmbH(g) | | 3.50% | | | | 09/30/2024 | | | | 138,372 | |
100,000 | | | Renk AG/Frankfurt am Main | | 5.75% | | | | 07/15/2025 | | | | 120,700 | |
100,000 | | | TUI Cruises GmbH | | 6.50% | | | | 05/15/2026 | | | | 119,686 | |
100,000 | | | WEPA Hygieneprodukte GmbH(g) | | 2.88% | | | | 12/15/2027 | | | | 113,312 | |
| | | | | | | | | | | | | 852,464 | |
Great Britain - 2.67% | | | | | | | | | | | |
100,000 | | | Arqiva Broadcast Finance PLC | | 6.75% | | | | 09/30/2023 | | | | 137,568 | |
100,000 | | | Bellis Acquisition Co. PLC(f) | | 3.25% | | | | 02/16/2026 | | | | 132,686 | |
55,000 | | | Connect Finco SARL / Connect US Finco LLC(f) | | 6.75% | | | | 10/01/2026 | | | | 57,616 | |
100,000 | | | eG Global Finance PLC | | 6.25% | | | | 10/30/2025 | | | | 118,613 | |
100,000 | | | Pinnacle Bidco PLC | | 5.50% | | | | 02/15/2025 | | | | 119,540 | |
60,000 | | | Rolls-Royce PLC(f) | | 5.75% | | | | 10/15/2027 | | | | 66,375 | |
100,000 | | | Thames Water Kemble Finance PLC | | 4.63% | | | | 05/19/2026 | | | | 140,910 | |
100,000 | | | Victoria PLC | | 3.63% | | | | 08/24/2026 | | | | 118,731 | |
60,000 | | | Virgin Media Finance PLC(f) | | 5.00% | | | | 07/15/2030 | | | | 61,608 | |
150,000 | | | Vmed O2 UK Financing I PLC(f) | | 4.75% | | | | 07/15/2031 | | | | 153,439 | |
| | | | | 3.00% - 5Y EUR | | | | | | | | | |
100,000 | | | Vodafone Group PLC(e) | | SWAP | | | | 08/27/2080 | | | | 119,482 | |
| | | | | | | | | | | | | 1,226,568 | |
Hong Kong - 0.19% | | | | | | | | | | | |
85,000 | | | Seaspan Corp.(f) | | 5.50% | | | | 08/01/2029 | | | | 86,825 | |
| | | | | | | | | | | | | | | |
Ireland - 0.91% | | | | | | | | | | | |
200,000 | | | Ardagh Packaging Finance PLC / Ardagh Holdings USA, Inc.(f) | | 5.25% | | | | 08/15/2027 | | | | 203,875 | |
75,000 | | | Jazz Securities DAC(f) | | 4.38% | | | | 01/15/2029 | | | | 77,816 | |
See Notes to Financial Statements. | |
Annual Report | September 30, 2021 | 91 |
RiverNorth/Oaktree High Income Fund | Schedule of Investments |
| September 30, 2021 |
Principal Amount/Description | | Rate | | | Maturity | | | Value | |
$ | 100,000 | | | Virgin Media Vendor Financing Notes III DAC(f) | | 4.88% | | | | 07/15/2028 | | | $ | 137,657 | |
| | | | | | | | | | | | | 419,348 | |
Isle Of Man - 0.25% | | | | | | | | |
100,000 | | | Playtech PLC | | 3.75% | | | | 10/12/2023 | | | | 117,136 | |
| | | | | | | | | | | | | | | |
Italy - 1.53% | | | | | | | | | | | |
100,000 | | | Bormioli Pharma SpA(e)(g) | | 3M EUR L + 3.50% | | | | 11/15/2024 | | | | 113,171 | |
100,000 | | | Brunello Bidco SpA(f) | | 3.50% | | | | 02/15/2028 | | | | 115,933 | |
| | | | | 3M EUR L + | | | | | | | | | |
100,000 | | | Cedacri Mergeco SPA(e)(f) | | 4.625% | | | | 05/15/2028 | | | | 116,703 | |
100,000 | | | Centurion Bidco SpA | | 5.88% | | | | 09/30/2026 | | | | 121,518 | |
100,000 | | | Gamma Bidco SpA(e) | | 3M EUR L + 6.00% | | | | 07/15/2025 | | | | 117,054 | |
100,000 | | | Sofima Holding SpA | | 3.75% | | | | 01/15/2028 | | | | 116,932 | |
| | | | | | | | | | | | | 701,311 | |
Jersey - 0.31% | | | | | | | | | | | |
100,000 | | | AA Bond Co., Ltd. | | 6.50% | | | | 01/31/2026 | | | | 141,876 | |
| | | | | | | | | | | | | | | |
Luxembourg - 2.87% | | | | | | | | | | | |
100,000 | | | Allied Universal Holdco LLC/Allied Universal Finance Corp./Atlas Luxco 4 Sarl(f) | | 4.63% | | | | 06/01/2028 | | | | 99,970 | |
100,000 | | | Altice Financing SA(f) | | 3.00% | | | | 01/15/2028 | | | | 109,324 | |
55,000 | | | Altice Financing SA(f) | | 5.75% | | | | 08/15/2029 | | | | 53,350 | |
100,000 | | | Altice Financing SA(f) | | 4.25% | | | | 08/15/2029 | | | | 113,880 | |
100,000 | | | Altice France Holding SA(f) | | 4.00% | | | | 02/15/2028 | | | | 109,231 | |
100,000 | | | ARD Finance SA(c)(f) | | 5.00% (5.75%) | | | | 06/30/2027 | | | | 120,551 | |
100,000 | | | Cirsa Finance International Sarl(f) | | 4.50% | | | | 03/15/2027 | | | | 114,899 | |
100,000 | | | Dana Financing Luxembourg Sarl(f) | | 3.00% | | | | 07/15/2029 | | | | 118,531 | |
100,000 | | | Lincoln Financing SARL(g) | | 3.63% | | | | 04/01/2024 | | | | 117,002 | |
100,000 | | | Matterhorn Telecom SA | | 4.00% | | | | 11/15/2027 | | | | 118,853 | |
100,000 | | | Summer BC Holdco B SARL(g) | | 5.75% | | | | 10/31/2026 | | | | 121,626 | |
100,000 | | | Telenet Finance Luxembourg Notes SARL(g) | | 3.50% | | | | 03/01/2028 | | | | 120,184 | |
| | | | | | | | | | | | | 1,317,401 | |
Netherlands - 3.15% | | | | | | | | | | | |
185,000 | | | Diamond BC BV(f) | | 4.63% | | | | 10/01/2029 | | | | 188,009 | |
115,000 | | | Energizer Gamma Acquisition BV(f) | | 3.50% | | | | 06/30/2029 | | | | 132,452 | |
107,000 | | | OCI NV(f) | | 4.63% | | | | 10/15/2025 | | | | 112,542 | |
100,000 | | | Sigma Holdco BV(g) | | 5.75% | | | | 05/15/2026 | | | | 111,015 | |
100,000 | | | Telefonica Europe BV(d)(e)(f) | | 4.38% | | | | 12/14/2024 | | | | 125,833 | |
100,000 | | | Titan Holdings II BV(f) | | 5.13% | | | | 07/15/2029 | | | | 117,787 | |
100,000 | | | Trivium Packaging Finance BV(f) | | 3.75% | | | | 08/15/2026 | | | | 118,800 | |
200,000 | | | UPC Holding BV(f) | | 5.50% | | | | 01/15/2028 | | | | 209,595 | |
45,000 | | | Ziggo Bond Co. BV(f) | | 5.13% | | | | 02/28/2030 | | | | 46,226 | |
See Notes to Financial Statements. | |
92 | (888) 848-7569 | www.rivernorth.com |
RiverNorth/Oaktree High Income Fund | Schedule of Investments |
| September 30, 2021 |
Principal Amount/Description | | Rate | | | Maturity | | | Value | |
$ | 100,000 | | | Ziggo Bond Co. BV | | 3.38% | | | | 02/28/2030 | | | $ | 115,835 | |
145,000 | | | Ziggo Bond Co. BV(f) | | 3.38% | | | | 02/28/2030 | | | | 167,960 | |
| | | | | | | | | | | | | 1,446,054 | |
Spain - 0.77% | | | | | | | | | | | |
100,000 | | | Grifols Escrow Issuer SA(f) | | 3.88% | | | | 10/15/2028 | | | | 117,342 | |
100,000 | | | Grupo Antolin-Irausa SA | | 3.38% | | | | 04/30/2026 | | | | 113,972 | |
105,000 | | | Lorca Telecom Bondco SA(f) | | 4.00% | | | | 09/18/2027 | | | | 122,545 | |
| | | | | | | | | | | | | 353,859 | |
Sweden - 0.51% | | | | | | | | | | | |
100,000 | | | Intrum AB(g) | | 3.00% | | | | 09/15/2027 | | | | 115,628 | |
100,000 | | | Verisure Midholding AB | | 5.25% | | | | 02/15/2029 | | | | 119,096 | |
| | | | | | | | | | | | | 234,724 | |
United States - 40.95% | | | | | | | | |
40,000 | | | Academy, Ltd.(f) | | 6.00% | | | | 11/15/2027 | | | | 43,250 | |
135,000 | | | Acadia Healthcare Co., Inc.(f) | | 5.50% | | | | 07/01/2028 | | | | 142,083 | |
10,000 | | | Acadia Healthcare Co., Inc.(f) | | 5.00% | | | | 04/15/2029 | | | | 10,425 | |
70,000 | | | Acuris Finance US, Inc. / Acuris Finance SARL(f) | | 5.00% | | | | 05/01/2028 | | | | 69,746 | |
10,000 | | | ADT Security Corp.(f) | | 4.13% | | | | 08/01/2029 | | | | 9,951 | |
70,000 | | | Ahead DB Holdings LLC(f) | | 6.63% | | | | 05/01/2028 | | | | 70,631 | |
45,000 | | | Albertsons Cos. Inc / Safeway, Inc. / New Albertsons LP / Albertsons LLC(f) | | 5.88% | | | | 02/15/2028 | | | | 47,981 | |
105,000 | | | Allied Universal Holdco LLC / Allied Universal Finance Corp.(f) | | 6.63% | | | | 07/15/2026 | | | | 111,146 | |
95,000 | | | Ambience Merger Sub, Inc.(f) | | 7.13% | | | | 07/15/2029 | | | | 94,287 | |
60,000 | | | American Airlines, Inc.(f) | | 11.75% | | | | 07/15/2025 | | | | 74,325 | |
50,000 | | | American Airlines, Inc./AAdvantage Loyalty IP, Ltd.(f) | | 5.50% | | | | 04/20/2026 | | | | 52,625 | |
30,000 | | | American Airlines, Inc./AAdvantage Loyalty IP, Ltd.(f) | | 5.75% | | | | 04/20/2029 | | | | 32,362 | |
65,000 | | | American Axle & Manufacturing, Inc. | | 5.00% | | | | 10/01/2029 | | | | 63,342 | |
175,000 | | | APX Group, Inc.(f) | | 6.75% | | | | 02/15/2027 | | | | 186,130 | |
70,000 | | | APX Group, Inc.(f) | | 5.75% | | | | 07/15/2029 | | | | 69,191 | |
10,000 | | | Aramark Services, Inc.(f) | | 6.38% | | | | 05/01/2025 | | | | 10,525 | |
115,000 | | | Aramark Services, Inc.(f) | | 5.00% | | | | 02/01/2028 | | | | 118,317 | |
45,000 | | | Archrock Partners LP / Archrock Partners Finance Corp.(f) | | 6.88% | | | | 04/01/2027 | | | | 47,381 | |
105,000 | | | Archrock Partners LP / Archrock Partners Finance Corp.(f) | | 6.25% | | | | 04/01/2028 | | | | 108,737 | |
105,000 | | | Arconic Corp.(f) | | 6.13% | | | | 02/15/2028 | | | | 111,433 | |
85,000 | | | Artera Services LLC(f) | | 9.03% | | | | 12/04/2025 | | | | 92,331 | |
31,000 | | | Asbury Automotive Group, Inc. | | 4.50% | | | | 03/01/2028 | | | | 31,852 | |
33,000 | | | Asbury Automotive Group, Inc. | | 4.75% | | | | 03/01/2030 | | | | 34,485 | |
75,000 | | | Ascent Resources Utica Holdings LLC / ARU Finance Corp.(f) | | 7.00% | | | | 11/01/2026 | | | | 77,624 | |
80,000 | | | Ashland LLC(f) | | 3.38% | | | | 09/01/2031 | | | | 80,800 | |
See Notes to Financial Statements. | |
Annual Report | September 30, 2021 | 93 |
RiverNorth/Oaktree High Income Fund | Schedule of Investments |
| September 30, 2021 |
Principal Amount/Description | | Rate | | | Maturity | | | Value | |
$ | 55,000 | | | Ashton Woods USA LLC / Ashton Woods Finance Co.(f) | | 4.63% | | | | 08/01/2029 | | | $ | 55,604 | |
60,000 | | | AssuredPartners, Inc.(f) | | 5.63% | | | | 01/15/2029 | | | | 60,460 | |
6,000 | | | Bath & Body Works, Inc.(f) | | 9.38% | | | | 07/01/2025 | | | | 7,620 | |
105,000 | | | Bath & Body Works, Inc. | | 7.50% | | | | 06/15/2029 | | | | 119,881 | |
15,000 | | | Bath & Body Works, Inc.(f) | | 6.63% | | | | 10/01/2030 | | | | 17,044 | |
71,000 | | | Bausch Health Cos., Inc.(f) | | 6.13% | | | | 04/15/2025 | | | | 72,555 | |
65,000 | | | Bausch Health Cos., Inc.(f) | | 4.88% | | | | 06/01/2028 | | | | 67,437 | |
60,000 | | | Big River Steel LLC / BRS Finance Corp.(f) | | 6.63% | | | | 01/31/2029 | | | | 64,985 | |
35,000 | | | Block Communications, Inc.(f) | | 4.88% | | | | 03/01/2028 | | | | 35,857 | |
65,000 | | | Boyd Gaming Corp. | | 4.75% | | | | 12/01/2027 | | | | 67,076 | |
65,000 | | | Brink’s Co.(f) | | 5.50% | | | | 07/15/2025 | | | | 68,042 | |
45,000 | | | Buckeye Partners LP(f) | | 4.50% | | | | 03/01/2028 | | | | 45,754 | |
85,000 | | | Cablevision Lightpath LLC(f) | | 5.63% | | | | 09/15/2028 | | | | 85,440 | |
125,000 | | | Caesars Entertainment, Inc.(f) | | 6.25% | | | | 07/01/2025 | | | | 131,751 | |
160,000 | | | Calpine Corp.(f) | | 5.13% | | | | 03/15/2028 | | | | 162,237 | |
30,000 | | | Carnival Corp.(f) | | 4.00% | | | | 08/01/2028 | | | | 30,337 | |
25,000 | | | Carpenter Technology Corp. | | 6.38% | | | | 07/15/2028 | | | | 26,901 | |
50,000 | | | CCO Holdings LLC / CCO Holdings Capital Corp.(f) | | 5.50% | | | | 05/01/2026 | | | | 51,626 | |
25,000 | | | CCO Holdings LLC / CCO Holdings Capital Corp.(f) | | 5.00% | | | | 02/01/2028 | | | | 26,129 | |
15,000 | | | CCO Holdings LLC / CCO Holdings Capital Corp.(f) | | 5.38% | | | | 06/01/2029 | | | | 16,219 | |
120,000 | | | CCO Holdings LLC / CCO Holdings Capital Corp.(f) | | 4.75% | | | | 03/01/2030 | | | | 125,607 | |
130,000 | | | Cedar Fair LP | | 5.25% | | | | 07/15/2029 | | | | 133,485 | |
65,000 | | | Central Garden & Pet Co. | | 5.13% | | | | 02/01/2028 | | | | 68,694 | |
14,000 | | | ChampionX Corp. | | 6.38% | | | | 05/01/2026 | | | | 14,613 | |
80,000 | | | Change Healthcare Holdings LLC / Change Healthcare Finance, Inc.(f) | | 5.75% | | | | 03/01/2025 | | | | 80,700 | |
5,000 | | | Cheniere Energy Partners LP(f) | | 3.25% | | | | 01/31/2032 | | | | 5,023 | |
90,000 | | | Cheniere Energy, Inc. | | 4.63% | | | | 10/15/2028 | | | | 94,950 | |
25,000 | | | Chesapeake Energy Corp.(f) | | 5.50% | | | | 02/01/2026 | | | | 26,156 | |
40,000 | | | Chesapeake Energy Corp.(f) | | 5.88% | | | | 02/01/2029 | | | | 42,788 | |
30,000 | | | Chobani LLC / Chobani Finance Corp., Inc.(f) | | 7.50% | | | | 04/15/2025 | | | | 31,252 | |
30,000 | | | CHS/Community Health Systems, Inc.(f) | | 8.00% | | | | 03/15/2026 | | | | 31,852 | |
60,000 | | | CHS/Community Health Systems, Inc.(f) | | 5.63% | | | | 03/15/2027 | | | | 62,903 | |
160,000 | | | CHS/Community Health Systems, Inc.(f) | | 6.00% | | | | 01/15/2029 | | | | 169,800 | |
15,000 | | | CHS/Community Health Systems, Inc.(f) | | 4.75% | | | | 02/15/2031 | | | | 15,112 | |
65,000 | | | Churchill Downs, Inc.(f) | | 5.50% | | | | 04/01/2027 | | | | 67,519 | |
10,000 | | | Churchill Downs, Inc.(f) | | 4.75% | | | | 01/15/2028 | | | | 10,475 | |
145,000 | | | CITGO Petroleum Corp.(f) | | 7.00% | | | | 06/15/2025 | | | | 148,461 | |
35,000 | | | CITGO Petroleum Corp.(f) | | 6.38% | | | | 06/15/2026 | | | | 35,762 | |
30,000 | | | Clean Harbors, Inc.(f) | | 5.13% | | | | 07/15/2029 | | | | 32,949 | |
56,000 | | | Clear Channel Outdoor Holdings, Inc.(f) | | 7.75% | | | | 04/17/2028 | | | | 59,015 | |
See Notes to Financial Statements. | |
94 | (888) 848-7569 | www.rivernorth.com |
RiverNorth/Oaktree High Income Fund | Schedule of Investments |
September 30, 2021
Principal Amount/Description | | Rate | | Maturity | | Value | |
$ | 65,000 | | | Cleveland-Cliffs, Inc.(f) | | 6.75% | | 03/15/2026 | | $ | 69,387 | |
| 70,000 | | | Cleveland-Cliffs, Inc.(f) | | 4.63% | | 03/01/2029 | | | 71,575 | |
| 30,000 | | | Cleveland-Cliffs, Inc.(f) | | 4.88% | | 03/01/2031 | | | 31,013 | |
| 75,000 | | | Colgate Energy Partners III LLC(f) | | 7.75% | | 02/15/2026 | | | 79,097 | |
| 20,000 | | | Colgate Energy Partners III LLC(f) | | 5.88% | | 07/01/2029 | | | 20,176 | |
| 34,000 | | | CommScope Technologies LLC(f) | | 6.00% | | 06/15/2025 | | | 34,468 | |
| 155,000 | | | CommScope Technologies LLC(f) | | 5.00% | | 03/15/2027 | | | 147,665 | |
| 30,000 | | | CommScope, Inc.(f) | | 6.00% | | 03/01/2026 | | | 31,187 | |
| 70,000 | | | CommScope, Inc.(f) | | 4.75% | | 09/01/2029 | | | 70,000 | |
| 100,000 | | | Compass Group Diversified Holdings LLC(f) | | 5.25% | | 04/16/2029 | | | 104,750 | |
| 85,000 | | | Comstock Resources, Inc.(f) | | 6.75% | | 03/01/2029 | | | 91,906 | |
| 25,000 | | | Comstock Resources, Inc.(f) | | 5.88% | | 01/15/2030 | | | 26,035 | |
| 75,000 | | | Consensus Cloud Solutions, Inc.(f) | | 6.50% | | 10/15/2028 | | | 78,019 | |
| 70,000 | | | Consolidated Communications, Inc.(f) | | 5.00% | | 10/01/2028 | | | 72,366 | |
| 130,000 | | | Coty, Inc.(f) | | 5.00% | | 04/15/2026 | | | 132,964 | |
| 62,000 | | | CrownRock LP / CrownRock Finance, Inc.(f) | | 5.63% | | 10/15/2025 | | | 63,532 | |
| 35,000 | | | CrownRock LP / CrownRock Finance, Inc.(f) | | 5.00% | | 05/01/2029 | | | 36,587 | |
| 115,000 | | | CSC Holdings LLC(f) | | 5.75% | | 01/15/2030 | | | 117,088 | |
| 110,000 | | | CSC Holdings LLC(f) | | 4.63% | | 12/01/2030 | | | 104,421 | |
| 30,000 | | | CSC Holdings LLC(f) | | 5.00% | | 11/15/2031 | | | 28,791 | |
| 20,000 | | | Cushman & Wakefield US Borrower LLC(f) | | 6.75% | | 05/15/2028 | | | 21,725 | |
| 20,000 | | | Dana, Inc. | | 5.38% | | 11/15/2027 | | | 21,100 | |
| 30,000 | | | Dana, Inc. | | 5.63% | | 06/15/2028 | | | 32,343 | |
| 140,000 | | | DaVita, Inc.(f) | | 4.63% | | 06/01/2030 | | | 144,181 | |
| 25,000 | | | DCP Midstream Operating LP | | 5.13% | | 05/15/2029 | | | 28,179 | |
| 30,000 | | | DCP Midstream Operating LP(f) | | 6.45% | | 11/03/2036 | | | 37,334 | |
| 20,000 | | | DCP Midstream Operating LP | | 5.60% | | 04/01/2044 | | | 23,396 | |
| 135,000 | | | DIRECTV Holdings LLC / DIRECTV Financing Co., Inc.(f) | | 5.88% | | 08/15/2027 | | | 141,075 | |
| 35,000 | | | DISH DBS Corp. | | 7.75% | | 07/01/2026 | | | 39,567 | |
| 35,000 | | | DISH DBS Corp. | | 7.38% | | 07/01/2028 | | | 37,164 | |
| 55,000 | | | DISH DBS Corp. | | 5.13% | | 06/01/2029 | | | 53,963 | |
| 55,000 | | | DT Midstream, Inc.(f) | | 4.38% | | 06/15/2031 | | | 56,719 | |
| 50,000 | | | Dycom Industries, Inc.(f) | | 4.50% | | 04/15/2029 | | | 50,274 | |
| 45,000 | | | Edgewell Personal Care Co.(f) | | 5.50% | | 06/01/2028 | | | 47,582 | |
| 65,000 | | | Elastic NV(f) | | 4.13% | | 07/15/2029 | | | 65,406 | |
| 80,000 | | | Encompass Health Corp. | | 4.50% | | 02/01/2028 | | | 82,704 | |
| 50,000 | | | EnLink Midstream LLC(f) | | 5.63% | | 01/15/2028 | | | 53,299 | |
| 15,000 | | | EQM Midstream Partners LP(f) | | 4.50% | | 01/15/2029 | | | 15,581 | |
| 70,000 | | | EQM Midstream Partners LP(f) | | 4.75% | | 01/15/2031 | | | 72,889 | |
| 10,000 | | | FirstCash, Inc.(f) | | 4.63% | | 09/01/2028 | | | 10,387 | |
| 35,000 | | | FirstEnergy Corp. | | 5.35% | | 07/15/2047 | | | 42,752 | |
| 25,000 | | | FirstEnergy Transmission LLC(f) | | 4.55% | | 04/01/2049 | | | 29,335 | |
See Notes to Financial Statements.
| Annual Report | September 30, 2021 | 95 |
RiverNorth/Oaktree High Income Fund | Schedule of Investments |
Principal Amount/Description | | Rate | | Maturity | | Value | |
$ | 5,000 | | | Ford Motor Credit Co. LLC | | 5.60% | | 01/07/2022 | | $ | 5,066 | |
| 30,000 | | | Ford Motor Credit Co. LLC | | 5.13% | | 06/16/2025 | | | 32,625 | |
| 45,000 | | | Ford Motor Credit Co. LLC | | 4.13% | | 08/17/2027 | | | 47,779 | |
| 70,000 | | | Ford Motor Credit Co. LLC | | 5.11% | | 05/03/2029 | | | 78,312 | |
| 30,000 | | | Frontier Communications Holdings LLC(f) | | 5.88% | | 10/15/2027 | | | 31,912 | |
| 195,000 | | | Frontier Communications Holdings LLC(f) | | 5.00% | | 05/01/2028 | | | 204,994 | |
| 35,000 | | | Frontier Communications Holdings LLC(f) | | 6.75% | | 05/01/2029 | | | 36,934 | |
| 35,000 | | | Go Daddy Operating Co. LLC / GD Finance Co, Inc.(f) | | 5.25% | | 12/01/2027 | | | 36,531 | |
| 125,000 | | | Golden Nugget, Inc.(f) | | 6.75% | | 10/15/2024 | | | 125,319 | |
| 55,000 | | | Goodyear Tire & Rubber Co. | | 9.50% | | 05/31/2025 | | | 60,431 | |
| 35,000 | | | Goodyear Tire & Rubber Co. | | 5.25% | | 04/30/2031 | | | 37,657 | |
| 80,000 | | | Great Lakes Dredge & Dock Corp.(f) | | 5.25% | | 06/01/2029 | | | 82,900 | |
| 75,000 | | | Greystar Real Estate Partners LLC(f) | | 5.75% | | 12/01/2025 | | | 76,282 | |
| 55,000 | | | Grinding Media, Inc. / Moly-Cop AltaSteel, Ltd.(f) | | 7.38% | | 12/15/2023 | | | 56,100 | |
| 60,000 | | | Hawaiian Brand Intellectual Property, Ltd. / HawaiianMiles Loyalty, Ltd.(f) | | 5.75% | | 01/20/2026 | | | 62,850 | |
| 45,000 | | | Helios Software Holdings, Inc. / ION Corporate Solutions Finance Sarl(f) | | 4.63% | | 05/01/2028 | | | 44,381 | |
| 100,000 | | | Herc Holdings, Inc.(f) | | 5.50% | | 07/15/2027 | | | 105,047 | |
| 75,000 | | | Hess Midstream Operations LP(f) | | 5.63% | | 02/15/2026 | | | 77,906 | |
| 5,000 | | | Hess Midstream Operations LP(f) | | 5.13% | | 06/15/2028 | | | 5,229 | |
| 50,000 | | | Hess Midstream Operations LP(f) | | 4.25% | | 02/15/2030 | | | 50,625 | |
| 135,000 | | | Hilton Grand Vacations Borrower Escrow LLC / Hilton Grand Vacations Borrower Esc(f) | | 5.00% | | 06/01/2029 | | | 137,869 | |
| 95,000 | | | HLF Financing Sarl LLC / Herbalife International, Inc.(f) | | 4.88% | | 06/01/2029 | | | 95,119 | |
| 45,000 | | | HUB International, Ltd.(f) | | 7.00% | | 05/01/2026 | | | 46,575 | |
| 15,000 | | | Hunt Companies, Inc.(f) | | 5.25% | | 04/15/2029 | | | 14,720 | |
| 40,000 | | | IAA, Inc.(f) | | 5.50% | | 06/15/2027 | | | 41,850 | |
| 10,000 | | | iHeartCommunications, Inc. | | 8.38% | | 05/01/2027 | | | 10,700 | |
| 110,000 | | | iHeartCommunications, Inc.(f) | | 5.25% | | 08/15/2027 | | | 114,434 | |
| 80,000 | | | Illuminate Buyer LLC / Illuminate Holdings IV, Inc.(f) | | 9.00% | | 07/01/2028 | | | 88,305 | |
| 135,000 | | | Imola Merger Corp.(f) | | 4.75% | | 05/15/2029 | | | 139,829 | |
| 105,000 | | | Intelsat Jackson Holdings SA(f)(h) | | 8.00% | | 02/15/2024 | | | 107,887 | |
| 100,000 | | | International Game Technology PLC | | 3.50% | | 06/15/2026 | | | 119,061 | |
| 55,000 | | | Iron Mountain, Inc.(f) | | 5.25% | | 03/15/2028 | | | 57,544 | |
| 15,000 | | | Iron Mountain, Inc.(f) | | 5.00% | | 07/15/2028 | | | 15,653 | |
| 105,000 | | | Iron Mountain, Inc.(f) | | 4.88% | | 09/15/2029 | | | 110,119 | |
| 55,000 | | | Iron Mountain, Inc.(f) | | 5.25% | | 07/15/2030 | | | 58,436 | |
See Notes to Financial Statements.
| 96 | (888) 848-7569 | www.rivernorth.com |
RiverNorth/Oaktree High Income Fund | Schedule of Investments |
Principal Amount/Description | | Rate | | Maturity | | Value | |
$ | 50,000 | | | Jefferies Finance LLC / JFIN Co.-Issuer Corp.(f) | | 5.00% | | 08/15/2028 | | $ | 50,750 | |
| 115,000 | | | Kennedy-Wilson, Inc. | | 4.75% | | 03/01/2029 | | | 117,156 | |
| 40,000 | | | Kennedy-Wilson, Inc. | | 4.75% | | 02/01/2030 | | | 40,660 | |
| 90,000 | | | Kraft Heinz Foods Co. | | 6.88% | | 01/26/2039 | | | 133,032 | |
| 40,000 | | | Kraft Heinz Foods Co. | | 6.50% | | 02/09/2040 | | | 56,894 | |
| 30,000 | | | Kraft Heinz Foods Co. | | 4.88% | | 10/01/2049 | | | 36,582 | |
| 20,000 | | | Lamar Media Corp. | | 4.00% | | 02/15/2030 | | | 20,615 | |
| 45,000 | | | Laredo Petroleum, Inc. | | 9.50% | | 01/15/2025 | | | 46,688 | |
| 70,000 | | | LD Holdings Group LLC(f) | | 6.50% | | 11/01/2025 | | | 69,917 | |
| 60,000 | | | Leeward Renewable Energy Operations LLC(f) | | 4.25% | | 07/01/2029 | | | 61,061 | |
| 75,000 | | | Level 3 Financing, Inc. | | 5.25% | | 03/15/2026 | | | 77,494 | |
| 20,000 | | | Level 3 Financing, Inc.(f) | | 4.63% | | 09/15/2027 | | | 20,601 | |
| 75,000 | | | LFS Topco LLC(f) | | 5.88% | | 10/15/2026 | | | 77,349 | |
| 15,000 | | | Live Nation Entertainment, Inc.(f) | | 6.50% | | 05/15/2027 | | | 16,519 | |
| 165,000 | | | Lumen Technologies, Inc.(f) | | 5.13% | | 12/15/2026 | | | 171,394 | |
| 5,000 | | | Lumen Technologies, Inc.(f) | | 4.50% | | 01/15/2029 | | | 4,851 | |
| 125,000 | | | Marriott Ownership Resorts, Inc.(f) | | 6.13% | | 09/15/2025 | | | 132,188 | |
| 45,000 | | | Masonite International Corp.(f) | | 5.38% | | 02/01/2028 | | | 47,441 | |
| 250,000 | | | Mauser Packaging Solutions Holding Co.(f) | | 5.50% | | 04/15/2024 | | | 252,500 | |
| 145,000 | | | MEDNAX, Inc.(f) | | 6.25% | | 01/15/2027 | | | 152,613 | |
| 60,000 | | | Mercer International, Inc. | | 5.50% | | 01/15/2026 | | | 61,350 | |
| 34,000 | | | MGIC Investment Corp. | | 5.25% | | 08/15/2028 | | | 36,322 | |
| 60,000 | | | Midwest Gaming Borrower LLC / Midwest Gaming Finance Corp.(f) | | 4.88% | | 05/01/2029 | | | 61,200 | |
| 60,000 | | | ModivCare Escrow Issuer, Inc.(f) | | 5.00% | | 10/01/2029 | | | 62,268 | |
| 80,000 | | | Mozart Debt Merger Sub, Inc.(f) | | 5.25% | | 10/01/2029 | | | 81,000 | |
| 80,000 | | | MPH Acquisition Holdings LLC(f) | | 5.50% | | 09/01/2028 | | | 79,890 | |
| 85,000 | | | MPH Acquisition Holdings LLC(f) | | 5.75% | | 11/01/2028 | | | 80,197 | |
| 45,000 | | | Murphy Oil Corp. | | 5.88% | | 12/01/2027 | | | 46,890 | |
| 105,000 | | | Nabors Industries, Ltd.(f) | | 7.25% | | 01/15/2026 | | | 102,291 | |
| 30,000 | | | Nabors Industries, Ltd.(f) | | 7.50% | | 01/15/2028 | | | 28,475 | |
| 35,000 | | | NCR Corp.(f) | | 5.75% | | 09/01/2027 | | | 36,971 | |
| 105,000 | | | NCR Corp.(f) | | 5.13% | | 04/15/2029 | | | 108,413 | |
| 80,000 | | | NCR Corp.(f) | | 6.13% | | 09/01/2029 | | | 86,900 | |
| 40,000 | | | NCR Corp.(f) | | 5.25% | | 10/01/2030 | | | 42,012 | |
| 35,000 | | | New Enterprise Stone & Lime Co., Inc.(f) | | 9.75% | | 07/15/2028 | | | 38,118 | |
| 115,000 | | | New Enterprise Stone & Lime Co., Inc.(f) | | 5.25% | | 07/15/2028 | | | 116,581 | |
| 95,000 | | | Nexstar Media, Inc.(f) | | 5.63% | | 07/15/2027 | | | 100,626 | |
| 80,000 | | | Nexstar Media, Inc.(f) | | 4.75% | | 11/01/2028 | | | 83,091 | |
| 130,000 | | | NFP Corp.(f) | | 6.88% | | 08/15/2028 | | | 132,913 | |
| 5,000 | | | NuStar Logistics LP | | 6.00% | | 06/01/2026 | | | 5,409 | |
| 55,000 | | | NuStar Logistics LP | | 6.38% | | 10/01/2030 | | | 60,569 | |
| 35,000 | | | Occidental Pete Oxy | | 4.20% | | 03/15/2048 | | | 33,470 | |
| 65,000 | | | Occidental Petroleum Corp. | | 4.50% | | 07/15/2044 | | | 65,426 | |
See Notes to Financial Statements.
| Annual Report | September 30, 2021 | 97 |
RiverNorth/Oaktree High Income Fund | Schedule of Investments |
Principal Amount/Description | | Rate | | Maturity | | Value | |
$ | 55,000 | | | Occidental Petroleum Corp. | | 4.40% | | 04/15/2046 | | $ | 54,923 | |
| 25,000 | | | Occidental Petroleum Corp. | | 4.40% | | 08/15/2049 | | | 24,576 | |
| 50,000 | | | Oceaneering International, Inc. | | 6.00% | | 02/01/2028 | | | 50,844 | |
| 20,000 | | | Olin Corp. | | 5.63% | | 08/01/2029 | | | 22,012 | |
| 105,000 | | | Olin Corp. | | 5.00% | | 02/01/2030 | | | 111,169 | |
| 75,000 | | | Olympus Water US Holding Corp.(f) | | 4.25% | | 10/01/2028 | | | 74,005 | |
| 35,000 | | | Olympus Water US Holding Corp.(f) | | 6.25% | | 10/01/2029 | | | 34,727 | |
| 90,000 | | | Organon & Co. / Organon Foreign Debt Co-Issuer BV(f) | | 5.13% | | 04/30/2031 | | | 94,644 | |
| 30,000 | | | Ortho-Clinical Diagnostics, Inc. / Ortho-Clinical Diagnostics SA(f) | | 7.25% | | 02/01/2028 | | | 32,152 | |
| 35,000 | | | Outfront Media Capital LLC / Outfront Media Capital Corp.(f) | | 6.25% | | 06/15/2025 | | | 37,012 | |
| 20,000 | | | Outfront Media Capital LLC / Outfront Media Capital Corp.(f) | | 5.00% | | 08/15/2027 | | | 20,538 | |
| 35,000 | | | Outfront Media Capital LLC / Outfront Media Capital Corp.(f) | | 4.25% | | 01/15/2029 | | | 34,737 | |
| 50,000 | | | Owens & Minor, Inc.(f) | | 4.50% | | 03/31/2029 | | | 50,563 | |
| 130,000 | | | Pactiv Evergreen Group Issuer LLC(f) | | 4.38% | | 10/15/2028 | | | 130,650 | |
| 220,000 | | | Par Pharmaceutical, Inc.(f) | | 7.50% | | 04/01/2027 | | | 224,415 | |
| 110,000 | | | Park Intermediate Holdings LLC / PK Domestic Property LLC / PK Finance Co.-Issuer(f) | | 4.88% | | 05/15/2029 | | | 113,352 | |
| 30,000 | | | PDC Energy, Inc. | | 6.13% | | 09/15/2024 | | | 30,487 | |
| 65,000 | | | PDC Energy, Inc. | | 5.75% | | 05/15/2026 | | | 67,763 | |
| 70,000 | | | PennyMac Financial Services, Inc.(f) | | 5.75% | | 09/15/2031 | | | 69,985 | |
| 75,000 | | | Performance Food Group, Inc.(f) | | 5.50% | | 10/15/2027 | | | 78,623 | |
| 30,000 | | | Performance Food Group, Inc.(f) | | 4.25% | | 08/01/2029 | | | 30,113 | |
| 25,000 | | | PG&E Corp. | | 5.00% | | 07/01/2028 | | | 25,500 | |
| 95,000 | | | PG&E Corp. | | 5.25% | | 07/01/2030 | | | 97,375 | |
| 155,000 | | | Pike Corp.(f) | | 5.50% | | 09/01/2028 | | | 158,160 | |
| 55,000 | | | Powdr Corp.(f) | | 6.00% | | 08/01/2025 | | | 57,838 | |
| 10,000 | | | Prestige Brands, Inc.(f) | | 5.13% | | 01/15/2028 | | | 10,448 | |
| 220,000 | | | Prime Security Services Borrower LLC / Prime Finance, Inc.(f) | | 6.25% | | 01/15/2028 | | | 227,733 | |
| 110,000 | | | Primo Water Holdings, Inc. | | 3.88% | | 10/31/2028 | | | 132,234 | |
| 45,000 | | | QVC, Inc. | | 4.75% | | 02/15/2027 | | | 47,756 | |
| 85,000 | | | Realogy Group LLC / Realogy Co.-Issuer Corp.(f) | | 7.63% | | 06/15/2025 | | | 90,882 | |
| 20,000 | | | Realogy Group LLC / Realogy Co.-Issuer Corp.(f) | | 5.75% | | 01/15/2029 | | | 20,773 | |
| 90,000 | | | Renewable Energy Group, Inc.(f) | | 5.88% | | 06/01/2028 | | | 93,164 | |
| 95,000 | | | RHP Hotel Properties LP / RHP Finance Corp. | | 4.75% | | 10/15/2027 | | | 98,442 | |
| 70,000 | | | Rockcliff Energy II LLC(f) | | 5.50% | | 10/15/2029 | | | 71,138 | |
| 120,000 | | | Rocket Software, Inc.(f) | | 6.50% | | 02/15/2029 | | | 118,966 | |
| 95,000 | | | Royal Caribbean Cruises, Ltd.(f) | | 5.50% | | 04/01/2028 | | | 97,307 | |
See Notes to Financial Statements.
| 98 | (888) 848-7569 | www.rivernorth.com |
RiverNorth/Oaktree High Income Fund | Schedule of Investments |
Principal Amount/Description | | Rate | | Maturity | | Value | |
$ | 20,000 | | | Sabre GLBL, Inc.(f) | | 9.25% | | 04/15/2025 | | $ | 23,141 | |
| 55,000 | | | Sabre GLBL, Inc.(f) | | 7.38% | | 09/01/2025 | | | 58,688 | |
| 100,000 | | | Scientific Games International, Inc. | | 5.50% | | 02/15/2026 | | | 119,650 | |
| 80,000 | | | Scotts Miracle-Gro Co.(f) | | 4.38% | | 02/01/2032 | | | 80,750 | |
| 85,000 | | | Scripps Escrow II, Inc.(f) | | 5.38% | | 01/15/2031 | | | 83,693 | |
| 100,000 | | | SeaWorld Parks & Entertainment, Inc.(f) | | 5.25% | | 08/15/2029 | | | 102,438 | |
| 10,000 | | | SEG Holding LLC / SEG Finance Corp.(f) | | 5.63% | | 10/15/2028 | | | 10,438 | |
| 35,000 | | | Shea Homes LP / Shea Homes Funding Corp.(f) | | 4.75% | | 02/15/2028 | | | 36,067 | |
| 35,000 | | | Shea Homes LP / Shea Homes Funding Corp.(f) | | 4.75% | | 04/01/2029 | | | 36,038 | |
| 5,000 | | | Sirius XM Radio, Inc.(f) | | 5.50% | | 07/01/2029 | | | 5,413 | |
| 80,000 | | | Six Flags Entertainment Corp.(f) | | 5.50% | | 04/15/2027 | | | 82,700 | |
| 30,000 | | | Six Flags Theme Parks, Inc.(f) | | 7.00% | | 07/01/2025 | | | 31,988 | |
| 20,000 | | | Southwestern Energy Co. | | 7.75% | | 10/01/2027 | | | 21,631 | |
| 40,000 | | | Southwestern Energy Co. | | 8.38% | | 09/15/2028 | | | 45,359 | |
| 30,000 | | | Southwestern Energy Co. | | 5.38% | | 03/15/2030 | | | 32,414 | |
| 100,000 | | | Spectrum Brands, Inc.(f) | | 5.00% | | 10/01/2029 | | | 107,721 | |
| 70,000 | | | SS&C Technologies, Inc.(f) | | 5.50% | | 09/30/2027 | | | 74,003 | |
| 40,000 | | | Stevens Holding Co., Inc.(f) | | 6.13% | | 10/01/2026 | | | 43,200 | |
| 40,000 | | | Suburban Propane Partners LP/Suburban Energy Finance Corp. | | 5.88% | | 03/01/2027 | | | 41,831 | |
| 135,000 | | | Suburban Propane Partners LP/Suburban Energy Finance Corp.(f) | | 5.00% | | 06/01/2031 | | | 140,231 | |
| 50,000 | | | Sylvamo Corp.(f) | | 7.00% | | 09/01/2029 | | | 51,224 | |
| 15,000 | | | Targa Resources Partners LP / Targa Resources Partners Finance Corp. | | 5.88% | | 04/15/2026 | | | 15,684 | |
| 20,000 | | | Targa Resources Partners LP / Targa Resources Partners Finance Corp. | | 5.38% | | 02/01/2027 | | | 20,749 | |
| 30,000 | | | Targa Resources Partners LP / Targa Resources Partners Finance Corp. | | 5.00% | | 01/15/2028 | | | 31,538 | |
| 100,000 | | | Targa Resources Partners LP / Targa Resources Partners Finance Corp. | | 5.50% | | 03/01/2030 | | | 109,469 | |
| 180,000 | | | Tenet Healthcare Corp.(f) | | 6.25% | | 02/01/2027 | | | 186,975 | |
| 15,000 | | | Tenet Healthcare Corp.(f) | | 5.13% | | 11/01/2027 | | | 15,656 | |
| 20,000 | | | Tenet Healthcare Corp.(f) | | 6.13% | | 10/01/2028 | | | 21,035 | |
| 65,000 | | | TMS International Corp.(f) | | 6.25% | | 04/15/2029 | | | 68,006 | |
| 105,000 | | | TransDigm, Inc.(f) | | 8.00% | | 12/15/2025 | | | 112,088 | |
| 70,000 | | | TransDigm, Inc.(f) | | 6.25% | | 03/15/2026 | | | 73,062 | |
| 30,000 | | | TransDigm, Inc. | | 5.50% | | 11/15/2027 | | | 30,864 | |
| 110,000 | | | TransDigm, Inc. | | 4.63% | | 01/15/2029 | | | 110,000 | |
| 10,000 | | | Tronox, Inc.(f) | | 6.50% | | 05/01/2025 | | | 10,509 | |
| 80,000 | | | Uber Technologies, Inc.(f) | | 7.50% | | 05/15/2025 | | | 85,380 | |
| 20,000 | | | Uber Technologies, Inc.(f) | | 6.25% | | 01/15/2028 | | | 21,475 | |
| 105,000 | | | Unifrax Escrow Issuer Corp.(f) | | 5.25% | | 09/30/2028 | | | 106,444 | |
| 20,000 | | | Unifrax Escrow Issuer Corp.(f) | | 7.50% | | 09/30/2029 | | | 20,520 | |
See Notes to Financial Statements.
| Annual Report | September 30, 2021 | 99 |
| RiverNorth/Oaktree High Income Fund | Schedule of Investments |
Principal Amount/Description | | Rate | | | Maturity | | | Value |
$ | 55,000 | | | Univar Solutions USA, Inc./Washington(f) | | | | 5.13% | | | 12/01/2027 | | | $ | 57,816 | |
15,000 | | | Univision Communications, Inc.(f) | | | | 9.50% | | | 05/01/2025 | | | | 16,299 | |
115,000 | | | Univision Communications, Inc.(f) | | | | 6.63% | | | 06/01/2027 | | | | 125,063 | |
40,000 | | | US Foods, Inc.(f) | | | | 6.25% | | | 04/15/2025 | | | | 42,008 | |
60,000 | | | USA Compression Partners LP / USA Compression Finance Corp. | | | | 6.88% | | | 04/01/2026 | | | | 62,550 | |
30,000 | | | USA Compression Partners LP / USA Compression Finance Corp. | | | | 6.88% | | | 09/01/2027 | | | | 31,803 | |
20,000 | | | Venture Global Calcasieu Pass LLC(f) | | | | 3.88% | | | 08/15/2029 | | | | 20,626 | |
30,000 | | | Venture Global Calcasieu Pass LLC(f) | | | | 4.13% | | | 08/15/2031 | | | | 31,313 | |
85,000 | | | Viasat, Inc.(f) | | | | 5.63% | | | 09/15/2025 | | | | 86,248 | |
20,000 | | | VICI Properties LP / VICI Note Co., Inc.(f) | | | | 4.25% | | | 12/01/2026 | | | | 20,911 | |
20,000 | | | VICI Properties LP / VICI Note Co., Inc.(f) | | | | 4.63% | | | 12/01/2029 | | | | 21,525 | |
35,000 | | | VICI Properties LP / VICI Note Co., Inc.(f) | | | | 4.13% | | | 08/15/2030 | | | | 37,144 | |
65,000 | | | Vine Engergy Holdings LLC(f) | | | | 6.75% | | | 04/15/2029 | | | | 70,241 | |
65,000 | | | Vistra Operations Co. LLC(f) | | | | 5.00% | | | 07/31/2027 | | | | 67,194 | |
115,000 | | | VM Consolidated, Inc.(f) | | | | 5.50% | | | 04/15/2029 | | | | 117,127 | |
145,000 | | | WASH Multifamily Acquisition, Inc.(f) | | | | 5.75% | | | 04/15/2026 | | | | 151,594 | |
140,000 | | | Western Midstream Operating LP | | | | 5.50% | | | 08/15/2048 | | | | 164,067 | |
95,000 | | | WR Grace Holdings LLC(f) | | | | 4.88% | | | 06/15/2027 | | | | 97,850 | |
60,000 | | | WR Grace Holdings LLC(f) | | | | 5.63% | | | 08/15/2029 | | | | 61,951 | |
180,000 | | | Xerox Holdings Corp.(f) | | | | 5.00% | | | 08/15/2025 | | | | 189,360 | |
| | | | | | | | | | | | | | 18,808,449 | |
| | | | | | | | | | | | | | | |
TOTAL HIGH YIELD DEBT | | | | | | | | | | |
(Cost $27,548,944) | | | | | | | | | 28,181,004 | |
Shares/Description | | | Value | |
RIGHTS - 0.00%(b)(j) | | | | | |
198 | | | DBI Investors, Inc., Strike Price 11.50, Expires 12/31/2049(a) | | | | 28 | |
| | | | | | | | |
TOTAL RIGHTS | | | | | |
(Cost $11,231) | | | | 28 | |
| | | | | | | | |
WARRANTS - 0.01%(b) | | | | | |
4 | | | David’s Bridal, Strike Price 219.47, Expires 01/18/2024(a) | | | | – | |
11 | | | Toys R Us Propco Warrant, Strike Price 11.50, Expires 12/31/2049(a) | | | | – | |
237 | | | Windstream Holdings Inc -Pvt Warrant, Strike Price 0.00, Expires 12/31/2049 | | | | 3,436 | |
| | | | | | | | |
TOTAL WARRANTS | | | | | |
(Cost $106,180) | | | | 3,436 | |
| See Notes to Financial Statements. | |
| 100 | (888) 848-7569 | www.rivernorth.com |
| RiverNorth/Oaktree High Income Fund | Schedule of Investments |
Shares/Description | | Value | |
SHORT-TERM INVESTMENTS -4.74% | | | | |
2,176,162 State Street Institutional Trust (7 Day Yield 0.01%) | | $ | 2,176,162 | |
| | | | |
TOTAL SHORT-TERM INVESTMENTS | | | | |
(Cost $2,176,162) | | | 2,176,162 | |
| | | | |
TOTAL INVESTMENTS - 101.99% | | | | |
(Cost $46,398,918) | | | 46,849,046 | |
| | | | |
CASH SEGREGATED AT CUSTODIAN FOR FORWARD FOREIGN CURRENCY CONTRACTS - 0.11% | | | 50,000 | |
LIABILITIES IN EXCESS OF OTHER ASSETS - (2.10)% | | | (964,896 | ) |
NET ASSETS - 100.00% | | $ | 45,934,150 | |
Investment Abbreviations:
EURIBOR - Euro Interbank Offered Rate
LIBOR - London Interbank Offered Rate
LLC - Limited Liability Company
LP - Limited Partnership
PLC - Public Limited Company
Libor Rates:
1M US L - 1 Month LIBOR as of September 30, 2021 was 0.08%
3M US L - 3 Month LIBOR as of September 30, 2021 was 0.13%
6M US L - 6 Month LIBOR as of September 30, 2021 was 0.16%
3M EUR L - 3 Month EURIBOR as of September 30, 2021 was -0.54%
6M EUR L - 6 Month EURIBOR as of September 30, 2021 was -0.52%
5Y EUR SWAP - 5 Year Euro ICE Swap Rate as of September 30, 2021 was -0.25%
(a) | The Level 3 assets were a result of unavailable quoted prices from an active market or the unavailability of other significant observable inputs. |
(b) | Non-income producing security. The date disclosed represents the next call date, if applicable. (c) Pay-in-kind securities. Rate paid in-kind is shown in parenthesis. |
(d) | Security has no contractual maturity date, is not redeemable and contractually pays an indefinite stream of interest. |
(e) | Variable rate investment. Interest rates reset periodically. Interest rate shown reflects the rate in effect at September 30, 2021. For securities based on a published reference rate and spread, the reference rate and spread are indicated in the description above. Certain variable rate securities are not based on a published reference rate and spread but are determined by the issuer or agent and are based on current market conditions. These securities do not indicate a reference rate and spread in their description above. |
| See Notes to Financial Statements. | |
| Annual Report | September 30, 2021 | 101 |
RiverNorth/Oaktree High Income Fund | Schedule of Investments |
(f) | Security exempt from registration under Rule 144A of the Securities Act of 1933. These securities have been deemed liquid under procedures approved by the Fund’s Board of Trustees (the "Board") and may normally be sold to qualified institutional buyers in transactions exempt from registration. Total fair value of Rule 144A securities amounts to $20,443,895, which represents approximately 44.51% of net assets as of September 30, 2021. |
(g) | Securities were purchased pursuant to Regulation S under the Securities Act of 1933, which exempts securities offered and sold outside of the United States from registration. Such securities cannot be sold in the United States without either an effective registration statement filed pursuant to the Securities Act of 1933, or pursuant to an exemption from registration. These securities have been deemed liquid under procedures approved by the Board. As of September 30, 2021, the aggregate fair value of those securities was $3,259,440, representing 7.10% of net assets. |
(h) | Security is currently in default. |
(i) | All or a portion of this position has not settled as of June 30, 2021. The interest rate shown represents the stated spread over the London Interbank Offered Rate ("LIBOR" or "L") or the Euro Interbank Offered Rate ("EURIBOR" or "E") or the applicable LIBOR/EURIBOR floor; the Fund will not accrue interest until the settlement date, at which point LIBOR/EURIBOR will be established. |
OUTSTANDING FORWARD FOREIGN CURRENCY CONTRACTS |
| | | | | | U.S. $ Value | | | | U.S. $ Value | | Unrealized | |
| | Settlement | | Fund | | at September | | Fund | | at September | | Appreciation/ | |
Counterparty | | Date | | Receiving | | 30, 2021 | | Delivering | | 30, 2021 | | (Depreciation) | |
State Street Corporation | | 10/6/2021 | | USD | | 5,751,454 | | EUR | | 5,619,086 | | $ | 132,368 | |
State Street Corporation | | 10/6/2021 | | USD | | 914,772 | | EUR | | 893,719 | | | 21,053 | |
State Street Corporation | | 10/6/2021 | | USD | | 107,434 | | EUR | | 105,122 | | | 2,312 | |
State Street Corporation | | 10/6/2021 | | USD | | 726,674 | | GBP | | 709,818 | | | 16,856 | |
State Street Corporation | | 10/6/2021 | | USD | | 339,690 | | GBP | | 331,810 | | | 7,880 | |
State Street Corporation | | 10/6/2021 | | USD | | 152,451 | | GBP | | 148,503 | | | 3,948 | |
| | | | | | | | | | | | $ | 184,417 | |
| | | | | | | | | | | | | | | |
State Street Corporation | | 10/6/2021 | | EUR | | 110,057 | | USD | | 111,967 | | $ | (1,910 | ) |
| | | | | | | | | | | | $ | (1,910 | ) |
See Notes to Financial Statements. | |
102 | (888) 848-7569 | www.rivernorth.com |
| RiverNorth Core Opportunity Fund | |
| Statement of Assets and Liabilities | September 30, 2021 |
ASSETS: | | | |
Investment in securities: | | | | |
At cost | | $ | 76,195,788 | |
At value | | $ | 80,265,949 | |
| | | | |
Cash | | | 42,823 | |
Receivable for fund investments sold | | | 1,146,362 | |
Receivable for fund shares sold | | | 84,175 | |
Dividends receivable | | | 71,132 | |
Interest receivable | | | 46,654 | |
Prepaid line of credit fee | | | 5,893 | |
Prepaid expenses and other assets | | | 11,728 | |
Total Assets | | | 81,674,716 | |
| | | | |
LIABILITIES: | | | | |
Payable for fund investments purchased | | | 884,836 | |
Payable for fund shares redeemed | | | 61,750 | |
Payable to Adviser | | | 66,794 | |
Payable for fund accounting and administration fees | | | 10,830 | |
Accrued 12b-1 fees - Class R Shares | | | 5,337 | |
Payable for custodian fees | | | 31,919 | |
Payable for audit fees | | | 25,828 | |
Payable to transfer agent | | | 7,303 | |
Payable for Compliance fees | | | 1,740 | |
Payable to Trustees | | | 120 | |
Other accrued expenses | | | 5,729 | |
Total Liabilities | | | 1,102,186 | |
Net Assets | | $ | 80,572,530 | |
| | | | |
NET ASSETS CONSIST OF: | | | | |
Paid-in capital | | $ | 64,237,866 | |
Total distributable earnings | | | 16,334,664 | |
Net Assets | | $ | 80,572,530 | |
| | | | |
PRICING OF SHARES: | | | | |
Class I Shares | | | | |
Net Assets | | $ | 54,867,919 | |
Shares of common stock outstanding | | | | |
(unlimited number of shares, no par value) | | | 5,901,082 | |
Net Asset Value Per Share, Offering and Redemption Price Per Share | | $ | 9.30 | |
Class R Shares | | | | |
Net Assets | | $ | 25,704,611 | |
Shares of common stock outstanding | | | | |
(unlimited number of shares, no par value) | | | 2,761,112 | |
Net Asset Value Per Share, Offering and Redemption Price Per Share | | $ | 9.31 | |
| See Notes to Financial Statements. | |
| Annual Report | September 30, 2021 | 103 |
| RiverNorth/DoubleLine Strategic Income Fund | |
| Statement of Assets and Liabilities | September 30, 2021 |
ASSETS: | | | |
Investment in securities: | | | | |
At cost | | $ | 2,073,803,434 | |
At value | | $ | 2,010,650,856 | |
| | | | |
Investment in affiliates: | | | | |
At cost | | | 33,404,026 | |
At value | | | 32,734,160 | |
Cash | | | 590,541 | |
Receivable for fund investments sold | | | 46,048,923 | |
Interest receivable | | | 7,939,682 | |
Receivable for fund shares sold | | | 3,427,337 | |
Dividends receivable | | | 636,753 | |
Prepaid expenses and other assets | | | 19,472 | |
Total Assets | | | 2,102,047,724 | |
| | | | |
LIABILITIES: | | | | |
Payable for fund investments purchased | | | 61,245,560 | |
Facility loan fee payable | | | 51,755 | |
Payable for fund shares redeemed | | | 3,460,633 | |
Payable to Adviser | | | 1,241,860 | |
Payable for fund accounting and administration fees | | | 452,055 | |
Accrued 12b-1 fees - Class R Shares | | | 28,687 | |
Payable for custodian fees | | | 149,829 | |
Payable for audit fees | | | 41,828 | |
Payable to transfer agent | | | 35,119 | |
Payable for Compliance fees | | | 1,740 | |
Payable to Trustees | | | 2,957 | |
Other accrued expenses | | | 74,958 | |
Total Liabilities | | | 66,786,981 | |
Net Assets | | $ | 2,035,260,743 | |
| | | | |
NET ASSETS CONSIST OF: | | | | |
Paid-in capital | | $ | 2,112,363,827 | |
Total distributable earnings/(accumulated deficit) | | | (77,103,084 | ) |
Net Assets | | $ | 2,035,260,743 | |
| | | | |
PRICING OF SHARES: | | | | |
Class I Shares | | | | |
Net Assets | | $ | 1,894,398,226 | |
Shares of common stock outstanding | | | | |
(unlimited number of shares, no par value) | | | 180,089,246 | |
Net Asset Value Per Share, Offering and Redemption Price Per Share | | $ | 10.52 | |
Class R Shares | | | | |
Net Assets | | $ | 140,862,517 | |
Shares of common stock outstanding | | | | |
(unlimited number of shares, no par value) | | | 13,364,598 | |
Net Asset Value Per Share, Offering and Redemption Price Per Share | | $ | 10.54 | |
| See Notes to Financial Statements. | |
| 104 | (888) 848-7569 | www.rivernorth.com |
RiverNorth/Oaktree High Income Fund | |
Statement of Assets and Liabilities | September 30, 2021 |
| ASSETS: | | | |
| Investment in securities: | | | |
| At cost | $ | 46,398,918 | |
| At value | $ | 46,849,046 | |
| Cash | | 131,021 | |
| Foreign currency, at value (Cost $174,159) | | 173,635 | |
| Interest receivable | | 449,492 | |
| Receivable for fund investments sold | | 229,006 | |
| Unrealized appreciation on forward foreign currency contracts | | 184,417 | |
| Cash segregated at custodian for forward foreign currency contracts | | 50,000 | |
| Prepaid line of credit fee | | 6,973 | |
| Dividends receivable | | 2,297 | |
| Receivable for fund shares sold | | 1,483 | |
| Prepaid expenses and other assets | | 4,960 | |
| Total Assets | | 48,082,330 | |
| LIABILITIES: | | | |
| Payable for fund investments purchased | | 1,965,738 | |
| Interest payable on facility loan | | 68 | |
| Payable for fund shares redeemed | | 1,093 | |
| Unrealized depreciation on forward foreign currency contracts | | 1,910 | |
| Payable to Adviser | | 16,203 | |
| Payable for fund accounting and administration fees | | 82,939 | |
| Accrued 12b-1 fees - Class R Shares | | 939 | |
| Payable for custodian fees | | 37,056 | |
| Payable for audit fees | | 31,828 | |
| Payable to transfer agent | | 5,895 | |
| Payable for Compliance fees | | 1,740 | |
| Payable to Trustees | | 67 | |
| Other accrued expenses | | 2,704 | |
| Total Liabilities | | 2,148,180 | |
| Net Assets | $ | 45,934,150 | |
| NET ASSETS CONSIST OF: | | | |
| Paid-in capital | $ | 50,565,243 | |
| Total distributable earnings/(accumulated deficit) | | (4,631,093 | ) |
| Net Assets | $ | 45,934,150 | |
See Notes to Financial Statements | |
Annual Report | September 30, 2021 | 105 |
RiverNorth/Oaktree High Income Fund | |
Statement of Assets and Liabilities | September 30, 2021 |
PRICING OF SHARES: | | | |
Class I Shares | | | |
Net Assets | $ | 41,386,173 | |
| | | |
Shares of common stock outstanding (unlimited number of shares, no par value) | | 4,344,043 | |
Net Asset Value Per Share, Offering and Redemption Price Per Share | $ | 9.53 | |
Class R Shares | | | |
Net Assets | $ | 4,547,977 | |
Shares of common stock outstanding (unlimited number of shares, no par value) | | 477,947 | |
Net Asset Value Per Share, Offering and Redemption Price Per Share | $ | 9.52 | |
See Notes to Financial Statements | |
106 | (888) 848-7569 | www.rivernorth.com |
RiverNorth Core Opportunity Fund | |
Statement of Operations | For the Year Ended September 30, 2021 |
INVESTMENT INCOME: | | | |
Dividend income | $ | 3,353,076 | |
Interest income | | 274,758 | |
Other income | | 25,642 | |
Total Investment Income | | 3,653,476 | |
| | | | |
EXPENSES: | | | |
Investment Adviser fee | | 811,910 | |
12b-1 fees - Class R Shares | | 70,885 | |
Registration expenses | | 42,861 | |
Accounting and administration fee | | 42,592 | |
Transfer agent expenses | | 42,444 | |
Compliance expense | | 29,452 | |
Custodian expenses | | 26,280 | |
Audit expenses | | 26,214 | |
Facility loan fees | | 18,453 | |
Printing expenses | | 11,313 | |
Trustee expenses | | 7,049 | |
Legal expenses | | 5,931 | |
Insurance expenses | | 1,497 | |
Miscellaneous expenses | | 13,514 | |
Total Expenses | | 1,150,395 | |
Net Investment Income | | 2,503,081 | |
| | | | |
REALIZED AND UNREALIZED GAIN/(LOSS): | | | |
Net realized gain/(loss) on: | | | |
Investments | | 13,125,576 | |
Net realized gain | | 13,125,576 | |
Long-term capital gain distributions from other investment companies | | 565,724 | |
Net change in unrealized appreciation/depreciation on: | | | |
Investments | | 6,389,430 | |
Net change in unrealized appreciation/depreciation | | 6,389,430 | |
Net Realized and Unrealized Gain on Investments | | 20,080,730 | |
Net Increase in Net Assets Resulting from Operations | $ | 22,583,811 | |
See Notes to Financial Statements | |
Annual Report | September 30, 2021 | 107 |
RiverNorth/DoubleLine Strategic Income Fund | |
Statement of Operations | For the Year Ended September 30, 2021 |
INVESTMENT INCOME: | | | |
Dividend income | $ | 15,732,968 | |
Dividend income from affiliated securities | | 1,109,286 | |
Interest income | | 69,152,364 | |
Other income | | 207,728 | |
Foreign taxes withheld | | (5,082 | ) |
Total Investment Income | | 86,197,264 | |
| | | | |
EXPENSES: | | | |
Investment Adviser fee | | 14,266,795 | |
Accounting and administration fee | | 997,255 | |
12b-1 fees - Class R Shares | | 330,673 | |
Facility loan fees | | 246,471 | |
Compliance expense | | 179,643 | |
Transfer agent expenses | | 168,590 | |
Trustee expenses | | 163,069 | |
Custodian expenses | | 124,376 | |
Printing expenses | | 109,816 | |
Registration expenses | | 98,374 | |
Legal expenses | | 91,631 | |
Audit expenses | | 42,214 | |
Insurance expenses | | 35,171 | |
Miscellaneous expenses | | 114,348 | |
Total Expenses | | 16,968,426 | |
Less fees waived/reimbursed by Investment Adviser | | (184,645 | ) |
Net Expenses | | 16,783,781 | |
Net Investment Income | | 69,413,483 | |
| | | | |
REALIZED AND UNREALIZED GAIN/(LOSS): | | | |
Net realized gain/(loss) on: | | | |
Investments | | 46,151,888 | |
Net realized gain | | 46,151,888 | |
Long-term capital gain distributions from other investment companies | | 31,770 | |
Net change in unrealized appreciation/depreciation on: | | | |
Investments | | 17,788,017 | |
Affiliated Investments | | 994,332 | |
Net change in unrealized appreciation/depreciation | | 18,782,349 | |
Net Realized and Unrealized Gain on Investments | | 64,966,007 | |
Net Increase in Net Assets Resulting from Operations | $ | 134,379,490 | |
See Notes to Financial Statements | |
108 | (888) 848-7569 | www.rivernorth.com |
RiverNorth/Oaktree High Income Fund | |
Statement of Operations | For the Year Ended September 30, 2021 |
INVESTMENT INCOME: | | | |
Dividend income | $ | 61,176 | |
Interest income | | 2,124,064 | |
Other income | | 33,205 | |
Foreign taxes withheld | | (4,575 | ) |
Total Investment Income | | 2,213,870 | |
| | | | |
EXPENSES: | | | |
Investment Adviser fee | | 459,088 | |
Accounting and administration fee | | 138,297 | |
Registration expenses | | 36,946 | |
Transfer agent expenses | | 34,883 | |
Custodian expenses | | 32,773 | |
Audit expenses | | 32,214 | |
Compliance expense | | 26,576 | |
Facility loan fees | | 14,069 | |
12b-1 fees - Class R Shares | | 12,155 | |
Printing expenses | | 9,773 | |
Legal expenses | | 4,062 | |
Trustee expenses | | 4,026 | |
Interest expense on facility loan | | 999 | |
Insurance expenses | | 905 | |
Miscellaneous expenses | | 8,614 | |
Total expenses | | 815,380 | |
Less fees waived/reimbursed by Investment Adviser: | | (182,428 | ) |
Class I Shares | | (163,274 | ) |
Class R Shares | | (19,154 | ) |
Net Expenses | | 632,952 | |
Net Investment Income | | 1,580,918 | |
| | | | |
REALIZED AND UNREALIZED GAIN/(LOSS): | | | |
Net realized gain/(loss) on: | | | |
Investments | | 704,572 | |
Forward foreign currency contracts | | 57,668 | |
Translation of assets and liabilities denominated in foreign currencies | | (18,298 | ) |
Net realized gain | | 743,942 | |
Net change in unrealized appreciation/depreciation on: | | | |
Investments | | 1,363,761 | |
Forward foreign currency contracts | | 72,135 | |
Translation of assets and liabilities denominated in foreign currencies | | 1,809 | |
Net change in unrealized appreciation/depreciation | | 1,437,705 | |
Net Realized and Unrealized Gain on Investments, translation of assets and liabilities denominated in foreign currencies and forward foreign currency contracts | | 2,181,647 | |
Net Increase in Net Assets Resulting from Operations | $ | 3,762,565 | |
See Notes to Financial Statements | |
Annual Report | September 30, 2021 | 109 |
RiverNorth Core Opportunity Fund
Statements of Changes in Net Assets
| | | For the
Year Ended
September 30, 2021 | | | For the
Year Ended
September 30, 2020 | |
| NET INCREASE/(DECREASE) IN NET ASSETS FROM OPERATIONS: | | | | | | | | |
| Net investment income | | $ | 2,503,081 | | | $ | 1,796,728 | |
| Net realized gain | | | 13,125,576 | | | | 2,957,569 | |
| Long-term capital gains from other investment companies | | | 565,724 | | | | 1,011,327 | |
| Net change in unrealized appreciation/depreciation on investments | | | 6,389,430 | | | | (7,771,480 | ) |
| Net increase/(decrease) in net assets resulting from operations | | | 22,583,811 | | | | (2,005,856 | ) |
| | | | | | | | | |
| DISTRIBUTIONS TO SHAREHOLDERS: | | | | | | | | |
| Class I shares | | | (3,148,616 | ) | | | (2,659,147 | ) |
| Class R shares | | | (1,632,358 | ) | | | (1,527,249 | ) |
| Net decrease in net assets from distributions to shareholders | | | (4,780,974 | ) | | | (4,186,396 | ) |
| | | | | | | | | |
| CAPITAL SHARE TRANSACTIONS: | | | | | | | | |
| Class I Shares | | | | | | | | |
| Proceeds from shares sold | | | 8,348,674 | | | | 22,357,753 | |
| Reinvestment of distributions | | | 2,779,849 | | | | 2,231,392 | |
| Cost of shares redeemed | | | (17,705,774 | ) | | | (36,906,930 | ) |
| Net decrease in net assets from capital share transactions | | | (6,577,251 | ) | | | (12,317,785 | ) |
| Class R Shares | | | | | | | | |
| Proceeds from shares sold | | | 1,900,425 | | | | 5,640,144 | |
| Reinvestment of distributions | | | 1,550,292 | | | | 1,460,842 | |
| Cost of shares redeemed | | | (11,311,038 | ) | | | (18,389,204 | ) |
| Net decrease in net assets from capital share transactions | | | (7,860,321 | ) | | | (11,288,218 | ) |
| Net Increase/(Decrease) in Net Assets | | | 3,365,265 | | | | (29,798,255 | ) |
| | | | | | | | | |
| NET ASSETS: | | | | | | | | |
| Beginning of year | | $ | 77,207,265 | | | $ | 107,005,520 | |
| End of year | | $ | 80,572,530 | | | $ | 77,207,265 | |
See Notes to Financial Statements.
| 110 | (888) 848-7569 | www.rivernorth.com |
RiverNorth Core Opportunity Fund
Statements of Changes in Net Assets
| | | For the
Year Ended
September 30, 2021 | | | For the
Year Ended
September 30, 2020 | |
| OTHER INFORMATION: | | | | | | | | |
| Share Transactions: | | | | | | | | |
| Class I Shares | | | | | | | | |
| Shares sold | | | 943,399 | | | | 3,161,984 | |
| Shares issued in reinvestment of distributions | | | 322,701 | | | | 294,928 | |
| Shares redeemed | | | (2,093,907 | ) | | | (5,005,286 | ) |
| Net decrease from share transactions | | | (827,807 | ) | | | (1,548,374 | ) |
| | | | | | | | | |
| Class R Shares | | | | | | | | |
| Shares sold | | | 217,473 | | | | 874,710 | |
| Shares issued in reinvestment of distributions | | | 180,777 | | | | 194,516 | |
| Shares redeemed | | | (1,295,488 | ) | | | (2,414,622 | ) |
| Net decrease from share transactions | | | (897,238 | ) | | | (1,345,396 | ) |
See Notes to Financial Statements.
| Annual Report | September 30, 2021 | 111 |
RiverNorth/DoubleLine Strategic Income Fund
Statements of Changes in Net Assets
| | | For the
Year Ended
September 30, 2021 | | | For the
Year Ended
September 30, 2020 | |
| NET INCREASE/(DECREASE) IN NET ASSETS FROM OPERATIONS: | | | | | | | | |
| Net investment income | | $ | 69,413,483 | | | $ | 83,771,662 | |
| Net realized gain | | | 46,151,888 | | | | 19,390,925 | |
| Long-term capital gains from other investment companies | | | 31,770 | | | | 36,569 | |
| Net change in unrealized appreciation/depreciation on investments | | | 18,782,349 | | | | (54,425,827 | ) |
| Net increase in net assets resulting from operations | | | 134,379,490 | | | | 48,773,329 | |
| | | | | | | | | |
| DISTRIBUTIONS TO SHAREHOLDERS: | | | | | | | | |
| Class I shares | | | (73,505,027 | ) | | | (79,390,062 | ) |
| Class R shares | | | (5,148,979 | ) | | | (6,188,907 | ) |
| From tax return of capital | | | | | | | | |
| Class I shares | | | – | | | | (2,716,414 | ) |
| Class R shares | | | – | | | | (204,602 | ) |
| Net decrease in net assets from distributions to shareholders | | | (78,654,006 | ) | | | (88,499,985 | ) |
| | | | | | | | | |
| CAPITAL SHARE TRANSACTIONS: | | | | | | | | |
| Class I Shares | | | | | | | | |
| Proceeds from shares sold | | | 535,909,799 | | | | 611,196,220 | |
| Reinvestment of distributions | | | 63,682,135 | | | | 68,779,135 | |
| Cost of shares redeemed | | | (443,840,174 | ) | | | (814,875,369 | ) |
| Net increase/(decrease) in net assets from capital share transactions | | | 155,751,760 | | | | (134,900,014 | ) |
| Class R Shares | | | | | | | | |
| Proceeds from shares sold | | | 44,563,657 | | | | 40,377,316 | |
| Reinvestment of distributions | | | 5,057,864 | | | | 6,146,105 | |
| Cost of shares redeemed | | | (42,065,796 | ) | | | (80,913,738 | ) |
| Net increase/(decrease) in net assets from capital share transactions | | | 7,555,725 | | | | (34,390,317 | ) |
| Net Increase/(Decrease) in Net Assets | | | 219,032,969 | | | | (209,016,987 | ) |
| | | | | | | | | |
| NET ASSETS: | | | | | | | | |
| Beginning of year | | $ | 1,816,227,774 | | | $ | 2,025,244,761 | |
| End of year | | $ | 2,035,260,743 | | | $ | 1,816,227,774 | |
See Notes to Financial Statements.
| 112 | (888) 848-7569 | www.rivernorth.com |
RiverNorth/DoubleLine Strategic Income Fund
Statements of Changes in Net Assets
| | | For the
Year Ended
September 30, 2021 | | | For the
Year Ended
September 30, 2020 | |
| OTHER INFORMATION: | | | | | | | | |
| Share Transactions: | | | | | | | | |
| Class I Shares | | | | | | | | |
| Shares sold | | | 51,080,769 | | | | 60,904,804 | |
| Shares issued in reinvestment of distributions | | | 6,089,656 | | | | 6,809,776 | |
| Shares redeemed | | | (42,478,497 | ) | | | (82,235,772 | ) |
| Net increase/(decrease) from share transactions | | | 14,691,928 | | | | (14,521,192 | ) |
| | | | | | | | | |
| Class R Shares | | | | | | | | |
| Shares sold | | | 4,233,570 | | | | 3,986,283 | |
| Shares issued in reinvestment of distributions | | | 482,815 | | | | 606,703 | |
| Shares redeemed | | | (4,010,903 | ) | | | (8,089,175 | ) |
| Net increase/(decrease) from share transactions | | | 705,482 | | | | (3,496,189 | ) |
See Notes to Financial Statements.
| Annual Report | September 30, 2021 | 113 |
RiverNorth/Oaktree High Income Fund
Statements of Changes in Net Assets
| | | For the
Year Ended
September 30, 2021 | | | For the
Year Ended
September 30, 2020 | |
| NET INCREASE/(DECREASE) IN NET ASSETS FROM OPERATIONS: | | | | | | | | |
| Net investment income | | $ | 1,580,918 | | | $ | 1,790,458 | |
| Net realized gain/(loss) | | | 743,942 | | | | (1,982,955 | ) |
| Net change in unrealized appreciation/depreciation | | | 1,437,705 | | | | (221,560 | ) |
| Net increase/(decrease) in net assets resulting from operations | | | 3,762,565 | | | | (414,057 | ) |
| | | | | | | | | |
| DISTRIBUTIONS TO SHAREHOLDERS: | | | | | | | | |
| Class I Shares | | | (1,425,508 | ) | | | (1,711,826 | ) |
| Class R Shares | | | (157,316 | ) | | | (212,395 | ) |
| From tax return of capital | | | | | | | | |
| Class I Shares | | | – | | | | (362,852 | ) |
| Class R Shares | | | – | | | | (44,662 | ) |
| Net decrease in net assets from distributions to shareholders | | | (1,582,824 | ) | | | (2,331,735 | ) |
| | | | | | | | | |
| CAPITAL SHARE TRANSACTIONS: | | | | | | | | |
| Class I Shares | | | | | | | | |
| Proceeds from shares sold | | | 898,392 | | | | 1,466,082 | |
| Reinvestment of distributions | | | 1,422,378 | | | | 2,064,745 | |
| Cost of shares redeemed | | | (3,254,457 | ) | | | (6,011,805 | ) |
| Net decrease in net assets from capital share transactions | | | (933,687 | ) | | | (2,480,978 | ) |
| | | | | | | | | |
| Class R Shares | | | | | | | | |
| Proceeds from shares sold | | | 425,555 | | | | 602,945 | |
| Reinvestment of distributions | | | 155,684 | | | | 249,412 | |
| Cost of shares redeemed | | | (1,256,467 | ) | | | (1,505,591 | ) |
| Net decrease in net assets from capital share transactions | | | (675,228 | ) | | | (653,234 | ) |
| | | | | | | | | |
| Net Increase/(Decrease) in Net Assets | | | 570,826 | | | | (5,880,004 | ) |
| | | | | | | | | |
| NET ASSETS: | | | | | | | | |
| Beginning of year | | $ | 45,363,324 | | | $ | 51,243,328 | |
| End of year | | $ | 45,934,150 | | | $ | 45,363,324 | |
See Notes to Financial Statements.
| 114 | (888) 848-7569 | www.rivernorth.com |
RiverNorth/Oaktree High Income Fund
Statements of Changes in Net Assets
| | | For the
Year Ended
September 30, 2021 | | | For the
Year Ended
September 30, 2020 | |
| OTHER INFORMATION: | | | | | | | | |
| Share Transactions: | | | | | | | | |
| Class I Shares | | | | | | | | |
| Shares sold | | | 94,482 | | | | 174,046 | |
| Shares issued in reinvestment of distributions | | | 150,730 | | | | 226,317 | |
| Shares redeemed | | | (344,168 | ) | | | (703,397 | ) |
| Net decrease from share transactions | | | (98,956 | ) | | | (303,034 | ) |
| | | | | | | | | |
| Class R Shares | | | | | | | | |
| Shares sold | | | 44,895 | | | | 65,278 | |
| Shares issued in reinvestment of distributions | | | 16,518 | | | | 27,369 | |
| Shares redeemed | | | (133,029 | ) | | | (165,647 | ) |
| Net decrease from share transactions | | | (71,616 | ) | | | (73,000 | ) |
See Notes to Financial Statements.
| Annual Report | September 30, 2021 | 115 |
| RiverNorth Core Opportunity Fund | Class I |
Financial Highlights
| Net asset value - beginning of period |
| Income/(Loss) from investment operations: |
| Net investment income(a) |
| Net realized and unrealized gain/(loss) on investments |
| Total income/(loss) from investment operations |
| Less distributions: |
| From net investment income |
| From net realized gain on investments |
| From tax return of capital |
| Total distributions |
| Paid-in capital from redemption fees(a) |
| Net increase/(decrease) in net asset value |
| Net asset value - end of period |
| Total Return(d) |
| Ratios/Supplemental Data: |
| Net assets, end of period (in thousands) |
| Ratios to Average Net Assets (including interest expense): |
| |
| Ratio of expenses to average net assets excluding fee waivers and reimbursements(e) |
| |
| Ratio of expenses to average net assets including fee waivers and reimbursements(e) |
| Ratio of net investment income to average net assets excluding fee waivers and reimbursements(e) |
| Ratio of net investment income to average net assets including fee waivers and reimbursements(e) |
| Ratios to Average Net Assets (excluding interest expense): |
| |
| Ratio of expenses to average net assets excluding fee waivers and reimbursements(e) |
| |
| Ratio of expenses to average net assets including fee waivers and reimbursements(e) |
| Ratio of net investment income to average net assets excluding fee waivers and reimbursements(e) |
| Ratio of net investment income to average net assets including fee waivers and reimbursements(e) |
| Portfolio turnover rate |
See Notes to Financial Statements.
| 116 | (888) 848-7569 | www.rivernorth.com |
For a share outstanding throughout the periods presented
For the
Year Ended
September 30,
2021 | | | For the
Year Ended
September 30,
2020 | | | For the
Year Ended
September 30,
2019 | | | For the
Year Ended
September 30,
2018 | | | For the
Year Ended
September 30,
2017 | |
| $ | 7.43 | | | $ | 8.05 | | | $ | 10.88 | | | $ | 12.37 | | | $ | 11.33 | |
| | | | | | | | | | | | | | | | | | | |
| | 0.28 | | | | 0.16 | | | | 0.24 | | | | 0.27 | | | | 0.17 | |
| | 2.11 | | | | (0.41 | ) | | | (0.25 | )(b) | | | 0.42 | | | | 1.45 | |
| | 2.39 | | | | (0.25 | ) | | | (0.01 | ) | | | 0.69 | | | | 1.62 | |
| | | | | | | | | | | | | | | | | | | |
| | (0.39 | ) | | | (0.19 | ) | | | (0.18 | ) | | | (0.40 | ) | | | (0.30 | ) |
| | (0.13 | ) | | | (0.18 | ) | | | (2.64 | ) | | | (1.78 | ) | | | (0.28 | ) |
| | – | | | | – | | | | – | | | | – | | | | – | |
| | (0.52 | ) | | | (0.37 | ) | | | (2.82 | ) | | | (2.18 | ) | | | (0.58 | ) |
| | – | | | | – | | | | 0.00 | (c) | | | 0.00 | (c) | | | 0.00 | (c) |
| | 1.87 | | | | (0.62 | ) | | | (2.83 | ) | | | (1.49 | ) | | | 1.04 | |
| $ | 9.30 | | | $ | 7.43 | | | $ | 8.05 | | | $ | 10.88 | | | $ | 12.37 | |
| | 32.96 | % | | | (3.00 | %) | | | 3.51 | % | | | 5.92 | % | | | 14.71 | % |
| | | | | | | | | | | | | | | | | | | |
| $ | 54,868 | | | $ | 49,994 | | | $ | 66,662 | | | $ | 65,592 | | | $ | 109,627 | |
| | | | | | | | | | | | | | | | | | | |
| | N/A | | | | N/A | | | | 1.22 | % | | | N/A | | | | 1.12 | % |
| | | | | | | | | | | | | | | | | | | |
| | N/A | | | | N/A | | | | 1.22 | % | | | N/A | | | | 1.12 | % |
| | | | | | | | | | | | | | | | | | | |
| | N/A | | | | N/A | | | | 2.88 | % | | | N/A | | | | 1.45 | % |
| | | | | | | | | | | | | | | | | | | |
| | N/A | | | | N/A | | | | 2.88 | % | | | N/A | | | | 1.45 | % |
| | | | | | | | | | | | | | | | | | | |
| | 1.33 | % | | | 1.29 | % | | | 1.22 | % | | | 1.17 | % | | | 1.12 | % |
| | | | | | | | | | | | | | | | | | | |
| | 1.33 | % | | | 1.29 | % | | | 1.22 | % | | | 1.17 | % | | | 1.12 | % |
| | | | | | | | | | | | | | | | | | �� | |
| | 3.19 | % | | | 2.10 | % | | | 2.88 | % | | | 2.37 | % | | | 1.45 | % |
| | | | | | | | | | | | | | | | | | | |
| | 3.19 | % | | | 2.10 | % | | | 2.88 | % | | | 2.37 | % | | | 1.45 | % |
| | 182 | % | | | 110 | % | | | 36 | % | | | 58 | %(f) | | | 39 | %(f) |
| Annual Report | September 30, 2021 | 117 |
| RiverNorth Core Opportunity Fund | Class I |
| Financial Highlights | For a share outstanding throughout the periods presented |
| (a) | Based on average shares outstanding during the period. |
| (b) | Realized and unrealized gains and losses per share in this caption are balancing amounts necessary to reconcile the change in net asset value per share for the period, and may not reconcile with the aggregate gains and losses in the Statement of Operations due to share transactions for the period. |
| (c) | Less than $0.005 per share. |
| (d) | Total return in the above table represents the rate that the investor would have earned or lost on an investment in the Fund, assuming reinvestment of dividends. |
| (e) | The ratios exclude the impact of expenses of the underlying funds in which the Fund invests as represented in the Schedule of Investments. |
| (f) | Portfolio turnover does not include redemptions in-kind. |
See Notes to Financial Statements.
| 118 | (888) 848-7569 | www.rivernorth.com |
Intentionally Left Blank
| RiverNorth Core Opportunity Fund | Class R |
Financial Highlights
| Net asset value - beginning of period |
| Income/(Loss) from investment operations: |
| Net investment income(a) |
| Net realized and unrealized gain/(loss) on investments |
| Total income/(loss) from investment operations |
| Less distributions: |
| From net investment income |
| From net realized gain on investments |
| Total distributions |
| Paid-in capital from redemption fees(a) |
| Net increase/ (decrease) in net asset value |
| Net asset value - end of period |
| Total Return(d) |
| Ratios/Supplemental Data: |
| Net assets, end of period (in thousands) |
| Ratios to Average Net Assets (including interest expense): |
| Ratio of expenses to average net assets excluding fee waivers and reimbursements(e) |
| Ratio of expenses to average net assets including fee waivers and reimbursements(e) |
| Ratio of net investment income to average net assets excluding fee waivers and reimbursements(e) |
| |
| Ratio of net investment income to average net assets including fee waivers and reimbursements(e) |
| Ratios to Average Net Assets (excluding interest expense): |
| Ratio of expenses to average net assets excluding fee waivers and reimbursements(e) |
| Ratio of expenses to average net assets including fee waivers and reimbursements(e) |
| Ratio of net investment income to average net assets excluding fee waivers and reimbursements(e) |
| Ratio of net investment income to average net assets including fee waivers and reimbursements(e) |
| Portfolio turnover rate |
See Notes to Financial Statements.
| 120 | (888) 848-7569 | www.rivernorth.com |
For a share outstanding throughout the periods presented
For the
Year Ended
September 30,
2021 | | | For the
Year Ended
September 30,
2020 | | | For the
Year Ended
September 30,
2019 | | | For the
Year Ended
September 30,
2018 | | | For the
Year Ended
September 30,
2017 | |
| $ | 7.44 | | | $ | 8.06 | | | $ | 10.89 | | | $ | 12.37 | | | $ | 11.32 | |
| | | | | | | | | | | | | | | | | | | |
| | 0.25 | | | | 0.15 | | | | 0.22 | | | | 0.23 | | | | 0.16 | |
| | 2.12 | | | | (0.42 | ) | | | (0.26 | )(b) | | | 0.44 | | | | 1.44 | |
| | 2.37 | | | | (0.27 | ) | | | (0.04 | ) | | | 0.67 | | | | 1.60 | |
| | | | | | | | | | | | | | | | | | | |
| | (0.37 | ) | | | (0.18 | ) | | | (0.17 | ) | | | (0.37 | ) | | | (0.27 | ) |
| | (0.13 | ) | | | (0.17 | ) | | | (2.62 | ) | | | (1.78 | ) | | | (0.28 | ) |
| | (0.50 | ) | | | (0.35 | ) | | | (2.79 | ) | | | (2.15 | ) | | | (0.55 | ) |
| | – | | | | – | | | | 0.00 | (c) | | | 0.00 | (c) | | | 0.00 | (c) |
| | 1.87 | | | | (0.62 | ) | | | (2.83 | ) | | | (1.48 | ) | | | 1.05 | |
| $ | 9.31 | | | $ | 7.44 | | | $ | 8.06 | | | $ | 10.89 | | | $ | 12.37 | |
| | 32.58 | % | | | (3.24 | %) | | | 3.23 | % | | | 5.70 | % | | | 14.51 | % |
| | | | | | | | | | | | | | | | | | | |
| $ | 25,705 | | | $ | 27,213 | | | $ | 40,344 | | | $ | 67,199 | | | $ | 213,737 | |
| | | | | | | | | | | | | | | | | | | |
| | N/A | | | | N/A | | | | 1.48 | % | | | N/A | | | | 1.37 | % |
| | N/A | | | | N/A | | | | 1.48 | % | | | N/A | | | | 1.37 | % |
| | | | | | | | | | | | | | | | | | | |
| | N/A | | | | N/A | | | | 2.62 | % | | | N/A | | | | 1.38 | % |
| | | | | | | | | | | | | | | | | | | |
| | N/A | | | | N/A | | | | 2.62 | % | | | N/A | | | | 1.38 | % |
| | | | | | | | | | | | | | | | | | | |
| | 1.58 | % | | | 1.54 | % | | | 1.48 | % | | | 1.41 | % | | | 1.37 | % |
| | 1.58 | % | | | 1.54 | % | | | 1.48 | % | | | 1.41 | % | | | 1.37 | % |
| | | | | | | | | | | | | | | | | | | |
| | 2.88 | % | | | 1.93 | % | | | 2.62 | % | | | 2.02 | % | | | 1.38 | % |
| | | | | | | | | | | | | | | | | | | |
| | 2.88 | % | | | 1.93 | % | | | 2.62 | % | | | 2.02 | % | | | 1.38 | % |
| | 182 | % | | | 110 | % | | | 36 | % | | | 58 | %(f) | | | 39 | %(f) |
| Annual Report | September 30, 2021 | 121 |
| RiverNorth Core Opportunity Fund | Class R |
| Financial Highlights | For a share outstanding throughout the periods presented |
| (a) | Based on average shares outstanding during the period. |
| (b) | Realized and unrealized gains and losses per share in this caption are balancing amounts necessary to reconcile the change in net asset value per share for the period, and may not reconcile with the aggregate gains and losses in the Statement of Operations due to share transactions for the period. |
| (c) | Less than $0.005 per share. |
| (d) | Total return in the above table represents the rate that the investor would have earned or lost on an investment in the Fund, assuming reinvestment of dividends. |
| (e) | The ratios exclude the impact of expenses of the underlying funds in which the Fund invests as represented in the Schedule of Investments. |
| (f) | Portfolio turnover does not include redemptions in-kind. |
See Notes to Financial Statements.
| 122 | (888) 848-7569 | www.rivernorth.com |
Intentionally Left Blank
| RiverNorth/DoubleLine Strategic Income Fund | Class I |
Financial Highlights
| Net asset value - beginning of period |
| Income from investment operations: |
| Net investment income(a) |
| Net realized and unrealized gain/(loss) on investments |
| Total income from investment operations |
| |
| Less distributions: |
| From net investment income |
| From net realized gain on investments |
| From tax return of capital |
| Total distributions |
| Paid-in capital from redemption fees(a) |
| Net increase/(decrease) in net asset value |
| Net asset value - end of period |
| |
| Total Return(c) |
| |
| Ratios/Supplemental Data: |
| Net assets, end of period (in thousands) |
| Ratios to Average Net Assets (including interest expense): |
| Ratio of expenses to average net assets excluding fee waivers and reimbursements(d) |
| Ratio of expenses to average net assets including fee waivers and reimbursements(d) |
| |
| Ratio of net investment income to average net assets excluding fee waivers and reimbursements(d) |
| |
| Ratio of net investment income to average net assets including fee waivers and reimbursements(d) |
| Ratios to Average Net Assets (excluding interest expense): |
| Ratio of expenses to average net assets excluding fee waivers and reimbursements(d) |
| Ratio of expenses to average net assets including fee waivers and reimbursements(d) |
| |
| Ratio of net investment income to average net assets excluding fee waivers and reimbursements(d) |
| |
| Ratio of net investment income to average net assets including fee waivers and reimbursements(d) |
| Portfolio turnover rate |
See Notes to Financial Statements.
| 124 | (888) 848-7569 | www.rivernorth.com |
For a share outstanding throughout the periods presented
For the
Year Ended
September 30,
2021 | | | For the
Year Ended
September 30,
2020 | | | For the
Year Ended
September 30,
2019 | | | For the
Year Ended
September 30,
2018 | | | For the
Year Ended
September 30,
2017 | |
| $ | 10.20 | | | $ | 10.33 | | | $ | 10.08 | | | $ | 10.61 | | | $ | 10.61 | |
| | | | | | | | | | | | | | | | | | | |
| | 0.38 | | | | 0.45 | | | | 0.52 | | | | 0.47 | | | | 0.40 | |
| | 0.38 | | | | (0.10 | ) | | | 0.28 | | | | (0.44 | ) | | | 0.08 | |
| | 0.76 | | | | 0.35 | | | | 0.80 | | | | 0.03 | | | | 0.48 | |
| | | | | | | | | | | | | | | | | | | |
| | (0.44 | ) | | | (0.46 | ) | | | (0.55 | ) | | | (0.51 | ) | | | (0.45 | ) |
| | – | | | | – | | | | – | | | | (0.04 | ) | | | (0.03 | ) |
| | – | | | | (0.02 | ) | | | – | | | | (0.01 | ) | | | – | |
| | (0.44 | ) | | | (0.48 | ) | | | (0.55 | ) | | | (0.56 | ) | | | (0.48 | ) |
| | – | | | | – | | | | 0.00 | (b) | | | 0.00 | (b) | | | 0.00 | (b) |
| | 0.32 | | | | (0.13 | ) | | | 0.25 | | | | (0.53 | ) | | | – | |
| $ | 10.52 | | | $ | 10.20 | | | $ | 10.33 | | | $ | 10.08 | | | $ | 10.61 | |
| | | | | | | | | | | | | | | | | | | |
| | 7.52 | % | | | 3.51 | % | | | 8.21 | % | | | 0.33 | % | | | 4.67 | % |
| | | | | | | | | | | | | | | | | | | |
| $ | 1,894,398 | | | $ | 1,686,872 | | | $ | 1,858,103 | | | $ | 1,715,495 | | | $ | 2,024,142 | |
| | | | | | | | | | | | | | | | | | | |
| | N/A | | | | N/A | | | | 0.86 | % | | | N/A | | | | N/A | |
| | N/A | | | | N/A | | | | 0.86 | % | | | N/A | | | | N/A | |
| | | | | | | | | | | | | | | | | | | |
| | N/A | | | | N/A | | | | 5.13 | % | | | N/A | | | | N/A | |
| | | | | | | | | | | | | | | | | | | |
| | N/A | | | | N/A | | | | 5.13 | % | | | N/A | | | | N/A | |
| | | | | | | | | | | | | | | | | | | |
| | 0.87 | % | | | 0.87 | % | | | 0.86 | % | | | 0.86 | % | | | 0.85 | % |
| | 0.86 | % | | | 0.87 | % | | | 0.86 | % | | | 0.86 | % | | | 0.85 | % |
| | | | | | | | | | | | | | | | | | | |
| | 3.66 | % | | | 4.42 | % | | | 5.13 | % | | | 4.60 | % | | | 3.80 | % |
| | | | | | | | | | | | | | | | | | | |
| | 3.66 | % | | | 4.42 | % | | | 5.13 | % | | | 4.60 | % | | | 3.80 | % |
| | 100 | % | | | 81 | % | | | 60 | % | | | 37 | % | | | 50 | % |
| Annual Report | September 30, 2021 | 125 |
| RiverNorth/DoubleLine Strategic Income Fund | Class I |
| Financial Highlights | For a share outstanding throughout the periods presented |
| (a) | Based on average shares outstanding during the period. |
| (b) | Less than $0.005 per share. |
| (c) | Total return in the above table represents the rate that the investor would have earned or lost on an investment in the Fund, assuming reinvestment of dividends. |
| (d) | The ratios exclude the impact of expenses of the underlying funds in which the Fund invests as represented in the Schedule of Investments. |
See Notes to Financial Statements.
| 126 | (888) 848-7569 | www.rivernorth.com |
Intentionally Left Blank
| RiverNorth/DoubleLine Strategic Income Fund | Class R |
Financial Highlights
| Net asset value - beginning of period |
| Income from investment operations: |
| Net investment income(a) |
| Net realized and unrealized gain/(loss) on investments |
| Total income from investment operations |
| |
| Less distributions: |
| From net investment income |
| From net realized gain on investments |
| From tax return of capital |
| Total distributions |
| Paid-in capital from redemption fees(a) |
| Net increase/(decrease) in net asset value |
| Net asset value - end of period |
| |
| Total Return(c) |
| |
| Ratios/Supplemental Data: |
| Net assets, end of period (in thousands) |
| Ratios to Average Net Assets (including interest expense): |
| Ratio of expenses to average net assets excluding fee waivers and reimbursements(d) |
| Ratio of expenses to average net assets including fee waivers and reimbursements(d) |
| |
| Ratio of net investment income to average net assets excluding fee waivers and reimbursements(d) |
| |
| Ratio of net investment income to average net assets including fee waivers and reimbursements(d) |
| Ratios to Average Net Assets (excluding interest expense): |
| Ratio of expenses to average net assets excluding fee waivers and reimbursements(d) |
| Ratio of expenses to average net assets including fee waivers and reimbursements(d) |
| |
| Ratio of net investment income to average net assets excluding fee waivers and reimbursements(d) |
| |
| Ratio of net investment income to average net assets including fee waivers and reimbursements(d) |
| Portfolio turnover rate |
See Notes to Financial Statements.
| 128 | (888) 848-7569 | www.rivernorth.com |
For a share outstanding throughout the periods presented
For the
Year Ended
September 30,
2021 | | | For the
Year Ended
September 30,
2020 | | | For the
Year Ended
September 30,
2019 | | | For the
Year Ended
September 30,
2018 | | | For the
Year Ended
September 30,
2017 | |
| $ | 10.22 | | | $ | 10.35 | | | $ | 10.09 | | | $ | 10.62 | | | $ | 10.62 | |
| | | | | | | | | | | | | | | | | | | |
| | 0.36 | | | | 0.43 | | | | 0.50 | | | | 0.45 | | | | 0.38 | |
| | 0.37 | | | | (0.10 | ) | | | 0.28 | | | | (0.45 | ) | | | 0.08 | |
| | 0.73 | | | | 0.33 | | | | 0.78 | | | | – | | | | 0.46 | |
| | | | | | | | | | | | | | | | | | | |
| | (0.41 | ) | | | (0.44 | ) | | | (0.52 | ) | | | (0.48 | ) | | | (0.43 | ) |
| | – | | | | – | | | | – | | | | (0.04 | ) | | | (0.03 | ) |
| | – | | | | (0.02 | ) | | | – | | | | (0.01 | ) | | | – | |
| | (0.41 | ) | | | (0.46 | ) | | | (0.52 | ) | | | (0.53 | ) | | | (0.46 | ) |
| | – | | | | – | | | | 0.00 | (b) | | | 0.00 | (b) | | | 0.00 | (b) |
| | 0.32 | | | | (0.13 | ) | | | 0.26 | | | | (0.53 | ) | | | – | |
| $ | 10.54 | | | $ | 10.22 | | | $ | 10.35 | | | $ | 10.09 | | | $ | 10.62 | |
| | | | | | | | | | | | | | | | | | | |
| | 7.23 | % | | | 3.24 | % | | | 8.03 | % | | | 0.07 | % | | | 4.40 | % |
| | | | | | | | | | | | | | | | | | | |
| $ | 140,863 | | | $ | 129,355 | | | $ | 167,141 | | | $ | 165,472 | | | $ | 208,143 | |
| | | | | | | | | | | | | | | | | | | |
| | N/A | | | | N/A | | | | 1.11 | % | | | N/A | | | | N/A | |
| | N/A | | | | N/A | | | | 1.11 | % | | | N/A | | | | N/A | |
| | | | | | | | | | | | | | | | | | | |
| | N/A | | | | N/A | | | | 4.90 | % | | | N/A | | | | N/A | |
| | | | | | | | | | | | | | | | | | | |
| | N/A | | | | N/A | | | | 4.90 | % | | | N/A | | | | N/A | |
| | | | | | | | | | | | | | | | | | | |
| | 1.12 | % | | | 1.12 | % | | | 1.11 | % | | | 1.11 | % | | | 1.10 | % |
| | 1.11 | % | | | 1.12 | % | | | 1.11 | % | | | 1.11 | % | | | 1.10 | % |
| | | | | | | | | | | | | | | | | | | |
| | 3.41 | % | | | 4.18 | % | | | 4.90 | % | | | 4.34 | % | | | 3.56 | % |
| | | | | | | | | | | | | | | | | | | |
| | 3.42 | % | | | 4.18 | % | | | 4.90 | % | | | 4.34 | % | | | 3.56 | % |
| | 100 | % | | | 81 | % | | | 60 | % | | | 37 | % | | | 50 | % |
| Annual Report | September 30, 2021 | 129 |
| RiverNorth/DoubleLine Strategic Income Fund | Class R |
| Financial Highlights | For a share outstanding throughout the periods presented |
| (a) | Based on average shares outstanding during the period. |
| (b) | Less than $0.005 per share. |
| (c) | Total return in the above table represents the rate that the investor would have earned or lost on an investment in the Fund, assuming reinvestment of dividends. |
| (d) | The ratios exclude the impact of expenses of the underlying funds in which the Fund invests as represented in the Schedule of Investments. |
See Notes to Financial Statements.
| 130 | (888) 848-7569 | www.rivernorth.com |
Intentionally Left Blank
RiverNorth/Oaktree High Income Fund | Class I |
Financial Highlights | For a share outstanding throughout the periods presented |
Net asset value - beginning of period |
Income/(loss) from investment operations: |
Net investment income(a) |
Net realized and unrealized gain/(loss) on investments |
Total income/(loss) from investment operations |
|
Less distributions: |
From net investment income |
From tax return of capital |
Total distributions |
Paid-in capital from redemption fees(a) |
Net increase/(decrease) in net asset value |
Net asset value - end of period |
|
Total Return(c) |
|
Supplemental Data: |
Net assets, end of period (in thousands) |
Ratios to Average Net Assets (including interest expense) |
Ratio of expenses to average net assets excluding fee waivers and reimbursements(d) |
Ratio of expenses to average net assets including fee waivers and reimbursements(d) |
|
Ratio of net investment income to average net assets excluding fee waivers and reimbursements(d) |
|
Ratio of net investment income to average net assets including fee waivers and reimbursements(d) |
| |
Ratios to Average Net Assets (excluding interest expense) |
Ratio of expenses to average net assets excluding fee waivers and reimbursements(d) |
Ratio of expenses to average net assets including fee waivers and reimbursements(d) |
|
Ratio of net investment income to average net assets excluding fee waivers and reimbursements(d) |
|
Ratio of net investment income to average net assets including fee waivers and reimbursements(d) |
Portfolio turnover rate |
See Notes to Financial Statements.
132 | (888) 848-7569 | www.rivernorth.com |
| For a share outstanding throughout the periods presented |
For the
Year Ended
September 30,
2021 | | | For the
Year Ended
September 30,
2020 | | | For the
Year Ended
September 30,
2019 | | | For the
Year Ended
September 30,
2018 | | | For the
Year Ended
September 30,
2017 |
$ | 9.09 | | | $ | 9.55 | | | $ | 9.58 | | | $ | 9.73 | | | $ | 9.48 | |
| | | | | | | | | | | | | | | | | | |
| 0.33 | | | | 0.34 | | | | 0.38 | | | | 0.39 | | | | 0.35 | |
| 0.44 | | | | (0.35 | ) | | | 0.07 | | | | (0.18 | ) | | | 0.31 | |
| 0.77 | | | | (0.01 | ) | | | 0.45 | | | | 0.21 | | | | 0.66 | |
| | | | | | | | | | | | | | | | | | |
| (0.33 | ) | | | (0.37 | ) | | | (0.48 | ) | | | (0.24 | ) | | | (0.38 | ) |
| – | | | | (0.08 | ) | | | – | | | | (0.12 | ) | | | (0.03 | ) |
| (0.33 | ) | | | (0.45 | ) | | | (0.48 | ) | | | (0.36 | ) | | | (0.41 | ) |
| – | | | | – | | | | 0.00 | (b) | | | 0.00 | (b) | | | 0.00 | (b) |
| 0.44 | | | | (0.46 | ) | | | (0.03 | ) | | | (0.15 | ) | | | 0.25 | |
$ | 9.53 | | | $ | 9.09 | | | $ | 9.55 | | | $ | 9.58 | | | $ | 9.73 | |
| | | | | | | | | | | | | | | | | | | |
| 8.55 | % | | | (0.02 | %) | | | 4.85 | % | | | 2.22 | % | | | 7.11 | % |
| | | | | | | | | | | | | | | | | | |
$ | 41,386 | | | $ | 40,375 | | | $ | 45,306 | | | $ | 49,856 | | | $ | 63,842 | |
| | | | | | | | | | | | | | | | | | |
| 1.75 | % | | | N/A | | | | 1.58 | % | | | 1.54 | % | | | 1.35 | % |
| 1.35 | % | | | N/A | | | | 1.36 | % | | | 1.36 | % | | | 1.35 | % |
| | | | | | | | | | | | | | | | | | |
| 3.07 | % | | | N/A | | | | 3.83 | % | | | 3.84 | % | | | 3.59 | % |
| | | | | | | | | | | | | | | | | | |
| 3.47 | % | | | N/A | | | | 4.05 | % | | | 4.02 | % | | | 3.59 | % |
| | | | | | | | | | | | | | | | | | |
| 1.75 | % | | | 1.69 | % | | | 1.57 | % | | | 1.53 | % | | | 1.35 | % |
| 1.35 | % | | | 1.35 | % | | | 1.35 | % | | | 1.35 | % | | | 1.35 | % |
| | | | | | | | | | | | | | | | | | |
| 3.07 | % | | | 3.43 | % | | | 3.84 | % | | | 3.83 | % | | | 3.59 | % |
| | | | | | | | | | | | | | | | | | |
| 3.47 | % | | | 3.78 | % | | | 4.06 | % | | | 4.01 | % | | | 3.59 | % |
| 72 | % | | | 80 | % | | | 52 | % | | | 76 | % | | | 121 | % |
Annual Report | September 30, 2021 | 133 |
RiverNorth/Oaktree High Income Fund | Class I |
Financial Highlights | For a share outstanding throughout the periods presented |
(a) | Based on average shares outstanding during the period. |
(b) | Less than $0.005 per share. |
(c) | Total return in the above table represents the rate that the investor would have earned or lost on an investment in the Fund, assuming reinvestment of dividends. |
(d) | The ratios exclude the impact of expenses of the underlying funds in which the Fund invests as represented in the Schedule of Investments. |
See Notes to Financial Statements.
134 | (888) 848-7569 | www.rivernorth.com |
Intentionally Left Blank
RiverNorth/Oaktree High Income Fund | Class R |
Net asset value - beginning of period |
Income/(loss) from investment operations: |
Net investment income(a) |
Net realized and unrealized gain/(loss) on investments |
Total income/(loss) from investment operations |
|
Less distributions: |
From net investment income |
From tax return of capital |
Total distributions |
Paid-in capital from redemption fees(a) |
Net increase/(decrease) in net asset value |
Net asset value - end of period |
|
Total Return(c) |
|
Supplemental Data: |
Net assets, end of period (in thousands) |
Ratios to Average Net Assets (including interest expense) |
Ratio of expenses to average net assets excluding fee waivers and reimbursements(d) |
Ratio of expenses to average net assets including fee waivers and reimbursements(d) |
|
Ratio of net investment income to average net assets excluding fee waivers and reimbursements(d) |
|
Ratio of net investment income to average net assets including fee waivers and reimbursements(d) |
| |
Ratios to Average Net Assets (excluding interest expense) |
Ratio of expenses to average net assets excluding fee waivers and reimbursements(d) |
Ratio of expenses to average net assets including fee waivers and reimbursements(d) |
|
Ratio of net investment income to average net assets excluding fee waivers and reimbursements(d) |
|
Ratio of net investment income to average net assets including fee waivers and reimbursements(d) |
Portfolio turnover rate |
See Notes to Financial Statements.
136 | (888) 848-7569 | www.rivernorth.com |
For a share outstanding throughout the periods presented |
For the
Year Ended
September 30,
2021 | | | For the
Year Ended
September 30,
2020 | | | For the
Year Ended
September 30,
2019 | | | For the
Year Ended
September 30,
2018 | | | For the
Year Ended
September 30,
2017 |
$ | 9.08 | | | $ | 9.54 | | | $ | 9.58 | | | $ | 9.72 | | | $ | 9.47 | |
| | | | | | | | | | | | | | | | | | |
| 0.30 | | | | 0.32 | | | | 0.36 | | | | 0.36 | | | | 0.32 | |
| 0.45 | | | | (0.36 | ) | | | 0.05 | | | | (0.16 | ) | | | 0.32 | |
| 0.75 | | | | (0.04 | ) | | | 0.41 | | | | 0.20 | | | | 0.64 | |
| | | | | | | | | | | | | | | | | | |
| (0.31 | ) | | | (0.35 | ) | | | (0.45 | ) | | | (0.23 | ) | | | (0.36 | ) |
| – | | | | (0.07 | ) | | | – | | | | (0.11 | ) | | | (0.03 | ) |
| (0.31 | ) | | | (0.42 | ) | | | (0.45 | ) | | | (0.34 | ) | | | (0.39 | ) |
| – | | | | – | | | | 0.00 | (b) | | | 0.00 | (b) | | | 0.00 | (b) |
| 0.44 | | | | (0.46 | ) | | | (0.04 | ) | | | (0.14 | ) | | | 0.25 | |
$ | 9.52 | | | $ | 9.08 | | | $ | 9.54 | | | $ | 9.58 | | | $ | 9.72 | |
| | | | | | | | | | | | | | | | | | | |
| 8.31 | % | | | (0.27 | %) | | | 4.48 | % | | | 2.07 | % | | | 6.83 | % |
| | | | | | | | | | | | | | | | | | |
$ | 4,548 | | | $ | 4,989 | | | $ | 5,937 | | | $ | 6,758 | | | $ | 7,635 | |
| | | | | | | | | | | | | | | | | | |
| 2.00 | % | | | N/A | | | | 1.83 | % | | | 1.79 | % | | | 1.63 | % |
| 1.60 | % | | | N/A | | | | 1.61 | % | | | 1.61 | % | | | 1.60 | % |
| | | | | | | | | | | | | | | | | | |
| 2.83 | % | | | N/A | | | | 3.58 | % | | | 3.60 | % | | | 3.29 | % |
| | | | | | | | | | | | | | | | | | |
| 3.22 | % | | | N/A | | | | 3.80 | % | | | 3.78 | % | | | 3.33 | % |
| | | | | | | | | | | | | | | | | | |
| 2.00 | % | | | 1.95 | % | | | 1.82 | % | | | 1.78 | % | | | 1.63 | % |
| 1.60 | % | | | 1.60 | % | | | 1.60 | % | | | 1.60 | % | | | 1.60 | % |
| | | | | | | | | | | | | | | | | | |
| 2.83 | % | | | 3.19 | % | | | 3.59 | % | | | 3.59 | % | | | 3.29 | % |
| | | | | | | | | | | | | | | | | | |
| 3.22 | % | | | 3.53 | % | | | 3.81 | % | | | 3.77 | % | | | 3.33 | % |
| 72 | % | | | 80 | % | | | 52 | % | | | 76 | % | | | 121 | % |
Annual Report | September 30, 2021 | 137 |
RiverNorth/Oaktree High Income Fund | Class R |
Financial Highlights | For a share outstanding throughout the periods presented |
(a) | Based on average shares outstanding during the period. |
(b) | Less than $0.005 per share. |
(c) | Total return in the above table represents the rate that the investor would have earned or lost on an investment in the Fund, assuming reinvestment of dividends. |
(d) | The ratios exclude the impact of expenses of the underlying funds in which the Fund invests as represented in the Schedule of Investments. |
See Notes to Financial Statements.
138 | (888) 848-7569 | www.rivernorth.com |
RiverNorth Funds | Notes to Financial Statements |
| September 30, 2021 |
1. ORGANIZATION
The RiverNorth Funds (the “Trust” or “Funds”) was established under the laws of Ohio by an Agreement and Declaration of Trust dated July 18, 2006 (the “Trust Agreement”). The Trust is an open-end management investment company registered under the Investment Company Act of 1940, as amended (the “1940 Act”). The Trust Agreement permits the Board of Trustees (the “Board” or “Trustees”) to authorize and issue an unlimited number of shares of beneficial interest of a separate series without par value. All classes of shares for each of the Funds have identical rights to earnings, assets and voting privileges, except for class-specific expenses and exclusive rights to vote on matters affecting only individual classes. The Funds are considered investment companies and therefore follow the investment company accounting and reporting guidance of the Financial Accounting Standards Board (“FASB”) Accounting Standards Codification Topic 946 Financial Services Investment Companies.
The RiverNorth Core Opportunity Fund (the “Core Opportunity Fund”) was organized as a diversified series of the Trust on July 18, 2006 and commenced investment operations on December 27, 2006. The Core Opportunity Fund offers two classes of shares, Class I Shares (inception date of August 11, 2014) and Class R Shares (inception date of December 27, 2006). The investment adviser to the Core Opportunity Fund is RiverNorth Capital Management, LLC (“RiverNorth” or the “Adviser”). The investment objective of the Core Opportunity Fund is to seek long-term capital appreciation and income.
The RiverNorth/DoubleLine Strategic Income Fund (the “Strategic Income Fund”) is a diversified series of the Trust and commenced investment operations on December 30, 2010. The Strategic Income Fund offers two classes of shares, Class I Shares and Class R Shares. The investment adviser to the Strategic Income Fund is RiverNorth. The Strategic Income Fund’s sub-adviser is DoubleLine Capital, LP (“DoubleLine”). The investment objective of the Strategic Income Fund is current income and overall total return.
The RiverNorth/Oaktree High Income Fund (the “High Income Fund”) is a diversified series of the Trust and commenced investment operations on December 28, 2012. The High Income Fund offers two classes of shares, Class I Shares and Class R Shares. The investment adviser to the High Income Fund is RiverNorth. The High Income Fund’s sub-adviser is Oaktree Capital Management, L.P. (“Oaktree Capital,” and with DoubleLine, each a “Sub-Adviser” or collectively, the “Sub-Advisers”). The investment objective of the High Income Fund is overall total return consisting of long-term capital appreciation and income.
2. SIGNIFICANT ACCOUNTING POLICIES
The following is a summary of significant accounting policies followed by the Funds. These policies are in conformity with generally accepted accounting principles in the United States of America (“GAAP”). The financial statements are prepared in accordance with GAAP, which requires management to make estimates and assumptions that affect the reported amounts and disclosures, including the disclosure of contingent assets and liabilities, in the financial statements during the reporting period. Management believes the estimates and security valuations are appropriate; however, actual results may differ from those estimates, and the security valuations reflected in the financial statements may differ from the value the Funds ultimately realize upon sale of the securities. The financial statements have been prepared as of the close of the New York Stock Exchange (“NYSE” or the “Exchange”) on the fiscal period end of the Funds.
| Annual Report | September 30, 2021 | 139 |
RiverNorth Funds | Notes to Financial Statements |
| September 30, 2021 |
Security Valuation: The Funds’ assets and other financial instruments are recorded at their estimated fair value as described in Note 3.
Security Transactions and Related Income: The Funds follow industry practice and record security transactions on the trade date basis. The specific identification method is used for determining gains or losses for financial statements and income tax purposes. Dividend income is recorded on the ex-dividend date or for certain foreign securities, when the information becomes available to the Funds, and interest income and expenses are recorded on an accrual basis. Discounts and premiums on securities purchased are amortized or accreted using the effective interest method. Withholding taxes on foreign dividends have been provided for in accordance with the Funds’ understanding of the applicable country’s tax rules and rates. The ability of issuers of debt securities held by the Funds to meet their obligations may be affected by economic and political developments in a specific country or region. Settlement on bank loans transactions may be in excess of seven business days. Interest only stripped mortgage backed securities ("IO Strips") are securities that receive only interest payments from a pool of mortgage loans. Little to no principal will be received by the Funds upon maturity of an IO Strip. Periodic adjustments are recorded to reduce the cost of the security until maturity, which are included in interest income.
Foreign Currency Translation: The books and records of the Funds are maintained in U.S. dollars. Investment valuations and other assets and liabilities initially expressed in foreign currencies are converted each business day into U.S. dollars based upon current exchange rates. Prevailing foreign exchange rates may generally be obtained at the close of the NYSE (normally, 4:00 p.m. Eastern Time). The portion of realized and unrealized gains or losses on investments due to fluctuations in foreign currency exchange rates is not separately disclosed and is included in realized and unrealized gains or losses on investments, when applicable.
Foreign Securities: The Funds may directly purchase securities of foreign issuers. Investing in securities of foreign issuers involves special risks not typically associated with investing in securities of U.S. issuers. The risks include possible revaluation of currencies, the ability to repatriate funds, less complete financial information about companies and possible future adverse political and economic developments. Moreover, securities of many foreign issuers and their markets may be less liquid and their prices more volatile than those of securities of comparable U.S. issuers.
Certain foreign countries impose a capital gains tax which is accrued by the Funds based on the unrealized appreciation, if any, on affected securities. Any accrual would reduce a Fund’s net asset value ("NAV"). The tax is paid when the gain is realized and is included in capital gains tax in the Statements of Operations. During the year ended September 30, 2021, no foreign capital gains tax was accrued or paid by the Fund.
Other: The Funds hold certain investments which pay dividends to their shareholders based upon available funds from operations. It is possible for these dividends to exceed the underlying investments’ taxable earnings and profits resulting in the excess portion of such dividends being designated as a return of capital. Distributions received from investments in securities that represent a return of capital or capital gains are recorded as a reduction of the cost of investments or as a realized gain, respectively.
140 | (888) 848-7569 | www.rivernorth.com |
RiverNorth Funds | Notes to Financial Statements |
| September 30, 2021 |
Principal Investment Risks: All mutual funds carry a certain amount of risk. For more information on the related risks of investing in the Funds, please refer to the prospectus of each Fund.
Share Valuation: The NAV is generally calculated as of the close of trading on the NYSE (normally 4:00 p.m. Eastern Time) every day the Exchange is open. The NAV is calculated by taking the total value of each Fund’s or class’ assets, subtracting its liabilities, and then dividing by the total number of shares outstanding, rounded to the nearest cent. The offering price and redemption price per share is equal to the NAV per share.
Expenses: Some expenses of the Trust can be directly attributed to a Fund or a Fund specific share class. Expenses which cannot be directly attributed are apportioned among all Funds and Fund series classes in the Trust based on average net assets or another method approved by the Board.
Federal Income Taxes: The Funds make no provision for federal income tax. Each Fund intends to qualify each year as a “regulated investment company” under subchapter M of the Internal Revenue Code of 1986, as amended (the "Code"), by distributing substantially all of its taxable income. If the required amount of net investment income is not distributed, the Funds could incur a tax expense.
As of and during the year ended September 30, 2021, the Funds did not have a liability for any unrecognized tax benefits. The Funds file U.S. federal, state, and local tax returns as required. The Funds’ tax returns are subject to examination by the relevant tax authorities until expiration of the applicable statute of limitations which is generally three years after the filing of the tax return for federal purposes and four years for most state returns. Tax returns for open years have incorporated no uncertain tax positions that require a provision for income taxes.
The Funds recognize interest and penalties, if any, related to unrecognized tax benefits as income tax expenses in the Statements of Operations. During the year ended September 30, 2021, the Funds did not incur any interest or penalties.
Distributions to Shareholders: Distributions to shareholders, which are determined in accordance with income tax regulations, are recorded on the ex-dividend date. The treatment for financial reporting purposes of distributions made to shareholders during the year from net investment income or net realized capital gains may differ from their ultimate treatment for federal income tax purposes. These differences are caused primarily by differences in the timing of recognition of certain components of income, expense, or realized capital gain for federal income tax purposes. Where such differences are permanent in nature, they are reclassified in the components of the net assets based on their ultimate characterization for federal income tax purposes. Any such reclassification will have no effect on net assets, results of operations or net asset values per share of the Funds.
3. SECURITIES VALUATION AND FAIR VALUE MEASUREMENTS |
Fair value is defined as the price that a Fund might reasonably expect to receive upon selling an investment in a timely transaction to an independent buyer in the principal or most advantageous market of the investment. GAAP establishes a three-tier hierarchy to maximize the use of observable market data and minimize the use of unobservable inputs and to establish classification of fair value measurements for disclosure purposes.
Annual Report | September 30, 2021 | 141 |
RiverNorth Funds | Notes to Financial Statements |
| September 30, 2021 |
Inputs refer broadly to the assumptions that market participants would use in pricing the asset or liability, including assumptions about risk. For example, the risk inherent in a particular valuation technique used to measure fair value including using such a pricing model and/or the risk inherent in the inputs to the valuation technique. Inputs may be observable or unobservable. Observable inputs are inputs that reflect the assumptions market participants would use in pricing the asset or liability developed based on market data obtained from sources independent of the reporting entity. Unobservable inputs are inputs that reflect the reporting entity’s own assumptions about the assumptions market participants would use in pricing the asset or liability developed based on the best information available in the circumstances.
Various inputs are used in determining the value of the Funds’ investments. These inputs are summarized in the three broad levels listed below.
| ● | Level 1 – Unadjusted quoted prices in active markets for identical, unrestricted assets or liabilities that a Fund has the ability to access at the measurement date; |
| ● | Level 2 – Quoted prices which are not active, quoted prices for similar assets or liabilities in active markets or inputs other than quoted prices that are observable (either directly or indirectly) for substantially the full term of the asset or liability; and |
| ● | Level 3 – Significant unobservable prices or inputs (including the Funds’ own assumptions in determining the fair value of investments) where there is little or no market activity for the asset or liability at the measurement date. |
The inputs used to measure fair value may fall into different levels of the fair value hierarchy. In such cases, for disclosure purposes, the level in the fair value hierarchy within which the fair value measurement falls in its entirety is determined based on the lowest level input that is significant to the fair value measurement in its entirety.
Equity securities, including common stocks, rights and warrants, closed-end funds, exchange-traded funds, preferred stocks, business development companies and special purpose acquisition companies, are generally valued by using market quotations, but may be valued on the basis of prices furnished by a pricing service when the Adviser or a Sub-Adviser believes such prices more accurately reflect the fair market value of such securities. Securities that are traded on any stock exchange are generally valued by the pricing service at the last quoted sale price. Lacking a last sale price, an exchange traded security is generally valued by the pricing service at its last bid price. Securities traded in the NASDAQ over-the-counter market are generally valued by the pricing service at the NASDAQ Official Closing Price. When using the market quotations or close prices provided by the pricing service and when the market is considered active, the security will be classified as a Level 1 security. Sometimes, an equity security owned by the Funds will be valued by the pricing service with factors other than market quotations or when the market is considered inactive. When this happens, the security will be classified as a Level 2 security. When market quotations are not readily available, when the Adviser or a Sub-Adviser determines that the market quotation or the price provided by the pricing service does not accurately reflect the current fair value, or when restricted or illiquid securities are being valued, such securities are valued as determined in good faith by the Adviser, Sub-Adviser, or valuation committee in conformity with guidelines adopted by and subject to review by the Board. These securities will be categorized as Level 3 securities.
142 | (888) 848-7569 | www.rivernorth.com |
RiverNorth Funds | Notes to Financial Statements |
| September 30, 2021 |
Investments in mutual funds, including short-term investments and open-end funds, are generally priced at the ending NAV provided by the service agent of the funds. These securities will be categorized as Level 1 securities.
Domestic and foreign fixed income securities, including foreign and U.S. corporate bonds, convertible corporate bonds, U.S. government bonds and notes, foreign government bonds and notes, supranationals and foreign agencies, non-agency collateralized mortgage obligations, U.S. government/agency mortgage backed securities, business development company notes, bank loans, collateralized loan obligations, municipal bonds, and high yield debt, as well as non-exchange traded derivatives, including forward foreign currency contracts, are normally valued on the basis of quotes obtained from brokers and dealers or independent pricing services. Foreign currency positions, including forward foreign currency contracts, are priced at the mean between the closing bid and asked prices at 4:00 p.m. Eastern Time. Prices obtained from independent pricing services typically use information provided by market makers or estimates of market values obtained from yield data relating to investments or securities with similar characteristics. Data used to establish quotes includes analysis of cash flows, pre-payment speeds, default rates, delinquency assumptions and assumptions regarding collateral and loss assumptions. These securities will be classified as Level 2 securities.
Short-term investments in fixed income securities, with maturities of less than 60 days when acquired, or which subsequently are within 60 days of maturity, are valued by using the amortized cost method of valuation, which the Board has determined will represent fair value. These securities will be classified as Level 2 securities.
In accordance with the Funds’ good faith pricing guidelines, the Adviser, Sub-Adviser, or valuation committee is required to consider all appropriate factors relevant to the value of securities for which it has determined other pricing sources are not available or reliable as described above. No single standard exists for determining fair value, because fair value depends upon the circumstances of each individual case. As a general principle, the current fair value of an issue of securities being valued by the Adviser, Sub-Adviser, or valuation committee would appear to be the amount which the owner might reasonably expect to receive for them upon their current sale. Methods which are in accordance with this principle may, for example, be based on (i) a multiple of earnings; (ii) discounted cash flow models; (iii) weighted average cost or weighted average price; (iv) a discount from market of a similar freely traded security (including a derivative security or a basket of securities traded on other markets, exchanges or among dealers); or (v) yield to maturity with respect to debt issues, or a combination of these and other methods. Good faith pricing is permitted if, in the Adviser’s, a Sub-Adviser’s, or the valuation committee’s opinion, the validity of market quotations appears to be questionable based on factors such as evidence of a thin market in the security based on a small number of quotations, a significant event occurs after the close of a market but before a Fund’s NAV calculation that may affect a security’s value, or the Adviser or a Sub-Adviser is aware of any other data that calls into question the reliability of market quotations.
Good faith pricing may also be used in instances when the bonds in which the Funds invest default or otherwise cease to have market quotations readily available. Investments in foreign securities, junk bonds, or other thinly traded securities are more likely to trigger good faith pricing than other securities.
Annual Report | September 30, 2021 | 143 |
RiverNorth Funds | Notes to Financial Statements |
| September 30, 2021 |
The following is a summary of the inputs used at September 30, 2021 in valuing the Funds’ assets and liabilities:
| Core Opportunity Fund | | | | | | |
| | | Valuation Inputs | | | | | |
| Investments in Securities at Value* | | | Level 1 | | | | Level 2 | | | | Level 3 | | | | Total | |
| Closed-End Funds | | $ | 47,044,195 | | | $ | – | | | $ | – | | | $ | 47,044,195 | |
| Business Development Companies | | | 5,222,293 | | | | – | | | | – | | | | 5,222,293 | |
| Common Stocks | | | 7,637,573 | | | | – | | | | – | | | | 7,637,573 | |
| Exchange Traded Funds | | | 847,870 | | | | – | | | | – | | | | 847,870 | |
| Preferred Stocks | | | 400,201 | | | | – | | | | – | | | | 400,201 | |
| Business Development Company Notes | | | 1,803,466 | | | | 1,232,337 | | | | – | | | | 3,035,803 | |
| Convertible Corporate Bonds | | | – | | | | 1,954,873 | | | | – | | | | 1,954,873 | |
| Rights | | | 3,320 | | | | – | | | | – | | | | 3,320 | |
| Warrants | | | 154,383 | | | | – | | | | – | | | | 154,383 | |
| Short-Term Investments | | | 13,965,438 | | | | – | | | | – | | | | 13,965,438 | |
| Total | | $ | 77,078,739 | | | $ | 3,187,210 | | | $ | – | | | $ | 80,265,949 | |
144 | (888) 848-7569 | www.rivernorth.com |
RiverNorth Funds | Notes to Financial Statements |
| September 30, 2021 |
| Strategic Income Fund | | | | | | | |
| | | Valuation Inputs | | | | | |
| Investments in Securities at Value* | | | Level 1 | | | | Level 2 | | | | Level 3 | | | | Total | |
| Closed-End Funds | | $ | 222,519,016 | | | $ | – | | | $ | – | | | $ | 222,519,016 | |
| Business Development Companies | | | 10,523,009 | | | | – | | | | – | | | | 10,523,009 | |
| Common Stocks | | | 80,597,336 | | | | – | | | | – | | | | 80,597,336 | |
| Open-End Funds | | | 32,734,160 | | | | – | | | | – | | | | 32,734,160 | |
| Business Development Company Notes | | | 20,288,696 | | | | 3,030,338 | | | | – | | | | 23,319,034 | |
| Foreign Corporate Bonds | | | – | | | | 90,684,033 | | | | – | | | | 90,684,033 | |
| U.S. Corporate Bonds | | | – | | | | 144,441,653 | | | | – | | | | 144,441,653 | |
| Convertible Corporate Bonds | | | – | | | | 16,907,359 | | | | – | | | | 16,907,359 | |
| Foreign Government Bonds and Notes, Supranationals and Foreign Agencies | | | – | | | | 18,945,865 | | | | – | | | | 18,945,865 | |
| Bank Loans | | | – | | | | 45,760,221 | | | | – | | | | 45,760,221 | |
| Collateralized Loan Obligations | | | – | | | | 67,924,288 | | | | – | | | | 67,924,288 | |
| Non-Agency Collateralized Mortgage Obligations | | | – | | | | 478,284,916 | | | | – | | | | 478,284,916 | |
| U.S. Government Bonds and Notes | | | – | | | | 223,053,930 | | | | – | | | | 223,053,930 | |
| Municipal Bonds | | | – | | | | 278,356 | | | | – | | | | 278,356 | |
| U.S. Government / Agency Mortgage Backed Securities | | | – | | | | 288,703,957 | | | | – | | | | 288,703,957 | |
| Short-Term Investments | | | 298,707,883 | | | | – | | | | – | | | | 298,707,883 | |
| Total | | $ | 665,370,100 | | | $ | 1,378,014,916 | | | $ | – | | | $ | 2,043,385,016 | |
Annual Report | September 30, 2021 | 145 |
RiverNorth Funds | Notes to Financial Statements |
| September 30, 2021 |
High Income Fund
| | | Valuation Inputs | | | | | |
| Investments in Securities at Value* | | | Level 1 | | | | Level 2 | | | | Level 3 | | | | Total | |
| Closed-End Funds | | $ | 290,723 | | | $ | – | | | $ | – | | | $ | 290,723 | |
| Common Stocks | | | – | | | | 150 | | | | 75,753 | | | | 75,903 | |
| Preferred Stocks | | | – | | | | – | | | | 117,022 | | | | 117,022 | |
| Bank Loans | | | – | | | | 16,004,768 | | | | – | | | | 16,004,768 | |
| High Yield Debt | | | – | | | | 28,181,004 | | | | – | | | | 28,181,004 | |
| Rights | | | – | | | | – | | | | 28 | | | | 28 | |
| Warrants | | | – | | | | 3,436 | | | | – | | | | 3,436 | |
| Short-Term Investments | | | 2,176,162 | | | | – | | | | – | | | | 2,176,162 | |
| Total | | $ | 2,466,885 | | | $ | 44,189,358 | | | $ | 192,803 | | | $ | 46,849,046 | |
| | | Valuation Inputs | | | | | |
| Other Financial Instruments** | | | Level 1 | | | | Level 2 | | | | Level 3 | | | | Total | |
| Assets | | | | | | | | | | | | | | | | |
| Forward Foreign Currency Contracts | | $ | – | | | $ | 184,417 | | | $ | – | | | $ | 184,417 | |
| Liabilities | | | | | | | | | | | | | | | | |
| Forward Foreign Currency Contracts | | $ | – | | | $ | (1,910 | ) | | $ | – | | | $ | (1,910 | ) |
| Total | | $ | – | | | $ | 182,507 | | | $ | – | | | $ | 182,507 | |
| * | Refer to each Fund’s Schedule of Investments for a listing of securities by type. |
| ** | Other financial instruments are derivative instruments reflected in the Schedule of Investments. |
146 | (888) 848-7569 | www.rivernorth.com |
| RiverNorth Funds | Notes to Financial Statements |
September 30, 2021
The changes of the fair value of investments for which the Funds have used Level 3 inputs to determine the fair value are as follows:
| Asset Type | | Balance as of
September 30, 2020 | | | Accrued Discount/
premium | | | Return
of
Capital | | | Realized
Gain/
(Loss) | | | Change in
Unrealized
Appreciation/
Depreciation | | | Purchases | | | Sales
Proceeds | | | Transfer
into
Level 3 | | | Transfer
Out of
Level 3 | | | Balance
as of
September 30, 2021 | | | Net change in
unrealized
appreciation/
(depreciation)
included in the
Statements of
Operations
attributable to
Level 3
investments
held at
September 30, 2021 | |
| Strategic Income Fund | | | | | | | | | | | | | | | | | | | | | | | | | | | | | | | | | | | | | | | | | |
| Equity-Linked Note | | $ | 11,250 | | | $ | – | | | $ | – | | | $ | – | | | $ | (11,250 | ) | | $ | – | | | $ | – | | | $ | – | | | $ | – | | | $ | – | | | $ | (11,250 | ) |
| | | $ | 11,250 | | | $ | – | | | $ | – | | | $ | – | | | $ | (11,250 | ) | | $ | – | | | $ | – | | | $ | – | | | $ | – | | | $ | – | | | $ | (11,250 | ) |
| | | | | | | | | | | | | | | | | | | | | | | | | | | | | | | | | | | | | | | | | | | | | |
| High Income Fund | | | | | | | | | | | | | | | | | | | | | | | | | | | | | | | | | | | | | | | |
| Common Stocks | | $ | 38,113 | | | $ | – | | | $ | – | | | $ | (14,367 | ) | | $ | 52,540 | | | $ | – | | | $ | (533 | ) | | $ | – | | | $ | – | | | $ | 75,753 | | | $ | 37,996 | |
| Preferred Stocks | | | 96,490 | | | | – | | | | – | | | | – | | | | 6,530 | | | | 14,000 | | | | 2 | | | | – | | | | – | | | | 117,022 | | | | 6,530 | |
| Bank Loans | | | 68,060 | | | | – | | | | – | | | | (4,311 | ) | | | 41,936 | | | | 1 | | | | (105,686 | ) | | | – | | | | – | | | | – | | | | – | |
| Rights | | | 32 | | | | – | | | | – | | | | – | | | | (4 | ) | | | – | | | | – | | | | – | | | | – | | | | 28 | | | | (4 | ) |
| Warrants | | | – | | | | | | | | | | | | | | | | 1 | | | | – | | | | (1 | ) | | | – | | | | – | | | | – | | | | 1 | |
| | | $ | 202,695 | | | $ | – | | | $ | – | | | $ | (18,678 | ) | | $ | 101,003 | | | $ | 14,001 | | | $ | (106,218 | ) | | $ | – | | | $ | – | | | $ | 192,803 | | | $ | 44,523 | |
The table below provides additional information about the Level 3 Fair Value Measurements as of September 30, 2021:
Quantitative Information about Level 3 Fair Value Measurements
High Income Fund
| Asset Class | Fair Value (USD) | Valuation Technique | Unobservable Inputs(a) | Value/Range (Weighted Average) |
| Common Stocks | $75,753 | Market Comparable Companies | EBITDA Multiple | 6.00x |
| | | | Company Provided Financial Information | N/A |
| Preferred Stocks | 117,022 | Market Comparable Companies | EBITDA Multiple | 12.25x |
| | | | Company Provided Financial Information | N/A |
| (a) | A change to the unobservable input may result in a significant change to the value of the investment as follows: |
| Unobservable Inputs | Impact to Value if Input Increases | Impact to Value if Input Decreases |
| EBITDA Multiple | Increase | Decrease |
| Annual Report | September 30, 2021 | 147 |
| RiverNorth Funds | Notes to Financial Statements |
September 30, 2021
4. DERIVATIVE FINANCIAL INSTRUMENTS
The following discloses the Funds’ use of derivative instruments. The Funds’ investment objectives not only permit the Funds to purchase investment securities, they also allow the Funds to enter into various types of derivative contracts such as forward foreign currency contracts. In doing so, the Funds will employ strategies in differing combinations to permit them to increase, decrease, or change the level or types of exposure to market factors. Central to those strategies are features inherent to derivatives that make them more attractive for this purpose than equity or debt securities; they require little or no initial cash investment, they can focus exposure on only certain selected risk factors, and they may not require the ultimate receipt or delivery of the underlying security (or securities) to the contract. This may allow the Funds to pursue their objectives more quickly and efficiently than if they were to make direct purchases or sales of securities capable of affecting a similar response to market factors.
Market Risk Factors: In pursuit of their investment objectives, the Funds may seek to use derivatives to increase or decrease their exposure to the following market risk factors:
Foreign Exchange Rate Risk: Foreign exchange rate risk relates to the change in the U.S. dollar value of a security held that is denominated in a foreign currency. The value of a foreign currency denominated security will decrease as the dollar appreciates against the currency, while the value of the foreign currency denominated security will increase as the dollar depreciates against the currency.
Risk of Investing in Derivatives
The Funds’ use of derivatives can result in losses due to unanticipated changes in the market risk factors and the overall market. Derivatives may have little or no initial cash investment relative to their market value exposure and therefore can produce significant gains or losses in excess of their cost. This use of embedded leverage allows the Funds to increase their market value exposure relative to their net assets and can substantially increase the volatility of the Funds’ performance.
Additional associated risks from investing in derivatives also exist and potentially could have significant effects on the valuation of the derivative and the Funds. Typically, the associated risks are not the risks that the Funds are attempting to increase or decrease exposure to, per their investment objectives, but are the additional risks from investing in derivatives.
Examples of these associated risks are liquidity risk, which is the risk that the Funds will not be able to sell the derivative in the open market in a timely manner, and counterparty credit risk, which is the risk that the counterparty will not fulfill its obligation to the Funds.
Forward Foreign Currency Contracts
The Funds may engage in currency transactions with counterparties to hedge the value of portfolio securities denominated in particular currencies against fluctuations in relative value, to gain or reduce exposure to certain currencies, or to generate income or gains. A forward foreign currency contract is an agreement between two parties to buy and sell a currency at a set price on a future date. During the year ended September 30, 2021, the High Income Fund engaged in forward foreign currency contracts. The contracts are marked-to-market daily and the change in value is recorded by the High Income Fund as an unrealized gain or loss. When a forward foreign currency contract is extinguished, through either delivery or offset by entering into another forward foreign currency contract, the High Income Fund records a realized gain or loss equal to the difference between the value of the contract at the time it was opened and the value of the contract at the time it was extinguished.
| 148 | (888) 848-7569 | www.rivernorth.com |
| RiverNorth Funds | Notes to Financial Statements |
September 30, 2021
Forward foreign currency contracts involve elements of market risk in excess of the amounts reflected in the Statement of Assets and Liabilities. The High Income Fund bears the risk of an unfavorable change in the foreign exchange rate underlying the forward foreign currency contract. Risks may also arise upon entering into these contracts from the potential inability of the counterparties to meet the terms of their contracts.
If required by the forward foreign currency contracts, the High Income Fund has segregated sufficient assets as collateral to satisfy the current obligations with respect to forward foreign currency contracts, and this is reflected as Cash segregated at custodian for forward foreign currency contracts on the High Income Fund’s Statement of Assets and Liabilities.
The effect of derivatives instruments on each Fund's Statement of Assets and Liabilities as of September 30, 2021:
| | | | | Asset Derivatives |
| Fund | | Risk Exposure | | Statement of Assets and Liabilities Location | | Fair Value | |
| High Income Fund | | Foreign exchange rate risk (Forward foreign currency contracts) | | Unrealized appreciation on forward foreign currency contracts | | $ | 184,417 | |
| | | | | Liabilities Derivatives |
| Fund | | Risk Exposure | | Statement of Assets and Liabilities Location | | Fair Value | |
| High Income Fund | | Foreign exchange rate risk (Forward foreign currency contracts) | | Unrealized depreciation on forward foreign currency contracts | | $ | (1,910 | ) |
| Annual Report | September 30, 2021 | 149 |
| RiverNorth Funds | Notes to Financial Statements |
September 30, 2021
The effect of derivatives instruments on each Fund's Statement of Operations for the year ended September 30, 2021:
| Fund | | Risk Exposure | | Statement of Operations Location | | Realized Gain/(Loss) on Derivatives Recognized in Income | | | Change in Unrealized Appreciation/Depreciation on Derivatives Recognized in Income | |
| High Income Fund | | Foreign exchange rate risk (Forward foreign currency contracts) | | Net realized gain/(loss) on Forward Foreign Currency Contracts/ Net change in unrealized appreciation/depreciation on Forward Foreign Currency Contracts | | $ | 57,668 | | | $ | 72,135 | |
The forward currency contracts average notional amount during the year ended September 30, 2021, is noted below.
| Fund | | Average Notional Amount of Forward Foreign Currency Contracts | |
| High Income Fund | | $ | 6,072,944 | |
Offsetting Arrangements: Certain derivative contracts are executed under standardized netting agreements. A derivative netting arrangement creates an enforceable right of set-off that becomes effective, and affects the realization of settlement on individual assets, liabilities and collateral amounts, only following a specified event of default or early termination. Default events may include the failure to make payments or deliver securities timely, material adverse changes in financial condition or insolvency, the breach of minimum regulatory capital requirements, or loss of license, charter or other legal authorization necessary to perform under the contract. These agreements mitigate counterparty credit risk by providing for a single net settlement with a counterparty of all financial transactions covered by the agreement in an event of default as defined under such agreement.
| 150 | (888) 848-7569 | www.rivernorth.com |
| RiverNorth Funds | Notes to Financial Statements |
September 30, 2021
The following table presents derivative financial instruments that are subject to enforceable netting arrangements, collateral arrangements or other similar agreements as of September 30, 2021.
| Offsetting of Derivatives Asset |
| | | | | | | | | | | | Gross Amounts Not Offset in the Statements of Assets and Liabilities | |
| | | Gross Amounts of Recognized Assets | | | Gross Amounts Offset in the Statements of Assets and Liabilities | | | Net Amounts Presented in the Statements of Assets and Liabilities | | | Financial Instruments Available for Offset(a) | | | Cash Collateral Received(a) | | | Net Amount | |
| High Income Fund | | | | | | | | | | | | | | | | | | |
| Forward Foreign Currency Contracts | | $ | 184,417 | | | $ | – | | | $ | 184,417 | | | $ | (1,910 | ) | | $ | – | | | $ | 182,507 | |
| Total | | $ | 184,417 | | | $ | – | | | $ | 184,417 | | | $ | (1,910 | ) | | $ | – | | | $ | 182,507 | |
| Offsetting of Derivatives Liability |
| | | | | | | | | | | | Gross Amounts Not Offset in the Statement of Assets and Liabilities | |
| | | Gross Amounts of Recognized Liabilities | | | Gross Amounts Offset in the Statement of Assets and Liabilities | | | Net Amounts Presented in the Statement of Assets and Liabilities | | | Financial Instruments Available for Offset(a) | | | Cash Collateral Pledged(a) | | | Net Amount | |
| High Income Fund | | | | | | | | | | | | | | | | | | |
| Forward Foreign Currency Contracts | | $ | 1,910 | | | $ | 1,910 | | | $ | (1,910 | ) | | $ | – | | | $ | – | | | | | |
| Total | | $ | 1,910 | | | $ | – | | | $ | 1,910 | | | $ | (1,910 | ) | | $ | – | | | $ | – | |
| (a) | These amounts are limited to the derivatives asset/liability balance and, accordingly, do not include excess collateral received/pledged. |
| Annual Report | September 30, 2021 | 151 |
| RiverNorth Funds | Notes to Financial Statements |
September 30, 2021
5. LOAN PARTICIPATIONS AND ASSIGNMENTS
The Strategic Income Fund and High Income Fund may each invest in direct debt instruments which are interests in amounts owed to lenders or lending syndicates by corporate, governmental, or other borrowers. The Strategic Income Fund and High Income Fund will normally invest in corporate debt issuers in North America and Europe. The Strategic Income Fund’s and High Income Fund’s investments in loans may be in the form of participations in loans or assignments of all or a portion of loans from third parties. A loan is often administered by a bank or other financial institution (the “lender”) that acts as agent for all holders. The agent administers the terms of the loan, as specified in the loan agreement. The Strategic Income Fund and High Income Fund may each invest in multiple series or tranches of a loan, which may have varying terms and carry different associated risks. The Strategic Income Fund and High Income Fund will generally purchase assignments of these loans, in which case they will typically become lenders for purposes of the relevant loan agreement with direct contractual rights against the borrower, including the right to receive payments of principal and interest. When purchasing participation interests in a loan, the Strategic Income Fund and High Income Fund generally have no right to enforce compliance with the terms of the loan agreement with the borrower. As a result, the Strategic Income Fund and High Income Fund may each be subject to the credit risk of both the borrower and the lender that is selling the loan agreement. The Strategic Income Fund and High Income Fund may each enter into unfunded loan commitments, which are contractual obligations for future funding. Unfunded loan commitments represent a future obligation in full, even though a percentage of the notional loan amounts may not be utilized by the borrower. When investing in a loan participation, the Strategic Income Fund and High Income Fund have the right to receive payments of principal, interest and any fees to which they are entitled only from the lender selling the loan agreement and only upon receipt of payments by the lender from the borrower. The Strategic Income Fund and High Income Fund may each receive a commitment fee based on the undrawn portion of the underlying line of credit portion of a floating rate loan. In certain circumstances, the Strategic Income Fund and High Income Fund may each receive a penalty fee upon the prepayment of a floating rate loan by a borrower. Fees earned are recorded as a component of interest income or interest expense, respectively, on the Statements of Operations. At September 30, 2021, the Strategic Income Fund and High Income Fund had $2,689,384 and $952,883 respectively, in unsettled domestic and foreign loan commitments.
6. ADVISORY FEES, TRUSTEE FEES AND OTHER AGREEMENTS
The Adviser serves as the investment adviser to the Funds. Under the terms of the management agreement (the “Agreement”), the Adviser, subject to the supervision of the Board, provides or arranges to be provided to the Funds such investment advice as it deems advisable and will furnish or arrange to be furnished a continuous investment program for the Funds consistent with the Funds’ investment objectives and policies. As compensation for its management services, the Funds are obligated to pay the Adviser a fee computed and accrued daily and paid monthly in arrears at an annual rate of the average daily net assets of the Funds.
| 152 | (888) 848-7569 | www.rivernorth.com |
| RiverNorth Funds | Notes to Financial Statements |
September 30, 2021
The following table reflects the Funds’ contractual management fee rates (expressed as an annual rate).
| Fund | Contractual Management Fee |
| Core Opportunity Fund | 1.00% |
| Strategic Income Fund | 0.75% |
| High Income Fund | 1.00% |
The Adviser has contractually agreed to waive the High Income Fund’s management fees and/or reimburse expenses (excluding brokerage fees and commissions; borrowing costs such as (a) interest and (b) dividends on securities sold short; taxes; indirect expenses incurred by the underlying funds in which the Fund invests; and extraordinary expenses) of the High Income Fund until at least January 31, 2022 in order to maintain the Total Annual Fund Operating Expenses After Fee Deferral and/or Reimbursement at 1.60% and 1.35% for the Class R shares and Class I shares, respectively. This agreement may be terminated by the Board on 60 days’ written notice to the Adviser. Any waiver or reimbursement is subject to repayment by the High Income Fund within three years following the fiscal year in which the expenses occurred if the Fund is able to make the repayment without exceeding its current expense limitation and the repayment is approved by the Board. The recoupment period is limited to three years from the time the expenses were waived or incurred, and such recoupment is limited to the lesser of (i) the expense cap in effect at the time of the waiver, and (ii) the expense cap in effect at the time of recapture.
For the year ended September 30, 2021, reimbursed expenses for the High Income Fund subject to potential recovery by year of expiration are as follows:
| | | Expiring September 30, | |
| | | 2022 | | | 2023 | | | 2024 | |
| High Income Fund | | | | | | | | | |
| Class I | | $ | 104,992 | | | $ | 145,507 | | | $ | 163,274 | |
| Class R | | $ | 13,864 | | | $ | 19,074 | | | $ | 19,154 | |
| Total | | $ | 111,856 | | | $ | 164,581 | | | $ | 182,428 | |
For the year ended September 30, 2021, the Adviser voluntarily waived $184,645 in affiliated management fees attributable to the Strategic Income Fund related to the Fund's investment in an affiliate fund, the High Income Fund. The Investment Adviser Fee disclosed on the Strategic Income Fund's Statement of Operations is reflective of this waiver of affiliated management fees.
DoubleLine is the investment sub-adviser to the Strategic Income Fund. Oaktree Capital is the investment sub-adviser to the High Income Fund. Under the terms of the sub-advisory agreements, the Sub-Advisers, subject to the supervision of the Adviser and the Board of Trustees, provide to the Strategic Income Fund and the High Income Fund such investment advice as deemed advisable and will furnish a continuous investment program for the portion of assets managed in the respective Fund consistent with the respective Fund's investment objective and policies. As compensation for its sub-advisory services, the Adviser, out of its own fee, is obligated to pay each Sub-Adviser a fee computed and accrued daily and paid monthly in arrears based on an annual rate of the average daily net assets of the Strategic Income Fund and the High Income Fund.
| Annual Report | September 30, 2021 | 153 |
| RiverNorth Funds | Notes to Financial Statements |
September 30, 2021
ALPS Fund Services, Inc. (“ALPS”) provides the Funds with fund administration and fund accounting services. ALPS also serves as transfer agent, dividend paying and shareholder servicing agent for the Funds (“Transfer Agent”). ALPS receives an annual fee based on the Funds' average daily net assets, subject to certain minimums.
State Street Bank & Trust, Co. serves as the Funds’ custodian.
The Funds have adopted a plan pursuant to Rule 12b-1 under the 1940 Act (the “Plan”). The Plan permits the Funds to pay the Adviser for distribution and promotion expenses related to marketing shares of the Funds. The amount payable annually by the Class R shares of the Core Opportunity Fund, the Class R Shares of the Strategic Income Fund, and the Class R Shares of the High Income Fund is 0.25% of the average daily net assets. The expenses of the Funds’ Plan are reflected as 12b-1 fees in the Statements of Operations.
The Funds have entered into a Distribution Agreement with ALPS Distributors, Inc., an affiliate of ALPS, to provide distribution services to the Funds. The Distributor serves as underwriter/distributor of shares of the Funds.
Trustees who are “interested persons” of the Trust receive no salary or fees from the Trust. Each Trustee who is not an “interested person” receives a fee of $36,000 per year, plus $1,500 per meeting attended from the Trust. In addition, the chair of the audit committee receives $1,000 annually and the lead independent Trustee receives $250 annually. The Trust reimburses each Trustee and Officer for his or her travel and other expenses relating to attendance at such meetings. A Trustee and certain Officers of the Trust are also employees of the Adviser, the Distributor or ALPS.
The Trust's officers receive no compensation directly from the Trust for performing the duties of their offices. The Trust's Chief Compliance Officer (“CCO”) provides compliance services to the Trust and is also an employee and CCO of the Adviser. The CCO receives compensation directly from the Adviser for his compliance services. The Trust reimburses the Adviser for certain compliance costs related to the Funds, inclusive of a portion of the CCO's compensation. The expenses of the CCO are reflected as Compliance expenses in the Statements of Operations.
7. TAX BASIS INFORMATION
Tax Basis of Distributions to Shareholders: The character of distributions made during the year from net investment income or net realized gains may differ from its ultimate characterization for federal income tax purposes. Also, due to the timing of dividend distributions, the fiscal year in which amounts are distributed may differ from the fiscal year in which the income or realized gain were recorded by a Fund.
| 154 | (888) 848-7569 | www.rivernorth.com |
| RiverNorth Funds | Notes to Financial Statements |
September 30, 2021
The tax character of distributions paid by the Funds during the fiscal year ended September 30, 2021, was as follows:
| | | | Ordinary Income | | | Tax-Exempt Income | | | Distributions paid from Long-Term Capital Gain | | | Return of Capital | | | Total | |
| Core Opportunity Fund | | | $ | 3,460,956 | | | $ | 45,613 | | | | $1,274,405 | | | $ | – | | | $ | 4,780,974 | |
| Strategic Income Fund | | | | 78,654,006 | | | | – | | | | – | | | | – | | | | 78,654,006 | |
| High Income Fund | | | | 1,582,824 | | | | – | | | | – | | | | – | | | | 1,582,824 | |
The tax character of distributions paid by the Funds during the fiscal year ended September 30, 2020, was as follows:
| | | | Ordinary Income | | | Tax-Exempt Income | | | Distributions paid from Long-Term Capital Gain | | | Return of Capital | | | Total | |
| Core Opportunity Fund | | | $ | 2,155,943 | | | $ | 77,500 | | | $ | 1,952,953 | | | $ | – | | | $ | 4,186,396 | |
| Strategic Income Fund | | | | 85,578,969 | | | | – | | | | – | | | | 2,921,016 | | | | 88,499,985 | |
| High Income Fund | | | | 1,924,221 | | | | – | | | | – | | | | 407,514 | | | | 2,331,735 | |
Components of Distributable Earnings on a Tax Basis: The tax components of distributable earnings are determined in accordance with income tax regulations which may differ from the composition of net assets reported under GAAP. Accordingly, for the year ended September 30, 2021, certain differences were reclassified. The amounts reclassified did not affect net assets. The reclassifications were as follows:
| | | | Paid-in Capital | | | Total Distributable Earnings | |
| Core Opportunity Fund | | | $ | – | | | $ | – | |
| Strategic Income Fund | | | | (2,749,698 | ) | | | 2,749,698 | |
| High Income Fund | | | | (43,909 | ) | | | 43,909 | |
At September 30, 2021, the components of distributable earnings on a tax basis for the Funds were as follows:
| | | | Undistributed Ordinary Income | | | Accumulated Capital Gains/(Losses) | | | Net Unrealized Appreciation/ (Depreciation) | | | Other Cumulative Effect of Timing Differences | | | Total | |
| Core Opportunity Fund | | | $ | 10,251,418 | | | $ | 3,563,128 | | | $ | 2,520,118 | | | $ | – | | | $ | 16,334,664 | |
| Strategic Income Fund | | | | 624,894 | | | | (8,091,303 | ) | | | (69,636,675 | ) | | | – | | | | (77,103,084 | ) |
| High Income Fund | | | | 32,455 | | | | (5,093,054 | ) | | | 612,013 | | | | (182,507 | ) | | | (4,631,093 | ) |
| Annual Report | September 30, 2021 | 155 |
| RiverNorth Funds | Notes to Financial Statements |
September 30, 2021
Capital Losses: As of September 30, 2021, the following Funds had capital loss carryforwards which may reduce the applicable Fund’s taxable income arising from future net realized gains on investments, if any, to the extent permitted by the Code and thus may reduce the amount of the distributions to shareholders which would otherwise be necessary to relieve the Funds of any liability for federal tax pursuant to the Code. The capital loss carryforwards may be carried forward indefinitely.
Capital losses carried forward were as follows:
| Fund | | | Non-Expiring Short-Term | | | Non-Expiring Long-Term | |
| Strategic Income Fund | | | $ | – | | | $ | 8,091,303 | |
| High Income Fund | | | | 1,116,297 | | | | 3,976,757 | |
The Strategic Income Fund used capital loss carryovers during year ended September 30, 2021 in the amount of $38,607,801.
Unrealized Appreciation and Depreciation on Investments: The amount of net unrealized appreciation/(depreciation) and the cost of investment securities for tax purposes, including short-term securities at September 30, 2021, were as follows:
| Fund | | | Gross Appreciation (excess of value over tax) | | | Gross Depreciation (excess of tax cost over value) | | | Net Appreciation on Foreign Currency and Derivatives | | | Net Unrealized Appreciation/ (Depreciation) | | | Cost of Investments for Income Tax Purposes | |
| Core Opportunity Fund* | | | $ | 3,788,121 | | | $ | (1,268,003 | ) | | $ | – | | | $ | 2,520,118 | | | $ | 77,745,831 | |
| Strategic Income Fund* | | | | 61,511,350 | | | | (131,148,025 | ) | | | – | | | | (69,636,675 | ) | | | 2,113,021,691 | |
| High Income Fund* | | | | 932,464 | | | | (503,042 | ) | | | 182,591 | | | | 612,013 | | | | 46,419,624 | |
| * | The difference between book and tax basis unrealized appreciation/(depreciation) for the Funds is attributable primarily to passive foreign investment companies, wash sales, forward contract mark to market, and tax treatment of certain other investments. |
8. INVESTMENT TRANSACTIONS
Investment transactions for the year ended September 30, 2021, excluding U.S. government obligations and short-term investments, were as follows:
| Fund | | | Purchases of Securities | | | Proceeds from Sales of Securities | |
| Core Opportunity Fund | | | $ | 123,791,550 | | | $ | 141,226,732 | |
| Strategic Income Fund | | | | 853,907,593 | | | | 854,933,009 | |
| High Income Fund | | | | 32,802,589 | | | | 35,599,042 | |
| 156 | (888) 848-7569 | www.rivernorth.com |
| RiverNorth Funds | Notes to Financial Statements |
September 30, 2021
Investment transactions in long term U.S. Government Obligations for the year ended September 30, 2021 were as follows:
| | | | Purchases of Securities | | | Proceeds from Sales of Securities | |
| Core Opportunity Fund | | | $ | 1,196,906 | | | $ | 1,316,388 | |
| Strategic Income Fund | | | | 892,566,670 | | | | 781,972,510 | |
9. INVESTMENTS IN AFFILIATED COMPANIES
The Funds may invest in certain securities that are considered securities issued by affiliated companies. As defined by the 1940 Act, an affiliated person, including an affiliated company, is one in which a Fund owns 5% or more of the outstanding voting securities, or a company which is under common ownership or control with the Fund. The purchases, sales, dividend income, capital gains, shares and value of investment in affiliated companies for the year ended September 30, 2021 were as follows:
Strategic Income Fund
| Security Name | | Value as of September 30, 2020 | | | Purchases | | | Sales | | | Realized Gain/Loss | | | Change in Unrealized Gain (Loss) | | | Value as of September 30, 2021 | | | Share Balance as of September 30, 2021 | | | Distributions | |
| Controlled Investments: | | | | | | | | | | | | | | | | | | | | | | | | | | | | | | | | |
| RiverNorth/Oaktree High Income Fund | | $ | 30,155,295 | | | $ | 1,584,533 | | | $ | – | | | $ | – | | | $ | 994,332 | | | $ | 32,734,160 | | | | 3,435,936 | | | $ | 1,109,286 | |
| | | $ | 30,155,295 | | | $ | 1,584,533 | | | $ | – | | | $ | – | | | $ | 994,332 | | | $ | 32,734,160 | | | | 3,435,936 | | | $ | 1,109,286 | |
10. REVOLVING LINE OF CREDIT
On April 8, 2014, the Funds entered into a $100,000,000 committed, unsecured Revolving Credit Agreement with State Street Bank & Trust, Co. The Revolving Credit Agreement was amended on April 17, 2015, April 5, 2016, April 4, 2017, April 3, 2018, April 2, 2019, March 31, 2020 and on March 30, 2021. The Revolving Credit Agreement expires on March 29, 2022. Borrowings under this arrangement bear interest at the higher of the Federal Funds Rate and the One-Month LIBOR Rate in effect on the day the loan is made plus 1.25%, which was 1.33% at September 30, 2021. For the year ended September 30, 2021, the Funds paid a facility fee on unloaned balances equal to the product of $100,000,000 less the principal amount of loans outstanding and 0.25%.
| Annual Report | September 30, 2021 | 157 |
| RiverNorth Funds | Notes to Financial Statements |
September 30, 2021
For the year ended September 30, 2021, Core Opportunity Fund and Strategic Income Fund had no borrowings under the Revolving Credit Agreement. High Income Fund's borrowings were as follows:
| | Dates of Borrowing | Maximum Borrowing Amount | Average Loan Balance Outstanding | Average Interest Rate |
| High Income Fund | March 29, 2021-
April 22, 2021 | $1,000,000 | $1,000,000 | 1.417% |
11. BENEFICIAL OWNERSHIP
On September 30, 2021, there were an unlimited number of no par value shares of beneficial interest authorized for each Fund. Transactions in shares of beneficial interest are shown in the Statements of Changes in Net Assets.
The beneficial ownership, either directly or indirectly, of more than 25% of the voting securities of a fund creates a presumption of control of the fund, under Section 2(a)(9) of the 1940 Act. Beneficial owners owning more than 25% of the voting securities for the benefit of their customers of each class of each Fund, as of September 30, 2021, are listed below:
| Fund | Shareholder Name | Percentage Interest |
| Core Opportunity Fund – Class I | Pershing | 30.40% |
| Core Opportunity Fund – Class I | UBS Financial Services, Inc. | 26.23% |
| Core Opportunity Fund – Class R | Charles Schwab & Company, Inc. | 35.88% |
| Core Opportunity Fund – Class R | National Financial Services, LLC | 27.23% |
| Strategic Income Fund – Class I | Charles Schwab & Company, Inc. | 44.11% |
| Strategic Income Fund – Class R | Charles Schwab & Company, Inc. | 46.17% |
| Strategic Income Fund – Class R | TD Ameritrade, Inc. | 27.18% |
| High Income Fund – Class I | RiverNorth/DoubleLine Strategic Income Fund | 79.10% |
| High Income Fund – Class R | Charles Schwab & Company, Inc. | 66.12% |
12. RELATED PARTY TRANSACTIONS
The Strategic Income Fund engaged in cross trades with other affiliated funds during the year ended September 30, 2021 pursuant to Rule 17a-7 under the 1940 Act. Generally, cross trading is the buying or selling of portfolio securities between funds to which the Adviser or Sub-Adviser serves as the investment adviser or sub-adviser. The Board previously adopted procedures that apply to transactions between the Fund and its affiliates pursuant to Rule 17a-7. At its regularly scheduled meetings, the Board reviews such transactions as of the most current calendar quarter for compliance with the requirements set forth by Rule 17a-7 and each Fund’s procedures. The procedures require that the transactions be a purchase or sale for no consideration other than cash payment against prompt delivery of a security for which market quotations are readily available, and be consistent with the investment policies of a Fund. During the year ended September 30, 2021, the Strategic Income Fund purchased securities of affiliated funds in the amount of $11,084,244.
| 158 | (888) 848-7569 | www.rivernorth.com |
| RiverNorth Funds | Notes to Financial Statements |
September 30, 2021
13. INDEMNIFICATIONS
Under the Trust’s organizational documents, its officers and Trustees are indemnified against certain liability arising out of the performance of their duties to the Trust. Additionally, in the normal course of business, the Trust enters into contracts with service providers that may contain general indemnification clauses. The Trust’s maximum exposure under these arrangements is unknown, as this would involve future claims that may be made against the Trust that have not yet occurred.
14. LIBOR TRANSITION
Certain of the Funds’ investments, payment obligations and financing terms may be based on floating rates, such as LIBOR, Euro Interbank Offered Rate and other similar types of reference rates (each, a “Reference Rate”). In July of 2017, the head of the UK Financial Conduct Authority (“FCA”) announced a desire to phase out the use of LIBOR by the end of 2021. The FCA and ICE Benchmark Administrator have since announced that most LIBOR settings will no longer be published after December 31, 2021 and a majority of U.S. dollar LIBOR settings will cease publication after June 30, 2023. It is possible that a subset of LIBOR settings will be published after these dates on a “synthetic” basis, but any such publications would be considered non-representative of the underlying market. The U.S. Federal Reserve, based on the recommendations of the New York Federal Reserve’s Alternative Reference Rate Committee (comprised of major derivative market participants and their regulators), has begun publishing Secured Overnight Financing Rate Data (“SOFR”) that is intended to replace U.S. dollar LIBOR. Proposals for alternative reference rates for other currencies have also been announced or have already begun publication. Markets are slowly developing in response to these new reference rates. Uncertainty related to the liquidity impact of the change in rates, and how to appropriately adjust these rates at the time of transition, poses risks for the Underlying Funds and Funds. The effect of any changes to, or discontinuation of, LIBOR on the Underlying Funds and Funds will depend on, among other things, (1) existing fallback or termination provisions in individual contracts, and (2) whether, how, and when industry participants develop and adopt new reference rates and fallbacks for both legacy and new instruments and contracts. The expected discontinuation of LIBOR could have a significant impact on the financial markets in general and may also present heightened risk to market participants, including public companies, investment advisers, investment companies, and broker-dealers. The risks associated with this discontinuation and transition will be exacerbated if the work necessary to effect an orderly transition to an alternative reference rate is not completed in a timely manner. For example, current information technology systems may be unable to accommodate new instruments and rates with features that differ from LIBOR. Accordingly, it is difficult to predict the full impact of the transition away from LIBOR on the Underlying Funds and Funds until new reference rates and fallbacks for both legacy and new instruments and contracts are commercially accepted and market practices become settled.
The transition process might lead to increased volatility and illiquidity in markets for instruments whose terms currently include LIBOR. It could also lead to a reduction in the value of some LIBORbased investments. Since the usefulness of LIBOR as a benchmark could deteriorate during the transition period, these effects could occur prior to the completion of the transition. All of the aforementioned may adversely affect the Funds' performance or NAV.
| Annual Report | September 30, 2021 | 159 |
| RiverNorth Funds | Notes to Financial Statements |
September 30, 2021
15. CORONAVIRUS (COVID-19) PANDEMIC
An outbreak of respiratory disease caused by a novel coronavirus was first detected in December 2019 and has spread internationally. The outbreak and efforts to contain its spread have resulted in closing borders and quarantines, restricting international and domestic travel, enhanced health screenings, cancellations, disrupted supply chains and customer activity, responses by businesses (including changes to operations and reducing staff), and have produced general concern and uncertainty. The impact of the coronavirus pandemic, and other epidemics and pandemics that may arise in the future could adversely affect national and global economies, individual companies and the market in general in a manner and for a period of time that cannot be foreseen at the present time and may adversely affect the value, volatility and liquidity of dividend and interest paying securities. Although vaccines for COVID-19 are becoming more widely available, it is unknown how long circumstances related to the pandemic will persist, whether they will reoccur in the future, whether efforts to support the economy and financial markets will be successful, and what additional implications may follow from the pandemic. The impact of these events and other epidemics or pandemics in the future could adversely affect Fund performance. In the event of a pandemic or an outbreak, there can be no assurance that the Funds and their service providers will be able to maintain normal business operations for an extended period of time or will not lose the services of key personnel on a temporary or long-term basis due to illness or other reasons, and could otherwise disrupt the ability of the Funds’ service providers to perform essential services. Certain economic and market conditions arising out of a pandemic or outbreak could result in the Funds’ inability to achieve their investment objectives, cause the postponement of reconstitution or rebalance dates for benchmark indices, adversely affect the prices and liquidity of the securities and other instruments in which the Funds invest, negatively impact the Funds’ performance, and cause losses on your investment in the Funds. Management is monitoring the development of the pandemic, which was ongoing as of the date of the financial statements, and is evaluating its impact on the financial position and operating results of the Funds.
16. SUBSEQUENT EVENTS
The trust has performed an evaluation of subsequent events through the date the financial statements were issued and has determined that no additional items require recognition or disclosure.
| 160 | (888) 848-7569 | www.rivernorth.com |
RiverNorth Funds | Report of Independent Registered Public Accounting Firm |
September 30, 2021
To the Shareholders and Board of Trustees of
RiverNorth Funds
Opinion on the Financial Statements
We have audited the accompanying statements of assets and liabilities, including the schedules of investments, of RiverNorth Funds, comprising RiverNorth Core Opportunity Fund, RiverNorth/DoubleLine Strategic Income Fund, and RiverNorth/Oaktree High Income Fund (the “Funds”) as of September 30, 2021, the related statements of operations for the year then ended, the statements of changes in net assets for each of the two years in the period then ended, the related notes, and the financial highlights for each of the five years in the period then ended (collectively referred to as the “financial statements”). In our opinion, the financial statements present fairly, in all material respects, the financial position of each of the Funds as of September 30, 2021, the results of their operations for the year then ended, the changes in net assets for each of the two years in the period then ended, and the financial highlights for each of the five years in the period then ended, in conformity with accounting principles generally accepted in the United States of America.
Basis for Opinion
These financial statements are the responsibility of the Funds’ management. Our responsibility is to express an opinion on the Funds’ financial statements based on our audits. We are a public accounting firm registered with the Public Company Accounting Oversight Board (United States) (“PCAOB”) and are required to be independent with respect to the Funds in accordance with the U.S. federal securities laws and the applicable rules and regulations of the Securities and Exchange Commission and the PCAOB.
We conducted our audits in accordance with the standards of the PCAOB. Those standards require that we plan and perform the audit to obtain reasonable assurance about whether the financial statements are free of material misstatement whether due to error or fraud.
Our audits included performing procedures to assess the risks of material misstatement of the financial statements, whether due to error or fraud, and performing procedures that respond to those risks. Such procedures included examining, on a test basis, evidence regarding the amounts and disclosures in the financial statements. Our procedures included confirmation of securities owned as of September 30, 2021, by correspondence with the custodian, agent banks, and brokers; when replies were not received from agent banks or brokers, we performed other auditing procedures. Our audits also included evaluating the accounting principles used and significant estimates made by management, as well as evaluating the overall presentation of the financial statements. We believe that our audits provide a reasonable basis for our opinion.
We have served as the auditor of one or more of RiverNorth Capital Management, LLC’s investment companies since 2006.

COHEN & COMPANY, LTD.
Cleveland, Ohio
November 29, 2021
Annual Report | September 30, 2021 | 161 |
RiverNorth Funds | Additional Information |
September 30, 2021 (Unaudited)
PROXY VOTING GUIDELINES
A description of the policies and procedures that the Funds used to determine how to vote proxies relating to portfolio securities and information regarding how the Funds voted proxies during the most recent 12-month period ended June 30, are available without charge upon request by (1) calling the Funds at (888) 848-7569 and (2) from Form N-PX filed by the Funds with the Securities and Exchange Commission (“SEC”) on the SEC’s website at www.sec.gov.
PORTFOLIO HOLDINGS DISCLOSURE POLICY
The Funds file a complete schedule of investments with the SEC for the first and third quarter of each fiscal year on Part F of N-PORT. The Funds’ first and third fiscal quarters end on December 31 and June 30. The Form N-PORT must be made within 60 days of the end of the quarter. The Funds’ Form N-PORT is available on the SEC’s website at www.sec.gov. You may also obtain copies by calling the Funds at 1-888-848-7569 or on the Funds’ website, www.rivernorth.com.
UNAUDITED TAX INFORMATION
The RiverNorth Core Opportunity Fund designated the following for federal income tax purposes for the year ended September 30, 2021:
| Foreign Taxes
Paid | Foreign Source
Income | Tax-Exempt
Percentage |
RiverNorth Core Opportunity Fund | $54,461 | $4,108,118 | 1.66% |
Of the distributions paid by the Funds from ordinary income for the calendar year ended December 31, 2020, the following percentages met the requirements to be treated as qualifying for the corporate dividends received deduction and qualified dividend income:
| Dividend Received
Deduction | Qualified Dividend
Income |
RiverNorth Core Opportunity Fund | 11.69% | 38.88% |
In early 2021, if applicable, shareholders of record received this information for the distributions paid to them by the Funds during the calendar year 2020 via Form 1099. The Funds will notify shareholders in early 2022 of amounts paid to them by the Funds, if any, during the calendar year 2021.
Pursuant to Section 852(b)(3) of the Internal Revenue Code, the RiverNorth Core Opportunity Fund designated $1,274,405 as long-term capital gain dividends.
162 | (888) 848-7569 | www.rivernorth.com |
RiverNorth Funds | Additional Information |
September 30, 2021 (Unaudited)
STOCKHOLDER MEETING RESULTS
On September 16, 2021, the Trust held a Special Meeting of Shareholders to consider the proposals set forth below. The following votes were recorded:
Proposal 1: The election or re-election of five (5) Trustees of the Trust to indefinite terms.
Election of Patrick W. Galley as a Trustee of the Trust to an indefinite term to last for the lifetime of the Trust or until he sooner dies, resigns, retires or is removed.
RiverNorth Core Opportunity Fund | Shares Voted | % of Shares Voted |
For | 5,177,862 | 72.75% |
Withheld | 1,939,149 | 27.25% |
Total | 7,117,011 | 100.00% |
RiverNorth/DoubleLine Strategic Income Fund | Shares Voted | % of Shares Voted |
For | 5,177,862 | 72.75% |
Withheld | 1,939,149 | 27.25% |
Total | 7,117,011 | 100.00% |
RiverNorth/Oaktree High Income Fund | Shares Voted | % of Shares Voted |
For | 3,871,889 | 95.60% |
Withheld | 178,018 | 4.40% |
Total | 4,049,907 | 100.00% |
Election of John K. Carter as a Trustee of the Trust to an indefinite term to last for the lifetime of the Trust or until he sooner dies, resigns, retires or is removed.
RiverNorth Core Opportunity Fund | Shares Voted | % of Shares Voted |
For | 7,066,895 | 99.30% |
Withheld | 50,116 | 0.70% |
Total | 7,117,011 | 100.00% |
RiverNorth/DoubleLine Strategic Income Fund | Shares Voted | % of Shares Voted |
For | 7,066,895 | 99.30% |
Withheld | 50,116 | 0.70% |
Total | 7,117,011 | 100.00% |
RiverNorth/Oaktree High Income Fund | Shares Voted | % of Shares Voted |
For | 4,037,863 | 99.70 |
Withheld | 12,044 | 0.30% |
Total | 4,049,907 | 100.00% |
Annual Report | September 30, 2021 | 163 |
RiverNorth Funds | Additional Information |
September 30, 2021 (Unaudited)
Election of John S. Oakes as a Trustee of the Trust to an indefinite term to last for the lifetime of the Trust or until he sooner dies, resigns, retires or is removed.
RiverNorth Core Opportunity Fund | Shares Voted | % of Shares Voted |
For | 7,063,442 | 99.25% |
Withheld | 53,569 | 0.75% |
Total | 7,117,011 | 100.00% |
RiverNorth/DoubleLine Strategic Income Fund | Shares Voted | % of Shares Voted |
For | 7,063,442 | 99.25% |
Withheld | 53,569 | 0.75% |
Total | 7,117,011 | 100.00% |
RiverNorth/Oaktree High Income Fund | Shares Voted | % of Shares Voted |
For | 4,037,863 | 99.70% |
Withheld | 12,044 | 0.30% |
Total | 4,049,907 | 100.00% |
Election of David M. Swanson as a Trustee of the Trust to an indefinite term to last for the lifetime of the Trust or until he sooner dies, resigns, retires or is removed.
RiverNorth Core Opportunity Fund | Shares Voted | % of Shares Voted |
For | 7,066,895 | 99.30% |
Withheld | 50,116 | 0.70% |
Total | 7,117,011 | 100.00% |
RiverNorth/DoubleLine Strategic Income Fund | Shares Voted | % of Shares Voted |
For | 7,066,895 | 99.30% |
Withheld | 50,116 | 0.70% |
Total | 7,117,011 | 100.00% |
RiverNorth/Oaktree High Income Fund | Shares Voted | % of Shares Voted |
For | 4,037,863 | 99.70% |
Withheld | 12,044 | 0.30% |
Total | 4,049,907 | 100.00% |
164 | (888) 848-7569 | www.rivernorth.com |
RiverNorth Funds | Additional Information |
September 30, 2021 (Unaudited)
Election of J. Wayne Hutchens as a Trustee of the Trust to an indefinite term to last for the lifetime of the Trust or until he sooner dies, resigns, retires or is removed.
RiverNorth Core Opportunity Fund | Shares Voted | % of Shares Voted |
For | 7,066,895 | 99.30% |
Withheld | 50,116 | 0.70% |
Total | 7,117,011 | 100.00% |
RiverNorth/DoubleLine Strategic Income Fund | Shares Voted | % of Shares Voted |
For | 7,066,895 | 99.30% |
Withheld | 50,116 | 0.70% |
Total | 7,117,011 | 100.00% |
RiverNorth/Oaktree High Income Fund | Shares Voted | % of Shares Voted |
For | 4,037,863 | 99.70% |
Withheld | 12,044 | 0.30% |
Total | 4,049,907 | 100.00% |
Annual Report | September 30, 2021 | 165 |
RiverNorth Funds | Liquidity Risk Management Program |
September 30, 2021 (Unaudited)
The Funds have implemented a liquidity risk management program (the “LRM Program”) as required by Rule 22e-4 under the Investment Company Act of 1940, as amended. The LRM Program’s principal objectives include assessing, managing, and periodically reviewing each Fund’s liquidity risk. Liquidity risk is defined as the risk that a Fund could not meet shareholder redemption requests without significant dilution of remaining shareholders’ interests in the Fund.
In accordance with the requirements of Rule 22e-4, the program administrator conducted an annual review of the LRM Program and, in August 2021, provided the Board of Trustees (the “Board”) with a report addressing the operation of the LRM Program and assessing its adequacy and effectiveness of implementation for the first year of operation. Among other things, the program administrator reported to the Board as to the following:
| ● | each Fund had sufficient liquidity to both meet redemptions and operate effectively on behalf of their respective shareholders; |
| ● | there were no material changes to the LRM Program during the period; |
| ● | each Fund’s strategy continued to be effective for an open-end mutual fund; |
| ● | the implementation of the LRM Program was effective to manage each Fund’s liquidity risk and remains reasonably designed to manage each Fund’s liquidity risk; |
| ● | the LRM Program includes provisions reasonably designed to comply with the 15% limit on illiquid investments and for determining, periodically reviewing and complying with the highly liquid investment minimum requirements; and |
| ● | the LRM Program operated adequately during the period and was effective in assessing, monitoring and managing the liquidity risk of each Fund’s portfolio. |
There can be no assurance that the LRM Program will achieve its objectives in the future. Please refer to the Funds’ prospectuses for more information regarding the Funds’ exposure to liquidity risk and other principal risks to which an investment in the Funds may be subject.
166 | (888) 848-7569 | www.rivernorth.com |
RiverNorth Funds | Trustees and Officers |
September 30, 2021 (Unaudited)
The following table provides information regarding each Trustee who is not an “interested person” of the Fund, as defined in the 1940 Act.
INDEPENDENT TRUSTEES
Name, Address1
and Year of
Birth | Position(s)
Held with
the Fund | Term of
Office/Length
of Time
Served | Principal
Occupation(s) During
Past 5 Years | Number of
Portfolios
in Fund
Complex
Overseen by
Trustee2 | Other
Directorships
Held by Trustee
During the Past
5 Years |
John K. Carter
Y.O.B. 1961 | Trustee | Indefinite/ January 2013 to present | Partner, Law Office of John K. Carter, P.A. dba Carter Reymann Law, P.A. (a general practice and corporate law firm) (2015 to present); Managing Partner, Global Recruiters of St. Petersburg (a financial services consulting and recruiting firm) (2012 to 2015). | 10 | RiverNorth Opportunities Fund, Inc. (one fund), RiverNorth/ DoubleLine Strategic Opportunity Fund, Inc. (one fund), RiverNorth Opportunistic Municipal Income Fund, Inc. (one fund), RiverNorth Managed Duration Municipal Income Fund, Inc. (one fund), RiverNorth Specialty Finance Corporation (one fund), RiverNorth Flexible Municipal Income Fund, Inc. (one fund), RiverNorth Flexible Municipal Income Fund II, Inc. (one fund), and Carillon Series Trust (11 funds). |
Annual Report | September 30, 2021 | 167 |
RiverNorth Funds | Trustees and Officers |
September 30, 2021 (Unaudited)
INDEPENDENT TRUSTEES
Name, Address1
and Year of
Birth | Position(s)
Held with
the Fund | Term of
Office/Length
of Time
Served | Principal
Occupation(s) During
Past 5 Years | Number of
Portfolios
in Fund
Complex
Overseen by
Trustee2 | Other
Directorships
Held by Trustee
During the Past
5 Years |
J. Wayne Hutchens Y.O.B. 1944 | Trustee | Indefinite/ September 2021 to present | Currently retired; Trustee of the Denver Museum of Nature and Science (2000 to 2020); Director of AMG National Trust Bank (2012 to present); Trustee of Children’s Hospital Colorado (2012 to 2020). | 10 | RiverNorth Opportunities Fund, Inc. (one fund), RiverNorth/ DoubleLine Strategic Opportunity Fund, Inc. (one fund), RiverNorth Opportunistic Municipal Income Fund, Inc. (one fund), RiverNorth Managed Duration Municipal Income Fund, Inc. (one fund), RiverNorth Specialty Finance Corporation (one fund), RiverNorth Flexible Municipal Income Fund, Inc. (one fund), RiverNorth Flexible Municipal Income Fund II, Inc. (one fund), and ALPS Series Trust (11 funds). |
168 | (888) 848-7569 | www.rivernorth.com |
RiverNorth Funds | Trustees and Officers |
September 30, 2021 (Unaudited)
INDEPENDENT TRUSTEES
Name, Address1
and Year of
Birth | Position(s)
Held with
the Fund | Term of
Office/Length
of Time
Served | Principal
Occupation(s) During
Past 5 Years | Number of
Portfolios
in Fund
Complex
Overseen by
Trustee2 | Other
Directorships
Held by Trustee
During the Past
5 Years |
John S. Oakes Y.O.B. 1943 | Trustee; Lead Independent Trustee | Indefinite/ December 2010 to present | Currently retired; Principal, Financial Search and Consulting (a recruiting and consulting firm) (2013 to 2017). | 10 | RiverNorth Opportunities Fund, Inc. (one fund), RiverNorth/ DoubleLine Strategic Opportunity Fund, Inc. (one fund), RiverNorth Opportunistic Municipal Income Fund, Inc. (one fund), RiverNorth Managed Duration Municipal Income Fund, Inc. (one fund), RiverNorth Specialty Finance Corporation (one fund), RiverNorth Flexible Municipal Income Fund, Inc. (one fund), and RiverNorth Flexible Municipal Income Fund II, Inc. (one fund). |
Annual Report | September 30, 2021 | 169 |
RiverNorth Funds | Trustees and Officers |
September 30, 2021 (Unaudited)
INDEPENDENT TRUSTEES
Name, Address1
and Year of
Birth | Position(s)
Held with
the Fund | Term of
Office/Length
of Time
Served | Principal
Occupation(s) During
Past 5 Years | Number of
Portfolios
in Fund
Complex
Overseen by
Trustee2 | Other
Directorships
Held by Trustee
During the Past
5 Years |
David M. Swanson Y.O.B. 1957 | Trustee | Indefinite/ November 2018 to present | Founder & Managing Partner, SwanDog Strategic Marketing (2006 to present). | 9 | RiverNorth Opportunities Fund, Inc. (one fund), RiverNorth/ DoubleLine Strategic Opportunity Fund, Inc. (one fund), RiverNorth Opportunistic Municipal Income Fund, Inc. (one fund), RiverNorth Managed Duration Municipal Income Fund, Inc. (one fund), RiverNorth Specialty Finance Corporation (one fund), RiverNorth Flexible Municipal Income Fund, Inc. (one fund), RiverNorth Flexible Municipal Income Fund II, Inc. (one fund), and ALPS Variable Investment Trust (7 funds) (2006 to present). |
1 | The mailing address of each Trustee is 325 N. LaSalle Street, Suite 645, Chicago, IL 60654. |
2 | The Fund Complex consists of the RiverNorth Core Opportunity Fund, the RiverNorth/DoubleLine Strategic Income Fund, and the RiverNorth/Oaktree High Income Fund, each a series of RiverNorth Funds, RiverNorth Opportunities Fund, Inc., RiverNorth DoubleLine Strategic Opportunity Fund, Inc., RiverNorth Opportunistic Municipal Income Fund, Inc., RiverNorth Managed Duration Municipal Income Fund, Inc., RiverNorth Specialty Finance Corporation, and Rivernorth Flexible Municipal Income Fund, Inc. |
170 | (888) 848-7569 | www.rivernorth.com |
RiverNorth Funds | Trustees and Officers |
September 30, 2021 (Unaudited)
The following table provides information regarding each Trustee who is an “interested person” of the Trust, as defined in the 1940 Act, and each officer of the Trust.
INTERESTED TRUSTEE AND OFFICERS
Name, Address1
and Year of Birth | Position(s)
Held with
the Fund | Term of
Office/Length
of Time Served | Principal Occupation(s)
During Past 5 Years | Number of
Portfolios
in Fund
Complex
Overseen by
Trustee2 | Other
Directorships
Held by Trustee
During the Past
5 Years |
Patrick W. Galley3 Y.O.B. 1975 | President, Principal Executive Officer and Trustee | Indefinite/ July 2006 to present | Chief Executive Officer (2020 to present) and Chief Investment Officer, RiverNorth Capital Management, LLC (2004 to present). | 10 | RiverNorth Opportunities Fund, Inc. (one fund), RiverNorth/ DoubleLine Strategic Opportunity Fund, Inc. (one fund), RiverNorth Opportunistic Municipal Income Fund, Inc. (one fund), RiverNorth Managed Duration Municipal Income Fund, Inc. (one fund), RiverNorth Specialty Finance Corporation (one fund), RiverNorth Flexible Municipal Income Fund, Inc. (one fund), and RiverNorth Flexible Municipal Income Fund II, Inc. (one fund). |
Annual Report | September 30, 2021 | 171 |
RiverNorth Funds | Trustees and Officers |
September 30, 2021 (Unaudited)
INTERESTED TRUSTEE AND OFFICERS
Name, Address1
and Year of Birth | Position(s)
Held with
the Fund | Term of
Office/Length
of Time Served | Principal Occupation(s)
During Past 5 Years | Number of
Portfolios
in Fund
Complex
Overseen by
Trustee2 | Other
Directorships
Held by Trustee
During the Past
5 Years |
Jonathan M. Mohrhardt Y.O.B. 1974 | Treasurer and Chief Financial Officer | Indefinite/ February 2009 to present | President (since 2020) and Chief Operating Officer (2011 to present), RiverNorth Capital Management, LLC. | NA | Board of Managers RiverNorth Capital Management, LLC (2010 to present), Board of Managers of RiverNorth Securities, LLC (2010 to 2012) and Board of Directors RiverNorth Holdings, Co. (2010 to present). |
Marcus L. Collins Y.O.B. 1968 | Chief Compliance Officer; Secretary | Indefinite/ May 2012 to Present; Indefinite/ January 2017 to Present | General Counsel and Chief Compliance Officer, RiverNorth Capital Management, LLC (2012 to present). | NA | NA |
1 | The mailing address of each Trustee and officer, unless otherwise noted, is 325 N. LaSalle Street, Suite 645, Chicago, IL 60654. |
2 | The Fund Complex consists of the RiverNorth Core Opportunity Fund, the RiverNorth/DoubleLine Strategic Income Fund, and the RiverNorth/Oaktree High Income Fund, each a series of the RiverNorth Funds Trust, and the RiverNorth Opportunities Fund, Inc., RiverNorth/DoubleLine Strategic Opportunity Fund, Inc., RiverNorth Opportunistic Municipal Income Fund, Inc., RiverNorth Managed Duration Municipal Income Fund, Inc., RiverNorth Specialty Finance Corporation, RiverNorth Flexible Municipal Income Fund, Inc., and RiverNorth Flexible Municipal Income Fund II, Inc. |
3 | Patrick W. Galley is considered an "Interested” Trustee as defined in the Investment Company Act of 1940, as amended, because he is an officer of the Trust and Chief Investment Officer of the Funds’ investment adviser. |
The Statement of Additional Information includes additional information about the Trust’s Trustees and is available, without charge, upon request by calling (toll-free) 1-888-848-7569.
172 | (888) 848-7569 | www.rivernorth.com |
RiverNorth Funds
RiverNorth Core Opportunity Fund
RiverNorth/DoubleLine Strategic Income Fund
RiverNorth/Oaktree High Income Fund
Board of Trustees
Patrick W. Galley, CFA, Chairman
John S. Oakes
David M. Swanson
John K. Carter
J. Wayne Hutchens
Investment Adviser
RiverNorth Capital Management, LLC
Sub Advisers
DoubleLine Capital LP
Oaktree Capital Management, L.P.
Transfer Agent, Administrator and
Dividend Disbursing Agent
ALPS Fund Services, Inc.
Distributor
ALPS Distributors, Inc.
Custodian
State Street Bank & Trust, Co.
Independent Registered
Public Accounting Firm
Cohen & Company, Ltd.
This report is provided for the general information of the shareholders of the RiverNorth Funds. This report is not intended for distribution to prospective investors in the Funds, unless preceded or accompanied by an effective prospectus.
| (a) | The registrant, as of the end of the period covered by this report, has adopted a code of ethics that applies to the registrant’s principal executive officer, principal financial officer, principal accounting officer or controller or any persons performing similar functions on behalf of the registrant. |
| (b) | For purposes of this item, “code of ethics” means written standards that are reasonably designed to deter wrongdoing and to promote: |
| (1) | Honest and ethical conduct, including the ethical handling of actual or apparent conflicts of interest between personal and professional relationships; |
| (2) | Full, fair, accurate, timely, and understandable disclosure in reports and documents that a registrant files with, or submits to, the Commission and in other public communications made by the registrant; |
| (3) | Compliance with applicable governmental laws, rules, and regulations; |
| (4) | The prompt internal reporting of violations of the code of ethics to an appropriate person or persons identified in the code of ethics; and |
| (5) | Accountability for adherence to the code of ethics. |
| (c) | Amendments: During the period covered by this report, no amendments were made to the provisions of the code of ethics adopted in 2(a) above. |
| (d) | Waivers: During the period covered by this report, no implicit or explicit waivers to the provisions of the code of ethics adopted in 2(a) above were granted. |
| (e) | Posting: We do not intend to post the code of ethics for the Officers or any amendments or waivers on a website. |
| (f) | Availability: The code of ethics for the Officers can be obtained, free of charge by calling the toll free number for the appropriate Fund listed in that Fund’s prospectus . |
| Item 3. | Audit Committee Financial Expert. |
The registrant’s board of trustees has determined that the registrant does not have an audit committee financial expert. The committee members and the full Board considered a possibility of adding a member that would qualify as an expert. The audit committee determined that, although none of its members meet the technical definition of an audit committee expert, the committee has sufficient financial expertise to adequately perform its duties under the Audit Committee Charter without the addition of a qualified expert.
| Item 4. | Principal Accountant Fees and Services. |
| (a) | Audit Fees | |
| | Fiscal Year | Audit Fees |
| | FY 2021 | $82,901 |
| | FY 2020 | $83,653 |
| | | |
| (b) | Audit-Related Fees | |
| | Fiscal Year | Registrant |
| | FY 2021 | $0 |
| | FY 2020 | $0 |
| | | |
| (c) | Tax Fees | |
| | Fiscal Year | Registrant |
| | FY 2021 | $15,000 |
| | FY 2020 | $15,000 |
| | Nature of the Tax Fees: prepare tax returns |
| | | |
| (d) | All Other Fees | |
| | Fiscal Year | Registrant |
| | FY 2021 | $0 |
| | FY 2020 | $0 |
(1) Audit Committee’s Pre-Approval Policies
The Audit Committee Charter requires the Audit Committee to be responsible for the selection, retention or termination of auditors and, in connection therewith, to (i) evaluate the proposed fees and other compensation, if any, to be paid to the auditors, (ii) evaluate the independence of the auditors, (iii) pre-approve all audit services and, when appropriate, any non-audit services provided by the independent auditors to the Trust, (iv) pre-approve, when appropriate, any non-audit services provided by the independent auditors to the Trust’s investment adviser, or any entity controlling, controlled by, or under common control with the investment adviser and that provides ongoing services to the Trust if the engagement relates directly to the operations and financial reporting of the Trust, and (v) receive the auditors’ specific representations as to their independence.
(2) Percentages of Services Approved by the Audit Committee pursuant to paragraph (c)(7)(i)(C) of Rule 2-01 of Regulation S-X.
| Registrant | |
| Audit-Related Fees: | 0% |
| Tax Fees: | 0% |
| All Other Fees: | 0% |
| (f) | During audit of registrant’s financial statements for the most recent fiscal year, less than 50 percent of the hours expended on the principal accountant’s engagement were attributed to work performed by persons other than the principal accountant’s full-time, permanent employees. |
| (g) | The aggregate non-audit fees billed by the registrant’s accountant for services rendered to the registrant, and rendered to the registrant’s investment adviser (not including any sub-adviser whose role is primarily portfolio management and is subcontracted with or overseen by another investment adviser), and any entity controlling, controlled by, or under common control with the adviser that provides ongoing services to the registrant: |
| Fiscal Year | Registrant | Adviser |
| FY 2021 | $15,000 | $0 |
| FY 2020 | $15,000 | $0 |
| Item 5. | Audit Committee of Listed Registrants. |
NOT APPLICABLE – applies to listed companies only
| Item 6. | Schedule of Investments. |
| (a) | The schedule of investments is included as part of the Report to Stockholders filed under Item 1 of this report. |
| Item 7. | Disclosure of Proxy Voting Policies and Procedures for Closed-End Management Investment Companies. |
NOT APPLICABLE – applies to closed-end funds only
| Item 8. | Portfolio Managers of Closed-End Management Investment Companies. |
NOT APPLICABLE – applies to closed-end funds only
| Item 9. | Purchases of Equity Securities by Closed-End Management Investment Company and Affiliated Purchasers. |
NOT APPLICABLE – applies to closed-end funds only
| Item 10. | Submission of Matters to Vote of Security Holders. |
The registrant has not adopted procedures by which shareholders may recommend nominees to the registrant’s board of trustees.
| Item 11. | Controls and Procedures. |
| (a) | Based on an evaluation of the registrant’s disclosure controls and procedures (as defined in Rule 30a-3(c) under the Investment Company Act of 1940) as of a date within 90 days of the filing date of this Form N-CSR, the disclosure controls and procedures are reasonably designed to ensure that the information required in filings on Forms N-CSR is recorded, processed, summarized, and reported on a timely basis. |
| (b) | There were no significant changes in the registrant’s internal control over financial reporting that occurred during the registrant’s second fiscal quarter of the period covered by this report that have materially affected, or are reasonably likely to materially affect, the registrant’s internal control over financial reporting. |
| Item 12. | Disclosure of Securities Lending Activities for Closed-End Management Investment Companies. |
NOT APPLICABLE – applies to closed-end funds only
| (a)(1) | Certifications pursuant to Rule 30a-2(b) under the Act (17 CFR 30a-2(b)) and Section 1350 of Chapter 63 of Title 18 of the United States Code (18 U.S.C. 1350) are attached hereto. |
SIGNATURES
Pursuant to the requirements of the Securities Exchange Act of 1934 and the Investment Company Act of 1940, the registrant has duly caused this report to be signed on its behalf by the undersigned, thereunto duly authorized.
Registrant: RiverNorth Funds
| By: | /s/ Patrick W. Galley | |
| Name: | Patrick W. Galley | |
| Title: | President | |
| | | |
| Date: | December 9, 2021 | |
Pursuant to the requirements of the Securities Exchange Act of 1934 and the Investment Company Act of 1940, this report has been signed below by the following persons on behalf of the registrant and in the capacities and on the dates indicated.
| By: | /s/ Patrick W. Galley | |
| Name: | Patrick W. Galley | |
| Title: | President & Chief Executive Officer | |
| | | |
| Date: | December 9, 2021 | |
| By: | /s/ Jonathan M. Mohrhardt | |
| Name: | Jonathan M. Mohrhardt | |
| Title: | Treasurer & Chief Financial Officer | |
| | | |
| Date: | December 9, 2021 | |