UNITED STATES
SECURITIES AND EXCHANGE COMMISSION
Washington, D.C. 20549
FORM N-CSR
CERTIFIED SHAREHOLDER REPORT OF REGISTERED
MANAGEMENT INVESTMENT COMPANIES
Investment Company Act file number: 811-21934
RiverNorth Funds
(Exact name of registrant as specified in charter)
325 North LaSalle Street, Suite 645
Chicago, IL 60654
(Address of principal executive offices) (Zip code)
Marc L. Collins
325 North LaSalle Street, Suite 645
Chicago, IL 60654
(Name and address of agent for service)
Registrant's telephone number, including area code: 312-832-1440
Date of fiscal year end: 09/30
Date of reporting period: 09/30/2020
| Item 1. | Reports to Stockholders. |
| RiverNorth Funds | Table of Contents |
| Shareholder Letter | 2 |
| Opportunistic Closed-End Fund Strategies | |
| Portfolio Update | 5 |
| RiverNorth Core Opportunity Fund | 7 |
| RiverNorth/DoubleLine Strategic Income Fund | 13 |
| RiverNorth/Oaktree High Income Fund | 18 |
| RiverNorth Funds Schedule of Investments and Financial Statements | |
| Disclosure of Fund Expenses | 25 |
| Schedule of Investments | |
| RiverNorth Core Opportunity Fund | 27 |
| RiverNorth/DoubleLine Strategic Income Fund | 31 |
| RiverNorth/Oaktree High Income Fund | 80 |
| Statement of Assets and Liabilities | |
| RiverNorth Core Opportunity Fund | 99 |
| RiverNorth/DoubleLine Strategic Income Fund | 100 |
| RiverNorth/Oaktree High Income Fund | 101 |
| Statement of Operations | |
| RiverNorth Core Opportunity Fund | 102 |
| RiverNorth/DoubleLine Strategic Income Fund | 103 |
| RiverNorth/Oaktree High Income Fund | 104 |
| Statements of Changes in Net Assets | |
| RiverNorth Core Opportunity Fund | 105 |
| RiverNorth/DoubleLine Strategic Income Fund | 107 |
| RiverNorth/Oaktree High Income Fund | 109 |
| Financial Highlights | |
| RiverNorth Core Opportunity Fund | 112 |
| RiverNorth/DoubleLine Strategic Income Fund | 120 |
| RiverNorth/Oaktree High Income Fund | 128 |
| Notes to Financial Statements | 135 |
| Report of Independent Registered Public Accounting Firm | 157 |
| Additional Information | 158 |
| Liquidity Risk Management Program | 159 |
| Trustees & Officers | 160 |
| RiverNorth Funds | Shareholder Letter |
September 30, 2020 (Unaudited)
Dear Fellow Shareholders,
What a wild year! The closed-end fund market, which is RiverNorth Capital Management, LLC's ("RiverNorth") predominant investment domain, experienced a roller-coaster of a year with both market prices and net asset values (NAV) reaching historic highs and lows, all packed into a six-month period that included the worst quarter since we began keeping records.
Worst 10 Quarters by NAV Total Return
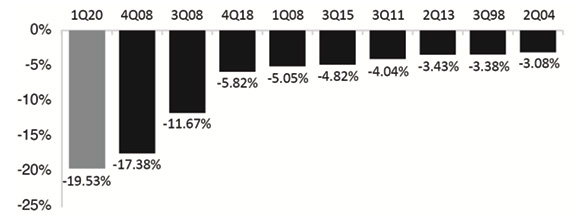
Source: RiverNorth Capital Management, LLC; Morningstar, Inc.
Past performance is not a guarantee of future results.
Worst 10 Quarters by Price Total Return
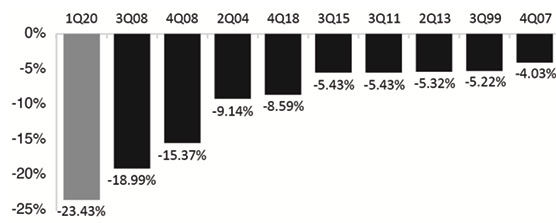
Source: RiverNorth Capital Management, LLC; Morningstar, Inc.
Past performance is not a guarantee of future results.
As one of the largest institutional investors in closed-end funds, RiverNorth thrives off of closed-end fund discount volatility. Our opportunistic investment strategies are structured in a way to increase closed-end fund exposure as discounts widen and decrease closed-end fund exposure when discounts narrow. Because closed-end funds are mostly owned by retail investors, the discount/premium swings, motivated by fear and greed, can be drastic at times. With the backdrop of a global pandemic, this year wasn’t immune to discount volatility. While discounts of closed-end funds reached levels seen during the 2008 Great Financial Crisis (“GFC”), this time around was different. As discounts trended narrower at the beginning of the year and, underlying asset classes exhibited well-priced valuations, the Great Shutdown of 2020 began which resulted in an unwind and precipitous drop in NAVs of closed-end funds with market prices falling even harder as investors ran for the liquidity exits. This took place within a three-week period of time with the nadir falling on March 18th as discounts on virtually all closed-end funds were greater than 20%. The fuel on the fire was leverage utilized by closed-end funds. As closed-end fund NAVs depreciated, leverage asset coverage requirements were violated and many managers were forced to sell assets at the lows only putting more pressure on asset prices. While discounts during the GFC were similar, and even slightly wider, that sell-off was more gradual, as it filtered through our financial system forcing deleveraging, but ultimately took greater than a year to play out vs. the lightening in a jar experienced in 2020.
| 2 | (888) 848-7569 | www.rivernorth.com |
| RiverNorth Funds | Shareholder Letter |
September 30, 2020 (Unaudited)
Ultimately with a Federal Reserve bailout and a pledge to keep interest rates low for years to come, we are excited about the future for closed-end funds. Historically, persistent low interest rates have typically resulted in discounts being narrower than their long-term averages and, as 2012 proved, closed-end funds can even trade at average premiums to their NAVs. As of fiscal year end (September 30th), discounts remained much wider than their long term averages as investors are still scarred from the March experience coupled with an underlying net assets rally from the lows making it difficult for market prices to keep up.
Despite the wild backdrop for closed-end funds this year, the closed-end fund initial public offering (IPO) market has remained open and experienced its best year since 2013 based on new assets raised. Through September 30th, the market has priced 8 closed-end funds raising $6.8 billion. The new IPO pricing structure initiated by RiverNorth in 2018 where fees are paid by the fund sponsor and new closed-end funds are priced at NAV has created continued strong demand.
Looking forward, while the rest of the world awaits a resolution to the pandemic and determination of the U.S. Presidential Election, we believe RiverNorth is positioned to capitalize on any unforeseen volatility and opportunity within closed-end funds. RiverNorth has grown accustomed to expecting the unexpected. We believe uncertainty leads to opportunity for RiverNorth through the ability to exploit overreaction by investors in closed-end funds, making next year’s outlook exciting.
We are pleased to provide you with the 2020 Annual Report for the RiverNorth Funds. The report reviews our three opportunistic closed-end strategies: the RiverNorth Core Opportunity Fund (ticker: RNCIX and RNCOX), the RiverNorth/DoubleLine Strategic Income Fund (tickers: RNSIX and RNDLX), and the RiverNorth/Oaktree High Income Fund (tickers: RNHIX and RNOTX).
Please visit www.rivernorth.com for additional information.
| Annual Report | September 30, 2020 | 3 |
| RiverNorth Funds | Shareholder Letter |
September 30, 2020 (Unaudited)
We thank you for your investment and trust in managing your assets.
Respectfully,
Patrick W. Galley, CFA
President and Chief Investment Officer
RiverNorth Funds
Opinions and estimates offered constitute our judgement and are subject to change.
Definitions:
Closed-End Fund – A closed-end fund is a portfolio of pooled assets that raises a fixed amount of capital through an initial public offering (IPO) and then lists shares for trade on a stock exchange.
2008 Great Financial Crisis (“GFC”) – This financial crisis was the worst economic disaster since the Stock Market Crash of 1929. It started with a subprime mortgage lending crisis in 2007 and expanded into a global banking crisis with the failure of investment bank Lehman Brothers in September 2008. Huge bailouts and other measures meant to limit the spread of the damage failed and the global economy fell into recession.
Great Shutdown of 2020 – An economic consequence of the ongoing COVID-19 pandemic, the first major sign of the coronavirus recession was the 2020 stock market crash on February 20, and the International Monetary Fund (IMF) reported on April 14 that all of the G7 nations had already entered or were entering into a "deep recession" and that there had already been a significant slowdown of growth in emerging economies.
Market Price – The market price at which a closed-end fund trades often varies from its NAV. Some funds have market prices below their NAVs, referred to as a discount. Conversely, some funds have market prices above their NAVs, referred to as a premium.
| 4 | (888) 848-7569 | www.rivernorth.com |
| RiverNorth Funds | Portfolio Update |
September 30, 2020 (Unaudited)
Closed-End Fund Market Overview
In the past twelve months, the average closed-end fund (CEF) reported a market price total return of 5.5%. The asset class category returns for equity1, taxable bond1 and municipal bond funds1 were -15.0%, -3.2% and 1.1%, respectively.
Trailing twelve month returns conceal the tumultuous first quarter of 2020. During this period, the average market price total return for CEFs1 was negative 23.4%. This was the worst calendar quarter total return in the past twenty-plus years.
On September 30, 2020, the average discount on equity, taxable bond and municipal bond funds was 13.0%, 6.5% and 6.0%, respectively. Using data back to 19982, these average discounts were in the 94th, 82nd and 76th percentile of widest discounts. In March 20202, when discounts bottomed around 20%, the market was in the 99th percentile of widest discounts.
RiverNorth believes that discounts measure investor sentiment towards financial assets. Given that discounts are wide today; CEF investors seem to be anxious. That may be reasonable given that the U.S. economy entered a recession in February 2020 and the recovery has been constrained by COVID-19. However, there are signs of financial confidence outside the CEF market. Credit spreads are narrow, interest rate volatility is low and market-cap weighted indices of U.S. stocks are near all-time highs. Therefore, wide discounts in the CEF market seem contradictory compared to traditional metrics of risk tolerance in the capital markets. We believe that time, shareholder activism and distribution stability will cause discounts to narrow in the year ahead.
Leveraged CEFs have benefited from lower borrowing costs. Twelve months ago, "the 1-week" Security Industry and Financial Market Assoc. Index (SIFMA) and 1-month London Interbank Offered Rate (LIBOR) were 1.58% and 2.02%, respectively. On September 30, 2020, those key borrowing rates were 0.11% and 0.15%, respectively. Although reinvestment rates are lower too, the yield curve has steepened and therefore earnings power has improved. As of 9/30, the average CEF distribution yield is 7.6%.
| (1) | Source: RiverNorth. Derived from Morningstar and Bloomberg data. |
| (2) | Source: RiverNorth Capital Management, LLC; Morningstar, Inc. |
| Annual Report | September 30, 2020 | 5 |
| RiverNorth Funds | Portfolio Update |
September 30, 2020 (Unaudited)
Definitions:
Equity Closed-End Funds – Domestic equity closed-end funds are defined as funds investing their assets primarily in U.S. equity securities; generally, these funds are seeking long-term capital appreciation rather than income.
London Interbank Offered Rate (LIBOR) – LIBOR is a benchmark interest rate at which major global banks lend to one another in the international interbank market for short-term loans.
Municipal Bond Closed-End Funds – Municipal bond closed-end funds are defined as funds that invest in a diversified portfolio of investment grade municipal bonds in a variety of sectors and States.
SIFMA (Security Industry/Financial Market Assoc.) Index – SIFMA is a 7-day high-grade market index comprised of tax-exempt Variable Rate Demand Obligations (VRDOs) with certain characteristics. The Index is calculated and published by Bloomberg. The indexes cannot be invested in directly and do not reflect fees and expenses.
Taxable Bond Closed-End Funds – Taxable bond closed-end funds are defined as funds that invest in debt securities whose return is subject to taxes at the local, state or federal level, or some combination thereof.
Variable Rate Demand Obligations (VRDOs) – Variable-rate demand obligations (or VRDOs) are long-term, tax-exempt, floating-rate bonds whose interest rates generally reset on a daily, weekly, or monthly basis.
Yield – Yield is the income return on an investment. This refers to the interest or dividends received from a security and is usually expressed annually as a percentage based on the investment's cost, its current market value or its face value.
Yield Curve - A yield curve is a line that plots yields (interest rates) of bonds having equal credit quality but differing maturity dates. The slope of the yield curve gives an idea of future interest rate changes and economic activity.
| 6 | (888) 848-7569 | www.rivernorth.com |
| RiverNorth Funds | Portfolio Update |
September 30, 2020 (Unaudited)
RiverNorth Core Opportunity Fund
What is the Fund's investment strategy?
The RiverNorth Core Opportunity Fund ("the Fund") invests in a broad range of equity, fixed income and short-term securities. To implement the Fund's tactical asset allocation, the adviser generally invests in closed-end funds (CEF), exchange-traded funds (ETF) and business development companies (BDC). Additionally, the Fund also invests in special-purpose acquisition companies (SPAC).
How did the RiverNorth Core Opportunity Fund perform relative to its benchmark during the reporting period?
For the twelve month period ended September 30, 2020, the Class I share (symbol: RNCIX) returned -3.00% and the Class R share (symbol: RNCOX) returned -3.24%. The Morningstar U.S. Fund Allocation Category - 50% to 70% Equity returned 6.28% during the same period. Funds in allocation categories seek to provide both income and capital appreciation by investing in multiple asset classes, including stocks, bonds, and cash. These portfolios are dominated by domestic holdings and have equity exposures between 50% and 70%.
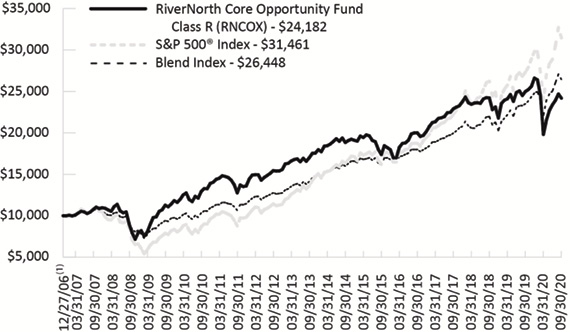
Comparison of a $10,000 Investment in the RiverNorth Core Opportunity Fund Class R, the Blend Index, and the S&P 500® Index.
| Annual Report | September 30, 2020 | 7 |
| RiverNorth Funds | Portfolio Update |
September 30, 2020 (Unaudited)
Comparison of a $5,000,000 Investment in the RiverNorth Core Opportunity Fund Class I, the Blend Index, and the S&P 500® Index.
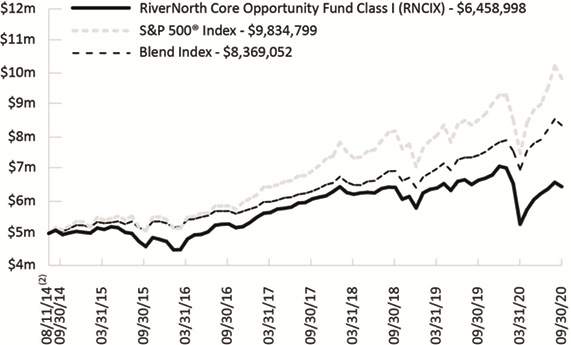
Average Annual Total Returns for Periods Ended September 30, 2020
| | 1-Year | 3-Year | 5-Year | 10 Year | Since
Inception(1)(2) |
| RiverNorth Core Opportunity Fund – Class I (RNCIX)(3) | -3.00% | 2.07% | 7.07% | 6.72% | 6.89% |
| RiverNorth Core Opportunity Fund – Class R (RNCOX) | -3.24% | 1.83% | 6.81% | 6.46% | 6.63% |
| Blend Index(4) | 12.50% | 9.84% | 10.37% | 9.85% | 7.35% |
| S&P 500® Index(4) | 15.15% | 12.28% | 14.15% | 13.74% | 8.69% |
| (1) | Inception date of Class R is December 27, 2006. |
| (2) | Inception date of Class I is August 11, 2014. |
| (3) | In presenting performance information for the newer Institutional share class of the Fund, the Fund includes, for periods prior to the offering of the Institutional share class, the operating expense ratio and performance of the Fund’s Retail share class, adjusted to reflect the class-related operating expenses of the Institutional share class. Actual expense differentials across classes will vary over time. The performance of the Fund’s newer Institutional share class would have been substantially similar to the performance of the Fund’s Retail share class because both share classes of the Fund are invested in the same portfolio of securities and would have differed only to the extent that the classes do not have the same expenses (although differences in expenses between share classes may change over time). |
| 8 | (888) 848-7569 | www.rivernorth.com |
| RiverNorth Funds | Portfolio Update |
September 30, 2020 (Unaudited)
| (4) | Blend Index consists of 60% S&P 500® Index and 40% Bloomberg Barclays Capital U.S. Aggregate Bond Index. S&P 500® Index is a capitalization-weighted index of 500 stocks. The Bloomberg Barclays Capital U.S. Aggregate Bond Index is an unmanaged index of investment-grade fixed-rate debt issues with maturities of at least one year. This unmanaged index does not reflect fees and expenses. The S&P 500® and Blend Indices are indices only and cannot be invested in directly. |
Performance data quoted represents past performance, which is not a guarantee of future results. Current performance may be lower or higher than the performance quoted. The principal value and investment return of an investment will fluctuate so that your shares, when redeemed, may be worth more or less than their original cost. You can obtain performance data current to the most recent month end by calling (888) 848-7569 or visiting www.rivernorth.com. Total return measures net investment income and capital gain or loss from portfolio investments. All performance shown assumes reinvestment of dividends and capital gains distributions and does not reflect the deduction of taxes that a shareholder would pay on fund distributions or the redemption of fund shares.
The Total Annual Fund Operating Expense for the Fund as disclosed in the prospectus dated January 28, 2020: 2.72% (RNCIX); 2.98% (RNCOX). In presenting expense information for the newer Institutional share class of the Fund, the Fund includes, for periods prior to the offering of the Institutional share class, the operating expense ratio of the Fund’s Retail share class, adjusted to reflect the class-related operating expenses of the Institutional share class. Actual expense differentials across share classes will vary over time. The annualized net expense ratio in this annual report dated September 30, 2020 is 1.29% (RNCIX); 1.54% (RNCOX). The expense ratio as disclosed in the Fund’s annual report dated September 30, 2020 only includes the direct expenses paid by shareholders from their investment. The expense ratio as disclosed in the Fund’s prospectus dated January 28, 2020 is required to include the indirect expenses of investing in underlying funds.
What contributing factors were responsible for the RiverNorth Core Opportunity Fund's relative performance during the period?
With respect to the equity portion of the portfolio, U.S. equity focused closed-end funds contributed to performance over the period. The biggest detractor from performance was the Fund’s exposure to closed-end funds that held energy related securities.
With respect to the fixed income portion of the portfolio, relative performance benefited from exposure to municipal bond focused closed-end funds and discount narrowing due to corporate actions among several taxable fixed income closed-end funds. The Fund’s exposure to bank loan closed-end funds detracted from performance as these funds on average experienced negative net asset value (NAV) returns and discount widening over the period.
How was the RiverNorth Core Opportunity Fund positioned at the end of September 2020?
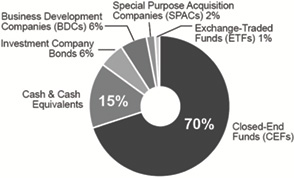
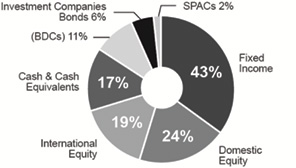
We have allocated 43% of the portfolio to equity, 43% to fixed income, 11% to BDCs, 6% to investment company bonds, 2% to SPACs and 17% to cash. Closed-end fund exposure was 70%. Allocations exceed 100% due to leverage utilized by the underlying funds.
We have increased our exposure to closed-end funds over the past year, and decreased exposure to ETFs.
Within the Fund’s allocation to BDC equity securities (11% allocation), we have selectively focused on issuers which we believe are managed by top-tier credit underwriters with strong balance sheets. We are optimistic regarding the fundamental outlook for their underlying portfolios, which predominately consist of senior-secured middle market corporate loans. The Fund’s investment company bond exposure (6% allocation) consists of unsecured notes issued by BDCs. Given that BDCs are required to maintain a minimum asset coverage ratio of 150% under the Investment Company Act of 1940 (i.e. maximum debt/equity of 2x), this provides a buffer for debt holders through required equity subordination. The weighted average yield for the Fund’s investment company bonds is roughly 6% with a duration of 2 years, offering the Fund’s investors an attractive return profile relative to the underlying risk in our view.
| Annual Report | September 30, 2020 | 9 |
| RiverNorth Funds | Portfolio Update |
September 30, 2020 (Unaudited)
Investment Vehicle Allocation(1) (percentages are based on net assets)
Asset Class Allocation(1) (percentages are based on net assets)
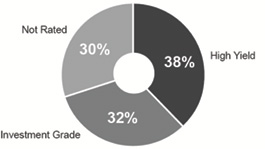
Fixed Income Allocation(1)(2) (percentages are based on net assets)
Portfolio detail statistics are estimates made by the adviser and are subject to change.
| (1) | Convertible Security Risk – the market value of convertible securities adjusts with interest rates and the value of the underlying stock. Exchange Traded Note Risk – exchange traded notes represent unsecured debt of the issuer and may be influenced by interest rates, credit ratings of the issuer or changes in value of the reference index. Fixed Income Risk – the market value of fixed income securities adjusts with interest rates and the securities are subject to issuer default. Foreign/Emerging Market Risk – foreign securities may be subject to inefficient or volatile markets, different regulatory regimes or different tax policies. These risks may be enhanced in emerging markets. Management Risk – there is no guarantee that the adviser’s investment decisions will produce the desired results. Large Shareholder Purchase and Redemption Risk – The Fund may experience adverse effects when certain large shareholders purchase or redeem large amounts of shares of the Fund. Market Risk –economic conditions, interest rates and political events may affect the securities markets. REIT Risk – the value of REITs changes with the value of the underlying properties and changes in interest rates and are subject to additional fees. Security Risk – The value of the Fund may decrease in response to the activities and financial prospects of individual securities in the Fund’s portfolio. Short Sale Risk – short positions are speculative, are subject to transaction costs and are riskier than long positions in securities. Small-Cap Risk – small cap companies are more susceptible to failure, are often thinly traded and have more volatile stock prices. Structured Notes Risk – because of the imbedded derivative feature, structured notes are subject to more risk than investing in a simple note or bond. Swap Risk – swap agreements are subject to counterparty default risk and may not perform as intended. Underlying Fund Risk – underlying funds have additional fees, may utilize leverage, may not correlate to an intended index and may trade at a discount to their net asset values. |
| Annual Report | September 30, 2020 | 10 |
| RiverNorth Funds | Portfolio Update |
September 30, 2020 (Unaudited)
| (2) | Credit quality allocation reflects a fixed-income portfolio weighted average of the credit breakdown of each closed-end fund as provided by the adviser of said closed-end fund. If a credit breakdown is not provided by the adviser, Bloomberg is used. Investment grade refers to a bond rated BBB- or higher by Standard & Poor’s or Baa3 or higher by Moody’s. High yield refers to a bond rate lower than investment grade. For more information about securities ratings, please see the Fund’s Statement of Additional information at www.rivernorth.com. |
| 11 | (888) 848-7569 | www.rivernorth.com |
| RiverNorth Funds | Portfolio Update |
September 30, 2020 (Unaudited)
RiverNorth/DoubleLine Strategic Income Fund
What is the Fund's investment strategy?
The RiverNorth/DoubleLine Strategic Income ("the Fund") invests in a broad range of fixed income securities of U.S. and foreign issuers, including closed-end funds.
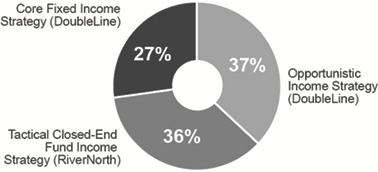
Assets of the Fund are tactically managed across three strategies (or sleeves). RiverNorth Capital Management, LLC (“RiverNorth”) oversees the strategy weights and manages the Tactical Closed-End Fund Income Strategy. The RiverNorth strategy provides diversified exposure to the fixed income market through opportunistic investments in closed-end bond funds (CEF), and business development companies (BDC). Sector allocations are based on RiverNorth's assessment of relative value among asset classes and CEFs. Jeffrey Gundlach, CEO and CIO of DoubleLine Capital, LP (“DoubleLine”), and his team oversee the Opportunistic Income and Core Fixed Income Strategies. The Opportunistic Income Strategy seeks to achieve positive absolute returns and is managed without duration constraints. The Core Fixed Income Strategy incorporates an active asset allocation approach in an effort to mitigate risk and achieve the highest possible risk-adjusted returns.
How did the RiverNorth/DoubleLine Strategic Income Fund perform relative to its benchmark during the reporting period?
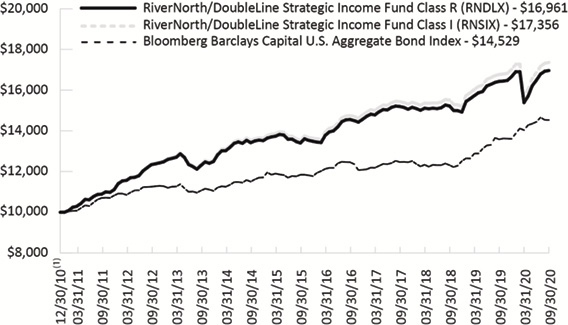
For the twelve month period ended September 30, 2020, the Class I share (symbol: RNSIX) returned 3.51% and the Class R share (symbol: RNDLX) returned 3.24%. The Bloomberg Barclays Capital U.S. Aggregate Bond Index returned 6.98%, during the same period.
Comparison of a $10,000 Investment in the RiverNorth/DoubleLine Strategic Income Fund and the Barclays Capital U.S. Aggregate Bond Index
| Annual Report | September 30, 2020 | 12 |
| RiverNorth Funds | Portfolio Update |
September 30, 2020 (Unaudited)
Average Annual Total Returns for Periods Ended September 30, 2020
| | 1-Year | 3-Year | 5-Year | Since
Inception(1) |
| RiverNorth/DoubleLine Strategic Income Fund – Class I (RNSIX) | 3.51% | 4.00% | 5.10% | 5.82% |
| RiverNorth/DoubleLine Strategic Income Fund – Class R (RNDLX) | 3.24% | 3.73% | 4.82% | 5.57% |
| Bloomberg Barclays Capital U.S. Aggregate Bond Index(2) | 6.98% | 5.24% | 4.18% | 3.91% |
| (1) | Inception date is December 30, 2010. |
| (2) | The Bloomberg Barclays Capital U.S. Aggregate Bond Index is an unmanaged index of investment-grade fixed-rate debt issues with maturities of at least one year. The index cannot be invested in directly and does not reflect fees and expenses. |
Performance data quoted represents past performance, which is not a guarantee of future results. Current performance may be lower or higher than the performance quoted. The principal value and investment return of an investment will fluctuate so that your shares, when redeemed, may be worth more or less than their original cost. You can obtain performance data current to the most recent month end by calling (888) 848-7569 or visiting www.rivernorth.com. Total return measures net investment income and capital gain or loss from portfolio investments. All performance shown assumes reinvestment of dividends and capital gains distributions and does not reflect the deduction of taxes that a shareholder would pay on fund distributions or the redemption of fund shares.
The Total Annual Fund Operating Expense for the Fund as disclosed in the prospectus dated January 28, 2020: 1.65% (RNSIX); 1.90% (RNDLX). The annualized net expense ratio in this annual report dated September 30, 2020 is 0.87% (RNSIX) and 1.12% (RNDLX). The expense ratio as disclosed in the Fund’s annual report dated September 30, 2020 only includes the direct expenses paid by shareholders from their investment. The expense ratio as disclosed in the Fund’s prospectus dated January 28, 2020 is required to include the indirect expenses of investing in underlying funds.
What contributing factors were responsible for the RiverNorth/DoubleLine Strategic Income Fund's relative performance during the period?
RiverNorth Tactical Closed-End Fund Income Sleeve
The RiverNorth sleeve’s performance benefited from exposure to municipal bond focused closed-end funds and discount narrowing due to corporate actions among several taxable fixed income closed-end funds. The Fund’s exposure to bank loan closed-end funds detracted from performance as these funds on average experienced negative net asset value (NAV) returns and discount widening over the period.
DoubleLine Opportunistic Income Sleeve
For the 12-month period ended September 30, 2020, the portfolio underperformed the Bloomberg Barclays US Aggregate Bond Index return of 6.98%. Relative underperformance was driven by the portfolio’s short duration positioning and overweight credit positioning relative to the benchmark as the COVID-19 pandemic led to a steep drop in U.S. Treasury yields and a blowout in risk asset spreads. Agency residential mortgage-backed securities (RMBS) was the best performing sector of the Fund over the period and outperformed the benchmark due to the long duration profile of inverse-interest only (Inverse IOs) and inverse-floater securities held in the Fund. These securities posted strong returns as rates plummeted at the beginning of the year. Commercial mortgage-backed securities (CMBS) and asset backed securities (ABS) were the largest detractors from relative performance as economic sectors such as retail, hospitality, and aircraft were more acutely impacted by the COVID-19 pandemic. Collateralized loan obligations (CLOs) also detracted from performance as investors remained concerned about the fundamentals of mezzanine portions of the sector amidst the ongoing pandemic. Other sectors within the Fund, such as non-agency RMBS, emerging market bonds, and bank loans, all posted positive returns but underperformed the benchmark as spreads ended the period wider than pre-COVID levels even after a summer rally in risk assets.
| 13 | (888) 848-7569 | www.rivernorth.com |
| RiverNorth Funds | Portfolio Update |
September 30, 2020 (Unaudited)
DoubleLine Core Fixed Income Sleeve
For the 12-month period ended September 30, 2020, the portfolio underperformed the Bloomberg Barclays U.S. Aggregate Bond Index return of 6.98%. Relative underperformance was driven by the portfolio’s short duration positioning and overweight credit positioning relative to the benchmark as the COVID-19 pandemic led to a steep drop in U.S. Treasury yields and a blowout in risk asset spreads. Sectors that outperformed the benchmark over the period, such as investment grade corporates and U.S. Treasuries, benefitted from having a longer duration profile than other assets as rates decreased significantly across all tenors of the U.S. Treasury curve with 2-year and 10-year yields falling by 150 basis points (bps) and 98 bps, respectively. CMBS and ABS were the largest detractors from relative performance as economic sectors such as retail, hospitality, and aircraft were more acutely impacted by the COVID-19 pandemic. Despite posting positive returns over the period amidst a strong summer rally in risk assets, the remainder of sectors in the portfolio underperformed the benchmark.
How was the RiverNorth/DoubleLine Strategic Income Fund positioned at the end of September 2020?
We have allocated 36%, 27% and 37% to the Tactical Closed-end Fund, Core Fixed Income, and Opportunistic Income sleeves, respectively. Compared to one year ago, the Fund has a higher exposure to non-agency MBS, and agency MBS, and a lower exposure to U.S. government, and bank loans.
Strategy (“Sleeve”) Allocation
| Annual Report | September 30, 2020 | 14 |
| RiverNorth Funds | Portfolio Update |
September 30, 2020 (Unaudited)
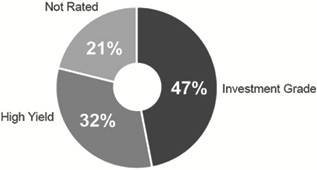
Credit Quality Distribution(1)(2) (percentages are based on net assets)
Sector Breakdown(1) (percentages are based on net assets)
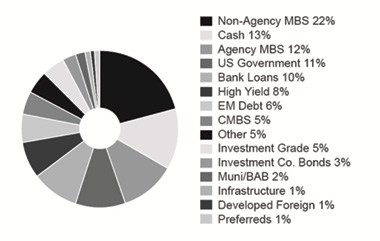
The allocation does not add up to 100% as it reflects the estimated leverage utilized by the underlying funds.
Portfolio detail statistics are estimates made by the adviser and are subject to change.
| (1) | Asset-Backed Security Risk – the risk that the value of the underlying assets will impair the value of the security. Borrowing Risk – borrowings increase fund expenses and are subject to repayment, possibly at inopportune times. Convertible Security Risk – the market value of convertible securities adjusts with interest rates and the value of the underlying stock. Defaulted Securities Risk – defaulted securities carry the risk of uncertainty of repayment. Derivatives Risk – derivatives are subject to counterparty risk. Exchange Traded Note Risk – exchange traded notes represent unsecured debt of the issuer and may be influenced by interest rates, credit ratings of the issuer or changes in value of the reference index. Fixed Income Risk – the market value of fixed income securities adjusts with interest rates and the securities are subject to issuer default. Foreign/Emerging Market Risk – foreign securities may be subject to inefficient or volatile markets, different regulatory regimes or different tax policies. These risks may be enhanced in emerging markets. Liquidity Risk – illiquid investments may be difficult or impossible to sell. Large Shareholder Purchase and Redemption Risk – The Fund may experience adverse effects when certain large shareholders purchase or redeem large amounts of shares of the Fund. Management Risk – there is no guarantee that the adviser’s or sub-adviser’s investment decisions will produce the desired results. Market Risk – economic conditions, interest rates and political events may affect the securities markets. Mortgage-Backed Security Risk – mortgage backed securities are subject to credit risk, pre-payment risk and devaluation of the underlying collateral. Portfolio Turnover Risk – increased portfolio turnover results in higher brokerage expenses and may impact the tax status of distributions. Rating Agency Risk – rating agencies may change their ratings or ratings may not accurately reflect a debt issuer’s creditworthiness. REIT Risk – the value of REITs changes with the value of the underlying properties and changes in interest rates and are subject to additional fees. Security Risk –The value of the Fund may decrease in response to the activities and financial prospects of individual securities in the Fund’s portfolio. Structured Notes Risk – because of the imbedded derivative feature, structured notes are subject to more risk than investing in a simple note or bond. Swap Risk – swap agreements are subject to counterparty default risk and may not perform as intended. Underlying Fund Risk – underlying funds have additional fees, may utilize leverage, may not correlate to an intended index and may trade at a discount to their net asset values. |
| 15 | (888) 848-7569 | www.rivernorth.com |
| RiverNorth Funds | Portfolio Update |
September 30, 2020 (Unaudited)
| (2) | For the sleeve managed by RiverNorth, credit quality allocation reflects a fixed-income portfolio weighted average of the credit breakdown of each closed-end fund as provided by the advisor of said closed-end fund. If a credit breakdown is not provided by the advisor, Bloomberg is used. For the sleeves managed by DoubleLine, credit quality allocation is determined from the highest available credit rating from any Nationally Recognized Statistical Rating Organization (S&P, Moody’s and Fitch). Investment grade refers to a bond rated BBB- or higher by Standard & Poor’s or Baa3 or higher by Moody’s. High yield refers to a bond rated lower than investment grade. For more information about securities ratings, please see the Fund’s Statement of Additional Information at www.rivernorth.com. |
| Annual Report | September 30, 2020 | 16 |
| RiverNorth Funds | Portfolio Update |
September 30, 2020 (Unaudited)
RiverNorth/Oaktree High Income Fund
What is the Fund's investment strategy?
The RiverNorth/Oaktree High Income Fund ("the Fund") invests in a broad range of income producing securities including both fixed income and equity securities.
Assets of the Fund are tactically managed across three income strategies (or sleeves). RiverNorth Capital Management, LLC (“RiverNorth”) manages the Tactical Closed-End Fund Strategy. This strategy is designed to provide diversified fixed income and equity income exposure through opportunistic investments in closed-end funds. Oaktree Capital Management, LP (“Oaktree”) manages the High Yield Bond and Senior Loan Strategies on a global basis. Oaktree will tactically manage the allocation between the High Yield Bond and Senior Loan Strategies based both on market opportunities and the risk and reward trade-offs between the two asset classes.
How did the RiverNorth/Oaktree High Income Fund perform relative to its benchmark during the reporting period?
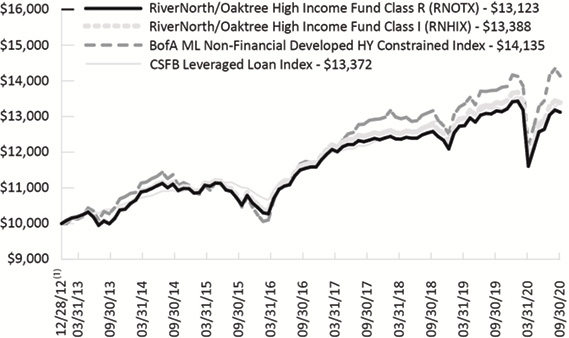
For the 12-month period ended September 30, 2020, the Class I share (symbol: RNHIX) returned -0.02% and the Class R share (symbol: RNOTX) returned -0.27%. The Bank of America Merrill Lynch Non-Financial Developed High Yield Constrained Index (the "BofA ML Non-Financial Developed HY Constrained Index”) and CSFB Leveraged Loan Index returned 2.89% and 0.83%, respectively, during the same period.
Comparison of a $10,000 Investment in the RiverNorth/Oaktree High Income Fund, BofA ML Non-Financial Developed HY Constrained Index and the CSFB Leveraged Loan Index
| 17 | (888) 848-7569 | www.rivernorth.com |
| RiverNorth Funds | Portfolio Update |
September 30, 2020 (Unaudited)
Average Annual Total Returns for the Period Ended September 30, 2020
| | 1-Year | 3-Year | 5-Year | Since Inception(1) |
| RiverNorth/Oaktree High Income Fund – Class I (RNHIX) | -0.02% | 2.33% | 4.79% | 3.83% |
| RiverNorth/Oaktree High Income Fund – Class R (RNOTX) | -0.27% | 2.08% | 4.53% | 3.57% |
| BofA ML Non-Financial Developed HY Constrained Index(2) | 2.89% | 3.12% | 6.20% | 4.56% |
| CSFB Leveraged Loan Index(2) | 0.83% | 3.05% | 3.96% | 3.82% |
| (1) | Inception date is December 28, 2012. |
| (2) | The BofA ML Non-Financial Developed Markets HY Constrained Index contains all securities in the BofA Merrill Lynch Global High Yield Index from developed markets countries but cap issuer exposure at 2%. Developed markets is defined as an FX-G10 member, a Western European nation, or a territory of the U.S. or a Western European nation. The index tracks the performance of USD, CAD, GBP and EUR denominated below investment grade corporate debt publicly issued in the major domestic or Eurobond markets. Qualifying securities must have a below investment grade rating (based on an average of Moody’s, S&P and Fitch). CSFB Leveraged Loan Index tracks the investable market of the U.S. dollar denominated leveraged loan market. It consists of issues rated “5B” or lower, meaning that the highest rated issues included in this index are Moody’s/S&P ratings of Baa1/BB+ or Ba1/BBB+. All loans are funded term loans with a tenor of at least one year and are made by issuers domiciled in developed countries. The BofA ML Non-Financial Developed Markets HY Constrained and the CSFB Leveraged Loan Indices are indices only and cannot be invested in directly. |
Performance data quoted represents past performance, which is not a guarantee of future results. Current performance may be lower or higher than the performance quoted. The principal value and investment return of an investment will fluctuate so that your shares, when redeemed, may be worth more or less than their original cost. You can obtain performance data current to the most recent month end by calling (888) 848-7569 or visiting www.rivernorth.com. Total return measures net investment income and capital gain or loss from portfolio investments. All performance shown assumes reinvestment of dividends and capital gains distributions and does not reflect the deduction of taxes that a shareholder would pay on fund distributions or the redemption of fund shares.
The Total Annual Operating Expense for the Fund as disclosed in the prospectus dated January 28, 2020: 1.85% (RNHIX); 2.10% (RNOTX). The adviser has contractually agreed to defer the collection of fees and/or reimburse expenses, but only to the extent necessary to limit Total Annual Fund Operating Expenses (excluding brokerage fees and commissions; borrowing costs, such as (a) interest and (b) dividends on securities sold short; taxes; indirect expenses incurred by the underlying funds in which the Fund invests; and extraordinary expenses) to 1.35% (RNHIX) and 1.60% (RNOTX) of the average daily net assets of the Fund through January 31, 2021. The annualized net expense ratio in this annual report dated September 30, 2020 is 1.35% (RNHIX) and 1.60% (RNOTX). The expense ratio as disclosed in the Fund’s annual report dated September 30, 2020 only includes the direct expenses paid by shareholders from their investment. The expense ratio as disclosed in the Fund’s prospectus dated January 28, 2020 is required to include the indirect expenses of investing in underlying funds.
| Annual Report | September 30, 2020 | 18 |
| RiverNorth Funds | Portfolio Update |
September 30, 2020 (Unaudited)
What contributing factors were responsible for the RiverNorth/Oaktree High Income Fund's relative performance during the period?
RiverNorth Tactical Closed-End Fund Sleeve
The RiverNorth sleeve’s performance benefited from discount narrowing due to corporate actions among several high yield bond closed-end funds. The Fund’s exposure to bank loan closed-end funds detracted from performance as these funds on average experienced negative net asset value (NAV) returns and discount widening over the period.
Oaktree High Yield Bond & Senior Loan Sleeve
The portfolio generated a positive return over the twelve-month period.
After a strong fourth quarter of 2019 and solid start to 2020, risk assets suffered a massive blow in February due to the rapidly spreading coronavirus. Responding to fears of a prolonged economic downturn, equities and high yield bonds suffered major losses in the first quarter. However, risk assets rallied back in the second and third quarters amid the gradual re-opening of the global economy and aggressive Federal Reserve and fiscal stimulus.
Given the variance in performance over the full twelve-month period, there was no single factor that materially impacted performance. However, our risk-controlled portfolio and strict underwriting requirements were back in favor when the market sold off in February.
How was the RiverNorth/Oaktree High Income Fund positioned at the end of September 2020?
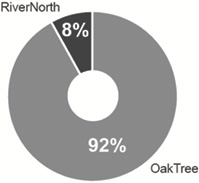
The Fund allocation was 12% RiverNorth Tactical Closed-End Fund and 88% Oaktree High Yield Bond and Senior Loan. The closed-end fund sleeve is primarily invested in the common shares of closed-end funds. Over the past year we have decreased the Fund's allocation to bank loans and increased the Fund's allocation to high yield.
Oaktree High Yield Bond & Senior Loan Sleeve
At the end of September, the portfolio remained broadly diversified. Roughly 78% of the global portfolio was allocated to North America, with the balance invested in Europe. In terms of industry exposure, diversified telecommunication services (8.0%) and media (7.4%) represented the two largest sectors in the portfolio.
We remain focused on the mid-to-upper quality segment of the market, rather than stretching for yield. As you would expect, the portfolio remains defensively positioned; it seeks to provide what we feel is an attractive coupon, but with sufficient downside mitigation to weather the next downturn.
| 19 | (888) 848-7569 | www.rivernorth.com |
| RiverNorth Funds | Portfolio Update |
September 30, 2020 (Unaudited)
Strategy Allocation
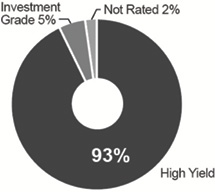
Credit Quality Distribution(1)(2) (percentages are based on net assets)
Sector Breakdown(1) (percentages are based on net assets)
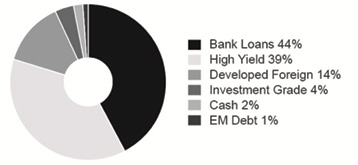
The allocation does not add up to 100% as it reflects the leverage utilized by the underlying funds.
| Annual Report | September 30, 2020 | 20 |
| RiverNorth Funds | Portfolio Update |
September 30, 2020 (Unaudited)
| (1) | Borrowing Risk – borrowings increase fund expenses and are subject to repayment, possibly at inopportune times. Closed- End Fund Risk – closed-end funds are exchange traded, may trade at a discount to their net asset values and may deploy leverage. Convertible Security Risk – the market value of convertible securities adjusts with interest rates and the value of the underlying stock. Credit Derivatives Risk – the use of credit derivatives is highly specialized, involves default, counterparty and liquidity risks and may not perfectly correlate to the underlying asset or liability being hedged. Currency Risk – foreign currencies will rise or decline relative to the U.S. dollar. Distressed and Defaulted Securities Risk – defaulted securities carry the risk of uncertainty of repayment. Equity Risk – equity securities may experience volatility and the value of equity securities may move in opposite directions from each other and from other equity markets generally. Fixed Income Risk – the market value of fixed income securities adjusts with interest rates and the securities are subject to issuer default. Foreign/Emerging Market Risk – foreign securities may be subject to inefficient or volatile markets, different regulatory regimes or different tax policies. These risks may be enhanced in emerging markets. Floating Interest Rate Risk – loans pay interest based on the London Interbank Offered Rate (LIBOR) and a decline in LIBOR could negatively impact the Fund’s return. Investment Style Risk – investment strategies may come in and out of favor with investors and may underperform or outperform at times. Large Shareholder Purchase and Redemption Risk – The Fund may experience adverse effects when certain large shareholders purchase or redeem large amounts of shares of the Fund. Loans Risk – loans may be unrated or rated below investment grade and the pledged collateral may lose value. Secondary trading in loans is not fully-developed and may result in illiquidity. Management Risk – there is no guarantee that the adviser’s or sub-adviser’s investment decisions will produce the desired results. Market Risk – economic conditions, interest rates and political events may affect the securities markets. Portfolio Turnover Risk – increased portfolio turnover results in higher brokerage expenses and may impact the tax status of distributions. Preferred Stock Risk – preferred stocks generally pay dividends, but may be less liquid than common stocks, have less priority than debt instruments and may be subject to redemption by the issuer. Security Risk – the value of the Fund may increase or decrease in response to the prospects of the issuers of securities and loans held in the Fund. Swap Risk – swap agreements are subject to counterparty default risk and may not perform as intended. Underlying Fund Risk – underlying funds have additional fees, may utilize leverage, may not correlate to an intended index and may trade at a discount to their net asset values. Valuation Risk – Loans and fixed-income securities are traded “over the counter” and because there is no centralized information regarding trading, the valuation of loans and fixed-income securities may vary. |
| (2) | For the sleeve managed by RiverNorth, credit quality allocation reflects a fixed-income portfolio weighted average of the credit breakdown of each closed-end fund as provided by the advisor of said closed-end fund. If a credit breakdown is not provided by the advisor, Bloomberg is used. For the sleeves managed by Oaktree, the sub-adviser uses a proprietary credit scoring matrix to rank potential investments. This process offers a systematic way of reviewing the key quantitative and qualitative variables impacting credit quality for each investment. Investment grade refers to a bond rated BBB- or higher by Standard & Poor’s or Baa3 or higher by Moody’s. High yield refers to a bond rated lower than investment grade. For more information about securities ratings, please see the Fund’s Statement of Additional Information at www.rivernorth.com. |
| 21 | (888) 848-7569 | www.rivernorth.com |
| RiverNorth Funds | Portfolio Update |
September 30, 2020 (Unaudited)
Definitions:
Agency Mortgage-Backed Securities (Agency MBS) – Agency MBS are mortgage-backed securities issued by government-sponsored enterprises such as Government National Mortgage Association (GNMA or Ginnie Mae), Federal National Mortgage Association (FNMA or Fannie Mae) or Federal Home Loan Mortgage Corporation (Freddie Mac).
Basis Point (bps) – A common unit of measure for interest rates and other percentages in finance. One basis point is equal to 1/100th of 1%, or 0.01% (0.0001), and is used to denote the percentage change in a financial instrument.
Bloomberg Barclays US Aggregate Bond Index – The Bloomberg Barclays US Aggregate Bond Index is an unmanaged index of investment-grade fixed-rate debt issues with maturities of at least one year. The index cannot be invested in directly and does not reflect fees and expenses.
BofA Merrill Lynch Developed Markets High Yield Constrained Index – The BofA Merrill Lynch Developed Markets High Yield Constrained Index contains all securities in the BofA Merrill Lynch Global High Yield index from developed markets countries but cap issuer exposure at 2%. Developed markets is defined as an FX-G10 member, a Western European nation, or a territory of the U.S. or a Western European nation. The index tracks the performance of USD, CAD, GBP and EUR denominated below investment grade corporate debt publicly issued in the major domestic or Eurobond markets. Qualifying securities must have a below investment grade rating (based on an average of Moody's, S&P and Fitch). The index cannot be invested in directly and does not reflect fees and expenses.
Business Development Company (BDC) – A Business Development Company (BDC) is an organization that invests in small- and medium-sized companies as well as distressed companies. A BDC helps the small- and medium-sized firms grow in the initial stages of their development.
Collateralized Loan Obligation (CLO) – A CLO is a security backed by a pool of debt, often low-rated corporate loans. The investor receives scheduled debt payments from the underlying loans but assumes most of the risk in the event that borrowers default.
Commercial Mortgage-Backed Securities (CMBS) – Commercial mortgage-backed securities (CMBS) are fixed-income investment products that are backed by mortgages on commercial properties rather than residential real estate.
Coupon – A coupon is the annual interest rate paid on a bond, expressed as a percentage of the face value.
CS Leveraged Loan Index – The CS Leveraged Loan Index tracks the investable market of the U.S. dollar denominated leveraged loan market. It consists of issues rated "5B" or lower, meaning that the highest rated issues included in this index are Moody's/S&P ratings of Baa1/BB+ or Ba1/BBB+. All loans are funded term loans with a tenor of at least one year and are made by issuers domiciled in developed countries. The index cannot be invested in directly and does not reflect fees and expenses.
| Annual Report | September 30, 2020 | 22 |
| RiverNorth Funds | Portfolio Update |
September 30, 2020 (Unaudited)
Floating Rate Coupons – Floating rate coupons are derived from financial instruments paying a variable or floating interest rate.
Inverse-Floater Securities – An inverse-floater is a bond or other type of debt whose coupon rate has an inverse relationship to a benchmark rate. An inverse floater adjusts its coupon payment as the interest rate changes.
Inverse-Interest Only Securities (Inverse IOs) – Inverse IOs are interest only securities that pay a coupon inversely related to market rates (i.e., it moves in the opposite direction of interest rates).
Mezzanine Debt – Mezzanine debt has embedded equity instruments attached, often known as warrants, which increase the value of the subordinated debt and allow greater flexibility when dealing with bondholders.
Morningstar U.S. Fund Allocation Category – The Morningstar U.S. Fund Allocation Category - 50% to 70% Equity. Funds in allocation categories seek to provide both income and capital appreciation by investing in multiple asset classes, including stocks, bonds, and cash. These portfolios are dominated by domestic holdings and have equity exposures between 50% and 70%.
Mortgage-Backed Securities (MBS) – MBS are asset-backed securities that are secured by a mortgage or collection of mortgages.
Non-Agency Residential Mortgage-Backed Securities (Non-Agency RMBS) – Non-Agency RMBS are mortgage-backed securities sponsored by private companies other than the government sponsored enterprises such as Fannie Mae, Ginnie Mae, or Freddie Mac.
Residential Mortgage-Backed securities (RMBS) – RMBS are a type of mortgage-backed debt obligation whose cash flows come from residential debt, such as mortgages, home-equity loans and subprime mortgages.
Special Purpose Acquisition Company (SPAC) – A SPAC is a company with no commercial operations that is formed strictly to raise capital through an initial public offering (IPO) for the purpose of acquiring an existing company.
| 23 | (888) 848-7569 | www.rivernorth.com |
| RiverNorth Funds | Disclosure of Fund Expenses |
September 30, 2020 (Unaudited)
Expense Example
As a shareholder of the RiverNorth Funds (the "Trust" or "Funds"), you incur two types of costs: (1) transaction costs; and (2) ongoing costs, including management fees, distribution and service (12b-1) fees and other Fund expenses. This example is intended to help you understand your ongoing costs (in dollars) of investing in the Funds and to compare these costs with the ongoing costs of investing in other mutual funds. The Example is based on an investment of $1,000 invested at the beginning of the period, April 1, 2020, and held for the six months ended September 30, 2020.
Actual Expenses
The first line of the table below provides information about actual account values and actual expenses. You may use the information in this line, together with the amount you invested, to estimate the expenses that you paid over the period. Simply divide your variable account value by $1,000 (for example, an $8,600 account value divided by $1,000 = 8.6), then multiply the result by the number in the first line under the heading entitled “Expenses Paid During Period” to estimate the expenses you paid on your account during this period.
Hypothetical Example for Comparison Purposes
The second line of the table below provides information about hypothetical account values and hypothetical expenses based on each Fund’s actual expense ratio and an assumed rate of return of 5% per year before expenses, which is not each Fund’s actual return. The hypothetical account values and expenses may not be used to estimate the actual ending account balance or expenses you paid for the period. You may use this information to compare the ongoing costs of investing in each Fund and other funds. To do so, compare these 5% hypothetical examples with the 5% hypothetical examples that appear in the shareholder reports of other funds.
Please note that the expenses shown in the table below are meant to highlight your ongoing costs only and do not reflect any transactional costs, such as redemption fees. Therefore, the second line for each share class of each Fund within the table is useful in comparing ongoing costs only, and will not help you determine the relative total costs of owning different funds. If these transactional costs were included, your costs would have been higher.
| Annual Report | September 30, 2020 | 24 |
| RiverNorth Funds | Disclosure of Fund Expenses |
September 30, 2020 (Unaudited)
| | Beginning Account Value 04/01/2020 | Ending Account Value 09/30/2020 | Expense Ratio(a) | Expenses Paid During Period(b) |
| RiverNorth Core Opportunity Fund | | | |
| Class I Shares | | | | |
| Actual | $1,000.00 | $1,222.10 | 1.32% | $7.33 |
| Hypothetical (5% return before expenses) | $1,000.00 | $1,018.40 | 1.32% | $6.66 |
| Class R Shares | | | | |
| Actual | $1,000.00 | $1,220.30 | 1.57% | $8.71 |
| Hypothetical (5% return before expenses) | $1,000.00 | $1,017.15 | 1.57% | $7.92 |
| RiverNorth/DoubleLine Strategic Income Fund | | | |
| Class I Shares | | | | |
| Actual | $1,000.00 | $1,103.90 | 0.87% | $4.58 |
| Hypothetical (5% return before expenses) | $1,000.00 | $1,020.65 | 0.87% | $4.39 |
| Class R Shares | | | | |
| Actual | $1,000.00 | $1,102.30 | 1.12% | $5.89 |
| Hypothetical (5% return before expenses) | $1,000.00 | $1,019.40 | 1.12% | $5.65 |
| RiverNorth/Oaktree High Income Fund | | | |
| Class I Shares | | | | |
| Actual | $1,000.00 | $1,131.90 | 1.35% | $7.20 |
| Hypothetical (5% return before expenses) | $1,000.00 | $1,018.25 | 1.35% | $6.81 |
| Class R Shares | | | | |
| Actual | $1,000.00 | $1,130.70 | 1.60% | $8.52 |
| Hypothetical (5% return before expenses) | $1,000.00 | $1,017.00 | 1.60% | $8.07 |
| (a) | Annualized, based on the Fund's most recent fiscal half-year expenses. |
| (b) | Expenses are equal to the Fund's annualized expense ratio multiplied by the average account value over the period, multiplied by the number of days in the most recent fiscal half year (183), then divided by 366. Note this expense example is typically based on a six-month period. |
| 25 | (888) 848-7569 | www.rivernorth.com |
| RiverNorth Core Opportunity Fund | Schedule of Investments |
September 30, 2020
| Shares/Description | | | Value | |
| CLOSED-END FUNDS - 70.39% | | | |
| 389,131 | | | Aberdeen Emerging Markets Equity Income Fund, Inc. | | $ | 2,521,569 | |
| 321,366 | | | Aberdeen Total Dynamic Dividend Fund | | | 2,551,646 | |
| 21,254 | | | AllianzGI Convertible & Income 2024 Target Term Fund | | | 187,035 | |
| 62,109 | | | Apollo Senior Floating Rate Fund, Inc. | | | 796,237 | |
| 69,090 | | | Apollo Tactical Income Fund, Inc. | | | 878,134 | |
| 56,602 | | | BlackRock Floating Rate Income Trust | | | 635,641 | |
| 11,870 | | | BlackRock Global Opportunities Equity Trust | | | 113,596 | |
| 257,187 | | | BlackRock Resources & Commodities Strategy Trust | | | 1,530,263 | |
| 87,879 | | | BrandywineGLOBAL - Global Income Opportunities Fund, Inc. | | | 1,011,487 | |
| 138,825 | | | Calamos Convertible Opportunities and Income Fund | | | 1,527,075 | |
| 179,717 | | | Calamos Long/Short Equity & Dynamic Income Trust | | | 2,612,187 | |
| 50,973 | | | Clough Global Equity Fund | | | 571,407 | |
| 257,067 | | | Clough Global Opportunities Fund | | | 2,401,006 | |
| 208,862 | | | Duff & Phelps Utility and Corporate Bond Trust, Inc. | | | 1,927,796 | |
| 166,024 | | | Eaton Vance, Ltd. Duration Income Fund | | | 1,877,731 | |
| 86,772 | | | First Trust Energy Income and Growth Fund | | | 786,154 | |
| 188,618 | | | First Trust New Opportunities MLP & Energy Fund | | | 679,025 | |
| 95,596 | | | Highland Global Allocation Fund | | | 592,695 | |
| 41,273 | | | Highland Income Fund | | | 354,535 | |
| 45,839 | | | Invesco Dynamic Credit Opportunities Fund | | | 422,177 | |
| 113,658 | | | NexPoint Credit Strategies Fund | | | 984,278 | |
| 55,266 | | | Nuveen AMT-Free Quality Municipal Income Fund | | | 792,514 | |
| 26,823 | | | Nuveen California AMT-Free Quality Municipal Income Fund | | | 409,587 | |
| 27,628 | | | Nuveen California Quality Municipal Income Fund | | | 402,264 | |
| 192,177 | | | Nuveen Credit Strategies Income Fund | | | 1,135,766 | |
| 105,804 | | | Nuveen Quality Municipal Income Fund | | | 1,536,274 | |
| 96,647 | | | Pershing Square Holdings Ltd. | | | 2,643,295 | |
| 63,888 | | | PGIM Global High Yield Fund, Inc. | | | 846,516 | |
| 207,035 | | | Royce Global Value Trust, Inc. | | | 2,542,390 | |
| 198,450 | | | Royce Micro-Cap Trust, Inc. | | | 1,522,112 | |
| 140,940 | | | Royce Value Trust, Inc. | | | 1,781,482 | |
| 99,846 | | | Source Capital, Inc. | | | 3,679,325 | |
| 598,339 | | | Sprott Focus Trust, Inc. | | | 3,560,117 | |
| 89,083 | | | Voya Emerging Markets High Income Dividend Equity Fund | | | 588,839 | |
| 553,017 | | | Voya Global Equity Dividend and Premium Opportunity Fund | | | 2,737,434 | |
| 168,576 | | | Voya International High Dividend Equity Income Fund | | | 746,792 | |
| 285,083 | | | Western Asset Global High Income Fund, Inc. | | | 2,748,200 | |
| 60,083 | | | Western Asset High Income Fund II, Inc. | | | 384,531 | |
| 190,642 | | | Western Asset High Income Opportunity Fund, Inc. | | | 934,146 | |
| 32,214 | | | Western Asset Managed Municipals Fund, Inc. | | | 392,689 | |
| | | | | | | | |
| TOTAL CLOSED-END FUNDS | | | | |
| (Cost $56,982,427) | | | 54,345,947 | |
See Notes to Financial Statements.
| Annual Report | September 30, 2020 | 26 |
| RiverNorth Core Opportunity Fund | Schedule of Investments |
September 30, 2020
| Shares/Description | | | Value | |
| BUSINESS DEVELOPMENT COMPANIES - 5.61% | | | |
| 130,725 | | | Bain Capital Specialty Finance, Inc. | | $ | 1,333,395 | |
| 157,820 | | | Barings BDC, Inc. | | | 1,262,560 | |
| 40 | | | Golub Capital BDC, Inc. | | | 530 | |
| 359,206 | | | Oaktree Specialty Lending Corp. | | | 1,738,557 | |
| | | | | | | | |
| TOTAL BUSINESS DEVELOPMENT COMPANIES | | | | |
| (Cost $4,584,761) | | | 4,335,042 | |
| | | | | | | | |
| COMMON STOCKS - 1.82% | | | | |
| 13,110 | | | Agba Acquisition, Ltd.(a) | | | 136,082 | |
| 6,581 | | | Amplitude Healthcare Acquisition Corp.(a) | | | 65,314 | |
| 29,944 | | | Churchill Capital Corp. II(a) | | | 315,910 | |
| 25,000 | | | Churchill Capital Corp. IV(a) | | | 250,500 | |
| 2,646 | | | CIIG Merger Corp.(a) | | | 26,513 | |
| 9,077 | | | Greenvision Acquisition Corp.(a) | | | 91,133 | |
| 1,323 | | | Healthcare Merger Corp.(a) | | | 13,429 | |
| 9,409 | | | InterPrivate Acquisition Corp.(a) | | | 94,090 | |
| 10,614 | | | LIV Capital Acquisition Corp.(a) | | | 104,548 | |
| 10,753 | | | Merida Merger Corp. I(a) | | | 106,293 | |
| 19,571 | | | South Mountain Merger Corp.(a) | | | 204,518 | |
| | | | | | | | |
| TOTAL COMMON STOCKS | | | | |
| (Cost $1,334,878) | | | 1,408,330 | |
| | | | | | | | |
| EXCHANGE TRADED FUNDS - 0.86% | | | | |
| 37,953 | | | Invesco FTSE RAFI Emerging Markets Portfolio | | | 666,075 | |
| | | | | | | | |
| TOTAL EXCHANGE TRADED FUNDS | | | | |
| (Cost $682,207) | 666,075 | |
| | | | | | | | |
| PREFERRED STOCKS - 0.15% | | | | |
| 4,687 | | | First Eagle Alternative Capital BDC, Inc., 6.750%, 12/30/2022 | | | 115,741 | |
| | | | | | | | |
| TOTAL PREFERRED STOCKS | | | | |
| (Cost $95,109) | | | 115,741 | |
| Shares/Description | | | Rate | | | Maturity | | | Value | |
| BUSINESS DEVELOPMENT COMPANY NOTES - 1.96% | | | | | | | |
| United States - 1.96% | | | | | | | | | |
| 4,420 | | | Monroe Capital Corp. | | 5.75% | | | 10/31/2023 | | | 108,466 | |
| 23,090 | | | PennantPark Investment Corp. | | 5.50% | | | 10/15/2024 | | | 552,313 | |
| 17,788 | | | Portman Ridge Finance Corp. | | 6.13% | | | 09/30/2022 | | | 438,652 | |
See Notes to Financial Statements.
| 27 | (888) 848-7569 | www.rivernorth.com | |
| RiverNorth Core Opportunity Fund | Schedule of Investments |
September 30, 2020
| Shares/Description | | | Rate | | | Maturity | | | Value | |
| | 16,590 | | | TriplePoint Venture Growth BDC Corp. | | 5.75% | | | 07/15/2022 | | | $ | 414,916 | |
| | | | | | | | | | | | | | | |
| TOTAL BUSINESS DEVELOPMENT COMPANY NOTES | | | | | | | | | | |
| (Cost $1,460,567) | | | | | | | | | 1,514,347 | |
| Principal Amount/Description | | Rate | | | Maturity | | | Value | |
| CONVERTIBLE CORPORATE BONDS - 3.55% | | | | | | | | | | |
| $ | 848,323 | | | BlackRock Capital Investment Corp. | | 5.00% | | | 06/15/2022 | | | | 837,364 | |
| | 190,456 | | | BlackRock TCP Capital Corp. | | 4.63% | | | 03/01/2022 | | | | 191,410 | |
| | 500,000 | | | Hercules Capital, Inc. | | 4.38% | | | 02/01/2022 | | | | 503,150 | |
| | 852,978 | | | New Mountain Finance Corp. | | 5.75% | | | 08/15/2023 | | | | 857,286 | |
| | 338,000 | | | Sixth Street Specialty Lending, Inc. | | 4.50% | | | 08/01/2022 | | | | 349,393 | |
| | | | | | | | | | | | | | | |
| TOTAL CONVERTIBLE CORPORATE BONDS | | | | | | | | | | |
| (Cost $2,416,547) | | | | | | | | | 2,738,603 | |
| Shares/Description | | Value | |
| Rights - 0.02%(a) | | |
| | 13,110 | | | Agba Acquisition, Ltd., Strike Price 11.50, Expires 12/31/2049 | | | 3,015 | |
| | 35,274 | | | Big Rock Partners Acquisition Corp., Strike Price 11.50, Expires 12/31/2049 | | | 7,224 | |
| | 9,077 | | | Greenvision Acquisition Corp., Strike Price 11.50, Expires 10/28/2024 | | | 4,220 | |
| | | | | | | | | |
| TOTAL RIGHTS | | | | |
| (Cost $17,962) | | 14,459 | |
| | | | | | | | | |
| Warrants - 0.37%(a) | | | | |
| | 13,110 | | | Agba Acquisition, Ltd., Strike Price 11.50, Expires 05/10/2024 | | | 4,195 | |
| | 3,290 | | | Amplitude Healthcare Acquisition Corp., Strike Price 11.50, Expires 12/01/2026 | | | 3,685 | |
| | 17,637 | | | Big Rock Partners Acquisition Corp., Strike Price 11.50, Expires 12/01/2022 | | | 4,587 | |
| | 17,648 | | | Brooge Energy, Ltd., Strike Price 11.50, Expires 07/14/2023 | | | 8,824 | |
| | 9,981 | | | Churchill Capital Corp. II, Strike Price 11.50, Expires 07/24/2024 | | | 21,793 | |
| | 1,323 | | | CIIG Merger Corp., Strike Price 11.50, Expires 12/31/2026 | | | 1,138 | |
| | 9,037 | | | Greenvision Acquisition Corp., Strike Price 11.50, Expires 10/28/2024 | | | 4,699 | |
| | 75,837 | | | Hall of Fame Resort & Entertainment Co., Strike Price 11.50, Expires 07/01/2025 | | | 19,718 | |
| | 661 | | | Healthcare Merger Corp., Strike Price 11.50, Expires 12/17/2021 | | | 1,183 | |
| | 4,704 | | | InterPrivate Acquisition Corp., Strike Price 11.50, Expires 10/29/2024 | | | 3,834 | |
| | 653 | | | Landcadia Holdings II, Inc., Strike Price 11.50, Expires 05/09/2026 | | | 2,867 | |
| | 24,617 | | | Legacy Acquisition Corp., Strike Price 11.50, Expires 12/01/2022 | | | 13,170 | |
| | 20,922 | | | Leisure Acquisition Corp., Strike Price 11.50, Expires 12/28/2022 | | | 9,835 | |
| | 12,752 | | | LF Capital Acquisition Corp., Strike Price 11.50, Expires 06/28/2023 | | | 22,954 | |
| | 10,614 | | | LIV Capital Acquisition Corp., Strike Price 11.50, Expires 01/10/2025 | | | 4,989 | |
See Notes to Financial Statements.
| Annual Report | September 30, 2020 | 28 |
| RiverNorth Core Opportunity Fund | Schedule of Investments |
September 30, 2020
| Shares/Description | | Value | |
| | 5,376 | | | Merida Merger Corp. I, Strike Price 11.50, Expires 11/07/2026 | | $ | 2,796 | |
| | 55,077 | | | Opes Acquisition Corp., Strike Price 11.50, Expires 01/16/2023 | | | 131,083 | |
| | 9,785 | | | South Mountain Merger Corp., Strike Price 11.50, Expires 06/20/2024 | | | 13,699 | |
| | 19,178 | | | Trident Acquisitions Corp., Strike Price 11.50, Expires 06/14/2021 | | | 7,059 | |
| | | | | | | | | |
| TOTAL WARRANTS | | | |
| (Cost $165,463) | | | 282,108 | |
| | | | | | | | | |
| SHORT-TERM INVESTMENTS - 15.71% | | | | |
| Money Market Fund - 15.71% | | | | |
| | 12,129,578 | | | State Street Institutional Trust (7 Day Yield 0.02%) | | | 12,129,578 | |
| | | | | | | | | |
| TOTAL SHORT-TERM INVESTMENTS | | | | |
| (Cost $12,129,578) | | | 12,129,578 | |
| | | | | | | | | |
| TOTAL INVESTMENTS - 100.44% | | | | |
| (Cost $79,869,499) | | $ | 77,550,230 | |
| LIABILITIES IN EXCESS OF OTHER ASSETS - (0.44)% | | | (342,965 | ) |
| NET ASSETS - 100.00% | | $ | 77,207,265 | |
| (a) | Non-income producing security. |
See Notes to Financial Statements.
| 29 | (888) 848-7569 | www.rivernorth.com |
| RiverNorth/DoubleLine Strategic Income Fund | Schedule of Investments |
September 30, 2020
| | | | | | | |
| Shares/Description | | | Value | |
| CLOSED-END FUNDS - 19.49% | | | | |
| | 311,477 | | | Advent Convertible and Income Fund | | $ | 4,301,497 | |
| | 1,527,618 | | | AllianceBernstein Global High Income Fund, Inc. | | | 16,055,265 | |
| | 411,629 | | | Ares Dynamic Credit Allocation Fund, Inc. | | | 5,219,456 | |
| | 1,314,569 | | | BlackRock Debt Strategies Fund, Inc. | | | 13,066,816 | |
| | 398,716 | | | BlackRock Floating Rate Income Strategies Fund, Inc. | | | 4,585,234 | |
| | 156,284 | | | BlackRock Multi-Sector Income Trust | | | 2,466,162 | |
| | 954,907 | | | BrandywineGLOBAL - Global Income Opportunities Fund, Inc. | | | 10,990,980 | |
| | 539,062 | | | Eaton Vance Floating-Rate Income Trust | | | 6,404,057 | |
| | 2,609,031 | | | Eaton Vance, Ltd. Duration Income Fund | | | 29,508,141 | |
| | 716,639 | | | First Trust High Income Long/Short Fund | | | 9,975,615 | |
| | 1,071,903 | | | First Trust Senior Floating Rate 2022 Target Term Fund | | | 9,046,861 | |
| | 389,099 | | | Highland Income Fund | | | 3,342,360 | |
| | 1,387,928 | | | Invesco Dynamic Credit Opportunities Fund | | | 12,782,817 | |
| | 1,746,476 | | | Invesco Senior Income Trust | | | 6,392,102 | |
| | 1,335,239 | | | Morgan Stanley Emerging Markets Domestic Debt Fund, Inc. | | | 7,423,929 | |
| | 321,315 | | | Nuveen AMT-Free Quality Municipal Income Fund | | | 4,607,657 | |
| | 2,499,497 | | | Nuveen Credit Strategies Income Fund | | | 14,772,027 | |
| | 460,740 | | | Nuveen Dividend Advantage Municipal Income Fund | | | 7,215,188 | |
| | 264,356 | | | Nuveen Floating Rate Income Opportunity Fund | | | 2,167,719 | |
| | 668,958 | | | Nuveen Global High Income Fund | | | 9,051,002 | |
| | 1,042,104 | | | Nuveen Quality Municipal Income Fund | | | 15,131,350 | |
| | 892,908 | | | PGIM Global High Yield Fund, Inc. | | | 11,831,031 | |
| | 718,549 | | | PGIM High Yield Bond Fund, Inc. | | | 9,923,162 | |
| | 670,579 | | | Templeton Emerging Markets Income Fund | | | 4,968,990 | |
| | 1,383,167 | | | Templeton Global Income Fund | | | 7,399,943 | |
| | 1,221,279 | | | Western Asset Emerging Markets Debt Fund, Inc. | | | 15,046,157 | |
| | 1,844,973 | | | Western Asset Global High Income Fund, Inc. | | | 17,785,540 | |
| | 1,151,239 | | | Western Asset High Income Fund II, Inc. | | | 7,367,930 | |
| | 6,905,381 | | | Western Asset High Income Opportunity Fund, Inc. | | | 33,836,367 | |
| | 136,297 | | | Western Asset High Yield Defined Opportunity Fund, Inc. | | | 1,912,247 | |
| | 4,395,937 | | | Western Asset Inflation-Linked Opportunities & Income Fund | | | 49,410,332 | |
| | | | | | | | | |
| TOTAL CLOSED-END FUNDS | | | | |
| (Cost $361,559,941) | | | 353,987,934 | |
| | | | | | | | | |
| BUSINESS DEVELOPMENT COMPANIES - 0.20% | | | | |
| | 450,876 | | | Barings BDC, Inc. | | | 3,607,008 | |
| | 926 | | | Golub Capital BDC, Inc. | | | 12,260 | |
| | | | | | | | | |
| TOTAL BUSINESS DEVELOPMENT COMPANIES | | | | |
| (Cost $4,520,588) | | | 3,619,268 | |
| | | | | | | | | |
| COMMON STOCKS - 0.00%(a) | | | |
| | 12,164 | | | Frontera Energy Corp. | | | 19,584 | |
See Notes to Financial Statements.
| Annual Report | September 30, 2020 | 30 |
| RiverNorth/DoubleLine Strategic Income Fund | Schedule of Investments |
September 30, 2020
| Shares/Description | | | Value | |
| | 31,580 | | | McDermott International, Ltd.(b) | | $ | 75,792 | |
| | | | | | | | | |
| TOTAL COMMON STOCKS | | | |
| (Cost $1,193,381) | | 95,376 | |
| | | | | | | | | |
| OPEN-END FUNDS - 1.66% | | | |
| | 3,318,436 | | | RiverNorth/Oaktree High Income Fund, Class I(c) | | | 30,155,295 | |
| | | | | | | | | |
| TOTAL OPEN-END FUNDS | | | |
| (Cost $31,819,493) | | 30,155,295 | |
| | | | | | | | | |
| PREFERRED STOCKS - 1.69% | | | |
| | 331,750 | | | Allianzgi Convertible & Income Fund, Series A, 5.625%(d) | | | 8,678,580 | |
| | 179,152 | | | First Eagle Alternative Capital BDC, Inc., 6.750%, 12/30/2022 | | | 4,423,980 | |
| | 208,354 | | | First Eagle Alternative Capital BDC, Inc., 6.125%, 10/30/2023 | | | 5,139,051 | |
| | 305,377 | | | Hercules Capital, Inc., 5.250%, 04/30/2025 | | | 7,774,898 | |
| | 188,696 | | | New Mountain Finance Corp., 5.750%, 10/01/2023 | | | 4,710,928 | |
| | | | | | | | | |
| TOTAL PREFERRED STOCKS | | | |
| (Cost $29,500,243) | | 30,727,437 | |
| Shares/Description | | | Rate | | | Maturity | | | Value | |
| BUSINESS DEVELOPMENT COMPANY NOTES - 0.90% | | | | | | | | | |
| United States - 0.90% | | | | | | | | | |
| | 233,620 | | | PennantPark Investment Corp. | | 5.50% | | | 10/15/2024 | | | | 5,588,190 | |
| | 194,239 | | | Portman Ridge Finance Corp. | | 6.13% | | | 09/30/2022 | | | | 4,789,934 | |
| | 237,249 | | | TriplePoint Venture Growth BDC Corp. | | 5.75% | | | 07/15/2022 | | | | 5,933,598 | |
| | | | | | | | | | | | | | | |
| TOTAL BUSINESS DEVELOPMENT COMPANY NOTES | | | | | | | | | |
| (Cost $16,423,552) | | | | | | | | 16,311,722 | |
| Principal Amount/Description | | Rate | | | Maturity | | | Value | |
| FOREIGN CORPORATE BONDS - 4.59% | | | | | |
| Argentina - 0.08% | | | | | |
| $ | 150,000 | | | AES Argentina Generacion SA(e) | | 7.75% | | | 02/02/2024 | | | $ | 104,905 | |
| | 600,000 | | | Banco Macro SA(e)(f) | | 6.75% | | | 11/04/2026 | | | | 460,506 | |
| | 150,000 | | | Capex SA(e) | | 6.88% | | | 05/15/2024 | | | | 126,677 | |
| | 150,000 | | | Pampa Energia SA(g) | | 9.13% | | | 04/15/2029 | | | | 117,591 | |
| | 450,000 | | | Pampa Energia SA(e) | | 9.13% | | | 04/15/2029 | | | | 352,773 | |
| | 575,629 | | | Stoneway Capital Corp.(e)(h) | | 10.00% | | | 03/01/2027 | | | | 247,526 | |
| | | | | | | | | | | | | | 1,409,978 | |
| Australia - 0.18% | | | | | | | | | |
| | 1,000,000 | | | APT Pipelines, Ltd.(g) | | 4.25% | | | 07/15/2027 | | | | 1,131,720 | |
See Notes to Financial Statements.
| 31 | (888) 848-7569 | www.rivernorth.com |
| RiverNorth/DoubleLine Strategic Income Fund | Schedule of Investments |
September 30, 2020
| Principal Amount/Description | | Rate | | Maturity | | Value | |
| $ | 475,000 | | | Commonwealth Bank of Australia(g) | | 4.32% | | 01/10/2048 | | $ | 580,281 | |
| | 530,000 | | | Macquarie Group, Ltd.(f)(g) | | 3M US L + 1.33% | | 03/27/2024 | | | 568,580 | |
| | 500,000 | | | Sydney Airport Finance Co. Pty, Ltd.(g) | | 3.38% | | 04/30/2025 | | | 529,187 | |
| | 500,000 | | | Sydney Airport Finance Co. Pty, Ltd.(g) | | 3.63% | | 04/28/2026 | | | 540,720 | |
| | | | | | | | | | | | 3,350,488 | |
| Bermuda - 0.02% | | | | | | | |
| | 400,000 | | | Ooredoo International Finance, Ltd.(e) | | 3.25% | | 02/21/2023 | | | 418,920 | |
| Brazil - 0.18% | | | | | | | |
| | 400,000 | | | Banco do Brasil SA(d)(e)(f) | | 6.25% | | Perpetual Maturity | | | 375,750 | |
| | 400,000 | | | CSN Islands XI Corp.(g) | | 6.75% | | 01/28/2028 | | | 384,780 | |
| | 1,050,000 | | | CSN Islands XII Corp.(d)(e) | | 7.00% | | Perpetual Maturity | | | 920,073 | |
| | 200,000 | | | Globo Comunicacao e Participacoes SA(g) | | 4.88% | | 01/22/2030 | | | 197,730 | |
| | 950,000 | | | Oi SA(i) | | 10.00% (4.00%) | | 07/27/2025 | | | 920,313 | |
| | 550,000 | | | Unigel Luxembourg SA(e) | | 8.75% | | 10/01/2026 | | | 534,880 | |
| | | | | | | | | | | | 3,333,526 | |
| British Virgin Islands - 0.13% | | | | | | | |
| | 400,000 | | | C10 Capital SPV, Ltd.(d)(e)(f) | | 3M US L + 4.71% | | Perpetual Maturity | | | 354,400 | |
| | 200,000 | | | C5 Capital SPV, Ltd.(d)(e)(f) | | 3M US L + 4.28% | | Perpetual Maturity | | | 166,000 | |
| | 200,000 | | | CNPC Global Capital, Ltd. | | 1.13% | | 06/23/2023 | | | 199,980 | |
| | 400,000 | | | CNPC Global Capital, Ltd. | | 1.35% | | 06/23/2025 | | | 401,234 | |
| | 800,000 | | | Radiant Access, Ltd.(d) | | 4.60% | | Perpetual Maturity | | | 802,596 | |
| | 200,000 | | | State Grid Overseas Investment 2013, Ltd.(e) | | 3.13% | | 05/22/2023 | | | 210,813 | |
| | 200,000 | | | State Grid Overseas Investment 2016, Ltd.(e) | | 3.75% | | 05/02/2023 | | | 214,183 | |
| | | | | | | | | | | | 2,349,206 | |
| Canada - 0.29% | | | | | | | |
| | 405,000 | | | Bank of Montreal(f) | | 3.80% | | 12/15/2032 | | | 451,502 | |
| | 355,000 | | | Bank of Nova Scotia | | 1.63% | | 05/01/2023 | | | 364,333 | |
| | 140,000 | | | Bombardier, Inc.(g) | | 6.00% | | 10/15/2022 | | | 130,025 | |
| | 300,000 | | | Canacol Energy, Ltd.(e) | | 7.25% | | 05/03/2025 | | | 308,816 | |
| | 270,000 | | | CCL Industries, Inc.(g) | | 3.05% | | 06/01/2030 | | | 288,590 | |
| | 85,000 | | | Cenovus Energy, Inc. | | 5.38% | | 07/15/2025 | | | 81,910 | |
| | 165,000 | | | Garda World Security Corp.(g) | | 8.75% | | 05/15/2025 | | | 167,164 | |
| | 130,000 | | | GFL Environmental, Inc.(g) | | 3.75% | | 08/01/2025 | | | 129,919 | |
See Notes to Financial Statements.
| Annual Report | September 30, 2020 | 32 |
| RiverNorth/DoubleLine Strategic Income Fund | Schedule of Investments |
September 30, 2020
| Principal Amount/Description | | Rate | | Maturity | | Value | |
| $ | 185,000 | | | GFL Environmental, Inc.(g) | | 5.13% | | 12/15/2026 | | $ | 192,649 | |
| | 72,000 | | | GFL Environmental, Inc.(g) | | 8.50% | | 05/01/2027 | | | 78,255 | |
| | 600,000 | | | Gran Tierra Energy, Inc.(g) | | 7.75% | | 05/23/2027 | | | 209,631 | |
| | 175,000 | | | Kronos Acquisition Holdings, Inc.(g) | | 9.00% | | 08/15/2023 | | | 177,844 | |
| | 205,000 | | | Mattamy Group Corp.(g) | | 4.63% | | 03/01/2030 | | | 207,936 | |
| | 265,000 | | | MEG Energy Corp.(g) | | 7.13% | | 02/01/2027 | | | 238,322 | |
| | 400,000 | | | MEGlobal Canada ULC(g) | | 5.00% | | 05/18/2025 | | | 433,086 | |
| | 470,000 | | | Nutrien, Ltd. | | 4.20% | | 04/01/2029 | | | 559,062 | |
| | 185,000 | | | Parkland Corp.(g) | | 5.88% | | 07/15/2027 | | | 194,828 | |
| | 55,000 | | | Telesat Canada / Telesat LLC(g) | | 6.50% | | 10/15/2027 | | | 55,473 | |
| | 175,000 | | | Tervita Corp.(g) | | 7.63% | | 12/01/2021 | | | 160,180 | |
| | 750,000 | | | TransCanada PipeLines, Ltd. | | 4.25% | | 05/15/2028 | | | 867,137 | |
| | | | | | | | | | | | 5,296,662 | |
| Cayman Islands - 0.31% | | | | | | | |
| | 600,000 | | | Banco BTG Pactual SA(e)(f) | | 7.75% | | 02/15/2029 | | | 620,250 | |
| | 200,000 | | | Banco Mercantil del Norte SA/Grand Cayman(d)(f)(g) | | 7.50% | | Perpetual Maturity | | | 197,328 | |
| | 950,000 | | | Banco Mercantil del Norte SA/Grand Cayman(d)(e)(f) | | 7.63% | | Perpetual Maturity | | | 949,430 | |
| | 300,000 | | | Banco Mercantil del Norte SA/Grand Cayman(d)(e)(f) | | 10Y US TI + 5.47% | | Perpetual Maturity | | | 295,992 | |
| | 1,000,000 | | | CK Hutchison Capital Securities 17, Ltd.(d)(e)(f) | | 4.00% | | Perpetual Maturity | | | 1,019,250 | |
| | 160,618 | | | Global Aircraft Leasing Co., Ltd.(g)(i) | | 6.50% (7.25%) | | 09/15/2024 | | | 90,147 | |
| | 624,000 | | | Gran Tierra Energy International Holdings, Ltd.(e) | | 6.25% | | 02/15/2025 | | | 215,093 | |
| | 783,651 | | | Interoceanica IV Finance, Ltd.(e)(j) | | 0.00% | | 11/30/2025 | | | 733,693 | |
| | 700,000 | | | Itau Unibanco Holding SA Island(d)(f)(g) | | 4.63% | | Perpetual Maturity | | | 613,200 | |
| | 200,000 | | | Latam Finance, Ltd.(g)(h) | | 7.00% | | 03/01/2026 | | | 74,500 | |
| | 200,000 | | | Latam Finance, Ltd.(e)(h) | | 6.88% | | 04/11/2024 | | | 74,500 | |
| | 900,000 | | | Latam Finance, Ltd.(e)(h) | | 7.00% | | 03/01/2026 | | | 335,250 | |
| | 159,664 | | | Lima Metro Line 2 Finance, Ltd.(g) | | 5.88% | | 07/05/2034 | | | 195,039 | |
| | 210,000 | | | Transocean Poseidon, Ltd.(g) | | 6.88% | | 02/01/2027 | | | 169,050 | |
| | | | | | | | | | | | 5,582,722 | |
| Chile - 0.31% | | | | | | | |
| | 600,000 | | | AES Gener SA(f)(g) | | 6.35% | | 10/07/2079 | | | 606,375 | |
| | 200,000 | | | AES Gener SA(e)(f) | | 7.13% | | 03/26/2079 | | | 204,806 | |
| | 400,000 | | | AES Gener SA(e)(f) | | 6.35% | | 10/07/2079 | | | 404,250 | |
| | 900,000 | | | Empresa de Transporte de Pasajeros Metro SA(g) | | 5.00% | | 01/25/2047 | | | 1,126,615 | |
| | 1,000,000 | | | Empresa Electrica Guacolda SA(e) | | 4.56% | | 04/30/2025 | | | 822,615 | |
| | 1,200,000 | | | Geopark, Ltd.(e) | | 6.50% | | 09/21/2024 | | | 1,132,800 | |
| | 450,000 | | | GNL Quintero SA(e) | | 4.63% | | 07/31/2029 | | | 482,648 | |
See Notes to Financial Statements.
| 33 | (888) 848-7569 | www.rivernorth.com |
| RiverNorth/DoubleLine Strategic Income Fund | Schedule of Investments |
September 30, 2020
| Principal Amount/Description | | Rate | | Maturity | | Value | |
| $ | 750,000 | | | Transelec SA(e) | | 3.88% | | 01/12/2029 | | $ | 821,295 | |
| | | | | | | | | | | | 5,601,404 | |
| China - 0.35% | | | | | | | |
| | 200,000 | | | Agile Group Holdings, Ltd.(d)(f) | | 6.88% | | Perpetual Maturity | | | 200,990 | |
| | 300,000 | | | Agile Group Holdings, Ltd.(d)(f) | | 7.88% | | Perpetual Maturity | | | 305,039 | |
| | 295,000 | | | Agile Group Holdings, Ltd.(d)(f) | | 7.75% | | Perpetual Maturity | | | 297,198 | |
| | 200,000 | | | Baidu, Inc. | | 3.43% | | 04/07/2030 | | | 220,802 | |
| | 200,000 | | | Central China Real Estate, Ltd. | | 7.25% | | 04/24/2023 | | | 200,500 | |
| | 700,000 | | | Central China Real Estate, Ltd. | | 7.25% | | 07/16/2024 | | | 683,438 | |
| | 750,000 | | | CIFI Holdings Group Co., Ltd.(d)(f) | | 5.38% | | Perpetual Maturity | | | 744,375 | |
| | 200,000 | | | ENN Energy Holdings, Ltd. | | 3.25% | | 07/24/2022 | | | 205,779 | |
| | 400,000 | | | JD.com, Inc. | | 3.38% | | 01/14/2030 | | | 433,933 | |
| | 400,000 | | | Ronshine China Holdings, Ltd. | | 7.35% | | 12/15/2023 | | | 391,027 | |
| | 600,000 | | | Ronshine China Holdings, Ltd. | | 6.75% | | 08/05/2024 | | | 565,500 | |
| | 650,000 | | | Sinopec Group Overseas Development 2018, Ltd.(g) | | 2.70% | | 05/13/2030 | | | 684,395 | |
| | 500,000 | | | Tencent Holdings, Ltd.(g) | | 2.39% | | 06/03/2030 | | | 508,940 | |
| | 350,000 | | | Yuzhou Group Holdings Co., Ltd. | | 8.30% | | 05/27/2025 | | | 353,961 | |
| | 600,000 | | | Yuzhou Group Holdings Co., Ltd. | | 7.38% | | 01/13/2026 | | | 577,484 | |
| | | | | | | | | | | | 6,373,361 | |
| Colombia - 0.11% | | | | | | | |
| | 350,000 | | | Credivalores-Crediservicios SAS(g) | | 8.88% | | 02/07/2025 | | | 244,125 | |
| | 200,000 | | | Credivalores-Crediservicios SAS(e) | | 9.75% | | 07/27/2022 | | | 151,203 | |
| | 400,000 | | | Credivalores-Crediservicios SAS(e) | | 8.88% | | 02/07/2025 | | | 279,000 | |
| | 150,000 | | | Gilex Holding Sarl(g) | | 8.50% | | 05/02/2023 | | | 152,907 | |
| | 750,000 | | | Gilex Holding Sarl(e) | | 8.50% | | 05/02/2023 | | | 764,539 | |
| | 400,000 | | | Tecnoglass, Inc.(e) | | 8.20% | | 01/31/2022 | | | 415,410 | |
| | | | | | | | | | | | 2,007,184 | |
| Dominican Republic - 0.05% | | | | | | | |
| | 600,000 | | | Aeropuertos Dominicanos Siglo XXI SA(e) | | 6.75% | | 03/30/2029 | | | 560,136 | |
| | 300,000 | | | Banco de Reservas de la Republica Dominicana(g) | | 7.00% | | 02/01/2023 | | | 308,253 | |
| | | | | | | | | | | | 868,389 | |
| France - 0.03% | | | | | | | |
| | 525,000 | | | BNP Paribas SA(f)(g) | | 1D US SOFR + 1.507% | | 01/13/2031 | | | 564,595 | |
| | | | | | | | | | | | | |
| Great Britain - 0.22% | | | | | | | |
| | 510,000 | | | Anglo American Capital PLC(g) | | 4.50% | | 03/15/2028 | | | 583,843 | |
| | 565,000 | | | Barclays PLC(f) | | 3M US L + 1.38% | | 05/16/2024 | | | 566,830 | |
See Notes to Financial Statements.
| Annual Report | September 30, 2020 | 34 |
| RiverNorth/DoubleLine Strategic Income Fund | Schedule of Investments |
September 30, 2020
| Principal Amount/Description | | Rate | | Maturity | | Value | |
| $ | 510,000 | | | Credit Agricole SA/London(g) | | 3.75% | | 04/24/2023 | | $ | 547,710 | |
| | 930,000 | | | HSBC Holdings PLC(f) | | 3M US L + 1.38% | | 09/12/2026 | | | 921,932 | |
| | 350,000 | | | Imperial Brands Finance PLC(g) | | 3.50% | | 07/26/2026 | | | 379,138 | |
| | 530,000 | | | Lloyds Banking Group PLC(f) | | 3M US L + 1.21% | | 11/07/2028 | | | 580,724 | |
| | 450,000 | | | Vedanta Resources Finance II PLC(g) | | 9.25% | | 04/23/2026 | | | 338,850 | |
| | 200,000 | | | Vedanta Resources Finance II PLC(e) | | 9.25% | | 04/23/2026 | | | 150,600 | |
| | | | | | | | | | | | 4,069,627 | |
| Guatemala - 0.02% | | | | | | | |
| | 300,000 | | | Energuate Trust(e) | | 5.88% | | 05/03/2027 | | | 310,969 | |
| | | | | | | | | | | | | |
| Hong Kong - 0.15% | | | | | | �� | |
| | 1,000,000 | | | Bangkok Bank PCL(d)(f)(g) | | 5Y US TI + 4.729% | | Perpetual Maturity | | | 1,002,960 | |
| | 200,000 | | | CNAC HK Finbridge Co., Ltd. | | 3.38% | | 06/19/2024 | | | 208,170 | |
| | 200,000 | | | CNOOC Finance 2012, Ltd.(e) | | 3.88% | | 05/02/2022 | | | 208,850 | |
| | 400,000 | | | CNOOC Finance 2013, Ltd. | | 3.00% | | 05/09/2023 | | | 419,736 | |
| | 600,000 | | | RKP Overseas Finance, Ltd.(d) | | 7.95% | | Perpetual Maturity | | | 586,810 | |
| | 400,000 | | | RKPF Overseas, Ltd.(d)(f) | | 7.75% | | Perpetual Maturity | | | 390,200 | |
| | | | | | | | | | | | 2,816,726 | |
| India - 0.13% | | | | | | | |
| | 200,000 | | | Adani Ports & Special Economic Zone, Ltd.(e) | | 3.95% | | 01/19/2022 | | | 204,223 | |
| | 200,000 | | | Indian Oil Corp., Ltd. | | 5.75% | | 08/01/2023 | | | 218,621 | |
| | 650,000 | | | Network i2i, Ltd.(d)(f)(g) | | 5.65% | | Perpetual Maturity | | | 653,250 | |
| | 650,000 | | | Reliance Industries, Ltd.(e) | | 5.40% | | 02/14/2022 | | | 685,261 | |
| | 800,000 | | | Vedanta Resources, Ltd.(e) | | 6.13% | | 08/09/2024 | | | 566,553 | |
| | | | | | | | | | | | 2,327,908 | |
| Indonesia - 0.15% | | | | | | | |
| | 1,000,000 | | | Bayan Resources Tbk PT(e) | | 6.13% | | 01/24/2023 | | | 948,020 | |
| | 1,000,000 | | | Perusahaan Perseroan Persero PT Perusahaan Listrik Negara(e) | 5.50% | | 11/22/2021 | | | 1,050,875 | |
| | 589,550 | | | Star Energy Geothermal Wayang Windu, Ltd.(e) | | 6.75% | | 04/24/2033 | | | 650,653 | |
| | | | | | | | | | | | 2,649,548 | |
| Ireland - 0.11% | | | | | | | |
| | 760,000 | | | AerCap Ireland Capital DAC / AerCap Global Aviation Trust | | 3.50% | | 01/15/2025 | | | 740,634 | |
| | 600,000 | | | C&W Senior Financing DAC(e) | | 6.88% | | 09/15/2027 | | | 624,795 | |
| | 640,000 | | | Shire Acquisitions Investments Ireland DAC | | 2.88% | | 09/23/2023 | | | 679,686 | |
| | | | | | | | | | | | 2,045,115 | |
See Notes to Financial Statements.
| 35 | (888) 848-7569 | www.rivernorth.com |
| RiverNorth/DoubleLine Strategic Income Fund | Schedule of Investments |
| Principal Amount/Description | | Rate | | Maturity | | Value | |
| Israel - 0.08% | | | | | |
| $ | 100,000 | | | Delek & Avner Tamar Bond, Ltd.(g) | | 5.08% | | 12/30/2023 | | $ | 101,809 | |
| | 100,000 | | | Delek & Avner Tamar Bond, Ltd.(g) | | 5.41% | | 12/30/2025 | | | 101,807 | |
| | 1,100,000 | | | Israel Electric Corp., Ltd.(g) | | 5.00% | | 11/12/2024 | | | 1,241,510 | |
| | | | | | | | | | | | 1,445,126 | |
| Jamaica - 0.00%(a) | | | | | | | |
| | 61,466 | | | Digicel Group 0.5, Ltd.(g)(i) | | 8.00% (8.00%) | | 04/01/2025 | | | 21,820 | |
| | | | | | | | | | | | | |
| Japan - 0.09% | | | | | | | |
| | 570,000 | | | Mitsubishi UFJ Financial Group, Inc. | | 1.41% | | 07/17/2025 | | | 577,966 | |
| | 975,000 | | | Sumitomo Mitsui Financial Group, Inc.(f) | | 3M US L + 0.74% | | 01/17/2023 | | | 979,722 | |
| | | | | | | | | | | | 1,557,688 | |
| Luxembourg - 0.06% | | | | | | | |
| | 400,000 | | | JSL Europe SA(e) | | 7.75% | | 07/26/2024 | | | 413,500 | |
| | 550,000 | | | Millicom International Cellular SA(e) | | 6.25% | | 03/25/2029 | | | 588,398 | |
| | 140,000 | | | Schlumberger Investment SA | | 2.65% | | 06/26/2030 | | | 141,972 | |
| | | | | | | | | | | | 1,143,870 | |
| Malaysia - 0.05% | | | | | | | |
| | 200,000 | | | CIMB Bank Bhd(f) | | 3M US L + 0.78% | | 10/09/2024 | | | 199,051 | |
| | 400,000 | | | Malayan Banking Bhd(f) | | 3.91% | | 10/29/2026 | | | 408,566 | |
| | 200,000 | | | TNB Global Ventures Capital Bhd | | 3.24% | | 10/19/2026 | | | 215,516 | |
| | | | | | | | | | | | 823,133 | |
| Mauritius - 0.07% | | | | | | | |
| | 900,000 | | | UPL Corp., Ltd.(d)(f) | | 5.25% | | Perpetual Maturity | | | 851,490 | |
| | 400,000 | | | UPL Corp., Ltd.(e) | | 3.25% | | 10/13/2021 | | | 405,478 | |
| | | | | | | | | | | | 1,256,968 | |
| Mexico - 0.40% | | | | | | | |
| | 700,000 | | | Alpha Holding SA de CV(g) | | 9.00% | | 02/10/2025 | | | 533,050 | |
| | 200,000 | | | Alpha Holding SA de CV(e) | | 9.00% | | 02/10/2025 | | | 152,300 | |
| | 500,000 | | | Banco Santander Mexico SA Institucion de Banca Multiple Grupo Financiero Santand(d)(f) | | 8.50% | | Perpetual Maturity | | | 516,300 | |
| | 650,000 | | | BBVA Bancomer SA(e)(f) | | 5.13% | | 01/18/2033 | | | 626,697 | |
| | 350,000 | | | Braskem Idesa SAPI(g) | | 7.45% | | 11/15/2029 | | | 329,966 | |
| | 300,000 | | | Braskem Idesa SAPI(e) | | 7.45% | | 11/15/2029 | | | 282,828 | |
| | 500,000 | | | Credito Real SAB de CV SOFOM ER(e) | | 9.50% | | 02/07/2026 | | | 481,375 | |
| | 1,200,000 | | | Credito Real SAB de CV SOFOM ER(d)(e)(f) | | 9.13% | | Perpetual Maturity | | | 915,012 | |
| | 301,619 | | | Fermaca Enterprises S RL(e) | | 6.38% | | 03/30/2038 | | | 325,749 | |
| | 800,000 | | | Mexarrend SAPI de CV(g) | | 10.25% | | 07/24/2024 | | | 593,000 | |
| | 200,000 | | | Mexarrend SAPI de CV(e) | | 10.25% | | 07/24/2024 | | | 148,250 | |
| | 750,000 | | | Operadora de Servicios Mega SA de CV Sofom ER(g) | | 8.25% | | 02/11/2025 | | | 691,406 | |
See Notes to Financial Statements.
| Annual Report | September 30, 2020 | 36 |
| RiverNorth/DoubleLine Strategic Income Fund | Schedule of Investments |
September 30, 2020
| Principal Amount/Description | | Rate | | Maturity | | Value | |
| $ | 600,000 | | | TV Azteca SAB de CV | | 8.25% | | 08/09/2024 | | $ | 375,687 | |
| | 200,000 | | | Unifin Financiera SAB de CV(e) | | 7.38% | | 02/12/2026 | | | 161,002 | |
| | 200,000 | | | Unifin Financiera SAB de CV(e) | | 8.38% | | 01/27/2028 | | | 162,980 | |
| | 1,400,000 | | | Unifin Financiera SAB de CV(d)(e)(f) | | 8.88% | | Perpetual Maturity | | | 976,500 | |
| | | | | | | | | | | | 7,272,102 | |
| Netherlands - 0.27% | | | | | | | |
| | 400,000 | | | AES Andres BV / Dominican Power Partners / Empresa Generadora de Electricidad It(g) | | 7.95% | | 05/11/2026 | | | 408,004 | |
| | 945,000 | | | AES Andres BV / Dominican Power Partners / Empresa Generadora de Electricidad It(e) | | 7.95% | | 05/11/2026 | | | 963,909 | |
| | 200,000 | | | Ajecorp BV(e) | | 6.50% | | 05/14/2022 | | | 198,703 | |
| | 300,000 | | | Braskem Netherlands Finance BV(f)(g) | | 5Y US TI + 8.22% | | 01/23/2081 | | | 301,690 | |
| | 950,000 | | | Braskem Netherlands Finance BV(e) | | 5.88% | | 01/31/2050 | | | 875,435 | |
| | 256,500 | | | Indo Energy Finance II BV(e) | | 6.38% | | 01/24/2023 | | | 250,715 | |
| | 800,000 | | | Metinvest BV(e) | | 7.75% | | 10/17/2029 | | | 767,000 | |
| | 235,000 | | | NXP BV / NXP Funding LLC / NXP USA, Inc.(g) | | 3.88% | | 06/18/2026 | | | 263,674 | |
| | 600,000 | | | Petrobras Global Finance BV | | 6.90% | | 03/19/2049 | | | 668,160 | |
| | 200,000 | | | Syngenta Finance NV | | 4.38% | | 03/28/2042 | | | 194,066 | |
| | | | | | | | | | | | 4,891,356 | |
| New Zealand - 0.03% | | | | | | | |
| | 520,000 | | | Bank of New Zealand(g) | | 3.50% | | 02/20/2024 | | | 566,909 | |
| | | | | | | | | | | | | |
| Panama - 0.03% | | | | | | | |
| | 200,000 | | | AES Panama Generation Holdings SRL(g) | | 4.38% | | 05/31/2030 | | | 205,950 | |
| | 150,000 | | | Banco de Credito del Peru/Panama(e)(f) | | 7.043% - 3M US L | | 04/24/2027 | | | 158,625 | |
| | 200,000 | | | Multibank, Inc.(e) | | 4.38% | | 11/09/2022 | | | 203,803 | |
| | | | | | | | | | | | 568,378 | |
| Peru - 0.14% | | | | | | | |
| | 100,000 | | | Banco BBVA Peru SA(e) | | 5.00% | | 08/26/2022 | | | 107,101 | |
| | 200,000 | | | Banco de Credito del Peru(f)(g) | | 3.13% | | 07/01/2030 | | | 200,976 | |
| | 300,000 | | | Camposol SA(g) | | 6.00% | | 02/03/2027 | | | 308,157 | |
| | 750,000 | | | Hunt Oil Co. of Peru LLC Sucursal Del Peru(e) | | 6.38% | | 06/01/2028 | | | 750,938 | |
| | 1,450,000 | | | Peru LNG Srl(e) | | 5.38% | | 03/22/2030 | | | 1,115,775 | |
| | | | | | | | | | | | 2,482,947 | |
| Philippines - 0.06% | | | | | | | |
| | 600,000 | | | BDO Unibank, Inc. | | 2.95% | | 03/06/2023 | | | 623,983 | |
See Notes to Financial Statements.
| 37 | (888) 848-7569 | www.rivernorth.com |
| RiverNorth/DoubleLine Strategic Income Fund | Schedule of Investments |
September 30, 2020
| Principal Amount/Description | | Rate | | Maturity | | Value | |
| $ | 400,000 | | | Union Bank of the Philippines | | 3.37% | | 11/29/2022 | | $ | 416,538 | |
| | | | | | | | | | | | 1,040,521 | |
| Singapore - 0.33% | | | | | | | |
| | 715,000 | | | BOC Aviation, Ltd.(f)(g) | | 3M US L + 1.13% | | 09/26/2023 | | | 701,140 | |
| | 800,000 | | | DBS Group Holdings, Ltd.(d)(f) | | 3.60% | | Perpetual Maturity | | | 801,000 | |
| | 800,000 | | | Indika Energy Capital III Pte, Ltd.(e) | | 5.88% | | 11/09/2024 | | | 720,000 | |
| | 400,000 | | | Medco Bell Pte, Ltd.(g) | | 6.38% | | 01/30/2027 | | | 346,000 | |
| | 600,000 | | | Medco Oak Tree Pte, Ltd.(e) | | 7.38% | | 05/14/2026 | | | 578,128 | |
| | 400,000 | | | ONGC Videsh Vankorneft Pte, Ltd. | | 2.88% | | 01/27/2022 | | | 403,694 | |
| | 200,000 | | | ONGC Videsh Vankorneft Pte, Ltd. | | 3.75% | | 07/27/2026 | | | 208,571 | |
| | 700,000 | | | Oversea-Chinese Banking Corp., Ltd.(f)(g) | | 5Y US TI + 1.58% | | 09/10/2030 | | | 699,109 | |
| | 200,000 | | | PSA Treasury Pte, Ltd. | | 2.13% | | 09/05/2029 | | | 208,868 | |
| | 350,000 | | | Temasek Financial I, Ltd.(g) | | 1.00% | | 10/06/2030 | | | 345,431 | |
| | 400,000 | | | United Overseas Bank, Ltd.(f) | | 2.88% | | 03/08/2027 | | | 407,406 | |
| | 500,000 | | | United Overseas Bank, Ltd.(d)(f) | | 3.88% | | Perpetual Maturity | | | 514,025 | |
| | | | | | | | | | | | 5,933,372 | |
| South Korea - 0.05% | | | | | | | |
| | 200,000 | | | Korea East-West Power Co., Ltd.(g) | | 1.75% | | 05/06/2025 | | | 206,863 | |
| | 200,000 | | | NongHyup Bank(g) | | 1.25% | | 07/20/2025 | | | 202,161 | |
| | 200,000 | | | POSCO(e) | | 2.38% | | 11/12/2022 | | | 205,058 | |
| | 200,000 | | | POSCO(e) | | 2.38% | | 01/17/2023 | | | 205,121 | |
| | | | | | | | | | | | 819,203 | |
| Spain - 0.03% | | | | | | | |
| | 600,000 | | | Banco Santander SA(f) | | 3M US L + 1.09% | | 02/23/2023 | | | 601,588 | |
| | | | | | | | | | | | | |
| Switzerland - 0.06% | | | | | | | |
| | 500,000 | | | Credit Suisse Group AG(f)(g) | | 3M US L + 1.24% | | 06/12/2024 | | | 504,295 | |
| | 650,000 | | | Walnut Bidco PLC(e) | | 9.13% | | 08/01/2024 | | | 668,804 | |
| | | | | | | | | | | | 1,173,099 | |
| Thailand - 0.01% | | | | | | | |
| | 200,000 | | | PTTEP Treasury Center Co., Ltd.(g) | | 2.59% | | 06/10/2027 | | | 207,218 | |
| | | | | | | | | | | | | |
| Trinidad and Tobago - 0.01% | | | | | | | |
| | 200,000 | | | Telecommunications Services of Trinidad & Tobago, Ltd.(e) | | 8.88% | | 10/18/2029 | | | 198,750 | |
| | | | | | | | | | | | | |
| TOTAL FOREIGN CORPORATE BONDS | | | | | | | |
| (Cost $84,043,469) | | | | | | 83,380,376 | |
See Notes to Financial Statements.
| Annual Report | September 30, 2020 | 38 |
| RiverNorth/DoubleLine Strategic Income Fund | Schedule of Investments |
September 30, 2020
| Principal Amount/Description | | Rate | | Maturity | | | Value | |
| U.S. CORPORATE BONDS - 5.52% | | | | | | | | |
| Advertising - 0.03% | | | | | | | | |
| $ | 460,000 | | | Interpublic Group of Cos., Inc. | | 5.40% | | 10/01/2048 | | | $ | 542,540 | |
| Aerospace & Defense - 0.01% | | | | | | | | |
| | 220,000 | | | TransDigm, Inc.(g) | | 6.25% | | 09/18/2023 | | | | 230,957 | |
| Aerospace/Defense - 0.13% | | | | | | | | |
| | 405,000 | | | Lockheed Martin Corp. | | 4.70% | | 05/15/2046 | | | | 552,087 | |
| | 350,000 | | | Northrop Grumman Corp. | | 5.15% | | 05/01/2040 | | | | 471,233 | |
| | 30,000 | | | TransDigm, Inc.(g) | | 8.00% | | 12/15/2025 | | | | 32,655 | |
| | 75,000 | | | TransDigm, Inc. | | 6.38% | | 06/15/2026 | | | | 75,469 | |
| | 135,000 | | | TransDigm, Inc. | | 5.50% | | 11/15/2027 | | | | 129,998 | |
| | 1,115,000 | | | Triumph Group, Inc.(g) | | 6.25% | | 09/15/2024 | | | | 951,117 | |
| | 370,000 | | | Triumph Group, Inc. | | 7.75% | | 08/15/2025 | | | | 238,650 | |
| | | | | | | | | | | | | 2,451,209 | |
| Agriculture - 0.10% | | | | | | | | |
| | 495,000 | | | Altria Group, Inc. | | 4.80% | | 02/14/2029 | | | | 587,840 | |
| | 820,000 | | | BAT Capital Corp. | | 3.46% | | 09/06/2029 | | | | 874,224 | |
| | 321,693 | | | Pyxus Holdings, Inc. | | 10.00% | | 08/24/2024 | | | | 281,481 | |
| | | | | | | | | | | | | 1,743,545 | |
| Airlines - 0.29% | | | | | | | | |
| | 60,000 | | | Delta Air Lines, Inc. / SkyMiles IP, Ltd.(g) | | 4.75% | | 10/20/2028 | | | | 62,339 | |
| | 3,000,000 | | | JetBlue 2019-1 Class B Pass Through Trust | | 8.00% | | 11/15/2027 | | | | 3,113,079 | |
| | 150,000 | | | Mileage Plus Holdings LLC / Mileage Plus Intellectual Property Assets, Ltd.(g) | | 6.50% | | 06/20/2027 | | | | 156,563 | |
| | 305,000 | | | Southwest Airlines Co. | | 4.75% | | 05/04/2023 | | | | 325,976 | |
| | 1,683,560 | | | US Airways 2012-2 Class B Pass Through Trust | | 6.75% | | 06/03/2021 | | | | 1,578,338 | |
| | | | | | | | | | | | | 5,236,295 | |
| Apparel - 0.02% | | | | | | | | |
| | 310,000 | | | William Carter Co.(g) | | 5.50% | | 05/15/2025 | | | | 325,306 | |
| Auto Manufacturers - 0.12% | | | | | | | | |
| | 110,000 | | | Ford Motor Co. | | 9.00% | | 04/22/2025 | | | | 126,258 | |
| | 200,000 | | | Ford Motor Credit Co. LLC | | 4.39% | | 01/08/2026 | | | | 198,000 | |
| | 865,000 | | | General Motors Financial Co., Inc.(f) | | 3M US L + 0.99% | | 01/05/2023 | | | | 855,958 | |
| | 25,000 | | | General Motors Financial Co., Inc. | | 3.95% | | 04/13/2024 | | | | 26,468 | |
| | 560,000 | | | Hyundai Capital America(g) | | 2.65% | | 02/10/2025 | | | | 577,742 | |
| | 55,000 | | | Hyundai Capital America(g) | | 1.80% | | 10/15/2025 | | | | 54,762 | |
| | 355,000 | | | Volkswagen Group of America Finance LLC(g) | | 4.25% | | 11/13/2023 | | | | 390,440 | |
| | | | | | | | | | | | | 2,229,628 | |
See Notes to Financial Statements.
| 39 | (888) 848-7569 | www.rivernorth.com |
| RiverNorth/DoubleLine Strategic Income Fund | Schedule of Investments |
September 30, 2020
| Principal Amount/Description | | Rate | | Maturity | | | Value | |
| Auto Parts & Equipment - 0.01% | | | | | | | | |
| $ | 105,000 | | | Clarios Global LP / Clarios US Finance Co.(g) | | 6.25% | | 05/15/2026 | | | $ | 110,295 | |
| Banks - 0.22% | | | | | | | | |
| | 525,000 | | | Bank of America Corp.(f) | | 3M US L + 1.21% | | 02/07/2030 | | | | 611,020 | |
| | 300,000 | | | BBVA Bancomer SA(e)(f) | | 5.40% | | 11/12/2029 | | | | 298,500 | |
| | 955,000 | | | Citigroup, Inc.(f) | | 3M US L + 1.10% | | 05/17/2024 | | | | 963,772 | |
| | 720,000 | | | Goldman Sachs Group, Inc.(f) | | 3M US L + 1.17% | | 05/15/2026 | | | | 727,649 | |
| | 350,000 | | | JPMorgan Chase & Co.(f) | | 1D US SOFR + 2.04% | | 04/22/2031 | | | | 373,490 | |
| | 500,000 | | | Morgan Stanley(f) | | 3M US L + 1.34% | | 07/22/2028 | | | | 563,093 | |
| | 245,000 | | | Wells Fargo & Co.(f) | | 3M US L + 1.17% | | 06/17/2027 | | | | 266,213 | |
| | 265,000 | | | Wells Fargo & Co.(f) | | 3M US L + 1.17% | | 10/30/2030 | | | | 283,105 | |
| | | | | | | | | | | | | 4,086,842 | |
| Beverages - 0.07% | | | | | | | | |
| | 550,000 | | | Anheuser-Busch InBev Worldwide, Inc. | | 4.60% | | 04/15/2048 | | | | 656,626 | |
| | 250,000 | | | Constellation Brands, Inc. | | 3.15% | | 08/01/2029 | | | | 273,387 | |
| | 35,000 | | | Constellation Brands, Inc. | | 2.88% | | 05/01/2030 | | | | 37,874 | |
| | 200,000 | | | Keurig Dr Pepper, Inc. | | 3.80% | | 05/01/2050 | | | | 230,411 | |
| | | | | | | | | | | | | 1,198,298 | |
| Biotechnology - 0.02% | | | | | | | | |
| | 325,000 | | | Royalty Pharma PLC(g) | | 3.30% | | 09/02/2040 | | | | 319,569 | |
| Building Materials - 0.06% | | | | | | | | |
| | 180,000 | | | Builders FirstSource, Inc.(g) | | 6.75% | | 06/01/2027 | | | | 193,050 | |
| | 360,000 | | | Carrier Global Corp.(g) | | 3.38% | | 04/05/2040 | | | | 377,057 | |
| | 130,000 | | | Griffon Corp. | | 5.75% | | 03/01/2028 | | | | 136,010 | |
| | 275,000 | | | Owens Corning | | 4.40% | | 01/30/2048 | | | | 307,129 | |
| | | | | | | | | | | | | 1,013,246 | |
| Chemicals - 0.11% | | | | | | | | |
| | 215,000 | | | DuPont de Nemours, Inc. | | 5.42% | | 11/15/2048 | | | | 288,443 | |
| | 780,000 | | | Illuminate Buyer LLC / Illuminate Holdings IV, Inc.(g) | | 9.00% | | 07/01/2028 | | | | 837,525 | |
| | 700,000 | | | Sasol Financing USA LLC | | 5.88% | | 03/27/2024 | | | | 677,250 | |
| | 200,000 | | | Sasol Financing USA LLC | | 6.50% | | 09/27/2028 | | | | 189,960 | |
| | | | | | | | | | | | | 1,993,178 | |
| Coal - 0.01% | | | | | | | | |
| | 110,000 | | | Peabody Energy Corp.(g) | | 6.00% | | 03/31/2022 | | | | 64,900 | |
| | 160,000 | | | SunCoke Energy Partners LP / SunCoke Energy Partners Finance Corp.(g) | | 7.50% | | 06/15/2025 | | | | 144,723 | |
| | | | | | | | | | | | | 209,623 | |
| Commercial Services - 0.08% | | | | | | | | |
| | 90,000 | | | Allied Universal Holdco LLC / Allied Universal Finance Corp.(g) | | 6.63% | | 07/15/2026 | | | | 95,962 | |
See Notes to Financial Statements.
| Annual Report | September 30, 2020 | 40 |
| RiverNorth/DoubleLine Strategic Income Fund | Schedule of Investments |
September 30, 2020
| Principal Amount/Description | | Rate | | Maturity | | | Value | |
| $ | 175,000 | | | Allied Universal Holdco LLC / Allied Universal Finance Corp.(g) | | 9.75% | | 07/15/2027 | | | $ | 190,445 | |
| | 80,000 | | | Jaguar Holding Co. II / PPD Development LP(g) | | 5.00% | | 06/15/2028 | | | | 83,600 | |
| | 195,000 | | | MPH Acquisition Holdings LLC(g) | | 7.13% | | 06/01/2024 | | | | 200,606 | |
| | 150,000 | | | Prime Security Services Borrower LLC / Prime Finance, Inc.(g) | | 3.38% | | 08/31/2027 | | | | 144,469 | |
| | 335,000 | | | Sabre GLBL, Inc.(g) | | 7.38% | | 09/01/2025 | | | | 338,853 | |
| | 160,000 | | | United Rentals North America, Inc. | | 5.25% | | 01/15/2030 | | | | 174,900 | |
| | 197,000 | | | Verscend Escrow Corp.(g) | | 9.75% | | 08/15/2026 | | | | 214,689 | |
| | | | | | | | | | | | | 1,443,524 | |
| Computers - 0.14% | | | | | | | | |
| | 545,000 | | | Apple, Inc. | | 4.65% | | 02/23/2046 | | | | 761,393 | |
| | 515,000 | | | Dell International LLC / EMC Corp.(g) | | 6.10% | | 07/15/2027 | | | | 608,787 | |
| | 780,000 | | | Flexential Intermediate Corp.(g) | | 11.25% | | 08/01/2024 | | | | 798,037 | |
| | 305,000 | | | NetApp, Inc. | | 1.88% | | 06/22/2025 | | | | 316,483 | |
| | | | | | | | | | | | | 2,484,700 | |
| Distribution/Wholesale - 0.01% | | | | | | | | |
| | 160,000 | | | Performance Food Group, Inc.(g) | | 5.50% | | 10/15/2027 | | | | 165,093 | |
| Diversified Financial Services - 0.23% | | | | | | | | |
| | 563,000 | | | Air Lease Corp. | | 3.75% | | 02/01/2022 | | | | 574,553 | |
| | 220,000 | | | Capital One Financial Corp.(f) | | 3M US L + 0.72% | | 01/30/2023 | | | | 220,186 | |
| | 515,000 | | | Charles Schwab Corp. | | 3.55% | | 02/01/2024 | | | | 563,133 | |
| | 1,055,000 | | | Discover Financial Services | | 4.10% | | 02/09/2027 | | | | 1,170,393 | |
| | 105,000 | | | Nationstar Mortgage Holdings, Inc.(g) | | 5.50% | | 08/15/2028 | | | | 105,066 | |
| | 95,000 | | | Navient Corp. | | 5.00% | | 03/15/2027 | | | | 89,339 | |
| | 95,000 | | | NFP Corp.(g) | | 6.88% | | 08/15/2028 | | | | 96,149 | |
| | 165,000 | | | OneMain Finance Corp. | | 6.63% | | 01/15/2028 | | | | 183,396 | |
| | 105,000 | | | PennyMac Financial Services, Inc.(g) | | 5.38% | | 10/15/2025 | | | | 106,444 | |
| | 745,000 | | | Synchrony Financial | | 3.95% | | 12/01/2027 | | | | 801,798 | |
| | 235,000 | | | Tempo Acquisition LLC / Tempo Acquisition Finance Corp.(g) | | 6.75% | | 06/01/2025 | | | | 240,284 | |
| | | | | | | | | | | | | 4,150,741 | |
| Electric - 0.44% | | | | | | | | |
| | 210,000 | | | Arizona Public Service Co. | | 3.35% | | 05/15/2050 | | | | 231,390 | |
| | 155,000 | | | Calpine Corp.(g) | | 5.13% | | 03/15/2028 | | | | 160,644 | |
| | 35,000 | | | Calpine Corp.(g) | | 4.63% | | 02/01/2029 | | | | 35,022 | |
| | 360,000 | | | Duke Energy Corp. | | 3.95% | | 08/15/2047 | | | | 425,389 | |
| | 360,000 | | | Duke Energy Progress LLC | | 4.15% | | 12/01/2044 | | | | 449,058 | |
| | 175,000 | | | Entergy Corp. | | 2.80% | | 06/15/2030 | | | | 189,894 | |
| | 325,000 | | | Eversource Energy | | 1.65% | | 08/15/2030 | | | | 324,381 | |
| | 105,000 | | | FirstEnergy Corp. | | 2.25% | | 09/01/2030 | | | | 102,800 | |
| | 240,000 | | | General Electric Co. | | 5.88% | | 01/14/2038 | | | | 280,359 | |
See Notes to Financial Statements.
| 41 | (888) 848-7569 | www.rivernorth.com |
| RiverNorth/DoubleLine Strategic Income Fund | Schedule of Investments |
September 30, 2020
| Principal Amount/Description | | Rate | | Maturity | | | Value | |
| $ | 715,000 | | | Georgia Power Co. | | 2.20% | | 09/15/2024 | | | $ | 754,572 | |
| | 1,100,000 | | | ITC Holdings Corp. | | 3.25% | | 06/30/2026 | | | | 1,229,769 | |
| | 275,000 | | | Monongahela Power Co.(g) | | 5.40% | | 12/15/2043 | | | | 387,495 | |
| | 300,000 | | | NextEra Energy Capital Holdings, Inc. | | 3.55% | | 05/01/2027 | | | | 338,522 | |
| | 500,000 | | | NextEra Energy Capital Holdings, Inc. | | 2.25% | | 06/01/2030 | | | | 521,676 | |
| | 550,000 | | | Oncor Electric Delivery Co. LLC | | 3.10% | | 09/15/2049 | | | | 605,043 | |
| | 65,000 | | | PG&E Corp. | | 5.00% | | 07/01/2028 | | | | 63,136 | |
| | 115,000 | | | Pike Corp.(g) | | 5.50% | | 09/01/2028 | | | | 116,071 | |
| | 370,000 | | | Pinnacle West Capital Corp. | | 1.30% | | 06/15/2025 | | | | 375,958 | |
| | 255,000 | | | PSEG Power LLC | | 3.85% | | 06/01/2023 | | | | 274,541 | |
| | 1,000,000 | | | Virginia Electric and Power Co. | | 3.50% | | 03/15/2027 | | | | 1,139,197 | |
| | | | | | | | | | | | | 8,004,917 | |
| Electrical Components & Equipment - 0.01% | | | | | | | | |
| | 175,000 | | | Energizer Holdings, Inc.(g) | | 4.75% | | 06/15/2028 | | | | 181,335 | |
| Electronics - 0.05% | | | | | | | | |
| | 265,000 | | | Arrow Electronics, Inc. | | 3.88% | | 01/12/2028 | | | | 295,006 | |
| | 650,000 | | | Roper Technologies, Inc. | | 1.75% | | 02/15/2031 | | | | 649,297 | |
| | | | | | | | | | | | | 944,303 | |
| Engineering & Construction - 0.02% | | | | | | | | |
| | 400,000 | | | SBA Tower Trust(g) | | 3.17% | | 04/11/2022 | | | | 405,194 | |
| Entertainment - 0.08% | | | | | | | | |
| | 160,000 | | | Caesars Entertainment, Inc.(g) | | 6.25% | | 07/01/2025 | | | | 167,001 | |
| | 150,000 | | | Cedar Fair LP | | 5.25% | | 07/15/2029 | | | | 142,660 | |
| | 210,000 | | | Lions Gate Capital Holdings LLC(g) | | 6.38% | | 02/01/2024 | | | | 208,554 | |
| | 150,000 | | | Live Nation Entertainment, Inc.(g) | | 6.50% | | 05/15/2027 | | | | 162,078 | |
| | 220,000 | | | Live Nation Entertainment, Inc.(g) | | 4.75% | | 10/15/2027 | | | | 206,388 | |
| | 135,000 | | | Scientific Games International, Inc.(g) | | 7.25% | | 11/15/2029 | | | | 137,253 | |
| | 305,000 | | | Six Flags Theme Parks, Inc.(g) | | 7.00% | | 07/01/2025 | | | | 325,016 | |
| | 180,000 | | | Twin River Worldwide Holdings, Inc.(g) | | 6.75% | | 06/01/2027 | | | | 179,640 | |
| | | | | | | | | | | | | 1,528,590 | |
| Food - 0.18% | | | | | | | | |
| | 100,000 | | | Albertsons Cos. Inc / Safeway, Inc. / New Albertsons LP / Albertsons LLC(g) | | 3.50% | | 03/15/2029 | | | | 97,250 | |
| | 100,000 | | | B&G Foods, Inc. | | 5.25% | | 04/01/2025 | | | | 102,850 | |
| | 80,000 | | | B&G Foods, Inc. | | 5.25% | | 09/15/2027 | | | | 83,541 | |
| | 185,000 | | | Campbell Soup Co. | | 2.38% | | 04/24/2030 | | | | 192,563 | |
| | 20,000 | | | JBS USA LUX SA / JBS USA Finance, Inc.(g) | | 5.88% | | 07/15/2024 | | | | 20,414 | |
| | 25,000 | | | JBS USA LUX SA / JBS USA Finance, Inc.(g) | | 5.75% | | 06/15/2025 | | | | 25,833 | |
See Notes to Financial Statements.
| Annual Report | September 30, 2020 | 42 |
| RiverNorth/DoubleLine Strategic Income Fund | Schedule of Investments |
September 30, 2020
| Principal Amount/Description | | Rate | | Maturity | | | Value | |
| $ | 230,000 | | | JBS USA LUX SA / JBS USA Finance, Inc.(g) | | 6.75% | | 02/15/2028 | | | $ | 250,403 | |
| | 75,000 | | | Kraft Heinz Foods Co. | | 5.00% | | 07/15/2035 | | | | 86,469 | |
| | 205,000 | | | Kraft Heinz Foods Co. | | 5.20% | | 07/15/2045 | | | | 224,343 | |
| | 275,000 | | | Kroger Co. | | 3.40% | | 04/15/2022 | | | | 285,334 | |
| | 210,000 | | | Mondelez International, Inc. | | 1.50% | | 05/04/2025 | | | | 215,785 | |
| | 335,000 | | | Mondelez International, Inc. | | 1.88% | | 10/15/2032 | | | | 334,287 | |
| | 130,000 | | | Pilgrim's Pride Corp.(g) | | 5.88% | | 09/30/2027 | | | | 134,388 | |
| | 180,000 | | | Post Holdings, Inc.(g) | | 4.63% | | 04/15/2030 | | | | 185,400 | |
| | 554,000 | | | Smithfield Foods, Inc.(g) | | 4.25% | | 02/01/2027 | | | | 606,195 | |
| | 495,000 | | | Sysco Corp. | | 3.30% | | 02/15/2050 | | | | 473,949 | |
| | 25,000 | | | US Foods, Inc.(g) | | 6.25% | | 04/15/2025 | | | | 26,502 | |
| | | | | | | | | | | | | 3,345,506 | |
| Healthcare-Products - 0.04% | | | | | | | | |
| | 145,000 | | | Ortho-Clinical Diagnostics, Inc. / Ortho-Clinical Diagnostics SA(g) | | 7.38% | | 06/01/2025 | | | | 147,447 | |
| | 505,000 | | | Ortho-Clinical Diagnostics, Inc. / Ortho-Clinical Diagnostics SA(g) | | 7.25% | | 02/01/2028 | | | | 526,147 | |
| | | | | | | | | | | | | 673,594 | |
| Healthcare-Services - 0.12% | | | | | | | | |
| | 265,000 | | | Anthem, Inc. | | 2.38% | | 01/15/2025 | | | | 281,795 | |
| | 85,000 | | | Centene Corp. | | 3.00% | | 10/15/2030 | | | | 86,700 | |
| | 120,000 | | | HCA, Inc. | | 4.13% | | 06/15/2029 | | | | 135,735 | |
| | 85,000 | | | Health Care Service Corp. A Mutual Legal Reserve Co.(g) | | 3.20% | | 06/01/2050 | | | | 88,396 | |
| | 85,000 | | | LifePoint Health, Inc.(g) | | 6.75% | | 04/15/2025 | | | | 89,675 | |
| | 145,000 | | | LifePoint Health, Inc.(g) | | 4.38% | | 02/15/2027 | | | | 145,544 | |
| | 935,000 | | | Radiology Partners, Inc.(g) | | 9.25% | | 02/01/2028 | | | | 974,737 | |
| | 155,000 | | | Select Medical Corp.(g) | | 6.25% | | 08/15/2026 | | | | 161,439 | |
| | 205,000 | | | West Street Merger Sub, Inc.(g) | | 6.38% | | 09/01/2025 | | | | 209,569 | |
| | | | | | | | | | | | | 2,173,590 | |
| Insurance - 0.15% | | | | | | | | |
| | 125,000 | | | Alliant Holdings Intermediate LLC / Alliant Holdings Co.-Issuer(g) | | 6.75% | | 10/15/2027 | | | | 131,351 | |
| | 620,000 | | | Athene Global Funding(g) | | 3.00% | | 07/01/2022 | | | | 640,438 | |
| | 785,000 | | | Equitable Holdings, Inc. | | 3.90% | | 04/20/2023 | | | | 843,789 | |
| | 160,000 | | | GTCR AP Finance, Inc.(g) | | 8.00% | | 05/15/2027 | | | | 170,100 | |
| | 340,000 | | | Prudential Financial, Inc. | | 3.91% | | 12/07/2047 | | | | 378,068 | |
| | 485,000 | | | Willis North America, Inc. | | 4.50% | | 09/15/2028 | | | | 578,657 | |
| | | | | | | | | | | | | 2,742,403 | |
| Internet - 0.05% | | | | | | | | |
| | 350,000 | | | Expedia Group, Inc. | | 3.80% | | 02/15/2028 | | | | 352,707 | |
| | 125,000 | | | Uber Technologies, Inc.(g) | | 7.50% | | 09/15/2027 | | | | 133,594 | |
| | 500,000 | | | Uber Technologies, Inc.(g) | | 6.25% | | 01/15/2028 | | | | 514,063 | |
| | | | | | | | | | | | | 1,000,364 | |
See Notes to Financial Statements.
| 43 | (888) 848-7569 | www.rivernorth.com |
| RiverNorth/DoubleLine Strategic Income Fund | Schedule of Investments |
September 30, 2020
| Principal Amount/Description | | Rate | | Maturity | | | Value | |
| Investment Companies - 0.56% | | | | | | | | | |
| $ | 5,000,000 | | | Business Development Corp. of America(g) | | 5.38% | | 05/30/2023 | | | $ | 4,929,636 | |
| | 5,000,000 | | | FS KKR Capital Corp. | | 4.75% | | 05/15/2022 | | | | 5,069,733 | |
| | 180,000 | | | Icahn Enterprises LP / Icahn Enterprises Finance Corp. | | 5.25% | | 05/15/2027 | | | | 188,086 | |
| | | | | | | | | | | | | 10,187,455 | |
| Leisure Time - 0.02% | | | | | | | | |
| | 50,000 | | | Carnival Corp.(g) | | 11.50% | | 04/01/2023 | | | | 56,122 | |
| | 55,000 | | | Viking Cruises, Ltd.(g) | | 13.00% | | 05/15/2025 | | | | 63,800 | |
| | 290,000 | | | Viking Cruises, Ltd.(g) | | 5.88% | | 09/15/2027 | | | | 226,019 | |
| | | | | | | | | | | | | 345,941 | |
| Lodging - 0.03% | | | | | | | | |
| | 205,000 | | | Boyd Gaming Corp. | | 4.75% | | 12/01/2027 | | | | 201,579 | |
| | 30,000 | | | Hilton Domestic Operating Co., Inc.(g) | | 5.38% | | 05/01/2025 | | | | 31,193 | |
| | 30,000 | | | Hilton Domestic Operating Co., Inc.(g) | | 5.75% | | 05/01/2028 | | | | 31,781 | |
| | 185,000 | | | MGM Resorts International | | 6.75% | | 05/01/2025 | | | | 194,177 | |
| | 100,000 | | | Wyndham Hotels & Resorts, Inc.(g) | | 4.38% | | 08/15/2028 | | | | 97,188 | |
| | | | | | | | | | | | | 555,918 | |
| Machinery-Construction & Mining - 0.00%(a) | | | | | | | | |
| | 80,000 | | | BWX Technologies, Inc.(g) | | 4.13% | | 06/30/2028 | | | | 82,050 | |
| Manufactured Goods - 0.01% | | | | | | | | |
| | 105,000 | | | Gates Global LLC / Gates Corp.(g) | | 6.25% | | 01/15/2026 | | | | 108,063 | |
| Media - 0.14% | | | | | | | | |
| | 105,000 | | | Cengage Learning, Inc.(g) | | 9.50% | | 06/15/2024 | | | | 69,683 | |
| | 485,000 | | | Charter Communications Operating LLC / Charter Communications Operating Capital | | 4.91% | | 07/23/2025 | | | | 561,178 | |
| | 200,000 | | | Comcast Corp. | | 3.95% | | 10/15/2025 | | | | 229,611 | |
| | 320,000 | | | Comcast Corp. | | 3.40% | | 04/01/2030 | | | | 370,016 | |
| | 425,000 | | | Comcast Corp. | | 1.50% | | 02/15/2031 | | | | 419,224 | |
| | 135,000 | | | Diamond Sports Group LLC / Diamond Sports Finance Co.(g) | 5.38% | | 08/15/2026 | | | | 95,839 | |
| | 130,000 | | | GCI LLC(g) | | 4.75% | | 10/15/2028 | | | | 131,951 | |
| | 245,000 | | | Gray Television, Inc.(g) | | 7.00% | | 05/15/2027 | | | | 265,920 | |
| | 35,000 | | | iHeartCommunications, Inc. | | 8.38% | | 05/01/2027 | | | | 34,539 | |
| | 90,000 | | | Nexstar Broadcasting, Inc.(g) | | 5.63% | | 07/15/2027 | | | | 94,546 | |
| | 110,000 | | | Radiate Holdco LLC / Radiate Finance, Inc.(g) | | 4.50% | | 09/15/2026 | | | | 110,390 | |
| | 130,000 | | | Scripps Escrow, Inc.(g) | | 5.88% | | 07/15/2027 | | | | 125,613 | |
| | | | | | | | | | | | | 2,508,510 | |
| Mining - 0.05% | | | | | | | | |
| | 195,000 | | | Arconic Corp.(g) | | 6.13% | | 02/15/2028 | | | | 200,728 | |
See Notes to Financial Statements.
| Annual Report | September 30, 2020 | 44 |
| RiverNorth/DoubleLine Strategic Income Fund | Schedule of Investments |
September 30, 2020
| Principal Amount/Description | | Rate | | Maturity | | | Value | |
| $ | 100,000 | | | Freeport-McMoRan, Inc. | | 4.63% | | 08/01/2030 | | | $ | 105,322 | |
| | 400,000 | | | Freeport-McMoRan, Inc. | | 5.45% | | 03/15/2043 | | | | 444,848 | |
| | 80,000 | | | Novelis Corp.(g) | | 4.75% | | 01/30/2030 | | | | 78,239 | |
| | | | | | | | | | | | | 829,137 | |
| Oil & Gas - 0.33% | | | | | | | | |
| | 50,000 | | | Apache Corp. | | 4.63% | | 11/15/2025 | | | | 47,750 | |
| | 95,000 | | | Apache Corp. | | 4.38% | | 10/15/2028 | | | | 87,103 | |
| | 440,000 | | | Brooklyn Union Gas Co.(g) | | 4.49% | | 03/04/2049 | | | | 565,716 | |
| | 515,000 | | | CNOOC Finance 2015 USA, LLC | | 3.75% | | 05/02/2023 | | | | 550,048 | |
| | 390,000 | | | East Ohio Gas Co.(g) | | 3.00% | | 06/15/2050 | | | | 407,095 | |
| | 110,000 | | | EOG Resources, Inc. | | 4.38% | | 04/15/2030 | | | | 129,833 | |
| | 100,000 | | | EQT Corp. | | 7.88% | | 02/01/2025 | | | | 110,984 | |
| | 265,000 | | | Exxon Mobil Corp. | | 2.61% | | 10/15/2030 | | | | 286,579 | |
| | 250,000 | | | Exxon Mobil Corp. | | 4.23% | | 03/19/2040 | | | | 307,035 | |
| | 175,000 | | | Gulfport Energy Corp. | | 6.38% | | 05/15/2025 | | | | 107,388 | |
| | 160,000 | | | Halliburton Co. | | 2.92% | | 03/01/2030 | | | | 157,422 | |
| | 140,000 | | | Hilcorp Energy I LP / Hilcorp Finance Co.(g) | | 6.25% | | 11/01/2028 | | | | 127,884 | |
| | 65,000 | | | Indigo Natural Resources LLC(g) | | 6.88% | | 02/15/2026 | | | | 63,426 | |
| | 800,000 | | | Kosmos Energy, Ltd.(e) | | 7.13% | | 04/04/2026 | | | | 705,872 | |
| | 490,000 | | | Marathon Petroleum Corp. | | 5.13% | | 12/15/2026 | | | | 568,383 | |
| | 175,000 | | | NiSource, Inc. | | 3.60% | | 05/01/2030 | | | | 199,757 | |
| | 75,000 | | | Occidental Petroleum Corp. | | 8.00% | | 07/15/2025 | | | | 75,608 | |
| | 110,000 | | | Occidental Petroleum Corp. | | 3.50% | | 08/15/2029 | | | | 84,524 | |
| | 80,000 | | | Occidental Petroleum Corp. | | 6.63% | | 09/01/2030 | | | | 73,950 | |
| | 145,000 | | | Parsley Energy LLC / Parsley Finance Corp.(g) | | 5.63% | | 10/15/2027 | | | | 144,547 | |
| | 265,000 | | | PBF Holding Co. LLC / PBF Finance Corp.(g) | | 9.25% | | 05/15/2025 | | | | 272,008 | |
| | 325,000 | | | Pioneer Natural Resources Co. | | 1.90% | | 08/15/2030 | | | | 305,871 | |
| | 140,000 | | | QEP Resources, Inc. | | 5.63% | | 03/01/2026 | | | | 79,800 | |
| | 110,000 | | | Sunoco LP / Sunoco Finance Corp. | | 6.00% | | 04/15/2027 | | �� | | 113,231 | |
| | 61,000 | | | Transocean, Inc.(g) | | 11.50% | | 01/30/2027 | | | | 24,629 | |
| | 220,000 | | | USA Compression Partners LP / USA Compression Finance Corp. | | 6.88% | | 09/01/2027 | | | | 218,528 | |
| | 95,000 | | | WPX Energy, Inc. | | 5.88% | | 06/15/2028 | | | | 99,396 | |
| | 95,000 | | | WPX Energy, Inc. | | 4.50% | | 01/15/2030 | | | | 93,988 | |
| | | | | | | | | | | | | 6,008,355 | |
| Packaging & Containers - 0.06% | | | | | | | | |
| | 185,000 | | | Flex Acquisition Co., Inc.(g) | | 6.88% | | 01/15/2025 | | | | 185,462 | |
| | 185,000 | | | Silgan Holdings, Inc. | | 4.13% | | 02/01/2028 | | | | 189,163 | |
| | 626,000 | | | WRKCo, Inc. | | 3.75% | | 03/15/2025 | | | | 700,460 | |
| | | | | | | | | | | | | 1,075,085 | |
See Notes to Financial Statements.
| 45 | (888) 848-7569 | www.rivernorth.com |
| RiverNorth/DoubleLine Strategic Income Fund | Schedule of Investments |
September 30, 2020
| Principal Amount/Description | | Rate | | Maturity | | | Value | |
| Pharmaceuticals - 0.28% | | | | | | | | |
| $ | 525,000 | | | AbbVie, Inc. | | 4.70% | | 05/14/2045 | | | $ | 646,173 | |
| | 285,000 | | | Bausch Health Cos., Inc.(g) | | 6.25% | | 02/15/2029 | | | | 293,550 | |
| | 840,000 | | | Becton Dickinson and Co. | | 2.89% | | 06/06/2022 | | | | 869,205 | |
| | 470,000 | | | Bristol-Myers Squibb Co. | | 4.35% | | 11/15/2047 | | | | 622,997 | |
| | 355,000 | | | Cigna Corp.(f) | | 3M US L + 0.89% | | 07/15/2023 | | | | 358,864 | |
| | 340,000 | | | Cigna Corp. | | 4.90% | | 12/15/2048 | | | | 443,808 | |
| | 290,000 | | | CVS Health Corp. | | 5.05% | | 03/25/2048 | | | | 369,988 | |
| | 637,000 | | | Eli Lilly and Co. | | 2.25% | | 05/15/2050 | | | | 603,546 | |
| | 620,000 | | | Merck & Co., Inc. | | 3.40% | | 03/07/2029 | | | | 722,549 | |
| | 215,000 | | | Upjohn, Inc.(g) | | 1.65% | | 06/22/2025 | | | | 220,381 | |
| | | | | | | | | | | | | 5,151,061 | |
| Pipelines - 0.16% | | | | | | | | |
| | 73,000 | | | Antero Midstream Partners LP / Antero Midstream Finance Corp.(g) | | 5.75% | | 03/01/2027 | | | | 60,590 | |
| | 80,000 | | | Cheniere Energy Partners LP | | 5.25% | | 10/01/2025 | | | | 81,920 | |
| | 130,000 | | | Cheniere Energy Partners LP | | 5.63% | | 10/01/2026 | | | | 135,421 | |
| | 200,000 | | | Enable Midstream Partners LP | | 4.40% | | 03/15/2027 | | | | 192,309 | |
| | 575,000 | | | Energy Transfer Operating LP | | 4.75% | | 01/15/2026 | | | | 613,106 | |
| | 175,000 | | | EQM Midstream Partners LP(g) | | 6.50% | | 07/01/2027 | | | | 185,751 | |
| | 145,000 | | | Hess Midstream Operations LP(g) | | 5.13% | | 06/15/2028 | | | | 144,804 | |
| | 448,000 | | | Kinder Morgan Energy Partners LP | | 6.95% | | 01/15/2038 | | | | 586,747 | |
| | 120,000 | | | NuStar Logistics LP | | 6.38% | | 10/01/2030 | | | | 124,800 | |
| | 180,000 | | | ONEOK, Inc. | | 3.40% | | 09/01/2029 | | | | 177,035 | |
| | 75,000 | | | Rattler Midstream LP(g) | | 5.63% | | 07/15/2025 | | | | 75,742 | |
| | 235,000 | | | Sabine Pass Liquefaction LLC | | 5.00% | | 03/15/2027 | | | | 264,610 | |
| | 170,000 | | | Targa Resources Partners LP / Targa Resources Partners Finance Corp.(g) | | 5.50% | | 03/01/2030 | | | | 169,310 | |
| | 120,000 | | | Western Midstream Operating LP | | 4.10% | | 02/01/2025 | | | | 114,491 | |
| | | | | | | | | | | | | 2,926,636 | |
| REITS - 0.24% | | | | | | | | |
| | 555,000 | | | Alexandria Real Estate Equities, Inc. | | 4.00% | | 01/15/2024 | | | | 610,920 | |
| | 555,000 | | | American Tower Corp. | | 3.60% | | 01/15/2028 | | | | 623,407 | |
| | 510,000 | | | Boston Properties LP | | 3.40% | | 06/21/2029 | | | | 555,757 | |
| | 800,000 | | | Crown Castle International Corp. | | 3.70% | | 06/15/2026 | | | | 892,717 | |
| | 255,000 | | | Crown Castle International Corp. | | 3.65% | | 09/01/2027 | | | | 285,625 | |
| | 560,000 | | | Crown Castle International Corp. | | 3.30% | | 07/01/2030 | | | | 612,474 | |
| | 205,000 | | | Equinix, Inc. | | 1.80% | | 07/15/2027 | | | | 207,119 | |
| | 98,000 | | | ESH Hospitality, Inc.(g) | | 5.25% | | 05/01/2025 | | | | 99,124 | |
| | 80,000 | | | Iron Mountain, Inc.(g) | | 4.50% | | 02/15/2031 | | | | 80,591 | |
| | 190,000 | | | National Retail Properties, Inc. | | 2.50% | | 04/15/2030 | | | | 189,942 | |
See Notes to Financial Statements.
| Annual Report | September 30, 2020 | 46 |
| RiverNorth/DoubleLine Strategic Income Fund | Schedule of Investments |
September 30, 2020
| Principal Amount/Description | | Rate | | Maturity | | | Value | |
| $ | 55,000 | | | Realogy Group LLC / Realogy Co.- Issuer Corp.(g) | | 7.63% | | 06/15/2025 | | | $ | 57,696 | |
| | 75,000 | | | Simon Property Group LP | | 2.45% | | 09/13/2029 | | | | 74,381 | |
| | | | | | | | | | | | | 4,289,753 | |
| Retail - 0.19% | | | | | | | | |
| | 27,000 | | | Asbury Automotive Group, Inc.(g) | | 4.50% | | 03/01/2028 | | | | 27,219 | |
| | 27,000 | | | Asbury Automotive Group, Inc.(g) | | 4.75% | | 03/01/2030 | | | | 27,253 | |
| | 235,000 | | | Beacon Roofing Supply, Inc.(g) | | 4.88% | | 11/01/2025 | | | | 230,726 | |
| | 60,000 | | | Carvana Co. | | 8.88% | | 10/01/2023 | | | | 62,663 | |
| | 120,000 | | | Costco Wholesale Corp. | | 1.75% | | 04/20/2032 | | | | 123,391 | |
| | 450,000 | | | Dollar Tree, Inc. | | 4.00% | | 05/15/2025 | | | | 508,236 | |
| | 235,000 | | | Golden Nugget, Inc.(g) | | 6.75% | | 10/15/2024 | | | | 196,519 | |
| | 35,000 | | | Group 1 Automotive, Inc.(g) | | 4.00% | | 08/15/2028 | | | | 34,453 | |
| | 235,000 | | | Home Depot, Inc. | | 3.90% | | 06/15/2047 | | | | 290,002 | |
| | 195,000 | | | IRB Holding Corp.(g) | | 6.75% | | 02/15/2026 | | | | 195,366 | |
| | 270,000 | | | McDonald's Corp. | | 3.60% | | 07/01/2030 | | | | 314,124 | |
| | 270,000 | | | McDonald's Corp. | | 4.45% | | 03/01/2047 | | | | 335,728 | |
| | 95,000 | | | PetSmart, Inc.(g) | | 7.13% | | 03/15/2023 | | | | 95,950 | |
| | 66,000 | | | PetSmart, Inc.(g) | | 5.88% | | 06/01/2025 | | | | 67,723 | |
| | 185,000 | | | Staples, Inc.(g) | | 7.50% | | 04/15/2026 | | | | 170,779 | |
| | 550,000 | | | Target Corp. | | 3.38% | | 04/15/2029 | | | | 639,568 | |
| | 195,000 | | | Yum! Brands, Inc. | | 3.63% | | 03/15/2031 | | | | 195,366 | |
| | | | | | | | | | | | | 3,515,066 | |
| Semiconductors - 0.13% | | | | | | | | |
| | 455,000 | | | Broadcom, Inc. | | 3.15% | | 11/15/2025 | | | | 491,324 | |
| | 300,000 | | | Lam Research Corp. | | 2.88% | | 06/15/2050 | | | | 311,406 | |
| | 645,000 | | | Marvell Technology Group, Ltd. | | 4.20% | | 06/22/2023 | | | | 696,679 | |
| | 305,000 | | | Micron Technology, Inc. | | 2.50% | | 04/24/2023 | | | | 316,974 | |
| | 170,000 | | | Texas Instruments, Inc. | | 1.75% | | 05/04/2030 | | | | 175,756 | |
| | 355,000 | | | Xilinx, Inc. | | 2.38% | | 06/01/2030 | | | | 374,521 | |
| | | | | | | | | | | | | 2,366,660 | |
| Software - 0.05% | | | | | | | | |
| | 135,000 | | | Activision Blizzard, Inc. | | 1.35% | | 09/15/2030 | | | | 131,900 | |
| | 100,000 | | | Black Knight InfoServ LLC(g) | | 3.63% | | 09/01/2028 | | | | 101,250 | |
| | 70,000 | | | BY Crown Parent LLC / BY Bond Finance, Inc.(g) | | 4.25% | | 01/31/2026 | | | | 71,356 | |
| | 93,000 | | | Dun & Bradstreet Corp.(g) | | 6.88% | | 08/15/2026 | | | | 100,061 | |
| | 435,000 | | | Oracle Corp. | | 3.85% | | 04/01/2060 | | | | 513,786 | |
| | | | | | | | | | | | | 918,353 | |
| Special Purpose Banks - 0.01% | | | | | | | | |
| | 160,000 | | | Caesars Resort Collection LLC / CRC Finco, Inc.(g) | | 5.25% | | 10/15/2025 | | | | 155,010 | |
| Telecommunications - 0.29% | | | | | | | | |
| | 500,000 | | | AT&T, Inc. | | 4.30% | | 02/15/2030 | | | | 592,888 | |
See Notes to Financial Statements.
| 47 | (888) 848-7569 | www.rivernorth.com |
| RiverNorth/DoubleLine Strategic Income Fund | Schedule of Investments |
September 30, 2020
| Principal Amount/Description | | Rate | | Maturity | | Value | |
| $ | 930,000 | | | AT&T, Inc.(g) | | 3.50% | | 09/15/2053 | | $ | 910,419 | |
| | 110,000 | | | Avaya, Inc.(g) | | 6.13% | | 09/15/2028 | | | 112,750 | |
| | 160,000 | | | CenturyLink, Inc.(g) | | 5.13% | | 12/15/2026 | | | 164,615 | |
| | 145,000 | | | CenturyLink, Inc.(g) | | 4.00% | | 02/15/2027 | | | 147,506 | |
| | 345,000 | | | Corning, Inc. | | 4.38% | | 11/15/2057 | | | 421,008 | |
| | 155,000 | | | Frontier Communications Corp.(g)(h) | | 8.00% | | 04/01/2027 | | | 154,709 | |
| | 120,000 | | | Gogo Intermediate Holdings LLC / Gogo Finance Co., Inc.(g) | | 9.88% | | 05/01/2024 | | | 128,505 | |
| | 80,000 | | | GTT Communications, Inc.(g) | | 7.88% | | 12/31/2024 | | | 41,500 | |
| | 1,245,000 | | | Intelsat Jackson Holdings SA(g)(h) | | 8.50% | | 10/15/2024 | | | 806,013 | |
| | 290,000 | | | T-Mobile USA, Inc.(g) | | 3.50% | | 04/15/2025 | | | 318,484 | |
| | 80,000 | | | T-Mobile USA, Inc.(g) | | 1.50% | | 02/15/2026 | | | 80,324 | |
| | 500,000 | | | Verizon Communications, Inc. | | 3.15% | | 03/22/2030 | | | 566,012 | |
| | 495,000 | | | Verizon Communications, Inc. | | 4.40% | | 11/01/2034 | | | 618,886 | |
| | 155,000 | | | Zayo Group Holdings, Inc.(g) | | 4.00% | | 03/01/2027 | | | 152,757 | |
| | 85,000 | | | Zayo Group Holdings, Inc.(g) | | 6.13% | | 03/01/2028 | | | 87,748 | |
| | | | | | | | | | | | 5,304,124 | |
| Toys/Games/Hobbies - 0.02% | | | | | | | |
| | 300,000 | | | Hasbro, Inc. | | 3.50% | | 09/15/2027 | | | 312,715 | |
| Transportation - 0.11% | | | | | | | |
| | 345,000 | | | Burlington Northern Santa Fe LLC | | 3.05% | | 02/15/2051 | | | 377,407 | |
| | 535,000 | | | CSX Corp. | | 3.80% | | 11/01/2046 | | | 623,611 | |
| | 270,000 | | | FedEx Corp. | | 4.75% | | 11/15/2045 | | | 334,440 | |
| | 30,000 | | | Kenan Advantage Group, Inc.(g) | | 7.88% | | 07/31/2023 | | | 29,209 | |
| | 500,000 | | | Union Pacific Corp. | | 3.70% | | 03/01/2029 | | | 580,950 | |
| | | | | | | | | | | | 1,945,617 | |
| Trucking & Leasing - 0.02% | | | | | | | |
| | 280,000 | | | Penske Truck Leasing Co. LP / PTL Finance Corp.(g) | | 4.20% | | 04/01/2027 | | | 314,203 | |
| Water - 0.02% | | | | | | | |
| | 355,000 | | | Essential Utilities, Inc. | | 2.70% | | 04/15/2030 | | | 380,373 | |
| | | | | | | | | | | | | |
| TOTAL U.S. CORPORATE BONDS | | | | | | | |
| (Cost $96,196,360) | | | | | | 100,214,470 | |
| | | | | | | | | | | | | |
| CONVERTIBLE CORPORATE BONDS - 0.74% | | | | | | | |
| | 5,871,438 | | | BlackRock TCP Capital Corp. | | 4.63% | | 03/01/2022 | | | 5,900,849 | |
| | 91,897 | | | Digicel Group 0.5, Ltd.(d)(g)(i) | | 5.09% (1.91%) | | Perpetual Maturity | | | 11,947 | |
| | 1,422,000 | | | Goldman Sachs BDC, Inc. | | 4.50% | | 04/01/2022 | | | 1,439,775 | |
| | 6,000,000 | | | New Mountain Finance Corp. | | 5.75% | | 08/15/2023 | | | 6,030,300 | |
| | | | | | | | | | | | | |
| TOTAL CONVERTIBLE CORPORATE BONDS | | | | | | | |
| (Cost $12,597,608) | | | | | | 13,382,871 | |
See Notes to Financial Statements.
| Annual Report | September 30, 2020 | 48 |
| RiverNorth/DoubleLine Strategic Income Fund | Schedule of Investments |
September 30, 2020
| Principal Amount/Description | | Rate | | Maturity | | Value |
| FOREIGN GOVERNMENT BONDS AND NOTES, SUPRANATIONALS AND FOREIGN AGENCIES - 0.33% |
| $ | 200,000 | | | Abu Dhabi Government International Bond(g) | | 0.75% | | 09/02/2023 | | $ | 200,005 | |
| | 200,000 | | | Abu Dhabi Government International Bond(g) | | 2.50% | | 04/16/2025 | | | 213,192 | |
| | 200,000 | | | Abu Dhabi Government International Bond(g) | | 3.13% | | 04/16/2030 | | | 224,576 | |
| | 300,000 | | | Banco Latinoamericano de Comercio Exterior SA(g) | | 2.38% | | 09/14/2025 | | | 304,500 | |
| | 600,000 | | | Dominican Republic International Bond(g) | | 6.40% | | 06/05/2049 | | | 605,100 | |
| | 600,000 | | | Export Import Bank of Thailand(f) | | 3M US L + 0.90% | | 11/20/2023 | | | 598,197 | |
| | 200,000 | | | Indonesia (rep) Indon 3 3/8 04/15/23 | | | | 04/15/2023 | | | 211,432 | |
| | 285,000 | | | Mexico Government International Bond | | 4.15% | | 03/28/2027 | | | 317,169 | |
| | 875,000 | | | Mexico Government International Bond | | 3.75% | | 01/11/2028 | | | 942,651 | |
| | 200,000 | | | Mexico Government International Bond | | 5.00% | | 04/27/2051 | | | 223,900 | |
| | 200,000 | | | Peruvian Government International Bond | | 2.39% | | 01/23/2026 | | | 209,900 | |
| | 200,000 | | | Philippine Government International Bond | | 2.46% | | 05/05/2030 | | | 216,118 | |
| | 200,000 | | | Qatar Government International Bond(e) | | 3.88% | | 04/23/2023 | | | 215,081 | |
| | 400,000 | | | Qatar Government International Bond(e) | | 3.38% | | 03/14/2024 | | | 431,566 | |
| | 400,000 | | | Saudi Government International Bond(g) | | 2.90% | | 10/22/2025 | | | 428,021 | |
| | 200,000 | | | Saudi Government International Bond(e) | | 2.38% | | 10/26/2021 | | | 203,655 | |
| | 400,000 | | | Saudi Government International Bond(e) | | 2.88% | | 03/04/2023 | | | 418,418 | |
| | | | | | | | | | | | | |
| TOTAL FOREIGN GOVERNMENT BONDS AND NOTES, SUPRANATIONALS AND FOREIGN AGENCIES |
| (Cost $5,733,041) | | | 5,963,481 | |
| | | | | | | | | | | | | |
| BANK LOANS - 1.13%(f) |
| Canada - 0.08% |
| | 940,000 | | | Kronos Acquisition Intermediate, Inc., First Lien - Initial Term Loan | | 3M US L + 4.00%, 1.00% Floor | | 05/15/2023 | | | 936,466 | |
See Notes to Financial Statements.
| 49 | (888) 848-7569 | www.rivernorth.com |
| RiverNorth/DoubleLine Strategic Income Fund | Schedule of Investments |
September 30, 2020
| Principal Amount/Description | | Rate | | Maturity | | Value |
| $ | 653,323 | | | Titan Acquisition, Ltd., First Lien - Initial Term Loan | | 3M US L + 3.00% | | 03/28/2025 | | $ | 619,262 | |
| | | | | | | | | | | | 1,555,728 | |
| Ireland - 0.03% |
| | 519,586 | | | ION Trading Technologies S.A.R.L., First Lien - 2018 Initial Dollar Term Loan | | 3M US L + 4.00%, 1.00% Floor | | 11/21/2024 | | | 512,081 | |
| | | | | | | | | | | | | |
| Luxembourg - 0.03% |
| | 310,949 | | | Travelport Finance S.à r.l., First Lien - Initial (Priority) Term Loan | | L + 8.00%, 1.00% Floor | | 02/28/2025 | | | 299,775 | |
| | 339,486 | | | Travelport Finance S.à r.l., First Lien - Initial Term Loan | | 3M US L + 5.00% | | 05/29/2026 | | | 257,161 | |
| | | | | | | | | | | | 556,936 | |
| Netherlands - 0.00% |
| | 5,736 | | | Lealand Finance Co. BV, First Lien - Make-Whole Term Loan | | 1M US L + 3.00% | | 06/28/2024 | | | 5,019 | |
| | 71,420 | | | Lealand Finance Co. BV, First Lien - Take-Back Term Loan | | 1M US L + 4.00% | | 06/30/2025 | | | 54,279 | |
| | | | | | | | | | | | 59,298 | |
| United States - 0.99% |
| | 1,263,939 | | | Air Methods Corp., First Lien - Initial Term Loan | | 3M US L + 3.50%, 1.00% Floor | | 04/22/2024 | | | 1,113,056 | |
| | 1,204,740 | | | American Tire Distributors, Inc., First Lien - Initial Term Loan | | 1M US L + 7.50%, 1.00% Floor | | 09/02/2024 | | | 1,035,215 | |
| | 249,751 | | | Avaya, Inc., First Lien - Tranche B Term Loan | | 1M US L + 4.25% | | 12/15/2024 | | | 248,854 | |
| | 310,250 | | | Avaya, Inc., First Lien - Tranche B-1 Term Loan | | 1M US L + 4.25% | | 12/15/2027 | | | 303,560 | |
| | 1,433,138 | | | BI-LO LLC, First Lien - Initial Term Loan | | 1M US L + 8.00%, 1.00% Floor | | 05/31/2024 | | | 1,435,617 | |
| | 746,875 | | | Castle US Holding Corp., First Lien - Initial Dollar Term Loan | | 3M US L + 3.75% | | 01/29/2027 | | | 720,070 | |
| | 1,016,727 | | | Cengage Learning, Inc., First Lien - 2016 Refinancing Term Loan | | 3M US L + 4.25%, 1.00% Floor | | 06/07/2023 | | | 852,963 | |
| | 779,450 | | | Cvent, Inc., First Lien Term Loan | | 1M US L + 3.75% | | 11/29/2024 | | | 708,462 | |
| | 1,029,388 | | | Flexential Intermediate Corp., First Lien - Initial Term Loan | | 3M US L + 3.50% | | 08/01/2024 | | | 887,847 | |
| | 490,130 | | | Forterra Finance LLC, First Lien - Replacement Term Loan | | 1M US L + 3.00%, 1.00% Floor | | 10/25/2023 | | | 486,250 | |
| | 455,318 | | | Global Medical Response, Inc., First Lien - 2018 New Term Loan | | 3M US L + 4.25%, 1.00% Floor | | 03/14/2025 | | | 442,797 | |
| | 408,850 | | | Golden Nugget, Inc., First Lien - Initial B Term Loan | | 2M US L + 2.50%, 0.75% Floor | | 10/04/2023 | | | 367,276 | |
See Notes to Financial Statements.
| Annual Report | September 30, 2020 | 50 |
| RiverNorth/DoubleLine Strategic Income Fund | Schedule of Investments |
September 30, 2020
| Principal Amount/Description | | Rate | | Maturity | | Value |
| $ | 775,646 | | | Granite US Holdings Corp., First Lien - B Term Loan | | 3M US L + 5.25% | | 09/30/2026 | | $ | 736,864 | |
| | 998,575 | | | Gulf Finance LLC, First Lien - Tranche B Term Loan | | 1M US L + 5.25%, 1.00% Floor | | 08/25/2023 | | | 708,574 | |
| | 87,616 | | | Klockner Pentaplast of America, Inc., First Lien - Dollar Term Loan | | 3M US L + 4.25%, 1.00% Floor | | 06/30/2022 | | | 85,352 | |
| | 301,188 | | | Lower Cadence Holdings LLC, First Lien - Initial Term Loan | | 1M US L + 4.00% | | 05/22/2026 | | | 279,577 | |
| | 330,000 | | | Milano Acquisition Corp., First Lien - B Term Loan | | L + 4.00%, 0.75% Floor | | 08/17/2027 | | | 327,319 | |
| | 1,135,589 | | | Minotaur Acquisition, Inc., First Lien - B Term Loan | | 1M US L + 5.00% | | 03/27/2026 | | | 1,086,384 | |
| | 494,301 | | | Misys, Ltd., First Lien - Dollar Term Loan | | 3M US L + 3.50%, 1.00% Floor | | 06/13/2024 | | | 463,530 | |
| | 1,135,000 | | | Mitchell International, Inc., Second Lien - Initial Term Loan | | 1M US L + 7.25% | | 12/01/2025 | | | 1,081,655 | |
| | 474,020 | | | MLN US HoldCo LLC, First Lien - B Term Loan | | 1M US L + 4.50% | | 11/30/2025 | | | 407,361 | |
| | 1,150,000 | | | MPH Acquisition Holdings LLC, First Lien - Initial Term Loan | | 3M US L + 2.75%, 1.00% Floor | | 06/07/2023 | | | 1,133,779 | |
| | 112,768 | | | Northeast Foods LLC, First Lien Term Loan | | 1M US L + 3.75% | | 07/20/2025 | | | 108,656 | |
| | 230,000 | | | Playtika Holding Corp., First Lien - B Term Loan | | L + 6.00%, 1.00% Floor | | 12/10/2024 | | | 230,634 | |
| | 532,304 | | | Radiology Partners, Inc., First Lien - B Term Loan | | 3M US L + 4.25% | | 07/09/2025 | | | 512,210 | |
| | 559,278 | | | Solenis Holdings LLC, First Lien - Initial Dollar Term Loan | | 3M US L + 4.00% | | 06/26/2025 | | | 548,152 | |
| | 230,000 | | | Solenis Holdings LLC, Second Lien - Initial Term Loan | | 3M US L + 8.50% | | 06/26/2026 | | | 215,280 | |
| | 984,795 | | | Team Health Holdings, Inc., First Lien - Initial Term Loan | | 1M US L + 2.75%, 1.00% Floor | | 02/06/2024 | | | 830,374 | |
| | 260,000 | | | TIBCO Software, Inc., Second Lien | | 1M US L + 7.25% | | 03/03/2028 | | | 255,937 | |
| | 340,000 | | | Vantage Specialty Chemicals, Inc., First Lien - Closing Date Term Loan | | L + 3.50%, 1.00% Floor | | 10/28/2024 | | | 308,550 | |
| | | | | | | | | | | | 17,922,155 | |
| | | | | | | | | | | | | |
| TOTAL BANK LOANS |
| (Cost $20,885,637) | | | 20,606,198 | |
| | | | | | | | | | | | | |
| COLLATERALIZED LOAN OBLIGATIONS - 2.56% |
| | | | | Adams Mill CLO, Ltd. | | | | | | | | |
| | 500,000 | | | Series 2014-1A(f)(g) | | 3M US L + 3.50% | | 07/15/2026 | | | 476,257 | |
See Notes to Financial Statements.
| 51 | (888) 848-7569 | www.rivernorth.com |
| RiverNorth/DoubleLine Strategic Income Fund | Schedule of Investments |
September 30, 2020
| Principal Amount/Description | | Rate | | Maturity | | Value |
| | | | | AIMCO CLO | | | | | | | | |
| $ | 500,000 | | | Series 2018-AA(f)(g) | | 3M US L + 2.55% | | 04/17/2031 | | $ | 471,203 | |
| | | | | AIMCO CLO 10, Ltd. | | | | | | | | |
| | 1,000,000 | | | Series 2019-10A(f)(g) | | 3.55% - 3M US L | | 07/22/2032 | | | 983,254 | |
| | | | | Apidos CLO XII | | | | | | | | |
| | 500,000 | | | Series 2018-12A(f)(g) | | 3M US L + 2.60% | | 04/15/2031 | | | 457,963 | |
| | | | | Apidos CLO XX | | | | | | | | |
| | 500,000 | | | Series 2018-20A(f)(g) | | 3M US L + 2.95% | | 07/16/2031 | | | 482,672 | |
| | | | | Apidos CLO XXI | | | | | | | | |
| | 500,000 | | | Series 2018-21A(f)(g) | | 3M US L + 2.45% | | 07/18/2027 | | | 473,298 | |
| | 1,000,000 | | | Series 2018-21A(f)(g) | | 3M US L + 8.25% | | 07/18/2027 | | | 779,282 | |
| | | | | Apidos CLO XXIV | | | | | | | | |
| | 1,000,000 | | | Series 2018-24A(f)(g) | | 3M US L + 5.80% | | 10/20/2030 | | | 864,992 | |
| | | | | Apres Static CLO 2, Ltd. | | | | | | | | |
| | 500,000 | | | Series 2020-1A(f)(g) | | 3M US L + 4.85% | | 04/15/2028 | | | 501,381 | |
| | | | | Avery Point VI CLO, Ltd. | | | | | | | | |
| | 499,884 | | | Series 2018-6A(f)(g) | | 3M US L + 1.05% | | 08/05/2027 | | | 498,669 | |
| | | | | Babson CLO, Ltd. | | | | | | | | |
| | 500,000 | | | Series 2018-IA(f)(g) | | 3M US L + 2.60% | | 01/20/2031 | | | 464,068 | |
| | | | | Barings CLO, Ltd. | | | | | | | | |
| | 500,000 | | | Series 2017-1A(f)(g) | | 3M US L + 3.60% | | 07/18/2029 | | | 500,063 | |
| | 500,000 | | | Series 2018-4A(f)(g) | | 3M US L + 5.82% | | 10/15/2030 | | | 434,434 | |
| | 1,000,000 | | | Series 2019-1A(f)(g) | | 3M US L + 6.68% | | 04/15/2031 | | | 919,401 | |
| | 500,000 | | | Series 2019-2A(f)(g) | | 3.85% - 3M US L | | 04/15/2031 | | | 500,150 | |
| | | | | Beechwood Park CLO, Ltd. | | | | | | | | |
| | 500,000 | | | Series 2019-1A(f)(g) | | 3M US L + 7.50% | | 01/17/2033 | | | 486,262 | |
| | | | | BlueMountain CLO, Ltd. | | | | | | | | |
| | 500,000 | | | Series 2018-3A(f)(g) | | 3M US L + 2.60% | | 04/20/2031 | | | 425,295 | |
| | | | | Buttermilk Park CLO, Ltd. | | | | | | | | |
| | 1,000,000 | | | Series 2018-1A(f)(g) | | 3M US L + 5.75% | | 10/15/2031 | | | 891,393 | |
| | | | | Canyon Capital CLO, Ltd. | | | | | | | | |
| | 500,000 | | | Series 2017-1A(f)(g) | | 3M US L + 3.60% | | 07/15/2030 | | | 495,312 | |
| | 1,000,000 | | | Series 2018-1A(f)(g) | | 3M US L + 2.75% | | 01/30/2031 | | | 882,061 | |
| | 1,500,000 | | | Series 2018-1A(f)(g) | | 3M US L + 5.50% | | 01/30/2031 | | | 1,152,120 | |
| | 1,000,000 | | | Series 2018-1A(f)(g) | | 3M US L + 5.75% | | 07/15/2031 | | | 843,365 | |
| | 500,000 | | | Series 2018-1A(f)(g) | | 3M US L + 2.80% | | 07/15/2031 | | | 461,428 | |
| | 500,000 | | | Series 2018-1RA(f)(g) | | 3M US L + 3.00% | | 07/15/2030 | | | 471,147 | |
| | | | | Canyon CLO, Ltd. | | | | | | | | |
| | 500,000 | | | Series 2018-1A(f)(g) | | 3M US L + 2.90% | | 07/15/2031 | | | 452,784 | |
| | | | | Carlyle Global Market Strategies CLO, Ltd. | | | | | | | | |
| | 1,000,000 | | | Series 2018-2RA(f)(g) | | 3M US L + 5.35% | | 05/15/2031 | | | 714,455 | |
| | 500,000 | | | Series 2018-3A(f)(g) | | 3M US L + 2.85% | | 07/28/2028 | | | 468,837 | |
See Notes to Financial Statements.
| Annual Report | September 30, 2020 | 52 |
| RiverNorth/DoubleLine Strategic Income Fund | Schedule of Investments |
September 30, 2020
| Principal Amount/Description | | Rate | | Maturity | | Value |
| | | | | Chenango Park CLO, Ltd. | | | | | | | | |
| $ | 500,000 | | | Series 2018-1A(f)(g) | | 3M US L + 3.00% | | 04/15/2030 | | $ | 475,307 | |
| | 1,000,000 | | | Series 2018-1A(f)(g) | | 3M US L + 5.80% | | 04/15/2030 | | | 893,323 | |
| | | | | Cook Park CLO, Ltd. | | | | | | | | |
| | 500,000 | | | Series 2018-1A(f)(g) | | 3M US L + 2.60% | | 04/17/2030 | | | 462,840 | |
| | | | | Crown Point CLO IV, Ltd. | | | | | | | | |
| | 500,000 | | | Series 2018-4A(f)(g) | | 3M US L + 1.90% | | 04/20/2031 | | | 476,779 | |
| | | | | Dorchester Park CLO DAC | | | | | | | | |
| | 500,000 | | | Series 2018-1A(f)(g) | | 3M US L + 2.40% | | 04/20/2028 | | | 479,865 | |
| | 875,000 | | | Series 2018-1A(f)(g) | | 3M US L + 5.00% | | 04/20/2028 | | | 797,807 | |
| | | | | Dryden 57 CLO, Ltd. | | | | | | | | |
| | 500,000 | | | Series 2018-57A(f)(g) | | 3M US L + 2.55% | | 05/15/2031 | | | 459,885 | |
| | | | | Dryden 60 CLO, Ltd. | | | | | | | | |
| | 1,000,000 | | | Series 2018-60A(f)(g) | | 3M US L + 3.00% | | 07/15/2031 | | | 968,803 | |
| | | | | Dryden 77 CLO, Ltd. | | | | | | | | |
| | 800,000 | | | Series 2020-77A(f)(g) | | 3M US L + 5.14% | | 05/20/2031 | | | 802,674 | |
| | | | | Elmwood CLO II, Ltd. | | | | | | | | |
| | 1,000,000 | | | Series 2019-2A(f)(g) | | 3M US L + 2.10% | | 04/20/2031 | | | 1,000,995 | |
| | | | | Fillmore Park CLO, Ltd. | | | | | | | | |
| | 500,000 | | | Series 2018-1A(f)(g) | | 3M US L + 2.90% | | 07/15/2030 | | | 482,743 | |
| | 1,000,000 | | | Series 2018-1A(f)(g) | | 3M US L + 5.40% | | 07/15/2030 | | | 877,954 | |
| | | | | Gilbert Park CLO, Ltd. | | | | | | | | |
| | 1,000,000 | | | Series 2017-1A(f)(g) | | 3M US L + 6.40% | | 10/15/2030 | | | 923,052 | |
| | | | | Goldentree Loan Management US CLO, Ltd. | | | | | | | | |
| | 1,000,000 | | | Series 2018-3A(f)(g) | | 3M US L + 2.85% | | 04/20/2030 | | | 959,887 | |
| | | | | Longfellow Place CLO, Ltd. | | | | | | | | |
| | 493,204 | | | Series 2017-1A(f)(g) | | 3M US L + 1.34% | | 04/15/2029 | | | 488,517 | |
| | | | | Myers Park CLO, Ltd. | | | | | | | | |
| | 500,000 | | | Series 2018-1A(f)(g) | | 3M US L + 3.05% | | 10/20/2030 | | | 485,322 | |
| | 1,000,000 | | | Series 2018-1A(f)(g) | | 3M US L + 5.50% | | 10/20/2030 | | | 879,919 | |
| | | | | Neuberger Berman CLO XXIII, Ltd. | | | | | | | | |
| | 1,000,000 | | | Series 2018-23A(f)(g) | | 3M US L + 5.75% | | 10/17/2027 | | | 913,986 | |
| | | | | PPM CLO 3, Ltd. | | | | | | | | |
| | 1,000,000 | | | Series 2019-3A(f)(g) | | 3.70% - 3M US L | | 07/17/2030 | | | 1,002,533 | |
| | | | | Stewart Park CLO, Ltd. | | | | | | | | |
| | 500,000 | | | Series 2018-1A(f)(g) | | 3M US L + 2.60% | | 01/15/2030 | | | 463,906 | |
| | | | | Symphony CLO XVII, Ltd. | | | | | | | | |
| | 1,500,000 | | | Series 2018-17A(f)(g) | | 3M US L + 2.65% | | 04/15/2028 | | | 1,430,294 | |
| | | | | Thayer Park CLO, Ltd. | | | | | | | | |
| | 500,000 | | | Series 2017-1A(f)(g) | | 3M US L + 6.10% | | 04/20/2029 | | | 464,720 | |
| | | | | THL Credit Wind River CLO, Ltd. | | | | | | | | |
| | 500,000 | | | Series 2017-1A(f)(g) | | 3M US L + 3.75% | | 04/18/2029 | | | 485,499 | |
| | 500,000 | | | Series 2018-1A(f)(g) | | 2.90% - 3M US L | | 07/15/2030 | | | 466,173 | |
See Notes to Financial Statements.
| 53 | (888) 848-7569 | www.rivernorth.com |
| RiverNorth/DoubleLine Strategic Income Fund | Schedule of Investments |
September 30, 2020
| Principal Amount/Description | | Rate | | Maturity | | Value | |
| $ | 2,000,000 | | Series 2018-1A(f)(g) | | 5.50% - 3M US L | | 07/15/2030 | | $ | 1,677,126 | |
| | 1,000,000 | | Series 2018-1A(f)(g) | | 3M US L + 3.00% | | 07/18/2031 | | | 879,070 | |
| | 1,000,000 | | Series 2018-2A(f)(g) | | 3M US L + 5.75% | | 07/15/2030 | | | 838,184 | |
| | 1,000,000 | | Series 2018-3A(f)(g) | | 3M US L + 6.22% | | 10/22/2031 | | | 777,856 | |
| | | | Tryon Park CLO, Ltd. | | | | | | | | |
| | 1,000,000 | | Series 2018-1A(f)(g) | | 3M US L + 5.95% | | 04/15/2029 | | | 909,148 | |
| | | | Venture XX CLO, Ltd. | | | | | | | | |
| | 1,000,000 | | Series 2017-20A(f)(g) | | 3M US L + 1.90% | | 04/15/2027 | | | 968,500 | |
| | | | VERDE CLO, Ltd. | | | | | | | | |
| | 1,000,000 | | Series 2019-1A(f)(g) | | 3.80% - 3M US L | | 04/15/2032 | | | 998,000 | |
| | | | VOYA CLO 2017-2 | | | | | | | | |
| | 1,000,000 | | Series 2017-2A(f)(g) | | 3M US L + 6.02% | | 06/07/2030 | | | 867,885 | |
| | | | Voya CLO, Ltd. | | | | | | | | |
| | 500,000 | | Series 2018-1A(f)(g) | | 3M US L + 2.80% | | 04/18/2031 | | | 436,294 | |
| | 1,000,000 | | Series 2018-2A(f)(g) | | 3M US L + 2.75% | | 07/15/2031 | | | 915,450 | |
| | 1,000,000 | | Series 2018-2A(f)(g) | | 3M US L + 5.25% | | 07/15/2031 | | | 851,002 | |
| | 500,000 | | Series 2018-3A(f)(g) | | 3M US L + 6.20% | | 10/20/2031 | | | 416,261 | |
| | 500,000 | | Series 2018-4A(f)(g) | | 3M US L + 5.95% | | 07/14/2031 | | | 418,940 | |
| | | | Webster Park CLO, Ltd. | | | | | | | | |
| | 1,000,000 | | Series 2018-1A(f)(g) | | 5.50% - 3M US L | | 07/20/2030 | | | 884,403 | |
| | | | Westcott Park CLO, Ltd. | | | | | | | | |
| | 1,000,000 | | Series 2019-1A(f)(g) | | 3M US L + 3.25% | | 07/20/2028 | | | 973,453 | |
| | | | | | | | | | | | |
| TOTAL COLLATERALIZED LOAN OBLIGATIONS | | | |
| (Cost $50,609,543) | | 46,505,901 | |
| | | | | | | | | | | | |
| EQUITY - LINKED NOTES - 0.00%(a) | | | |
| | 263,093 | | Inverpamplona SA(j)(k) | | 0.00% | | 12/30/2028 | | | 11,250 | |
| | | | | | | | | | | | |
| TOTAL EQUITY - LINKED NOTES | | | |
| (Cost $11,250) | | 11,250 | |
| | | | | | | | | | | | |
| NON-AGENCY COLLATERALIZED MORTGAGE OBLIGATIONS - 25.04% |
| | | | Aaset Trust | | | | | | | | |
| | 464,574 | | Series 2019-2(g) | | 3.38% | | 10/16/2026 | | | 436,407 | |
| | | | AASET, Ltd. | | | | | | | | |
| | 513,749 | | Series 2018-1A(g) | | 3.84% | | 09/16/2023 | | | 475,439 | |
| | | | ABFC Trust | | | | | | | | |
| | 3,394,597 | | Series 2007-WMC1(f) | | 1M US L + 1.25% | | 06/25/2037 | | | 2,916,454 | |
| | | | Adjustable Rate Mortgage Trust | | | | | | | | |
| | 306,906 | | Series 2005-1(f) | | 3.65% | | 05/25/2035 | | | 312,584 | |
| | 2,924,952 | | Series 2005-10(f) | | 3.11% | | 01/25/2036 | | | 2,597,510 | |
| | 136,794 | | Series 2005-7(f) | | 3.42% | | 10/25/2035 | | | 122,873 | |
See Notes to Financial Statements.
| Annual Report | September 30, 2020 | 54 |
| RiverNorth/DoubleLine Strategic Income Fund | Schedule of Investments |
September 30, 2020
| Principal Amount/Description | | Rate | | Maturity | | Value | |
| | | | Affirm Asset Securitization Trust 2020-A | | | | | | | | |
| $ | 1,750,000 | | Series 2020-A(g) | | 6.23% | | 10/15/2022 | | $ | 1,783,276 | |
| | | | Alternative Loan Trust | | | | | | | | |
| | 234,440 | | Series 2005-20CB | | 5.50% | | 07/25/2035 | | | 226,588 | |
| | 88,520 | | Series 2005-54CB | | 5.50% | | 11/25/2035 | | | 71,907 | |
| | 465,879 | | Series 2005-6CB | | 5.50% | | 04/25/2035 | | | 466,414 | |
| | 208,085 | | Series 2005-85CB(f) | | 21.63% - 3.67 x 1M US L | | 02/25/2036 | | | 298,976 | |
| | 985,326 | | Series 2005-85CB(f) | | 1M US L + 1.10% | | 02/25/2036 | | | 803,813 | |
| | 259,763 | | Series 2005-86CB | | 5.50% | | 02/25/2036 | | | 218,503 | |
| | 462,010 | | Series 2005-9CB(f)(l) | | 5.05% - 1M US L | | 05/25/2035 | | | 52,617 | |
| | 260,141 | | Series 2005-9CB(f) | | 1M US L + 0.50% | | 05/25/2035 | | | 232,527 | |
| | 260,910 | | Series 2006-12CB(f) | | 1M US L + 5.75% | | 05/25/2036 | | | 203,071 | |
| | 1,286,981 | | Series 2006-15CB | | 6.50% | | 06/25/2036 | | | 996,360 | |
| | 146,016 | | Series 2006-30T1 | | 6.25% | | 11/25/2036 | | | 130,494 | |
| | 126,315 | | Series 2006-32CB | | 5.50% | | 11/25/2036 | | | 98,709 | |
| | 293,442 | | Series 2006-36T2(f) | | 28.06% - 4.6 x 1M US L | | 12/25/2036 | | | 556,326 | |
| | 994,847 | | Series 2007-19 | | 6.00% | | 08/25/2037 | | | 741,360 | |
| | 3,494,874 | | Series 2007-20 | | 6.25% | | 08/25/2047 | | | 2,713,967 | |
| | 923,505 | | Series 2007-23CB(f)(l) | | 6.50% - 1M US L | | 09/25/2037 | | | 311,254 | |
| | 967,190 | | Series 2007-23CB(f) | | 1M US L + 0.50% | | 09/25/2037 | | | 376,146 | |
| | | | American Home Mortgage Investment Trust | | | | | | | | |
| | 168,158 | | Series 2007-A(g)(m) | | 6.60% | | 01/25/2037 | | | 64,560 | |
| | | | AmeriHome GMSR Issuer Trust | | | | | | | | |
| | 3,100,000 | | Series 2019-GT1(g) | | 4.68% | | 11/25/2026 | | | 2,712,403 | |
| | | | AMSR 2020-SFR3 Trust | | | | | | | | |
| | 5,100,000 | | Series 2020-SFR3(g) | | 4.99% | | 09/17/2025 | | | 5,129,298 | |
| | | | AREIT Trust | | | | | | | | |
| | 1,265,000 | | Series 2019-CRE3(f)(g) | | 1M US L + 2.65% | | 07/14/2022 | | | 1,204,513 | |
| | | | Atlas Senior Loan Fund X, Ltd. | | | | | | | | |
| | 492,745 | | Series 2018-10A(f)(g) | | 3M US L + 1.09% | | 01/15/2031 | | | 487,594 | |
| | | | Atrium Hotel Portfolio Trust | | | | | | | | |
| | 1,309,000 | | Series 2018-ATRM(f)(g) | | 1M US L + 3.40% | | 06/15/2021 | | | 1,129,909 | |
| | | | Atrium IX | | | | | | | | |
| | 500,000 | | Series 2017-9A(f)(g) | | 3M US L + 3.60% | | 05/28/2030 | | | 485,257 | |
| | | | Atrium XIII | | | | | | | | |
| | 1,000,000 | | Series 2017-13A(f)(g) | | 3M US L + 6.05% | | 11/21/2030 | | | 869,257 | |
| | | | Atrium XIV LLC | | | | | | | | |
| | 1,000,000 | | Series 2018-14A(f)(g) | | 3M US L + 5.65% | | 08/23/2030 | | | 915,262 | |
| | | | Atrium XV | | | | | | | | |
| | 1,000,000 | | Series 2018-15A(f)(g) | | 3M US L + 3.00% | | 01/23/2031 | | | 966,284 | |
See Notes to Financial Statements.
| 55 | (888) 848-7569 | www.rivernorth.com |
| RiverNorth/DoubleLine Strategic Income Fund | Schedule of Investments |
September 30, 2020
| Principal Amount/Description | | Rate | | Maturity | | Value | |
| | | | BAMLL Commercial Mortgage Securities Trust | | | | | | | | |
| $ | 683,000 | | Series 2019-AHT(f)(g) | | 2.68% | | 03/15/2021 | | $ | 597,475 | |
| | | | Banc of America Funding Corp. | | | | | | | | |
| | 39,380 | | Series 2008-R2(g) | | 6.00% | | 09/25/2037 | | | 40,048 | |
| | | | Banc of America Funding Trust | | | | | | | | |
| | 133,332 | | Series 2006-2 | | 5.50% | | 03/25/2036 | | | 133,630 | |
| | 3,581,065 | | Series 2010-R5(f)(g) | | 6.00% | | 10/26/2037 | | | 3,374,126 | |
| | | | Bancorp Commercial Mortgage Trust | | | | | | | | |
| | 605,000 | | Series 2019-CRE5(f)(g) | | 1M US L + 1.50% | | 01/15/2022 | | | 578,253 | |
| | 1,312,000 | | Series 2019-CRE5(f)(g) | | 1M US L + 2.35% | | 02/15/2022 | | | 1,199,570 | |
| | | | BANK | | | | | | | | |
| | 463,000 | | Series 2018-BN10(f) | | 4.08% | | 01/15/2028 | | | 505,603 | |
| | 10,291,000 | | Series 2018-BN12(f)(g)(l) | | 1.50% | | 05/15/2061 | | | 893,898 | |
| | 463,000 | | Series 2018-BN13(f) | | 4.70% | | 07/15/2028 | | | 536,605 | |
| | | | BANK 2020-BNK27 | | | | | | | | |
| | 16,875,000 | | Series 2020-BN27(f)(g)(l) | | 0.72% | | 04/15/2030 | | | 1,034,640 | |
| | | | BANK 2020-BNK28 | | | | | | | | |
| | 523,000 | | Series 2020-BN28 | | 2.34% | | 10/15/2030 | | | 538,730 | |
| | | | BBCMS Trust | | | | | | | | |
| | 3,000,000 | | Series 2018-CBM(f)(g) | | 1M US L + 3.55% | | 07/15/2037 | | | 2,458,409 | |
| | | | BCAP, LLC Trust | | | | | | | | |
| | 126,211 | | Series 2007-AA2(f) | | 7.50% | | 04/25/2037 | | | 104,173 | |
| | 81,887 | | Series 2007-AA2 | | 6.00% | | 04/25/2037 | | | 62,992 | |
| | 5,968,524 | | Series 2010-RR6(f)(g) | | 9.55% | | 07/26/2036 | | | 4,556,622 | |
| | | | Bear Stearns ALT-A Trust | | | | | | | | |
| | 1,037,070 | | Series 2004-11(f) | | 3.13% | | 11/25/2034 | | | 997,426 | |
| | 989,142 | | Series 2005-3(f) | | 3.06% | | 04/25/2035 | | | 924,957 | |
| | 8,268,031 | | Series 2006-3(f) | | 3.29% | | 05/25/2036 | | | 7,013,529 | |
| | 1,008,372 | | Series 2006-6(f) | | 3.62% | | 11/25/2036 | | | 729,989 | |
| | | | Bear Stearns Asset-Backed Securities Trust | | | | | | | | |
| | 2,008,534 | | Series 2006-AC1(m) | | 6.25% | | 02/25/2036 | | | 1,382,839 | |
| | | | Bellemeade Real Estate, Ltd. | | | | | | | | |
| | 1,469,148 | | Series 2019-2A(f)(g) | | 1M US L + 1.45% | | 04/25/2029 | | | 1,467,036 | |
| | | | Benchmark 2018-B4 Mortgage Trust | | | | | | | | |
| | 22,404,670 | | Series 2018-B4(f)(l) | | 0.69% | | 06/15/2028 | | | 659,246 | |
| | 1,589,000 | | Series 2018-B4(f)(g) | | 2.96% | | 07/15/2028 | | | 1,286,441 | |
| | | | Benchmark 2019-B12 Mortgage Trust | | | | | | | | |
| | 528,000 | | Series 2019-B12(f)(g) | | 3.56% | | 07/15/2024 | | | 518,521 | |
See Notes to Financial Statements.
| Annual Report | September 30, 2020 | 56 |
| RiverNorth/DoubleLine Strategic Income Fund | Schedule of Investments |
September 30, 2020
| Principal Amount/Description | | Rate | | Maturity | | Value | |
| | | | Benchmark 2020-B17 Mortgage Trust | | | | | | | | |
| $ | 954,000 | | Series 2020-B17(f) | | 3.37% | | 03/15/2030 | | $ | 952,231 | |
| | | | Benchmark 2020-B18 Mortgage Trust | | | | | | | | |
| | 522,000 | | Series 2020-B18(g) | | 4.14% | | 08/15/2025 | | | 524,329 | |
| | 488,000 | | Series 2020-B18(f) | | 3.77% | | 07/15/2030 | | | 523,507 | |
| | | | Benchmark 2020-B19 Mortgage Trust | | | | | | | | |
| | 523,000 | | Series 2020-B19 | | 2.35% | | 09/15/2030 | | | 538,682 | |
| | | | BF Mortgage Trust | | | | | | | | |
| | 705,000 | | Series 2019-NYT(f)(g) | | 1M US L + 3.00% | | 12/15/2020 | | | 682,416 | |
| | | | BHP Trust | | | | | | | | |
| | 761,000 | | Series 2019-BXHP(f)(g) | | 1M US L + 2.57% | | 08/15/2021 | | | 693,720 | |
| | | | BX Trust | | | | | | | | |
| | 3,626,000 | | Series 2019-OC11(f)(g) | | 4.08% | | 12/09/2029 | | | 3,346,095 | |
| | | | Cantor Commercial Real Estate Lending | | | | | | | | |
| | 1,113,000 | | Series 2019-CF1(f)(g) | | 4.12% | | 04/15/2024 | | | 1,034,864 | |
| | | | Cantor Commercial Real Estate Lending 2019-CF1 | | | | | | | | |
| | 266,000 | | Series 2019-CF1(f)(g) | | 4.14% | | 04/15/2024 | | | 261,832 | |
| | | | Carbon Capital VI Commercial Mortgage Trust | | | | | | | | |
| | 680,000 | | Series 2019-FL2(f)(g) | | 1M US L + 2.85% | | 11/15/2021 | | | 596,387 | |
| | | | Carrington Mortgage Loan Trust | | | | | | | | |
| | 1,702,043 | | Series 2006-NC4(f) | | 1M US L + 0.16% | | 10/25/2036 | | | 1,630,125 | |
| | | | Cascade MH Asset Trust | | | | | | | | |
| | 4,601,000 | | Series 2019-MH1(f)(g) | | 5.99% | | 10/25/2024 | | | 4,650,818 | |
| | | | Castlelake Aircraft Securitization Trust | | | | | | | | |
| | 2,949,138 | | Series 2018-1(g) | | 6.63% | | 06/15/2025 | | | 1,542,443 | |
| | | | Castlelake Aircraft Structured Trust | | | | | | | | |
| | 623,449 | | Series 2019-1A(g) | | 3.97% | | 04/15/2026 | | | 576,497 | |
| | 2,750,000 | | Series 2019-1A(g)(j) | | 0.00% | | 04/15/2039 | | | 1,062,682 | |
| | | | CF Trust | | | | | | | | |
| | 1,518,000 | | Series 2019-MF1(f)(g) | | 1M US L + 2.95% | | 08/21/2021 | | | 1,390,288 | |
| | | | Chase Mortgage Finance Trust | | | | | | | | |
| | 12,124,207 | | Series 2007-S2 | | 6.00% | | 03/25/2037 | | | 9,041,881 | |
| | 407,681 | | Series 2007-S3 | | 5.50% | | 05/25/2037 | | | 92,858 | |
| | | | CIM Trust | | | | | | | | |
| | 11,994,166 | | Series 2016-1RR(f)(g) | | 6.34% | | 07/26/2055 | | | 11,378,386 | |
| | 12,000,000 | | Series 2016-2RR B2(f)(g) | | 6.32% | | 02/25/2056 | | | 11,560,860 | |
| | 12,000,000 | | Series 2016-3RR B2(f)(g) | | 6.30% | | 02/27/2056 | | | 11,411,268 | |
| | 11,430,000 | | Series 2016-3RR B2(f)(g) | | 10.33% | | 01/27/2057 | | | 10,912,472 | |
See Notes to Financial Statements.
| 57 | (888) 848-7569 | www.rivernorth.com |
| RiverNorth/DoubleLine Strategic Income Fund | Schedule of Investments |
September 30, 2020
| Principal Amount/Description | | Rate | | Maturity | | Value | |
| | | | Citicorp Mortgage Securities Trust | | | | | | | | |
| $ | 453,491 | | Series 2007-1 | | 6.00% | | 01/25/2037 | | $ | 450,166 | |
| | | | Citigroup Commercial Mortgage Trust | | | | | | | | |
| | 3,748,606 | | Series 2014-GC25(f)(l) | | 1.14% | | 10/10/2047 | | | 123,472 | |
| | 866,000 | | Series 2015-GC27(f)(g) | | 4.57% | | 01/10/2025 | | | 708,078 | |
| | 400,000 | | Series 2015-GC31(f) | | 4.19% | | 06/10/2025 | | | 391,144 | |
| | 344,000 | | Series 2016-GC36(g) | | 2.85% | | 01/10/2026 | | | 232,028 | |
| | 464,000 | | Series 2017-C4(f) | | 4.10% | | 10/12/2027 | | | 505,723 | |
| | 463,000 | | Series 2018-B2(f) | | 4.28% | | 03/10/2028 | | | 521,842 | |
| | 515,000 | | Series 2018-C5(f) | | 4.88% | | 06/10/2028 | | | 545,168 | |
| | 901,000 | | Series 2019-SST2(f)(g) | | 1M US L + 1.60% | | 02/15/2022 | | | 866,028 | |
| | 901,000 | | Series 2019-SST2(f)(g) | | 1M US L + 2.00% | | 02/15/2022 | | | 863,839 | |
| | 1,433,000 | | Series 2020-555(g) | | 3.62% | | 12/10/2029 | | | 1,125,867 | |
| | | | Citigroup Commercial Mortgage Trust 2019-GC41 | | | | | | | | |
| | 520,000 | | Series 2019-GC41 | | 3.20% | | 08/10/2029 | | | 563,711 | |
| | | | Citigroup COmmercial Mortgage Trust 2019-SMRT | | | | | | | | |
| | 1,000,000 | | Series 2019-SMRT(f)(g) | | 4.90% | | 01/10/2024 | | | 1,006,494 | |
| | | | Citigroup Commercial Mortgage Trust 2020-GC46 | | | | | | | | |
| | 2,000,000 | | Series 2020-GC46(g) | | 2.60% | | 02/15/2030 | | | 1,357,502 | |
| | | | Citigroup Mortgage Loan Trust | | | | | | | | |
| | 762,211 | | Series 2006-WF1(m) | | 4.83% | | 03/25/2036 | | | 497,843 | |
| | 1,199,521 | | Series 2007-OPX1(m) | | 6.33% | | 01/25/2037 | | | 658,400 | |
| | 241,563 | | Series 2008-AR4(f)(g) | | 3.87% | | 11/25/2038 | | | 242,779 | |
| | | | CitiMortgage Alternative Loan Trust | | | | | | | | |
| | 519,207 | | Series 2007-A1 | | 6.00% | | 01/25/2037 | | | 522,292 | |
| | 102,270 | | Series 2007-A1(f)(l) | | 5.40% - 1M US L | | 01/25/2037 | | | 18,889 | |
| | 77,437 | | Series 2007-A3(f) | | 6.00% | | 03/25/2037 | | | 78,162 | |
| | 178,208 | | Series 2007-A3(f)(l) | | 5.40% - 1M US L | | 03/25/2037 | | | 34,789 | |
| | 614,979 | | Series 2007-A4 | | 5.75% | | 04/25/2037 | | | 613,606 | |
| | 540,576 | | Series 2007-A6 | | 5.50% | | 06/25/2037 | | | 509,486 | |
| | | | CLI Funding VI LLC | | | | | | | | |
| | 867,579 | | Series 2019-1A(g) | | 3.71% | | 05/18/2029 | | | 885,883 | |
| | | | CLNC 2019-FL1, Ltd. | | | | | | | | |
| | 1,037,000 | | Series 2019-FL1(f)(g) | | 1M US L + 1.55% | | 12/19/2025 | | | 1,015,561 | |
| | | | COMM Mortgage Trust | | | | | | | | |
| | 887,000 | | Series 2013-CR11(f) | | 5.28% | | 09/10/2023 | | | 941,460 | |
| | 500,000 | | Series 2016-GCT(f)(g) | | 3.58% | | 08/10/2021 | | | 492,609 | |
| | | | Commercial Mortgage Pass-Through Certificates | | | | | | | | |
| | 242,400 | | Series 2014-CR19(f) | | 4.87% | | 08/10/2024 | | | 249,514 | |
| | 8,643,281 | | Series 2014-UBS4(g) | | 3.75% | | 08/10/2024 | | | 1,498,086 | |
See Notes to Financial Statements.
| Annual Report | September 30, 2020 | 58 |
| RiverNorth/DoubleLine Strategic Income Fund | Schedule of Investments |
September 30, 2020
| Principal Amount/Description | | Rate | | Maturity | | Value | |
| $ | 11,000 | | Series 2014-UBS4(f)(g)(j) | | 0.00% | | 08/10/2047 | | $ | 1 | |
| | 3,263,913 | | Series 2015-CR22(f)(l) | | 1.03% | | 03/10/2025 | | | 95,834 | |
| | 916,000 | | Series 2015-CR25(f) | | 4.69% | | 08/10/2025 | | | 907,632 | |
| | 4,584,973 | | Series 2015-CR26(f)(l) | | 1.08% | | 09/10/2025 | | | 175,622 | |
| | 419,000 | | Series 2015-LC23(f) | | 4.79% | | 10/10/2025 | | | 421,277 | |
| | | | Commercial Mortgage Trust | | | | | | | | |
| | 659,000 | | Series 2012-CR4(f)(g) | | 4.75% | | 11/15/2022 | | | 70,182 | |
| | | | CORE Mortgage Trust | | | | | | | | |
| | 540,000 | | Series 2019-CORE(f)(g) | | 1M US L + 1.90% | | 12/15/2020 | | | 529,068 | |
| | 540,000 | | Series 2019-CORE(f)(g) | | 1M US L + 2.35% | | 12/15/2020 | | | 520,639 | |
| | | | Countrywide Home Loan Mortgage Pass-Through Trust | | | | | | | | |
| | 2,157,998 | | Series 2005-HYB7(f) | | 3.28% | | 11/20/2035 | | | 1,847,586 | |
| | 32,271 | | Series 2005-J4 | | 5.50% | | 11/25/2035 | | | 31,415 | |
| | 1,834,985 | | Series 2006-18 | | 6.00% | | 12/25/2036 | | | 1,533,169 | |
| | 273,337 | | Series 2007-17 | | 6.00% | | 10/25/2037 | | | 247,061 | |
| | 292,172 | | Series 2007-3 | | 6.00% | | 04/25/2037 | | | 224,410 | |
| | 316,062 | | Series 2007-7 | | 5.75% | | 06/25/2037 | | | 254,561 | |
| | | | Credit Suisse First Boston Mortgage Securities Corp. | | | | | | | | |
| | 68,497 | | Series 2005-10 | | 5.50% | | 11/25/2035 | | | 62,237 | |
| | 1,958,676 | | Series 2005-11 | | 6.00% | | 12/25/2035 | | | 1,811,699 | |
| | 67,218 | | Series 2005-8 | | 5.50% | | 08/25/2025 | | | 66,116 | |
| | 4,388,815 | | Series 2005-9 | | 6.00% | | 10/25/2035 | | | 2,213,904 | |
| | | | Credit Suisse Mortgage Capital Certificates | | | | | | | | |
| | 2,650,949 | | Series 2006-2 | | 5.75% | | 03/25/2036 | | | 2,054,337 | |
| | | | CSAB Mortgage-Backed Trust | | | | | | | | |
| | 8,781,274 | | Series 2006-2(m) | | 5.70% | | 09/25/2036 | | | 980,581 | |
| | 140,926 | | Series 2007-1(f) | | 5.90% | | 05/25/2037 | | | 52,415 | |
| | | | CSAIL 2016-C6 Commercial Mortgage Trust | | | | | | | | |
| | 490,000 | | Series 2016-C6(f) | | 5.09% | | 04/15/2026 | | | 513,953 | |
| | 1,362,000 | | Series 2016-C6(f)(g) | | 5.09% | | 05/15/2026 | | | 1,237,606 | |
| | | | CSAIL Commercial Mortgage Trust | | | | | | | | |
| | 5,288,269 | | Series 2015-C1(f)(l) | | 0.98% | | 01/15/2025 | | | 156,680 | |
| | 419,000 | | Series 2015-C4(f) | | 4.71% | | 11/15/2025 | | | 413,494 | |
| | 214,000 | | Series 2018-C14(f) | | 5.05% | | 10/15/2028 | | | 231,905 | |
| | | | CSMC Mortgage-Backed Trust | | | | | | | | |
| | 165,991 | | Series 2006-1 | | 6.00% | | 02/25/2036 | | | 94,437 | |
| | 22,438 | | Series 2006-4 | | 5.50% | | 05/25/2021 | | | 20,125 | |
| | 789,217 | | Series 2006-5 | | 6.25% | | 06/25/2036 | | | 287,587 | |
| | 88,285 | | Series 2006-9 | | 6.00% | | 11/25/2036 | | | 67,977 | |
| | 1,996,174 | | Series 2007-1 | | 6.00% | | 02/25/2037 | | | 1,812,563 | |
See Notes to Financial Statements.
| 59 | (888) 848-7569 | www.rivernorth.com |
| RiverNorth/DoubleLine Strategic Income Fund | Schedule of Investments |
September 30, 2020
| Principal Amount/Description | | Rate | | Maturity | | Value | |
| $ | 9,376 | | Series 2007-2 | | 5.00% | | 03/25/2037 | | $ | 9,127 | |
| | 521,460 | | Series 2007-3(f) | | 5.84% | | 04/25/2037 | | | 228,233 | |
| | 28,910 | | Series 2007-4 | | 6.00% | | 06/25/2037 | | | 23,140 | |
| | 604,000 | | Series 2017-CALI(f)(g) | | 3.90% | | 11/10/2024 | | | 623,565 | |
| | 253,000 | | Series 2017-CHOP(f)(g) | | 1M US L + 1.90% | | 07/15/2032 | | | 215,220 | |
| | 223,000 | | Series 2017-CHOP(f)(g) | | 1M US L + 3.30% | | 07/15/2032 | | | 179,404 | |
| | 765,671 | | Series 2018-RPL2(g)(m) | | 4.31% | | 08/25/2062 | | | 772,872 | |
| | | | DB Master Finance LLC | | | | | | | | |
| | 990,000 | | Series 2019-1A(g) | | 3.79% | | 02/20/2024 | | | 1,026,364 | |
| | | | DBGS 2018-BIOD Mortgage Trust | | | | | | | | |
| | 861,313 | | Series 2018-BIOD(f)(g) | | 1M US L + 2.00% | | 05/15/2035 | | | 850,667 | |
| | | | DBJPM 16-C1 Mortgage Trust | | | | | | | | |
| | 1,309,000 | | Series 2016-C1(f) | | 3.50% | | 03/10/2026 | | | 1,189,005 | |
| | | | Deutsche Alt-A Securities, Inc. Mortgage Loan Trust | | | | | | | | |
| | 270,565 | | Series 2005-6(f)(l) | | 5.08% - 1M US L | | 12/25/2035 | | | 52,788 | |
| | 118,612 | | Series 2005-6(f) | | 1M US L + 1.40% | | 12/25/2035 | | | 88,631 | |
| | | | Deutsche Mortgage Securities, Inc. Mortgage Loan Trust | | | | | | | | |
| | 157,024 | | Series 2006-PR1(f)(g) | | 12.12% - 1M US L | | 04/15/2036 | | | 158,699 | |
| | | | Dryden 38 Senior Loan Fund | | | | | | | | |
| | 1,000,000 | | Series 2018-38A(f)(g) | | 3M US L + 5.60% | | 07/15/2030 | | | 861,819 | |
| | | | Dryden 40 Senior Loan Fund | | | | | | | | |
| | 1,000,000 | | Series 2018-40A(f)(g) | | 3M US L + 5.75% | | 08/15/2031 | | | 891,089 | |
| | 500,000 | | Series 2018-40A(f)(g) | | 3M US L + 3.10% | | 08/15/2031 | | | 487,826 | |
| | | | Earnest Student Loan Program | | | | | | | | |
| | 35,000 | | Series 2016-D(g)(j) | | 0.00% | | 05/25/2025 | | | 496,203 | |
| | | | Ellington Financial Mortgage Trust | | | | | | | | |
| | 714,474 | | Series 2018-1(f)(g) | | 4.39% | | 10/25/2058 | | | 734,973 | |
| | | | Fannie Mae-Aces | | | | | | | | |
| | 16,990,766 | | Series 2019-M24(f)(l) | | 1.15% | | 03/25/2031 | | | 1,685,759 | |
| | 58,620,434 | | Series 2020-M10(f)(l) | | 0.99% | | 12/25/2027 | | | 2,683,374 | |
| | 59,884,173 | | Series 2020-M10(f)(l) | | 1.00% | | 07/25/2032 | | | 4,739,210 | |
| | | | First Horizon Alternative Mortgage Securities Trust | | | | | | | | |
| | 738,162 | | Series 2005-FA6 | | 5.50% | | 09/25/2035 | | | 630,908 | |
| | 129,354 | | Series 2007-FA2 | | 6.00% | | 04/25/2037 | | | 80,438 | |
| | | | First Horizon Mortgage Pass-Through Trust | | | | | | | | |
| | 980,048 | | Series 2007-AR3(f) | | 3.11% | | 11/25/2037 | | | 738,057 | |
| | | | FirstKey Homes 2020-SFR1 Trust | | | | | | | | |
| | 1,100,000 | | Series 2020-SFR1(g) | | 4.28% | | 09/17/2025 | | | 1,135,273 | |
| | | | Fontainebleau Miami Beach Trust | | | | | | | | |
| | 2,366,000 | | Series 2019-FBLU(f)(g) | | 4.10% | | 12/10/2024 | | | 2,048,505 | |
See Notes to Financial Statements.
| Annual Report | September 30, 2020 | 60 |
| RiverNorth/DoubleLine Strategic Income Fund | Schedule of Investments |
September 30, 2020
| Principal Amount/Description | | Rate | | Maturity | | Value | |
| | | | GAIA Aviation, Ltd. | | | | | | | | |
| $ | 553,415 | | Series 2019-1(g)(m) | | 3.97% | | 12/15/2026 | | $ | 498,836 | |
| | 374,679 | | Series 2019-1(g)(m) | | 7.00% | | 12/15/2026 | | | 184,953 | |
| | | | Great Wolf Trust | | | | | | | | |
| | 3,084,000 | | Series 2019-WOLF(f)(g) | | 1M US L + 3.13% | | 12/15/2024 | | | 2,702,334 | |
| | | | GS Mortgage Securities Corp. Trust 2018-RIVR | | | | | | | | |
| | 1,000,000 | | Series 2018-RIVR(f)(g) | | 1M US L + 1.55% | | 07/15/2035 | | | 881,256 | |
| | | | GS Mortgage Securities Trust | | | | | | | | |
| | 198,290 | | Series 2011-GC3(f)(g)(l) | | 0.66% | | 03/10/2021 | | | 58 | |
| | 2,183,852 | | Series 2011-GC5(f)(g)(l) | | 1.49% | | 08/10/2044 | | | 12,325 | |
| | 3,986,000 | | Series 2014-GC26(f)(g) | | 4.66% | | 11/10/2047 | | | 2,486,223 | |
| | 7,166,483 | | Series 2015-GS1(f)(l) | | 0.92% | | 11/10/2025 | | | 241,611 | |
| | 1,954,000 | | Series 2018-TWR(f)(g) | | 1M US L + 3.92% | | 07/15/2021 | | | 1,728,379 | |
| | 636,000 | | Series 2020-GC45(f) | | 3.41% | | 12/13/2029 | | | 682,012 | |
| | | | GS Mortgage Securities Trust 2016-GS2 | | | | | | | | |
| | 260,000 | | Series 2016-GS2(f) | | 3.76% | | 04/10/2026 | | | 281,183 | |
| | | | GSAA Home Equity Trust | | | | | | | | |
| | 2,299,353 | | Series 2006-13(f) | | 6.04% | | 07/25/2036 | | | 1,089,224 | |
| | 530,946 | | Series 2006-18(m) | | 5.68% | | 11/25/2036 | | | 215,138 | |
| | 166,312 | | Series 2006-6(f) | | 5.69% | | 03/25/2036 | | | 71,907 | |
| | 913,515 | | Series 2007-2(m) | | 6.10% | | 03/25/2037 | | | 324,034 | |
| | | | GSCG Trust | | | | | | | | |
| | 628,000 | | Series 2019-600C(g) | | 3.76% | | 09/06/2024 | | | 619,528 | |
| | 1,303,000 | | Series 2019-600C(f)(g) | | 4.12% | | 09/06/2024 | | | 1,200,086 | |
| | | | GSR Mortgage Loan Trust | | | | | | | | |
| | 215,938 | | Series 2005-AR4(f) | | 3.34% | | 07/25/2035 | | | 217,799 | |
| | 1,314,799 | | Series 2006-2F | | 5.25% | | 02/25/2036 | | | 895,582 | |
| | 241,082 | | Series 2007-2F | | 5.75% | | 02/25/2037 | | | 624,168 | |
| | 2,651,732 | | Series 2007-2F | | 6.00% | | 03/25/2037 | | | 2,168,188 | |
| | 1,047,133 | | Series 2007-AR2(f) | | 3.65% | | 05/25/2037 | | | 815,961 | |
| | | | Halcyon Loan Advisors Funding, Ltd. | | | | | | | | |
| | 250,000 | | Series 2013-2A(f)(g) | | 3M US L + 2.70% | | 08/01/2025 | | | 248,136 | |
| | | | Harley Marine Financing LLC | | | | | | | | |
| | 924,473 | | Series 2018-1A(g) | | 5.68% | | 05/15/2022 | | | 830,085 | |
| | | | Hawaii Hotel Trust | | | | | | | | |
| | 1,391,000 | | Series 2019-MAUI(f)(g) | | 1M US L + 2.75% | | 05/15/2021 | | | 1,211,275 | |
| | | | Hayfin Kingsland X, Ltd. | | | | | | | | |
| | 500,000 | | Series 2019-1A(f)(g) | | 3M US L + 2.25% | | 04/28/2031 | | | 499,820 | |
| | | | Helios Issuer, LLC Series | | | | | | | | |
| | 1,267,418 | | Series 2017-1A(g) | | 4.94% | | 09/20/2023 | | | 1,351,581 | |
| | | | Highbridge Loan Management, Ltd. | | | | | | | | |
| | 500,000 | | Series 2017-2A(f)(g) | | 3M US L + 6.60% | | 10/20/2029 | | | 427,432 | |
See Notes to Financial Statements.
| 61 | (888) 848-7569 | www.rivernorth.com |
| RiverNorth/DoubleLine Strategic Income Fund | Schedule of Investments |
September 30, 2020
| Principal Amount/Description | | Rate | | Maturity | | Value | |
| $ | 2,000,000 | | Series 2018-2015(f)(g) | | 3M US L + 5.10% | | 02/05/2031 | | $ | 1,642,938 | |
| | 500,000 | | Series 2018-2016(f)(g) | | 3M US L + 2.90% | | 07/20/2030 | | | 442,577 | |
| | | | Horizon Aircraft Finance III, Ltd. | | | | | | | | |
| | 967,542 | | Series 2019-2(g) | | 3.43% | | 11/15/2026 | | | 881,657 | |
| | | | HPLY Trust | | | | | | | | |
| | 572,076 | | Series 2019-HIT(f)(g) | | 1M US L + 3.15% | | 11/15/2021 | | | 498,950 | |
| | 1,140,054 | | Series 2019-HIT(f)(g) | | 1M US L + 3.90% | | 11/15/2021 | | | 922,523 | |
| | | | HSI Asset Securitization Corp. Trust | | | | | | | | |
| | 9,365,105 | | Series 2006-HE1(f) | | 1M US L + 0.14% | | 10/25/2036 | | | 4,239,805 | |
| | | | IMT Trust | | | | | | | | |
| | 325,349 | | Series 2017-APTS(f)(g) | | 1M US L + 1.10% | | 06/15/2034 | | | 319,753 | |
| | | | IndyMac IMJA Mortgage Loan Trust | | | | | | | | |
| | 1,094,003 | | Series 2007-A1 | | 6.00% | | 08/25/2037 | | | 681,985 | |
| | | | IndyMac IMSC Mortgage Loan Trust | | | | | | | | |
| | 4,708,454 | | Series 2007-F2 | | 6.50% | | 07/25/2037 | | | 2,596,475 | |
| | | | IndyMac Index Mortgage Loan Trust | | | | | | | | |
| | 1,599,385 | | Series 2005-AR31(f) | | 3.37% | | 01/25/2036 | | | 1,522,873 | |
| | 964,089 | | Series 2005-AR35(f) | | 3.26% | | 02/25/2036 | | | 896,965 | |
| | 2,279,953 | | Series 2006-AR25(f) | | 3.08% | | 09/25/2036 | | | 2,079,686 | |
| | | | Invitation Homes | | | | | | | | |
| | 995,000 | | Series 2018-SFR1(f)(g) | | 1M US L + 1.25% | | 03/17/2037 | | | 998,476 | |
| | 650,000 | | Series 2018-SFR1(f)(g) | | 1M US L + 1.45% | | 03/17/2037 | | | 651,181 | |
| | | | JOL Air, Ltd. | | | | | | | | |
| | 894,664 | | Series 2019-1(g) | | 3.97% | | 04/15/2026 | | | 849,960 | |
| | | | JP Morgan Alternative Loan Trust | | | | | | | | |
| | 250,509 | | Series 2005-S1 | | 6.00% | | 12/25/2035 | | | 229,537 | |
| | 119,595 | | Series 2006-S3(m) | | 6.12% | | 08/25/2036 | | | 117,094 | |
| | | | JP Morgan BB Commercial Mortgage Securities Trust | | | | | | | | |
| | 400,000 | | Series 2014-C21(f) | | 4.81% | | 07/15/2024 | | | 387,900 | |
| | 2,086,000 | | Series 2014-C23(f)(g) | | 3.36% | | 10/15/2024 | | | 1,288,203 | |
| | 388,000 | | Series 2014-C26(f) | | 4.52% | | 12/15/2024 | | | 399,327 | |
| | 4,497,980 | | Series 2015-C28(f)(l) | | 1.11% | | 03/15/2025 | | | 150,161 | |
| | 1,470,000 | | Series 2015-C28 | | 3.99% | | 03/15/2025 | | | 1,500,722 | |
| | 8,770,075 | | Series 2015-C30(f)(l) | | 0.65% | | 07/15/2025 | | | 185,234 | |
| | 3,462,694 | | Series 2015-C31(f)(l) | | 1.03% | | 08/15/2025 | | | 116,956 | |
| | | | JP Morgan Chase Commercial Mortgage Securities Corp. | | | | | | | | |
| | 2,092,000 | | Series 2018-AON(f)(g) | | 4.77% | | 07/05/2023 | | | 2,074,585 | |
| | | | JP Morgan Chase Commercial Mortgage Securities Trust | | | | | | | | |
| | 58,582 | | Series 2006-LDP8(f)(l) | | 0.29% | | 05/15/2045 | | | 1 | |
| | 4,000,000 | | Series 2007-CH1(m) | | 4.85% | | 11/25/2036 | | | 4,359,574 | |
| | 1,157,000 | | Series 2011-C3(f)(g) | | 5.85% | | 03/15/2021 | | | 340,485 | |
See Notes to Financial Statements.
| Annual Report | September 30, 2020 | 62 |
| RiverNorth/DoubleLine Strategic Income Fund | Schedule of Investments |
September 30, 2020
| Principal Amount/Description | | Rate | | Maturity | | Value | |
| $ | 2,323,987 | | Series 2012-C8(f)(l) | | 1.92% | | 09/15/2022 | | $ | 65,037 | |
| | 1,010,000 | | Series 2018-WPT(g) | | 5.54% | | 07/05/2023 | | | 965,577 | |
| | 887,000 | | Series 2019-COR4 | | 4.44% | | 12/10/2028 | | | 984,268 | |
| | 704,000 | | Series 2019-MFP(f)(g) | | 1M US L + 3.00% | | 07/15/2021 | | | 659,004 | |
| | 235,000 | | Series 2019-UES(g) | | 4.34% | | 05/05/2024 | | | 236,374 | |
| | 1,135,000 | | Series 2019-UES(f)(g) | | 4.45% | | 05/05/2024 | | | 1,062,230 | |
| | | | JP Morgan Chase Commercial Mortgage Securities Trust 2011-C5 | | | | | | | | |
| | 1,250,000 | | Series 2011-C5(f)(g) | | 5.61% | | 09/15/2021 | | | 1,262,419 | |
| | | | JP Morgan Mortgage Acquisition Corp. | | | | | | | | |
| | 263,260 | | Series 2006-CH2(m) | | 5.46% | | 09/25/2029 | | | 217,471 | |
| | | | JP Morgan Mortgage Acquisition Trust 2006-RM1 | | | | | | | | |
| | 2,657,639 | | Series 2006-RM1(f) | | 1M US L + 0.24% | | 08/25/2036 | | | 1,567,965 | |
| | | | JP Morgan Mortgage Trust | | | | | | | | |
| | 1,034,685 | | Series 2007-S3 | | 6.00% | | 07/25/2037 | | | 763,011 | |
| | | | JP Morgan Resecuritization Trust | | | | | | | | |
| | 1,019,772 | | Series 2011-1(f)(g) | | 6.00% | | 06/26/2037 | | | 953,385 | |
| | | | JPMBB Commercial Mortgage Securities Trust 2015-C27 | | | | | | | | |
| | 519,000 | | Series 2015-C27(f) | | 4.45% | | 02/15/2025 | | | 521,829 | |
| | | | JPMCC Commercial Mortgage Securities Trust 2017-JP7 | | | | | | | | |
| | 486,000 | | Series 2017-JP7(f) | | 3.80% | | 07/15/2027 | | | 490,804 | |
| | | | JPMDB Commercial Mortgage Securities Trust 2020-COR7 | | | | | | | | |
| | 421,000 | | Series 2020-COR7(f) | | 3.85% | | 03/13/2030 | | | 437,774 | |
| | | | Laurel Road Prime Student Loan Trust 2020-A | | | | | | | | |
| | 50,000,000 | | Series 2020-A(g)(j) | | 0.00% | | 11/25/2050 | | | 2,859,205 | |
| | | | LB-UBS Commercial Mortgage Trust | | | | | | | | |
| | 400,348 | | Series 2006-C7(f)(g)(l) | | 0.88% | | 11/15/2038 | | | 86 | |
| | | | LCM 28, Ltd. | | | | | | | | |
| | 1,000,000 | | Series 2018-28A(f)(g) | | 3M US L + 5.75% | | 10/20/2030 | | | 825,446 | |
| | | | LCM Loan Income Fund I Income Note Issuer, Ltd. | | | | | | | | |
| | 500,000 | | Series 2018-27A(f)(g) | | 3M US L + 5.60% | | 07/16/2031 | | | 411,213 | |
| | | | LCM XIV LP | | | | | | | | |
| | 1,000,000 | | Series 2018-14A(f)(g) | | 3M US L + 2.75% | | 07/20/2031 | | | 867,127 | |
| | 750,000 | | Series 2018-14A(f)(g) | | 3M US L + 5.50% | | 07/20/2031 | | | 537,569 | |
| | | | LCM XVII LP | | | | | | | | |
| | 1,000,000 | | Series 2018-17A(f)(g) | | 3M US L + 6.00% | | 10/15/2031 | | | 744,391 | |
See Notes to Financial Statements.
| 63 | (888) 848-7569 | www.rivernorth.com |
| RiverNorth/DoubleLine Strategic Income Fund | Schedule of Investments |
September 30, 2020
| Principal Amount/Description | | Rate | | Maturity | | | Value | |
| | | | | LCM XX LP | | | | | | | | | |
| $ | 1,000,000 | | | Series 2018-20A(f)(g) | | 3M US L + 5.45% | | 10/20/2027 | | | $ | 800,816 | |
| | | | | Legacy Mortgage Asset Trust | | | | | | | | | |
| | 13,400,000 | | | Series 2019-GS3(g)(m) | | 4.25% | | 04/25/2059 | | | | 13,515,784 | |
| | | | | Lehman Mortgage Trust | | | | | | | | | |
| | 4,171,635 | | | Series 2006-1(f) | | 5.24% | | 02/25/2036 | | | | 4,222,207 | |
| | 508,536 | | | Series 2006-6 | | 5.50% | | 10/25/2036 | | | | 410,263 | |
| | 3,851,048 | | | Series 2006-7(f) | | 1M US L + 0.25% | | 11/25/2036 | | | | 138,629 | |
| | 3,851,048 | | | Series 2006-7(f)(l) | | 7.75% - 1M US L | | 11/25/2036 | | | | 676,309 | |
| | 1,367,384 | | | Series 2006-8(f) | | 1M US L + 0.42% | | 12/25/2036 | | | | 297,243 | |
| | 1,367,384 | | | Series 2006-8(f)(l) | | 6.58% - 1M US L | | 12/25/2036 | | | | 432,953 | |
| | 597,909 | | | Series 2007-10 | | 6.00% | | 01/25/2038 | | | | 624,773 | |
| | 308,501 | | | Series 2007-10 | | 6.50% | | 01/25/2038 | | | | 172,187 | |
| | | | | Lehman XS Trust | | | | | | | | | |
| | 44,232 | | | Series 2006-5(m) | | 5.89% | | 04/25/2036 | | | | 44,801 | |
| | | | | MACH 1 Cayman, Ltd. | | | | | | | | | |
| | 1,392,578 | | | Series 2019-1(g) | | 3.47% | | 08/15/2026 | | | | 1,244,827 | |
| | | | | Madison Park Funding XIV, Ltd. | | | | | | | | | |
| | 1,000,000 | | | Series 2018-14A(f)(g) | | 3M US L + 2.95% | | 10/22/2030 | | | | 965,587 | |
| | 1,000,000 | | | Series 2018-14A(f)(g) | | 3M US L + 5.80% | | 10/22/2030 | | | | 866,109 | |
| | | | | MBRT 2019-MBR | | | | | | | | | |
| | 584,000 | | | Series 2019-MBR(f)(g) | | 1M US L + 2.55% | | 11/25/2021 | | | | 506,423 | |
| | 1,406,000 | | | Series 2019-MBR(f)(g) | | 1M US L + 2.90% | | 11/25/2021 | | | | 1,137,938 | |
| | | | | Mello Warehouse Securitization Trust | | | | | | | | | |
| | 2,500,000 | | | Series 2019-1(f)(g) | | 1M US L + 5.50% | | 05/14/2021 | | | | 2,494,083 | |
| | | | | Merrill Lynch Alternative Note Asset Trust | | | | | | | | | |
| | 704,471 | | | Series 2007-F1 | | 6.00% | | 03/25/2037 | | | | 155,940 | |
| | | | | Merrill Lynch Mortgage Investors Trust Series 2006-RM3 | | | | | | | | | |
| | 7,279,019 | | | Series 2006-RM3(f) | | 1M US L + 0.24% | | 06/25/2037 | | | | 2,491,705 | |
| | | | | MFT Trust 2020-ABC | | | | | | | | | |
| | 2,010,000 | | | Series 2020-ABC(f)(g) | | 3.48% | | 02/10/2030 | | | | 1,739,343 | |
| | | | | MKT Mortgage Trust | | | | | | | | | |
| | 250,000 | | | Series 2020-525M(f)(g) | | 2.94% | | 02/12/2030 | | | | 226,774 | |
| | | | | Morgan Stanley Bank of America Merrill Lynch Trust | | | | | | | | | |
| | 3,102,188 | | | Series 2012-C5(f)(g)(l) | | 1.57% | | 07/15/2022 | | | | 58,935 | |
| | 350,000 | | | Series 2015-C27(f) | | 4.68% | | 11/15/2025 | | | | 346,926 | |
| | | | | Morgan Stanley Capital Barclays Bank Trust 2016-MART | | | | | | | | | |
| | 1,250,000 | | | Series 2016-MART(g) | | 3.31% | | 09/13/2021 | | | | 1,200,358 | |
| | | | | Morgan Stanley Capital I Trust | | | | | | | | | |
| | 1,177,000 | | | Series 2007-IQ15(f)(g) | | 6.35% | | 06/11/2049 | | | | 1,145,237 | |
See Notes to Financial Statements.
| Annual Report | September 30, 2020 | 64 |
| RiverNorth/DoubleLine Strategic Income Fund | Schedule of Investments |
September 30, 2020
| Principal Amount/Description | | Rate | | Maturity | | | Value | |
| $ | 533,909 | | | Series 2011-C1(f)(g)(l) | | 0.64% | | 09/15/2047 | | | $ | 7 | |
| | 1,349,599 | | | Series 2016-UB11 XA(f)(l) | | 1.72% | | 08/15/2026 | | | | 84,827 | |
| | 1,000,000 | | | Series 2018-SUN(f)(g) | | 1M US L + 3.30% | | 07/15/2035 | | | | 899,299 | |
| | | | | Morgan Stanley Capital I Trust 2017-CLS | | | | | | | | | |
| | 576,000 | | | Series 2017-CLS(f)(g) | | 1M US L + 2.60% | | 11/15/2034 | | | | 562,155 | |
| | | | | Morgan Stanley Mortgage Loan Trust | | | | | | | | | |
| | 1,940,264 | | | Series 2005-3AR(f) | | 3.24% | | 07/25/2035 | | | | 1,785,660 | |
| | 3,312,105 | | | Series 2006-11 | | 6.00% | | 08/25/2036 | | | | 2,946,498 | |
| | 864,104 | | | Series 2006-7(f) | | 5.01% | | 06/25/2036 | | | | 719,799 | |
| | 922,610 | | | Series 2006-7 | | 6.00% | | 06/25/2036 | | | | 738,030 | |
| | 403,532 | | | Series 2007-3XS(m) | | 5.70% | | 01/25/2047 | | | | 226,850 | |
| | | | | Morgan Stanley Re-REMIC Trust | | | | | | | | | |
| | 225,747 | | | Series 2011-R1(f)(g) | | 5.94% | | 02/26/2037 | | | | 239,402 | |
| | | | | Mosaic Solar Loan Trust | | | | | | | | | |
| | 118,678 | | | Series 2017-1A(g) | | 4.45% | | 06/20/2042 | | | | 127,680 | |
| | 451,921 | | | Series 2018-1A(g) | | 4.01% | | 08/20/2030 | | | | 478,664 | |
| | | | | Mosaic Solar Loan Trust 2020-1 | | | | | | | | | |
| | 8,900,000 | | | Series 2020-1A(g)(j) | | 0.00% | | 04/20/2046 | | | | 3,139,012 | |
| | | | | Motel 6 Trust 2017-MTL6 | | | | | | | | | |
| | 968,555 | | | Series 2017-MTL6(f)(g) | | 1M US L + 4.25% | | 08/15/2034 | | | | 947,817 | |
| | | | | MSCG Trust | | | | | | | | | |
| | 2,154,000 | | | Series 2018-SELF(f)(g) | | 1M US L + 3.05% | | 10/15/2020 | | | | 2,044,886 | |
| | | | | Natixis Commercial Mortgage Securities Trust 2018-FL1 | | | | | | | | | |
| | 426,222 | | | Series 2018-FL1(f)(g) | | 1M US L + 2.35% | | 06/15/2035 | | | | 402,876 | |
| | | | | Navient Private Education Refi Loan Trust | | | | | | | | | |
| | 500,000 | | | Series 2018-A(g) | | 3.68% | | 11/17/2025 | | | | 509,718 | |
| | | | | Nomura Asset Acceptance Corp. Alternative Loan Trust | | | | | | | | | |
| | 1,153,719 | | | Series 2005-AP3(f) | | 5.32% | | 08/25/2035 | | | | 711,661 | |
| | | | | Ocagon Investment Partners 20-R, Ltd. | | | | | | | | | |
| | 1,500,000 | | | Series 2019-4A(f)(g) | | 3M US L + 6.80% | | 05/12/2031 | | | | 1,365,000 | |
| | | | | Octagon Investment Partners 26, Ltd. | | | | | | | | | |
| | 1,000,000 | | | Series 2018-1A(f)(g) | | 3M US L + 8.09% | | 07/15/2030 | | | | 753,767 | |
| | | | | Octagon Investment Partners 29, Ltd. | | | | | | | | | |
| | 2,000,000 | | | Series 2020-1A(f)(g) | | 3M US L + 7.25% | | 01/24/2033 | | | | 1,888,530 | |
| | | | | Octagon Investment Partners 37, Ltd. | | | | | | | | | |
| | 500,000 | | | Series 2018-2A(f)(g) | | 3M US L + 2.85% | | 07/25/2030 | | | | 465,635 | |
See Notes to Financial Statements.
| 65 | (888) 848-7569 | www.rivernorth.com |
| RiverNorth/DoubleLine Strategic Income Fund | Schedule of Investments |
September 30, 2020
| Principal Amount/Description | | Rate | | Maturity | | | Value | |
| | | | | Octagon Investment Partners 44, Ltd. | | | | | | | | | |
| $ | 1,000,000 | | | Series 2019-1A(f)(g) | | 3M US L + 3.65% | | 07/20/2032 | | | $ | 979,968 | |
| | | | | Octagon Investment Partners 47, Ltd. | | | | | | | | | |
| | 500,000 | | | Series 2020-1A(f)(g) | | 3M US L + 3.35% | | 04/20/2031 | | | | 502,349 | |
| | | | | Octagon Investment Partners XVI, Ltd. | | | | | | | | | |
| | 500,000 | | | Series 2018-1A(f)(g) | | 3M US L + 3.00% | | 07/17/2030 | | | | 471,650 | |
| | 1,000,000 | | | Series 2018-1A(f)(g) | | 3M US L + 5.75% | | 07/17/2030 | | | | 878,034 | |
| | | | | Octagon Investment Partners XXI, Ltd. | | | | | | | | | |
| | 1,000,000 | | | Series 2019-1A(f)(g) | | 3M US L + 7.00% | | 02/14/2031 | | | | 947,443 | |
| | | | | Octagon Investment Partners XXII, Ltd. | | | | | | | | | |
| | 970,000 | | | Series 2018-1A(f)(g) | | 3M US L + 1.90% | | 01/22/2030 | | | | 932,051 | |
| | 500,000 | | | Series 2018-1A(f)(g) | | 3M US L + 5.45% | | 01/22/2030 | | | | 428,644 | |
| | | | | OHA Credit Funding 1, Ltd. | | | | | | | | | |
| | 500,000 | | | Series 2018-1A(f)(g) | | 3M US L + 3.05% | | 10/20/2030 | | | | 485,484 | |
| | | | | OHA Credit Funding 3, Ltd. | | | | | | | | | |
| | 1,000,000 | | | Series 2019-3A(f)(g) | | 3.55% - 3M US L | | 07/20/2032 | | | | 978,523 | |
| | | | | OHA Credit Funding 5, Ltd. | | | | | | | | | |
| | 2,000,000 | | | Series 2020-5A(f)(g) | | 3M US L + 6.25% | | 04/18/2033 | | | | 1,879,641 | |
| | | | | One Market Plaza Trust | | | | | | | | | |
| | 1,211,000 | | | Series 2017-1MKT(g) | | 4.14% | | 02/10/2024 | | | | 1,230,098 | |
| | | | | PHH Alternative Mortgage Trust | | | | | | | | | |
| | 780,463 | | | Series 2007-2 | | 6.00% | | 05/25/2037 | | | | 716,187 | |
| | | | | PR Mortgage Loan Trust | | | | | | | | | |
| | 9,869,224 | | | Series 2014-1(f)(g) | | 5.91% | | 09/25/2047 | | | | 9,773,946 | |
| | | | | Pretium Mortgage Credit Partners I 2019-NPL2 LLC | | | | | | | | | |
| | 1,000,000 | | | Series 2019-NPL2(g)(m) | | 5.93% | | 12/27/2058 | | | | 1,000,628 | |
| | | | | Pretium Mortgage Credit Partners I LLC | | | | | | | | | |
| | 501,570 | | | Series 2019-NPL2(g)(m) | | 3.84% | | 12/27/2058 | | | | 503,440 | |
| | | | | Prime Mortgage Trust | | | | | | | | | |
| | 28,676 | | | Series 2006-1 | | 5.50% | | 06/25/2036 | | | | 28,470 | |
| | 78,804 | | | Series 2006-DR1(g) | | 5.50% | | 05/25/2035 | | | | 65,941 | |
| | | | | Primose Funding LLC | | | | | | | | | |
| | 992,500 | | | Series 2019-1A(g) | | 4.48% | | 07/30/2026 | | | | 1,033,135 | |
| | | | | Prosper Marketplace Issuance Trust | | | | | | | | | |
| | | | | Series 2018-1 | | | | | | | | | |
| | 601,300 | | | Series 2018-1A(g) | | 4.87% | | 06/17/2024 | | | | 602,541 | |
| | | | | PRPM 2019-4 LLC | | | | | | | | | |
| | 2,689,630 | | | Series 2019-4A(g)(m) | | 3.35% | | 11/25/2024 | | | | 2,700,940 | |
See Notes to Financial Statements.
| Annual Report | September 30, 2020 | 66 |
| RiverNorth/DoubleLine Strategic Income Fund | Schedule of Investments |
September 30, 2020
| Principal Amount/Description | | Rate | | Maturity | | | Value | |
| $ | 3,400,000 | | | Prpm 2020-3 A2(g)(m) | | 5.07% | | 09/25/2025 | | | $ | 3,399,996 | |
| | | | | PRPM LLC | | | | | | | | | |
| | 13,000,000 | | | Series 2020-1A(g)(m) | | 3.97% | | 02/25/2023 | | | | 12,592,391 | |
| | | | | RBSGC Structured Trust | | | | | | | | | |
| | 180,231 | | | Series 2008-B(g) | | 6.00% | | 06/25/2037 | | | | 180,529 | |
| | | | | Residential Accredit Loans, Inc. | | | | | | | | | |
| | 1,487,290 | | | Series 2005-QS17 | | 6.00% | | 12/25/2035 | | | | 1,473,720 | |
| | 4,159,939 | | | Series 2006-QA5(f) | | 1M US L + 0.22% | | 07/25/2036 | | | | 2,412,115 | |
| | 2,112,922 | | | Series 2006-QS10 | | 6.50% | | 08/25/2036 | | | | 2,147,794 | |
| | 770,350 | | | Series 2006-QS4 | | 6.00% | | 04/25/2036 | | | | 749,263 | |
| | 1,240,013 | | | Series 2006-QS6 | | 6.00% | | 06/25/2036 | | | | 1,206,858 | |
| | 1,361,070 | | | Series 2006-QS7 | | 6.00% | | 06/25/2036 | | | | 1,295,714 | |
| | 71,554 | | | Series 2006-QS7(f) | | 1M US L + 0.40% | | 06/25/2036 | | | | 49,549 | |
| | 214,662 | | | Series 2006-QS7(f)(l) | | 5.60% - 1M US L | | 06/25/2036 | | | | 33,345 | |
| | 88,887 | | | Series 2006-QS8(f) | | 1M US L + 0.45% | | 08/25/2036 | | | | 62,208 | |
| | 266,660 | | | Series 2006-QS8(f)(l) | | 5.55% - 1M US L | | 08/25/2036 | | | | 43,944 | |
| | 1,991,544 | | | Series 2007-QS3 | | 6.50% | | 02/25/2037 | | | | 1,954,116 | |
| | 57,363 | | | Series 2007-QS6 | | 6.25% | | 04/25/2037 | | | | 56,394 | |
| | 8,082 | | | Series 2007-QS6(f) | | 55.00% -8.33 x 1M US L | | 04/25/2037 | | | | 15,780 | |
| | 2,859,509 | | | Series 2007-QS9 | | 6.50% | | 07/25/2037 | | | | 2,790,850 | |
| | 315,015 | | | Series 2008-QR1 | | 6.00% | | 08/25/2036 | | | | 270,220 | |
| | | | | Residential Asset Securitization Trust | | | | | | | | | |
| | 466,076 | | | Series 2006-A1 | | 6.00% | | 04/25/2036 | | | | 341,846 | |
| | 981,525 | | | Series 2006-A2 | | 6.00% | | 05/25/2036 | | | | 641,177 | |
| | 896,311 | | | Series 2006-A6 | | 6.50% | | 07/25/2036 | | | | 355,536 | |
| | 327,951 | | | Series 2006-A8 | | 6.00% | | 08/25/2036 | | | | 281,857 | |
| | 150,717 | | | Series 2006-A8 | | 6.50% | | 08/25/2036 | | | | 77,109 | |
| | 319,110 | | | Series 2006-A8(f)(l) | | 5.90% - 1M US L | | 08/25/2036 | | | | 108,794 | |
| | 1,474,599 | | | Series 2007-A1 | | 6.00% | | 03/25/2037 | | | | 869,726 | |
| | 72,051 | | | Series 2007-A6 | | 6.00% | | 06/25/2037 | | | | 61,369 | |
| | 2,676,147 | | | Series 2007-A7 | | 6.00% | | 07/25/2037 | | | | 1,563,023 | |
| | | | | Residential Funding Mortgage Securities I Trust | | | | | | | | | |
| | 744,422 | | | Series 2006-S3 | | 5.50% | | 03/25/2036 | | | | 716,971 | |
| | 1,297,148 | | | Series 2006-S6 | | 6.00% | | 07/25/2036 | | | | 1,295,359 | |
| | 309,463 | | | Series 2007-S3 | | 6.00% | | 03/25/2037 | | | | 280,099 | |
| | 226,932 | | | Series 2007-S6 | | 6.00% | | 06/25/2037 | | | | 225,627 | |
| | | | | Sapphire Aviation Finance I, Ltd. | | | | | | | | | |
| | 2,801,238 | | | Series 2018-1A(g) | | 5.93% | | 03/15/2025 | | | | 1,762,655 | |
| | | | | Sapphire Aviation Finance II, Ltd. | | | | | | | | | |
| | 458,286 | | | Series 2020-1A(g) | | 3.23% | | 03/15/2027 | | | | 409,574 | |
See Notes to Financial Statements.
| 67 | (888) 848-7569 | www.rivernorth.com |
| RiverNorth/DoubleLine Strategic Income Fund | Schedule of Investments |
September 30, 2020
| Principal Amount/Description | | Rate | | Maturity | | | Value | |
| | | | | Sequoia Mortgage Trust | | | | | | | | | |
| $ | 1,736,288 | | | Series 2007-3(f) | | 3.26% | | 07/20/2037 | | | $ | 1,580,778 | |
| | | | | SMB Private Education Loan Trust | | | | | | | | | |
| | 434,277 | | | Series 2018-B(f)(g) | | 1M US L + 0.72% | | 08/15/2027 | | | | 431,849 | |
| | | | | SoFi Consumer Loan Program, LLC | | | | | | | | | |
| | 8,152 | | | Series 2017-2(g) | | 3.28% | | 02/25/2026 | | | | 8,167 | |
| | | | | Sofi Professional Loan Program 2018-C Trust | | | | | | | | | |
| | 80,000 | | | Series 2018-C(g)(j) | | 0.00% | | 01/25/2048 | | | | 2,968,913 | |
| | | | | SoFi Professional Loan Program Trust | | | | | | | | | |
| | 50,000 | | | Series 2020-A(g)(j) | | 0.00% | | 05/15/2046 | | | | 3,032,215 | |
| | | | | Sofi Professional Loan Program, LLC | | | | | | | | | |
| | 32,412 | | | Series 2018-A(g)(j) | | 0.00% | | 02/25/2042 | | | | 1,572,907 | |
| | | | | SoFi Professional Loan Program, LLC | | | | | | | | | |
| | 300,000 | | | Series 2017-D(g) | | 3.61% | | 09/25/2040 | | | | 310,308 | |
| | 56,760 | | | Series 2019-B(g)(j) | | 0.00% | | 08/17/2048 | | | | 1,858,535 | |
| | | | | Sprite, Ltd. | | | | | | | | | |
| | 322,873 | | | Series 2017-1(g) | | 4.25% | | 12/15/2024 | | | | 294,589 | |
| | | | | Stack Infrastructure Issuer LLC | | | | | | | | | |
| | 984,167 | | | Series 2019-1A(g) | | 4.54% | | 02/26/2024 | | | | 1,062,896 | |
| | 750,000 | | | Series 2019-2A(g) | | 3.08% | | 10/25/2024 | | | | 769,870 | |
| | | | | Start, Ltd. | | | | | | | | | |
| | 726,650 | | | Series 2018-1(g) | | 4.09% | | 05/15/2025 | | | | 668,835 | |
| | 824,567 | | | Series 2019-1(g) | | 4.09% | | 03/15/2026 | | | | 775,892 | |
| | | | | Structured Adjustable Rate Mortgage Loan Trust | | | | | | | | | |
| | 713,252 | | | Series 2005-15(f) | | 3.31% | | 07/25/2035 | | | | 534,216 | |
| | | | | Structured Asset Securities Corp. | | | | | | | | | |
| | 198,806 | | | Series 2005-RF1(f)(g) | | 1M US L + 0.35% | | 03/25/2035 | | | | 176,514 | |
| | 200,026 | | | Series 2005-RF1(f)(g)(l) | | 4.67% | | 03/25/2035 | | | | 35,395 | |
| | | | | Sunnova Sol Issuer LLC | | | | | | | | | |
| | 994,998 | | | Series 2020-1A(g) | | 3.35% | | 01/30/2030 | | | | 1,007,601 | |
| | | | | Sunrun Atlas Issuer LLC | | | | | | | | | |
| | 1,228,602 | | | Series 2019-2(g) | | 3.61% | | 10/30/2027 | | | | 1,292,161 | |
| | | | | TBW Mortgage-Backed Trust | | | | | | | | | |
| | 1,368,918 | | | Series 2006-2 | | 7.00% | | 07/25/2036 | | | | 479,557 | |
| | | | | Textainer Marine Containers VII, Ltd. | | | | | | | | | |
| | 496,269 | | | Series 2019-1A(g) | | 3.96% | | 10/20/2026 | | | | 496,318 | |
| | | | | Thunderbolt II Aircraft Lease, Ltd. | | | | | | | | | |
| | 4,464,286 | | | Series 2018-A(g)(m) | | 5.07% | | 09/15/2038 | | | | 3,184,571 | |
| | | | | Towd Point Mortgage Trust 2019-SJ2 | | | | | | | | | |
| | 3,310,000 | | | Series 2019-SJ2(f)(g) | | 4.25% | | 11/25/2058 | | | | 3,422,496 | |
See Notes to Financial Statements.
| Annual Report | September 30, 2020 | 68 |
| RiverNorth/DoubleLine Strategic Income Fund | Schedule of Investments |
September 30, 2020
| Principal Amount/Description | | Rate | | Maturity | | | Value | |
| | | | | Trimaran Cavu 2019-1, Ltd. | | | | | | | | | |
| $ | 1,700,000 | | | Series 2019-1A(f)(g) | | 3M US L + 4.15% | | 07/20/2032 | | | $ | 1,676,399 | |
| | | | | TRIP Rail Master Funding, LLC | | | | | | | | | |
| | 138,172 | | | Series 2017-1A(g) | | 2.71% | | 07/15/2021 | | | | 138,467 | |
| | | | | UBS Commercial Mortgage Trust | | | | | | | | | |
| | 464,000 | | | Series 2017-C6(f) | | 4.15% | | 12/15/2027 | | | | 492,199 | |
| | | | | UBS Commercial Mortgage Trust 2018-C10 | | | | | | | | | |
| | 520,000 | | | Series 2018-C10(f) | | 5.26% | | 05/15/2028 | | | | 569,171 | |
| | | | | UBS Commercial Mortgage Trust 2018-C9 | | | | | | | | | |
| | 928,000 | | | Series 2018-C9(f) | | 5.05% | | 03/15/2028 | | | | 912,702 | |
| | | | | UBS-Barclays Commercial Mortgage Trust | | | | | | | | | |
| | 989,000 | | | Series 2013-C5(f)(g) | | 4.23% | | 02/10/2023 | | | | 524,043 | |
| | | | | Vantage Data Centers Issuer, LLC | | | | | | | | | |
| | 730,625 | | | Series 2018-1A(g) | | 4.07% | | 02/15/2023 | | | | 757,592 | |
| | | | | VB-S1 Issuer LLC | | | | | | | | | |
| | 500,000 | | | Series 2020-1A(g) | | 3.03% | | 06/15/2025 | | | | 522,795 | |
| | | | | VB-S1 Issuer, LLC | | | | | | | | | |
| | 3,000,000 | | | Series 2018-1A(g) | | 5.25% | | 02/15/2023 | | | | 3,064,722 | |
| | | | | VCC 2020-MC1 Trust | | | | | | | | | |
| | 9,041,218 | | | Series 2020-MC1(f)(g) | | 4.50% | | 06/25/2045 | | | | 8,914,702 | |
| | | | | Velocity Commercial Capital Loan Trust | | | | | | | | | |
| | 613,847 | | | Series 2018-2(f)(g) | | 4.05% | | 09/25/2024 | | | | 624,589 | |
| | 1,335,650 | | | Series 2019-1(f)(g) | | 3.94% | | 01/25/2027 | | | | 1,363,526 | |
| | 397,711 | | | Series 2019-1(f)(g) | | 4.01% | | 07/25/2027 | | | | 398,101 | |
| | 394,913 | | | Series 2019-1(f)(g) | | 4.12% | | 11/25/2027 | | | | 387,439 | |
| | | | | Vericrest Opportunity Loan Trust 2019-NPL7 | | | | | | | | | |
| | 195,771 | | | Series 2019-NPL7(g)(m) | | 3.18% | | 10/25/2049 | | | | 196,494 | |
| | | | | Wachovia Bank Commercial Mortgage Trust | | | | | | | | | |
| | 39,161 | | | Series 2006-C29(f)(l)(n) | | 0.46% | | 11/15/2048 | | | | 0 | |
| | | | | Wachovia Mortgage Loan Trust, LLC Series Trust | | | | | | | | | |
| | 517,731 | | | Series 2005-B(f) | | 3.22% | | 10/20/2035 | | | | 495,105 | |
| | | | | Washington Mutual Alternative Mortgage Pass-Through Certificates | | | | | | | | | |
| | 1,334,899 | | | Series 2005-1 | | 6.00% | | 03/25/2035 | | | | 1,352,533 | |
| | 55,905 | | | Series 2005-9 | | 5.50% | | 11/25/2035 | | | | 49,729 | |
| | 428,821 | | | Series 2006-5 | | 6.00% | | 07/25/2036 | | | | 376,443 | |
See Notes to Financial Statements.
| 69 | (888) 848-7569 | www.rivernorth.com |
| RiverNorth/DoubleLine Strategic Income Fund | Schedule of Investments |
September 30, 2020
| Principal Amount/Description | | Rate | | Maturity | | | Value | |
| | | | | Washington Mutual Mortgage Pass-Through Certificates Trust | | | | | | | | | |
| $ | 820,401 | | | Series 2006-2 | | 6.00% | | 03/25/2036 | | | $ | 843,789 | |
| | | | | WAVE LLC | | | | | | | | | |
| | 946,388 | | | Series 2019-1(g) | | 3.60% | | 09/15/2027 | | | | 868,061 | |
| | 967,901 | | | Series 2019-1(g) | | 6.41% | | 09/15/2027 | | | | 528,420 | |
| | | | | Wells Fargo Alternative Loan Trust | | | | | | | | | |
| | 391,618 | | | Series 2007-PA2(f) | | 1M US L + 0.43% | | 06/25/2037 | | | | 314,119 | |
| | 391,618 | | | Series 2007-PA2(f)(l) | | 6.07% - 1M US L | | 06/25/2037 | | | | 53,591 | |
| | 171,684 | | | Series 2007-PA3 | | 5.75% | | 07/25/2037 | | | | 164,075 | |
| | 572,915 | | | Series 2007-PA3 | | 6.25% | | 07/25/2037 | | | | 569,019 | |
| | 2,908,685 | | | Series 2007-PA5 | | 6.25% | | 11/25/2037 | | | | 2,876,622 | |
| | | | | Wells Fargo Commercial Mortgage Trust | | | | | | | | | |
| | 158,000 | | | Series 2014-LC16(g) | | 3.94% | | 06/15/2024 | | | | 92,913 | |
| | 520,000 | | | Series 2015-NXS4(f) | | 4.82% | | 11/15/2025 | | | | 549,708 | |
| | 1,000,000 | | | Series 2016-C33(g) | | 3.12% | | 03/15/2059 | | | | 865,550 | |
| | 5,628,945 | | | Series 2016-C37(f)(g)(l) | | 1.60% | | 12/15/2049 | | | | 390,913 | |
| | 695,000 | | | Series 2016-LC25(f) | | 4.56% | | 11/15/2026 | | | | 748,441 | |
| | 518,000 | | | Series 2018-C45 | | 4.73% | | 06/15/2028 | | | | 531,632 | |
| | 523,000 | | | Series 2018-C47(f) | | 5.10% | | 10/15/2028 | | | | 520,675 | |
| | 436,000 | | | Series 2018-C48(f) | | 5.29% | | 12/15/2028 | | | | 460,988 | |
| | 901,000 | | | Series 2019-C49 | | 4.55% | | 02/15/2029 | | | | 1,041,871 | |
| | | | | Wells Fargo Commercial Mortgage Trust 2015-C28 | | | | | | | | | |
| | 1,539,000 | | | Series 2015-C28(f) | | 4.24% | | 05/15/2025 | | | | 1,309,218 | |
| | | | | Wells Fargo Commercial Mortgage Trust 2015-NXS4 | | | | | | | | | |
| | 1,245,000 | | | Series 2015-NXS4(f) | | 3.82% | | 11/15/2025 | | | | 1,103,493 | |
| | | | | WF-RBS Commercial Mortgage Trust | | | | | | | | | |
| | 1,989,843 | | | Series 2012-C9(f)(g)(l) | | 2.04% | | 11/15/2045 | | | | 58,952 | |
| | 3,513,115 | | | Series 2014-C21(f)(l) | | 1.19% | | 08/15/2047 | | | | 109,395 | |
| | 4,277,580 | | | Series 2014-C22(f)(l) | | 0.95% | | 09/15/2057 | | | | 107,472 | |
| | 636,000 | | | Series 2014-C23(f)(g) | | 4.14% | | 10/15/2057 | | | | 556,631 | |
| | | | | Willis Engine Structured Trust V | | | | | | | | | |
| | 977,229 | | | Series 2020-A(g) | | 3.23% | | 03/15/2028 | | | | 810,404 | |
| | 2,300,108 | | | Zephyrus Capital Aviation Tl | | 4.61% | | 10/15/2038 | | | | 2,111,418 | |
| | | | | | | | | | | | | | |
| TOTAL NON-AGENCY COLLATERALIZED MORTGAGE OBLIGATIONS | | | | | |
| (Cost $479,963,982) | | | | 454,699,084 | |
| | | | | | | | | | | | | | |
| U.S. GOVERNMENT BONDS AND NOTES - 7.43% | | | | | |
| | 1,030,000 | | | U.S. Treasury Bonds | | 2.25% | | 08/15/2027 | | | | 1,155,411 | |
See Notes to Financial Statements.
| Annual Report | September 30, 2020 | 70 |
| RiverNorth/DoubleLine Strategic Income Fund | Schedule of Investments |
September 30, 2020
| Principal Amount/Description | | Rate | | Maturity | | | Value | |
| $ | 5,830,000 | | | U.S. Treasury Bonds | | 2.25% | | 11/15/2027 | | | $ | 6,554,879 | |
| | 7,200,000 | | | U.S. Treasury Bonds | | 1.63% | | 08/15/2029 | | | | 7,837,875 | |
| | 4,530,000 | | | U.S. Treasury Bonds | | 1.13% | | 08/15/2040 | | | | 4,446,124 | |
| | 530,000 | | | U.S. Treasury Bonds | | 2.75% | | 11/15/2042 | | | | 678,835 | |
| | 3,710,000 | | | U.S. Treasury Bonds | | 3.13% | | 02/15/2043 | | | | 5,028,064 | |
| | 3,490,000 | | | U.S. Treasury Bonds | | 3.63% | | 08/15/2043 | | | | 5,089,402 | |
| | 3,910,000 | | | U.S. Treasury Bonds | | 2.75% | | 11/15/2047 | | | | 5,082,236 | |
| | 3,510,000 | | | U.S. Treasury Bonds | | 1.38% | | 08/15/2050 | | | | 3,434,864 | |
| | 7,830,000 | | | U.S. Treasury Notes | | 1.75% | | 11/30/2021 | | | | 7,976,812 | |
| | 6,850,000 | | | U.S. Treasury Notes | | 0.13% | | 09/30/2022 | | | | 6,849,465 | |
| | 10,280,000 | | | U.S. Treasury Notes | | 0.13% | | 09/15/2023 | | | | 10,270,764 | |
| | 5,840,000 | | | U.S. Treasury Notes | | 2.13% | | 09/30/2024 | | | | 6,285,300 | |
| | 6,265,000 | | | U.S. Treasury Notes | | 2.25% | | 10/31/2024 | | | | 6,782,352 | |
| | 3,570,000 | | | U.S. Treasury Notes | | 2.75% | | 02/28/2025 | | | | 3,964,234 | |
| | 5,710,000 | | | U.S. Treasury Notes | | 3.00% | | 09/30/2025 | | | | 6,480,404 | |
| | 11,420,000 | | | U.S. Treasury Notes | | 0.25% | | 09/30/2025 | | | | 11,405,279 | |
| | 935,000 | | | U.S. Treasury Notes | | 2.63% | | 01/31/2026 | | | | 1,049,355 | |
| | 4,800,000 | | | U.S. Treasury Notes | | 2.25% | | 03/31/2026 | | | | 5,302,500 | |
| | 5,710,000 | | | U.S. Treasury Notes | | 1.63% | | 10/31/2026 | | | | 6,136,689 | |
| | 17,010,000 | | | U.S. Treasury Notes | | 0.38% | | 09/30/2027 | | | | 16,897,043 | |
| | 6,280,000 | | | U.S. Treasury Notes | | 0.63% | | 08/15/2030 | | | | 6,244,184 | |
| | | | | | | | | | | | | | |
| TOTAL U.S. GOVERNMENT BONDS AND NOTES | | | | | |
| (Cost $132,170,881) | | | | 134,952,071 | |
| | | | | | | | | | | | | | |
| MUNICIPAL BONDS - 0.02% | | | | | | | | | |
| | 120,000 | | | Missouri Highway & Transportation Commission, Revenue Bonds | | 5.06% | | 05/01/2024 | | | | 135,415 | |
| | 165,000 | | | State of California, General Obligation Bonds | | 7.55% | | 04/01/2039 | | | | 289,039 | |
| | | | | | | | | | | | | | |
| TOTAL MUNICIPAL BONDS | | | | | |
| (Cost $365,447) | | | | 424,454 | |
| | | | | | | | | | | | | | |
| U.S. GOVERNMENT / AGENCY MORTGAGE BACKED SECURITIES - 15.85% | | | | | |
| | | | | Banc of America Funding | | | | | | | | | |
| | 3,250,008 | | | Series 2007-A(f) | | 1M US L + 0.21% | | 02/20/2047 | | | | 2,966,574 | |
| | | | | Chase Mortgage Finance Trust | | | | | | | | | |
| | 5,545,756 | | | Series 2007-S4 | | 6.00% | | 06/25/2037 | | | | 3,903,101 | |
| | | | | ChaseFlex Trust Series | | | | | | | | | |
| | 5,257,885 | | | Series 2007-M1(f) | | 1M US L + 0.23% | | 08/25/2037 | | | | 4,085,104 | |
| | | | | Citigroup Mortgage Loan Trust | | | | | | | | | |
| | 9,590,900 | | | Series 2018-A(f)(g) | | 4.25% | | 01/25/2068 | | | | 9,539,935 | |
See Notes to Financial Statements.
| 71 | (888) 848-7569 | www.rivernorth.com |
RiverNorth/DoubleLine Strategic Income Fund | Schedule of Investments |
September 30, 2020
| Principal Amount/Description | | Rate | | Maturity | | | Value | |
| | | | | Connecticut Avenue Securities Trust | | | | | | | | | |
| $ | 5,000,000 | | | Series 2019-R05(f)(g) | | 1M US L + 4.10% | | 07/25/2039 | | | $ | 4,407,814 | |
| | | | | Deephaven Residential Mortgage Trust | | | | | | | | | |
| | 6,613,000 | | | Series 2020-1(f)(g) | | 3.66% | | 03/25/2024 | | | | 6,480,207 | |
| | 4,000,000 | | | Series 2020-1(f)(g) | | 4.54% | | 03/25/2024 | | | | 3,705,853 | |
| | | | | Fannie Mae Interest Strip | | | | | | | | | |
| | 11,853,850 | | | Series 2014-419(l) | | 3.50% | | 04/25/2044 | | | | 1,723,810 | |
| | | | | Fannie Mae Pool | | | | | | | | | |
| | 4,400,000 | | | Series 2020- | | 1.50% | | 10/01/2035 | | | | 4,504,290 | |
| | 2,000,000 | | | Series 2020- | | 2.00% | | 10/01/2040 | | | | 2,069,304 | |
| | 7,400,000 | | | Series 2020- | | 2.00% | | 10/01/2050 | | | | 7,625,577 | |
| | 3,000,000 | | | Series Pool #BL4424 | | 2.14% | | 10/01/2029 | | | | 3,237,585 | |
| | 3,000,000 | | | Series Pool #BL5156 | | 2.37% | | 12/01/2029 | | | | 3,300,909 | |
| | 3,629,498 | | | Series Pool #MA3987 | | 2.50% | | 04/01/2040 | | | | 3,810,869 | |
| | | | | Fannie Mae REMICS | | | | | | | | | |
| | 11,180,858 | | | Series 2014-1(f)(l) | | 5.90% - 1M US L | | 02/25/2044 | | | | 2,121,768 | |
| | 13,346,099 | | | Series 2015-54(f)(l) | | 6.15% - 1M US L | | 07/25/2045 | | | | 2,833,524 | |
| | 4,232,042 | | | Series 2020-45 | | 3.00% | | 07/25/2040 | | | | 4,525,371 | |
| | | | | Federal Home Loan Mortgage Corp. Pool | | | | | | | | | |
| | 217,692 | | | Series Pool #G01840 | | 5.00% | | 07/01/2035 | | | | 250,570 | |
| | 80,603 | | | Series Pool #G04817 | | 5.00% | | 09/01/2038 | | | | 92,748 | |
| | | | | Federal Home Loan Mortgage Corp. REMICS | | | | | | | | | |
| | 1,072,671 | | | Series 2003-2722(f) | | 9.89% - 1M US L | | 12/15/2033 | | | | 1,376,671 | |
| | 201,656 | | | Series 2005-R003 | | 5.50% | | 10/15/2035 | | | | 235,375 | |
| | 1,502,080 | | | Series 2006-3244(f)(l) | | 6.66% - 1M US L | | 11/15/2036 | | | | 356,568 | |
| | 72,409 | | | Series 2007-3261(f)(l) | | 6.43% - 1M US L | | 01/15/2037 | | | | 16,984 | |
| | 160,781 | | | Series 2007-3262(f)(l) | | 6.40% - 1M US L | | 01/15/2037 | | | | 25,105 | |
| | 701,676 | | | Series 2007-3301(f)(l) | | 6.10% - 1M US L | | 04/15/2037 | | | | 141,870 | |
| | 491,401 | | | Series 2007-3303(f)(l) | | 6.10% - 1M US L | | 04/15/2037 | | | | 98,121 | |
| | 151,709 | | | Series 2007-3382(f)(l) | | 6.00% - 1M US L | | 11/15/2037 | | | | 21,272 | |
| | 402,485 | | | Series 2007-3384(f)(l) | | 6.31% - 1M US L | | 08/15/2036 | | | | 86,242 | |
| | 138,881 | | | Series 2007-3384(f)(l) | | 6.39% - 1M US L | | 11/15/2037 | | | | 17,125 | |
| | 189,872 | | | Series 2008-3417(f)(l) | | 6.18% - 1M US L | | 02/15/2038 | | | | 24,409 | |
| | 3,773,666 | | | Series 2008-3423(f)(l) | | 6.00% - 1M US L | | 03/15/2038 | | | | 30,421 | |
| | 198,087 | | | Series 2008-3423(f)(l) | | 5.65% - 1M US L | | 03/15/2038 | | | | 24,605 | |
| | 1,533,698 | | | Series 2009-3510(f)(l) | | 6.75% - 1M US L | | 02/15/2037 | | | | 322,135 | |
| | 379,505 | | | Series 2009-3523(f)(l) | | 6.00% - 1M US L | | 04/15/2039 | | | | 70,969 | |
| | 72,467 | | | Series 2009-3524(l) | | 3.54% | | 06/15/2038 | | | | 78,268 | |
| | 11,868 | | | Series 2009-3549(f)(l) | | 5.80% - 1M US L | | 07/15/2039 | | | | 1,498 | |
| | 836,530 | | | Series 2009-3560(f)(l) | | 6.40% - 1M US L | | 11/15/2036 | | | | 148,394 | |
| | 312,184 | | | Series 2010-3641 | | 4.50% | | 03/15/2040 | | | | 357,436 | |
See Notes to Financial Statements.
| Annual Report | September 30, 2020 | 72 |
| RiverNorth/DoubleLine Strategic Income Fund | Schedule of Investments |
September 30, 2020
| Principal Amount/Description | | Rate | | Maturity | | | Value | |
| $ | 415,795 | | | Series 2010-3726(f)(l) | | 6.05% - 1M US L | | 09/15/2040 | | | $ | 84,878 | |
| | 1,855,528 | | | Series 2010-3728(f)(l) | | 4.45% - 1M US L | | 09/15/2040 | | | | 246,580 | |
| | 676,714 | | | Series 2010-3779 | | 3.50% | | 12/15/2030 | | | | 735,856 | |
| | 126,709 | | | Series 2010-3779 | | 4.00% | | 12/15/2030 | | | | 139,693 | |
| | 457,356 | | | Series 2010-3779 | | 4.50% | | 12/15/2040 | | | | 510,586 | |
| | 73,215 | | | Series 2011-3786(f) | | 9.50% - 1M US L | | 01/15/2041 | | | | 86,454 | |
| | 962,369 | | | Series 2011-3795 | | 4.00% | | 01/15/2041 | | | | 1,042,787 | |
| | 62,698 | | | Series 2011-3798(f) | | 9.50% - 1M US L | | 11/15/2040 | | | | 70,459 | |
| | 426,350 | | | Series 2011-3808 | | 3.50% | | 02/15/2031 | | | | 459,652 | |
| | 39,198 | | | Series 2011-3809(f) | | 9.50% - 1M US L | | 02/15/2041 | | | | 50,804 | |
| | 796,989 | | | Series 2011-3815(f)(l) | | 5.85% - 1M US L | | 02/15/2041 | | | | 161,033 | |
| | 349,906 | | | Series 2011-3824 | | 3.50% | | 03/15/2031 | | | | 379,735 | |
| | 425,388 | | | Series 2011-3824(f)(l) | | 7.10% - 1M US L | | 08/15/2036 | | | | 102,453 | |
| | 464,065 | | | Series 2011-3863 | | 5.50% | | 08/15/2034 | | | | 530,462 | |
| | 562,100 | | | Series 2011-3864(f) | | 9.20% - 1M US L | | 05/15/2041 | | | | 683,932 | |
| | 532,213 | | | Series 2011-3871 | | 5.50% | | 06/15/2041 | | | | 622,862 | |
| | 514,071 | | | Series 2011-3872(f)(l) | | 5.95% - 1M US L | | 06/15/2041 | | | | 98,792 | |
| | 2,891,974 | | | Series 2011-3910 | | 5.00% | | 08/15/2041 | | | | 3,405,342 | |
| | 2,306,686 | | | Series 2011-3924(f)(l) | | 6.00% - 1M US L | | 09/15/2041 | | | | 421,713 | |
| | 114,929 | | | Series 2011-3925(l) | | 3.00% | | 09/15/2021 | | | | 1,350 | |
| | 3,187,829 | | | Series 2012-3(f)(l) | | 5.95% - 1M US L | | 02/25/2042 | | | | 606,343 | |
| | 3,045,318 | | | Series 2013-4170(f) | | 4.05% - 1M US L | | 01/15/2033 | | | | 3,173,541 | |
| | 10,786,400 | | | Series 2013-4218 | | 2.50% | | 02/15/2043 | | | | 11,504,383 | |
| | 5,764,144 | | | Series 2013-4239(j) | | 0.00% | | 07/15/2043 | | | | 5,163,396 | |
| | 4,904,553 | | | Series 2014-4413 | | 3.50% | | 11/15/2044 | | | | 5,210,826 | |
| | 3,546,295 | | | Series 2015-4434 | | 3.00% | | 02/15/2045 | | | | 3,979,416 | |
| | 3,448,883 | | | Series 2015-4440 | | 2.50% | | 02/15/2045 | | | | 3,694,597 | |
| | | | | Federal Home Loan Mortgage Corp. Strips | | | | | | | | | |
| | 2,256,279 | | | Series 2017-358 | | 3.00% | | 10/15/2047 | | | | 2,390,754 | |
| | | | | Federal National Mortgage Association Pool | | | | | | | | | |
| | 60,974 | | | Series Pool #555743 | | 5.00% | | 09/01/2033 | | | | 69,942 | |
| | 73,478 | | | Series Pool #735382 | | 5.00% | | 04/01/2035 | | | | 84,489 | |
| | 198,326 | | | Series Pool #735383 | | 5.00% | | 04/01/2035 | | | | 228,036 | |
| | 132,555 | | | Series Pool #735484 | | 5.00% | | 05/01/2035 | | | | 152,418 | |
| | 55,357 | | | Series Pool #AH4437 | | 4.00% | | 01/01/2041 | | | | 58,134 | |
| | | | | Federal National Mortgage Association REMICS | | | | | | | | | |
| | 66,027 | | | Series 2004-46(f)(l) | | 6.00% - 1M US L | | 03/25/2034 | | | | 7,434 | |
| | 239,388 | | | Series 2006-101(f)(l) | | 6.58% - 1M US L | | 10/25/2036 | | | | 54,595 | |
| | 704,055 | | | Series 2006-123(f)(l) | | 6.32% - 1M US L | | 01/25/2037 | | | | 150,707 | |
| | 3,397,610 | | | Series 2006-92(f)(l) | | 6.58% - 1M US L | | 10/25/2036 | | | | 727,938 | |
| | 83,657 | | | Series 2007-102(f)(l) | | 6.40% - 1M US L | | 11/25/2037 | | | | 17,547 | |
See Notes to Financial Statements.
| 73 | (888) 848-7569 | www.rivernorth.com |
| RiverNorth/DoubleLine Strategic Income Fund | Schedule of Investments |
September 30, 2020
| Principal Amount/Description | | Rate | | Maturity | | | Value | |
| $ | 79,111 | | | Series 2007-108(f)(l) | | 6.36% - 1M US L | | 12/25/2037 | | | $ | 12,313 | |
| | 15,460 | | | Series 2007-30(f)(l) | | 6.11% - 1M US L | | 04/25/2037 | | | | 2,493 | |
| | 359,528 | | | Series 2007-38(f)(l) | | 6.08% - 1M US L | | 05/25/2037 | | | | 44,784 | |
| | 11,295 | | | Series 2007-51(f)(l) | | 6.10% - 1M US L | | 06/25/2037 | | | | 1,735 | |
| | 38,050 | | | Series 2007-53(f)(l) | | 6.10% - 1M US L | | 06/25/2037 | | | | 4,854 | |
| | 476,712 | | | Series 2007-57(f)(l) | | 6.62% - 1M US L | | 10/25/2036 | | | | 96,190 | |
| | 91,723 | | | Series 2007-68(f)(l) | | 6.65% - 1M US L | | 07/25/2037 | | | | 15,050 | |
| | 558,194 | | | Series 2008-3(f)(l) | | 6.46% - 1M US L | | 02/25/2038 | | | | 126,109 | |
| | 160,965 | | | Series 2008-56(f)(l) | | 6.06% - 1M US L | | 07/25/2038 | | | | 22,111 | |
| | 34,299 | | | Series 2008-81 | | 5.50% | | 09/25/2038 | | | | 39,007 | |
| | 285,683 | | | Series 2009-111 | | 5.00% | | 01/25/2040 | | | | 328,154 | |
| | 145,795 | | | Series 2009-111(f)(l) | | 6.25% - 1M US L | | 01/25/2040 | | | | 23,260 | |
| | 927,576 | | | Series 2009-12(f)(l) | | 6.60% - 1M US L | | 03/25/2036 | | | | 196,347 | |
| | 31,442 | | | Series 2009-28(f)(l) | | 6.00% - 1M US L | | 04/25/2037 | | | | 5,941 | |
| | 345,073 | | | Series 2009-41 | | 4.50% | | 06/25/2039 | | | | 377,081 | |
| | 80,079 | | | Series 2009-42(f)(l) | | 6.00% - 1M US L | | 06/25/2039 | | | | 13,214 | |
| | 184,511 | | | Series 2009-47(f)(l) | | 6.10% - 1M US L | | 07/25/2039 | | | | 26,304 | |
| | 102,606 | | | Series 2009-62(f)(l) | | 6.10% - 1M US L | | 08/25/2039 | | | | 14,201 | |
| | 59,217 | | | Series 2009-66(f)(l) | | 5.80% - 1M US L | | 02/25/2038 | | | | 10,518 | |
| | 44,598 | | | Series 2009-68(f)(l) | | 5.25% - 1M US L | | 09/25/2039 | | | | 5,426 | |
| | 188,970 | | | Series 2010-11(f)(l) | | 4.80% - 1M US L | | 02/25/2040 | | | | 20,402 | |
| | 36,317 | | | Series 2010-111(f)(l) | | 6.00% - 1M US L | | 10/25/2040 | | | | 5,484 | |
| | 103,243 | | | Series 2010-112 | | 4.00% | | 10/25/2040 | | | | 107,237 | |
| | 126,141 | | | Series 2010-115(f)(l) | | 6.60% - 1M US L | | 11/25/2039 | | | | 22,653 | |
| | 1,786,553 | | | Series 2010-115(f)(l) | | 6.00% - 1M US L | | 10/25/2040 | | | | 428,223 | |
| | 4,098,066 | | | Series 2010-123(f)(l) | | 6.05% - 1M US L | | 11/25/2040 | | | | 843,861 | |
| | 676,877 | | | Series 2010-15(f)(l) | | 4.95% - 1M US L | | 03/25/2040 | | | | 102,651 | |
| | 71,550 | | | Series 2010-34(f)(l) | | 4.93% - 1M US L | | 04/25/2040 | | | | 8,359 | |
| | 58,921 | | | Series 2010-4(f)(l) | | 6.23% - 1M US L | | 02/25/2040 | | | | 10,829 | |
| | 82,039 | | | Series 2010-58(f) | | 12.47% - 1M US L | | 06/25/2040 | | | | 106,302 | |
| | 2,670,508 | | | Series 2010-75 | | 4.50% | | 07/25/2040 | | | | 2,999,981 | |
| | 200,380 | | | Series 2010-9(f)(l) | | 4.75% - 1M US L | | 02/25/2040 | | | | 22,881 | |
| | 48,273 | | | Series 2010-9(f)(l) | | 5.30% - 1M US L | | 02/25/2040 | | | | 7,253 | |
| | 12,964 | | | Series 2010-90(f)(l) | | 6.00% - 1M US L | | 08/25/2040 | | | | 1,776 | |
| | 350,976 | | | Series 2011-16 | | 3.50% | | 03/25/2031 | | | | 380,261 | |
| | 514,959 | | | Series 2011-25 | | 3.00% | | 04/25/2026 | | | | 537,004 | |
| | 368,350 | | | Series 2011-29 | | 3.50% | | 04/25/2031 | | | | 395,886 | |
| | 34,106 | | | Series 2011-48(f) | | 9.20% - 1M US L | | 06/25/2041 | | | | 34,846 | |
| | 343,212 | | | Series 2011-5(f)(l) | | 6.40% - 1M US L | | 11/25/2040 | | | | 32,946 | |
| | 3,309,136 | | | Series 2012-106(f)(l) | | 6.16% - 1M US L | | 10/25/2042 | | | | 693,204 | |
| | 1,194,654 | | | Series 2012-124(f) | | 7.79% - 1M US L | | 11/25/2042 | | | | 1,434,063 | |
| | 9,795,601 | | | Series 2012-128(f) | | 6.00% - 1M US L | | 11/25/2042 | | | | 10,806,929 | |
| | 189,607 | | | Series 2012-29(f)(l) | | 6.00% - 1M US L | | 04/25/2042 | | | | 39,110 | |
| | 706,932 | | | Series 2012-32(l) | | 5.00% | | 04/25/2042 | | | | 112,221 | |
See Notes to Financial Statements.
| Annual Report | September 30, 2020 | 74 |
| RiverNorth/DoubleLine Strategic Income Fund | Schedule of Investments |
September 30, 2020
| Principal Amount/Description | | Rate | | Maturity | | | Value | |
| $ | 3,338,277 | | | Series 2012-65(f)(l) | | 5.98% - 1M US L | | 06/25/2042 | | | $ | 637,224 | |
| | 2,393,770 | | | Series 2013-19(f) | | 5.40% - 1M US L | | 03/25/2043 | | | | 2,499,090 | |
| | 9,646,208 | | | Series 2013-51(f) | | 5.40% - 1M US L | | 04/25/2043 | | | | 9,896,757 | |
| | 966,871 | | | Series 2015-59 | | 3.00% | | 06/25/2041 | | | | 976,233 | |
| | 10,525,353 | | | Series 2015-79 | | 3.00% | | 11/25/2045 | | | | 11,310,274 | |
| | 1,518,121 | | | Series 2015-9 | | 3.00% | | 01/25/2045 | | | | 1,633,967 | |
| | 2,878,746 | | | Series 2016-72 | | 3.00% | | 10/25/2046 | | | | 2,888,637 | |
| | 2,299,558 | | | Series 2018-21(j) | | 0.00% | | 04/25/2048 | | | | 2,148,230 | |
| | 1,726,001 | | | Series 2018-27 | | 3.00% | | 12/25/2047 | | | | 1,800,121 | |
| | 2,098,619 | | | Series 2018-36 | | 3.00% | | 06/25/2048 | | | | 2,207,688 | |
| | 3,414,572 | | | Series 2019-12 | | 3.00% | | 04/25/2049 | | | | 3,576,352 | |
| | | | | FMC GMSR Issuer Trust | | | | | | | | | |
| | 500,000 | | | Series 2019-GT1(f)(g) | | 5.66% | | 05/25/2024 | | | | 447,200 | |
| | 5,000,000 | | | Series 2019-GT2(f)(g) | | 4.72% | | 09/25/2024 | | | | 4,417,543 | |
| | | | | Freddie Mac Pool | | | | | | | | | |
| | 4,958,206 | | | Series 2020- | | 2.00% | | 08/01/2050 | | | | 5,128,059 | |
| | 2,000,000 | | | Series 2020- | | 2.00% | | 10/01/2050 | | | | 2,049,899 | |
| | 2,437,995 | | | Series Pool #RB5022 | | 3.00% | | 11/01/2039 | | | | 2,554,500 | |
| | | | | Freddie Mac REMICS | | | | | | | | | |
| | 4,796,271 | | | Series 2011-3972(f)(l) | | 5.90% - 1M US L | | 12/15/2041 | | | | 863,458 | |
| | 4,468,114 | | | Series 2017-4703 | | 3.50% | | 07/15/2047 | | | | 4,929,064 | |
| | | | | Government National Mortgage Association | | | | | | | | | |
| | 51,129 | | | Series 2004-83(f)(l) | | 6.08% - 1M US L | | 10/20/2034 | | | | 9,138 | |
| | 43,637 | | | Series 2008-6(f)(l) | | 6.46% - 1M US L | | 02/20/2038 | | | | 7,961 | |
| | 41,307 | | | Series 2008-67(f)(l) | | 6.00% - 1M US L | | 08/20/2038 | | | | 7,176 | |
| | 652,806 | | | Series 2008-69(f)(l) | | 7.63% - 1M US L | | 08/20/2038 | | | | 145,650 | |
| | 59,384 | | | Series 2009-10(f)(l) | | 6.65% - 1M US L | | 02/16/2039 | | | | 11,485 | |
| | 813,532 | | | Series 2009-35 | | 4.50% | | 05/20/2039 | | | | 915,198 | |
| | 3,345,937 | | | Series 2009-58(f)(l) | | 6.25% - 1M US L | | 06/20/2039 | | | | 542,753 | |
| | 46,521 | | | Series 2009-6(f)(l) | | 5.95% - 1M US L | | 02/20/2038 | | | | 5,957 | |
| | 1,516,825 | | | Series 2009-75 | | 5.00% | | 09/20/2039 | | | | 1,733,955 | |
| | 3,544,318 | | | Series 2010-121(f)(l) | | 6.00% - 1M US L | | 09/20/2040 | | | | 675,141 | |
| | 62,492 | | | Series 2010-61(f)(l) | | 6.55% - 1M US L | | 09/20/2039 | | | | 10,996 | |
| | 112,775 | | | Series 2010-98(f)(l) | | 5.65% | | 03/20/2039 | | | | 12,473 | |
| | 2,406,580 | | | Series 2011-148 | | 3.50% | | 11/16/2041 | | | | 2,619,573 | |
| | 518,657 | | | Series 2011-69(j) | | 0.00% | | 05/20/2041 | | | | 505,507 | |
| | 1,515,737 | | | Series 2011-71 | | 4.50% | | 02/20/2041 | | | | 1,697,617 | |
| | 1,009,713 | | | Series 2011-71(f)(l) | | 5.40% - 1M US L | | 05/20/2041 | | | | 171,717 | |
| | 320,567 | | | Series 2011-72(f)(l) | | 6.15% - 1M US L | | 05/20/2041 | | | | 70,196 | |
| | 1,588,592 | | | Series 2011-89(f)(l) | | 5.45% - 1M US L | | 06/20/2041 | | | | 271,750 | |
| | 159,738 | | | Series 2012-105(f)(l) | | 6.20% - 1M US L | | 01/20/2041 | | | | 3,926 | |
| | 4,158,479 | | | Series 2013-113(f)(l) | | 6.25% - 1M US L | | 03/20/2043 | | | | 515,747 | |
| | 5,980,687 | | | Series 2013-122(f)(l) | | 6.10% - 1M US L | | 08/16/2043 | | | | 1,070,694 | |
See Notes to Financial Statements.
| 75 | (888) 848-7569 | www.rivernorth.com |
| RiverNorth/DoubleLine Strategic Income Fund | Schedule of Investments |
September 30, 2020
| Principal Amount/Description | | Rate | | Maturity | | | Value | |
| $ | 3,715,424 | | | Series 2013-148(f)(l) | | 5.68% - 1M US L | | 10/16/2043 | | | $ | 840,277 | |
| | 6,261,614 | | | Series 2013-186(f)(l) | | 6.25% - 1M US L | | 02/16/2043 | | | | 950,059 | |
| | 3,900,452 | | | Series 2014-156(f)(l) | | 6.25% - 1M US L | | 10/20/2044 | | | | 737,078 | |
| | 7,662,642 | | | Series 2014-4(f)(l) | | 6.10% - 1M US L | | 01/16/2044 | | | | 1,332,773 | |
| | 9,052,209 | | | Series 2014-41(f)(l) | | 6.10% - 1M US L | | 03/20/2044 | | | | 1,833,657 | |
| | 5,104,387 | | | Series 2014-5(f)(l) | | 6.15% - 1M US L | | 07/20/2043 | | | | 717,173 | |
| | 5,312,227 | | | Series 2014-95(f)(l) | | 6.25% - 1M US L | | 06/16/2044 | | | | 1,110,470 | |
| | 13,796,595 | | | Series 2015-80(f)(l) | | 6.25% - 1M US L | | 06/20/2045 | | | | 3,115,656 | |
| | 15,149,207 | | | Series 2018-97(f)(l) | | 6.20% - 1M US L | | 07/20/2048 | | | | 1,944,124 | |
| | 20,057,788 | | | Series 2019-22(f)(l) | | 5.60% - 1M US L | | 02/20/2045 | | | | 4,082,663 | |
| | 15,575,548 | | | Series 2019-92(f)(l) | | 6.10% - 1M US L | | 07/20/2049 | | | | 2,136,753 | |
| | 15,973,565 | | | Series 2020-112(f)(l) | | 6.25% - 1M US L | | 08/20/2050 | | | | 3,096,635 | |
| | 21,264,955 | | | Series 2020-47(f)(l) | | 6.00% - 1M US L | | 05/20/2044 | | | | 3,991,806 | |
| | | | | Homeward Opportunities Fund Trust 2020-BPL1 | | | | | | | | | |
| | 1,000,000 | | | Series 2020-BPL1(g)(m) | | 5.44% | | 08/25/2025 | | | | 1,002,247 | |
| | | | | JP Morgan Resecuritization Trust | | | | | | | | | |
| | 3,128,486 | | | Series 2014-6(f)(g) | | 1M US L + 0.21% | | 07/27/2046 | | | | 2,938,540 | |
| | | | | Legacy Mortgage Asset Trust | | | | | | | | | |
| | 13,310,000 | | | Series 2019-GS7(g)(m) | | 4.50% | | 11/25/2059 | | | | 13,074,575 | |
| | | | | LHOME Mortgage Trust | | | | | | | | | |
| | 4,250,000 | | | Series 2020-RTL1(g)(m) | | 3.72% | | 10/25/2022 | | | | 3,982,488 | |
| | 3,750,000 | | | Series 2020-RTL1(g)(m) | | 4.95% | | 10/25/2022 | | | | 3,073,313 | |
| | | | | Mello Warehouse Securitization Trust | | | | | | | | | |
| | 3,500,000 | | | Series 2019-1(f)(g) | | 1M US L + 3.50% | | 05/14/2021 | | | | 3,483,126 | |
| | 5,680,000 | | | Series 2019-2(f)(g) | | 1M US L + 3.25% | | 10/25/2021 | | | | 5,558,641 | |
| | | | | New Residential Mortgage Loan Trust 2019-NQM3 | | | | | | | | | |
| | 3,700,000 | | | Series 2019-NQM3(f)(g) | | 4.65% | | 08/25/2024 | | | | 3,808,410 | |
| | | | | PRPM 2019-1 LLC | | | | | | | | | |
| | 3,400,000 | | | Series 2019-1A(g)(m) | | 5.00% | | 01/25/2024 | | | | 3,396,961 | |
| | | | | Residential Mortgage Loan Trust | | | | | | | | | |
| | 3,250,000 | | | Series 2020-1(f)(g) | | 4.67% | | 02/25/2024 | | | | 2,958,417 | |
| | | | | Toorak Mortgage Corp., Ltd. | | | | | | | | | |
| | 3,500,000 | | | Series 2019-2(m) | | 4.21% | | 09/25/2022 | | | | 3,178,936 | |
| | | | | Verus Securitization Trust 2019-INV3 | | | | | | | | | |
| | 2,300,000 | | | Series 2019-INV3(f)(g) | | 3.28% | | 11/25/2059 | | | | 2,348,938 | |
| | | | | | | | | | | | | | |
| TOTAL U.S. GOVERNMENT / AGENCY MORTGAGE BACKED SECURITIES | | | | | |
| (Cost $337,958,148) | | | | 287,910,376 | |
See Notes to Financial Statements.
| Annual Report | September 30, 2020 | 76 |
| RiverNorth/DoubleLine Strategic Income Fund | Schedule of Investments |
September 30, 2020
| Shares/Description | | | Value | |
| Warrants - 0.00%(b) | | | |
| | 219,520 | | | Oas SA, Strike Price 1.00, Expires 05/16/2039(k) | | $ | 0 | |
| | | | | | | | | |
| TOTAL WARRANTS | | | | |
| (Cost $0) | | | 0 | |
| | | | | | | | | |
| SHORT-TERM INVESTMENTS - 12.61% | | | | |
| Money Market Fund - 12.58% | | | | |
| | 228,411,532 | | | State Street Institutional Trust (7 Day Yield 0.02%) | | | 228,411,532 | |
| Principal Amount/Description | | Rate | | Maturity | | | Value | |
| U.S. Treasury - 0.03% | | | | | | | | | |
| $ | 410,000 | | | United States Treasury Bill(o) | | 0.16% | | 11/27/2020 | | | | 409,942 | |
| | 125,000 | | | United States Treasury Bill(o) | | 1.54% | | 11/05/2020 | | | | 124,990 | |
| | | | | | | | | | | | | 534,932 | |
| | | | | | | | | | | | | | |
| TOTAL SHORT-TERM INVESTMENTS | | | | | | | | | |
| (Cost $228,946,257) | | | | | | | | 228,946,464 | |
| | | | | | | | | | | | | | |
| TOTAL INVESTMENTS - 99.76% | | | | | | | | | |
| (Cost $1,894,498,821) | | | | | | | $ | 1,811,894,028 | |
| OTHER ASSETS IN EXCESS OF LIABILITIES - 0.24% | | | | | | | | 4,333,746 | |
| NET ASSETS - 100.00% | | | | | | | $ | 1,816,227,774 | |
Investment Abbreviations:
LIBOR - London Interbank Offered Rate
SOFR - Secured Overnight Financing Rate Data
TI - Treasury Index
Libor Rates:
1M US L - 1 Month LIBOR as of September 30, 2020 was 0.15%
2M US L - 2 Month LIBOR as of September 30, 2020 was 0.23%
3M US L - 3 Month LIBOR as of September 30, 2020 was 0.23%
1D SOFR - 1 Day SOFR as of September 30, 2020 was 0.10%
5Y US TI - 5 Year TI as of September 30, 2020 was 0.24%
10Y US TI - 10 Year TI as of September 30, 2020 was 0.66%
| (b) | Non-income producing security. |
| (c) | Affiliated company. See Note 9 to Notes to Financial Statements. |
| (d) | Security has no contractual maturity date, is not redeemable and contractually pays an indefinite stream of interest. |
See Notes to Financial Statements.
| 77 | (888) 848-7569 | www.rivernorth.com |
| RiverNorth/DoubleLine Strategic Income Fund | Schedule of Investments |
September 30, 2020
| (e) | Securities were purchased pursuant to Regulation S under the Securities Act of 1933, which exempts securities offered and sold outside of the United States from registration. Such securities cannot be sold in the United States without either an effective registration statement filed pursuant to the Securities Act of 1933, or pursuant to an exemption from registration. These securities have been deemed liquid under procedures approved by the Fund's Board of Trustees (The "Board"). As of September 30, 2020, the aggregate fair value of those securities was $36,360,209, representing 2.00% of net assets. |
| (f) | Variable rate investment. Interest rates reset periodically. Interest rate shown reflects the rate in effect at September 30, 2020. For securities based on a published reference rate and spread, the reference rate and spread are indicated in the description above. Certain variable rate securities are not based on a published reference rate and spread but are determined by the issuer or agent and are based on current market conditions. These securities do not indicate a reference rate and spread in their description above. |
| (g) | Security exempt from registration under Rule 144A of the Securities Act of 1933. These securities have been deemed liquid under procedures approved by the Fund's Board of Trustees and may normally be sold to qualified institutional buyers in transactions exempt from registration. Total fair value of Rule 144A securities amounts to $465,201,853, which represents approximately 25.61% of net assets as of September 30, 2020. |
| (h) | Security is currently in default. |
| (i) | Pay-in-kind securities. Rate paid in-kind is shown in parenthesis. |
| (j) | Issued with a zero coupon. Income is recognized through the accretion of discount. |
| (k) | The Level 3 assets were a result of unavailable quoted prices from an active market or the unavailability of other significant observable inputs. |
| (l) | Interest only securities. |
| (m) | Step up bond. Coupon changes periodically based upon a predetermined schedule. Interest rate disclosed is that which is in effect at September 30, 2020. |
| (n) | Security does not have a market value or rate. Security will not be entitled to distributions in respect of principal or interest other than excess interest paid with respect to the mortgage loans. |
| (o) | Rate shown represents the bond equivalent yield to maturity at date of purchase. |
See Notes to Financial Statements.
| Annual Report | September 30, 2020 | 78 |
| RiverNorth/Oaktree High Income Fund | Schedule of Investments |
September 30, 2020
| Shares/Description | | | Value | |
| CLOSED-END FUNDS - 7.55% | | | |
| | 32,676 | | | BlackRock Debt Strategies Fund, Inc. | | $ | 324,799 | |
| | 13,706 | | | BrandywineGLOBAL - Global Income Opportunities Fund, Inc. | | | 157,756 | |
| | 49,098 | | | Eaton Vance, Ltd. Duration Income Fund | | | 555,298 | |
| | 11,998 | | | Highland Income Fund | | | 103,063 | |
| | 29,507 | | | Invesco Dynamic Credit Opportunities Fund | | | 271,760 | |
| | 161,470 | | | Invesco Senior Income Trust | | | 590,980 | |
| | 21,807 | | | PGIM High Yield Bond Fund, Inc. | | | 301,155 | |
| | 61,469 | | | Western Asset Global High Income Fund, Inc. | | | 592,561 | |
| | 107,700 | | | Western Asset High Income Opportunity Fund, Inc. | | | 527,730 | |
| | | | | | | | | |
| TOTAL CLOSED-END FUNDS | | | | |
| (Cost $3,711,735) | | | 3,425,102 | |
| | | | | | | | | |
| COMMON STOCKS - 0.16% | | | | |
| | 947 | | | DBI Investors, Inc.(a)(b) | | | 654 | |
| | 2,675 | | | PHI Group, Inc.(a)(b) | | | 30,040 | |
| | 629 | | | Phi, Inc.(a)(b) | | | 7,064 | |
| | 5 | | | Toys R Us Propco Equity, Perpetual Maturity(b) | | | 130 | |
| | 3,002 | | | Ultra Petroleum Corp.(b) | | | – | |
| | 16 | | | Ultra Sonus AB, Perpetual Maturity(a)(b) | | | 355 | |
| | 3,286 | | | Uniti Group, Inc. | | | 34,618 | |
| | | | | | | | | |
| TOTAL COMMON STOCKS | | | | |
| (Cost $300,793) | | | 72,861 | |
| | | | | | | | | |
| PREFERRED STOCKS - 0.21% | | | | |
| | 116 | | | DBI Investors Inc., 10.000%(a)(b)(c)(d) | | | 25 | |
| | 103 | | | Sequa Corp., 7.000%(a)(b)(d) | | | 96,465 | |
| | | | | | | | | |
| TOTAL PREFERRED STOCKS | | | | |
| (Cost $114,039) | | | 96,490 | |
| Principal Amount/Description | | Rate | | Maturity | | Value | |
| BANK LOANS - 39.04% | | | | | | | | |
| Canada - 0.52% | | | | | | | | |
| $ | 235,932 | | | GFL Environmental, Inc., First Lien - Effective Date Incremental Term Loan(e) | | 3M US L + 3.00%, 1.00% Floor | | 05/30/2025 | | | 235,253 | |
| | | | | | | | | | | | | |
| France - 1.63% | | | | | | | | |
| | 193,500 | | | Altice France SA, First Lien - USD TLB- 11 Term Loan(e) | | 1M US L + 2.75% | | 07/31/2025 | | | 185,265 | |
| | 98,250 | | | Altice France SA, First Lien - USD TLB- 13 Incremental Term Loan(e) | | 1M US L + 4.00% | | 08/14/2026 | | | 95,802 | |
See Notes to Financial Statements.
| 79 | (888) 848-7569 | www.rivernorth.com |
| RiverNorth/Oaktree High Income Fund | Schedule of Investments |
September 30, 2020
| Principal Amount/Description | | Rate | | Maturity | | Value | |
| $ | 100,000 | | | CAB, First Lien - Facility B Term Loan(e) | | 6M EUR L + 3.75% | | 04/25/2026 | | $ | 114,412 | |
| | 300,000 | | | Cerba Healthcare SASU, First Lien - Facility B Term Loan(e) | | 6M EUR L + 3.00% | | 04/22/2024 | | | 343,529 | |
| | | | | | | | | | | | 739,008 | |
| Germany - 0.33% | | | | | | | |
| | 157,130 | | | CTC AcquiCo GmbH, First Lien - Facility B2 Term Loan(e) | | 3M US L + 3.00% | | 03/07/2025 | | | 149,601 | |
| | | | | | | | | | | | | |
| Great Britain - 1.66% | | | | | | | |
| | 210,000 | | | Franklin UK Midco, Ltd., First Lien - Facility B1 Term Loan(e) | | 3M EUR L + 4.00% | | 12/18/2024 | | | 206,021 | |
| | 300,000 | | | Genesis Care Finance Pty, Ltd., First Lien - Facility B2 Term Loan(e) | | 3M EUR L + 3.00% | | 10/30/2025 | | | 342,065 | |
| | 181,182 | | | Lernen Bidco, Ltd., First Lien - Facility B1 (EUR) Term Loan(e) | | 6M EUR L + 4.25% | | 10/25/2025 | | | 207,206 | |
| | | | | | | | | | | | 755,292 | |
| Luxembourg - 1.70% | | | | | | | |
| | 249,375 | | | AI Convoy S.a r.l., First Lien - Facility B Term Loan(e) | | L + 3.50%, 1.00% Floor | | 01/18/2027 | | | 248,440 | |
| | 145,875 | | | Altice Financing SA, First Lien - October 2017 USD Term Loan(e) | | 1M US L + 2.75% | | 01/31/2026 | | | 138,217 | |
| | 248,125 | | | Camelot Finance SA, First Lien - Initial Term Loan(e) | | L + 3.00% | | 10/30/2026 | | | 243,899 | |
| | 137,105 | | | Intelsat Jackson Holdings SA, First Lien - DIP Facility Term Loan(e) | | L + 5.50%, 1.00% Floor | | 07/13/2022 | | | 139,904 | |
| | | | | | | | | | | | 770,460 | |
| Netherlands - 1.53% | | | | | | | |
| | 39,300 | | | NEP Group, Inc., First Lien - Initial Euro Term Loan(e) | | 3M EUR L + 3.50% | | 10/20/2025 | | | 40,635 | |
| | 283,418 | | | Peer Holdings III B.V., First Lien - Facility B Term Loan(e) | | 3M EUR L + 3.25% | | 03/07/2025 | | | 320,440 | |
| | 250,000 | | | Sigma Holdco B.V., First Lien - Facility B4 (GBP) Term Loan(e) | | 1M US L + 4.00% | | 07/02/2025 | | | 313,466 | |
| | 17,820 | | | Sunshine Investments B.V., First Lien - Facility B3 Term Loan(e) | | L + 3.25% | | 03/28/2025 | | | 17,497 | |
| | | | | | | | | | | | 692,038 | |
| United States - 31.67% | | | | | | | |
| | 243,957 | | | Access CIG LLC, First Lien - B Term Loan(e) | | 1M US L + 3.75% | | 02/27/2025 | | | 239,270 | |
| | 332,807 | | | Acuity Specialty Products, Inc., First Lien - Initial Term Loan(e) | | 3M US L + 4.00%, 1.00% Floor | | 08/12/2024 | | | 314,191 | |
| | 146,625 | | | Adtalem Global Education, Inc., First Lien - B Term Loan(e) | | 1M US L + 3.00% | | 04/11/2025 | | | 144,059 | |
| | 249,464 | | | AI Aqua Merger Sub, Inc., First Lien - Sixth Amendment Initial Incremental Term Loan(e) | | L + 5.25%, 1.00% Floor | | 12/13/2023 | | | 248,841 | |
See Notes to Financial Statements.
| Annual Report | September 30, 2020 | 80 |
| RiverNorth/Oaktree High Income Fund | Schedule of Investments |
September 30, 2020
| Principal Amount/Description | | Rate | | Maturity | | Value | |
| $ | 38,600 | | | AI Aqua Merger Sub, Inc., First Lien - Tranche B-1 Term Loan(e) | | 1M US L + 3.25%, 1.00% Floor | | 12/13/2023 | | $ | 37,828 | |
| | 21,000 | | | Alchemy Copyrights LLC, First Lien - 2020 Term Loan(e) | | 1M US L + 3.25%, 0.75% Floor | | 08/16/2027 | | | 21,000 | |
| | 238,721 | | | American Renal Holdings, Inc., First Lien - B Term Loan(e) | | 1M US L + 5.00% | | 06/21/2024 | | | 230,962 | |
| | 235,881 | | | American Rock Salt Co. LLC, First Lien - Initial Term Loan(e) | | 1M US L + 3.50%, 1.00% Floor | | 03/21/2025 | | | 234,701 | |
| | 146,626 | | | Amynta Agency Borrower, Inc., First Lien - B Term Loan(e) | | 1M US L + 4.50% | | 02/28/2025 | | | 135,720 | |
| | 145,541 | | | Applied Systems, Inc., First Lien - Closing Date Term Loan(e) | | 3M US L + 3.25%, 1.00% Floor | | 09/19/2024 | | | 144,942 | |
| | 250,000 | | | Asplundh Tree Expert LLC, First Lien - B Term Loan(e) | | L + 2.5% | | 09/07/2027 | | | 250,053 | |
| | 248,750 | | | AssuredPartners, Inc., First Lien - 2020 June Incremental Term Loan(e) | | L + 4.50%, 1.00% Floor | | 02/12/2027 | | | 248,750 | |
| | 142,418 | | | Asurion LLC, First Lien - Amendment No. 14 Replacement B-4 Term Loan(e) | | 1M US L + 3.00% | | 08/04/2022 | | | 141,053 | |
| | 245,625 | | | Atlantic Aviation FBO, Inc., First Lien - B Term Loan(e) | | 1M US L + 3.75% | | 12/06/2025 | | | 240,918 | |
| | 165,815 | | | Aveanna Healthcare LLC, First Lien - Initial Term Loan(e) | | 3M US L + 4.25%, 1.00% Floor | | 03/18/2024 | | | 157,068 | |
| | 178,847 | | | BCP Renaissance Parent LLC, First Lien - Initial Term Loan(e) | | 2M US L + 3.50%, 1.00% Floor | | 10/31/2024 | | | 166,608 | |
| | 145,875 | | | Belron Finance US LLC, First Lien - Initial B Term Loan(e) | | 3M US L + 2.50% | | 11/07/2024 | | | 144,325 | |
| | 243,140 | | | Boing US Holdco, Inc., First Lien - B Term Loan(e) | | 1M US L + 3.25%, 1.00% Floor | | 10/03/2024 | | | 239,091 | |
| | 245,000 | | | Bracket Intermediate Holding Corp., First Lien - Initial Term Loan(e) | | 3M US L + 4.25% | | 09/05/2025 | | | 240,508 | |
| | 245,625 | | | Brookfield WEC Holdings, Inc., First Lien - Initial (2020) Term Loan(e) | | 1M US L + 3.00%, 0.75% Floor | | 08/01/2025 | | | 240,010 | |
| | 99,750 | | | Carnival Corp., First Lien - Initial Advance Term Loan(e) | | L + 7.50%, 1.00% Floor | | 06/30/2025 | | | 101,385 | |
| | 171,656 | | | CCC Information Services, Inc., First Lien - Initial Term Loan(e) | | 1M US L + 3.00%, 1.00% Floor | | 04/29/2024 | | | 170,583 | |
| | 202,497 | | | Cengage Learning, Inc., First Lien - 2016 Refinancing Term Loan(e) | | 3M US L + 4.25%, 1.00% Floor | | 06/07/2023 | | | 169,880 | |
| | 245,625 | | | CentralSquare Technologies LLC, First Lien - Initial Term Loan(e) | | 1M US L + 3.75% | | 08/29/2025 | | | 221,447 | |
| | 247,503 | | | CenturyLink, Inc., First Lien - B Term Loan(e) | | L + 2.25% | | 03/15/2027 | | | 238,333 | |
| | 243,158 | | | Charter Communications Operating LLC, First Lien - B-2 Term Loan(e) | | 1M US L + 1.75% | | 02/01/2027 | | | 238,055 | |
| | 96,333 | | | Charter NEX US, Inc., First Lien - Initial Term Loan(e) | | 1M US L + 2.75%, 1.00% Floor | | 05/16/2024 | | | 94,327 | |
See Notes to Financial Statements.
| 81 | (888) 848-7569 | www.rivernorth.com |
| RiverNorth/Oaktree High Income Fund | Schedule of Investments |
September 30, 2020
| Principal Amount/Description | | Rate | | Maturity | | Value | |
| $ | 249,365 | | | CITGO Petroleum Corp., First Lien - 2019 Incremental B Term Loan(e) | | 3M US L + 5.00%, 1.00% Floor | | 03/28/2024 | | $ | 237,520 | |
| | 146,601 | | | Cogeco Communications II LP, First Lien - B Term Loan(e) | | 1M US L + 2.00% | | 01/03/2025 | | | 143,135 | |
| | 249,356 | | | CSC SW Holdco, Inc., First Lien - B-1 Term Loan(e) | | 2M US L + 3.25%, 1.00% Floor | | 11/14/2022 | | | 244,881 | |
| | 249,369 | | | Delta Air Lines, Inc., First Lien (e) | | L + 4.75%, 1.00% Floor | | 04/29/2023 | | | 249,369 | |
| | 146,252 | | | EG Group, Ltd., First Lien - Additional Facility Term Loan(e) | | 3M US L + 4.00% | | 02/07/2025 | | | 143,806 | |
| | 96,253 | | | ExamWorks Group, Inc., First Lien - B- 1 Term Loan(e) | | 3M US L + 3.25%, 1.00% Floor | | 07/27/2023 | | | 95,772 | |
| | 244,375 | | | Flynn Restaurant Group LP, First Lien - Initial Term Loan(e) | | 1M US L + 3.50% | | 06/27/2025 | | | 234,339 | |
| | 125,000 | | | Flynn Restaurant Group LP, Second Lien - Initial Term Loan(e) | | 1M US L + 7.00% | | 06/29/2026 | | | 109,375 | |
| | 249,375 | | | Froneri International, Ltd., First Lien - Facility B2 Term Loan(e) | | L + 2.25% | | 01/29/2027 | | | 240,247 | |
| | 136,303 | | | Gentiva Health Services, Inc., First Lien - B Term Loan(e) | | 1M US L + 3.25% | | 07/02/2025 | | | 133,748 | |
| | 214,961 | | | Globallogic Holdings, Inc., First Lien - Initial Term Loan(e) | | 1M US L + 2.75% | | 08/01/2025 | | | 209,856 | |
| | 31,000 | | | Go Daddy Operating Co. LLC, First Lien - Tranche B-3 Term Loan(e) | | L + 2.5% | | 08/10/2027 | | | 30,613 | |
| | 104,482 | | | Graftech International, Ltd., First Lien - Initial Term Loan(e) | | 1M US L + 3.50%, 1.00% Floor | | 02/12/2025 | | | 103,568 | |
| | 97,252 | | | Greenrock Finance, Inc., First Lien - Initial USD B Term Loan(e) | | 3M US L + 3.50%, 1.00% Floor | | 06/28/2024 | | | 92,800 | |
| | 98,500 | | | JBS USA LUX SA, First Lien - New Term Loan(e) | | 1M US L + 2.00% | | 05/01/2026 | | | 96,148 | |
| | 32,587 | | | JetBlue Airways Corp., First Lien (e) | | L + 5.25%, 1.00% Floor | | 06/17/2024 | | | 32,403 | |
| | 77,000 | | | Learfield Communications LLC, First Lien - Initial Term Loan(e) | | 1M US L + 3.25%, 1.00% Floor | | 12/01/2023 | | | 66,204 | |
| | 227,797 | | | Life Time Fitness, Inc., First Lien - 2017 Refinancing Term Loan(e) | | 3M US L + 2.75%, 1.00% Floor | | 06/10/2022 | | | 208,339 | |
| | 250,000 | | | LMBE-MC Holdco II LLC, First Lien (e) | | L + 4.00%, 1.00% Floor | | 12/03/2025 | | | 249,062 | |
| | 250,000 | | | LogMeIn, Inc., First Lien - Initial Term Loan(e) | | 1M US L + 4.75% | | 08/31/2027 | | | 242,110 | |
| | 250,000 | | | Marcel Lux IV SARL, First Lien - TLB Term Loan(e) | | L + 4.00% | | 09/22/2027 | | | 249,584 | |
| | 39,069 | | | McAfee LLC, First Lien - B USD Term Loan(e) | | 1M US L + 3.75% | | 09/30/2024 | | | 38,857 | |
| | 250,000 | | | Mileage Plus Holdings LLC, First Lien - Initial Term Loan(e) | | L + 5.25%, 1.00% Floor | | 06/21/2027 | | | 254,498 | |
See Notes to Financial Statements.
| Annual Report | September 30, 2020 | 82 |
| RiverNorth/Oaktree High Income Fund | Schedule of Investments |
September 30, 2020
| Principal Amount/Description | | Rate | | Maturity | | Value | |
| $ | 250,000 | | | NASCAR Holdings LLC, First Lien - Initial Term Loan(e) | | L + 2.75% | | 10/19/2026 | | $ | 244,740 | |
| | 242,512 | | | Natgasoline LLC, First Lien - Initial Term Loan(e) | | 3M US L + 3.50% | | 11/14/2025 | | | 232,811 | |
| | 9,950 | | | Navicure, Inc., First Lien - Initial Term Loan(e) | | L + 4.00% | | 10/22/2026 | | | 9,749 | |
| | 96,500 | | | Onvoy LLC, First Lien - Initial Term Loan(e) | | 1M US L + 4.50%, 1.00% Floor | | 02/10/2024 | | | 92,650 | |
| | 146,475 | | | PetVet Care Centers LLC, First Lien - Initial Term Loan(e) | | 1M US L + 2.75% | | 02/14/2025 | | | 142,035 | |
| | 249,375 | | | PG&E Corp., First Lien (e) | | L + 4.50%, 1.00% Floor | | 06/23/2025 | | | 244,803 | |
| | 250,000 | | | ProAmpac PG Borrower, LLC, First Lien Initial Term Loan, First Lien (e) | | 3M US L + 3.50%, 1.00% Floor | | 11/20/2023 | | | 247,406 | |
| | 248,750 | | | Pug LLC, First Lien - USD B Term Loan(e) | | L + 3.50% | | 02/12/2027 | | | 220,766 | |
| | 233,491 | | | Recess Holdings, Inc., First Lien - Initial Term Loan(e) | | 3M US L + 3.75%, 1.00% Floor | | 09/30/2024 | | | 215,979 | |
| | 235,865 | | | Recorded Books, Inc., First Lien - Initial Term Loan(e) | | L + 4.00% | | 08/29/2025 | | | 234,685 | |
| | 250,000 | | | Reynolds Group Holdings, Inc., First Lien - Tranche B-2 U.S. Term Loan(e) | | L + 3.25% | | 02/05/2026 | | | 246,250 | |
| | 194,150 | | | Ring Container Technologies Group LLC, First Lien - Initial Term Loan(e) | | 1M US L + 2.75% | | 10/31/2024 | | | 189,781 | |
| | 222,000 | | | Shearer's Foods LLC, First Lien (e) | | L + 4.00%, 0.75% Floor | | 09/23/2027 | | | 220,891 | |
| | 250,000 | | | SkyMiles IP, Ltd., First Lien - Initial Term Loan(e) | | L + 3.75%, 1.00% Floor | | 10/20/2027 | | | 252,144 | |
| | 248,750 | | | Sotera Health Holdings LLC, First Lien - Initial Term Loan(e) | | L + 4.50%, 1.00% Floor | | 12/11/2026 | | | 248,025 | |
| | 217,798 | | | St. George's University Scholastic Services LLC, First Lien (e) | | 1M US L + 3.25% | | 07/17/2025 | | | 213,714 | |
| | 171 | | | Toys R Us Tl2(c) | | 9.50% (12.50%) | | 03/08/2024 | | | 167 | |
| | 85,016 | | | Trans Union LLC, First Lien - 2019 Replacement B-5 Term Loan(e) | | 1M US L + 1.75% | | 11/16/2026 | | | 83,043 | |
| | 172,057 | | | TransDigm, Inc., First Lien - Tranche E Refinancing Term Loan(e) | | 1M US L + 2.25% | | 05/30/2025 | | | 162,982 | |
| | 246,250 | | | Tunnel Hill Partners LP, First Lien - Initial Term Loan(e) | | 1M US L + 3.50% | | 02/06/2026 | | | 238,862 | |
| | 248,702 | | | UFC Holdings LLC, First Lien - B-1 Term Loan(e) | | 3M US L + 3.25%, 1.00% Floor | | 04/29/2026 | | | 245,050 | |
| | 250,000 | | | Ultimate Software Group, Inc., First Lien - 2020 Incremental Term Loan(e) | | L + 4.00%, 0.75% Floor | | 05/04/2026 | | | 249,751 | |
| | 250,000 | | | UPC Financing Partnership, First Lien - Facility B1 Term Loan(e) | | L +3.5% | | 01/31/2029 | | | 243,500 | |
See Notes to Financial Statements.
| 83 | (888) 848-7569 | www.rivernorth.com |
| RiverNorth/Oaktree High Income Fund | Schedule of Investments |
September 30, 2020
| Principal Amount/Description | | Rate | | Maturity | | Value | |
| $ | 35,664 | | | Vestcom Parent Holdings, Inc., First Lien - L/C Collaterilized Term Loan(e) | | 1M US L + 4.00%, 1.00% Floor | | 12/19/2023 | | $ | 34,906 | |
| | 300,000 | | | Virgin Media Bristol LLC, First Lien - Q Term Loan(e) | | L + 3.25% | | 01/31/2029 | | | 295,641 | |
| | 375,000 | | | Windstream Services LLC, First Lien - Exit B Term Loan(e)(f) | | 1M US L + 6.25%, 1.00% Floor | | 08/24/2027 | | | 363,908 | |
| | 109,996 | | | Windstream Services Tl(a)(e) | | L + 4.00% | | 03/29/2021 | | | 68,060 | |
| | 131,327 | | | YI LLC, First Lien - Initial Term Loan(e) | | 1M US L + 4.00%, 1.00% Floor | | 11/07/2024 | | | 120,820 | |
| | 248,750 | | | Zayo Group Holdings, Inc., First Lien - Initial Dollar Term Loan(e) | | L + 3.00% | | 03/09/2027 | | | 241,954 | |
| | | | | | | | | | | | 14,365,215 | |
| | | | | | | | | | | | | |
| TOTAL BANK LOANS | | | | | | | | |
| (Cost $18,142,017) | | | | | | | 17,706,867 | |
| | | | | | | | | | | | | |
| HIGH YIELD DEBT- 53.40% | | | | | | | | |
| Australia - 0.37% | | | | | | | | |
| | 40,000 | | | Mineral Resources, Ltd.(g) | | 8.13% | | 05/01/2027 | | | 43,525 | |
| | 120,000 | | | Nufarm Australia, Ltd. / Nufarm Americas, Inc.(g) | | 5.75% | | 04/30/2026 | | | 122,839 | |
| | | | | | | | | | | | 166,364 | |
| Canada - 1.90% | | | | | | | | |
| | 70,000 | | | 1011778 BC ULC / New Red Finance, Inc.(g) | | 4.38% | | 01/15/2028 | | | 71,504 | |
| | 50,000 | | | 1011778 BC ULC / New Red Finance, Inc.(g) | | 4.00% | | 10/15/2030 | | | 50,511 | |
| | 30,000 | | | Baytex Energy Corp.(g) | | 8.75% | | 04/01/2027 | | | 13,613 | |
| | 10,000 | | | Bombardier, Inc.(g) | | 8.75% | | 12/01/2021 | | | 10,146 | |
| | 105,000 | | | Bombardier, Inc.(g) | | 6.13% | | 01/15/2023 | | | 89,880 | |
| | 35,000 | | | Cascades, Inc./Cascades USA, Inc.(g) | | 5.13% | | 01/15/2026 | | | 36,779 | |
| | 110,000 | | | Cascades, Inc./Cascades USA, Inc.(g) | | 5.38% | | 01/15/2028 | | | 115,844 | |
| | 36,000 | | | Eldorado Gold Corp.(g) | | 9.50% | | 06/01/2024 | | | 38,381 | |
| | 20,000 | | | First Quantum Minerals, Ltd.(g) | | 7.25% | | 04/01/2023 | | | 20,006 | |
| | 25,000 | | | First Quantum Minerals, Ltd.(g) | | 6.50% | | 03/01/2024 | | | 24,031 | |
| | 85,000 | | | GFL Environmental, Inc.(g) | | 5.13% | | 12/15/2026 | | | 88,515 | |
| | 20,000 | | | goeasy, Ltd.(g) | | 5.38% | | 12/01/2024 | | | 20,290 | |
| | 35,000 | | | Intelligent Packaging, Ltd. Finco, Inc. / Intelligent Packaging Ltd Co.-Issuer LLC(g) | | 6.00% | | 09/15/2028 | | | 35,557 | |
| | 50,000 | | | Mattamy Group Corp.(g) | | 4.63% | | 03/01/2030 | | | 50,716 | |
| | 55,000 | | | MEG Energy Corp.(g) | | 7.13% | | 02/01/2027 | | | 49,463 | |
| | 35,000 | | | Precision Drilling Corp. | | 7.75% | | 12/15/2023 | | | 26,709 | |
| | 15,000 | | | Precision Drilling Corp.(g) | | 7.13% | | 01/15/2026 | | | 9,701 | |
| | 70,000 | | | Telesat Canada / Telesat LLC(g) | | 4.88% | | 06/01/2027 | | | 70,502 | |
See Notes to Financial Statements.
| Annual Report | September 30, 2020 | 84 |
| RiverNorth/Oaktree High Income Fund | Schedule of Investments |
September 30, 2020
| Principal Amount/Description | | Rate | | Maturity | | Value |
| $ | 50,000 | | | Vermilion Energy, Inc.(g) | | 5.63% | | 03/15/2025 | | $ | 41,682 | |
| | | | | | | | | | | | 863,830 | |
| Cayman Islands - 0.28% |
| | 108,806 | | | Global Aircraft Leasing Co., Ltd.(c)(g) | | 6.50% (7.25%) | | 09/15/2024 | | | 61,068 | |
| | 62,400 | | | Transocean Guardian, Ltd.(g) | | 5.88% | | 01/15/2024 | | | 40,560 | |
| | 30,000 | | | Transocean Poseidon, Ltd.(g) | | 6.88% | | 02/01/2027 | | | 24,150 | |
| | | | | | | | | | | | 125,778 | |
| Denmark - 0.26% |
| | 100,000 | | | DKT Finance ApS(h) | | 7.00% | | 06/17/2023 | | | 118,713 | |
| | | | | | | | | | | | | |
| France - 1.57% |
| | 100,000 | | | Altice France SA(h) | | 5.88% | | 02/01/2027 | | | 124,252 | |
| | 120,000 | | | Altice France SA(g) | | 5.50% | | 01/15/2028 | | | 121,650 | |
| | 100,000 | | | Banijay Entertainment SASU(g) | | 3.50% | | 03/01/2025 | | | 114,764 | |
| | 100,000 | | | Constantin Investissement 3 SASU(h) | | 5.38% | | 04/15/2025 | | | 118,125 | |
| | 100,000 | | | Faurecia SE | | 3.13% | | 06/15/2026 | | | 116,742 | |
| | 100,000 | | | Rexel SA | | 2.63% | | 06/15/2024 | | | 117,545 | |
| | | | | | | | | | | | 713,078 | |
| Germany - 1.33% |
| | 100,000 | | | IHO Verwaltungs GmbH(c)(h) | | 3.75% (4.50%) | | 09/15/2026 | | | 117,464 | |
| | 120,000 | | | Nidda Healthcare Holding GmbH(h) | | 3.50% | | 09/30/2024 | | | 137,663 | |
| | 100,000 | | | Techem Verwaltungsgesellschaft 674 mbH(h) | | 6.00% | | 07/30/2026 | | | 120,016 | |
| | 100,000 | | | Tele Columbus AG(h) | | 3.88% | | 05/02/2025 | | | 112,292 | |
| | 100,000 | | | WEPA Hygieneprodukte GmbH(h) | | 2.88% | | 12/15/2027 | | | 115,607 | |
| | | | | | | | | | | | 603,042 | |
| Great Britain - 0.81% |
| | 100,000 | | | Arqiva Broadcast Finance PLC | | 6.75% | | 09/30/2023 | | | 133,391 | |
| | 55,000 | | | Connect Finco SARL / Connect US Finco LLC(g) | | 6.75% | | 10/01/2026 | | | 55,258 | |
| | 100,000 | | | Synlab Bondco PLC(e)(g) | | 3M EUR L + 4.75% | | 07/01/2025 | | | 118,942 | |
| | 60,000 | | | Virgin Media Finance PLC(g) | | 5.00% | | 07/15/2030 | | | 59,775 | |
| | | | | | | | | | | | 367,366 | |
| Ireland - 0.74% |
| | 200,000 | | | Ardagh Packaging Finance PLC / Ardagh Holdings USA, Inc.(g) | 5.25% | | 08/15/2027 | | | 204,000 | |
| | 100,000 | | | Virgin Media Vendor Financing Notes III DAC(g) | | 4.88% | | 07/15/2028 | | | 130,561 | |
| | | | | | | | | | | | 334,561 | |
| Isle Of Man - 0.26% |
| | 100,000 | | | Playtech PLC | | 3.75% | | 10/12/2023 | | | 117,281 | |
| | | | | | | | | | | | | |
| Italy - 0.78% |
| | 100,000 | | | Bormioli Pharma Bidco SpA(e)(h) | | 3M EUR L + 3.50% | | 11/15/2024 | | | 111,829 | |
See Notes to Financial Statements.
| 85 | (888) 848-7569 | www.rivernorth.com |
| RiverNorth/Oaktree High Income Fund | Schedule of Investments |
September 30, 2020
| Principal Amount/Description | | Rate | | Maturity | | Value |
| $ | 100,000 | | | Guala Closures SpA(e)(g) | | 3M EUR L + 3.50% | | 04/15/2024 | | $ | 116,723 | |
| | 100,000 | | | LKQ Italia Bondco SpA(h) | | 3.88% | | 04/01/2024 | | | 123,518 | |
| | | | | | | | | | | | 352,070 | |
| Jersey - 0.41% |
| | 39,329 | | | CPUK Finance, Ltd.(h) | | 4.25% | | 08/28/2022 | | | 67,220 | |
| | 100,000 | | | LHC3 PLC(c)(g) | | 4.13% (9.00%) | | 08/15/2024 | | | 118,711 | |
| | | | | | | | | | | | 185,931 | |
| Luxembourg - 2.73% |
| | 100,000 | | | Altice Financing SA(g) | | 3.00% | | 01/15/2028 | | | 109,239 | |
| | 100,000 | | | Altice France Holding SA(g) | | 4.00% | | 02/15/2028 | | | 107,143 | |
| | 45,000 | | | ArcelorMittal SA | | 3.60% | | 07/16/2024 | | | 47,175 | |
| | 55,000 | | | ArcelorMittal SA | | 4.55% | | 03/11/2026 | | | 59,458 | |
| | 15,000 | | | ArcelorMittal SA | | 7.25% | | 10/15/2039 | | | 19,018 | |
| | 100,000 | | | ARD Finance SA(c)(g) | | 5.00% (5.75%) | | 06/30/2027 | | | 114,807 | |
| | 100,000 | | | Cirsa Finance International Sarl(h) | | 6.25% | | 12/20/2023 | | | 107,309 | |
| | 85,000 | | | Dana Financing Luxembourg Sarl(g) | | 5.75% | | 04/15/2025 | | | 87,178 | |
| | 100,000 | | | Lincoln Financing SARL(h) | | 3.63% | | 04/01/2024 | | | 113,189 | |
| | 100,000 | | | Monitchem HoldCo 3 SA(h) | | 5.25% | | 03/15/2025 | | | 119,626 | |
| | 100,000 | | | Motion Finco Sarl(h) | | 7.00% | | 05/15/2025 | | | 116,126 | |
| | 100,000 | | | Summer BC Holdco B SARL(h) | | 5.75% | | 10/31/2026 | | | 115,627 | |
| | 100,000 | | | Telenet Finance Luxembourg Notes Sarl(h) | | 3.50% | | 03/01/2028 | | | 121,264 | |
| | | | | | | | | | | | 1,237,159 | |
| Netherlands - 2.47% |
| | 100,000 | | | Intertrust Group BV(h) | | 3.38% | | 11/15/2025 | | | 119,870 | |
| | 100,000 | | | Sigma Holdco BV(h) | | 5.75% | | 05/15/2026 | | | 116,034 | |
| | 100,000 | | | Sunshine Mid BV(h) | | 6.50% | | 05/15/2026 | | | 120,177 | |
| | 100,000 | | | Telefonica Europe BV(d)(e) | | 4.38% | | Perpetual Maturity | | | 123,917 | |
| | 100,000 | | | Trivium Packaging Finance BV(g) | | 3.75% | | 08/15/2026 | | | 116,408 | |
| | 200,000 | | | UPC Holding BV(g) | | 5.50% | | 01/15/2028 | | | 206,875 | |
| | 100,000 | | | ZF Europe Finance BV | | 2.00% | | 02/23/2026 | | | 107,401 | |
| | 45,000 | | | Ziggo Bond Co. BV(g) | | 5.13% | | 02/28/2030 | | | 45,669 | |
| | 145,000 | | | Ziggo Bond Co. BV(g) | | 3.38% | | 02/28/2030 | | | 162,237 | |
| | | | | | | | | | | | 1,118,588 | |
| Spain - 0.27% |
| | 105,000 | | | Lorca Telecom Bondco SAU(g) | | 4.00% | | 09/18/2027 | | | 124,955 | |
| | | | | | | | | | | | | |
| Sweden - 0.48% |
| | 100,000 | | | Intrum AB(h) | | 3.00% | | 09/15/2027 | | | 102,634 | |
| | 100,000 | | | Verisure Midholding AB(h) | | 5.75% | | 12/01/2023 | | | 117,588 | |
| | | | | | | | | | | | 220,222 | |
| United States - 38.74% |
| | 55,000 | | | Acadia Healthcare Co., Inc. | | 6.50% | | 03/01/2024 | | | 56,644 | |
See Notes to Financial Statements.
| Annual Report | September 30, 2020 | 86 |
| RiverNorth/Oaktree High Income Fund | Schedule of Investments |
September 30, 2020
| Principal Amount/Description | | Rate | | Maturity | | Value |
| $ | 135,000 | | | Acadia Healthcare Co., Inc.(g) | | 5.50% | | 07/01/2028 | | $ | 139,102 | |
| | 10,000 | | | Acadia Healthcare Co., Inc.(g) | | 5.00% | | 04/15/2029 | | | 10,113 | |
| | 50,000 | | | ACCO Brands Corp.(g) | | 5.25% | | 12/15/2024 | | | 51,370 | |
| | 20,000 | | | Acrisure LLC / Acrisure Finance, Inc.(g) | | 8.13% | | 02/15/2024 | | | 20,995 | |
| | 35,000 | | | Acrisure LLC / Acrisure Finance, Inc.(g) | | 10.13% | | 08/01/2026 | | | 38,850 | |
| | 60,000 | | | Adient US LLC(g) | | 7.00% | | 05/15/2026 | | | 64,357 | |
| | 75,000 | | | AES Corp. | | 6.00% | | 05/15/2026 | | | 79,033 | |
| | 45,000 | | | Albertsons Cos. Inc / Safeway, Inc. / New Albertsons LP / Albertsons LLC(g) | | 5.88% | | 02/15/2028 | | | 48,114 | |
| | 105,000 | | | Allied Universal Holdco LLC / Allied Universal Finance Corp.(g) | 6.63% | | 07/15/2026 | | | 111,956 | |
| | 80,000 | | | American Axle & Manufacturing, Inc. | | 6.88% | | 07/01/2028 | | | 77,754 | |
| | 65,000 | | | Amsted Industries, Inc.(g) | | 4.63% | | 05/15/2030 | | | 67,234 | |
| | 60,000 | | | Apache Corp. | | 4.75% | | 04/15/2043 | | | 53,454 | |
| | 10,000 | | | Apache Corp. | | 4.25% | | 01/15/2044 | | | 8,525 | |
| | 75,000 | | | APX Group, Inc.(g) | | 6.75% | | 02/15/2027 | | | 77,941 | |
| | 10,000 | | | Aramark Services, Inc.(g) | | 6.38% | | 05/01/2025 | | | 10,429 | |
| | 30,000 | | | Aramark Services, Inc.(g) | | 5.00% | | 02/01/2028 | | | 30,275 | |
| | 40,000 | | | Archrock Partners LP / Archrock Partners Finance Corp.(g) | | 6.88% | | 04/01/2027 | | | 38,508 | |
| | 50,000 | | | Archrock Partners LP / Archrock Partners Finance Corp.(g) | | 6.25% | | 04/01/2028 | | | 47,250 | |
| | 31,000 | | | Asbury Automotive Group, Inc.(g) | | 4.50% | | 03/01/2028 | | | 31,252 | |
| | 33,000 | | | Asbury Automotive Group, Inc.(g) | | 4.75% | | 03/01/2030 | | | 33,309 | |
| | 30,000 | | | Ascent Resources Utica Holdings LLC / ARU Finance Corp.(g) | | 7.00% | | 11/01/2026 | | | 23,025 | |
| | 100,000 | | | Axalta Coating Systems LLC(h) | | 4.25% | | 08/15/2024 | | | 118,360 | |
| | 97,000 | | | Bausch Health Cos., Inc.(g) | | 6.13% | | 04/15/2025 | | | 99,401 | |
| | 195,000 | | | Bausch Health Cos., Inc.(g) | | 5.00% | | 01/30/2028 | | | 189,637 | |
| | 85,000 | | | Berry Global, Inc.(g) | | 4.50% | | 02/15/2026 | | | 86,009 | |
| | 30,000 | | | Berry Petroleum Co. LLC(g) | | 7.00% | | 02/15/2026 | | | 23,432 | |
| | 75,000 | | | Big River Steel LLC / BRS Finance Corp.(g) | | 6.63% | | 01/31/2029 | | | 75,977 | |
| | 35,000 | | | Block Communications, Inc.(g) | | 4.88% | | 03/01/2028 | | | 35,782 | |
| | 65,000 | | | Boyd Gaming Corp. | | 6.38% | | 04/01/2026 | | | 67,768 | |
| | 10,000 | | | Boyd Gaming Corp. | | 6.00% | | 08/15/2026 | | | 10,348 | |
| | 65,000 | | | Boyd Gaming Corp. | | 4.75% | | 12/01/2027 | | | 63,915 | |
| | 65,000 | | | Brink's Co.(g) | | 5.50% | | 07/15/2025 | | | 67,803 | |
| | 45,000 | | | Buckeye Partners LP(g) | | 4.50% | | 03/01/2028 | | | 43,481 | |
| | 25,000 | | | Cablevision Lightpath LLC(g) | | 5.63% | | 09/15/2028 | | | 25,449 | |
| | 125,000 | | | Caesars Entertainment, Inc.(g) | | 6.25% | | 07/01/2025 | | | 130,469 | |
| | 5,000 | | | Callon Petroleum Co. | | 6.13% | | 10/01/2024 | | | 1,441 | |
| | 45,000 | | | Callon Petroleum Co. | | 6.38% | | 07/01/2026 | | | 11,185 | |
| | 45,000 | | | Calpine Corp.(g) | | 5.13% | | 03/15/2028 | | | 46,639 | |
| | 75,000 | | | Cardtronics, Inc. / Cardtronics USA, Inc.(g) | | 5.50% | | 05/01/2025 | | | 75,273 | |
See Notes to Financial Statements.
| 87 | (888) 848-7569 | www.rivernorth.com |
| RiverNorth/Oaktree High Income Fund | Schedule of Investments |
September 30, 2020
| Principal Amount/Description | | Rate | | Maturity | | Value |
| $ | 35,000 | | | Carpenter Technology Corp. | | 6.38% | | 07/15/2028 | | $ | 36,672 | |
| | 55,000 | | | Carriage Services, Inc.(g) | | 6.63% | | 06/01/2026 | | | 57,946 | |
| | 100,000 | | | Catalent Pharma Solutions, Inc.(g) | | 2.38% | | 03/01/2028 | | | 113,069 | |
| | 100,000 | | | CCO Holdings LLC / CCO Holdings Capital Corp.(g) | | 5.50% | | 05/01/2026 | | | 104,391 | |
| | 25,000 | | | CCO Holdings LLC / CCO Holdings Capital Corp.(g) | | 5.00% | | 02/01/2028 | | | 26,306 | |
| | 15,000 | | | CCO Holdings LLC / CCO Holdings Capital Corp.(g) | | 5.38% | | 06/01/2029 | | | 16,273 | |
| | 120,000 | | | CCO Holdings LLC / CCO Holdings Capital Corp.(g) | | 4.75% | | 03/01/2030 | | | 127,200 | |
| | 130,000 | | | Cedar Fair LP | | 5.25% | | 07/15/2029 | | | 123,639 | |
| | 65,000 | | | Central Garden & Pet Co. | �� | 5.13% | | 02/01/2028 | | | 68,481 | |
| | 165,000 | | | CenturyLink, Inc.(g) | | 5.13% | | 12/15/2026 | | | 169,759 | |
| | 25,000 | | | CF Industries, Inc. | | 5.15% | | 03/15/2034 | | | 29,598 | |
| | 30,000 | | | ChampionX Corp. | | 6.38% | | 05/01/2026 | | | 28,762 | |
| | 80,000 | | | Change Healthcare Holdings LLC / Change Healthcare Finance, Inc.(g) | | 5.75% | | 03/01/2025 | | | 81,100 | |
| | 90,000 | | | Cheniere Energy, Inc.(g) | | 4.63% | | 10/15/2028 | | | 92,531 | |
| | 65,000 | | | Churchill Downs, Inc.(g) | | 5.50% | | 04/01/2027 | | | 67,997 | |
| | 40,000 | | | CIT Group, Inc.(e) | | 1D US SOFR + 3.827% | | 06/19/2024 | | | 40,350 | |
| | 10,000 | | | Citgo Holding, Inc.(g) | | 9.25% | | 08/01/2024 | | | 9,550 | |
| | 105,000 | | | CITGO Petroleum Corp.(g) | | 6.25% | | 08/15/2022 | | | 104,454 | |
| | 20,000 | | | CITGO Petroleum Corp.(g) | | 7.00% | | 06/15/2025 | | | 19,763 | |
| | 30,000 | | | Clean Harbors, Inc.(g) | | 5.13% | | 07/15/2029 | | | 32,634 | |
| | 75,000 | | | Cleveland-Cliffs, Inc.(g) | | 6.75% | | 03/15/2026 | | | 76,384 | |
| | 37,000 | | | CommScope Technologies LLC(g) | | 6.00% | | 06/15/2025 | | | 37,551 | |
| | 135,000 | | | CommScope Technologies LLC(g) | | 5.00% | | 03/15/2027 | | | 129,853 | |
| | 5,000 | | | CommScope, Inc.(g) | | 5.50% | | 03/01/2024 | | | 5,145 | |
| | 30,000 | | | CommScope, Inc.(g) | | 6.00% | | 03/01/2026 | | | 31,311 | |
| | 70,000 | | | Comstock Resources, Inc. | | 9.75% | | 08/15/2026 | | | 71,895 | |
| | 45,000 | | | Continental Resources, Inc. | | 5.00% | | 09/15/2022 | | | 44,736 | |
| | 130,000 | | | Covanta Holding Corp. | | 6.00% | | 01/01/2027 | | | 135,663 | |
| | 62,000 | | | CrownRock LP / CrownRock Finance, Inc.(g) | | 5.63% | | 10/15/2025 | | | 58,590 | |
| | 115,000 | | | CSC Holdings LLC(g) | | 5.75% | | 01/15/2030 | | | 122,356 | |
| | 85,000 | | | CSC Holdings LLC(g) | | 4.63% | | 12/01/2030 | | | 85,520 | |
| | 20,000 | | | Cushman & Wakefield US Borrower LLC(g) | | 6.75% | | 05/15/2028 | | | 20,826 | |
| | 35,000 | | | CVR Energy, Inc.(g) | | 5.75% | | 02/15/2028 | | | 29,838 | |
| | 20,000 | | | Dana, Inc. | | 5.38% | | 11/15/2027 | | | 20,538 | |
| | 30,000 | | | Dana, Inc. | | 5.63% | | 06/15/2028 | | | 31,024 | |
| | 145,000 | | | DaVita, Inc.(g) | | 4.63% | | 06/01/2030 | | | 148,919 | |
| | 155,000 | | | Delta Air Lines, Inc.(g) | | 7.00% | | 05/01/2025 | | | 170,397 | |
See Notes to Financial Statements.
| Annual Report | September 30, 2020 | 88 |
| RiverNorth/Oaktree High Income Fund | Schedule of Investments |
September 30, 2020
| Principal Amount/Description | | Rate | | Maturity | | Value |
| $ | 135,000 | | | Delta Air Lines, Inc. / SkyMiles IP, Ltd.(g) | | 4.75% | | 10/20/2028 | | $ | 140,263 | |
| | 100,000 | | | Diamond BC BV(h) | | 5.63% | | 08/15/2025 | | | 115,166 | |
| | 35,000 | | | DISH DBS Corp. | | 7.75% | | 07/01/2026 | | | 38,522 | |
| | 40,000 | | | DISH DBS Corp.(g) | | 7.38% | | 07/01/2028 | | | 41,250 | |
| | 45,000 | | | Edgewell Personal Care Co.(g) | | 5.50% | | 06/01/2028 | | | 47,413 | |
| | 80,000 | | | Encompass Health Corp. | | 4.50% | | 02/01/2028 | | | 80,535 | |
| | 20,000 | | | Endo Dac / Endo Finance LLC / Endo Finco, Inc.(g) | | 9.50% | | 07/31/2027 | | | 20,938 | |
| | 100,000 | | | Energizer Gamma Acquisition BV(h) | | 4.63% | | 07/15/2026 | | | 121,042 | |
| | 85,000 | | | EnerSys(g) | | 4.38% | | 12/15/2027 | | | 86,966 | |
| | 100,000 | | | ESH Hospitality, Inc.(g) | | 5.25% | | 05/01/2025 | | | 101,147 | |
| | 55,000 | | | ESH Hospitality, Inc.(g) | | 4.63% | | 10/01/2027 | | | 54,039 | |
| | 60,000 | | | FirstCash, Inc.(g) | | 4.63% | | 09/01/2028 | | | 61,463 | |
| | 10,000 | | | Ford Motor Credit Co. LLC(e) | | 3M US L + 0.43% | | 11/02/2020 | | | 9,969 | |
| | 20,000 | | | Ford Motor Credit Co. LLC(e) | | 3M US L + 0.88% | | 10/12/2021 | | | 19,218 | |
| | 5,000 | | | Ford Motor Credit Co. LLC | | 5.60% | | 01/07/2022 | | | 5,125 | |
| | 30,000 | | | Ford Motor Credit Co. LLC(e) | | 3M US L + 3.14% | | 01/07/2022 | | | 29,634 | |
| | 45,000 | | | Ford Motor Credit Co. LLC(e) | | 3M US L + 1.27% | | 03/28/2022 | | | 42,989 | |
| | 65,000 | | | Ford Motor Credit Co. LLC(e) | | 3M US L + 1.08% | | 08/03/2022 | | | 61,609 | |
| | 50,000 | | | Ford Motor Credit Co. LLC | | 4.25% | | 09/20/2022 | | | 50,515 | |
| | 90,000 | | | Ford Motor Credit Co. LLC(e) | | 3M US L + 1.235% | | 02/15/2023 | | | 82,845 | |
| | 30,000 | | | Ford Motor Credit Co. LLC | | 5.13% | | 06/16/2025 | | | 30,975 | |
| | 45,000 | | | Ford Motor Credit Co. LLC | | 4.13% | | 08/17/2027 | | | 43,847 | |
| | 100,000 | | | Ford Motor Credit Co. LLC | | 5.11% | | 05/03/2029 | | | 102,875 | |
| | 145,000 | | | Frontier Communications Corp.(f)(g) | | 8.00% | | 04/01/2027 | | | 144,728 | |
| | 35,000 | | | Go Daddy Operating Co. LLC / GD Finance Co, Inc.(g) | | 5.25% | | 12/01/2027 | | | 36,497 | |
| | 115,000 | | | Golden Nugget, Inc.(g) | | 6.75% | | 10/15/2024 | | | 96,169 | |
| | 55,000 | | | Goodyear Tire & Rubber Co. | | 9.50% | | 05/31/2025 | | | 59,780 | |
| | 75,000 | | | Greystar Real Estate Partners LLC(g) | | 5.75% | | 12/01/2025 | | | 75,938 | |
| | 55,000 | | | Grinding Media, Inc. / Moly-Cop AltaSteel, Ltd.(g) | | 7.38% | | 12/15/2023 | | | 55,825 | |
| | 95,000 | | | H&E Equipment Services, Inc. | | 5.63% | | 09/01/2025 | | | 99,156 | |
| | 40,000 | | | Harvest Midstream I LP(g) | | 7.50% | | 09/01/2028 | | | 39,900 | |
| | 100,000 | | | Herc Holdings, Inc.(g) | | 5.50% | | 07/15/2027 | | | 103,653 | |
| | 75,000 | | | Hess Midstream Operations LP(g) | | 5.63% | | 02/15/2026 | | | 76,546 | |
| | 5,000 | | | Hess Midstream Operations LP(g) | | 5.13% | | 06/15/2028 | | | 4,993 | |
| | 45,000 | | | HUB International, Ltd.(g) | | 7.00% | | 05/01/2026 | | | 46,676 | |
| | 105,000 | | | Hunt Cos., Inc.(g) | | 6.25% | | 02/15/2026 | | | 101,105 | |
| | 40,000 | | | IAA, Inc.(g) | | 5.50% | | 06/15/2027 | | | 41,725 | |
| | 10,000 | | | iHeartCommunications, Inc. | | 8.38% | | 05/01/2027 | | | 9,868 | |
| | 110,000 | | | iHeartCommunications, Inc.(g) | | 5.25% | | 08/15/2027 | | | 107,436 | |
| | 60,000 | | | Illuminate Buyer LLC / Illuminate Holdings IV, Inc.(g) | | 9.00% | | 07/01/2028 | | | 64,425 | |
See Notes to Financial Statements.
| 89 | (888) 848-7569 | www.rivernorth.com |
| RiverNorth/Oaktree High Income Fund | Schedule of Investments |
September 30, 2020
| Principal Amount/Description | | Rate | | Maturity | | Value |
| $ | 19,000 | | | Ingles Markets, Inc. | | 5.75% | | 06/15/2023 | | $ | 19,329 | |
| | 115,000 | | | Intelsat Jackson Holdings SA(f)(g) | | 8.00% | | 02/15/2024 | | | 116,916 | |
| | 100,000 | | | International Game Technology PLC(h) | | 2.38% | | 04/15/2028 | | | 103,176 | |
| | 55,000 | | | Iron Mountain, Inc.(g) | | 5.25% | | 03/15/2028 | | | 57,372 | |
| | 15,000 | | | Iron Mountain, Inc.(g) | | 5.00% | | 07/15/2028 | | | 15,394 | |
| | 105,000 | | | Iron Mountain, Inc.(g) | | 4.88% | | 09/15/2029 | | | 106,942 | |
| | 55,000 | | | Iron Mountain, Inc.(g) | | 5.25% | | 07/15/2030 | | | 57,441 | |
| | 5,000 | | | Iron Mountain, Inc.(g) | | 4.50% | | 02/15/2031 | | | 5,037 | |
| | 30,000 | | | Itron, Inc.(g) | | 5.00% | | 01/15/2026 | | | 30,844 | |
| | 55,000 | | | JBS USA LUX SA / JBS USA Food Co. / JBS USA Finance, Inc.(g) | | 5.50% | | 01/15/2030 | | | 60,019 | |
| | 90,000 | | | KAR Auction Services, Inc.(g) | | 5.13% | | 06/01/2025 | | | 90,111 | |
| | 135,000 | | | Kennedy-Wilson, Inc. | | 5.88% | | 04/01/2024 | | | 134,494 | |
| | 90,000 | | | Kraft Heinz Foods Co. | | 6.88% | | 01/26/2039 | | | 120,652 | |
| | 125,000 | | | Kraft Heinz Foods Co. | | 6.50% | | 02/09/2040 | | | 159,057 | |
| | 190,000 | | | Kraft Heinz Foods Co. | | 4.38% | | 06/01/2046 | | | 195,637 | |
| | 30,000 | | | Kraft Heinz Foods Co.(g) | | 5.50% | | 06/01/2050 | | | 34,447 | |
| | 80,000 | | | Kraton Polymers, LLC / Kraton Polymers Capital Corp.(g) | | 7.00% | | 04/15/2025 | | | 81,750 | |
| | 10,000 | | | L Brands, Inc.(g) | | 9.38% | | 07/01/2025 | | | 11,488 | |
| | 105,000 | | | L Brands, Inc. | | 7.50% | | 06/15/2029 | | | 109,902 | |
| | 15,000 | | | L Brands, Inc.(g) | | 6.63% | | 10/01/2030 | | | 15,300 | |
| | 25,000 | | | L Brands, Inc. | | 6.95% | | 03/01/2033 | | | 22,277 | |
| | 75,000 | | | Lamar Media Corp. | | 5.75% | | 02/01/2026 | | | 77,571 | |
| | 20,000 | | | Lamar Media Corp.(g) | | 4.00% | | 02/15/2030 | | | 20,037 | |
| | 125,000 | | | Laredo Petroleum, Inc. | | 9.50% | | 01/15/2025 | | | 74,608 | |
| | 75,000 | | | Level 3 Financing, Inc. | | 5.25% | | 03/15/2026 | | | 77,790 | |
| | 20,000 | | | Level 3 Financing, Inc.(g) | | 4.63% | | 09/15/2027 | | | 20,586 | |
| | 15,000 | | | Live Nation Entertainment, Inc.(g) | | 6.50% | | 05/15/2027 | | | 16,208 | |
| | 35,000 | | | Logan Merger Sub, Inc.(g) | | 5.50% | | 09/01/2027 | | | 35,591 | |
| | 55,000 | | | Marriott Ownership Resorts, Inc.(g) | | 6.13% | | 09/15/2025 | | | 57,628 | |
| | 25,000 | | | Marriott Ownership Resorts, Inc. / ILG LLC | | 6.50% | | 09/15/2026 | | | 25,711 | |
| | 45,000 | | | Masonite International Corp.(g) | | 5.38% | | 02/01/2028 | | | 48,145 | |
| | 55,000 | | | MasTec, Inc.(g) | | 4.50% | | 08/15/2028 | | | 55,619 | |
| | 145,000 | | | Mauser Packaging Solutions Holding Co.(g) | | 5.50% | | 04/15/2024 | | | 145,725 | |
| | 5,000 | | | MEDNAX, Inc.(g) | | 5.25% | | 12/01/2023 | | | 5,057 | |
| | 145,000 | | | MEDNAX, Inc.(g) | | 6.25% | | 01/15/2027 | | | 150,616 | |
| | 100,000 | | | Mercer International, Inc. | | 7.38% | | 01/15/2025 | | | 101,438 | |
| | 60,000 | | | Mercer International, Inc. | | 5.50% | | 01/15/2026 | | | 57,712 | |
| | 50,000 | | | MGIC Investment Corp. | | 5.25% | | 08/15/2028 | | | 51,829 | |
| | 30,000 | | | MPT Operating Partnership LP / MPT Finance Corp. | | 5.50% | | 05/01/2024 | | | 30,422 | |
| | 80,000 | | | MTS Systems Corp.(g) | | 5.75% | | 08/15/2027 | | | 79,026 | |
See Notes to Financial Statements.
| Annual Report | September 30, 2020 | 90 |
| RiverNorth/Oaktree High Income Fund | Schedule of Investments |
September 30, 2020
| Principal Amount/Description | | Rate | | Maturity | | Value | |
| $ | 45,000 | | Murphy Oil Corp. | | 5.88% | | 12/01/2027 | | $ | 38,474 | |
| | 30,000 | | Nabors Industries, Ltd.(g) | | 7.25% | | 01/15/2026 | | | 14,888 | |
| | 30,000 | | Nabors Industries, Ltd.(g) | | 7.50% | | 01/15/2028 | | | 14,531 | |
| | 42,000 | | Nationstar Mortgage Holdings, Inc.(g) | | 6.00% | | 01/15/2027 | | | 42,885 | |
| | 50,000 | | NCR Corp.(g) | | 5.75% | | 09/01/2027 | | | 52,388 | |
| | 80,000 | | NCR Corp.(g) | | 6.13% | | 09/01/2029 | | | 84,665 | |
| | 40,000 | | NCR Corp.(g) | | 5.25% | | 10/01/2030 | | | 40,075 | |
| | 55,000 | | New Enterprise Stone & Lime Co., Inc.(g) | | 6.25% | | 03/15/2026 | | | 56,753 | |
| | 85,000 | | New Residential Investment Corp.(g) | | 6.25% | | 10/15/2025 | | | 83,925 | |
| | 95,000 | | Nexstar Broadcasting, Inc.(g) | | 5.63% | | 07/15/2027 | | | 99,799 | |
| | 80,000 | | Nexstar Broadcasting, Inc.(g) | | 4.75% | | 11/01/2028 | | | 81,800 | |
| | 35,000 | | Northern Oil and Gas, Inc.(c) | | 8.50% (9.50%) | | 05/15/2023 | | | 29,159 | |
| | 40,000 | | Novelis Corp.(g) | | 5.88% | | 09/30/2026 | | | 41,150 | |
| | 60,000 | | NuStar Logistics LP | | 6.38% | | 10/01/2030 | | | 62,400 | |
| | 80,000 | | Oasis Petroleum, Inc.(f) | | 6.88% | | 03/15/2022 | | | 18,950 | |
| | 45,000 | | Oasis Petroleum, Inc.(f) | | 6.88% | | 01/15/2023 | | | 10,575 | |
| | 25,000 | | Occidental Petroleum Corp. | | 3.13% | | 02/15/2022 | | | 23,722 | |
| | 10,000 | | Occidental Petroleum Corp. | | 2.60% | | 04/15/2022 | | | 9,475 | |
| | 135,000 | | Occidental Petroleum Corp. | | 2.70% | | 08/15/2022 | | | 126,386 | |
| | 155,000 | | Occidental Petroleum Corp.(e) | | 3M US L + 1.45% | | 08/15/2022 | | | 141,503 | |
| | 150,000 | | Occidental Petroleum Corp. | | 6.63% | | 09/01/2030 | | | 138,656 | |
| | 55,000 | | Occidental Petroleum Corp. | | 4.40% | | 04/15/2046 | | | 39,334 | |
| | 25,000 | | Occidental Petroleum Corp. | | 4.40% | | 08/15/2049 | | | 17,570 | |
| | 40,000 | | Oceaneering International, Inc. | | 6.00% | | 02/01/2028 | | | 25,120 | |
| | 20,000 | | Olin Corp. | | 5.63% | | 08/01/2029 | | | 19,725 | |
| | 105,000 | | Olin Corp. | | 5.00% | | 02/01/2030 | | | 98,943 | |
| | 85,000 | | OneMain Finance Corp. | | 7.75% | | 10/01/2021 | | | 89,097 | |
| | 20,000 | | OneMain Finance Corp. | | 8.88% | | 06/01/2025 | | | 22,187 | |
| | 100,000 | | Ortho-Clinical Diagnostics, Inc. / Ortho-Clinical Diagnostics SA(g) | | 7.38% | | 06/01/2025 | | | 101,687 | |
| | 50,000 | | Ortho-Clinical Diagnostics, Inc. / Ortho-Clinical Diagnostics SA(g) | | 7.25% | | 02/01/2028 | | | 52,094 | |
| | 40,000 | | Outfront Media Capital LLC / Outfront Media Capital Corp. | | 5.63% | | 02/15/2024 | | | 40,604 | |
| | 35,000 | | Outfront Media Capital LLC / Outfront Media Capital Corp.(g) | | 6.25% | | 06/15/2025 | | | 36,116 | |
| | 20,000 | | Outfront Media Capital LLC / Outfront Media Capital Corp.(g) | | 5.00% | | 08/15/2027 | | | 19,534 | |
| | 20,000 | | Outfront Media Capital LLC / Outfront Media Capital Corp.(g) | | 4.63% | | 03/15/2030 | | | 19,225 | |
| | 10,000 | | Ovintiv, Inc. | | 6.50% | | 08/15/2034 | | | 9,330 | |
| | 60,000 | | Ovintiv, Inc. | | 6.63% | | 08/15/2037 | | | 54,975 | |
| | 15,000 | | Ovintiv, Inc. | | 6.50% | | 02/01/2038 | | | 13,647 | |
| | 55,000 | | Par Pharmaceutical, Inc.(g) | | 7.50% | | 04/01/2027 | | | 57,694 | |
| | 30,000 | | PDC Energy, Inc. | | 6.13% | | 09/15/2024 | | | 28,650 | |
See Notes to Financial Statements.
| 91 | (888) 848-7569 | www.rivernorth.com |
| RiverNorth/Oaktree High Income Fund | Schedule of Investments |
September 30, 2020
| Principal Amount/Description | | Rate | | Maturity | | Value | |
| $ | 65,000 | | PDC Energy, Inc. | | 5.75% | | 05/15/2026 | | $ | 60,775 | |
| | 40,000 | | Performance Food Group, Inc.(g) | | 5.50% | | 06/01/2024 | | | 40,100 | |
| | 25,000 | | Performance Food Group, Inc.(g) | | 5.50% | | 10/15/2027 | | | 25,796 | |
| | 25,000 | | PG&E Corp. | | 5.00% | | 07/01/2028 | | | 24,283 | |
| | 95,000 | | PG&E Corp. | | 5.25% | | 07/01/2030 | | | 92,031 | |
| | 100,000 | | Pike Corp.(g) | | 5.50% | | 09/01/2028 | | | 100,932 | |
| | 55,000 | | Pilgrim's Pride Corp.(g) | | 5.75% | | 03/15/2025 | | | 56,100 | |
| | 25,000 | | Plantronics, Inc.(g) | | 5.50% | | 05/31/2023 | | | 22,328 | |
| | 100,000 | | Post Holdings, Inc.(g) | | 4.63% | | 04/15/2030 | | | 103,000 | |
| | 90,000 | | PowerTeam Services LLC(g) | | 9.03% | | 12/04/2025 | | | 95,231 | |
| | 40,000 | | PQ Corp.(g) | | 5.75% | | 12/15/2025 | | | 41,296 | |
| | 10,000 | | Prestige Brands, Inc.(g) | | 5.13% | | 01/15/2028 | | | 10,350 | |
| | 150,000 | | Prime Security Services Borrower LLC / Prime Finance, Inc.(g) | | 5.75% | | 04/15/2026 | | | 160,739 | |
| | 120,000 | | Prime Security Services Borrower LLC / Prime Finance, Inc.(g) | | 6.25% | | 01/15/2028 | | | 121,669 | |
| | 100,000 | | Primo Water Corp.(h) | | 5.50% | | 07/01/2024 | | | 119,757 | |
| | 40,000 | | QEP Resources, Inc. | | 5.38% | | 10/01/2022 | | | 32,900 | |
| | 5,000 | | Quicken Loans LLC(g) | | 5.75% | | 05/01/2025 | | | 5,150 | |
| | 85,000 | | Quicken Loans LLC(g) | | 5.25% | | 01/15/2028 | | | 89,720 | |
| | 5,000 | | Quicken Loans LLC / Quicken Loans Co.-Issuer, Inc.(g) | | 3.88% | | 03/01/2031 | | | 4,950 | |
| | 45,000 | | QVC, Inc. | | 4.75% | | 02/15/2027 | | | 46,300 | |
| | 85,000 | | QVC, Inc. | | 4.38% | | 09/01/2028 | | | 86,647 | |
| | 135,000 | | Realogy Group LLC / Realogy Co.- Issuer Corp.(g) | | 7.63% | | 06/15/2025 | | | 141,617 | |
| | 100,000 | | Refinitiv US Holdings, Inc.(g) | | 4.50% | | 05/15/2026 | | | 123,053 | |
| | 85,000 | | Reynolds Group Issuer, Inc. / Reynolds Group Issuer LLC / Reynolds Group Issuer Lu(g) | | 4.00% | | 10/15/2027 | | | 85,655 | |
| | 95,000 | | RHP Hotel Properties LP / RHP Finance Corp. | | 4.75% | | 10/15/2027 | | | 87,695 | |
| | 64,000 | | Rite Aid Corp.(g) | | 8.00% | | 11/15/2026 | | | 64,120 | |
| | 20,000 | | Sabre GLBL, Inc.(g) | | 9.25% | | 04/15/2025 | | | 22,049 | |
| | 55,000 | | Sabre GLBL, Inc.(g) | | 7.38% | | 09/01/2025 | | | 55,632 | |
| | 55,000 | | Scotts Miracle-Gro Co.(g) | | 4.50% | | 10/15/2029 | | | 58,439 | |
| | 35,000 | | Shea Homes LP / Shea Homes Funding Corp.(g) | | 4.75% | | 04/01/2029 | | | 34,978 | |
| | 35,000 | | Signature Aviation US Holdings, Inc.(g) | | 5.38% | | 05/01/2026 | | | 35,452 | |
| | 100,000 | | Silgan Holdings, Inc. | | 3.25% | | 03/15/2025 | | | 118,840 | |
| | 15,000 | | Simmons Foods, Inc.(g) | | 5.75% | | 11/01/2024 | | | 15,055 | |
| | 30,000 | | Sirius XM Radio, Inc.(g) | | 4.63% | | 07/15/2024 | | | 31,069 | |
| | 5,000 | | Sirius XM Radio, Inc.(g) | | 5.50% | | 07/01/2029 | | | 5,385 | |
| | 25,000 | | Six Flags Entertainment Corp.(g) | | 5.50% | | 04/15/2027 | | | 23,739 | |
| | 30,000 | | Six Flags Theme Parks, Inc.(g) | | 7.00% | | 07/01/2025 | | | 31,969 | |
See Notes to Financial Statements.
| Annual Report | September 30, 2020 | 92 |
| RiverNorth/Oaktree High Income Fund | Schedule of Investments |
September 30, 2020
| Principal Amount/Description | | Rate | | Maturity | | Value | |
| $ | 30,000 | | SM Energy Co. | | 5.00% | | 01/15/2024 | | $ | 16,125 | |
| | 30,000 | | SM Energy Co. | | 5.63% | | 06/01/2025 | | | 13,609 | |
| | 50,000 | | Sonic Automotive, Inc. | | 6.13% | | 03/15/2027 | | | 51,803 | |
| | 10,000 | | Southwestern Energy Co. | | 4.95% | | 01/23/2025 | | | 9,728 | |
| | 20,000 | | Southwestern Energy Co. | | 7.75% | | 10/01/2027 | | | 19,448 | |
| | 40,000 | | Southwestern Energy Co. | | 8.38% | | 09/15/2028 | | | 39,379 | |
| | 100,000 | | Spectrum Brands, Inc.(g) | | 5.00% | | 10/01/2029 | | | 104,000 | |
| | 70,000 | | SS&C Technologies, Inc.(g) | | 5.50% | | 09/30/2027 | | | 74,478 | |
| | 110,000 | | Station Casinos LLC(g) | | 4.50% | | 02/15/2028 | | | 101,956 | |
| | 40,000 | | Stevens Holding Co., Inc.(g) | | 6.13% | | 10/01/2026 | | | 42,942 | |
| | 110,000 | | Suburban Propane Partners LP/Suburban Energy Finance Corp. | | 5.75% | | 03/01/2025 | | | 111,799 | |
| | 40,000 | | Suburban Propane Partners LP/Suburban Energy Finance Corp. | | 5.88% | | 03/01/2027 | | | 41,075 | |
| | 30,000 | | Summit Materials LLC / Summit Materials Finance Corp.(g) | | 5.13% | | 06/01/2025 | | | 30,522 | |
| | 95,000 | | SunCoke Energy Partners LP / SunCoke Energy Partners Finance Corp.(g) | | 7.50% | | 06/15/2025 | | | 85,929 | |
| | 50,000 | | Tallgrass Energy Partners LP / Tallgrass Energy Finance Corp.(g) | | 6.00% | | 03/01/2027 | | | 45,875 | |
| | 15,000 | | Targa Resources Partners LP / Targa Resources Partners Finance Corp. | | 5.88% | | 04/15/2026 | | | 15,428 | |
| | 20,000 | | Targa Resources Partners LP / Targa Resources Partners Finance Corp. | | 5.38% | | 02/01/2027 | | | 20,159 | |
| | 20,000 | | Targa Resources Partners LP / Targa Resources Partners Finance Corp. | | 5.00% | | 01/15/2028 | | | 19,550 | |
| | 100,000 | | Targa Resources Partners LP / Targa Resources Partners Finance Corp.(g) | | 5.50% | | 03/01/2030 | | | 99,594 | |
| | 120,000 | | TEGNA, Inc.(g) | | 4.75% | | 03/15/2026 | | | 122,844 | |
| | 135,000 | | Tenet Healthcare Corp. | | 5.13% | | 05/01/2025 | | | 135,304 | |
| | 140,000 | | Tenet Healthcare Corp.(g) | | 6.25% | | 02/01/2027 | | | 144,705 | |
| | 15,000 | | Tenet Healthcare Corp.(g) | | 5.13% | | 11/01/2027 | | | 15,466 | |
| | 75,000 | | Tenet Healthcare Corp.(g) | | 4.63% | | 06/15/2028 | | | 75,772 | |
| | 30,000 | | Tenet Healthcare Corp.(g) | | 6.13% | | 10/01/2028 | | | 29,269 | |
| | 75,000 | | Tennant Co. | | 5.63% | | 05/01/2025 | | | 78,069 | |
| | 55,000 | | Tms International Holding Corp.(g) | | 7.25% | | 08/15/2025 | | | 51,631 | |
| | 90,000 | | TPC Group, Inc.(g) | | 10.50% | | 08/01/2024 | | | 75,778 | |
| | 70,000 | | TransDigm, Inc.(g) | | 6.25% | | 09/18/2023 | | | 73,486 | |
| | 105,000 | | TransDigm, Inc.(g) | | 8.00% | | 12/15/2025 | | | 114,292 | |
| | 30,000 | | TransDigm, Inc. | | 5.50% | | 11/15/2027 | | | 28,889 | |
| | 1,000 | | TreeHouse Foods, Inc.(g) | | 6.00% | | 02/15/2024 | | | 1,028 | |
| | 95,000 | | TreeHouse Foods, Inc. | | 4.00% | | 09/01/2028 | | | 96,259 | |
| | 40,000 | | TriMas Corp.(g) | | 4.88% | | 10/15/2025 | | | 40,594 | |
| | 45,000 | | Tronox, Inc.(g) | | 6.50% | | 04/15/2026 | | | 45,084 | |
| | 60,000 | | Uber Technologies, Inc.(g) | | 7.50% | | 05/15/2025 | | | 64,050 | |
See Notes to Financial Statements.
| 93 | (888) 848-7569 | www.rivernorth.com |
| RiverNorth/Oaktree High Income Fund | Schedule of Investments |
September 30, 2020
| Principal Amount/Description | | Rate | | Maturity | | Value | |
| $ | 20,000 | | Uber Technologies, Inc.(g) | | 6.25% | | 01/15/2028 | | $ | 20,563 | |
| | 100,000 | | UGI International LLC(g) | | 3.25% | | 11/01/2025 | | | 119,154 | |
| | 55,000 | | United Continental Holdings, Inc. | | 4.25% | | 10/01/2022 | | | 50,944 | |
| | 55,000 | | Univar Solutions USA, Inc./Washington(g) | | 5.13% | | 12/01/2027 | | | 56,537 | |
| | 15,000 | | Univision Communications, Inc.(g) | | 9.50% | | 05/01/2025 | | | 16,125 | |
| | 20,000 | | Univision Communications, Inc.(g) | | 6.63% | | 06/01/2027 | | | 19,575 | |
| | 40,000 | | US Foods, Inc.(g) | | 6.25% | | 04/15/2025 | | | 42,403 | |
| | 43,000 | | USA Compression Partners LP / USA Compression Finance Corp. | | 6.88% | | 04/01/2026 | | | 42,705 | |
| | 30,000 | | USA Compression Partners LP / USA Compression Finance Corp. | | 6.88% | | 09/01/2027 | | | 29,799 | |
| | 85,000 | | ViaSat, Inc.(g) | | 5.63% | | 09/15/2025 | | | 83,406 | |
| | 20,000 | | VICI Properties LP / VICI Note Co., Inc.(g) | | 4.25% | | 12/01/2026 | | | 20,124 | |
| | 20,000 | | VICI Properties LP / VICI Note Co., Inc.(g) | | 4.63% | | 12/01/2029 | | | 20,463 | |
| | 60,000 | | VICI Properties LP / VICI Note Co., Inc.(g) | | 4.13% | | 08/15/2030 | | | 59,175 | |
| | 70,000 | | West Street Merger Sub, Inc.(g) | | 6.38% | | 09/01/2025 | | | 71,560 | |
| | 140,000 | | Western Midstream Operating LP | | 5.50% | | 08/15/2048 | | | 116,200 | |
| | 65,000 | | Windstream Escrow LLC / Windstream Escrow Finance Corp.(g) | | 7.75% | | 08/15/2028 | | | 64,025 | |
| | 40,000 | | Wolverine World Wide, Inc.(g) | | 6.38% | | 05/15/2025 | | | 42,375 | |
| | 180,000 | | Xerox Holdings Corp.(g) | | 5.00% | | 08/15/2025 | | | 178,114 | |
| | 55,000 | | XPO Logistics, Inc.(g) | | 6.25% | | 05/01/2025 | | | 58,678 | |
| | | | | | | | | | | 17,574,885 | |
| | | | | | | | | | | | |
| TOTAL HIGH YIELD DEBT | | | |
| (Cost $24,158,345) | | 24,223,823 | |
| | | | | | | | | | | | |
| Shares/Description | | | | | | | Value | |
| RIGHTS - 0.00%(b)(i) |
| | 198 | | DBI Investors, Inc., Strike Price 11.50, Expires 12/31/2049(a) | | | 32 | |
| | | | | | | | | | | | |
| TOTAL RIGHTS | | | |
| (Cost $11,231) | | 32 | |
| | | | | | | | | | | | |
| WARRANTS - 0.00%(b)(i) |
| | 4 | | David's Bridal, Strike Price 219.47, Expires 01/18/2024(a) | | | – | |
| | 10 | | Toys R Us Propco Warrant, Strike Price 11.50, Expires 12/31/2049(a) | | | – | |
| | 210 | | Ultra Petroleum Corp, Strike Price 11.50, Expires 07/14/2025 | | | 2 | |
| | | | | | | | | | | | |
| TOTAL WARRANTS | | | |
| (Cost $650) | | 2 | |
See Notes to Financial Statements.
| Annual Report | September 30, 2020 | 94 |
| RiverNorth/Oaktree High Income Fund | Schedule of Investments |
September 30, 2020
| Shares/Description | | Value | |
| SHORT-TERM INVESTMENTS - 1.75% |
| 793,601 | | State Street Institutional Trust (7 Day Yield 0.02%) | | $ | 793,601 | |
| | | | | | | | |
| TOTAL SHORT-TERM INVESTMENTS | | | | |
| (Cost $793,601) | | | 793,601 | |
| | | | | | | | |
| TOTAL INVESTMENTS - 102.11% | | | | |
| (Cost $47,232,411) | | | 46,318,778 | |
| CASH SEGREGATED AT CUSTODIAN FOR FORWARD FOREIGN CURRENCY CONTRACTS - 0.11% | | | 50,000 | |
| LIABILITIES IN EXCESS OF OTHER ASSETS - (2.22)% | | | (1,005,454 | ) |
| NET ASSETS - 100.00% | | $ | 45,363,324 | |
Investment Abbreviations:
EURIBOR - Euro Interbank Offered Rate
LIBOR - London Interbank Offered Rate
SOFR - Secured Overnight Financing Rate
Libor Rates:
1M US L - 1 Month LIBOR as of September 30, 2020 was 0.15%
2M US L - 2 Month LIBOR as of September 30, 2020 was 0.19%
3M US L - 3 Month LIBOR as of September 30, 2020 was 0.23%
3M EUR L - 3 Month EURIBOR as of September 30, 2020 was -0.50%
6M EUR L - 6 Month EURIBOR as of September 30, 2020 was -0.48%
1D SOFR - 1 Day SOFR as of September 30, 2020 was 0.10%
| (a) | The Level 3 assets were a result of unavailable quoted prices from an active market or the unavailability of other significant observable inputs. |
| (b) | Non-income producing security. |
| (c) | Pay-in-kind securities. Rate paid in-kind is shown in parenthesis. |
| (d) | Security has no contractual maturity date, is not redeemable and contractually pays an indefinite stream of interest. |
| (e) | Variable rate investment. Interest rates reset periodically. Interest rate shown reflects the rate in effect at September 30, 2020. For securities based on a published reference rate and spread, the reference rate and spread are indicated in the description above. Certain variable rate securities are not based on a published reference rate and spread but are determined by the issuer or agent and are based on current market conditions. These securities do not indicate a reference rate and spread in their description above. |
| (f) | Security is currently in default. |
See Notes to Financial Statements.
| 95 | (888) 848-7569 | www.rivernorth.com |
| RiverNorth/Oaktree High Income Fund | Schedule of Investments |
September 30, 2020
| (g) | Security exempt from registration under Rule 144A of the Securities Act of 1933. These securities have been deemed liquid under procedures approved by the Fund's Board of Trustees and may normally be sold to qualified institutional buyers in transactions exempt from registration. Total fair value of Rule 144A securities amounts to $14,610,001, which represents approximately 32.21% of net assets as of September 30, 2020. |
| (h) | Securities were purchased pursuant to Regulation S under the Securities Act of 1933, which exempts securities offered and sold outside of the United States from registration. Such securities cannot be sold in the United States without either an effective registration statement filed pursuant to the Securities Act of 1933, or pursuant to an exemption from registration. These securities have been deemed liquid under procedures approved by the Fund's Board of Trustees (The "Board"). As of September 30, 2020, the aggregate fair value of those securities was $3,174,315, representing 7.00% of net assets. |
See Notes to Financial Statements.
| Annual Report | September 30, 2020 | 96 |
| RiverNorth/Oaktree High Income Fund | Schedule of Investments |
September 30, 2020
OUTSTANDING FORWARD FOREIGN CURRENCY CONTRACTS
| Counterparty | | Settlement Date | | Fund Receiving | | | U.S. $ Value at September 30, 2020 | | Fund Delivering | | | U.S. $ Value at September 30, 2020 | | | Unrealized Appreciation/ (Depreciation) | |
| State Street Boston | | 10/6/2020 | | EUR | | | | 280,363 | | | USD | | | | 279,942 | | | $ | 421 | |
| State Street Boston | | 10/6/2020 | | USD | | | | 2,001,090 | | | EUR | | | | 1,977,883 | | | | 23,207 | |
| State Street Boston | | 10/6/2020 | | USD | | | | 5,413,900 | | | EUR | | | | 5,351,113 | | | | 62,787 | |
| State Street Boston | | 10/6/2020 | | USD | | | | 45,384 | | | EUR | | | | 45,379 | | | | 5 | |
| State Street Boston | | 10/6/2020 | | USD | | | | 324,987 | | | GBP | | | | 314,340 | | | | 10,647 | |
| State Street Boston | | 10/6/2020 | | USD | | | | 410,692 | | | GBP | | | | 397,237 | | | | 13,455 | |
| | | | | | | | | | | | | | | | | | | $ | 110,522 | |
| State Street Boston | | 10/6/2020 | | EUR | | | | 37,184 | | | USD | | | | 37,334 | | | $ | (150 | ) |
| | | | | | | | | | | | | | | | | | | $ | (150 | ) |
See Notes to Financial Statements.
| 97 | (888) 848-7569 | www.rivernorth.com |
RiverNorth Core Opportunity Fund
| Statement of Assets and Liabilities | September 30, 2020 |
| ASSETS: | | | |
| Investment in securities: | | | | |
| At cost | | $ | 79,869,499 | |
| At value | | $ | 77,550,230 | |
| Cash | | | 100,436 | |
| Receivable for fund investments sold | | | 452,381 | |
| Dividends receivable | | | 109,181 | |
| Receivable for fund shares sold | | | 101,695 | |
| Interest receivable | | | 25,862 | |
| Prepaid expenses and other assets | | | 14,800 | |
| Total Assets | | | 78,354,585 | |
| LIABILITIES: | | | | |
| Facility loan fee payable | | | 2,564 | |
| Payable for fund investments purchased | | | 951,292 | |
| Payable for fund shares redeemed | | | 58,973 | |
| Payable to Adviser | | | 63,863 | |
| Payable for fund accounting and administration fees | | | 12,163 | |
| Accrued 12b-1 fees - Class R Shares | | | 5,694 | |
| Payable for custodian fees | | | 13,330 | |
| Payable for audit fees | | | 24,914 | |
| Payable to transfer agent | | | 7,598 | |
| Payable for Compliance fees | | | 2,083 | |
| Other accrued expenses | | | 4,846 | |
| Total Liabilities | | | 1,147,320 | |
| Net Assets | | $ | 77,207,265 | |
| NET ASSETS CONSIST OF: | | | | |
| Paid-in capital | | $ | 78,675,438 | |
| Total distributable earnings/(accumulated deficit) | | | (1,468,173 | ) |
| Net Assets | | $ | 77,207,265 | |
| PRICING OF SHARES: | | | | |
| Class I Shares | | | | |
| Net Assets | | $ | 49,994,479 | |
| Shares of common stock outstanding (unlimited number of shares, no par value) | | | 6,728,889 | |
| Net Asset Value Per Share, Offering and Redemption Price Per Share | | $ | 7.43 | |
| Class R Shares | | | | |
| Net Assets | | $ | 27,212,786 | |
| Shares of common stock outstanding (unlimited number of shares, no par value) | | | 3,658,350 | |
| Net Asset Value Per Share, Offering and Redemption Price Per Share | | $ | 7.44 | |
See Notes to Financial Statements.
| Annual Report | September 30, 2020 | 98 |
RiverNorth/DoubleLine Strategic Income Fund
| Statement of Assets and Liabilities | September 30, 2020 |
| ASSETS: | | | |
| Investment in securities: | | | | |
| At cost | | $ | 1,862,679,328 | |
| At value | | $ | 1,781,738,733 | |
| Investment in affiliates: | | | | |
| At cost | | | 31,819,493 | |
| At value | | | 30,155,295 | |
| Cash | | | 705,720 | |
| Receivable for fund investments sold | | | 49,734,409 | |
| Interest receivable | | | 6,575,240 | |
| Receivable for fund shares sold | | | 1,945,535 | |
| Dividends receivable | | | 1,334,898 | |
| Prepaid expenses and other assets | | | 51,656 | |
| Total Assets | | | 1,872,241,486 | |
| LIABILITIES: | | | | |
| Facility loan fee payable | | | 59,136 | |
| Payable for fund investments purchased | | | 52,264,541 | |
| Payable for fund shares redeemed | | | 1,946,102 | |
| Payable to Adviser | | | 1,114,786 | |
| Payable for fund accounting and administration fees | | | 386,202 | |
| Accrued 12b-1 fees - Class R Shares | | | 26,581 | |
| Payable for custodian fees | | | 69,136 | |
| Payable for audit fees | | | 40,914 | |
| Payable to transfer agent | | | 34,614 | |
| Payable for Compliance fees | | | 2,083 | |
| Other accrued expenses | | | 69,617 | |
| Total Liabilities | | | 56,013,712 | |
| Net Assets | | $ | 1,816,227,774 | |
| NET ASSETS CONSIST OF: | | | | |
| Paid-in capital | | $ | 1,951,806,040 | |
| Total distributable earnings/(accumulated deficit) | | | (135,578,266 | ) |
| Net Assets | | $ | 1,816,227,774 | |
| PRICING OF SHARES: | | | | |
| Class I Shares | | | | |
| Net Assets | | $ | 1,686,872,375 | |
| Shares of common stock outstanding (unlimited number of shares, no par value) | | | 165,397,318 | |
| Net Asset Value Per Share, Offering and Redemption Price Per Share | | $ | 10.20 | |
| Class R Shares | | | | |
| Net Assets | | $ | 129,355,399 | |
| Shares of common stock outstanding (unlimited number of shares, no par value) | | | 12,659,116 | |
| Net Asset Value Per Share, Offering and Redemption Price Per Share | | $ | 10.22 | |
See Notes to Financial Statements.
| 99 | (888) 848-7569 | www.rivernorth.com |
RiverNorth/Oaktree High Income Fund
| Statement of Assets and Liabilities | September 30, 2020 |
| ASSETS: | | | |
| Investment in securities: | | | | |
| At cost | | $ | 47,232,411 | |
| At value | | $ | 46,318,778 | |
| Foreign currency, at value (Cost $363,070) | | | 361,081 | |
| Receivable for fund investments sold | | | 1,015,701 | |
| Interest receivable | | | 423,871 | |
| Unrealized appreciation on forward foreign currency contracts | | | 110,522 | |
| Cash segregated at custodian for forward foreign currency contracts | | | 50,000 | |
| Dividends receivable | | | 9,876 | |
| Receivable for fund shares sold | | | 537 | |
| Prepaid expenses and other assets | | | 3,148 | |
| Total Assets | | | 48,293,514 | |
| LIABILITIES: | | | | |
| Payable to custodian due to overdraft | | | 166,307 | |
| Facility loan fee payable | | | 1,495 | |
| Payable for fund investments purchased | | | 2,611,162 | |
| Payable for fund shares redeemed | | | 15,000 | |
| Unrealized depreciation on forward foreign currency contracts | | | 150 | |
| Payable to Adviser | | | 14,987 | |
| Payable for fund accounting and administration fees | | | 64,305 | |
| Accrued 12b-1 fees - Class R Shares | | | 1,057 | |
| Payable for custodian fees | | | 12,799 | |
| Payable for audit fees | | | 30,914 | |
| Payable to transfer agent | | | 5,792 | |
| Payable for Compliance fees | | | 2,083 | |
| Other accrued expenses | | | 4,139 | |
| Total Liabilities | | | 2,930,190 | |
| Net Assets | | $ | 45,363,324 | |
| NET ASSETS CONSIST OF: | | | | |
| Paid-in capital | | $ | 52,218,067 | |
| Total distributable earnings/(accumulated deficit) | | | (6,854,743 | ) |
| Net Assets | | $ | 45,363,324 | |
| PRICING OF SHARES: | | | | |
| Class I Shares | | | | |
| Net Assets | | $ | 40,374,574 | |
| Shares of common stock outstanding (unlimited number of shares, no par value) | | | 4,442,999 | |
| Net Asset Value Per Share, Offering and Redemption Price Per Share | | $ | 9.09 | |
| Class R Shares | | | | |
| Net Assets | | $ | 4,988,750 | |
| Shares of common stock outstanding (unlimited number of shares, no par value) | | | 549,563 | |
| Net Asset Value Per Share, Offering and Redemption Price Per Share | | $ | 9.08 | |
See Notes to Financial Statements.
| Annual Report | September 30, 2020 | 100 |
RiverNorth Core Opportunity Fund
| Statement of Operations | For the Year Ended September 30, 2020 |
| INVESTMENT INCOME: | | | |
| Dividend income | | $ | 2,842,954 | |
| Interest income | | | 147,990 | |
| Other income | | | 24,845 | |
| Total Investment Income | | | 3,015,789 | |
| | | | | |
| EXPENSES: | | | | |
| Investment Adviser fee | | | 883,459 | |
| 12b-1 fees - Class R Shares | | | 82,701 | |
| Accounting and administration fee | | | 46,591 | |
| Transfer agent expenses | | | 44,051 | |
| Registration expenses | | | 40,838 | |
| Compliance expense | | | 30,819 | |
| Audit expenses | | | 26,650 | |
| Custodian expenses | | | 14,893 | |
| Printing expenses | | | 11,494 | |
| Facility loan fee | | | 11,089 | |
| Trustee expenses | | | 7,720 | |
| Legal expenses | | | 6,607 | |
| Insurance expenses | | | 2,178 | |
| Miscellaneous expenses | | | 9,971 | |
| Total Expenses | | | 1,219,061 | |
| Net Investment Income | | | 1,796,728 | |
| | | | | |
| REALIZED AND UNREALIZED GAIN/(LOSS): | | | | |
| Net realized gain/(loss) on: | | | | |
| Investments | | | 2,957,569 | |
| Net realized gain | | | 2,957,569 | |
| Long-term capital gain distributions from other investment companies | | | 1,011,327 | |
| Net change in unrealized appreciation/depreciation on: | | | | |
| Investments | | | (7,771,480 | ) |
| Net change in unrealized appreciation/depreciation | | | (7,771,480 | ) |
| Net Realized and Unrealized Loss on Investments | | | (3,802,584 | ) |
| Net Decrease in Net Assets Resulting from Operations | | $ | (2,005,856 | ) |
See Notes to Financial Statements.
| 101 | (888) 848-7569 | www.rivernorth.com |
RiverNorth/DoubleLine Strategic Income Fund
| Statement of Operations | For the Year Ended September 30, 2020 |
| INVESTMENT INCOME: | | | |
| Dividend income | | $ | 34,726,476 | |
| Dividend income from affiliated securities | | | 975,767 | |
| Interest income | | | 64,810,535 | |
| Other income | | | 105,552 | |
| Foreign taxes withheld | | | 2,451 | |
| Total Investment Income | | | 100,620,781 | |
| | | | | |
| EXPENSES: | | | | |
| Investment Adviser fee, net of voluntary waiver | | | 14,093,825 | |
| Accounting and administration fee | | | 1,049,929 | |
| 12b-1 fees - Class R Shares | | | 364,302 | |
| Facility loan fee | | | 237,110 | |
| Transfer agent expenses | | | 182,920 | |
| Compliance expense | | | 171,236 | |
| Trustee expenses | | | 164,109 | |
| Printing expenses | | | 119,518 | |
| Legal expenses | | | 114,501 | |
| Registration expenses | | | 89,670 | |
| Custodian expenses | | | 69,753 | |
| Audit expenses | | | 42,650 | |
| Insurance expenses | | | 40,099 | |
| Miscellaneous expenses | | | 109,497 | |
| Total Expenses | | | 16,849,119 | |
| Net Investment Income | | | 83,771,662 | |
| | | | | |
| REALIZED AND UNREALIZED GAIN/(LOSS): | | | | |
| Net realized gain/(loss) on: | | | | |
| Investments | | | 19,390,925 | |
| Net realized gain | | | 19,390,925 | |
| Long-term capital gain distributions from other investment companies | | | 36,569 | |
| Net change in unrealized appreciation/depreciation on: | | | | |
| Investments | | | (52,528,918 | ) |
| Affiliated Investments | | | (1,896,909 | ) |
| Net change in unrealized appreciation/depreciation | | | (54,425,827 | ) |
| Net Realized and Unrealized Loss on Investments | | | (34,998,333 | ) |
| Net Increase in Net Assets Resulting from Operations | | $ | 48,773,329 | |
See Notes to Financial Statements.
| Annual Report | September 30, 2020 | 102 |
RiverNorth/Oaktree High Income Fund
| Statement of Operations | For the Year Ended September 30, 2020 |
| INVESTMENT INCOME: | | | |
| Dividend income | | $ | 516,012 | |
| Interest income | | | 1,909,031 | |
| Other income | | | 26,300 | |
| Foreign taxes withheld | | | (2,542 | ) |
| Total Investment Income | | | 2,448,801 | |
| | | | | |
| EXPENSES: | | | | |
| Investment Adviser fee | | | 477,594 | |
| Accounting and administration fee | | | 124,906 | |
| Registration expenses | | | 41,236 | |
| Transfer agent expenses | | | 33,880 | |
| Audit expenses | | | 32,650 | |
| Legal expenses | | | 29,906 | |
| Compliance expense | | | 26,902 | |
| Custodian expenses | | | 14,024 | |
| 12b-1 fees - Class R Shares | | | 13,800 | |
| Printing expenses | | | 8,186 | |
| Facility loan fee | | | 5,968 | |
| Trustee expenses | | | 4,090 | |
| Insurance expenses | | | 1,023 | |
| Miscellaneous expenses | | | 8,759 | |
| Total expenses | | | 822,924 | |
| Less fees waived/reimbursed by Investment Adviser: | | | | |
| Class I Shares | | | (145,507 | ) |
| Class R Shares | | | (19,074 | ) |
| Net Expenses | | | 658,343 | |
| Net Investment Income | | | 1,790,458 | |
| | | | | |
| REALIZED AND UNREALIZED GAIN/(LOSS): | | | | |
| Net realized gain/(loss) on: | | | | |
| Investments | | | (1,530,572 | ) |
| Forward Foreign Currency Contracts | | | (476,865 | ) |
| Translation of assets and liabilities denominated in foreign currencies | | | 24,482 | |
| Net realized loss | | | (1,982,955 | ) |
| Net change in unrealized appreciation/depreciation on: | | | | |
| Investments | | | (230,595 | ) |
| Forward Foreign Currency Contracts | | | 8,655 | |
| Translation of assets and liabilities denominated in foreign currencies | | | 380 | |
| Net change in unrealized appreciation/depreciation | | | (221,560 | ) |
| Net Realized and Unrealized Loss on Investments, translation of assets and liabilities denominated in foreign currencies and forward foreign currency contracts | | | (2,204,515 | ) |
| Net Decrease in Net Assets Resulting from Operations | | $ | (414,057 | ) |
See Notes to Financial Statements.
| 103 | (888) 848-7569 | www.rivernorth.com |
RiverNorth Core Opportunity Fund
Statements of Changes in Net Assets
| | | For the
Year Ended
September 30,
2020 | | | For the
Year Ended
September 30,
2019 | |
| NET INCREASE/(DECREASE) IN NET ASSETS FROM OPERATIONS: | | | | | | | | |
| Net investment income | | $ | 1,796,728 | | | $ | 3,409,960 | |
| Net realized gain | | | 2,957,569 | | | | 1,887,614 | |
| Long-term capital gains from other investment companies | | | 1,011,327 | | | | 1,209,202 | |
| Net change in unrealized appreciation/depreciation on investments | | | (7,771,480 | ) | | | (2,628,004 | ) |
| Net increase/(decrease) in net assets resulting from operations | | | (2,005,856 | ) | | | 3,878,772 | |
| | | | | | | | | |
| DISTRIBUTIONS TO SHAREHOLDERS: | | | | | | | | |
| Class I shares | | | (2,659,147 | ) | | | (17,381,143 | ) |
| Class R shares | | | (1,527,249 | ) | | | (15,707,897 | ) |
| Net decrease in net assets from distributions to shareholders | | | (4,186,396 | ) | | | (33,089,040 | ) |
| | | | | | | | | |
| CAPITAL SHARE TRANSACTIONS: | | | | | | | | |
| Class I Shares | | | | | | | | |
| Proceeds from shares sold | | | 22,357,753 | | | | 42,934,744 | |
| Reinvestment of distributions | | | 2,231,392 | | | | 11,770,344 | |
| Cost of shares redeemed | | | (36,906,930 | ) | | | (39,179,988 | ) |
| Redemption fees(a) | | | – | | | | 1,733 | |
| Net increase/(decrease) in net assets from capital share transactions | | | (12,317,785 | ) | | | 15,526,833 | |
| Class R Shares | | | | | | | | |
| Proceeds from shares sold | | | 5,640,144 | | | | 9,464,344 | |
| Reinvestment of distributions | | | 1,460,842 | | | | 15,268,961 | |
| Cost of shares redeemed | | | (18,389,204 | ) | | | (36,835,297 | ) |
| Redemption fees(a) | | | – | | | | 184 | |
| Net decrease in net assets from capital share transactions | | | (11,288,218 | ) | | | (12,101,808 | ) |
| Net Decrease in Net Assets | | | (29,798,255 | ) | | | (25,785,243 | ) |
| | | | | | | | | |
| NET ASSETS: | | | | | | | | |
| Beginning of period/year | | $ | 107,005,520 | | | $ | 132,790,763 | |
| End of period/year | | | 77,207,265 | | | | 107,005,520 | |
See Notes to Financial Statements.
| Annual Report | September 30, 2020 | 104 |
RiverNorth Core Opportunity Fund
Statements of Changes in Net Assets
| | | For the
Year Ended
September 30,
2020 | | | For the
Year Ended
September 30,
2019 | |
| OTHER INFORMATION: | | | | | | | | |
| Share Transactions: | | | | | | | | |
| Class I Shares | | | | | | | | |
| Shares sold | | | 3,161,984 | | | | 5,361,367 | |
| Shares issued in reinvestment of distributions | | | 294,928 | | | | 1,595,372 | |
| Shares redeemed | | | (5,005,286 | ) | | | (4,705,712 | ) |
| Net increase/(decrease) from share transactions | | | (1,548,374 | ) | | | 2,251,027 | |
| | | | | | | | | |
| Class R Shares | | | | | | | | |
| Shares sold | | | 874,710 | | | | 1,202,806 | |
| Shares issued in reinvestment of distributions | | | 194,516 | | | | 2,084,044 | |
| Shares redeemed | | | (2,414,622 | ) | | | (4,453,626 | ) |
| Net decrease from share transactions | | | (1,345,396 | ) | | | (1,166,776 | ) |
| (a) | The Fund imposed a 2.00% redemption fee on shares redeemed within 90 days of purchase. The redemption fee was eliminated on March 4, 2019. |
See Notes to Financial Statements.
| 105 | (888) 848-7569 | www.rivernorth.com |
RiverNorth/DoubleLine Strategic Income Fund
Statements of Changes in Net Assets
| | | For the
Year Ended
September 30,
2020 | | | For the
Year Ended
September 30,
2019 | |
| NET INCREASE/(DECREASE) IN NET ASSETS FROM OPERATIONS: | | | | | | | | |
| Net investment income | | $ | 83,771,662 | | | $ | 96,084,073 | |
| Net realized gain/(loss) | | | 19,390,925 | | | | (50,206,791 | ) |
| Long-term capital gains from other investment companies | | | 36,569 | | | | 188,448 | |
| Net change in unrealized appreciation/depreciation on investments | | | (54,425,827 | ) | | | 96,457,160 | |
| Net increase in net assets resulting from operations | | | 48,773,329 | | | | 142,522,890 | |
| | | | | | | | | |
| DISTRIBUTIONS TO SHAREHOLDERS: | | | | | | | | |
| Class I shares | | | (79,390,062 | ) | | | (92,689,814 | ) |
| Class R shares | | | (6,188,907 | ) | | | (8,384,063 | ) |
| From tax return of capital | | | | | | | | |
| Class I shares | | | (2,716,414 | ) | | | – | |
| Class R shares | | | (204,602 | ) | | | – | |
| Net decrease in net assets from distributions to shareholders | | | (88,499,985 | ) | | | (101,073,877 | ) |
| | | | | | | | | |
| CAPITAL SHARE TRANSACTIONS: | | | | | | | | |
| Class I Shares | | | | | | | | |
| Proceeds from shares sold | | | 611,196,220 | | | | 860,449,587 | |
| Reinvestment of distributions | | | 68,779,135 | | | | 73,340,573 | |
| Cost of shares redeemed | | | (814,875,369 | ) | | | (828,839,766 | ) |
| Redemption fees(a) | | | – | | | | 67,075 | |
| Net increase/(decrease) in net assets from capital share transactions | | | (134,900,014 | ) | | | 105,017,469 | |
| Class R Shares | | | | | | | | |
| Proceeds from shares sold | | | 40,377,316 | | | | 53,658,489 | |
| Reinvestment of distributions | | | 6,146,105 | | | | 8,047,792 | |
| Cost of shares redeemed | | | (80,913,738 | ) | | | (63,914,017 | ) |
| Redemption fees(a) | | | – | | | | 19,243 | |
| Net decrease in net assets from capital share transactions | | | (34,390,317 | ) | | | (2,188,493 | ) |
| Net Increase/(Decrease) in Net Assets | | | (209,016,987 | ) | | | 144,277,989 | |
| | | | | | | | | |
| NET ASSETS: | | | | | | | | |
| Beginning of period/year | | $ | 2,025,244,761 | | | $ | 1,880,966,772 | |
| End of period/year | | | 1,816,227,774 | | | | 2,025,244,761 | |
See Notes to Financial Statements.
| Annual Report | September 30, 2020 | 106 |
RiverNorth/DoubleLine Strategic Income Fund
Statements of Changes in Net Assets
| | | For the
Year Ended
September 30,
2020 | | | For the
Year Ended
September 30,
2019 | |
| OTHER INFORMATION: | | | | | | | | |
| Share Transactions: | | | | | | | | |
| Class I Shares | | | | | | | | |
| Shares sold | | | 60,904,804 | | | | 85,244,983 | |
| Shares issued in reinvestment of distributions | | | 6,809,776 | | | | 7,258,179 | |
| Shares redeemed | | | (82,235,772 | ) | | | (82,788,383 | ) |
| Net increase/(decrease) from share transactions | | | (14,521,192 | ) | | | 9,714,779 | |
| | | | | | | | | |
| Class R Shares | | | | | | | | |
| Shares sold | | | 3,986,283 | | | | 5,301,831 | |
| Shares issued in reinvestment of distributions | | | 606,703 | | | | 795,933 | |
| Shares redeemed | | | (8,089,175 | ) | | | (6,334,432 | ) |
| Net decrease from share transactions | | | (3,496,189 | ) | | | (236,668 | ) |
| (a) | The Fund imposed a 2.00% redemption fee on shares redeemed within 90 days of purchase. The redemption fee was eliminated on March 4, 2019. |
See Notes to Financial Statements.
| 107 | (888) 848-7569 | www.rivernorth.com |
RiverNorth/Oaktree High Income Fund
Statements of Changes in Net Assets
| | | For the
Year Ended
September 30,
2020 | | | For the
Year Ended
September 30,
2019 | |
| NET INCREASE/(DECREASE) IN NET ASSETS FROM OPERATIONS: | | | | | | | | |
| Net investment income | | $ | 1,790,458 | | | $ | 2,129,809 | |
| Net realized gain/(loss) | | | (1,982,955 | ) | | | 210,728 | |
| Long-term capital gain distributions from other investment companies | | | – | | | | 2,473 | |
| Net change in unrealized appreciation/depreciation | | | (221,560 | ) | | | (23,037 | ) |
| Net increase/(decrease) in net assets resulting from operations | | | (414,057 | ) | | | 2,319,973 | |
| | | | | | | | | |
| DISTRIBUTIONS TO SHAREHOLDERS: | | | | | | | | |
| Class I Shares | | | (1,711,826 | ) | | | (2,340,774 | ) |
| Class R Shares | | | (212,395 | ) | | | (295,137 | ) |
| From tax return of capital | | | | | | | | |
| Class I Shares | | | (362,852 | ) | | | – | |
| Class R Shares | | | (44,662 | ) | | | – | |
| Net decrease in net assets from distributions to shareholders | | | (2,331,735 | ) | | | (2,635,911 | ) |
| | | | | | | | | |
| CAPITAL SHARE TRANSACTIONS: | | | | | | | | |
| Class I Shares | | | | | | | | |
| Proceeds from shares sold | | | 1,466,082 | | | | 1,386,595 | |
| Reinvestment of distributions | | | 2,064,745 | | | | 2,297,811 | |
| Cost of shares redeemed | | | (6,011,805 | ) | | | (7,975,638 | ) |
| Redemption fees(a) | | | – | | | | 16,396 | |
| Net decrease in net assets from capital share transactions | | | (2,480,978 | ) | | | (4,274,836 | ) |
| | | | | | | | | |
| Class R Shares | | | | | | | | |
| Proceeds from shares sold | | | 602,945 | | | | 687,413 | |
| Reinvestment of distributions | | | 249,412 | | | | 287,836 | |
| Cost of shares redeemed | | | (1,505,591 | ) | | | (1,755,228 | ) |
| Redemption fees(a) | | | – | | | | 129 | |
| Net decrease in net assets from capital share transactions | | | (653,234 | ) | | | (779,850 | ) |
| | | | | | | | | |
| Net Decrease in Net Assets | | | (5,880,004 | ) | | | (5,370,624 | ) |
| | | | | | | | | |
| NET ASSETS: | | | | | | | | |
| Beginning of period/year | | $ | 51,243,328 | | | $ | 56,613,952 | |
| End of period/year | | | 45,363,324 | | | | 51,243,328 | |
See Notes to Financial Statements.
| Annual Report | September 30, 2020 | 108 |
RiverNorth/Oaktree High Income Fund
Statements of Changes in Net Assets
| | | For the
Year Ended
September 30,
2020 | | | For the
Year Ended
September 30,
2019 | |
| OTHER INFORMATION: | | | | | | | | |
| Share Transactions: | | | | | | | | |
| Class I Shares | | | | | | | | |
| Shares sold | | | 174,046 | | | | 146,904 | |
| Shares issued in reinvestment of distributions | | | 226,317 | | | | 244,757 | |
| Shares redeemed | | | (703,397 | ) | | | (847,134 | ) |
| Net decrease from share transactions | | | (303,034 | ) | | | (455,473 | ) |
| | | | | | | | | |
| Class R Shares | | | | | | | | |
| Shares sold | | | 65,278 | | | | 73,019 | |
| Shares issued in reinvestment of distributions | | | 27,369 | | | | 30,715 | |
| Shares redeemed | | | (165,647 | ) | | | (186,885 | ) |
| Net decrease from share transactions | | | (73,000 | ) | | | (83,151 | ) |
| (a) | The Fund imposed a 2.00% redemption fee on shares redeemed within 90 days of purchase. The redemption fee was eliminated on March 4, 2019. |
See Notes to Financial Statements.
| 109 | (888) 848-7569 | www.rivernorth.com |
Intentionally Left Blank
| RiverNorth Core Opportunity Fund | Class I |
Financial Highlights
| Net asset value - beginning of period |
| Income/(Loss) from investment operations: |
| Net investment income(a) |
| Net realized and unrealized gain/(loss) on investments |
| Total income/(loss) from investment operations |
| Less distributions: |
| From net investment income |
| From net realized gain on investments |
| From tax return of capital |
| Total distributions |
| Paid-in capital from redemption fees(a) |
| Net increase/(decrease) in net asset value |
| Net asset value - end of period |
| Total Return(d) |
| Ratios/Supplemental Data: |
| Net assets, end of period (in thousands) |
| Ratios to Average Net Assets (including interest expense): |
| |
| Ratio of expenses to average net assets excluding fee waivers and reimbursements(e) |
| |
| Ratio of expenses to average net assets including fee waivers and reimbursements(e) |
| Ratio of net investment income to average net assets excluding fee waivers and reimbursements(e) |
| Ratio of net investment income to average net assets including fee waivers and reimbursements(e) |
| Ratios to Average Net Assets (excluding interest expense): |
| |
| Ratio of expenses to average net assets excluding fee waivers and reimbursements(e) |
| |
| Ratio of expenses to average net assets including fee waivers and reimbursements(e) |
| Ratio of net investment income to average net assets excluding fee waivers and reimbursements(e) |
| Ratio of net investment income to average net assets including fee waivers and reimbursements(e) |
| Portfolio turnover rate |
See Notes to Financial Statements.
| 111 | (888) 848-7569 | www.rivernorth.com |
For a share outstanding throughout the periods presented
For the
Year Ended
September 30, 2020 | | For the
Year Ended September 30, 2019 | | For the Year Ended September 30, 2018 | | For the Year Ended September 30, 2017 | | For the Year Ended September 30, 2016 |
| $ | 8.05 | | | $ | 10.88 | | | $ | 12.37 | | | $ | 11.33 | | | $ | 10.74 | |
| | | | | | | | | | | | | | | | | | | |
| | 0.16 | | | | 0.24 | | | | 0.27 | | | | 0.17 | | | | 0.23 | |
| | (0.41 | ) | | | (0.25 | )(b) | | | 0.42 | | | | 1.45 | | | | 1.33 | |
| | (0.25 | ) | | | (0.01 | ) | | | 0.69 | | | | 1.62 | | | | 1.56 | |
| | | | | | | | | | | | | | | | | | | |
| | (0.19 | ) | | | (0.18 | ) | | | (0.40 | ) | | | (0.30 | ) | | | (0.42 | ) |
| | (0.18 | ) | | | (2.64 | ) | | | (1.78 | ) | | | (0.28 | ) | | | (0.45 | ) |
| | – | | | | – | | | | – | | | | – | | | | (0.10 | ) |
| | (0.37 | ) | | | (2.82 | ) | | | (2.18 | ) | | | (0.58 | ) | | | (0.97 | ) |
| | – | | | | 0.00 | (c) | | | 0.00 | (c) | | | 0.00 | (c) | | | 0.00 | (c) |
| | (0.62 | ) | | | (2.83 | ) | | | (1.49 | ) | | | 1.04 | | | | 0.59 | |
| $ | 7.43 | | | $ | 8.05 | | | $ | 10.88 | | | $ | 12.37 | | | $ | 11.33 | |
| | (3.00 | %) | | | 3.51 | % | | | 5.92 | % | | | 14.71 | % | | | 15.35 | % |
| | | | | | | | | | | | | | | | | | | |
| $ | 49,994 | | | $ | 66,662 | | | $ | 65,592 | | | $ | 109,627 | | | $ | 201,712 | |
| | | | | | | | | | | | | | | | | | | |
| | N/A | | | | 1.22 | % | | | N/A | | | | 1.12 | % | | | N/A | |
| | N/A | | | | 1.22 | % | | | N/A | | | | 1.12 | % | | | N/A | |
| | N/A | | | | 2.88 | % | | | N/A | | | | 1.45 | % | | | N/A | |
| | N/A | | | | 2.88 | % | | | N/A | | | | 1.45 | % | | | N/A | |
| | | | | | | | | | | | | | | | | | | |
| | 1.29 | % | | | 1.22 | % | | | 1.17 | % | | | 1.12 | % | | | 1.11 | % |
| | 1.29 | % | | | 1.22 | % | | | 1.17 | % | | | 1.12 | % | | | 1.11 | % |
| | 2.10 | % | | | 2.88 | % | | | 2.37 | % | | | 1.45 | % | | | 2.11 | % |
| | | | | | | | | | | | | | | | | | | |
| | 2.10 | % | | | 2.88 | % | | | 2.37 | % | | | 1.45 | % | | | 2.11 | % |
| | 110 | % | | | 36 | % | | | 58 | %(f) | | | 39 | %(f) | | | 19 | % |
| Annual Report | September 30, 2020 | 112 |
| RiverNorth Core Opportunity Fund | Class I |
| Financial Highlights | For a share outstanding throughout the periods presented |
| (a) | Based on average shares outstanding during the period. |
| (b) | Realized and unrealized gains and losses per share in this caption are balancing amounts necessary to reconcile the change in net asset value per share for the period, and may not reconcile with the aggregate gains and losses in the Statement of Operations due to share transactions for the period. |
| (c) | Less than $0.005 per share. |
| (d) | Total return in the above table represents the rate that the investor would have earned or lost on an investment in the Fund, assuming reinvestment of dividends. |
| (e) | The ratios exclude the impact of expenses of the underlying funds in which the Fund invests as represented in the Schedule of Investments. |
| (f) | Portfolio turnover does not include redemptions in-kind. |
See Notes to Financial Statements.
| 113 | (888) 848-7569 | www.rivernorth.com |
Intentionally Left Blank
| RiverNorth Core Opportunity Fund | Class R |
Financial Highlights
| Net asset value - beginning of period |
| Income/(Loss) from investment operations: |
| Net investment income(a) |
| Net realized and unrealized gain/(loss) on investments |
| Total income/(loss) from investment operations |
| Less distributions: |
| From net investment income |
| From net realized gain on investments |
| From tax return of capital |
| Total distributions |
| Paid-in capital from redemption fees(a) |
| Net increase/ (decrease) in net asset value |
| Net asset value - end of period |
| Total Return(d) |
| Ratios/Supplemental Data: |
| Net assets, end of period (in thousands) |
| Ratios to Average Net Assets (including interest expense): |
| Ratio of expenses to average net assets excluding fee waivers and reimbursements(e) |
| Ratio of expenses to average net assets including fee waivers and reimbursements(e) |
| Ratio of net investment income to average net assets excluding fee waivers and reimbursements(e) |
| Ratio of net investment income to average net assets including fee waivers and reimbursements(e) |
| Ratios to Average Net Assets (excluding interest expense): |
| Ratio of expenses to average net assets excluding fee waivers and reimbursements(e) |
| Ratio of expenses to average net assets including fee waivers and reimbursements(e) |
| Ratio of net investment income to average net assets excluding fee waivers and reimbursements(e) |
| Ratio of net investment income to average net assets including fee waivers and reimbursements(e) |
| Portfolio turnover rate |
See Notes to Financial Statements.
| 115 | (888) 848-7569 | www.rivernorth.com |
For a share outstanding throughout the periods presented
For the Year Ended September 30, 2020 | | For the Year Ended September 30, 2019 | | For the Year Ended September 30, 2018 | | For the Year Ended September 30, 2017 | | For the Year Ended September 30, 2016 |
| $ | 8.06 | | | $ | 10.89 | | | $ | 12.37 | | | $ | 11.32 | | | $ | 10.74 | |
| | | | | | | | | | | | | | | | | | | |
| | 0.15 | | | | 0.22 | | | | 0.23 | | | | 0.16 | | | | 0.20 | |
| | (0.42 | ) | | | (0.26 | )(b) | | | 0.44 | | | | 1.44 | | | | 1.32 | |
| | (0.27 | ) | | | (0.04 | ) | | | 0.67 | | | | 1.60 | | | | 1.52 | |
| | | | | | | | | | | | | | | | | | | |
| | (0.18 | ) | | | (0.17 | ) | | | (0.37 | ) | | | (0.27 | ) | | | (0.40 | ) |
| | (0.17 | ) | | | (2.62 | ) | | | (1.78 | ) | | | (0.28 | ) | | | (0.45 | ) |
| | – | | | | – | | | | – | | | | – | | | | (0.09 | ) |
| | (0.35 | ) | | | (2.79 | ) | | | (2.15 | ) | | | (0.55 | ) | | | (0.94 | ) |
| | – | | | | 0.00 | (c) | | | 0.00 | (c) | | | 0.00 | (c) | | | 0.00 | (c) |
| | (0.62 | ) | | | (2.83 | ) | | | (1.48 | ) | | | 1.05 | | | | 0.58 | |
| $ | 7.44 | | | $ | 8.06 | | | $ | 10.89 | | | $ | 12.37 | | | $ | 11.32 | |
| | (3.24 | %) | | | 3.23 | % | | | 5.70 | % | | | 14.51 | % | | | 14.98 | % |
| | | | | | | | | | | | | | | | | | | |
| $ | 27,213 | | | $ | 40,344 | | | $ | 67,199 | | | $ | 213,737 | | | $ | 568,198 | |
| | | | | | | | | | | | | | | | | | | |
| | N/A | | | | 1.48 | % | | | N/A | | | | 1.37 | % | | | N/A | |
| | N/A | | | | 1.48 | % | | | N/A | | | | 1.37 | % | | | N/A | |
| | N/A | | | | 2.62 | % | | | N/A | | | | 1.38 | % | | | N/A | |
| | N/A | | | | 2.62 | % | | | N/A | | | | 1.38 | % | | | N/A | |
| | | | | | | | | | | | | | | | | | | |
| | 1.54 | % | | | 1.48 | % | | | 1.41 | % | | | 1.37 | % | | | 1.36 | % |
| | 1.54 | % | | | 1.48 | % | | | 1.41 | % | | | 1.37 | % | | | 1.36 | % |
| | | | | | | | | | | | | | | | | | | |
| | 1.93 | % | | | 2.62 | % | | | 2.02 | % | | | 1.38 | % | | | 1.90 | % |
| | | | | | | | | | | | | | | | | | | |
| | 1.93 | % | | | 2.62 | % | | | 2.02 | % | | | 1.38 | % | | | 1.90 | % |
| | 110 | % | | | 36 | % | | | 58 | %(f) | | | 39 | %(f) | | | 19 | % |
| Annual Report | September 30, 2020 | 116 |
| RiverNorth Core Opportunity Fund | Class R |
| Financial Highlights | For a share outstanding throughout the periods presented |
| (a) | Based on average shares outstanding during the period. |
| (b) | Realized and unrealized gains and losses per share in this caption are balancing amounts necessary to reconcile the change in net asset value per share for the period, and may not reconcile with the aggregate gains and losses in the Statement of Operations due to share transactions for the period. |
| (c) | Less than $0.005 per share. |
| (d) | Total return in the above table represents the rate that the investor would have earned or lost on an investment in the Fund, assuming reinvestment of dividends. |
| (e) | The ratios exclude the impact of expenses of the underlying funds in which the Fund invests as represented in the Schedule of Investments. |
| (f) | Portfolio turnover does not include redemptions in-kind. |
See Notes to Financial Statements.
| 117 | (888) 848-7569 | www.rivernorth.com |
Intentionally Left Blank
| RiverNorth/DoubleLine Strategic Income Fund | Class I |
Financial Highlights
| Net asset value - beginning of period |
| Income from investment operations: |
| Net investment income(a) |
| Net realized and unrealized gain/(loss) on investments |
| Total income from investment operations |
| |
| Less distributions: |
| From net investment income |
| From net realized gain on investments |
| From tax return of capital |
| Total distributions |
| Paid-in capital from redemption fees(a) |
| Net increase/(decrease) in net asset value |
| Net asset value - end of period |
| |
| Total Return(c) |
| |
| Ratios/Supplemental Data: |
| Net assets, end of period (in thousands) |
| Ratios to Average Net Assets (including interest expense): |
| Ratio of expenses to average net assets excluding fee waivers and reimbursements(d) |
| Ratio of expenses to average net assets including fee waivers and reimbursements(d) |
| |
| Ratio of net investment income to average net assets excluding fee waivers and reimbursements(d) |
| |
| Ratio of net investment income to average net assets including fee waivers and reimbursements(d) |
| Ratios to Average Net Assets (excluding interest expense): |
| Ratio of expenses to average net assets excluding fee waivers and reimbursements(d) |
| Ratio of expenses to average net assets including fee waivers and reimbursements(d) |
| |
| Ratio of net investment income to average net assets excluding fee waivers and reimbursements(d) |
| |
| Ratio of net investment income to average net assets including fee waivers and reimbursements(d) |
| Portfolio turnover rate |
See Notes to Financial Statements.
| 119 | (888) 848-7569 | www.rivernorth.com |
For a share outstanding throughout the periods presented
For the
Year Ended
September 30,
2020 | | | For the
Year Ended
September 30,
2019 | | | For the
Year Ended
September 30,
2018 | | | For the
Year Ended
September 30,
2017 | | | For the
Year Ended
September 30,
2016 | |
| $ | 10.33 | | | $ | 10.08 | | | $ | 10.61 | | | $ | 10.61 | | | $ | 10.37 | |
| | | | | | | | | | | | | | | | | | | |
| | 0.45 | | | | 0.52 | | | | 0.47 | | | | 0.40 | | | | 0.51 | |
| | (0.10 | ) | | | 0.28 | | | | (0.44 | ) | | | 0.08 | | | | 0.39 | |
| | 0.35 | | | | 0.80 | | | | 0.03 | | | | 0.48 | | | | 0.90 | |
| | | | | | | | | | | | | | | | | | | |
| | | | | | | | | | | | | | | | | | | |
| | (0.46 | ) | | | (0.55 | ) | | | (0.51 | ) | | | (0.45 | ) | | | (0.64 | ) |
| | – | | | | – | | | | (0.04 | ) | | | (0.03 | ) | | | – | |
| | (0.02 | ) | | | – | | | | (0.01 | ) | | | – | | | | (0.02 | ) |
| | (0.48 | ) | | | (0.55 | ) | | | (0.56 | ) | | | (0.48 | ) | | | (0.66 | ) |
| | – | | | | 0.00 | (b) | | | 0.00 | (b) | | | 0.00 | (b) | | | 0.00 | (b) |
| | (0.13 | ) | | | 0.25 | | | | (0.53 | ) | | | – | | | | 0.24 | |
| $ | 10.20 | | | $ | 10.33 | | | $ | 10.08 | | | $ | 10.61 | | | $ | 10.61 | |
| | | | | | | | | | | | | | | | | | | |
| | 3.51 | % | | | 8.21 | % | | | 0.33 | % | | | 4.67 | % | | | 9.00 | % |
| | | | | | | | | | | | | | | | | | | |
| | | | | | | | | | | | | | | | | | | |
| $ | 1,686,872 | | | $ | 1,858,103 | | | $ | 1,715,495 | | | $ | 2,024,142 | | | $ | 1,822,874 | |
| | | | | | | | | | | | | | | | | | | |
| | N/A | | | | 0.86 | % | | | N/A | | | | N/A | | | | N/A | |
| | N/A | | | | 0.86 | % | | | N/A | | | | N/A | | | | N/A | |
| | | | | | | | | | | | | | | | | | | |
| | N/A | | | | 5.13 | % | | | N/A | | | | N/A | | | | N/A | |
| | | | | | | | | | | | | | | | | | | |
| | N/A | | | | 5.13 | % | | | N/A | | | | N/A | | | | N/A | |
| | | | | | | | | | | | | | | | | | | |
| | 0.87 | % | | | 0.86 | % | | | 0.86 | % | | | 0.85 | % | | | 0.86 | % |
| | 0.87 | % | | | 0.86 | % | | | 0.86 | % | | | 0.85 | % | | | 0.86 | % |
| | | | | | | | | | | | | | | | | | | |
| | 4.42 | % | | | 5.13 | % | | | 4.60 | % | | | 3.80 | % | | | 4.92 | % |
| | | | | | | | | | | | | | | | | | | |
| | 4.42 | % | | | 5.13 | % | | | 4.60 | % | | | 3.80 | % | | | 4.92 | % |
| | 81 | % | | | 60 | % | | | 37 | % | | | 50 | % | | | 36 | % |
| Annual Report | September 30, 2020 | 120 |
| RiverNorth/DoubleLine Strategic Income Fund | Class I |
| Financial Highlights | For a share outstanding throughout the periods presented |
| (a) | Based on average shares outstanding during the period. |
| (b) | Less than $0.005 per share. |
| (c) | Total return in the above table represents the rate that the investor would have earned or lost on an investment in the Fund, assuming reinvestment of dividends. |
| (d) | The ratios exclude the impact of expenses of the underlying funds in which the Fund invests as represented in the Schedule of Investments. |
See Notes to Financial Statements.
| 121 | (888) 848-7569 | www.rivernorth.com |
Intentionally Left Blank
| RiverNorth/DoubleLine Strategic Income Fund | Class R |
Financial Highlights
| Net asset value - beginning of period |
| Income from investment operations: |
| Net investment income(a) |
| Net realized and unrealized gain/(loss) on investments |
| Total income from investment operations |
| |
| Less distributions: |
| From net investment income |
| From net realized gain on investments |
| From tax return of capital |
| Total distributions |
| Paid-in capital from redemption fees(a) |
| Net increase/(decrease) in net asset value |
| Net asset value - end of period |
| |
| Total Return(c) |
| |
| Ratios/Supplemental Data: |
| Net assets, end of period (in thousands) |
| Ratios to Average Net Assets (including interest expense): |
| Ratio of expenses to average net assets excluding fee waivers and reimbursements(d) |
| Ratio of expenses to average net assets including fee waivers and reimbursements(d) |
| |
| Ratio of net investment income to average net assets excluding fee waivers and reimbursements(d) |
| |
| Ratio of net investment income to average net assets including fee waivers and reimbursements(d) |
| Ratios to Average Net Assets (excluding interest expense): |
| Ratio of expenses to average net assets excluding fee waivers and reimbursements(d) |
| Ratio of expenses to average net assets including fee waivers and reimbursements(d) |
| |
| Ratio of net investment income to average net assets excluding fee waivers and reimbursements(d) |
| |
| Ratio of net investment income to average net assets including fee waivers and reimbursements(d) |
| Portfolio turnover rate |
See Notes to Financial Statements.
| 123 | (888) 848-7569 | www.rivernorth.com |
For a share outstanding throughout the periods presented
For the
Year Ended
September 30,
2020 | | | For the
Year Ended
September 30,
2019 | | | For the
Year Ended
September 30,
2018 | | | For the
Year Ended
September 30,
2017 | | | For the
Year Ended
September 30,
2016 | |
| $ | 10.35 | | | $ | 10.09 | | | $ | 10.62 | | | $ | 10.62 | | | $ | 10.39 | |
| | | | | | | | | | | | | | | | | | | |
| | 0.43 | | | | 0.50 | | | | 0.45 | | | | 0.38 | | | | 0.49 | |
| | (0.10 | ) | | | 0.28 | | | | (0.45 | ) | | | 0.08 | | | | 0.37 | |
| | 0.33 | | | | 0.78 | | | | – | | | | 0.46 | | | | 0.86 | |
| | | | | | | | | | | | | | | | | | | |
| | | | | | | | | | | | | | | | | | | |
| | (0.44 | ) | | | (0.52 | ) | | | (0.48 | ) | | | (0.43 | ) | | | (0.61 | ) |
| | – | | | | – | | | | (0.04 | ) | | | (0.03 | ) | | | – | |
| | (0.02 | ) | | | – | | | | (0.01 | ) | | | – | | | | (0.02 | ) |
| | (0.46 | ) | | | (0.52 | ) | | | (0.53 | ) | | | (0.46 | ) | | | (0.63 | ) |
| | – | | | | 0.00 | (b) | | | 0.00 | (b) | | | 0.00 | (b) | | | 0.00 | (b) |
| | (0.13 | ) | | | 0.26 | | | | (0.53 | ) | | | – | | | | 0.23 | |
| $ | 10.22 | | | $ | 10.35 | | | $ | 10.09 | | | $ | 10.62 | | | $ | 10.62 | |
| | | | | | | | | | | | | | | | | | | |
| | 3.24 | % | | | 8.03 | % | | | 0.07 | % | | | 4.40 | % | | | 8.62 | % |
| | | | | | | | | | | | | | | | | | | |
| | | | | | | | | | | | | | | | | | | |
| $ | 129,355 | | | $ | 167,141 | | | $ | 165,472 | | | $ | 208,143 | | | $ | 230,953 | |
| | | | | | | | | | | | | | | | | | | |
| | N/A | | | | 1.11 | % | | | N/A | | | | N/A | | | | N/A | |
| | N/A | | | | 1.11 | % | | | N/A | | | | N/A | | | | N/A | |
| | | | | | | | | | | | | | | | | | | |
| | N/A | | | | 4.90 | % | | | N/A | | | | N/A | | | | N/A | |
| | | | | | | | | | | | | | | | | | | |
| | N/A | | | | 4.90 | % | | | N/A | | | | N/A | | | | N/A | |
| | | | | | | | | | | | | | | | | | | |
| | 1.12 | % | | | 1.11 | % | | | 1.11 | % | | | 1.10 | % | | | 1.11 | % |
| | 1.12 | % | | | 1.11 | % | | | 1.11 | % | | | 1.10 | % | | | 1.11 | % |
| | | | | | | | | | | | | | | | | | | |
| | 4.18 | % | | | 4.90 | % | | | 4.34 | % | | | 3.56 | % | | | 4.67 | % |
| | | | | | | | | | | | | | | | | | | |
| | 4.18 | % | | | 4.90 | % | | | 4.34 | % | | | 3.56 | % | | | 4.67 | % |
| | 81 | % | | | 60 | % | | | 37 | % | | | 50 | % | | | 36 | % |
| Annual Report | September 30, 2020 | 124 |
| RiverNorth/DoubleLine Strategic Income Fund | Class R |
| Financial Highlights | For a share outstanding throughout the periods presented |
| (a) | Based on average shares outstanding during the period. |
| (b) | Less than $0.005 per share. |
| (c) | Total return in the above table represents the rate that the investor would have earned or lost on an investment in the Fund, assuming reinvestment of dividends. |
| (d) | The ratios exclude the impact of expenses of the underlying funds in which the Fund invests as represented in the Schedule of Investments. |
See Notes to Financial Statements.
| 125 | (888) 848-7569 | www.rivernorth.com |
Intentionally Left Blank
| RiverNorth/Oaktree High Income Fund | Class I |
Financial Highlights
| Net asset value - beginning of period |
| Income/(loss) from investment operations: |
| Net investment income(a) |
| Net realized and unrealized gain/(loss) on investments |
| Total income/(loss) from investment operations |
| |
| Less distributions: |
| From net investment income |
| From tax return of capital |
| Total distributions |
| Paid-in capital from redemption fees(a) |
| Net increase/(decrease) in net asset value |
| Net asset value - end of period |
| |
| Total Return(c) |
| |
| Supplemental Data: |
| Net assets, end of period (in thousands) |
| Ratios to Average Net Assets (including interest expense) |
| Ratio of expenses to average net assets excluding fee waivers and reimbursements(d) |
| Ratio of expenses to average net assets including fee waivers and reimbursements(d) |
| |
| Ratio of net investment income to average net assets excluding fee waivers and reimbursements(d) |
| |
| Ratio of net investment income to average net assets including fee waivers and reimbursements(d) |
| |
| Ratios to Average Net Assets (excluding interest expense) |
| Ratio of expenses to average net assets excluding fee waivers and reimbursements(d) |
| Ratio of expenses to average net assets including fee waivers and reimbursements(d) |
| |
| Ratio of net investment income to average net assets excluding fee waivers and reimbursements(d) |
| |
| Ratio of net investment income to average net assets including fee waivers and reimbursements(d) |
| Portfolio turnover rate |
See Notes to Financial Statements.
| 127 | (888) 848-7569 | www.rivernorth.com |
For a share outstanding throughout the periods presented
For the
Year Ended
September 30, 2020 | | | For the
Year Ended
September 30, 2019 | | | For the
Year Ended
September 30, 2018 | | | For the
Year Ended
September 30, 2017 | | | For the
Year Ended
September 30, 2016 | |
| $ | 9.55 | | | $ | 9.58 | | | $ | 9.73 | | | $ | 9.48 | | | $ | 9.18 | |
| | | | | | | | | | | | | | | | | | | |
| | 0.34 | | | | 0.38 | | | | 0.39 | | | | 0.35 | | | | 0.44 | |
| | (0.35 | ) | | | 0.07 | | | | (0.18 | ) | | | 0.31 | | | | 0.44 | |
| | (0.01 | ) | | | 0.45 | | | | 0.21 | | | | 0.66 | | | | 0.88 | |
| | | | | | | | | | | | | | | | | | | |
| | | | | | | | | | | | | | | | | | | |
| | (0.37 | ) | | | (0.48 | ) | | | (0.24 | ) | | | (0.38 | ) | | | (0.55 | ) |
| | (0.08 | ) | | | – | | | | (0.12 | ) | | | (0.03 | ) | | | (0.03 | ) |
| | (0.45 | ) | | | (0.48 | ) | | | (0.36 | ) | | | (0.41 | ) | | | (0.58 | ) |
| | – | | | | 0.00 | (b) | | | 0.00 | (b) | | | 0.00 | (b) | | | 0.00 | (b) |
| | (0.46 | ) | | | (0.03 | ) | | | (0.15 | ) | | | 0.25 | | | | 0.30 | |
| $ | 9.09 | | | $ | 9.55 | | | $ | 9.58 | | | $ | 9.73 | | | $ | 9.48 | |
| | | | | | | | | | | | | | | | | | | |
| | (0.02 | %) | | | 4.85 | % | | | 2.22 | % | | | 7.11 | % | | | 10.09 | % |
| | | | | | | | | | | | | | | | | | | |
| $ | 40,375 | | | $ | 45,306 | | | $ | 49,856 | | | $ | 63,842 | | | $ | 73,580 | |
| | | | | | | | | | | | | | | | | | | |
| | N/A | | | | 1.58 | % | | | 1.54 | % | | | 1.35 | % | | | 1.34 | % |
| | N/A | | | | 1.36 | % | | | 1.36 | % | | | 1.35 | % | | | 1.34 | % |
| | | | | | | | | | | | | | | | | | | |
| �� | N/A | | | | 3.83 | % | | | 3.84 | % | | | 3.59 | % | | | 4.86 | % |
| | | | | | | | | | | | | | | | | | | |
| | N/A | | | | 4.05 | % | | | 4.02 | % | | | 3.59 | % | | | 4.86 | % |
| | | | | | | | | | | | | | | | | | | |
| | | | | | | | | | | | | | | | | | | |
| | 1.69 | % | | | 1.57 | % | | | 1.53 | % | | | 1.35 | % | | | 1.34 | % |
| | 1.35 | % | | | 1.35 | % | | | 1.35 | % | | | 1.35 | % | | | 1.34 | % |
| | | | | | | | | | | | | | | | | | | |
| | 3.43 | % | | | 3.84 | % | | | 3.83 | % | | | 3.59 | % | | | 4.86 | % |
| | | | | | | | | | | | | | | | | | | |
| | 3.78 | % | | | 4.06 | % | | | 4.01 | % | | | 3.59 | % | | | 4.86 | % |
| | 80 | % | | | 52 | % | | | 76 | % | | | 121 | % | | | 40 | % |
| Annual Report | September 30, 2020 | 128 |
| RiverNorth/Oaktree High Income Fund | Class I |
| Financial Highlights | For a share outstanding throughout the periods presented |
| (a) | Based on average shares outstanding during the period. |
| (b) | Less than $0.005 per share. |
| (c) | Total return in the above table represents the rate that the investor would have earned or lost on an investment in the Fund, assuming reinvestment of dividends. |
| (d) | The ratios exclude the impact of expenses of the underlying funds in which the Fund invests as represented in the Schedule of Investments. |
See Notes to Financial Statements.
| 129 | (888) 848-7569 | www.rivernorth.com |
Intentionally Left Blank
| RiverNorth/Oaktree High Income Fund | Class R |
Financial Highlights
| Net asset value - beginning of period |
| Income/(loss) from investment operations: |
| Net investment income(a) |
| Net realized and unrealized gain/(loss) on investments |
| Total income/(loss) from investment operations |
| |
| Less distributions: |
| From net investment income |
| From tax return of capital |
| Total distributions |
| Paid-in capital from redemption fees(a) |
| Net increase/(decrease) in net asset value |
| Net asset value - end of period |
| |
| Total Return(c) |
| |
| Supplemental Data: |
| Net assets, end of period (in thousands) |
| Ratios to Average Net Assets (including interest expense) |
| Ratio of expenses to average net assets excluding fee waivers and reimbursements(d) |
| Ratio of expenses to average net assets including fee waivers and reimbursements(d) |
| |
| Ratio of net investment income to average net assets excluding fee waivers and reimbursements(d) |
| |
| Ratio of net investment income to average net assets including fee waivers and reimbursements(d) |
| |
| Ratios to Average Net Assets (excluding interest expense) |
| Ratio of expenses to average net assets excluding fee waivers and reimbursements(d) |
| Ratio of expenses to average net assets including fee waivers and reimbursements(d) |
| |
| Ratio of net investment income to average net assets excluding fee waivers and reimbursements(d) |
| |
| Ratio of net investment income to average net assets including fee waivers and reimbursements(d) |
| Portfolio turnover rate |
See Notes to Financial Statements.
| 131 | (888) 848-7569 | www.rivernorth.com |
For a share outstanding throughout the periods presented
For the Year Ended September 30, 2020 | | | For the Year Ended September 30, 2019 | | | For the Year Ended September 30, 2018 | | | For the Year Ended September 30, 2017 | | | For the Year Ended September 30, 2016 | |
| $ | 9.54 | | | $ | 9.58 | | | $ | 9.72 | | | $ | 9.47 | | | $ | 9.17 | |
| | | | | | | | | | | | | | | | | | | |
| | 0.32 | | | | 0.36 | | | | 0.36 | | | | 0.32 | | | | 0.43 | |
| | (0.36 | ) | | | 0.05 | | | | (0.16 | ) | | | 0.32 | | | | 0.43 | |
| | (0.04 | ) | | | 0.41 | | | | 0.20 | | | | 0.64 | | | | 0.86 | |
| | | | | | | | | | | | | | | | | | | |
| | | | | | | | | | | | | | | | | �� | | |
| | (0.35 | ) | | | (0.45 | ) | | | (0.23 | ) | | | (0.36 | ) | | | (0.54 | ) |
| | (0.07 | ) | | | – | | | | (0.11 | ) | | | (0.03 | ) | | | (0.02 | ) |
| | (0.42 | ) | | | (0.45 | ) | | | (0.34 | ) | | | (0.39 | ) | | | (0.56 | ) |
| | – | | | | 0.00 | (b) | | | 0.00 | (b) | | | 0.00 | (b) | | | 0.00 | (b) |
| | (0.46 | ) | | | (0.04 | ) | | | (0.14 | ) | | | 0.25 | | | | 0.30 | |
| $ | 9.08 | | | $ | 9.54 | | | $ | 9.58 | | | $ | 9.72 | | | $ | 9.47 | |
| | | | | | | | | | | | | | | | | | | |
| | (0.27 | %) | | | 4.48 | % | | | 2.07 | % | | | 6.83 | % | | | 9.83 | % |
| | | | | | | | | | | | | | | | | | | |
| $ | 4,989 | | | $ | 5,937 | | | $ | 6,758 | | | $ | 7,635 | | | $ | 7,203 | |
| | | | | | | | | | | | | | | | | | | |
| | N/A | | | | 1.83 | % | | | 1.79 | % | | | 1.63 | % | | | 1.62 | % |
| | N/A | | | | 1.61 | % | | | 1.61 | % | | | 1.60 | % | | | 1.60 | % |
| | | | | | | | | | | | | | | | | | | |
| | N/A | | | | 3.58 | % | | | 3.60 | % | | | 3.29 | % | | | 4.69 | % |
| | | | | | | | | | | | | | | | | | | |
| | N/A | | | | 3.80 | % | | | 3.78 | % | | | 3.33 | % | | | 4.71 | % |
| | | | | | | | | | | | | | | | | | | |
| | | | | | | | | | | | | | | | | | | |
| | 1.95 | % | | | 1.82 | % | | | 1.78 | % | | | 1.63 | % | | | 1.62 | % |
| | 1.60 | % | | | 1.60 | % | | | 1.60 | % | | | 1.60 | % | | | 1.60 | % |
| | | | | | | | | | | | | | | | | | | |
| | 3.19 | % | | | 3.59 | % | | | 3.59 | % | | | 3.29 | % | | | 4.69 | % |
| | | | | | | | | | | | | | | | | | | |
| | 3.53 | % | | | 3.81 | % | | | 3.77 | % | | | 3.33 | % | | | 4.71 | % |
| | 80 | % | | | 52 | % | | | 76 | % | | | 121 | % | | | 40 | % |
| Annual Report | September 30, 2020 | 132 |
| RiverNorth/Oaktree High Income Fund | Class R |
| Financial Highlights | For a share outstanding throughout the periods presented |
| (a) | Based on average shares outstanding during the period. |
| (b) | Less than $0.005 per share. |
| (c) | Total return in the above table represents the rate that the investor would have earned or lost on an investment in the Fund, assuming reinvestment of dividends. |
| (d) | The ratios exclude the impact of expenses of the underlying funds in which the Fund invests as represented in the Schedule of Investments. |
See Notes to Financial Statements.
| 133 | (888) 848-7569 | www.rivernorth.com |
| RiverNorth Funds | Notes to Financial Statements |
September 30, 2020
1. ORGANIZATION
The RiverNorth Funds (the “Trust” or “Funds”) was established under the laws of Ohio by an Agreement and Declaration of Trust dated July 18, 2006 (the “Trust Agreement”). The Trust is an open-end management investment company registered under the Investment Company Act of 1940, as amended (the “1940 Act”). The Trust Agreement permits the Board of Trustees (the “Board” or “Trustees”) to authorize and issue an unlimited number of shares of beneficial interest of a separate series without par value. All classes of shares for each of the Funds have identical rights to earnings, assets and voting privileges, except for class-specific expenses and exclusive rights to vote on matters affecting only individual classes. The Funds are considered investment companies and therefore follow the Investment Company accounting and reporting guidance of the Financial Accounting Standards Board (“FASB”) Accounting Standards Codification Topic 946 Financial Services Investment Companies.
The RiverNorth Core Opportunity Fund (the “Core Opportunity Fund”) was organized as a diversified series of the Trust on July 18, 2006 and commenced investment operations on December 27, 2006. The Core Opportunity Fund offers two classes of shares, Class I Shares (inception date of August 11, 2014) and Class R Shares (inception date of December 27, 2006). The investment adviser to the Core Opportunity Fund is RiverNorth Capital Management, LLC ("RiverNorth" or the “Adviser”). The investment objective of the Core Opportunity Fund is to seek long-term capital appreciation and income.
The RiverNorth/DoubleLine Strategic Income Fund (the “Strategic Income Fund”) is a diversified series of the Trust and commenced investment operations on December 30, 2010. The Strategic Income Fund offers two classes of shares, Class I Shares and Class R Shares. The investment adviser to the Strategic Income Fund is RiverNorth. The Strategic Income Fund’s sub-adviser is DoubleLine Capital, LP (“DoubleLine”). The investment objective of the Strategic Income Fund is current income and overall total return.
The RiverNorth/Oaktree High Income Fund (the “High Income Fund”) is a diversified series of the Trust and commenced investment operations on December 28, 2012. The High Income Fund offers two classes of shares, Class I Shares and Class R Shares. The investment adviser to the High Income Fund is RiverNorth. The High Income Fund’s sub-adviser is Oaktree Capital Management, L.P. (“Oaktree Capital,” and with DoubleLine, each a “Sub-Adviser” or collectively, the “Sub-Advisers”). The investment objective of the High Income Fund is overall total return consisting of long-term capital appreciation and income.
2. SIGNIFICANT ACCOUNTING POLICIES
The following is a summary of significant accounting policies followed by the Funds. These policies are in conformity with generally accepted accounting principles in the United States of America (“GAAP”). The financial statements are prepared in accordance with GAAP, which requires management to make estimates and assumptions that affect the reported amounts and disclosures, including the disclosure of contingent assets and liabilities, in the financial statements during the reporting period. Management believes the estimates and security valuations are appropriate; however, actual results may differ from those estimates, and the security valuations reflected in the financial statements may differ from the value the Funds ultimately realize upon sale of the securities. The financial statements have been prepared as of the close of the New York Stock Exchange (“NYSE” or the "Exchange") on the fiscal period end of the Funds.
| Annual Report | September 30, 2020 | 134 |
| RiverNorth Funds | Notes to Financial Statements |
September 30, 2020
Security Valuation: The Funds’ assets and other financial instruments are recorded at their estimated fair value as described in Note 3.
Security Transactions and Related Income: The Funds follow industry practice and record security transactions on the trade date basis. The specific identification method is used for determining gains or losses for financial statements and income tax purposes. Dividend income is recorded on the ex-dividend date or for certain foreign securities, when the information becomes available to the Funds, and interest income and expenses are recorded on an accrual basis. Discounts and premiums on securities purchased are amortized or accreted using the effective interest method. Withholding taxes on foreign dividends have been provided for in accordance with the Funds’ understanding of the applicable country’s tax rules and rates. The ability of issuers of debt securities held by the Funds to meet their obligations may be affected by economic and political developments in a specific country or region. Settlement on bank loans transactions may be in excess of seven business days. Interest only stripped mortgage backed securities ("IO Strips") are securities that receive only interest payments from a pool of mortgage loans. Little to no principal will be received by the Funds upon maturity of an IO Strip. Periodic adjustments are recorded to reduce the cost of the security until maturity, which are included in interest income.
Foreign Currency Translation: The books and records of the Funds are maintained in U.S. dollars. Investment valuations and other assets and liabilities initially expressed in foreign currencies are converted each business day into U.S. dollars based upon current exchange rates. Prevailing foreign exchange rates may generally be obtained at the close of the NYSE (normally, 4:00 p.m. Eastern time). The portion of realized and unrealized gains or losses on investments due to fluctuations in foreign currency exchange rates is not separately disclosed and is included in realized and unrealized gains or losses on investments, when applicable.
Foreign Securities: The Funds may directly purchase securities of foreign issuers. Investing in securities of foreign issuers involves special risks not typically associated with investing in securities of U.S. issuers. The risks include possible revaluation of currencies, the ability to repatriate funds, less complete financial information about companies and possible future adverse political and economic developments. Moreover, securities of many foreign issuers and their markets may be less liquid and their prices more volatile than those of securities of comparable U.S. issuers.
Certain foreign countries impose a capital gains tax which is accrued by the Funds based on the unrealized appreciation, if any, on affected securities. Any accrual would reduce a Fund’s net asset value ("NAV"). The tax is paid when the gain is realized and is included in capital gains tax in the Statements of Operations.
Other: The Funds hold certain investments which pay dividends to their shareholders based upon available funds from operations. It is possible for these dividends to exceed the underlying investments’ taxable earnings and profits resulting in the excess portion of such dividends being designated as a return of capital. Distributions received from investments in securities that represent a return of capital or capital gains are recorded as a reduction of the cost of investments or as a realized gain, respectively.
| 135 | (888) 848-7569 | www.rivernorth.com |
| RiverNorth Funds | Notes to Financial Statements |
September 30, 2020
Principal Investment Risks: All mutual funds carry a certain amount of risk. For more information on the related risks of investing in the Funds please refer to the prospectus of each Fund.
Share Valuation: The NAV is generally calculated as of the close of trading on the NYSE (normally 4:00 p.m. Eastern Time) every day the Exchange is open. The NAV is calculated by taking the total value of each Fund’s or class’ assets, subtracting its liabilities, and then dividing by the total number of shares outstanding, rounded to the nearest cent. The offering price and redemption price per share is equal to the NAV per share, except that shares of each Fund were subject to a redemption fee of 2% if redeemed within 90 days of purchase until March 4, 2019 when the redemption fee was eliminated.
Expenses: Some expenses of the Trust can be directly attributed to a Fund or a Fund specific share class. Expenses which cannot be directly attributed are apportioned among all Funds and Fund series classes in the Trust based on average net assets or another method approved by the Board.
Federal Income Taxes: The Funds make no provision for federal income tax. Each Fund intends to qualify each year as a “regulated investment company” under subchapter M of the Internal Revenue Code of 1986, as amended, by distributing substantially all of its taxable income. If the required amount of net investment income is not distributed, the Funds could incur a tax expense.
As of and during the year ended September 30, 2020, the Funds did not have a liability for any unrecognized tax benefits. The Funds file U.S. federal, state, and local tax returns as required. The Funds’ tax returns are subject to examination by the relevant tax authorities until expiration of the applicable statute of limitations which is generally three years after the filing of the tax return for federal purposes and four years for most state returns. Tax returns for open years have incorporated no uncertain tax positions that require a provision for income taxes.
The Funds recognize interest and penalties, if any, related to unrecognized tax benefits as income tax expenses in the Statements of Operations. During the year ended September 30, 2020, the Funds did not incur any interest or penalties.
Distributions to Shareholders: Distributions to shareholders, which are determined in accordance with income tax regulations, are recorded on the ex-dividend date. The treatment for financial reporting purposes of distributions made to shareholders during the year from net investment income or net realized capital gains may differ from their ultimate treatment for federal income tax purposes. These differences are caused primarily by differences in the timing of recognition of certain components of income, expense, or realized capital gain for federal income tax purposes. Where such differences are permanent in nature, they are reclassified in the components of the net assets based on their ultimate characterization for federal income tax purposes. Any such reclassification will have no effect on net assets, results of operations or net asset values per share of the Funds.
| Annual Report | September 30, 2020 | 136 |
| RiverNorth Funds | Notes to Financial Statements |
September 30, 2020
3. SECURITIES VALUATION AND FAIR VALUE MEASUREMENTS
Fair value is defined as the price that a Fund might reasonably expect to receive upon selling an investment in a timely transaction to an independent buyer in the principal or most advantageous market of the investment. GAAP establishes a three-tier hierarchy to maximize the use of observable market data and minimize the use of unobservable inputs and to establish classification of fair value measurements for disclosure purposes.
Inputs refer broadly to the assumptions that market participants would use in pricing the asset or liability, including assumptions about risk, for example, the risk inherent in a particular valuation technique used to measure fair value including using such a pricing model and/or the risk inherent in the inputs to the valuation technique. Inputs may be observable or unobservable. Observable inputs are inputs that reflect the assumptions market participants would use in pricing the asset or liability developed based on market data obtained from sources independent of the reporting entity. Unobservable inputs are inputs that reflect the reporting entity’s own assumptions about the assumptions market participants would use in pricing the asset or liability developed based on the best information available in the circumstances.
Various inputs are used in determining the value of the Funds’ investments. These inputs are summarized in the three broad levels listed below.
| ● | Level 1 – Unadjusted quoted prices in active markets for identical, unrestricted assets or liabilities that a Fund has the ability to access at the measurement date; |
| ● | Level 2 – Quoted prices which are not active, quoted prices for similar assets or liabilities in active markets or inputs other than quoted prices that are observable (either directly or indirectly) for substantially the full term of the asset or liability; and |
| ● | Level 3 – Significant unobservable prices or inputs (including the Funds’ own assumptions in determining the fair value of investments) where there is little or no market activity for the asset or liability at the measurement date. |
The inputs used to measure fair value may fall into different levels of the fair value hierarchy. In such cases, for disclosure purposes, the level in the fair value hierarchy within which the fair value measurement falls in its entirety is determined based on the lowest level input that is significant to the fair value measurement in its entirety.
Equity securities, including common stocks, rights and warrants, closed-end funds, exchange-traded funds, preferred stocks and business development companies are generally valued by using market quotations, but may be valued on the basis of prices furnished by a pricing service when the Adviser or a Sub-Adviser believes such prices more accurately reflect the fair market value of such securities. Securities that are traded on any stock exchange are generally valued by the pricing service at the last quoted sale price. Lacking a last sale price, an exchange traded security is generally valued by the pricing service at its last bid price. Securities traded in the NASDAQ over-the-counter market are generally valued by the pricing service at the NASDAQ Official Closing Price. When using the market quotations or close prices provided by the pricing service and when the market is considered active, the security will be classified as a Level 1 security. Sometimes, an equity security owned by the Funds will be valued by the pricing service with factors other than market quotations or when the market is considered inactive. When this happens, the security will be classified as a Level 2 security. When market quotations are not readily available, when the Adviser or a Sub-Adviser determines that the market quotation or the price provided by the pricing service does not accurately reflect the current fair value, or when restricted or illiquid securities are being valued, such securities are valued as determined in good faith by the Adviser, Sub-Adviser, or valuation committee in conformity with guidelines adopted by and subject to review by the Board. These securities will be categorized as Level 3 securities.
| 137 | (888) 848-7569 | www.rivernorth.com |
| RiverNorth Funds | Notes to Financial Statements |
September 30, 2020
Investments in mutual funds, including short-term investments and open-end funds, are generally priced at the ending NAV provided by the service agent of the funds. These securities will be categorized as Level 1 securities.
Domestic and foreign fixed income securities, including foreign and U.S. corporate bonds, convertible corporate bonds, U.S. Government bonds and notes, foreign government bonds and notes, supranationals and foreign agencies, non-agency collateralized mortgage obligations, U.S. government/agency mortgage backed securities, business development company notes, bank loans, collateralized loan obligations, municipal bonds, and high yield debt, as well as non-exchange traded derivatives, including forward foreign currency contracts, are normally valued on the basis of quotes obtained from brokers and dealers or independent pricing services. Foreign currency positions, including forward foreign currency contracts, are priced at the mean between the closing bid and asked prices at 4:00 p.m. Eastern Time. Prices obtained from independent pricing services typically use information provided by market makers or estimates of market values obtained from yield data relating to investments or securities with similar characteristics. Data used to establish quotes includes analysis of cash flows, pre-payment speeds, default rates, delinquency assumptions and assumptions regarding collateral and loss assumptions. These securities will be classified as Level 2 securities.
Short-term investments in fixed income securities, with maturities of less than 60 days when acquired, or which subsequently are within 60 days of maturity, are valued by using the amortized cost method of valuation, which the Board has determined will represent fair value. These securities will be classified as Level 2 securities.
In accordance with the Funds’ good faith pricing guidelines, the Adviser, Sub-Adviser, or valuation committee is required to consider all appropriate factors relevant to the value of securities for which it has determined other pricing sources are not available or reliable as described above. No single standard exists for determining fair value, because fair value depends upon the circumstances of each individual case. As a general principle, the current fair value of an issue of securities being valued by the Adviser, Sub-Adviser, or valuation committee would appear to be the amount which the owner might reasonably expect to receive for them upon their current sale. Methods which are in accordance with this principle may, for example, be based on (i) a multiple of earnings; (ii) discounted cash flow models; (iii) weighted average cost or weighted average price; (iv) a discount from market of a similar freely traded security (including a derivative security or a basket of securities traded on other markets, exchanges or among dealers); or (v) yield to maturity with respect to debt issues, or a combination of these and other methods. Good faith pricing is permitted if, in the Adviser’s, a Sub-Adviser’s, or the valuation committee’s opinion, the validity of market quotations appears to be questionable based on factors such as evidence of a thin market in the security based on a small number of quotations, a significant event occurs after the close of a market but before a Fund’s NAV calculation that may affect a security’s value, or the Adviser or a Sub-Adviser is aware of any other data that calls into question the reliability of market quotations.
| Annual Report | September 30, 2020 | 138 |
| RiverNorth Funds | Notes to Financial Statements |
September 30, 2020
Good faith pricing may also be used in instances when the bonds in which the Funds invest default or otherwise cease to have market quotations readily available. Investments in foreign securities, junk bonds, or other thinly traded securities are more likely to trigger good faith pricing than other securities.
The following is a summary of the inputs used at September 30, 2020 in valuing the Funds’ assets and liabilities:
Core Opportunity Fund
| | Valuation Inputs | | | | | |
| Investments in Securities at Value* | | | Level 1 | | | | Level 2 | | | | Level 3 | | | | Total | |
| Closed-End Funds | | $ | 54,345,947 | | | $ | – | | | $ | – | | | $ | 54,345,947 | |
| Business Development Companies | | | 4,335,042 | | | | – | | | | – | | | | 4,335,042 | |
| Common Stocks | | | 1,408,330 | | | | – | | | | – | | | | 1,408,330 | |
| Exchange Traded Funds | | | 666,075 | | | | – | | | | – | | | | 666,075 | |
| Preferred Stocks | | | 115,741 | | | | – | | | | – | | | | 115,741 | |
| Business Development Company Notes | | | 1,514,347 | | | | – | | | | – | | | | 1,514,347 | |
| Convertible Corporate Bonds | | | – | | | | 2,738,603 | | | | – | | | | 2,738,603 | |
| Rights | | | 14,459 | | | | – | | | | – | | | | 14,459 | |
| Warrants | | | 282,108 | | | | – | | | | – | | | | 282,108 | |
| Short-Term Investments | | | 12,129,578 | | | | – | | | | – | | | | 12,129,578 | |
| Total | | $ | 74,811,627 | | | $ | 2,738,603 | | | $ | – | | | $ | 77,550,230 | |
| 139 | (888) 848-7569 | www.rivernorth.com |
| RiverNorth Funds | Notes to Financial Statements |
September 30, 2020
Strategic Income Fund
| | | Valuation Inputs | | | | | |
| Investments in Securities at Value* | | | Level 1 | | | | Level 2 | | | | Level 3 | | | | Total | |
| Closed-End Funds | | $ | 353,987,934 | | | $ | – | | | $ | – | | | $ | 353,987,934 | |
| Business Development Companies | | | 3,619,268 | | | | – | | | | – | | | | 3,619,268 | |
| Common Stocks | | | 95,376 | | | | – | | | | – | | | | 95,376 | |
| Open-End Funds | | | 30,155,295 | | | | – | | | | – | | | | 30,155,295 | |
| Preferred Stocks | | | 30,727,437 | | | | – | | | | – | | | | 30,727,437 | |
| Business Development Company Notes | | | 16,311,722 | | | | – | | | | – | | | | 16,311,722 | |
| Foreign Corporate Bonds | | | – | | | | 83,380,376 | | | | – | | | | 83,380,376 | |
| U.S. Corporate Bonds | | | – | | | | 100,214,470 | | | | – | | | | 100,214,470 | |
| Convertible Corporate Bonds | | | – | | | | 13,382,871 | | | | – | | | | 13,382,871 | |
| Foreign Government Bonds and Notes, Supranationals and Foreign Agencies | | | – | | | | 5,963,481 | | | | – | | | | 5,963,481 | |
| Bank Loans | | | – | | | | 20,606,198 | | | | – | | | | 20,606,198 | |
| Collateralized Loan Obligations | | | – | | | | 46,505,901 | | | | – | | | | 46,505,901 | |
| Equity - Linked Notes | | | – | | | | – | | | | 11,250 | | | | 11,250 | |
| Non-Agency Collateralized Mortgage Obligations | | | – | | | | 454,699,084 | | | | – | | | | 454,699,084 | |
| U.S. Government Bonds and Notes | | | – | | | | 134,952,071 | | | | – | | | | 134,952,071 | |
| Municipal Bonds | | | – | | | | 424,454 | | | | – | | | | 424,454 | |
| U.S. Government / Agency Mortgage Backed Securities | | | – | | | | 287,910,376 | | | | – | | | | 287,910,376 | |
| Short-Term Investments | | | 228,411,532 | | | | 534,932 | | | | – | | | | 228,946,464 | |
| Total | | $ | 663,308,564 | | | $ | 1,148,574,214 | | | $ | 11,250 | | | $ | 1,811,894,028 | |
| Annual Report | September 30, 2020 | 140 |
| RiverNorth Funds | Notes to Financial Statements |
September 30, 2020
High Income Fund
| | Valuation Inputs | | | | | |
| Investments in Securities at Value* | | | Level 1 | | | | Level 2 | | | | Level 3 | | | | Total | |
| Closed-End Funds | | $ | 3,425,102 | | | $ | – | | | $ | – | | | $ | 3,425,102 | |
| Common Stocks | | | 34,618 | | | | 130 | | | | 38,113 | | | | 72,861 | |
| Preferred Stocks | | | – | | | | – | | | | 96,490 | | | | 96,490 | |
| Bank Loans | | | – | | | | 17,638,807 | | | | 68,060 | | | | 17,706,867 | |
| High Yield Debt | | | – | | | | 24,223,823 | | | | – | | | | 24,223,823 | |
| Rights | | | – | | | | – | | | | 32 | | | | 32 | |
| Warrants | | | 2 | | | | – | | | | – | | | | 2 | |
| Short-Term Investments | | | 793,601 | | | | – | | | | – | | | | 793,601 | |
| Total | | $ | 4,253,323 | | | $ | 41,862,760 | | | $ | 202,695 | | | $ | 46,318,778 | |
| | | | | | | | | | | | | | | | | |
| | Valuation Inputs | | | | | |
| Other Financial Instruments** | | | Level 1 | | | | Level 2 | | | | Level 3 | | | | Total | |
| Assets | | | | | | | | | | | | | | | | |
| Forward Foreign Currency Contracts | | $ | – | | | $ | 110,522 | | | $ | – | | | $ | 110,522 | |
| Liabilities | | | | | | | | | | | | | | | | |
| Forward Foreign Currency Contracts | | $ | – | | | $ | (150 | ) | | $ | – | | | $ | (150 | ) |
| Total | | $ | – | | | $ | 110,372 | | | $ | – | | | $ | 110,372 | |
| * | Refer to each Fund’s Schedule of Investments for a listing of securities by type. |
| ** | Other financial instruments are derivative instruments reflected in the Schedule of Investments. |
| 141 | (888) 848-7569 | www.rivernorth.com |
| RiverNorth Funds | Notes to Financial Statements |
September 30, 2020
The changes of the fair value of investments for which the Funds have used Level 3 inputs to determine the fair value are as follows:
| Asset Type | | Balance as of September 30, 2019 | | | Accrued Discount/ premium | | | Realized Gain/ (Loss) | | | Change in Unrealized Appreciation/ Depreciation | | | Purchases | | | Sales Proceeds | | | Transfer into Level 3 | | | Transfer Out of Level 3 | | | Balance as of September 30, 2020 | | | Net change in unrealized appreciation/ (depreciation) included in the Statements of Operations attributable to Level 3 investments held at September 30, 2020 | |
| Strategic Income Fund | | | | | | | | | | | | | | | | | | | | | | | | | | | | | | |
U.S. Corporate
Bonds | | $ | 5,050,000 | | | $ | 5,226 | | | $ | – | | | $ | (125,590 | ) | | $ | – | | | $ | – | | | $ | – | | | $ | (4,929,636 | ) | | $ | – | | | $ | – | |
| Equity-Linked Note | | | 11,250 | | | | – | | | | – | | | | – | | | | – | | | | – | | | | – | | | | – | | | | 11,250 | | | | – | |
| | | $ | 5,061,250 | | | $ | 5,226 | | | $ | – | | | $ | (125,590 | ) | | $ | – | | | $ | – | | | $ | – | | | $ | (4,929,636 | ) | | $ | 11,250 | | | $ | – | |
| | | | | | | | | | | | | | | | | | | | | | | | | | | | | | | | | | | | | | | | | |
| High Income Fund | | | | | | | | | | | | | | | | | | | | | | | | | | | | | | | | | | | | | | | | |
| Common Stocks | | $ | 30,185 | | | $ | – | | | $ | 620 | | | $ | (158,871 | ) | | $ | 167,882 | | | $ | (1,703 | ) | | $ | – | | | $ | – | | | $ | 38,113 | | | $ | (158,871 | ) |
| Preferred Stocks | | | 92,000 | | | | – | | | | – | | | | (17,490 | ) | | | 21,980 | | | | – | | | | – | | | | – | | | | 96,490 | | | | (17,490 | ) |
| Bank Loans | | | 20,361 | | | | (443 | ) | | | – | | | | 4,972 | | | | 227,682 | | | | (184,512 | ) | | | – | | | | – | | | | 68,060 | | | | (41,936 | ) |
| Rights | | | – | | | | – | | | | – | | | | (11,199 | ) | | | 11,231 | | | | – | | | | – | | | | – | | | | 32 | | | | (11,199 | ) |
| High Yield Debt | | | – | | | | 2,463 | | | | (45,531 | ) | | | 43,295 | | | | – | | | | (227 | ) | | | – | | | | – | | | | – | | | | – | |
| Warrants | | | 3,714 | | | | – | | | | 1,352 | | | | (1,352 | ) | | | – | | | | (3,714 | ) | | | – | | | | – | | | | – | | | | – | |
| | | $ | 146,260 | | | $ | 2,020 | | | $ | (43,559 | ) | | $ | (140,645 | ) | | $ | 428,775 | | | $ | (190,156 | ) | | $ | – | | | $ | – | | | $ | 202,695 | | | $ | (229,496 | ) |
The table below provides additional information about the Level 3 Fair Value Measurements as of September 30, 2020:
Quantitative Information about Level 3 Fair Value Measurements
Strategic Income Fund
| Asset Class | Fair Value (USD) | Valuation Technique | Unobservable Inputs(a) | Value/Range (Weighted Average) |
| Equity-Linked Note | 11,250 | Vendor Price | Indicative Broker Quote | N/A |
| Annual Report | September 30, 2020 | 142 |
| RiverNorth Funds | Notes to Financial Statements |
September 30, 2020
High Income Fund
| Asset Class | Fair Value (USD) | Valuation Technique | Unobservable Inputs(a) | Value/Range (Weighted Average) |
| Common Stocks | $38,113 | Vendor Price | Indicative Broker Quotes | $20.50-$24.00 |
| | | Market Comparable Companies | EBITDA Multiple | 4.75x |
| | | | Revenue Multiple | 0.21x-0.29x |
| | | | Liquidity Discount | 80.57% |
| | | | Company Provided Financial Information | N/A |
| Preferred Stocks | 96,490 | Market Comparable Companies | EBITDA Multiple | 9.25x-9.75x |
| | | | Company Provided Financial Information | N/A |
| Bank Loans | 68,060 | Vendor Price | Broker Quote | N/A |
| Rights | 32 | Market Comparable Companies | Revenue Multiple | 0.21x-0.29x |
| | | | Liquidity Discount | 80.57% |
| | | | Company Provided Financial Information | N/A |
| (a) | A change to the unobservable input may result in a significant change to the value of the investment as follows: |
| Unobservable Inputs | Impact to Value if Input Increases | Impact to Value if Input Decreases |
| Indicative Broker Quotes | Increase | Decrease |
| EBITDA Multiple | Increase | Decrease |
| Revenue Multiple | Increase | Decrease |
| Liquidity Discount | Decrease | Increase |
4. DERIVATIVE FINANCIAL INSTRUMENTS
The following discloses the Funds’ use of derivative instruments. The Funds’ investment objectives not only permit the Funds to purchase investment securities, they also allow the Funds to enter into various types of derivative contracts such as forward foreign currency contracts. In doing so, the Funds will employ strategies in differing combinations to permit them to increase, decrease, or change the level or types of exposure to market factors. Central to those strategies are features inherent to derivatives that make them more attractive for this purpose than equity or debt securities; they require little or no initial cash investment, they can focus exposure on only certain selected risk factors, and they may not require the ultimate receipt or delivery of the underlying security (or securities) to the contract. This may allow the Funds to pursue their objectives more quickly and efficiently than if they were to make direct purchases or sales of securities capable of affecting a similar response to market factors.
| 143 | (888) 848-7569 | www.rivernorth.com |
| RiverNorth Funds | Notes to Financial Statements |
September 30, 2020
Market Risk Factors: In pursuit of their investment objectives, the Funds may seek to use derivatives to increase or decrease their exposure to the following market risk factors:
Foreign Exchange Rate Risk: Foreign exchange rate risk relates to the change in the U.S. dollar value of a security held that is denominated in a foreign currency. The value of a foreign currency denominated security will decrease as the dollar appreciates against the currency, while the value of the foreign currency denominated security will increase as the dollar depreciates against the currency.
Risk of Investing in Derivatives
The Funds’ use of derivatives can result in losses due to unanticipated changes in the market risk factors and the overall market. Derivatives may have little or no initial cash investment relative to their market value exposure and therefore can produce significant gains or losses in excess of their cost. This use of embedded leverage allows the Funds to increase their market value exposure relative to their net assets and can substantially increase the volatility of the Funds’ performance.
Additional associated risks from investing in derivatives also exist and potentially could have significant effects on the valuation of the derivative and the Funds. Typically, the associated risks are not the risks that the Funds are attempting to increase or decrease exposure to, per their investment objectives, but are the additional risks from investing in derivatives.
Examples of these associated risks are liquidity risk, which is the risk that the Funds will not be able to sell the derivative in the open market in a timely manner, and counterparty credit risk, which is the risk that the counterparty will not fulfill its obligation to the Funds.
Forward Foreign Currency Contracts
The Funds may engage in currency transactions with counterparties to hedge the value of portfolio securities denominated in particular currencies against fluctuations in relative value, to gain or reduce exposure to certain currencies, or to generate income or gains. A forward foreign currency contract is an agreement between two parties to buy and sell a currency at a set price on a future date. During the year ended September 30, 2020, the High Income Fund engaged in forward foreign currency contracts. The contracts are marked-to-market daily and the change in value is recorded by the High Income Fund as an unrealized gain or loss. When a forward foreign currency contract is extinguished, through either delivery or offset by entering into another forward foreign currency contract, the High Income Fund records a realized gain or loss equal to the difference between the value of the contract at the time it was opened and the value of the contract at the time it was extinguished.
Forward foreign currency contracts involve elements of market risk in excess of the amounts reflected in the Statement of Assets and Liabilities. The High Income Fund bears the risk of an unfavorable change in the foreign exchange rate underlying the forward foreign currency contract. Risks may also arise upon entering into these contracts from the potential inability of the counterparties to meet the terms of their contracts.
If required by the forward foreign currency contracts, the High Income Fund has segregated sufficient assets as collateral to satisfy the current obligations with respect to forward foreign currency contracts, and this is reflected as Cash segregated at custodian for forward foreign currency contracts on the High Income Fund’s Statement of Assets and Liabilities.
| Annual Report | September 30, 2020 | 144 |
| RiverNorth Funds | Notes to Financial Statements |
September 30, 2020
The effect of derivatives instruments on each Fund's Statement of Assets and Liabilities as of September 30, 2020:
| | | | | Asset Derivatives | |
| Fund | | Risk Exposure | | Statement of Assets and Liabilities Location | | Fair Value | |
| High Income Fund | | Foreign exchange rate risk (Forward foreign currency contracts) | | Unrealized appreciation on forward foreign currency contracts | | $ | 110,522 | |
| | | | | Liabilities Derivatives | |
| Fund | | Risk Exposure | | Statement of Assets and Liabilities Location | | Fair Value | |
| High Income Fund | | Foreign exchange rate risk (Forward foreign currency contracts) | | Unrealized depreciation on forward foreign currency contracts | | $ | (150 | ) |
The effect of derivatives instruments on each Fund's Statement of Operations for the year ended September 30, 2020:
| Fund | | | Risk Exposure | | Statement of Operations Location | | Realized Gain/ (Loss) on Derivatives Recognized in Income | | | Change in Unrealized Appreciation/ Depreciation on Derivatives Recognized in Income | |
| High Income Fund | | | Foreign exchange rate risk (Forward foreign currency contracts) | | Net realized gain/(loss) on Forward Foreign Currency Contracts/ Net change in unrealized appreciation/ depreciation on Forward Foreign Currency Contracts | | $ | (476,865 | ) | | $ | 8,655 | |
The forward currency contracts average notional amount during the year ended September 30, 2020, is noted below.
| Fund | | Average Notional Amount of Forward Foreign Currency Contracts | |
| High Income Fund | | $ | 7,362,117 | |
| 145 | (888) 848-7569 | www.rivernorth.com |
| RiverNorth Funds | Notes to Financial Statements |
September 30, 2020
Offsetting Arrangements: Certain derivative contracts are executed under standardized netting agreements. A derivative netting arrangement creates an enforceable right of set-off that becomes effective, and affects the realization of settlement on individual assets, liabilities and collateral amounts, only following a specified event of default or early termination. Default events may include the failure to make payments or deliver securities timely, material adverse changes in financial condition or insolvency, the breach of minimum regulatory capital requirements, or loss of license, charter or other legal authorization necessary to perform under the contract. These agreements mitigate counterparty credit risk by providing for a single net settlement with a counterparty of all financial transactions covered by the agreement in an event of default as defined under such agreement.
The following table presents derivative financial instruments that are subject to enforceable netting arrangements, collateral arrangements or other similar agreements as of September 30, 2020.
| Offsetting of Derivatives Asset | | | | | | | | |
| | | | | | | | | | | | Gross Amounts Not Offset in the Statements of Assets and Liabilities | |
| | | Gross Amounts of Recognized Assets | | | Gross Amounts Offset in the Statements of Assets and Liabilities | | | Net Amounts Presented in the Statements of Assets and Liabilities | | | Financial Instruments Available for Offset(a) | | | Cash Collateral Received(a) | | | Net Amount | |
| High Income Fund | | | | | | | | | | | | | | | | | | |
| Forward Foreign Currency Contracts | | $ | 110,522 | | | $ | – | | | $ | 110,522 | | | $ | (150 | ) | | $ | – | | | $ | 110,372 | |
| Total | | $ | 110,522 | | | $ | – | | | $ | 110,522 | | | $ | (150 | ) | | $ | – | | | $ | 110,372 | |
| Annual Report | September 30, 2020 | 146 |
| RiverNorth Funds | Notes to Financial Statements |
September 30, 2020
| Offsetting of Derivatives Liability | | | | | | | | | | | | |
| | | | | | | | | | | | Gross Amounts Not Offset in the Statement of Assets and Liabilities | |
| | | Gross Amounts of Recognized Liabilities | | | Gross Amounts Offset in the Statement of Assets and Liabilities | | | Net Amounts Presented in the Statement of Assets and Liabilities | | | Financial Instruments Available for Offset(a) | | | Cash Collateral Pledged(a) | | | Net Amount | |
| High Income Fund | | | | | | | | | | | | | | | | | | |
| Forward Foreign Currency Contracts | | $ | 150 | | | | | | | $ | 150 | | | $ | (150 | ) | | $ | – | | | $ | – | |
| Total | | $ | 150 | | | $ | – | | | $ | 150 | | | $ | (150 | ) | | $ | – | | | $ | – | |
| (a) | These amounts are limited to the derivatives asset/liability balance and, accordingly, do not include excess collateral received/pledged. |
5. LOAN PARTICIPATIONS AND ASSIGNMENTS
The Strategic Income Fund and High Income Fund may each invest in direct debt instruments which are interests in amounts owed to lenders or lending syndicates by corporate, governmental, or other borrowers. The Strategic Income Fund and High Income Fund will normally invest in corporate debt issuers in North America and Europe. The Strategic Income Fund’s and High Income Fund’s investments in loans may be in the form of participations in loans or assignments of all or a portion of loans from third parties. A loan is often administered by a bank or other financial institution (the “lender”) that acts as agent for all holders. The agent administers the terms of the loan, as specified in the loan agreement. The Strategic Income Fund and High Income Fund may each invest in multiple series or tranches of a loan, which may have varying terms and carry different associated risks. The Strategic Income Fund and High Income Fund will generally purchase assignments of these loans, in which case they will typically become lenders for purposes of the relevant loan agreement with direct contractual rights against the borrower, including the right to receive payments of principal and interest. When purchasing participation interests in a loan, the Strategic Income Fund and High Income Fund generally have no right to enforce compliance with the terms of the loan agreement with the borrower. As a result, the Strategic Income Fund and High Income Fund may each be subject to the credit risk of both the borrower and the lender that is selling the loan agreement. The Strategic Income Fund and High Income Fund may each enter into unfunded loan commitments, which are contractual obligations for future funding. Unfunded loan commitments represent a future obligation in full, even though a percentage of the notional loan amounts may not be utilized by the borrower. When investing in a loan participation, the Strategic Income Fund and High Income Fund have the right to receive payments of principal, interest and any fees to which they are entitled only from the lender selling
| 147 | (888) 848-7569 | www.rivernorth.com |
| RiverNorth Funds | Notes to Financial Statements |
September 30, 2020
the loan agreement and only upon receipt of payments by the lender from the borrower. The Strategic Income Fund and High Income Fund may each receive a commitment fee based on the undrawn portion of the underlying line of credit portion of a floating rate loan. In certain circumstances, the Strategic Income Fund and High Income Fund may each receive a penalty fee upon the prepayment of a floating rate loan by a borrower. Fees earned are recorded as a component of interest income or interest expense, respectively, on the Statements of Operations. At September 30, 2020, the Strategic Income Fund and High Income Fund had $957,127 and $2,348,517 respectively, in unsettled domestic and foreign loan commitments.
6. ADVISORY FEES, TRUSTEE FEES AND OTHER AGREEMENTS
The Adviser serves as the investment adviser to the Funds. Under the terms of the management agreement (the “Agreement”), the Adviser, subject to the supervision of the Board, provides or arranges to be provided to the Funds such investment advice as it deems advisable and will furnish or arrange to be furnished a continuous investment program for the Funds consistent with the Funds’ investment objectives and policies. As compensation for its management services, the Funds are obligated to pay the Adviser a fee computed and accrued daily and paid monthly in arrears at an annual rate of the average daily net assets of the Funds.
The Chief Compliance Officer (“CCO”) of the Funds is an affiliate of the Funds. For the year ended September 30, 2020, the total related amounts paid by the Funds for CCO fees are included in Compliance expenses on each Fund’s Statement of Operations.
The following table reflects the Funds’ contractual management fee rates (expressed as an annual rate).
| Fund | Contractual Management Fee |
| Core Opportunity Fund | 1.00% |
| Strategic Income Fund | 0.75% |
| High Income Fund | 1.00% |
The Adviser has contractually agreed to waive the High Income Fund’s management fees and/or reimburse expenses (excluding brokerage fees and commissions; borrowing costs such as (a) interest and (b) dividends on securities sold short; taxes; indirect expenses incurred by the underlying funds in which the Fund invests; and extraordinary expenses) of the High Income Fund until at least January 31, 2021 in order to maintain the Total Annual Fund Operating Expenses After Fee Deferral and/or Reimbursement at 1.60% and 1.35% for the Class R shares and Class I shares, respectively. This agreement may be terminated by the Board on 60 days’ written notice to the Adviser. Any waiver or reimbursement is subject to repayment by the High Income Fund within three years following the fiscal year in which the expenses occurred if the Fund is able to make the repayment without exceeding its current expense limitation and the repayment is approved by the Board.
| Annual Report | September 30, 2020 | 148 |
| RiverNorth Funds | Notes to Financial Statements |
September 30, 2020
For the year ended September 30, 2020, reimbursed expenses for the High Income Fund subject to potential recovery by year of expiration are as follows:
| | | Expiring September 30, | |
| | | 2021 | | | 2022 | | | 2023 | |
| High Income Fund | | | | | | | | | | | | |
| Class I | | $ | 98,502 | | | $ | 104,992 | | | $ | 145,507 | |
| Class R | | $ | 13,126 | | | $ | 13,864 | | | $ | 19,074 | |
| Total | | $ | 111,628 | | | $ | 111,856 | | | $ | 164,581 | |
For the year ended September 30, 2020, the Adviser voluntarily waived $171,600 in management fees attributable to the Strategic Income Fund related to the Fund's investment in an affiliate fund, the High Income Fund. The Investment Adviser Fee disclosed on the Strategic Income Fund's Statement of Operations is reflective of this waiver of affiliated management fees.
DoubleLine is the investment sub-adviser to the Strategic Income Fund. Oaktree Capital is the investment sub-adviser to the High Income Fund. Under the terms of the sub-advisory agreements, the Sub-Advisers, subject to the supervision of the Adviser and the Board of Trustees, provide to the Strategic Income Fund and the High Income Fund such investment advice as deemed advisable and will furnish a continuous investment program for the portion of assets managed in the respective Fund consistent with the respective Fund's investment objective and policies. As compensation for its sub-advisory services, the Adviser, out of its own fee, is obligated to pay each Sub-Adviser a fee computed and accrued daily and paid monthly in arrears based on an annual rate of the average daily net assets of the Strategic Income Fund and the High Income Fund.
ALPS Fund Services, Inc. (“ALPS”) provides the Funds with fund administration and fund accounting services. ALPS also serves as transfer agent, dividend paying and shareholder servicing agent for the Funds (“Transfer Agent”). ALPS receives an annual fee based on the Funds' average daily net assets, subject to certain minimums.
State Street Bank & Trust, Co. serves as the Funds’ custodian.
The Funds have adopted a plan pursuant to Rule 12b-1 under the 1940 Act (the “Plan”). The Plan permits the Funds to pay the Adviser for distribution and promotion expenses related to marketing shares of the Funds. The amount payable annually by the Class R shares of the Core Opportunity Fund, the Class R Shares of the Strategic Income Fund, and the Class R Shares of the High Income Fund is 0.25% of the average daily net assets. Under the Plan, the Trust may engage in any activities related to the distribution of Fund shares. The expenses of the Funds’ Plan are reflected as 12b-1 fees in the Statements of Operations.
The Funds have entered into a Distribution Agreement with ALPS Distributors, Inc. (“the Distributor”), an affiliate of ALPS, to provide distribution services to the Funds. The Distributor serves as underwriter/distributor of shares of the Funds.
Officers of the Trust and Trustees who are “interested persons” of the Trust or the Adviser received no salary or fees from the Trust. Each Trustee who is not an “interested person” receives a fee of $36,000 per year, plus $1,500 per meeting attended from the Trust. In addition, the chair of the audit committee receives $500 annually and the lead independent Trustee receives $250 annually. The Trust reimburses each Trustee and Officer for his or her travel and other expenses relating to attendance at such meetings. The Trustees are also compensated for their services as independent directors of other funds within the fund complex.1
| 149 | (888) 848-7569 | www.rivernorth.com |
| RiverNorth Funds | Notes to Financial Statements |
September 30, 2020
A Trustee and certain Officers of the Trust are also employees of the Adviser, the Distributor or ALPS.
| 1 | The Fund Complex consists of the RiverNorth Core Opportunity Fund, the RiverNorth/DoubleLine Strategic Income Fund, and the RiverNorth/Oaktree High Income Fund, each a series of RiverNorth Funds, and the RiverNorth Opportunities Fund, Inc., RiverNorth/DoubleLine Strategic Opportunity Fund, Inc., the RiverNorth Specialty Finance Corporation, RiverNorth Opportunistic Municipal Income Fund, Inc., RiverNorth Managed Duration Municipal Income Fund, Inc., and RiverNorth Flexible Municipal Income Fund, Inc. |
7. TAX BASIS INFORMATION
Tax Basis of Distributions to Shareholders: The character of distributions made during the year from net investment income or net realized gains may differ from its ultimate characterization for federal income tax purposes. Also, due to the timing of dividend distributions, the fiscal year in which amounts are distributed may differ from the fiscal year in which the income or realized gain were recorded by a Fund.
The tax character of distributions paid by the Funds during the fiscal year ended September 30, 2020, was as follows:
| | | | Ordinary Income | | | Tax-Exempt Income | | | Distributions paid from Long-Term Capital Gain | | | Return of Capital | | | Total | |
| Core Opportunity Fund | | | $ | 2,155,943 | | | $ | 77,500 | | | $ | 1,952,953 | | | $ | – | | | $ | 4,186,396 | |
| Strategic Income Fund | | | | 85,578,969 | | | | – | | | | – | | | | 2,921,016 | | | | 88,499,985 | |
| High Income Fund | | | | 1,924,221 | | | | – | | | | – | | | | 407,514 | | | | 2,331,735 | |
The tax character of distributions paid by the Funds during the fiscal year ended September 30, 2019, was as follows:
| | | | Ordinary Income | | | Tax-Exempt Income | | | Distributions paid from Long-Term Capital Gain | | | Return of Capital | | | Total | |
| Core Opportunity Fund | | | $ | 5,255,331 | | | $ | 189,479 | | | $ | 27,644,230 | | | $ | – | | | $ | 33,089,040 | |
| Strategic Income Fund | | | | 101,073,877 | | | | – | | | | – | | | | – | | | | 101,073,877 | |
| High Income Fund | | | | 2,635,911 | | | | – | | | | – | | | | – | | | | 2,635,911 | |
Components of Distributable Earnings on a Tax Basis: The tax components of distributable earnings are determined in accordance with income tax regulations which may differ from the composition of net assets reported under GAAP. Accordingly, for the year ended September 30, 2020, certain differences were reclassified. The amounts reclassified did not affect net assets. The reclassifications were as follows:
| Annual Report | September 30, 2020 | 150 |
| RiverNorth Funds | Notes to Financial Statements |
September 30, 2020
| | | | Paid-in Capital | | | Total Distributable Earnings | |
| Core Opportunity Fund | | | $ | – | | | $ | – | |
| Strategic Income Fund | | | | (59,431 | ) | | | 59,431 | |
| High Income Fund | | | | – | | | | – | |
At September 30, 2020, the components of distributable earnings on a tax basis for the Funds were as follows:
| | | | Undistributed Ordinary Income | | | Accumulated Capital Gains/(Losses) | | | Net Unrealized Appreciation/ (Depreciation) | | | Other Cumulative Effect of Timing Differences | | | Total | |
| Core Opportunity Fund | | | $ | – | | | $ | 1,274,363 | | | $ | (2,732,164 | ) | | $ | (10,372 | ) | | $ | (1,468,173 | ) |
| Strategic Income Fund | | | | – | | | | (47,357,781 | ) | | | (88,220,485 | ) | | | – | | | | (135,578,266 | ) |
| High Income Fund | | | | – | | | | (5,588,456 | ) | | | (837,357 | ) | | | (428,930 | ) | | | (6,854,743 | ) |
Capital Losses: As of September 30, 2020, the following Funds had capital loss carryforwards which may reduce the applicable Fund’s taxable income arising from future net realized gains on investments, if any, to the extent permitted by the Code and thus may reduce the amount of the distributions to shareholders which would otherwise be necessary to relieve the Funds of any liability for federal tax pursuant to the Code. The capital loss carryforwards may be carried forward indefinitely.
Capital losses carried forward were as follows:
| Fund | | | Non-Expiring Short-Term | | | Non-Expiring Long-Term | |
| Strategic Income Fund | | | $ | – | | | $ | 47,357,781 | |
| High Income Fund | | | | 694,327 | | | | 3,505,932 | |
The Rivernorth Oaktree High Income Fund elects to defer to the period ending September 30, 2021, capital losses recognized during the period November 1 through September 30, 2020 in the amount of $1,388,197.
The Rivernorth Core Opportunity Fund and Rivernorth Oaktree High Income Fund elects to defer to the period ending September 30, 2021, late year ordinary losses in the amount of $10,372 and $318,558, respectively.
| 151 | (888) 848-7569 | www.rivernorth.com |
| RiverNorth Funds | Notes to Financial Statements |
September 30, 2020
Unrealized Appreciation and Depreciation on Investments: The amount of net unrealized appreciation/(depreciation) and the cost of investment securities for tax purposes, including short-term securities at September 30, 2020, were as follows:
| Fund | | | Gross Appreciation (excess of value over tax) | | | Gross Depreciation (excess of tax cost over value) | | | Net Appreciation on Foreign Currency and Derivatives | | | Net Unrealized Appreciation/ (Depreciation) | | | Cost of Investments for Income Tax Purposes | |
| Core Opportunity Fund* | | | $ | 2,339,894 | | | $ | (5,072,058 | ) | | $ | – | | | $ | (2,732,164 | ) | | $ | 80,282,394 | |
| Strategic Income Fund* | | | | 66,308,249 | | | | (154,528,734 | ) | | | – | | | | (88,220,485 | ) | | | 1,900,114,514 | |
| High Income Fund* | | | | 867,797 | | | | (1,704,140 | ) | | | (1,014 | ) | | | (837,357 | ) | | | 47,264,782 | |
| * | The difference between book and tax basis unrealized appreciation/(depreciation) for the Funds is attributable primarily to passive foreign investment companies, wash sales, forward contract mark to market, and tax treatment of certain other investments. |
8. INVESTMENT TRANSACTIONS
Investment transactions for the year ended September 30, 2020, excluding U.S. government obligations and short-term investments, were as follows:
| Fund | | Purchases of Securities | | | Proceeds from Sales of Securities | |
| Core Opportunity Fund | | $ | 87,367,894 | | | $ | 117,252,514 | |
| Strategic Income Fund | | | 827,454,570 | | | | 921,577,141 | |
| High Income Fund | | | 37,177,993 | | | | 35,661,002 | |
Investment Transactions in long term U.S. government obligations for the year ended September 30, 2020 were as follows:
| Fund | | | Purchases of Securities | | | Proceeds from Sales of Securities | |
| Strategic Income Fund | | | | 470,736,971 | | | | 604,906,596 | |
| Annual Report | September 30, 2020 | 152 |
| RiverNorth Funds | Notes to Financial Statements |
September 30, 2020
9. INVESTMENTS IN AFFILIATED COMPANIES
The Funds may invest in certain securities that are considered securities issued by affiliated companies. As defined by the 1940 Act, an affiliated person, including an affiliated company, is one in which a Fund owns 5% or more of the outstanding voting securities, or a company which is under common ownership or control with the Fund. The purchases, sales, dividend income, capital gains, shares and value of investment in affiliated companies for the year ended September 30, 2020 were as follows:
Strategic Income Fund
Security Name | | Value as of September 30, 2019 | | | Purchases | | | Sales | | | Realized Gain/Loss | | | Change in Unrealized Gain (Loss) | | | Value as of September 30, 2020 | | | Share Balance as of September 30, 2020 | | | Distributions | |
| RiverNorth/Oaktree High Income Fund | | $ | 30,156,442 | | | $ | 1,451,014 | | | $ | – | | | $ | – | | | $ | (1,896,909 | ) | | $ | 30,155,295 | | | | 3,318,436 | | | $ | 1,451,014 | |
| | | | | | | | | | | | | | | $ | – | | | $ | (1,896,909 | ) | | $ | 30,155,295 | | | | 3,518,436 | | | $ | 1,451,014 | |
10. REVOLVING LINE OF CREDIT
On April 8, 2014, the Funds entered into a $100,000,000 committed, unsecured Revolving Credit Agreement with State Street Bank & Trust, Co. The Revolving Credit Agreement was amended on April 17, 2015, April 5, 2016, April 4, 2017, April 3, 2018, April 2, 2019 and on March 31, 2020. The Revolving Credit Agreement expires on March 30, 2021. Borrowings under this arrangement bear interest at the higher of the Federal Funds Rate and the One-Month LIBOR Rate in effect on the day the loan is made plus 1.25%, which was 1.40% at September 30, 2020. From October 1, 2019 through September 30, 2020, the Funds paid a facility fee on unloaned balances equal to the product of $100,000,000 less the principal amount of loans outstanding and 0.25%.
For the year ended September 30, 2020, the Funds had no borrowings under the Revolving Credit Agreement.
11. BENEFICIAL OWNERSHIP
On September 30, 2020, there were an unlimited number of no par value shares of beneficial interest authorized for each Fund. Transactions in shares of beneficial interest are shown in the Statements of Changes in Net Assets.
| 153 | (888) 848-7569 | www.rivernorth.com |
| RiverNorth Funds | Notes to Financial Statements |
September 30, 2020
The beneficial ownership, either directly or indirectly, of more than 25% of the voting securities of a fund creates a presumption of control of the fund, under Section 2(a)(9) of the Investment Company Act of 1940. Beneficial owners owning more than 25% of the voting securities for the benefit of their customers of each class of each Fund, as of September 30, 2020, are listed below:
| Fund | Shareholder Name | Percentage Interest |
| Core Opportunity Fund – Class I | Pershing | 27.09% |
| Core Opportunity Fund – Class R | Charles Schwab & Company, Inc. | 34.00% |
| Strategic Income Fund – Class I | Charles Schwab & Company, Inc. | 42.44% |
| Strategic Income Fund – Class R | Charles Schwab & Company, Inc. | 44.52% |
| High Income Fund – Class I | RiverNorth/DoubleLine Strategic Income Fund | 74.69% |
| High Income Fund – Class R | Charles Schwab & Company, Inc. | 58.44% |
12. INDEMNIFICATIONS
Under the Trust’s organizational documents, its officers and Trustees are indemnified against certain liability arising out of the performance of their duties to the Trust. Additionally, in the normal course of business, the Trust enters into contracts with service providers that may contain general indemnification clauses. The Trust’s maximum exposure under these arrangements is unknown, as this would involve future claims that may be made against the Trust that have not yet occurred.
13. LIBOR TRANSITION
Certain of the Funds’ investments, payment obligations and financing terms may be based on floating rates, such as LIBOR, Euro Interbank Offered Rate and other similar types of reference rates (each, a “Reference Rate”). On July 27, 2017, the Chief Executive of the UK Financial Conduct Authority (“FCA”), which regulates LIBOR, announced that the FCA will no longer persuade nor compel banks to submit rates for the calculation of LIBOR and certain other Reference Rates after 2021. Such announcement indicates that the continuation of LIBOR and other Reference Rates on the current basis cannot and will not be guaranteed after 2021. The transition away from Reference Rates may lead to increased volatility and illiquidity in markets that are tied to such Reference Rates and reduced values of Reference Rate-related instruments. This announcement and any additional regulatory or market changes that occur as a result of the transition away from Reference Rates may have an adverse impact on a Fund’s investments, performance or financial condition.
14. CORONAVIRUS (COVID-19) PANDEMIC
A recent outbreak of respiratory disease caused by a novel coronavirus was first detected in December 2019 and has spread internationally. The outbreak and efforts to contain its spread have resulted in closing borders and quarantines, restricting international and domestic travel, enhanced health screenings, cancelations, disrupted supply chains and customer activity, responses by businesses (including changes to operations and reducing staff), and have produced general concern and uncertainty. The impact of the coronavirus pandemic, and other epidemics and pandemics that may arise in the future could adversely affect national and global economies, individual companies and the market in general in a manner and for a period of time that cannot be foreseen at the present time and may adversely affect the value, volatility and liquidity of dividend and interest paying securities. In the event of a pandemic or an outbreak, there can be no assurance that the Funds and their service providers will be able to maintain normal business operations for an extended period of time or will not lose the services of key personnel on a temporary or long-term basis due to illness or other reasons, and could otherwise disrupt the ability of the Funds' service providers to perform essential services. Certain economic and market conditions arising out of a pandemic or outbreak could result in a Fund’s inability to achieve its investment objectives, cause the postponement of reconstitution or rebalance dates for benchmark indices, adversely affect the prices and liquidity of the securities and other instruments in which a Fund invests, negatively impact a Fund’s performance, and cause losses on your investment in a Fund. Management is monitoring the development of the pandemic, which was ongoing as of the date of the financial statements.
| Annual Report | September 30, 2020 | 154 |
| | Report of Independent Registered |
| RiverNorth Funds | Public Accounting Firm |
September 30, 2020
To the Shareholders and Board of Trustees of RiverNorth Funds
Opinion on the Financial Statements
We have audited the accompanying statements of assets and liabilities, including the schedules of investments, of RiverNorth Funds, comprising RiverNorth Core Opportunity Fund, RiverNorth/DoubleLine Strategic Income Fund, and RiverNorth/Oaktree High Income Fund (the “Funds”) as of September 30, 2020, the related statements of operations for the year then ended, the statements of changes in net assets for each of the two years in the period then ended, including the related notes, and the financial highlights for each of the five years in the period then ended (collectively referred to as the “financial statements”). In our opinion, the financial statements present fairly, in all material respects, the financial position of the each of the Funds as of September 30, 2020, the results of their operations for the year then ended, the changes in their net assets for each of the two years in the period then ended, and the financial highlights for each of the five years in the period then ended, in conformity with accounting principles generally accepted in the United States of America.
Basis for Opinion
These financial statements are the responsibility of the Funds’ management. Our responsibility is to express an opinion on the Funds’ financial statements based on our audits. We are a public accounting firm registered with the Public Company Accounting Oversight Board (United States) (“PCAOB”) and are required to be independent with respect to the Funds in accordance with the U.S. federal securities laws and the applicable rules and regulations of the Securities and Exchange Commission and the PCAOB.
We conducted our audits in accordance with the standards of the PCAOB. Those standards require that we plan and perform the audit to obtain reasonable assurance about whether the financial statements are free of material misstatement whether due to error or fraud.
Our audits included performing procedures to assess the risks of material misstatement of the financial statements, whether due to error or fraud, and performing procedures that respond to those risks. Such procedures included examining, on a test basis, evidence regarding the amounts and disclosures in the financial statements. Our procedures included confirmation of securities owned as of September 30, 2020, by correspondence with the custodian, agent banks, and brokers, or by other appropriate auditing procedures where replies from brokers or agent banks were not received. Our audits also included evaluating the accounting principles used and significant estimates made by management, as well as evaluating the overall presentation of the financial statements. We believe that our audits provide a reasonable basis for our opinion.
We have served as the auditor of one or more of RiverNorth Capital Management, LLC’s investment companies since 2006.

COHEN & COMPANY, LTD.
Cleveland, Ohio
November 27, 2020
| Annual Report | September 30, 2020 | 155 |
| RiverNorth Funds | Additional Information |
September 30, 2020 (Unaudited)
PROXY VOTING GUIDELINES
A description of the policies and procedures that the Funds used to determine how to vote proxies relating to portfolio securities and information regarding how the Funds voted proxies during the most recent 12-month period ended June 30, are available without charge upon request by (1) calling the Funds at (888) 848-7569 and (2) from Form N-PX filed by the Funds with the Securities and Exchange Commission (“SEC”) on the SEC’s website at www.sec.gov.
PORTFOLIO HOLDINGS DISCLOSURE POLICY
The Funds file a complete schedule of investments with the SEC for the first and third quarter of each fiscal year on Part F of N-PORT. The Funds’ first and third fiscal quarters end on December 31 and June 30. The Form N-PORT must be made within 60 days of the end of the quarter. The Funds’ Form N-PORT is available on the SEC’s website at www.sec.gov. You may also obtain copies by calling the Funds at 1-888-848-7569.
UNAUDITED TAX INFORMATION
The RiverNorth Core Opportunity Fund designated the following for federal income tax purposes for the year ended September 30, 2020:
| | Foreign Taxes Paid | Foreign Source Income |
| RiverNorth Core Opportunity Fund | $53,573 | $376,101 |
| | Tax-Exempt Percentage |
| RiverNorth Core Opportunity Fund | 3.47% |
Of the distributions paid by the Funds from ordinary income for the calendar year ended December 31, 2019, the following percentages met the requirements to be treated as qualifying for the corporate dividends received deduction and qualified dividend income:
| | Dividend Received Deduction | Qualified Dividend Income |
| RiverNorth Core Opportunity Fund | 14.23% | 27.33% |
| RiverNorth/DoubleLine Strategic Income Fund | 0.56% | 1.17% |
| RiverNorth/Oaktree High Income Fund | 0.93% | 1.12% |
In early 2020, if applicable, shareholders of record received this information for the distributions paid to them by the Funds during the calendar year 2019 via Form 1099. The Funds will notify shareholders in early 2021 of amounts paid to them by the Funds, if any, during the calendar year 2020.
Pursuant to Section 852(b)(3) of the Internal Revenue Code, RiverNorth Core Opportunity Fund designated $1,952,953 as long-term capital gain dividends.
| 156 | (888) 848-7569 | www.rivernorth.com |
| RiverNorth Funds | Liquidity Risk Management Program |
September 30, 2020 (Unaudited)
The Funds have implemented a liquidity risk management program (the “LRM Program”) as required by Rule 22e-4 under the Investment Company Act of 1940, as amended. The LRM Program’s principal objectives include assessing, managing, and periodically reviewing each Fund’s liquidity risk. Liquidity risk is defined as the risk that a Fund could not meet shareholder redemption requests without significant dilution of remaining shareholders’ interests in the Fund.
In accordance with the requirements of Rule 22e-4, the program administrator conducted an annual review of the LRM Program and, in August 2020, provided the Board of Trustees (the “Board”) with a report addressing the operation of the LRM Program and assessing its adequacy and effectiveness of implementation for the first year of operation. Among other things, the program administrator reported to the Board as to the following:
| ● | each Fund had sufficient liquidity to both meet redemptions and operate effectively on behalf of their respective shareholders; |
| ● | there were no material changes to the LRM Program during the period; |
| ● | each Fund’s strategy continued to be effective for an open-end mutual fund; |
| | ● | the implementation of the LRM Program was effective to manage each Fund’s liquidity risk and remains reasonably designed to manage each Fund’s liquidity risk; |
| ● | the LRM Program includes provisions reasonably designed to comply with the 15% limit on illiquid investments and for determining, periodically reviewing and complying with the highly liquid investment minimum requirements; |
| ● | on the basis of the review conducted, it was recommended that the highly liquid investment minimum for each Fund be reduced to 25% and that the LRM Program be amended to allow for an internal assessment of liquidity by the adviser for any security not reported by a liquidity vendor; and |
| ● | the LRM Program operated adequately during the period and was effective in assessing, monitoring and managing the liquidity risk of each Fund’s portfolio. |
There can be no assurance that the LRM Program will achieve its objectives in the future. Please refer to the Funds’ prospectuses for more information regarding the Funds’ exposure to liquidity risk and other principal risks to which an investment in the Funds may be subject.
| Annual Report | September 30, 2020 | 157 |
| RiverNorth Funds | Trustees and Officers |
September 30, 2020 (Unaudited)
The following table provides information regarding each Trustee who is not an “interested person” of the Fund, as defined in the 1940 Act.
INDEPENDENT TRUSTEES
Name, Address1 and Year of Birth | Position(s) Held with the Fund | Term of Office/Length of Time Served | Principal Occupation(s) During Past 5 Years | Number of Portfolios in Fund Complex Overseen by Trustee2 | Other Directorships Held by Trustee During the Past 5 Years |
John K. Carter Y.O.B. 1961 | Trustee | Indefinite/ January 2013 to present | Managing Partner, Law Office of John K. Carter, P.A. (a general practice and corporate law firm) (2015 to present); Managing Partner, Global Recruiters of St. Petersburg (a financial services consulting and recruiting firm) (2012 to 2015). | 9 | RiverNorth Managed Duration Municipal Income Fund Inc. (1 fund) (2019 to present); RiverNorth Opportunistic Municipal Income Fund, Inc. (1 fund) (2018 to present); Carillon Mutual Funds (12 funds) (2016 to present); RiverNorth Specialty Finance Corporation (1 fund) (2016 to present); RiverNorth/DoubleLi ne Strategic Opportunity Fund, Inc. (1 fund) (2016 to present); RiverNorth Opportunities Fund, Inc. (1 fund) (2013 to present); RiverNorth Flexible Municipal Income Fund, Inc. (2020 to present). |
James G. Kelley Y.O.B. 1948 | Trustee | Indefinite/ December 2006 to present | Certified Business Coach, JGK & Associates (2000 to present). | 3 | Member, Illinois Board of Examiners (2012 to present); Chair (2017 to present). |
| 158 | (888) 848-7569 | www.rivernorth.com |
| RiverNorth Funds | Trustees and Officers |
September 30, 2020 (Unaudited)
INDEPENDENT TRUSTEES
Name, Address1 and Year of Birth | Position(s) Held with the Fund | Term of Office/Length of Time Served | Principal Occupation(s) During Past 5 Years | Number of Portfolios in Fund Complex Overseen by Trustee2 | Other Directorships Held by Trustee During the Past 5 Years |
John S. Oakes Y.O.B. 1943 | Trustee; Lead Independent Trustee | Indefinite/ December 2010 to present | Principal, Financial Search and Consulting (a recruiting and consulting firm) (2013 to present). | 9 | RiverNorth Managed Duration Municipal Income Fund Inc. (1 fund) (2019 to present); RiverNorth Opportunistic Municipal Income Fund, Inc. (1 fund) (2018 to present); RiverNorth Specialty Finance Corporation (1 fund) (2016 to present); RiverNorth/ DoubleLine Strategic Opportunity Fund, Inc. (1 fund) (2016 to present); RiverNorth Opportunities Fund, Inc. (1 fund) (2013 to present); RiverNorth Flexible Municipal Income Fund, Inc. (2020 to present). |
| Annual Report | September 30, 2020 | 159 |
| RiverNorth Funds | Trustees and Officers |
September 30, 2020 (Unaudited)
INDEPENDENT TRUSTEES
Name, Address1 and Year of Birth | Position(s) Held with the Fund | Term of Office/Length of Time Served | Principal Occupation(s) During Past 5 Years | Number of Portfolios in Fund Complex Overseen by Trustee2 | Other Directorships Held by Trustee During the Past 5 Years |
David M. Swanson Y.O.B. 1957 | Trustee | Indefinite/ November 2018 to present | Founder & Managing Partner of SwanDog Strategic Marketing (marketing consulting firm) (2006 to present). | 9 | RiverNorth Managed Duration Municipal Income Fund Inc. (1 fund) (2019 to present); RiverNorth Specialty Finance Corporation (1 fund) (2018 to present); RiverNorth/ DoubleLine Strategic Opportunity Fund, Inc. (1 fund) (2018 to present); RiverNorth Opportunities Fund, Inc. (1 fund) (2013 to present); RiverNorth Opportunistic Municipal Income Fund, Inc. (1 fund) (2018 to present); Managed Portfolio Series (38 funds) (2011 to present); RiverNorth Flexible Municipal Income Fund, Inc. (2020 to present); ALPS Variable Investment Trust (9 funds) (2006 to present). |
| 1 | The mailing address of each Trustee is 325 N. LaSalle Street, Suite 645, Chicago, IL 60654. |
| 2 | The Fund Complex consists of the RiverNorth Core Opportunity Fund, the RiverNorth/DoubleLine Strategic Income Fund, and the RiverNorth/Oaktree High Income Fund, each a series of RiverNorth Funds, RiverNorth Opportunities Fund, Inc., RiverNorth DoubleLine Strategic Opportunity Fund, Inc., RiverNorth Opportunistic Municipal Income Fund, Inc., RiverNorth Managed Duration Municipal Income Fund, Inc., RiverNorth Specialty Finance Corporation, and Rivernorth Flexible Municipal Income Fund, Inc. |
| 160 | (888) 848-7569 | www.rivernorth.com |
| RiverNorth Funds | Trustees and Officers |
September 30, 2020 (Unaudited)
The following table provides information regarding each Trustee who is an “interested person” of the Trust, as defined in the 1940 Act, and each officer of the Trust.
INTERESTED TRUSTEE AND OFFICERS
Name, Address1 and Year of Birth | Position(s) Held with the Fund | Term of Office/Length of Time Served | Principal Occupation(s) During Past 5 Years | Number of Portfolios in Fund Complex Overseen by Trustee2 | Other Directorships Held by Trustee During the Past 5 Years |
Patrick W. Galley3 Y.O.B. 1975 | President, Principal Executive Officer and Trustee | Indefinite/ July 2006 to present | Chief Executive Officer, Rivernorth Capital Management, LLC (Since 2020); Chief Investment Officer, RiverNorth Capital Management, LLC (2004 to present); Board of Managers of RiverNorth Capital Management, LLC and RiverNorth Securities, LLC (since 2010) and Board of Directors RiverNorth Holdings, Co. (since 2010). | 9 | RiverNorth Managed Duration Municipal Income Fund Inc. (1 fund) (2019 to present); RiverNorth Opportunistic Municipal Income Fund, Inc. (1 fund) (2018 to present); RiverNorth Specialty Finance Corporation (1 fund) (2016 to present); RiverNorth/Do ubleLine Strategic Opportunity Fund, Inc. (1 fund) (2016 to present); RiverNorth Opportunities Fund, Inc. (1 fund) (2013 to present); RiverNorth Flexible Municipal Income Fund, Inc. (2019 to present). |
| Annual Report | September 30, 2020 | 161 |
| RiverNorth Funds | Trustees and Officers |
September 30, 2020 (Unaudited)
INTERESTED TRUSTEE AND OFFICERS
Name, Address1 and Year of Birth | Position(s) Held with the Fund | Term of Office/Length of Time Served | Principal Occupation(s) During Past 5 Years | Number of Portfolios in Fund Complex Overseen by Trustee2 | Other Directorships Held by Trustee During the Past 5 Years |
Jonathan M. Mohrhardt Y.O.B. 1974 | Treasurer and Chief Financial Officer | Indefinite/ February 2009 to present | President, RiverNorth Capital Management, LLC (Since 2020); Chief Operating Officer, RiverNorth Capital Management, LLC (Since 2011). | NA | NA |
Marcus L. Collins Y.O.B. 1968 | Chief Compliance Officer; Secretary | Indefinite/ May 2012 to Present; Indefinite/ January 2017 to Present | General Counsel, RiverNorth Capital Management, LLC (2012 to present), Chief Compliance Officer, RiverNorth Capital Management, LLC (2012 to present). | NA | NA |
| 1 | The mailing address of each Trustee and officer, unless otherwise noted, is 325 N. LaSalle Street, Suite 645, Chicago, IL 60654. |
| 2 | The Fund Complex consists of the RiverNorth Core Opportunity Fund, the RiverNorth/DoubleLine Strategic Income Fund, and the RiverNorth/Oaktree High Income Fund, each a series of the RiverNorth Funds Trust, and the RiverNorth Opportunities Fund, Inc., RiverNorth DoubleLine Strategic Opportunity Fund, Inc., RiverNorth Opportunistic Municipal Income Fund, Inc., RiverNorth Managed Duration Municipal Income Fund, Inc., the RiverNorth Specialty Finance Corporation, and RiverNorth Flexible Municipal Income Fund, Inc. |
| 3 | Patrick W. Galley is considered an "Interested” Trustee as defined in the Investment Company Act of 1940, as amended, because he is an officer of the Trust and Chief Investment Officer of the Funds’ investment adviser. |
The Statement of Additional Information includes additional information about the Trust’s Trustees and is available, without charge, upon request by calling (toll-free) 1-888-848-7569.
| 162 | (888) 848-7569 | www.rivernorth.com |
Intentionally Left Blank
Intentionally Left Blank
Intentionally Left Blank
RiverNorth Funds
RiverNorth Core Opportunity Fund
RiverNorth/DoubleLine Strategic Income Fund
RiverNorth/Oaktree High Income Fund
Board of Trustees
Patrick W. Galley, CFA, Chairman
James G. Kelley
John S. Oakes
David M. Swanson
John K. Carter
Investment Adviser
RiverNorth Capital Management, LLC
Sub Advisers
DoubleLine Capital LP
Oaktree Capital Management, L.P.
Transfer Agent, Administrator and
Dividend Disbursing Agent
ALPS Fund Services, Inc.
Distributor
ALPS Distributors, Inc.
Custodian
State Street Bank & Trust
Independent Registered
Public Accounting Firm
Cohen & Company, Ltd.
This report is provided for the general information of the shareholders of the RiverNorth Funds. This report is not intended for distribution to prospective investors in the Funds, unless preceded or accompanied by an effective prospectus.
| (a) | The registrant, as of the end of the period covered by this report, has adopted a code of ethics that applies to the registrant's principal executive officer, principal financial officer, principal accounting officer or controller or any persons performing similar functions on behalf of the registrant. |
| (b) | For purposes of this item, “code of ethics” means written standards that are reasonably designed to deter wrongdoing and to promote: |
| (1) | Honest and ethical conduct, including the ethical handling of actual or apparent conflicts of interest between personal and professional relationships; |
| (2) | Full, fair, accurate, timely, and understandable disclosure in reports and documents that a registrant files with, or submits to, the Commission and in other public communications made by the registrant; |
| (3) | Compliance with applicable governmental laws, rules, and regulations; |
| (4) | The prompt internal reporting of violations of the code of ethics to an appropriate person or persons identified in the code of ethics; and |
| (5) | Accountability for adherence to the code of ethics. |
| (c) | Amendments: During the period covered by this report, no amendments were made to the provisions of the code of ethics adopted in 2(a) above. |
| (d) | Waivers: During the period covered by this report, no implicit or explicit waivers to the provisions of the code of ethics adopted in 2(a) above were granted. |
| (f) | Availability: The code of ethics for the Officers can be obtained, free of charge by calling the toll free number for the appropriate Fund listed in that Fund’s prospectus . |
| Item 3. | Audit Committee Financial Expert. |
The registrant’s board of trustees has determined that the registrant does not have an audit committee financial expert. The committee members and the full Board considered a possibility of adding a member that would qualify as an expert. The audit committee determined that, although none of its members meet the technical definition of an audit committee expert, the committee has sufficient financial expertise to adequately perform its duties under the Audit Committee Charter without the addition of a qualified expert.
| Item 4. | Principal Accountant Fees and Services. |
| Fiscal Year | Audit Fees |
| FY 2020 | $83,653 |
| FY 2019 | $85,289 |
| Fiscal Year | Registrant |
| FY 2020 | $0 |
| FY 2019 | $0 |
| Fiscal Year | Registrant |
| FY 2020 | $15,000 |
| FY 2019 | $15,000 |
| | Nature of the Tax Fees: Preparation of tax returns |
| | | |
| (d) | All Other Fees | |
| Fiscal Year | Registrant |
| FY 2020 | $0 |
| FY 2019 | $0 |
(1) Audit Committee’s Pre-Approval Policies
The Audit Committee Charter requires the Audit Committee to be responsible for the selection, retention or termination of auditors and, in connection therewith, to (i) evaluate the proposed fees and other compensation, if any, to be paid to the auditors, (ii) evaluate the independence of the auditors, (iii) pre-approve all audit services and, when appropriate, any non-audit services provided by the independent auditors to the Trust, (iv) pre-approve, when appropriate, any non-audit services provided by the independent auditors to the Trust's investment adviser, or any entity controlling, controlled by, or under common control with the investment adviser and that provides ongoing services to the Trust if the engagement relates directly to the operations and financial reporting of the Trust, and (v) receive the auditors’ specific representations as to their independence.
(2) Percentages of Services Approved by the Audit Committee pursuant to paragraph (c)(7)(i)(C) of Rule 2-01 of Regulation S-X.
| Registrant | | |
| Audit-Related Fees: | 0% | |
| Tax Fees: | 0% | |
| All Other Fees: | 0% | |
| (f) | During the audit of the registrant's financial statements for the most recent fiscal year, less than 50 percent of the hours expended on the principal accountant's engagement were attributed to work performed by persons other than the principal accountant's full-time, permanent employees. |
| (g) | The aggregate non-audit fees billed by the registrant's accountant for services rendered to the registrant, and rendered to the registrant's investment adviser (not including any sub-adviser whose role is primarily portfolio management and is subcontracted with or overseen by another investment adviser), and any entity controlling, controlled by, or under common control with the adviser that provides ongoing services to the registrant: |
| Fiscal Year | Registrant | Adviser and Adviser Affiliated Service Providers | |
| FY 2020 | $15,000 | $0 | |
| FY 2019 | $15,000 | $0 | |
| Item 5. | Audit Committee of Listed Registrants. |
NOT APPLICABLE – applies to listed companies only
| Item 6. | Schedule of Investments. |
| (a) | The schedule of investments is included as part of the Report to Stockholders filed under Item 1 of this report. |
| Item 7. | Disclosure of Proxy Voting Policies and Procedures for Closed-End Management Investment Companies. |
NOT APPLICABLE – applies to closed-end funds only
| Item 8. | Portfolio Managers of Closed-End Management Investment Companies. |
NOT APPLICABLE – applies to closed-end funds only
| Item 9. | Purchases of Equity Securities by Closed-End Management Investment Company and Affiliated Purchasers. |
NOT APPLICABLE – applies to closed-end funds only
| Item 10. | Submission of Matters to Vote of Security Holders. |
The registrant has not adopted procedures by which shareholders may recommend nominees to the registrant’s board of trustees.
| Item 11. | Controls and Procedures. |
| (a) | Based on an evaluation of the registrant's disclosure controls and procedures (as defined in Rule 30a-3(c) under the Investment Company Act of 1940) as of a date within 90 days of the filing date of this Form N-CSR, the disclosure controls and procedures are reasonably designed to ensure that the information required in filings on Forms N-CSR is recorded, processed, summarized, and reported on a timely basis. |
| (b) | There were no significant changes in the registrant’s internal control over financial reporting that occurred during the period covered by this report that have materially affected, or are reasonably likely to materially affect, the registrant’s internal control over financial reporting. |
| Item 12. | Disclosure of Securities Lending Activities for Closed-End Management Investment Companies. |
NOT APPLICABLE – applies to closed-end funds only
SIGNATURES
Pursuant to the requirements of the Securities Exchange Act of 1934 and the Investment Company Act of 1940, the registrant has duly caused this report to be signed on its behalf by the undersigned, thereunto duly authorized.
Registrant: RiverNorth Funds
| By: | /s/ Patrick W. Galley | |
| Name: | Patrick W. Galley | |
| Title: | President | |
| | | |
| Date: | December 3, 2020 | |
Pursuant to the requirements of the Securities Exchange Act of 1934 and the Investment Company Act of 1940, this report has been signed below by the following persons on behalf of the registrant and in the capacities and on the dates indicated.
| By: | /s/ Patrick W. Galley | |
| Name: | Patrick W. Galley | |
| Title: | President & Chief Executive Officer | |
| | | |
| Date: | December 3, 2020 | |
| By: | /s/ Jonathan M. Mohrhardt | |
| Name: | Jonathan M. Mohrhardt | |
| Title: | Treasurer & Chief Financial Officer | |
| | | |
| Date: | December 3, 2020 | |