UNITED STATES
SECURITIES AND EXCHANGE COMMISSION
Washington, D.C. 20549
FORM N-CSR
CERTIFIED SHAREHOLDER REPORT OF REGISTERED
MANAGEMENT INVESTMENT COMPANIES
Investment Company Act file number: 811-21934
RiverNorth Funds
(Exact name of registrant as specified in charter)
325 North LaSalle Street, Suite 645
Chicago, IL 60654
(Address of principal executive offices) (Zip code)
Marc L. Collins
325 North LaSalle Street, Suite 645
Chicago, IL 60654
(Name and address of agent for service)
Registrant's telephone number, including area code: 312-832-1440
Date of fiscal year end: 09/30
Date of reporting period: 09/30/2018
| Item 1. | | Reports to Stockholders. |
| RiverNorth Funds | Table of Contents |
| Shareholder Letter | 2 |
| Opportunistic Closed-End Fund Strategies | |
| Portfolio Update | 4 |
| RiverNorth Core Opportunity Fund | 8 |
| RiverNorth/DoubleLine Strategic Income Fund | 13 |
| RiverNorth/Oaktree High Income Fund | 18 |
| RiverNorth Funds Schedule of Investments and Financial Statements | |
| Disclosure of Fund Expenses | 24 |
| Schedule of Investments | |
| RiverNorth Core Opportunity Fund | 26 |
| RiverNorth/DoubleLine Strategic Income Fund | 30 |
| RiverNorth/Oaktree High Income Fund | 73 |
| Statement of Assets and Liabilities | |
| RiverNorth Core Opportunity Fund | 91 |
| RiverNorth/DoubleLine Strategic Income Fund | 93 |
| RiverNorth/Oaktree High Income Fund | 95 |
| Statement of Operations | |
| RiverNorth Core Opportunity Fund | 97 |
| RiverNorth/DoubleLine Strategic Income Fund | 98 |
| RiverNorth/Oaktree High Income Fund | 99 |
| Statements of Changes in Net Assets | |
| RiverNorth Core Opportunity Fund | 100 |
| RiverNorth/DoubleLine Strategic Income Fund | 102 |
| RiverNorth/Oaktree High Income Fund | 104 |
| Financial Highlights | |
| RiverNorth Core Opportunity Fund | 106 |
| RiverNorth/DoubleLine Strategic Income Fund | 114 |
| RiverNorth/Oaktree High Income Fund | 118 |
| Notes to Financial Statements | 125 |
| Report of Independent Registered Public Accounting Firm | 145 |
| Additional Information | 146 |
| Trustees & Officers | 148 |
| RiverNorth Funds | Shareholder Letter |
September 30, 2018 (Unaudited)
Dear Fellow Shareholders,
It has been ten years since the financial crisis. Unprecedented low interest rates and low inflation have resulted in new stock market highs coupled with record low volatility. Investors investing in a passive basket of equities ten years ago in the depths of the financial crisis, would potentially have tripled their money and experienced little volatility along the way. Unfortunately, most investors missed the bulk of the bull market, as the fear of investing in the throes of the financial crisis was too difficult to overcome, despite investing rule #1: “buy low – sell high.”
Not sure about you, but we believe the next ten years will be different. While our crystal ball is murky on what asset classes will actually outperform over the next ten years, we are encouraged that closed-end fund discounts are currently attractive. Investors today can buy virtually any asset class through a closed-end fund at a significant discount to its net asset value. This includes both so called “risk-on” and “risk-off” asset classes. We are also encouraged that volatility is starting to pick up. This gives RiverNorth the opportunity to potentially extract excess returns from closed-end funds. For example, owning a fixed income closed-end fund trading at a 10% discount that narrows to 5% results in 5.6%1 of excess return in addition to the underlying asset’s performance. Of course, the discount could also widen, most likely as a result of increased volatility or fear in the marketplace. In this case, we are typically more excited to buy cheaper assets by selling non-closed-end fund exposure to buy similar exposure in a wrapper trading at a wider discount. This is what makes RiverNorth’s closed-end fund trading strategies so unique, the ability to increase and decrease closed-end fund exposure as discounts narrow and widen. Historically, the result has been the more volatility the better the opportunity to add additional return from closed-end fund discounts ebbing and flowing.
With mostly retail investors controlling the approximate $270 billion closed-end fund universe one can imagine that fear and greed gets exacerbated through closed-end fund discounts and premiums. We view this as the opportunity. Fortunately for us, we believe closed-end funds are misunderstood, presenting more pockets of opportunity. For one, many investors just look at price. Little do they understand, closed-end funds are regulated investment companies and are required to pay out almost all of their income and realized gains annually. The result may be an asymmetric price profile, meaning the chances of the price increasing over the years is unlikely (especially if it’s a fixed income fund) and the chances of it going down is very likely.
On the surface, this sounds like a poor investment until you factor in the compelling distributions investors receive every year. This is why we believe that investors should look only at total return results vs. price returns. For example, purchasing a closed-end fund at $20 per share, distributes $3 per share of realized gains and income, and has an ending price of $19 per share results in a total return of approximately 10%, despite the price going down $12. Making matters worse, most investor’s statements don’t reflect the total return and only show the change in price, which is typically lower than when they purchased the security. This statement risk only reinforces the inefficiencies in the closed-end fund universe.
Closed-end funds (CEF) in the past year have been shunned as there have only been two initial public offerings (IPOs) in the past twelve months and discounts are abound. Heeding to buy low, RiverNorth is more active now than anytime post the financial crisis putting capital to work through opportunistic investments in closed-end funds. With a backdrop of increasing interest rates, record highs in the equity markets, tight credit spreads, and very attractive closed-end fund discount levels we are more than excited about the future.
| 2 | (888) 848-7569 | www.rivernorth.com |
| RiverNorth Funds | Shareholder Letter |
September 30, 2018 (Unaudited)
We are pleased to provide you with the 2018 Annual Report for the RiverNorth Funds. The report reviews our three opportunistic closed-end strategies: the RiverNorth Core Opportunity Fund (ticker: RNCIX and RNCOX), the RiverNorth/DoubleLine Strategic Income Fund (tickers: RNSIX and RNDLX), and the RiverNorth/Oaktree High Income Fund (tickers: RNHIX and RNOTX).
Please visit www.rivernorth.com for additional information.
We thank you for your investment and trust in managing your assets.
Respectfully,
Patrick W. Galley, CFA
President and Chief Investment Officer
RiverNorth Funds
| 1 | Illustrative excess return calculation.
Assumptions:
Net Asset Value (NAV) = $20 |
| 1st Market Price (MP) trades at a 10% discount to NAV = MP1 = $20 – ($20*10%) = $18 |
| 2nd Market Price (MP) trades at a 5% discount to NAV = MP2 = $20 – ($20*5%) = $19 Excess Return = (MP2 / MP1) – 1 = ($19/$18) - 1 = 5.6% |
| 2 | In the example provided, distributions are not guaranteed. If distributions ceased, performance would be affected. |
Definitions:
Opinions and estimates offered constitute our judgment and are subject to change.
The financial crisis of 2007-2008, also known as the global financial crisis and the 2008 financial crisis, is considered by many economists to have been the worst financial crisis since the Great Depression of the 1930s.
The price at which a closed-end fund trades often varies from its NAV. Some funds have market prices below their net asset values, referred to as a discount. Conversely, come funds have market prices above their net asset values, referred to as a premium.
Risk-on risk-off refers to changes in investment activity in response to global economic patterns. During periods when risk is perceived as low, risk-on risk-off theory states that investors tend to engage in higher-risk investments; when risk is perceived as high, investors have the tendency to gravitate toward lower-risk investments.
Credit spread is the difference in yield between two bonds of similar maturity but different credit quality. Widening credit spreads indicate growing concern about the ability of corporate (and other private) borrowers to service their debt. Narrowing credit spreads indicate improving private creditworthiness.
| Annual Report | September 30, 2018 | 3 |
| RiverNorth Funds | Portfolio Update |
September 30, 2018 (Unaudited)
Closed-End Fund Market Overview and Outlook
In the past twelve months, the average closed-end fund1 reported a market price total return of 0.00% and a net asset value (NAV) total return of positive 3.03%. Looking at the category returns, the market price total return for equity+hybrid*1, taxable bond1 and municipal bond1 funds were positive 5.09%, positive 0.49% and negative 5.90%, respectively. The net asset value total returns were positive 5.89%, positive 2.86% and 0.12%, respectively. At month-end September 30, 2018, the average discount on equity+hybrid, taxable bond and municipal bond funds were 6.1%, 4.6% and 9.1%, respectively.
We have to imagine that most investors dislike closed-end funds (CEFs) today. There were very few winners over the past twelve months. Most equity funds massively underperformed the S&P 500. Many taxable bond funds have reported positive NAV returns, but negative market price returns due to discount widening. And on average, municipal funds have punished investors despite having flat NAV returns. Adding insult to injury, most bond funds lowered their distribution rate one or more times in the past year. Lower income, higher volatility and year-to-date price declines are three good reasons for many to hit the sell button, especially during tax-loss season.
But, one man’s trash is another man’s treasure. Negative sentiment in the CEFs market has pushed discounts to historically attractive levels. Over the past twenty years, the average discount on municipal bond funds has been narrower 97% of the time.2 We also see many taxable bond funds trading at double-digit discounts, including many funds with strong year-to-date net asset value total returns. We are finding less opportunity in the equity closed-end fund market, but there are pockets of value, most notably in non-US equity funds.
Looking forward, we are especially bullish on two categories of CEFs – bank loan and municipal bond funds. We have waited a long time to get aggressive on bank loan funds. We had been waiting for distributions to rise and for selling pressure to subside. Investors had plowed money into bank loan funds from 2013 to 2015 in anticipation of distribution growth. As we know now, distribution growth in bank loan CEFs did not occur until 2018 and therefore many early investors have been disappointed and their selling pressure has been an overhang for the sector. We now believe most of the selling pressure is behind us and distributions may increase. As a result, we think that discounts could narrow substantially in 2019. Although municipal bonds are basically the opposite of bank loans, we also see capital gains potential in municipal CEFs. Here we agree with the market – dividends should come down and duration is probably too high. However, we believe discounts are simply too wide. We anticipate that investors will come back to the municipal closed-end fund market as early as December and discounts should narrow through March 2019.
We are cautious on most equity and hybrid CEFs that have experienced very strong net asset value returns. We think equity CEFs are showing textbook overvaluation in this long bull market. We have seen tech heavy equity CEFs trading at 15% premiums to NAV. That’s a good sign that investors are overpaying for past performance. We believe discounts on many equity CEFs could widen out at least a couple hundred basis points if/when this bull market stumbles. RiverNorth will be waiting for future dislocations.
| 4 | (888) 848-7569 | www.rivernorth.com |
| RiverNorth Funds | Portfolio Update |
September 30, 2018 (Unaudited)
| * | Equity+ hybrid refer to the combination of equity closed-end funds and hybrid closed-end funds. For further information, please see the definition page. |
| 1 | Source: RiverNorth. Derived from Morningstar and Bloomberg data. |
| 2 | Source: Morningstar, RiverNorth |
Definitions:
Asset-Backed Securities (ABS) – ABS are bonds or notes backed by financial assets.
Bank of America Merrill Lynch Developed Markets High Yield Constrained Index – contains all securities in the BofA Merrill Lynch Global High Yield index from developed markets countries but cap issuer exposure at 2%. Developed markets is defined as an FX-G10 member, a Western European nation, or a territory of the U.S. or a Western European nation. The index tracks the performance of USD, CAD, GBP and EUR denominated below investment grade corporate debt publicly issued in the major domestic or Eurobond markets. Qualifying securities must have a below investment grade rating (based on an average of Moody's, S&P and Fitch).
Basis Point (bps or bip) – A common unit of measure for interest rates and other percentages in finance. One basis point is equal to 1/100th of 1%, or 0.01% (0.0001), and is used to denote the percentage change in a financial instrument.
Bloomberg Barclays Capital U.S. Aggregate Bond Index – The Barclays Capital U.S. Aggregate Bond Index is an unmanagedi ndex of investment-grade fixed-rate debt issues with maturities of at least one year.
Bloomberg Barclays U.S. Corporate High Yield Index – The Bloomberg Barclays US Corporate High Yield Bond Index measures the USD-denominated, high yield, fixed-rate corporate bond market.
Bullish – Investors who believe that a stock price will increase over time are said to be bullish.
Bull Market – A bull market is the condition of a financial market of a group of securities in which prices are rising or are expected to rise.
Business Development Company (BDC) – A business development company (BDC) is an organization that invests in and helps small- and medium-size companies grow in the initial stages of their development.
Collateralized Loan Obligation (CLO) – a security backed by a pool of debt, often low-rated corporate loans. The investor receives scheduled debt payments from the underlying loans but assumes most of the risk in the event that borrowers default.
Collateralized Mortgage Obligation (CMO) – A CMO refers to a type of mortgage-backed security that contains a pool of mortgages bundled together and sold as an investment.
Commercial Mortgage Backed Securities (CMBS) – Commercial mortgage-backed securities (CMBS) are a type of mortgage-backed security that is secured by mortgages on commercial properties, instead of residential real estate.
| Annual Report | September 30, 2018 | 5 |
| RiverNorth Funds | Portfolio Update |
September 30, 2018 (Unaudited)
Coupon – A coupon is the annual interest rate paid on a bond, expressed as a percentage of the face value.
Credit Suisse Leveraged Loan Index – tracks the investable market of the U.S. dollar denominated leveraged loan market. It consists of issues rated "5B" or lower, meaning that the highest rated issues included in this index are Moody's/S&P ratings of Baa1/BB+ or Ba1/BBB+. All loans are funded term loans with a tenor of at least one year and are made by issuers domiciled in developed countries.
Default – the failure to promptly pay interest or principal when due.
Discount – The price at which a closed-end fund trades often varies from its net asset value (NAV). The price is said to be a discount to the NAV when it is below the NAV.
Duration – Duration is a measure of the sensitivity of the price of a fixed income investment to a change in interest rates.
Equity Closed-End Funds – Domestic equity closed-end funds are defined as funds investing their assets primarily in U.S. equity securities; generally, these funds are seeking long-term capital appreciation rather than income.
Federal Funds Rate – the interest rate at which a depository institution lends funds maintained at the Federal Reserve to another depository institution overnight.
High Yield Corporates – A high-yield corporate bond is a type of corporate bond that offers a higher rate of interest because of its higher risk of default.
Hybrid Closed-End Funds – Hybrid closed-end funds are funds investing in both equity and fixed-income securities in U.S. and foreign countries, with an emphasis on developed countries. Funds are categorized into this peer group if they have a policy of investing no more than 70% of their assets in either equities or fixed income.
LIBOR – is the world’s most widely-used benchmark for short-term interest rates. It serves as the primary indicator for the average rate at which banks that contribute to the determination of LIBOR may obtain short-term loans in the London interbank market.
Morningstar U.S. Fund Allocation Category - 50% to 70% Equity – Funds in allocation categories seek to provide both income and capital appreciation by investing in multiple asset classes, including stocks, bonds, and cash. These portfolios are dominated by domestic holdings and have equity exposures between 50% and 70%.
Mortgage-Backed Securities (MBS) – MBS are asset-backed securities that are secured by a mortgage or collection of mortgages.
Par – Par is a term that refers to a financial instrument that is trading at its face value.
| 6 | (888) 848-7569 | www.rivernorth.com |
| RiverNorth Funds | Portfolio Update |
September 30, 2018 (Unaudited)
Residential Mortgage-Backed Securities (RMBS) – RMBS are a type of mortgage-backed debt obligation whose cash flows come from residential debt, such as mortgages, home-equity loans and subprime mortgages.
S&P 500 Index – The S&P 500 is a capitalization-weighted index of 500 stocks. The index is designed to measure performance of the broad domestic economy based on the changing aggregate market value of these 500 stocks. The index cannot be invested in directly and does not reflect fees and expenses.
Sector Spread – The spread between the interest rate offered in two sectors of the bond market for issues of the same maturity.
Senior Loan – A senior loan is a debt financing obligation issued by a bank or similar financial institution to a company or individual that holds legal claim to the borrower's assets above all other debt obligations.
Special-Purpose Acquisition Company (SPAC) – A special-purpose acquisition company uses an initial public offering (IPO) to raise money it will use to purchase or merge with an existing company.
Subprime Loan – a type of loan that is offered at a higher interest rate to individuals who do not qualify for prime rate loans. Subprime borrowers are often turned away from traditional lenders because of their low credit ratings or other factors that suggest that they have a reasonable chance of defaulting on the debt repayment.
U.S. Treasuries – Negotiable U.S. Government debt obligations, backed by its full faith and credit.
U.S. Treasury Curve – The U.S. Treasury yield curve compares the yields of short-term Treasury bills with long-term Treasury notes and bonds.
Yield – The yield is the income return on an investment. This refers to the interest or dividends received from a security and is usually expressed annually as a percentage based on the investment's cost, its current market value or its face value.
| Annual Report | September 30, 2018 | 7 |
| RiverNorth Funds | Portfolio Update |
September 30, 2018 (Unaudited)
RiverNorth Core Opportunity Fund
What is the RiverNorth Core Opportunity Fund's investment strategy?
The RiverNorth Core Opportunity Fund ("the Fund") invests in a broad range of equity, fixed income and short-term securities. To implement the Fund's tactical asset allocation, the adviser generally invests in closed-end funds (CEF), exchange-traded funds (ETF) and business development companies (BDC). Additionally, the Fund also invests in special-purpose acquisition companies (SPAC).
How did the RiverNorth Core Opportunity Fund perform relative to its benchmark during the reporting period?
For the twelve month period ended September 30, 2018, the Class I share (symbol: RNCIX) returned 5.92% and the Class R share (symbol: RNCOX) returned 5.70%. The S&P 500 Index returned 17.91%, and the Morningstar U.S. Fund Allocation Category - 50% to 70% Equity returned 6.52% during the same period. Funds in allocation categories seek to provide both income and capital appreciation by investing in multiple asset classes, including stocks, bonds, and cash. These portfolios are dominated by domestic holdings and have equity exposures between 50% and 70%.
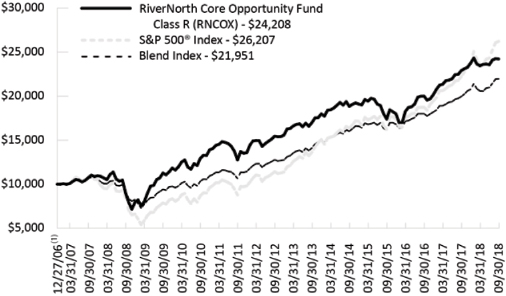
Comparison of a $10,000 Investment in the RiverNorth Core Opportunity Fund Class R, the Blend Index, and the S&P 500® Index.
| 8 | (888) 848-7569 | www.rivernorth.com |
| RiverNorth Funds | Portfolio Update |
September 30, 2018 (Unaudited)
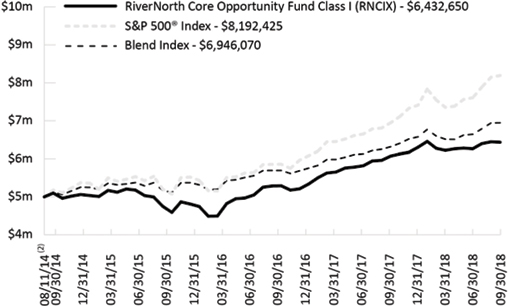
Comparison of a $5,000,000 Investment in the RiverNorth Core Opportunity Fund Class I, the Blend Index, and the S&P 500® Index.
Average Annual Total Returns for Periods Ended September 30, 2018
| | 1-Year | 3-Year | 5-Year | 10 Year | Since
Inception(1)(2) |
| RiverNorth Core Opportunity Fund – Class I (RNCIX)(3) | 5.92% | 11.91% | 7.58% | 10.68% | 8.07% |
| RiverNorth Core Opportunity Fund – Class R (RNCOX) | 5.70% | 11.65% | 7.32% | 10.41% | 7.81% |
| Blend Index(4) | 9.99% | 10.77% | 9.22% | 8.91% | 6.95% |
| S&P 500® Index(4) | 17.91% | 17.31% | 13.95% | 11.97% | 8.54% |
| (1) | Inception date of Class R is December 27, 2006. |
| (2) | Inception date of Class I is August 11, 2014. |
| (3) | In presenting performance information for the newer Institutional share class of the Fund, the Fund includes, for periods prior to the offering of the Institutional share class, the operating expense ratio and performance of the Fund’s Retail share class, adjusted to reflect the class-related operating expenses of the Institutional share class. Actual expense differentials across classes will vary over time. The performance of the Fund’s newer Institutional share class would have been substantially similar to the performance of the Fund’s Retail share class because both share classes of the Fund are invested in the same portfolio of securities and would have differed only to the extent that the classes do not have the same expenses (although differences in expenses between share classes may change over time). |
| Annual Report | September 30, 2018 | 9 |
| RiverNorth Funds | Portfolio Update |
| | September 30, 2018 (Unaudited) |
| (4) | Blend Index consists of 60% S&P 500® Index and 40% Bloomberg Barclays Capital U.S. Aggregate Bond Index. S&P 500® Index is a capitalization-weighted index of 500 stocks. The Bloomberg Barclays Capital U.S. Aggregate Bond Index is an unmanaged index of investment-grade fixed-rate debt issues with maturities of at least one year. This unmanaged index does not reflect fees and expenses. The S&P 500® and Blend Indices are indices only and cannot be invested in directly. |
Performance data quoted represents past performance, which is not a guarantee of future results. Current performance may be lower or higher than the performance quoted. The principal value and investment return of an investment will fluctuate so that your shares, when redeemed, may be worth more or less than their original cost. You can obtain performance data current to the most recent month end by calling (888) 848-7569 or www.rivernorth.com. Total return measures net investment income and capital gain or loss from portfolio investments. All performance shown assumes reinvestment of dividends and capital gains distributions and does not reflect the deduction of taxes that a shareholder would pay on fund distributions or the redemption of fund shares.
The Total Annual Fund Operating Expense for the Fund as disclosed in the prospectus dated January 28, 2018: 2.39% (RNCIX), 2.64% (RNCOX). In presenting expense information for the newer Institutional share class of the Fund, the Fund includes, for periods prior to the offering of the Institutional share class, the operating expense ratio of the Fund’s Retail share class, adjusted to reflect the class-related operating expenses of the Institutional share class. Actual expense differentials across share classes will vary over time. The annualized net expense ratio in this annual report dated September 30, 2018 is 1.17% (RNCIX) and 1.41% (RNCOX). The expense ratio as disclosed in the Fund’s annual report dated September 30, 2018 only includes the direct expenses paid by shareholders from their investment. The expense ratio as disclosed in the Fund’s prospectus dated January 28, 2018 is required to include the indirect expenses of investing in underlying funds.
What contributing factors were responsible for the RiverNorth Core Opportunity Fund's relative performance during the period?
With respect to the equity portion of the portfolio, discount narrowing among high distribution US equity focused CEFs contributed to performance over the period. The biggest detractor from performance was the Fund’s exposure to emerging market equity funds.
With respect to the fixed income portion of the portfolio, relative performance benefitted from the net asset value (NAV) returns of CEFs in lower credit quality sectors, such as high yield and bank loan funds, as the NAV returns of funds in these sectors generally outperformed the Barclays Capital U.S. Aggregate Bond Index. However, discount widening in general among fixed income CEFs detracted from performance, as did exposure to emerging market income CEFs.
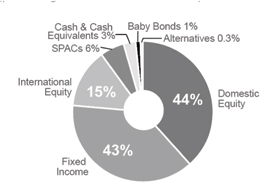
How was the RiverNorth Core Opportunity Fund positioned at the end of September 2018?
We have allocated 59% of the portfolio to equity, 43% to fixed income, 6% to Special Purpose Acquisition Companies and 3% to cash. Closed-end fund exposure was 54%. Allocations exceed 100% due to leverage utilized by the underlying funds.
We have reduced our exposure to equity CEFs over the past year as discounts have narrowed, and increased exposure to equity ETFs. We also reduced cash and added exposure to Special Purpose Acquisition Companies.
| 10 | (888) 848-7569 | www.rivernorth.com |
| RiverNorth Funds | Portfolio Update |
| | September 30, 2018 (Unaudited) |
Investment Vehicle Allocation(1) (percentages are based on net assets)
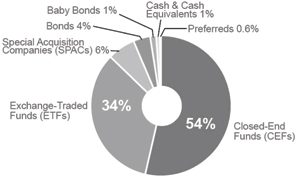
The allocation does not add up to 100% due to rounding.
Asset Class Allocation(1) (percentages are based on net assets)
Fixed Income Allocation(1)(2) (percentages are based on net assets)
The allocation does not add up to 100% as it reflects the estimated leverage utilized by the underlying funds and the effects of a total return swap.
Portfolio detail statistics are estimates made by the adviser and are subject to change.
| (1) | Convertible Security Risk – the market value of convertible securities adjusts with interest rates and the value of the underlying stock. Exchange Traded Note Risk – exchange traded notes represent unsecured debt of the issuer and may be influenced by interest rates, credit ratings of the issuer or changes in value of the reference index. Fixed Income Risk – the market value of fixed income securities adjusts with interest rates and the securities are subject to issuer default. Foreign/Emerging Market Risk – foreign securities may be subject to inefficient or volatile markets, different regulatory regimes or different tax policies. These risks may be enhanced in emerging markets. Management Risk – there is no guarantee that the adviser’s investment decisions will produce the desired results. Large Shareholder Purchase and Redemption Risk – The Fund may experience adverse effects when certain large shareholders purchase or redeem large amounts of shares of the Fund. Market Risk – economic conditions, interest rates and political events may affect the securities markets. REIT Risk – the value of REITs changes with the value of the underlying properties and changes in interest rates and are subject to additional fees. Security Risk – The value of the Fund may decrease in response to the activities and financial prospects of individual securities in the Fund’s portfolio. Short Sale Risk – short positions are speculative, are subject to transaction costs and are riskier than long positions in securities. Small-Cap Risk – small- cap companies are more susceptible to failure, are often thinly traded and have more volatile stock prices. Structured Notes Risk – because of the imbedded derivative feature, structured notes are subject to more risk than investing in a simple note or bond. Swap Risk – swap agreements are subject to counterparty default risk and may not perform as intended. Underlying Fund Risk – underlying funds have additional fees, may utilize leverage, may not correlate to an intended index and may trade at a discount to their net asset values. |
| Annual Report | September 30, 2018 | 11 |
| RiverNorth Funds | Portfolio Update |
| | September 30, 2018 (Unaudited) |
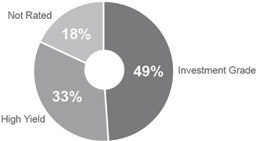
| (2) | Credit quality allocation reflects a fixed-income portfolio weighted average of the credit breakdown of each closed-end fund as provided by the adviser of said closed-end fund. If a credit breakdown is not provided by the adviser, Bloomberg is used. Investment grade refers to a bond rated BBB- or higher by Standard & Poor’s or Baa3 or higher by Moody’s. High yield refers to a bond rate lower than investment grade. For more information about securities ratings, please see the Fund’s Statement of Additional information at www.rivernorth.com. |
| 12 | (888) 848-7569 | www.rivernorth.com |
| RiverNorth Funds | Portfolio Update |
| | September 30, 2018 (Unaudited) |
RiverNorth/DoubleLine Strategic Income Fund
What is the RiverNorth/DoubleLine Strategic Income Fund's investment strategy?
The RiverNorth/DoubleLine Strategic Income Fund ("the Fund") invests in a broad range of fixed income securities of U.S. and foreign issuers, including closed-end funds (“CEFs”).
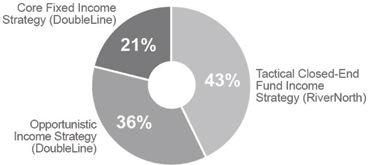
Assets of the Fund are tactically managed across three strategies (or sleeves). RiverNorth oversees the strategy weights and manages the Tactical Closed-End Fund Income Strategy. The RiverNorth strategy provides diversified exposure to the fixed income market through opportunistic investments in bond CEFs, and business development companies (BDC). Sector allocations are based on RiverNorth's assessment of relative value among asset classes and CEFs. Jeffrey Gundlach, CEO and CIO of DoubleLine, and his team oversee the Opportunistic Income and Core Fixed Income Strategies. The Opportunistic Income Strategy seeks to achieve positive absolute returns and is managed without duration constraints. The Core Fixed Income Strategy incorporates an active asset allocation approach in an effort to mitigate risk and achieve the highest possible risk-adjusted returns.
How did the RiverNorth/DoubleLine Strategic Income Fund perform relative to its benchmark during the reporting period?
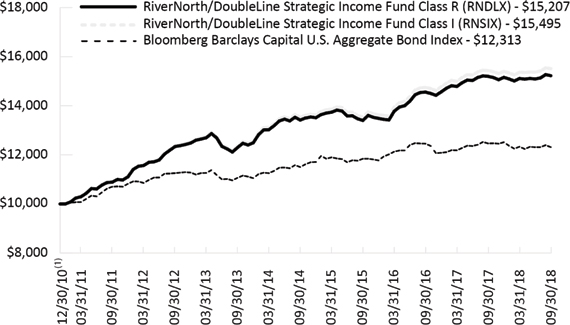
For the twelve month period ended September 30, 2018, the Class I share (symbol: RNSIX) returned 0.33% and the Class R share (symbol: RNDLX) returned 0.07%. The Bloomberg Barclays Capital U.S. Aggregate Bond Index returned -1.22%, during the same period.
Comparison of a $10,000 Investment in the RiverNorth/DoubleLine Strategic Income Fund and the Barclays Capital U.S. Aggregate Bond Index
| Annual Report | September 30, 2018 | 13 |
| RiverNorth Funds | Portfolio Update |
| | September 30, 2018 (Unaudited) |
Average Annual Total Returns for Periods Ended September 30, 2018
| | 1-Year | 3-Year | 5-Year | Since
Inception(1) |
| RiverNorth/DoubleLine Strategic Income Fund – Class I (RNSIX) | 0.33% | 4.61% | 4.61% | 5.81% |
| RiverNorth/DoubleLine Strategic Income Fund – Class R (RNDLX) | 0.07% | 4.31% | 4.34% | 5.56% |
| Bloomberg Barclays Capital U.S. Aggregate Bond Index(2) | -1.22% | 1.31% | 2.16% | 2.72% |
| (1) | Inception date is December 30, 2010. |
| (2) | The Bloomberg Barclays Capital U.S. Aggregate Bond Index is an unmanaged index of investment-grade fixed-rate debt issues with maturities of at least one year. The index cannot be invested in directly and does not reflect fees and expenses. |
Performance data quoted represents past performance, which is not a guarantee of future results. Current performance may be lower or higher than the performance quoted. The principal value and investment return of an investment will fluctuate so that your shares, when redeemed, may be worth more or less than their original cost. You can obtain performance data current to the most recent month end by calling (888) 848-7569 or www.rivernorth.com. Total return measures net investment income and capital gain or loss from portfolio investments. All performance shown assumes reinvestment of dividends and capital gains distributions and does not reflect the deduction of taxes that a shareholder would pay on fund distributions or the redemption of fund shares.
The Total Annual Fund Operating Expense for the Fund as disclosed in the prospectus dated January 28, 2018: 1.61% (RNSIX), 1.86% (RNDLX). The annualized net expense ratio in this annual report dated September 30, 2018 is 0.86% (RNSIX) and 1.11% (RNDLX). The expense ratio as disclosed in the Fund’s annual report dated September 30, 2018 only includes the direct expenses paid by shareholders from their investment. The expense ratio as disclosed in the Fund’s prospectus dated January 28, 2018 is required to include the indirect expenses of investing in underlying funds.
What contributing factors were responsible for the RiverNorth/DoubleLine Strategic Income Fund's relative performance during the period?
RiverNorth Tactical Closed-End Fund Income Sleeve
The RiverNorth sleeve’s performance relative to the Fund’s index benefitted from exposure to CEFs that invest in securities with lower credit quality, as this area of the market outperformed the Fund’s benchmark index over the year. Discount widening among fixed income CEFs detracted from performance, as did exposure to emerging market income CEFs.
DoubleLine Opportunistic Income Sleeve
For the 12-month period ended September 30, 2018, the Rivernorth Opportunistic Income portfolio outperformed the Bloomberg Barclays Aggregate Bond Index return of -1.22%. The positive performance was driven by interest carry from non-agency residential mortgage-backed securities (RMBS) and the increased valuations on Puerto Rico Municipals. Other securitized credit sectors were also accretive to returns due to interest income. Prices were generally down across the portfolio as the U.S. Treasury curve flattened with 2-year and 10-year yields up 134 basis points (bps) and 73 bps, respectively. Agency MBS were the largest detractors to performance due to their longer duration profile. Subprime securities within non-Agency RMBS outperformed as prices increased.
| 14 | (888) 848-7569 | www.rivernorth.com |
| RiverNorth Funds | Portfolio Update |
| | September 30, 2018 (Unaudited) |
DoubleLine Core Fixed Income Sleeve
The Fund outperformed the Bloomberg Barclays U.S. Aggregate Bond Index’s return of -1.22% over the 12-month period ended September 30, 2018. The outperformance can largely be attributed to a combination of being underweight duration relative to the benchmark, and strong performance from sectors such as Collateralized Loan Obligations (CLO), Commercial Mortgage Backed Securities (CMBS), and Residential Mortgage Backed Securities (RMBS). While a small allocation, High Yield Corporates were also a positive contributor to the portfolio further adding to outperformance. Of note, allocations to CLOs increased on three separate occasions throughout the year, starting at 4% of the portfolio and finishing the year at 8.5%. Over the past 12-months, the US yield curve flattened by 61bps with the 2-year portion rising 134bps and the 10-year portion rising 73bps. With the exception of Emerging Markets, spreads on risk assets were tighter across the board year over year. As to be expected during a period of rising rates and spread compression, the only sector that did not outperform the overall benchmark was U.S. Treasuries. Allocation decreases relative to the prior year were to U.S. Treasuries and Agency RMBS.
How was the RiverNorth/DoubleLine Strategic Income Fund positioned at the end of September 2018?
We have allocated 43%, 36% and 21% to the Tactical Closed-end Fund, Opportunistic Income and Core Fixed Income sleeves, respectively. Compared to one year ago, the Fund holds less cash and has a higher exposure to corporate credit, municipal bonds, and government bonds.
Strategy (“Sleeve”) Allocation
| Annual Report | September 30, 2018 | 15 |
| RiverNorth Funds | Portfolio Update |
| | September 30, 2018 (Unaudited) |
Credit Quality Distribution(1)(2) (percentages are based on net assets)
Totals may not add up to 100% due to rounding.
Sector Breakdown(1) (percentages are based on net assets)
The allocation does not add up to 100% as it reflects the estimated leverage utilized by the underlying funds and the effects of a total return swap.
Portfolio detail statistics are estimates made by the adviser and are subject to change.
| (1) | Asset-Backed Security Risk – the risk that the value of the underlying assets will impair the value of the security. Borrowing Risk – borrowings increase fund expenses and are subject to repayment, possibly at inopportune times. Convertible Security Risk – the market value of convertible securities adjusts with interest rates and the value of the underlying stock. Defaulted Securities Risk – defaulted securities carry the risk of uncertainty of repayment. Derivatives Risk – derivatives are subject to counterparty risk. Exchange Traded Note Risk – exchange traded notes represent unsecured debt of the issuer and may be influenced by interest rates, credit ratings of the issuer or changes in value of the reference index. Fixed Income Risk – the market value of fixed income securities adjusts with interest rates and the securities are subject to issuer default. Foreign/Emerging Market Risk – foreign securities may be subject to inefficient or volatile markets, different regulatory regimes or different tax policies. These risks may be enhanced in emerging markets. Liquidity Risk – illiquid investments may be difficult or impossible to sell. Large Shareholder Purchase and Redemption Risk – The Fund may experience adverse effects when certain large shareholders purchase or redeem large amounts of shares of the Fund. Management Risk – there is no guarantee that the adviser’s or sub-adviser’s investment decisions will produce the desired results. Market Risk – economic conditions, interest rates and political events may affect the securities markets. Mortgage-Backed Security Risk – mortgage backed securities are subject to credit risk, pre-payment risk and devaluation of the underlying collateral. Portfolio Turnover Risk – increased portfolio turnover results in higher brokerage expenses and may impact the tax status of distributions. Rating Agency Risk – rating agencies may change their ratings or ratings may not accurately reflect a debt issuer’s creditworthiness. REIT Risk – the value of REITs changes with the value of the underlying properties and changes in interest rates and are subject to additional fees. Security Risk – The value of the Fund may decrease in response to the activities and financial prospects of individual securities in the Fund’s portfolio. Structured Notes Risk – because of the imbedded derivative feature, structured notes are subject to more risk than investing in a simple note or bond. Swap Risk – swap agreements are subject to counterparty default risk and may not perform as intended. Underlying Fund Risk – underlying funds have additional fees, may utilize leverage, may not correlate to an intended index and may trade at a discount to their net asset values. |
| 16 | (888) 848-7569 | www.rivernorth.com |
| RiverNorth Funds | Portfolio Update |
| | September 30, 2018 (Unaudited) |
| (2) | For the sleeve managed by RiverNorth, credit quality allocation reflects a fixed-income portfolio weighted average of the credit breakdown of each closed-end fund as provided by the advisor of said closed-end fund. If a credit breakdown is not provided by the advisor, Bloomberg is used. For the sleeves managed by DoubleLine, credit quality allocation is determined from the highest available credit rating from any Nationally Recognized Statistical Rating Organization (S&P, Moody’s and Fitch). Investment grade refers to a bond rated BBB- or higher by Standard & Poor’s or Baa3 or higher by Moody’s. High yield refers to a bond rated lower than investment grade. For more information about securities ratings, please see the Fund’s Statement of Additional Information at www.rivernorth.com. |
| Annual Report | September 30, 2018 | 17 |
| RiverNorth Funds | Portfolio Update |
| | September 30, 2018 (Unaudited) |
RiverNorth/Oaktree High Income Fund
What is the RiverNorth/Oaktree High Income Fund's investment strategy?
The RiverNorth/Oaktree High Income Fund ("the Fund") invests in a broad range of income producing securities including both fixed income and equity securities.
Assets of the Fund are tactically managed across three income strategies (or sleeves). RiverNorth manages the Tactical Closed-End Fund Strategy. This strategy is designed to provide diversified fixed income and equity income exposure through opportunistic investments in closed-end funds (CEFs). Oaktree Capital Management, LP manages the High Yield Bond and Senior Loan Strategies on a global basis. Oaktree will tactically manage the allocation between the High Yield Bond and Senior Loan Strategies based both on market opportunities and the risk and reward trade-offs between the two asset classes.
How did the RiverNorth/Oaktree High Income Fund perform relative to its benchmark during the reporting period?
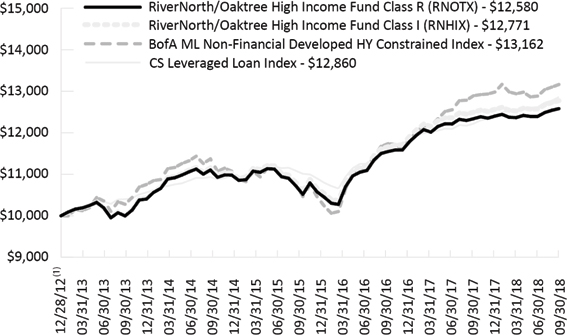
For the 12-month period ended September 30, 2018, the Class I share (symbol: RNHIX) returned 2.22% and the Class R share (symbol: RNOTX) returned 2.07%. The Bank of America Merrill Lynch Non- Financial Developed High Yield Constrained Index and Credit Suisse Leveraged Loan Index returned 2.09% and 5.24%, respectively, during the same period.
Comparison of a $10,000 Investment in the RiverNorth/Oaktree High Income Fund, BofA ML Non-Financial Developed HY Constrained Index and the CS Leveraged Loan Index
| 18 | (888) 848-7569 | www.rivernorth.com |
| RiverNorth Funds | Portfolio Update |
| | September 30, 2018 (Unaudited) |
Average Annual Total Returns for the Period Ended September 30, 2018
| | 1-Year | 3-Year | 5-Year | Since
Inception(1) |
| RiverNorth/Oaktree High Income Fund –Class I (RNHIX) | 2.22% | 6.42% | 4.70% | 4.34% |
| RiverNorth/Oaktree High Income Fund –Class R (RNOTX) | 2.07% | 6.20% | 4.43% | 4.09% |
| BofA ML Non-Financial Developed HY Constrained Index(2) | 2.09% | 7.94% | 4.74% | 4.89% |
| CS Leveraged Loan Index(2) | 5.24% | 5.31% | 4.28% | 4.47% |
| (1) | Inception date is December 28, 2012. |
| (2) | The BofA Merrill Lynch Non-Financial Developed Markets High Yield Constrained Index contains all securities in the BofA Merrill Lynch Global High Yield index from developed markets countries but cap issuer exposure at 2%. Developed markets is defined as an FX-G10 member, a Western European nation, or a territory of the U.S. or a Western European nation. The index tracks the performance of USD, CAD, GBP and EUR denominated below investment grade corporate debt publicly issued in the major domestic or Eurobond markets. Qualifying securities must have a below investment grade rating (based on an average of Moody’s, S&P and Fitch). CS Leveraged Loan Index tracks the investable market of the U.S. dollar denominated leveraged loan market. It consists of issues rated “5B” or lower, meaning that the highest rated issues included in this index are Moody’s/S&P ratings of Baa1/BB+ or Ba1/BBB+. All loans are funded term loans with a tenor of at least one year and are made by issuers domiciled in developed countries. The Bofa Merrill Lynch Non-Financial Developed Markets High Yield Constrained and the CS Leveraged Loan Indices are indices only and cannot be invested in directly. |
Performance data quoted represents past performance, which is not a guarantee of future results. Current performance may be lower or higher than the performance quoted. The principal value and investment return of an investment will fluctuate so that your shares, when redeemed, may be worth more or less than their original cost. You can obtain performance data current to the most recent month end by calling (888) 848-7569 or www.rivernorth.com. Total return measures net investment income and capital gain or loss from portfolio investments. All performance shown assumes reinvestment of dividends and capital gains distributions and does not reflect the deduction of taxes that a shareholder would pay on fund distributions or the redemption of fund shares.
The Total Annual Operating Expense for the Fund as disclosed in the prospectus dated January 28, 2018: 1.88% (RNHIX), 2.13% (RNOTX). The adviser has contractually agreed to defer the collection of fees and/or reimburse expenses, but only to the extent necessary to limit Total Annual Fund Operating Expenses (excluding brokerage fees and commissions; borrowing costs, such as (a) interest and (b) dividends on securities sold short; taxes; indirect expenses incurred by the underlying funds in which the Fund invests; and extraordinary expenses) to 1.35% (RNHIX) and 1.60% (RNOTX) of the average daily net assets of the Fund through January 31, 2019. The annualized net expense ratio in this annual report dated September 30, 2018 is 1.36% (RNHIX) and 1.61% (RNOTX). The expense ratio as disclosed in the Fund’s annual report dated September 30, 2018 only includes the direct expenses paid by shareholders from their investment. The expense ratio as disclosed in the Fund’s prospectus dated January 28, 2018 is required to include the indirect expenses of investing in underlying funds.
| Annual Report | September 30, 2018 | 19 |
| RiverNorth Funds | Portfolio Update |
| | September 30, 2018 (Unaudited) |
What contributing factors were responsible for the RiverNorth/Oaktree High Income Fund's relative performance during the period?
RiverNorth Tactical Closed-End Fund Sleeve
The portfolio’s overweighting of high yield CEFs compared to bank loan funds detracted from performance. In addition, discount widening negatively impacted both high yield and bank loan CEFs over the period.
Oaktree High Yield Bond & Senior Loan Sleeve
Volatility, particularly within the credit markets, saw a marked increase during the twelve month period ended September 30, 2018. Beginning in late 4Q2017, high yield bonds decoupled from rallying equities amid massive outflows from the high yield bond ETFs and mutual funds. This divergence extended into 2018 and was further exacerbated by concerns around rising interest rates. Conversely, senior loans benefitted from the rising rate environment and were a top performer among major credit asset classes during the period. The asset class experienced limited volatility with stable, coupon-like performance, largely driven by robust demand from record CLO formation.
Despite increased volatility, investors’ appetite for risk remained as CCC-rated bonds and loans outperformed their higher rated counterparts. Sound credit fundamentals and negligible default activity supported this risk-taking sentiment. Looking forward, we anticipate little stress on the fundamental side outside of a handful of struggling retail, energy and telecom issuers. We also expect defaults to remain low as a reflection of this positive economic backdrop.
How was the RiverNorth/Oaktree High Income Fund positioned at the end of September 2018?
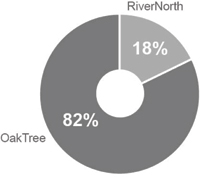
The Fund allocation was 18% RiverNorth Tactical Closed-End Fund and 82% Oaktree High Yield Bond and Senior Loan. The closed-end fund sleeve is primarily invested in the common shares of closed-end funds. Over the past year we have decreased cash and increased the Fund's allocation to high yield.
Oaktree High Yield Bond & Senior Loan Sleeve
We believe our portfolios remain defensively positioned and are constructed to preserve capital in the event of a market downturn. Our loan investments may see some near-term benefit from further increases in LIBOR following the latest federal funds rate hike in September. With that said, we remain cautious in our approach with a continued unwillingness to stretch for yield. To reiterate the view of our Chairman Howard Marks in his latest memo, “… this is the kind of environment – marked by too much money chasing too few deals – in which investors should emphasize caution over aggressiveness.”
Bond rating disclosure: A bond rating is a grade given to a bond that indicates its credit quality. Private independent rating services provide these evaluations of a bond issuer's financial strength or its ability to pay a bond's principal and interest in a timely fashion. Bond ratings are expressed as letters ranging from "AAA," which is the highest grade, to "C" or "D" ("junk"), which is the lowest grade.
| 20 | (888) 848-7569 | www.rivernorth.com |
| RiverNorth Funds | Portfolio Update |
| | September 30, 2018 (Unaudited) |
Strategy Allocation
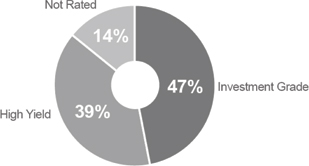
Credit Quality Distribution(1)(2) (percentages are based on net assets)
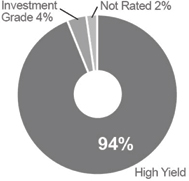
Totals may not add up to 100% due to rounding.
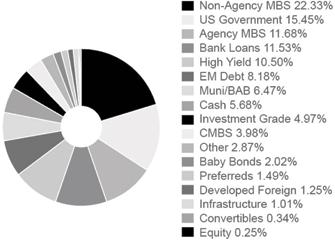
Sector Breakdown(1) (percentages are based on net assets)
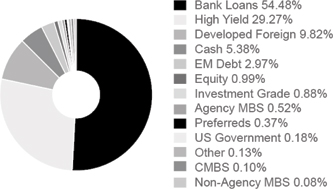
The allocation does not add up to 100% as it reflects the leverage utilized by the underlying funds.
| Annual Report | September 30, 2018 | 21 |
| RiverNorth Funds | Portfolio Update |
| | September 30, 2018 (Unaudited) |
High Yield & Bank Loan Geographic Breakdown
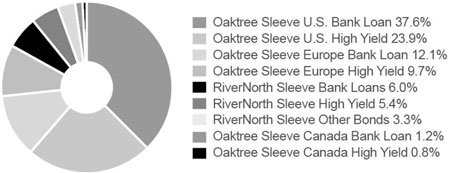
Totals may not add up to 100% due to rounding.
Portfolio detail statistics are estimates made by the adviser and are subject to change.
| (1) | Borrowing Risk – borrowings increase fund expenses and are subject to repayment, possibly at inopportune times. Closed-End Fund Risk – closed-end funds are exchange traded, may trade at a discount to their net asset values and may deploy leverage. Convertible Security Risk – the market value of convertible securities adjusts with interest rates and the value of the underlying stock. Credit Derivatives Risk – the use of credit derivatives is highly specialized, involves default, counterparty and liquidity risks and may not perfectly correlate to the underlying asset or liability being hedged. Currency Risk – foreign currencies will rise or decline relative to the U.S. dollar. Distressed and Defaulted Securities Risk – defaulted securities carry the risk of uncertainty of repayment. Equity Risk – equity securities may experience volatility and the value of equity securities may move in opposite directions from each other and from other equity markets generally. Fixed Income Risk – the market value of fixed income securities adjusts with interest rates and the securities are subject to issuer default. Foreign/Emerging Market Risk – foreign securities may be subject to inefficient or volatile markets, different regulatory regimes or different tax policies. These risks may be enhanced in emerging markets. Floating Interest Rate Risk – loans pay interest based on the London Interbank Offered Rate (LIBOR) and a decline in LIBOR could negatively impact the Fund’s return. Investment Style Risk – investment strategies may come in and out of favor with investors and may underperform or outperform at times. Large Shareholder Purchase and Redemption Risk – The Fund may experience adverse effects when certain large shareholders purchase or redeem large amounts of shares of the Fund. Loans Risk – loans may be unrated or rated below investment grade and the pledged collateral may lose value. Secondary trading in loans is not fully-developed and may result in illiquidity. Management Risk – there is no guarantee that the adviser’s or sub-adviser’s investment decisions will produce the desired results. Market Risk – economic conditions, interest rates and political events may affect the securities markets. Portfolio Turnover Risk – increased portfolio turnover results in higher brokerage expenses and may impact the tax status of distributions. Preferred Stock Risk – preferred stocks generally pay dividends, but may be less liquid than common stocks, have less priority than debt instruments and may be subject to redemption by the issuer. Security Risk – the value of the Fund may increase or decrease in response to the prospects of the issuers of securities and loans held in the Fund. Swap Risk – swap agreements are subject to counterparty default risk and may not perform as intended. Underlying Fund Risk – underlying funds have additional fees, may utilize leverage, may not correlate to an intended index and may trade at a discount to their net asset values. Valuation Risk – Loans and fixed-income securities are traded “over the counter” and because there is no centralized information regarding trading, the valuation of loans and fixed-income securities may vary. |
| 22 | (888) 848-7569 | www.rivernorth.com |
| RiverNorth Funds | Portfolio Update |
| | September 30, 2018 (Unaudited) |
| (2) | For the sleeve managed by RiverNorth, credit quality allocation reflects a fixed-income portfolio weighted average of the credit breakdown of each closed-end fund as provided by the advisor of said closed-end fund. If a credit breakdown is not provided by the advisor, Bloomberg is used. For the sleeves ma For the sleeves managed by Oaktree, the sub-adviser uses a proprietary credit scoring matrix to rank potential investments. This process offers a systematic way of reviewing the key quantitative and qualitative variables impacting credit quality for each investment. Investment grade refers to a bond rated BBB- or higher by Standard & Poor’s or Baa3 or higher by Moody’s. High yield refers to a bond rated lower than investment grade. For more information about securities ratings, please see the Fund’s Statement of Additional Information at www.rivernorth.com. |
| Annual Report | September 30, 2018 | 23 |
| RiverNorth Funds | Disclosure of Fund Expenses |
| | September 30, 2018 (Unaudited) |
Expense Example
As a shareholder of the RiverNorth Funds (the "Trust" or "Funds"), you incur two types of costs: (1) transaction costs (such as the 2% fee on redemptions of Fund shares made within 90 days of purchase); and (2) ongoing costs, including management fees, distribution and service (12b-1) fees and other Fund expenses. This example is intended to help you understand your ongoing costs (in dollars) of investing in the Funds and to compare these costs with the ongoing costs of investing in other mutual funds. The Example is based on an investment of $1,000 invested at the beginning of the period, April 1, 2018, and held for the six months ended September 30, 2018.
Actual Expenses
The first line of the table below provides information about actual account values and actual expenses. You may use the information in this line, together with the amount you invested, to estimate the expenses that you paid over the period. Simply divide your variable account value by $1,000 (for example, an $8,600 account value divided by $1,000 = 8.6), then multiply the result by the number in the first line under the heading entitled “Expenses Paid During Period” to estimate the expenses you paid on your account during this period.
Hypothetical Example for Comparison Purposes
The second line of the table below provides information about hypothetical account values and hypothetical expenses based on each Fund’s actual expense ratio and an assumed rate of return of 5% per year before expenses, which is not each Fund’s actual return. The hypothetical account values and expenses may not be used to estimate the actual ending account balance or expenses you paid for the period. You may use this information to compare the ongoing costs of investing in each Fund and other funds. To do so, compare these 5% hypothetical examples with the 5% hypothetical examples that appear in the shareholder reports of other funds.
Please note that the expenses shown in the table below are meant to highlight your ongoing costs only and do not reflect any transactional costs, such as redemption fees. Therefore, the second line for each share class of each Fund within the table is useful in comparing ongoing costs only, and will not help you determine the relative total costs of owning different funds. If these transactional costs were included, your costs would have been higher.
| 24 | (888) 848-7569 | www.rivernorth.com |
| RiverNorth Funds | Disclosure of Fund Expenses |
September 30, 2018 (Unaudited)
| | Beginning
Account Value
04/01/2018 | | Ending Account Value
09/30/2018 | | Expense
Ratio(a) | | Expenses Paid
During Period(b) |
| RiverNorth Core Opportunity Fund | | | | | | |
| Class I Shares | | | | | | | |
| Actual | $1,000.00 | | $1,034.10 | | 1.20% | | $6.12 |
| Hypothetical (5% return before expenses) | $1,000.00 | | $1,019.05 | | 1.20% | | $6.07 |
| Class R Shares | | | | | | | |
| Actual | $1,000.00 | | $1,033.50 | | 1.44% | | $7.34 |
| Hypothetical (5% return before expenses) | $1,000.00 | | $1,017.85 | | 1.44% | | $7.28 |
| RiverNorth/DoubleLine Strategic Income Fund | | | | | | |
| Class I Shares | | | | | | | |
| Actual | $1,000.00 | | $1,008.70 | | 0.86% | | $4.33 |
| Hypothetical (5% return before expenses) | $1,000.00 | | $1,020.76 | | 0.86% | | $4.36 |
| Class R Shares | | | | | | | |
| Actual | $1,000.00 | | $1,006.40 | | 1.11% | | $5.58 |
| Hypothetical (5% return before expenses) | $1,000.00 | | $1,019.50 | | 1.11% | | $5.62 |
| RiverNorth/Oaktree High Income Fund | | | | | | |
| Class I Shares | | | | | | | |
| Actual | $1,000.00 | | $1,018.70 | | 1.36% | | $6.88 |
| Hypothetical (5% return before expenses) | $1,000.00 | | $1,018.25 | | 1.36% | | $6.88 |
| Class R Shares | | | | | | | |
| Actual | $1,000.00 | | $1,018.50 | | 1.61% | | $8.15 |
| Hypothetical (5% return before expenses) | $1,000.00 | | $1,017.00 | | 1.61% | | $8.14 |
| (a) | Annualized, based on the Fund's most recent fiscal half-year expenses. |
| (b) | Expenses are equal to the Fund's annualized expense ratio multiplied by the average account value over the period, multiplied by the number of days in the most recent fiscal half year (183), then divided by 365. Note this expense example is typically based on a six-month period. |
| Annual Report | September 30, 2018 | 25 |
| RiverNorth Core Opportunity Fund | Schedule of Investments |
September 30, 2018
| Shares/Description | | Value | |
| CLOSED-END FUNDS - 53.72% | | | | |
| | 304,575 | | | Aberdeen Emerging Markets Equity Income Fund, Inc. | | $ | 2,089,385 | |
| | 466,790 | | | Aberdeen Total Dynamic Dividend Fund | | | 4,098,416 | |
| | 451,404 | | | AllianzGI NFJ Dividend Interest & Premium Strategy Fund | | | 5,913,392 | |
| | 291,636 | | | BlackRock Credit Allocation Income Trust | | | 3,569,625 | |
| | 193,151 | | | BrandywineGLOBAL Global Income Opportunities Fund, Inc. | | | 2,109,209 | |
| | 364,597 | | | Clough Global Opportunities Fund | | | 3,952,231 | |
| | 160,121 | | | Cornerstone Strategic Value Fund, Inc. | | | 2,241,694 | |
| | 54,857 | | | Cornerstone Total Return Fund, Inc. | | | 761,415 | |
| | 115,009 | | | Eaton Vance Limited Duration Income Fund | | | 1,458,314 | |
| | 3 | | | Franklin Limited Duration Income Trust | | | 31 | |
| | 58,568 | | | Highland Floating Rate Opportunities Fund | | | 903,119 | |
| | 153,791 | | | Kayne Anderson MLP/Midstream Investment Co. | | | 2,745,169 | |
| | 587,323 | | | Liberty All Star® Equity Fund | | | 3,999,670 | |
| | 38,073 | | | Morgan Stanley Emerging Markets Debt Fund, Inc. | | | 330,093 | |
| | 77,652 | | | Morgan Stanley Emerging Markets Domestic Debt Fund, Inc. | | | 523,374 | |
| | 91,874 | | | Neuberger Berman High Yield Strategies Fund, Inc. | | | 1,006,020 | |
| | 48,498 | | | NexPoint Credit Strategies Fund | | | 1,086,355 | |
| | 182,008 | | | Nuveen AMT-Free Quality Municipal Income Fund | | | 2,304,221 | |
| | 242,127 | | | Nuveen Credit Strategies Income Fund | | | 1,929,752 | |
| | 127,691 | | | Nuveen Intermediate Duration Quality Municipal Term Fund | | | 1,571,876 | |
| | 188,030 | | | Nuveen Mortgage Opportunity Term Fund | | | 4,512,720 | |
| | 72,530 | | | Nuveen Mortgage Opportunity Term Fund 2 | | | 1,668,190 | |
| | 156,224 | | | Nuveen Quality Municipal Income Fund | | | 1,998,105 | |
| | 55,949 | | | PGIM Global Short Duration High Yield Fund, Inc. | | | 776,013 | |
| | 532,854 | | | Sprott Focus Trust, Inc. | | | 3,932,463 | |
| | 635,041 | | | Templeton Global Income Fund | | | 3,886,451 | |
| | 184,210 | | | Tortoise MLP Fund, Inc. | | | 2,962,097 | |
| | 46,853 | | | Voya Emerging Markets High Income Dividend Equity Fund | | | 378,104 | |
| | 387,977 | | | Western Asset Emerging Markets Debt Fund, Inc. | | | 5,206,651 | |
| | 719,524 | | | Western Asset High Income Opportunity Fund, Inc. | | | 3,424,934 | |
| | | | | | | | | |
| TOTAL CLOSED-END FUNDS (Cost $69,351,067) | | | 71,339,089 | |
| | | | | | | | | |
| COMMON STOCKS - 6.00% | | | | |
| | 35,274 | | | Big Rock Partners Acquisition Corp.(a) | | | 352,740 | |
| | 29,885 | | | Black Ridge Acquisition Corp.(a) | | | 291,379 | |
| | 44,762 | | | CM Seven Star Acquisition Corp.(a) | | | 451,201 | |
| | 18,166 | | | Draper Oakwood Technology Acquisition, Inc., Class A(a) | | | 170,579 | |
| | 9,711 | | | Far Point Acquisition Corp., Class A(a) | | | 93,541 | |
| | 75,837 | | | Gordon Pointe Acquisition Corp.(a) | | | 746,995 | |
| | 40,973 | | | Haymaker Acquisition Corp., Class A(a) | | | 399,876 | |
| | 1 | | | Haymaker Acquisition Corp.(a) | | | 10 | |
| | 24,181 | | | Industrea Acquisition Corp., Class A(a) | | | 246,646 | |
| | 29,414 | | | Legacy Acquisition Corp., Class A(a) | | | 285,628 | |
See Notes to Financial Statements.
| 26 | (888) 848-7569 | www.rivernorth.com |
| RiverNorth Core Opportunity Fund | Schedule of Investments |
September 30, 2018
| Shares/Description | | Value | |
| | 41,843 | | | Leisure Acquisition Corp.(a) | | $ | 405,459 | |
| | 1 | | | Leisure Acquisition Corp.(a) | | | 10 | |
| | 12,752 | | | LF Capital Acquisition Corp., Class A(a) | | | 121,909 | |
| | 62,602 | | | MTech Acquisition Corp.(a) | | | 638,540 | |
| | 54,611 | | | One Madison Corp., Class A(a) | | | 530,819 | |
| | 82,651 | | | Opes Acquisition Corp.(a) | | | 814,112 | |
| | 56,421 | | | Pensare Acquisition Corp.(a) | | | 561,953 | |
| | 32,602 | | | Pure Acquisition Corp.(a) | | | 316,403 | |
| | 1 | | | Pure Acquisition Corp.(a) | | | 10 | |
| | 19,187 | | | Thunder Bridge Acquisition, Ltd., Class A(a) | | | 186,306 | |
| | 37,631 | | | Tiberius Acquisition Corp.(a) | | | 362,763 | |
| | 19,178 | | | Trident Acquisitions Corp.(a) | | | 188,326 | |
| | 15,528 | | | Trinity Merger Corp., Class A(a) | | | 152,640 | |
| | 19,229 | | | Twelve Seas Investment Co.(a) | | | 183,060 | |
| | 29,556 | | | Union Acquisition Corp.(a) | | | 288,171 | |
| | 18,162 | | | VectoIQ Acquisition Corp.(a) | | | 173,810 | |
| | | | | | | | | |
| TOTAL COMMON STOCKS (Cost $7,681,561) | | | 7,962,886 | |
| | | | | | | | | |
| EXCHANGE-TRADED FUNDS - 33.78% | | | | |
| | 187,653 | | | PowerShares® FTSE RAFI Emerging Markets Portfolio | | | 3,966,984 | |
| | 61,419 | | | PowerShares® FTSE RAFI US 1000 Portfolio | | | 7,294,735 | |
| | 85,000 | | | SPDR® S&P 500® ETF Trust | | | 24,711,200 | |
| | 77,070 | | | Vanguard® FTSE Developed Markets ETF | | | 3,334,819 | |
| | 135,426 | | | Vanguard® FTSE Emerging Markets ETF | | | 5,552,466 | |
| | | | | | | | | |
| TOTAL EXCHANGE-TRADED FUNDS (Cost $39,191,267) | | | 44,860,204 | |
| | | | | | | | | |
| PREFERRED STOCKS - 0.06% | | | | |
| | 3,054 | | | General American Investors Co., Inc., Series B, 5.950%(b) | | | 79,575 | |
| | | | | | | | | |
| TOTAL PREFERRED STOCKS (Cost $74,399) | | | 79,575 | |
| Shares/Description | | Rate | | Maturity | | | Value | |
| BUSINESS DEVELOPMENT COMPANY NOTES - 1.37% | | | | | | | | | |
| United States - 1.37% | | | | | | | | | | | | |
| | 26,021 | | KCAP Financial, Inc. | | | 6.13 | % | | | 09/30/2022 | | | | 655,729 | |
| | 46,726 | | TriplePoint Venture Growth BDC Corp. | | | 5.75 | % | | | 07/15/2022 | | | | 1,168,884 | |
| | | | | | | | | | | | | | | 1,824,613 | |
| | | | | | | | | | | | | | | | |
| TOTAL BUSINESS DEVELOPMENT COMPANY NOTES (Cost $1,818,675) | | | | | | | | | | | 1,824,613 | |
See Notes to Financial Statements.
| Annual Report | September 30, 2018 | 27 |
| RiverNorth Core Opportunity Fund | Schedule of Investments |
September 30, 2018
| Shares/Description | | Rate | | Maturity | | | Value | |
| U.S. GOVERNMENT BONDS AND NOTES - 3.75% | | | | | | | | | | | | |
| $ | 4,996,100 | | | U.S. Treasury Notes | | | 1.13 | % | | | 01/31/2019 | | | $ | 4,976,550 | |
| | | | | | | | | | | | | | | | | |
| TOTAL U.S. GOVERNMENT BONDS AND NOTES (Cost $4,984,857) | | | | | | | | | | | 4,976,550 | |
| Shares/Description | | Value | |
| RIGHTS - 0.07% | | | |
| | 35,274 | | | Big Rock Partners Acquisition Corp., Strike Price 11.50, Expires 12/31/2049(a) | | | 14,462 | |
| | 14,943 | | | Black Ridge Acquisition Corp., Strike Price 11.50, Expires 10/25/2022(a) | | | 4,810 | |
| | 44,762 | | | CM Seven Star Acquisition Corp., Strike Price 11.50, Expires 11/06/2018(a) | | | 22,381 | |
| | 18,166 | | | Draper Oakwood Technology Acquisition, Inc., Strike Price 11.50, Expires 09/30/2024(a) | | | 9,265 | |
| | 56,421 | | | Pensare Acquisition Corp., Strike Price 11.50, Expires 08/08/2022(a) | | | 25,344 | |
| | 29,556 | | | Union Acquisition Corp., Strike Price 11.50, Expires 12/31/2049(a) | | | 11,823 | |
| | | | | | | | | |
| TOTAL RIGHTS (Cost $71,441) | | | 88,085 | |
| | | | | | | | | |
| WARRANTS - 0.37% | | | | |
| | 17,637 | | | Big Rock Partners Acquisition Corp., Strike Price 11.50, Expires 12/01/2022(a) | | | 5,483 | |
| | 44,826 | | | Black Ridge Acquisition Corp., Strike Price 11.50, Expires 10/25/2022(a) | | | 19,275 | |
| | 22,381 | | | CM Seven Star Acquisition Corp., Strike Price 11.50, Expires 11/06/2018(a) | | | 10,519 | |
| | 9,083 | | | Draper Oakwood Technology Acquisition, Inc., Strike Price 11.50, Expires 09/30/2024(a) | | | 5,359 | |
| | 14,121 | | | Falcon Minerals Corp., Strike Price 11.50, Expires 08/15/2022(a) | | | 24,035 | |
| | 3,237 | | | Far Point Acquisition Corp., Strike Price 11.50, Expires 06/01/2025(a) | | | 5,341 | |
| | 3 | | | Franklin, Ltd. Duration Income Trust, Strike Price 10.30, Expires 10/19/2018(a) | | | 0 | |
| | 75,837 | | | Gordon Pointe Acquisition Corp., Strike Price 11.50, Expires 03/12/2019(a) | | | 49,294 | |
| | 20,487 | | | Haymaker Acquisition Corp., Strike Price 11.50, Expires 11/17/2022(a) | | | 24,584 | |
| | 23,033 | | | I-AM Capital Acquisition Co., Strike Price 11.50, Expires 10/09/2022(a) | | | 8,062 | |
| | 24,181 | | | Industrea Acquisition Corp., Strike Price 11.50, Expires 08/01/2024(a) | | | 24,181 | |
| | 29,414 | | | Legacy Acquisition Corp., Strike Price 5.75, Expires 12/01/2022(a) | | | 12,060 | |
| | 20,922 | | | Leisure Acquisition Corp., Strike Price 11.50, Expires 12/28/2022(a) | | | 19,876 | |
| | 12,752 | | | LF Capital Acquisition Corp., Strike Price 11.50, Expires 06/27/2023(a) | | | 6,376 | |
| | 62,602 | | | MTech Acquisition Corp., Strike Price 11.50, Expires 08/02/2024(a) | | | 92,651 | |
| | 27,306 | | | One Madison Corp., Strike Price 11.50, Expires 02/23/2023(a) | | | 31,689 | |
| | 82,651 | | | Opes Acquisition Corp., Strike Price 11.50, Expires 01/16/2023(a) | | | 33,060 | |
See Notes to Financial Statements.
| 28 | (888) 848-7569 | www.rivernorth.com |
| RiverNorth Core Opportunity Fund | Schedule of Investments |
September 30, 2018
| Shares/Description | | Value | |
| | 28,211 | | | Pensare Acquisition Corp., Strike Price 11.50, Expires 08/08/2022 | | $ | 14,670 | |
| | 16,301 | | | Pure Acquisition Corp., Strike Price 11.50, Expires 04/17/2023(a) | | | 22,006 | |
| | 19,187 | | | Thunder Bridge Acquisition, Ltd., Strike Price 11.50, Expires 07/17/2022(a) | | | 8,602 | |
| | 37,631 | | | Tiberius Acquisition Corp., Strike Price 11.50, Expires 04/10/2023 | | | 22,202 | |
| | 19,178 | | | Trident Acquisitions Corp., Strike Price 11.50, Expires 06/14/2021(a) | | | 5,562 | |
| | 15,528 | | | Trinity Merger Corp., Strike Price 11.50, Expires 06/01/2023 | | | 7,764 | |
| | 19,229 | | | Twelve Seas Investment Co., Strike Price 11.50, Expires 07/14/2023 | | | 7,884 | |
| | 19,229 | | | Twelve Seas Investment Co., Strike Price 11.50, Expires 07/13/2023 | | | 6,922 | |
| | 29,556 | | | Union Acquisition Corp., Strike Price 11.50, Expires 07/01/2025(a) | | | 9,458 | |
| | 18,162 | | | VectoIQ Acquisition Corp., Strike Price 11.50, Expires 06/12/2023 | | | 10,716 | |
| | | | | | | | | |
| TOTAL WARRANTS (Cost $365,151) | | | 487,631 | |
| | | | | | | | | |
| TOTAL INVESTMENTS - 99.12% (Cost $123,538,418) | | | 131,618,633 | |
| CASH SEGREGATED AT CUSTODIAN FOR TOTAL RETURN SWAP CONTRACTS - 0.30% | | | 400,000 | |
| OTHER ASSETS IN EXCESS OF LIABILITIES - 0.58% | | | 772,130 | |
| NET ASSETS - 100.00% | | $ | 132,790,763 | |
| (a) | Non-income producing security. |
| (b) | Security has no contractual maturity date, is not redeemable and contractually pays an indefinite stream of interest. |
See Notes to Financial Statements.
| Annual Report | September 30, 2018 | 29 |
| RiverNorth/DoubleLine Strategic Income Fund | Schedule of Investments |
September 30, 2018
| Shares/Description | Value |
| CLOSED-END FUNDS - 26.74% | |
| | 898,507 | | Aberdeen Asia-Pacific Income Fund, Inc. | $ | 3,719,819 | |
| | 482,160 | | Advent Claymore Convertible Securities and Income Fund | | 7,555,447 | |
| | 404,831 | | AllianceBernstein Global High Income Fund, Inc. | | 4,716,281 | |
| | 346,084 | | AllianceBernstein National Municipal Income Fund, Inc. | | 4,287,981 | |
| | 440,703 | | Ares Dynamic Credit Allocation Fund, Inc. | | 6,844,118 | |
| | 1,806,240 | | BlackRock Corporate High Yield Fund, Inc. | | 18,983,582 | |
| | 2,035,155 | | BlackRock Credit Allocation Income Trust | | 24,910,297 | |
| | 151,080 | | BlackRock Debt Strategies Fund, Inc. | | 1,683,031 | |
| | 391,655 | | BlackRock Limited Duration Income Trust | | 5,831,743 | |
| | 552,021 | | BlackRock Multi-Sector Income Trust | | 9,340,195 | |
| | 482,346 | | BlackRock Muni Intermediate Duration Fund, Inc. | | 6,309,086 | |
| | 574,739 | | BrandywineGLOBAL Global Income Opportunities Fund, Inc. | | 6,276,150 | |
| | 645,132 | | Deutsche Multi-Market Income Trust | | 5,793,285 | |
| | 17,460 | | Deutsche Strategic Income Trust | | 219,483 | |
| | 2,962,326 | | Eaton Vance Limited Duration Income Fund | | 37,562,294 | |
| | 1,073,571 | | Eaton Vance Senior Income Trust | | 6,924,533 | |
| | 19,510 | | Eaton Vance Short Duration Diversified Income Fund | | 251,874 | |
| | 146,407 | | Highland Floating Rate Opportunities Fund | | 2,257,596 | |
| | 1,725,921 | | Invesco Dynamic Credit Opportunities Fund | | 19,796,314 | |
| | 219,867 | | Invesco High Income Trust II | | 3,012,178 | |
| | 2,610,566 | | Invesco Senior Income Trust | | 11,225,434 | |
| | 605,376 | | MFS Charter Income Trust | | 4,697,718 | |
| | 167,343 | | MFS Multimarket Income Trust | | 925,407 | |
| | 483,942 | | Morgan Stanley Emerging Markets Debt Fund, Inc. | | 4,195,777 | |
| | 1,777,870 | | Morgan Stanley Emerging Markets Domestic Debt Fund, Inc. | | 11,982,844 | |
| | 475,488 | | Neuberger Berman High Yield Strategies Fund, Inc. | | 5,206,594 | |
| | 2,672,451 | | Nuveen AMT-Free Quality Municipal Income Fund | | 33,833,230 | |
| | 2,361,824 | | Nuveen Credit Strategies Income Fund | | 18,823,737 | |
| | 84,622 | | Nuveen Floating Rate Income Opportunity Fund | | 872,453 | |
| | 386,267 | | Nuveen Global High Income Fund | | 6,021,902 | |
| | 140,954 | | Nuveen Preferred & Income Securities Fund | | 1,240,395 | |
| | 1,379,572 | | Nuveen Quality Municipal Income Fund | | 17,644,726 | |
| | 922,310 | | PGIM Global Short Duration High Yield Fund, Inc. | | 12,792,440 | |
| | 953,633 | | PGIM Short Duration High Yield Fund, Inc. | | 13,484,371 | |
| | 1,258,342 | | Templeton Emerging Markets Income Fund | | 12,583,420 | |
| | 3,252,294 | | Templeton Global Income Fund | | 19,904,039 | |
| | 2,865,792 | | Voya Prime Rate Trust | | 14,271,644 | |
| | 646,836 | | Wells Fargo Income Opportunities Fund | | 5,122,941 | |
| | 2,847,520 | | Western Asset Emerging Markets Debt Fund, Inc. | | 38,213,718 | |
| | 148,770 | | Western Asset Global Corporate Defined Opportunity Fund, Inc. | | 2,410,074 | |
| | 1,534,505 | | Western Asset Global High Income Fund, Inc. | | 13,979,340 | |
| | 1,017,217 | | Western Asset High Income Fund II, Inc. | | 6,449,156 | |
| | 6,274,114 | | Western Asset High Income Opportunity Fund, Inc. | | 29,864,783 | |
| | 911,858 | | Western Asset High Yield Defined Opportunity Fund, Inc. | | 13,267,534 | |
| | 745,377 | | Western Asset Inflation - Linked Securities & Income Fund | | 8,392,945 | |
See Notes to Financial Statements.
| 30 | (888) 848-7569 | www.rivernorth.com |
| RiverNorth/DoubleLine Strategic Income Fund | Schedule of Investments |
September 30, 2018
| Shares/Description | Value |
| | 1,772,455 | | Western Asset Inflation-Linked Opportunities & Income Fund | $ | 19,213,412 | |
| | | | | | | |
| TOTAL CLOSED-END FUNDS (Cost $535,256,807) | | 502,895,321 | |
| | | | | | | |
| COMMON STOCKS - 0.04% | | | |
| | 12,164 | | Frontera Energy Corp.(a) | | 170,296 | |
| | 52,330 | | SandRidge Energy, Inc.(a) | | 568,827 | |
| | | | | | | |
| TOTAL COMMON STOCKS (Cost $2,720,381) | | 739,123 | |
| | | | | | | |
| OPEN-END FUNDS - 1.53% | | |
| | 3,003,658 | | RiverNorth/Oaktree High Income Fund, Class I(b) | | 28,777,147 | |
| | | | | | | |
| TOTAL OPEN-END FUNDS (Cost $29,173,156) | | 28,777,147 | |
| | | | | | | |
| PREFERRED STOCKS - 2.22% |
| | 340,000 | | Allianzgi Convertible & Income Fund, Series A, 5.625%(c) | | 8,547,600 | |
| | 103,000 | | Annaly Capital, Series G, 6.500%(c) | | 2,491,570 | |
| | 120,000 | | Annaly Capital, Series F, 6.950%(c) | | 3,062,400 | |
| | 150,000 | | GDL Fund, Series C, 4.000% | | 7,695,000 | |
| | 72,950 | | Gladstone Investment Corp., 6.250%, 09/30/2023 | | 1,843,548 | |
| | 473,100 | | Hercules Capital, Inc., 5.250%, 04/30/2025 | | 11,449,020 | |
| | 125,774 | | Kayne Anderson MLP/Midstream Investment Co., Series F, 3.500% | | 3,150,639 | |
| | 140,000 | | New Mountain Finance Corp., 5.750%, 10/01/2023 | | 3,500,000 | |
| | | | | | | |
| TOTAL PREFERRED STOCKS (Cost $41,680,762) | | 41,739,777 | |
| Shares/Description | | Rate | | Maturity | | Value |
| BUSINESS DEVELOPMENT COMPANY NOTES - 1.10% | | | | | | | | |
| United States - 1.10% | | | | | | | | |
| | 205,671 | | KCAP Financial, Inc. | | 6.13% | | 09/30/2022 | | | 5,182,909 | |
| | 246,653 | | MVC Capital, Inc. | | 6.25% | | 11/30/2022 | | | 6,260,053 | |
| | 123,596 | | THL Credit, Inc. | | 6.75% | | 12/30/2022 | | | 3,117,437 | |
| | 247,369 | | TriplePoint Venture Growth BDC Corp. | | 5.75% | | 07/15/2022 | | | 6,188,109 | |
| | | | | | | | | | | 20,748,508 | |
| | | | | | | | | | | | |
| TOTAL BUSINESS DEVELOPMENT COMPANY NOTES (Cost $20,550,088) | | | | | | | 20,748,508 | |
See Notes to Financial Statements.
| Annual Report | September 30, 2018 | 31 |
| RiverNorth/DoubleLine Strategic Income Fund | Schedule of Investments |
September 30, 2018
| Principal Amount/Description | | Rate | | Maturity | | Value | |
| FOREIGN CORPORATE BONDS - 2.50% |
| Argentina - 0.07% | | | | | | | |
| $ | 500,000 | | Banco Macro SA(d) | | 6.75% | | 11/04/2026 | | $ | 420,005 | |
| | 450,000 | | Pampa Energia SA(d) | | 7.50% | | 01/24/2027 | | | 400,320 | |
| | 400,000 | | YPF SA(d) | | 8.50% | | 07/28/2025 | | | 391,504 | |
| | 200,000 | | YPF SA(d) | | 6.95% | | 07/21/2027 | | | 175,690 | |
| | | | | | | | | | | 1,387,519 | |
| Australia - 0.17% | | | | | | | | |
| | 1,000,000 | | APT Pipelines, Ltd.(e) | | 4.25% | | 07/15/2027 | | | 976,823 | |
| | 265,000 | | Macquarie Group, Ltd.(e)(f) | | 3M US L + 1.023% | | 11/28/2023 | | | 254,938 | |
| | 245,000 | | Macquarie Group, Ltd.(e)(f) | | 3M US L + 1.33% | | 03/27/2024 | | | 244,191 | |
| | 500,000 | | Sydney Airport Finance Co. Pty, Ltd.(e) | | 3.38% | | 04/30/2025 | | | 476,418 | |
| | 500,000 | | Sydney Airport Finance Co. Pty, Ltd.(e) | | 3.63% | | 04/28/2026 | | | 478,309 | |
| | 775,000 | | Westpac Banking Corp.(f) | | 3M US L + 0.72% | | 05/15/2023 | | | 777,800 | |
| | | | | | | | | | | 3,208,479 | |
| Austria - 0.03% | | | | | | | | |
| | 400,000 | | ESAL GmbH(d) | | 6.25% | | 02/05/2023 | | | 398,500 | |
| | 200,000 | | JBS Investments GmbH(d) | | 7.25% | | 04/03/2024 | | | 204,252 | |
| | | | | | | | | | | 602,752 | |
| Bermuda - 0.02% | | | | | | | | |
| | 200,000 | | Digicel Group, Ltd.(e) | | 7.13% | | 04/01/2022 | | | 131,972 | |
| | 400,000 | | Digicel Group, Ltd.(d) | | 7.13% | | 04/01/2022 | | | 263,940 | |
| | | | | | | | | | | 395,912 | |
| Brazil - 0.01% | | | | | | | | |
| | 200,000 | | Nexa Resources SA(d) | | 5.38% | | 05/04/2027 | | | 194,800 | |
| | 1,500,000 | | OAS Finance, Ltd.(c)(e)(g) | | 8.88% | | Perpetual Maturity | | | 86,250 | |
| | | | | | | | | | | 281,050 | |
| Canada - 0.16% | | | | | | | | |
| | 330,000 | | 1011778 BC ULC / New Red Finance, Inc.(e) | | 5.00% | | 10/15/2025 | | | 316,803 | |
| | 395,000 | | Bank of Montreal(f) | | 3.80% | | 12/15/2032 | | | 369,558 | |
| | 600,000 | | Canacol Energy, Ltd.(d) | | 7.25% | | 05/03/2025 | | | 582,750 | |
| | 540,000 | | Fortis, Inc. | | 2.10% | | 10/04/2021 | | | 516,219 | |
| | 310,000 | | Garda World Security Corp.(e) | | 8.75% | | 05/15/2025 | | | 304,575 | |
| | 335,000 | | Kronos Acquisition Holdings, Inc.(e) | | 9.00% | | 08/15/2023 | | | 316,575 | |
| | 290,000 | | Telesat Canada / Telesat LLC(e) | | 8.88% | | 11/15/2024 | | | 311,025 | |
| | 305,000 | | Tervita Escrow Corp.(e) | | 7.63% | | 12/01/2021 | | | 316,056 | |
| | | | | | | | | | | 3,033,561 | |
See Notes to Financial Statements.
| 32 | (888) 848-7569 | www.rivernorth.com |
| RiverNorth/DoubleLine Strategic Income Fund | Schedule of Investments |
September 30, 2018
| Principal Amount/Description | | Rate | | Maturity | | Value |
| Cayman Islands - 0.26% | | | | | | | | |
| | 200,000 | | Banco BTG Pactual SA(d) | | 5.50% | | 01/31/2023 | | $ | 189,215 | |
| | 600,000 | | Banco do Brasil SA(c)(d) | | 6.25% | | 12/31/2049 | | | 460,500 | |
| | 400,000 | | Banco Mercantil del Norte SA/Grand Cayman(c)(d) | | 7.63% | | 12/31/2049 | | | 406,000 | |
| | 200,000 | | Comunicaciones Celulares SA Via Comcel Trust(d) | | 6.88% | | 02/06/2024 | | | 205,125 | |
| | 400,000 | | Gran Tierra Energy International Holdings, Ltd.(d) | | 6.25% | | 02/15/2025 | | | 392,720 | |
| | 200,000 | | Grupo Aval, Ltd.(d) | | 4.75% | | 09/26/2022 | | | 198,250 | |
| | 366,890 | | Guanay Finance, Ltd.(d) | | 6.00% | | 12/15/2020 | | | 369,642 | |
| | 1,099,130 | | Interoceanica IV Finance, Ltd.(d)(h) | | 0.00% | | 11/30/2025 | | | 939,756 | |
| | 300,000 | | Itau Unibanco Holding SA Island(c)(d) | | 6.50% | | 12/31/2049 | | | 281,790 | |
| | 200,000 | | Latam Finance, Ltd.(d) | | 6.88% | | 04/11/2024 | | | 195,000 | |
| | 300,000 | | Lima Metro Line 2 Finance, Ltd.(e) | | 5.88% | | 07/05/2034 | | | 311,992 | |
| | 400,000 | | SPARC EM SPC Panama Metro Line 2 SP(e)(h) | | 0.00% | | 12/05/2022 | | | 367,960 | |
| | 500,000 | | SPARC EM SPC Panama Metro Line 2 SP(d)(h) | | 0.00% | | 12/05/2022 | | | 459,950 | |
| | 80,000 | | Transocean Guardian, Ltd.(e) | | 5.88% | | 01/15/2024 | | | 81,000 | |
| | | | | | | | | | | 4,858,900 | |
| Chile - 0.15% | | | | | | | | |
| | 200,000 | | Banco de Credito e Inversiones SA(d) | | 4.00% | | 02/11/2023 | | | 201,250 | |
| | 700,000 | | Embotelladora Andina SA(d) | | 5.00% | | 10/01/2023 | | | 732,160 | |
| | 900,000 | | Empresa de Transporte de Pasajeros Metro SA(e) | | 5.00% | | 01/25/2047 | | | 908,775 | |
| | 191,300 | | Empresa Electrica Angamos SA(d) | | 4.88% | | 05/25/2029 | | | 188,851 | |
| | 300,000 | | Engie Energia Chile SA(d) | | 5.63% | | 01/15/2021 | | | 312,123 | |
| | 200,000 | | Geopark, Ltd.(d) | | 6.50% | | 09/21/2024 | | | 201,750 | |
| | 200,000 | | VTR Finance BV(d) | | 6.88% | | 01/15/2024 | | | 204,250 | |
| | | | | | | | | | | 2,749,159 | |
| China - 0.02% | | | | | | | |
| | 200,000 | | Alibaba Group Holding, Ltd. | | 2.80% | | 06/06/2023 | | | 192,666 | |
| | 300,000 | | Sinopec Group Overseas Development 2016, Ltd.(d) | | 2.75% | | 09/29/2026 | | | 268,323 | |
| | | | | | | | | | | 460,989 | |
| Colombia - 0.04% | | | | | | | | |
| | 200,000 | | Banco Bilbao Vizcaya Argentaria Colombia SA(d) | | 4.88% | | 04/21/2025 | | | 199,500 | |
| | 200,000 | | Bancolombia SA | | 4.88% | | 10/18/2027 | | | 192,760 | |
| | 100,000 | | Ecopetrol SA | | 5.88% | | 09/18/2023 | | | 106,800 | |
| | 200,000 | | SURA Asset Management SA(d) | | 4.88% | | 04/17/2024 | | | 200,850 | |
| | | | | | | | | | | 699,910 | |
See Notes to Financial Statements.
| Annual Report | September 30, 2018 | 33 |
| RiverNorth/DoubleLine Strategic Income Fund | Schedule of Investments |
September 30, 2018
| Principal Amount/Description | Rate | | Maturity | | Value |
| Dominican Republic - 0.02% | | | | | | | | |
| $ | 300,000 | | Banco de Reservas de la Republica Dominicana(e) | | 7.00% | | 02/01/2023 | | $ | 306,000 | |
| France - 0.05% | | | | | | | | |
| | 525,000 | | BNP Paribas SA(e) | | 3.38% | | 01/09/2025 | | | 497,528 | |
| | 507,000 | | Orange SA | | 2.75% | | 02/06/2019 | | | 507,185 | |
| | | | | | | | | | | 1,004,713 | |
| Great Britain - 0.21% | | | | | | | | |
| | 510,000 | | Anglo American Capital PLC(e) | | 4.50% | | 03/15/2028 | | | 490,145 | |
| | 530,000 | | AstraZeneca PLC | | 2.38% | | 06/12/2022 | | | 509,429 | |
| | 390,000 | | Barclays PLC(f) | | 3M US L + 1.38% | | 05/16/2024 | | | 388,253 | |
| | 510,000 | | Credit Agricole SA/London(e) | | 3.75% | | 04/24/2023 | | | 500,707 | |
| | 765,000 | | HSBC Holdings PLC(f) | | 3M US L + 1.38% | | 09/12/2026 | | | 765,775 | |
| | 530,000 | | Lloyds Banking Group PLC(f) | | 3M US L + 1.205% | | 11/07/2028 | | | 486,196 | |
| | 200,000 | | MARB BondCo PLC(d) | | 7.00% | | 03/15/2024 | | | 189,750 | |
| | 300,000 | | MARB BondCo PLC(d) | | 6.88% | | 01/19/2025 | | | 279,937 | |
| | 255,000 | | Royal Bank of Scotland Group PLC(f) | | 3M US L + 1.48% | | 05/15/2023 | | | 247,254 | |
| | | | | | | | | | | 3,857,446 | |
| Guatemala - 0.01% | | | | | | | | |
| | 200,000 | | Energuate Trust(e) | | 5.88% | | 05/03/2027 | | | 189,900 | |
| India - 0.08% | | | | | | | | |
| | 200,000 | | Adani Ports & Special Economic Zone, Ltd.(d) | | 3.95% | | 01/19/2022 | | | 196,040 | |
| | 300,000 | | Bharti Airtel, Ltd.(d) | | 4.38% | | 06/10/2025 | | | 278,290 | |
| | 200,000 | | Indian Oil Corp., Ltd. | | 5.63% | | 08/02/2021 | | | 207,803 | |
| | 200,000 | | Indian Oil Corp., Ltd. | | 5.75% | | 08/01/2023 | | | 209,757 | |
| | 600,000 | | Vedanta Resources PLC(d) | | 6.13% | | 08/09/2024 | | | 560,441 | |
| | | | | | | | | | | 1,452,331 | |
| Ireland - 0.10% | | | | | | | | |
| | 535,000 | | AerCap Ireland Capital DAC / AerCap Global Aviation Trust | | 3.50% | | 01/15/2025 | | | 504,654 | |
| | 325,000 | | Avolon Holdings Funding, Ltd.(e) | | 5.13% | | 10/01/2023 | | | 328,657 | |
| | 600,000 | | C&W Senior Financing DAC(d) | | 6.88% | | 09/15/2027 | | | 600,000 | |
| | 415,000 | | Shire Acquisitions Investments Ireland DAC | | 2.88% | | 09/23/2023 | | | 396,207 | |
| | | | | | | | | | | 1,829,518 | |
| Isle Of Man - 0.03% | | | | | | | | |
| | 600,000 | | Gohl Capital, Ltd. | | 4.25% | | 01/24/2027 | | | 573,130 | |
| Israel - 0.07% | | | | | | | | |
| | 100,000 | | Delek & Avner Tamar Bond, Ltd.(e) | | 5.08% | | 12/30/2023 | | | 100,676 | |
| | 100,000 | | Delek & Avner Tamar Bond, Ltd.(e) | | 5.41% | | 12/30/2025 | | | 100,709 | |
See Notes to Financial Statements.
| 34 | (888) 848-7569 | www.rivernorth.com |
| RiverNorth/DoubleLine Strategic Income Fund | Schedule of Investments |
September 30, 2018
| Principal Amount/Description | Rate | | Maturity | | Value |
| $ | 1,100,000 | | Israel Electric Corp., Ltd.(e) | | 5.00% | | 11/12/2024 | | $ | 1,119,250 | |
| | | | | | | | | | | 1,320,635 | |
| Japan - 0.07% | | | | | | | | |
| | 490,000 | | Mitsubishi UFJ Financial Group, Inc.(f) | | 3M US L + 0.74% | | 03/02/2023 | | | 491,769 | |
| | 785,000 | | Sumitomo Mitsui Financial Group, Inc.(f) | | 3M US L + 0.74% | | 01/17/2023 | | | 786,248 | |
| | | | | | | | | | | 1,278,017 | |
| Luxembourg - 0.06% | | | | | | | | |
| | 200,000 | | Cosan Luxembourg SA(d) | | 7.00% | | 01/20/2027 | | | 198,200 | |
| | 200,000 | | Millicom International Cellular SA(d) | | 5.13% | | 01/15/2028 | | | 184,750 | |
| | 400,000 | | Minerva Luxembourg SA(d) | | 6.50% | | 09/20/2026 | | | 376,500 | |
| | 200,000 | | Minerva Luxembourg SA(d) | | 5.88% | | 01/19/2028 | | | 178,250 | |
| | 200,000 | | Raizen Fuels Finance SA(d) | | 5.30% | | 01/20/2027 | | | 188,500 | |
| | | | | | | | | | | 1,126,200 | |
| Malaysia - 0.06% | | | | | | | | |
| | 600,000 | | Axiata SPV2 Bhd | | 3.47% | | 11/19/2020 | | | 597,700 | |
| | 600,000 | | Malayan Banking Bhd(f) | | 3.91% | | 10/29/2026 | | | 592,404 | |
| | | | | | | | | | | 1,190,104 | |
| Mauritius - 0.02% | | | | | | | | |
| | 400,000 | | UPL Corp., Ltd.(d) | | 3.25% | | 10/13/2021 | | | 387,232 | |
| Mexico - 0.20% | | | | | | | | |
| | 200,000 | | Banco Santander Mexico SA Institucion de Banca Multiple Grupo Financiero Santander(e) | | 5.95% | | 10/01/2028 | | | 203,500 | |
| | 600,000 | | Banco Santander Mexico SA Institucion de Banca Multiple Grupo Financiero Santander(d)(f) | | 5.95% | | 01/30/2024 | | | 605,250 | |
| | 600,000 | | BBVA Bancomer SA(d) | | 5.13% | | 01/18/2033 | | | 548,250 | |
| | 200,000 | | Cometa Energia SA de CV(d) | | 6.38% | | 04/24/2035 | | | 197,200 | |
| | 200,000 | | Credito Real SAB de CV SOFOM ER(c)(d) | | 9.13% | | 12/31/2049 | | | 199,252 | |
| | 400,000 | | Fresnillo PLC(d) | | 5.50% | | 11/13/2023 | | | 413,500 | |
| | 200,000 | | Grupo Idesa SA de CV(e) | | 7.88% | | 12/18/2020 | | | 179,000 | |
| | 200,000 | | Grupo Idesa SA de CV(d) | | 7.88% | | 12/18/2020 | | | 179,000 | |
| | 450,000 | | Mexico City Airport Trust(e) | | 4.25% | | 10/31/2026 | | | 424,687 | |
| | 175,942 | | Mexico Generadora de Energia S de rl(d) | | 5.50% | | 12/06/2032 | | | 176,162 | |
| | 600,000 | | Unifin Financiera SAB de CV SOFOM ENR(c)(d) | | 8.88% | | 12/31/2049 | | | 564,006 | |
| | | | | | | | | | | 3,689,807 | |
| Netherlands - 0.15% | | | | | | | | |
| | 400,000 | | AES Andres BV / Dominican Power Partners / Empresa Generadora de Electricidad It(e) | | 7.95% | | 05/11/2026 | | | 415,000 | |
See Notes to Financial Statements.
| Annual Report | September 30, 2018 | 35 |
| RiverNorth/DoubleLine Strategic Income Fund | Schedule of Investments |
September 30, 2018
| Principal Amount/Description | Rate | Maturity | Value |
| | 500,000 | | Bharti Airtel International Netherlands BV(d) | | 5.13% | | 03/11/2023 | | $ | 494,621 | |
| | 520,000 | | Enel Finance International NV(e) | | 4.25% | | 09/14/2023 | | | 513,274 | |
| | 600,000 | | Petrobras Global Finance BV | | 5.75% | | 02/01/2029 | | | 537,150 | |
| | 685,000 | | Teva Pharmaceutical Finance Netherlands III BV | | 2.80% | | 07/21/2023 | | | 610,506 | |
| | 200,000 | | VTR Finance BV(d)(e) | | 6.88% | | 01/15/2024 | | | 204,250 | |
| | | | | | | | | | | 2,774,801 | |
| Panama - 0.09% | | | | | | | |
| | 388,308 | | Aeropuerto Internacional de Tocumen SA | | 5.75% | | 10/09/2023 | | | 400,442 | |
| | 500,000 | | Banco Internacional del Peru SAA/Panama(d) | | 5.75% | | 10/07/2020 | | | 521,750 | |
| | 239,566 | | ENA Norte Trust(d) | | 4.95% | | 04/25/2023 | | | 241,363 | |
| | 400,000 | | Global Bank Corp.(d) | | 5.13% | | 10/30/2019 | | | 403,900 | |
| | 200,000 | | Global Bank Corp.(d) | | 4.50% | | 10/20/2021 | | | 198,700 | |
| | | | | | | | | | | 1,766,155 | |
| Peru - 0.04% | | | | | | | | |
| | 100,000 | | BBVA Banco Continental SA(d) | | 5.00% | | 08/26/2022 | | | 103,500 | |
| | 200,000 | | Fondo MIVIVIENDA SA(e) | | 3.50% | | 01/31/2023 | | | 194,500 | |
| | 200,000 | | Inkia Energy, Ltd.(d) | | 5.88% | | 11/09/2027 | | | 190,752 | |
| | 200,000 | | Pesquera Exalmar SAA(d) | | 7.38% | | 01/31/2020 | | | 199,750 | |
| | | | | | | | | | | 688,502 | |
| Philippines - 0.06% | | | | | | | | |
| | 150,000 | | BDO Unibank, Inc. | | 2.63% | | 10/24/2021 | | | 144,051 | |
| | 600,000 | | BDO Unibank, Inc. | | 2.95% | | 03/06/2023 | | | 566,410 | |
| | 400,000 | | Union Bank of the Philippines | | 3.37% | | 11/29/2022 | | | 384,043 | |
| | | | | | | | | | | 1,094,504 | |
| Singapore - 0.16% | | | | | | | | |
| | 515,000 | | BOC Aviation, Ltd.(e)(f) | | 3M US L + 1.125% | | 09/26/2023 | | | 514,979 | |
| | 600,000 | | BPRL International Singapore Pte, Ltd. | | 4.38% | | 01/18/2027 | | | 566,285 | |
| | 200,000 | | DBS Group Holdings, Ltd.(c) | | 3.60% | | 12/29/2049 | | | 193,750 | |
| | 600,000 | | ONGC Videsh Vankorneft Pte, Ltd. | | 3.75% | | 07/27/2026 | | | 554,837 | |
| | 500,000 | | Temasek Financial I, Ltd.(d) | | 2.38% | | 01/23/2023 | | | 479,921 | |
| | 400,000 | | United Overseas Bank, Ltd.(f) | | 3.50% | | 09/16/2026 | | | 394,176 | |
| | 300,000 | | United Overseas Bank, Ltd.(c) | | 3.88% | | 12/31/2049 | | | 282,053 | |
| | | | | | | | | | | 2,986,001 | |
| South Korea - 0.03% | | | | | | | | |
| | 550,000 | | Korea Expressway Corp.(e)(f) | | 3M US L + 0.70% | | 04/20/2020 | | | 551,175 | |
| Spain - 0.03% | | | | | | | | |
| | 600,000 | | Banco Santander SA(f) | | 3M US L + 1.09% | | 02/23/2023 | | | 602,358 | |
See Notes to Financial Statements.
| 36 | (888) 848-7569 | www.rivernorth.com |
| RiverNorth/DoubleLine Strategic Income Fund | Schedule of Investments |
September 30, 2018
| Principal Amount/Description | | Rate | | Maturity | | Value |
| Switzerland - 0.03% | | | | | | |
| | 640,000 | | Credit Suisse Group AG(e)(f) | | 3M US L + 1.24% | | 06/12/2024 | | $ | 644,032 | |
| | | | | | | | | |
| TOTAL FOREIGN CORPORATE BONDS (Cost $49,511,910) | | | | | | | 46,990,792 | |
| | | | | | | | | | | | |
| U.S. CORPORATE BONDS - 3.44% | | | | | | | | |
| Advertising - 0.03% | | | | | | | | |
| | 500,000 | | Interpublic Group of Cos., Inc. | | 5.40% | | 10/01/2048 | | | 498,163 | |
| Aerospace/Defense - 0.04% | | | | | | | | |
| | 475,000 | | Lockheed Martin Corp. | | 4.70% | | 05/15/2046 | | | 507,558 | |
| | 320,000 | | TransDigm, Inc. | | 6.38% | | 06/15/2026 | | | 324,000 | |
| | | | | | | | | | | 831,558 | |
| Agriculture - 0.03% | | | | | | | | |
| | 95,000 | | BAT Capital Corp.(e)(f) | | 3M US L + 0.88% | | 08/15/2022 | | | 95,803 | |
| | 390,000 | | Reynolds American, Inc. | | 4.00% | | 06/12/2022 | | | 392,673 | |
| | | | | | | | | | | 488,476 | |
| Airlines - 0.03% | | | | | | | | |
| | 515,000 | | Delta Air Lines, Inc. | | 3.80% | | 04/19/2023 | | | 504,949 | |
| Auto Manufacturers - 0.13% | | | | | | | | |
| | 1,035,000 | | Daimler Finance North America LLC(e)(f) | | 3M US L + 0.84% | | 05/04/2023 | | | 1,039,747 | |
| | 420,000 | | Ford Motor Co. | | 7.45% | | 07/16/2031 | | | 468,814 | |
| | 185,000 | | General Motors Co.(f) | | 3M US L + 0.80% | | 08/07/2020 | | | 185,671 | |
| | 450,000 | | General Motors Financial Co., Inc.(f) | | 3M US L + 0.99% | | 01/05/2023 | | | 451,066 | |
| | 305,000 | | General Motors Financial Co., Inc. | | 3.95% | | 04/13/2024 | | | 297,330 | |
| | | | | | | | | | | 2,442,628 | |
| Banks - 0.11% | | | | | | | | |
| | 125,000 | | Capital One Financial Corp.(f) | | 3M US L + 0.72% | | 01/30/2023 | | | 124,521 | |
| | 755,000 | | Citigroup, Inc.(f) | | 3M US L + 1.10% | | 05/17/2024 | | | 761,490 | |
| | 330,000 | | Goldman Sachs Group, Inc.(f) | | 3M US L + 0.78% | | 10/31/2022 | | | 331,737 | |
| | 325,000 | | Goldman Sachs Group, Inc.(f) | | 3M US L + 1.17% | | 05/15/2026 | | | 325,485 | |
| | 520,000 | | Morgan Stanley(f) | | 3M US L + 1.34% | | 07/22/2028 | | | 493,648 | |
| | | | | | | | | | | 2,036,881 | |
| Beverages - 0.03% | | | | | | | | |
| | 300,000 | | Anheuser-Busch InBev Finance, Inc. | | 4.90% | | 02/01/2046 | | | 301,762 | |
See Notes to Financial Statements.
| Annual Report | September 30, 2018 | 37 |
| RiverNorth/DoubleLine Strategic Income Fund | Schedule of Investments |
September 30, 2018
| Principal Amount/Description | | Rate | | Maturity | | Value |
| $ | 250,000 | | Anheuser-Busch InBev Worldwide, Inc. | | 4.60% | | 04/15/2048 | | $ | 242,734 | |
| | | | | | | | | | | 544,496 | |
| Biotechnology - 0.03% | | | | | | | | |
| | 520,000 | | Celgene Corp. | | 4.35% | | 11/15/2047 | | | 466,599 | |
| Building Materials - 0.03% | | | | | | | | |
| | 320,000 | | Builders FirstSource, Inc.(e) | | 5.63% | | 09/01/2024 | | | 308,800 | |
| | 260,000 | | Owens Corning | | 4.40% | | 01/30/2048 | | | 215,799 | |
| | | | | | | | | | | 524,599 | |
| Chemicals - 0.04% | | | | | | | | |
| | 80,000 | | Hexion, Inc. | | 6.63% | | 04/15/2020 | | | 75,400 | |
| | 240,000 | | Hexion, Inc.(e) | | 10.38% | | 02/01/2022 | | | 234,600 | |
| | 515,000 | | Mosaic Co. | | 4.05% | | 11/15/2027 | | | 498,930 | |
| | | | | | | | | | | 808,930 | |
| Coal - 0.03% | | | | | | | | |
| | 305,000 | | Peabody Energy Corp.(e) | | 6.00% | | 03/31/2022 | | | 311,100 | |
| | 310,000 | | SunCoke Energy Partners LP /SunCoke Energy Partners Finance Corp.(e) | | 7.50% | | 06/15/2025 | | | 320,075 | |
| | | | | | | | | | | 631,175 | |
| Commercial Services - 0.03% | | | | | | | | |
| | 239,000 | | Prime Security Services Borrower LLC / Prime Finance, Inc.(e) | | 9.25% | | 05/15/2023 | | | 256,208 | |
| | 65,000 | | ServiceMaster Co. LLC(e) | | 5.13% | | 11/15/2024 | | | 64,341 | |
| | 260,000 | | Verscend Escrow Corp.(e) | | 9.75% | | 08/15/2026 | | | 268,775 | |
| | | | | | | | | | | 589,324 | |
| Containers and Packaging - 0.04% | | | | | | | | |
| | 255,000 | | Packaging Corp. of America | | 3.40% | | 12/15/2027 | | | 240,013 | |
| | 500,000 | | WestRock Co.(e) | | 3.75% | | 03/15/2025 | | | 491,905 | |
| | | | | | | | | | | 731,918 | |
| Distribution/Wholesale - 0.03% | | | | | | | | |
| | 320,000 | | Avantor, Inc.(e) | | 9.00% | | 10/01/2025 | | | 330,800 | |
| | 340,000 | | Beacon Roofing Supply, Inc.(e) | | 4.88% | | 11/01/2025 | | | 314,500 | |
| | | | | | | | | | | 645,300 | |
| Diversified Financial Services - 0.22% | | | | | | | | |
| | 568,000 | | Air Lease Corp. | | 3.75% | | 02/01/2022 | | | 569,370 | |
| | 645,000 | | Ally Financial, Inc. | | 4.13% | | 03/30/2020 | | | 649,031 | |
| | 40,000 | | Ally Financial, Inc. | | 4.25% | | 04/15/2021 | | | 40,380 | |
| | 1,045,000 | | American Express Co. | | 2.50% | | 08/01/2022 | | | 1,003,562 | |
| | 175,000 | | ASP AMC Merger Sub, Inc.(e) | | 8.00% | | 05/15/2025 | | | 133,875 | |
| | 640,000 | | Discover Financial Services | | 4.10% | | 02/09/2027 | | | 612,459 | |
| | 140,000 | | Nationstar Mortgage Holdings, Inc.(e) | | 8.13% | | 07/15/2023 | | | 146,972 | |
| | 320,000 | | NFP Corp.(e) | | 6.88% | | 07/15/2025 | | | 321,600 | |
| | 100,000 | | Springleaf Finance Corp. | | 7.13% | | 03/15/2026 | | | 100,000 | |
| | 499,000 | | Synchrony Financial | | 3.00% | | 08/15/2019 | | | 498,100 | |
See Notes to Financial Statements.
| 38 | (888) 848-7569 | www.rivernorth.com |
| RiverNorth/DoubleLine Strategic Income Fund | Schedule of Investments |
September 30, 2018
| Principal Amount/Description | | Rate | | Maturity | | Value |
| $ | 15,000 | | Synchrony Financial | | 3.95% | | 12/01/2027 | | $ | 13,616 | |
| | | | | | | | | | | 4,088,965 | |
| Electric - 0.26% | | | | | | | | |
| | 230,000 | | Duke Energy Corp. | | 3.75% | | 09/01/2046 | | | 202,635 | |
| | 215,000 | | Duke Energy Corp. | | 3.95% | | 08/15/2047 | | | 194,245 | |
| | 450,000 | | Duke Energy Progress LLC | | 4.15% | | 12/01/2044 | | | 441,842 | |
| | 500,000 | | Edison International | | 4.13% | | 03/15/2028 | | | 495,554 | |
| | 1,100,000 | | ITC Holdings Corp. | | 3.25% | | 06/30/2026 | | | 1,039,705 | |
| | 250,000 | | NextEra Energy Capital Holdings, Inc. 3.55% | | | | 05/01/2027 | | | 240,830 | |
| | 335,000 | | NextEra Energy Operating Partners LP(e) | | 4.50% | | 09/15/2027 | | | 322,019 | |
| | 380,000 | | PSEG Power LLC | | 3.85% | | 06/01/2023 | | | 378,933 | |
| | 260,000 | | Southern California Edison Co. | | 4.13% | | 03/01/2048 | | | 248,722 | |
| | 1,000,000 | | Virginia Electric & Power Co. | | 3.50% | | 03/15/2027 | | | 978,853 | |
| | 325,000 | | Vistra Operations Co. LLC(e) | | 5.50% | | 09/01/2026 | | | 329,062 | |
| | | | | | | | | | | 4,872,400 | |
| Electronics - 0.04% | | | | | | | | |
| | 265,000 | | Arrow Electronics, Inc. | | 3.88% | | 01/12/2028 | | | 247,197 | |
| | 525,000 | | Corning, Inc. | | 4.38% | | 11/15/2057 | | | 460,951 | |
| | | | | | | | | | | 708,148 | |
| Engineering & Construction - 0.02% | | | | | | | | |
| | 400,000 | | SBA Tower Trust(e) | | 3.17% | | 04/11/2022 | | | 394,193 | |
| Entertainment - 0.04% | | | | | | | | |
| | 80,000 | | Delta Merger Sub, Inc.(e) | | 6.00% | | 09/15/2026 | | | 81,200 | |
| | 235,000 | | Eldorado Resorts, Inc. | | 6.00% | | 04/01/2025 | | | 238,819 | |
| | 295,000 | | GLP Capital LP / GLP Financing II, Inc. 5.75% | | | | 06/01/2028 | | | 305,136 | |
| | 200,000 | | GLP Capital LP / GLP Financing II, Inc. 5.30% | | | | 01/15/2029 | | | 200,856 | |
| | | | | | | | | | | 826,011 | |
| Food - 0.10% | | | | | | | | |
| | 255,000 | | JBS USA LUX SA / JBS USA Finance, Inc.(e) | | 6.75% | | 02/15/2028 | | | 253,725 | |
| | 515,000 | | Kroger Co. | | 3.40% | | 04/15/2022 | | | 510,986 | |
| | 325,000 | | Pilgrim's Pride Corp.(e) | | 5.75% | | 03/15/2025 | | | 314,438 | |
| | 320,000 | | Post Holdings, Inc.(e) | | 5.50% | | 03/01/2025 | | | 318,640 | |
| | 530,000 | | Smithfield Foods, Inc.(e) | | 4.25% | | 02/01/2027 | | | 499,064 | |
| | | | | | | | | | | 1,896,853 | |
| Forest Products & Paper - 0.03% | | | | | | | | |
| | 510,000 | | Georgia-Pacific LLC(e) | | 3.60% | | 03/01/2025 | | | 505,221 | |
| Healthcare-Products - 0.08% | | | | | | | | |
| | 760,000 | | Becton Dickinson and Co. | | 2.89% | | 06/06/2022 | | | 739,433 | |
| | 315,000 | | Universal Hospital Services, Inc. | | 7.63% | | 08/15/2020 | | | 316,544 | |
| | 520,000 | | Zimmer Biomet Holdings, Inc. | | 2.70% | | 04/01/2020 | | | 515,101 | |
| | | | | | | | | | | 1,571,078 | |
See Notes to Financial Statements.
| Annual Report | September 30, 2018 | 39 |
| RiverNorth/DoubleLine Strategic Income Fund | Schedule of Investments |
September 30, 2018
| Principal Amount/Description | | Rate | | Maturity | | Value |
| Healthcare-Services - 0.07% | | | | | | |
| $ | 320,000 | | Centene Corp. | | 4.75% | | 01/15/2025 | | $ | 320,000 | |
| | 35,000 | | Centene Corp.(e) | | 5.38% | | 06/01/2026 | | | 35,962 | |
| | 515,000 | | Halfmoon Parent, Inc.(e)(f) | | 3M US L + 0.89% | | 07/15/2023 | | | 515,365 | |
| | 320,000 | | HCA, Inc. | | 5.38% | | 09/01/2026 | | | 324,640 | |
| | 200,000 | | WellCare Health Plans, Inc.(e) | | 5.38% | | 08/15/2026 | | | 204,000 | |
| | | | | | | | | | | 1,399,967 | |
| Home Furnishings - 0.02% | | | | | | | |
| | 330,000 | | Tempur Sealy International, Inc. | | 5.50% | | 06/15/2026 | | | 317,213 | |
| Insurance - 0.18% | | | | | | | | | |
| | 300,000 | | Alliant Holdings Intermediate LLC /Alliant Holdings Co.-Issuer(e) | | 8.25% | | 08/01/2023 | | | 311,250 | |
| | 505,000 | | Athene Global Funding(e) | | 3.00% | | 07/01/2022 | | | 489,753 | |
| | 530,000 | | AXA Equitable Holdings, Inc.(e) | | 3.90% | | 04/20/2023 | | | 526,577 | |
| | 515,000 | | Brighthouse Financial, Inc. | | 3.70% | | 06/22/2027 | | | 457,934 | |
| | 855,000 | | Liberty Mutual Group, Inc.(e) | | 6.50% | | 05/01/2042 | | | 1,035,690 | |
| | 515,000 | | Willis North America, Inc. | | 4.50% | | 09/15/2028 | | | 515,593 | |
| | | | | | | | | | | 3,336,797 | |
| Internet - 0.04% | | | | | | | | |
| | 530,000 | | Expedia Group, Inc. | | 3.80% | | 02/15/2028 | | | 489,149 | |
| | 325,000 | | Match Group, Inc.(e) | | 5.00% | | 12/15/2027 | | | 325,032 | |
| | | | | | | | | | | 814,181 | |
| Investment Companies - 0.40% | | | | | | | | |
| | 5,000,000 | | Business Development Corp. of America(e) | | 5.38% | | 05/30/2023 | | | 4,972,650 | |
| | 2,500,000 | | FS Investment Corp. | | 4.25% | | 01/15/2020 | | | 2,502,222 | |
| | | | | | | | | | | 7,474,872 | |
| Leisure Time - 0.03% | | | | | | | |
| | 260,000 | | Royal Caribbean Cruises, Ltd. | | 3.70% | | 03/15/2028 | | | 241,440 | |
| | 330,000 | | Viking Cruises, Ltd.(e) | | 5.88% | | 09/15/2027 | | | 322,839 | |
| | | | | | | | | | | 564,279 | |
| Lodging - 0.03% | | | | | | | | | |
| | 505,000 | | Hilton Domestic Operating Co., Inc.(e) | | 5.13% | | 05/01/2026 | | | 504,369 | |
| Machinery-Construction & Mining - 0.02% | | | | | | | | |
| | 295,000 | | BlueLine Rental Finance Corp. / BlueLine Rental LLC(e) | | 9.25% | | 03/15/2024 | | | 310,303 | |
| Media - 0.07% | | | | | | | | |
| | 160,000 | | CCO Holdings LLC / CCO Holdings Capital Corp.(e) | | 5.75% | | 02/15/2026 | | | 161,000 | |
| | 170,000 | | CCO Holdings LLC / CCO Holdings Capital Corp.(e) | | 5.00% | | 02/01/2028 | | | 160,208 | |
| | 280,000 | | Cengage Learning, Inc.(e) | | 9.50% | | 06/15/2024 | | | 242,550 | |
See Notes to Financial Statements.
| 40 | (888) 848-7569 | www.rivernorth.com |
| RiverNorth/DoubleLine Strategic Income Fund | Schedule of Investments |
September 30, 2018
| Principal Amount/Description | | Rate | | Maturity | | Value |
| $ | 605,000 | | Charter Communications Operating LLC / Charter Communications Operating Capital | | 4.91% | | 07/23/2025 | | $ | 614,902 | |
| | 170,000 | | CSC Holdings LLC | | 5.25% | | 06/01/2024 | | | 166,600 | |
| | | | | | | | | | | 1,345,260 | |
| Oil & Gas - 0.17% | | | | | | | | |
| | 480,000 | | Andeavor | | 5.13% | | 12/15/2026 | | | 502,795 | |
| | 255,000 | | Apache Corp. | | 4.38% | | 10/15/2028 | | | 251,207 | |
| | 515,000 | | CNOOC Finance 2015 USA LLC | | 3.75% | | 05/02/2023 | | | 511,049 | |
| | 160,000 | | EP Energy LLC / Everest Acquisition Finance, Inc.(e) | | 7.75% | | 05/15/2026 | | | 164,400 | |
| | 540,000 | | EQT Corp. | | 3.90% | | 10/01/2027 | | | 506,701 | |
| | 130,000 | | Extraction Oil & Gas, Inc.(e) | | 5.63% | | 02/01/2026 | | | 115,700 | |
| | 325,000 | | Gulfport Energy Corp. | | 6.38% | | 05/15/2025 | | | 320,937 | |
| | 185,000 | | Indigo Natural Resources LLC(e) | | 6.88% | | 02/15/2026 | | | 179,912 | |
| | 190,000 | | Nabors Industries, Inc.(e) | | 5.75% | | 02/01/2025 | | | 182,567 | |
| | 170,000 | | QEP Resources, Inc. | | 5.63% | | 03/01/2026 | | | 163,200 | |
| | 165,000 | | Sunoco LP / Sunoco Finance Corp.(e) | | 5.50% | | 02/15/2026 | | | 159,803 | |
| | 150,000 | | USA Compression Partners LP / USA Compression Finance Corp.(e) | | 6.88% | | 04/01/2026 | | | 155,438 | |
| | | | | | | | | | | 3,213,709 | |
| Packaging & Containers - 0.03% | | | | | | | |
| | 325,000 | | Crown Americas LLC / Crown Americas Capital Corp. VI(e) | | 4.75% | | 02/01/2026 | | | 312,000 | |
| | 325,000 | | Flex Acquisition Co., Inc.(e) | | 6.88% | | 01/15/2025 | | | 312,000 | |
| | | | | | | | | | | 624,000 | |
| Pharmaceuticals - 0.05% | | | | | | | | |
| | 530,000 | | AbbVie, Inc. | | 4.70% | | 05/14/2045 | | | 510,263 | |
| | 500,000 | | CVS Health Corp. | | 5.05% | | 03/25/2048 | | | 512,780 | |
| | | | | | | | | | | 1,023,043 | |
| Pipelines - 0.18% | | | | | | | | |
| | 330,000 | | Cheniere Energy Partners LP | | 5.25% | | 10/01/2025 | | | 330,825 | |
| | 530,000 | | Enable Midstream Partners LP | | 4.40% | | 03/15/2027 | | | 509,315 | |
| | 480,000 | | Energy Transfer Partners LP | | 4.75% | | 01/15/2026 | | | 485,515 | |
| | 30,000 | | Energy Transfer Partners LP | | 4.20% | | 04/15/2027 | | | 29,016 | |
| | 650,000 | | EQT Midstream Partners LP | | 4.75% | | 07/15/2023 | | | 659,642 | |
| | 633,000 | | Kinder Morgan Energy Partners LP | | 6.95% | | 01/15/2038 | | | 767,742 | |
| | 585,000 | | Sabine Pass Liquefaction LLC | | 5.00% | | 03/15/2027 | | | 600,988 | |
| | | | | | | | | | | 3,383,043 | |
| REITS - 0.26% | | | | | | | | |
| | 380,000 | | Alexandria Real Estate Equities, Inc. | | 4.00% | | 01/15/2024 | | | 381,287 | |
| | 800,000 | | American Tower Corp. | | 3.38% | | 10/15/2026 | | | 745,944 | |
| | 550,000 | | American Tower Corp. | | 3.60% | | 01/15/2028 | | | 514,579 | |
| | 500,000 | | Boston Properties LP | | 4.13% | | 05/15/2021 | | | 508,728 | |
| | 800,000 | | Crown Castle International Corp. | | 3.70% | | 06/15/2026 | | | 765,396 | |
See Notes to Financial Statements.
| Annual Report | September 30, 2018 | 41 |
| RiverNorth/DoubleLine Strategic Income Fund | Schedule of Investments |
September 30, 2018
| Principal Amount/Description | | Rate | | Maturity | | Value |
| $ | 515,000 | | Crown Castle International Corp. | | 3.65% | | 09/01/2027 | | $ | 484,532 | |
| | 400,000 | | Digital Realty Trust LP | | 3.70% | | 08/15/2027 | | | 380,470 | |
| | 328,000 | | ESH Hospitality, Inc.(e) | | 5.25% | | 05/01/2025 | | | 318,980 | |
| | 335,000 | | MPT Operating Partnership LP / MPT Finance Corp. | | 5.25% | | 08/01/2026 | | | 335,000 | |
| | 515,000 | | Welltower, Inc. | | 3.95% | | 09/01/2023 | | | 515,342 | |
| | | | | | | | | | | 4,950,258 | |
| Retail - 0.05% | | | | | | | |
| | 510,000 | | Dollar Tree, Inc. | | 4.00% | | 05/15/2025 | | | 500,693 | |
| | 200,000 | | McDonald's Corp. | | 4.45% | | 03/01/2047 | | | 196,851 | |
| | 210,000 | | PetSmart, Inc.(e) | | 7.13% | | 03/15/2023 | | | 151,988 | |
| | 120,000 | | PetSmart, Inc.(e) | | 5.88% | | 06/01/2025 | | | 98,963 | |
| | | | | | | | | | | 948,495 | |
| Semiconductors - 0.05% | | | | | | | |
| | 505,000 | | Marvell Technology Group, Ltd. | | 4.20% | | 06/22/2023 | | | 502,927 | |
| | 510,000 | | Microchip Technology, Inc.(e) | | 4.33% | | 06/01/2023 | | | 507,252 | |
| | | | | | | | | | | 1,010,179 | |
| Software - 0.09% | | | | | | | |
| | 155,000 | | CDK Global, Inc. | | 5.88% | | 06/15/2026 | | | 160,484 | |
| | 148,000 | | Fidelity National Information Services, Inc. | | 3.63% | | 10/15/2020 | | | 148,870 | |
| | 285,000 | | Genesys Telecommunications Laboratories, Inc./Greeneden Lux 3 Sarl/Greeneden US Ho(e) | | 10.00% | | 11/30/2024 | | | 316,350 | |
| | 310,000 | | Informatica LLC(e) | | 7.13% | | 07/15/2023 | | | 318,860 | |
| | 260,000 | | Oracle Corp. | | 4.13% | | 05/15/2045 | | | 252,255 | |
| | 90,000 | | Riverbed Technology, Inc.(e) | | 8.88% | | 03/01/2023 | | | 85,163 | |
| | 60,000 | | Solera LLC / Solera Finance, Inc.(e) | | 10.50% | | 03/01/2024 | | | 66,048 | |
| | 305,000 | | Sophia LP / Sophia Finance, Inc.(e) | | 9.00% | | 09/30/2023 | | | 319,487 | |
| | | | | | | | | | | 1,667,517 | |
| Special Purpose Banks - 0.02% | | | | | | | |
| | 330,000 | | Caesars Resort Collection LLC / CRC Finco, Inc.(e) | | 5.25% | | 10/15/2025 | | | 315,150 | |
| Telecommunications - 0.14% | | | | | | | | |
| | 720,000 | | AT&T, Inc. | | 5.25% | | 03/01/2037 | | | 718,820 | |
| | 310,000 | | CommScope Technologies LLC(e) | | 6.00% | | 06/15/2025 | | | 321,470 | |
| | 315,000 | | Level 3 Financing, Inc. | | 5.38% | | 01/15/2024 | | | 316,336 | |
| | 80,000 | | Sprint Capital Corp. | | 6.88% | | 11/15/2028 | | | 80,575 | |
| | 160,000 | | Sprint Corp. | | 7.13% | | 06/15/2024 | | | 166,600 | |
| | 515,000 | | Sprint Spectrum Co. LLC / Sprint Spectrum Co II LLC / Sprint Spectrum Co III LLC(e) | | 4.74% | | 03/20/2025 | | | 516,056 | |
| | 515,000 | | Verizon Communications, Inc. | | 4.40% | | 11/01/2034 | | | 503,069 | |
| | | | | | | | | | | 2,622,926 | |
See Notes to Financial Statements.
| 42 | (888) 848-7569 | www.rivernorth.com |
| RiverNorth/DoubleLine Strategic Income Fund | Schedule of Investments |
September 30, 2018
| Principal Amount/Description | | Rate | | Maturity | | Value |
| Toys/Games/Hobbies - 0.03% | | | | | | |
| $ | 550,000 | | Hasbro, Inc. | | 3.50% | | 09/15/2027 | | $ | 511,272 | |
| Transportation - 0.08% | | | | | | | | |
| | 465,000 | | Burlington Northern Santa Fe LLC | | 4.55% | | 09/01/2044 | | | 484,603 | |
| | 575,000 | | CSX Corp. | | 3.80% | | 11/01/2046 | | | 521,215 | |
| | 550,000 | | FedEx Corp. | | 4.75% | | 11/15/2045 | | | 551,998 | |
| | | | | | | | | | | 1,557,816 | |
| Trucking & Leasing - 0.01% | | | | | | | | |
| | 245,000 | | Penske Truck Leasing Co. LP / PTL Finance Corp.(e) | | 4.20% | | 04/01/2027 | | | 240,777 | |
| | | | | | | | | | | | |
| TOTAL U.S. CORPORATE BONDS (Cost $65,855,841) | | | | | | | 64,743,291 | |
| | | | | | | | | |
| FOREIGN GOVERNMENT BONDS AND NOTES, SUPRANATIONALS AND FOREIGN AGENCIES - 0.25% |
| | 700,000 | | Argentine Republic Government International Bond | | 6.88% | | 01/26/2027 | | | 596,750 | |
| | 200,000 | | Chile Government International Bond | | 3.13% | | 01/21/2026 | | | 192,349 | |
| | 400,000 | | Costa Rica Government International Bond(d) | | 10.00% | | 08/01/2020 | | | 430,000 | |
| | 600,000 | | Israel Government International Bond | | 2.88% | | 03/16/2026 | | | 568,620 | |
| | 400,000 | | Malaysia Sovereign Sukuk Bhd International Bond(d) | | 3.04% | | 04/22/2025 | | | 383,200 | |
| | 285,000 | | Mexico Government International Bond | | 4.15% | | 03/28/2027 | | | 280,974 | |
| | 475,000 | | Mexico Government International Bond | | 3.75% | | 01/11/2028 | | | 453,269 | |
| | 600,000 | | Perusahaan Penerbit SBSN Indonesia III International Bond(e) | | 4.15% | | 03/29/2027 | | | 580,200 | |
| | 700,000 | | Philippine Government International Bond | | 4.20% | | 01/21/2024 | | | 720,841 | |
| | 600,000 | | Provincia de Buenos Aires International Bond(d) | | 7.88% | | 06/15/2027 | | | 501,906 | |
| | | | | | | | | | | | |
| TOTAL FOREIGN GOVERNMENT BONDS AND NOTES, SUPRANATIONALS AND FOREIGN AGENCIES (Cost $5,014,753) | | | | | | | 4,708,109 | |
See Notes to Financial Statements.
| Annual Report | September 30, 2018 | 43 |
| RiverNorth/DoubleLine Strategic Income Fund | Schedule of Investments |
September 30, 2018
| Principal Amount/Description | | Rate | | Maturity | | Value | |
| BANK LOANS - 1.79%(f) | | | | | | | |
| Canada - 0.03% | | | | | | | |
| $ | 648,359 | | GW Honos Security Corp., First Lien B Term Loan | | 3M US L + 3.497%, 1.00% Floor | | 05/24/2024 | | $ | 651,869 | |
| | | | | | | | | | | | |
| Jersey - 0.04% | | | | | | | | |
| | 675,000 | | Capri Acquisitions BidCo, Ltd., First Lien Initial Dollar Term Loan(i) | | 3M US L + 3.25% | | 11/01/2024 | | | 674,295 | |
| | | | | | | | | | | | |
| Luxembourg - 0.01% | | | | | | | | |
| | 250,000 | | Auris LuxCo, First Lien B Term Loan(i) | | L + 3.75% | | 07/24/2025 | | | 253,439 | |
| | | | | | | | | | | | |
| United States - 1.71% | | | | | | | | |
| | 675,000 | | Acrisure LLC, First Lien 2017-2 Refinancing Term Loan | | 3M US L + 4.25%, 1.00% Floor | | 11/22/2023 | | | 678,659 | |
| | 398,987 | | AlixPartners, LLP, First Lien 2017 Refinancing Term Loan | | 3M US L + 2.75%, 1.00% Floor | | 04/04/2024 | | | 401,315 | |
| | 648,363 | | Applied Systems, Inc., First Lien Initial Term Loan | | 3M US L + 3.00%, 1.00% Floor | | 09/19/2024 | | | 652,911 | |
| | 675,000 | | AssuredPartners, Inc., First Lien 2017 September Refinancing Term Loan | | 1M US L + 3.25% | | 10/22/2024 | | | 677,531 | |
| | 673,313 | | Asurion LLC, First Lien New B-7 Term Loan | | 1M US L + 3.00% | | 11/03/2024 | | | 678,837 | |
| | 675,000 | | BMC Software Finance, Inc., First Lien Initial Dollar Term Loan(i) | | L + 4.25% | | 09/01/2025 | | | 682,361 | |
| | 315,000 | | Brookfield WEC Holdings, Inc., First Lien Initial Term Loan | | 1M US L + 3.75%, 0.75% Floor | | 08/01/2025 | | | 319,273 | |
| | 675,000 | | Canyon Valor Cos., Inc., First Lien Initial Dollar Term Loan(i) | | 3M US L + 3.25% | | 06/16/2023 | | | 679,458 | |
| | 666,456 | | Change Healthcare Holdings, Inc., First Lien Closing Date Term Loan | | 1M US L + 2.75%, 1.00% Floor | | 03/01/2024 | | | 669,425 | |
| | 675,000 | | CHG Healthcare Services, Inc., First Lien 2017 New Term Loan | | 3M US L + 3.00%, 1.00% Floor | | 06/07/2023 | | | 679,958 | |
| | 650,000 | | Concentra, Inc., First Lien Tranche B-1 Term Loan | | 1M US L + 2.75%, 1.00% Floor | | 06/01/2022 | | | 655,281 | |
| | 673,308 | | Cvent, Inc., First Lien Term Loan | | 1M US L + 3.75%, 1.00% Floor | | 11/29/2024 | | | 674,571 | |
See Notes to Financial Statements.
| 44 | (888) 848-7569 | www.rivernorth.com |
| RiverNorth/DoubleLine Strategic Income Fund | Schedule of Investments |
September 30, 2018
| Principal Amount/Description | | Rate | | Maturity | | Value | |
| $ | 673,295 | | Cyxtera DC Holdings, Inc., First Lien Initial Term Loan | | 3M US L + 3.00%, 1.00% Floor | | 05/01/2024 | | $ | 675,191 | |
| | 305,000 | | Edelman Financial Center LLC, First Lien Initial Term Loan | | 3M US L + 3.25% | | 07/21/2025 | | | 308,114 | |
| | 525,000 | | Envision Healthcare Corp., First Lien Term Loan(i) | | L + 3.75% | | 09/26/2025 | | | 522,375 | |
| | 673,295 | | Equian Buyer Corp., First Lien 2018 Incremental Term Loan | | 1M US L + 3.25%, 1.00% Floor | | 05/20/2024 | | | 677,399 | |
| | 673,300 | | Equinox Holdings, Inc., First Lien B1 Term Loan | | 1M US L + 3.00%, 1.00% Floor | | 03/08/2024 | | | 677,255 | |
| | 650,000 | | Exgen Renewables IV LLC, First Lien Term Loan | | 3M US L + 3.00%, 1.00% Floor | | 11/28/2024 | | | 656,500 | |
| | 673,308 | | Filtration Group Corp., First Lien Initial Dollar Term Loan | | 1M US L + 3.00% | | 03/29/2025 | | | 678,840 | |
| | 420,000 | | Financial & Risk US Holdings, Inc., First Lien Initial Dollar Term Loan(i) | | L + 3.75% | | 09/18/2025 | | | 419,563 | |
| | 648,363 | | Gates Global LLC, First Lien Initial B-2 Dollar Term Loan | | 1M US L + 2.75%, 1.00% Floor | | 04/01/2024 | | | 653,125 | |
| | 675,000 | | Gentiva Health Services, Inc., First Lien Closing Date Initial Term Loan | | 1M US L + 3.75% | | 07/02/2025 | | | 683,859 | |
| | 641,875 | | Graftech International, Ltd., First Lien Initial Term Loan | | 1M US L + 3.50%, 1.00% Floor | | 02/12/2025 | | | 647,090 | |
| | 650,000 | | Greeneden US Holdings II LLC, First Lien Tranche B-3 Dollar Term Loan(i) | | 1M US L + 3.50% | | 12/01/2023 | | | 654,225 | |
| | 665,000 | | Hayward Industries, Inc., First Lien Initial Term Loan(i) | | 1M US L + 3.50% | | 08/05/2024 | | | 669,988 | |
| | 648,354 | | Hyland Software, Inc., First Lien Term-3 Term Loan | | 1M US L + 3.25%, 0.75% Floor | | 07/01/2022 | | | 653,532 | |
| | 650,000 | | Informatica LLC, First Lien Dollar B-1 Term Loan(i) | | 1M US L + 3.25% | | 08/05/2022 | | | 655,889 | |
| | 673,260 | | Jaguar Holding Co. II, First Lien 2018 Term Loan | | 1M US L + 2.50%, 1.00% Floor | | 08/18/2022 | | | 674,600 | |
| | 675,000 | | Kronos, Inc., First Lien Incremental Term Loan(i) | | 3M US L + 3.00% | | 11/01/2023 | | | 679,178 | |
| | 675,000 | | Life Time Fitness, Inc., First Lien 2017 Refinancing Term Loan(i) | | 3M US L + 2.75%, 1.00% Floor | | 06/10/2022 | | | 678,837 | |
See Notes to Financial Statements.
| Annual Report | September 30, 2018 | 45 |
| RiverNorth/DoubleLine Strategic Income Fund | Schedule of Investments |
September 30, 2018
| Principal Amount/Description | | Rate | | Maturity | | Value | |
| $ | 655,987 | | Milacron LLC, First Lien B Term Loan | | 1M US L + 2.50% | | 09/28/2023 | | $ | 657,423 | |
| | 640,006 | | Misys, Ltd., First Lien Dollar Term Loan | | 3M US L + 3.50%, 1.00% Floor | | 06/13/2024 | | | 641,206 | |
| | 670,000 | | MLN US HoldCo LLC, First Lien Term Loan(i) | | L + 4.50% | | 07/11/2025 | | | 677,749 | |
| | 660,000 | | MPH Acquisition Holdings LLC, First Lien Initial Term Loan(i) | | L + 2.75%, 1.00% Floor | | 06/07/2023 | | | 662,138 | |
| | 673,300 | | National Vision, Inc., First Lien New Term Loan | | 1M US L + 2.50% | | 11/20/2024 | | | 679,403 | |
| | 673,300 | | Peak 10 Holding Corp., First Lien Initial Term Loan | | 3M US L + 3.50% | | 08/01/2024 | | | 668,109 | |
| | 655,911 | | Pike Corp., First Lien 2018 Initial Term Loan | | 1M US L + 3.50%, 1.00% Floor | | 03/23/2025 | | | 662,142 | |
| | 675,000 | | Plantronics, Inc., First Lien Initial B Term Loan | | 1M US L + 2.50% | | 07/02/2025 | | | 678,166 | |
| | 673,300 | | PODS LLC, First Lien Tranche B-4 Term Loan | | 1M US L + 2.75%, 1.00% Floor | | 12/06/2024 | | | 675,721 | |
| | 673,295 | | Prime Security Services Borrower LLC, First Lien 2016-2 Refinancing B-1 Term Loan | | 1M US L + 2.75%, 1.00% Floor | | 05/02/2022 | | | 677,187 | |
| | 673,295 | | Project Alpha Intermediate Holding, Inc., First Lien Term Loan | | 3M US L + 3.50%, 1.00% Floor | | 04/26/2024 | | | 674,279 | |
| | 591,245 | | SCS Holdings I, Inc., First Lien New Tranche B Term Loan | | 1M US L + 4.25%, 1.00% Floor | | 10/30/2022 | | | 595,679 | |
| | 650,000 | | Securus Technologies Holdings, Inc., First Lien Initial Term Loan(i) | | 1M US L + 4.50%, 1.00% Floor | | 11/01/2024 | | | 652,600 | |
| | 675,000 | | Select Medical Corp., First Lien Tranche B Term Loan | | 1M US L + 2.749%, 1.00% Floor | | 03/01/2021 | | | 680,484 | |
| | 673,274 | | Solera LLC, First Lien Dollar Term Loan | | 1M US L + 2.75% | | 03/03/2023 | | | 675,485 | |
| | 675,000 | | Sophia LP, First Lien B Term Loan | | 3M US L + 3.25%, 1.00% Floor | | 09/30/2022 | | | 678,729 | |
| | 265,000 | | Starfruit Finco B.V., First Lien Initial Dollar Term Loan(i) | | L + 3.25% | | 09/19/2025 | | | 266,435 | |
| | 673,308 | | Transdigm, Inc., First Lien 2018 New Tranche F Term Loan | | 1M US L + 2.50% | | 06/09/2023 | | | 676,537 | |
| | 169,575 | | Travel Leaders Group LLC, First Lien 2018 Refinancing Term Loan | | 1M US L + 4.00% | | 01/25/2024 | | | 171,801 | |
See Notes to Financial Statements.
| 46 | (888) 848-7569 | www.rivernorth.com |
| RiverNorth/DoubleLine Strategic Income Fund | Schedule of Investments |
September 30, 2018
| Principal Amount/Description | | Rate | | Maturity | | Value | |
| $ | 365,000 | | VeriFone Systems, Inc., First Lien Initial Term Loan | | 3M US L + 4.00% | | 08/20/2025 | | $ | 367,783 | |
| | 370,000 | | Verscend Holding Corp., First Lien B Term Loan | | 1M US L + 4.50% | | 08/27/2025 | | | 373,778 | |
| | 675,000 | | Vertafore, Inc., First Lien Initial Term Loan | | 1M US L + 3.25% | | 07/02/2025 | | | 678,675 | |
| | 250,000 | | Web.com Group, Inc., First Lien Term Loan(i) | | L + 3.75% | | 09/17/2025 | | | 251,875 | |
| | | | | | | | | | | 32,138,524 | |
| | | | | | | | | | | | |
| TOTAL BANK LOANS (Cost $33,606,053) | | | | | 33,718,127 | |
| | | | | | | | | | | | |
| COLLATERALIZED LOAN OBLIGATIONS - 2.08% | | | | |
| | | | Adams Mill CLO, Ltd. | | | | | | | | |
| | 500,000 | | Series 2014-1A(e)(f) | | 3M US L + 3.50% | | 07/15/2026 | | | 500,840 | |
| | | | AIMCO CLO | | | | | | | | |
| | 500,000 | | Series 2018-AA(e)(f) | | 3M US L + 2.55% | | 04/17/2031 | | | 497,426 | |
| | | | Apidos CLO XII | | | | | | | | |
| | 500,000 | | Series 2018-12A(e)(f) | | 3M US L + 2.60% | | 04/15/2031 | | | 494,124 | |
| | | | Apidos CLO XVIII | | | | | | | | |
| | 250,000 | | Series 2014-18A(e)(f) | | 3M US L + 5.20% | | 07/22/2026 | | | 250,140 | |
| | | | Apidos CLO XX | | | | | | | | |
| | 500,000 | | Series 2018-20A(e)(f) | | 3M US L + 2.95% | | 07/16/2031 | | | 498,179 | |
| | | | Apidos CLO XXI | | | | | | | | |
| | 500,000 | | Series 2018-21A(e)(f) | | 3M US L + 2.45% | | 07/18/2027 | | | 500,048 | |
| | 1,000,000 | | Series 2018-21A(e)(f) | | 3M US L + 8.25% | | 07/18/2027 | | | 999,881 | |
| | | | Apidos CLO XXII | | | | | | | | |
| | 1,000,000 | | Series 2015-22A(e)(f) | | 3M US L + 6.00% | | 10/20/2027 | | | 1,002,063 | |
| | | | Apidos CLO XXIV | | | | | | | | |
| | 1,000,000 | | Series 2018-24A(e)(f) | | 3M US L + 5.80% | | 10/20/2030 | | | 998,852 | |
| | | | Avery Point VI CLO, Ltd. | | | | | | | | |
| | 500,000 | | Series 2018-6A(e)(f) | | 3M US L + 1.05% | | 08/05/2027 | | | 500,189 | |
| | | | Babson CLO, Ltd. | | | | | | | | |
| | 500,000 | | Series 2018-IA(e)(f) | | 3M US L + 2.60% | | 01/20/2031 | | | 484,112 | |
See Notes to Financial Statements.
| Annual Report | September 30, 2018 | 47 |
| RiverNorth/DoubleLine Strategic Income Fund | Schedule of Investments |
September 30, 2018
| Principal Amount/Description | | Rate | | Maturity | | Value | |
| | | | Barings CLO, Ltd. | | | | | | | | |
| $ | 500,000 | | Series 2016-3A(e)(f) | | 3M US L + 3.95% | | 01/15/2028 | | $ | 502,859 | |
| | 500,000 | | Series 2017-1A(e)(f) | | 3M US L + 3.60% | | 07/18/2029 | | | 502,117 | |
| | 1,000,000 | | Series 2018-3A(e)(f) | | 3M US L + 2.90% | | 07/20/2029 | | | 992,584 | |
| | | | BlueMountain CLO, Ltd. | | | | | | | | |
| | 500,000 | | Series 2018-3A(e)(f) | | 3M US L + 2.60% | | 04/20/2031 | | | 491,529 | |
| | | | Buttermilk Park CLO, Ltd. | | | | | | | | |
| | 1,000,000 | | Series 2018-1A(e)(f) | | 3M US L + 5.75% | | 10/15/2031 | | | 1,000,000 | |
| | | | Canyon Capital CLO, Ltd. | | | | | | | | |
| | 500,000 | | Series 2017-1A(e)(f) | | 3M US L + 3.60% | | 07/15/2030 | | | 501,759 | |
| | 1,000,000 | | Series 2018-1A(e)(f) | | 3M US L + 2.75% | | 01/30/2031 | | | 989,997 | |
| | 1,500,000 | | Series 2018-1A(e)(f) | | 3M US L + 5.50% | | 01/30/2031 | | | 1,495,140 | |
| | 1,000,000 | | Series 2018-1A(e)(f) | | 3M US L + 5.75% | | 07/15/2031 | | | 984,151 | |
| | 500,000 | | Series 2018-1A(e)(f) | | 3M US L + 2.80% | | 07/15/2031 | | | 488,984 | |
| | 500,000 | | Series 2018-1RA(e)(f) | | 3M US L + 3.00% | | 07/15/2030 | | | 500,016 | |
| | | | Canyon CLO, Ltd. | | | | | | | | |
| | 500,000 | | Series 2018-1A(e)(f) | | 3M US L + 2.90% | | 07/15/2031 | | | 496,389 | |
| | | | Carlyle Global Market Strategies CLO, Ltd. | | | | | | | | |
| | 1,000,000 | | Series 2018-2RA(e)(f) | | 3M US L + 5.35% | | 05/15/2031 | | | 976,243 | |
| | 500,000 | | Series 2018-3A(e)(f) | | 3M US L + 2.85% | | 07/28/2028 | | | 501,996 | |
| | | | Chenango Park CLO, Ltd. | | | | | | | | |
| | 500,000 | | Series 2018-1A(e)(f) | | 3M US L + 3.00% | | 04/15/2030 | | | 500,525 | |
| | 1,000,000 | | Series 2018-1A(e)(f) | | 3M US L + 5.80% | | 04/15/2030 | | | 1,005,971 | |
| | | | Cook Park CLO, Ltd. | | | | | | | | |
| | 500,000 | | Series 2018-1A(e)(f) | | 3M US L + 2.60% | | 04/17/2030 | | | 491,094 | |
| | | | Dorchester Park CLO DAC | | | | | | | | |
| | 500,000 | | Series 2018-1A(e)(f) | | 3M US L + 2.40% | | 04/20/2028 | | | 494,276 | |
See Notes to Financial Statements.
| 48 | (888) 848-7569 | www.rivernorth.com |
| RiverNorth/DoubleLine Strategic Income Fund | Schedule of Investments |
September 30, 2018
| Principal Amount/Description | | Rate | | Maturity | | Value | |
| $ | 875,000 | | Series 2018-1A(e)(f) | | 3M US L + 5.00% | | 04/20/2028 | | $ | 864,204 | |
| | | | Dryden 57 CLO, Ltd. | | | | | | | | |
| | 500,000 | | Series 2018-57A(e)(f) | | 3M US L + 2.55% | | 05/15/2031 | | | 496,982 | |
| | | | Dryden 60 CLO, Ltd. | | | | | | | | |
| | 1,000,000 | | Series 2018-60A(e)(f) | | 3M US L + 3.00% | | 07/15/2031 | | | 999,910 | |
| | | | Fillmore Park CLO, Ltd. | | | | | | | | |
| | 500,000 | | Series 2018-1A(e)(f) | | 3M US L + 2.90% | | 07/15/2030 | | | 499,843 | |
| | 1,000,000 | | Series 2018-1A(e)(f) | | 3M US L + 5.40% | | 07/15/2030 | | | 998,962 | |
| | | | Gilbert Park CLO, Ltd. | | | | | | | | |
| | 1,000,000 | | Series 2017-1A(e)(f) | | 3M US L + 6.40% | | 10/15/2030 | | | 1,023,284 | |
| | | | Goldentree Loan Management US CLO, Ltd. | | | | | | | | |
| | 500,000 | | Series 2018-3A(e)(f) | | 3M US L + 2.85% | | 04/20/2030 | | | 493,069 | |
| | | | Madison Park Funding XIV CLO, Ltd. | | | | | | | | |
| | 250,000 | | Series 2014-14A(e)(f) | | 3M US L + 4.75% | | 07/20/2026 | | | 250,858 | |
| | | | Myers Park CLO, Ltd. | | | | | | | | |
| | 500,000 | | Series 2018-1A(e)(f) | | 3.05 - 3M US L | | 10/20/2030 | | | 499,646 | |
| | 1,000,000 | | Series 2018-1A(e)(f) | | 5.50 - 3M US L | | 10/20/2030 | | | 1,000,000 | |
| | | | Neuberger Berman CLO XXIII, Ltd. | | | | | | | | |
| | 1,000,000 | | Series 2018-23A(e)(f) | | 5.75 - 3M US L | | 10/17/2027 | | | 1,000,000 | |
| | | | Stewart Park CLO, Ltd. | | | | | | | | |
| | 500,000 | | Series 2018-1A(e)(f) | | 3M US L + 2.60% | | 01/15/2030 | | | 489,372 | |
| | | | Symphony CLO XVII, Ltd. | | | | | | | | |
| | 1,500,000 | | Series 2018-17A(e)(f) | | 3M US L + 2.65% | | 04/15/2028 | | | 1,487,163 | |
| | | | THL Credit Wind River CLO, Ltd. | | | | | | | | |
| | 1,000,000 | | Series 2014-1A(e)(f) | | 3M US L + 3.00% | | 07/18/2031 | | | 999,987 | |
| | 1,000,000 | | Series 2014-3A(e)(f)(j) | | 6.22 - 3M US L | | 10/22/2031 | | | 985,717 | |
| | 500,000 | | Series 2017-1A(e)(f) | | 3M US L + 3.75% | | 04/18/2029 | | | 505,899 | |
| | 1,000,000 | | Series 2018-2A(e)(f) | | 3M US L + 5.75% | | 07/15/2030 | | | 999,913 | |
| | | | Voya CLO, Ltd. | | | | | | | | |
| | 500,000 | | Series 2018-1A(e)(f) | | 3M US L + 2.80% | | 04/18/2031 | | | 497,536 | |
See Notes to Financial Statements.
| Annual Report | September 30, 2018 | 49 |
| RiverNorth/DoubleLine Strategic Income Fund | Schedule of Investments |
September 30, 2018
| Principal Amount/Description | | Rate | | Maturity | | Value | |
| $ | 1,000,000 | | Series 2018-2A(e)(f) | | 3M US L + 2.75% | | 07/15/2031 | | $ | 984,159 | |
| | 1,000,000 | | Series 2018-2A(e)(f) | | 3M US L + 5.25% | | 07/15/2031 | | | 973,107 | |
| | | | Webster Park CLO, Ltd. | | | | | | | | |
| | 1,000,000 | | Series 2018-1A(e)(f) | | 5.50% - 3M US L | | 07/20/2030 | | | 998,143 | |
| | | | Wind River CLO, Ltd. | | | | | | | | |
| | 500,000 | | Series 2018-1A(e)(f) | | 2.90% - 3M US L | | 07/15/2030 | | | 494,246 | |
| | 2,000,000 | | Series 2018-1A(e)(f) | | 5.50% - 3M US L | | 07/15/2030 | | | 1,967,686 | |
| | | | | | | | | | | | |
| TOTAL COLLATERALIZED LOAN OBLIGATIONS (Cost $39,301,174) | | | 39,151,170 | |
| | | | | | | | | | | | |
| NON-AGENCY COLLATERALIZED MORTGAGE OBLIGATIONS - 27.95% | | | | |
| | | | AASET, Ltd. | | | | | | | | |
| | 935,242 | | Series 2018-1A(e) | | 3.84% | | 01/16/2038 | | | 926,247 | |
| | | | Adjustable Rate Mortgage Trust | | | | | | | | |
| | 483,841 | | Series 2005-1(f) | | 4.19% | | 05/25/2035 | | | 491,921 | |
| | 3,825,672 | | Series 2005-10(f) | | 4.46% | | 01/25/2036 | | | 3,358,246 | |
| | 384,658 | | Series 2005-7(f) | | 4.20% | | 10/25/2035 | | | 342,254 | |
| | | | ALM XII, Ltd. | | | | | | | | |
| | 500,000 | | Series 2018-12A(e)(f) | | 3M US L + 2.65% | | 04/16/2027 | | | 496,642 | |
| | | | Alternative Loan Trust | | | | | | | | |
| | 350,455 | | Series 2005-20CB | | 5.50% | | 07/25/2035 | | | 340,906 | |
| | 123,901 | | Series 2005-54CB | | 5.50% | | 11/25/2035 | | | 108,559 | |
| | 6,571,239 | | Series 2005-69(f) | | 4.33% | | 12/25/2035 | | | 6,396,723 | |
| | 625,600 | | Series 2005-6CB | | 5.50% | | 04/25/2035 | | | 631,290 | |
| | 293,663 | | Series 2005-85CB(f) | | 21.63% - 3.67 x 1M US L | | 02/25/2036 | | | 319,903 | |
| | 1,390,551 | | Series 2005-85CB(f) | | 1M US L + 1.10% | | 02/25/2036 | | | 1,248,834 | |
| | 348,868 | | Series 2005-86CB | | 5.50% | | 02/25/2036 | | | 308,272 | |
| | 638,639 | | Series 2005-9CB(f) | | 5.05% - 1M US L | | 05/25/2035 | | | 39,759 | |
| | 359,594 | | Series 2005-9CB(f) | | 1M US L + 0.50% | | 05/25/2035 | | | 334,881 | |
| | 324,816 | | Series 2006-12CB(f) | | 1M US L + 5.75% | | 05/25/2036 | | | 260,202 | |
| | 1,541,322 | | Series 2006-15CB | | 6.50% | | 06/25/2036 | | | 1,194,811 | |
| | 203,441 | | Series 2006-30T1 | | 6.25% | | 11/25/2036 | | | 178,970 | |
| | 162,495 | | Series 2006-32CB | | 5.50% | | 11/25/2036 | | | 136,108 | |
| | 334,911 | | Series 2006-36T2(f) | | 28.06% - 4.6 x 1M US L | | 12/25/2036 | | | 396,450 | |
| | 15,706,104 | | Series 2006-J7 | | 6.25% | | 11/25/2036 | | | 12,768,424 | |
| | 1,261,223 | | Series 2007-19 | | 6.00% | | 08/25/2037 | | | 1,018,243 | |
See Notes to Financial Statements.
| 50 | (888) 848-7569 | www.rivernorth.com |
| RiverNorth/DoubleLine Strategic Income Fund | Schedule of Investments |
September 30, 2018
| Principal Amount/Description | | Rate | | Maturity | | Value | |
| $ | 4,429,845 | | Series 2007-20 | | 6.25% | | 08/25/2047 | | $ | 3,694,915 | |
| | 1,182,694 | | Series 2007-23CB(f) | | 6.50% - 1M US | | L09/25/2037 | | | 202,411 | |
| | 1,238,639 | | Series 2007-23CB(f) | | 1M US L + 0.50% | | 09/25/2037 | | | 843,076 | |
| | 6,893,659 | | Series 2007-HY2(f) | | 3.57% | | 03/25/2047 | | | 6,405,599 | |
| | | | American Home Mortgage Investment Trust | | | | | | | | |
| | 10,743,117 | | Series 2006-1(f) | | 6M US L + 1.75% | | 12/25/2035 | | | 5,000,382 | |
| | 172,018 | | Series 2007-A(e)(k) | | 6.60% | | 01/25/2037 | | | 77,700 | |
| | | | Atlas Senior Loan Fund X, Ltd. | | | | | | | | |
| | 500,000 | | Series 2018-10A(e)(f) | | 3M US L + 1.09% | | 01/15/2031 | | | 497,625 | |
| | | | Atrium Hotel Portfolio Trust | | | | | | | | |
| | 515,000 | | Series 2017-ATRM(e)(f) | | 1M US L + 3.05% | | 12/15/2019 | | | 517,563 | |
| | 515,000 | | Series 2018-ATRM(e)(f) | | 1M US L + 2.30% | | 06/15/2021 | | | 517,925 | |
| | 1,309,000 | | Series 2018-ATRM(e)(f) | | 1M US L + 3.40% | | 06/15/2021 | | | 1,319,863 | |
| | | | Atrium IX | | | | | | | | |
| | 500,000 | | Series 2017-9A(e)(f) | | 3M US L + 3.60% | | 05/28/2030 | | | 503,430 | |
| | | | Atrium XIII | | | | | | | | |
| | 1,000,000 | | Series 2017-13A(e)(f) | | 3M US L + 6.05% | | 11/21/2030 | | | 1,012,361 | |
| | | | Atrium XIV LLC | | | | | | | | |
| | 1,000,000 | | Series 2018-14A(e)(f) | | 3M US L + 5.65% | | 08/23/2030 | | | 993,389 | |
| | | | Banc of America Alternative Loan Trust | | | | | | | | |
| | 48,456 | | Series 2005-6 | | 6.00% | | 07/25/2035 | | | 48,436 | |
| | 101,262 | | Series 2005-6 | | 5.50% | | 07/25/2035 | | | 92,370 | |
| | | | Banc of America Funding Corp. | | | | | | | | |
| | 362,597 | | Series 2008-R2(e) | | 6.00% | | 09/25/2037 | | | 373,334 | |
| | | | Banc of America Funding Trust | | | | | | | | |
| | 3,000,000 | | Series 2005-B(f) | | 1M US L + 0.45% | | 04/20/2035 | | | 2,873,284 | |
| | 187,136 | | Series 2006-2 | | 5.50% | | 03/25/2036 | | | 182,702 | |
| | 6,338,831 | | Series 2007-4(f) | | 5.77% | | 05/25/2037 | | | 6,188,370 | |
| | 5,121,733 | | Series 2010-R5(e)(f) | | 6.00% | | 10/26/2037 | | | 4,808,252 | |
| | | | BBCMS Mortgage Trust | | | | | | | | |
| | 341,000 | | Series 2018-TALL(e)(f) | | 1M US L + 0.722% | | 03/15/2037 | | | 341,400 | |
See Notes to Financial Statements.
| Annual Report | September 30, 2018 | 51 |
| RiverNorth/DoubleLine Strategic Income Fund | Schedule of Investments |
September 30, 2018
| Principal Amount/Description | | Rate | | Maturity | | Value | |
| | | | BBCMS Trust | | | | | | | | |
| $ | 3,000,000 | | Series 2018-CBM(e)(f) | | 1M US L + 3.15% | | 07/15/2037 | | $ | 3,025,829 | |
| | | | BCAP, LLC Trust | | | | | | | | |
| | 148,812 | | Series 2007-AA2(f) | | 7.50% | | 04/25/2037 | | | 136,999 | |
| | 96,552 | | Series 2007-AA2 | | 6.00% | | 04/25/2037 | | | 80,281 | |
| | 2,118,090 | | Series 2009-RR1(e)(f) | | 6.00% | | 10/26/2036 | | | 2,121,707 | |
| | 6,608,439 | | Series 2010-RR6(e)(f) | | 6.00% | | 07/26/2036 | | | 4,995,052 | |
| | | | Bear Stearns ALT-A Trust | | | | | | | | |
| | 1,417,874 | | Series 2004-11(f) | | 3.43% | | 11/25/2034 | | | 1,263,153 | |
| | 1,386,734 | | Series 2005-3(f) | | 3.93% | | 04/25/2035 | | | 1,307,568 | |
| | 10,447,988 | | Series 2006-3(f) | | 3.76% | | 05/25/2036 | | | 8,532,686 | |
| | 1,257,468 | | Series 2006-6(f) | | 3.90% | | 11/25/2036 | | | 1,139,114 | |
| | | | Bear Stearns Asset Backed Securities I Trust | | | | | | | | |
| | 11,593,413 | | Series 2007-HE2(f) | | 1M US L + 0.23% | | 02/25/2037 | | | 10,165,084 | |
| | | | Bear Stearns Asset-Backed Securities Trust | | | | | | | | |
| | 127,348 | | Series 2005-HE3(f) | | 1M US L + 1.02% | | 03/25/2035 | | | 127,901 | |
| | 2,352,118 | | Series 2006-AC1(k) | | 6.25% | | 02/25/2036 | | | 1,842,537 | |
| | | | BHMS | | | | | | | | |
| | 518,000 | | Series 2018-ATLS(e)(f) | | 1M US L + 1.90% | | 07/15/2020 | | | 519,064 | |
| | | | BX Trust | | | | | | | | |
| | 170,444 | | Series 2017-SLCT(e)(f) | | 1M US L + 2.05% | | 07/15/2034 | | | 170,870 | |
| | 279,634 | | Series 2017-SLCT(e)(f) | | 1M US L + 3.15% | | 07/15/2034 | | | 281,033 | |
| | | | CAL Funding III, Ltd. | | | | | | | | |
| | 941,667 | | Series 2018-1A(e) | | 3.96% | | 02/25/2043 | | | 930,809 | |
| | | | Carrington Mortgage Loan Trust | | | | | | | | |
| | 2,351,255 | | Series 2006-NC4(f) | | 1M US L + 0.16% | | 10/25/2036 | | | 2,215,518 | |
| | | | Castlelake Aircraft Securitization Trust | | | | | | | | |
| | 3,857,200 | | Series 2018-1(e) | | 6.63% | | 06/15/2025 | | | 3,863,078 | |
| | | | CFCRE Commercial Mortgage Trust | | | | | | | | |
| | 5,129,094 | | Series 2016-C3(f) | | 1.22% | | 12/10/2025 | | | 315,637 | |
| | | | Chase Mortgage Finance Trust | | | | | | | | |
| | 5,118,035 | | Series 2007-S2 | | 6.00% | | 03/25/2037 | | | 4,305,072 | |
| | 10,389,734 | | Series 2007-S2 | | 6.00% | | 03/25/2037 | | | 8,796,179 | |
| | 558,881 | | Series 2007-S3 | | 5.50% | | 05/25/2037 | | | 413,733 | |
See Notes to Financial Statements.
| 52 | (888) 848-7569 | www.rivernorth.com |
| RiverNorth/DoubleLine Strategic Income Fund | Schedule of Investments |
September 30, 2018
| Principal Amount/Description | | Rate | | Maturity | | Value | |
| | | | CHT Mortgage Trust | | | | | | | | |
| $ | 335,000 | | Series 2017-CSMO(e)(f) | | 1M US L + 3.00% | | 11/15/2019 | | $ | 338,119 | |
| | 178,000 | | Series 2017-CSMO(e)(f) | | 1M US L + 3.7412% | | 11/15/2019 | | | 179,437 | |
| | | | CIM Trust | | | | | | | | |
| | 12,000,000 | | Series 2016-1RR(e)(f) | | 12.35% | | 07/26/2055 | | | 11,543,073 | |
| | 12,000,000 | | Series 2016-2RR B2(e)(f) | | 7.68% | | 02/25/2056 | | | 11,664,390 | |
| | 12,000,000 | | Series 2016-3RR B2(e)(f) | | 7.64% | | 02/27/2056 | | | 11,644,243 | |
| | 11,430,000 | | Series 2016-3RR B2(e)(f) | | 12.29% | | 01/27/2057 | | | 12,262,333 | |
| | 4,144,621 | | Series 2017-6 A1(e)(f) | | 3.02% | | 06/25/2057 | | | 4,071,929 | |
| | | | Citicorp Mortgage Securities Trust | | | | | | | | |
| | 783,403 | | Series 2007-1 | | 6.00% | | 01/25/2037 | | | 766,540 | |
| | 8,666 | | Series 2007-2 | | 5.50% | | 02/25/2037 | | | 8,671 | |
| | | | Citigroup Commercial Mortgage Trust | | | | | | | | |
| | 3,908,953 | | Series 2014-GC25(f) | | 1.17% | | 10/10/2047 | | | 193,835 | |
| | 525,000 | | Series 2015-GC27(f) | | 4.58% | | 01/10/2025 | | | 514,377 | |
| | 2,035,500 | | Series 2015-GC27(e)(f) | | 4.58% | | 01/10/2025 | | | 1,879,520 | |
| | 400,000 | | Series 2015-GC31(f) | | 4.20% | | 06/10/2025 | | | 377,349 | |
| | 420,000 | | Series 2015-GC35(f) | | 4.65% | | 11/10/2025 | | | 412,248 | |
| | 5,446,723 | | Series 2015-GC35(f) | | 1.03% | | 11/10/2048 | | | 223,255 | |
| | 1,351,000 | | Series 2016-GC36(e) | | 2.85% | | 01/10/2026 | | | 1,092,305 | |
| | 488,000 | | Series 2016-P4 | | 2.90% | | 07/10/2026 | | | 460,797 | |
| | 3,319,980 | | Series 2016-P4(f) | | 2.16% | | 07/10/2049 | | | 369,496 | |
| | 388,000 | | Series 2016-P6(f) | | 3.72% | | 12/10/2049 | | | 387,452 | |
| | 515,000 | | Series 2018-C5(f) | | 4.88% | | 06/10/2028 | | | 523,779 | |
| | | | Citigroup Mortgage Loan Trust | | | | | | | | |
| | 933,035 | | Series 2006-WF1(k) | | 4.94% | | 03/25/2036 | | | 660,184 | |
| | 1,374,062 | | Series 2007-OPX1(k) | | 6.33% | | 01/25/2037 | | | 966,124 | |
| | 866,919 | | Series 2008-AR4(e)(f) | | 3.81% | | 11/25/2038 | | | 864,457 | |
| | 898,875 | | Series 2008-AR4(e)(f) | | 3.94% | | 11/25/2038 | | | 906,934 | |
| | 771,555 | | Series 2010-8(e)(f) | | 6.00% | | 11/25/2036 | | | 766,375 | |
| | 2,375,472 | | Series 2010-8(e)(f) | | 6.00% | | 12/25/2036 | | | 2,339,297 | |
| | | | CitiMortgage Alternative Loan Trust | | | | | | | | |
| | 715,913 | | Series 2007-A1 | | 6.00% | | 01/25/2037 | | | 673,090 | |
| | 141,016 | | Series 2007-A1(f) | | 5.40% - 1M US | | L01/25/2037 | | | 11,727 | |
| | 98,774 | | Series 2007-A3(f) | | 6.00% | | 03/25/2037 | | | 96,558 | |
| | 227,310 | | Series 2007-A3(f) | | 5.40% - 1M US | | L03/25/2037 | | | 18,740 | |
| | 839,004 | | Series 2007-A4 | | 5.75% | | 04/25/2037 | | | 794,275 | |
| | 724,596 | | Series 2007-A6 | | 5.50% | | 06/25/2037 | | | 689,165 | |
| | | | CLNS Trust | | | | | | | | |
| | 168,000 | | Series 2017-IKPR(e)(f) | | 1M US L + 3.15% | | 06/11/2032 | | | 168,800 | |
See Notes to Financial Statements.
| Annual Report | September 30, 2018 | 53 |
| RiverNorth/DoubleLine Strategic Income Fund | Schedule of Investments |
September 30, 2018
| Principal Amount/Description | | Rate | | Maturity | | Value | |
| $ | 168,000 | | Series 2017-IKPR(e)(f) | | 1M US L + 3.50% | | 06/11/2032 | | $ | 169,353 | |
| | 168,000 | | Series 2017-IKPR(e)(f) | | 1M US L + 4.50% | | 06/11/2032 | | | 169,820 | |
| | | | COBALT CMBS Commercial Mortgage Trust | | | | | | | | |
| | 52,828 | | Series 2007-C2(f) | | 5.57% | | 04/15/2047 | | | 53,268 | |
| | | | Coinstar Funding LLC | | | | | | | | |
| | 4,937,500 | | Series 2017-1A(e) | | 5.22% | | 04/25/2047 | | | 5,000,985 | |
| | | | Cold Storage Trust | | | | | | | | |
| | 301,000 | | Series 2017-ICE3(e)(f) | | 1M US L + 1.00% | | 04/15/2024 | | | 302,180 | |
| | 367,000 | | Series 2017-ICE3(e)(f) | | 1M US L + 1.35% | | 04/15/2024 | | | 369,147 | |
| | | | COMM Mortgage Trust | | | | | | | | |
| | 2,286,000 | | Series 2014-LC15(e)(f) | | 5.11% | | 03/10/2024 | | | 2,092,357 | |
| | 523,000 | | Series 2018-HCLV(e)(f) | | 1M US L + 1.70% | | 09/15/2020 | | | 521,667 | |
| | 2,614,000 | | Series 2018-HCLV(e)(f) | | 1M US L + 2.18% | | 09/15/2020 | | | 2,599,082 | |
| | | | Commercial Mortgage Pass-Through Certificates | | | | | | | | |
| | 312,400 | | Series 2014-CR19(f) | | 4.87% | | 08/10/2047 | | | 314,880 | |
| | 400,000 | | Series 2014-CR20(f) | | 4.65% | | 11/10/2047 | | | 394,641 | |
| | 2,705,400 | | Series 2014-UBS4(e) | | 3.75% | | 08/10/2047 | | | 1,837,773 | |
| | 3,091,920 | | Series 2014-UBS4(e) | | 3.75% | | 08/10/2047 | | | 1,637,796 | |
| | 5,797,416 | | Series 2014-UBS4(e) | | 3.75% | | 08/10/2047 | | | 1,560,891 | |
| | 11,000 | | Series 2014-UBS4(e)(f) | | 0.00% | | 08/10/2047 | | | 1 | |
| | 3,860,664 | | Series 2015-CR22(f) | | 1.11% | | 03/10/2025 | | | 156,605 | |
| | 475,000 | | Series 2015-CR25(f) | | 4.70% | | 08/10/2025 | | | 466,951 | |
| | 4,983,026 | | Series 2015-CR26(f) | | 1.18% | | 09/10/2025 | | | 251,597 | |
| | 419,000 | | Series 2015-LC23(f) | | 4.80% | | 10/10/2025 | | | 423,415 | |
| | 3,654,225 | | Series 2016-DC2(f) | | 1.20% | | 10/10/2025 | | | 209,200 | |
| | 249,000 | | Series 2016-DC2(f) | | 4.80% | | 02/10/2026 | | | 245,434 | |
| | | | Commercial Mortgage Trust | | | | | | | | |
| | 659,000 | | Series 2012-CR4(e)(f) | | 4.73% | | 10/15/2045 | | | 350,655 | |
| | | | Countrywide Home Loan Mortgage Pass-Through Trust | | | | | | | | |
| | 2,874,813 | | Series 2005-HYB7(f) | | 3.39% | | 11/20/2035 | | | 2,703,672 | |
| | 66,286 | | Series 2005-J4 | | 5.50% | | 11/25/2035 | | | 64,950 | |
| | 2,304,739 | | Series 2006-18 | | 6.00% | | 12/25/2036 | | | 2,049,988 | |
| | 384,275 | | Series 2007-17 | | 6.00% | | 10/25/2037 | | | 364,169 | |
| | 395,608 | | Series 2007-3 | | 6.00% | | 04/25/2037 | | | 328,998 | |
| | 430,178 | | Series 2007-7 | | 5.75% | | 06/25/2037 | | | 365,821 | |
See Notes to Financial Statements.
| 54 | (888) 848-7569 | www.rivernorth.com |
| RiverNorth/DoubleLine Strategic Income Fund | Schedule of Investments |
September 30, 2018
| Principal Amount/Description | | Rate | | Maturity | | Value | |
| | | | Credit Suisse First Boston Mortgage Securities Corp. | | | | | | | | |
| $ | 86,016 | | Series 2005-10 | | 5.50% | | 11/25/2035 | | $ | 83,520 | |
| | 2,586,566 | | Series 2005-11 | | 6.00% | | 12/25/2035 | | | 2,452,134 | |
| | 70,637 | | Series 2005-8 | | 5.50% | | 08/25/2025 | | | 71,305 | |
| | 5,325,478 | | Series 2005-9 | | 6.00% | | 10/25/2035 | | | 3,033,002 | |
| | | | Credit Suisse Mortgage Capital Certificates | | | | | | | | |
| | 4,446,640 | | Series 2006-2 | | 5.75% | | 03/25/2036 | | | 3,970,342 | |
| | | | Credit-Based Asset Servicing & Securitization LLC | | | | | | | | |
| | 13,403,031 | | Series 2007-CB6(e)(f) | | 1M US L + 0.22% | | 07/25/2037 | | | 9,198,488 | |
| | | | CSAB Mortgage-Backed Trust | | | | | | | | |
| | 8,781,274 | | Series 2006-2(k) | | 5.70% | | 09/25/2036 | | | 1,497,147 | |
| | 154,476 | | Series 2007-1(f) | | 5.90% | | 05/25/2037 | | | 70,579 | |
| | | | CSAIL Commercial Mortgage Trust | | | | | | | | |
| | 5,817,214 | | Series 2015-C1(f) | | 1.07% | | 01/15/2025 | | | 245,670 | |
| | 419,000 | | Series 2015-C4(f) | | 4.74% | | 11/15/2025 | | | 421,013 | |
| | 5,923,433 | | Series 2017-C8(f) | | 1.40% | | 06/15/2050 | | | 420,137 | |
| | | | CSMC Mortgage-Backed Trust | | | | | | | | |
| | 211,632 | | Series 2006-1 | | 6.00% | | 02/25/2036 | | | 154,610 | |
| | 45,294 | | Series 2006-4 | | 5.50% | | 05/25/2021 | | | 42,517 | |
| | 866,893 | | Series 2006-5 | | 6.25% | | 06/25/2036 | | | 412,919 | |
| | 116,791 | | Series 2006-9 | | 6.00% | | 11/25/2036 | | | 90,955 | |
| | 2,408,315 | | Series 2007-1 | | 6.00% | | 02/25/2037 | | | 2,123,324 | |
| | 12,591 | | Series 2007-2 | | 5.00% | | 03/25/2037 | | | 12,323 | |
| | 583,228 | | Series 2007-3(f) | | 5.84% | | 04/25/2037 | | | 275,748 | |
| | 38,489 | | Series 2007-4 | | 6.00% | | 06/25/2037 | | | 35,160 | |
| | 3,489,060 | | Series 2009-16R(e)(f) | | 6.00% | | 07/26/2037 | | | 3,510,665 | |
| | 945,787 | | Series 2010-7R(e)(f) | | 6.00% | | 04/26/2037 | | | 945,926 | |
| | 4,891,824 | | Series 2016-PR1(e)(k) | | 5.50% | | 07/25/2056 | | | 4,828,498 | |
| | | | CSMC Trust | | | | | | | | |
| | 253,000 | | Series 2017-CHOP(e)(f) | | 1M US L + 1.90% | | 07/15/2032 | | | 253,682 | |
| | 253,000 | | Series 2017-CHOP(e)(f) | | 1M US L + 3.30% | | 07/15/2032 | | | 254,657 | |
| | 180,000 | | Series 2017-PFHP(e)(f) | | 1M US L + 6.15% | | 12/15/2019 | | | 181,849 | |
| | 959,574 | | Series 2018-RPL2(e)(k) | | 4.03% | | 08/25/2062 | | | 959,736 | |
| | 2,000,000 | | Series 2018-RPL8(e) | | 4.13% | | 07/25/2058 | | | 2,002,578 | |
| | | | DBGS Mortgage Trust | | | | | | | | |
| | 550,000 | | Series 2018-5BP(e)(f) | | 1M US L + 1.35% | | 06/15/2020 | | | 548,971 | |
See Notes to Financial Statements.
| Annual Report | September 30, 2018 | 55 |
| RiverNorth/DoubleLine Strategic Income Fund | Schedule of Investments |
September 30, 2018
| Principal Amount/Description | | Rate | | Maturity | | Value | |
| $ | 550,000 | | Series 2018-5BP(e)(f) | | 1M US L + 2.45% | | 06/15/2020 | | $ | 548,476 | |
| | | | Deutsche Alt-A Securities, Inc. Mortgage Loan Trust | | | | | | | | |
| | 385,813 | | Series 2005-6(f) | | 5.08% - 1M US L12/25/2035 | | | | | 36,964 | |
| | 169,081 | | Series 2005-6(f) | | 1M US L + 1.40% | | 12/25/2035 | | | 145,908 | |
| | | | Deutsche Mortgage Securities, Inc. Mortgage Loan Trust | | | | | | | | |
| | 190,782 | | Series 2006-PR1(e)(f) | | 12.12% - 1M US L | | 04/15/2036 | | | 165,704 | |
| | | | Dryden 40 Senior Loan Fund | | | | | | | | |
| | 1,000,000 | | Series 2018-40A(e)(f) | | 3M US L + 5.75% | | 08/15/2031 | | | 990,044 | |
| | 500,000 | | Series 2018-40A(e)(f) | | 3M US L + 3.10% | | 08/15/2031 | | | 499,985 | |
| | | | Earnest Student Loan Program | | | | | | | | |
| | 35,000 | | Series 2016-D(e)(h) | | 0.00% | | 01/25/2041 | | | 2,326,852 | |
| | | | First Horizon Alternative Mortgage Securities Trust | | | | | | | | |
| | 79,105 | | Series 2005-FA6 | | 5.50% | | 09/25/2035 | | | 70,165 | |
| | 1,022,829 | | Series 2005-FA6 | | 5.50% | | 09/25/2035 | | | 907,243 | |
| | 87,787 | | Series 2006-FA7 | | 6.25% | | 12/25/2036 | | | 73,808 | |
| | 159,661 | | Series 2007-FA2 | | 6.00% | | 04/25/2037 | | | 116,140 | |
| | | | First Horizon Mortgage Pass-Through Trust | | | | | | | | |
| | 2,145,336 | | Series 2007-AR3(f) | | 4.17% | | 11/25/2037 | | | 1,990,626 | |
| | | | Freddie Mac Multifamily Structured Pass Through Certificates | | | | | | | | |
| | 3,584,414 | | Series 2016-K722(f) | | 1.44% | | 03/25/2023 | | | 167,110 | |
| | | | GE Commercial Mortgage Corp. Trust | | | | | | | | |
| | 80,763 | | Series 2007-C1(f) | | 5.61% | | 12/10/2049 | | | 80,597 | |
| | | | Global SC Finance IV, Ltd. | | | | | | | | |
| | 480,550 | | Series 2018-1A(e) | | 4.29% | | 05/17/2028 | | | 482,236 | |
| | | | GRACE Mortgage Trust | | | | | | | | |
| | 400,000 | | Series 2014-GRCE(e) | | 3.37% | | 06/10/2028 | | | 400,432 | |
| | | | Great Wolf Trust | | | | | | | | |
| | 152,000 | | Series 2017-WOLF(e)(f) | | 1M US L + 2.10% | | 09/15/2034 | | | 152,794 | |
| | 235,000 | | Series 2017-WOLF(e)(f) | | 1M US L + 3.10% | | 09/15/2034 | | | 236,697 | |
| | 125,000 | | Series 2017-WOLF(e)(f) | | 1M US L + 4.07% | | 09/15/2034 | | | 126,028 | |
See Notes to Financial Statements.
| 56 | (888) 848-7569 | www.rivernorth.com |
| RiverNorth/DoubleLine Strategic Income Fund | Schedule of Investments |
September 30, 2018
| Principal Amount/Description | | Rate | | Maturity | | Value | |
| | | | GS Mortgage Securities Corp. Trust | | | | | | | | |
| $ | 525,000 | | Series 2018-3PCK(e)(f) | | 1M US L + 1.45% | | 09/15/2021 | | $ | 525,662 | |
| | 1,954,000 | | Series 2018-TWR(e)(f) | | 1M US L + 3.92% | | 07/15/2021 | | | 1,961,348 | |
| | | | GS Mortgage Securities Trust | | | | | | | | |
| | 302,595 | | Series 2011-GC3(e)(f) | | 0.82% | | 03/10/2021 | | | 3,909 | |
| | 2,295,343 | | Series 2011-GC5(e)(f) | | 1.51% | | 08/10/2044 | | | 69,170 | |
| | 4,594,000 | | Series 2014-GC26(e)(f) | | 4.66% | | 11/10/2047 | | | 4,020,264 | |
| | 1,419,000 | | Series 2015-GC34 | | 2.98% | | 10/10/2025 | | | 1,152,353 | |
| | 7,343,928 | | Series 2015-GS1(f) | | 0.96% | | 11/10/2048 | | | 346,849 | |
| | 5,925,431 | | Series 2017-GS7(f) | | 1.29% | | 08/10/2050 | | | 448,485 | |
| | | | GSAA Home Equity Trust | | | | | | | | |
| | 2,633,700 | | Series 2006-13(f) | | 6.04% | | 07/25/2036 | | | 1,480,128 | |
| | 596,586 | | Series 2006-18(k) | | 5.68% | | 11/25/2036 | | | 301,443 | |
| | 185,933 | | Series 2006-6(f) | | 5.69% | | 03/25/2036 | | | 92,449 | |
| | 987,483 | | Series 2007-2(k) | | 6.10% | | 03/25/2037 | | | 416,141 | |
| | | | GSR Mortgage Loan Trust | | | | | | | | |
| | 420,961 | | Series 2005-AR4(f) | | 4.35% | | 07/25/2035 | | | 424,593 | |
| | 1,736,567 | | Series 2006-2F | | 5.25% | | 02/25/2036 | | | 1,368,923 | |
| | 947,317 | | Series 2007-2F | | 5.75% | | 02/25/2037 | | | 1,256,786 | |
| | 3,627,584 | | Series 2007-2F | | 6.00% | | 03/25/2037 | | | 3,232,923 | |
| | 1,524,558 | | Series 2007-AR2(f) | | 3.87% | | 05/25/2037 | | | 1,362,304 | |
| | | | Halcyon Loan Advisors Funding, Ltd. | | | | | | | | |
| | 380,719 | | Series 2013-1A(e)(f) | | 3M US L + 1.15% | | 04/15/2025 | | | 380,187 | |
| | 250,000 | | Series 2013-2A(e)(f) | | 3M US L + 2.70% | | 08/01/2025 | | | 250,357 | |
| | | | Harley Marine Financing LLC | | | | | | | | |
| | 990,000 | | Series 2018-1A(e) | | 5.68% | | 05/15/2022 | | | 978,853 | |
| | | | Helios Issuer, LLC Series | | | | | | | | |
| | 1,391,170 | | Series 2017-1A(e) | | 4.94% | | 09/20/2049 | | | 1,420,700 | |
| | | | Highbridge Loan Management, Ltd. | | | | | | | | |
| | 500,000 | | Series 2018-2016(e)(f) | | 3M US L + 2.90% | | 07/20/2030 | | | 499,537 | |
| | | | HSI Asset Loan Obligation Trust | | | | | | | | |
| | 49,160 | | Series 2007-2 | | 5.50% | | 09/25/2037 | | | 47,341 | |
| | | | IndyMac IMJA Mortgage Loan Trust | | | | | | | | |
| | 1,373,296 | | Series 2007-A1 | | 6.00% | | 08/25/2037 | | | 1,051,052 | |
| | | | IndyMac IMSC Mortgage Loan Trust | | | | | �� | | | |
| | 4,754,976 | | Series 2007-F2 | | 6.50% | | 07/25/2037 | | | 3,054,376 | |
| | | | IndyMac Index Mortgage Loan Trust | | | | | | | | |
| | 2,576,777 | | Series 2005-AR31(f) | | 3.56% | | 01/25/2036 | | | 2,455,944 | |
| | 1,383,221 | | Series 2005-AR35(f) | | 3.60% | | 02/25/2036 | | | 1,190,409 | |
| | 3,546,126 | | Series 2006-AR25(f) | | 3.68% | | 09/25/2036 | | | 3,383,428 | |
See Notes to Financial Statements.
| Annual Report | September 30, 2018 | 57 |
| RiverNorth/DoubleLine Strategic Income Fund | Schedule of Investments |
September 30, 2018
| Principal Amount/Description | | Rate | | Maturity | | Value | |
| | | | Invitation Homes | | | | | | | | |
| $ | 995,000 | | Series 2018-SFR1(e)(f) | | 1M US L + 1.25% | | 03/17/2037 | | $ | 996,779 | |
| | 650,000 | | Series 2018-SFR1(e)(f) | | 1M US L + 1.45% | | 03/17/2037 | | | 650,433 | |
| | | | J.P. Morgan Chase Commercial Mortgage Securities Trust | | | | | | | | |
| | 129,000 | | Series 2017-MAUI(e)(f) | | 1M US L + 1.25% | | 07/15/2034 | | | 129,401 | |
| | 121,000 | | Series 2017-MAUI(e)(f) | | 1M US L + 1.95% | | 07/15/2034 | | | 121,575 | |
| | 107,000 | | Series 2017-MAUI(e)(f) | | 1M US L + 2.95% | | 07/15/2034 | | | 107,739 | |
| | 151,000 | | Series 2017-MAUI(e)(f) | | 1M US L + 3.75% | | 07/15/2034 | | | 152,313 | |
| | 1,010,000 | | Series 2018-WPT(e) | | 5.54% | | 07/05/2023 | | | 988,967 | |
| | | | JP Morgan Alternative Loan Trust | | | | | | | | |
| | 341,158 | | Series 2005-S1 | | 6.00% | | 12/25/2035 | | | 331,199 | |
| | 15,808 | | Series 2006-S1 | | 5.00% | | 02/25/2021 | | | 15,797 | |
| | 283,955 | | Series 2006-S3(k) | | 6.12% | | 08/25/2036 | | | 269,732 | |
| | | | JP Morgan BB Commercial Mortgage Securities Trust | | | | | | | | |
| | 400,000 | | Series 2014-C21(f) | | 4.81% | | 08/15/2047 | | | 394,444 | |
| | 388,000 | | Series 2014-C26(f) | | 4.57% | | 12/15/2024 | | | 384,075 | |
| | 627,390 | | Series 2015-C27(e)(f) | | 3.98% | | 02/15/2025 | | | 571,423 | |
| | 5,780,503 | | Series 2015-C28(f) | | 1.29% | | 03/15/2025 | | | 254,888 | |
| | 9,964,473 | | Series 2015-C30(f) | | 0.76% | | 07/15/2025 | | | 278,240 | |
| | 3,883,858 | | Series 2015-C31(f) | | 1.12% | | 08/15/2025 | | | 180,334 | |
| | 200,000 | | Series 2015-C32(f) | | 4.82% | | 10/15/2025 | | | 200,426 | |
| | 489,000 | | Series 2015-C33(f) | | 4.77% | | 11/15/2025 | | | 494,979 | |
| | 414,000 | | Series 2016-C1(f) | | 4.90% | | 02/15/2026 | | | 424,053 | |
| | | | JP Morgan Chase Commercial Mortgage Securities Corp. | | | | | | | | |
| | 138,352 | | Series 2006-LDP8(f) | | 0.53% | | 05/15/2045 | | | 187 | |
| | 15,372 | | Series 2006-LDP8(f) | | 0.53% | | 05/15/2045 | | | 21 | |
| | 98,483 | | Series 2006-LDP9 | | 5.37% | | 05/15/2047 | | | 98,874 | |
| | 4,000,000 | | Series 2007-CH1(k) | | 4.93% | | 11/25/2036 | | | 4,052,158 | |
| | 73,401 | | Series 2007-LD11(f) | | 6.18% | | 06/15/2049 | | | 73,509 | |
| | 30,970 | | Series 2007-LDPX(f) | | 5.46% | | 01/15/2049 | | | 30,763 | |
| | 2,921,676 | | Series 2012-C8(f) | | 1.94% | | 10/15/2045 | | | 162,602 | |
| | 116,000 | | Series 2015-JP1(e)(f) | | 4.90% | | 01/15/2049 | | | 90,907 | |
| | 155,000 | | Series 2016-JP2 | | 3.46% | | 07/15/2026 | | | 148,512 | |
| | 119,000 | | Series 2016-JP2(f) | | 3.94% | | 07/15/2026 | | | 114,014 | |
| | | | JP Morgan Chase Commercial Mortgage Securities Trust | | | | | | | | |
| | 2,250,000 | | Series 2011-C3(e)(f) | | 5.87% | | 03/15/2021 | | | 2,220,331 | |
See Notes to Financial Statements.
| 58 | (888) 848-7569 | www.rivernorth.com |
| RiverNorth/DoubleLine Strategic Income Fund | Schedule of Investments |
September 30, 2018
| Principal Amount/Description | | Rate | | Maturity | | Value | |
| $ | 517,000 | | Series 2018-LAQ(e)(f) | | 1M US L + 1.60% | | 06/15/2025 | | $ | 520,250 | |
| | 517,000 | | Series 2018-LAQ(e)(f) | | 1M US L + 2.10% | | 06/15/2025 | | | 521,591 | |
| | | | JP Morgan Mortgage Acquisition Corp. | | | | | | | | |
| | 324,783 | | Series 2006-CH2(k) | | 5.46% | | 09/25/2029 | | | 266,592 | |
| | | | JP Morgan Mortgage Trust | | | | | | | | |
| | 7,978,227 | | Series 2005-S3 | | 6.50% | | 01/25/2036 | | | 6,627,596 | |
| | 203,958 | | Series 2007-S3 | | 6.00% | | 08/25/2037 | | | 175,069 | |
| | 1,140,573 | | Series 2007-S3 | | 6.00% | | 08/25/2037 | | | 979,018 | |
| | | | JP Morgan Resecuritization Trust | | | | | | | | |
| | 1,711,666 | | Series 2011-1(e)(f) | | 6.00% | | 06/26/2037 | | | 1,572,898 | |
| | | | Labrador Aviation Finance, Ltd. | | | | | | | | |
| | 11,197,917 | | Series 2016-1A(e) | | 5.68% | | 01/15/2042 | | | 11,135,287 | |
| | | | LB-UBS Commercial Mortgage Trust | | | | | | | | |
| | 286,420 | | Series 2006-C7(e)(f) | | 0.90% | | 11/15/2038 | | | 75 | |
| | 214,815 | | Series 2006-C7(e)(f) | | 0.90% | | 11/15/2038 | | | 56 | |
| | | | LCM Loan Income Fund I Income Note Issuer, Ltd. | | | | | | | | |
| | 500,000 | | Series 2018-27A(e)(f) | | 3M US L + 5.60% | | 07/16/2031 | | | 495,053 | |
| | | | LCM XIV LP | | | | | | | | |
| | 1,000,000 | | Series 2018-14A(e)(f) | | 3M US L + 2.75% | | 07/20/2031 | | | 991,408 | |
| | 750,000 | | Series 2018-14A(e)(f) | | 3M US L + 5.50% | | 07/20/2031 | | | 750,120 | |
| | | | LCM XVII LP | | | | | | | | |
| | 1,000,000 | | Series 2018-17A(e)(f) | | 6.00 - 3M US L | | 10/15/2031 | | | 1,000,000 | |
| | | | LCM XX LP | | | | | | | | |
| | 1,000,000 | | Series 2018-20A(e)(f)(j) | | 3M US L + 5.45% | | 10/20/2027 | | | 1,000,000 | |
| | | | Lehman Mortgage Trust | | | | | | | | |
| | 6,395,878 | | Series 2006-1(f) | | 5.43% | | 02/25/2036 | | | 6,395,762 | |
| | 687,013 | | Series 2006-6 | | 5.50% | | 10/25/2036 | | | 613,891 | |
| | 3,901,576 | | Series 2006-7(f) | | 1M US L + 0.25% | | 11/25/2036 | | | 374,404 | |
| | 3,901,576 | | Series 2006-7(f) | | 7.75% - 1M US | | L11/25/2036 | | | 665,451 | |
| | 1,573,427 | | Series 2006-8(f) | | 1M US L + 0.42% | | 12/25/2036 | | | 807,261 | |
| | 1,573,427 | | Series 2006-8(f) | | 6.58% - 1M US | | L12/25/2036 | | | 325,880 | |
| | 808,879 | | Series 2007-10 | | 6.00% | | 01/25/2038 | | | 838,095 | |
| | 358,091 | | Series 2007-10 | | 6.50% | | 01/25/2038 | | | 250,527 | |
| | | | Lehman XS Trust | | | | | | | | |
| | 134,257 | | Series 2006-5(k) | | 5.89% | | 04/25/2036 | | | 164,321 | |
See Notes to Financial Statements.
| Annual Report | September 30, 2018 | 59 |
| RiverNorth/DoubleLine Strategic Income Fund | Schedule of Investments |
September 30, 2018
| Principal Amount/Description | | Rate | | Maturity | | Value | |
| | | | Master Asset Backed Securities Trust | | | | | | | | |
| $ | 17,638,297 | | Series 2006-NC3(f) | | 1M US L + 0.21% | | 10/25/2036 | | $ | 11,622,410 | |
| | | | Merrill Lynch Alternative Note Asset Trust | | | | | | | | |
| | 776,783 | | Series 2007-F1 | | 6.00% | | 03/25/2037 | | | 329,924 | |
| | | | Monarch Beach Resort Trust | | | | | | | | |
| | 5,000,000 | | Series 2018-MBMZ(e)(f) | | 1M US L + 4.96% | | 07/15/2025 | | | 5,035,874 | |
| | | | Morgan Stanley Bank of America Merrill Lynch Trust | | | | | | | | |
| | 3,426,025 | | Series 2012-C5(e)(f) | | 1.63% | | 08/15/2045 | | | 148,705 | |
| | 450,000 | | Series 2014-C19 | | 4.00% | | 12/15/2024 | | | 429,285 | |
| | 380,000 | | Series 2015-C25(f) | | 4.68% | | 09/15/2025 | | | 378,942 | |
| | 340,000 | | Series 2015-C26(e) | | 3.06% | | 10/15/2025 | | | 293,648 | |
| | 350,000 | | Series 2015-C27(f) | | 4.68% | | 11/15/2025 | | | 341,468 | |
| | 502,000 | | Series 2015-C27(e)(f) | | 3.24% | | 11/15/2025 | | | 427,881 | |
| | 404,000 | | Series 2016-C32 | | 3.72% | | 12/15/2049 | | | 402,683 | |
| | | | Morgan Stanley Capital I Trust | | | | | | | | |
| | 3,325,971 | | Series 2011-C1(e)(f) | | 0.57% | | 09/15/2047 | | | 23,788 | |
| | 1,409,556 | | Series 2016-UB11 XA(f) | | 1.79% | | 08/15/2026 | | | 122,962 | |
| | 1,000,000 | | Series 2018-SUN(e)(f) | | 1M US L + 3.05% | | 07/15/2035 | | | 1,004,708 | |
| | | | Morgan Stanley Mortgage Loan Trust | | | | | | | | |
| | 2,689,017 | | Series 2005-3AR(f) | | 3.91% | | 07/25/2035 | | | 2,508,590 | |
| | 218,073 | | Series 2006-11 | | 6.00% | | 08/25/2036 | | | 178,366 | |
| | 1,113,321 | | Series 2006-7(f) | | 5.05% | | 06/25/2036 | | | 972,280 | |
| | 1,142,943 | | Series 2006-7 | | 6.00% | | 06/25/2036 | | | 992,389 | |
| | 464,153 | | Series 2007-3XS(k) | | 5.70% | | 01/25/2047 | | | 272,646 | |
| | | | Morgan Stanley Re-REMIC Trust | | | | | | | | |
| | 352,429 | | Series 2011-R1(e)(f) | | 5.94% | | 02/26/2037 | | | 367,409 | |
| | | | Mosaic Solar Loan Trust | | | | | | | | |
| | 180,299 | | Series 2017-1A(e) | | 4.45% | | 06/20/2042 | | | 181,780 | |
| | 682,008 | | Series 2018-1A(e) | | 4.01% | | 08/20/2030 | | | 676,978 | |
| | 955,556 | | Series 2018-2GS(e) | | 4.20% | | 10/21/2030 | | | 954,173 | |
| | | | MSCG Trust | | | | | | | | |
| | 255,000 | | Series 2016-SNR(e) | | 5.21% | | 11/15/2034 | | | 253,642 | |
| | | | Nationstar HECM Loan Trust | | | | | | | | |
| | 12,000,000 | | Series 2017-2A(e)(f) | | 3.97% | | 09/25/2027 | | | 12,030,012 | |
| | | | Natixis Commercial Mortgage Securities Trust | | | | | | | | |
| | 345,000 | | Series 2018-FL1(e)(f) | | 1M US L + 0.95% | | 06/15/2035 | | | 345,373 | |
| | 345,000 | | Series 2018-FL1(e)(f) | | 1M US L + 2.20% | | 06/15/2035 | | | 345,585 | |
See Notes to Financial Statements.
| 60 | (888) 848-7569 | www.rivernorth.com |
| RiverNorth/DoubleLine Strategic Income Fund | Schedule of Investments |
September 30, 2018
| Principal Amount/Description | | Rate | | Maturity | | Value | |
| | | | Navient Private Education Refi Loan Trust | | | | | | | | |
| $ | 500,000 | | Series 2018-A(e) | | 3.68% | | 11/17/2025 | | $ | 491,439 | |
| | | | Neuberger Berman CLP XXIII, Ltd. | | | | | | | | |
| | 1,000,000 | | Series 2016-23A(e)(f) | | 3M US L + 6.58% | | 10/17/2027 | | | 1,003,775 | |
| | | | New Century Home Equity Loan Trust | | | | | | | | |
| | 15,015,000 | | Series 2005-3(f) | | 1M US L + 0.70% | | 07/25/2035 | | | 14,345,658 | |
| | | | Nomura Asset Acceptance Corp. Alternative Loan Trust | | | | | | | | |
| | 1,404,402 | | Series 2005-AP3(f) | | 5.32% | | 08/25/2035 | | | 942,470 | |
| | | | Octagon Investment Partners 26, Ltd. | | | | | | | | |
| | 1,000,000 | | Series 2018-1A(e)(f) | | 3M US L + 8.09% | | 07/15/2030 | | | 987,204 | |
| | | | Octagon Investment Partners 37, Ltd. | | | | | | | | |
| | 500,000 | | Series 2018-2A(e)(f) | | 3M US L + 2.85% | | 07/25/2030 | | | 499,874 | |
| | | | Octagon Investment Partners XIV, Ltd. | | | | | | | | |
| | 500,000 | | Series 2017-1A(e)(f) | | 3M US L + 4.00% | | 07/15/2029 | | | 508,289 | |
| | | | Octagon Investment Partners XVI, Ltd. | | | | | | | | |
| | 500,000 | | Series 2018-1A(e)(f) | | 3M US L + 3.00% | | 07/17/2030 | | | 498,427 | |
| | 1,000,000 | | Series 2018-1A(e)(f) | | 3M US L + 5.75% | | 07/17/2030 | | | 997,186 | |
| | | | Octagon Investment Partners XXII, Ltd. | | | | | | | | |
| | 500,000 | | Series 2018-1A(e)(f) | | 3M US L + 5.45% | | 01/22/2030 | | | 491,500 | |
| | | | OHA Credit Funding 1, Ltd. | | | | | | | | |
| | 500,000 | | Series 2018-1A(e)(f)(j) | | 3.05 - 3M US L | | 10/20/2030 | | | 500,000 | |
| | | | OneMain Financial Issuance Trust | | | | | | | | |
| | 722,305 | | Series 2015-1A(e) | | 3.19% | | 03/18/2026 | | | 724,121 | |
| | | | PFP, Ltd. | | | | | | | | |
| | 59,137 | | Series 2017-3(e)(f) | | 1M US L + 1.05% | | 01/14/2035 | | | 59,224 | |
| | 146,000 | | Series 2017-3(e)(f) | | 1M US L + 1.30% | | 01/14/2035 | | | 146,326 | |
| | 84,000 | | Series 2017-3(e)(f) | | 1M US L + 1.75% | | 01/14/2035 | | | 84,328 | |
See Notes to Financial Statements.
| Annual Report | September 30, 2018 | 61 |
| RiverNorth/DoubleLine Strategic Income Fund | Schedule of Investments |
September 30, 2018
| Principal Amount/Description | | Rate | | Maturity | | Value | |
| $ | 88,000 | | Series 2017-3(e)(f) | | 1M US L + 2.50% | | 01/14/2035 | | $ | 88,527 | |
| | | | PHH Alternative Mortgage Trust | | | | | | | | |
| | 1,263,819 | | Series 2007-2 | | 6.00% | | 05/25/2037 | | | 1,159,549 | |
| | | | PR Mortgage Loan Trust | | | | | | | | |
| | 12,278,963 | | Series 2014-1(e)(f) | | 5.91% | | 10/25/2049 | | | 10,846,784 | |
| | | | Pretium Mortgage Credit Partners LLC | | | | | | | | |
| | 1,304,214 | | Series 2018-NPL2(e)(k) | | 3.70% | | 03/27/2033 | | | 1,296,792 | |
| | | | Prime Mortgage Trust | | | | | | | | |
| | 51,582 | | Series 2006-1 | | 5.50% | | 06/25/2036 | | | 51,584 | |
| | 99,909 | | Series 2006-DR1(e) | | 5.50% | | 05/25/2035 | | | 84,873 | |
| | | | RAIT Trust | | | | | | | | |
| | 289,833 | | Series 2017-FL7(e)(f) | | 1M US L + 0.95% | | 06/15/2025 | | | 289,958 | |
| | 111,000 | | Series 2017-FL7(e)(f) | | 1M US L + 1.30% | | 06/15/2025 | | | 111,033 | |
| | | | RBSGC Structured Trust | | | | | | | | |
| | 241,585 | | Series 2008-B(e) | | 6.00% | | 06/25/2037 | | | 236,132 | |
| | | | Residential Accredit Loans, Inc. | | | | | | | | |
| | 1,980,313 | | Series 2005-QS17 | | 6.00% | | 12/25/2035 | | | 1,914,439 | |
| | 4,915,419 | | Series 2006-QA5(f) | | 1M US L + 0.22% | | 07/25/2036 | | | 3,299,140 | |
| | 3,048,161 | | Series 2006-QS10 | | 6.50% | | 08/25/2036 | | | 2,854,419 | |
| | 1,087,545 | | Series 2006-QS4 | | 6.00% | | 04/25/2036 | | | 1,016,278 | |
| | 986,197 | | Series 2006-QS6 | | 6.00% | | 06/25/2036 | | | 905,013 | |
| | 702,674 | | Series 2006-QS6 | | 6.00% | | 06/25/2036 | | | 644,830 | |
| | 2,008,141 | | Series 2006-QS7 | | 6.00% | | 06/25/2036 | | | 1,845,745 | |
| | 105,572 | | Series 2006-QS7(f) | | 1M US L + 0.40% | | 06/25/2036 | | | 82,373 | |
| | 316,716 | | Series 2006-QS7(f) | | 5.60% - 1M US L | | 06/25/2036 | | | 33,871 | |
| | 123,154 | | Series 2006-QS8(f) | | 1M US L + 0.45% | | 08/25/2036 | | | 93,478 | |
| | 369,461 | | Series 2006-QS8(f) | | 5.55% - 1M US L | | 08/25/2036 | | | 37,096 | |
| | 2,689,464 | | Series 2007-QS3 | | 6.50% | | 02/25/2037 | | | 2,507,777 | |
| | 80,002 | | Series 2007-QS6 | | 6.25% | | 04/25/2037 | | | 75,735 | |
| | 11,272 | | Series 2007-QS6(f) | | 55.00% -8.33 x 1M US L | | 04/25/2037 | | | 18,418 | |
| | 3,818,849 | | Series 2007-QS9 | | 6.50% | | 07/25/2037 | | | 3,546,369 | |
| | 353,779 | | Series 2008-QR1 | | 6.00% | | 08/25/2036 | | | 278,797 | |
| | | | Residential Asset Securitization Trust | | | | | | | | |
| | 551,477 | | Series 2006-A1 | | 6.00% | | 04/25/2036 | | | 462,274 | |
| | 1,114,417 | | Series 2006-A2 | | 6.00% | | 01/25/2046 | | | 820,952 | |
| | 1,002,320 | | Series 2006-A6 | | 6.50% | | 07/25/2036 | | | 556,530 | |
| | 4,857,130 | | Series 2006-A7CB | | 6.25% | | 07/25/2036 | | | 4,719,617 | |
See Notes to Financial Statements.
| 62 | (888) 848-7569 | www.rivernorth.com |
| RiverNorth/DoubleLine Strategic Income Fund | Schedule of Investments |
September 30, 2018
| Principal Amount/Description | | Rate | | Maturity | | Value | |
| $ | 453,616 | | Series 2006-A8 | | 6.00% | | 08/25/2036 | | $ | 401,968 | |
| | 157,553 | | Series 2006-A8 | | 6.50% | | 08/25/2036 | | | 87,923 | |
| | 333,585 | | Series 2006-A8(f) | | 5.90% - 1M US L | | 08/25/2036 | | | 62,520 | |
| | 1,677,147 | | Series 2007-A1 | | 6.00% | | 03/25/2037 | | | 1,098,532 | |
| | 87,868 | | Series 2007-A6 | | 6.00% | | 06/25/2037 | | | 78,178 | |
| | 2,887,023 | | Series 2007-A7 | | 6.00% | | 07/25/2037 | | | 1,951,258 | |
| | 10,413,154 | | Series 2007-A8 | | 6.00% | | 08/25/2037 | | | 8,390,070 | |
| | | | Residential Funding Mortgage Securities I Trust | | | | | | | | |
| | 1,115,142 | | Series 2006-S3 | | 5.50% | | 03/25/2036 | | | 1,081,842 | |
| | 1,776,853 | | Series 2006-S6 | | 6.00% | | 07/25/2036 | | | 1,734,008 | |
| | 250,749 | | Series 2006-S6 | | 6.00% | | 07/25/2036 | | | 244,703 | |
| | 459,579 | | Series 2007-S3 | | 6.00% | | 03/25/2037 | | | 435,947 | |
| | 380,901 | | Series 2007-S6 | | 6.00% | | 06/25/2037 | | | 356,792 | |
| | | | Sapphire Aviation Finance I, Ltd. | | | | | | | | |
| | 958,333 | | Series 2018-1A(e) | | 5.93% | | 03/15/2025 | | | 980,730 | |
| | | | Sequoia Mortgage Trust | | | | | | | | |
| | 2,500,544 | | Series 2007-3(f) | | 3.94% | | 07/20/2037 | | | 2,406,651 | |
| | | | SLIDE | | | | | | | | |
| | 3,257,000 | | Series 2018-FUN(e)(f) | | 1M US L + 3.00% | | 06/15/2021 | | | 3,262,771 | |
| | | | SMB Private Education Loan Trust | | | | | | | | |
| | 500,000 | | Series 2018-B(e)(f) | | 1M US L + 0.72% | | 08/15/2027 | | | 503,189 | |
| | | | SoFi Consumer Loan Program, LLC | | | | | | | | |
| | 112,832 | | Series 2017-2(e) | | 3.28% | | 02/25/2026 | | | 112,665 | |
| | | | SoFi Professional Loan Program, LLC | | | | | | | | |
| | 300,000 | | Series 2017-D(e) | | 3.61% | | 09/25/2040 | | | 290,447 | |
| | | | Springleaf Funding Trust | | | | | | | | |
| | 1,056,164 | | Series 2015-AA(e) | | 3.16% | | 05/15/2019 | | | 1,056,306 | |
| | | | Sprite, Ltd. | | | | | | | | |
| | 470,702 | | Series 2017-1(e) | | 4.25% | | 12/15/2037 | | | 469,650 | |
| | | | Start, Ltd. | | | | | | | | |
| | 976,191 | | Series 2018-1(e) | | 4.09% | | 05/15/2025 | | | 974,501 | |
| | | | Structured Adjustable Rate Mortgage Loan Trust | | | | | | | | |
| | 995,386 | | Series 2005-15(f) | | 4.10% | | 07/25/2035 | | | 828,336 | |
| | | | Structured Asset Securities Corp. | | | | | | | | |
| | 249,687 | | Series 2005-RF1(e)(f) | | 1M US L + 0.35% | | 03/25/2035 | | | 233,644 | |
| | 250,907 | | Series 2005-RF1(e)(f) | | 2.91% | | 03/25/2035 | | | 24,109 | |
| | | | STWD Mortgage Trust | | | | | | | | |
| | 1,634,000 | | Series 2018-URB(e)(f) | | 1M US L + 3.15% | | 05/15/2021 | | | 1,640,101 | |
See Notes to Financial Statements.
| Annual Report | September 30, 2018 | 63 |
| RiverNorth/DoubleLine Strategic Income Fund | Schedule of Investments |
September 30, 2018
| Principal Amount/Description | | Rate | | Maturity | | Value | |
| | | | Suntrust Alternative Loan Trust | | | | | | | | |
| $ | 6,658,579 | | Series 2005-1F | | 6.50% | | 12/25/2035 | | $ | 6,377,596 | |
| | | | TAL Advantage, LLC | | | | | | | | |
| | 860,609 | | Series 17-1A | | 4.50% | | 04/20/2042 | | | 868,542 | |
| | | | TBW Mortgage-Backed Trust | | | | | | | | |
| | 1,452,566 | | Series 2006-2 | | 7.00% | | 07/25/2036 | | | 579,373 | |
| | | | Textainer Marine Containers V, Ltd. | | | | | | | | |
| | 872,564 | | Series 2017-1A(e) | | 3.72% | | 05/20/2042 | | | 861,169 | |
| | | | Thunderbolt II Aircraft Lease, Ltd. | | | | | | | | |
| | 5,000,000 | | Series 2018-A(e)(k) | | 5.07% | | 09/15/2038 | | | 5,030,600 | |
| | | | TRIP Rail Master Funding, LLC | | | | | | | | |
| | 398,152 | | Series 2017-1A(e) | | 2.71% | | 08/15/2047 | | | 392,533 | |
| | | | UBS Commercial Mortgage Trust | | | | | | | | |
| | 513,000 | | Series 2017-C6(f) | | 4.60% | | 12/15/2050 | | | 506,317 | |
| | 511,000 | | Series 2018-C8(f) | | 4.86% | | 02/15/2051 | | | 512,989 | |
| | 6,190,301 | | Series 2018-C9(f) | | 1.07% | | 03/15/2051 | | | 425,587 | |
| | | | Vantage Data Centers Issuer, LLC | | | | | | | | |
| | 745,625 | | Series 2018-1A(e) | | 4.07% | | 02/15/2023 | | | 746,857 | |
| | | | VB-S1 Issuer, LLC | | | | | | | | |
| | 3,000,000 | | Series 2018-1A(e) | | 5.25% | | 02/15/2048 | | | 2,999,424 | |
| | | | Velocity Commercial Capital Loan Trust | | | | | | | | |
| | 5,256,140 | | Series 2017-2(e)(f) | | 3.07% | | 11/25/2047 | | | 5,164,280 | |
| | | | Wachovia Bank Commercial Mortgage Trust | | | | | | | | |
| | 56,626 | | Series 2006-C29(f) | | 0.37% | | 11/15/2048 | | | 1 | |
| | | | Wachovia Mortgage Loan Trust, LLC Series Trust | | | | | | | | |
| | 872,254 | | Series 2005-B(f) | | 4.16% | | 10/20/2035 | | | 863,309 | |
| | | | Washington Mutual Alternative Mortgage Pass-Through Certificates | | | | | | | | |
| | 1,769,146 | | Series 2005-1 | | 6.00% | | 03/25/2035 | | | 1,778,751 | |
| | 72,303 | | Series 2005-9 | | 5.50% | | 11/25/2035 | | | 63,923 | |
| | 559,831 | | Series 2006-5 | | 6.00% | | 07/25/2036 | | | 460,975 | |
| | | | Washington Mutual Mortgage Pass-Through Certificates Trust | | | | | | | | |
| | 1,089,896 | | Series 2006-2 | | 6.00% | | 03/25/2036 | | | 1,058,832 | |
| | | | Wells Fargo Alternative Loan Trust | | | | | | | | |
| | 665,412 | | Series 2007-PA2(f) | | 1M US L + 0.43% | | 06/25/2037 | | | 558,798 | |
| | 665,412 | | Series 2007-PA2(f) | | 6.07% - 1M US L | | 06/25/2037 | | | 60,608 | |
| | 233,561 | | Series 2007-PA3 | | 5.75% | | 07/25/2037 | | | 219,458 | |
| | 865,590 | | Series 2007-PA3 | | 6.25% | | 07/25/2037 | | | 821,147 | |
| | 4,676,287 | | Series 2007-PA5 | | 6.25% | | 11/25/2037 | | | 4,625,845 | |
See Notes to Financial Statements.
| 64 | (888) 848-7569 | www.rivernorth.com |
| RiverNorth/DoubleLine Strategic Income Fund | Schedule of Investments |
September 30, 2018
| Principal Amount/Description | | Rate | | Maturity | | Value | |
| | | | Wells Fargo Commercial Mortgage Trust | | | | | | | | |
| $ | 525,000 | | Series 2014-LC16(e) | | 3.94% | | 06/15/2024 | | $ | 434,934 | |
| | 420,000 | | Series 2015-C31(f) | | 4.76% | | 11/15/2025 | | | 421,122 | |
| | 340,000 | | Series 2015-LC22(f) | | 4.69% | | 09/15/2058 | | | 336,675 | |
| | 380,000 | | Series 2015-NXS3(f) | | 4.64% | | 09/15/2057 | | | 371,626 | |
| | 420,000 | | Series 2015-NXS4(f) | | 4.75% | | 12/15/2048 | | | 422,759 | |
| | 1,000,000 | | Series 2016-C33(e) | | 3.12% | | 03/15/2059 | | | 839,889 | |
| | 518,000 | | Series 2018-C45 | | 4.73% | | 06/15/2051 | | | 515,334 | |
| | 165,000 | | Series 2018-C46 | | 5.15% | | 08/15/2051 | | | 166,315 | |
| | | | Wells Fargo Mortgage-Backed Securities Trust | | | | | | | | |
| | 1,580,132 | | Series 2005-12 | | 5.50% | | 11/25/2035 | | | 1,605,898 | |
| | 437,953 | | Series 2006-11 | | 6.00% | | 09/25/2036 | | | 422,700 | |
| | 162,025 | | Series 2006-2 | | 5.50% | | 03/25/2036 | | | 159,464 | |
| | 53,004 | | Series 2006-2 | | 5.75% | | 03/25/2036 | | | 51,943 | |
| | 497,990 | | Series 2007-13 | | 6.00% | | 09/25/2037 | | | 499,936 | |
| | 597,171 | | Series 2007-14 | | 6.00% | | 10/25/2037 | | | 591,926 | |
| | 507,967 | | Series 2007-2 | | 6.00% | | 03/25/2037 | | | 504,253 | |
| | | | WF-RBS Commercial Mortgage Trust | | | | | | | | |
| | 2,345,167 | | Series 2012-C9(e)(f) | | 2.05% | | 11/15/2045 | | | 145,801 | |
| | 4,237,643 | | Series 2014-C21(f) | | 1.23% | | 08/15/2047 | | | 188,341 | |
| | 4,700,477 | | Series 2014-C22(f) | | 1.00% | | 09/15/2057 | | | 176,758 | |
| | | | Zcap | | | | | | | | |
| | 3,000,000 | | Series 2018-1(e) | | 4.61% | | 09/15/2025 | | | 2,955,555 | |
| | | | | | | | | | | | |
| TOTAL NON-AGENCY COLLATERALIZED MORTGAGE OBLIGATIONS (Cost $518,327,428) | | | 525,710,253 | |
| | | | | | | | | | | | |
| U.S. GOVERNMENT BONDS AND NOTES - 13.05% | | | | |
| | 5,155,000 | | U.S. Treasury Bonds | | 2.25% | | 08/15/2027 | | | 4,835,732 | |
| | 4,750,000 | | U.S. Treasury Bonds | | 2.25% | | 11/15/2027 | | | 4,447,095 | |
| | 3,330,000 | | U.S. Treasury Bonds | | 2.75% | | 02/15/2028 | | | 3,248,181 | |
| | 3,790,000 | | U.S. Treasury Bonds | | 2.75% | | 11/15/2042 | | | 3,506,860 | |
| | 2,710,000 | | U.S. Treasury Bonds | | 3.13% | | 02/15/2043 | | | 2,677,131 | |
| | 4,000,000 | | U.S. Treasury Bonds | | 3.63% | | 08/15/2043 | | | 4,290,937 | |
| | 2,880,000 | | U.S. Treasury Bonds | | 3.75% | | 11/15/2043 | | | 3,153,094 | |
| | 2,510,000 | | U.S. Treasury Bonds | | 3.38% | | 05/15/2044 | | | 2,587,016 | |
| | 3,260,000 | | U.S. Treasury Bonds | | 2.88% | | 08/15/2045 | | | 3,068,921 | |
| | 2,900,000 | | U.S. Treasury Bonds | | 2.75% | | 11/15/2047 | | | 2,653,726 | |
| | 1,300,000 | | U.S. Treasury Bonds | | 3.00% | | 08/15/2048 | | | 1,250,590 | |
| | 7,500,000 | | U.S. Treasury Notes | | 0.75% | | 10/31/2018 | | | 7,492,087 | |
| | 7,500,000 | | U.S. Treasury Notes | | 1.38% | | 11/30/2018 | | | 7,490,383 | |
| | 116,404,000 | | U.S. Treasury Notes | | 1.13% | | 01/31/2019 | | | 115,948,502 | |
| | 7,500,000 | | U.S. Treasury Notes | | 1.50% | | 02/28/2019 | | | 7,474,219 | |
See Notes to Financial Statements.
| Annual Report | September 30, 2018 | 65 |
| RiverNorth/DoubleLine Strategic Income Fund | Schedule of Investments |
September 30, 2018
| Principal Amount/Description | | Rate | | Maturity | | Value | |
| $ | 15,500,000 | | U.S. Treasury Notes | | 1.50% | | 03/31/2019 | | $ | 15,430,371 | |
| | 5,330,000 | | U.S. Treasury Notes | | 1.50% | | 10/31/2019 | | | 5,263,791 | |
| | 5,120,000 | | U.S. Treasury Notes | | 1.75% | | 11/30/2019 | | | 5,065,400 | |
| | 4,190,000 | | U.S. Treasury Notes | | 2.63% | | 07/31/2020 | | | 4,176,824 | |
| | 4,290,000 | | U.S. Treasury Notes | | 2.13% | | 08/31/2020 | | | 4,235,118 | |
| | 4,650,000 | | U.S. Treasury Notes | | 2.00% | | 09/30/2020 | | | 4,576,345 | |
| | 4,200,000 | | U.S. Treasury Notes | | 1.75% | | 10/31/2020 | | | 4,108,781 | |
| | 4,660,000 | | U.S. Treasury Notes | | 1.63% | | 11/30/2020 | | | 4,541,953 | |
| | 4,610,000 | | U.S. Treasury Notes | | 2.00% | | 05/31/2021 | | | 4,508,256 | |
| | 4,790,000 | | U.S. Treasury Notes | | 1.13% | | 06/30/2021 | | | 4,570,988 | |
| | 655,000 | | U.S. Treasury Notes | | 1.88% | | 01/31/2022 | | | 633,751 | |
| | 4,750,000 | | U.S. Treasury Notes | | 1.88% | | 08/31/2024 | | | 4,467,134 | |
| | 4,760,000 | | U.S. Treasury Notes | | 2.13% | | 09/30/2024 | | | 4,536,410 | |
| | 5,500,000 | | U.S. Treasury Notes | | 2.25% | | 10/31/2024 | | | 5,275,381 | |
| | | | | | | | | | | | |
| TOTAL U.S. GOVERNMENT BONDS AND NOTES (Cost $247,641,783) | | | | | 245,514,977 | |
| | | | | | | | | | | | |
| MUNICIPAL BONDS - 1.06% | | | | | | |
| | 33,700,000 | | Commonwealth of Puerto Rico, Series A, Revenue Bonds(g) | | 8.00% | | 07/01/2035 | | | 19,588,125 | |
| | 120,000 | | Missouri Highway & Transportation Commission, Revenue Bonds | | 5.06% | | 05/01/2024 | | | 128,765 | |
| | 165,000 | | State of California, General Obligation Bonds | | 7.55% | | 04/01/2039 | | | 241,416 | |
| | | | | | | | | | | | |
| TOTAL MUNICIPAL BONDS (Cost $26,391,379) | | | | | 19,958,306 | |
| | | | | | | | | | | | |
| U.S. GOVERNMENT / AGENCY MORTGAGE BACKED SECURITIES - 10.87% | | | | |
| | | | Federal Home Loan Mortgage Corp. Multifamily Structured Pass Through Certificates | | | | | | | | |
| | 311,000 | | Series 2015-K050(f) | | 3.33% | | 08/25/2025 | | | 310,608 | |
| | 412,000 | | Series 2016-K053 | | 3.00% | | 12/25/2025 | | | 402,150 | |
| | | | Federal Home Loan Mortgage Corp. Pool | | | | | | | | |
| | 318,209 | | Series Pool #G01840 | | 5.00% | | 07/01/2035 | | | 337,785 | |
| | 120,819 | | Series Pool #G04817 | | 5.00% | | 09/01/2038 | | | 128,301 | |
| | | | Federal Home Loan Mortgage Corp. REMICS | | | | | | | | |
| | 1,557,218 | | Series 2003-2722(f) | | 9.89% - 1M US L | | 12/15/2033 | | | 1,647,341 | |
| | 293,087 | | Series 2005-R003 | | 5.50% | | 10/15/2035 | | | 313,468 | |
| | 2,091,976 | | Series 2006-3244(f) | | 6.66% - 1M US L | | 11/15/2036 | | | 320,042 | |
| | 98,898 | | Series 2007-3261(f) | | 6.43% - 1M US L | | 01/15/2037 | | | 13,976 | |
See Notes to Financial Statements.
| 66 | (888) 848-7569 | www.rivernorth.com |
| RiverNorth/DoubleLine Strategic Income Fund | Schedule of Investments |
September 30, 2018
| Principal Amount/Description | | Rate | | Maturity | | Value | |
| $ | 268,018 | | Series 2007-3262(f) | | 6.40% - 1M US L | | 01/15/2037 | | $ | 23,075 | |
| | 870,981 | | Series 2007-3301(f) | | 6.10% - 1M US L | | 04/15/2037 | | | 94,676 | |
| | 692,959 | | Series 2007-3303(f) | | 6.10% - 1M US L | | 04/15/2037 | | | 85,589 | |
| | 1,306,724 | | Series 2007-3303(f) | | 6.08% - 1M US L | | 04/15/2037 | | | 146,730 | |
| | 303,153 | | Series 2007-3382(f) | | 6.00% - 1M US L | | 11/15/2037 | | | 24,829 | |
| | 603,622 | | Series 2007-3384(f) | | 6.31% - 1M US L | | 08/15/2036 | | | 80,751 | |
| | 248,645 | | Series 2007-3384(f) | | 6.39% - 1M US L | | 11/15/2037 | | | 21,495 | |
| | 335,527 | | Series 2008-3417(f) | | 6.18% - 1M US L | | 02/15/2038 | | | 27,384 | |
| | 3,588,090 | | Series 2008-3419(f) | | 6.43% - 1M US L | | 02/15/2038 | | | 432,968 | |
| | 308,183 | | Series 2008-3423(f) | | 5.65% - 1M US L | | 03/15/2038 | | | 25,215 | |
| | 6,203,314 | | Series 2008-3423(f) | | 6.00% - 1M US L | | 03/15/2038 | | | 55,185 | |
| | 6,907,113 | | Series 2008-3435(f) | | 5.98% - 1M US L | | 04/15/2038 | | | 696,833 | |
| | 2,049,339 | | Series 2009-3510(f) | | 6.75% - 1M US L | | 02/15/2037 | | | 305,974 | |
| | 504,319 | | Series 2009-3523(f) | | 6.00% - 1M US L | | 04/15/2039 | | | 51,306 | |
| | 101,704 | | Series 2009-3524 | | 3.69% | | 06/15/2038 | | | 100,151 | |
| | 21,504 | | Series 2009-3549(f) | | 5.80% - 1M US L | | 07/15/2039 | | | 1,795 | |
| | 1,274,500 | | Series 2009-3560(f) | | 6.40% - 1M US L | | 11/15/2036 | | | 136,938 | |
| | 486,166 | | Series 2010-3641 | | 4.50% | | 03/15/2040 | | | 504,314 | |
| | 598,050 | | Series 2010-3726(f) | | 6.05% - 1M US L | | 09/15/2040 | | | 65,886 | |
| | 3,448,678 | | Series 2010-3728(f) | | 4.45% - 1M US L | | 09/15/2040 | | | 198,936 | |
| | 750,000 | | Series 2010-3779 | | 3.50% | | 12/15/2030 | | | 750,008 | |
| | 193,927 | | Series 2010-3779 | | 4.00% | | 12/15/2030 | | | 199,004 | |
| | 494,947 | | Series 2010-3779 | | 4.50% | | 12/15/2040 | | | 513,053 | |
| | 78,997 | | Series 2011-3786(f) | | 9.50% - 1M US L | | 01/15/2041 | | | 72,452 | |
| | 1,358,195 | | Series 2011-3795 | | 4.00% | | 01/15/2041 | | | 1,389,472 | |
| | 69,792 | | Series 2011-3798(f) | | 9.50% - 1M US L | | 11/15/2040 | | | 65,569 | |
| | 600,000 | | Series 2011-3808 | | 3.50% | | 02/15/2031 | | | 594,213 | |
| | 39,198 | | Series 2011-3809(f) | | 9.50% - 1M US L | | 02/15/2041 | | | 33,019 | |
| | 1,070,598 | | Series 2011-3815(f) | | 5.85% - 1M US L | | 02/15/2041 | | | 119,258 | |
| | 500,000 | | Series 2011-3824 | | 3.50% | | 03/15/2031 | | | 505,958 | |
| | 598,155 | | Series 2011-3824(f) | | 7.10% - 1M US L | | 08/15/2036 | | | 94,654 | |
| | 731,905 | | Series 2011-3863 | | 5.50% | | 08/15/2034 | | | 765,668 | |
| | 646,115 | | Series 2011-3864(f) | | 9.20% - 1M US L | | 05/15/2041 | | | 629,075 | |
| | 763,698 | | Series 2011-3871 | | 5.50% | | 06/15/2041 | | | 835,633 | |
| | 734,931 | | Series 2011-3872(f) | | 5.95% - 1M US L | | 06/15/2041 | | | 83,250 | |
| | 1,803,186 | | Series 2011-3888 | | 4.00% | | 07/15/2041 | | | 1,834,835 | |
| | 3,044,756 | | Series 2011-3894 | | 4.50% | | 07/15/2041 | | | 3,103,454 | |
| | 2,847,889 | | Series 2011-3910 | | 5.00% | | 08/15/2041 | | | 3,054,385 | |
| | 3,480,133 | | Series 2011-3924(f) | | 6.00% - 1M US L | | 09/15/2041 | | | 405,378 | |
| | 1,614,011 | | Series 2011-3924(f) | | 6.00% - 1M US L | | 09/15/2041 | | | 184,185 | |
| | 777,035 | | Series 2011-3925 | | 3.00% | | 09/15/2021 | | | 23,762 | |
| | 4,731,015 | | Series 2012-3(f) | | 5.95% - 1M US L | | 02/25/2042 | | | 548,950 | |
| | 3,850,475 | | Series 2012-4057 | | 4.00% | | 06/15/2042 | | | 3,900,869 | |
| | 9,718,102 | | Series 2013-4196(f) | | 5.40% - 1M US L | | 03/15/2043 | | | 7,638,634 | |
See Notes to Financial Statements.
| Annual Report | September 30, 2018 | 67 |
| RiverNorth/DoubleLine Strategic Income Fund | Schedule of Investments |
September 30, 2018
| Principal Amount/Description | | Rate | | Maturity | | Value | |
| $ | 10,260,874 | | Series 2013-4218 | | 2.50% | | 02/15/2043 | | $ | 8,280,413 | |
| | 7,304,203 | | Series 2013-4239(h) | | 0.00% | | 07/15/2043 | | | 4,862,241 | |
| | 4,131,128 | | Series 2014-4302(f) | | 6.15% - 1M US L | | 02/15/2044 | | | 525,011 | |
| | 4,573,440 | | Series 2014-4413 | | 3.50% | | 11/15/2044 | | | 4,296,496 | |
| | 8,520,844 | | Series 2015-4427(f) | | 5.60% - 1M US L | | 07/15/2044 | | | 1,098,412 | |
| | 3,340,024 | | Series 2015-4434 | | 3.00% | | 02/15/2045 | | | 2,918,357 | |
| | 3,280,850 | | Series 2015-4440 | | 2.50% | | 02/15/2045 | | | 2,732,021 | |
| | 12,128,908 | | Series 2017-4686 | | 4.00% | | 03/15/2047 | | | 12,330,758 | |
| | | | Federal Home Loan Mortgage Corp. Strips | | | | | | | | |
| | 3,073,620 | | Series 2017-358 | | 3.00% | | 10/15/2047 | | | 2,947,937 | |
| | | | Federal National Mortgage Association ACES | | | | | | | | |
| | 413,000 | | Series 2016-M3 | | 2.70% | | 02/25/2026 | | | 393,235 | |
| | | | Federal National Mortgage Association Pool | | | | | | | | |
| | 88,655 | | Series Pool #555743 | | 5.00% | | 09/01/2033 | | | 94,171 | |
| | 108,307 | | Series Pool #735382 | | 5.00% | | 04/01/2035 | | | 115,048 | |
| | 287,899 | | Series Pool #735383 | | 5.00% | | 04/01/2035 | | | 305,844 | |
| | 197,138 | | Series Pool #735484 | | 5.00% | | 05/01/2035 | | | 209,415 | |
| | 87,365 | | Series Pool #AH4437 | | 4.00% | | 01/01/2041 | | | 87,958 | |
| | 3,290,389 | | Series Pool #AL9238 | | 3.00% | | 10/01/2041 | | | 3,179,342 | |
| | 3,490,273 | | Series Pool #AS4645 | | 3.00% | | 03/01/2045 | | | 3,357,365 | |
| | 4,186,491 | | Series Pool #AS7661 | | 3.00% | | 08/01/2046 | | | 4,001,415 | |
| | 362,824 | | Series Pool #MA0264 | | 4.50% | | 12/01/2029 | | | 375,592 | |
| | 2,796,979 | | Series Pool #MA2737 | | 3.00% | | 09/01/2046 | | | 2,680,559 | |
| | 892,572 | | Series Pool #MA3894 | | 4.00% | | 09/01/2031 | | | 908,740 | |
| | | | Federal National Mortgage Association REMICS | | | | | | | | |
| | 110,439 | | Series 2004-46(f) | | 6.00% - 1M US L | | 03/25/2034 | | | 9,247 | |
| | 343,174 | | Series 2006-101(f) | | 6.58% - 1M US L | | 10/25/2036 | | | 51,368 | |
| | 1,005,178 | | Series 2006-123(f) | | 6.32% - 1M US L | | 01/25/2037 | | | 142,264 | |
| | 4,691,804 | | Series 2006-92(f) | | 6.58% - 1M US L | | 10/25/2036 | | | 638,240 | |
| | 125,477 | | Series 2007-102(f) | | 6.40% - 1M US L | | 11/25/2037 | | | 15,456 | |
| | 89,790 | | Series 2007-108(f) | | 6.36% - 1M US L | | 12/25/2037 | | | 10,293 | |
| | 25,593 | | Series 2007-30(f) | | 6.11% - 1M US L | | 04/25/2037 | | | 2,516 | |
| | 412,955 | | Series 2007-38(f) | | 6.08% - 1M US L | | 05/25/2037 | | | 40,967 | |
| | 20,059 | | Series 2007-51(f) | | 6.10% - 1M US L | | 06/25/2037 | | | 1,655 | |
| | 67,740 | | Series 2007-53(f) | | 6.10% - 1M US L | | 06/25/2037 | | | 7,602 | |
| | 689,823 | | Series 2007-57(f) | | 6.62% - 1M US L | | 10/25/2036 | | | 86,494 | |
| | 203,431 | | Series 2007-68(f) | | 6.65% - 1M US L | | 07/25/2037 | | | 25,333 | |
| | 755,764 | | Series 2008-3(f) | | 6.46% - 1M US L | | 02/25/2038 | | | 102,792 | |
| | 294,372 | | Series 2008-56(f) | | 6.06% - 1M US L | | 07/25/2038 | | | 31,955 | |
| | 108,527 | | Series 2008-81 | | 5.50% | | 09/25/2038 | | | 112,911 | |
| | 256,074 | | Series 2009-111(f) | | 6.25% - 1M US L | | 01/25/2040 | | | 25,999 | |
See Notes to Financial Statements.
| 68 | (888) 848-7569 | www.rivernorth.com |
| RiverNorth/DoubleLine Strategic Income Fund | Schedule of Investments |
September 30, 2018
| Principal Amount/Description | | Rate | | Maturity | | Value | |
| $ | 448,478 | | Series 2009-111 | | 5.00% | | 01/25/2040 | | $ | 464,626 | |
| | 1,149,427 | | Series 2009-12(f) | | 6.60% - 1M US L | | 03/25/2036 | | | 142,851 | |
| | 44,224 | | Series 2009-28(f) | | 6.00% - 1M US L | | 04/25/2037 | | | 3,919 | |
| | 495,448 | | Series 2009-41 | | 4.50% | | 06/25/2039 | | | 505,909 | |
| | 149,054 | | Series 2009-42(f) | | 6.00% - 1M US L | | 06/25/2039 | | | 13,211 | |
| | 301,499 | | Series 2009-47(f) | | 6.10% - 1M US L | | 07/25/2039 | | | 27,403 | |
| | 174,627 | | Series 2009-62(f) | | 6.10% - 1M US L | | 08/25/2039 | | | 10,224 | |
| | 84,664 | | Series 2009-66(f) | | 5.80% - 1M US L | | 02/25/2038 | | | 8,742 | |
| | 88,729 | | Series 2009-68(f) | | 5.25% - 1M US L | | 09/25/2039 | | | 6,237 | |
| | 18,497 | | Series 2010-109(f) | | 55.00% - 1M US L | | 10/25/2040 | | | 49,569 | |
| | 466,521 | | Series 2010-11(f) | | 4.80% - 1M US L | | 02/25/2040 | | | 28,346 | |
| | 100,927 | | Series 2010-111(f) | | 6.00% - 1M US L | | 10/25/2040 | | | 8,472 | |
| | 158,962 | | Series 2010-112 | | 4.00% | | 10/25/2040 | | | 158,485 | |
| | 262,825 | | Series 2010-115(f) | | 6.60% - 1M US L | | 11/25/2039 | | | 29,971 | |
| | 2,527,932 | | Series 2010-115(f) | | 6.00% - 1M US L | | 10/25/2040 | | | 358,367 | |
| | 5,778,109 | | Series 2010-123(f) | | 6.05% - 1M US L | | 11/25/2040 | | | 845,966 | |
| | 951,669 | | Series 2010-15(f) | | 4.95% - 1M US L | | 03/25/2040 | | | 77,655 | |
| | 149,886 | | Series 2010-34(f) | | 4.93% - 1M US L | | 04/25/2040 | | | 11,705 | |
| | 91,108 | | Series 2010-4(f) | | 6.23% - 1M US L | | 02/25/2040 | | | 10,837 | |
| | 119,854 | | Series 2010-58(f) | | 12.47% - 1M US L | | 06/25/2040 | | | 119,042 | |
| | 3,270,802 | | Series 2010-75 | | 4.50% | | 07/25/2040 | | | 3,448,868 | |
| | 77,632 | | Series 2010-9(f) | | 5.30% - 1M US L | | 02/25/2040 | | | 6,474 | |
| | 311,031 | | Series 2010-9(f) | | 4.75% - 1M US L | | 02/25/2040 | | | 16,358 | |
| | 18,313 | | Series 2010-90(f) | | 6.00% - 1M US L | | 08/25/2040 | | | 2,044 | |
| | 500,000 | | Series 2011-16 | | 3.50% | | 03/25/2031 | | | 501,397 | |
| | 2,261,005 | | Series 2011-2 | | 4.00% | | 02/25/2041 | | | 2,294,090 | |
| | 952,216 | | Series 2011-25 | | 3.00% | | 04/25/2026 | | | 946,776 | |
| | 500,000 | | Series 2011-29 | | 3.50% | | 04/25/2031 | | | 491,319 | |
| | 306,666 | | Series 2011-48(f) | | 9.20% - 1M US L | | 06/25/2041 | | | 286,928 | |
| | 684,742 | | Series 2011-5(f) | | 6.40% - 1M US L | | 11/25/2040 | | | 72,895 | |
| | 11,541,875 | | Series 2011-51(f) | | 1M US L + 6.00% | | 06/25/2041 | | | 1,548,758 | |
| | 1,465,110 | | Series 2011-58(f) | | 6.55% - 1M US L | | 07/25/2041 | | | 217,825 | |
| | 4,750,117 | | Series 2012-106(f) | | 6.16% - 1M US L | | 10/25/2042 | | | 681,190 | |
| | 1,194,654 | | Series 2012-124(f) | | 7.79% - 1M US L | | 11/25/2042 | | | 1,015,155 | |
| | 9,795,601 | | Series 2012-128(f) | | 6.00% - 1M US L | | 11/25/2042 | | | 7,285,114 | |
| | 10,069,619 | | Series 2012-20 | | 3.50% | | 03/25/2042 | | | 9,754,206 | |
| | 383,293 | | Series 2012-29(f) | | 6.00% - 1M US L | | 04/25/2042 | | | 36,141 | |
| | 1,066,084 | | Series 2012-32 | | 5.00% | | 04/25/2042 | | | 243,553 | |
| | 4,659,104 | | Series 2012-65(f) | | 5.98% - 1M US L | | 06/25/2042 | | | 628,874 | |
| | 5,431,818 | | Series 2012-92 | | 3.50% | | 08/25/2042 | | | 5,186,288 | |
| | 3,290,061 | | Series 2013-19(f) | | 5.40% - 1M US L | | 03/25/2043 | | | 2,500,626 | |
| | 9,646,208 | | Series 2013-51(f) | | 5.40% - 1M US L | | 04/25/2043 | | | 7,699,310 | |
See Notes to Financial Statements.
| Annual Report | September 30, 2018 | 69 |
| RiverNorth/DoubleLine Strategic Income Fund | Schedule of Investments |
September 30, 2018
| Principal Amount/Description | | Rate | | Maturity | | Value | |
| $ | 9,688,453 | | Series 2014-50(f) | | 6.20% - 1M US L | | 08/25/2044 | | $ | 1,207,835 | |
| | 5,385,339 | | Series 2014-73(f) | | 6.20% - 1M US L | | 11/25/2044 | | | 860,411 | |
| | 2,708,012 | | Series 2015-59 | | 3.00% | | 06/25/2041 | | | 2,649,189 | |
| | 9,913,147 | | Series 2015-79 | | 3.00% | | 11/25/2045 | | | 8,645,218 | |
| | 2,261,261 | | Series 2015-9 | | 3.00% | | 01/25/2045 | | | 2,222,004 | |
| | 12,869,526 | | Series 2016-72 | | 3.00% | | 10/25/2046 | | | 10,920,632 | |
| | 6,742,024 | | Series 2016-72 | | 3.00% | | 10/25/2046 | | | 5,992,772 | |
| | 3,861,139 | | Series 2018-21(h) | | 0.00% | | 04/25/2048 | | | 2,979,445 | |
| | 3,327,106 | | Series 2018-27 | | 3.00% | | 12/25/2047 | | | 3,173,894 | |
| | 3,865,359 | | Series 2018-36 | | 3.00% | | 06/25/2048 | | | 3,724,917 | |
| | | | Government National Mortgage Association | | | | | | | | |
| | 73,513 | | Series 2004-83(f) | | 6.08% - 1M US L | | 10/20/2034 | | | 8,942 | |
| | 62,812 | | Series 2008-6(f) | | 6.46% - 1M US L | | 02/20/2038 | | | 8,416 | |
| | 60,161 | | Series 2008-67(f) | | 6.00% - 1M US L | | 08/20/2038 | | | 6,425 | |
| | 943,905 | | Series 2008-69(f) | | 7.63% - 1M US L | | 08/20/2038 | | | 151,419 | |
| | 80,311 | | Series 2009-10(f) | | 6.65% - 1M US L | | 02/16/2039 | | | 12,100 | |
| | 1,233,158 | | Series 2009-35 | | 4.50% | | 05/20/2039 | | | 1,281,778 | |
| | 4,779,288 | | Series 2009-58(f) | | 6.25% - 1M US L | | 06/20/2039 | | | 505,231 | |
| | 66,964 | | Series 2009-6(f) | | 5.95% - 1M US L | | 02/20/2038 | | | 7,707 | |
| | 2,372,802 | | Series 2009-75 | | 5.00% | | 09/20/2039 | | | 2,467,934 | |
| | 5,728,758 | | Series 2010-121(f) | | 6.00% - 1M US L | | 09/20/2040 | | | 693,961 | |
| | 3,638,194 | | Series 2010-26(f) | | 6.25% - 1M US L | | 02/20/2040 | | | 529,044 | |
| | 8,461,366 | | Series 2010-35(f) | | 5.68% - 1M US L | | 03/20/2040 | | | 1,064,082 | |
| | 97,870 | | Series 2010-61(f) | | 6.55% - 1M US L | | 09/20/2039 | | | 11,890 | |
| | 218,610 | | Series 2010-98(f) | | 5.75% | | 03/20/2039 | | | 28,632 | |
| | 1,873,266 | | Series 2011-45 | | 4.50% | | 03/20/2041 | | | 1,903,590 | |
| | 837,267 | | Series 2011-69 | | 0.00% | | 05/20/2041 | | | 699,195 | |
| | 2,362,418 | | Series 2011-71 | | 4.50% | | 02/20/2041 | | | 2,420,054 | |
| | 1,546,695 | | Series 2011-71(f) | | 5.40% - 1M US L | | 05/20/2041 | | | 157,484 | |
| | 480,320 | | Series 2011-72(f) | | 6.15% - 1M US L | | 05/20/2041 | | | 67,211 | |
| | 2,509,052 | | Series 2011-89(f) | | 5.45% - 1M US L | | 06/20/2041 | | | 253,264 | |
| | 579,542 | | Series 2012-105(f) | | 6.20% - 1M US L | | 01/20/2041 | | | 35,233 | |
| | 6,516,295 | | Series 2013-102(f) | | 6.15% - 1M US L | | 03/20/2043 | | | 805,505 | |
| | 7,245,189 | | Series 2013-113(f) | | 6.25% - 1M US L | | 03/20/2043 | | | 764,498 | |
| | 9,243,362 | | Series 2013-122(f) | | 6.10% - 1M US L | | 08/16/2043 | | | 1,285,143 | |
| | 5,474,037 | | Series 2013-148(f) | | 5.68% - 1M US L | | 10/16/2043 | | | 624,965 | |
| | 10,003,714 | | Series 2013-186(f) | | 6.25% - 1M US L | | 02/16/2043 | | | 1,285,142 | |
| | 6,357,390 | | Series 2014-156(f) | | 6.25% - 1M US L | | 10/20/2044 | | | 902,049 | |
| | 12,239,601 | | Series 2014-3(f) | | 6.10% - 1M US L | | 01/20/2044 | | | 1,796,973 | |
| | 12,738,900 | | Series 2014-4(f) | | 6.10% - 1M US L | | 01/16/2044 | | | 1,713,009 | |
| | 8,829,386 | | Series 2014-5(f) | | 6.15% - 1M US L | | 07/20/2043 | | | 957,297 | |
See Notes to Financial Statements.
| 70 | (888) 848-7569 | www.rivernorth.com |
| RiverNorth/DoubleLine Strategic Income Fund | Schedule of Investments |
September 30, 2018
| Principal Amount/Description | | Rate | | Maturity | | Value | |
| $ | 7,536,019 | | Series 2014-95(f) | | 6.25% - 1M US L | | 06/16/2044 | | $ | 923,878 | |
| | | | | | | | | | | | |
| TOTAL U.S. GOVERNMENT / AGENCY MORTGAGE BACKED SECURITIES (Cost $289,396,733) | | | | | 204,397,955 | |
| Shares/Description | | | | | | Value | |
| SHORT-TERM INVESTMENTS - 5.78% | | | | | | | | |
| Money Market Fund | | | | | | | | |
| | 99,981,380 | | State Street Institutional Trust (7 Day Yield 1.94%) | | | | | | | 99,981,380 | |
| U.S. Treasury | | | | | | | | |
| | 7,500,000 | | United States Treasury Bill(l) | | 1.98% | | 11/01/2018 | | | 7,486,712 | |
| | 1,220,000 | | United States Treasury Bill(l) | | 2.31% | | 03/07/2019 | | | 1,207,896 | |
| | | | | | | | | | | 8,694,608 | |
| | | | | | | | | | | | |
| TOTAL SHORT-TERM INVESTMENTS (Cost $108,676,722) | | | | | 108,675,988 | |
| | | | | | | | | | | | |
| TOTAL INVESTMENTS - 100.40% (Cost $2,013,104,970) | | | | | 1,888,468,844 | |
| CASH SEGREGATED AT CUSTODIAN FOR TOTAL RETURN SWAP CONTRACTS - 0.02% | | | 400,000 | |
| LIABILITIES IN EXCESS OF OTHER ASSETS - (0.42)% | | | (7,902,072 | ) |
| NET ASSETS - 100.00% | | | | $ | 1,880,966,772 | |
Investment Abbreviations:
LIBOR - London Interbank Offered Rate
Libor Rates:
1M US L - 1 Month LIBOR as of September 30, 2018 was 2.26%
3M US L - 3 Month LIBOR as of September 30, 2018 was 2.40%
6M US L - 6 Month LIBOR as of September 30, 2018 was 2.60%
| (a) | Non-income producing security. |
| (b) | Affiliated company. See Note 9 to Notes to Financial Statements. |
| (c) | Security has no contractual maturity date, is not redeemable and contractually pays an indefinite stream of interest. |
| (d) | Securities were purchased pursuant to Regulation S under the Securities Act of 1933, which exempts securities offered and sold outside of the United States from registration. Such securities cannot be sold in the United States without either an effective registration statement filed pursuant to the Securities Act of 1933, or pursuant to an exemption from registration. These securities have been deemed liquid under procedures approved by the Fund's Board of Trustees. As of September 30, 2018, the aggregate fair value of those securities was $20,288,637, representing 1.08% of net assets. |
See Notes to Financial Statements.
| Annual Report | September 30, 2018 | 71 |
| RiverNorth/DoubleLine Strategic Income Fund | Schedule of Investments |
September 30, 2018
| (e) | Security exempt from registration under Rule 144A of the Securities Act of 1933. These securities have been deemed liquid under procedures approved by the Fund's Board of Trustees and may normally be sold to qualified institutional buyers in transactions exempt from registration. Total fair value of Rule 144A securities amounts to $314,547,062, which represents approximately 16.72% of net assets as of September 30, 2018. |
| (f) | Variable rate investment. Interest rates reset periodically. Interest rate shown reflects the rate in effect at September 30, 2018. For securities based on a published reference rate and spread, the reference rate and spread are indicated the description above. Certain variable rate securities are not based on a published reference rate and spread but are determined by the issuer or agent and are based on current market conditions. These securities do not indicate a reference rate and spread in their description above. |
| (g) | Security is currently in default. |
| (h) | Issued with a zero coupon. Income is recognized through the accretion of discount. |
| (i) | All or a portion of this position has not settled as of September 30, 2018. The interest rate shown represents the stated spread over the London Interbank Offered Rate (“LIBOR” or “L”) or the Euro Interbank Offered Rate (“EURIBOR” or “E”) or the applicable LIBOR/EURIBOR floor; the Fund will not accrue interest until the settlement date, at which point LIBOR/EURIBOR will be established. |
| (k) | Step bond. Coupon changes periodically based upon a predetermined schedule. Interest rate disclosed is that which is in effect at September 30, 2018. |
| (l) | Rate shown represents the bond equivalent yield to maturity at date of purchase. |
See Notes to Financial Statements.
| 72 | (888) 848-7569 | www.rivernorth.com |
| RiverNorth/Oaktree High Income Fund | Schedule of Investments |
September 30, 2018
| Shares/Description | | Value |
| CLOSED-END FUNDS - 15.26% | | | | |
| | 54,178 | | BlackRock Corporate High Yield Fund, Inc. | | $ | 569,411 | |
| | 39,089 | | BrandywineGLOBAL Global Income Opportunities Fund, Inc. | | | 426,852 | |
| | 57,526 | | Eaton Vance Limited Duration Income Fund | | | 729,430 | |
| | 3 | | Franklin Limited Duration Income Trust | | | 30 | |
| | 18,664 | | Highland Floating Rate Opportunities Fund | | | 287,799 | |
| | 21,591 | | Invesco High Income Trust II | | | 295,797 | |
| | 199,499 | | Invesco Senior Income Trust | | | 857,846 | |
| | 25,362 | | NexPoint Credit Strategies Fund | | | 568,109 | |
| | 184,184 | | Nuveen Credit Strategies Income Fund | | | 1,467,946 | |
| | 628 | | Nuveen High Income November 2021 Target Term Fund | | | 5,985 | |
| | 33,679 | | PGIM Global Short Duration High Yield Fund, Inc. | | | 467,128 | |
| | 65,934 | | Western Asset Emerging Markets Debt Fund, Inc. | | | 884,834 | |
| | 74,121 | | Western Asset Global High Income Fund, Inc. | | | 675,242 | |
| | 294,108 | | Western Asset High Income Opportunity Fund, Inc. | | | 1,399,954 | |
| | | | | |
| TOTAL CLOSED-END FUNDS (Cost $9,097,717) | | | 8,636,363 | |
| | | | | | | | |
| COMMON STOCKS - 0.01% | | | |
| | 3,002 | | Ultra Petroleum Corp.(a) | | | 3,362 | |
| | | | | |
| TOTAL COMMON STOCKS (Cost $51,695) | | | 3,362 | |
| | | | | | | | |
| CONVERTIBLE PREFERRED STOCKS - 0.01% | | | | |
| | 11 | | Ditech Holding Corp., 0.000%(a)(b)(c) | | | 5,500 | |
| | | | | |
| TOTAL CONVERTIBLE PREFERRED STOCKS (Cost $18,945) | | | 5,500 | |
| | | | | | | | |
| PREFERRED STOCKS - 0.13% | | | | |
| | 75 | | Sequa Corp., 7.000%(a)(d)(e) | | | 75,000 | |
| | | | | |
| TOTAL PREFERRED STOCKS (Cost $75,058) | | | 75,000 | |
| Principal Amount/Description | | Rate | | Maturity | | Value |
| BANK LOANS - 47.87%(f) | | | | | | |
| Canada - 0.87% | | | | | | |
| $ | 197,786 | | 1011778 BC ULC, First Lien B-3 Term Loan | | 1M US L + 2.25%, 1.00% Floor | | 02/16/2024 | | | 198,132 | |
| | 149,666 | | GFL Environmental, Inc., First Lien Effective Date Incremental Term Loan(g) | | 3M US L + 2.75%, 1.00% Floor | | 05/30/2025 | | | 150,041 | |
See Notes to Financial Statements.
| Annual Report | September 30, 2018 | 73 |
| RiverNorth/Oaktree High Income Fund | Schedule of Investments |
September 30, 2018
| Principal Amount/Description | | Rate | | Maturity | | Value |
| $ | 144,931 | | Hudson's Bay Co., First Lien Initial Term Loan | | 1M US L + 3.25%, 1.00% Floor | | 09/30/2022 | | $ | 142,848 | |
| | | | | | | | | | | 491,021 | |
| Denmark -1.50% | | | | | | | | |
| | 229,305 | | Evergood 4 APS, First Lien Facility B1E Term Loan | | 3M EUR L + 3.25% | | 02/06/2025 | | | 267,051 | |
| | 364,560 | | Roy Bidco APS, First Lien Facility B2 Term Loan | | 3M EUR L + 4.50% | | 08/23/2024 | | | 468,634 | |
| | 100,000 | | TDC A/S, First Lien Facility B1 Term Loan | | 3M EUR L + 3.50% | | 06/04/2025 | | | 117,049 | |
| | | | | | | | | | | 852,734 | |
| France - 1.40% | | | | | | | |
| | 100,000 | | Altice France S.A., First Lien USD TLB- [13] Incremental Term Loan | | 1M US L + 4.00% | | 08/14/2026 | | | 99,429 | |
| | 197,500 | | Altice France S.A., First Lien USD TLB-11 Term Loan | | 1M US L + 2.75% | | 07/31/2025 | | | 193,303 | |
| | 300,000 | | Constantin Investissement 4 S.A.S., First Lien Facility B Term Loan | | 3M EUR L + 3.00% | | 04/22/2024 | | | 348,125 | |
| | 130,000 | | Financière Labeyrie Fine Foods, First Lien Facility B Term Loan | | 3M EUR L + 4.25% | | 05/23/2023 | | | 152,352 | |
| | | | | | | | | | | 793,209 | |
| Germany - 0.42% | | | | | | | | |
| | 60,000 | | Blitz F18-675 GmbH, First Lien Facility B2 Term Loan | | 3M EUR L + 3.75% | | 07/31/2025 | | | 70,302 | |
| | 170,000 | | CTC AcquiCo GmbH, First Lien Facility B2 Term Loan | | 3M US L + 3.25% | | 03/07/2025 | | | 169,363 | |
| | | | | | | | | | | 239,665 | |
| Great Britain - 1.84% | | | | | | | | |
| | 210,000 | | Franklin UK Midco, Ltd., First Lien Facility B1 Term Loan | | 3M EUR L + 4.00% | | 12/18/2024 | | | 244,849 | |
| | 130,000 | | Froneri International PLC, First Lien Facility B3 Term Loan | | 1M US L + 3.25% | | 01/31/2025 | | | 170,149 | |
| | 250,000 | | LGC Science Holdings, Ltd., First Lien Facility B3 Term Loan | | 1M US L + 3.50% | | 03/08/2023 | | | 250,312 | |
| | 155,402 | | Richmond UK Holdco, Ltd., First Lien Facility B Term Loan | | 1M US L + 4.25% | | 03/03/2024 | | | 199,539 | |
| | 155,000 | | Survitec Group, Ltd., First Lien Facility B Tranche 2 Term Loan | | 6M EUR L + 4.25% | | 03/12/2022 | | | 175,465 | |
| | | | | | | | | | | 1,040,314 | |
| Luxembourg - 3.02% | | | | | | | |
| | 190,000 | | Alpha Group, SARL, First Lien Facility B Term Loan | | 3M EUR L + 3.75% | | 01/31/2025 | | | 222,186 | |
| | 148,875 | | Altice Financing SA, First Lien October 2017 USD Term Loan | | 1M US L + 2.75% | | 01/31/2026 | | | 145,823 | |
| | 80,000 | | Auris LuxCo, First Lien B Term Loan(g) | | E + 4.00% | | 07/24/2025 | | | 93,967 | |
| | 250,000 | | Auris LuxCo, First Lien B Term Loan(g) | | L + 3.75% | | 07/24/2025 | | | 253,439 | |
See Notes to Financial Statements.
| 74 | (888) 848-7569 | www.rivernorth.com |
| RiverNorth/Oaktree High Income Fund | Schedule of Investments |
September 30, 2018
| Principal Amount/Description | | Rate | | Maturity | | Value |
| $ | 120,000 | | Befesa SA, First Lien Facility B Term Loan | | 6M EUR L + 2.75% | | 12/07/2022 | | $ | 139,861 | |
| | 190,000 | | CCP Lux Holdings S.a. r.l., First Lien Senior EUR Facility B Term Loan | | 3M EUR L + 3.75% | | 01/10/2025 | | | 221,316 | |
| | 175,772 | | Formula One Management, Ltd., First Lien Facility B3 Term Loan | | 1M US L + 2.50%, 1.00% Floor | | 02/01/2024 | | | 174,619 | |
| | 300,000 | | Ino Holdco S.À R.L., First Lien Facility B2 Term Loan | | 2M EUR L + 3.75% | | 08/24/2023 | | | 339,825 | |
| | 100,000 | | Marcel LUX IV SARL, First Lien EUR Term Loan(g) | | E + 4.25% | | 09/26/2025 | | | 117,121 | |
| | | | | | | | | | | 1,708,157 | |
| Netherlands - 2.15% | | | | | | | | |
| | 218,350 | | Diamond B.V., First Lien Initial Euro Term Loan | | 1M EUR L + 3.25% | | 09/06/2024 | | | 250,311 | |
| | 62,806 | | Jacobs Douwe Egberts International BV, First Lien B-5 USD Term Loan | | 3M US L + 2.25% | | 07/01/2022 | | | 63,375 | |
| | 217,250 | | NEP Europe Finco B.V., First Lien Euro Term Loan | | 3M EUR L + 3.00%, 0.75% Floor | | 01/03/2024 | | | 253,709 | |
| | 283,418 | | Peer Holdings III B.V., First Lien Facility B Term Loan | | 3M EUR L + 3.50% | | 03/07/2025 | | | 327,234 | |
| | 250,000 | | Sigma Holdco B.V., First Lien Facility B4 (GBP) Term Loan | | 1M US L + 4.00% | | 07/02/2025 | | | 324,588 | |
| | | | | | | | | | | 1,219,217 | |
| United States - 36.67% | | | | | | | | |
| | 248,888 | | Access CIG LLC, First Lien B Term Loan(g) | | 1M US L + 3.75% | | 02/27/2025 | | | 250,600 | |
| | 339,669 | | Acuity Specialty Products, Inc., First Lien Initial Term Loan | | 3M US L + 4.00%, 1.00% Floor | | 08/12/2024 | | | 324,172 | |
| | 149,625 | | Adtalem Global Education, Inc., First Lien B Term Loan | | 1M US L + 3.00% | | 04/11/2025 | | | 150,934 | |
| | 39,400 | | AI Aqua Merger Sub, Inc., First Lien Tranche B-1 Term Loan | | 1M US L + 3.25%, 1.00% Floor | | 12/13/2023 | | | 39,498 | |
| | 197,493 | | Air Medical Group Holdings, Inc., First Lien 2018 Term Loan | | 1M US L + 3.25%, 1.00% Floor | | 04/28/2022 | | | 194,708 | |
| | 78,600 | | A-L Parent LLC, First Lien Initial Term Loan | | 1M US L + 3.25%, 1.00% Floor | | 12/01/2023 | | | 79,582 | |
| | 97,336 | | Allnex & Cy S.C.A., First Lien Tranche B-2 Term Loan | | 3M US L + 3.25%, 0.75% Floor | | 09/13/2023 | | | 97,884 | |
| | 98,750 | | Altice US Finance I Corp., First Lien March 2017 Refinancing Term Loan | | 1M US L + 2.25% | | 07/28/2025 | | | 98,861 | |
| | 103,425 | | American Builders & Contractors Supply Co., Inc., First Lien B-2 Term Loan | | 1M US L + 2.00%, 0.75% Floor | | 10/31/2023 | | | 103,260 | |
| | 245,559 | | American Renal Holdings, Inc., First Lien B Term Loan | | 1M US L + 3.25% | | 06/21/2024 | | | 244,209 | |
| | 248,750 | | American Rock Salt Co. LLC, First Lien Initial Term Loan | | 1M US L + 3.75%, 1.00% Floor | | 03/21/2025 | | | 250,927 | |
See Notes to Financial Statements.
| Annual Report | September 30, 2018 | 75 |
| RiverNorth/Oaktree High Income Fund | Schedule of Investments |
September 30, 2018
| Principal Amount/Description | | Rate | | Maturity | | Value |
| $ | 148,500 | | Applied Systems, Inc., First Lien Initial Term Loan | | 3M US L + 3.00%, 1.00% Floor | | 09/19/2024 | | $ | 149,542 | |
| | 233,166 | | Aramark Intermediate HoldCo Corp., First Lien U.S. B-3 Term Loan | | 3M US L + 1.75% | | 03/11/2025 | | | 234,186 | |
| | 99,000 | | Ascend Learning LLC, First Lien Initial Term Loan | | 1M US L + 3.00%, 1.00% Floor | | 07/12/2024 | | | 99,216 | |
| | 175,191 | | Asurion LLC, First Lien Amendment No. 14 Replacement B-4 Term Loan | | 1M US L + 3.00% | | 08/04/2022 | | | 176,834 | |
| | 248,125 | | Avantor, Inc., First Lien Initial Dollar Term Loan | | 1M US L + 4.00%, 1.00% Floor | | 11/21/2024 | | | 251,440 | |
| | 169,257 | | Aveanna Healthcare LLC, First Lien Initial Term Loan | | 1M US L + 4.25%, 1.00% Floor | | 03/18/2024 | | | 167,776 | |
| | 995,000 | | Axalta Coating Systems Dutch Holding B B.V., First Lien B-3 Dollar Term Loan | | 3M US L + 1.75% | | 06/01/2024 | | | 998,224 | |
| | 148,500 | | Badger Finance LLC, First Lien 2018 Refinancing Term Loan | | 1M US L + 3.50%, 1.00% Floor | | 09/30/2024 | | | 148,129 | |
| | 361,350 | | Bass Pro Group LLC, First Lien Initial Term Loan | | 1M US L + 5.00%, 0.75% Floor | | 09/25/2024 | | | 365,415 | |
| | 183,000 | | BCP Renaissance Parent LLC, First Lien Initial Term Loan | | 3M US L + 3.50%, 1.00% Floor | | 10/31/2024 | | | 184,385 | |
| | 199,000 | | Beacon Roofing Supply, Inc., First Lien Initial Term Loan | | 1M US L + 2.25% | | 01/02/2025 | | | 198,916 | |
| | 148,875 | | Belron Finance US LLC, First Lien Initial B Term Loan | | 3M US L + 2.50% | | 11/07/2024 | | | 149,899 | |
| | 99,000 | | Big River Steel LLC, First Lien Closing Date Term Loan | | 3M US L + 5.00%, 1.00% Floor | | 08/23/2023 | | | 100,671 | |
| | 248,128 | | Boing US Holdco, Inc., First Lien B Term Loan | | 3M US L + 3.25%, 1.00% Floor | | 10/03/2024 | | | 249,679 | |
| | 91,156 | | Boyd Gaming Corp., First Lien Refinancing B Term Loan | | 1W US L + 2.25% | | 09/15/2023 | | | 91,742 | |
| | 250,000 | | Bracket Intermediate Holding Corp., First Lien Initial Term Loan(g) | | 3M US L + 4.25% | | 09/05/2025 | | | 250,625 | |
| | 250,000 | | Brookfield WEC Holdings, Inc., First Lien Initial Term Loan | | 1M US L + 3.75%, 0.75% Floor | | 08/01/2025 | | | 253,391 | |
| | 100,000 | | Brookfield WEC Holdings, Inc., Second Lien Initial Term Loan | | 1M US L + 6.75%, 0.75% Floor | | 08/03/2026 | | | 102,075 | |
| | 248,125 | | Caesars Resort Collection LLC, First Lien B Term Loan | | 1M US L + 2.75% | | 12/23/2024 | | | 249,763 | |
| | 78,410 | | Camelot U.S. Acquisition 1 Co., First Lien New Term Loan | | 1M US L + 3.25%, 1.00% Floor | | 10/03/2023 | | | 78,573 | |
| | 141,254 | | Canyon Valor Cos., Inc., First Lien Initial Dollar Term Loan | | 3M US L + 3.25% | | 06/16/2023 | | | 142,186 | |
| | 128,700 | | Canyon Valor Cos., Inc., First Lien Initial Euro Term Loan | | 3M EUR L + 3.50% | | 06/16/2023 | | | 150,735 | |
| | 98,500 | | Caraustar Industries, Inc., First Lien Refinancing Term Loan | | 3M US L + 5.50%, 1.00% Floor | | 03/14/2022 | | | 99,503 | |
See Notes to Financial Statements.
| 76 | (888) 848-7569 | www.rivernorth.com |
| RiverNorth/Oaktree High Income Fund | Schedule of Investments |
September 30, 2018
| Principal Amount/Description | | Rate | | Maturity | | Value |
| $ | 221,608 | | Cengage Learning, Inc., First Lien 2016 Refinancing Term Loan | | 1M US L + 4.25%, 1.00% Floor | | 06/07/2023 | | $ | 207,666 | |
| | 297,750 | | CenturyLink, Inc., First Lien Initial B Term Loan | | 1M US L + 2.75% | | 01/31/2025 | | | 296,038 | |
| | 128,033 | | CEOC LLC, First Lien B Term Loan | | 1M US L + 2.00% | | 10/07/2024 | | | 128,133 | |
| | 248,125 | | Charter Communications Operating LLC, First Lien B Term Loan | | 1M US L + 2.00% | | 04/30/2025 | | | 248,774 | |
| | 99,496 | | Charter NEX US, Inc., First Lien Initial Term Loan | | 1M US L + 3.00%, 1.00% Floor | | 05/16/2024 | | | 99,683 | |
| | 149,250 | | CHG Healthcare Services, Inc., First Lien 2017 New Term Loan | | 1M US L + 3.00%, 1.00% Floor | | 06/07/2023 | | | 150,346 | |
| | 149,625 | | Cogeco Communications II LP, First Lien B Term Loan | | 1M US L + 2.375% | | 01/03/2025 | | | 149,794 | |
| | 295,724 | | Communications Sales & Leasing, Inc., First Lien Shortfall Term Loan | | 1M US L + 3.00%, 1.00% Floor | | 10/24/2022 | | | 283,414 | |
| | 249,375 | | Covia Holdings Corp., First Lien Initial Term Loan | | 1M US L + 3.75%, 1.00% Floor | | 06/01/2025 | | | 236,490 | |
| | 249,375 | | CSC Holdings LLC, First Lien January 2018 Incremental Term Loan | | 1M US L + 2.50% | | 01/25/2026 | | | 250,674 | |
| | 204,987 | | CWGS Group LLC, First Lien Term Loan | | 1M US L + 2.75%, 0.75% Floor | | 11/08/2023 | | | 201,759 | |
| | 197,500 | | Cypress Intermediate Holdings III, Inc., First Lien Initial Term Loan | | 1M US L + 3.00%, 1.00% Floor | | 04/29/2024 | | | 198,562 | |
| | 90,000 | | David's Bridal, Inc., First Lien Initial Term Loan | | 3M US L + 4.00%, 1.25% Floor | | 10/11/2019 | | | 80,241 | |
| | 149,250 | | EG Group, Ltd., First Lien Additional Facility Term Loan | | 3M US L + 4.00% | | 02/07/2025 | | | 149,740 | |
| | 28,757 | | Emmis Operating Co., First Lien Term Loan | | 1M US L + 7.00%, 1.00% Floor | | 04/18/2019 | | | 28,577 | |
| | 250,000 | | Envision Healthcare Corp., First Lien Term Loan(g) | | L + 3.75% | | 09/26/2025 | | | 248,750 | |
| | 290,770 | | Envision Healthcare Corp., First Lien Initial Term Loan | | 1M US L + 3.00%, 0.75% Floor | | 12/01/2023 | | | 291,212 | |
| | 98,253 | | ExamWorks Group, Inc., First Lien B-1 Term Loan | | 1M US L + 3.25%, 1.00% Floor | | 07/27/2023 | | | 99,162 | |
| | 98,737 | | Explorer Holdings, Inc., First Lien Initial Term Loan | | 3M US L + 3.75%, 1.00% Floor | | 05/02/2023 | | | 99,540 | |
| | 250,000 | | Financial & Risk US Holdings, Inc., First Lien Initial Dollar Term Loan(g) | | L + 3.75% | | 09/18/2025 | | | 249,740 | |
| | 100,000 | | Financial & Risk US Holdings, Inc., First Lien Initial Euro Term Loan(g) | | E + 4.00% | | 09/18/2025 | | | 116,970 | |
| | 249,375 | | Flynn Restaurant Group LP, First Lien Initial Term Loan | | 1M US L + 3.50% | | 06/27/2025 | | | 248,907 | |
| | 125,000 | | Flynn Restaurant Group LP, Second Lien Initial Term Loan | | 1M US L + 7.00% | | 06/29/2026 | | | 124,688 | |
| | 250,000 | | Franklin Square Holdings LP, First Lien Initial Term Loan | | 1M US L + 2.50% | | 08/01/2025 | | | 251,720 | |
See Notes to Financial Statements.
| Annual Report | September 30, 2018 | 77 |
| RiverNorth/Oaktree High Income Fund | Schedule of Investments |
September 30, 2018
| Principal Amount/Description | | Rate | | Maturity | | Value |
| $ | 250,000 | | Gentiva Health Services, Inc., First Lien Closing Date Initial Term Loan | | 1M US L + 3.75% | | 07/02/2025 | | $ | 253,281 | |
| | 150,000 | | GIP III Stetson I LP, First Lien Initial Term Loan | | 2M US L + 4.25% | | 07/18/2025 | | | 151,078 | |
| | 250,000 | | GlobalLogic Holdings, Inc., First Lien Initial Term Loan(g) | | 1M US L + 3.25% | | 08/01/2025 | | | 252,422 | |
| | 157,471 | | GOBP Holdings, Inc., First Lien Incremental Term Loan | | 1M US L + 3.50%, 1.00% Floor | | 10/21/2021 | | | 157,987 | |
| | 216,637 | | Golden Nugget, Inc., First Lien Initial B Term Loan | | 1M US L + 2.75%, 0.75% Floor | | 10/04/2023 | | | 217,720 | |
| | 246,875 | | Graftech International, Ltd., First Lien Initial Term Loan | | 1M US L + 3.50%, 1.00% Floor | | 02/12/2025 | | | 248,881 | |
| | 163,089 | | Greeneden US Holdings II LLC, First Lien Tranche B-3 Dollar Term Loan | | 1M US L + 3.50% | | 12/01/2023 | | | 164,149 | |
| | 99,250 | | Greenrock Finance, Inc., First Lien Initial USD B Term Loan | | 1M US L + 3.50%, 1.00% Floor | | 06/28/2024 | | | 99,643 | |
| | 215,595 | | HD Supply, Inc., First Lien B-3 Term Loan | | 1M US L + 2.25% | | 08/13/2021 | | | 217,751 | |
| | 149,625 | | Hub International, Ltd., First Lien Initial Term Loan | | 3M US L + 3.00% | | 04/25/2025 | | | 150,110 | |
| | 8,250 | | Innoviva, Inc., First Lien Initial Term Loan | | 3M US L + 4.50%, 1.00% Floor | | 08/18/2022 | | | 8,291 | |
| | 664,391 | | Jaguar Holding Co. II, First Lien 2018 Term Loan | | 1M US L + 2.50%, 1.00% Floor | | 08/18/2022 | | | 665,713 | |
| | 230,331 | | JBS USA LUX SA, First Lien Initial Term Loan | | 3M US L + 2.50%, 0.75% Floor | | 10/30/2022 | | | 231,178 | |
| | 243,579 | | Life Time Fitness, Inc., First Lien 2017 Refinancing Term Loan | | 3M US L + 2.75%, 1.00% Floor | | 06/10/2022 | | | 244,963 | |
| | 12,865 | | MA FinanceCo LLC, First Lien Tranche B-3 Term Loan | | 1M US L + 2.50% | | 06/21/2024 | | | 12,847 | |
| | 149,625 | | Mayfield Agency Borrower, Inc., First Lien B Term Loan | | 1M US L + 4.50% | | 02/28/2025 | | | 150,747 | |
| | 297,000 | | McAfee LLC, First Lien Closing Date USD Term Loan | | 1M US L + 4.50%, 1.00% Floor | | 09/30/2024 | | | 299,811 | |
| | 38,028 | | Monitronics International, Inc., First Lien B-2 Term Loan | | 3M US L + 5.50%, 1.00% Floor | | 09/30/2022 | | | 37,192 | |
| | 99,250 | | MRC Global, Inc., First Lien 2018 Refinancing Term Loan | | 1M US L + 3.00% | | 09/20/2024 | | | 100,056 | |
| | 61,375 | | MTL Publishing LLC, First Lien B-6 Term Loan | | 1M US L + 2.25% | | 08/20/2023 | | | 61,519 | |
| | 248,750 | | NVA Holdings, Inc., First Lien B-3 Term Loan | | 1M US L + 2.75%, 1.00% Floor | | 02/02/2025 | | | 248,322 | |
| | 99,251 | | Odyssey Logistics & Technology Corp., First Lien New Term Loan | | 1M US L + 3.75%, 1.00% Floor | | 10/12/2024 | | | 99,872 | |
| | 98,500 | | Onvoy LLC, First Lien Initial Term Loan | | 3M US L + 4.50%, 1.00% Floor | | 02/10/2024 | | | 96,592 | |
See Notes to Financial Statements.
| 78 | (888) 848-7569 | www.rivernorth.com |
| RiverNorth/Oaktree High Income Fund | Schedule of Investments |
September 30, 2018
| Principal Amount/Description | | Rate | | Maturity | | Value |
| $ | 98,707 | | Optiv, Inc., First Lien Initial Term Loan | | 1M US L + 3.25%, 1.00% Floor | | 02/01/2024 | | $ | 96,270 | |
| | 41,745 | | OSG Bulk Ships, Inc., First Lien Initial Term Loan | | 3M US L + 4.25%, 1.00% Floor | | 08/05/2019 | | | 41,432 | |
| | 149,397 | | Pearl Intermediate Parent LLC, First Lien Initial Term Loan(g) | | 1M US L + 2.75% | | 02/14/2025 | | | 148,043 | |
| | 98,751 | | Playa Resorts Holding B.V., First Lien Initial Term Loan | | 1M US L + 2.75%, 1.00% Floor | | 04/29/2024 | | | 98,146 | |
| | 197,500 | | Post Holdings, Inc., First Lien Series A Incremental Term Loan | | 1M US L + 2.00% | | 05/24/2024 | | | 197,817 | |
| | 248,348 | | Recess Holdings, Inc., First Lien Initial Term Loan(g) | | 3M US L + 3.75%, 1.00% Floor | | 09/30/2024 | | | 250,755 | |
| | 198,500 | | Ring Container Technologies Group LLC, First Lien Initial Term Loan | | 1M US L + 2.75% | | 10/31/2024 | | | 199,058 | |
| | 95,985 | | RPI Finance Trust, First Lien Initial B -6 Term Loan | | 3M US L + 2.00% | | 03/27/2023 | | | 96,439 | |
| | 149,250 | | Scientific Games International, Inc., First Lien Initial B-5 Term Loan | | 1M US L + 2.75% | | 08/14/2024 | | | 149,192 | |
| | 86,884 | | Seattle SpinCo, Inc., First Lien Initial Term Loan | | 1M US L + 2.50% | | 06/21/2024 | | | 86,757 | |
| | 148,875 | | Securus Technologies Holdings, Inc., First Lien Initial Term Loan | | 1M US L + 4.50%, 1.00% Floor | | 11/01/2024 | | | 149,470 | |
| | 250,000 | | Sedgwick Claims Management Services, Inc., Second Lien Initial Term Loan | | 3M US L +5.75%, 1.00% Floor | | 02/28/2022 | | | 251,407 | |
| | 68,223 | | Servicemaster Co., LLC, First Lien Tranche C Term Loan | | 1M US L + 2.50% | | 11/08/2023 | | | 68,906 | |
| | 108,701 | | SIG Combibloc Holdings S.C.A., First Lien Initial Dollar Term Loan | | 3M US L + 1.75%, 1.00% Floor | | 03/11/2022 | | | 109,003 | |
| | 248,125 | | SolarWinds Holdings, Inc., First Lien 2018 Refinancing Term Loan | | 1M US L + 3.00% | | 02/05/2024 | | | 249,866 | |
| | 250,000 | | St. George's University Scholastic Services LLC, First Lien Term Loan(g) | | 1M US L + 3.50% | | 07/17/2025 | | | 253,125 | |
| | 246,243 | | St. Joseph Energy Center LLC, First Lien B Advance Term Loan | | 3M US L + 3.50%, 1.00% Floor | | 04/10/2025 | | | 248,551 | |
| | 123,920 | | Staples, Inc., First Lien Closing Date Term Loan | | 3M US L + 4.00%, 1.00% Floor | | 09/12/2024 | | | 124,127 | |
| | 148,875 | | Strategic Materials Holding Corp., First Lien Initial Term Loan | | 3M US L + 3.75%, 1.00% Floor | | 11/01/2024 | | | 142,672 | |
| | 250,000 | | SuperMoose Borrower LLC, First Lien Initial Term Loan(g) | | 1M US L + 3.75% | | 08/29/2025 | | | 251,875 | |
| | 98,500 | | Team Health Holdings, Inc., First Lien Initial Term Loan | | 1M US L + 2.75%, 1.00% Floor | | 02/06/2024 | | | 95,976 | |
| | 40,538 | | Toys R Us Property Co. I LLC(h) | | 1M US L + 5.00%, 1.00% Floor | | 08/21/2019 | | | 35,200 | |
| | 106,708 | | Trans Union LLC, First Lien 2017 Replacement B-3 Term Loan | | 1M US L + 2.00% | | 04/10/2023 | | | 107,075 | |
See Notes to Financial Statements.
| Annual Report | September 30, 2018 | 79 |
| RiverNorth/Oaktree High Income Fund | Schedule of Investments |
September 30, 2018
| Principal Amount/Description | | Rate | | Maturity | | | Value | |
| $ | 444,574 | | | Transdigm, Inc., First Lien 2018 New Tranche E Term Loan | | 1M US L + 2.50% | | | 05/30/2025 | | | $ | 446,347 | |
| | 168,000 | | | Traverse Midstream Partners LLC, First Lien Advance Term Loan | | 3M US L + 4.00%, 1.00% Floor | | | 09/27/2024 | | | | 169,488 | |
| | 170,188 | | | US Renal Care, Inc., First Lien Initial Term Loan | | 3M US L + 4.25%, 1.00% Floor | | | 12/30/2022 | | | | 166,252 | |
| | 148,413 | | | UTEX Industries, Inc., First Lien Initial Term Loan | | 1M US L + 4.00%, 1.00% Floor | | | 05/21/2021 | | | | 147,299 | |
| | 500,000 | | | Verscend Holding Corp., First Lien B Term Loan | | 1M US L + 4.50% | | | 08/27/2025 | | | | 505,105 | |
| | 36,536 | | | Vestcom Parent Holdings, Inc., First Lien L/C Collaterilized Term Loan | | 1M US L + 4.00%, 1.00% Floor | | | 12/19/2023 | | | | 36,719 | |
| | 228,263 | | | Windstream Services LLC, First Lien 2016 Tranche B-6 Term Loan | | 1M US L + 4.00%, 0.75% Floor | | | 03/29/2021 | | | | 218,847 | |
| | 149,037 | | | YI LLC, First Lien Initial Term Loan(g) | | 3M US L + 4.00%, 1.00% Floor | | | 11/07/2024 | | | | 149,037 | |
| | 133,576 | | | York Risk Services Holding Corp., First Lien Term Loan | | 1M US L + 3.75%, 1.00% Floor | | | 10/01/2021 | | | | 129,764 | |
| | | | | | | | | | | | | | 20,758,265 | |
| | | | | | | | | | | | | | | |
| TOTAL BANK LOANS (Cost $27,068,363) | | | | | | | | | 27,102,582 | |
| Principal Amount/Description | | Rate | | Maturity | | | Value | |
| HIGH YIELD DEBT- 32.46% | | | | | | | | | | | |
| Australia- 0.08% | | | | | | | | | | | |
| $ | 50,000 | | | Nufarm Australia, Ltd. / Nufarm Americas, Inc.(i) | | | 5.75% | | | 04/30/2026 | | | | 47,438 | |
| Canada - 1.73% | | | | | | | | | | | |
| | 45,000 | | | 1011778 BC ULC / New Red Finance, Inc.(i) | | | 5.00% | | | 10/15/2025 | | | | 43,200 | |
| | 25,000 | | | Baffinland Iron Mines Corp. / Baffinland Iron Mines LP(i) | | | 8.75% | | | 07/15/2026 | | | | 25,187 | |
| | 115,000 | | | Bausch Health Cos., Inc.(i) | | | 5.63% | | | 12/01/2021 | | | | 115,000 | |
| | 120,000 | | | Bausch Health Cos., Inc.(i) | | | 5.88% | | | 05/15/2023 | | | | 116,940 | |
| | 40,000 | | | Bausch Health Cos., Inc.(i) | | | 5.50% | | | 11/01/2025 | | | | 40,080 | |
| | 40,000 | | | Baytex Energy Corp.(i) | | | 5.13% | | | 06/01/2021 | | | | 39,600 | |
| | 100,000 | | | Cascades, Inc.(i) | | | 5.50% | | | 07/15/2022 | | | | 101,250 | |
| | 11,000 | | | Cascades, Inc.(i) | | | 5.75% | | | 07/15/2023 | | | | 11,055 | |
| | 60,000 | | | Eldorado Gold Corp.(i) | | | 6.13% | | | 12/15/2020 | | | | 57,150 | |
| | 25,000 | | | First Quantum Minerals, Ltd.(i) | | | 7.25% | | | 05/15/2022 | | | | 24,563 | |
| | 20,000 | | | First Quantum Minerals, Ltd.(i) | | | 7.25% | | | 04/01/2023 | | | | 19,100 | |
| | 60,000 | | | goeasy, Ltd.(i) | | | 7.88% | | | 11/01/2022 | | | | 62,625 | |
| | 15,000 | | | MEG Energy Corp.(i) | | | 6.38% | | | 01/30/2023 | | | | 13,725 | |
| | 35,000 | | | Mercer International, Inc. | | | 5.50% | | | 01/15/2026 | | | | 34,388 | |
See Notes to Financial Statements.
| 80 | (888) 848-7569 | www.rivernorth.com |
| RiverNorth/Oaktree High Income Fund | Schedule of Investments |
September 30, 2018
| Principal Amount/Description | | Rate | | Maturity | | Value | |
| $ | 35,000 | | | New Gold, Inc.(i) | | | 6.25% | | | 11/15/2022 | | $ | 30,800 | |
| | 10,000 | | | New Gold, Inc.(i) | | | 6.38% | | | 05/15/2025 | | | 8,350 | |
| | 60,000 | | | Open Text Corp.(i) | | | 5.63% | | | 01/15/2023 | | | 61,200 | |
| | 35,000 | | | Precision Drilling Corp. | | | 7.75% | | | 12/15/2023 | | | 37,188 | |
| | 30,000 | | | Precision Drilling Corp.(i) | | | 7.13% | | | 01/15/2026 | | | 30,900 | |
| | 50,000 | | | Ritchie Bros Auctioneers, Inc.(i) | | | 5.38% | | | 01/15/2025 | | | 50,225 | |
| | 55,000 | | | Vermilion Energy, Inc.(i) | | | 5.63% | | | 03/15/2025 | | | 54,931 | |
| | | | | | | | | | | | | | 977,457 | |
| Cayman Islands - 0.19% | | | | | | | | | | |
| | 90,000 | | | UPCB Finance IV, Ltd.(j) | | | 4.00% | | | 01/15/2027 | | | 108,136 | |
| | | | | | | | | | | | | | | |
| Denmark- 0.22% | | | | | | | | | | |
| | 100,000 | | | DKT Finance ApS(j) | | | 7.00% | | | 06/17/2023 | | | 124,306 | |
| | | | | | | | | | | | | | | |
| France - 0.82% | | | | | | | | | | |
| | 100,000 | | | Altice France SA(j) | | | 5.63% | | | 05/15/2024 | | | 121,613 | |
| | 100,000 | | | Constantin Investissement 3 SASU(j) | | | 5.38% | | | 04/15/2025 | | | 115,561 | |
| | 100,000 | | | La Financiere Atalian SASU(j) | | | 5.13% | | | 05/15/2025 | | | 114,491 | |
| | 100,000 | | | Picard Groupe SAS(f)(j) | | | 3M EUR L + 3.00% | | | 11/30/2023 | | | 115,211 | |
| | | | | | | | | | | | | | 466,876 | |
| Germany- 1.05% | | | | | | | | | | |
| | 100,000 | | | Blitz F18-674 GmbH(j) | | | 6.00% | | | 07/30/2026 | | | 117,477 | |
| | 100,000 | | | Nidda BondCo GmbH(j) | | | 5.00% | | | 09/30/2025 | | | 115,326 | |
| | 120,000 | | | Nidda Healthcare Holding GmbH(j) | | | 3.50% | | | 09/30/2024 | | | 139,749 | |
| | 100,000 | | | Tele Columbus AG(j) | | | 3.88% | | | 05/02/2025 | | | 106,345 | |
| | 100,000 | | | WEPA Hygieneprodukte GmbH(j) | | | 3.75% | | | 05/15/2024 | | | 115,142 | |
| | | | | | | | | | | | | | 594,039 | |
| Great Britain - 0.37% | | | | | | | | | | |
| | 5,000 | | | Ensco PLC | | | 5.20% | | | 03/15/2025 | | | 4,369 | |
| | 20,000 | | | Ensco PLC | | | 7.75% | | | 02/01/2026 | | | 19,925 | |
| | 5,000 | | | Ensco PLC | | | 5.75% | | | 10/01/2044 | | | 3,756 | |
| | 65,000 | | | Tronox Finance PLC(i) | | | 5.75% | | | 10/01/2025 | | | 60,450 | |
| | 90,000 | | | Virgin Media Secured Finance PLC(j) | | | 5.50% | | | 01/15/2025 | | | 120,681 | |
| | | | | | | | | | | | | | 209,181 | |
| Ireland - 0.62% | | | | | | | | | | |
| | 10,000 | | | Avolon Holdings Funding, Ltd.(i) | | | 5.50% | | | 01/15/2023 | | | 10,175 | |
| | 100,000 | | | James Hardie International Finance DAC(i) | | | 3.63% | | | 10/01/2026 | | | 117,695 | |
| | 35,000 | | | Park Aerospace Holdings, Ltd.(i) | | | 5.25% | | | 08/15/2022 | | | 35,481 | |
| | 30,000 | | | Park Aerospace Holdings, Ltd.(i) | | | 4.50% | | | 03/15/2023 | | | 29,363 | |
| | 25,000 | | | Park Aerospace Holdings, Ltd.(i) | | | 5.50% | | | 02/15/2024 | | | 25,656 | |
| | 100,000 | | | Virgin Media Receivables Financing Notes I DAC(j) | | | 5.50% | | | 09/15/2024 | | | 131,113 | |
| | | | | | | | | | | | | | 349,483 | |
See Notes to Financial Statements.
| Annual Report | September 30, 2018 | 81 |
| RiverNorth/Oaktree High Income Fund | Schedule of Investments |
September 30, 2018
| Principal Amount/Description | | Rate | | Maturity | | | Value | |
| Italy - 1.24% | | | | | | | | |
| $ | 100,000 | | | Bormioli Pharma Bidco SpA(f)(j) | | | 3M EUR L + 3.50% | | | 11/15/2024 | | | $ | 113,336 | |
| | 100,000 | | | Guala Closures SPA(i) | | | 3.50% | | | 04/15/2024 | | | | 116,915 | |
| | 100,000 | | | LKQ Italia Bondco SpA(j) | | | 3.88% | | | 04/01/2024 | | | | 123,271 | |
| | 120,000 | | | Nexi Capital SPA(i) | | | 4.13% | | | 11/01/2023 | | | | 140,830 | |
| | 170,000 | | | Telecom Italia SpA | | | 3.63% | | | 01/19/2024 | | | | 209,619 | |
| | | | | | | | | | | | | | | 703,971 | |
| Jersey - 0.65% | | | | | | | | | | | |
| | 100,000 | | | AA Bond Co., Ltd.(j) | | | 5.50% | | | 07/31/2022 | | | | 119,929 | |
| | 100,000 | | | CPUK Finance, Ltd.(j) | | | 4.25% | | | 08/28/2022 | | | | 130,639 | |
| | 100,000 | | | LHC3 PLC(i)(k) | | | 4.13% (9.00%) | | | 08/15/2024 | | | | 116,284 | |
| | | | | | | | | | | | | | | 366,852 | |
| Luxembourg - 1.83% | | | | | | | | | | | |
| | 120,000 | | | Altice Financing SA(j) | | | 5.25% | | | 02/15/2023 | | | | 145,119 | |
| | 105,000 | | | Altice Luxembourg SA(j) | | | 6.25% | | | 02/15/2025 | | | | 114,138 | |
| | 150,000 | | | ARD Finance SA(k) | | | 6.63% (7.375%) | | | 09/15/2023 | | | | 179,924 | |
| | 65,000 | | | Dana Financing Luxembourg Sarl(i) | | | 5.75% | | | 04/15/2025 | | | | 64,005 | |
| | 80,000 | | | Intelsat Jackson Holdings SA(i) | | | 8.00% | | | 02/15/2024 | | | | 84,377 | |
| | 75,000 | | | Intelsat Jackson Holdings SA(i) | | | 8.50% | | | 10/15/2024 | | | | 75,750 | |
| | 100,000 | | | Samsonite Finco Sarl(j) | | | 3.50% | | | 05/15/2026 | | | | 113,328 | |
| | 100,000 | | | SES SA(b)(f) | | | 4.63% | | | 12/31/2049 | | | | 120,860 | |
| | 25,000 | | | Telecom Italia Capital SA | | | 6.38% | | | 11/15/2033 | | | | 24,625 | |
| | 90,000 | | | Telenet Finance VI Luxembourg SCA(j) | | | 4.88% | | | 07/15/2027 | | | | 113,410 | |
| | | | | | | | | | | | | | | 1,035,536 | |
| Netherlands - 1.44% | | | | | | | | | | | |
| | 100,000 | | | Diamond BC BV(i) | | | 5.63% | | | 08/15/2025 | | | | 108,969 | |
| | 100,000 | | | Energizer Gamma Acquisition BV(i) | | | 4.63% | | | 07/15/2026 | | | | 120,828 | |
| | 100,000 | | | InterXion Holding NV(i) | | | 4.75% | | | 06/15/2025 | | | | 121,971 | |
| | 100,000 | | | Sigma Holdco BV(j) | | | 5.75% | | | 05/15/2026 | | | | 109,847 | |
| | 35,000 | | | Stars Group Holdings BV / Stars Group US Co.-Borrower LLC(i) | | | 7.00% | | | 07/15/2026 | | | | 36,197 | |
| | 100,000 | | | Telefonica Europe BV(b)(f) | | | 3.75% | | | 12/31/2049 | | | | 118,994 | |
| | 175,000 | | | Ziggo Bond Finance BV(j) | | | 4.63% | | | 01/15/2025 | | | | 201,904 | |
| | | | | | | | | | | | | | | 818,710 | |
| Spain - 0.49% | | | | | | | | | | | |
| | 135,000 | | | Grifols SA(i) | | | 3.20% | | | 05/01/2025 | | | | 159,289 | |
| | 100,000 | | | Grifols SA(j) | | | 3.20% | | | 05/01/2025 | | | | 117,992 | |
| | | | | | | | | | | | | | | 277,281 | |
| Sweden - 0.21% | | | | | | | | | | | |
| | 100,000 | | | Verisure Midholding AB(j) | | | 5.75% | | | 12/01/2023 | | | | 118,036 | |
| | | | | | | | | | | | | | | | |
| United States - 21.52% | | | | | | | | | | | |
| | 65,000 | | | Acadia Healthcare Co., Inc. | | | 5.13% | | | 07/01/2022 | | | | 65,162 | |
| | 30,000 | | | Acadia Healthcare Co., Inc. | | | 5.63% | | | 02/15/2023 | | | | 30,300 | |
| | 25,000 | | | Acadia Healthcare Co., Inc. | | | 6.50% | | | 03/01/2024 | | | | 25,969 | |
See Notes to Financial Statements.
| 82 | (888) 848-7569 | www.rivernorth.com |
| RiverNorth/Oaktree High Income Fund | Schedule of Investments |
September 30, 2018
| Principal Amount/Description | | Rate | | Maturity | | | Value | |
| $ | 75,000 | | | ACCO Brands Corp.(i) | | | 5.25% | | | 12/15/2024 | | | $ | 74,900 | |
| | 35,000 | | | AES Corp. | | | 4.50% | | | 03/15/2023 | | | | 35,131 | |
| | 75,000 | | | AES Corp. | | | 6.00% | | | 05/15/2026 | | | | 79,406 | |
| | 55,000 | | | Albertsons Cos. LLC / Safeway, Inc. / New Albertsons LP / Albertson's LLC | | | 6.63% | | | 06/15/2024 | | | | 53,144 | |
| | 45,000 | | | Albertsons Cos. LLC / Safeway, Inc. / New Albertsons LP / Albertson's LLC | | | 5.75% | | | 03/15/2025 | | | | 40,500 | |
| | 55,000 | | | Allison Transmission, Inc.(i) | | | 5.00% | | | 10/01/2024 | | | | 54,862 | |
| | 75,000 | | | American Builders & Contractors Supply Co., Inc.(i) | | | 5.75% | | | 12/15/2023 | | | | 76,781 | |
| | 40,000 | | | American Builders & Contractors Supply Co., Inc.(i) | | | 5.88% | | | 05/15/2026 | | | | 40,250 | |
| | 60,000 | | | AmeriGas Partners LP / AmeriGas Finance Corp. | | | 5.63% | | | 05/20/2024 | | | | 59,850 | |
| | 45,000 | | | APX Group, Inc. | | | 7.88% | | | 12/01/2022 | | | | 46,012 | |
| | 60,000 | | | Ascent Resources Utica Holdings LLC /ARU Finance Corp.(i) | | | 7.00% | | | 11/01/2026 | | | | 59,745 | |
| | 40,000 | | | Avis Budget Car Rental LLC / Avis Budget Finance, Inc. | | | 5.50% | | | 04/01/2023 | | | | 39,938 | |
| | 100,000 | | | Axalta Coating Systems LLC(j) | | | 4.25% | | | 08/15/2024 | | | | 121,984 | |
| | 5,000 | | | B&G Foods, Inc. | | | 4.63% | | | 06/01/2021 | | | | 5,012 | |
| | 50,000 | | | B&G Foods, Inc. | | | 5.25% | | | 04/01/2025 | | | | 48,053 | |
| | 50,000 | | | Bausch Health Cos., Inc.(i) | | | 5.50% | | | 03/01/2023 | | | | 48,288 | |
| | 35,000 | | | BBA US Holdings, Inc.(i) | | | 5.38% | | | 05/01/2026 | | | | 35,219 | |
| | 50,000 | | | Beacon Roofing Supply, Inc.(i) | | | 4.88% | | | 11/01/2025 | | | | 46,250 | |
| | 35,000 | | | BMC East LLC(i) | | | 5.50% | | | 10/01/2024 | | | | 33,906 | |
| | 40,000 | | | Booz Allen Hamilton, Inc.(i) | | | 5.13% | | | 05/01/2025 | | | | 39,400 | |
| | 80,000 | | | Boyd Gaming Corp. | | | 6.38% | | | 04/01/2026 | | | | 82,560 | |
| | 70,000 | | | BWAY Holding Co.(i) | | | 5.50% | | | 04/15/2024 | | | | 68,991 | |
| | 30,000 | | | BWX Technologies, Inc.(i) | | | 5.38% | | | 07/15/2026 | | | | 30,187 | |
| | 40,000 | | | Cable One, Inc.(i) | | | 5.75% | | | 06/15/2022 | | | | 40,850 | |
| | 45,000 | | | Callon Petroleum Co. | | | 6.38% | | | 07/01/2026 | | | | 46,012 | |
| | 60,000 | | | Cardtronics, Inc. / Cardtronics USA, Inc.(i) | | | 5.50% | | | 05/01/2025 | | | | 57,600 | |
| | 55,000 | | | Carriage Services, Inc.(i) | | | 6.63% | | | 06/01/2026 | | | | 56,512 | |
| | 100,000 | | | Catalent Pharma Solutions, Inc.(j) | | | 4.75% | | | 12/15/2024 | | | | 122,514 | |
| | 45,000 | | | CCO Holdings LLC / CCO Holdings Capital Corp.(i) | | | 5.13% | | | 05/01/2023 | | | | 45,295 | |
| | 30,000 | | | CCO Holdings LLC / CCO Holdings Capital Corp. | | | 5.75% | | | 09/01/2023 | | | | 30,562 | |
| | 25,000 | | | CCO Holdings LLC / CCO Holdings Capital Corp.(i) | | | 5.88% | | | 04/01/2024 | | | | 25,594 | |
| | 45,000 | | | CCO Holdings LLC / CCO Holdings Capital Corp.(i) | | | 5.00% | | | 02/01/2028 | | | | 42,408 | |
| | 80,000 | | | Cedar Fair LP / Canada's Wonderland Co. / Magnum Management Corp. | | | 5.38% | | | 06/01/2024 | | | | 80,000 | |
See Notes to Financial Statements.
| Annual Report | September 30, 2018 | 83 |
| RiverNorth/Oaktree High Income Fund | Schedule of Investments |
September 30, 2018
| Principal Amount/Description | | Rate | | Maturity | | Value | |
| $ | 25,000 | | Centene Corp. | | 6.13% | | 02/15/2024 | | $ | 26,375 | |
| | 65,000 | | CenturyLink, Inc. | | 5.63% | | 04/01/2025 | | | 63,719 | |
| | 35,000 | | Chaparral Energy, Inc.(i) | | 8.75% | | 07/15/2023 | | | 35,000 | |
| | 40,000 | | Charles River Laboratories International, Inc.(i) | | 5.50% | | 04/01/2026 | | | 40,700 | |
| | 120,000 | | Chemours Co. | | 4.00% | | 05/15/2026 | | | 139,842 | |
| | 60,000 | | Cheniere Corpus Christi Holdings LLC | | 7.00% | | 06/30/2024 | | | 65,850 | |
| | 25,000 | | Cheniere Corpus Christi Holdings LLC | | 5.13% | | 06/30/2027 | | | 25,156 | |
| | 10,000 | | Chesapeake Energy Corp. | | 5.38% | | 06/15/2021 | | | 10,000 | |
| | 95,000 | | Chesapeake Energy Corp. | | 7.00% | | 10/01/2024 | | | 95,119 | |
| | 45,000 | | Chesapeake Energy Corp. | | 8.00% | | 01/15/2025 | | | 46,552 | |
| | 60,000 | | CHS/Community Health Systems, Inc. | | 5.13% | | 08/01/2021 | | | 58,650 | |
| | 45,000 | | CHS/Community Health Systems, Inc. | | 6.25% | | 03/31/2023 | | | 42,919 | |
| | 10,000 | | Churchill Downs, Inc.(i) | | 4.75% | | 01/15/2028 | | | 9,400 | |
| | 100,000 | | CITGO Petroleum Corp.(i) | | 6.25% | | 08/15/2022 | | | 100,250 | |
| | 35,000 | | Clearway Energy Operating LLC | | 5.38% | | 08/15/2024 | | | 35,350 | |
| | 50,000 | | Clearway Energy Operating LLC | | 5.00% | | 09/15/2026 | | | 48,125 | |
| | 35,000 | | CommScope Technologies LLC(i) | | 5.00% | | 03/15/2027 | | | 33,775 | |
| | 75,000 | | CommScope, Inc.(i) | | 5.50% | | 06/15/2024 | | | 75,844 | |
| | 40,000 | | Comstock Escrow Corp.(i) | | 9.75% | | 08/15/2026 | | | 40,012 | |
| | 10,000 | | CoreCivic, Inc. | | 5.00% | | 10/15/2022 | | | 9,925 | |
| | 60,000 | | CoreCivic, Inc. | | 4.63% | | 05/01/2023 | | | 57,900 | |
| | 100,000 | | Cott Corp.(j) | | 5.50% | | 07/01/2024 | | | 123,652 | |
| | 75,000 | | Covanta Holding Corp. | | 6.38% | | 10/01/2022 | | | 76,688 | |
| | 25,000 | | Covanta Holding Corp. | | 5.88% | | 03/01/2024 | | | 25,586 | |
| | 50,000 | | CrownRock LP / CrownRock Finance, Inc.(i) | | 5.63% | | 10/15/2025 | | | 49,062 | |
| | 115,000 | | CSC Holdings LLC(i) | | 5.50% | | 04/15/2027 | | | 112,169 | |
| | 45,000 | | CyrusOne LP / CyrusOne Finance Corp. | | 5.00% | | 03/15/2024 | | | 45,956 | |
| | 115,000 | | DaVita, Inc. | | 5.13% | | 07/15/2024 | | | 111,550 | |
| | 5,000 | | DaVita, Inc. | | 5.00% | | 05/01/2025 | | | 4,823 | |
| | 85,000 | | DBP Holding Corp.(i) | | 7.75% | | 10/15/2020 | | | 38,675 | |
| | 40,000 | | DISH DBS Corp. | | 5.88% | | 07/15/2022 | | | 39,175 | |
| | 15,000 | | DISH DBS Corp. | | 7.75% | | 07/01/2026 | | | 14,269 | |
| | 30,000 | | DISH DBS Corp. | | 5.00% | | 03/15/2023 | | | 27,335 | |
| | 38,021 | | Ditech Holding Corp.(k) | | 9.00% (9.00%) | | 12/31/2024 | | | 30,607 | |
| | 80,000 | | Eldorado Resorts, Inc. | | 6.00% | | 04/01/2025 | | | 81,300 | |
| | 5,000 | | Encompass Health Corp. | | 5.13% | | 03/15/2023 | | | 5,038 | |
| | 100,000 | | Encompass Health Corp. | | 5.75% | | 11/01/2024 | | | 101,741 | |
| | 5,000 | | Endo Dac / Endo Finance LLC / Endo Finco, Inc.(i) | | 6.00% | | 07/15/2023 | | | 4,462 | |
| | 120,000 | | Endo Finance LLC(i) | | 5.75% | | 01/15/2022 | | | 112,650 | |
| | 55,000 | | EnerSys(i) | | 5.00% | | 04/30/2023 | | | 55,756 | |
| | 80,000 | | Envision Healthcare Corp. | | 5.63% | | 07/15/2022 | | | 82,296 | |
| | 100,000 | | Equinix, Inc. | | 2.88% | | 02/01/2026 | | | 114,691 | |
See Notes to Financial Statements.
| 84 | (888) 848-7569 | www.rivernorth.com |
| RiverNorth/Oaktree High Income Fund | Schedule of Investments |
September 30, 2018
| Principal Amount/Description | | Rate | | Maturity | | Value | |
| $ | 85,000 | | ESH Hospitality, Inc.(i) | | 5.25% | | 05/01/2025 | | $ | 82,662 | |
| | 50,000 | | Extraction Oil & Gas, Inc.(i) | | 7.38% | | 05/15/2024 | | | 49,625 | |
| | 100,000 | | Financial & Risk US Holdings, Inc.(i) | | 4.50% | | 05/15/2026 | | | 115,489 | |
| | 45,000 | | First Data Corp.(i) | | 7.00% | | 12/01/2023 | | | 46,969 | |
| | 125,000 | | First Data Corp.(i) | | 5.75% | | 01/15/2024 | | | 127,062 | |
| | 80,000 | | First Quality Finance Co., Inc.(i) | | 4.63% | | 05/15/2021 | | | 80,300 | |
| | 50,000 | | Flex Acquisition Co., Inc.(i) | | 6.88% | | 01/15/2025 | | | 48,000 | |
| | 25,000 | | Flex Acquisition Co., Inc.(i) | | 7.88% | | 07/15/2026 | | | 24,750 | |
| | 50,000 | | Forum Energy Technologies, Inc. | | 6.25% | | 10/01/2021 | | | 50,125 | |
| | 45,000 | | Frontier Communications Corp.(i) | | 8.50% | | 04/01/2026 | | | 42,694 | |
| | 55,000 | | Gartner, Inc.(i) | | 5.13% | | 04/01/2025 | | | 55,433 | |
| | 70,000 | | GEO Group, Inc. | | 5.13% | | 04/01/2023 | | | 67,375 | |
| | 10,000 | | GEO Group, Inc. | | 6.00% | | 04/15/2026 | | | 9,625 | |
| | 95,000 | | Golden Nugget, Inc.(i) | | 6.75% | | 10/15/2024 | | | 96,604 | |
| | 40,000 | | Great Western Petroleum LLC / Great Western Finance Corp.(i) | | 9.00% | | 09/30/2021 | | | 39,600 | |
| | 55,000 | | Greystar Real Estate Partners LLC(i) | | 5.75% | | 12/01/2025 | | | 53,762 | |
| | 80,000 | | Grinding Media, Inc. / Moly-Cop AltaSteel, Ltd.(i) | | 7.38% | | 12/15/2023 | | | 83,459 | |
| | 55,000 | | Gulfport Energy Corp. | | 6.63% | | 05/01/2023 | | | 56,238 | |
| | 60,000 | | H&E Equipment Services, Inc. | | 5.63% | | 09/01/2025 | | | 60,000 | |
| | 75,000 | | HCA Healthcare, Inc. | | 6.25% | | 02/15/2021 | | | 78,375 | |
| | 50,000 | | HUB International, Ltd.(i) | | 7.00% | | 05/01/2026 | | | 50,191 | |
| | 115,000 | | Hunt Cos., Inc.(i) | | 6.25% | | 02/15/2026 | | | 107,525 | |
| | 110,000 | | Ingles Markets, Inc. | | 5.75% | | 06/15/2023 | | | 111,925 | |
| | 100,000 | | IQVIA, Inc.(j) | | 2.88% | | 09/15/2025 | | | 114,787 | |
| | 65,000 | | Iron Mountain, Inc.(i) | | 4.88% | | 09/15/2027 | | | 59,881 | |
| | 100,000 | | Iron Mountain, Inc.(j) | | 3.00% | | 01/15/2025 | | | 115,031 | |
| | 75,000 | | Jaguar Holding Co. II / Pharmaceutical Product Development LLC(i) | | 6.38% | | 08/01/2023 | | | 75,750 | |
| | 5,000 | | JBS USA LUX SA / JBS USA Finance, Inc.(i) | | 7.25% | | 06/01/2021 | | | 5,100 | |
| | 70,000 | | JBS USA LUX SA / JBS USA Finance, Inc.(i) | | 7.25% | | 06/01/2021 | | | 71,400 | |
| | 55,000 | | KAR Auction Services, Inc.(i) | | 5.13% | | 06/01/2025 | | | 53,488 | |
| | 145,000 | | Kennedy-Wilson, Inc. | | 5.88% | | 04/01/2024 | | | 143,550 | |
| | 100,000 | | Kraton Polymers LLC / Kraton Polymers Capital Corp.(j) | | 5.25% | | 05/15/2026 | | | 119,298 | |
| | 100,000 | | Kronos International, Inc.(j) | | 3.75% | | 09/15/2025 | | | 112,364 | |
| | 25,000 | | Laredo Petroleum, Inc. | | 5.63% | | 01/15/2022 | | | 24,938 | |
| | 35,000 | | Laredo Petroleum, Inc. | | 6.25% | | 03/15/2023 | | | 35,175 | |
| | 80,000 | | Level 3 Financing, Inc. | | 5.13% | | 05/01/2023 | | | 80,900 | |
| | 10,000 | | Level 3 Financing, Inc. | | 5.38% | | 01/15/2024 | | | 10,042 | |
| | 30,000 | | LifePoint Health, Inc. | | 5.88% | | 12/01/2023 | | | 31,388 | |
| | 15,000 | | LifePoint Health, Inc. | | 5.38% | | 05/01/2024 | | | 15,656 | |
See Notes to Financial Statements.
| Annual Report | September 30, 2018 | 85 |
| RiverNorth/Oaktree High Income Fund | Schedule of Investments |
September 30, 2018
| Principal Amount/Description | | Rate | | Maturity | | Value | |
| $ | 20,000 | | Masonite International Corp.(i) | | 5.63% | | 03/15/2023 | | $ | 20,525 | |
| | 75,000 | | Matador Resources Co.(i) | | 5.88% | | 09/15/2026 | | | 76,125 | |
| | 30,000 | | Matthews International Corp.(i) | | 5.25% | | 12/01/2025 | | | 29,100 | |
| | 55,000 | | MEDNAX, Inc.(i) | | 5.25% | | 12/01/2023 | | | 55,206 | |
| | 35,000 | | MGM Resorts International | | 5.75% | | 06/15/2025 | | | 35,245 | |
| | 40,000 | | MPH Acquisition Holdings, LLC(i) | | 7.13% | | 06/01/2024 | | | 41,680 | |
| | 45,000 | | MSCI, Inc.(i) | | 5.75% | | 08/15/2025 | | | 47,372 | |
| | 35,000 | | Mueller Water Products, Inc.(i) | | 5.50% | | 06/15/2026 | | | 35,263 | |
| | 30,000 | | Multi-Color Corp.(i) | | 4.88% | | 11/01/2025 | | | 28,125 | |
| | 50,000 | | Nabors Industries, Inc. | | 5.50% | | 01/15/2023 | | | 49,357 | |
| | 10,000 | | Nabors Industries, Inc.(i) | | 5.75% | | 02/01/2025 | | | 9,609 | |
| | 120,000 | | Nationstar Mortgage Holdings, Inc.(i) | | 8.13% | | 07/15/2023 | | | 125,976 | |
| | 35,000 | | Natural Resource Partners LP / NRP Finance Corp. | | 10.50% | | 03/15/2022 | | | 37,625 | |
| | 20,000 | | Navient Corp. | | 7.25% | | 09/25/2023 | | | 21,300 | |
| | 100,000 | | NCR Corp. | | 6.38% | | 12/15/2023 | | | 102,125 | |
| | 104,238 | | Neiman Marcus Group, Ltd. LLC(i)(k) | | 8.75% (9.50%) | | 10/15/2021 | | | 69,253 | |
| | 40,000 | | New Enterprise Stone & Lime Co., Inc.(i) | | 6.25% | | 03/15/2026 | | | 40,400 | |
| | 65,000 | | Nielsen Finance LLC / Nielsen Finance Co.(i) | | 5.00% | | 04/15/2022 | | | 63,602 | |
| | 55,000 | | Novelis Corp.(i) | | 6.25% | | 08/15/2024 | | | 56,238 | |
| | 40,000 | | Novelis Corp.(i) | | 5.88% | | 09/30/2026 | | | 39,150 | |
| | 52,000 | | Oasis Petroleum, Inc. | | 6.88% | | 03/15/2022 | | | 52,974 | |
| | 20,000 | | Oasis Petroleum, Inc. | | 6.88% | | 01/15/2023 | | | 20,375 | |
| | 45,000 | | Olin Corp. | | 5.13% | | 09/15/2027 | | | 43,538 | |
| | 75,000 | | Owens-Brockway Glass Container, Inc.(i) | | 5.88% | | 08/15/2023 | | | 77,438 | |
| | 60,000 | | PDC Energy, Inc. | | 5.75% | | 05/15/2026 | | | 57,225 | |
| | 75,000 | | Performance Food Group, Inc.(i) | | 5.50% | | 06/01/2024 | | | 74,625 | |
| | 15,000 | | PetSmart, Inc.(i) | | 7.13% | | 03/15/2023 | | | 10,856 | |
| | 10,000 | | PetSmart, Inc.(i) | | 5.88% | | 06/01/2025 | | | 8,247 | |
| | 80,000 | | PHI, Inc. | | 5.25% | | 03/15/2019 | | | 76,600 | |
| | 50,000 | | Pilgrim's Pride Corp.(i) | | 5.75% | | 03/15/2025 | | | 48,375 | |
| | 30,000 | | Pinnacle Foods Finance LLC / Pinnacle Foods Finance Corp. | | 5.88% | | 01/15/2024 | | | 31,650 | |
| | 110,000 | | Plantronics, Inc.(i) | | 5.50% | | 05/31/2023 | | | 109,725 | |
| | 20,000 | | Post Holdings, Inc.(i) | | 5.50% | | 03/01/2025 | | | 19,915 | |
| | 40,000 | | Post Holdings, Inc.(i) | | 5.00% | | 08/15/2026 | | | 37,972 | |
| | 35,000 | | Post Holdings, Inc.(i) | | 5.63% | | 01/15/2028 | | | 33,775 | |
| | 35,000 | | Prestige Brands, Inc.(i) | | 6.38% | | 03/01/2024 | | | 35,569 | |
| | 50,000 | | Prime Security Services Borrower LLC / Prime Finance, Inc.(i) | | 9.25% | | 05/15/2023 | | | 53,600 | |
| | 70,000 | | Quicken Loans, Inc.(i) | | 5.75% | | 05/01/2025 | | | 70,263 | |
| | 10,000 | | Quicken Loans, Inc.(i) | | 5.25% | | 01/15/2028 | | | 9,325 | |
| | 55,000 | | RBS Global, Inc. / Rexnord LLC(i) | | 4.88% | | 12/15/2025 | | | 52,663 | |
See Notes to Financial Statements.
| 86 | (888) 848-7569 | www.rivernorth.com |
| RiverNorth/Oaktree High Income Fund | Schedule of Investments |
September 30, 2018
| Principal Amount/Description | | Rate | | Maturity | | Value | |
| $ | 50,000 | | Reynolds Group Issuer, Inc. / Reynolds Group Issuer, LLC(i) | | 7.00% | | 07/15/2024 | | $ | 50,969 | |
| | 82,374 | | Reynolds Group Issuer, Inc. / Reynolds Group Issuer, LLC | | 5.75% | | 10/15/2020 | | | 82,683 | |
| | 55,000 | | RHP Hotel Properties LP / RHP Finance Corp. | | 5.00% | | 04/15/2023 | | | 55,298 | |
| | 40,000 | | Rite Aid Corp.(i) | | 6.13% | | 04/01/2023 | | | 36,050 | |
| | 105,000 | | SBA Communications Corp. | | 4.88% | | 09/01/2024 | | | 104,081 | |
| | 100,000 | | Scientific Games International, Inc.(j) | | 3.38% | | 02/15/2026 | | | 110,833 | |
| | 55,000 | | Service Corp. International | | 5.38% | | 05/15/2024 | | | 56,306 | |
| | 15,000 | | SESI LLC | | 7.13% | | 12/15/2021 | | | 15,247 | |
| | 45,000 | | SESI LLC | | 7.75% | | 09/15/2024 | | | 46,069 | |
| | 100,000 | | Silgan Holdings, Inc. | | 3.25% | | 03/15/2025 | | | 120,029 | |
| | 100,000 | | Sirius XM Radio, Inc.(i) | | 5.38% | | 04/15/2025 | | | 100,625 | |
| | 85,000 | | Six Flags Entertainment Corp.(i) | | 4.88% | | 07/31/2024 | | | 83,470 | |
| | 15,000 | | SM Energy Co. | | 6.13% | | 11/15/2022 | | | 15,525 | |
| | 10,000 | | SM Energy Co. | | 5.00% | | 01/15/2024 | | | 9,825 | |
| | 30,000 | | SM Energy Co. | | 5.63% | | 06/01/2025 | | | 30,038 | |
| | 35,000 | | Sonic Automotive, Inc. | | 6.13% | | 03/15/2027 | | | 32,900 | |
| | 70,000 | | Sotheby's(i) | | 4.88% | | 12/15/2025 | | | 67,113 | |
| | 100,000 | | Spectrum Brands, Inc.(j) | | 4.00% | | 10/01/2026 | | | 118,251 | |
| | 55,000 | | Sprint Capital Corp. | | 6.88% | | 11/15/2028 | | | 55,395 | |
| | 170,000 | | Sprint Communications, Inc. | | 6.00% | | 11/15/2022 | | | 173,825 | |
| | 10,000 | | Sprint Corp. | | 7.88% | | 09/15/2023 | | | 10,799 | |
| | 25,000 | | Sprint Corp. | | 7.13% | | 06/15/2024 | | | 26,031 | |
| | 5,000 | | Sprint Corp. | | 7.63% | | 02/15/2025 | | | 5,315 | |
| | 45,000 | | Standard Industries, Inc.(i) | | 5.50% | | 02/15/2023 | | | 45,619 | |
| | 50,000 | | Standard Industries, Inc.(i) | | 6.00% | | 10/15/2025 | | | 51,312 | |
| | 20,000 | | Suburban Propane Partners LP/Suburban Energy Finance Corp. | | 5.50% | | 06/01/2024 | | | 19,750 | |
| | 40,000 | | Suburban Propane Partners LP/Suburban Energy Finance Corp. | | 5.75% | | 03/01/2025 | | | 39,000 | |
| | 30,000 | | Suburban Propane Partners LP/Suburban Energy Finance Corp. | | 5.88% | | 03/01/2027 | | | 28,650 | |
| | 115,000 | | Summit Materials LLC / Summit Materials Finance Corp. | | 6.13% | | 07/15/2023 | | | 117,206 | |
| | 75,000 | | SunCoke Energy Partners LP / SunCoke Energy Partners Finance Corp.(i) | | 7.50% | | 06/15/2025 | | | 77,438 | |
| | 30,000 | | Sunoco LP / Sunoco Finance Corp.(i) | | 4.88% | | 01/15/2023 | | | 29,775 | |
| | 20,000 | | Sunoco LP / Sunoco Finance Corp.(i) | | 5.50% | | 02/15/2026 | | | 19,370 | |
| | 65,000 | | Targa Resources Partners LP / Targa Resources Partners Finance Corp. | | 6.75% | | 03/15/2024 | | | 68,737 | |
| | 45,000 | | Targa Resources Partners LP / Targa Resources Partners Finance Corp. | | 5.13% | | 02/01/2025 | | | 45,450 | |
| | 10,000 | | Targa Resources Partners LP / Targa Resources Partners Finance Corp.(i) | | 5.88% | | 04/15/2026 | | | 10,363 | |
See Notes to Financial Statements.
| Annual Report | September 30, 2018 | 87 |
| RiverNorth/Oaktree High Income Fund | Schedule of Investments |
September 30, 2018
| Principal Amount/Description | | Rate | | Maturity | | Value | |
| $ | 20,000 | | Tempur Sealy International, Inc. | | 5.63% | | 10/15/2023 | | $ | 20,050 | |
| | 25,000 | | Tempur Sealy International, Inc. | | 5.50% | | 06/15/2026 | | | 24,031 | |
| | 65,000 | | Tenet Healthcare Corp.(i) | | 7.50% | | 01/01/2022 | | | 68,088 | |
| | 45,000 | | Tenet Healthcare Corp. | | 6.75% | | 06/15/2023 | | | 45,000 | |
| | 20,000 | | Tenet Healthcare Corp. | | 4.63% | | 07/15/2024 | | | 19,490 | |
| | 20,000 | | Tenet Healthcare Corp. | | 5.13% | | 05/01/2025 | | | 19,750 | |
| | 45,000 | | Tennant Co. | | 5.63% | | 05/01/2025 | | | 45,788 | |
| | 50,000 | | Tenneco, Inc. | | 5.38% | | 12/15/2024 | | | 47,188 | |
| | 25,000 | | TerraForm Power Operating LLC(i) | | 4.25% | | 01/31/2023 | | | 24,500 | |
| | 15,000 | | TerraForm Power Operating LLC(i) | | 5.00% | | 01/31/2028 | | | 14,006 | |
| | 55,000 | | T-Mobile USA, Inc. | | 6.00% | | 04/15/2024 | | | 57,173 | |
| | 20,000 | | T-Mobile USA, Inc. | | 6.38% | | 03/01/2025 | | | 20,886 | |
| | 55,000 | | TMS International Corp.(i) | | 7.25% | | 08/15/2025 | | | 55,550 | |
| | 10,000 | | TransDigm, Inc. | | 6.50% | | 07/15/2024 | | | 10,270 | |
| | 35,000 | | TransDigm, Inc. | | 6.50% | | 05/15/2025 | | | 35,744 | |
| | 80,000 | | TreeHouse Foods, Inc.(i) | | 6.00% | | 02/15/2024 | | | 82,900 | |
| | 50,000 | | TriMas Corp.(i) | | 4.88% | | 10/15/2025 | | | 47,969 | |
| | 15,000 | | Tronox, Inc.(i) | | 6.50% | | 04/15/2026 | | | 14,494 | |
| | 15,000 | | Ultra Resources, Inc.(i) | | 6.88% | | 04/15/2022 | | | 7,200 | |
| | 70,000 | | United Rentals North America, Inc. | | 5.50% | | 07/15/2025 | | | 71,663 | |
| | 100,000 | | Univision Communications, Inc.(i) | | 5.13% | | 05/15/2023 | | | 96,000 | |
| | 75,000 | | US Foods, Inc.(i) | | 5.88% | | 06/15/2024 | | | 75,750 | |
| | 45,000 | | USA Compression Partners LP / USA Compression Finance Corp.(i) | | 6.88% | | 04/01/2026 | | | 46,631 | |
| | 100,000 | | Vantiv LLC / Vantiv Issuer Corp.(j) | | 3.88% | | 11/15/2025 | | | 127,733 | |
| | 45,000 | | ViaSat, Inc.(i) | | 5.63% | | 09/15/2025 | | | 42,764 | |
| | 75,000 | | Watco Cos. LLC / Watco Finance Corp.(i) | | 6.38% | | 04/01/2023 | | | 76,781 | |
| | 40,000 | | Weatherford International, Ltd. | | 7.75% | | 06/15/2021 | | | 39,850 | |
| | 10,000 | | Weatherford International, Ltd. | | 4.50% | | 04/15/2022 | | | 8,800 | |
| | 10,000 | | Weatherford International, Ltd. | | 6.50% | | 08/01/2036 | | | 7,575 | |
| | 45,000 | | Whiting Petroleum Corp. | | 6.63% | | 01/15/2026 | | | 46,969 | |
| | 120,000 | | WMG Acquisition Corp.(i) | | 4.13% | | 11/01/2024 | | | 144,687 | |
| | 60,000 | | Wynn Las Vegas LLC / Wynn Las Vegas Capital Corp.(i) | | 5.25% | | 05/15/2027 | | | 55,800 | |
| | | | | | | | | | | 12,182,040 | |
| | | | | | | | | | | | |
| TOTAL HIGH YIELD DEBT (Cost $18,468,442) | | | | | 18,379,342 | |
| | | | | | | | | | | | |
| RIGHTS - 0.00% | | | | | | |
| | 3 | | Franklin, Ltd. Duration Income Trust, Expires 10/19/2018 | | | | | | | 0 | |
| | | | | | | | | | | | |
| TOTAL RIGHTS (Cost $0) | | | | | 0 | |
See Notes to Financial Statements.
| 88 | (888) 848-7569 | www.rivernorth.com |
| RiverNorth/Oaktree High Income Fund | Schedule of Investments |
September 30, 2018
| Shares/Description | | Value | |
| SHORT-TERM INVESTMENTS - 5.06% | | | | |
| 2,867,163 State Street Institutional Trust (7 Day Yield 1.94%) | | $ | 2,867,163 | |
| | | | | |
| TOTAL SHORT-TERM INVESTMENTS (Cost $2,867,163) | | | 2,867,163 | |
| | | | | |
| TOTAL INVESTMENTS - 100.80% (Cost $57,647,383) | | | 57,069,312 | |
| CASH SEGREGATED AT CUSTODIAN FOR FORWARD FOREIGN CURRENCY CONTRACTS - 0.09% | | | 50,000 | |
| LIABILITIES IN EXCESS OF OTHER ASSETS - (0.89)% | | | (505,360 | ) |
| NET ASSETS - 100.00% | | $ | 56,613,952 | |
Investment Abbreviations:
LIBOR - London Interbank Offered Rate
Libor Rates:
1W US L - 1 Week LIBOR as of September 30, 2018 was 2.20%
1M US L - 1 Month LIBOR as of September 30, 2018 was 2.26%
2M US L - 2 Month LIBOR as of September 30, 2018 was 2.31%
3M US L - 3 Month LIBOR as of September 30, 2018 was 2.40%
2M EUR L - 2 Month EURIBOR as of September 30, 2018 was -0.37%
3M EUR L - 3 Month EURIBOR as of September 30, 2018 was -0.35%
6M EUR L - 6 Month EURIBOR as of September 30, 2018 was -0.31%
| (a) | Non-income producing security. |
| (b) | Security has no contractual maturity date, is not redeemable and contractually pays an indefinite stream of interest. |
| (c) | Issued with a zero coupon. Income is recognized through the accretion of discount. |
| (d) | The level 3 assets were a result of unavailable quoted prices from an active market or the unavailability of other significant observable inputs. |
| (e) | Security determined to be illiquid under the procedures approved by the Fund’s Board of Trustees. Total fair value of the security is $75,000, which represents approximately 0.13% of net assets as of September 30, 2018. |
| (f) | Variable rate investment. Interest rates reset periodically. Interest rate shown reflects the rate in effect at September 30, 2018. For securities based on a published reference rate and spread, the reference rate and spread are indicated the description above. Certain variable rate securities are not based on a published reference rate and spread but are determined by the issuer or agent and are based on current market conditions. These securities do not indicate a reference rate and spread in their description above. |
See Notes to Financial Statements.
| Annual Report | September 30, 2018 | 89 |
| RiverNorth/Oaktree High Income Fund | Schedule of Investments |
September 30, 2018
| (g) | All or a portion of this position has not settled as of September 30, 2018. The interest rate shown represents the stated spread over the London Interbank Offered Rate ("LIBOR" or "L") or the Euro Interbank Offered Rate ("EURIBOR" or "E") or the applicable LIBOR/EURIBOR floor; the Fund will not accrue interest until the settlement date, at which point LIBOR/EURIBOR will be established. |
| (h) | Security is currently in default. |
| (i) | Security exempt from registration under Rule 144A of the Securities Act of 1933. These securities have been deemed liquid under procedures approved by the Fund's Board of Trustees and may normally be sold to qualified institutional buyers in transactions exempt from registration. Total fair value of Rule 144A securities amounts to $8,137,287, which represents approximately 14.37% of net assets as of September 30, 2018. |
| (j) | Securities were purchased pursuant to Regulation S under the Securities Act of 1933, which exempts securities offered and sold outside of the United States from registration. Such securities cannot be sold in the United States without either an effective registration statement filed pursuant to the Securities Act of 1933, or pursuant to an exemption from registration. These securities have been deemed liquid under procedures approved by the Fund's Board of Trustees. As of September 30, 2018, the aggregate fair value of those securities was $4,252,547, representing 7.51% of net assets. |
| (k) | Pay-in-kind securities - Rate paid in-kind is shown in parenthesis. |
OUTSTANDING FORWARD FOREIGN CURRENCY CONTRACTS
| Counterparty | | Settlement Date | | Fund Receiving | | U.S. $ Value at September 30, 2018 | | | Fund Delivering | | U.S. $ Value at September 30, 2018 | | | Unrealized Appreciation/ (Depreciation) | |
| State Street Boston | | 10/5/2018 | | USD | | | 8,890,586 | | | EUR | | | 8,931,784 | | | | 41,198 | |
| State Street Boston | | 10/5/2018 | | USD | | | 248,096 | | | GBP | | | 250,353 | | | | 2,257 | |
| | | | | | | | | | | | | | | | | $ | 43,455 | |
| State Street Boston | | 10/5/2018 | | USD | | | 92,747 | | | EUR | | | 92,510 | | | | (237 | ) |
| State Street Boston | | 10/5/2018 | | USD | | | 2,115,938 | | | GBP | | | 2,106,910 | | | | (9,028 | ) |
| | | | | | | | | | | | | | | | | $ | (9,265 | ) |
| * | The contracted amount is stated in the currency in which the security is denominated. |
See Notes to Financial Statements.
| 90 | (888) 848-7569 | www.rivernorth.com |
RiverNorth Core Opportunity Fund
| Statement of Assets and Liabilities | September 30, 2018 |
| ASSETS: | | | |
| Investment in securities: | | | | |
| At cost | | $ | 123,538,418 | |
| At value | | $ | 131,618,633 | |
| Receivable for fund investments sold | | | 1,496,418 | |
| Dividends receivable | | | 450,253 | |
| Cash segregated at custodian for total return swap contracts | | | 400,000 | |
| Receivable for fund shares sold | | | 56,533 | |
| Interest receivable | | | 9,470 | |
| Prepaid expenses and other assets | | | 14,807 | |
| Total Assets | | | 134,046,114 | |
| | | | | |
| LIABILITIES: | | | | |
| Payable to custodian due to overdraft | | | 581,595 | |
| Facility loan fee payable | | | 4,148 | |
| Payable for fund shares redeemed | | | 478,733 | |
| Payable to Adviser | | | 110,664 | |
| Payable for Fund Accounting and Administration fees | | | 11,414 | |
| Accrued 12b-1 fees - Class R Shares | | | 14,100 | |
| Payable for Custodian fees | | | 9,656 | |
| Payable for Audit fees | | | 21,908 | |
| Payable to Transfer agency | | | 8,813 | |
| Payable to Trustees and Officers | | | 2,428 | |
| Other accrued expenses | | | 11,892 | |
| Total Liabilities | | | 1,255,351 | |
| Net Assets | | $ | 132,790,763 | |
| | | | | |
| NET ASSETS CONSIST OF: | | | | |
| Paid-in capital | | $ | 98,903,291 | |
| Total distributable earnings | | | 33,887,472 | |
| Net Assets | | $ | 132,790,763 | |
See Notes to Financial Statements.
| Annual Report | September 30, 2018 | 91 |
RiverNorth Core Opportunity Fund
| Statement of Assets and Liabilities | September 30, 2018 |
| PRICING OF SHARES: | | | |
| Class I Shares | | | |
| Net Assets | | $ | 65,591,537 | |
| Shares of beneficial interest outstanding (unlimited number of shares, no par value) | | | 6,026,236 | |
| Net Asset Value Per Share, Offering and Redemption Price Per Share | | $ | 10.88 | |
| Minimum Redemption Price Per Share(a) | | $ | 10.66 | |
| Class R Shares | | | | |
| Net Assets | | $ | 67,199,226 | |
| Shares of beneficial interest outstanding (unlimited number of shares, no par value) | | | 6,170,522 | |
| Net Asset Value Per Share, Offering and Redemption Price Per Share | | $ | 10.89 | |
| Minimum Redemption Price Per Share(a) | | $ | 10.67 | |
| (a) | The Fund will impose a 2.00% redemption fee on shares redeemed within 90 days of purchase. |
See Notes to Financial Statements.
| 92 | (888) 848-7569 | www.rivernorth.com |
RiverNorth/DoubleLine Strategic Income Fund
| Statement of Assets and Liabilities | September 30, 2018 |
| ASSETS: | | | |
| Investment in securities: | | | | |
| At cost | | $ | 1,983,931,814 | |
| At value | | $ | 1,859,691,697 | |
| Investment in affiliates: | | | | |
| At cost | | | 29,173,156 | |
| At value | | | 28,777,147 | |
| Cash | | | 2,852,396 | |
| Interest receivable | | | 6,524,756 | |
| Receivable for fund shares sold | | | 2,592,974 | |
| Dividends receivable | | | 1,961,621 | |
| Receivable for fund investments sold | | | 1,209,410 | |
| Cash segregated at custodian for total return swap contracts | | | 400,000 | |
| Prepaid expenses and other assets | | | 38,875 | |
| Total Assets | | | 1,904,048,876 | |
| | | | | |
| LIABILITIES: | | | | |
| Facility loan fee payable | | | 57,034 | |
| Payable for fund investments purchased | | | 20,013,867 | |
| Payable for fund shares redeemed | | | 1,380,850 | |
| Payable to Adviser | | | 1,148,012 | |
| Payable for Fund Accounting and Administration fees | | | 251,529 | |
| Accrued 12b-1 fees - Class R Shares | | | 34,100 | |
| Payable for Custodian fees | | | 15,628 | |
| Payable for Audit fees | | | 32,909 | |
| Payable to Transfer agency | | | 43,891 | |
| Payable to Trustees and Officers | | | 2,834 | |
| Other accrued expenses | | | 101,450 | |
| Total Liabilities | | | 23,082,104 | |
| Net Assets | | $ | 1,880,966,772 | |
| | | | | |
| NET ASSETS CONSIST OF: | | | | |
| Paid-in capital | | $ | 2,021,610,581 | |
| Total distributable earnings | | | (140,643,809 | ) |
| Net Assets | | $ | 1,880,966,772 | |
See Notes to Financial Statements.
| Annual Report | September 30, 2018 | 93 |
RiverNorth/DoubleLine Strategic Income Fund
| Statement of Assets and Liabilities | September 30, 2018 |
| PRICING OF SHARES: | | | |
| Class I Shares | | | |
| Net Assets | | $ | 1,715,494,746 | |
| Shares of beneficial interest outstanding (unlimited number of shares, no par value) | | | 170,203,731 | |
| Net Asset Value Per Share, Offering and Redemption Price Per Share | | $ | 10.08 | |
| Minimum Redemption Price Per Share(a) | | $ | 9.88 | |
| Class R Shares | | | | |
| Net Assets | | $ | 165,472,026 | |
| Shares of beneficial interest outstanding (unlimited number of shares, no par value) | | | 16,391,973 | |
| Net Asset Value Per Share, Offering and Redemption Price Per Share | | $ | 10.09 | |
| Minimum Redemption Price Per Share(a) | | $ | 9.89 | |
| (a) | The Fund will impose a 2.00% redemption fee on shares redeemed within 90 days of purchase. |
See Notes to Financial Statements.
| 94 | (888) 848-7569 | www.rivernorth.com |
RiverNorth/Oaktree High Income Fund
| Statement of Assets and Liabilities | September 30, 2018 |
| ASSETS: | | |
| Investment in securities: | | | | |
| At cost | | $ | 57,647,383 | |
| At value | | $ | 57,069,312 | |
| Cash | | | 272,200 | |
| Foreign currency, at value (Cost 415,189) | | | 415,809 | |
| Receivable for fund investments sold | | | 1,104,045 | |
| Interest receivable | | | 397,713 | |
| Cash segregated at custodian for forward foreign currency contracts | | | 50,000 | |
| Unrealized appreciation on forward foreign currency contracts | | | 43,455 | |
| Dividends receivable | | | 29,160 | |
| Receivable for fund shares sold | | | 1,098 | |
| Prepaid expenses and other assets | | | 5,529 | |
| Total Assets | | | 59,388,321 | |
| | | | | |
| LIABILITIES: | | | | |
| Facility loan fee payable | | | 1,721 | |
| Payable for fund investments purchased | | | 2,626,070 | |
| Payable for fund shares redeemed | | | 5,444 | |
| Unrealized depreciation on forward foreign currency contracts | | | 9,265 | |
| Payable to Adviser | | | 28,894 | |
| Payable for Fund Accounting and Administration fees | | | 53,528 | |
| Accrued 12b-1 fees - Class R Shares | | | 1,387 | |
| Payable for Custodian fees | | | 5,403 | |
| Payable for Audit fees | | | 30,908 | |
| Payable to Transfer agency | | | 5,679 | |
| Payable to Trustees and Officers | | | 2,409 | |
| Other accrued expenses | | | 3,661 | |
| Total Liabilities | | | 2,774,369 | |
| Net Assets | | $ | 56,613,952 | |
| | | | | |
| NET ASSETS CONSIST OF: | | | | |
| Paid-in capital | | $ | 60,839,481 | |
| Total distributable earnings | | | (4,225,529 | ) |
| Net Assets | | $ | 56,613,952 | |
See Notes to Financial Statements.
| Annual Report | September 30, 2018 | 95 |
RiverNorth/Oaktree High Income Fund
| Statement of Assets and Liabilities | September 30, 2018 |
| PRICING OF SHARES: | | |
| Class I Shares | | |
| Net Assets | | $ | 49,856,248 | |
| Shares of beneficial interest outstanding (unlimited number of shares, no par value) | | | 5,201,506 | |
| Net Asset Value Per Share, Offering and Redemption Price Per Share | | $ | 9.58 | |
| Minimum Redemption Price Per Share(a) | | $ | 9.39 | |
| Class R Shares | | | | |
| Net Assets | | $ | 6,757,704 | |
| Shares of beneficial interest outstanding (unlimited number of shares, no par value) | | | 705,714 | |
| Net Asset Value Per Share, Offering and Redemption Price Per Share | | $ | 9.58 | |
| Minimum Redemption Price Per Share(a) | | $ | 9.39 | |
| (a) | The Fund will impose a 2.00% redemption fee on shares redeemed within 90 days of purchase. |
See Notes to Financial Statements.
| 96 | (888) 848-7569 | www.rivernorth.com |
RiverNorth Core Opportunity Fund
| Statement of Operations | For the Year Ended September 30, 2018 |
| INVESTMENT INCOME: | | |
| Dividend income | | $ | 8,281,164 | |
| Interest income | | | 163,174 | |
| Foreign taxes withheld | | | (716 | ) |
| Total Investment Income | | | 8,443,622 | |
| | | | | |
| EXPENSES: | | | | |
| Investment Adviser fee | | | 2,439,326 | |
| 12b-1 fees - Class R Shares | | | 402,616 | |
| Accounting and administration fee | | | 80,811 | |
| Compliance expenses | | | 49,581 | |
| Transfer agent expenses | | | 47,085 | |
| Registration expenses | | | 43,683 | |
| Custodian expenses | | | 27,055 | |
| Printing expenses | | | 26,858 | |
| Facility loan fee | | | 25,969 | |
| Audit expenses | | | 23,371 | |
| Trustee expenses | | | 19,961 | |
| Legal expenses | | | 15,817 | |
| Insurance expenses | | | 6,265 | |
| Miscellaneous expenses | | | 21,057 | |
| Total Expenses | | | 3,229,455 | |
| Net Investment Income | | | 5,214,167 | |
| | | | | |
| REALIZED AND UNREALIZED GAIN/(LOSS): | | | | |
| Net realized gain/(loss) on: | | | | |
| Investments | | | 29,617,643 | |
| Net realized gain | | | 29,617,643 | |
| Long-term capital gain distributions from other investment companies | | | 4,619,375 | |
| Net change in unrealized appreciation/depreciation on: | | | | |
| Investments | | | (24,533,245 | ) |
| Net change in unrealized appreciation/depreciation | | | (24,533,245 | ) |
| Net Realized and Unrealized Gain on Investments | | | 9,703,773 | |
| Net Increase in Net Assets Resulting from Operations | | $ | 14,917,940 | |
See Notes to Financial Statements.
| Annual Report | September 30, 2018 | 97 |
RiverNorth/DoubleLine Strategic Income Fund
| Statement of Operations | For the Year Ended September 30, 2018 |
| INVESTMENT INCOME: | | | | |
| Dividend income | | $ | 40,630,273 | |
| Dividend income from affiliated securities | | | 960,199 | |
| Interest income | | | 68,822,710 | |
| Other income | | | 13,520 | |
| Foreign taxes withheld | | | (4,738 | ) |
| Total Investment Income | | | 110,421,964 | |
| | | | | |
| EXPENSES: | | | | |
| Investment Adviser fee | | | 15,022,951 | |
| Accounting and administration fee | | | 923,662 | |
| 12b-1 fees - Class R Shares | | | 471,541 | |
| Facility loan fee | | | 221,007 | |
| Transfer agent expenses | | | 208,395 | |
| Compliance expenses | | | 191,811 | |
| Trustee expenses | | | 151,030 | |
| Legal expenses | | | 139,554 | |
| Printing expenses | | | 127,964 | |
| Registration expenses | | | 70,217 | |
| Custodian expenses | | | 68,531 | |
| Insurance expenses | | | 44,735 | |
| Audit expenses | | | 34,371 | |
| Miscellaneous expenses | | | 112,017 | |
| Total Expenses | | | 17,787,786 | |
| Net Investment Income | | | 92,634,178 | |
| | | | | |
| REALIZED AND UNREALIZED GAIN/(LOSS): | | | | |
| Net realized gain/(loss) on: | | | | |
| Investments | | | (1,825,140 | ) |
| Net realized loss | | | (1,825,140 | ) |
| Long-term capital gain distributions from other investment companies | | | 73,380 | |
| Net change in unrealized appreciation/depreciation on: | | | | |
| Investments | | | (86,256,700 | ) |
| Affiliated Investments | | | (312,699 | ) |
| Net change in unrealized appreciation/depreciation | | | (86,569,399 | ) |
| Net Realized and Unrealized Loss on Investments | | | (88,321,159 | ) |
| Net Increase in Net Assets Resulting from Operations | | $ | 4,313,019 | |
See Notes to Financial Statements.
| 98 | (888) 848-7569 | www.rivernorth.com |
RiverNorth/Oaktree High Income Fund
| Statement of Operations | For the Year Ended September 30, 2018 |
| INVESTMENT INCOME: | | |
| Dividend income | | $ | 748,702 | |
| Interest income | | | 2,529,990 | |
| Other income | | | 891 | |
| Foreign taxes withheld | | | (8,654 | ) |
| Total Investment Income | | | 3,270,929 | |
| | | | | |
| EXPENSES: | | | | |
| Investment Adviser fee | | | 608,300 | |
| Accounting and administration fee | | | 132,969 | |
| Registration expenses | | | 38,289 | |
| Transfer agent expenses | | | 32,742 | |
| Audit expenses | | | 32,371 | |
| Compliance expenses | | | 32,361 | |
| Custodian expenses | | | 21,865 | |
| 12b-1 fees - Class R Shares | | | 17,771 | |
| Printing expenses | | | 7,863 | |
| Facility loan fee | | | 6,607 | |
| Trustee expenses | | | 4,761 | |
| Legal expenses | | | 4,147 | |
| Interest expense | | | 3,687 | |
| Insurance expenses | | | 1,669 | |
| Miscellaneous expenses | | | 8,353 | |
| Less fees waived/reimbursed by Investment Adviser: | | | | |
| Class I Shares | | | (98,502 | ) |
| Class R Shares | | | (13,126 | ) |
| Net Expenses | | | 842,127 | |
| Net Investment Income | | | 2,428,802 | |
| | | | | |
| REALIZED AND UNREALIZED GAIN/(LOSS): | | | | |
| Net realized gain/(loss) on: | | | | |
| Investments | | | 276,893 | |
| Forward Foreign Currency Contracts | | | 748,292 | |
| Translation of assets and liabilities denominated in foreign currencies | | | (503,271 | ) |
| Net realized gain | | | 521,914 | |
| Net change in unrealized appreciation/depreciation on: | | | | |
| Investments | | | (1,691,069 | ) |
| Forward Foreign Currency Contracts | | | 35,448 | |
| Translation of assets and liabilities denominated in foreign currencies | | | 26,314 | |
| Net change in unrealized appreciation/depreciation | | | (1,629,307 | ) |
| Net Realized and Unrealized Loss on Investments, translation of assets and liabilities denominated in foreign currencies and forward foreign currency contracts | | | (1,107,393 | ) |
| Net Increase in Net Assets Resulting from Operations | | $ | 1,321,409 | |
See Notes to Financial Statements.
| Annual Report | September 30, 2018 | 99 |
RiverNorth Core Opportunity Fund
Statements of Changes in Net Assets
| | | For the
Year Ended
September 30, 2018 | | For the
Year Ended
September 30, 2017 |
| NET INCREASE/(DECREASE) IN NET ASSETS FROM OPERATIONS: | | | | | | | | |
| Net investment income | | $ | 5,214,167 | | | $ | 7,096,392 | |
| Net realized gain/(loss) | | | 29,617,643 | | | | 43,331,497 | |
| Long-term capital gain distributions from other investment companies | | | 4,619,375 | | | | 8,411,842 | |
| Net change in unrealized appreciation/depreciation | | | (24,533,245 | ) | | | 2,720,395 | |
| Net increase in net assets resulting from operations | | | 14,917,940 | | | | 61,560,126 | |
| | | | | | | | | |
| DISTRIBUTIONS TO SHAREHOLDERS:(a) | | | | | | | | |
| Class I shares | | | (17,414,020 | ) | | | (6,792,126 | ) |
| Class R shares | | | (31,988,487 | ) | | | (16,888,412 | ) |
| Net decrease in net assets from distributions to shareholders | | | (49,402,507 | ) | | | (23,680,538 | ) |
| | | | | | | | | |
| CAPITAL SHARE TRANSACTIONS: | | | | | | | | |
| Class I Shares | | | | | | | | |
| Proceeds from shares sold | | | 37,578,872 | | | | 46,546,239 | |
| Reinvestment of distributions | | | 10,189,389 | | | | 4,512,884 | |
| Cost of shares redeemed | | | (80,063,488 | ) | | | (154,520,350 | ) |
| Redemption fees(b) | | | 13,320 | | | | 38,263 | |
| Net decrease in net assets from capital share transactions | | | (32,281,907 | ) | | | (103,422,964 | ) |
| | | | | | | | | |
| Class R Shares | | | | | | | | |
| Proceeds from shares sold | | | 11,398,807 | | | | 41,626,713 | |
| Reinvestment of distributions | | | 31,627,486 | | | | 16,755,567 | |
| Cost of shares redeemed | | | (166,833,549 | ) | | | (439,389,198 | ) |
| Redemption fees(b) | | | 480 | | | | 4,262 | |
| Net decrease in net assets from capital share transactions | | | (123,806,776 | ) | | | (381,002,656 | ) |
| | | | | | | | | |
| Net Decrease in Net Assets | | | (190,573,250 | ) | | | (446,546,032 | ) |
| | | | | | | | | |
| NET ASSETS: | | | | | | | | |
| Beginning of period | | $ | 323,364,013 | | | $ | 769,910,045 | |
| End of period (a) | | | 132,790,763 | | | | 323,364,013 | |
See Notes to Financial Statements.
| 100 | (888) 848-7569 | www.rivernorth.com |
RiverNorth Core Opportunity Fund
Statements of Changes in Net Assets
| | | For the
Year Ended
September 30, 2018 | | For the
Year Ended
September 30, 2017 |
| OTHER INFORMATION: | | | | | | | | |
| Share Transactions: | | | | | | | | |
| Class I Shares | | | | | | | | |
| Shares sold | | | 3,214,606 | | | | 3,996,698 | |
| Shares issued in reinvestment of distributions | | | 944,429 | | | | 387,331 | |
| Shares redeemed | | | (6,996,741 | ) | | | (13,330,076 | ) |
| Net decrease from share transactions | | | (2,837,706 | ) | | | (8,946,047 | ) |
| | | | | | | | | |
| Class R Shares | | | | | | | | |
| Shares sold | | | 1,008,872 | | | | 3,608,158 | |
| Shares issued in reinvestment of distributions | | | 2,929,289 | | | | 1,446,579 | |
| Shares redeemed | | | (15,045,765 | ) | | | (37,956,954 | ) |
| Net decrease from share transactions | | | (11,107,604 | ) | | | (32,902,217 | ) |
| (a) | For the prior year ended September 30, 2017, RiverNorth Core Opportunity Fund had Total Distributions consisting of Net Investment Income of $13,503,018, and Net Realized Gains of $10,177,520 and Net Assets included accumulated net investment loss of $242,114. |
| (b) | The Fund will impose a 2.00% redemption fee on shares redeemed within 90 days of purchase. |
See Notes to Financial Statements.
| Annual Report | September 30, 2018 | 101 |
RiverNorth/DoubleLine Strategic Income Fund
Statements of Changes in Net Assets
| | | For the
Year Ended
September 30, 2018 | | For the
Year Ended
September 30, 2017 |
| NET INCREASE/(DECREASE) IN NET ASSETS FROM OPERATIONS: | | | | | | | | |
| Net investment income | | $ | 92,634,178 | | | $ | 80,946,905 | |
| Net realized gain/(loss) | | | (1,825,140 | ) | | | 22,609,514 | |
| Long-term capital gain distributions from other investment companies | | | 73,380 | | | | 439,705 | |
| Net change in unrealized appreciation/depreciation | | | (86,569,399 | ) | | | (7,033,038 | ) |
| Net increase in net assets resulting from operations | | | 4,313,019 | | | | 96,963,086 | |
| | | | | | | | | |
| DISTRIBUTIONS TO SHAREHOLDERS:(a) | | | | | | | | |
| Class I shares | | | (97,793,631 | ) | | | (88,225,388 | ) |
| Class R shares | | | (9,571,898 | ) | | | (9,292,211 | ) |
| From tax return of capital | | | | | | | | |
| Class I shares | | | (1,730,567 | ) | | | – | |
| Class R shares | | | (169,385 | ) | | | – | |
| Net decrease in net assets from distributions to shareholders | | | (109,265,481 | ) | | | (97,517,599 | ) |
| | | | | | | | | |
| CAPITAL SHARE TRANSACTIONS: | | | | | | | | |
| Class I Shares | | | | | | | | |
| Proceeds from shares sold | | | 445,909,981 | | | | 663,829,940 | |
| Reinvestment of distributions | | | 76,135,927 | | | | 64,580,225 | |
| Cost of shares redeemed | | | (735,657,272 | ) | | | (526,765,934 | ) |
| Redemption fees(b) | | | 60,895 | | | | 69,874 | |
| Net increase/(decrease) in net assets from capital share transactions | | | (213,550,469 | ) | | | 201,714,105 | |
| | | | | | | | | |
| Class R Shares | | | | | | | | |
| Proceeds from shares sold | | | 58,318,144 | | | | 63,167,525 | |
| Reinvestment of distributions | | | 9,393,059 | | | | 8,954,389 | |
| Cost of shares redeemed | | | (100,541,570 | ) | | | (94,841,502 | ) |
| Redemption fees(b) | | | 15,043 | | | | 18,119 | |
| Net decrease in net assets from capital share transactions | | | (32,815,324 | ) | | | (22,701,469 | ) |
| | | | | | | | | |
| Net Increase/(Decrease) in Net Assets | | | (351,318,255 | ) | | | 178,458,123 | |
| | | | | | | | | |
| NET ASSETS: | | | | | | | | |
| Beginning of period | | $ | 2,232,285,027 | | | $ | 2,053,826,904 | |
| End of period (a) | | | 1,880,966,772 | | | | 2,232,285,027 | |
See Notes to Financial Statements.
| 102 | (888) 848-7569 | www.rivernorth.com |
RiverNorth/DoubleLine Strategic Income Fund
Statements of Changes in Net Assets
| | | For the
Year Ended
September 30, 2018 | | For the
Year Ended
September 30, 2017 |
| OTHER INFORMATION: | | | | | | | | |
| Share Transactions: | | | | | | | | |
| Class I Shares | | | | | | | | |
| Shares sold | | | 43,253,978 | | | | 62,769,675 | |
| Shares issued in reinvestment of distributions | | | 7,419,361 | | | | 6,112,222 | |
| Shares redeemed | | | (71,333,873 | ) | | | (49,854,167 | ) |
| Net increase/(decrease) from share transactions | | | (20,660,534 | ) | | | 19,027,730 | |
| | | | | | | | | |
| Class R Shares | | | | | | | | |
| Shares sold | | | 5,605,491 | | | | 5,966,271 | |
| Shares issued in reinvestment of distributions | | | 913,262 | | | | 846,326 | |
| Shares redeemed | | | (9,725,055 | ) | | | (8,955,376 | ) |
| Net decrease from share transactions | | | (3,206,302 | ) | | | (2,142,779 | ) |
| (a) | For the prior year ended September 30, 2017, RiverNorth/DoubleLine Strategic Income Fund had Total Distributions consisting of Net Investment Income of $91,349,517, and Net Realized Gains of $6,168,082 and Net Assets included accumulated net investment loss of $3,379,439. |
| (b) | The Fund will impose a 2.00% redemption fee on shares redeemed within 90 days of purchase. |
See Notes to Financial Statements.
| Annual Report | September 30, 2018 | 103 |
RiverNorth/Oaktree High Income Fund
Statements of Changes in Net Assets
| | | For the
Year Ended
September 30, 2018 | | | For the
Year Ended
September 30, 2017 | |
| NET INCREASE/(DECREASE) IN NET ASSETS FROM OPERATIONS: | | | | | | | | |
| Net investment income | | $ | 2,428,802 | | | $ | 2,950,991 | |
| Net realized gain/(loss) | | | 521,914 | | | | (703,192 | ) |
| Long-term capital gain distributions from other investment companies | | | – | | | | 3,320 | |
| Net change in unrealized appreciation/depreciation | | | (1,629,307 | ) | | | 3,461,101 | |
| Net increase in net assets resulting from operations | | | 1,321,409 | | | | 5,712,220 | |
| | | | | | | | | |
| DISTRIBUTIONS TO SHAREHOLDERS:(a) | | | | | | | | |
| Class I Shares | | | (1,337,107 | ) | | | (2,921,176 | ) |
| Class R Shares | | | (166,196 | ) | | | (302,770 | ) |
| From tax return of capital | | | | | | | | |
| Class I Shares | | | (650,715 | ) | | | (259,165 | ) |
| Class R Shares | | | (80,881 | ) | | | (26,861 | ) |
| Net decrease in net assets from distributions to shareholders | | | (2,234,899 | ) | | | (3,509,972 | ) |
| | | | | | | | | |
| CAPITAL SHARE TRANSACTIONS: | | | | | | | | |
| Class I Shares | | | | | | | | |
| Proceeds from shares sold | | | 3,307,159 | | | | 14,250,482 | |
| Reinvestment of distributions | | | 1,930,632 | | | | 2,709,105 | |
| Cost of shares redeemed | | | (18,416,586 | ) | | | (28,702,824 | ) |
| Redemption fees(b) | | | 257 | | | | 6,279 | |
| Net decrease in net assets from capital share transactions | | | (13,178,538 | ) | | | (11,736,958 | ) |
| | | | | | | | | |
| Class R Shares | | | | | | | | |
| Proceeds from shares sold | | | 859,168 | | | | 3,096,004 | |
| Reinvestment of distributions | | | 241,660 | | | | 325,388 | |
| Cost of shares redeemed | | | (1,871,291 | ) | | | (3,194,299 | ) |
| Redemption fees(b) | | | 23 | | | | 536 | |
| Net increase/(decrease) in net assets from capital share transactions | | | (770,440 | ) | | | 227,629 | |
| | | | | | | | | |
| Net Decrease in Net Assets | | | (14,862,468 | ) | | | (9,307,081 | ) |
| | | | | | | | | |
| NET ASSETS: | | | | | | | | |
| Beginning of period | | $ | 71,476,420 | | | $ | 80,783,501 | |
| End of period (a) | | | 56,613,952 | | | | 71,476,420 | |
See Notes to Financial Statements.
| 104 | (888) 848-7569 | www.rivernorth.com |
RiverNorth/Oaktree High Income Fund
Statements of Changes in Net Assets
| | | For the
Year Ended
September 30, 2018 | | | For the
Year Ended
September 30, 2017 | |
| OTHER INFORMATION: | | | | | | | | |
| Share Transactions: | | | | | | | | |
| Class I Shares | | | | | | | | |
| Shares sold | | | 341,685 | | | | 1,480,726 | |
| Shares issued in reinvestment of distributions | | | 200,668 | | | | 281,131 | |
| Shares redeemed | | | (1,901,069 | ) | | | (2,962,599 | ) |
| Net decrease from share transactions | | | (1,358,716 | ) | | | (1,200,742 | ) |
| | | | | | | | | |
| Class R Shares | | | | | | | | |
| Shares sold | | | 89,276 | | | | 320,980 | |
| Shares issued in reinvestment of distributions | | | 25,140 | | | | 33,780 | |
| Shares redeemed | | | (193,955 | ) | | | (330,097 | ) |
| Net increase/(decrease) from share transactions | | | (79,539 | ) | | | 24,663 | |
| (a) | For the prior year ended September 30, 2017, RiverNorth/Oaktree High Income Fund had Total Distributions consisting of Net Investment Income of $3,223,946, and Net Realized Gains of $0 and Net Assets included accumulated net investment loss of $1,791,575. |
| (b) | The Fund will impose a 2.00% redemption fee on shares redeemed within 90 days of purchase. |
See Notes to Financial Statements.
| Annual Report | September 30, 2018 | 105 |
| RiverNorth Core Opportunity Fund | Class I |
Financial Highlights
| Net asset value - beginning of period |
| Income/(Loss) from investment operations: |
| Net investment income(b) |
| Net realized and unrealized gain/(loss) on investments(b) |
| Total income/(loss) from investment operations |
| Less distributions: |
| From net investment income |
| From net realized gain on investments |
| From tax return of capital |
| Total distributions |
| Paid-in capital from redemption fees(b) |
| Net increase/(decrease) in net asset value |
| Net asset value - end of period |
| Total Return(e) |
| Ratios/Supplemental Data: |
| Net assets, end of period (in thousands) |
| |
| Ratios to Average Net Assets (including interest expense): |
| |
| Ratio of expenses to average net assets excluding fee waivers and reimbursements(g) |
| Ratio of expenses to average net assets including fee waivers and reimbursements(g) |
| Ratio of net investment income to average net assets excluding fee waivers and reimbursements(g) |
| Ratio of net investment income to average net assets including fee waivers and reimbursements(g) |
| |
| Ratios to Average Net Assets (excluding interest expense): |
| |
|
| Ratio of expenses to average net assets excluding fee waivers and reimbursements(g) |
| Ratio of expenses to average net assets including fee waivers and reimbursements(g) |
| Ratio of net investment income to average net assets excluding fee waivers and reimbursements(g) |
| Ratio of net investment income to average net assets including fee waivers and reimbursements(g) |
| Portfolio turnover rate |
See Notes to Financial Statements.
| 106 | (888) 848-7569 | www.rivernorth.com |
For a share outstanding throughout the periods presented
For the
Year Ended
September 30,
2018 | | | For the
Year Ended
September 30,
2017 | | | For the
Year Ended
September 30,
2016 | | | For the
Year Ended
September 30,
2015 | | | For the Period
ended
September 30,
2014(a) | |
| $ | 12.37 | | | $ | 11.33 | | | $ | 10.74 | | | $ | 13.06 | | | $ | 13.16 | |
| | | | | | | | | | | | | | | | | | | |
| | 0.27 | | | | 0.17 | | | | 0.23 | | | | 0.44 | | | | 0.08 | |
| | 0.42 | | | | 1.45 | | | | 1.33 | | | | (1.30 | ) | | | (0.18 | )(c) |
| | 0.69 | | | | 1.62 | | | | 1.56 | | | | (0.86 | ) | | | (0.10 | ) |
| | | | | | | | | | | | | | | | | | | |
| | (0.40 | ) | | | (0.30 | ) | | | (0.42 | ) | | | (0.60 | ) | | | – | |
| | (1.78 | ) | | | (0.28 | ) | | | (0.45 | ) | | | (0.86 | ) | | | – | |
| | – | | | | – | | | | (0.10 | ) | | | – | | | | – | |
| | (2.18 | ) | | | (0.58 | ) | | | (0.97 | ) | | | (1.46 | ) | | | – | |
| | 0.00 | (d) | | | 0.00 | (d) | | | 0.00 | (d) | | | 0.00 | (d) | | | – | |
| | (1.49 | ) | | | 1.04 | | | | 0.59 | | | | (2.32 | ) | | | (0.10 | ) |
| $ | 10.88 | | | $ | 12.37 | | | $ | 11.33 | | | $ | 10.74 | | | $ | 13.06 | |
| | 5.92 | % | | | 14.71 | % | | | 15.35 | % | | | (7.50 | %) | | | (0.76 | %)(f) |
| | | | | | | | | | | | | | | | | | | |
| $ | 65,592 | | | $ | 109,627 | | | $ | 201,712 | | | $ | 166,905 | | | $ | 39,623 | |
| | | | | | | | | | | | | | | | | | | |
| | N/A | | | | 1.12 | % | | | N/A | | | | N/A | | | | N/A | |
| | | | | | | | | | | | | | | | | | | |
| | N/A | | | | 1.12 | % | | | N/A | | | | N/A | | | | N/A | |
| | | | | | | | | | | | | | | | | | | |
| | N/A | | | | 1.45 | % | | | N/A | | | | N/A | | | | N/A | |
| | | | | | | | | | | | | | | | | | | |
| | N/A | | | | 1.45 | % | | | N/A | | | | N/A | | | | N/A | |
| | | | | | | | | | | | | | | | | | | |
| | 1.17 | % | | | 1.12 | % | | | 1.11 | % | | | 1.11 | % | | | 1.20 | %(h) |
| | | | | | | | | | | | | | | | | | | |
| | 1.17 | % | | | 1.12 | % | | | 1.11 | % | | | 1.11 | % | | | 1.20 | %(h) |
| | | | | | | | | | | | | | | | | | | |
| | 2.37 | % | | | 1.45 | % | | | 2.11 | % | | | 3.62 | % | | | 2.93 | %(h) |
| | | | | | | | | | | | | | | | | | | |
| | 2.37 | % | | | 1.45 | % | | | 2.11 | % | | | 3.62 | % | | | 2.93 | %(h) |
| | 58 | %(i) | | | 39 | %(i) | | | 19 | % | | | 23 | % | | | 46 | %(f) |
| Annual Report | September 30, 2018 | 107 |
| RiverNorth Core Opportunity Fund | Class I |
| Financial Highlights | For a share outstanding throughout the periods presented |
| (a) | Commenced operations on August 11, 2014. |
| (b) | Based on average shares outstanding during the period. |
| (c) | The amount shown for a share outstanding throughout the period may not correlate with the Statement of Operations for the period due to the timing of sales and redemptions of Fund shares in relation to realized and unrealized gains and losses on investments of the Fund. |
| (d) | Less than $0.005 per share. |
| (e) | Total return in the above table represents the rate that the investor would have earned or lost on an investment in the Fund, assuming reinvestment of dividends. |
| (g) | The ratios exclude the impact of expenses of the underlying funds in which the Fund invests as represented in the Schedule of Investments. |
| (i) | Portfolio turnover does not include redemptions in-kind. |
See Notes to Financial Statements.
| 108 | (888) 848-7569 | www.rivernorth.com |
Intentionally Left Blank
| RiverNorth Core Opportunity Fund | Class R |
Financial Highlights
| Net asset value - beginning of period |
| Income/(Loss) from investment operations: |
| Net investment income(a) |
| Net realized and unrealized gain/(loss) on investments(a) |
| Total income/(loss) from investment operations |
| Less distributions: |
| From net investment income |
| From net realized gain on investments |
| From tax return of capital |
| Total distributions |
| Paid-in capital from redemption fees(a) |
| Net increase/ (decrease) in net asset value |
| Net asset value - end of period |
| Total Return(c) |
| Ratios/Supplemental Data: |
| Net assets, end of period (in thousands) |
| Ratios to Average Net Assets (including interest expense): |
| |
| Ratio of expenses to average net assets excluding fee waivers and reimbursements(d) |
| Ratio of expenses to average net assets including fee waivers and reimbursements(d) |
| Ratio of net investment income to average net assets excluding fee waivers and reimbursements(d) |
| Ratio of net investment income to average net assets including fee waivers and reimbursements(d) |
| Ratios to Average Net Assets (excluding interest expense): |
| |
| Ratio of expenses to average net assets excluding fee waivers and reimbursements(d) |
| Ratio of expenses to average net assets including fee waivers and reimbursements(d) |
| Ratio of net investment income to average net assets excluding fee waivers and reimbursements(d) |
| Ratio of net investment income to average net assets including fee waivers and reimbursements(d) |
| Portfolio turnover rate |
See Notes to Financial Statements.
| 110 | (888) 848-7569 | www.rivernorth.com |
For a share outstanding throughout the periods presented
For the
Year Ended
September 30,
2018 | | | For the
Year Ended
September 30,
2017 | | | For the
Year Ended
September 30,
2016 | | | For the
Year Ended
September 30,
2015 | | | For the
Year Ended
September 30,
2014 | |
| $ | 12.37 | | | $ | 11.32 | | | $ | 10.74 | | | $ | 13.05 | | | $ | 12.65 | |
| | | | | | | | | | | | | | | | | | | |
| | 0.23 | | | | 0.16 | | | | 0.20 | | | | 0.39 | | | | 0.32 | |
| | 0.44 | | | | 1.44 | | | | 1.32 | | | | (1.27 | ) | | | 1.00 | |
| | 0.67 | | | | 1.60 | | | | 1.52 | | | | (0.88 | ) | | | 1.32 | |
| | | | | | | | | | | | | | | | | | | |
| | (0.37 | ) | | | (0.27 | ) | | | (0.40 | ) | | | (0.57 | ) | | | (0.24 | ) |
| | (1.78 | ) | | | (0.28 | ) | | | (0.45 | ) | | | (0.86 | ) | | | (0.68 | ) |
| | – | | | | – | | | | (0.09 | ) | | | – | | | | – | |
| | (2.15 | ) | | | (0.55 | ) | | | (0.94 | ) | | | (1.43 | ) | | | (0.92 | ) |
| | 0.00 | (b) | | | 0.00 | (b) | | | 0.00 | (b) | | | 0.00 | (b) | | | 0.00 | (b) |
| | (1.48 | ) | | | 1.05 | | | | 0.58 | | | | (2.31 | ) | | | 0.40 | |
| $ | 10.89 | | | $ | 12.37 | | | $ | 11.32 | | | $ | 10.74 | | | $ | 13.05 | |
| | 5.70 | % | | | 14.51 | % | | | 14.98 | % | | | (7.67 | %) | | | 10.81 | % |
| | | | | | | | | | | | | | | | | | | |
| $ | 67,199 | | | $ | 213,737 | | | $ | 568,198 | | | $ | 538,689 | | | $ | 705,299 | |
| | | | | | | | | | | | | | | | | | | |
| | N/A | | | | 1.37 | % | | | N/A | | | | N/A | | | | N/A | |
| | N/A | | | | 1.37 | % | | | N/A | | | | N/A | | | | N/A | |
| | | | | | | | | | | | | | | | | | | |
| | N/A | | | | 1.38 | % | | | N/A | | | | N/A | | | | N/A | |
| | | | | | | | | | | | | | | | | | | |
| | N/A | | | | 1.38 | % | | | N/A | | | | N/A | | | | N/A | |
| | | | | | | | | | | | | | | | | | | |
| | 1.41 | % | | | 1.37 | % | | | 1.36 | % | | | 1.35 | % | | | 1.37 | % |
| | 1.41 | % | | | 1.37 | % | | | 1.36 | % | | | 1.35 | % | | | 1.37 | % |
| | | | | | | | | | | | | | | | | | | |
| | 2.02 | % | | | 1.38 | % | | | 1.90 | % | | | 3.16 | % | | | 2.60 | % |
| | | | | | | | | | | | | | | | | | | |
| | 2.02 | % | | | 1.38 | % | | | 1.90 | % | | | 3.16 | % | | | 2.60 | % |
| | 58 | %(e) | | | 39 | %(e) | | | 19 | % | | | 23 | % | | | 46 | % |
| Annual Report | September 30, 2018 | 111 |
| RiverNorth Core Opportunity Fund | Class R |
| Financial Highlights | For a share outstanding throughout the periods presented |
| (a) | Based on average shares outstanding during the period. |
| (b) | Less than $0.005 per share. |
| (c) | Total return in the above table represents the rate that the investor would have earned or lost on an investment in the Fund, assuming reinvestment of dividends. |
| (d) | The ratios exclude the impact of expenses of the underlying funds in which the Fund invests as represented in the Schedule of Investments. |
| (e) | Portfolio turnover does not include redemptions in-kind. |
See Notes to Financial Statements.
| 112 | (888) 848-7569 | www.rivernorth.com |
Intentionally Left Blank
| RiverNorth/DoubleLine Strategic Income Fund | Class I |
Financial Highlights
| Net asset value - beginning of period |
| Income from investment operations: |
| Net investment income(a) |
| Net realized and unrealized gain/ (loss) on investments(a) |
| Total income from investment operations |
| |
| Less distributions: |
| From net investment income |
| From net realized gain on investments |
| From tax return of capital |
| Total distributions |
| Paid-in capital from redemption fees(a) |
| Net increase/(decrease) in net asset value |
| Net asset value - end of period |
| |
| Total Return(c) |
| |
| Ratios/Supplemental Data: |
| Net assets, end of period (in thousands) |
| Ratio of expenses to average net assets excluding fee waivers and reimbursements(d) |
| Ratio of expenses to average net assets including fee waivers and reimbursements(d) |
| |
| Ratio of net investment income to average net assets excluding fee waivers and reimbursements(d) |
| |
| Ratio of net investment income to average net assets including fee waivers and reimbursements(d) |
| Portfolio turnover rate |
| (a) | Based on average shares outstanding during the period. |
| (b) | Less than $0.005 per share. |
| (c) | Total return in the above table represents the rate that the investor would have earned or lost on an investment in the Fund, assuming reinvestment of dividends. |
| (d) | The ratios exclude the impact of expenses of the underlying funds in which the Fund invests as represented in the Schedule of Investments. |
See Notes to Financial Statements.
| 114 | (888) 848-7569 | www.rivernorth.com |
For a share outstanding throughout the periods presented
For the
Year Ended
September 30,
2018 | | | For the
Year Ended
September 30,
2017 | | | For the
Year Ended
September 30,
2016 | | | For the
Year Ended
September 30,
2015 | | | For the
Year Ended
September 30,
2014 | |
| $ | 10.61 | | | $ | 10.61 | | | $ | 10.37 | | | $ | 10.88 | | | $ | 10.62 | |
| | | | | | | | | | | | | | | | | | | |
| | 0.47 | | | | 0.40 | | | | 0.51 | | | | 0.56 | | | | 0.59 | |
| | (0.44 | ) | | | 0.08 | | | | 0.39 | | | | (0.55 | ) | | | 0.38 | |
| | 0.03 | | | | 0.48 | | | | 0.90 | | | | 0.01 | | | | 0.97 | |
| | | | | | | | | | | | | | | | | | | |
| | (0.51 | ) | | | (0.45 | ) | | | (0.64 | ) | | | (0.52 | ) | | | (0.66 | ) |
| | (0.04 | ) | | | (0.03 | ) | | | – | | | | – | | | | (0.05 | ) |
| | (0.01 | ) | | | – | | | | (0.02 | ) | | | – | | | | – | |
| | (0.56 | ) | | | (0.48 | ) | | | (0.66 | ) | | | (0.52 | ) | | | (0.71 | ) |
| | 0.00 | (b) | | | 0.00 | (b) | | | 0.00 | (b) | | | 0.00 | (b) | | | 0.00 | (b) |
| | (0.53 | ) | | | – | | | | 0.24 | | | | (0.51 | ) | | | 0.26 | |
| $ | 10.08 | | | $ | 10.61 | | | $ | 10.61 | | | $ | 10.37 | | | $ | 10.88 | |
| | | | | | | | | | | | | | | | | | | |
| | 0.33 | % | | | 4.67 | % | | | 9.00 | % | | | 0.04 | % | | | 9.38 | % |
| | | | | | | | | | | | | | | | | | | |
| | | | | | | | | | | | | | | | | | | |
| $ | 1,715,495 | | | $ | 2,024,142 | | | $ | 1,822,874 | | | $ | 1,735,108 | | | $ | 1,148,744 | |
| | 0.86 | % | | | 0.85 | % | | | 0.86 | % | | | 0.86 | % | | | 0.91 | % |
| | 0.86 | % | | | 0.85 | % | | | 0.86 | % | | | 0.86 | % | | | 0.91 | % |
| | | | | | | | | | | | | | | | | | | |
| | 4.60 | % | | | 3.80 | % | | | 4.92 | % | | | 5.24 | % | | | 5.47 | % |
| | | | | | | | | | | | | | | | | | | |
| | 4.60 | % | | | 3.80 | % | | | 4.92 | % | | | 5.24 | % | | | 5.47 | % |
| | 37 | % | | | 50 | % | | | 36 | % | | | 29 | % | | | 56 | % |
| Annual Report | September 30, 2018 | 115 |
| RiverNorth/DoubleLine Strategic Income Fund | Class R |
Financial Highlights
| Net asset value - beginning of period |
| Income/(loss) from investment operations: |
| Net investment income(a) |
| Net realized and unrealized gain/ (loss) on investments(a) |
| Total income/(loss) from investment operations |
| |
| Less distributions: |
| From net investment income |
| From net realized gain on investments |
| From tax return of capital |
| Total distributions |
| Paid-in capital from redemption fees(a) |
| Net increase/(decrease) in net asset value |
| Net asset value - end of period |
| |
| Total Return(c) |
| |
| Ratios/Supplemental Data: |
| Net assets, end of period (in thousands) |
| Ratio of expenses to average net assets excluding fee waivers and reimbursements(d) |
| Ratio of expenses to average net assets including fee waivers and reimbursements(d) |
| |
| Ratio of net investment income to average net assets excluding fee waivers and reimbursements(d) |
| |
| Ratio of net investment income to average net assets including fee waivers and reimbursements(d) |
| Portfolio turnover rate |
| (a) | Based on average shares outstanding during the period. |
| (b) | Less than $0.005 per share. |
| (c) | Total return in the above table represents the rate that the investor would have earned or lost on an investment in the Fund, assuming reinvestment of dividends. |
| (d) | The ratios exclude the impact of expenses of the underlying funds in which the Fund invests as represented in the Schedule of Investments. |
See Notes to Financial Statements.
| 116 | (888) 848-7569 | www.rivernorth.com |
For a share outstanding throughout the periods presented
For the
Year Ended
September 30,
2018 | | | For the
Year Ended
September 30,
2017 | | | For the
Year Ended
September 30,
2016 | | | For the
Year Ended
September 30,
2015 | | | For the
Year Ended
September 30,
2014 | |
| $ | 10.62 | | | $ | 10.62 | | | $ | 10.39 | | | $ | 10.89 | | | $ | 10.63 | |
| | | | | | | | | | | | | | | | | | | |
| | 0.45 | | | | 0.38 | | | | 0.49 | | | | 0.54 | | | | 0.57 | |
| | (0.45 | ) | | | 0.08 | | | | 0.37 | | | | (0.55 | ) | | | 0.38 | |
| | – | | | | 0.46 | | | | 0.86 | | | | (0.01 | ) | | | 0.95 | |
| | | | | | | | | | | | | | | | | | | |
| | (0.48 | ) | | | (0.43 | ) | | | (0.61 | ) | | | (0.49 | ) | | | (0.64 | ) |
| | (0.04 | ) | | | (0.03 | ) | | | – | | | | – | | | | (0.05 | ) |
| | (0.01 | ) | | | – | | | | (0.02 | ) | | | – | | | | – | |
| | (0.53 | ) | | | (0.46 | ) | | | (0.63 | ) | | | (0.49 | ) | | | (0.69 | ) |
| | 0.00 | (b) | | | 0.00 | (b) | | | 0.00 | (b) | | | 0.00 | (b) | | | 0.00 | (b) |
| | (0.53 | ) | | | – | | | | 0.23 | | | | (0.50 | ) | | | 0.26 | |
| $ | 10.09 | | | $ | 10.62 | | | $ | 10.62 | | | $ | 10.39 | | | $ | 10.89 | |
| | | | | | | | | | | | | | | | | | | |
| | 0.07 | % | | | 4.40 | % | | | 8.62 | % | | | (0.12 | %) | | | 9.09 | % |
| | | | | | | | | | | | | | | | | | | |
| $ | 165,472 | | | $ | 208,143 | | | $ | 230,953 | | | $ | 233,319 | | | $ | 232,191 | |
| | 1.11 | % | | | 1.10 | % | | | 1.11 | % | | | 1.11 | % | | | 1.16 | % |
| | 1.11 | % | | | 1.10 | % | | | 1.11 | % | | | 1.11 | % | | | 1.16 | % |
| | | | | | | | | | | | | | | | | | | |
| | 4.34 | % | | | 3.56 | % | | | 4.67 | % | | | 4.97 | % | | | 5.26 | % |
| | | | | | | | | | | | | | | | | | | |
| | 4.34 | % | | | 3.56 | % | | | 4.67 | % | | | 4.97 | % | | | 5.26 | % |
| | 37 | % | | | 50 | % | | | 36 | % | | | 29 | % | | | 56 | % |
| Annual Report | September 30, 2018 | 117 |
| RiverNorth/Oaktree High Income Fund | Class I |
Financial Highlights
| Net asset value - beginning of period |
| Income/(loss) from investment operations: |
| Net investment income(a) |
| Net realized and unrealized gain/(loss) on investments(a) |
| Total income/(loss) from investment operations |
| |
| Less distributions: |
| From net investment income |
| From net realized gain on investments |
| From tax return of capital |
| Total distributions |
| Paid-in capital from redemption fees(a) |
| Net increase/(decrease) in net asset value |
| Net asset value - end of period |
| |
| Total Return(c) |
| |
| Supplemental Data: |
| Net assets, end of period (in thousands) |
| Ratios to Average Net Assets (including interest expense) |
| Ratio of expenses to average net assets excluding fee waivers and reimbursements(d) |
| Ratio of expenses to average net assets including fee waivers and reimbursements(d) |
| |
| Ratio of net investment income to average net assets excluding fee waivers and reimbursements(d) |
| |
| Ratio of net investment income to average net assets including fee waivers and reimbursements(d) |
| |
| Ratios to Average Net Assets (excluding interest expense) |
| Ratio of expenses to average net assets excluding fee waivers and reimbursements(d) |
| Ratio of expenses to average net assets including fee waivers and reimbursements(d) |
| |
| Ratio of net investment income to average net assets excluding fee waivers and reimbursements(d) |
| |
| Ratio of net investment income to average net assets including fee waivers and reimbursements(d) |
| Portfolio turnover rate |
See Notes to Financial Statements.
| 118 | (888) 848-7569 | www.rivernorth.com |
For a share outstanding throughout the periods presented
For the
Year Ended
September 30, 2018 | | | For the
Year Ended
September 30, 2017 | | | For the
Year Ended
September 30, 2016 | | | For the
Year Ended
September 30, 2015 | | | For the
Year Ended
September 30, 2014 | |
| $ | 9.73 | | | $ | 9.48 | | | $ | 9.18 | | | $ | 10.25 | | | $ | 9.95 | |
| | | | | | | | | | | | | | | | | | | |
| | 0.39 | | | | 0.35 | | | | 0.44 | | | | 0.43 | | | | 0.47 | |
| | (0.18 | ) | | | 0.31 | | | | 0.44 | | | | (0.77 | ) | | | 0.33 | |
| | 0.21 | | | | 0.66 | | | | 0.88 | | | | (0.34 | ) | | | 0.80 | |
| | | | | | | | | | | | | | | | | | | |
| | (0.24 | ) | | | (0.38 | ) | | | (0.55 | ) | | | (0.53 | ) | | | (0.50 | ) |
| | – | | | | – | | | | – | | | | (0.20 | ) | | | – | |
| | (0.12 | ) | | | (0.03 | ) | | | (0.03 | ) | | | – | | | | – | |
| | (0.36 | ) | | | (0.41 | ) | | | (0.58 | ) | | | (0.73 | ) | | | (0.50 | ) |
| | 0.00 | (b) | | | 0.00 | (b) | | | 0.00 | (b) | | | 0.00 | (b) | | | 0.00 | (b) |
| | (0.15 | ) | | | 0.25 | | | | 0.30 | | | | (1.07 | ) | | | 0.30 | |
| $ | 9.58 | | | $ | 9.73 | | | $ | 9.48 | | | $ | 9.18 | | | $ | 10.25 | |
| | | | | | | | | | | | | | | | | | | |
| | 2.22 | % | | | 7.11 | % | | | 10.09 | % | | | (3.50 | %) | | | 8.16 | % |
| | | | | | | | | | | | | | | | | | | |
| $ | 49,856 | | | $ | 63,842 | | | $ | 73,580 | | | $ | 88,360 | | | $ | 69,473 | |
| | | | | | | | | | | | | | | | | | | |
| | 1.54 | %(e) | | | 1.35 | %(e) | | | 1.34 | %(e) | | | 1.36 | %(e) | | | 1.39 | % |
| | 1.36 | %(e) | | | 1.35 | %(e) | | | 1.34 | %(e) | | | 1.36 | %(e) | | | 1.35 | % |
| | | | | | | | | | | | | | | | | | | |
| | 3.84 | %(e) | | | 3.59 | %(e) | | | 4.86 | %(e) | | | 4.40 | %(e) | | | 4.45 | % |
| | | | | | | | | | | | | | | | | | | |
| | 4.02 | %(e) | | | 3.59 | %(e) | | | 4.86 | %(e) | | | 4.40 | %(e) | | | 4.49 | % |
| | | | | | | | | | | | | | | | | | | |
| | 1.53 | %(e) | | | 1.35 | %(e) | | | 1.34 | %(e) | | | 1.35 | %(e) | | | N/A | |
| | 1.35 | %(e) | | | 1.35 | %(e) | | | 1.34 | %(e) | | | 1.35 | %(e) | | | N/A | |
| | | | | | | | | | | | | | | | | | | |
| | 3.83 | %(e) | | | 3.59 | %(e) | | | 4.86 | %(e) | | | 4.41 | %(e) | | | N/A | |
| | | | | | | | | | | | | | | | | | | |
| | 4.01 | %(e) | | | 3.59 | %(e) | | | 4.86 | %(e) | | | 4.41 | %(e) | | | N/A | |
| | 76 | % | | | 121 | % | | | 40 | % | | | 70 | % | | | 91 | % |
| Annual Report | September 30, 2018 | 119 |
| RiverNorth/Oaktree High Income Fund | Class I |
| Financial Highlights | For a share outstanding throughout the periods presented |
| (a) | Based on average shares outstanding during the period. |
| (b) | Less than $0.005 per share. |
| (c) | Total return in the above table represents the rate that the investor would have earned or lost on an investment in the Fund, assuming reinvestment of dividends. |
| (d) | The ratios exclude the impact of expenses of the underlying funds in which the Fund invests as represented in the Schedule of Investments. |
| (e) | The portion of the ratios attributable to recoupments for the periods ended September 30, 2018, September 30, 2017, September 30, 2016 and September 30, 2015 were 0.00%, 0.00%, 0.00% and 0.06%, respectively. |
See Notes to Financial Statements.
| 120 | (888) 848-7569 | www.rivernorth.com |
Intentionally Left Blank
| RiverNorth/Oaktree High Income Fund | Class R |
Financial Highlights
| Net asset value - beginning of period |
| Income/(loss) from investment operations: |
| Net investment income(a) |
| Net realized and unrealized gain/(loss) on investments(a) |
| Total income/(loss) from investment operations |
| |
| Less distributions: |
| From net investment income |
| From net realized gain on investments |
| From tax return of capital |
| Total distributions |
| Paid-in capital from redemption fees(a) |
| Net increase/(decrease) in net asset value |
| Net asset value - end of period |
| |
| Total Return(c) |
| |
| Supplemental Data: |
| Net assets, end of period (in thousands) |
| Ratios to Average Net Assets (including interest expense) |
| Ratio of expenses to average net assets excluding fee waivers and reimbursements(d) |
| Ratio of expenses to average net assets including fee waivers and reimbursements(d) |
| |
| Ratio of net investment income to average net assets excluding fee waivers and reimbursements(d) |
| |
| Ratio of net investment income to average net assets including fee waivers and reimbursements(d) |
| |
| Ratios to Average Net Assets (excluding interest expense) |
| Ratio of expenses to average net assets excluding fee waivers and reimbursements(d) |
| Ratio of expenses to average net assets including fee waivers and reimbursements(d) |
| |
| Ratio of net investment income to average net assets excluding fee waivers and reimbursements(d) |
| |
| Ratio of net investment income to average net assets including fee waivers and reimbursements(d) |
| Portfolio turnover rate |
| |
See Notes to Financial Statements.
| 122 | (888) 848-7569 | www.rivernorth.com |
For a share outstanding throughout the periods presented
For the
Year Ended
September 30,
2018 | | | For the
Year Ended
September 30,
2017 | | | For the
Year Ended
September 30,
2016 | | | For the
Year Ended
September 30,
2015 | | | For the
Year Ended
September 30,
2014 | |
| $ | 9.72 | | | $ | 9.47 | | | $ | 9.17 | | | $ | 10.24 | | | $ | 9.95 | |
| | | | | | | | | | | | | | | | | | | |
| | 0.36 | | | | 0.32 | | | | 0.43 | | | | 0.41 | | | | 0.46 | |
| | (0.16 | ) | | | 0.32 | | | | 0.43 | | | | (0.77 | ) | | | 0.31 | |
| | 0.20 | | | | 0.64 | | | | 0.86 | | | | (0.36 | ) | | | 0.77 | |
| | | | | | | | | | | | | | | | | | | |
| | (0.23 | ) | | | (0.36 | ) | | | (0.54 | ) | | | (0.51 | ) | | | (0.48 | ) |
| | – | | | | – | | | | – | | | | (0.20 | ) | | | – | |
| | (0.11 | ) | | | (0.03 | ) | | | (0.02 | ) | | | – | | | | – | |
| | (0.34 | ) | | | (0.39 | ) | | | (0.56 | ) | | | (0.71 | ) | | | (0.48 | ) |
| | 0.00 | (b) | | | 0.00 | (b) | | | 0.00 | (b) | | | 0.00 | (b) | | | 0.00 | (b) |
| | (0.14 | ) | | | 0.25 | | | | 0.30 | | | | (1.07 | ) | | | 0.29 | |
| $ | 9.58 | | | $ | 9.72 | | | $ | 9.47 | | | $ | 9.17 | | | $ | 10.24 | |
| | | | | | | | | | | | | | | | | | | |
| | 2.07 | % | | | 6.83 | % | | | 9.83 | % | | | (3.76 | %) | | | 7.78 | % |
| | | | | | | | | | | | | | | | | | | |
| $ | 6,758 | | | $ | 7,635 | | | $ | 7,203 | | | $ | 10,368 | | | $ | 16,163 | |
| | | | | | | | | | | | | | | | | | | |
| | 1.79 | %(e) | | | 1.63 | %(e) | | | 1.62 | %(e) | | | 1.61 | %(e) | | | 1.63 | % |
| | 1.61 | %(e) | | | 1.60 | %(e) | | | 1.60 | %(e) | | | 1.61 | %(e) | | | 1.60 | % |
| | | | | | | | | | | | | | | | | | | |
| | 3.60 | %(e) | | | 3.29 | %(e) | | | 4.69 | %(e) | | | 4.14 | %(e) | | | 4.40 | % |
| | | | | | | | | | | | | | | | | | | |
| | 3.78 | %(e) | | | 3.33 | %(e) | | | 4.71 | %(e) | | | 4.14 | %(e) | | | 4.43 | % |
| | | | | | | | | | | | | | | | | | | |
| | 1.78 | %(e) | | | 1.63 | %(e) | | | 1.62 | %(e) | | | 1.60 | %(e) | | | N/A | |
| | 1.60 | %(e) | | | 1.60 | %(e) | | | 1.60 | %(e) | | | 1.60 | %(e) | | | N/A | |
| | | | | | | | | | | | | | | | | | | |
| | 3.59 | %(e) | | | 3.29 | %(e) | | | 4.69 | %(e) | | | 4.15 | %(e) | | | N/A | |
| | | | | | | | | | | | | | | | | | | |
| | 3.77 | %(e) | | | 3.33 | %(e) | | | 4.71 | %(e) | | | 4.15 | %(e) | | | N/A | |
| | 76 | % | | | 121 | % | | | 40 | % | | | 70 | % | | | 91 | % |
| Annual Report | September 30, 2018 | 123 |
| RiverNorth/Oaktree High Income Fund | Class R |
| Financial Highlights | For a share outstanding throughout the periods presented |
| (a) | Based on average shares outstanding during the period. |
| (b) | Less than $0.005 per share. |
| (c) | Total return in the above table represents the rate that the investor would have earned or lost on an investment in the Fund, assuming reinvestment of dividends. |
| (d) | The ratios exclude the impact of expenses of the underlying funds in which the Fund invests as represented in the Schedule of Investments. |
| (e) | The portion of the ratios attributable to recoupments for the periods ended September 30, 2018, September 30, 2017, September 30, 2016 and September 30, 2015 were 0.00%, 0.00%, 0.01% and 0.07%, respectively. |
See Notes to Financial Statements.
| 124 | (888) 848-7569 | www.rivernorth.com |
| RiverNorth Funds | Notes to Financial Statements |
September 30, 2018
1. ORGANIZATION
The RiverNorth Funds (the “Trust” or “Funds”) was established under the laws of Ohio by an Agreement and Declaration of Trust dated July 18, 2006 (the “Trust Agreement”). The Trust is an open-end management investment company registered under the Investment Company Act of 1940, as amended (the “1940 Act”). The Trust Agreement permits the Board of Trustees (the “Board” or “Trustees”) to authorize and issue an unlimited number of shares of beneficial interest of a separate series without par value. All classes of shares for each of the Funds have identical rights to earnings, assets and voting privileges, except for class-specific expenses and exclusive rights to vote on matters affecting only individual classes. The Funds are considered investment companies and therefore follow the Investment Company accounting and reporting guidance of the Financial Accounting Standards Board (“FASB”) Accounting Standards Codification Topic 946 Financial Services Investment Companies.
The RiverNorth Core Opportunity Fund (the “Core Opportunity Fund”) was organized as a diversified series of the Trust on July 18, 2006 and commenced investment operations on December 27, 2006. The Core Opportunity Fund offers two classes of shares, Class I Shares (inception date of August 11, 2014) and Class R Shares (inception date of December 27, 2006). The investment adviser to the Core Opportunity Fund is RiverNorth Capital Management, LLC (the “Adviser”). The investment objective of the Core Opportunity Fund is to seek long-term capital appreciation and income.
The RiverNorth/DoubleLine Strategic Income Fund (the “Strategic Income Fund”) is a diversified series of the Trust and commenced investment operations on December 30, 2010. The Strategic Income Fund offers two classes of shares, Class I Shares and Class R Shares. The investment adviser to the Strategic Income Fund is RiverNorth Capital Management, LLC. The Strategic Income Fund’s sub-adviser is DoubleLine Capital, LP (“DoubleLine”). The investment objective of the Strategic Income Fund is current income and overall total return.
The RiverNorth/Oaktree High Income Fund (the “High Income Fund”) is a diversified series of the Trust and commenced investment operations on December 28, 2012. The High Income Fund offers two classes of shares, Class I Shares and Class R Shares. The investment adviser to the High Income Fund is RiverNorth Capital Management, LLC. The High Income Fund’s sub-adviser is Oaktree Capital Management, L.P. (“Oaktree Capital,” and with DoubleLine, each a “Sub-Adviser” or collectively, the “Sub-Advisers”). The investment objective of the High Income Fund is overall total return consisting of long-term capital appreciation and income.
2. SIGNIFICANT ACCOUNTING POLICIES
The following is a summary of significant accounting policies followed by the Funds. These policies are in conformity with generally accepted accounting principles in the United States of America (“GAAP”). The financial statements are prepared in accordance with GAAP, which requires management to make estimates and assumptions that affect the reported amounts and disclosures in the financial statements during the reporting period. Management believes the estimates and security valuations are appropriate; however, actual results may differ from those estimates, and the security valuations reflected in the financial statements may differ from the value the Funds ultimately realize upon sale of the securities. The financial statements have been prepared as of the close of the New York Stock Exchange (“NYSE”) on the fiscal year end of the Funds.
| Annual Report | September 30, 2018 | 125 |
| RiverNorth Funds | Notes to Financial Statements |
September 30, 2018
Security Valuation: The Funds’ assets and other financial instruments are generally valued at their fair value using market quotations. If a market value quotation is unavailable a security may be valued at its estimated fair value as described in Note 3.
Security Transactions and Related Income: The Funds follow industry practice and record security transactions on the trade date basis. The specific identification method is used for determining gains or losses for financial statements and income tax purposes. Dividend income is recorded on the ex-dividend date or for certain foreign securities, when the information becomes available to the Funds, and interest income and expenses are recorded on an accrual basis. Discounts and premiums on securities purchased are amortized or accreted using the effective interest method. Withholding taxes on foreign dividends have been provided for in accordance with the Funds’ understanding of the applicable country’s tax rules and rates. The ability of issuers of debt securities held by the Funds to meet their obligations may be affected by economic and political developments in a specific country or region. Settlement on bank loans transactions may be in excess of seven business days.
Foreign Currency Translation: The books and records of the Funds are maintained in U.S. dollars. Investment valuations and other assets and liabilities initially expressed in foreign currencies are converted each business day into U.S. dollars based upon current exchange rates. Prevailing foreign exchange rates may generally be obtained at the close of the NYSE (normally, 4:00 p.m. Eastern time). The portion of realized and unrealized gains or losses on investments due to fluctuations in foreign currency exchange rates is not separately disclosed and is included in realized and unrealized gains or losses on investments, when applicable.
Foreign Securities: The Funds may directly purchase securities of foreign issuers. Investing in securities of foreign issuers involves special risks not typically associated with investing in securities of U.S. issuers. The risks include possible revaluation of currencies, the ability to repatriate funds, less complete financial information about companies and possible future adverse political and economic developments. Moreover, securities of many foreign issuers and their markets may be less liquid and their prices more volatile than those of securities of comparable U.S. issuers.
Certain foreign countries impose a capital gains tax which is accrued by the Funds based on the unrealized appreciation, if any, on affected securities. Any accrual would reduce a Fund’s NAV. The tax is paid when the gain is realized and is included in capital gains tax in the Statements of Operations.
Other: The Funds hold certain investments which pay dividends to their shareholders based upon available funds from operations. It is possible for these dividends to exceed the underlying investments’ taxable earnings and profits resulting in the excess portion of such dividends being designated as a return of capital. Distributions received from investments in securities that represent a return of capital or capital gains are recorded as a reduction of the cost of investments or as a realized gain, respectively.
Share Valuation: The net asset value (the “NAV”) is generally calculated as of the close of trading on the New York Stock Exchange (“the Exchange”) (normally 4:00 p.m. Eastern time) every day the Exchange is open. The NAV is calculated by taking the total value of each Fund’s or class’ assets, subtracting their liabilities, and then dividing by the total number of shares outstanding, rounded to the nearest cent. The offering price and redemption price per share is equal to the net asset value per share, except that shares of each Fund are subject to a redemption fee of 2% if redeemed within 90 days of purchase. For the year ended September 30, 2018, the Core Opportunity Fund, Strategic Income Fund, and High Income Fund received redemption fees of $13,800, $75,938, and $280, respectively.
| 126 | (888) 848-7569 | www.rivernorth.com |
| RiverNorth Funds | Notes to Financial Statements |
September 30, 2018
Expenses: Some expenses of the Trust can be directly attributed to a Fund or a Fund specific share class. Expenses which cannot be directly attributed are apportioned among all Funds and Fund series classes in the Trust based on average net assets or another method approved by the Board.
Federal Income Taxes: The Funds make no provision for federal income tax. Each Fund intends to qualify each year as a “regulated investment company” under subchapter M of the Internal Revenue Code of 1986, as amended, by distributing substantially all of its taxable income. If the required amount of net investment income is not distributed, the Funds could incur a tax expense.
As of and during the year ended September 30, 2018, the Funds did not have a liability for any unrecognized tax benefits. The Funds file U.S. federal, state, and local tax returns as required. The Funds’ tax returns are subject to examination by the relevant tax authorities until expiration of the applicable statute of limitations which is generally three years after the filing of the tax return for federal purposes and four years for most state returns. Tax returns for open years have incorporated no uncertain tax positions that require a provision for income taxes.
The Funds recognize interest and penalties, if any, related to unrecognized tax benefits as income tax expenses in the Statements of Operations. During the year the Funds did not incur any interest or penalties.
Distributions to Shareholders: Distributions to shareholders, which are determined in accordance with income tax regulations, are recorded on the ex-dividend date. The treatment for financial reporting purposes of distributions made to shareholders during the year from net investment income or net realized capital gains may differ from their ultimate treatment for federal income tax purposes. These differences are caused primarily by differences in the timing of recognition of certain components of income, expense, or realized capital gain for federal income tax purposes. Where such differences are permanent in nature, they are reclassified in the components of the net assets based on their ultimate characterization for federal income tax purposes. Any such reclassification will have no effect on net assets, results of operations or net asset values per share of the Funds.
3. SECURITIES VALUATION AND FAIR VALUE MEASUREMENTS
Fair value is defined as the price that a Fund might reasonably expect to receive upon selling an investment in a timely transaction to an independent buyer in the principal or most advantageous market of the investment. GAAP establishes a three-tier hierarchy to maximize the use of observable market data and minimize the use of unobservable inputs and to establish classification of fair value measurements for disclosure purposes.
Inputs refer broadly to the assumptions that market participants would use in pricing the asset or liability, including assumptions about risk, for example, the risk inherent in a particular valuation technique used to measure fair value including using such a pricing model and/or the risk inherent in the inputs to the valuation technique. Inputs may be observable or unobservable. Observable inputs are inputs that reflect the assumptions market participants would use in pricing the asset or liability developed based on market data obtained from sources independent of the reporting entity. Unobservable inputs are inputs that reflect the reporting entity’s own assumptions about the assumptions market participants would use in pricing the asset or liability developed based on the best information available in the circumstances.
| Annual Report | September 30, 2018 | 127 |
| RiverNorth Funds | Notes to Financial Statements |
September 30, 2018
Various inputs are used in determining the value of the Funds’ investments. These inputs are summarized in the three broad levels listed below.
| ● | Level 1 – Unadjusted quoted prices in active markets for identical, unrestricted assets or liabilities that a Fund has the ability to access at the measurement date; |
| ● | Level 2 – Quoted prices which are not active, quoted prices for similar assets or liabilities in active markets or inputs other than quoted prices that are observable (either directly or indirectly) for substantially the full term of the asset or liability; and |
| ● | Level 3 – Significant unobservable prices or inputs (including the Funds’ own assumptions in determining the fair value of investments) where there is little or no market activity for the asset or liability at the measurement date. |
The inputs used to measure fair value may fall into different levels of the fair value hierarchy. In such cases, for disclosure purposes, the level in the fair value hierarchy within which the fair value measurement falls in its entirety is determined based on the lowest level input that is significant to the fair value measurement in its entirety.
Equity securities, including common stocks, rights, warrants, closed-end funds, exchange-traded funds, preferred stocks, and business development company notes are generally valued by using market quotations, but may be valued on the basis of prices furnished by a pricing service when the Adviser or a Sub-Adviser believes such prices more accurately reflect the fair market value of such securities. Securities that are traded on any stock exchange are generally valued by the pricing service at the last quoted sale price. Lacking a last sale price, an exchange traded security is generally valued by the pricing service at its last bid price. Securities traded in the NASDAQ over-the-counter market are generally valued by the pricing service at the NASDAQ Official Closing Price. When using the market quotations or close prices provided by the pricing service and when the market is considered active, the security will be classified as a Level 1 security. Sometimes, an equity security owned by the Funds will be valued by the pricing service with factors other than market quotations or when the market is considered inactive. When this happens, the security will be classified as a Level 2 security. When market quotations are not readily available, when the Adviser or a Sub-Adviser determines that the market quotation or the price provided by the pricing service does not accurately reflect the current fair value, or when restricted or illiquid securities are being valued, such securities are valued as determined in good faith by the Adviser, Sub-Adviser, or valuation committee in conformity with guidelines adopted by and subject to review by the Board. These securities will be categorized as Level 3 securities.
Investments in mutual funds, including short-term investments and open-end funds, are generally priced at the ending net asset value (NAV) provided by the service agent of the funds. These securities will be categorized as Level 1 securities.
| 128 | (888) 848-7569 | www.rivernorth.com |
| RiverNorth Funds | Notes to Financial Statements |
September 30, 2018
Domestic and foreign fixed income securities, including foreign and U.S. corporate bonds, U.S. Government bonds and notes, foreign government bonds and notes, supranationals and foreign agencies, non-agency collateralized mortgage obligations, U.S. Government/Agency mortgage backed securities, bank loans, collateralized loan obligations, municipal bonds, and high yield debt, as well as non-exchange traded derivatives, including forward foreign currency contracts and total return swaps, are normally valued on the basis of quotes obtained from brokers and dealers or independent pricing services. Total Return swaps are valued based on a formula of the underlying asset’s nightly value, the Overnight London-Interbank Offered Rate (“USD-LIBOR”) and an annual fee or various agreed upon inputs. Foreign currency positions, including forward foreign currency contracts, are priced at the mean between the closing bid and asked prices at 4:00 p.m. Eastern time. Prices obtained from independent pricing services typically use information provided by market makers or estimates of market values obtained from yield data relating to investments or securities with similar characteristics. Data used to establish quotes includes analysis of cash flows, pre-payment speeds, default rates, delinquency assumptions and assumptions regarding collateral and loss assumptions. These securities will be classified as Level 2 securities.
Short-term investments in fixed income securities, with maturities of less than 60 days when acquired, or which subsequently are within 60 days of maturity, are valued by using the amortized cost method of valuation, which the Board has determined will represent fair value. These securities will be classified as Level 2 securities.
In accordance with the Funds’ good faith pricing guidelines, the Adviser, Sub-Adviser, or valuation committee is required to consider all appropriate factors relevant to the value of securities for which it has determined other pricing sources are not available or reliable as described above. No single standard exists for determining fair value, because fair value depends upon the circumstances of each individual case. As a general principle, the current fair value of an issue of securities being valued by the Adviser, Sub-Adviser, or valuation committee would appear to be the amount which the owner might reasonably expect to receive for them upon their current sale. Methods which are in accordance with this principle may, for example, be based on (i) a multiple of earnings; (ii) discounted cash flow models; (iii) weighted average cost or weighted average price; (iv) a discount from market of a similar freely traded security (including a derivative security or a basket of securities traded on other markets, exchanges or among dealers); or (v) yield to maturity with respect to debt issues, or a combination of these and other methods. Good faith pricing is permitted if, in the Adviser’s, a Sub-Adviser’s, or the valuation committee’s opinion, the validity of market quotations appears to be questionable based on factors such as evidence of a thin market in the security based on a small number of quotations, a significant event occurs after the close of a market but before a Funds’ NAV calculation that may affect a security’s value, or the Adviser or a Sub-Adviser is aware of any other data that calls into question the reliability of market quotations.
Good faith pricing may also be used in instances when the bonds in which the Funds invest default or otherwise cease to have market quotations readily available. Investments in foreign securities, junk bonds, or other thinly traded securities are more likely to trigger good faith pricing than other securities.
| Annual Report | September 30, 2018 | 129 |
| RiverNorth Funds | Notes to Financial Statements |
September 30, 2018
The following is a summary of the inputs used at September 30, 2018 in valuing the Funds’ assets and liabilities:
Core Opportunity Fund
| | | Valuation Inputs | | | | |
| Investments in Securities at Value* | | Level 1 | | | Level 2 | | | Level 3 | | | Total | |
| Closed-End Funds | | $ | 71,339,089 | | | $ | – | | | $ | – | | | $ | 71,339,089 | |
| Common Stocks | | | 7,962,886 | | | | – | | | | – | | | | 7,962,886 | |
| Exchange-Traded Funds | | | 44,860,204 | | | | – | | | | – | | | | 44,860,204 | |
| Preferred Stocks | | | 79,575 | | | | – | | | | – | | | | 79,575 | |
| Business Development Company Notes | | | 1,824,613 | | | | – | | | | – | | | | 1,824,613 | |
| U.S. Government Bonds and Notes | | | – | | | | 4,976,550 | | | | – | | | | 4,976,550 | |
| Rights | | | 88,085 | | | | – | | | | – | | | | 88,085 | |
| Warrants | | | 487,631 | | | | – | | | | – | | | | 487,631 | |
| Total | | $ | 126,642,083 | | | $ | 4,976,550 | | | $ | – | | | $ | 131,618,633 | |
Strategic Income Fund
| | | Valuation Inputs | | | | |
| Investments in Securities at Value* | | Level 1 | | | Level 2 | | | Level 3 | | | Total | |
| Closed-End Funds | | $ | 502,895,321 | | | $ | – | | | $ | – | | | $ | 502,895,321 | |
| Common Stocks | | | 739,123 | | | | – | | | | – | | | | 739,123 | |
| Open-End Funds | | | 28,777,147 | | | | – | | | | – | | | | 28,777,147 | |
| Preferred Stocks | | | 41,739,777 | | | | – | | | | – | | | | 41,739,777 | |
| Business Development Company Notes | | | 20,748,508 | | | | – | | | | – | | | | 20,748,508 | |
| Foreign Corporate Bonds | | | – | | | | 46,990,792 | | | | – | | | | 46,990,792 | |
| U.S. Corporate Bonds | | | – | | | | 64,743,291 | | | | – | | | | 64,743,291 | |
| Foreign Government Bonds and Notes, Supranationals and Foreign Agencies | | | – | | | | 4,708,109 | | | | – | | | | 4,708,109 | |
| Bank Loans | | | – | | | | 33,718,127 | | | | – | | | | 33,718,127 | |
| Collateralized Loan Obligations | | | – | | | | 39,151,170 | | | | – | | | | 39,151,170 | |
| Non-Agency Collateralized Mortgage Obligations | | | – | | | | 525,710,253 | | | | – | | | | 525,710,253 | |
| U.S. Government Bonds and Notes | | | – | | | | 245,514,977 | | | | – | | | | 245,514,977 | |
| Municipal Bonds | | | – | | | | 19,958,306 | | | | – | | | | 19,958,306 | |
| U.S. Government / Agency Mortgage Backed Securities | | | – | | | | 204,397,955 | | | | – | | | | 204,397,955 | |
| Short-Term Investments | | | 99,981,380 | | | | 8,694,608 | | | | – | | | | 108,675,988 | |
| Total | | $ | 694,881,256 | | | $ | 1,193,587,588 | | | $ | – | | | $ | 1,888,468,844 | |
| 130 | (888) 848-7569 | www.rivernorth.com |
| RiverNorth Funds | Notes to Financial Statements |
September 30, 2018
High Income Fund
| | | Valuation Inputs | | | | |
| Investments in Securities at Value* | | Level 1 | | | Level 2 | | | Level 3 | | | Total | |
| Closed-End Funds | | $ | 8,636,363 | | | $ | – | | | $ | – | | | $ | 8,636,363 | |
| Common Stocks | | | 3,362 | | | | – | | | | – | | | | 3,362 | |
| Convertible Preferred Stocks | | | 5,500 | | | | – | | | | – | | | | 5,500 | |
| Preferred Stocks | | | – | | | | – | | | | 75,000 | | | | 75,000 | |
| Bank Loans | | | – | | | | 27,102,582 | | | | – | | | | 27,102,582 | |
| High Yield Debt | | | – | | | | 18,379,342 | | | | – | | | | 18,379,342 | |
| Rights | | | 0 | | | | – | | | | – | | | | 0 | |
| Short-Term Investments | | | 2,867,163 | | | | – | | | | – | | | | 2,867,163 | |
| Total | | $ | 11,512,388 | | | $ | 45,481,924 | | | $ | 75,000 | | | $ | 57,069,312 | |
| | | Valuation Inputs | | | | |
| Other Financial Instruments** | | Level 1 | | | Level 2 | | | Level 3 | | | Total | |
| Assets | | | | | | | | | | | | |
| Forward Foreign Currency Contracts | | $ | – | | | $ | 43,455 | | | $ | – | | | $ | 43,455 | |
| Liabilities | | | | | | | | | | | | | | | | |
| Forward Foreign Currency Contracts | | $ | – | | | $ | (9,265 | ) | | $ | – | | | $ | (9,265 | ) |
| Total | | $ | – | | | $ | 34,189 | | | $ | – | | | $ | 34,189 | |
| * | Refer to each Fund’s Schedule of Investments for a listing of securities by type. |
| ** | Other financial instruments are derivative instruments reflected in the Schedule of Investments. |
The changes of the fair value of investments for which the Funds have used Level 3 inputs to determine the fair value are as follows:
Investments
in Securities | | Balance
as of
October 1,
2017 | | | Change in
Unrealized
Appreciation/
Depreciation | | | Purchases | | | Sales Proceeds | | | Transfer
into Level 3 | | | Transfer
Out of
Level 3 | | | Balance as
of
September 30, 2018 | | | Net change
in unrealized
appreciation/
(depreciation)
included in the
Statements of
Operations
attributable to
Level 3
investments
held at
September 30, 2018 | |
| High Income Fund | | | | | | | | | | | | | | | | | | | | | | | | |
| Preferred Stock | | $ | 75,000 | | | $ | – | | | $ | – | | | $ | – | | | $ | – | | | $ | – | | | $ | 75,000 | | | $ | – | |
| | | $ | 75,000 | | | $ | – | | | $ | – | | | $ | – | | | $ | – | | | $ | – | | | $ | 75,000 | | | $ | – | |
| Annual Report | September 30, 2018 | 131 |
| RiverNorth Funds | Notes to Financial Statements |
September 30, 2018
The Table below provides additional information about the Level 3 Fair Value Measurements as of September 30, 2018:
Quantitative Information about Level 3 Fair Value Measurements
High Income Fund
| Asset Class | Fair Value (USD) | Valuation Technique | Unobservable Inputs(a) | Range |
| Preferred Stock | $75,000 | Market Approach | EBITA Multiple | 9.5-10x |
| (a) | A change to the unobservable input may result in a significant change to the value of the investment as follows: |
| Unobservable Input | Impact to Value if Input Increases | Impact to Value if Input Decreases |
| EBITA Multiple | Increase | Decrease |
There were no transfers into or out of Level 3 during the period.
4. DERIVATIVE FINANCIAL INSTRUMENTS
The following discloses the Funds’ use of derivative instruments. The Funds’ investment objectives not only permit the Funds to purchase investment securities, they also allow the Funds to enter into various types of derivative contracts such as total return swap contracts and forward foreign currency contracts. In doing so, the Funds will employ strategies in differing combinations to permit them to increase, decrease, or change the level or types of exposure to market factors. Central to those strategies are features inherent to derivatives that make them more attractive for this purpose than equity or debt securities; they require little or no initial cash investment, they can focus exposure on only certain selected risk factors, and they may not require the ultimate receipt or delivery of the underlying security (or securities) to the contract. This may allow the Funds to pursue their objectives more quickly and efficiently than if they were to make direct purchases or sales of securities capable of affecting a similar response to market factors.
Market Risk Factors: In pursuit of their investment objectives, the Funds may seek to use derivatives to increase or decrease their exposure to the following market risk factors:
Equity Risk: Equity risk relates to the change in value of equity securities as they relate to increases or decreases in the general market.
Foreign Exchange Rate Risk: Foreign exchange rate risk relates to the change in the U.S. dollar value of a security held that is denominated in a foreign currency. The value of a foreign currency denominated security will decrease as the dollar appreciates against the currency, while the value of the foreign currency denominated security will increase as the dollar depreciates against the currency.
Risk of Investing in Derivatives
The Funds’ use of derivatives can result in losses due to unanticipated changes in the market risk factors and the overall market. Derivatives may have little or no initial cash investment relative to their market value exposure and therefore can produce significant gains or losses in excess of their cost. This use of embedded leverage allows the Funds to increase their market value exposure relative to their net assets and can substantially increase the volatility of the Funds’ performance.
| 132 | (888) 848-7569 | www.rivernorth.com |
| RiverNorth Funds | Notes to Financial Statements |
September 30, 2018
Additional associated risks from investing in derivatives also exist and potentially could have significant effects on the valuation of the derivative and the Funds. Typically, the associated risks are not the risks that the Funds are attempting to increase or decrease exposure to, per their investment objectives, but are the additional risks from investing in derivatives.
Examples of these associated risks are liquidity risk, which is the risk that the Funds will not be able to sell the derivative in the open market in a timely manner, and counterparty credit risk, which is the risk that the counterparty will not fulfill its obligation to the Funds.
Forward Foreign Currency Contracts
The Funds may engage in currency transactions with counterparties to hedge the value of portfolio securities denominated in particular currencies against fluctuations in relative value, to gain or reduce exposure to certain currencies, or to generate income or gains. A forward foreign currency contract is an agreement between two parties to buy and sell a currency at a set price on a future date. During the year ended September 30, 2018, the High Income Fund engaged in forward foreign currency contracts. The contracts are marked-to-market daily and the change in value is recorded by the High Income Fund as an unrealized gain or loss. When a forward foreign currency contract is extinguished, through either delivery or offset by entering into another forward foreign currency contract, the High Income Fund records a realized gain or loss equal to the difference between the value of the contract at the time it was opened and the value of the contract at the time it was extinguished.
Forward foreign currency contracts involve elements of market risk in excess of the amounts reflected in the Statement of Assets and Liabilities. The High Income Fund bears the risk of an unfavorable change in the foreign exchange rate underlying the forward foreign currency contract. Risks may also arise upon entering into these contracts from the potential inability of the counterparties to meet the terms of their contracts.
If required by the forward foreign currency contracts, the High Income Fund has segregated sufficient assets as collateral to satisfy the current obligations with respect to forward foreign currency contracts, and this is reflected as Cash segregated at custodian for forward foreign currency contracts on the High Income Fund’s Statement of Assets and Liabilities.
Total Return Swaps
Certain Funds may enter into total return swaps. Total return swaps are agreements that provide the Funds with a return based on the performance of an underlying asset (called a “reference asset”), in exchange for fee payments to a counterparty based on a specific rate of return. The difference in the value of these income streams is recorded daily by the Funds, and is settled in cash periodically. The fee paid by the Funds will typically be determined by multiplying the face value of the swap agreement by an agreed upon interest rate. Generally, the basis of the total return swap is the unamortized premium received or paid. The periodic swap payments received or made by the Funds are recorded in the Statement of Operations as realized gains or losses, respectively. When the swap is terminated, the Funds will record a realized gain or loss equal to the difference between the proceeds from (or cost of) the closing transaction and the Funds’ basis in the contract, if any. In addition, if the reference asset declines in value over the term of the swap, the Funds would also be required to pay the dollar value of that decline to the counterparty. Total return swaps could result in losses if the reference asset does not perform as anticipated by the Adviser. The Funds may use its own net asset value or the net asset value of a similar fund as the reference asset in a total return swap. This strategy serves to reduce “cash drag” (the impact of uninvested cash on the Fund’s overall return) by replacing it with the total return of the Fund’s own, or a similar fund’s investment holdings. The Funds record fluctuations in the value of open swap contracts on a daily basis as unrealized gains or losses. No Funds invested in swaps during the fiscal year ended September 30, 2018.
| Annual Report | September 30, 2018 | 133 |
| RiverNorth Funds | Notes to Financial Statements |
September 30, 2018
International Swaps and Derivatives Association, Inc. Master Agreements (“ISDA Master Agreements”) govern OTC financial derivative transactions entered into by a Fund and those counterparties. The ISDA Master Agreements maintain provisions for general obligations, representations, agreements, collateral and events of default or termination. Events of termination include conditions that may entitle counterparties to elect to terminate early and cause settlement of all outstanding transactions under the applicable ISDA Master Agreement.
If required by the swap agreement, the Funds have segregated sufficient assets as collateral to satisfy the current obligations with respect to total return swaps, and this is reflected as Cash segregated at custodian for total return swap contracts on each Fund's respective Statement of Assets and Liabilities.
The effect of derivatives instruments on each Fund's Statement of Assets and Liabilities as of September 30, 2018:
| | | | | Asset Derivatives | |
| Fund | | Risk Exposure | | Statement of Assets
and Liabilities Location | | | Fair Value | |
| High Income Fund | | Foreign exchange rate risk (Forward foreign currency contracts) | | Unrealized appreciation on forward foreign currency contracts | | $ | 43,455 | |
| | | | | Liabilities Derivatives | |
| Fund | | Risk Exposure | | Statement of Assets and
Liabilities Location | | | Fair Value | |
| High Income Fund | | Foreign exchange rate risk (Forward foreign currency contracts) | | Unrealized depreciation on forward foreign currency contracts | | $ | (9,265 | ) |
| 134 | (888) 848-7569 | www.rivernorth.com |
| RiverNorth Funds | Notes to Financial Statements |
September 30, 2018
The effect of derivatives instruments on each Fund's Statement of Operations for the year ended September 30, 2018:
| Fund | | Risk Exposure | | Statement of Operations Location | | Realized Gain/(Loss)
on Derivatives
Recognized in Income | | | Change in
Unrealized
Appreciation/
(Depreciation)
on Derivatives
Recognized in Income | |
| High Income Fund | | Foreign exchange rate risk (Forward foreign currency contracts) | | Net realized gain/(loss) on Forward Foreign Currency Contracts/ Net change in unrealized appreciation/ depreciation on Forward Foreign Currency Contracts | | $ | 748,292 | | | $ | 35,448 | |
The forward currency contracts average notional amount during the year ended September 30, 2018, is noted below.
| Fund | | | Average Notional
Amount of
Forward Foreign
Currency Contracts | |
| High Income Fund | | | $ | 13,808,629 | |
Offsetting Arrangements: Certain derivative contracts are executed under standardized netting agreements. A derivative netting arrangement creates an enforceable right of set-off that becomes effective, and affects the realization of settlement on individual assets, liabilities and collateral amounts, only following a specified event of default or early termination. Default events may include the failure to make payments or deliver securities timely, material adverse changes in financial condition or insolvency, the breach of minimum regulatory capital requirements, or loss of license, charter or other legal authorization necessary to perform under the contract. These agreements mitigate counterparty credit risk by providing for a single net settlement with a counterparty of all financial transactions covered by the agreement in an event of default as defined under such agreement.
| Annual Report | September 30, 2018 | 135 |
| RiverNorth Funds | Notes to Financial Statements |
September 30, 2018
The following table presents derivative financial instruments that are subject to enforceable netting arrangements, collateral arrangements or other similar agreements as of September 30, 2018.
Offsetting of Derivatives Asset
| | | | | | | | | | | | Gross Amounts
Not Offset in the
Statements of
Assets and Liabilities | |
| | | Gross
Amounts of
Recognized
Assets | | | Gross Amounts
Offset in the
Statements of
Assets and Liabilities | | | Net Amounts
Presented in the
Statements of
Assets and Liabilities | | | Financial
Instruments
Available
for Offset(a) | | | Cash Collateral
Received(a) | | | Net Amount | |
| High Income Fund | | | | | | | | | | | | | | | | | | |
| Forward Foreign Currency Contracts | | $ | 43,455 | | | $ | – | | | $ | 43,455 | | | $ | (9,265 | ) | | $ | – | | | $ | 34,190 | |
| Total | | $ | 43,455 | | | $ | – | | | $ | 43,455 | | | $ | (9,265 | ) | | $ | – | | | $ | 34,190 | |
Offsetting of Derivatives Liability
| | | | | | | | | | | | Gross Amounts
Not Offset in the
Statement of
Assets and Liabilities | |
| | | Gross
Amounts of
Recognized
Liabilities | | | Gross Amounts
Offset in the
Statement of
Assets and Liabilities | | | Net Amounts
Presented in the
Statement of
Assets and Liabilities | | | Financial
Instruments
Available
for Offset(a) | | | Cash Collateral
Pledged(a) | | | Net Amount | |
| High Income Fund | | | | | | | | | | | | | | | | | | |
| Forward Foreign Currency Contracts | | $ | 9,265 | | | $ | – | | | $ | 9,265 | | | $ | (9,265 | ) | | $ | – | | | $ | – | |
| Total | | $ | 9,265 | | | $ | – | | | $ | 9,265 | | | $ | (9,265 | ) | | $ | – | | | $ | – | |
| (a) | These amounts are limited to the derivatives asset/liability balance and, accordingly, do not include excess collateral received/pledged. |
| 136 | (888) 848-7569 | www.rivernorth.com |
| RiverNorth Funds | Notes to Financial Statements |
September 30, 2018
5. LOAN PARTICIPATIONS AND ASSIGNMENTS
The Strategic Income Fund and High Income Fund may each invest in direct debt instruments which are interests in amounts owed to lenders or lending syndicates by corporate, governmental, or other borrowers. The Strategic Income Fund and High Income Fund will normally invest in corporate debt issuers in North America and Europe. The Strategic Income Fund and High Income Fund investments in loans may be in the form of participations in loans or assignments of all or a portion of loans from third parties. A loan is often administered by a bank or other financial institution (the “lender”) that acts as agent for all holders. The agent administers the terms of the loan, as specified in the loan agreement. The Strategic Income Fund and High Income Fund may each invest in multiple series or tranches of a loan, which may have varying terms and carry different associated risks. The Strategic Income Fund and High Income Fund will generally purchase assignments of these loans, in which case they will typically become lenders for purposes of the relevant loan agreement with direct contractual rights against the borrower, including the right to receive payments of principal and interest. When purchasing participation interests in a loan, the Strategic Income Fund and High Income Fund generally have no right to enforce compliance with the terms of the loan agreement with the borrower. As a result, the Strategic Income Fund and High Income Fund may each be subject to the credit risk of both the borrower and the lender that is selling the loan agreement. The Strategic Income Fund and High Income Fund may each enter into unfunded loan commitments, which are contractual obligations for future funding. Unfunded loan commitments represent a future obligation in full, even though a percentage of the notional loan amounts may not be utilized by the borrower. When investing in a loan participation, the Strategic Income Fund and High Income Fund have the right to receive payments of principal, interest and any fees to which it is entitled only from the lender selling the loan agreement and only upon receipt of payments by the lender from the borrower. The Strategic Income Fund and High Income Fund may each receive a commitment fee based on the undrawn portion of the underlying line of credit portion of a floating rate loan. In certain circumstances, the Strategic Income Fund and High Income Fund may each receive a penalty fee upon the prepayment of a floating rate loan by a borrower. Fees earned are recorded as a component of interest income or interest expense, respectively, on the Statements of Operations. At September 30, 2018, the Strategic Income Fund and High Income Fund had $9,220,000 and $1,767,583, respectively, in unsettled domestic and foreign loan commitments.
6. ADVISORY FEES, TRUSTEE FEES AND OTHER AGREEMENTS
The Adviser serves as the investment adviser to the Funds. Under the terms of the management agreement (the “Agreement”), the Adviser, subject to the supervision of the Board, provides or arranges to be provided to the Funds such investment advice as it deems advisable and will furnish or arrange to be furnished a continuous investment program for the Funds consistent with the Funds’ investment objectives and policies. As compensation for its management services, the Funds are obligated to pay the Adviser a fee computed and accrued daily and paid monthly in arrears at an annual rate of the average daily net assets of the Funds.
The Chief Compliance Officer (“CCO”) of the Funds is an affiliate of the Funds. For the year ended September 30, 2018, the total related amounts paid by the Funds for CCO fees are included in Compliance expenses on each Funds’ Statement of Operations.
| Annual Report | September 30, 2018 | 137 |
| RiverNorth Funds | Notes to Financial Statements |
September 30, 2018
The following table reflects the Funds’ contractual management fee rates (expressed as an annual rate).
| Fund | Contractual Management Fee |
| Core Opportunity Fund | 1.00% |
| Strategic Income Fund | 0.75% |
| High Income Fund | 1.00% |
The Adviser has contractually agreed to waive the High Income Fund’s management fees and/or reimburse expenses (excluding brokerage fees and commissions; borrowing costs such as (a) interest and (b) dividends on securities sold short; taxes; indirect expenses incurred by the underlying funds in which the Fund invests; and extraordinary expenses) of the High Income Fund until at least January 31, 2019 in order to maintain the Total Annual Fund Operating Expenses After Fee Deferral and/or Reimbursement at 1.60% and 1.35% for the Class R shares and Class I shares, respectively. This agreement may be terminated by the Fund’s Board of Trustees on 60 days written notice to the Adviser. Any waiver or reimbursement is subject to repayment by the High Income Fund within three years following the fiscal year in which the expenses occurred if the Fund is able to make the repayment without exceeding its current expense limitation and the repayment is approved by the Board of Trustees.
As of the year ended September 30, 2018, reimbursed expenses for the High Income Fund subject to potential recovery by year of expiration are as follows:
| | | Expiring September 30, | |
| | | 2019 | | | 2020 | | | 2021 | |
| High Income Fund | | | | | | | | | |
| Class I | | | N/A | | | | N/A | | | $ | 98,502 | |
| Class R | | $ | 1,430 | | | $ | 2,773 | | | $ | 13,126 | |
| Total | | $ | 1,430 | | | $ | 2,773 | | | $ | 111,628 | |
For the year ended September 30, 2018, the Adviser opted to forgo $164,526 in management fees in the Strategic Income Fund related to the Fund's investment in an affiliate fund, the High Income Fund. This waiver of affiliated management fees is reflected net within the Investment Adviser Fee on the Statement of Operations.
DoubleLine is the investment sub-adviser to the Strategic Income Fund. Oaktree Capital is the investment sub-adviser to the High Income Fund. Under the terms of the sub-advisory agreements, the Sub-Advisers, subject to the supervision of the Adviser and the Board of the Trust, provide to the Strategic Income Fund and the High Income Fund such investment advice as deemed advisable and will furnish a continuous investment program for the portion of assets managed in the respective Fund consistent with the respective Fund's investment objective and policies. As compensation for its sub-advisory services, the Adviser is obligated to pay each Sub-Adviser a fee computed and accrued daily and paid monthly in arrears based on an annual rate of the average daily net assets of the Strategic Income Fund and the High Income Fund.
ALPS Fund Services, Inc. (“ALPS”) provides the Funds with fund administration and fund accounting services. ALPS also serves as transfer agent, dividend paying and shareholder servicing agent for the Funds (“Transfer Agent”).
State Street Bank & Trust, Co. serves as the Funds’ custodian.
The Funds have adopted a plan pursuant to Rule 12b-1 under the Investment Company Act of 1940, as amended (the “Plan”). The Plan permits the Funds to pay the Adviser for distribution and promotion expenses related to marketing shares of the Funds. The amount payable annually by the Class R shares of the Core Opportunity Fund, the Class R Shares of the Strategic Income Fund, and the Class R Shares of the High Income Fund is 0.25% of the average daily net assets. Under the Plan the Trust may engage in any activities related to the distribution of Fund shares. The expenses of the Funds’ Plan are reflected as 12b-1 fees in the Statements of Operations.
| 138 | (888) 848-7569 | www.rivernorth.com |
| RiverNorth Funds | Notes to Financial Statements |
September 30, 2018
The Funds have entered into a Distribution Agreement with ALPS Distributors, Inc. (“the Distributor”), an affiliate of ALPS, to provide distribution services to the Funds. The Distributor serves as underwriter/distributor of shares of the Funds. DST Systems, Inc. (‘‘DST’’), the parent company of AFS, is a wholly-owned subsidiary of SS&C Technologies Holdings, Inc., a publicly traded company listed on the NASDAQ Global Select Market, which acquired DST in a transaction which closed on April 16, 2018.
Officers of the Trust and Trustees who are “interested persons” of the Trust or the Adviser received no salary or fees from the Trust. Each Trustee who is not an “interested person” receives a fee of $36,000 per year, plus $1,500 per meeting attended from the Trust. In addition, the chair of the audit committee receives $500 annually and the lead independent Trustee receives $250 annually. The Trust reimburses each Trustee and Officer for his or her travel and other expenses relating to attendance at such meetings. The Trustees are also compensated for their services as independent directors of other funds within the fund complex.1
A Trustee and certain Officers of the Trust are also employees of the Adviser, the Distributor or ALPS Fund Services, Inc.
| 1 | The Fund Complex consists of the RiverNorth Core Opportunity Fund, the RiverNorth/DoubleLine Strategic Income Fund, and the RiverNorth/Oaktree High Income Fund, each a series of the RiverNorth Funds Trust, and the RiverNorth Opportunities Fund, Inc., RiverNorth/DoubleLine Strategic Opportunity Fund, Inc., the RiverNorth Marketplace Lending Corporation, and the RiverNorth Opportunistic Municipal Income Fund, Inc. |
7. TAX BASIS INFORMATION
Tax Basis of Distributions to Shareholders: The character of distributions made during the year from net investment income or net realized gains may differ from its ultimate characterization for federal income tax purposes. Also, due to the timing of dividend distributions, the fiscal year in which amounts are distributed may differ from the fiscal year in which the income or realized gain were recorded by a Fund.
The tax character of distributions paid by the Funds during the fiscal year ended September 30, 2018, was as follows:
| | | | Ordinary
Income | | | Tax-Exempt
Income | | | Distributions
paid from
Long-Term
Capital Gain | | | Return of
Capital | | | Total | |
| Core Opportunity Fund* | | | $ | 7,867,901 | | | $ | 135,673 | | | $ | 41,398,933 | | | $ | – | | | $ | 49,402,507 | |
| Strategic Income Fund* | | | | 100,095,220 | | | | – | | | | 7,270,309 | | | | 1,899,952 | | | | 109,265,481 | |
| High Income Fund* | | | | 1,503,303 | | | | – | | | | – | | | | 731,596 | | | | 2,234,899 | |
| Annual Report | September 30, 2018 | 139 |
| RiverNorth Funds | Notes to Financial Statements |
September 30, 2018
The tax character of distributions paid by the Funds during the fiscal year ended September 30, 2017, was as follows:
| | | | Ordinary
Income | | | Tax-Exempt
Income | | | Distributions
paid from
Long-Term
Capital Gain | | | Return of
Capital | | | Total | |
| Core Opportunity Fund* | | | $ | 13,479,295 | | | $ | 23,723 | | | $ | 10,177,520 | | | $ | – | | | $ | 23,680,538 | |
| Strategic Income Fund* | | | | 95,846,805 | | | | 529,827 | | | | 1,140,967 | | | | – | | | | 97,517,599 | |
| High Income Fund* | | | | 3,223,946 | | | | – | | | | – | | | | 286,026 | | | | 3,509,972 | |
| * | Classification of Distributions: Net investment income and net realized gain may differ for financial statement and tax purposes. The character of distributions made during the year from net investment income or net realized gains may differ from its ultimate characterization for federal income tax purposes. |
Components of Distributable Earnings on a Tax Basis: The tax components of distributable earnings are determined in accordance with income tax regulations which may differ from the composition of net assets reported under GAAP. Accordingly, for the year ended September 30, 2018, certain differences were reclassified. These differences were primarily due to prior year true up, redemption in-kind, book/tax distribution differences, tax treatment of passive foreign investment companies, principle payments, and to the different tax treatment of certain other investments; the amounts reclassified did not affect net assets. The reclassifications were as follows:
| | | | Paid-in Capital | | | Total Distributable Earnings | |
| Core Opportunity Fund | | | $ | (69,553 | ) | | $ | 69,553 | |
| Strategic Income Fund | | | | – | | | | – | |
| High Income Fund | | | | (14,517 | ) | | | 14,517 | |
At September 30, 2018, the components of distributable earnings on a tax basis for the Funds were as follows:
| | | Undistributed Ordinary Income | | | Accumulated Capital Gains/(Losses) | | | Net Unrealized Appreciation/ (Depreciation) | | | Other Cumulative Effect of Timing Differences | | | Total | |
| Core Opportunity Fund | | $ | 1,675,344 | | | $ | 25,113,249 | | | $ | 7,098,879 | | | $ | – | | | $ | 33,887,472 | |
| Strategic Income Fund | | | – | | | | (7,990,620 | ) | | | (126,478,548 | ) | | | (6,174,641 | ) | | | (140,643,809 | ) |
| High Income Fund | | | – | | | | (3,598,960 | ) | | | (592,379 | ) | | | (34,190 | ) | | | (4,225,529 | ) |
Capital Losses: As of September 30, 2018 the following Funds had capital loss carryforwards which may reduce the applicable Fund’s taxable income arising from future net realized gains on investments, if any, to the extent permitted by the Code and thus may reduce the amount of the distributions to shareholders which would otherwise be necessary to relieve the Funds of any liability for federal tax pursuant to the Code. The capital loss carryforwards may be carried forward indefinitely. Other cumulative effect of timing differences were primarily due to treatment of defaulted security and to the different tax treatment of certain other investments.
| 140 | (888) 848-7569 | www.rivernorth.com |
| RiverNorth Funds | Notes to Financial Statements |
September 30, 2018
Capital losses carried forward were as follows:
| Fund | | | Non-Expiring Short-Term | | | Non-Expiring Long-Term | |
| High Income Fund | | | $ | 705,759 | | | $ | 2,390,720 | |
The Strategic Income Fund and the High Income Fund have elected to defer to the year ending September 30, 2019, capital losses recognized during the period November 1, 2017 to September 30, 2018, in the amount of $7,990,620 and $502,481.
Unrealized Appreciation and Depreciation on Investments: The amount of net unrealized appreciation/(depreciation) and the cost of investment securities for tax purposes, including short-term securities at September 30, 2018, were as follows:
| Fund | | | Gross Appreciation (excess of value over tax) | | | Gross Depreciation (excess of tax cost over value) | | | Net Appreciation on Foreign Currency and Derivatives | | | Net Unrealized Appreciation/ (Depreciation) | | | Cost of Investments for Income Tax Purposes | |
| Core Opportunity Fund* | | | $ | 9,277,317 | | | $ | (2,178,438 | ) | | $ | – | | | $ | 7,098,879 | | | $ | 124,519,754 | |
| Strategic Income Fund* | | | | 45,188,770 | | | | (171,667,318 | ) | | | – | | | | (126,478,548 | ) | | | 2,014,947,392 | |
| High Income Fund* | | | | 499,440 | | | | (1,109,501 | ) | | | 17,682 | | | | (592,379 | ) | | | 57,679,373 | |
| * | The difference between book and tax basis unrealized appreciation/(depreciation) for the Funds is attributable primarily to PFIC’s, wash sales and tax treatment of certain other investments. |
8. INVESTMENT TRANSACTIONS
Investment transactions for the year ended September 30, 2018, excluding U.S. Government Obligations and short-term investments, were as follows:
| Fund | | | Purchases of Securities | | | Proceeds from Sales of Securities | |
| Core Opportunity Fund | | | $ | 114,645,912 | | | $ | 232,010,186 | * |
| Strategic Income Fund | | | | 523,198,532 | | | | 421,881,101 | |
| High Income Fund | | | | 44,068,075 | | | | 50,872,244 | |
| * | Does not include redemption in-kind. See Note 10. |
| Annual Report | September 30, 2018 | 141 |
| RiverNorth Funds | Notes to Financial Statements |
September 30, 2018
Investment Transactions in U.S. Government Obligations for the year ended September 30, 2018 were as follows:
| Fund | | | Purchases of Securities | | | Proceeds from Sales of Securities | |
| Core Opportunity Fund | | | $ | 15,039,242 | | | $ | 10,094,176 | |
| Strategic Income Fund | | | | 288,085,728 | | | | 230,654,640 | |
9. INVESTMENTS IN AFFILIATED COMPANIES
Funds may invest in certain securities that are considered securities issued by affiliated companies. As defined by the Investment Company Act of 1940, an affiliated person, including an affiliated company, is one in which a Fund owns 5% or more of the outstanding voting securities, or a company which is under common ownership or control with the Fund. The purchases, sales, dividend income, capital gains, shares and value of investment in affiliated companies for the year ended September 30, 2018 were as follows:
Strategic Income Fund
| Security Name | | Share
Balance as of
September
30, 2017 | | | Purchases | | | Sales | | | Share
Balance as of September 30, 2018 | | | Value as of
September
30, 2018 | | | Dividends | | | Change in
Unrealized
Gain (Loss) | | | Realized
Gain
(Loss) | |
| RiverNorth/Oaktree High Income Fund, Class I | | | 2,893,133 | | | | 110,525 | | | | – | | | | 3,003,658 | | | $ | 28,777,147 | | | $ | 960,199 | | | $ | (312,699 | ) | | $ | – | |
| | | | | | | | | | | | | | | | | | | $ | 28,777,147 | | | $ | 960,199 | | | $ | (312,699 | ) | | $ | – | |
10. RELATED PARTY TRANSACTIONS
The Funds are permitted to purchase and sell securities from or to certain affiliates under specific conditions outlined in the Rule 17a-7 procedures adopted by the Board. The procedures are designed to ensure that any purchase or sale of securities by a Fund from or to another fund that is or could be considered an affiliate by virtue of having a common investment adviser (or affiliated investment advisers), common trustees and/or common officers complies with Rule 17a-7 under the 1940 Act. Each transaction is effected at the current market price as defined in the Rule 17a-7 procedures. During th year ended September 30, 2018, the RiverNorth Core Opportunity Fund made in-kind redemptions of securities with the Brinker Destinations Multi-Strategy Alternatives Fund (the “Brinker Fund”), which is an affiliated fund due to the Adviser’s engagement as a subadviser to the Brinker Fund. The intent of the transactions was to save on transaction costs for both the Brinker Fund and for the RiverNorth Core Opportunity Fund on the sale of assets. The in-kind redemption transactions of 3,623,914 shares were in the amount of $75,486,564, of which $30,008,566 was the market value of securities, with a realized loss of $27,171. There were no in-kind purchases and no other in-kind transactions during the year.
| 142 | (888) 848-7569 | www.rivernorth.com |
| RiverNorth Funds | Notes to Financial Statements |
September 30, 2018
11. REVOLVING LINE OF CREDIT
On April 8, 2014, the Funds entered into a $100,000,000 committed unsecured Revolving Credit Agreement with State Street Bank & Trust, Co. The Revolving Credit Agreement was amended on April 17, 2015, April 5, 2016, April 4, 2017 and on April 3, 2018. The Revolving Credit Agreement expires on April 2, 2019. Borrowings under this arrangement bear interest at the higher of the Federal Funds Rate and the One-Month LIBOR Rate in effect on the day the loan is made plus 1.25%, which is 3.51% at September 30, 2018. From October 1, 2017 through September 30, 2018, the Funds paid a facility fee on unloaned balances equal to the product of $100,000,000 less the principal amount of loans outstanding and 0.25%. The Revolving Credit Agreement expires on April 2, 2019. For the year ended September 30, 2018, the High Income Fund borrowed $1,500,000 from April 16, 2018 to May 14, 2018 at an interest rate of 3.16%. These amounts reflect the average borrowing amount, maximum borrowed amount, and average interest rate during the year for the days the Fund borrowed. No other Fund borrowed under the agreement during the year presented.
12. BENEFICIAL OWNERSHIP
On September 30, 2018, there were an unlimited number of no par value shares of beneficial interest authorized for each Fund. Transactions in shares of beneficial interest are shown in the Statements of Changes in Net Assets.
The beneficial ownership, either directly or indirectly, of more than 25% of the voting securities of a fund creates a presumption of control of the fund, under Section 2(a)(9) of the Investment Company Act of 1940. Beneficial owners owning more than 25% of the voting securities for the benefit of their customers of each class of each Fund, as of September 30, 2018, are listed below:
| Fund | Shareholder Name | Percentage Interest |
| Core Opportunity Fund - Class I | National Financial Services, LLC | 44.32% |
| Core Opportunity Fund - Class R | Charles Schwab & Company, Inc. | 26.83% |
| Core Opportunity Fund - Class R | National Financial Services, LLC | 26.37% |
| Strategic Income Fund - Class I | Charles Schwab & Company, Inc. | 35.57% |
| Strategic Income Fund - Class R | Charles Schwab & Company, Inc. | 40.15% |
| High Income Fund - Class I | RiverNorth Doubleline Strategic Income Fund | 57.75% |
| High Income Fund - Class R | Charles Schwab & Company, Inc. | 57.11% |
13. INDEMNIFICATIONS
Under the Trust’s organizational documents, its officers and Trustees are indemnified against certain liability arising out of the performance of their duties to the Trust. Additionally, in the normal course of business, the Trust enters into contracts with service providers that may contain general indemnification clauses. The Trust’s maximum exposure under these arrangements is unknown, as this would involve future claims that may be made against the Trust that have not yet occurred.
| Annual Report | September 30, 2018 | 143 |
| RiverNorth Funds | Notes to Financial Statements |
September 30, 2018
14. SEC REGULATIONS
On October 4, 2018, the SEC amended Regulation S-X to require certain financial statement disclosure requirements to conform them to US Generally Accepted Accounting Principles for investment companies. Effective November 4, 2018, the Fund adopted disclosure requirement changes for Regulation S-X and these changes are reflected throughout this report. The Funds’ adoption of those amendments, effective with the financial statements prepared as of September 30, 2018, had no effect on the Funds’ net assets or results of operations.
15. NEW ACCOUNTING PRONOUNCEMENTS
In March 2017, the Financial Accounting Standards Board (“FASB”) issued Accounting Standards Update “Premium Amortization on Purchased Callable Debt Securities” which amends the amortization period for a callable debt security held at a premium from the maturity date to the earliest call date. The guidance is effective for annual periods beginning after December 15, 2018, and interim periods within those annual periods. At this time, management is evaluating the implications of these changes on the funds.
| 144 | (888) 848-7569 | www.rivernorth.com |
| | Report of Independent Registered |
| RiverNorth Funds | Public Accounting Firm |
September 30, 2018
To the Shareholders and Board of Trustees of
RiverNorth Funds
Opinion on the Financial Statements
We have audited the accompanying statements of assets and liabilities, including the schedules of investments, of RiverNorth Funds, comprising RiverNorth Core Opportunity Fund, RiverNorth/DoubleLine Strategic Income Fund, and RiverNorth/Oaktree High Income Fund (the “Funds”), as of September 30, 2018, and the related statements of operations for the year then ended, the statements of changes in net assets for each of the two years in the period then ended, including the related notes, and the financial highlights for each of the five years in the period then ended (collectively referred to as the “financial statements”). In our opinion, the financial statements present fairly, in all material respects, the financial position of the each of the Funds as of September 30, 2018, the results of their operations for the year then ended, the changes in their net assets for each of the two years in the period then ended, and the financial highlights for each of the five years in the period then ended, in conformity with accounting principles generally accepted in the United States of America.
Basis for Opinion
These financial statements are the responsibility of the Funds’ management. Our responsibility is to express an opinion on the Funds’ financial statements based on our audits. We are a public accounting firm registered with the Public Company Accounting Oversight Board (United States) (“PCAOB”) and are required to be independent with respect to the Funds in accordance with the U.S. federal securities laws and the applicable rules and regulations of the Securities and Exchange Commission and the PCAOB.
We conducted our audits in accordance with the standards of the PCAOB. Those standards require that we plan and perform the audit to obtain reasonable assurance about whether the financial statements are free of material misstatement, whether due to error or fraud.
Our audits include performing procedures to assess the risks of material misstatement of the financial statements, whether due to error or fraud, and performing procedures that respond to those risks. Such procedures include examining, on a test basis, evidence regarding the amounts and disclosures in the financial statements and confirmation of securities owned as of September 30, 2018, by correspondence with the custodian, agent banks, and brokers, or by other appropriate auditing procedures where replies from agent banks or brokers were not received. Our audits also included evaluating the accounting principles used and significant estimates made by management, as well as evaluating the overall presentation of the financial statements. We believe that our audits provide a reasonable basis for our opinion.
We have served as the auditor of one or more of RiverNorth Capital Management, LLC’s investment companies since 2006.

COHEN & COMPANY, LTD.
Cleveland, Ohio
November 29, 2018
| Annual Report | September 30, 2018 | 145 |
| RiverNorth Funds | Additional Information |
September 30, 2018 (Unaudited)
PROXY VOTING GUIDELINES
A description of the policies and procedures that the Funds used to determine how to vote proxies relating to portfolio securities and information regarding how the Funds voted proxies during the most recent 12-month period ended June 30, are available without charge upon request by (1) calling the Funds at (888) 848-7569 and (2) from Form N-PX filed by the Funds with the Securities and Exchange Commission (“SEC”) on the SEC’s website at www.sec.gov.
PORTFOLIO HOLDINGS DISCLOSURE POLICY
The Funds file a complete schedule of investments with the SEC for the first and third quarter of each fiscal year on Form N-Q. The Funds’ first and third fiscal quarters end on December 31 and June 30. The Form N-Q filing must be made within 60 days of the end of the quarter. The Funds’ Forms N-Q are available on the SEC’s website at www.sec.gov, or they may be reviewed and copied at the SEC’s Public Reference Room in Washington, DC (call 1-800-732-0330 for information on the operations of the Public Reference Room). You may also obtain copies by calling the Funds at 1-888-848-7569.
UNAUDITED TAX INFORMATION
The RiverNorth Core Opportunity Fund designated the following for federal income tax purposes for the year ended September 30, 2018:
| | Foreign Taxes Paid | Foreign Source Income |
| RiverNorth Core Opportunity Fund | $89,678 | $828,906 |
| | Tax-Exempt Percentage |
| RiverNorth Core Opportunity Fund | 2.59% |
Of the distributions paid by the Funds from ordinary income for the calendar year ended December 31, 2017, the following percentages met the requirements to be treated as qualifying for the corporate dividends received deduction and qualified dividend income:
| | Dividend Received Deduction | Qualified Dividend Income |
| RiverNorth Core Opportunity Fund | - | 28.17% |
| RiverNorth/DoubleLine Strategic Income Fund | - | 1.20% |
| RiverNorth/Oaktree High Income Fund | - | 0.74% |
In early 2018, if applicable, shareholders of record received this information for the distributions paid to them by the Funds during the calendar year 2017 via Form 1099. The Funds will notify shareholders in early 2019 of amounts paid to them by the Funds, if any, during the calendar year 2018.
| 146 | (888) 848-7569 | www.rivernorth.com |
| RiverNorth Funds | Additional Information |
September 30, 2018 (Unaudited)
Pursuant to Section 852(b)(3) of the Internal Revenue Code, RiverNorth Core Opportunity Fund and RiverNorth/DoubleLine Strategic Income Fund, designated $41,398,933 and $7,270,309 respectively, as long-term capital gain dividends.
| Annual Report | September 30, 2018 | 147 |
| RiverNorth Funds | Trustees and Officers |
September 30, 2018 (Unaudited)
The following table provides information regarding each Trustee who is not an “interested person” of the Trust, as defined in the 1940 Act.
INDEPENDENT TRUSTEES
Name,
Address1
and Year
of Birth | Position(s)
Held with
the Fund | Term of
Office/
Length
of Time
Served | Principal Occupation(s)
During Past 5 Years | Number of
Portfolios
in Fund
Complex
Overseen
by Trustee2 | Other Directorships
Held by Trustee During
the Past 5 Years |
John K. Carter
Y.O.B. 1961 | Trustee | Indefinite/ January 2013 to present | Partner, Law Office of Carter Reymann Law, P.A. (a general practice and corporate law firm) (2018 to present); Law Office of John K. Carter, P.A. (a general practice and corporate law firm) (2015 to 2018); Managing Partner, Global Recruiters of St. Petersburg (a financial services consulting and recruiting firm) (2012 to 2015). | 7 | RiverNorth Opportunistic Municipal Income Fund (1 fund) (2018- present); Carillon Mutual Funds (14 funds) (2016 to present)); RiverNorth Marketplace Lending Corporation (1 fund) (2016 to present); RiverNorth/ DoubleLine Strategic Opportunity Fund, Inc. (1 fund) (2016 to present); RiverNorth Funds (3 funds) (2006 to present). |
James G. Kelley
Y.O.B. 1948 | Trustee | Indefinite/ December 2006 to present | Certified Business Coach, JGK & Associates (2000 to present). | 5 | Member, Illinois Board of Examiners (2012 to present); Chair (2017 to present). |
| 148 | (888) 848-7569 | www.rivernorth.com |
| RiverNorth Funds | Trustees and Officers |
September 30, 2018 (Unaudited)
INDEPENDENT TRUSTEES
Name,
Address1
and Year
of Birth | Position(s)
Held with
the Fund | Term of
Office/
Length
of Time
Served | Principal Occupation(s)
During Past 5 Years | Number of
Portfolios
in Fund
Complex
Overseen
by Trustee2 | Other Directorships
Held by Trustee During
the Past 5 Years |
John S. Oakes
Y.O.B. 1943 | Trustee | Indefinite/ December 2010 to present | Principal, Financial Search and Consulting (a recruiting and consulting firm) (2013 to present); Regional Vice President, Securities America (a broker-dealer) (2007 to 2013). | 7 | RiverNorth Opportunistic Municipal Income Fund (1 fund) (2018-present); RiverNorth Marketplace Lending Corporation (1 fund) (2016 to present); RiverNorth/ DoubleLine Strategic Opportunity Fund, Inc. (1 fund) (2016 to present); RiverNorth Opportunities Fund, Inc. (1 fund) (2013 to present). |
Fred G. Steingraber
Y.O.B. 1938 | Trustee | Indefinite/ January 2013 to present | Chairman, Board Advisors LLC (a consulting firm) (2001 to present). Retired, Chairman Emeritus, A.T. Kearney (a business consulting firm) (2001 to present) | 5 | Director, Diamond Hill Financial Trends Fund (a closed-end fund) (1989 to 2013). Director, Elkay Manufacturing (2004 to present). Director, Talent Intelligence (leadership development) (2004 to present). Chairman Emeritus, A.T. Kearney (management consulting) (2001 to present). Chairman, Board Advisors (Board consulting) (2001 to present) |
| 1 | The mailing address of each Trustee is 325 N. LaSalle Street, Suite 645, Chicago, IL 60654. |
| 2 | The Fund Complex consists of the RiverNorth Core Opportunity Fund, the RiverNorth/DoubleLine Strategic Income Fund, and the RiverNorth/Oaktree High Income Fund, each a series of the RiverNorth Funds Trust, and the RiverNorth Opportunities Fund, Inc., RiverNorth DoubleLine Strategic Opportunity Fund, Inc., the RiverNorth Marketplace Lending Corporation, and the RiverNorth Opportunistic Municipal Income Fund, Inc. |
| Annual Report | September 30, 2018 | 149 |
| RiverNorth Funds | Trustees and Officers |
September 30, 2018 (Unaudited)
The following table provides information regarding each Trustee who is an “interested person” of the Trust, as defined in the 1940 Act, and each officer of the Trust.
INTERESTED TRUSTEE AND OFFICERS
Name,
Address1 and
Year of Birth | Position(s)
Held with
the Fund | Term of
Office/Length
of Time Served | Principal
Occupation(s)
During Past 5 Years | Number of
Portfolios
in Fund
Complex
Overseen
by Trustee2 | Other Directorships
Held by Trustee During
the Past 5 Years |
Patrick W. Galley3
Y.O.B. 1975 | President, Principal Executive Officer and Trustee | Indefinite/ July 2006 to present | Chief Investment Officer, RiverNorth Capital Management, LLC (2004 to present). | 7 | RiverNorth Opportunistic Municipal Income Fund (1 fund) (2018-present); RiverNorth Marketplace Lending Corporation (1 fund) (2016 to present); RiverNorth/ DoubleLine Strategic Opportunity Fund, Inc. (1 fund) (2016 to present); RiverNorth Opportunities Fund, Inc. (1 fund) (2013 to present); Board of Managers of RiverNorth Capital Management, LLC (since 2010) and RiverNorth Financial Holdings, LLC (2014 to present) and Board of Directors RiverNorth Holdings, Co. (since 2010). |
Jonathan M. Mohrhardt
Y.O.B. 1974 | Treasurer and Chief Financial Officer | Indefinite/ February 2009 to present | Chief Operating Officer, RiverNorth Capital Management, LLC (2011 to present). | N/A | Board of Managers RiverNorth Capital Management, LLC (2010 to present), Board of Managers of RiverNorth Financial Holdings, LLC (2014 to present) and Board of Directors RiverNorth Holdings, Co. (2010 to present). |
| 150 | (888) 848-7569 | www.rivernorth.com |
| RiverNorth Funds | Trustees and Officers |
September 30, 2018 (Unaudited)
INTERESTED TRUSTEE AND OFFICERS
| Name, Address1 and Year of Birth | Position(s) Held with the Fund | Term of Office/Length of Time Served | Principal Occupation(s) During Past 5 Years | Number of Portfolios in Fund Complex Overseen by Trustee2 | Other Directorships Held by Trustee During the Past 5 Years |
Marcus L. Collins Y.O.B. 1968 | Chief Compliance Officer; Secretary | Indefinite/ May 2012 to Present; Indefinite/ January 2017 to Present | General Counsel, RiverNorth Capital Management, LLC (2012 to present), Chief Compliance Officer, RiverNorth Capital Management, LLC (2012 to present). | N/A | N/A |
Allen G. French Y.O.B. 1959 c/o ALPS Fund Services, Inc. 1290 Broadway, Suite 1100 Denver, CO 80203 | Assistant Secretary | Indefinite/ November 2016 to present | Senior Investment Company Act Paralegal, ALPS Fund Services, Inc. (2016 to present); Manager, Investment Company Act Products, Transamerica Asset Management, Inc. (2015 to 2016); Senior Paralegal, ALPS Fund Services, Inc. (2012 to 2015). | N/A | N/A |
Michael Herrera Y.O.B. 1985 c/o ALPS Fund Services, Inc. 1290 Broadway, Suite 1100 Denver, CO 80203 | Assistant Treasurer | Indefinite/ August 2018 to present | Fund Controller, ALPS Fund Services (2007 to present). | N/A | N/A |
| 1 | The mailing address of each Trustee and officer, unless otherwise noted, is 325 N. LaSalle Street, Suite 645, Chicago, IL 60654. |
| 2 | The Fund Complex consists of the RiverNorth Core Opportunity Fund, the RiverNorth/DoubleLine Strategic Income Fund, and the RiverNorth/Oaktree High Income Fund, each a series of the RiverNorth Funds Trust, and the RiverNorth Opportunities Fund, Inc., RiverNorth DoubleLine Strategic Opportunity Fund, Inc., the RiverNorth Marketplace Lending Corporation, and the RiverNorth Opportunistic Municipal Income Fund, Inc. |
| 3 | Patrick W. Galley is considered an "Interested” Trustee as defined in the Investment Company Act of 1940, as amended, because he is an officer of the Trust and Chief Investment Officer of the Fund's investment adviser. |
The Statement of Additional Information includes additional information about the Trust’s Trustees and is available, without charge, upon request by calling (toll-free) 1-888-848-7569
| Annual Report | September 30, 2018 | 151 |
RiverNorth Funds
RiverNorth Core Opportunity Fund
RiverNorth/DoubleLine Strategic Income Fund
RiverNorth/Oaktree High Income Fund
Board of Trustees
Patrick W. Galley, CFA, Chairman
James G. Kelley
John S. Oakes
Fred G. Steingraber
John K. Carter
Investment Adviser
RiverNorth Capital Management, LLC
Sub Advisers
DoubleLine Capital LP
Oaktree Capital Management, L.P.
Transfer Agent, Administrator and
Dividend Disbursing Agent
ALPS Fund Services, Inc.
Distributor
ALPS Distributors, Inc.
Custodian
State Street Bank & Trust
Independent Registered
Public Accounting Firm
Cohen & Company, Ltd.
This report is provided for the general information of the shareholders of the RiverNorth Funds. This report is not intended for distribution to prospective investors in the Funds, unless preceded or accompanied by an effective prospectus.
| (a) | The registrant, as of the end of the period covered by this report, has adopted a code of ethics that applies to the registrant's principal executive officer, principal financial officer, principal accounting officer or controller or any persons performing similar functions on behalf of the registrant. |
| (b) | For purposes of this item, “code of ethics” means written standards that are reasonably designed to deter wrongdoing and to promote: |
| (1) | Honest and ethical conduct, including the ethical handling of actual or apparent conflicts of interest between personal and professional relationships; |
| (2) | Full, fair, accurate, timely, and understandable disclosure in reports and documents that a registrant files with, or submits to, the Commission and in other public communications made by the registrant; |
| (3) | Compliance with applicable governmental laws, rules, and regulations; |
| (4) | The prompt internal reporting of violations of the code of ethics to an appropriate person or persons identified in the code of ethics; and |
| (5) | Accountability for adherence to the code of ethics. |
| (c) | Amendments: During the period covered by this report, no amendments were made to the provisions of the code of ethics adopted in 2(a) above. |
| (d) | Waivers: During the period covered by this report, no implicit or explicit waivers to the provisions of the code of ethics adopted in 2(a) above were granted. |
| (e) | Posting: We do not intend to post the code of ethics for the Officers or any amendments or waivers on a website. |
| (f) | Availability: The code of ethics for the Officers can be obtained, free of charge by calling the toll free number for the appropriate Fund listed in that Fund’s prospectus . |
| Item 3. | Audit Committee Financial Expert. |
The registrant’s board of trustees has determined that the registrant does not have an audit committee financial expert. The committee members and the full Board considered a possibility of adding a member that would qualify as an expert. The audit committee determined that, although none of its members meet the technical definition of an audit committee expert, the committee has sufficient financial expertise to adequately perform its duties under the Audit Committee Charter without the addition of a qualified expert.
| Item 4. | | Principal Accountant Fees and Services. |
| (a) | Audit Fees | |
| | Fiscal Year | Audit Fees |
| | FY 2018 | $68,000 |
| | FY 2017 | $68,000 |
| (b) | Audit-Related Fees | |
| | Fiscal Year | Registrant |
| | FY 2018 | $0 |
| | FY 2017 | $0 |
| (c) | Tax Fees | |
| | Fiscal Year | Registrant |
| | FY 2018 | $15,000 |
| | FY 2017 | $15,000 |
| | Nature of the Tax Fees: prepare tax returns |
| (d) | All Other Fees | |
| | Fiscal Year | Registrant |
| | FY 2018 | $7,275 |
| | FY 2017 | $4,550 |
| | Nature of the fees: cursory review of Semi-Annual Shareholder report, certain out-of-pocket expenses, and post-effective amendment consents. |
| (1) | Audit Committee’s Pre-Approval Policies |
| The Audit Committee Charter requires the Audit Committee to be responsible for the selection, retention or termination of auditors and, in connection therewith, to (i) evaluate the proposed fees and other compensation, if any, to be paid to the auditors, (ii) evaluate the independence of the auditors, (iii) pre-approve all audit services and, when appropriate, any non-audit services provided by the independent auditors to the Trust, (iv) pre-approve, when appropriate, any non-audit services provided by the independent auditors to the Trust's investment adviser, or any entity controlling, controlled by, or under common control with the investment adviser and that provides ongoing services to the Trust if the engagement relates directly to the operations and financial reporting of the Trust, and (v) receive the auditors’ specific representations as to their independence. |
| (2) | Percentages of Services Approved by the Audit Committee pursuant to paragraph (c)(7)(i)(C) of Rule 2-01 of Regulation S-X. |
| Registrant | |
| Audit-Related Fees: | 0% |
| Tax Fees: | 0% |
| All Other Fees: | 0% |
| (f) | During audit of registrant's financial statements for the most recent fiscal year, less than 50 percent of the hours expended on the principal accountant's engagement were attributed to work performed by persons other than the principal accountant's full-time, permanent employees. |
| (g) | The aggregate non-audit fees billed by the registrant's accountant for services rendered to the registrant, and rendered to the registrant's investment adviser (not including any sub-adviser whose role is primarily portfolio management and is subcontracted with or overseen by another investment adviser), and any entity controlling, controlled by, or under common control with the adviser that provides ongoing services to the registrant: |
| Fiscal Year | Registrant | Adviser |
| FY 2018 | $0 | $0 |
| FY 2017 | $19,550 | $0 |
| Item 5. | | Audit Committee of Listed Registrants. |
NOT APPLICABLE – applies to listed companies only
| Item 6. | | Schedule of Investments. |
| (a) | The schedule of investments is included as part of the Report to Stockholders filed under Item 1 of this report. |
| Item 7. | | Disclosure of Proxy Voting Policies and Procedures for Closed-End Management Investment Companies. |
NOT APPLICABLE – applies to closed-end funds only
| Item 8. | | Portfolio Managers of Closed-End Management Investment Companies. |
NOT APPLICABLE – applies to closed-end funds only
| Item 9. | | Purchases of Equity Securities by Closed-End Management Investment Company and Affiliated Purchasers. |
NOT APPLICABLE – applies to closed-end funds only
| Item 10. | | Submission of Matters to Vote of Security Holders. |
The registrant has not adopted procedures by which shareholders may recommend nominees to the registrant’s board of trustees.
| Item 11. | | Controls and Procedures. |
| (a) | Based on an evaluation of the registrant's disclosure controls and procedures (as defined in Rule 30a-3(c) under the Investment Company Act of 1940) as of a date within 90 days of the filing date of this Form N-CSR, the disclosure controls and procedures are reasonably designed to ensure that the information required in filings on Forms N-CSR is recorded, processed, summarized, and reported on a timely basis. |
| (b) | There were no significant changes in the registrant’s internal control over financial reporting that occurred during the registrant’s second fiscal quarter of the period covered by this report that have materially affected, or are reasonably likely to materially affect, the registrant’s internal control over financial reporting. |
| Item 12. | | Disclosure of Securities Lending Activities for Closed-End Management Investment Companies. |
NOT APPLICABLE – applies to closed-end funds only
| (a)(1) | Certifications pursuant to Rule 30a-2(b) under the Act (17 CFR 30a-2(b)) and Section 1350 of Chapter 63 of Title 18 of the United States Code (18 U.S.C. 1350) are attached hereto. |
| (a)(2) | Certifications pursuant to Rule 30a-2(a) under the Act (17 CFR 30a-2(a)) are attached hereto. |
| (b) | Certifications pursuant to Rule 30a-2(b) under the Act (17 CFR 30a-2(b)) and Section 1350 of Chapter 63 of Title 18 of the United States Code (18 U.S.C. 1350) are attached hereto. |
SIGNATURES
Pursuant to the requirements of the Securities Exchange Act of 1934 and the Investment Company Act of 1940, the registrant has duly caused this report to be signed on its behalf by the undersigned, thereunto duly authorized.
Registrant: RiverNorth Funds
| By: | /s/ Patrick W. Galley | |
| Name: | Patrick W. Galley | |
| Title: | President | |
| | | |
| Date: | December 10, 2018 | |
Pursuant to the requirements of the Securities Exchange Act of 1934 and the Investment Company Act of 1940, this report has been signed below by the following persons on behalf of the registrant and in the capacities and on the dates indicated.
| By: | /s/ Patrick W. Galley | |
| Name: | Patrick W. Galley | |
| Title: | President & Chief Executive Officer | |
| | | |
| Date: | December 10, 2018 | |
| By: | /s/ Jonathan M. Mohrhardt | |
| Name: | Jonathan M. Mohrhardt | |
| Title: | Treasurer & Chief Financial Officer | |
| | | |
| Date: | December 10, 2018 | |