UNITED STATES
SECURITIES AND EXCHANGE COMMISSION
Washington, D.C. 20549
FORM N-CSR
CERTIFIED SHAREHOLDER REPORT OF REGISTERED
MANAGEMENTINVESTMENT COMPANIES
Investment Company Act file number: 811-21934
RiverNorth Funds
(Exact name of registrant as specified in charter)
325 North LaSalle Street, Suite 645
Chicago, IL 60654
(Address of principal executive offices) (Zip code)
Marc L. Collins
325 North LaSalle Street, Suite 645
Chicago, IL 60654
(Name and address of agent for service)
Registrant's telephone number, including area code: 312-832-1440
Date of fiscal year end: 09/30
Date of reporting period: 09/30/2016
| Item 1. | Reports to Stockholders. |
| RiverNorth Funds | Table of Contents |
| Shareholder Letter | 2 |
| Opportunistic Closed-End Fund Strategies | |
| Portfolio Update | 3 |
| RiverNorth Core Opportunity Fund | 6 |
| RiverNorth/DoubleLine Strategic Income Fund | 12 |
| RiverNorth Equity Opportunity Fund | 18 |
| RiverNorth/Oaktree High Income Fund | 22 |
| RiverNorth Funds Schedule of Investments and Financial Statements | |
| Disclosure of Fund Expenses | 28 |
| Schedule of Investments | |
| RiverNorth Core Opportunity Fund | 31 |
| RiverNorth/DoubleLine Strategic Income Fund | 35 |
| RiverNorth Equity Opportunity Fund | 69 |
| RiverNorth/Oaktree High Income Fund | 71 |
| Statement of Assets and Liabilities | |
| RiverNorth Core Opportunity Fund | 87 |
| RiverNorth/DoubleLine Strategic Income Fund | 89 |
| RiverNorth Equity Opportunity Fund | 91 |
| RiverNorth/Oaktree High Income Fund | 92 |
| Statement of Operations | |
| RiverNorth Core Opportunity Fund | 94 |
| RiverNorth/DoubleLine Strategic Income Fund | 95 |
| RiverNorth Equity Opportunity Fund | 96 |
| RiverNorth/Oaktree High Income Fund | 97 |
| Statements of Changes in Net Assets | |
| RiverNorth Core Opportunity Fund | 99 |
| RiverNorth/DoubleLine Strategic Income Fund | 101 |
| RiverNorth Equity Opportunity Fund | 103 |
| RiverNorth/Oaktree High Income Fund | 105 |
| Financial Highlights | |
| RiverNorth Core Opportunity Fund | 108 |
| RiverNorth/DoubleLine Strategic Income Fund | 112 |
| RiverNorth Equity Opportunity Fund | 116 |
| RiverNorth/Oaktree High Income Fund | 120 |
| Notes to Financial Statements | 126 |
| Report of Independent Registered Public Accounting Firm | 150 |
| Additional Information | 151 |
| Trustees & Officers | 152 |
| RiverNorth Funds | Shareholder Letter |
September 30, 2016 (Unaudited)
Dear Fellow Shareholders,
As an investment manager, RiverNorth does not attempt to speculate on uncertain outcomes. Instead, we position our portfolios in an effort to take advantage of overreaction to both perceived certainty and uncertainty. Fiscal year 2016 was no exception, as many investors would characterize it as a year marked by several unexpected events: oil’s descent to $27 a barrel, the worst two-week start to a new calendar year for equity markets, the United Kingdom’s referendum vote to leave the EU (“Brexit”); all followed by an amazing turnaround in risk assets resulting in equity markets hitting numerous all-time highs.
Closed-end fund discounts followed suit as investors sold risk assets, pushing taxable closed-end fund discounts to -12.4% on January 20, 2016, only to rebound to a -4.4% discount on September 30, 2016(1). It comes as no surprise that investors were inevitably selling risk assets at the lows, pushing discounts wider, and then buying only when risk assets rebounded. The increased volatility of this widening and narrowing discount cycle provides opportunity for RiverNorth’s strategies. Closed-end fund discounts give us confidence to stay invested and become buyers in times of volatility and uncertainty, allowing us to then lock in gains when discounts narrow.
Looking forward, we see no end in sight to uncertainty in the capital markets. As an investor in closed-end funds, we welcome the uncertainty. In the near-term, we are confident that events like the U.S. Presidential election, the impact of the Brexit vote and the Federal Reserve’s decision over interest rates will result in uncertain outcomes. Currently, many investors favor passive investment strategies when simply looking at past performance versus their actively managed peers. This is one area in which we caution investors - past performance may not be indicative of future results. Assets pouring into passive strategies results in supply and demand imbalances and outperformance for these concentrated, often index based strategies. However, we believe these trends will one day need to reverse. One thing about which we are confident is that the desire to run for the exit occurs much faster than running for the entrance.
We are pleased to provide you with the 2016 Annual Report for RiverNorth Funds. The report reviews our four opportunistic closed-end strategies: RiverNorth Core Opportunity Fund (ticker: RNCIX and RNCOX), RiverNorth/DoubleLine Strategic Income Fund (tickers: RNSIX and RNDLX), RiverNorth Equity Opportunity Fund (tickers: RNDIX and RNEOX), and RiverNorth/Oaktree High Income Fund (tickers: RNHIX and RNOTX).
Please visit www.rivernorth.com for additional information.
We thank you for your investment and trust in managing your assets.
Respectfully,
Patrick W. Galley, CFA
President and Chief Investment Officer
RiverNorth Funds
| 2 | (888) 848-7569 | www.rivernorth.com |
| RiverNorth Funds | Portfolio Update |
September 30, 2016 (Unaudited)
Closed-End Fund Market Overview and Outlook
Prepared by Portfolio Manager, Stephen O’Neill
It has been a good time to own closed-end funds (CEFs). For the year ended 9/30/16, the RiverNorth Taxable CEF Index was up 17.2% and the RiverNorth Municipal Index was up 11.7%. Due to strong performance, the total market capitalization of CEFs increased from $210 billion to $230 billion. The average CEF discount narrowed from 9.8% to 4.4%; while the average CEF yield declined from 7.7% to 6.7%.
Both stocks and bonds have performed well and discount narrowing has boosted total returns. To illustrate, we can look at the PIMCO Dynamic Credit and Mortgage Income Fund (PCI). This security was the largest bond fund position in the Core Opportunity, Strategic Income and High Income Funds at 9/30/15. In the past twelve months, the market price and net asset value (NAV) total returns were 25.7% and 11.9%, respectively. The discount has narrowed from 15.5% on 9/30/15 to 6.1% on 9/30/16. For PCI, and many other CEFs, the trailing twelve month NAV returns were certainly good, but the market price returns were exceptional due to discount narrowing.
Unfortunately, closed-end funds are no longer categorically cheap. Discounts on the most popular funds, like PCI, and discounts on longer duration fixed income funds, like municipals, have narrowed substantially. However, we believe many other closed-end fund groups remain compelling. Credit funds, that own corporate/mortgage/sovereign bonds, and equity funds remain out-of-favor with retail investors. The depth of the closed-end fund opportunity has enabled us to build diversified portfolios with attractive average discounts. As of 9/30/16, the average discounts for the Core Opportunity, Strategic Income, High Income and Equity Opportunity Funds were 12.9%, 9.4%, 10.0% and 12.4%, respectively.
We remain bullish on taxable bond funds trading around 10% discounts because we believe investors will continue to bid up the group. Similar to how municipal funds narrowed from double digit discounts to premiums from 2013 to 2016, we would argue that a tailwind of strong performance should lead to significant discount narrowing on bank loan, high yield and multi sector bond funds. We consider these positions to be inexpensive call options on market upside. RiverNorth also sees value in equity closed-end funds trading at discounts between 10% and 20%, with high managed distribution policies of 5% to 10%. The potential alpha from these equity positions will be lumpier and likely driven by corporate actions, but the valuations
remain compelling.
On the topic of corporate actions, the frequency of activity has accelerated in 2015/2016. Liquidations, open-endings and tender offers are becoming more common. The success of shareholder activism is the primary explanation. Discounts on many funds have been wide since 2013 and that has created an opportunity for shareholders to pressure management to close the gap between the market price and NAV. We believe the number of lead activists and institutional followers is on the rise and we’ll continue to see more shareholder activism so long as discounts are wide. Interestingly, we would argue that the market does not efficiently price in the probability of corporate actions. In other words, investors generally do not pay a meaningful premium (i.e. narrower discount) to own closed-end funds that are likely to have a favorable corporate action. We believe many investors are simply unaware of the relative values in the closed-end fund market. CEFs are primarily owned by retail investors that focus on yield and market price.
| Annual Report | September 30, 2016 | 3 |
| RiverNorth Funds | Portfolio Update |
September 30, 2016 (Unaudited)
Distribution stability has become another topic worth discussing. The overall earnings power of bond funds is under pressure. The assets are yielding less and the liabilities are costing more. The yield curve is flattening and levered closed-end funds are getting squeezed. For municipal funds, the Securities Industry and Financial Markets Association (SIFMA) reference rate on leverage has jumped from 0.03% at 9/30/15 to 0.88% at 9/30/16. For taxable funds, the 30 day London Interbank Offered Rate (LIBOR) reference rate on leverage has jumped from 0.33% at 9/30/15 to 0.89% at 9/30/16. Much of the rise in both reference rates has occurred in the past six months. Money market reform, not monetary policy, has been the driving factor. While we believe that investors need to closely monitor the earnings power of their closed-end funds, we would argue that the market has already priced in the risk of lower distributions into the discounted valuations of many taxable bond funds. That said, there are plenty of municipal funds and popular taxable bond funds that trade at premiums to NAV and are likely to cut their distributions in the intermediate future. It’s the latter group that may experience air pockets beneath their market price if/when distributions are lowered.
Finally, it’s worth reminding investors that closed-end funds are actively managed investment strategies. Fund managers like DoubleLine, BlackRock and Gabelli manage portfolios in an attempt to generate superior risk adjusted returns. RiverNorth, as a buyer of closed-end funds, can be considered a manager of managers. However, given that RiverNorth runs diversified portfolios of closed-end funds, we believe that any one manger’s outperformance tends to be offset by another manager’s underperformance. We generally view our aggregate net asset value exposure as beta, not a collection of bets on alpha generating managers. That said, since we launched our first mutual fund in 2006, equity managers as a group have generally underperformed their benchmarks and fixed income managers have outperformed. That trend continued in 2015/2016 and should be considered when thinking about the performance of the RiverNorth Funds.
Diversification does not eliminate the risk of experiencing investment loss.
| 4 | (888) 848-7569 | www.rivernorth.com |
| RiverNorth Funds | Portfolio Update |
September 30, 2016 (Unaudited)
Definitions:
Yield – The yield is the income return on an investment, such as the interest or dividends received from holding a particular security.
CEF Discount – The price per share is determined by the market and is usually different from the underlying value or net asset value (NAV) per share of the investments held by the fund. The price is said to be at a discount to the NAV when it is below the NAV.
Call Option – A call option is an agreement that gives an investor the right, but not the obligation, to buy a stock, bond, commodity or other instrument at a specified price within a specific time period.
Yield Curve – A yield curve is a line that plots the interest rates, at a set point in time, of bonds having equal credit quality but differing maturity dates.
Beta – A measure of the volatility, or systematic risk, of a security or a portfolio in comparison to the market as a whole.
Alpha – The measure of a fund’s actual returns and expected performance, given its level of risk (as measured by beta).
Basis Points – one hundredth of one percent, used chiefly in expressing differences of interest rates.
| Annual Report | September 30, 2016 | 5 |
| RiverNorth Funds | Portfolio Update |
September 30, 2016 (Unaudited)
RiverNorth Core Opportunity Fund
What is the Fund’s investment strategy?
The RiverNorth Core Opportunity Fund ("the Fund") invests in a broad range of equity, fixed income and short-term securities. To implement the Fund's tactical asset allocation, the adviser generally invests in closed-end funds and exchange-traded funds.
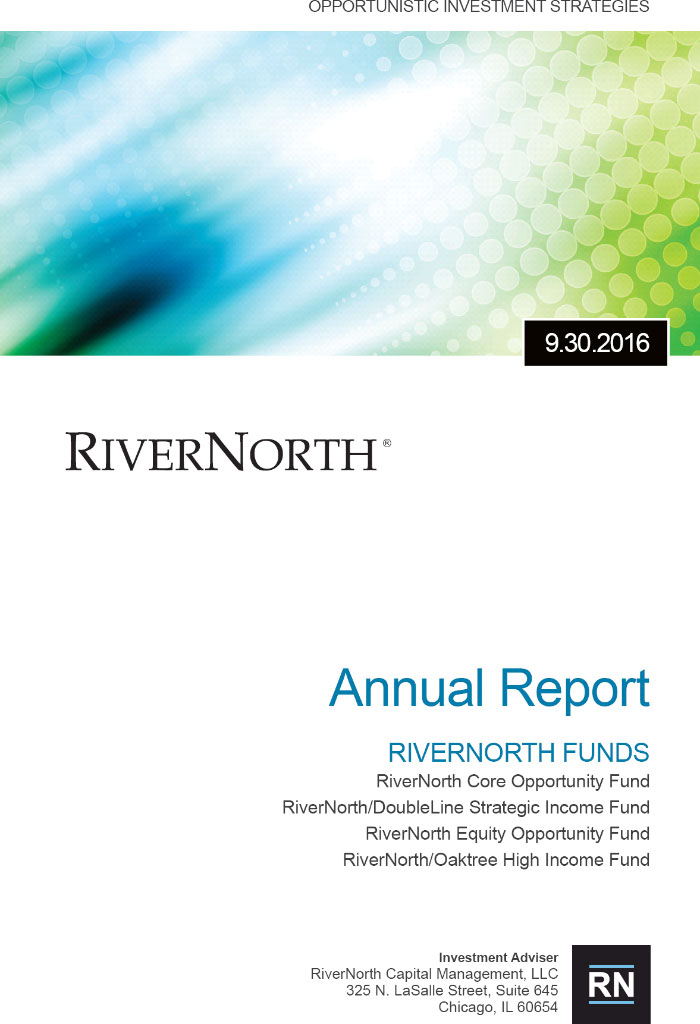
How did the RiverNorth Core Opportunity Fund perform relative to its benchmark during the reporting period?
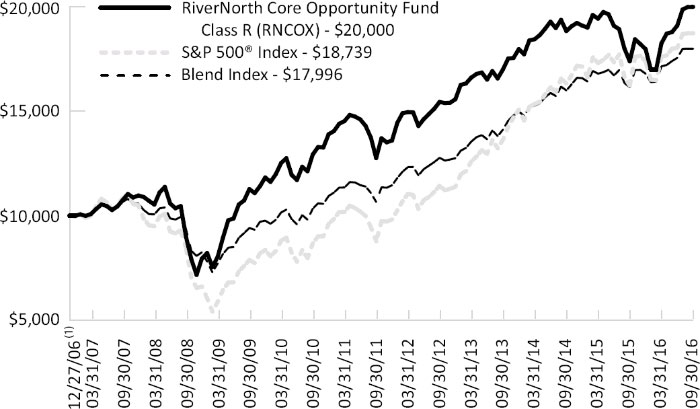
For the twelve month period ending September 30, 2016, the Class I share (symbol: RNCIX) returned 15.35% and the Class R share (symbol: RNCOX) returned 14.98%. The unmanaged Blend Index returned 11.43% during the same period. The Blend Index consists of 60% S&P 500 Index and 40% Barclays Capital U.S. Aggregate Bond Index.
Comparison of a $10,000 Investment in the RiverNorth Core Opportunity Fund Class R, the Blend Index, and the S&P 500® Index.
| 6 | (888) 848-7569 | www.rivernorth.com |
| RiverNorth Funds | Portfolio Update |
September 30, 2016 (Unaudited)
Comparison of a $10,000 Investment in the RiverNorth Core Opportunity Fund Class I, the Blend Index, and the S&P 500® Index.
Average Annual Total Returns for Periods Ending September 30, 2016
| | 1-Year | 3-Year | 5-Year | Since
Inception(1)(2) |
RiverNorth Core Opportunity Fund – Class I (RNCIX)(3) | 15.35% | 5.81% | 9.67% | 7.63% |
| RiverNorth Core Opportunity Fund – Class R (RNCOX) | 14.98% | 5.56% | 9.41% | 7.36% |
Blend Index(4) | 11.43% | 8.41% | 11.05% | 6.21% |
S&P 500® Index(4) | 15.43% | 11.16% | 16.37% | 6.65% |
| (1) | Inception date of Class R is December 27, 2006. |
| (2) | Inception date of Class I is August 11, 2014. |
| (3) | In presenting performance information for the newer Institutional share class of the Fund, the Fund includes, for periods prior to the offering of the Institutional share class, the operating expense ratio and performance of the Fund’s Retail share class, adjusted to reflect the class related operating expenses of the Institutional share class. Actual expense differentials across classes will vary over time. The performance of the Fund’s newer Institutional share class would have been substantially similar to the performance of the Fund’s Retail share class because both share classes of the Fund are invested in the same portfolio of securities and would have differed only to the extent that the classes do not have the same expenses (although differences in expenses between share classes may change over time). |
| (4) | Blend Index consists of 60% S&P 500® Index and 40% Barclays Capital U.S. Aggregate Bond Index. S&P 500® Index is a capitalization-weighted index of 500 stocks. The Barclays Capital U.S. Aggregate Bond Index is an unmanaged index of investment-grade fixed-rate debt issues with maturities of at least one year. This unmanaged index does not reflect fees and expenses. The S&P 500® and Blend Indices are indices only and cannot be invested in directly. |
| Annual Report | September 30, 2016 | 7 |
| RiverNorth Funds | Portfolio Update |
September 30, 2016 (Unaudited)
Performance data quoted represents past performance, which is not a guarantee of future results. Current performance may be lower or higher than the performance quoted. The principal value and investment return of an investment will fluctuate so that your shares, when redeemed, may be worth more or less than their original cost. You can obtain performance data current to the most recent month end by calling (888) 848-7569 or www.rivernorth.com. Total return measures net investment income and capital gain or loss from portfolio investments. All performance shown assumes reinvestment of dividends and capital gains distributions and does not reflect the deduction of taxes that a shareholder would pay on fund distributions or the redemption of
fund shares.
The Total Annual Fund Operating Expense for the Fund as disclosed in the prospectus dated January 28, 2016: 2.36% (RNCIX), 2.60% (RNCOX). In presenting expense information for the newer Institutional share class of the Fund, the Fund includes, for periods prior to the offering of the Institutional share class, the operating expense ratio of the Fund’s Retail share class, adjusted to reflect the class-related operating expenses of the Institutional share class. Actual expense differentials across share classes will vary over time. The adviser has contractually agreed to defer the collection of fees and/or reimburse expenses, but only to the extent necessary to limit Total Annual Fund Operating Expenses (excluding brokerage fees and commissions; borrowing costs, such as (a) interest and (b) dividends on securities sold short; taxes; indirect expenses incurred by the underlying funds in which the Fund invests; and extraordinary expenses) to 1.35% (RNCIX) and 1.60% (RNCOX) of the average daily net assets of the Fund through January 31, 2017. The annualized net expense ratio in this annual report dated September 30, 2016 is 1.11% (RNCIX) and 1.36% (RNCOX). The expense ratio as disclosed in the Fund’s annual report dated September 30, 2016 only includes the direct expenses paid by shareholders from their investment. The expense ratio as disclosed in the Fund’s prospectus dated January 28, 2016 is required to include the indirect expenses of investing in underlying funds.
What contributing factors were responsible for the RiverNorth Core Opportunity Fund's relative performance during the period?
With respect to the equity portion of the portfolio, the Fund's allocation to emerging market equity and real estate funds contributed to relative outperformance. The Fund’s exposure to MLP and global allocation funds detracted from relative performance as the portfolio holdings in these sectors underperformed the Fund’s benchmark.
With respect to the fixed income portion of the portfolio, our allocation to closed end funds with lower credit quality, such as multi-sector bond, global income, and high yield funds contributed to outperformance, as the NAV returns of funds in these sectors generally outperformed the Barclays Capital U.S. Aggregate Bond Index. In addition, discount narrowing among fixed income closed end funds contributed to performance.
How was the RiverNorth Core Opportunity Fund positioned at the end of September 2016?
At the aggregate Fund level, we allocated 53% of the portfolio to equities, 38% to fixed income, 17% to cash, and 4% to hybrid securities. Allocations exceed 100% due to leverage utilized by some of the closed-end funds that we own.
Our equity allocation is neutral. We are 53% invested in equities; with 74% domestic and 26% international exposure. The biggest changes in our equity allocations were increases in US equity and global equity closed-end funds, and a decrease in our allocation to MLP and real estate closed-end funds.
| 8 | (888) 848-7569 | www.rivernorth.com |
| RiverNorth Funds | Portfolio Update |
September 30, 2016 (Unaudited)
On the fixed income side, we have decreased exposure to multi-sector, municipal bond, and high yield closed-end funds, as funds focusing on these areas have experienced significant discount narrowing over the past year in addition to their positive NAV performance.
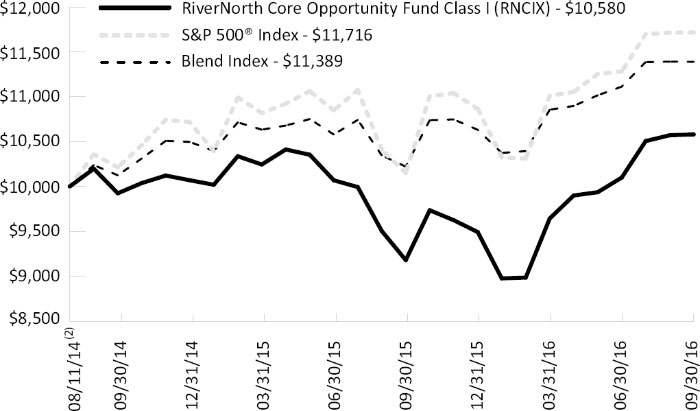
Investment Vehicle Allocation(1) (percentages are based on net assets)
The allocation does not add up to 100% due to rounding.
Asset Class Allocation(1) (percentages are based on net assets)
The allocation does not add up to 100% as it reflects the estimated leverage utilized by the underlying funds and the effects of a total return swap.
| Annual Report | September 30, 2016 | 9 |
| RiverNorth Funds | Portfolio Update |
September 30, 2016 (Unaudited)
Equity Capitalization Allocation(1) (percentages are based on net assets)
Fixed Income Allocation(1)(2) (percentages are based on net assets)
Portfolio detail statistics are estimates made by the adviser and are subject to change.
| (1) | Convertible Security Risk – the market value of convertible securities adjusts with interest rates and the value of the underlying stock. Exchange Traded Note Risk – exchange traded notes represent unsecured debt of the issuer and may be influenced by interest rates, credit ratings of the issuer or changes in value of the reference index. Fixed Income Risk – the market value of fixed income securities adjusts with interest rates and the securities are subject to issuer default. Foreign/Emerging Market Risk – foreign securities may be subject to inefficient or volatile markets, different regulatory regimes or different tax policies. These risks may be enhanced in emerging markets. Management Risk – there is no guarantee that the adviser’s investment decisions will produce the desired results. Large Shareholder Purchase and Redemption Risk – The Fund may experience adverse effects when certain large shareholders purchase or redeem large amounts of shares of the Fund. Market Risk – economic conditions, interest rates and political events may affect the securities markets. REIT Risk – the value of REITs changes with the value of the underlying properties and changes in interest rates and are subject to additional fees. Security Risk – The value of the Fund may decrease in response to the activities and financial prospects of individual securities in the Fund’s portfolio. Short Sale Risk – short positions are speculative, are subject to transaction costs and are riskier than long positions in securities. Small Cap Risk – small-cap companies are more susceptible to failure, are often thinly traded and have more volatile stock prices. Structured Notes Risk – because of the imbedded derivative feature, structured notes are subject to more risk than investing in a simple note or bond. Swap Risk – swap agreements are subject to counterparty default risk and may not perform as intended. Underlying Fund Risk – underlying funds have additional fees, may utilize leverage, may not correlate to an intended index and may trade at a discount to their net asset values. |
| 10 | (888) 848-7569 | www.rivernorth.com |
| RiverNorth Funds | Portfolio Update |
September 30, 2016 (Unaudited)
| (2) | Credit quality allocation reflects a fixed-income portfolio weighted average of the credit breakdown of each closed end fund as provided by the adviser of said closed-end fund. If a credit breakdown is not provided by the adviser, Bloomberg is used. Investment grade refers to a bond rated BBB- or higher by Standard & Poor’s or Baa3 or higher by Moody’s. High yield refers to a bond rate lower than investment grade. For more information about securities ratings, please see the Fund’s Statement of Additional information at www.rivernorth.com. |
| Annual Report | September 30, 2016 | 11 |
| RiverNorth Funds | Portfolio Update |
September 30, 2016 (Unaudited)RiverNorth/DoubleLine Strategic Income Fund
What is the Fund’s investment strategy?
The RiverNorth/DoubleLine Strategic Income (“the Fund”) invests in a broad range of fixed income securities of U.S. and foreign issuers, including closed-end funds.
Assets of the Fund are tactically managed across three distinct fixed income strategies (or sleeves). RiverNorth oversees the strategy weights and manages the Tactical Closed-End Fund Income Strategy. The RiverNorth strategy provides diversified exposure to the fixed income market through opportunistic investments in closed-end bond funds. Sector allocations may vary based on RiverNorth’s assessment of relative value among asset classes and closed-end funds. Jeffrey Gundlach, CEO and CIO of DoubleLine Capital, LP oversees the Opportunistic Income and Core Fixed Income Strategies. The Opportunistic Income Strategy seeks to achieve positive absolute returns and is managed without duration constraints. The Core Fixed Income Strategy – the most traditional of the three sleeves – incorporates an active asset allocation approach in an effort to mitigate risk and achieve the highest possible risk-adjusted returns.
How did the RiverNorth/DoubleLine Strategic Income Fund perform relative to its benchmark during the reporting period?
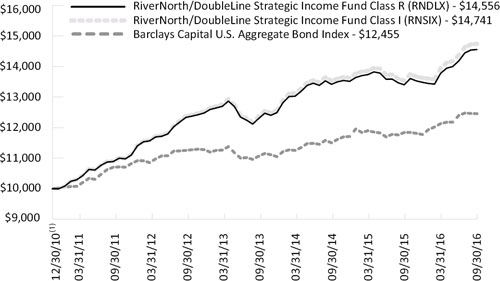
For the twelve month period ending September 30, 2016, the Class I share (symbol: RNSIX) returned 9.00% and the Class R share (symbol: RNDLX) returned 8.62%. The Fund’s benchmark, the Barclays Capital U.S. Aggregate Bond Index, returned 5.19%, during the same period.
| 12 | (888) 848-7569 | www.rivernorth.com |
| RiverNorth Funds | Portfolio Update |
September 30, 2016 (Unaudited)
Comparison of a $10,000 Investment in the RiverNorth/DoubleLine Strategic Income Fund and the Barclays Capital U.S. Aggregate Bond Index
Average Annual Total Returns for Periods Ending September 30, 2016
| | 1-Year | 3-Year | 5-Year | Since
Inception(1) |
| RiverNorth/DoubleLine Strategic Income Fund – Class I (RNSIX) | 9.00% | 6.05% | 6.25% | 7.00% |
| RiverNorth/DoubleLine Strategic Income Fund – Class R (RNDLX) | 8.62% | 5.78% | 5.98% | 6.75% |
Barclays Capital U.S. Aggregate Bond Index(2) | 5.19% | 4.03% | 3.08% | 3.89% |
| (1) | Inception date is December 30, 2010. |
| (2) | The Barclays Capital U.S. Aggregate Bond Index is an unmanaged index of investment-grade fixed-rate debt issues with maturities of at least one year. The index cannot be invested in directly and does not reflect fees and expenses. |
Performance data quoted represents past performance, which is not a guarantee of future results. Current performance may be lower or higher than the performance quoted. The principal value and investment return of an investment will fluctuate so that your shares, when redeemed, may be worth more or less than their original cost. You can obtain performance data current to the most recent month end by calling (888) 848-7569 or www.rivernorth.com. Total return measures net investment income and capital gain or loss from portfolio investments. All performance shown assumes reinvestment of dividends and capital gains distributions and does not reflect the deduction of taxes that a shareholder would pay on fund distributions or the redemption of fund shares.
| Annual Report | September 30, 2016 | 13 |
| RiverNorth Funds | Portfolio Update |
September 30, 2016 (Unaudited)
The Total Annual Fund Operating Expense for the Fund as disclosed in the prospectus dated January 28, 2016: 1.40% (RNSIX), 1.65% (RNDLX). The adviser has contractually agreed to defer the collection of fees and/or reimburse expenses, but only to the extent necessary to limit Total Annual Fund Operating Expenses (excluding brokerage fees and commissions; borrowing costs, such as (a) interest and (b) dividends on securities sold short; taxes; indirect expenses incurred by the underlying funds in which the Fund invests; and extraordinary expenses) to 0.95% (RNSIX) and 1.20% (RNDLX) of the average daily net assets of the Fund through January 31, 2017. The annualized net expense ratio in this annual report dated September 30, 2016 is 0.86% (RNSIX) and 1.11% (RNDLX). The expense ratio as disclosed in the Fund’s annual report dated September 30, 2016 only includes the direct expenses paid by shareholders from their investment. The expense ratio as disclosed in the Fund’s prospectus dated January 28, 2016 is required to include the indirect expenses of investing in underlying funds.
What contributing factors were responsible for the RiverNorth/DoubleLine Strategic Income Fund’s relative performance during the period?
RiverNorth Tactical Closed-End Fund Income Sleeve
The RiverNorth sleeve outperformed the benchmark index during the period. This was due to exposure to closed-end funds that invest in securities with lower credit quality, as well as closed-end funds that invest in emerging market fixed income, as both of these areas outperformed the Fund’s benchmark index over the year. In addition, discount narrowing among fixed income closed-end funds during the period also contributed to performance.
DoubleLine Core Fixed Income Sleeve
For the annual period ended September 30, 2016, the Core Fixed Income sleeve outperformed the Barclays U.S. Aggregate Bond Index’s return of 5.19%. The outperformance can largely be attributed to strong performance from non-index sectors like Emerging Markets Fixed Income and High Yield Corporates. Both sectors benefited from continued accommodative monetary policy, a recovering commodities complex, and a rally in risk assets that began in February of 2016. Other credit related sectors, such as Investment Grade Corporates, Collateralized Loan Obligations, Commercial MBS and Asset-Backed Securities all posted positive returns as spreads in each sector hit 52-week tights in the latter half of the period. Over the period, the U.S. yield curve flattened significantly, with higher rates in the short end and lower rates in the intermediate and long end of the curve. As a result of the flatter yield curve, exposures to both U.S. Treasuries and Agency MBS were accretive due to their relatively longer durations compared to other exposures within the Fund. Non-Agency MBS also contributed positively with the largest contributions coming from allocations to Alt-A Collateralized Mortgage Obligations.
DoubleLine Opportunistic Income Sleeve
For the annual period ended September 30, 2016, the U.S. Treasury curve flattened with 1-year yields increasing by about 28 basis points and 10-year yields declining by about 44 basis points. The more interest-rate sensitive, Agency residential mortgage backed securities (RMBS) broadly performed well as they benefited from intermediate to longer term yields declining during this time period. Non-Agency RMBS faced some weakness when the corporate credit markets saw spreads widening at the end of 2015 and early 2016; however, valuations have improved since that time with credit spreads tightening from the highs seen in February 2016. Within Agency RMBS, inverse interest-only securities were the highest contributors to total return, primarily driven by the sector’s high coupon returns. Inverse floating rate securities were a close second as they benefited from strong price gains and continue to contribute healthy interest income due to LIBOR remaining low from a historical context. Within Non-Agency RMBS, Alt-A bonds were the highest contributors to total return despite the sector facing some weakness in valuations during the credit selloff earlier in the year; robust interest carry helped offset these declines. Though a small allocation within the portfolio, Subprime bonds had the highest absolute total return for the period as they benefited from tightening credit spreads. Municipals detracted from overall performance due to prices declining caused by concerns regarding Puerto Rico.
| 14 | (888) 848-7569 | www.rivernorth.com |
| RiverNorth Funds | Portfolio Update |
September 30, 2016 (Unaudited)
How was the RiverNorth/DoubleLine Strategic Income Fund positioned at the end of September 2016?
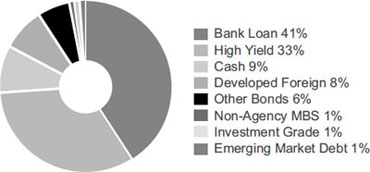
The Fund allocation was 51% RiverNorth Tactical Closed-End Fund Income, 30% DoubleLine Opportunistic Income and 19% DoubleLine Core Fixed Income. The biggest changes over the year were decreases in high yield and municipal bond exposure, and an increase in the Fund’s cash position. Our allocation to cash offsets some of the leveraged exposure the Fund acquires as a result of holding leveraged closed-end funds, and also allows the Fund to be opportunistic as we will look to deploy some of the cash when volatility returns to the fixed income markets.
Strategy (“Sleeve”) Allocation
Credit Quality Distribution(1)(2) (percentages are based on net assets)
Totals may not add up to 100% due to rounding.
| Annual Report | September 30, 2016 | 15 |
| RiverNorth Funds | Portfolio Update |
September 30, 2016 (Unaudited)
Sector Breakdown(1) (percentages are based on net assets)
The allocation does not add up to 100% as it reflects the estimated leverage utilized by the underlying funds and the effects of a total return swap.
Portfolio detail statistics are estimates made by the adviser and are subject to change.
| (1) | Asset-Backed Security Risk – the risk that the value of the underlying assets will impair the value of the security. Borrowing Risk – borrowings increase fund expenses and are subject to repayment, possibly at inopportune times. Convertible Security Risk – the market value of convertible securities adjusts with interest rates and the value of the underlying stock. Defaulted Securities Risk – defaulted securities carry the risk of uncertainty of repayment. Derivatives Risk – derivatives are subject to counterparty risk. Exchange Traded Note Risk – exchange traded notes represent unsecured debt of the issuer and may be influenced by interest rates, credit ratings of the issuer or changes in value of the reference index. Fixed Income Risk – the market value of fixed income securities adjusts with interest rates and the securities are subject to issuer default. Foreign/Emerging Market Risk – foreign securities may be subject to inefficient or volatile markets, different regulatory regimes or different tax policies. These risks may be enhanced in emerging markets. Liquidity Risk – illiquid investments may be difficult or impossible to sell. Large Shareholder Purchase and Redemption Risk – The Fund may experience adverse effects when certain large shareholders purchase or redeem large amounts of shares of the Fund. Management Risk – there is no guarantee that the adviser’s or sub-adviser’s investment decisions will produce the desired results. Market Risk – economic conditions, interest rates and political events may affect the securities markets. Mortgage-Backed Security Risk – mortgage backed securities are subject to credit risk, pre-payment risk and devaluation of the underlying collateral. Portfolio Turnover Risk – increased portfolio turnover results in higher brokerage expenses and may impact the tax status of distributions. Rating Agency Risk – rating agencies may change their ratings or ratings may not accurately reflect a debt issuer’s creditworthiness. REIT Risk – the value of REITs changes with the value of the underlying properties and changes in interest rates and are subject to additional fees. Security Risk – The value of the Fund may decrease in response to the activities and financial prospects of individual securities in the Fund’s portfolio. Structured Notes Risk – because of the imbedded derivative feature, structured notes are subject to more risk than investing in a simple note or bond. Swap Risk – swap agreements are subject to counterparty default risk and may not perform as intended. Underlying Fund Risk – underlying funds have additional fees, may utilize leverage, may not correlate to an intended index and may trade at a discount to their net asset values. |
| 16 | (888) 848-7569 | www.rivernorth.com |
| RiverNorth Funds | Portfolio Update |
September 30, 2016 (Unaudited)
| (2) | For the sleeve managed by RiverNorth, credit quality allocation reflects a fixed-income portfolio weighted average of the credit breakdown of each closed-end fund as provided by the advisor of said closed-end fund. If a credit breakdown is not provided by the advisor, Bloomberg is used. For the sleeves managed by DoubleLine, credit quality allocation is determined from the highest available credit rating from any Nationally Recognized Statistical Rating Organization (S&P, Moody’s and Fitch). Investment grade refers to a bond rated BBB- or higher by Standard & Poor’s or Baa3 or higher by Moody’s. High yield refers to a bond rated lower than investment grade. For more information about securities ratings, please see the Fund’s Statement of Additional Information at www.rivernorth.com. |
| Annual Report | September 30, 2016 | 17 |
| RiverNorth Funds | Portfolio Update |
September 30, 2016 (Unaudited)
RiverNorth Equity Opportunity Fund
What is the Fund's investment strategy?
The RiverNorth Equity Opportunity Fund (“the Fund”) invests primarily in equity based closed-end funds and exchange-traded funds.
How did the RiverNorth Equity Opportunity Fund perform relative to its benchmark during the reporting period?
For the 12-month period ending September 30, 2016, the Class I share (symbol: RNDIX) returned 13.60% and the Class R share (symbol: RNEOX) returned 13.22%. The Russell 1000 Value Index returned 16.20%.
Comparison of a $10,000 Investment in the RiverNorth Equity Opportunity Fund and the Russell 1000 Value Index
| 18 | (888) 848-7569 | www.rivernorth.com |
| RiverNorth Funds | Portfolio Update |
September 30, 2016 (Unaudited)
Average Annual Total Returns for Periods Ending September 30, 2016
| | 1-Year | 3-Year | Since
Inception(1) |
| RiverNorth Equity Opportunity Fund - Class I (RNDIX) | 13.60% | 6.56% | 9.75% |
| RiverNorth Equity Opportunity Fund - Class R (RNEOX) | 13.22% | 6.27% | 9.48% |
Russell 1000® Value Index TR(2) | 16.20% | 9.70% | 13.57% |
| (1) | Inception date is July 18, 2012. |
| (2) | The Russell 1000® Value Index measures the performance of the large-cap value segment of the U.S. equity universe. It includes those Russell 1000® Index companies with lower price-to-book ratios and lower expected growth values. The index cannot be invested in directly and does not reflect fees and expenses. |
Performance data quoted represents past performance, which is not a guarantee of future results. Current performance may be lower or higher than the performance quoted. The principal value and investment return of an investment will fluctuate so that your shares, when redeemed, may be worth more or less than their original cost. You can obtain performance data current to the most recent month end by calling (888) 848-7569 or www.rivernorth.com. Total return measures net investment income and capital gain or loss from portfolio investments. All performance shown assumes reinvestment of dividends and capital gains distributions and does not reflect the deduction of taxes that a shareholder would pay on fund distributions or the redemption of fund shares. Prior to 1/1/2014, the Fund was managed in part by a sub-adviser pursuing a different strategy.
The Total Annual Operating Expense for the Fund as disclosed in the prospectus dated January 28, 2016: 2.69% (RNDIX), 2.94% (RNEOX). The adviser has contractually agreed to defer the collection of fees and/or reimburse expenses, but only to the extent necessary to limit Total Annual Fund Operating Expenses (excluding brokerage fees and commissions; borrowing costs, such as (a) interest and (b) dividends on securities sold short; taxes; indirect expenses incurred by the underlying funds in which the Fund invests; and extraordinary expenses) to 1.35% (RNDIX) and 1.60% (RNEOX) of the average daily net assets of the Fund through January 31, 2017. The annualized net expense ratio in this annual report dated September 30, 2015 is 1.35% (RNDIX) and 1.60% (RNEOX). The expense ratio as disclosed in the Fund’s annual report dated September 30, 2016 only includes the direct expenses paid by shareholders from their investment. The expense ratio as disclosed in the Fund’s prospectus dated January 28, 2016 is required to include the indirect expenses of investing in underlying funds.
What contributing factors were responsible for the RiverNorth Equity Opportunity Fund's relative performance during the period?
The Fund’s beta was less than 1.0 (relative to the Russell 1000® Value Index) and hybrid closed-end fund detracted from performance.
How was the RiverNorth Equity Opportunity Fund positioned at the end of September 2016?
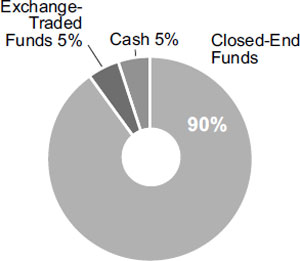
The Fund is 90% invested in closed-end funds, 5% in ETFs and 5% in cash. The closed-end funds are primarily general equity funds along with hybrid funds that can invest in a range of equity and fixed income securities. The large-cap U.S. equity ETFs in the portfolio are dry powder for closed-end fund trading opportunities.
| Annual Report | September 30, 2016 | 19 |
| RiverNorth Funds | Portfolio Update |
September 30, 2016 (Unaudited)
Investment Vehicle Allocation(1) (percentages are based on net assets)
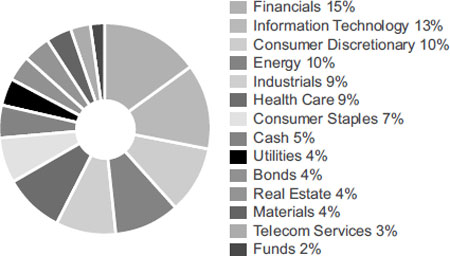
Sector Breakdown(1) (percentages are based on net assets)
Totals may not add up to 100% due to rounding.
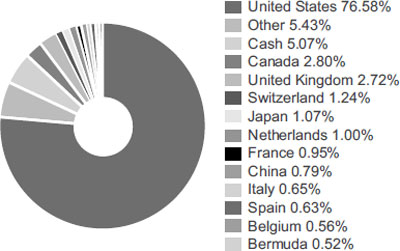
Exposure By Country
| 20 | (888) 848-7569 | www.rivernorth.com |
| RiverNorth Funds | Portfolio Update |
September 30, 2016 (Unaudited)
Portfolio detail statistics are estimates made by the adviser and are subject to change.
| (1) | Convertible Security Risk – the market value of convertible securities adjusts with interest rates and the value of the underlying stock. Currency Risk – foreign currencies will rise or decline relative to the U.S. dollar. Equity Risk – the value of equity securities changes frequently. Fixed Income Risk – the market value of fixed income securities adjusts with interest rates and the securities are subject to issuer default. Foreign/Emerging Market Risk – foreign securities may be subject to inefficient or volatile markets, different regulatory regimes or different tax policies. These risks may be enhanced in emerging markets. Investment Style Risk – investment strategies may come in and out of favor with investors and may underperform or outperform at times. Large Shareholder Purchase and Redemption Risk – The Fund may experience adverse effects when certain large shareholders purchase or redeem large amounts of shares of the Fund. Mid-Cap Risk – midcap companies may be more susceptible to adverse business or economic events than large-cap companies. Management Risk – there is no guarantee that the adviser’s investment decisions will produce the desired results. Market Risk – economic conditions, interest rates and political events may affect the securities markets. Portfolio Turnover Risk – increased portfolio turnover results in higher brokerage expenses and may impact the tax status of distributions. Preferred Stock Risk – preferred stocks generally pay dividends, but may be less liquid than common stocks, have less priority than debt instruments and may be subject to redemption by the issuer. Security Risk – The value of the Fund may decrease in response to the activities and financial prospects of individual securities in the Fund’s portfolio. Small-Cap Risk – small-cap companies are more susceptible to failure, are often thinly traded and have more volatile stock prices. Swap Risk – swap agreements are subject to counterparty default risk and may not perform as intended. Tax Risk – new federal or state governmental action could adversely affect the tax-exempt status of securities held by the Fund, resulting in higher tax liability for shareholders and potentially hurting Fund performance as well. Underlying Fund Risk – underlying funds have additional fees, may utilize leverage, may not correlate to an intended index and may trade at a discount to their net asset values. |
| Annual Report | September 30, 2016 | 21 |
| RiverNorth Funds | Portfolio Update |
September 30, 2016 (Unaudited)
RiverNorth/Oaktree High Income Fund
What is the Fund’s investment strategy?
The RiverNorth/Oaktree High Income Fund (“the Fund”) invests in a broad range of income producing securities including both fixed income and equity securities.
Assets of the Fund are tactically managed across three income strategies (or sleeves). RiverNorth manages the Tactical Closed-End Fund Strategy. This strategy is designed to provide diversified fixed income and equity income exposure through opportunistic investments in closed-end funds. Oaktree Capital Management, LP manages the High Yield Bond and Senior Loan Strategies on a global basis. Oaktree will tactically manage the allocation between the High Yield Bond and Senior Loan Strategies based both on market opportunities and the risk and reward trade-offs between the two asset classes.
How did the RiverNorth/Oaktree High Income Fund perform relative to its benchmark during the reporting period?
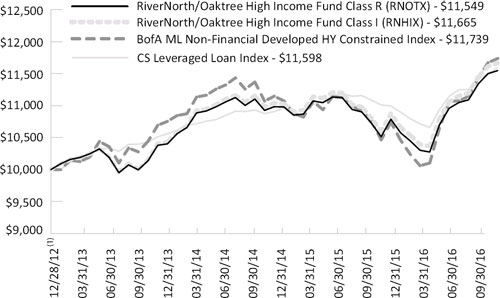
For the 12-month period ending September 30, 2016, the Class I share (symbol: RNHIX) returned 10.09% and the Class R share (symbol: RNOTX) returned 9.83%. The BofA ML Non- Financial Developed HY Constrained Index and CS Leveraged Loan Index returned 12.17% and 5.32%, respectively, during the same period.
Comparison of a $10,000 Investment in the RiverNorth/Oaktree High Income Fund, BofA ML Non-Financial Developed HY Constrained Index and the CS Leveraged Loan Index
| 22 | (888) 848-7569 | www.rivernorth.com |
| RiverNorth Funds | Portfolio Update |
September 30, 2016 (Unaudited)
Cumulative Total Returns for the Period Ending September 30, 2016
| | 1-Year | 3-Year | Since
Inception(1) |
| RiverNorth/Oaktree High Income Fund – Class I (RNHIX) | 10.09% | 4.74% | 4.18% |
| RiverNorth/Oaktree High Income Fund – Class R (RNOTX) | 9.83% | 4.44% | 3.91% |
BofA ML Non-Financial Developed HY Constrained Index(2) | 12.17% | 3.98% | 4.36% |
CS Leveraged Loan Index(2) | 5.32% | 3.61% | 4.03% |
| (1) | Inception date is December 28, 2012. |
| (2) | The BofA Merrill Lynch Non-Financial Developed Markets High Yield Constrained Index contains all securities in the BofA Merrill Lynch Global High Yield index from developed markets countries but cap issuer exposure at 2%. Developed markets is defined as an FX-G10 member, a Western European nation, or a territory of the U.S. or a Western European nation. The index tracks the performance of USD, CAD, GBP and EUR denominated below investment grade corporate debt publicly issued in the major domestic or Eurobond markets. Qualifying securities must have a below investment grade rating (based on an average of Moody’s, S&P and Fitch). CS Leveraged Loan Index tracks the investable market of the U.S. dollar denominated leveraged loan market. It consists of issues rated “5B” or lower, meaning that the highest rated issues included in this index are Moody’s/S&P ratings of Baa1/BB+ or Ba1/BBB+. All loans are funded term loans with a tenor of at least one year and are made by issuers domiciled in developed countries. The Bofa Merrill Lynch Non-Financial Developed Markets High Yield Constrained and the CS Leveraged Loan Indices are indices only and cannot be invested in directly. |
Performance data quoted represents past performance, which is not a guarantee of future results. Current performance may be lower or higher than the performance quoted. The principal value and investment return of an investment will fluctuate so that your shares, when redeemed, may be worth more or less than their original cost. You can obtain performance data current to the most recent month end by calling (888) 848-7569 or www.rivernorth.com. Total return measures net investment income and capital gain or loss from portfolio investments. All performance shown assumes reinvestment of dividends and capital gains distributions and does not reflect the deduction of taxes that a shareholder would pay on fund distributions or the redemption of
fund shares.
The Total Annual Operating Expense for the Fund as disclosed in the prospectus dated January 28, 2016: 1.82% (RNHIX), 2.07% (RNOTX). The adviser has contractually agreed to defer the collection of fees and/or reimburse expenses, but only to the extent necessary to limit Total Annual Fund Operating Expenses (excluding brokerage fees and commissions; borrowing costs, such as (a) interest and (b) dividends on securities sold short; taxes; indirect expenses incurred by the underlying funds in which the Fund invests; and extraordinary expenses) to 1.35% (RNHIX) and 1.60% (RNOTX) of the average daily net assets of the Fund through January 31, 2017. The annualized net expense ratio in this annual report dated September 30, 2016 is 1.34% (RNHIX) and 1.60% (RNOTX). The expense ratio as disclosed in the Fund’s annual report dated September 30, 2016 only includes the direct expenses paid by shareholders from their investment. The expense ratio as disclosed in the Fund’s prospectus dated January 28, 2016 is required to include the indirect expenses of investing in underlying funds.
| Annual Report | September 30, 2016 | 23 |
| RiverNorth Funds | Portfolio Update |
September 30, 2016 (Unaudited)
What contributing factors were responsible for the RiverNorth/Oaktree High Income Fund's relative performance during the period?
RiverNorth Tactical Closed-End Fund Sleeve
The Fund’s overweighting of high yield closed-end funds compared to bank loan funds contributed to performance over the year as high yield funds’ net asset value performance was better on average over the period. In addition, discount narrowing positively impacted both high yield and bank loan funds over the period.
Oaktree High Yield Bond & Senior Loan Sleeve
Global high yield bonds and global senior loans experienced a rollercoaster ride over the twelve months ended September 30, 2016. For analytic purposes, the trailing twelve months can be divided into two periods. The period between October 2015 and February 2016 was quite difficult, reflecting a major selloff in the energy and metals and mining sectors, and an increase in risk aversion. However, high yield bonds and senior loans broke out of their slump in mid-February 2016, and the market rallied strongly through September 30, 2016, which resulted in significantly higher than coupon returns over the period.
What caused the sudden about-face in the high yield bond and senior loan markets? While there was no single factor, rising oil prices and a rebound in equities encouraged investors to take on more risk. At the same time, a moderately growing U.S. economy, bolstered by a strengthening labor market and supportive global central banks, created a more favorable macro-economic backdrop. Perhaps most importantly though, while fundamental creditworthiness hadn’t changed, valuations (yield spreads) had become quite attractive early in the year.
Riskier credits (such as CCC-rated bonds and second-lien loans) were the stars over the trailing-twelve month reporting period. In the high yield bond market, CCC-rated securities returned 15.0%, while the BB/B segment returned 12.9%. Given the strong performance in 2016, the blended yield on the combined portfolio across high yield and senior loans narrowed considerably, beginning the period at approximately 6.5% and ending the period at approximately 5.3%.
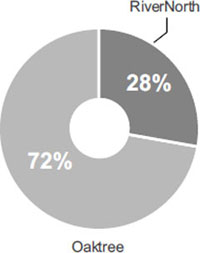
How was the RiverNorth/Oaktree High Income Fund positioned at the end of September 2016?
The Fund allocation was 28% RiverNorth Tactical Closed-End Fund and 72% Oaktree High Yield Bond and Senior Loan.
The closed-end fund sleeve is primarily invested in the common shares of closed-end funds. Over the past year we have decreased the Fund’s allocation to high yield closed-end funds relative to bank loan closed-end funds.
The Oaktree portfolio remains defensively positioned and constructed to preserve capital in the event of a market downturn. Oaktree believes the key to long-term success is managing credit risk, avoiding dangerous concentrations and minimizing defaults in the portfolio.
| 24 | (888) 848-7569 | www.rivernorth.com |
| RiverNorth Funds | Portfolio Update |
September 30, 2016 (Unaudited)
Strategy Allocation
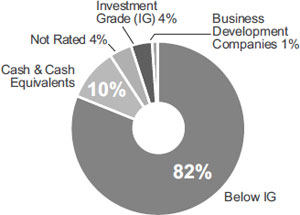
Credit Quality Distribution(1)(2) (percentages are based on net assets)
Totals may not add up to 100% due to rounding.
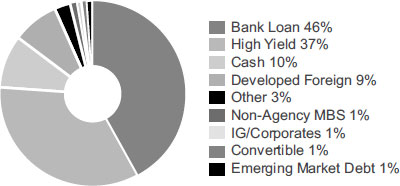
Sector Breakdown(1) (percentages are based on net assets)
The allocation does not add up to 100% as it reflects the leverage utilized by the underlying funds.
| Annual Report | September 30, 2016 | 25 |
| RiverNorth Funds | Portfolio Update |
September 30, 2016 (Unaudited)
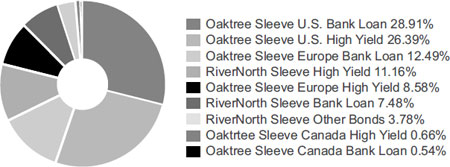
High Yield & Bank Loan Geographic Breakdown
Totals may not add up to 100% due to rounding.
Credit Exposure By Type
Portfolio detail statistics are estimates made by the adviser and are subject to change.
| (1) | Borrowing Risk – borrowings increase fund expenses and are subject to repayment, possibly at inopportune times. Closed-End Fund Risk – closed-end funds are exchange traded, may trade at a discount to their net asset values and may deploy leverage. Convertible Security Risk – the market value of convertible securities adjusts with interest rates and the value of the underlying stock. Credit Derivatives Risk – the use of credit derivatives is highly specialized, involves default, counterparty and liquidity risks and may not perfectly correlate to the underlying asset or liability being hedged. Currency Risk – foreign currencies will rise or decline relative to the U.S. dollar. Distressed and Defaulted Securities Risk – defaulted securities carry the risk of uncertainty of repayment. Equity Risk – equity securities may experience volatility and the value of equity securities may move in opposite directions from each other and from other equity markets generally. Fixed Income Risk – the market value of fixed income securities adjusts with interest rates and the securities are subject to issuer default. Foreign/Emerging Market Risk – foreign securities may be subject to inefficient or volatile markets, different regulatory regimes or different tax policies. These risks may be enhanced in emerging markets. Floating Interest Rate Risk – loans pay interest based on the London Interbank Offered Rate (LIBOR) and a decline in LIBOR could negatively impact the Fund’s return. Investment Style Risk – investment strategies may come in and out of favor with investors and may underperform or outperform at times. Large Shareholder Purchase and Redemption Risk – The Fund may experience adverse effects when certain large shareholders purchase or redeem large amounts of shares of the Fund. Loans Risk – loans may be unrated or rated below investment grade and the pledged collateral may lose value. Secondary trading in loans is not fully-developed and may result in illiquidity. Management Risk – there is no guarantee that the adviser’s or sub-adviser's investment decisions will produce the desired results. Market Risk – economic conditions, interest rates and political events may affect the securities markets. Portfolio Turnover Risk – increased portfolio turnover results in higher brokerage expenses and may impact the tax status of distributions. Preferred Stock Risk – preferred stocks generally pay dividends, but may be less liquid than common stocks, have less priority than debt instruments and may be subject to redemption by the issuer. Security Risk – the value of the Fund may increase or decrease in response to the prospects of the issuers of securities and loans held in the Fund. Swap Risk – swap agreements are subject to counterparty default risk and may not perform as intended. Underlying Fund Risk – underlying funds have additional fees, may utilize leverage, may not correlate to an intended index and may trade at a discount to their net asset values. Valuation Risk – Loans and fixed-income securities are traded “over the counter” and because there is no centralized information regarding trading, the valuation of loans and fixed-income securities may vary. |
| 26 | (888) 848-7569 | www.rivernorth.com |
| RiverNorth Funds | Portfolio Update |
September 30, 2016 (Unaudited)
| (2) | For the sleeve managed by RiverNorth, credit quality allocation reflects a fixed-income portfolio weighted average of the credit breakdown of each closed-end fund as provided by the advisor of said closed-end fund. If a credit breakdown is not provided by the advisor, Bloomberg is used. For the sleeves managed by Oaktree, the sub-adviser uses a proprietary credit scoring matrix to rank potential investments. This process offers a systematic way of reviewing the key quantitative and qualitative variables impacting credit quality for each investment. Investment grade refers to a bond rated BBB- or higher by Standard & Poor’s or Baa3 or higher by Moody’s. High yield refers to a bond rated lower than investment grade. For more information about securities ratings, please see the Fund’s Statement of Additional Information at www.rivernorth.com. |
| Annual Report | September 30, 2016 | 27 |
| RiverNorth Funds | Disclosure of Fund Expenses |
September 30, 2016 (Unaudited)
Expense Example
As a shareholder of the RiverNorth Funds (the “Trust” or “Funds”), you incur two types of costs: (1) transaction costs (such as the 2% fee on redemption of Fund shares made within 90 days of purchase); and (2) ongoing costs, including management fees, distribution and service (12b-1) fees and other Fund expenses. This example is intended to help you understand your ongoing costs (in dollars) of investing in the Funds and to compare these costs with the ongoing costs of investing in other mutual funds. The Example is based on an investment of $1,000 invested at the beginning of the period, October 1, 2015 and held for the six months ended March 31, 2016.
Actual Expenses
The first line of the table below provides information about actual account values and actual expenses. You may use the information in this line, together with the amount you invested, to estimate the expenses that you paid over the period. Simply divide your account value by $1,000 (for example, an $8,600 account value divided by $1,000 = 8.6), then multiply the result by the number in the first line under the heading entitled “Expenses Paid During Period” to estimate the expenses you paid on your account during this period.
Hypothetical Example for Comparison Purposes
The second line of the table below provides information about hypothetical account values and hypothetical expenses based on each Fund’s actual expense ratio and an assumed rate of return of 5% per year before expenses, which is not each Fund’s actual return. The hypothetical account values and expenses may not be used to estimate the actual ending account balance or expenses you paid for the period. You may use this information to compare the ongoing costs of investing in each Fund and other funds. To do so, compare these 5% hypothetical examples with the 5% hypothetical examples that appear in the shareholder reports of other funds.
Please note that the expenses shown in the table below are meant to highlight your ongoing costs only and do not reflect any transactional costs, such as redemption fees. Therefore, the second line for each share class of each Fund within the table is useful in comparing ongoing costs only, and will not help you determine the relative total costs of owning different funds. If these transactional costs were included, your costs would have been higher.
| 28 | (888) 848-7569 | www.rivernorth.com |
| RiverNorth Funds | Disclosure of Fund Expenses |
September 30, 2016 (Unaudited)
| | | Beginning Account Value 04/01/2016 | | Ending Account Value 09/30/2016 | | Expense Ratio(a) | | Expenses Paid During Period(b) | |
| RiverNorth Core Opportunity Fund | | | | | | | | | |
| Class I Shares | | | | | | | | | |
| Actual | | $1,000.00 | | $1,098.00 | | 1.11% | | $5.82 | |
| Hypothetical (5% return before expenses) | | $1,000.00 | | $1,019.45 | | 1.11% | | $5.60 | |
| | | | | | | | | | |
| Class R Shares | | | | | | | | | |
| Actual | | $1,000.00 | | $1,095.70 | | 1.36% | | $7.13 | |
| Hypothetical (5% return before expenses) | | $1,000.00 | | $1,018.20 | | 1.36% | | $6.86 | |
| | | | | | | | | | |
| RiverNorth/DoubleLine Strategic Income Fund | | | | | | | | | |
| Class I Shares | | | | | | | | | |
| Actual | | $1,000.00 | | $1,056.90 | | 0.86% | | $4.42 | |
| Hypothetical (5% return before expenses) | | $1,000.00 | | $1,020.70 | | 0.86% | | $4.34 | |
| | | | | | | | | | |
| Class R Shares | | | | | | | | | |
| Actual | | $1,000.00 | | $1,056.60 | | 1.11% | | $5.71 | |
| Hypothetical (5% return before expenses) | | $1,000.00 | | $1,019.45 | | 1.11% | | $5.60 | |
| | | | | | | | | | |
| RiverNorth Equity Opportunity Fund | | | | | | | | | |
| Class I Shares | | | | | | | | | |
| Actual | | $1,000.00 | | $1,103.10 | | 1.35% | | $7.10 | |
| Hypothetical (5% return before expenses) | | $1,000.00 | | $1,018.25 | | 1.35% | | $6.81 | |
| | | | | | | | | | |
| Class R Shares | | | | | | | | | |
| Actual | | $1,000.00 | | $1,100.60 | | 1.60% | | $8.40 | |
| Hypothetical (5% return before expenses) | | $1,000.00 | | $1,017.00 | | 1.60% | | $8.07 | |
| | | | | | | | | | |
| RiverNorth/Oaktree High Income Fund | | | | | | | | | |
| Class I Shares | | | | | | | | | |
| Actual | | $1,000.00 | | $1,080.50 | | 1.35% | | 7.02 | |
| Hypothetical (5% return before expenses) | | $1,000.00 | | $1,018.25 | | 1.35% | | 6.81 | |
| | | | | | | | | | |
| Class R Shares | | | | | | | | | |
| Actual | | $1,000.00 | | $1,079.30 | | 1.59% | | 8.27 | |
| Hypothetical (5% return before expenses) | | $1,000.00 | | $1,017.05 | | 1.59% | | 8.02 | |
| Annual Report | September 30, 2016 | 29 |
| RiverNorth Funds | Disclosure of Fund Expenses |
September 30, 2016 (Unaudited)
(a) | Annualized, based on the Fund's most recent fiscal half-year expenses. |
(b) | Expenses are equal to the Fund's annualized ratio multiplied by the average account value over the period, multiplied by the number of days in the most recent fiscal half year (183), then divided by 366. Note this expense example is typically based on a six-month period. |
| 30 | (888) 848-7569 | www.rivernorth.com |
| RiverNorth Core Opportunity Fund | Schedule of Investments |
| Shares/Description | | | Value | |
| CLOSED-END FUNDS - 60.48% | |
| 268,587 | | Aberdeen Emerging Markets Smaller Co. Opportunities Fund, Inc. | | $ | 3,394,940 | |
| 1,711,552 | | Adams Diversified Equity Fund, Inc. | | | 22,506,909 | |
| 156,082 | | Advent Claymore Convertible Securities and Income Fund II | | | 899,032 | |
| 502,577 | | AllianzGI Equity & Convertible Income Fund | | | 9,408,241 | |
| 79,326 | | Alpine Global Dynamic Dividend Fund | | | 690,136 | |
| 2,090,751 | | Alpine Total Dynamic Dividend Fund | | | 15,952,430 | |
| 235,017 | | Apollo Tactical Income Fund, Inc. | | | 3,633,363 | |
| 370,560 | | Avenue Income Credit Strategies Fund | | | 4,806,163 | |
| 1,162,627 | | BlackRock Credit Allocation Income Trust | | | 15,521,070 | |
| 933,436 | | BlackRock Debt Strategies Fund, Inc. | | | 3,407,041 | |
| 926,778 | | BlackRock Global Opportunities Equity Trust | | | 11,353,030 | |
| 349,804 | | BlackRock Multi-Sector Income Trust | | | 5,971,154 | |
| 28,792 | | BlackRock Resources & Commodity Strategy Trust | | | 234,655 | |
| 308,178 | | Blackstone/GSO Long-Short Credit Income Fund | | | 4,789,086 | |
| 465,654 | | Blackstone/GSO Strategic Credit Fund | | | 6,947,558 | |
| 1,717,354 | | Boulder Growth & Income Fund, Inc. | | | 14,391,426 | |
| 84,607 | | Brookfield Global Listed Infrastructure Income Fund, Inc. | | | 1,160,808 | |
| 169,035 | | Calamos Global Dynamic Income Fund | | | 1,269,453 | |
| 525,117 | | CBRE Clarion Global Real Estate Income Fund | | | 4,410,983 | |
| 737,465 | | Central Fund of Canada Ltd. - Class A | | | 10,199,141 | |
| 275,806 | | ClearBridge American Energy MLP Fund, Inc. | | | 2,471,222 | |
| 135,743 | | ClearBridge Energy MLP Total Return Fund, Inc. | | | 1,774,161 | |
| 274,153 | | Clough Global Allocation Fund | | | 3,325,476 | |
| 1,211,584 | | Clough Global Equity Fund(a) | | | 13,787,826 | |
| 3,053,415 | | Clough Global Opportunities Fund(a) | | | 29,526,523 | |
| 464,723 | | Deutsche High Income Trust | | | 4,280,099 | |
| 81,529 | | Deutsche Strategic Income Trust | | | 988,131 | |
| 56,844 | | Eaton Vance Floating-Rate Income Plus Fund | | | 889,040 | |
| 386,412 | | Eaton Vance Limited Duration Income Fund | | | 5,297,709 | |
| 277,752 | | Eaton Vance Short Duration Diversified Income Fund | | | 3,807,980 | |
| 406,083 | | First Trust High Income Long/Short Fund | | | 6,330,834 | |
| 431,555 | | Franklin Limited Duration Income Trust | | | 5,217,500 | |
| 362,709 | | General American Investors Co., Inc. | | | 11,842,449 | |
| 403,685 | | Invesco Dynamic Credit Opportunities Fund | | | 4,747,336 | |
| 273,019 | | Legg Mason BW Global Income Opportunities Fund, Inc. | | | 3,707,598 | |
| 7,395,127 | | Liberty All Star® Equity Fund | | | 38,306,758 | |
| 444,466 | | LMP Capital and Income Fund, Inc. | | | 6,058,072 | |
| 164,149 | | Madison Strategic Sector Premium Fund | | | 1,928,751 | |
| 50,360 | | MFS Charter Income Trust | | | 435,110 | |
| 932,777 | | MFS Multimarket Income Trust | | | 5,680,612 | |
| 152,600 | | Morgan Stanley Emerging Markets Debt Fund, Inc. | | | 1,472,590 | |
| 365,190 | | Morgan Stanley Emerging Markets Domestic Debt Fund, Inc. | | | 2,932,476 | |
| 111,804 | | Neuberger Berman High Yield Strategies Fund, Inc. | | | 1,325,995 | |
| 1,633,401 | | Neuberger Berman Real Estate Securities Income Fund, Inc. | | | 9,294,052 | |
| 275,191 | | NexPoint Credit Strategies Fund | | | 6,117,496 | |
See Notes to Financial Statements.
| Annual Report | September 30, 2016 | 31 |
| RiverNorth Core Opportunity Fund | Schedule of Investments |
September 30, 2016
| Shares/Description | | | Value | |
| 1,018,249 | | | Nuveen Credit Strategies Income Fund | | $ | 8,634,752 | |
| 400,000 | | | Nuveen Global Equity Income Fund | | | 4,776,000 | |
| 447,970 | | | Nuveen Mortgage Opportunity Term Fund | | | 10,831,915 | |
| 131,168 | | | Nuveen Mortgage Opportunity Term Fund 2 | | | 3,111,305 | |
| 315,085 | | | PIMCO Dynamic Credit Income Fund | | | 6,424,583 | |
| 105,528 | | | Prudential Global Short Duration High Yield Fund, Inc. | | | 1,594,528 | |
| 117,716 | | | Royce Global Value Trust, Inc. | | | 956,442 | |
| 433,625 | | | Royce Micro-Cap Trust, Inc. | | | 3,386,611 | |
| 2,087,861 | | | Royce Value Trust, Inc. | | | 26,432,320 | |
| 1,108,917 | | | Sprott Focus Trust, Inc. | | | 7,651,527 | |
| 1,807,940 | | | Templeton Global Income Fund | | | 11,281,546 | |
| 80,082 | | | THL Credit Senior Loan Fund | | | 1,320,552 | |
| 1,084,537 | | | Tri-Continental Corp. | | | 23,187,401 | |
| 105,661 | | | Voya Emerging Markets High Income Dividend Equity Fund | | | 865,364 | |
| 483,772 | | | Wells Fargo Advantage Multi-Sector Income Fund | | | 6,274,523 | |
| 609,133 | | | Western Asset Emerging Markets Income Fund, Inc. | | | 7,011,121 | |
| 245,786 | | | Western Asset Global Corporate Defined Opportunity Fund, Inc. | | | 4,347,954 | |
| 1,706,316 | | | Western Asset High Income Opportunity Fund, Inc. | | | 8,616,896 | |
| 357,148 | | | Western Asset Worldwide Income Fund, Inc. | | | 4,146,488 | |
| 394,986 | | | Zweig Fund, Inc. | | | 5,115,070 | |
| 597,153 | | | Zweig Total Return Fund, Inc. | | | 7,189,722 | |
| | | | | | | | |
| TOTAL CLOSED-END FUNDS (Cost $446,010,650) | | 465,649,035 | |
| | | | | | | | |
| BUSINESS DEVELOPMENT COMPANIES - 1.50 % | | | |
| 683,211 | | | American Capital Ltd.(b) | | | 11,553,098 | |
| | | | | | | | |
| TOTAL BUSINESS DEVELOPMENT COMPANIES (Cost $9,436,583) | | 11,553,098 | |
| | | | | | | | |
| EXCHANGE-TRADED FUNDS - 15.15% | |
| 49,099 | | | Guggenheim S&P 500® Top 50® ETF | | | 7,500,854 | |
| 30,000 | | | iShares® Russell 2000® ETF | | | 3,726,300 | |
| 209,517 | | | Market Vectors® Gold Miners ETF | | | 5,537,534 | |
| 521,245 | | | PowerShares® FTSE RAFI Emerging Markets Portfolio | | | 9,340,710 | |
| 240,668 | | | PowerShares® FTSE RAFI US 1000 Portfolio | | | 22,526,525 | |
| 110,659 | | | SPDR® S&P 500® ETF Trust | | | 23,935,542 | |
| 482,753 | | | Vanguard® FTSE Developed Markets ETF | | | 18,059,790 | |
See Notes to Financial Statements.
| 32 | (888) 848-7569 | www.rivernorth.com |
| RiverNorth Core Opportunity Fund | Schedule of Investments |
September 30, 2016
| Shares/Description | | | Value | |
| | 690,375 | | Vanguard® FTSE Emerging Markets ETF | | $ | 25,978,811 | |
| | | | | | | | |
| TOTAL EXCHANGE-TRADED FUNDS (Cost $109,708,530) | | | 116,606,066 | |
| | | | | | | | |
| OPEN-END FUNDS - 0.36% | | | | |
| | 339,790 | | AB Income Fund | | | 2,765,893 | |
| | | | | | | | |
| TOTAL OPEN-END FUNDS (Cost $2,546,258) | | | 2,765,893 | |
| | | | | | | | |
| PREFERRED STOCKS - 0.21% | | | | |
| | 61,158 | | General American Investors Co., Inc., Series B, 5.950% | | | 1,629,861 | |
| | | | | | | | |
| TOTAL PREFERRED STOCKS (Cost $1,444,152) | | | 1,629,861 | |
| | | | | | | | |
| SHORT-TERM INVESTMENTS - 21.23% | | | | |
| Money Market Fund | | | | |
| | 163,465,551 | | State Street Institutional Trust (7 Day Yield 0.19%) | | | 163,465,551 | |
| | | | | | | | |
| TOTAL SHORT-TERM INVESTMENTS (Cost $163,465,551) | | | 163,465,551 | |
| | | | | | | | |
| TOTAL INVESTMENTS - 98.93% (Cost $732,611,724) | | | 761,669,504 | |
| CASH SEGREGATED AT CUSTODIAN FOR TOTAL RETURN SWAP CONTRACTS - 0.05% | | | 400,000 | |
| OTHER ASSETS IN EXCESS OF LIABILITIES -1.02% | | | 7,840,541 | |
| NET ASSETS - 100.00% | | $ | 769,910,045 | |
| (a) | Affiliated company. See Note 9 to Notes to Financial Statements. |
| (b) | Non-income producing security. |
See Notes to Financial Statements.
| Annual Report | September 30, 2016 | 33 |
| RiverNorth Core Opportunity Fund | Schedule of Investments |
September 30, 2016
TOTAL RETURN SWAP CONTRACTS*
| Counterparty | Reference
Asset | Termination Date | | Rate paid by the Fund | | Notional Amount | | | Upfront Premiums Paid | | | Unrealized Appreciation | |
ReFlow Fund, LLC(a) | Net Asset Value | 12/16/2016 | | | 2.28 | %(b) | | $ | 65,000,000 | | | $ | – | | | $ | 252,002 | |
| Goldman Sachs | Fifth Street Finance Corp., Common Shares | 10/27/2016 | | | 1.18 | % | | | 1,929,552 | | | | 1,929,552 | | | | 90,393 | |
| Goldman Sachs | Fifth Street Finance Corp., Common Shares | 10/28/2016 | | | 1.18 | % | | | 1,960,842 | | | | 1,960,842 | | | | 59,103 | |
| Goldman Sachs | Fifth Street Finance Corp., Common Shares | 10/31/2016 | | | 1.18 | % | | | 1,971,266 | | | | 1,971,266 | | | | 48,674 | |
| Goldman Sachs | Fifth Street Finance Corp., Common Shares | 01/20/2017 | | | 1.18 | % | | | 1,354,045 | | | | 1,354,045 | | | | 249,306 | |
| Goldman Sachs | Fifth Street Finance Corp., Common Shares | 01/24/2017 | | | 1.18 | % | | | 311,483 | | | | 311,483 | | | | 43,078 | |
| Goldman Sachs | Fifth Street Finance Corp., Common Shares | 01/25/2017 | | | 1.18 | % | | | 465,334 | | | | 465,334 | | | | 92,729 | |
| | | | | | | | | | | | | | | | | $ | 835,285 | |
| (a) | The Fund receives monthly payments based on any positive monthly return of the Reference Asset. The Fund makes payments on any negative monthly return of such Reference Asset. |
| (b) | Floating or variable rate security. Interest rate disclosed is that which is in effect at September 30, 2016. |
| * | See Note 4 in the Notes to Financial Statements. |
See Notes to Financial Statements.
| 34 | (888) 848-7569 | www.rivernorth.com |
| RiverNorth/DoubleLine Strategic Income Fund | Schedule of Investments |
September 30, 2016
| Shares/Description | | Value |
| CLOSED-END FUNDS - 22.62% | | |
1,913,505 | | Aberdeen Asia-Pacific Income Fund, Inc. | | $ | 9,797,146 |
315,609 | | Advent Claymore Convertible Securities and Income Fund | | | 4,601,579 |
805,025 | | Advent Claymore Convertible Securities and Income Fund II | | | 4,636,944 |
408,091 | | Advent/Claymore Enhanced Growth & Income Fund | | | 3,407,560 |
232,546 | | AllianzGI Diversified Income & Convertible Fund | | | 4,425,350 |
129,350 | | Apollo Senior Floating Rate Fund, Inc. | | | 2,189,895 |
599,626 | | Ares Dynamic Credit Allocation Fund, Inc. | | | 8,904,446 |
254,019 | | Barings Global Short Duration High Yield Fund | | | 4,732,374 |
1,471,606 | | BlackRock Corporate High Yield Fund, Inc. | | | 15,922,777 |
1,765,786 | | BlackRock Credit Allocation Income Trust | | | 23,573,243 |
3,645,963 | | BlackRock Debt Strategies Fund, Inc. | | | 13,307,765 |
332,786 | | BlackRock Floating Rate Income Strategies Fund, Inc. | | | 4,612,414 |
206,664 | | BlackRock Limited Duration Income Trust | | | 3,207,425 |
511,077 | | BlackRock Multi-Sector Income Trust | | | 8,724,084 |
826,617 | | Blackstone/GSO Strategic Credit Fund | | | 12,333,126 |
540,922 | | Brookfield High Income Fund, Inc. | | | 3,959,549 |
561,144 | | Brookfield Mortgage Opportunity Income Fund, Inc. | | | 8,417,160 |
64,078 | | Calamos Convertible Opportunities and Income Fund | | | 661,926 |
979,780 | | Credit Suisse Asset Management Income Fund, Inc. | | | 3,076,509 |
182,913 | | Deutsche Global High Income Fund, Inc. | | | 1,539,926 |
455,060 | | Deutsche High Income Opportunities Fund, Inc. | | | 6,439,099 |
604,704 | | Deutsche Multi-Market Income Trust | | | 5,170,219 |
1,865,560 | | Eaton Vance Limited Duration Income Fund | | | 25,576,828 |
863,252 | | Eaton Vance Senior Income Trust | | | 5,559,343 |
267,675 | | Eaton Vance Short Duration Diversified Income Fund | | | 3,669,824 |
265,855 | | First Trust Aberdeen Global Opportunity Income Fund | | | 3,131,772 |
588,167 | | First Trust High Income Long/Short Fund | | | 9,169,524 |
192,271 | | First Trust Strategic High Income Fund II | | | 2,372,624 |
329,024 | | Franklin Limited Duration Income Trust | | | 3,977,900 |
1,386,646 | | Invesco Dynamic Credit Opportunities Fund | | | 16,306,957 |
205,493 | | Invesco High Income Trust II | | | 3,004,308 |
2,228,771 | | Invesco Senior Income Trust | | | 9,650,578 |
48,232 | | KKR Income Opportunities Fund | | | 772,677 |
455,821 | | Legg Mason BW Global Income Opportunities Fund, Inc. | | | 6,190,049 |
1,113,076 | | MFS Charter Income Trust | | | 9,616,977 |
805,672 | | MFS Multimarket Income Trust | | | 4,906,542 |
483,942 | | Morgan Stanley Emerging Markets Debt Fund, Inc. | | | 4,670,040 |
1,334,041 | | Morgan Stanley Emerging Markets Domestic Debt Fund, Inc. | | | 10,712,349 |
230,385 | | Morgan Stanley Income Securities, Inc. | | | 4,358,884 |
374,040 | | Neuberger Berman High Yield Strategies Fund, Inc. | | | 4,436,114 |
134,985 | | NexPoint Credit Strategies Fund | | | 3,000,717 |
2,015,306 | | Nuveen Credit Strategies Income Fund | | | 17,089,795 |
553,895 | | Nuveen Global High Income Fund | | | 8,696,152 |
848,448 | | Nuveen Senior Income Fund | | | 5,548,850 |
1,396,140 | | PIMCO Dynamic Credit Income Fund | | | 28,467,295 |
See Notes to Financial Statements.
| Annual Report | September 30, 2016 | 35 |
| RiverNorth/DoubleLine Strategic Income Fund | Schedule of Investments |
September 30, 2016
| Shares/Description | | Value |
235,493 | | Pioneer Floating Rate Trust | | $ | 2,778,817 |
917,310 | | Prudential Global Short Duration High Yield Fund, Inc. | | | 13,860,554 |
285,289 | | Putnam High Income Securities Fund | | | 2,288,018 |
1,854,219 | | Putnam Premier Income Trust | | | 9,067,131 |
1,244,514 | | Templeton Emerging Markets Income Fund | | | 13,689,654 |
2,166,040 | | Templeton Global Income Fund | | | 13,516,090 |
383,472 | | The GDL Fund | | | 3,815,546 |
263,881 | | The New America High Income Fund, Inc. | | | 2,430,344 |
194,754 | | Virtus Global Multi-Sector Income Fund | | | 3,094,641 |
260,130 | | Voya Prime Rate Trust | | | 1,373,486 |
751,459 | | Wells Fargo Advantage Multi-Sector Income Fund | | | 9,746,423 |
192,532 | | Western Asset Corporate Loan Fund, Inc. | | | 2,058,167 |
363,591 | | Western Asset Emerging Markets Debt Fund, Inc. | | | 5,911,990 |
503,539 | | Western Asset Emerging Markets Income Fund, Inc. | | | 5,795,734 |
162,856 | | Western Asset Global Corporate Defined Opportunity Fund, Inc. | | | 2,880,923 |
2,118,656 | | Western Asset High Income Opportunity Fund, Inc. | | | 10,699,214 |
635,622 | | Western Asset High Yield Defined Opportunity Fund, Inc. | | | 9,794,935 |
70,219 | | Western Asset Worldwide Income Fund, Inc. | | | 815,243 |
582,157 | | Western Asset/Claymore Inflation-Linked Opportunities & Income Fund | | | 6,514,337 |
| | | | |
| TOTAL CLOSED-END FUNDS (Cost $479,239,016) | | | 464,657,862 |
| | | | |
| BUSINESS DEVELOPMENT COMPANIES - 1.40% | | | |
1,696,892 | | American Capital Ltd.(a) | | | 28,694,444 |
| | | | |
| TOTAL BUSINESS DEVELOPMENT COMPANIES (Cost $24,466,370) | | | 28,694,444 |
| | | | | | |
| OPEN-END FUNDS - 3.10% | | | |
4,596,408 | | AB Income Fund | | | 37,414,765 |
2,772,396 | | RiverNorth/Oaktree High Income Fund, Class I(b) | | | 26,286,745 |
| | | | |
| TOTAL OPEN-END FUNDS (Cost $61,610,335) | | | 63,701,510 |
| | | | | | |
PREFERRED STOCKS - 0.78% | | | |
84,225 | | Apollo Commercial Real Estate Finance, Inc., Series A, 8.625% | | | 2,168,794 |
80,000 | | Gladstone Investment Corp., 6.250% | | | 2,033,600 |
128,956 | | Gladstone Investment Corp., Series C, 6.500% | | | 3,351,554 |
56,444 | | Hercules Capital, Inc., 6.250% | | | 1,448,353 |
125,774 | | Kayne Anderson MLP Investment Co., Series F, 3.500% | | | 3,182,082 |
See Notes to Financial Statements.
| 36 | (888) 848-7569 | www.rivernorth.com |
| RiverNorth/DoubleLine Strategic Income Fund | Schedule of Investments |
September 30, 2016
| Shares/Description | | | Value | |
| | 76,371 | | The GDL Fund, Series B, 3.000% | | $ | 3,872,002 | |
| | | | | | | | |
TOTAL PREFERRED STOCKS (Cost $15,889,902) | | | 16,056,385 | |
| Shares/Description | Rate | Maturity | | | Value | |
| BUSINESS DEVELOPMENT COMPANY SENIOR NOTES - 1.06% | | | | |
| | 232,005 | | Fifth Street Finance Corp. | 6.13% | 04/30/2028 | | | 5,967,192 | |
| | 152,445 | | Main Street Capital Corp. | 6.13% | 04/01/2023 | | | 3,956,435 | |
| | 90,923 | | Medley Capital Corp. | 7.13% | 03/30/2019 | | | 2,313,081 | |
| | 135,503 | | MVC Capital, Inc. | 7.25% | 01/15/2023 | | | 3,424,703 | |
| | 124,486 | | THL Credit, Inc. | 6.75% | 11/15/2021 | | | 3,232,441 | |
| | 112,010 | | THL Credit, Inc. | 6.75% | 12/30/2022 | | | 2,912,260 | |
| | | | | | | | | | |
TOTAL BUSINESS DEVELOPMENT COMPANY SENIOR NOTES (Cost $21,047,071) | | | | | 21,806,112 | |
| Principal Amount/Description | Rate | Maturity | | | Value | |
| FOREIGN CORPORATE BONDS - 1.74% | | | | | | |
| Australia - 0.08% | | | | | | |
| $ | 585,000 | | Australia & New Zealand Banking Group Ltd.(c) | 4.88% | 01/12/2021 | | | 654,591 | |
| | 200,000 | | CNOOC Finance 2015 Australia Pty Ltd. | 2.63% | 05/05/2020 | | | 204,161 | |
| | 590,000 | | Westpac Banking Corp. | 2.60% | 11/23/2020 | | | 606,789 | |
| | 75,000 | | Westpac Banking Corp. | 2.00% | 08/19/2021 | | | 75,012 | |
| | | | | | | | | 1,540,553 | |
| Bermuda - 0.05% | | | | | | |
| | 600,000 | | Digicel Group Ltd.(c) | 7.13% | 04/01/2022 | | | 464,820 | |
| | 400,000 | | Digicel Group Ltd.(d) | 7.13% | 04/01/2022 | | | 307,880 | |
| | 200,000 | | Inkia Energy Ltd.(d) | 8.38% | 04/04/2021 | | | 208,300 | |
| | | | | | | | | 981,000 | |
| Brazil - 0.01% | | | | | | | | |
| | 100,000 | | Cosan Overseas Ltd.(e) | 8.25% | Perpetual Maturity | | | 100,000 | |
| | 1,500,000 | | OAS Finance Ltd.(c)(e)(f)(g) | 8.88% | Perpetual Maturity | | | 75,000 | |
| | | | | | | | | 175,000 | |
| British Virgin Islands - 0.03% | | | | | | |
| | 300,000 | | CNOOC Finance 2011 Ltd.(d) | 4.25% | 01/26/2021 | | | 324,851 | |
| | 200,000 | | Sinopec Group Overseas Development 2015 Ltd.(c) | 2.50% | 04/28/2020 | | | 203,701 | |
| | | | | | | | | 528,552 | |
See Notes to Financial Statements.
| Annual Report | September 30, 2016 | 37 |
| RiverNorth/DoubleLine Strategic Income Fund | Schedule of Investments |
September 30, 2016
| Principal Amount/Description | Rate | Maturity | | | Value | |
| Canada - 0.06% | | | | | | |
| $ | 70,000 | | Lundin Mining Corp.(c) | 7.50% | 11/01/2020 | | $ | 74,725 | |
| | 70,000 | | Open Text Corp.(c) | 5.88% | 06/01/2026 | | | 73,412 | |
| | 160,000 | | Royal Bank of Canada | 2.50% | 01/19/2021 | | | 165,244 | |
| | 1,005,000 | | The Toronto-Dominion Bank | 1.80% | 07/13/2021 | | | 1,001,765 | |
| | | | | | | | | 1,315,146 | |
| Cayman Islands - 0.18% | | | | | | |
| | 500,000 | | Agromercantil Senior Trust(c) | 6.25% | 04/10/2019 | | | 522,500 | |
| | 200,000 | | Banco Nacional de Comercio Exterior SNC/Cayman Islands(d)(f) | 3.80% | 08/11/2026 | | | 194,440 | |
| | 150,000 | | Bantrab Senior Trust(d) | 9.00% | 11/14/2020 | | | 132,750 | |
| | 600,000 | | Grupo Aval Ltd.(d) | 4.75% | 09/26/2022 | | | 595,200 | |
| | 870,529 | | Guanay Finance Ltd.(d) | 6.00% | 12/15/2020 | | | 893,381 | |
| | 600,000 | | Industrial Senior Trust(c) | 5.50% | 11/01/2022 | | | 597,000 | |
| | 300,000 | | Industrial Senior Trust(d) | 5.50% | 11/01/2022 | | | 298,500 | |
| | 650,000 | | Peru Enhanced Pass-Through Finance Ltd.(d)(h) | 0.00% | 06/02/2025 | | | 543,725 | |
| | | | | | | | | 3,777,496 | |
| Chile - 0.07% | | | | | | |
| | 400,000 | | Colbun SA(d) | 6.00% | 01/21/2020 | | | 448,186 | |
| | 550,000 | | CorpGroup Banking SA(c) | 6.75% | 03/15/2023 | | | 532,812 | |
| | 500,000 | | Empresa Electrica Angamos SA(d) | 4.88% | 05/25/2029 | | | 492,915 | |
| | | | | | | | | 1,473,913 | |
| Colombia - 0.04% | | | | | | |
| | 250,000 | | Banco GNB Sudameris SA(d) | 7.50% | 07/30/2022 | | | 269,063 | |
| | 200,000 | | Empresa de Energia de Bogota SA ESP(d) | 6.13% | 11/10/2021 | | | 207,000 | |
| | 200,000 | | Empresas Publicas de Medellin ESP(d) | 7.63% | 07/29/2019 | | | 227,250 | |
| | 600,000 | | Pacific Exploration and Production Corp.(c)(g) | 5.13% | 03/28/2023 | | | 114,000 | |
| | 100,000 | | Pacific Exploration and Production Corp.(c)(g) | 5.63% | 01/19/2025 | | | 19,000 | |
| | 400,000 | | Pacific Exploration and Production Corp.(d)(g) | 5.13% | 03/28/2023 | | | 76,000 | |
| | | | | | | | | 912,313 | |
| Costa Rica - 0.09% | | | | | | |
| | 600,000 | | Banco de Costa Rica(d) | 5.25% | 08/12/2018 | | | 618,000 | |
| | 600,000 | | Banco Nacional de Costa Rica(d) | 4.88% | 11/01/2018 | | | 618,300 | |
| | 400,000 | | Instituto Costarricense de Electricidad(c) | 6.95% | 11/10/2021 | | | 426,000 | |
| | 200,000 | | Instituto Costarricense de Electricidad(d) | 6.95% | 11/10/2021 | | | 213,000 | |
| | | | | | | | | 1,875,300 | |
| Curacao - 0.03% | | | | | | |
| | 687,000 | | Teva Pharmaceutical Finance Co. BV | 2.95% | 12/18/2022 | | | 705,436 | |
See Notes to Financial Statements.
| 38 | (888) 848-7569 | www.rivernorth.com |
| RiverNorth/DoubleLine Strategic Income Fund | Schedule of Investments |
September 30, 2016
| Principal Amount/Description | Rate | Maturity | | Value | |
| Dominican Republic - 0.05% | |
| $ | 400,000 | | Aeropuertos Dominicanos Siglo XXI SA(d) | 9.75% | 11/13/2019 | | $ | 421,200 | |
| | 300,000 | | Banco de Reservas de la Republica Dominicana(c) | 7.00% | 02/01/2023 | | | 310,500 | |
| | 200,000 | | Banco de Reservas de la Republica Dominicana(d) | 7.00% | 02/01/2023 | | | 207,000 | |
| | | | | | | 938,700 | |
| France - 0.03% | |
| | 631,000 | | Orange SA | 2.75% | 02/06/2019 | | | 649,873 | |
| Great Britain - 0.10% | |
| | 320,000 | | AstraZeneca PLC | 2.38% | 11/16/2020 | | | 329,302 | |
| | 290,000 | | BP Capital Markets PLC | 3.06% | 03/17/2022 | | | 304,004 | |
| | 105,000 | | BP Capital Markets PLC | 3.12% | 05/04/2026 | | | 107,975 | |
| | 1,188,000 | | British Telecommunications PLC | 5.95% | 01/15/2018 | | | 1,257,164 | |
| | 107,000 | | Delphi Automotive PLC | 4.25% | 01/15/2026 | | | 116,852 | |
| | | | | | | 2,115,297 | |
| Guatemala - 0.01% | |
| | 200,000 | | Comcel Trust via Comunicaciones Celulares SA(d) | 6.88% | 02/06/2024 | | | 206,640 | |
| India - 0.06% | |
| | 600,000 | | Adani Ports & Special Economic Zone Ltd.(d) | 3.50% | 07/29/2020 | | | 608,457 | |
| | 200,000 | | Export-Import Bank of India | 3.13% | 07/20/2021 | | | 206,659 | |
| | 400,000 | | ONGC Videsh Ltd. | 3.25% | 07/15/2019 | | | 411,400 | |
| | | | | | | 1,226,516 | |
| Ireland - 0.03% | |
| | 680,000 | | Shire Acquisitions Investments Ireland DAC | 2.88% | 09/23/2023 | | | 684,179 | |
| Israel - 0.06% | |
| | 600,000 | | Delek & Avner Tamar Bond Ltd.(c) | 4.44% | 12/30/2020 | | | 633,750 | |
| | 500,000 | | Israel Electric Corp. Ltd.(d) | 5.63% | 06/21/2018 | | | 529,500 | |
| | | | | | | 1,163,250 | |
| Japan - 0.05% | |
| | 665,000 | | Sumitomo Mitsui Financial Group, Inc. | 2.93% | 03/09/2021 | | | 683,937 | |
| | 310,000 | | Sumitomo Mitsui Financial Group, Inc. | 2.06% | 07/14/2021 | | | 307,704 | |
| | | | | | | 991,641 | |
| Luxembourg - 0.06% | |
| | 655,000 | | Actavis Funding SCS | 2.35% | 03/12/2018 | | | 661,941 | |
| | 65,000 | | Intelsat Jackson Holdings SA | 5.50% | 08/01/2023 | | | 45,337 | |
| | 35,000 | | Intelsat Jackson Holdings SA(c) | 8.00% | 02/15/2024 | | | 35,263 | |
See Notes to Financial Statements.
| Annual Report | September 30, 2016 | 39 |
| RiverNorth/DoubleLine Strategic Income Fund | Schedule of Investments |
September 30, 2016
| Principal Amount/Description | Rate | Maturity | | Value | |
| $ | 400,000 | | Minerva Luxembourg SA(c)(e)(f) | 8.75% | Perpetual Maturity | | $ | 406,000 | |
| | | | | | | 1,148,541 | |
| Malaysia - 0.02% | |
| | 500,000 | | Petronas Global Sukuk Ltd.(d) | 2.71% | 03/18/2020 | | | 511,918 | |
| Mexico - 0.19% | |
| | 500,000 | | Banco Santander Mexico SA Institucion de Banca Multiple Grupo Financiero Santander(d)(f) | 5.95% | 01/30/2024 | | | 526,725 | |
| | 700,000 | | BBVA Bancomer SA(d)(f) | 5.35% | 11/12/2029 | | | 708,750 | |
| | 241,727 | | Fermaca Enterprises S de RL de CV(d) | 6.38% | 03/30/2038 | | | 248,979 | |
| | 300,000 | | Grupo Elektra SAB de CV | 7.25% | 08/06/2018 | | | 300,750 | |
| | 200,000 | | Grupo Idesa SA de CV(c) | 7.88% | 12/18/2020 | | | 201,000 | |
| | 200,000 | | Grupo Idesa SA de CV(d) | 7.88% | 12/18/2020 | | | 201,000 | |
| | 200,000 | | Nemak SAB de CV(d) | 5.50% | 02/28/2023 | | | 204,800 | |
| | 300,000 | | Petroleos Mexicanos | 3.50% | 07/18/2018 | | | 307,650 | |
| | 680,000 | | Petroleos Mexicanos(c) | 6.75% | 09/21/2047 | | | 678,980 | |
| | 200,000 | | Petroleos Mexicanos(d) | 5.50% | 02/04/2019 | | | 211,400 | |
| | 300,000 | | TV Azteca SAB de CV(d) | 7.50% | 05/25/2018 | | | 252,375 | |
| | | | | | | 3,842,409 | |
| Netherlands - 0.10% | |
| | 400,000 | | AES Andres BV / Dominican Power Partners / Empresa Generadora de Electricidad It(c) | 7.95% | 05/11/2026 | | | 427,500 | |
| | 250,000 | | Ajecorp BV(d) | 6.50% | 05/14/2022 | | | 136,250 | |
| | 300,000 | | CIMPOR Financial Operations BV(c) | 5.75% | 07/17/2024 | | | 258,750 | |
| | 200,000 | | Marfrig Holdings Europe BV(c) | 8.00% | 06/08/2023 | | | 205,400 | |
| | 80,000 | | NXP BV / NXP Funding LLC(c) | 4.13% | 06/01/2021 | | | 85,900 | |
| | 40,000 | | NXP BV / NXP Funding LLC(c) | 3.88% | 09/01/2022 | | | 42,000 | |
| | 355,000 | | Shell International Finance BV | 1.38% | 05/10/2019 | | | 354,132 | |
| | 235,000 | | Teva Pharmaceutical Finance Netherlands III BV | 2.80% | 07/21/2023 | | | 236,043 | |
| | 300,000 | | VTR Finance BV(d) | 6.88% | 01/15/2024 | | | 311,250 | |
| | | | | | | 2,057,225 | |
| Panama - 0.15% | |
| | 450,000 | | Aeropuerto Internacional de Tocumen SA | 5.75% | 10/09/2023 | | | 488,250 | |
| | 700,000 | | AES El Salvador Trust II(d) | 6.75% | 03/28/2023 | | | 665,000 | |
| | 400,000 | | Avianca Holdings SA / Avianca Leasing LLC / Grupo Taca Holdings Ltd.(d) | 8.38% | 05/10/2020 | | | 383,000 | |
| | 300,000 | | Banco Latinoamericano de Comercio Exterior SA(d) | 3.25% | 05/07/2020 | | | 307,500 | |
| | 671,566 | | ENA Norte Trust(d) | 4.95% | 04/25/2023 | | | 701,786 | |
See Notes to Financial Statements.
| 40 | (888) 848-7569 | www.rivernorth.com |
| RiverNorth/DoubleLine Strategic Income Fund | Schedule of Investments |
September 30, 2016
| Principal Amount/Description | Rate | Maturity | | Value | |
| $ | 600,000 | | Global Bank Corp.(d) | 5.13% | 10/30/2019 | | $ | 631,500 | |
| | | | | | | 3,177,036 | |
| Paraguay - 0.06% | |
| | 200,000 | | Banco Continental SAECA(d) | 8.88% | 10/15/2017 | | | 201,000 | |
| | 150,000 | | Banco Regional SAECA(c) | 8.13% | 01/24/2019 | | | 162,000 | |
| | 350,000 | | Banco Regional SAECA(d) | 8.13% | 01/24/2019 | | | 378,000 | |
| | 400,000 | | Telefonica Celular del Paraguay SA(d) | 6.75% | 12/13/2022 | | | 416,000 | |
| | | | | | | 1,157,000 | |
| Peru - 0.07% | |
| | 200,000 | | Abengoa Transmision Sur SA(d) | 6.88% | 04/30/2043 | | | 215,000 | |
| | 180,000 | | Camposol SA(c) | 10.50% | 07/15/2021 | | | 165,600 | |
| | 200,000 | | Inkia Energy Ltd.(c) | 8.38% | 04/04/2021 | | | 208,300 | |
| | 500,000 | | Pesquera Exalmar SAA(c) | 7.38% | 01/31/2020 | | | 398,750 | |
| | 500,000 | | Pesquera Exalmar SAA(d) | 7.38% | 01/31/2020 | | | 398,750 | |
| | | | | | | 1,386,400 | |
| Singapore - 0.04% | |
| | 400,000 | | Oversea-Chinese Banking Corp. Ltd.(d)(f) | 4.00% | 10/15/2024 | | | 418,200 | |
| | 400,000 | | United Overseas Bank Ltd.(f) | 3.50% | 09/16/2026 | | | 412,855 | |
| | | | | | | 831,055 | |
| Trinidad/Tobago - 0.02% | |
| | 300,000 | | National Gas Co. of Trinidad & Tobago Ltd.(d) | 6.05% | 01/15/2036 | | | 322,500 | |
| | | | | | | | | | |
| TOTAL FOREIGN CORPORATE BONDS (Cost $38,086,187) | | | | | 35,694,889 | |
| | | | | | | | |
| U.S. CORPORATE BONDS - 3.14% | |
| Advertising - 0.03% | |
| | 635,000 | | Omnicom Group, Inc. | 3.60% | 04/15/2026 | | | 672,861 | |
| Aerospace/Defense - 0.08% | |
| | 665,000 | | Lockheed Martin Corp. | 4.70% | 05/15/2046 | | | 795,534 | |
| | 451,000 | | The Boeing Co. | 6.88% | 03/15/2039 | | | 683,609 | |
| | 110,000 | | TransDigm, Inc. | 6.00% | 07/15/2022 | | | 116,600 | |
| | | | | | | | | 1,595,743 | |
| Agriculture - 0.03% | |
| | 635,000 | | Reynolds American, Inc. | 4.00% | 06/12/2022 | | | 690,776 | |
Apparel - 0.00%(i) | |
| | 70,000 | | Levi Strauss & Co. | 5.00% | 05/01/2025 | | | 73,325 | |
| Auto Manufacturers - 0.08% | |
| | 490,000 | | Ford Motor Co. | 7.45% | 07/16/2031 | | | 650,199 | |
| | 510,000 | | General Motors Financial Co., Inc. | 2.40% | 05/09/2019 | | | 512,143 | |
| | 345,000 | | General Motors Financial Co., Inc. | 3.20% | 07/13/2020 | | | 353,589 | |
See Notes to Financial Statements.
| Annual Report | September 30, 2016 | 41 |
| RiverNorth/DoubleLine Strategic Income Fund | Schedule of Investments |
September 30, 2016
| Principal Amount/Description | Rate | Maturity | | Value | |
| $ | 145,000 | | General Motors Financial Co., Inc. | 3.20% | 07/06/2021 | | $ | 146,950 | |
| | | | | | | | | 1,662,881 | |
| Auto Parts & Equipment - 0.04% | |
| | 35,000 | | Allison Transmission, Inc.(c) | 5.00% | 10/01/2024 | | | 35,889 | |
| | 95,000 | | American Axle & Manufacturing, Inc. | 6.63% | 10/15/2022 | | | 100,819 | |
| | 55,000 | | Dana Holding Corp. | 5.50% | 12/15/2024 | | | 56,237 | |
| | 545,000 | | Delphi Corp. | 4.15% | 03/15/2024 | | | 586,240 | |
| | 100,000 | | The Goodyear Tire & Rubber Co. | 5.13% | 11/15/2023 | | | 104,500 | |
| | | | | | | | | 883,685 | |
| Banks - 0.47% | |
| | 495,000 | | Bank of America Corp. | 2.00% | 01/11/2018 | | | 497,421 | |
| | 500,000 | | Bank of America Corp. | 2.63% | 04/19/2021 | | | 508,533 | |
| | 655,000 | | Bank of Montreal | 1.90% | 08/27/2021 | | | 652,083 | |
| | 555,000 | | BB&T Corp. | 2.45% | 01/15/2020 | | | 568,241 | |
| | 390,000 | | BB&T Corp. | 2.05% | 05/10/2021 | | | 394,355 | |
| | 320,000 | | Citigroup, Inc. | 2.65% | 10/26/2020 | | | 327,211 | |
| | 625,000 | | Citigroup, Inc. | 2.70% | 03/30/2021 | | | 639,632 | |
| | 200,000 | | DBS Bank Ltd.(d)(f) | 3.63% | 09/21/2022 | | | 203,412 | |
| | 680,000 | | JPMorgan Chase & Co. | 2.40% | 06/07/2021 | | | 688,172 | |
| | 665,000 | | JPMorgan Chase & Co. | 4.25% | 10/01/2027 | | | 717,435 | |
| | 300,000 | | Morgan Stanley | 2.65% | 01/27/2020 | | | 306,817 | |
| | 215,000 | | Morgan Stanley | 2.50% | 04/21/2021 | | | 217,331 | |
| | 300,000 | | Morgan Stanley | 3.88% | 01/27/2026 | | | 319,736 | |
| | 220,000 | | Morgan Stanley | 3.13% | 07/27/2026 | | | 222,662 | |
| | 655,000 | | PNC Funding Corp. | 3.30% | 03/08/2022 | | | 696,046 | |
| | 480,000 | | State Street Corp. | 3.55% | 08/18/2025 | | | 521,332 | |
| | 230,000 | | State Street Corp. | 2.65% | 05/19/2026 | | | 233,065 | |
| | 730,000 | | The Goldman Sachs Group, Inc. | 2.35% | 11/15/2021 | | | 729,438 | |
| | 655,000 | | Wells Fargo & Co. | 3.55% | 09/29/2025 | | | 692,518 | |
| | 465,000 | | Wells Fargo & Co. | 3.00% | 04/22/2026 | | | 470,256 | |
| | | | | | | | | 9,605,696 | |
| Beverages - 0.04% | |
| | 190,000 | | Anheuser-Busch InBev Finance, Inc. | 4.90% | 02/01/2046 | | | 228,823 | |
| | 195,000 | | The Coca-Cola Co. | 1.88% | 10/27/2020 | | | 198,405 | |
| | 455,000 | | The Coca-Cola Co. | 1.55% | 09/01/2021 | | | 453,553 | |
| | | | | | | | | 880,781 | |
| Biotechnology - 0.02% | |
| | 305,000 | | Celgene Corp. | 3.88% | 08/15/2025 | | | 327,214 | |
Building Materials - 0.00%(i) | |
| | 42,000 | | Builders FirstSource, Inc.(c) | 5.63% | 09/01/2024 | | | 43,260 | |
| Chemicals - 0.01% | |
| | 100,000 | | Ashland, Inc. | 4.75% | 08/15/2022 | | | 104,375 | |
See Notes to Financial Statements.
| 42 | (888) 848-7569 | www.rivernorth.com |
| RiverNorth/DoubleLine Strategic Income Fund | Schedule of Investments |
September 30, 2016
| Principal Amount/Description | Rate | Maturity | | Value | |
| $ | 50,000 | | PQ Corp.(c) | 6.75% | 11/15/2022 | | $ | 53,125 | |
| | | | | | | | | 157,500 | |
| Commercial Services - 0.01% | |
| | 100,000 | | Prime Security Services Borrower LLC / Prime Finance, Inc.(c) | 9.25% | 05/15/2023 | | | 109,250 | |
| | 45,000 | | Team Health, Inc.(c) | 7.25% | 12/15/2023 | | | 48,544 | |
| | | | | | | | | 157,794 | |
| Computers - 0.06% | |
| | 508,000 | | Apple, Inc. | 4.65% | 02/23/2046 | | | 589,193 | |
| | 80,000 | | Diamond 1 Finance Corp. / Diamond 2 Finance Corp.(c) | 7.13% | 06/15/2024 | | | 88,039 | |
| | 400,000 | | Hewlett Packard Enterprise Co.(c) | 3.60% | 10/15/2020 | | | 420,100 | |
| | 25,000 | | Western Digital Corp.(c) | 7.38% | 04/01/2023 | | | 27,500 | |
| | | | | | | | | 1,124,832 | |
Cosmetics/Personal Care - 0.00%(i) | |
| | 55,000 | | Revlon Consumer Products Corp. | 5.75% | 02/15/2021 | | | 56,375 | |
| | 15,000 | | Revlon Consumer Products Corp.(c) | 6.25% | 08/01/2024 | | | 15,525 | |
| | | | | | | | | 71,900 | |
| Distribution/Wholesale - 0.01% | |
| | 100,000 | | HD Supply, Inc. | 7.50% | 07/15/2020 | | | 103,875 | |
| Diversified Financial Services - 0.23% | |
| | 635,000 | | Air Lease Corp. | 3.75% | 02/01/2022 | | | 666,360 | |
| | 645,000 | | Ally Financial, Inc. | 4.13% | 03/30/2020 | | | 657,900 | |
| | 40,000 | | Ally Financial, Inc. | 4.25% | 04/15/2021 | | | 40,850 | |
| | 265,000 | | American Express Credit Corp. | 2.25% | 08/15/2019 | | | 270,502 | |
| | 1,030,000 | | American Express Credit Corp. | 2.25% | 05/05/2021 | | | 1,046,543 | |
| | 300,000 | | Credito Real SAB de CV SOFOM ER(c) | 7.25% | 07/20/2023 | | | 301,500 | |
| | 35,000 | | Double Eagle Acquisition Sub, Inc.(c) | 7.50% | 10/01/2024 | | | 35,744 | |
| | 369,000 | | National Rural Utilities Cooperative Finance Corp. | 10.38% | 11/01/2018 | | | 436,560 | |
| | 520,000 | | National Rural Utilities Cooperative Finance Corp. | 2.00% | 01/27/2020 | | | 525,658 | |
| | 659,000 | | Synchrony Financial | 3.00% | 08/15/2019 | | | 675,084 | |
| | | | | | | | | 4,656,701 | |
| Electric - 0.17% | |
| | 787,000 | | Berkshire Hathaway Energy Co. | 6.50% | 09/15/2037 | | | 1,087,888 | |
| | 25,000 | | Calpine Corp. | 5.75% | 01/15/2025 | | | 24,750 | |
| | 230,000 | | Duke Energy Corp. | 3.75% | 09/01/2046 | | | 224,650 | |
| | 450,000 | | Duke Energy Progress, Inc. | 4.15% | 12/01/2044 | | | 495,031 | |
| | 315,000 | | Exelon Corp. | 3.40% | 04/15/2026 | | | 327,710 | |
| | 200,000 | | Fortis, Inc.(c) | 2.10% | 10/04/2021 | | | 199,394 | |
| | 70,000 | | NRG Energy, Inc.(c) | 7.25% | 05/15/2026 | | | 71,575 | |
| | 965,000 | | The Southern Co. | 2.45% | 09/01/2018 | | | 984,097 | |
| | | | | | | | | 3,415,095 | |
See Notes to Financial Statements.
| Annual Report | September 30, 2016 | 43 |
| RiverNorth/DoubleLine Strategic Income Fund | Schedule of Investments |
September 30, 2016
| Principal Amount/Description | Rate | Maturity | | Value | |
| Engineering & Construction - 0.01% | |
| $ | 100,000 | | SBA Communications Corp. | 5.63% | 10/01/2019 | | $ | 102,813 | |
| Entertainment - 0.01% | |
| | 35,000 | | GLP Capital LP / GLP Financing II, Inc. | 5.38% | 04/15/2026 | | | 37,712 | |
| | 105,000 | | Scientific Games International, Inc.(c) | 7.00% | 01/01/2022 | | | 111,563 | |
| | 85,000 | | WMG Acquisition Corp.(c) | 6.75% | 04/15/2022 | | | 90,525 | |
| | | | | | | | | 239,800 | |
| Environmental Control - 0.03% | |
| | 530,000 | | Waste Management, Inc. | 4.10% | 03/01/2045 | | | 584,806 | |
| Food - 0.13% | |
| | 70,000 | | Albertsons Cos. LLC / Safeway, Inc. / New Albertson's, Inc. / Albertson's LLC(c) | 5.75% | 03/15/2025 | | | 70,000 | |
| | 55,000 | | JBS USA LLC / JBS USA Finance, Inc.(c) | 5.75% | 06/15/2025 | | | 54,312 | |
| | 160,000 | | Kraft Heinz Foods Co. | 2.00% | 07/02/2018 | | | 161,650 | |
| | 105,000 | | Pilgrim's Pride Corp.(c) | 5.75% | 03/15/2025 | | | 108,675 | |
| | 40,000 | | Post Holdings, Inc.(c) | 5.00% | 08/15/2026 | | | 39,900 | |
| | 770,000 | | The Kroger Co. | 3.40% | 04/15/2022 | | | 817,829 | |
| | 35,000 | | TreeHouse Foods, Inc.(c) | 6.00% | 02/15/2024 | | | 37,844 | |
| | 1,205,000 | | Tyson Foods, Inc. | 3.95% | 08/15/2024 | | | 1,303,393 | |
| | | | | | | | | 2,593,603 | |
| Forest Products & Paper - 0.08% | |
| | 1,315,000 | | Georgia-Pacific LLC(c) | 3.60% | 03/01/2025 | | | 1,403,999 | |
| | 290,000 | | International Paper Co. | 3.00% | 02/15/2027 | | | 290,458 | |
| | | | | | | | | 1,694,457 | |
| Hand/Machine Tools - 0.01% | |
| | 115,000 | | Milacron LLC / Mcron Finance Corp.(c) | 7.75% | 02/15/2021 | | | 120,175 | |
| Healthcare-Products - 0.08% | |
| | 1,000,000 | | Thermo Fisher Scientific, Inc. | 3.30% | 02/15/2022 | | | 1,049,306 | |
| | 660,000 | | Zimmer Biomet Holdings, Inc. | 1.45% | 04/01/2017 | | | 660,787 | |
| | | | | | | | | 1,710,093 | |
| Healthcare-Services - 0.12% | |
| | 658,000 | | Anthem, Inc. | 2.30% | 07/15/2018 | | | 666,880 | |
| | 95,000 | | Centene Corp. | 5.63% | 02/15/2021 | | | 101,175 | |
| | 50,000 | | HCA, Inc. | 5.88% | 02/15/2026 | | | 53,375 | |
| | 660,000 | | Laboratory Corp. of America Holdings | 2.50% | 11/01/2018 | | | 671,388 | |
| | 495,000 | | Laboratory Corp. of America Holdings | 4.70% | 02/01/2045 | | | 541,895 | |
| | 105,000 | | MPH Acquisition Holdings LLC(c) | 7.13% | 06/01/2024 | | | 113,137 | |
| | 35,000 | | RegionalCare Hospital Partners Holdings, Inc.(c) | 8.25% | 05/01/2023 | | | 36,225 | |
| | 110,000 | | Select Medical Corp. | 6.38% | 06/01/2021 | | | 108,762 | |
| | 110,000 | | Tenet Healthcare Corp. | 6.75% | 06/15/2023 | | | 102,575 | |
| | | | | | | | | 2,395,412 | |
See Notes to Financial Statements.
| 44 | (888) 848-7569 | www.rivernorth.com |
RiverNorth/DoubleLine Strategic Income Fund | Schedule of Investments |
September 30, 2016
| Principal Amount/Description | Rate | Maturity | | Value | |
| Holding Companies-Diversified - 0.04% | |
| $ | 85,000 | | Argos Merger Sub, Inc.(c) | 7.13% | 03/15/2023 | | $ | 89,462 | |
| | 675,000 | | MUFG Americas Holdings Corp. | 1.63% | 02/09/2018 | | | 676,131 | |
| | | | | | | | | 765,593 | |
| Household Products/Wares - 0.01% | |
| | 35,000 | | Kronos Acquisition Holdings, Inc.(c) | 9.00% | 08/15/2023 | | | 36,247 | |
| | 100,000 | | Spectrum Brands, Inc. | 5.75% | 07/15/2025 | | | 108,500 | |
| | | | | | | | | 144,747 | |
| Housewares - 0.01% | |
| | 155,000 | | Newell Brands, Inc. | 3.15% | 04/01/2021 | | | 161,666 | |
| | | | | | | | | | |
| Insurance - 0.09% | |
| | 855,000 | | Liberty Mutual Group, Inc.(c) | 6.50% | 05/01/2042 | | | 1,068,744 | |
| | 660,000 | | TIAA Asset Management Finance Co. LLC(c) | 2.95% | 11/01/2019 | | | 680,503 | |
| | | | | | | | | 1,749,247 | |
| Internet - 0.01% | |
| | 225,000 | | Amazon.com, Inc. | 3.80% | 12/05/2024 | | | 249,959 | |
| | | | | | | | | | |
| Iron/Steel - 0.00%(i) | |
| | 75,000 | | Signode Industrial Group Lux SA / Signode Industrial Group US, Inc.(c) | 6.38% | 05/01/2022 | | | 76,313 | |
| | | | | | | | | | |
| Leisure Time - 0.01% | |
| | 105,000 | | NCL Corp. Ltd.(c) | 5.25% | 11/15/2019 | | | 106,575 | |
| | 70,000 | | Sabre GLBL, Inc.(c) | 5.25% | 11/15/2023 | | | 71,575 | |
| | 75,000 | | Viking Cruises Ltd.(c) | 8.50% | 10/15/2022 | | | 77,250 | |
| | | | | | | | | 255,400 | |
| Lodging - 0.01% | |
| | 35,000 | | Hilton Domestic Operating Co. Inc(c) | 4.25% | 09/01/2024 | | | 35,875 | |
| | 100,000 | | MGM Resorts International | 4.63% | 09/01/2026 | | | 98,000 | |
| | 65,000 | | Station Casinos LLC | 7.50% | 03/01/2021 | | | 68,815 | |
| | | | | | | | | 202,690 | |
Machinery-Construction & Mining - 0.00%(i) | |
| | 95,000 | | Terex Corp. | 6.00% | 05/15/2021 | | | 97,494 | |
| | | | | | | | | | |
| Media - 0.09% | |
| | 335,000 | | 21st Century Fox America, Inc. | 4.75% | 09/15/2044 | | | 369,225 | |
| | 60,000 | | CCO Holdings LLC / CCO Holdings Capital Corp. | 5.25% | 09/30/2022 | | | 62,850 | |
| | 25,000 | | CCO Holdings LLC / CCO Holdings Capital Corp.(c) | 5.13% | 05/01/2023 | | | 26,156 | |
| | 105,000 | | Cequel Communications Holdings I LLC / Cequel Capital Corp.(c) | 6.38% | 09/15/2020 | | | 108,544 | |
| | 190,000 | | Comcast Corp. | 4.20% | 08/15/2034 | | | 210,889 | |
| | 395,000 | | Comcast Corp. | 4.40% | 08/15/2035 | | | 449,160 | |
| | 40,000 | | CSC Holdings LLC | 5.25% | 06/01/2024 | | | 38,100 | |
| | 35,000 | | CSC Holdings LLC(c) | 5.50% | 04/15/2027 | | | 35,875 | |
See Notes to Financial Statements.
Annual Report | September 30, 2016 | 45 |
RiverNorth/DoubleLine Strategic Income Fund | Schedule of Investments |
September 30, 2016
| Principal Amount/Description | Rate | Maturity | | Value | |
| $ | 65,000 | | Gray Television, Inc. | 7.50% | 10/01/2020 | | $ | 67,507 | |
| | 40,000 | | Gray Television, Inc.(c) | 5.13% | 10/15/2024 | | | 39,350 | |
| | 50,000 | | Gray Television, Inc.(c) | 5.88% | 07/15/2026 | | | 50,500 | |
| | 55,000 | | Nexstar Escrow Corp.(c) | 5.63% | 08/01/2024 | | | 55,550 | |
| | 100,000 | | Sinclair Television Group, Inc.(c) | 5.63% | 08/01/2024 | | | 102,500 | |
| | 105,000 | | Sirius XM Radio, Inc.(c) | 5.38% | 07/15/2026 | | | 108,150 | |
| | 110,000 | | TEGNA, Inc.(c) | 4.88% | 09/15/2021 | | | 114,675 | |
| | | | | | | | | 1,839,031 | |
Metal Fabricate/Hardware - 0.00%(i) | |
| | 50,000 | | Novelis Corp.(c) | 6.25% | 08/15/2024 | | | 53,250 | |
| | 25,000 | | Novelis Corp.(c) | 5.88% | 09/30/2026 | | | 25,656 | |
| | | | | | | | | 78,906 | |
Miscellaneous Manufacturing - 0.00%(i) | |
| | 80,000 | | Gates Global LLC / Gates Global Co.(c) | 6.00% | 07/15/2022 | | | 76,400 | |
| | | | | | | | | | |
| Office/Business Equipment - 0.03% | |
| | 650,000 | | Xerox Corp. | 2.95% | 03/15/2017 | | | 653,915 | |
| | | | | | | | | | |
| Oil & Gas - 0.22% | |
| | 355,000 | | Apache Corp. | 4.75% | 04/15/2043 | | | 366,411 | |
| | 230,000 | | BP Capital Markets PLC | 3.02% | 01/16/2027 | | | 233,736 | |
| | 49,000 | | Chevron Corp. | 1.37% | 03/02/2018 | | | 49,095 | |
| | 252,000 | | Chevron Corp. | 1.79% | 11/16/2018 | | | 254,677 | |
| | 290,000 | | Chevron Corp. | 1.56% | 05/16/2019 | | | 291,671 | |
| | 145,000 | | Energy XXI Gulf Coast, Inc.(g) | 9.25% | 12/15/2017 | | | 14,500 | |
| | 1,630,000 | | Energy XXI Gulf Coast, Inc.(c)(g) | 11.00% | 03/15/2020 | | | 660,150 | |
| | 60,000 | | Energy XXI Gulf Coast, Inc.(g) | 7.50% | 12/15/2021 | | | 6,000 | |
| | 335,000 | | EOG Resources, Inc. | 4.15% | 01/15/2026 | | | 366,802 | |
| | 80,000 | | EPL Oil & Gas, Inc.(g) | 8.25% | 02/15/2018 | | | 11,400 | |
| | 35,000 | | Extraction Oil & Gas Holdings LLC / Extraction Finance Corp.(c) | 7.88% | 07/15/2021 | | | 36,488 | |
| | 130,000 | | Memorial Production Partners LP / Memorial Production Finance Corp. | 6.88% | 08/01/2022 | | | 63,375 | |
| | 155,000 | | Occidental Petroleum Corp. | 3.40% | 04/15/2026 | | | 164,276 | |
| | 25,000 | | PDC Energy, Inc.(c) | 6.13% | 09/15/2024 | | | 26,063 | |
| | 263,000 | | Phillips 66 | 5.88% | 05/01/2042 | | | 331,967 | |
| | 35,000 | | Phillips 66 | 4.88% | 11/15/2044 | | | 39,130 | |
| | 250,000 | | Reliance Holding USA, Inc.(d) | 5.40% | 02/14/2022 | | | 282,007 | |
| | 40,000 | | Sanchez Energy Corp. | 6.13% | 01/15/2023 | | | 32,300 | |
| | 2,420,000 | | SandRidge Energy, Inc.(c)(g) | 8.75% | 06/01/2020 | | | 877,250 | |
| | 330,000 | | Schlumberger Holdings Corp.(c) | 2.35% | 12/21/2018 | | | 336,255 | |
| | | | | | | | | 4,443,553 | |
| Packaging & Containers - 0.01% | |
| | 70,000 | | Berry Plastics Corp. | 5.50% | 05/15/2022 | | | 72,800 | |
| | 70,000 | | Plastipak Holdings, Inc.(c) | 6.50% | 10/01/2021 | | | 72,975 | |
See Notes to Financial Statements.
| 46 | (888) 848-7569 | www.rivernorth.com |
RiverNorth/DoubleLine Strategic Income Fund | Schedule of Investments |
September 30, 2016
| Principal Amount/Description | Rate | Maturity | | Value | |
| $ | 135,000 | | Reynolds Group Issuer, Inc. / Reynolds Group Issuer LLC | 8.25% | 02/15/2021 | | $ | 140,864 | |
| | | | | | | | | 286,639 | |
| Pharmaceuticals - 0.15% | |
| | 600,000 | | AbbVie, Inc. | 4.70% | 05/14/2045 | | | 650,263 | |
| | 665,000 | | Cardinal Health, Inc. | 1.95% | 06/15/2018 | | | 671,542 | |
| | 495,000 | | Eli Lilly & Co. | 3.70% | 03/01/2045 | | | 535,066 | |
| | 335,000 | | Express Scripts Holding Co. | 4.50% | 02/25/2026 | | | 368,350 | |
| | 135,000 | | Express Scripts Holding Co. | 3.40% | 03/01/2027 | | | 136,147 | |
| | 615,000 | | Mylan NV(c) | 3.15% | 06/15/2021 | | | 627,260 | |
| | 70,000 | | Quintiles Transnational Corp.(c) | 4.88% | 05/15/2023 | | | 72,275 | |
| | 65,000 | | Vizient, Inc.(c) | 10.38% | 03/01/2024 | | | 74,750 | |
| | | | | | | | | 3,135,653 | |
| Pipelines - 0.11% | |
| | 90,000 | | Energy Transfer Equity LP | 5.50% | 06/01/2027 | | | 90,000 | |
| | 710,000 | | Energy Transfer Partners LP | 4.75% | 01/15/2026 | | | 735,300 | |
| | 522,000 | | Enterprise Products Operating LLC | 3.70% | 02/15/2026 | | | 538,712 | |
| | 595,000 | | Kinder Morgan Energy Partners LP | 6.95% | 01/15/2038 | | | 678,676 | |
| | 75,000 | | Targa Resources Partners LP / Targa Resources Partners Finance Corp.(c) | 5.38% | 02/01/2027 | | | 75,656 | |
| | 110,000 | | Williams Partners LP / ACMP Finance Corp. | 4.88% | 03/15/2024 | | | 111,351 | |
| | | | | | | | | 2,229,695 | |
| REITS - 0.08% | |
| | 625,000 | | Boston Properties LP | 4.13% | 05/15/2021 | | | 680,447 | |
| | 60,000 | | Equinix, Inc. | 5.88% | 01/15/2026 | | | 64,650 | |
| | 110,000 | | ESH Hospitality, Inc.(c) | 5.25% | 05/01/2025 | | | 110,413 | |
| | 20,000 | | MGM Growth Properties Operating Partnership LP / MGP Finance Co.-Issuer, Inc.(c) | 5.63% | 05/01/2024 | | | 21,744 | |
| | 655,000 | | Simon Property Group LP | 3.30% | 01/15/2026 | | | 693,443 | |
| | | | | | | | | 1,570,697 | |
| Retail - 0.09% | |
| | 50,000 | | Asbury Automotive Group, Inc. | 6.00% | 12/15/2024 | | | 51,750 | |
| | 230,000 | | CVS Health Corp. | 2.88% | 06/01/2026 | | | 234,036 | |
| | 25,000 | | Dollar Tree, Inc. | 5.75% | 03/01/2023 | | | 27,031 | |
| | 70,000 | | Rite Aid Corp.(c) | 6.13% | 04/01/2023 | | | 75,688 | |
| | 100,000 | | Sally Holdings LLC / Sally Capital, Inc. | 5.75% | 06/01/2022 | | | 104,750 | |
| | 310,000 | | The Home Depot, Inc. | 3.35% | 09/15/2025 | | | 336,570 | |
| | 330,000 | | The Home Depot, Inc. | 3.00% | 04/01/2026 | | | 349,757 | |
| | 605,000 | | Wal-Mart Stores, Inc. | 4.30% | 04/22/2044 | | | 714,348 | |
| | | | | | | | | 1,893,930 | |
| Semiconductors - 0.03% | |
| | 235,000 | | Intel Corp. | 4.10% | 05/19/2046 | | | 252,743 | |
See Notes to Financial Statements.
Annual Report | September 30, 2016 | 47 |
RiverNorth/DoubleLine Strategic Income Fund | Schedule of Investments |
September 30, 2016
| Principal Amount/Description | Rate | Maturity | | Value | |
| $ | 40,000 | | Lam Research Corp. | 2.80% | 06/15/2021 | | $ | 41,104 | |
| | 118,000 | | Lam Research Corp. | 3.45% | 06/15/2023 | | | 120,912 | |
| | 15,000 | | Microsemi Corp.(c) | 9.13% | 04/15/2023 | | | 17,175 | |
| | 225,000 | | NVIDIA Corp. | 3.20% | 09/16/2026 | | | 227,685 | |
| | | | | | | | | 659,619 | |
| Software - 0.20% | |
| | 95,000 | | Activision Blizzard, Inc.(c) | 5.63% | 09/15/2021 | | | 99,124 | |
| | 35,000 | | Cengage Learning, Inc.(c) | 9.50% | 06/15/2024 | | | 35,700 | |
| | 490,000 | | Fidelity National Information Services, Inc. | 3.63% | 10/15/2020 | | | 520,239 | |
| | 50,000 | | First Data Corp.(c) | 7.00% | 12/01/2023 | | | 53,000 | |
| | 50,000 | | First Data Corp.(c) | 5.75% | 01/15/2024 | | | 51,562 | |
| | 70,000 | | Infor US, Inc. | 6.50% | 05/15/2022 | | | 71,225 | |
| | 330,000 | | McGraw-Hill Financials, Inc. | 4.40% | 02/15/2026 | | | 369,673 | |
| | 660,000 | | Microsoft Corp. | 4.45% | 11/03/2045 | | | 754,060 | |
| | 615,000 | | Oracle Corp. | 2.38% | 01/15/2019 | | | 630,764 | |
| | 110,000 | | Oracle Corp. | 2.25% | 10/08/2019 | | | 112,760 | |
| | 565,000 | | Oracle Corp. | 1.90% | 09/15/2021 | | | 566,870 | |
| | 695,000 | | Oracle Corp. | 4.13% | 05/15/2045 | | | 731,675 | |
| | 50,000 | | Solera LLC / Solera Finance, Inc.(c) | 10.50% | 03/01/2024 | | | 56,000 | |
| | 105,000 | | Sophia LP / Sophia Finance, Inc.(c) | 9.00% | 09/30/2023 | | | 110,775 | |
| | | | | | | | | 4,163,427 | |
| Telecommunications - 0.14% | |
| | 530,000 | | AT&T, Inc. | 3.40% | 05/15/2025 | | | 545,823 | |
| | 90,000 | | AT&T, Inc. | 4.13% | 02/17/2026 | | | 97,498 | |
| | 680,000 | | Cisco Systems, Inc. | 1.85% | 09/20/2021 | | | 684,926 | |
| | 110,000 | | CommScope, Inc.(c) | 5.00% | 06/15/2021 | | | 114,262 | |
| | 50,000 | | Embarq Corp. | 8.00% | 06/01/2036 | | | 50,724 | |
| | 100,000 | | Level 3 Communications, Inc. | 5.75% | 12/01/2022 | | | 104,750 | |
| | 1,220,000 | | Verizon Communications, Inc. | 4.40% | 11/01/2034 | | | 1,297,386 | |
| | | | | | | | | 2,895,369 | |
| Transportation - 0.06% | |
| | 110,000 | | Air Medical Merger Sub Corp.(c) | 6.38% | 05/15/2023 | | | 106,975 | |
| | 465,000 | | Burlington Northern Santa Fe LLC | 4.55% | 09/01/2044 | | | 541,080 | |
| | 550,000 | | FedEx Corp. | 4.75% | 11/15/2045 | | | 630,239 | |
| | 40,000 | | OPE KAG Finance Sub, Inc.(c) | 7.88% | 07/31/2023 | | | 38,100 | |
| | | | | | | | | 1,316,394 | |
| | | | | | | | | | |
| TOTAL U.S. CORPORATE BONDS (Cost $63,653,237) | | | | | 64,511,415 | |
See Notes to Financial Statements.
| 48 | (888) 848-7569 | www.rivernorth.com |
RiverNorth/DoubleLine Strategic Income Fund | Schedule of Investments |
September 30, 2016
| Principal Amount/Description | Rate | Maturity | | Value | |
| FOREIGN GOVERNMENT BONDS AND NOTES, SUPRANATIONALS AND FOREIGN AGENCIES - 0.19% | |
| $ | 400,000 | | Costa Rica Government International Bond(d) | 10.00% | 08/01/2020 | | $ | 487,000 | |
| | 163,947 | | Dominican Republic International Bond(d) | 9.04% | 01/23/2018 | | | 172,144 | |
| | 200,000 | | Hungary Government International Bond | 4.00% | 03/25/2019 | | | 210,076 | |
| | 940,000 | | Mexico Government International Bond | 4.00% | 10/02/2023 | | | 1,007,680 | |
| | 700,000 | | Panama Government International Bond | 5.20% | 01/30/2020 | | | 775,250 | |
| | 400,000 | | Poland Government International Bond | 5.13% | 04/21/2021 | | | 452,789 | |
| | 800,000 | | Qatar Government International Bond(d) | 2.38% | 06/02/2021 | | | 807,557 | |
| | | | | | | | | | |
| TOTAL FOREIGN GOVERNMENT BONDS AND NOTES, SUPRANATIONALS AND FOREIGN AGENCIES (Cost $3,854,896) | | | 3,912,496 | |
| | | | | | | | |
| COLLATERALIZED LOAN OBLIGATIONS - 0.79% | |
| | | | Adams Mill CLO Ltd. | | | | | | |
| | 500,000 | | Series 2014-1A(c)(f) | 4.18% | 07/15/2026 | | | 463,227 | |
| | 250,000 | | Series 2014-1A(c)(f) | 5.68% | 07/15/2026 | | | 204,243 | |
| | | | Apidos CLO XVIII | | | | | | |
| | 500,000 | | Series 2014-18A(c)(f) | 4.35% | 07/22/2026 | | | 491,157 | |
| | 250,000 | | Series 2014-18A(c)(f) | 5.90% | 07/22/2026 | | | 222,750 | |
| | | | Avery Point II CLO Ltd. | | | | | | |
| | 250,000 | | Series 2013-2A(c)(f) | 3.43% | 07/17/2025 | | | 248,125 | |
| | 500,000 | | Series 2013-2A(c)(f) | 4.13% | 07/17/2025 | | | 463,017 | |
| | | | Babson CLO Ltd. | | | | | | |
| | 500,000 | | Series 2015-2A(c)(f) | 4.50% | 07/20/2027 | | | 497,065 | |
| | 500,000 | | Series 2015-IA(c)(f) | 4.15% | 04/20/2027 | | | 482,181 | |
| | | | Betony CLO Ltd. | | | | | | |
| | 500,000 | | Series 2015-1A(c)(f) | 3.83% | 04/15/2027 | | | 500,000 | |
| | 500,000 | | Series 2015-1A(c)(f) | 4.28% | 04/15/2027 | | | 468,426 | |
| | | | Birchwood Park CLO Ltd. | | | | | | |
| | 250,000 | | Series 2014-1A(c)(f) | 7.08% | 07/15/2026 | | | 228,198 | |
| | 250,000 | | Series 2014-1A(c)(f) | 3.83% | 07/15/2026 | | | 250,225 | |
| | 250,000 | | Series 2014-1A(c)(f) | 4.88% | 07/15/2026 | | | 249,830 | |
| | | | BlueMountain CLO Ltd. | | | | | | |
| | 500,000 | | Series 2012-1A(c)(f) | 6.20% | 07/20/2023 | | | 499,834 | |
| | 500,000 | | Series 2015-3A(c)(f) | 3.80% | 10/20/2027 | | | 501,026 | |
| | 500,000 | | Series 2015-3A(c)(f) | 4.25% | 10/20/2027 | | | 490,892 | |
| | | | Brookside Mill CLO Ltd. | | | | | | |
| | 250,000 | | Series 2013-1A(c)(f) | 3.38% | 04/17/2025 | | | 246,006 | |
See Notes to Financial Statements.
Annual Report | September 30, 2016 | 49 |
RiverNorth/DoubleLine Strategic Income Fund | Schedule of Investments |
September 30, 2016
| Principal Amount/Description | Rate | Maturity | | Value | |
| $ | 500,000 | | Series 2013-1A(c)(f) | 3.73% | 04/17/2025 | | $ | 457,419 | |
| | 500,000 | | Series 2013-1A(c)(f) | 5.08% | 04/17/2025 | | | 372,445 | |
| | | | Carlyle Global Market Strategies CLO Ltd. | | | | | | |
| | 250,000 | | Series 2014-3A(c)(f) | 3.88% | 07/27/2026 | | | 250,643 | |
| | 500,000 | | Series 2014-3A(c)(f) | 4.93% | 07/27/2026 | | | 501,317 | |
| | | | Catamaran CLO Ltd. | | | | | | |
| | 500,000 | | Series 2015-1A(c)(f) | 3.80% | 04/22/2027 | | | 499,992 | |
| | | | Dorchester Park CLO Ltd. | | | | | | |
| | 250,000 | | Series 2015-1A(c)(f) | 3.90% | 01/20/2027 | | | 252,879 | |
| | 250,000 | | Series 2015-1A(c)(f) | 4.25% | 01/20/2027 | | | 244,642 | |
| | | | Emerson Park CLO Ltd. | | | | | | |
| | 250,000 | | Series 2013-1A(c)(f) | 3.43% | 07/15/2025 | | | 249,407 | |
| | | | Flatiron CLO Ltd. | | | | | | |
| | 250,000 | | Series 2014-1A(c)(f) | 3.98% | 07/17/2026 | | | 228,125 | |
| | | | Galaxy XV CLO Ltd. | | | | | | |
| | 500,000 | | Series 2013-15A(c)(f) | 4.08% | 04/15/2025 | | | 487,345 | |
| | | | Halcyon Loan Advisors Funding Ltd. | | | | | | |
| | 250,000 | | Series 2013-2A(c)(f) | 3.46% | 08/01/2025 | | | 245,945 | |
| | | | ING IM CLO Ltd. | | | | | | |
| | 250,000 | | Series 2013-3A(c)(f) | 3.38% | 01/18/2026 | | | 249,033 | |
| | | | LCM XII LP | | | | | | |
| | 250,000 | | Series 2015-12A(c)(f) | 4.33% | 10/19/2022 | | | 247,658 | |
| | | | LCM XIV LP | | | | | | |
| | 500,000 | | Series 2013-14A(c)(f) | 4.18% | 07/15/2025 | | | 490,296 | |
| | | | LCM XV LP | | | | | | |
| | 250,000 | | Series 2014-15A(c)(f) | 3.93% | 08/25/2024 | | | 250,315 | |
| | | | Limerock CLO I | | | | | | |
| | 500,000 | | Series 2007-1A(c)(f) | 1.34% | 04/24/2023 | | | 489,825 | |
| | | | Madison Park Funding XIII Ltd. | | | | | | |
| | 250,000 | | Series 2014-13A(c)(f) | 4.04% | 01/19/2025 | | | 244,722 | |
| | | | Madison Park Funding XIV Ltd. | | | | | | |
| | 250,000 | | Series 2014-14A(c)(f) | 4.30% | 07/20/2026 | | | 248,045 | |
| | 250,000 | | Series 2014-14A(c)(f) | 5.45% | 07/20/2026 | | | 222,883 | |
| | | | Magnetite CLO Ltd. | | | | | | |
| | 500,000 | | Series 2012-7A(c)(f) | 5.93% | 01/15/2025 | | | 500,003 | |
| | | | Nomad CLO Ltd. | | | | | | |
| | 250,000 | | Series 2013-1A(c)(f) | 3.63% | 01/15/2025 | | | 250,130 | |
| | 250,000 | | Series 2013-1A(c)(f) | 4.18% | 01/15/2025 | | | 245,679 | |
| | | | Octagon Investment Partners XVI Ltd. | | | | | | |
| | 500,000 | | Series 2013-1A(c)(f) | 4.03% | 07/17/2025 | | | 485,613 | |
| | 500,000 | | Series 2013-1A(c)(f) | 5.18% | 07/17/2025 | | | 427,414 | |
| | | | Symphony CLO XI Ltd. | | | | | | |
| | 500,000 | | Series 2013-11A(c)(f) | 3.83% | 01/17/2025 | | | 500,444 | |
See Notes to Financial Statements.
| 50 | (888) 848-7569 | www.rivernorth.com |
RiverNorth/DoubleLine Strategic Income Fund | Schedule of Investments |
September 30, 2016
| Principal Amount/Description | Rate | Maturity | | Value | |
| | | | Venture X CLO Ltd. | | | | | | |
| $ | 500,000 | | Series 2012-10A(c)(f) | 4.90% | 07/20/2022 | | $ | 501,908 | |
| | | | Venture XV CLO Ltd. | | | | | | |
| | 500,000 | | Series 2013-15A(c)(f) | 3.78% | 07/15/2025 | | | 500,665 | |
| | | | | | | | | | |
| TOTAL COLLATERALIZED LOAN OBLIGATIONS (Cost $16,341,397) | | | | | 16,150,994 | |
| | | | | | | | |
| CONTINGENT CONVERTIBLE SECURITIES - 0.01% | |
| | 300,000 | | United Overseas Bank Ltd.(f) | 3.75% | 09/19/2024 | | | 311,349 | |
| | | | | | | | | | |
| TOTAL CONTINGENT CONVERTIBLE SECURITIES (Cost $308,748) | | | | | 311,349 | |
| | | | | | | | |
| NON-AGENCY COLLATERALIZED MORTGAGE OBLIGATIONS - 21.30% | |
| | | | Adjustable Rate Mortgage Trust | | | | | | |
| | 1,418,225 | | Series 2005-1(f) | 3.15% | 05/25/2035 | | | 1,391,192 | |
| | 5,840,408 | | Series 2005-10(f) | 3.21% | 01/25/2036 | | | 5,010,370 | |
| | 1,138,615 | | Series 2005-7(f) | 3.54% | 10/25/2035 | | | 1,002,589 | |
| | | | Alternative Loan Trust | | | | | | |
| | 520,755 | | Series 2005-20CB | 5.50% | 07/25/2035 | | | 477,894 | |
| | 197,954 | | Series 2005-54CB | 5.50% | 11/25/2035 | | | 174,986 | |
| | 890,501 | | Series 2005-6CB | 5.50% | 04/25/2035 | | | 859,066 | |
| | 1,988,627 | | Series 2005-85CB(f) | 1.63% | 02/25/2036 | | | 1,494,011 | |
| | 419,967 | | Series 2005-85CB(f) | 19.71% | 02/25/2036 | | | 603,274 | |
| | 484,035 | | Series 2005-86CB | 5.50% | 02/25/2036 | | | 422,733 | |
| | 968,650 | | Series 2005-9CB(f) | 4.52% | 05/25/2035 | | | 134,641 | |
| | 545,411 | | Series 2005-9CB(f) | 1.03% | 05/25/2035 | | | 447,701 | |
| | 436,425 | | Series 2006-12CB(f) | 5.75% | 05/25/2036 | | | 327,312 | |
| | 2,033,439 | | Series 2006-15CB | 6.50% | 06/25/2036 | | | 1,490,893 | |
| | 264,744 | | Series 2006-30T1 | 6.25% | 11/25/2036 | | | 234,956 | |
| | 212,888 | | Series 2006-32CB | 5.50% | 11/25/2036 | | | 181,239 | |
| | 422,181 | | Series 2006-36T2(f) | 25.64% | 12/25/2036 | | | 600,295 | |
| | 1,635,821 | | Series 2007-19 | 6.00% | 08/25/2037 | | | 1,307,811 | |
| | 5,714,306 | | Series 2007-20 | 6.25% | 08/25/2047 | | | 4,813,312 | |
| | 1,726,426 | | Series 2007-23CB(f) | 1.03% | 09/25/2037 | | | 927,600 | |
| | 1,648,449 | | Series 2007-23CB(f) | 5.97% | 09/25/2037 | | | 482,508 | |
| | 10,834,296 | | Series 2007-HY2(f) | 2.80% | 03/25/2047 | | | 9,439,780 | |
| | | | American Home Mortgage Investment Trust | | | | | | |
| | 188,967 | | Series 2007-A(c)(j) | 6.60% | 01/25/2037 | | | 107,899 | |
See Notes to Financial Statements.
Annual Report | September 30, 2016 | 51 |
RiverNorth/DoubleLine Strategic Income Fund | Schedule of Investments |
September 30, 2016
| Principal Amount/Description | Rate | Maturity | | Value | |
| | | | AVANT Loans Funding Trust | | | | | | |
| $ | 161,809 | | Series 2016-B(c) | 3.92% | 08/15/2019 | | $ | 162,679 | |
| | | | BAMLL Commercial Mortgage Securities Trust | | | | | | |
| | 400,000 | | Series 2014-IP(c)(f) | 2.81% | 06/15/2018 | | | 395,205 | |
| | 17,000,000 | | Series 2015-200P(c)(f) | 0.50% | 04/14/2025 | | | 517,135 | |
| | | | Banc of America Alternative Loan Trust | | | | | | |
| | 76,183 | | Series 2005-6 | 6.00% | 07/25/2035 | | | 72,702 | |
| | 145,122 | | Series 2005-6 | 5.50% | 07/25/2035 | | | 124,334 | |
| | | | Banc of America Commercial Mortgage Trust | | | | | | |
| | 306,300 | | Series 2007-5(f) | 5.77% | 10/10/2017 | | | 314,159 | |
| | | | Banc of America Funding Corp. | | | | | | |
| | 757,220 | | Series 2008-R2(c) | 6.00% | 09/25/2037 | | | 772,594 | |
| | | | Banc of America Funding Trust | | | | | | |
| | 3,000,000 | | Series 2005-B(f) | 0.98% | 04/20/2035 | | | 2,486,852 | |
| | 405,102 | | Series 2006-2 | 5.50% | 03/25/2036 | | | 402,235 | |
| | 1,441,735 | | Series 2006-A(f) | 2.94% | 02/20/2036 | | | 1,341,883 | |
| | 8,447,131 | | Series 2007-4(f) | 5.77% | 05/25/2037 | | | 7,631,382 | |
| | 7,864,042 | | Series 2010-R5(c) | 6.00% | 10/26/2037 | | | 6,975,437 | |
| | | | BCAP LLC Trust | | | | | | |
| | 202,095 | | Series 2007-AA2(f) | 7.50% | 04/25/2037 | | | 194,894 | |
| | 131,123 | | Series 2007-AA2 | 6.00% | 04/25/2037 | | | 116,095 | |
| | 4,156,409 | | Series 2009-RR1(c)(f) | 6.00% | 10/26/2036 | | | 4,135,977 | |
| | 8,744,825 | | Series 2010-RR6(c)(f) | 6.00% | 07/26/2036 | | | 6,930,177 | |
| | | | Bear Stearns ALT-A Trust | | | | | | |
| | 2,036,700 | | Series 2004-11(f) | 3.08% | 11/25/2034 | | | 1,886,186 | |
| | 1,944,285 | | Series 2005-3(f) | 2.95% | 04/25/2035 | | | 1,447,499 | |
| | 13,487,634 | | Series 2006-3(f) | 2.85% | 05/25/2036 | | | 10,250,817 | |
| | 8,742,391 | | Series 2006-4(f) | 3.08% | 07/25/2036 | | | 7,305,675 | |
| | 1,783,438 | | Series 2006-6(f) | 3.47% | 11/25/2036 | | | 1,491,971 | |
| | | | Bear Stearns Asset-Backed Securities Trust | | | | | | |
| | 456,844 | | Series 2005-HE3(f) | 1.54% | 03/25/2035 | | | 453,957 | |
| | 2,972,496 | | Series 2006-AC1(j) | 6.25% | 02/25/2036 | | | 2,277,323 | |
| | | | Bear Stearns Commercial Mortgage Securities Trust | | | | | | |
| | 71,572 | | Series 2006-PW13(f) | 5.61% | 08/11/2016 | | | 71,542 | |
| | | | Blue Elephant Loan Trust | | | | | | |
| | 1,300,000 | | Series 2015-1(c) | 5.56% | 12/15/2022 | | | 1,296,660 | |
| | | | CFCRE Commercial Mortgage Trust | | | | | | |
| | 5,224,654 | | Series 2016-C3(f) | 1.25% | 12/10/2025 | | | 402,140 | |
| | | | Chase Mortgage Finance Trust | | | | | | |
| | 6,216,887 | | Series 2007-S2 | 6.00% | 03/25/2037 | | | 5,371,761 | |
See Notes to Financial Statements.
| 52 | (888) 848-7569 | www.rivernorth.com |
RiverNorth/DoubleLine Strategic Income Fund | Schedule of Investments |
September 30, 2016
| Principal Amount/Description | Rate | Maturity | | Value | |
| $ | 12,636,043 | | Series 2007-S2 | 6.00% | 03/25/2037 | | $ | 10,967,546 | |
| | 703,132 | | Series 2007-S3 | 5.50% | 05/25/2037 | | | 556,861 | |
| | | | CIM Trust | | | | | | |
| | 12,000,000 | | Series 2016-1RR(c)(f) | 12.32% | 07/26/2055 | | | 10,634,064 | |
| | 12,000,000 | | Series 2016-2RR B2(c)(f) | 13.12% | 02/27/2056 | | | 10,754,191 | |
| | 12,000,000 | | Series 2016-3RR B2(c)(f) | 0.00% | 02/27/2056 | | | 10,784,063 | |
| | | | Citicorp Mortgage Securities Trust | | | | | | |
| | 1,204,461 | | Series 2007-1 | 6.00% | 01/25/2037 | | | 1,224,088 | |
| | 403,714 | | Series 2007-2 | 5.50% | 02/25/2037 | | | 402,705 | |
| | | | Citigroup / Deutsche Bank Commercial Mortgage Trust | | | | | | |
| | 313,100 | | Series 2007-CD4(f) | 5.37% | 12/11/2049 | | | 316,115 | |
| | | | Citigroup / Deutshe Bank Commercial Mortgage Trust | | | | | | |
| | 181,000 | | Series 2007-CD4(c)(f) | 5.30% | 12/11/2049 | | | 182,705 | |
| | | | Citigroup Commercial Mortgage Trust | | | | | | |
| | 4,032,188 | | Series 2014-GC25(f) | 1.23% | 10/10/2047 | | | 270,900 | |
| | 355,500 | | Series 2015-GC27(c)(f) | 4.58% | 01/10/2025 | | | 290,656 | |
| | 400,000 | | Series 2015-GC31(f) | 4.20% | 06/10/2025 | | | 406,476 | |
| | 420,000 | | Series 2015-GC35 | 4.65% | 11/10/2025 | | | 430,831 | |
| | 5,527,844 | | Series 2015-GC35(f) | 1.06% | 11/10/2048 | | | 310,720 | |
| | 488,000 | | Series 2016-P4 | 2.90% | 07/10/2026 | | | 503,636 | |
| | 3,369,000 | | Series 2016-P4(f) | 2.18% | 07/10/2049 | | | 486,480 | |
| | 494,000 | | Series 2016-SMPLC D | 3.52% | 09/10/2021 | | | 494,695 | |
| | | | Citigroup Mortgage Loan Trust | | | | | | |
| | 1,216,710 | | Series 2006-WF1(j) | 5.21% | 03/25/2036 | | | 890,579 | |
| | 1,746,621 | | Series 2007-OPX1(j) | 6.33% | 01/25/2037 | | | 1,275,733 | |
| | 2,000,000 | | Series 2008-AR4(c)(f) | 2.99% | 11/25/2038 | | | 1,860,563 | |
| | 1,400,000 | | Series 2008-AR4(c)(f) | 3.13% | 11/25/2038 | | | 1,345,600 | |
| | 1,274,686 | | Series 2010-8(c)(f) | 6.29% | 11/25/2036 | | | 1,195,097 | |
| | 3,759,979 | | Series 2010-8(c)(f) | 6.30% | 12/25/2036 | | | 3,506,221 | |
| | | | CitiMortgage Alternative Loan Trust | | | | | | |
| | 1,046,249 | | Series 2007-A1 | 6.00% | 01/25/2037 | | | 906,720 | |
| | 206,084 | | Series 2007-A1(f) | 4.87% | 01/25/2037 | | | 35,977 | |
| | 346,646 | | Series 2007-A3(f) | 4.87% | 03/25/2037 | | | 60,541 | |
| | 150,629 | | Series 2007-A3(f) | 6.00% | 03/25/2037 | | | 133,047 | |
| | 1,219,076 | | Series 2007-A4 | 5.75% | 04/25/2037 | | | 1,055,415 | |
| | 1,055,268 | | Series 2007-A6 | 5.50% | 06/25/2037 | | | 893,722 | |
| | | | COBALT CMBS Commercial Mortgage Trust | | | | | | |
| | 320,700 | | Series 2007-C2(f) | 5.57% | 04/15/2047 | | | 320,859 | |
| | | | Commercial Mortgage Pass-Through Certificates | | | | | | |
| | 345,670 | | Series 2010-C1(c)(f) | 1.74% | 07/10/2046 | | | 6,086 | |
See Notes to Financial Statements.
Annual Report | September 30, 2016 | 53 |
RiverNorth/DoubleLine Strategic Income Fund | Schedule of Investments |
September 30, 2016
| Principal Amount/Description | Rate | Maturity | | Value | |
| $ | 312,400 | | Series 2014-CR19(f) | 4.88% | 08/10/2047 | | $ | 327,040 | |
| | 400,000 | | Series 2014-CR20(f) | 4.66% | 11/10/2047 | | | 416,561 | |
| | 5,797,416 | | Series 2014-UBS4(c) | 3.75% | 08/10/2047 | | | 1,747,225 | |
| | 11,000 | | Series 2014-UBS4(c)(f)(k) | 0.00% | 08/10/2047 | | | 0 | |
| | 2,705,400 | | Series 2014-UBS4(c) | 3.75% | 08/10/2047 | | | 1,863,975 | |
| | 3,091,920 | | Series 2014-UBS4(c) | 3.75% | 08/10/2047 | | | 1,830,429 | |
| | 3,957,970 | | Series 2015-CR22(f) | 1.16% | 03/10/2025 | | | 227,996 | |
| | 475,000 | | Series 2015-CR25(f) | 4.70% | 08/10/2025 | | | 496,036 | |
| | 5,071,020 | | Series 2015-CR26(f) | 1.21% | 09/10/2025 | | | 359,074 | |
| | 419,000 | | Series 2015-LC23(f) | 4.80% | 10/10/2025 | | | 425,137 | |
| | 3,728,034 | | Series 2016-DC2(f) | 1.24% | 10/10/2025 | | | 274,086 | |
| | 249,000 | | Series 2016-DC2(f) | 4.80% | 02/10/2026 | | | 260,547 | |
| | | | Commercial Mortgage Trust | | | | | | |
| | 312,200 | | Series 2007-GG11(f) | 6.24% | 12/10/2049 | | | 312,548 | |
| | 400,000 | | Series 2007-GG9 | 5.48% | 03/10/2039 | | | 403,042 | |
| | | | Consumer Credit Origination Loan Trust | | | | | | |
| | 3,750,000 | | Series 2015-1(c) | 5.21% | 04/15/2018 | | | 3,648,569 | |
| | | | Countrywide Home Loan Mortgage Pass-Through Trust | | | | | | |
| | 4,233,140 | | Series 2005-HYB7(f) | 2.70% | 11/20/2035 | | | 3,565,405 | |
| | 132,338 | | Series 2005-J4 | 5.50% | 11/25/2035 | | | 129,806 | |
| | 3,465,091 | | Series 2006-18 | 6.00% | 12/25/2036 | | | 3,116,810 | |
| | 545,101 | | Series 2007-17 | 6.00% | 10/25/2037 | | | 526,153 | |
| | 602,737 | | Series 2007-3 | 6.00% | 04/25/2037 | | | 524,769 | |
| | 720,371 | | Series 2007-7 | 5.75% | 06/25/2037 | | | 655,963 | |
| | | | Credit Suisse First Boston Mortgage Securities Corp. | | | | | | |
| | 19,637 | | Series 1998-C2(c)(f) | 6.75% | 11/15/2030 | | | 19,755 | |
| | 109,384 | | Series 2005-10 | 5.50% | 11/25/2035 | | | 101,856 | |
| | 3,617,664 | | Series 2005-11 | 6.00% | 12/25/2035 | | | 3,484,799 | |
| | 85,837 | | Series 2005-8 | 5.50% | 08/25/2025 | | | 81,230 | |
| | 7,278,732 | | Series 2005-9 | 6.00% | 10/25/2035 | | | 4,820,989 | |
| | | | CSAB Mortgage-Backed Trust | | | | | | |
| | 8,781,274 | | Series 2006-2(j) | 5.70% | 09/25/2036 | | | 2,265,404 | |
| | 175,010 | | Series 2007-1(f) | 5.90% | 05/25/2037 | | | 84,852 | |
| | | | CSAIL Commercial Mortgage Trust | | | | | | |
| | 5,946,269 | | Series 2015-C1(f) | 1.11% | 01/15/2025 | | | 346,004 | |
| | 419,000 | | Series 2015-C4(f) | 4.74% | 11/15/2025 | | | 430,657 | |
| | | | CSMC Mortgage-Backed Trust | | | | | | |
| | 284,274 | | Series 2006-1 | 6.00% | 02/25/2036 | | | 208,224 | |
| | 6,431,822 | | Series 2006-2 | 5.75% | 03/25/2036 | | | 5,927,128 | |
| | 77,865 | | Series 2006-4 | 5.50% | 05/25/2021 | | | 74,733 | |
| | 1,065,077 | | Series 2006-5 | 6.25% | 06/25/2036 | | | 550,988 | |
| | 144,875 | | Series 2006-9 | 6.00% | 11/25/2036 | | | 118,328 | |
See Notes to Financial Statements.
| 54 | (888) 848-7569 | www.rivernorth.com |
| RiverNorth/DoubleLine Strategic Income Fund | Schedule of Investments |
September 30, 2016
| Principal Amount/Description | Rate | Maturity | | Value | |
| $ | 3,302,900 | | Series 2007-1 | 6.00% | 02/25/2037 | | $ | 2,827,443 | |
| | 18,671 | | Series 2007-2 | 5.00% | 03/25/2037 | | | 18,411 | |
| | 658,685 | | Series 2007-3(f) | 5.84% | 04/25/2037 | | | 331,520 | |
| | 68,927 | | Series 2007-4 | 6.00% | 06/25/2037 | | | 65,432 | |
| | 302,900 | | Series 2007-C4(f) | 6.13% | 09/15/2039 | | | 311,233 | |
| | 6,586,496 | | Series 2009-16R(c) | 6.00% | 07/26/2037 | | | 6,311,297 | |
| | 1,833,600 | | Series 2010-7R(c)(f) | 6.00% | 04/26/2037 | | | 1,751,418 | |
| | 6,641,105 | | Series 2016-PR1(c)(j) | 5.13% | 05/25/2019 | | | 6,612,557 | |
| | | | Deutsche Alt-A Securities, Inc. Mortgage Loan Trust | | | | | | |
| | 523,478 | | Series 2005-6(f) | 4.55% | 12/25/2035 | | | 101,905 | |
| | 229,351 | | Series 2005-6(f) | 1.93% | 12/25/2035 | | | 171,431 | |
| | 1,626,533 | | Series 2007-1(f) | 0.67% | 08/25/2037 | | | 1,457,648 | |
| | | | Deutsche Mortgage Securities, Inc. Mortgage Loan Trust | | | | | | |
| | 220,495 | | Series 2006-PR1(c)(f) | 11.39% | 04/15/2036 | | | 247,760 | |
| | | | FHLMC Multifamily Structured Pass Through Certificates | | | | | | |
| | 6,002,630 | | Series 2016-K722(f) | 1.31% | 03/25/2023 | | | 419,309 | |
| | | | First Horizon Alternative Mortgage Securities Trust | | | | | | |
| | 116,619 | | Series 2005-FA6 | 5.50% | 09/25/2035 | | | 103,303 | |
| | 1,507,894 | | Series 2005-FA6 | 5.50% | 09/25/2035 | | | 1,335,720 | |
| | 133,339 | | Series 2006-FA7 | 6.25% | 12/25/2036 | | | 105,075 | |
| | 238,013 | | Series 2007-FA2 | 6.00% | 04/25/2037 | | | 178,564 | |
| | | | First Horizon Mortgage Pass-Through Trust | | | | | | |
| | 3,951,852 | | Series 2007-AR3(f) | 2.74% | 11/25/2037 | | | 3,448,209 | |
| | | | GE Commercial Mortgage Corp. Trust | | | | | | |
| | 489,000 | | Series 2007-C1(f) | 5.61% | 12/10/2049 | | | 484,810 | |
| | | | GRACE Mortgage Trust | | | | | | |
| | 400,000 | | Series 2014-GRCE(c) | 3.37% | 06/10/2028 | | | 426,375 | |
| | | | GS Mortgage Securities Trust | | | | | | |
| | 425,611 | | Series 2006-GG6(c)(f) | 0.00% | 04/10/2038 | | | 4 | |
| | 362,784 | | Series 2007-GG10(f) | 5.99% | 08/10/2045 | | | 368,702 | |
| | 334,894 | | Series 2011-GC3(c)(f) | 0.84% | 03/10/2021 | | | 8,085 | |
| | 2,420,391 | | Series 2011-GC5(c)(f) | 1.54% | 08/10/2044 | | | 128,274 | |
| | 281,000 | | Series 2014-GC26(c)(f) | 4.66% | 11/10/2047 | | | 231,479 | |
| | 7,463,707 | | Series 2015-GS1(f) | 0.99% | 11/10/2048 | | | 445,065 | |
| | 412,000 | | Series 2016-ICE2(c)(f) | 2.45% | 02/15/2018 | | | 414,764 | |
| | | | GSAA Home Equity Trust | | | | | | |
| | 3,059,543 | | Series 2006-13(f) | 6.04% | 07/25/2036 | | | 1,850,620 | |
| | 665,778 | | Series 2006-18(j) | 5.68% | 11/25/2036 | | | 350,244 | |
| | 213,561 | | Series 2006-6(f) | 5.69% | 03/25/2036 | | | 114,772 | |
See Notes to Financial Statements.
| Annual Report | September 30, 2016 | 55 |
| RiverNorth/DoubleLine Strategic Income Fund | Schedule of Investments |
September 30, 2016
| Principal Amount/Description | Rate | Maturity | | Value | |
| $ | 1,154,905 | | Series 2007-2(j) | 6.10% | 03/25/2037 | | $ | 599,645 | |
| | | | GSR Mortgage Loan Trust | | | | | | |
| | 846,262 | | Series 2005-AR4(f) | 3.20% | 07/25/2035 | | | 834,947 | |
| | 2,735,264 | | Series 2006-2F | 5.25% | 02/25/2036 | | | 2,133,707 | |
| | 2,065,601 | | Series 2007-2F | 5.75% | 02/25/2037 | | | 2,030,050 | |
| | 5,071,324 | | Series 2007-2F | 6.00% | 03/25/2037 | | | 4,829,091 | |
| | 2,572,340 | | Series 2007-AR2(f) | 3.19% | 05/25/2037 | | | 2,118,054 | |
| | | | HSI Asset Loan Obligation Trust | | | | | | |
| | 148,804 | | Series 2007-2 | 5.50% | 09/25/2037 | | | 143,310 | |
| | | | IndyMac IMJA Mortgage Loan Trust | | | | | | |
| | 1,838,268 | | Series 2007-A1 | 6.00% | 08/25/2037 | | | 1,509,880 | |
| | | | IndyMac IMSC Mortgage Loan Trust | | | | | | |
| | 5,312,996 | | Series 2007-F2 | 6.50% | 07/25/2037 | | | 3,230,961 | |
| | | | IndyMac Index Mortgage Loan Trust | | | | | | |
| | 4,819,510 | | Series 2005-AR31(f) | 2.81% | 01/25/2036 | | | 4,277,102 | |
| | 1,840,286 | | Series 2005-AR35(f) | 2.91% | 02/25/2036 | | | 1,460,948 | |
| | 5,653,500 | | Series 2006-AR25(f) | 3.12% | 09/25/2036 | | | 4,572,812 | |
| | 897,566 | | Series 2007-FLX1(f) | 0.71% | 02/25/2037 | | | 884,948 | |
| | | | JP Morgan Alternative Loan Trust | | | | | | |
| | 469,494 | | Series 2005-S1 | 6.00% | 12/25/2035 | | | 431,268 | |
| | 84,078 | | Series 2006-S1 | 5.00% | 02/25/2021 | | | 82,290 | |
| | 680,476 | | Series 2006-S3(j) | 6.12% | 08/25/2036 | | | 670,224 | |
| | | | JP Morgan BB Commercial Mortgage Securities Trust | | | | | | |
| | 400,000 | | Series 2014-C21(f) | 4.82% | 08/15/2047 | | | 419,027 | |
| | 388,000 | | Series 2014-C26(f) | 4.57% | 12/15/2024 | | | 399,273 | |
| | 300,000 | | Series 2015-C27(c)(f) | 3.98% | 02/15/2025 | | | 228,340 | |
| | 5,954,104 | | Series 2015-C28(f) | 1.34% | 03/15/2025 | | | 374,106 | |
| | 10,429,580 | | Series 2015-C30(f) | 0.86% | 07/15/2025 | | | 399,398 | |
| | 3,996,376 | | Series 2015-C31(f) | 1.17% | 08/15/2025 | | | 244,571 | |
| | 200,000 | | Series 2015-C32(f) | 4.82%�� | 10/15/2025 | | | 191,409 | |
| | 489,000 | | Series 2015-C33(f) | 4.77% | 11/15/2025 | | | 516,189 | |
| | 414,000 | | Series 2016-C1(f) | 4.90% | 02/15/2026 | | | 441,194 | |
| | | | JP Morgan Chase Commercial Mortgage Securities Corp. | | | | | | |
| | 89,723 | | Series 2006-LDP8(f) | 0.68% | 05/15/2045 | | | 1 | |
| | 807,508 | | Series 2006-LDP8(f) | 0.58% | 05/15/2045 | | | 7 | |
| | 314,430 | | Series 2006-LDP9 | 5.37% | 05/15/2047 | | | 315,422 | |
| | 310,000 | | Series 2007-CB19(f) | 5.88% | 05/12/2017 | | | 315,403 | |
| | 400,000 | | Series 2007-CB20(f) | 6.29% | 02/12/2051 | | | 400,183 | |
| | 4,000,000 | | Series 2007-CH1(j) | 5.04% | 11/25/2036 | | | 3,788,066 | |
| | 495,000 | | Series 2007-LD11(f) | 5.94% | 06/15/2017 | | | 498,578 | |
| | 480,000 | | Series 2007-LD12(f) | 6.21% | 08/15/2017 | | | 493,332 | |
| | 495,000 | | Series 2007-LDPX(f) | 5.46% | 03/15/2017 | | | 485,740 | |
See Notes to Financial Statements.
| 56 | (888) 848-7569 | www.rivernorth.com |
| RiverNorth/DoubleLine Strategic Income Fund | Schedule of Investments |
September 30, 2016
| Principal Amount/Description | Rate | Maturity | | Value | |
| $ | 3,907,803 | | Series 2012-C8(f) | 2.17% | 10/15/2045 | | $ | 282,298 | |
| | 400,000 | | Series 2014-DSTY(c) | 3.43% | 06/10/2027 | | | 413,197 | |
| | 119,000 | | Series 2016-JP2(f) | 3.95% | 07/15/2026 | | | 118,855 | |
| | 155,000 | | Series 2016-JP2(f) | 3.46% | 07/15/2026 | | | 160,432 | |
| | 3,458,000 | | Series 2016-JP2(f) | 2.02% | 07/15/2026 | | | 482,553 | |
| | | | JP Morgan Mortgage Acquisition Corp. | | | | | | |
| | 416,247 | | Series 2006-CH2(j) | 5.46% | 10/25/2036 | | | 324,466 | |
| | | | JP Morgan Mortgage Trust | | | | | | |
| | 10,268,479 | | Series 2005-S3 | 6.50% | 01/25/2036 | | | 8,526,824 | |
| | 273,892 | | Series 2007-S3 | 6.00% | 08/25/2037 | | | 238,057 | |
| | 1,523,135 | | Series 2007-S3 | 6.00% | 08/25/2037 | | | 1,362,406 | |
| | 4,548,202 | | Series 2015-3(c)(f) | 3.50% | 01/25/2035 | | | 4,724,980 | |
| | | | JP Morgan Resecuritization Trust | | | | | | |
| | 2,357,508 | | Series 2011-1(c)(f) | 6.00% | 06/26/2037 | | | 2,037,703 | |
| | | | LB-UBS Commercial Mortgage Trust | | | | | | |
| | 729,776 | | Series 2006-C7(c)(f) | 0.90% | 11/15/2038 | | | 1,279 | |
| | 973,035 | | Series 2006-C7(c)(f) | 0.90% | 11/15/2038 | | | 1,706 | |
| | 415,000 | | Series 2007-C1 | 5.48% | 02/15/2040 | | | 416,039 | |
| | 400,000 | | Series 2007-C2(f) | 5.49% | 02/15/2040 | | | 406,464 | |
| | 400,000 | | Series 2007-C7(f) | 6.45% | 09/15/2045 | | | 402,814 | |
| | | | Lehman Mortgage Trust | | | | | | |
| | 11,277,144 | | Series 2006-1(f) | 5.66% | 02/25/2036 | | | 10,711,399 | |
| | 914,532 | | Series 2006-6 | 5.50% | 10/25/2036 | | | 729,530 | |
| | 4,038,916 | | Series 2006-7(f) | 0.78% | 11/25/2036 | | | 297,831 | |
| | 4,038,916 | | Series 2006-7(f) | 7.22% | 11/25/2036 | | | 1,080,767 | |
| | 1,932,869 | | Series 2006-8(f) | 0.95% | 12/25/2036 | | | 693,642 | |
| | 1,932,869 | | Series 2006-8(f) | 6.05% | 12/25/2036 | | | 602,040 | |
| | 1,539,927 | | Series 2007-10 | 6.00% | 01/25/2038 | | | 1,527,682 | |
| | 479,219 | | Series 2007-10 | 6.50% | 01/25/2038 | | | 368,200 | |
| | | | Lehman XS Trust | | | | | | |
| | 363,241 | | Series 2006-5(j) | 5.89% | 04/25/2036 | | | 340,889 | |
| | | | MASTR Asset Securitization Trust | | | | | | |
| | 80,270 | | Series 2003-1 | 5.75% | 02/25/2033 | | | 80,161 | |
| | 113,668 | | Series 2003-2 | 5.75% | 04/25/2033 | | | 112,485 | |
| | | | Merrill Lynch Alternative Note Asset Trust | | | | | | |
| | 973,325 | | Series 2007-F1 | 6.00% | 03/25/2037 | | | 554,984 | |
| | | | Morgan Stanley Bank of America Merrill Lynch Trust | | | | | | |
| | 4,431,177 | | Series 2012-C5(c)(f) | 1.88% | 08/15/2045 | | | 257,035 | |
| | 450,000 | | Series 2014-C19 | 4.00% | 12/15/2024 | | | 434,477 | |
| | 380,000 | | Series 2015-C25(f) | 4.68% | 09/15/2025 | | | 401,261 | |
| | 600,000 | | Series 2015-C26(c) | 3.06% | 10/15/2025 | | | 431,206 | |
| | 350,000 | | Series 2015-C27(f) | 4.69% | 11/15/2025 | | | 357,728 | |
See Notes to Financial Statements.
| Annual Report | September 30, 2016 | 57 |
| RiverNorth/DoubleLine Strategic Income Fund | Schedule of Investments |
September 30, 2016
| Principal Amount/Description | Rate | Maturity | | Value | |
| $ | 502,000 | | Series 2015-C27(c)(f) | 3.24% | 11/15/2025 | | $ | 330,328 | |
| | 3,329,000 | | Series 2016-C30 XA(f) | 1.47% | 08/15/2026 | | | 359,565 | |
| | | | Morgan Stanley Capital I Trust | | | | | | |
| | 111,914 | | Series 2006-HQ8(f) | 5.59% | 03/12/2044 | | | 112,463 | |
| | 316,200 | | Series 2007-HQ11(f) | 5.51% | 02/12/2044 | | | 312,137 | |
| | 308,400 | | Series 2007-IQ13 | 5.41% | 03/15/2044 | | | 310,865 | |
| | 4,197,795 | | Series 2011-C1(c)(f) | 0.63% | 09/15/2047 | | | 65,900 | |
| | 400,000 | | Series 2014-MP(c)(f) | 3.82% | 08/11/2021 | | | 404,899 | |
| | 6,963,306 | | Series 2015-UBS8(f) | 1.13% | 12/15/2025 | | | 465,324 | |
| | 426,000 | | Series 2015-XLF2(c)(f) | 3.52% | 08/15/2016 | | | 425,894 | |
| | 1,459,000 | | Series 2016-UB11 XA(f) | 1.83% | 08/15/2026 | | | 163,176 | |
| | | | Morgan Stanley Mortgage Loan Trust | | | | | | |
| | 4,256,901 | | Series 2005-3AR(f) | 2.82% | 07/25/2035 | | | 3,492,117 | |
| | 272,731 | | Series 2006-11 | 6.00% | 08/25/2036 | | | 226,186 | |
| | 1,461,741 | | Series 2006-7(f) | 5.18% | 06/25/2036 | | | 1,216,823 | |
| | 1,538,339 | | Series 2006-7 | 6.00% | 06/25/2036 | | | 1,396,800 | |
| | 549,047 | | Series 2007-3XS(j) | 5.70% | 01/25/2047 | | | 354,525 | |
| | | | Morgan Stanley Re-REMIC Trust | | | | | | |
| | 523,333 | | Series 2011-R1(c)(f) | 5.94% | 02/26/2037 | | | 552,823 | |
| | | | Nomura Asset Acceptance Corp. Alternative Loan Trust | | | | | | |
| | 1,769,395 | | Series 2005-AP3(f) | 5.32% | 08/25/2035 | | | 1,180,461 | |
| | | | OneMain Financial Issuance Trust | | | | | | |
| | 2,000,000 | | Series 2015-1A(c) | 3.19% | 03/18/2026 | | | 2,022,808 | |
| | | | PHH Alternative Mortgage Trust | | | | | | |
| | 2,325,332 | | Series 2007-2 | 6.00% | 05/25/2037 | | | 2,064,858 | |
| | | | PR Mortgage Loan Trust | | | | | | |
| | 8,081,569 | | Series 2014-1(f) | 5.91% | 09/25/2047 | | | 8,180,027 | |
| | | | Prime Mortgage Trust | | | | | | |
| | 115,691 | | Series 2006-1 | 5.50% | 06/25/2036 | | | 109,312 | |
| | 120,548 | | Series 2006-DR1(c) | 5.50% | 05/25/2035 | | | 112,858 | |
| | | | RBSGC Structured Trust | | | | | | |
| | 351,833 | | Series 2008-B(c) | 6.00% | 06/25/2037 | | | 304,706 | |
| | | | Residential Accredit Loans, Inc. | | | | | | |
| | 264,395 | | Series 2004-QS15 | 5.25% | 11/25/2034 | | | 270,008 | |
| | 2,831,465 | | Series 2005-QS17 | 6.00% | 12/25/2035 | | | 2,468,189 | |
| | 6,240,379 | | Series 2006-QA5(f) | 0.75% | 07/25/2036 | | | 4,190,916 | |
| | 4,219,941 | | Series 2006-QS10 | 6.50% | 08/25/2036 | | | 3,628,232 | |
| | 1,583,389 | | Series 2006-QS4 | 6.00% | 04/25/2036 | | | 1,375,075 | |
| | 1,054,196 | | Series 2006-QS6 | 6.00% | 06/25/2036 | | | 911,655 | |
| | 1,479,555 | | Series 2006-QS6 | 6.00% | 06/25/2036 | | | 1,279,500 | |
| | 465,503 | | Series 2006-QS7(f) | 5.07% | 06/25/2036 | | | 91,440 | |
| | 151,688 | | Series 2006-QS7(f) | 0.93% | 06/25/2036 | | | 98,304 | |
| | 2,885,333 | | Series 2006-QS7 | 6.00% | 06/25/2036 | | | 2,445,194 | |
See Notes to Financial Statements.
| 58 | (888) 848-7569 | www.rivernorth.com |
| RiverNorth/DoubleLine Strategic Income Fund | Schedule of Investments |
September 30, 2016
| Principal Amount/Description | Rate | Maturity | | Value | |
| $ | 582,919 | | Series 2006-QS8(f) | 5.02% | 08/25/2036 | | $ | 118,933 | |
| | 187,682 | | Series 2006-QS8(f) | 0.98% | 08/25/2036 | | | 122,914 | |
| | 3,755,559 | | Series 2007-QS3 | 6.50% | 02/25/2037 | | | 3,147,139 | |
| | 117,794 | | Series 2007-QS6 | 6.25% | 04/25/2037 | | | 102,327 | |
| | 16,597 | | Series 2007-QS6(f) | 50.62% | 04/25/2037 | | | 40,481 | |
| | 5,345,492 | | Series 2007‐QS9 | 6.50% | 07/25/2037 | | | 4,578,274 | |
| | 399,232 | | Series 2008-QR1 | 6.00% | 08/25/2036 | | | 308,417 | |
| | | | Residential Asset Mortgage Products Trust | | | | | | |
| | 20,868 | | Series 2004-RS4(f) | 5.07% | 04/25/2034 | | | 21,409 | |
| | | | Residential Asset Securitization Trust | | | | | | |
| | 698,530 | | Series 2006-A1 | 6.00% | 04/25/2036 | | | 536,800 | |
| | 1,387,353 | | Series 2006-A2 | 6.00% | 05/25/2036 | | | 1,097,813 | |
| | 1,070,582 | | Series 2006-A6 | 6.50% | 07/25/2036 | | | 564,443 | |
| | 6,680,841 | | Series 2006-A7CB | 6.25% | 07/25/2036 | | | 6,317,892 | |
| | 180,352 | | Series 2006-A8 | 6.50% | 08/25/2036 | | | 102,996 | |
| | 544,295 | | Series 2006-A8 | 6.00% | 08/25/2036 | | | 484,407 | |
| | 389,330 | | Series 2006-A8(f) | 5.37% | 08/25/2036 | | | 124,136 | |
| | 2,117,924 | | Series 2007-A1 | 6.00% | 03/25/2037 | | | 1,453,369 | |
| | 3,471,389 | | Series 2007-A2 | 6.00% | 04/25/2037 | | | 2,930,738 | |
| | 115,712 | | Series 2007-A6 | 6.00% | 06/25/2037 | | | 106,353 | |
| | 3,570,684 | | Series 2007-A7 | 6.00% | 07/25/2037 | | | 2,511,239 | |
| | 12,938,631 | | Series 2007-A8 | 6.00% | 08/25/2037 | | | 10,998,510 | |
| | | | Residential Funding Mortgage Securities I Trust | | | | | | |
| | 1,662,446 | | Series 2006-S3 | 5.50% | 03/25/2036 | | | 1,508,015 | |
| | 390,682 | | Series 2006-S6 | 6.00% | 07/25/2036 | | | 367,820 | |
| | 2,768,445 | | Series 2006-S6 | 6.00% | 07/25/2036 | | | 2,606,439 | |
| | 689,655 | | Series 2007-S3 | 6.00% | 03/25/2037 | | | 623,293 | |
| | 524,622 | | Series 2007-S6 | 6.00% | 06/25/2037 | | | 487,331 | |
| | | | Sequoia Mortgage Trust | | | | | | |
| | 3,944,477 | | Series 2007-3(f) | 3.06% | 07/20/2037 | | | 3,206,282 | |
| | | | SG Commercial Mortgage Securities Trust 2016-C5 | | | | | | |
| | 3,556,162 | | Series 2016-C5(f) | 2.20% | 03/10/2026 | | | 475,561 | |
| | | | Springleaf Funding Trust | | | | | | |
| | 2,500,000 | | Series 2015-AA(c) | 3.16% | 05/15/2019 | | | 2,532,394 | |
| | | | Structured Adjustable Rate Mortgage Loan Trust | | | | | | |
| | 1,603,911 | | Series 2005-15(f) | 2.83% | 07/25/2035 | | | 1,294,436 | |
| | | | Structured Asset Securities Corp. | | | | | | |
| | 309,356 | | Series 2005-RF1(c)(f) | 0.88% | 03/25/2035 | | | 255,139 | |
| | 314,988 | | Series 2005-RF1(c)(f) | 4.64% | 03/25/2035 | | | 59,771 | |
See Notes to Financial Statements.
| Annual Report | September 30, 2016 | 59 |
| RiverNorth/DoubleLine Strategic Income Fund | Schedule of Investments |
September 30, 2016
| Principal Amount/Description | Rate | Maturity | | Value | |
| | | | Suntrust Alternative Loan Trust | | | | | | |
| $ | 11,079,672 | | Series 2005-1F | 6.50% | 12/25/2035 | | $ | 10,439,835 | |
| | | | TBW Mortgage‐Backed Trust | | | | | | |
| | 1,660,841 | | Series 2006-2 | 7.00% | 07/25/2036 | | | 777,078 | |
| | | | Wachovia Bank Commercial Mortgage Trust | | | | | | |
| | 36,530 | | Series 2006-C24(f) | 5.66% | 03/15/2045 | | | 36,485 | |
| | 400,000 | | Series 2006-C28(f) | 5.63% | 10/15/2016 | | | 398,848 | |
| | 749,727 | | Series 2006-C29(f) | 0.48% | 11/15/2048 | | | 252 | |
| | 400,000 | | Series 2007-C30(f) | 5.41% | 12/15/2043 | | | 400,815 | |
| | 419,052 | | Series 2007-C33(f) | 6.16% | 07/15/2017 | | | 427,801 | |
| | | | Wachovia Mortgage Loan Trust LLC Series Trust | | | | | | |
| | 1,962,134 | | Series 2005-B(f) | 2.99% | 10/20/2035 | | | 1,709,606 | |
| | | | Washington Mutual Alternative Mortgage Pass-Through Certificates | | | | | | |
| | 2,609,487 | | Series 2005-1 | 6.00% | 03/25/2035 | | | 2,650,153 | |
| | 100,125 | | Series 2005-9 | 5.50% | 11/25/2035 | | | 87,057 | |
| | 789,834 | | Series 2006-5 | 6.00% | 07/25/2036 | | | 649,276 | |
| | | | Washington Mutual Mortgage Pass-Through Certificates Trust | | | | | | |
| | 1,393,183 | | Series 2006-2 | 6.00% | 03/25/2036 | | | 1,328,858 | |
| | | | Wells Fargo Alternative Loan Trust | | | | | | |
| | 1,147,789 | | Series 2007-PA2(f) | 0.96% | 06/25/2037 | | | 847,595 | |
| | 1,173,692 | | Series 2007-PA2(f) | 5.54% | 06/25/2037 | | | 190,415 | |
| | 441,254 | | Series 2007-PA3 | 5.75% | 07/25/2037 | | | 394,125 | |
| | 1,372,401 | | Series 2007-PA3 | 6.25% | 07/25/2037 | | | 1,250,544 | |
| | 8,321,028 | | Series 2007-PA5 | 6.25% | 11/25/2037 | | | 8,019,664 | |
| | | | Wells Fargo Commercial Mortgage Trust | | | | | | |
| | 525,000 | | Series 2014-LC16(c) | 3.94% | 06/15/2024 | | | 430,831 | |
| | 6,112,024 | | Series 2015-C31(f) | 1.27% | 07/15/2025 | | | 455,529 | |
| | 420,000 | | Series 2015-C31(f) | 4.77% | 11/15/2025 | | | 440,050 | |
| | 340,000 | | Series 2015-LC22(f) | 4.69% | 09/15/2058 | | | 354,506 | |
| | 380,000 | | Series 2015-NXS3(f) | 4.64% | 09/15/2057 | | | 369,476 | |
| | 420,000 | | Series 2015-NXS4(f) | 4.76% | 11/15/2025 | | | 442,978 | |
| | | | Wells Fargo Mortgage‐Backed Securities Trust | | | | | | |
| | 2,482,615 | | Series 2005-12 | 5.50% | 11/25/2035 | | | 2,517,891 | |
| | 835,673 | | Series 2006-11 | 6.00% | 09/25/2036 | | | 813,867 | |
| | 119,428 | | Series 2006-2 | 5.75% | 03/25/2036 | | | 121,100 | |
| | 290,435 | | Series 2006-2 | 5.50% | 03/25/2036 | | | 288,764 | |
| | 1,071,931 | | Series 2007-13 | 6.00% | 09/25/2037 | | | 1,082,306 | |
| | 1,102,861 | | Series 2007-14 | 6.00% | 10/25/2037 | | | 1,086,849 | |
See Notes to Financial Statements.
| 60 | (888) 848-7569 | www.rivernorth.com |
| RiverNorth/DoubleLine Strategic Income Fund | Schedule of Investments |
September 30, 2016
| Principal Amount/Description | Rate | Maturity | | Value | |
| $ | 956,388 | | Series 2007-2 | 6.00% | 03/25/2037 | | $ | 941,316 | |
| | | | WF‐RBS Commercial Mortgage Trust | | | | | | |
| | 2,895,751 | | Series 2012‐C9(c)(f) | 2.28% | 11/15/2045 | | | 240,924 | |
| | 4,450,399 | | Series 2014-C21(f) | 1.32% | 08/15/2047 | | | 281,237 | |
| | 4,919,487 | | Series 2014-C22(f) | 1.09% | 09/15/2057 | | | 251,458 | |
| | | | | | | | | | |
| TOTAL NON-AGENCY COLLATERALIZED MORTGAGE OBLIGATIONS (Cost $425,815,060) | | | 437,448,566 | |
| | | | | | | | | | |
| U.S. GOVERNMENT BONDS AND NOTES ‐ 5.18% | | | | |
| | 5,600,000 | | U.S. Treasury Bonds | 2.13% | 05/15/2025 | | | 5,859,219 | |
| | 4,540,000 | | U.S. Treasury Bonds | 2.75% | 11/15/2042 | | | 4,958,175 | |
| | 5,650,000 | | U.S. Treasury Bonds | 3.00% | 11/15/2044 | | | 6,464,176 | |
| | 16,205,341 | | U.S. Treasury Inflation Indexed Bonds | 0.13% | 07/15/2026 | | | 16,415,557 | |
| | 4,062,960 | | U.S. Treasury Inflation Indexed Bonds | 1.00% | 02/15/2046 | | | 4,520,587 | |
| | 8,000,000 | | U.S. Treasury Notes | 0.50% | 11/30/2016 | | | 8,004,112 | |
| | 7,980,000 | | U.S. Treasury Notes | 0.50% | 01/31/2017 | | | 7,985,059 | |
| | 12,930,000 | | U.S. Treasury Notes | 0.75% | 10/31/2017 | | | 12,939,348 | |
| | 1,270,000 | | U.S. Treasury Notes | 1.00% | 05/15/2018 | | | 1,275,184 | |
| | 310,000 | | U.S. Treasury Notes | 1.00% | 11/30/2019 | | | 310,624 | |
| | 13,960,000 | | U.S. Treasury Notes | 2.00% | 11/30/2020 | | | 14,473,142 | |
| | 10,620,000 | | U.S. Treasury Notes | 2.25% | 03/31/2021 | | | 11,135,442 | |
| | 540,000 | | U.S. Treasury Notes | 1.88% | 11/30/2021 | | | 557,824 | |
| | 4,990,000 | | U.S. Treasury Notes | 1.75% | 03/31/2022 | | | 5,120,209 | |
| | 5,870,000 | | U.S. Treasury Notes | 1.50% | 03/31/2023 | | | 5,914,712 | |
| | 370,000 | | U.S. Treasury Notes | 2.38% | 08/15/2024 | | | 394,433 | |
| | | | | | | | | | |
| TOTAL U.S. GOVERNMENT BONDS AND NOTES (Cost $104,322,970) | | | 106,327,803 | |
| | | | | | |
| MUNICIPAL BONDS ‐ 1.11% | | | | |
| | 33,700,000 | | Commonwealth of Puerto Rico, Series A Revenue Bonds(g) | 8.00% | 07/01/2035 | | | 22,115,625 | |
| | 310,000 | | New York State Dormitory Authority, Series A Revenue Bonds | 5.00% | 03/15/2033 | | | 376,024 | |
| | 300,000 | | State of California, Revenue Bonds | 5.00% | 08/01/2033 | | | 365,847 | |
| | | | | | | | | | |
| TOTAL MUNICIPAL BONDS (Cost $26,810,856) | | | 22,857,496 | |
See Notes to Financial Statements.
| Annual Report | September 30, 2016 | 61 |
| RiverNorth/DoubleLine Strategic Income Fund | Schedule of Investments |
| Principal Amount/Description | Rate | Maturity | | Value | |
| U.S. GOVERNMENT / AGENCY MORTGAGE BACKED SECURITIES - 11.49% | | | | | |
| | | | Fannie Mae-Aces | | | | | | |
| $ | 413,000 | | Series 2016-M3 | 2.70% | 02/25/2026 | | $ | 433,992 | |
| | | | Federal Home Loan Mortgage Corp. | | | | | | |
| | | | Multifamily Structured Pass Through Certificates | | | | | | |
| | 311,000 | | Series 2015-K050(f) | 3.33% | 08/25/2025 | | | 343,421 | |
| | 412,000 | | Series 2016-K053 | 3.00% | 12/25/2025 | | | 442,403 | |
| | | | Federal Home Loan Mortgage Corp. Pool | | | | | | |
| | 508,185 | | Series Pool #G01840 | 5.00% | 07/01/2035 | | | 569,208 | |
| | 196,933 | | Series Pool #G04817 | 5.00% | 09/01/2038 | | | 218,174 | |
| | | | Federal Home Loan Mortgage Corp. REMICS | | | | | | |
| | 2,291,464 | | Series 2003-2722(f) | 9.31% | 12/15/2033 | | | 2,568,893 | |
| | 459,052 | | Series 2005-R003 | 5.50% | 10/15/2035 | | | 528,315 | |
| | 2,976,064 | | Series 2006-3244(f) | 6.14% | 11/15/2036 | | | 598,547 | |
| | 138,505 | | Series 2007-3261(f) | 5.91% | 01/15/2037 | | | 26,470 | |
| | 585,678 | | Series 2007-3262(f) | 5.88% | 01/15/2037 | | | 81,633 | |
| | 1,444,147 | | Series 2007-3301(f) | 5.58% | 04/15/2037 | | | 231,096 | |
| | 2,228,348 | | Series 2007-3303(f) | 5.56% | 04/15/2037 | | | 411,970 | |
| | 1,181,700 | | Series 2007-3303(f) | 5.58% | 04/15/2037 | | | 233,306 | |
| | 714,781 | | Series 2007-3382(f) | 5.48% | 11/15/2037 | | | 95,029 | |
| | 974,414 | | Series 2007-3384(f) | 5.79% | 08/15/2036 | | | 144,135 | |
| | 813,608 | | Series 2007-3384(f) | 5.87% | 11/15/2037 | | | 97,298 | |
| | 766,921 | | Series 2008-3417(f) | 5.66% | 02/15/2038 | | | 102,849 | |
| | 5,806,050 | | Series 2008-3419(f) | 5.91% | 02/15/2038 | | | 1,165,737 | |
| | 800,579 | | Series 2008-3423(f) | 5.13% | 03/15/2038 | | | 98,501 | |
| | 17,069,780 | | Series 2008-3423(f) | 0.35% | 03/15/2038 | | | 129,718 | |
| | 11,100,083 | | Series 2008-3435(f) | 5.46% | 04/15/2038 | | | 1,875,805 | |
| | 2,852,795 | | Series 2009-3510(f) | 6.23% | 02/15/2037 | | | 566,609 | |
| | 817,058 | | Series 2009-3523(f) | 5.48% | 04/15/2039 | | | 122,409 | |
| | 156,470 | | Series 2009-3524 | 3.98% | 06/15/2038 | | | 157,721 | |
| | 63,276 | | Series 2009-3549(f) | 5.28% | 07/15/2039 | | | 8,133 | |
| | 1,957,093 | | Series 2009-3560(f) | 5.88% | 11/15/2036 | | | 324,611 | |
| | 570,901 | | Series 2010-3630(f) | 1.93% | 03/15/2017 | | | 3,611 | |
| | 723,703 | | Series 2010-3641 | 4.50% | 03/15/2040 | | | 793,663 | |
| | 961,921 | | Series 2010-3726(f) | 5.53% | 09/15/2040 | | | 157,706 | |
| | 5,950,054 | | Series 2010-3728(f) | 3.93% | 09/15/2040 | | | 635,128 | |
| | 16,029 | | Series 2010-3766(f) | 8.95% | 11/15/2040 | | | 16,092 | |
| | 250,000 | | Series 2010-3779 | 4.00% | 12/15/2030 | | | 270,492 | |
| | 750,000 | | Series 2010-3779 | 3.50% | 12/15/2030 | | | 818,021 | |
| | 519,366 | | Series 2010-3779 | 4.50% | 12/15/2040 | | | 579,487 | |
| | 96,928 | | Series 2011-3786(f) | 8.45% | 01/15/2041 | | | 108,889 | |
| | 1,253,939 | | Series 2011-3795 | 4.00% | 01/15/2041 | | | 1,387,049 | |
See Notes to Financial Statements.
| 62 | (888) 848-7569 | www.rivernorth.com |
| RiverNorth/DoubleLine Strategic Income Fund | Schedule of Investments |
September 30, 2016
| Principal Amount/Description | Rate | Maturity | | Value | |
| $ | 106,090 | | Series 2011-3798(f) | 8.45% | 11/15/2040 | | $ | 112,718 | |
| | 600,000 | | Series 2011-3808 | 3.50% | 02/15/2031 | | | 636,544 | |
| | 47,894 | | Series 2011-3809(f) | 8.45% | 02/15/2041 | | | 52,302 | |
| | 1,807,256 | | Series 2011-3815(f) | 5.33% | 02/15/2041 | | | 276,888 | |
| | 500,000 | | Series 2011-3824 | 3.50% | 03/15/2031 | | | 541,636 | |
| | 934,698 | | Series 2011-3824(f) | 6.58% | 08/15/2036 | | | 189,747 | |
| | 76,834 | | Series 2011-3857(f) | 8.21% | 05/15/2041 | | | 77,006 | |
| | 1,156,653 | | Series 2011-3863 | 5.50% | 08/15/2034 | | | 1,288,441 | |
| | 715,420 | | Series 2011-3864(f) | 8.15% | 05/15/2041 | | | 826,664 | |
| | 1,256,972 | | Series 2011-3871 | 5.50% | 06/15/2041 | | | 1,460,896 | |
| | 1,304,848 | | Series 2011-3872(f) | 5.43% | 06/15/2041 | | | 185,162 | |
| | 2,212,470 | | Series 2011-3888 | 4.00% | 07/15/2041 | | | 2,397,255 | |
| | 3,531,365 | | Series 2011-3894 | 4.50% | 07/15/2041 | | | 3,724,496 | |
| | 2,577,412 | | Series 2011-3910 | 5.00% | 08/15/2041 | | | 3,198,142 | |
| | 5,286,610 | | Series 2011-3924(f) | 5.48% | 09/15/2041 | | | 1,024,433 | |
| | 2,267,455 | | Series 2011-3924(f) | 5.48% | 09/15/2041 | | | 411,861 | |
| | 2,039,137 | | Series 2011-3925 | 3.00% | 09/15/2021 | | | 94,518 | |
| | 7,969,294 | | Series 2012-3(f) | 5.42% | 02/25/2042 | | | 1,288,185 | |
| | 3,554,909 | | Series 2012-4057 | 4.00% | 06/15/2042 | | | 4,024,932 | |
| | 9,718,102 | | Series 2013-4196(f) | 4.77% | 03/15/2043 | | | 9,800,932 | |
| | 9,760,953 | | Series 2013-4218 | 2.50% | 02/15/2043 | | | 9,202,462 | |
| | 8,478,181 | | Series 2013-4239(h) | 0.00% | 07/15/2043 | | | 6,897,519 | |
| | 6,119,800 | | Series 2014-4302(f) | 5.63% | 02/15/2044 | | | 1,222,348 | |
| | 4,264,682 | | Series 2014-4413 | 3.50% | 11/15/2044 | | | 4,520,281 | |
| | 11,973,441 | | Series 2015-4427(f) | 5.08% | 07/15/2044 | | | 1,817,398 | |
| | 3,145,752 | | Series 2015-4434 | 3.00% | 02/15/2045 | | | 3,116,380 | |
| | 3,121,003 | | Series 2015-4440 | 2.50% | 02/15/2045 | | | 2,992,119 | |
| | | | Federal National Mortgage Association Pool | | | | | | |
| | 141,724 | | Series Pool #555743 | 5.00% | 09/01/2033 | | | 159,297 | |
| | 173,394 | | Series Pool #735382 | 5.00% | 04/01/2035 | | | 193,918 | |
| | 435,510 | | Series Pool #735383 | 5.00% | 04/01/2035 | | | 487,376 | |
| | 313,942 | | Series Pool #735484 | 5.00% | 05/01/2035 | | | 350,576 | |
| | 125,435 | | Series Pool #AH4437 | 4.00% | 01/01/2041 | | | 131,982 | |
| | 4,444,050 | | Series Pool #AS4645 | 3.00% | 03/01/2045 | | | 4,625,967 | |
| | 4,936,913 | | Series Pool #AS7661 | 3.00% | 08/01/2046 | | | 5,068,121 | |
| | 554,913 | | Series Pool #MA0264 | 4.50% | 12/01/2029 | | | 609,190 | |
| | 7,274,881 | | Series Pool #MA2737 | 3.00% | 09/01/2046 | | | 7,572,679 | |
| | 1,349,982 | | Series Pool #MA3894 | 4.00% | 09/01/2031 | | | 1,462,624 | |
| | | | Federal National Mortgage Association REMICS | | | | | | |
| | 180,170 | | Series 2004-46(f) | 5.47% | 03/25/2034 | | | 25,539 | |
| | 344,613 | | Series 2005-104(f) | 6.17% | 12/25/2033 | | | 8,037 | |
| | 508,939 | | Series 2006-101(f) | 6.05% | 10/25/2036 | | | 102,440 | |
See Notes to Financial Statements.
| Annual Report | September 30, 2016 | 63 |
| RiverNorth/DoubleLine Strategic Income Fund | Schedule of Investments |
September 30, 2016
| Principal Amount/Description | Rate | Maturity | | Value | |
| $ | 1,516,301 | | Series 2006-123(f) | 5.79% | 01/25/2037 | | $ | 304,361 | |
| | 7,271,662 | | Series 2006-92(f) | 6.05% | 10/25/2036 | | | 1,572,463 | |
| | 228,566 | | Series 2007-102(f) | 5.87% | 11/25/2037 | | | 39,407 | |
| | 284,269 | | Series 2007-108(f) | 5.83% | 12/25/2037 | | | 43,626 | |
| | 61,567 | | Series 2007-30(f) | 5.58% | 04/25/2037 | | | 8,482 | |
| | 770,831 | | Series 2007-38(f) | 5.55% | 05/25/2037 | | | 104,525 | |
| | 55,342 | | Series 2007-51(f) | 5.57% | 06/25/2037 | | | 7,607 | |
| | 140,043 | | Series 2007-53(f) | 5.57% | 06/25/2037 | | | 18,421 | |
| | 1,088,802 | | Series 2007-57(f) | 6.09% | 10/25/2036 | | | 201,730 | |
| | 744,363 | | Series 2007-68(f) | 6.12% | 07/25/2037 | | | 117,787 | |
| | 1,339,431 | | Series 2008-3(f) | 5.93% | 02/25/2038 | | | 263,220 | |
| | 685,300 | | Series 2008-56(f) | 5.53% | 07/25/2038 | | | 103,295 | |
| | 265,585 | | Series 2008-81 | 5.50% | 09/25/2038 | | | 291,692 | |
| | 792,208 | | Series 2009-111 | 5.00% | 01/25/2040 | | | 838,109 | |
| | 729,107 | | Series 2009-111(f) | 5.72% | 01/25/2040 | | | 91,910 | |
| | 2,024,992 | | Series 2009-12(f) | 6.07% | 03/25/2036 | | | 449,636 | |
| | 107,496 | | Series 2009-28(f) | 5.47% | 04/25/2037 | | | 14,689 | |
| | 805,567 | | Series 2009-41 | 4.50% | 06/25/2039 | | | 861,252 | |
| | 355,197 | | Series 2009-42(f) | 5.47% | 06/25/2039 | | | 53,885 | |
| | 977,762 | | Series 2009-47(f) | 5.57% | 07/25/2039 | | | 121,920 | |
| | 558,279 | | Series 2009-62(f) | 5.57% | 08/25/2039 | | | 66,572 | |
| | 208,366 | | Series 2009-66(f) | 5.27% | 02/25/2038 | | | 30,309 | |
| | 155,050 | | Series 2009-68(f) | 4.72% | 09/25/2039 | | | 18,500 | |
| | 18,497 | | Series 2010-109(f) | 49.24% | 10/25/2040 | | | 84,785 | |
| | 1,294,479 | | Series 2010-11(f) | 4.27% | 02/25/2040 | | | 140,119 | |
| | 177,019 | | Series 2010-111(f) | 5.47% | 10/25/2040 | | | 26,083 | |
| | 250,475 | | Series 2010-112 | 4.00% | 10/25/2040 | | | 262,204 | |
| | 603,190 | | Series 2010-115(f) | 6.07% | 11/25/2039 | | | 95,804 | |
| | 3,547,014 | | Series 2010-115(f) | 5.47% | 10/25/2040 | | | 782,947 | |
| | 8,486,621 | | Series 2010-123(f) | 5.52% | 11/25/2040 | | | 1,705,261 | |
| | 1,563,856 | | Series 2010-15(f) | 4.42% | 03/25/2040 | | | 172,003 | |
| | 258,066 | | Series 2010-34(f) | 4.40% | 04/25/2040 | | | 23,029 | |
| | 140,081 | | Series 2010-4(f) | 5.70% | 02/25/2040 | | | 24,607 | |
| | 224,182 | | Series 2010-58(f) | 11.12% | 06/25/2040 | | | 265,198 | |
| | 2,989,791 | | Series 2010-75 | 4.50% | 07/25/2040 | | | 3,360,695 | |
| | 190,807 | | Series 2010-9(f) | 4.77% | 02/25/2040 | | | 24,170 | |
| | 1,164,443 | | Series 2010-9(f) | 4.22% | 02/25/2040 | | | 102,646 | |
| | 60,531 | | Series 2010-90(f) | 5.47% | 08/25/2040 | | | 7,606 | |
| | 500,000 | | Series 2011-16 | 3.50% | 03/25/2031 | | | 539,992 | |
| | 3,134,847 | | Series 2011-2 | 4.00% | 02/25/2041 | | | 3,321,900 | |
| | 1,000,000 | | Series 2011-25 | 3.00% | 04/25/2026 | | | 1,054,418 | |
| | 500,000 | | Series 2011-29 | 3.50% | 04/25/2031 | | | 536,663 | |
| | 666,176 | | Series 2011-48(f) | 8.15% | 06/25/2041 | | | 694,151 | |
See Notes to Financial Statements.
| 64 | (888) 848-7569 | www.rivernorth.com |
| RiverNorth/DoubleLine Strategic Income Fund | Schedule of Investments |
September 30, 2016
| Principal Amount/Description | Rate | Maturity | | Value | |
| $ | 1,253,824 | | Series 2011-5(f) | 5.87% | 11/25/2040 | | $ | 141,503 | |
| | 20,443,514 | | Series 2011-51(f) | 5.47% | 06/25/2041 | | | 3,586,401 | |
| | 2,134,704 | | Series 2011-58(f) | 6.02% | 07/25/2041 | | | 425,184 | |
| | 7,389,204 | | Series 2012-106(f) | 5.63% | 10/25/2042 | | | 1,502,703 | |
| | 1,391,159 | | Series 2012-124(f) | 6.87% | 11/25/2042 | | | 1,469,576 | |
| | 9,795,601 | | Series 2012-128(f) | 5.21% | 11/25/2042 | | | 9,476,662 | |
| | 47,368 | | Series 2012-140(f) | 6.96% | 12/25/2042 | | | 47,363 | |
| | 9,389,807 | | Series 2012-20 | 3.50% | 03/25/2042 | | | 10,155,818 | |
| | 1,129,605 | | Series 2012-29(f) | 5.47% | 04/25/2042 | | | 154,602 | |
| | 1,719,389 | | Series 2012-32 | 5.00% | 04/25/2042 | | | 303,857 | |
| | 6,857,465 | | Series 2012-65(f) | 5.45% | 06/25/2042 | | | 1,299,698 | |
| | 5,065,109 | | Series 2012-92 | 3.50% | 08/25/2042 | | | 5,538,475 | |
| | 5,237,632 | | Series 2013-19(f) | 4.77% | 03/25/2043 | | | 5,267,371 | |
| | 9,646,208 | | Series 2013-51(f) | 4.77% | 04/25/2043 | | | 9,259,449 | |
| | 15,125,651 | | Series 2014-50(f) | 5.67% | 08/25/2044 | | | 2,486,096 | |
| | 8,393,655 | | Series 2014-73(f) | 5.67% | 11/25/2044 | | | 1,306,535 | |
| | 4,059,004 | | Series 2015-59 | 3.00% | 06/25/2041 | | | 4,159,724 | |
| | 9,336,549 | | Series 2015-79 | 3.00% | 11/25/2045 | | | 9,514,004 | |
| | 3,579,831 | | Series 2015-9 | 3.00% | 01/25/2045 | | | 3,755,525 | |
| | | | Freddie Mac Gold Pool | | | | | | |
| | 5,982,809 | | Series Pool #GO8721 | 3.00% | 09/01/2046 | | | 6,225,867 | |
| | | | Government National Mortgage Association | | | | | | |
| | 108,116 | | Series 2004-83(f) | 5.55% | 10/20/2034 | | | 18,413 | |
| | 98,545 | | Series 2008-6(f) | 5.93% | 02/20/2038 | | | 16,890 | |
| | 95,305 | | Series 2008-67(f) | 5.47% | 08/20/2038 | | | 14,503 | |
| | 1,479,942 | | Series 2008-69(f) | 7.10% | 08/20/2038 | | | 300,309 | |
| | 110,296 | | Series 2009-10(f) | 6.12% | 02/16/2039 | | | 23,484 | |
| | 2,011,943 | | Series 2009-35 | 4.50% | 05/20/2039 | | | 2,198,518 | |
| | 7,493,526 | | Series 2009-58(f) | 5.72% | 06/20/2039 | | | 1,149,143 | |
| | 105,058 | | Series 2009-6(f) | 5.42% | 02/20/2038 | | | 18,729 | |
| | 3,941,483 | | Series 2009-75 | 5.00% | 09/20/2039 | | | 4,333,470 | |
| | 9,248,504 | | Series 2010-121(f) | 5.47% | 09/20/2040 | | | 1,526,200 | |
| | 5,879,652 | | Series 2010-26(f) | 5.72% | 02/20/2040 | | | 1,007,245 | |
| | 13,675,538 | | Series 2010-35(f) | 5.15% | 03/20/2040 | | | 1,988,937 | |
| | 161,899 | | Series 2010-61(f) | 6.02% | 09/20/2039 | | | 22,920 | |
| | 514,985 | | Series 2010-98(f) | 5.83% | 03/20/2039 | | | 50,610 | |
| | 2,805,603 | | Series 2011-45 | 4.50% | 03/20/2041 | | | 3,015,275 | |
| | 1,480,655 | | Series 2011-69(h) | 0.00% | 05/20/2041 | | | 1,397,253 | |
| | 2,541,357 | | Series 2011-71 | 4.50% | 02/20/2041 | | | 2,787,932 | |
| | 2,583,226 | | Series 2011-71(f) | 4.87% | 05/20/2041 | | | 350,894 | |
| | 772,322 | | Series 2011-72(f) | 5.62% | 05/20/2041 | | | 118,902 | |
| | 4,061,167 | | Series 2011-89(f) | 4.92% | 06/20/2041 | | | 523,566 | |
| | 1,280,793 | | Series 2012-105(f) | 5.67% | 01/20/2041 | | | 101,411 | |
See Notes to Financial Statements.
| Annual Report | September 30, 2016 | 65 |
| RiverNorth/DoubleLine Strategic Income Fund | Schedule of Investments |
September 30, 2016
| Principal Amount/Description | Rate | Maturity | | Value | |
| $ | 11,180,588 | | Series 2013-102(f) | 5.62% | 03/20/2043 | | $ | 1,589,236 | |
| | 12,383,159 | | Series 2013-113(f) | 5.72% | 03/20/2043 | | | 1,664,950 | |
| | 14,850,153 | | Series 2013-122(f) | 5.57% | 08/16/2043 | | | 2,584,932 | |
| | 8,002,513 | | Series 2013-148(f) | 5.15% | 10/16/2043 | | | 1,381,551 | |
| | 16,646,375 | | Series 2013-186(f) | 5.72% | 02/16/2043 | | | 2,238,659 | |
| | 10,497,383 | | Series 2014-156(f) | 5.72% | 10/20/2044 | | | 1,596,827 | |
| | 19,472,490 | | Series 2014-3(f) | 5.57% | 01/20/2044 | | | 3,121,876 | |
| | 21,406,131 | | Series 2014-4(f) | 5.57% | 01/16/2044 | | | 3,059,328 | |
| | 15,050,147 | | Series 2014-5(f) | 5.62% | 07/20/2043 | | | 2,077,971 | |
| | 11,058,545 | | Series 2014-95(f) | 5.72% | 06/16/2044 | | | 2,231,499 | |
| | | | | | | |
| TOTAL U.S. GOVERNMENT / AGENCY MORTGAGE BACKED SECURITIES (Cost $269,044,602) | | | | 235,960,657 | |
| Shares/Description | | Value | |
| SHORT-TERM INVESTMENTS - 25.25% | | | | |
| Money Market Fund | | | | |
| | 518,569,809 | | State Street Institutional Trust (7 Day Yield 0.19%) | | | 518,569,809 | |
| | | | | | | | |
| TOTAL SHORT-TERM INVESTMENTS (Cost $518,569,809) | | | 518,569,809 | |
| | | | | | | | |
TOTAL INVESTMENTS - 99.16% (Cost $2,069,060,456) | | | 2,036,661,787 | |
| CASH SEGREGATED AT CUSTODIAN FOR TOTAL RETURN SWAP CONTRACTS - 0.02% | | | 400,000 | |
| OTHER ASSETS IN EXCESS OF LIABILITIES - 0.82% | | | 16,765,117 | |
| NET ASSETS - 100.00% | | $ | 2,053,826,904 | |
(a) | Non-income producing security. |
(b) | Affiliated company. See Note 9 to Notes to Financial Statements. |
(c) | Security exempt from registration under Rule 144A of the Securities Act of 1933. These securities have been deemed liquid under procedures approved by the Fund's Board of Trustees and may normally be sold to qualified institutional buyers in transactions exempt from registration. Total fair value of Rule 144A securities amounts to $137,482,534, which represents approximately 6.69% of net assets as of September 30, 2016. |
See Notes to Financial Statements.
| 66 | (888) 848-7569 | www.rivernorth.com |
| RiverNorth/DoubleLine Strategic Income Fund | Schedule of Investments |
September 30, 2016
(d) | Securities were purchased pursuant to Regulation S under the Securities Act of 1933, which exempts securities offered and sold outside of the United States from registration. Such securities cannot be sold in the United States without either an effective registration statement filed pursuant to the Securities Act of 1933, or pursuant to an exemption from registration. These securities have been deemed liquid under procedures approved by the Fund's Board of Trustees. As of September 30, 2016, the aggregate fair value of those securities was $18,945,341, representing 0.92% of net assets. |
(e) | Security has no contractual maturity date, is not redeemable and contractually pays an indefinite stream of interest. |
(f) | Floating or variable rate security. Interest rate disclosed is that which is in effect at September 30, 2016. |
(g) | Security is currently in default. |
(h) | Issued with a zero coupon. Income is recognized through the accretion of discount. |
(j) | Step bond. Coupon changes periodically based upon a predetermined schedule. Interest rate disclosed is that which is in effect at September 30, 2016. |
(k) | Security does not have a market value or rate. Security is not entitled to distributions in respect of principal or interest other than excess interest paid with respect to the mortgage loans. |
See Notes to Financial Statements.
| Annual Report | September 30, 2016 | 67 |
| RiverNorth/DoubleLine Strategic Income Fund | Schedule of Investments |
September 30, 2016
TOTAL RETURN SWAP CONTRACTS*
| Counterparty | Reference Asset | Termination Date | Rate paid by the Fund | | Notional Amount | | Upfront Premiums Paid | | Unrealized Appreciation | |
| Goldman Sachs | Fifth Street Finance Corp., Common Shares | 10/27/2016 | 1.18% | | $ | 2,041,240 | | $ | 2,041,240 | | $ | 95,626 | |
| Goldman Sachs | Fifth Street Finance Corp., Common Shares | 10/28/2016 | 1.18% | | | 2,074,341 | | | 2,074,341 | | | 62,524 | |
| Goldman Sachs | Fifth Street Finance Corp., Common Shares | 10/31/2016 | 1.18% | | | 2,085,375 | | | 2,085,375 | | | 51,491 | |
| Goldman Sachs | Fifth Street Finance Corp., Common Shares | 1/20/2017 | 1.18% | | | 4,062,145 | | | 4,062,145 | | | 747,919 | |
| Goldman Sachs | Fifth Street Finance Corp., Common Shares | 1/24/2017 | 1.18% | | | 934,448 | | | 934,448 | | | 129,235 | |
| Goldman Sachs | Fifth Street Finance Corp., Common Shares | 1/25/2017 | 1.18% | | | 1,395,996 | | | 1,395,996 | | | 278,185 | |
| | | | | | | | | | | | $ | 1,364,980 | |
| * | See Note 4 in the Notes to Financial Statements. |
See Notes to Financial Statements.
| 68 | (888) 848-7569 | www.rivernorth.com |
| RiverNorth Equity Opportunity Fund | Schedule of Investments |
September 30, 2016
| Shares/Description | | Value | |
| CLOSED-END FUNDS - 89.64% | |
28,289 | | Adams Diversified Equity Fund, Inc. | | $ | 372,000 | |
88,948 | | Alpine Global Dynamic Dividend Fund | | | 773,848 | |
25,759 | | Alpine Total Dynamic Dividend Fund | | | 196,541 | |
95,841 | | Boulder Growth & Income Fund, Inc. | | | 803,148 | |
22,612 | | Brookfield Global Listed Infrastructure Income Fund, Inc. | | | 310,237 | |
66,345 | | Calamos Global Dynamic Income Fund | | | 498,251 | |
20,596 | | Clough Global Allocation Fund | | | 249,829 | |
88,005 | | Clough Global Equity Fund | | | 1,001,497 | |
27,800 | | Clough Global Opportunities Fund | | | 268,826 | |
200 | | Cornerstone Total Return Fund, Inc. | | | 2,906 | |
15,937 | | General American Investors Co., Inc. | | | 520,343 | |
202,018 | | Liberty All Star® Equity Fund | | | 1,046,453 | |
39,577 | | LMP Capital and Income Fund, Inc. | | | 539,434 | |
18,601 | | Madison Covered Call & Equity Strategy Fund | | | 144,716 | |
21,808 | | Neuberger Berman Real Estate Securities Income Fund, Inc. | | | 124,088 | |
94,974 | | Nuveen Global Equity Income Fund | | | 1,133,990 | |
28,750 | | Royce Micro-Cap Trust, Inc. | | | 224,537 | |
70,658 | | Royce Value Trust, Inc. | | | 894,530 | |
96,071 | | Sprott Focus Trust, Inc. | | | 662,890 | |
33,117 | | The Gabelli Global Small and Mid Cap Value Trust(a) | | | 357,995 | |
132,669 | | Virtus Total Return Fund | | | 628,851 | |
112,366 | | Zweig Fund, Inc. | | | 1,455,140 | |
13,236 | | Zweig Total Return Fund, Inc. | | | 159,361 | |
| | | | | | | |
| TOTAL CLOSED-END FUNDS (Cost $12,284,093) | | | 12,369,411 | |
| | | | | | | |
| EXCHANGE-TRADED FUNDS - 5.45% | |
7,117 | | iShares® Russell 1000® Value ETF | | | 751,698 | |
| | | | | | | |
| TOTAL EXCHANGE-TRADED FUNDS (Cost $688,978) | | | 751,698 | |
| | | | | | | |
RIGHTS - 0.00%(b) | |
200 | | Cornerstone Total Return Fund, Expires 10/22/2016 | | | 0 | |
| | | | | | | |
| TOTAL RIGHTS (Cost $0) | | | 0 | |
See Notes to Financial Statements.
Annual Report | September 30, 2016 | 69 |
| RiverNorth Equity Opportunity Fund | Schedule of Investments |
September 30, 2016
| Shares/Description | | Value | |
| SHORT-TERM INVESTMENTS - 5.00% | |
| Money Market Fund | | | |
689,802 | | State Street Institutional Trust (7 Day Yield 0.19%) | | $ | 689,802 | |
| | | | | | | |
| TOTAL SHORT-TERM INVESTMENTS (Cost $689,802) | | | 689,802 | |
| | | | | | | |
TOTAL INVESTMENTS - 100.09% (Cost $13,662,873) | | | 13,810,911 | |
| LIABILITIES IN EXCESS OF OTHER ASSETS - (0.09)% | | | (12,057 | ) |
| NET ASSETS - 100.00% | | $ | 13,798,854 | |
| (a) | Non-income producing security. |
See Notes to Financial Statements.
70 | (888) 848-7569 | www.rivernorth.com |
| RiverNorth/Oaktree High Income Fund | Schedule of Investments |
September 30, 2016
| Shares/Description | | Value | |
| BUSINESS DEVELOPMENT COMPANIES - 0.74% | |
224,439 | | Full Circle Capital Corp. | | $ | 592,519 | |
| | | | | | | |
| TOTAL BUSINESS DEVELOPMENT COMPANIES (Cost $574,264) | | | 592,519 | |
| | | | | | | |
| CLOSED-END FUNDS - 20.60% | |
15,405 | | Advent Claymore Convertible Securities and Income Fund | | | 224,605 | |
42,167 | | Apollo Tactical Income Fund, Inc. | | | 651,902 | |
102,126 | | Ares Dynamic Credit Allocation Fund, Inc. | | | 1,516,571 | |
482,174 | | BlackRock Debt Strategies Fund, Inc. | | | 1,759,935 | |
84,617 | | BlackRock Multi-Sector Income Trust | | | 1,444,412 | |
37,276 | | Blackstone/GSO Long-Short Credit Income Fund | | | 579,269 | |
89,809 | | Brookfield Mortgage Opportunity Income Fund, Inc. | | | 1,347,135 | |
38,415 | | Deutsche High Income Opportunities Fund, Inc. | | | 543,572 | |
9,200 | | Deutsche High Income Trust | | | 84,732 | |
23,869 | | Deutsche Multi-Market Income Trust | | | 204,080 | |
13,355 | | First Trust High Income Long/Short Fund | | | 208,205 | |
51,370 | | First Trust Strategic High Income Fund II | | | 633,906 | |
42,981 | | Franklin Limited Duration Income Trust | | | 519,640 | |
15,158 | | Invesco High Income Trust II | | | 221,610 | |
52,067 | | Invesco Senior Income Trust | | | 225,450 | |
42,438 | | Legg Mason BW Global Income Opportunities Fund, Inc. | | | 576,308 | |
46,526 | | Neuberger Berman High Yield Strategies Fund, Inc. | | | 551,798 | |
7,674 | | NexPoint Credit Strategies Fund | | | 170,593 | |
189,803 | | Nuveen Credit Strategies Income Fund | | | 1,609,530 | |
23,565 | | Nuveen Senior Income Fund | | | 154,115 | |
124,079 | | Pacholder High Yield Fund, Inc. | | | 884,683 | |
27,384 | | Prudential Global Short Duration High Yield Fund, Inc. | | | 413,772 | |
66,444 | | Putnam High Income Securities Fund | | | 532,881 | |
300,941 | | Western Asset High Income Opportunity Fund, Inc. | | | 1,519,752 | |
5,143 | | Western Asset Worldwide Income Fund, Inc. | | | 59,710 | |
| | | | | | | |
| TOTAL CLOSED-END FUNDS (Cost $17,231,366) | | | 16,638,166 | |
| | | | | | | |
COMMON STOCKS - 0.00%(a) | |
3,604 | | New Millennium Holding Co. - Private Equity(b)(c) | | | 2,658 | |
| | | | | | | |
| TOTAL COMMON STOCKS (Cost $47,570) | | | 2,658 | |
See Notes to Financial Statements.
Annual Report | September 30, 2016 | 71 |
| RiverNorth/Oaktree High Income Fund | Schedule of Investments |
September 30, 2016| Principal Amount/Description | Rate | Maturity | | Value | |
| BANK LOANS - 37.05% | |
| Austria - 0.06% | |
| $ | 50,000 | | Constantia Flex First Lien, Term B3 Loan(d) | L+3.00% | 04/29/2022 | | $ | 50,312 | |
| | | | | | | | |
| Belgium - 0.27% | |
| | 195,000 | | Telenet International Finance SA, Y Facility Term Loan | 3.50% | 06/30/2023 | | | 220,458 | |
| | | | | | | | |
| Bermuda - 0.73% | |
| | 97,750 | | Belmond Interfin Ltd., Euro Term Loan | 4.00% | 03/19/2021 | | | 110,906 | |
| | 500,000 | | Intelsat Jackson Holdings SA, Tranche B-2 Term Loan | 3.75% | 06/30/2019 | | | 476,760 | |
| | | | | | | 587,666 | |
| Canada - 0.46% | |
| | 75,000 | | Air Canada First Lien, Term B Loan(d) | L+2.75% | 09/21/2023 | | | 75,262 | |
| | 294,931 | | Hudson's Bay Co., Initial Term Loan | 4.75% | 09/30/2022 | | | 296,223 | |
| | | | | | | 371,485 | |
| Cayman Islands - 0.40% | |
| | 317,118 | | Avago Technologies, Term B Loan | 3.52% | 02/01/2023 | | | 321,236 | |
| | | | | | | | |
| France - 2.03% | |
| | 362,263 | | Altice France SA (Numericable-SFR SA), Term B Loan | 4.56% | 07/29/2022 | | | 365,488 | |
| | 235,000 | | Financiere Mendel, Term B Loan | 4.25% | 06/30/2021 | | | 268,535 | |
| | 220,000 | | Financiere Verdi II S.A.S, Facility B Term Loan | 6.00% | 07/21/2023 | | | 250,535 | |
| | 144,380 | | Generale de Sante, First Lien Facility B1A Loan | 3.20% | 07/29/2020 | | | 163,419 | |
| | 228,376 | | SAM Bidco., Term B Loan | 4.25% | 12/17/2021 | | | 259,754 | |
| | 295,000 | | Verallia Packaging S.A.S., Facility B2 Term Loan | 4.50% | 10/29/2022 | | | 336,096 | |
| | | | | | | 1,643,827 | |
| Germany - 1.05% | |
| | 113,063 | | Orion Engineered Carbons GmbH (OEC Finance US LLC), Initial Euro Term Loan | 3.75% | 07/25/2021 | | | 129,034 | |
| | 404,875 | | Springer Science + Business Media GmbH, First Lien B Term Loan | 4.75% | 08/14/2020 | | | 456,011 | |
| | 230,000 | | Tele Columbus AG, Term Loan | 4.50% | 01/04/2021 | | | 260,567 | |
| | | | | | | 845,612 | |
| Great Britain - 1.64% | |
| | 250,000 | | Figaro Bidco Ltd., Facility Term B1 Loan | 5.02% | 03/08/2023 | | | 248,750 | |
| | 100,000 | | Frontier Bidco Ltd., Facility B Term Loan | 5.27% | 11/27/2020 | | | 129,465 | |
| | 404,873 | | Ineos Finance PLC, Euro Term Loan | 4.25% | 03/31/2022 | | | 459,426 | |
See Notes to Financial Statements.
| 72 | (888) 848-7569 | www.rivernorth.com |
| RiverNorth/Oaktree High Income Fund | Schedule of Investments |
September 30, 2016
| Principal Amount/Description | Rate | Maturity | | Value | |
| $ | 155,000 | | Onex Eagle Acquisition Company Ltd., Facility B Tranche 2 Term Loan | E+4.25% | 02/24/2022 | | $ | 172,813 | |
| | 240,000 | | United Biscuits Ltd., Term B1 Loan | 4.64% | 11/19/2021 | | | 313,077 | |
| | | | | | | 1,323,531 | |
| Greece - 0.41% | |
| | 170,000 | | Coherent Holding GmbH, Term B Loan(d) | E+3.50% | 08/01/2023 | | | 194,033 | |
| | 120,000 | | Springer Science, First Lien Term B10 Loan(d) | 4.75% | 06/15/2020 | | | 135,055 | |
| | | | | | | 329,088 | |
| Ireland - 0.14% | |
| | 100,000 | | Valeo Foods Group Ltd., Term B Loan | 4.00% | 05/06/2022 | | | 112,335 | |
| | | | | | | | |
| Italy - 0.39% | |
| | 283,044 | | Inter Media and Communications S.r.l., Term B Loan | 5.50% | 05/27/2019 | | | 317,162 | |
| | | | | | | | |
| Luxembourg - 2.22% | |
| | 285,659 | | Auris Luxembourg III S.A.R.L. (aka Siemens Audiology), Facility B4 Term Loan | 4.25% | 01/17/2022 | | | 287,801 | |
| | 200,000 | | Delta 2 (Lux) S.A.R.L., Facility B3 Term Loan | 4.75% | 07/30/2021 | | | 200,597 | |
| | 100,000 | | Delta 2 (Lux) S.A.R.L., Second Lien Facility Term Loan | 7.75% | 07/29/2022 | | | 100,525 | |
| | 220,000 | | Diaverum Holdings S.A.R.L., Facility C1 Term Loan | 4.00% | 04/01/2022 | | | 248,451 | |
| | 396,900 | | Evergreen Skills Lux S.A.R.L., First Lien Initial Term Loan | 5.75% | 04/28/2021 | | | 352,622 | |
| | 165,000 | | Evergreen Skills Lux S.A.R.L., Second Lien Initial Term Loan | 9.25% | 04/28/2022 | | | 100,238 | |
| | 120,402 | | Onex Wizard Acquisition Company II SCA, Initial Euro Term B Loan | E+3.75% | 03/13/2022 | | | 120,720 | |
| | 335,750 | | Onex Wizard Acquisition Company II SCA, Initial Euro Term Loan | 4.00% | 03/11/2022 | | | 379,650 | |
| | | | | | | 1,790,604 | |
| Netherlands - 1.45% | |
| | 283,418 | | Action Holding BV (fka Peer Holdings BV), Term B Loan | 4.50% | 02/25/2022 | | | 324,082 | |
| | 148,350 | | Jacobs Douwe Egberts International BV (fka Charger OpCo BV), Term B-1 Euro Term Loan | 4.25% | 07/02/2022 | | | 169,172 | |
See Notes to Financial Statements.
| Annual Report | September 30, 2016 | 73 |
| RiverNorth/Oaktree High Income Fund | Schedule of Investments |
September 30, 2016
| Principal Amount/Description | Rate | Maturity | | Value | |
| $ | 66,241 | | MacDermid Agricultural Solutions Holdings BV (Netherlands Agricultural Investment Partners LLC), Euro Tranche Term Loan | 5.50% | 06/07/2020 | | $ | 75,319 | |
| | 164,646 | | MacDermid Agricultural Solutions Holdings BV (Netherlands Agricultural Investment Partners LLC), Euro Tranche Term Loan | 5.50% | 06/07/2020 | | | 187,210 | |
| | 370,000 | | Mediq B.V. (fka Al Garden), Facility B3 Loan(d) | 5.50% | 02/28/2022 | | | 419,692 | |
| | | | | | | 1,175,475 | |
| Spain - 0.67% | |
| | 300,000 | | Ino Holdings Co. S.A.R.L., Facility B Term Loan(d) | 5.25% | 08/30/2023 | | | 337,005 | |
| | 91,639 | | Livister Investments, S.L.U., Facility B Term Loan | 4.20% | 06/28/2021 | | | 103,998 | |
| | 88,361 | | Livister Investments, S.L.U., Facility B Term Loan | 4.20% | 06/28/2021 | | | 100,278 | |
| | | | | | | 541,281 | |
| Sweden - 0.42% | |
| | 300,000 | | Verisure Midholding AB, Facility B1A Term Loan | 4.50% | 10/21/2022 | | | 342,291 | |
| | | | | | | | |
| United States - 24.71% | |
| | 278,497 | | Acadia Healthcare Co., Inc., Tranche B-2 Term Loan | 3.75% | 02/15/2023 | | | 280,848 | |
| | 571,305 | | Access CIG LLC, First Lien Term B Loan | 6.00% | 10/18/2021 | | | 570,877 | |
| | 390,063 | | Alliant Holdings Intermediate LLC, Initial Term Loan | 4.75% | 08/12/2022 | | | 390,648 | |
| | 105,000 | | American Builders & Contractors Supply Co., First Lien Term Loan | L+2.75% | 09/22/2023 | | | 105,446 | |
| | 552,288 | | American Rock Salt Co., First Lien Term B Loan | 4.75% | 05/20/2021 | | | 534,959 | |
| | 70,909 | | Arch Coal, Inc., Term Loan(e) | 5.00% | 01/31/2017 | | | 71,219 | |
| | 244,935 | | Arch Coal, Inc., Term Loan(e) | 7.50% | 05/16/2018 | | | 189,416 | |
| | 390,500 | | Asurion LLC, Incremental Tranche Term Loan | 5.00% | 08/04/2022 | | | 393,038 | |
| | 656,688 | | AVSC Holding Corp., Tranche 1 Incremental Term Loan | 4.50% | 01/25/2021 | | | 659,971 | |
| | 349,787 | | Berry Plastics Corp., Term H Loan | 3.75% | 10/01/2022 | | | 351,366 | |
| | 900 | | Caesars Entertainment Resort Properties LLC, Term B Loan | 7.00% | 10/11/2020 | | | 899 | |
| | 349,200 | | Caesars Entertainment Resort Properties LLC, Term B Loan | 7.00% | 10/11/2020 | | | 349,092 | |
See Notes to Financial Statements.
| 74 | (888) 848-7569 | www.rivernorth.com |
| RiverNorth/Oaktree High Income Fund | Schedule of Investments |
September 30, 2016
| Principal Amount/Description | Rate | Maturity | | Value | |
| $ | 40,000 | | Camelot Finance LP (aka Thomson Reuters Intellectual Property & Science), Initial Term Loan(d) | L+3.75% | 09/15/2023 | | $ | 40,110 | |
| | 196,002 | | Catalent Pharma Solutions, Inc. (fka Cardinal Health 409, Inc.), Euro Term Loan | 4.25% | 05/20/2021 | | | 222,105 | |
| | 226,433 | | Centage Learning Inc., Term Loan | 5.25% | 06/07/2023 | | | 226,635 | |
| | 554,400 | | Communications Sales & Leasing, Inc., Term Loan | 5.00% | 10/24/2022 | | | 558,004 | |
| | 219,450 | | Coty, Inc., Term B Loan | 3.50% | 10/27/2022 | | | 249,909 | |
| | 362,854 | | CPI Buyer LLC, First Lien Initial Term Loan | 5.50% | 08/16/2021 | | | 361,039 | |
| | 55,000 | | Donnelley Financial First Lien, Term B Loan(d) | L+4.00% | 09/23/2023 | | | 55,344 | |
| | 108,169 | | Element Material Technology Group US Holdings, Inc., Term B2 Loan | 5.75% | 03/22/2023 | | | 122,119 | |
| | 186,831 | | Element Materials Technology Group US Holdings, Inc., Term B2 Loan | 5.75% | 03/22/2023 | | | 210,926 | |
| | 178,978 | | Emmis Operating Co., Term Loan | 7.00% | 06/10/2021 | | | 169,134 | |
| | 439,875 | | Encompass Digital Media, Inc., First Lien Tranche B Term Loan | 5.50% | 06/06/2021 | | | 431,080 | |
| | 150,000 | | Encompass Digital Media, Inc., First Lien Tranche B Term Loan | 8.75% | 06/06/2022 | | | 136,500 | |
| | 199,500 | | Equinix, Inc., Sterling Term B Loan | 4.50% | 01/06/2023 | | | 261,168 | |
| | 243,108 | | Excelitas Technology Corp., Term B Loan | 6.00% | 11/02/2020 | | | 239,309 | |
| | 420,000 | | Fieldwood Energy LLC, Second Lien Term Loan | 8.38% | 09/30/2020 | | | 169,399 | |
| | 70,000 | | Fitness International LLC, Term B Loan(d) | L+5.00% | 07/01/2020 | | | 70,087 | |
| | 314,384 | | Getty Images, Inc., Initial Term Loan | 4.75% | 10/18/2019 | | | 263,822 | |
| | 80,000 | | GFL Environmental, Inc., Term B Loan(d) | L+2.75% | 09/27/2023 | | | 80,184 | |
| | 161,092 | | GOBP Holdings, Inc., First Lien Initial Term Loan | 5.00% | 10/21/2021 | | | 161,092 | |
| | 342,413 | | HD Supply, Inc., First Lien Initial Term Loan | 3.75% | 08/13/2021 | | | 343,625 | |
| | 342,413 | | HD Supply, Inc., Incremental Term Loan | 3.75% | 08/13/2021 | | | 343,625 | |
| | 224,250 | | Hi-Crush Partners LP, Advance Term Loan | 4.75% | 04/28/2021 | | | 205,540 | |
| | 292,050 | | Hostess Brands LLC, First Lien Term B Loan(f) | 4.50% | 08/03/2022 | | | 294,515 | |
| | 293,250 | | Hub International Ltd., Initial Term Loan | 4.00% | 10/02/2020 | | | 293,776 | |
| | 234,630 | | Hudson Products Holdings, Inc., Term Loan | 5.00% | 03/15/2019 | | | 217,033 | |
| | 184,326 | | IMC OP, LP, First Lien Initial Term Loan | 4.50% | 08/15/2020 | | | 185,709 | |
| | 543,125 | | Jaguar Holding Co. I (aka Pharmaceutical Product Development, Inc.), Initial Term Loan | 4.25% | 08/18/2022 | | | 545,746 | |
| | 724,525 | | JBS USA LLC, 2015 Incremental Term Loan | 4.00% | 10/30/2022 | | | 725,677 | |
See Notes to Financial Statements.
| Annual Report | September 30, 2016 | 75 |
| RiverNorth/Oaktree High Income Fund | Schedule of Investments |
September 30, 2016
| Principal Amount/Description | Rate | Maturity | | Value | |
| $ | 70,000 | | JDA Software Group, First Lien Term Loan(d) | L+3.50% | 09/21/2023 | | $ | 70,175 | |
| | 483,788 | | Keurig Green Mountain, Inc., Term B Euro Loan | 5.00% | 03/03/2023 | | | 553,449 | |
| | 380,188 | | Kleopatra Holdings 2 SCA, Initial Term Loan | 5.00% | 04/28/2020 | | | 384,702 | |
| | 90,000 | | Landry's Inc. (fka Lamdry's Restaurants, Inc.), Term B Loan(d) | L+3.25% | 10/04/2023 | | | 90,562 | |
| | 320,938 | | Life Time Fitness, Inc., Closing Date Term Loan | 4.25% | 06/10/2022 | | | 321,711 | |
| | 187,692 | | Manitowoc Foodservice, Inc., Term B Loan(f) | 5.75% | 03/03/2023 | | | 190,468 | |
| | 86,196 | | Media General, Inc., Term B Loan | 4.00% | 07/31/2020 | | | 86,347 | |
| | 190,660 | | Michaels Stores, Inc., Incremental Term Loan | L+2.75% | 01/28/2020 | | | 191,673 | |
| | 65,000 | | Monitronics International Inc., Term B-2 Loan(d) | L+5.50% | 09/30/2022 | | | 64,899 | |
| | 4,559 | | Multi Packaging Solutions Global Holdings Ltd., Sterling Term Loan | 5.50% | 09/30/2020 | | | 5,939 | |
| | 96,989 | | Multi Packaging Solutions Global Holdings Ltd., Sterling Term Loan | 5.50% | 09/30/2020 | | | 126,340 | |
| | 146,104 | | Navistar, Inc., Tranche B Term Loan | 6.50% | 08/07/2020 | | | 146,697 | |
| | 100,000 | | NBTY, Inc., Sterling Term B Loan | 6.25% | 05/05/2023 | | | 130,456 | |
| | 541,125 | | Neiman Marcus Group, Inc., Term Loan | 4.25% | 10/25/2020 | | | 499,526 | |
| | 122,763 | | New Millennium Holdco, Inc. (Millennium Health LLC), Closing Date Term Loan | 7.55% | 12/21/2020 | | | 61,075 | |
| | 370,000 | | Nexstar Broadcasting, First Lien Term B Loan(d) | L+3.00% | 09/22/2023 | | | 372,235 | |
| | 93,813 | | NM Z Merger Sub, Inc. (aka Zep, Inc.), Term Loan | 5.50% | 06/27/2022 | | | 94,282 | |
| | 94,763 | | NVA Holdings, Inc., First Lien Term B Loan | 5.50% | 08/14/2021 | | | 95,118 | |
| | 162,900 | | Ortho-Clinical Diagnostics Holdings Luxembourg S.A.R.L., Initial Term Loan | 4.75% | 06/30/2021 | | | 159,711 | |
| | 227,125 | | Paragon Offshore Finance Co., Term Loan | 5.25% | 07/16/2021 | | | 57,207 | |
| | 95,761 | | Penn Engineering & Manufacturing Corp., Incremental Tranche C Term Loan | 4.00% | 08/27/2021 | | | 108,367 | |
| | 250,000 | | Quicksilver Resources, Inc., Second Lien Term Loan(e) | 7.00% | 06/21/2019 | | | 48,645 | |
| | 434,500 | | SBA Senior Finance II LLC, Incremental Tranche B-2 Term Loan | 3.34% | 06/10/2022 | | | 435,677 | |
| | 130,957 | | Scientific Games International, Inc., Initial Term B2 Loan | 6.00% | 10/01/2021 | | | 131,375 | |
| | 118,062 | | Scientific Games International, Inc., Initial Term B2 Loan | 6.00% | 10/01/2021 | | | 118,440 | |
| | 218,350 | | Securus Technologies Holdings, Inc., First Lien Incremental Term Loan | 5.25% | 04/30/2020 | | | 216,235 | |
See Notes to Financial Statements.
| 76 | (888) 848-7569 | www.rivernorth.com |
| RiverNorth/Oaktree High Income Fund | Schedule of Investments |
September 30, 2016
| Principal Amount/Description | Rate | Maturity | | Value | |
| $ | 250,000 | | Sedgwick Claims Management Services, Inc., Second Lien Term Loan | 6.75% | 02/28/2022 | | $ | 247,969 | |
| | 107,800 | | Signode Industrial Group Lux SA, Initial Euro Term Loan | 4.00% | 05/01/2021 | | | 121,612 | |
| | 358,605 | | Smart & Final Stores LLC, First Lien Term Loan(d) | L+3.50% | 11/15/2022 | | | 359,391 | |
| | 200,000 | | Solenis International LP, Tranche C Term Loan | 5.00% | 07/31/2021 | | | 227,385 | |
| | 274,313 | | Solera Holdings, Inc., Euro Term Loan | 5.75% | 02/28/2023 | | | 313,301 | |
| | 47,688 | | Spectrum Brands, Inc., Euro Term Loan | 3.50% | 06/23/2022 | | | 54,051 | |
| | 113,850 | | Sterigenics-Nordion Holdings LLC, Initial Term Loan | 4.25% | 05/16/2022 | | | 114,419 | |
| | 148,875 | | TI Group Automotive Systems LLC, Initial Euro Term Loan | 4.50% | 06/30/2022 | | | 167,866 | |
| | 252,450 | | TI Group Automotive Systems LLC, Initial US Term Loan | 4.50% | 06/30/2022 | | | 253,554 | |
| | 220,782 | | Toys 'R' US Property Co. I LLC, Initial Term Loan | 6.00% | 08/21/2019 | | | 210,019 | |
| | 438,753 | | Trans Union LLC, Term B-2 Loan | 3.59% | 04/09/2021 | | | 440,796 | |
| | 453,432 | | TransDigm, Inc., Tranche E Term Loan | 3.75% | 05/14/2022 | | | 454,565 | |
| | 105,000 | | Ultra Resources, Inc., Revolving Credit Term Loan(d)(e) | L+1.75% | 10/06/2023 | | | 98,700 | |
| | 173,688 | | US Renal Care, Inc., First Lien Initial Term Loan | 5.25% | 12/30/2022 | | | 167,174 | |
| | 151,900 | | Utex Industrials, Inc., First Lien Initial Term Loan | 5.00% | 05/21/2021 | | | 113,355 | |
| | 135,000 | | Versum Materials Inc., First Lien B Term Loan(d) | L+2.50% | 09/20/2023 | | | 135,900 | |
| | 220,000 | | Western Digital Corp., Euro Term B Loan | 4.00% | 04/29/2023 | | | 251,021 | |
| | 260,000 | | Windstream Services LLC (fka Windstream Corporation), Term B6 Loan(d) | L+4.00% | 03/29/2021 | | | 261,300 | |
| | 136,706 | | York Risk Services Holding Corp., Term Loan | 4.75% | 10/01/2021 | | | 125,941 | |
| | | | | | | 19,960,621 | |
| | | | | | | | | | |
| TOTAL BANK LOANS (Cost $31,511,707) | | | | | 29,932,984 | |
See Notes to Financial Statements.
| Annual Report | September 30, 2016 | 77 |
| RiverNorth/Oaktree High Income Fund | Schedule of Investments |
September 30, 2016
| Principal Amount/Description | Rate | Maturity | | Value | |
| HIGH YIELD DEBT- 31.64% | |
| Australia - 0.07% | |
| $ | 55,000 | | BlueScope Steel Finance Ltd./BlueScope Steel Finance USA LLC(g) | 6.50% | 05/15/2021 | | $ | 58,300 | |
| | | | | | | | |
| Bermuda - 0.14% | |
| | 95,000 | | Weatherford International Ltd. | 7.75% | 06/15/2021 | | | 94,406 | |
| | 10,000 | | Weatherford International Ltd. | 4.50% | 04/15/2022 | | | 8,500 | |
| | 10,000 | | Weatherford International Ltd. | 8.25% | 06/15/2023 | | | 9,925 | |
| | | | | | | 112,831 | |
| Canada - 1.68% | |
| | 70,000 | | 1011778 BC ULC / New Red Finance, Inc.(g) | 4.63% | 01/15/2022 | | | 72,975 | |
| | 65,000 | | Baytex Energy Corp.(g) | 5.13% | 06/01/2021 | | | 54,437 | |
| | 170,000 | | Cascades, Inc.(g) | 5.50% | 07/15/2022 | | | 173,612 | |
| | 15,000 | | Cascades, Inc.(g) | 5.75% | 07/15/2023 | | | 15,263 | |
| | 100,000 | | Cott Corp.(g) | 5.50% | 07/01/2024 | | | 118,251 | |
| | 85,000 | | Eldorado Gold Corp.(g) | 6.13% | 12/15/2020 | | | 86,020 | |
| | 100,000 | | First Quantum Minerals Ltd.(g) | 7.25% | 05/15/2022 | | | 89,500 | |
| | 105,000 | | HudBay Minerals, Inc. | 9.50% | 10/01/2020 | | | 105,814 | |
| | 90,000 | | Open Text Corp.(g) | 5.63% | 01/15/2023 | | | 92,250 | |
| | 55,000 | | Open Text Corp.(g) | 5.88% | 06/01/2026 | | | 57,681 | |
| | 60,000 | | Precision Drilling Corp. | 6.63% | 11/15/2020 | | | 55,950 | |
| | 55,000 | | Teck Resources Ltd.(g) | 8.50% | 06/01/2024 | | | 63,113 | |
| | 400,000 | | Valeant Pharmaceuticals International, Inc.(g) | 5.38% | 03/15/2020 | | | 372,000 | |
| | | | | | | 1,356,866 | |
| France - 0.72% | |
| | 110,000 | | Crown European Holdings SA(g) | 2.63% | 09/30/2024 | | | 122,178 | |
| | 100,000 | | Holding Medi-Partenaires SAS(h) | 7.00% | 05/15/2020 | | | 118,233 | |
| | 290,000 | | Numericable-SFR SAS(h) | 5.63% | 05/15/2024 | | | 337,174 | |
| | | | | | | 577,585 | |
| Germany - 0.60% | |
| | 120,000 | | IHO Verwaltungs GmbH(g) | 3.25% | 09/15/2023 | | | 134,568 | |
| | 20,000 | | IHO Verwaltungs GmbH(g)(i) | 4.50% | 09/15/2023 | | | 20,237 | |
| | 100,000 | | Unitymedia GmbH(h) | 3.75% | 01/15/2027 | | | 107,912 | |
| | 105,000 | | Unitymedia Hessen GmbH & Co. KG / Unitymedia NRW GmbH(h) | 4.00% | 01/15/2025 | | | 121,638 | |
| | 81,000 | | Unitymedia Hessen GmbH & Co. KG / Unitymedia NRW GmbH(h) | 5.75% | 01/15/2023 | | | 96,673 | |
| | | | | | | 481,028 | |
| Great Britain - 2.82% | |
| | 150,000 | | Arqiva Broadcast Finance PLC(h) | 9.50% | 03/31/2020 | | | 210,428 | |
See Notes to Financial Statements.
| 78 | (888) 848-7569 | www.rivernorth.com |
| RiverNorth/Oaktree High Income Fund | Schedule of Investments |
September 30, 2016
| Principal Amount/Description | Rate | Maturity | | Value | |
| $ | 100,000 | | Boparan Finance PLC(h) | 5.50% | 07/15/2021 | | $ | 120,283 | |
| | 100,000 | | IDH Finance PLC(g) | 6.25% | 08/15/2022 | | | 126,867 | |
| | 100,000 | | IDH Finance PLC(f)(g) | 6.41% | 08/15/2022 | | | 128,967 | |
| | 200,000 | | Inmarsat Finance PLC(g) | 6.50% | 10/01/2024 | | | 200,750 | |
| | 100,000 | | Inovyn Finance PLC(g) | 6.25% | 05/15/2021 | | | 116,710 | |
| | 110,000 | | Iron Mountain Europe PLC(h) | 6.13% | 09/15/2022 | | | 149,884 | |
| | 100,000 | | Moto Finance PLC(g) | 6.38% | 09/01/2020 | | | 135,546 | |
| | 130,000 | | Synlab Bondco PLC(g) | 6.25% | 07/01/2022 | | | 155,236 | |
| | 150,000 | | TA MFG. Ltd.(g) | 3.63% | 04/15/2023 | | | 166,030 | |
| | 200,000 | | Tullow Oil PLC(g) | 6.00% | 11/01/2020 | | | 181,500 | |
| | 230,000 | | Virgin Media Finance PLC(h) | 7.00% | 04/15/2023 | | | 315,443 | |
| | 100,000 | | Vougeot Bidco PLC(g) | 7.88% | 07/15/2020 | | | 135,318 | |
| | 100,000 | | Vougeot Bidco PLC(h) | 7.88% | 07/15/2020 | | | 135,318 | |
| | | | | | | 2,278,280 | |
| Ireland - 0.20% | |
| | 135,000 | | Ardagh Packaging Finance PLC / Ardagh Holdings USA, Inc.(g) | 6.75% | 05/15/2024 | | | 159,330 | |
| | | | | | | | |
| Italy - 0.16% | |
| | 110,000 | | LKQ Italia Bondco SpA(g) | 3.88% | 04/01/2024 | | | 132,113 | |
| | | | | | | | |
| Jersey - 0.59% | |
| | 150,000 | | AA Bond Co. Ltd.(g) | 5.50% | 07/31/2022 | | | 192,916 | |
| | 120,000 | | CPUK Finance Ltd.(g) | 7.00% | 08/28/2020 | | | 164,831 | |
| | 100,000 | | Lincoln Finance Ltd.(g) | 6.88% | 04/15/2021 | | | 121,322 | |
| | | | | | | 479,069 | |
| Luxembourg - 2.91% | |
| | 100,000 | | Altice Financing SA(g) | 5.25% | 02/15/2023 | | | 116,935 | |
| | 100,000 | | Altice Luxembourg SA(h) | 7.25% | 05/15/2022 | | | 118,879 | |
| | 305,000 | | ArcelorMittal | 6.50% | 03/01/2021 | | | 340,837 | |
| | 116,000 | | Capsugel SA(g)(i) | 7.00% | 05/15/2019 | | | 116,363 | |
| | 200,000 | | ConvaTec Finance International SA(g)(i) | 8.25% | 01/15/2019 | | | 199,800 | |
| | 200,000 | | FAGE International SA/ FAGE USA Dairy Industry, Inc.(g) | 5.63% | 08/15/2026 | | | 206,500 | |
| | 125,000 | | Hanesbrands Finance Luxembourg SCA(g) | 3.50% | 06/15/2024 | | | 145,878 | |
| | 135,000 | | Intelsat Jackson Holdings SA | 7.50% | 04/01/2021 | | | 102,600 | |
| | 105,000 | | Intelsat Jackson Holdings SA(g) | 8.00% | 02/15/2024 | | | 105,787 | |
| | 140,000 | | Matterhorn Telecom SA(g) | 3.88% | 05/01/2022 | | | 157,156 | |
| | 100,000 | | SIG Combibloc Holdings SCA(g) | 7.75% | 02/15/2023 | | | 118,317 | |
| | 100,000 | | Telenet Finance VI Luxembourg SCA(h) | 4.88% | 07/15/2027 | | | 118,460 | |
| | 480,000 | | Wind Acquisition Finance SA(g) | 7.38% | 04/23/2021 | | | 503,400 | |
| | | | | | | 2,350,912 | |
See Notes to Financial Statements.
| Annual Report | September 30, 2016 | 79 |
| RiverNorth/Oaktree High Income Fund | Schedule of Investments |
September 30, 2016
| Principal Amount/Description | Rate | Maturity | | Value | |
| Netherlands - 0.93% | |
| $ | 130,000 | | Alcoa Nederland Holding BV(g) | 6.75% | 09/30/2024 | | $ | 135,363 | |
| | 25,000 | | Alcoa Nederland Holding BV(g) | 7.00% | 09/30/2026 | | | 25,906 | |
| | 220,000 | | Darling Global Finance BV(g) | 4.75% | 05/30/2022 | | | 253,316 | |
| | 115,000 | | UPC Holding BV(h) | 6.75% | 03/15/2023 | | | 139,353 | |
| | 175,000 | | Ziggo Bond Finance BV(h) | 4.63% | 01/15/2025 | | | 197,260 | |
| | | | | | | 751,198 | |
| United States - 20.82% | |
| | 110,000 | | Acadia Healthcare Co., Inc. | 5.13% | 07/01/2022 | | | 109,450 | |
| | 55,000 | | Acadia Healthcare Co., Inc. | 5.63% | 02/15/2023 | | | 56,100 | |
| | 90,000 | | AECOM | 5.75% | 10/15/2022 | | | 94,978 | |
| | 95,000 | | AES Corp. | 6.00% | 05/15/2026 | | | 100,344 | |
| | 75,000 | | Albertsons Cos. LLC / Safeway, Inc. / New Albertson's, Inc. / Albertson's LLC(g) | 6.63% | 06/15/2024 | | | 78,187 | |
| | 110,000 | | Albertsons Cos. LLC / Safeway, Inc. / New Albertson's, Inc. / Albertson's LLC(g) | 5.75% | 03/15/2025 | | | 110,000 | |
| | 110,000 | | Allegion US Holding Co., Inc. | 5.75% | 10/01/2021 | | | 115,087 | |
| | 150,000 | | American Builders & Contractors Supply Co., Inc.(g) | 5.63% | 04/15/2021 | | | 156,000 | |
| | 95,000 | | AmeriGas Finance LLC / AmeriGas Finance Corp. | 7.00% | 05/20/2022 | | | 100,937 | |
| | 135,000 | | AmeriGas Partners LP / AmeriGas Finance Corp. | 5.63% | 05/20/2024 | | | 143,437 | |
| | 130,000 | | Amsurg Corp. | 5.63% | 07/15/2022 | | | 133,412 | |
| | 20,000 | | Antero Midstream Partners LP / Antero Midstream Finance Corp.(g) | 5.38% | 09/15/2024 | | | 20,300 | |
| | 35,000 | | Antero Resources Corp. | 5.38% | 11/01/2021 | | | 35,612 | |
| | 15,000 | | Antero Resources Corp. | 5.13% | 12/01/2022 | | | 15,187 | |
| | 30,000 | | Antero Resources Corp. | 5.63% | 06/01/2023 | | | 30,713 | |
| | 125,000 | | Apex Tool Group LLC(g) | 7.00% | 02/01/2021 | | | 120,156 | |
| | 56,000 | | Ashtead Capital, Inc.(g) | 6.50% | 07/15/2022 | | | 59,150 | |
| | 15,000 | | Ashtead Capital, Inc.(g) | 5.63% | 10/01/2024 | | | 15,862 | |
| | 115,000 | | Axalta Coating Systems(g) | 4.25% | 08/15/2024 | | | 133,057 | |
| | 10,000 | | B&G Foods, Inc. | 4.63% | 06/01/2021 | | | 10,350 | |
| | 160,000 | | BlueLine Rental Finance Corp.(g) | 7.00% | 02/01/2019 | | | 140,400 | |
| | 85,000 | | Boyd Gaming Corp.(g) | 6.38% | 04/01/2026 | | | 91,587 | |
| | 200,000 | | Carlson Travel Holdings, Inc.(g)(i) | 7.50% | 08/15/2019 | | | 199,000 | |
| | 35,000 | | Carrizo Oil & Gas, Inc. | 6.25% | 04/15/2023 | | | 34,825 | |
| | 75,000 | | CCO Holdings LLC / CCO Holdings Capital Corp.(g) | 5.13% | 05/01/2023 | | | 78,469 | |
| | 45,000 | | CCO Holdings LLC / CCO Holdings Capital Corp.(g) | 5.88% | 04/01/2024 | | | 48,123 | |
| | 70,000 | | Centene Corp. | 5.63% | 02/15/2021 | | | 74,550 | |
| | 30,000 | | Centene Corp. | 4.75% | 05/15/2022 | | | 31,125 | |
See Notes to Financial Statements.
| 80 | (888) 848-7569 | www.rivernorth.com |
| RiverNorth/Oaktree High Income Fund | Schedule of Investments |
September 30, 2016
| Principal Amount/Description | Rate | Maturity | | Value | |
| $ | 45,000 | | Centene Corp. | 6.13% | 02/15/2024 | | $ | 48,937 | |
| | 105,000 | | CenturyLink, Inc. | 5.63% | 04/01/2025 | | | 100,931 | |
| | 100,000 | | Cheniere Corpus Christi Holdings LLC(g) | 7.00% | 06/30/2024 | | | 108,500 | |
| | 80,000 | | Chesapeake Energy Corp. | 5.38% | 06/15/2021 | | | 70,000 | |
| | 180,000 | | CHS/Community Health Systems, Inc. | 6.88% | 02/01/2022 | | | 155,700 | |
| | 110,000 | | Churchill Downs, Inc. | 5.38% | 12/15/2021 | | | 114,950 | |
| | 15,000 | | Churchill Downs, Inc.(g) | 5.38% | 12/15/2021 | | | 15,675 | |
| | 105,000 | | CITGO Petroleum Corp.(g) | 6.25% | 08/15/2022 | | | 102,900 | |
| | 100,000 | | Cliffs Natural Resources, Inc.(g) | 8.25% | 03/31/2020 | | | 106,625 | |
| | 90,000 | | CNH Industrial Capital LLC | 4.38% | 11/06/2020 | | | 94,275 | |
| | 105,000 | | CommScope, Inc.(g) | 5.50% | 06/15/2024 | | | 111,169 | |
| | 20,000 | | Corrections Corp. of America | 5.00% | 10/15/2022 | | | 18,200 | |
| | 90,000 | | Corrections Corp. of America | 4.63% | 05/01/2023 | | | 79,650 | |
| | 155,000 | | Covanta Holding Corp. | 6.38% | 10/01/2022 | | | 161,200 | |
| | 10,000 | | CSC Holdings LLC | 5.25% | 06/01/2024 | | | 9,525 | |
| | 55,000 | | CSC Holdings LLC(g) | 5.50% | 04/15/2027 | | | 56,375 | |
| | 125,000 | | DaVita, Inc. | 5.13% | 07/15/2024 | | | 127,734 | |
| | 145,000 | | DBP Holding Corp.(g) | 7.75% | 10/15/2020 | | | 115,637 | |
| | 40,000 | | Denbury Resources, Inc.(g) | 9.00% | 05/15/2021 | | | 42,100 | |
| | 120,000 | | Denbury Resources, Inc. | 5.50% | 05/01/2022 | | | 86,700 | |
| | 115,000 | | Diamond 1 Finance Corp. / Diamond 2 Finance Corp(g) | 5.45% | 06/15/2023 | | | 123,338 | |
| | 160,000 | | Diamond 1 Finance Corp. / Diamond 2 Finance Corp(g) | 6.02% | 06/15/2026 | | | 175,827 | |
| | 55,000 | | DISH DBS Corp. | 5.88% | 07/15/2022 | | | 56,788 | |
| | 5,000 | | DISH DBS Corp. | 5.88% | 11/15/2024 | | | 4,956 | |
| | 55,000 | | DISH DBS Corp.(g) | 7.75% | 07/01/2026 | | | 58,575 | |
| | 15,000 | | DISH DBS Corp. | 5.00% | 03/15/2023 | | | 14,625 | |
| | 80,000 | | Dollar Tree, Inc. | 5.75% | 03/01/2023 | | | 86,500 | |
| | 70,000 | | Dynegy, Inc. | 6.75% | 11/01/2019 | | | 72,100 | |
| | 85,000 | | Endo Finance LLC(g) | 5.75% | 01/15/2022 | | | 79,262 | |
| | 80,000 | | Energizer SpinCo, Inc.(g) | 5.50% | 06/15/2025 | | | 82,600 | |
| | 120,000 | | EnerSys(g) | 5.00% | 04/30/2023 | | | 120,450 | |
| | 150,000 | | Envision Healthcare Corp.(g) | 5.13% | 07/01/2022 | | | 150,000 | |
| | 150,000 | | ESH Hospitality, Inc.(g) | 5.25% | 05/01/2025 | | | 150,562 | |
| | 350,000 | | First Data Corp.(g) | 7.00% | 12/01/2023 | | | 371,000 | |
| | 50,000 | | First Data Corp.(g) | 5.00% | 01/15/2024 | | | 50,937 | |
| | 170,000 | | First Quality Finance Co., Inc.(g) | 4.63% | 05/15/2021 | | | 169,575 | |
| | 140,000 | | Flexi-Van Leasing, Inc.(g) | 7.88% | 08/15/2018 | | | 127,050 | |
| | 180,000 | | Frontier Communications Corp. | 6.88% | 01/15/2025 | | | 159,975 | |
| | 60,000 | | GLP Capital LP / GLP Financing II, Inc. | 5.38% | 04/15/2026 | | | 64,650 | |
| | 90,000 | | Gulfport Energy Corp. | 6.63% | 05/01/2023 | | | 92,700 | |
| | 225,000 | | HCA Holdings, Inc. | 6.25% | 02/15/2021 | | | 244,687 | |
| | 15,000 | | HCA, Inc. | 5.25% | 06/15/2026 | | | 15,975 | |
See Notes to Financial Statements.
| Annual Report | September 30, 2016 | 81 |
| RiverNorth/Oaktree High Income Fund | Schedule of Investments |
September 30, 2016
| Principal Amount/Description | Rate | Maturity | | Value | |
| $ | 185,000 | | HCA, Inc. | 5.88% | 05/01/2023 | | $ | 197,487 | |
| | 160,000 | | HD Supply, Inc.(g) | 5.75% | 04/15/2024 | | | 168,400 | |
| | 5,000 | | HealthSouth Corp. | 5.13% | 03/15/2023 | | | 5,012 | |
| | 135,000 | | HealthSouth Corp. | 5.75% | 11/01/2024 | | | 140,484 | |
| | 105,000 | | HUB International Ltd.(g) | 7.88% | 10/01/2021 | | | 107,362 | |
| | 25,000 | | Hughes Satellite Systems Corp.(g) | 5.25% | 08/01/2026 | | | 24,750 | |
| | 25,000 | | Hughes Satellite Systems Corp.(g) | 6.63% | 08/01/2026 | | | 24,187 | |
| | 105,000 | | Huntington Ingalls Industries, Inc.(g) | 5.00% | 11/15/2025 | | | 111,300 | |
| | 220,000 | | IMS Health, Inc.(g) | 4.13% | 04/01/2023 | | | 255,762 | |
| | 150,000 | | Ingles Markets, Inc. | 5.75% | 06/15/2023 | | | 156,375 | |
| | 100,000 | | Intrepid Aviation Group Holdings LLC / Intrepid Finance Co.(g) | 6.88% | 02/15/2019 | | | 90,500 | |
| | 100,000 | | Jaguar Holding Co. II / Pharmaceutical Product Development LLC(g) | 6.38% | 08/01/2023 | | | 104,250 | |
| | 120,000 | | JBS USA LLC / JBS USA Finance, Inc.(g) | 7.25% | 06/01/2021 | | | 123,900 | |
| | 75,000 | | Jones Energy Holdings LLC / Jones Energy Finance Corp. | 6.75% | 04/01/2022 | | | 64,125 | |
| | 75,000 | | Kennedy-Wilson, Inc. | 5.88% | 04/01/2024 | | | 75,844 | |
| | 95,000 | | KFC Holding Co./Pizza Hut Holdings LLC/Taco Bell of America LLC(g) | 5.00% | 06/01/2024 | | | 99,513 | |
| | 90,000 | | Lamar Media Corp. | 5.75% | 02/01/2026 | | | 97,313 | |
| | 5,000 | | Laredo Petroleum, Inc. | 5.63% | 01/15/2022 | | | 4,875 | |
| | 85,000 | | Laredo Petroleum, Inc. | 6.25% | 03/15/2023 | | | 83,725 | |
| | 115,000 | | Level 3 Financing, Inc. | 5.13% | 05/01/2023 | | | 118,881 | |
| | 20,000 | | Level 3 Financing, Inc. | 5.38% | 01/15/2024 | | | 20,888 | |
| | 80,000 | | LifePoint Health, Inc. | 5.50% | 12/01/2021 | | | 83,600 | |
| | 95,000 | | LifePoint Health, Inc.(g) | 5.38% | 05/01/2024 | | | 95,238 | |
| | 93,000 | | Linn Energy LLC / Linn Energy Finance Corp.(e)(g) | 12.00% | 12/15/2020 | | | 45,570 | |
| | 30,000 | | Mallinckrodt International Finance SA / Mallinckrodt CB LLC(g) | 4.88% | 04/15/2020 | | | 30,750 | |
| | 115,000 | | Mallinckrodt International Finance SA / Mallinckrodt CB LLC(g) | 5.75% | 08/01/2022 | | | 113,994 | |
| | 5,000 | | Mallinckrodt International Finance SA / Mallinckrodt CB LLC(g) | 5.63% | 10/15/2023 | | | 4,812 | |
| | 95,000 | | MGM Growth Properties Operating Partnership LP / MGP Finance Co.-Issuer, Inc.(g) | 5.63% | 05/01/2024 | | | 103,284 | |
| | 110,000 | | Milacron LLC / Mcron Finance Corp.(g) | 7.75% | 02/15/2021 | | | 114,950 | |
| | 80,000 | | MPT Operating Partnership LP / MPT Finance Corp. | 6.38% | 03/01/2024 | | | 87,200 | |
| | 160,000 | | Natural Resource Partners LP / NRP Finance Corp. | 9.13% | 10/01/2018 | | | 148,000 | |
| | 10,000 | | NCR Corp. | 5.88% | 12/15/2021 | | | 10,563 | |
| | 65,000 | | Neiman Marcus Group Ltd. LLC(g)(i) | 8.75% | 10/15/2021 | | | 51,675 | |
See Notes to Financial Statements.
| 82 | (888) 848-7569 | www.rivernorth.com |
| RiverNorth/Oaktree High Income Fund | Schedule of Investments |
September 30, 2016
| Principal Amount/Description | Rate | Maturity | | Value | |
| $ | 100,000 | | Neuberger Berman Group LLC / Neuberger Berman Finance Corp.(g) | 5.88% | 03/15/2022 | | $ | 104,500 | |
| | 5,000 | | Newfield Exploration Co. | 5.63% | 07/01/2024 | | | 5,150 | |
| | 170,000 | | Nielsen Finance LLC / Nielsen Finance Co.(g) | 5.00% | 04/15/2022 | | | 176,163 | |
| | 50,000 | | Novelis Corp.(g) | 6.25% | 08/15/2024 | | | 53,250 | |
| | 70,000 | | Novelis Corp.(g) | 5.88% | 09/30/2026 | | | 71,838 | |
| | 135,000 | | NRG Energy, Inc. | 6.63% | 03/15/2023 | | | 137,025 | |
| | 140,000 | | NRG Yield Operating LLC(g) | 5.00% | 09/15/2026 | | | 137,550 | |
| | 65,000 | | Oasis Petroleum, Inc. | 6.88% | 03/15/2022 | | | 62,563 | |
| | 35,000 | | Oasis Petroleum, Inc. | 6.88% | 01/15/2023 | | | 33,512 | |
| | 90,000 | | Party City Holdings, Inc.(g) | 6.13% | 08/15/2023 | | | 96,413 | |
| | 110,000 | | PHI, Inc. | 5.25% | 03/15/2019 | | | 106,425 | |
| | 70,000 | | Pilgrim's Pride Corp.(g) | 5.75% | 03/15/2025 | | | 72,450 | |
| | 115,000 | | Pinnacle Foods Finance LLC / Pinnacle Foods Finance Corp. | 4.88% | 05/01/2021 | | | 118,594 | |
| | 55,000 | | Plantronics, Inc.(g) | 5.50% | 05/31/2023 | | | 56,788 | |
| | 140,000 | | Plastipak Holdings, Inc.(g) | 6.50% | 10/01/2021 | | | 145,950 | |
| | 80,000 | | Post Holdings, Inc.(g) | 6.00% | 12/15/2022 | | | 84,800 | |
| | 25,000 | | Post Holdings, Inc.(g) | 7.75% | 03/15/2024 | | | 28,125 | |
| | 65,000 | | Post Holdings, Inc.(g) | 5.00% | 08/15/2026 | | | 64,838 | |
| | 135,000 | | Prestige Brands, Inc.(g) | 5.38% | 12/15/2021 | | | 140,400 | |
| | 100,000 | | PSPC Escrow Corp.(g) | 6.00% | 02/01/2023 | | | 106,077 | |
| | 50,000 | | Range Resources Corp.(g) | 5.00% | 08/15/2022 | | | 50,000 | |
| | 30,000 | | Range Resources Corp. | 4.88% | 05/15/2025 | | | 28,950 | |
| | 95,000 | | Rent-A-Center, Inc. | 4.75% | 05/01/2021 | | | 80,750 | |
| | 65,000 | | Reynolds Group Issuer, Inc. / Reynolds Group Issuer LLC(g) | 5.13% | 07/15/2023 | | | 67,194 | |
| | 60,000 | | Reynolds Group Issuer, Inc. / Reynolds Group Issuer LLC(g) | 7.00% | 07/15/2024 | | | 64,463 | |
| | 145,000 | | Reynolds Group Issuer, Inc. / Reynolds Group Issuer LLC | 5.75% | 10/15/2020 | | | 149,712 | |
| | 90,000 | | RHP Hotel Properties LP / RHP Finance Corp. | 5.00% | 04/15/2023 | | | 91,800 | |
| | 60,000 | | Rite Aid Corp.(g) | 6.13% | 04/01/2023 | | | 64,875 | |
| | 170,000 | | Sabine Pass Liquefaction LLC | 5.63% | 04/15/2023 | | | 182,325 | |
| | 50,000 | | Sabine Pass Liquefaction LLC(g) | 5.88% | 06/30/2026 | | | 54,531 | |
| | 50,000 | | Sabine Pass Liquefaction LLC(g) | 5.00% | 03/15/2027 | | | 51,375 | |
| | 75,000 | | Sally Holdings LLC / Sally Capital, Inc. | 5.75% | 06/01/2022 | | | 78,563 | |
| | 150,000 | | SBA Communications Corp. | 4.88% | 07/15/2022 | | | 155,625 | |
| | 15,000 | | SBA Communications Corp.(g) | 4.88% | 09/01/2024 | | | 15,150 | |
| | 155,000 | | Scientific Games International, Inc.(g) | 7.00% | 01/01/2022 | | | 164,688 | |
| | 75,000 | | Sequa Corp.(g) | 7.00% | 12/15/2017 | | | 26,063 | |
| | 120,000 | | Six Flags Entertainment Corp.(g) | 4.88% | 07/31/2024 | | | 121,500 | |
See Notes to Financial Statements.
| Annual Report | September 30, 2016 | 83 |
| RiverNorth/Oaktree High Income Fund | Schedule of Investments |
September 30, 2016
| Principal Amount/Description | Rate | Maturity | | Value | |
| $ | 15,000 | | SM Energy Co. | 6.13% | 11/15/2022 | | $ | 15,075 | |
| | 20,000 | | SM Energy Co. | 6.75% | 09/15/2026 | | | 20,238 | |
| | 135,000 | | Smithfield Foods, Inc. | 6.63% | 08/15/2022 | | | 143,438 | |
| | 15,000 | | Southwestern Energy Co. | 4.10% | 03/15/2022 | | | 13,687 | |
| | 70,000 | | Southwestern Energy Co. | 6.70% | 01/23/2025 | | | 70,263 | |
| | 100,000 | | Spectrum Brands, Inc.(g) | 4.00% | 10/01/2026 | | | 114,503 | |
| | 520,000 | | Sprint Corp. | 7.25% | 09/15/2021 | | | 525,200 | |
| | 50,000 | | SS&C Technologies Holdings, Inc. | 5.88% | 07/15/2023 | | | 52,875 | |
| | 60,000 | | Standard Industries, Inc.(g) | 5.50% | 02/15/2023 | | | 63,000 | |
| | 150,000 | | Standard Industries, Inc.(g) | 6.00% | 10/15/2025 | | | 161,250 | |
| | 85,000 | | Steel Dynamics, Inc. | 5.13% | 10/01/2021 | | | 88,719 | |
| | 20,000 | | Steel Dynamics, Inc. | 5.50% | 10/01/2024 | | | 21,000 | |
| | 195,000 | | Summit Materials LLC / Summit Materials Finance Corp. | 6.13% | 07/15/2023 | | | 199,875 | |
| | 150,000 | | SunCoke Energy Partners LP / SunCoke Energy Partners Finance Corp.(g) | 7.38% | 02/01/2020 | | | 141,000 | |
| | 105,000 | | Targa Resources Partners LP / Targa Resources Partners Finance Corp. | 6.75% | 03/15/2024 | | | 112,875 | |
| | 40,000 | | Targa Resources Partners LP / Targa Resources Partners Finance Corp.(g) | 5.13% | 02/01/2025 | | | 40,150 | |
| | 15,000 | | Tempur Sealy International, Inc. | 5.63% | 10/15/2023 | | | 15,938 | |
| | 160,000 | | Tempur Sealy International, Inc.(g) | 5.50% | 06/15/2026 | | | 165,200 | |
| | 130,000 | | Tenet Healthcare Corp. | 4.50% | 04/01/2021 | | | 131,462 | |
| | 75,000 | | Tenet Healthcare Corp. | 6.75% | 06/15/2023 | | | 69,938 | |
| | 50,000 | | Tenneco, Inc. | 5.38% | 12/15/2024 | | | 52,750 | |
| | 105,000 | | TerraForm Power Operating LLC(g)(j) | 9.38% | 02/01/2023 | | | 108,675 | |
| | 115,000 | | The GEO Group, Inc. | 5.13% | 04/01/2023 | | | 98,325 | |
| | 60,000 | | The GEO Group, Inc. | 6.00% | 04/15/2026 | | | 51,300 | |
| | 110,000 | | The Goodyear Tire & Rubber Co. | 5.13% | 11/15/2023 | | | 114,950 | |
| | 130,000 | | T-Mobile USA, Inc. | 6.00% | 03/01/2023 | | | 139,368 | |
| | 165,000 | | T-Mobile USA, Inc. | 6.00% | 04/15/2024 | | | 176,962 | |
| | 160,000 | | TMS International Corp.(g) | 7.63% | 10/15/2021 | | | 137,600 | |
| | 95,000 | | TreeHouse Foods, Inc.(g) | 6.00% | 02/15/2024 | | | 102,719 | |
| | 45,000 | | Tronox Finance LLC | 6.38% | 08/15/2020 | | | 41,737 | |
| | 110,000 | | Tronox Finance LLC(g) | 7.50% | 03/15/2022 | | | 100,925 | |
| | 60,000 | | Ultra Petroleum Corp.(b)(e)(g) | 6.13% | 10/01/2024 | | | 47,700 | |
| | 40,000 | | United Rentals NA | 5.88% | 09/15/2026 | | | 41,400 | |
| | 80,000 | | United Rentals North America, Inc. | 5.50% | 07/15/2025 | | | 82,300 | |
| | 125,000 | | Univision Communications, Inc.(g) | 5.13% | 05/15/2023 | | | 127,188 | |
| | 10,000 | | USG Corp.(g) | 5.50% | 03/01/2025 | | | 10,763 | |
| | 75,000 | | Vereit Operating Partnership LP | 4.60% | 02/06/2024 | | | 78,375 | |
| | 125,000 | | VWR Funding, Inc.(g) | 4.63% | 04/15/2022 | | | 144,087 | |
| | 70,000 | | Walter Investment Management Corp. | 7.88% | 12/15/2021 | | | 46,900 | |
| | 100,000 | | Watco Cos. LLC / Watco Finance Corp.(g) | 6.38% | 04/01/2023 | | | 101,500 | |
See Notes to Financial Statements.
| 84 | (888) 848-7569 | www.rivernorth.com |
| RiverNorth/Oaktree High Income Fund | Schedule of Investments |
September 30, 2016
| Principal Amount/Description | Rate | Maturity | | Value | |
| $ | 95,000 | | ZF North America Capital, Inc.(g) | 4.50% | 04/29/2022 | | $ | 100,819 | |
| | | | | | | 16,821,886 | |
| | | | | | | | | | |
| TOTAL HIGH YIELD DEBT (Cost $25,687,798) | | | | | 25,559,398 | |
| Shares/Description | | Value | |
| SHORT-TERM INVESTMENTS - 12.74% | |
| | 10,292,660 | | State Street Institutional Trust (7 Day Yield 0.19%) | | | 10,292,660 | |
| | | | | | | | |
| TOTAL SHORT-TERM INVESTMENTS (Cost $10,292,660) | | | 10,292,660 | |
| | | | | | |
TOTAL INVESTMENTS - 102.77% (Cost $85,345,365) | | | 83,018,385 | |
| CASH SEGREGATED AT CUSTODIAN FOR FORWARD FOREIGN CURRENCY CONTRACTS AND TOTAL RETURN SWAP CONTRACTS - 0.35% | | | 281,000 | |
| LIABILITIES IN EXCESS OF OTHER ASSETS - (3.12)% | | | (2,434,884 | ) |
| NET ASSETS - 100.00% | | $ | 80,783,501 | |
| (b) | Non-income producing security. |
| (c) | Private Placement: these securities may only be resold in transactions exempt from registration under the Securities Act of 1933. |
| (d) | All or a portion of this position has not settled as of September 30, 2016. The interest rate shown represents the stated spread over the London Interbank Offered Rate ("LIBOR" or "L") or the Euro Interbank Offered Rate ("EURIBOR" or "E") or the applicable LIBOR/EURIBOR floor; the Fund will not accrue interest until the settlement date, at which point LIBOR/EURIBOR will be established. |
| (e) | Security is currently in default. |
| (f) | Floating or variable rate security. Interest rate disclosed is that which is in effect at September 30, 2016. |
| (g) | Security exempt from registration under Rule 144A of the Securities Act of 1933. These securities have been deemed liquid under procedures approved by the Fund's Board of Trustees and may normally be sold to qualified institutional buyers in transactions exempt from registration. Total fair value of Rule 144A securities amounts to $14,657,247, which represents approximately 18.14% of net assets as of September 30, 2016. |
See Notes to Financial Statements.
| Annual Report | September 30, 2016 | 85 |
| RiverNorth/Oaktree High Income Fund | Schedule of Investments |
September 30, 2016
| (h) | Securities were purchased pursuant to Regulation S under the Securities Act of 1933, which exempts securities offered and sold outside of the United States from registration. Such securities cannot be sold in the United States without either an effective registration statement filed pursuant to the Securities Act of 1933, or pursuant to an exemption from registration. These securities have been deemed liquid under procedures approved by the Fund's Board of Trustees. As of September 30, 2016, the aggregate fair value of those securities was $2,286,938, representing 2.83% of net assets. |
| (i) | Pay-in-kind securities. |
| (j) | Step bond. Coupon changes periodically based upon a predetermined schedule. Interest rate disclosed is that which is in effect at September 30, 2016. |
OUTSTANDING FORWARD FOREIGN CURRENCY CONTRACTS
| Counterparty | Foreign Currency | Contracted Amount* | Contract Type | Settlement Date | | Current Value | | Unrealized Appreciation | |
| State Street Boston | EUR | 749,404 | Purchase | 10/05/2016 | | $ | 841,884 | | $ | 1,203 | |
| State Street Boston | EUR | 159,724 | Sale | 10/05/2016 | | | 179,435 | | | 99 | |
| State Street Boston | GBP | 2,226,690 | Sale | 10/05/2016 | | | 2,886,188 | | | 44,845 | |
| | | | | | | | | | $ | 46,147 | |
| Counterparty | Foreign Currency | Contracted Amount* | Contract Type | Settlement Date | | Current Value | | Unrealized Depreciation | |
| State Street Boston | EUR | 273,572 | Purchase | 10/05/2016 | | $ | 307,332 | | $ | (955 | ) |
| State Street Boston | GBP | 46,473 | Purchase | 10/05/2016 | | | 60,238 | | | (450 | ) |
| State Street Boston | EUR | 12,507,321 | Sale | 10/05/2016 | | | 14,050,781 | | | (97,785 | ) |
| | | | | | | | | | $ | (99,190 | ) |
| * | The contracted amount is stated in the currency in which the security is denominated. |
See Notes to Financial Statements.
| 86 | (888) 848-7569 | www.rivernorth.com |
RiverNorth Core Opportunity Fund
Statement of Assets and Liabilities | September 30, 2016 |
| ASSETS: | | | |
| Investment in securities: | | | |
| At cost | | $ | 685,099,396 | |
| At value | | $ | 718,355,155 | |
| Investment in affiliates: | | | | |
| At cost | | | 47,512,328 | |
| At value | | | 43,314,349 | |
| Total return swap contracts premium paid | | | 7,992,521 | |
| Receivable for fund investments sold | | | 1,431,835 | |
| Unrealized appreciation on total return swap contracts | | | 835,285 | |
| Dividends receivable | | | 555,319 | |
| Cash segregated at custodian for total return swap contracts | | | 400,000 | |
| Receivable for fund shares sold | | | 340,774 | |
| Prepaid expenses and other assets | | | 33,849 | |
| Total Assets | | | 773,259,087 | |
| | | | | |
| LIABILITIES: | | | | |
| Facility loan fee payable | | | 16,642 | |
| Payable for fund investments purchased | | | 1,487,597 | |
| Payable for fund shares redeemed | | | 867,542 | |
| Interest payable on total return swap contracts | | | 82,450 | |
| Payable to Adviser | | | 635,378 | |
| Payable for Fund Accounting and Administration fees | | | 59,299 | |
| Accrued 12b-1 fees - Class R Shares | | | 116,682 | |
| Payable for Custodian fees | | | 6,059 | |
| Payable for Audit fees | | | 18,988 | |
| Payable to Transfer agency | | | 14,436 | |
| Payable to Trustees and Officers | | | 3,384 | |
| Other accrued expenses | | | 40,585 | |
| Total Liabilities | | | 3,349,042 | |
| Net Assets | | $ | 769,910,045 | |
| | | | | |
| NET ASSETS CONSIST OF: | | | | |
| Paid-in capital | | $ | 743,979,033 | |
| Accumulated net investment loss | | | (1,265,521 | ) |
| Accumulated net realized loss on investments and total return swap contracts | | | (2,696,532 | ) |
| Net unrealized appreciation on investments and total return swap contracts | | | 29,893,065 | |
| Net Assets | | $ | 769,910,045 | |
See Notes to Financial Statements.
Annual Report | September 30, 2016 | 87 |
RiverNorth Core Opportunity Fund
Statement of Assets and Liabilities | September 30, 2016 |
| PRICING OF SHARES: | | | | |
| Class I Shares | | | | |
| Net Assets | | $ | 201,712,130 | |
| Shares of beneficial interest outstanding (unlimited number of shares, no par value) | | | 17,809,989 | |
| Net Asset Value Per Share, Offering and Redemption Price Per Share | | $ | 11.33 | |
Minimum Redemption Price Per Share(a) | | $ | 11.10 | |
| Class R Shares | | | | |
| Net Assets | | $ | 568,197,915 | |
| Shares of beneficial interest outstanding (unlimited number of shares, no par value) | | | 50,180,343 | |
| Net Asset Value Per Share, Offering and Redemption Price Per Share | | $ | 11.32 | |
Minimum Redemption Price Per Share(a) | | $ | 11.09 | |
(a) | The Fund will impose a 2.00% redemption fee on shares redeemed within 90 days of purchase. |
See Notes to Financial Statements.
| 88 | (888) 848-7569 | www.rivernorth.com |
RiverNorth/DoubleLine Strategic Income Fund
Statement of Assets and Liabilities | September 30, 2016 |
| ASSETS: | | | | |
| Investment in securities: | | | | |
| At cost | | $ | 2,041,904,298 | |
| At value | | $ | 2,010,375,042 | |
| Investment in affiliates: | | | | |
| At cost | | | 27,156,158 | |
| At value | | | 26,286,745 | |
| Total return swap contracts premium paid | | | 12,593,545 | |
| Interest receivable | | | 6,599,310 | |
| Receivable for fund investments sold | | | 3,088,963 | |
| Dividends receivable | | | 1,544,191 | |
| Receivable for fund shares sold | | | 1,517,247 | |
| Unrealized appreciation on total return swap contracts | | | 1,364,980 | |
| Cash segregated at custodian for total return swap contracts | | | 400,000 | |
| Prepaid expenses and other assets | | | 39,310 | |
| Total Assets | | | 2,063,809,333 | |
| | | | | |
| LIABILITIES: | | | | |
| Facility loan fee payable | | | 43,410 | |
| Payable for fund investments purchased | | | 1,365,264 | |
| Payable for fund shares redeemed | | | 6,750,472 | |
| Interest payable on total return swap contracts | | | 53,298 | |
| Payable to Adviser | | | 1,253,988 | |
| Payable for Fund Accounting and Administration fees | | | 231,256 | |
| Accrued 12b-1 fees - Class R Shares | | | 48,092 | |
| Payable for Custodian fees | | | 14,447 | |
| Payable for Audit fees | | | 28,488 | |
| Payable to Transfer agency | | | 52,765 | |
| Payable to Trustees and Officers | | | 8,810 | |
| Other accrued expenses | | | 132,139 | |
| Total Liabilities | | | 9,982,429 | |
| Net Assets | | $ | 2,053,826,904 | |
| | | | | |
| NET ASSETS CONSIST OF: | | | | |
| Paid-in capital | | $ | 2,094,255,290 | |
| Accumulated net investment loss | | | (2,056,291 | ) |
| Accumulated net realized loss on investments and total return swap contracts | | | (7,338,406 | ) |
| Net unrealized depreciation on investments and total return swap contracts | | | (31,033,689 | ) |
| Net Assets | | $ | 2,053,826,904 | |
See Notes to Financial Statements.
Annual Report | September 30, 2016 | 89 |
RiverNorth/DoubleLine Strategic Income Fund
Statement of Assets and Liabilities | September 30, 2016 |
| PRICING OF SHARES: | | | | |
| Class I Shares | | | | |
| Net Assets | | $ | 1,822,873,606 | |
| Shares of beneficial interest outstanding (unlimited number of shares, no par value) | | | 171,836,535 | |
| Net Asset Value Per Share, Offering and Redemption Price Per Share | | $ | 10.61 | |
Minimum Redemption Price Per Share(a) | | $ | 10.40 | |
| Class R Shares | | | | |
| Net Assets | | $ | 230,953,298 | |
| Shares of beneficial interest outstanding (unlimited number of shares, no par value) | | | 21,741,054 | |
| Net Asset Value Per Share, Offering and Redemption Price Per Share | | $ | 10.62 | |
Minimum Redemption Price Per Share(a) | | $ | 10.41 | |
(a) | The Fund will impose a 2.00% redemption fee on shares redeemed within 90 days of purchase. |
See Notes to Financial Statements.
| 90 | (888) 848-7569 | www.rivernorth.com |
RiverNorth Equity Opportunity Fund
Statement of Assets and Liabilities | September 30, 2016 |
| ASSETS: | | | | |
| Investment in securities: | | | | |
| At cost | | $ | 13,662,873 | |
| At value | | $ | 13,810,911 | |
| Dividends receivable | | | 22,227 | |
| Receivable for fund shares sold | | | 125 | |
| Prepaid expenses and other assets | | | 14,064 | |
| Total Assets | | | 13,847,327 | |
| | | | | |
| LIABILITIES: | | | | |
| Facility loan fee payable | | | 299 | |
| Payable for fund investments purchased | | | 13,751 | |
| Payable to Adviser | | | 5,358 | |
| Payable for Fund Accounting and Administration fees | | | 2,152 | |
| Accrued 12b-1 fees - Class R Shares | | | 765 | |
| Payable for Custodian fees | | | 1,457 | |
| Payable for Audit fees | | | 17,488 | |
| Payable to Transfer agency | | | 5,456 | |
| Payable to Trustees and Officers | | | 61 | |
| Other accrued expenses | | | 1,686 | |
| Total Liabilities | | | 48,473 | |
| Net Assets | | $ | 13,798,854 | |
| | | | | |
| NET ASSETS CONSIST OF: | | | | |
| Paid-in capital | | $ | 13,650,816 | |
| Net unrealized appreciation on investments | | | 148,038 | |
| Net Assets | | $ | 13,798,854 | |
| | | | | |
| PRICING OF SHARES: | | | | |
| Class I Shares | | | | |
| Net Assets | | $ | 10,078,838 | |
| Shares of beneficial interest outstanding (unlimited number of shares, no par value) | | | 1,052,383 | |
| Net Asset Value Per Share, Offering and Redemption Price Per Share | | $ | 9.58 | |
Minimum Redemption Price Per Share(a) | | $ | 9.39 | |
| Class R Shares | | | | |
| Net Assets | | $ | 3,720,016 | |
| Shares of beneficial interest outstanding (unlimited number of shares, no par value) | | | 388,548 | |
| Net Asset Value Per Share, Offering and Redemption Price Per Share | | $ | 9.57 | |
Minimum Redemption Price Per Share(a) | | $ | 9.38 | |
(a) | The Fund will impose a 2.00% redemption fee on shares redeemed within 90 days of purchase. |
See Notes to Financial Statements.
Annual Report | September 30, 2016 | 91 |
RiverNorth/Oaktree High Income Fund
Statement of Assets and Liabilities | September 30, 2016 |
| ASSETS: | | | | |
| Investment in securities: | | | | |
| At cost | | $ | 85,345,365 | |
| At value | | $ | 83,018,385 | |
| Foreign currency, at value (Cost $117,046) | | | 117,037 | |
| Interest receivable | | | 556,386 | |
| Receivable for fund investments sold | | | 221,584 | |
| Cash segregated at custodian for total return swap contracts | | | 200,000 | |
| Cash segregated at custodian for forward foreign currency contracts | | | 81,000 | |
| Receivable for fund shares sold | | | 75,021 | |
| Unrealized appreciation on forward foreign currency contracts | | | 46,147 | |
| Dividends receivable | | | 27,825 | |
| Prepaid expenses and other assets | | | 6,623 | |
| Total Assets | | | 84,350,008 | |
| | | | | |
| LIABILITIES: | | | | |
| Facility loan fee payable | | | 1,733 | |
| Payable for fund investments purchased | | | 3,303,231 | |
| Payable for fund shares redeemed | | | 665 | |
| Unrealized depreciation on forward foreign currency contracts | | | 99,190 | |
| Payable to Adviser | | | 65,770 | |
| Payable for Fund Accounting and Administration fees | | | 46,632 | |
| Accrued 12b-1 fees - Class R Shares | | | 1,466 | |
| Payable for Custodian fees | | | 10,001 | |
| Payable for Audit fees | | | 27,488 | |
| Payable to Transfer agency | | | 5,577 | |
| Payable to Trustees and Officers | | | 360 | |
| Other accrued expenses | | | 4,394 | |
| Total Liabilities | | | 3,566,507 | |
| Net Assets | | $ | 80,783,501 | |
| | | | | |
| NET ASSETS CONSIST OF: | | | | |
| Paid-in capital | | $ | 87,407,376 | |
| Accumulated net investment loss | | | (316,909 | ) |
| Accumulated net realized loss on investments, total return swap contracts, translation of assets and liabilities denominated in foreign currencies and forward foreign currency contracts | | | (3,914,783 | ) |
| Net unrealized depreciation on investments, total return swap contracts, translation of assets and liabilities denominated in foreign currencies and forward foreign currency contracts | | | (2,392,183 | ) |
| Net Assets | | $ | 80,783,501 | |
See Notes to Financial Statements.
| 92 | (888) 848-7569 | www.rivernorth.com |
RiverNorth/Oaktree High Income Fund
Statement of Assets and Liabilities | September 30, 2016 |
| PRICING OF SHARES: | | | | |
| Class I Shares | | | | |
| Net Assets | | $ | 73,580,206 | |
| Shares of beneficial interest outstanding (unlimited number of shares, no par value) | | | 7,760,964 | |
| Net Asset Value Per Share, Offering and Redemption Price Per Share | | $ | 9.48 | |
Minimum Redemption Price Per Share(a) | | $ | 9.29 | |
| Class R Shares | | | | |
| Net Assets | | $ | 7,203,295 | |
| Shares of beneficial interest outstanding (unlimited number of shares, no par value) | | | 760,590 | |
| Net Asset Value Per Share, Offering and Redemption Price Per Share | | $ | 9.47 | |
Minimum Redemption Price Per Share(a) | | $ | 9.28 | |
(a) | The Fund will impose a 2.00% redemption fee on shares redeemed within 90 days of purchase. |
See Notes to Financial Statements.
Annual Report | September 30, 2016 | 93 |
RiverNorth Core Opportunity Fund
| Statement of Operations | For the Year Ended September 30, 2016 |
| INVESTMENT INCOME: | |
| Dividend income | | $ | 24,366,614 | |
| Dividend income from affiliated securities | | | 301,177 | |
| Foreign taxes withheld | | | (1,106 | ) |
| Total Investment Income | | | 24,666,685 | |
| | | | | |
| EXPENSES: | |
| Investment Adviser fee | | | 7,597,355 | |
| 12b-1 fees - Class R Shares | | | 1,450,653 | |
| Accounting and administration fee | | | 296,576 | |
| Printing expenses | | | 91,771 | |
| Compliance expenses | | | 67,088 | |
| Registration expenses | | | 64,122 | |
| Facility loan fee | | | 53,715 | |
| Transfer agent expenses | | | 52,793 | |
| Trustee expenses | | | 49,130 | |
| Legal expenses | | | 37,267 | |
| Custodian expenses | | | 29,013 | |
| Audit expenses | | | 19,934 | |
| Insurance expenses | | | 16,708 | |
| 24f-2 expenses | | | 2,332 | |
| Miscellaneous expenses | | | 35,793 | |
| Total Expenses | | | 9,864,250 | |
| Net Investment Income | | | 14,802,435 | |
| | | | | |
| REALIZED AND UNREALIZED GAIN/(LOSS): | | | | |
| Net realized gain/(loss) on: | | | | |
| Investments | | | (2,991,496 | ) |
| Total return swap contracts (See Note 4) | | | 7,175,965 | |
| Net realized gain | | | 4,184,469 | |
| Long-term capital gain distributions from other investment companies | | | 12,375,866 | |
| Net change in unrealized appreciation on: | | | | |
| Investments | | | 71,684,930 | |
| Total return swap contracts | | | 823,239 | |
| Net change in unrealized appreciation | | | 72,508,169 | |
| Net Realized and Unrealized Gain on Investments and Total return swap contracts | | | 89,068,504 | |
| Net Increase in Net Assets Resulting from Operations | | $ | 103,870,939 | |
See Notes to Financial Statements.
| 94 | (888) 848-7569 | www.rivernorth.com |
RiverNorth/DoubleLine Strategic Income Fund
| Statement of Operations | For the Year Ended September 30, 2016 |
| INVESTMENT INCOME: | |
| Dividend income | | $ | 46,826,339 | |
| Dividend income from affiliated securities | | | 1,555,692 | |
| Interest income | | | 65,670,808 | |
| Other income | | | 41,438 | |
| Foreign taxes withheld | | | (3,832 | ) |
| Total Investment Income | | | 114,090,445 | |
| | | | | |
| EXPENSES: | |
| Investment Adviser fee | | | 14,676,146 | |
| Accounting and administration fee | | | 967,704 | |
| 12b-1 fees - Class R Shares | | | 573,999 | |
| Transfer agent expenses | | | 243,199 | |
| Compliance expenses | | | 174,272 | |
| Printing expenses | | | 147,055 | |
| Facility loan fee | | | 142,516 | |
| Trustee expenses | | | 124,680 | |
| Registration expenses | | | 103,494 | |
| Legal expenses | | | 103,470 | |
| Custodian expenses | | | 61,800 | |
| Insurance expenses | | | 43,453 | |
| Audit expenses | | | 28,456 | |
| 24f-2 expenses | | | 720 | |
| Miscellaneous expenses | | | 107,231 | |
| Net Expenses | | | 17,498,195 | |
| Net Investment Income | | | 96,592,250 | |
| | | | | |
| REALIZED AND UNREALIZED GAIN/(LOSS): | | | | |
| Net realized gain on: | | | | |
| Investments | | | 6,640,370 | |
| Total return swap contracts (See Note 4) | | | 4,048,056 | |
| Net realized gain | | | 10,688,426 | |
| Long-term capital gain distributions from other investment companies | | | 487,125 | |
| Net change in unrealized depreciation on: | | | | |
| Investments | | | 60,976,326 | |
| Total return swap contracts | | | 1,549,064 | |
| Net change in unrealized depreciation | | | 62,525,390 | |
| Net Realized and Unrealized Gain on Investments and Total return swap contracts | | | 73,700,941 | |
| Net Increase in Net Assets Resulting from Operations | | $ | 170,293,191 | |
See Notes to Financial Statements.
Annual Report | September 30, 2016 | 95 |
RiverNorth Equity Opportunity Fund
| Statement of Operations | For the Year Ended September 30, 2016 |
| INVESTMENT INCOME: | |
| Dividend income | | $ | 450,923 | |
| Foreign taxes withheld | | | (119 | ) |
| Total Investment Income | | | 450,804 | |
| | | | | |
| EXPENSES: | |
| Investment Adviser fee | | | 138,243 | |
| Registration expenses | | | 35,728 | |
| Transfer agent expenses | | | 28,743 | |
| Audit expenses | | | 18,434 | |
| 12b-1 fees - Class R Shares | | | 10,718 | |
| Accounting and administration fee | | | 7,400 | |
| Printing expenses | | | 4,036 | |
| Compliance expenses | | | 1,203 | |
| Facility loan fee | | | 945 | |
| Trustee expenses | | | 889 | |
| Legal expenses | | | 646 | |
| 24f-2 expenses | | | 547 | |
| Insurance expenses | | | 221 | |
| Miscellaneous expenses | | | 3,887 | |
| Total expenses before waiver/reimbursement | | | 251,640 | |
| Less fees waived/reimbursed by Investment Adviser: | | | | |
| Class I Shares | | | (37,790 | ) |
| Class R Shares | | | (16,671 | ) |
| Net Expenses | | | 197,179 | |
| Net Investment Income | | | 253,625 | |
| | | | | |
| REALIZED AND UNREALIZED LOSS: | | | | |
| Net realized gain on: | | | | |
| Investments | | | 140,179 | |
| Long-term capital gain distributions from other investment companies | | | 483,578 | |
| Net change in unrealized appreciation on: | | | | |
| Investments | | | 702,535 | |
| Net Realized and Unrealized Gain on Investments | | | 1,326,292 | |
| Net Increase in Net Assets Resulting from Operations | | $ | 1,579,917 | |
See Notes to Financial Statements.
| 96 | (888) 848-7569 | www.rivernorth.com |
RiverNorth/Oaktree High Income Fund
| Statement of Operations | For the Year Ended September 30, 2016 |
| INVESTMENT INCOME: | |
| Dividend income | | $ | 2,067,280 | |
| Interest income | | | 3,120,702 | |
| Other income | | | 32,598 | |
| Foreign taxes withheld | | | (3,577 | ) |
| Total Investment Income | | | 5,217,003 | |
| | | | | |
| EXPENSES: | |
| Investment Adviser fee | | | 839,966 | |
| Accounting and administration fee | | | 124,939 | |
| Registration expenses | | | 40,462 | |
| Transfer agent expenses | | | 32,369 | |
| Audit expenses | | | 28,434 | |
| 12b-1 fees - Class R Shares | | | 19,129 | |
| Custodian expenses | | | 15,234 | |
| Printing expenses | | | 9,128 | |
| Compliance expenses | | | 7,437 | |
| Facility loan fee | | | 5,879 | |
| Trustee expenses | | | 5,356 | |
| Legal expenses | | | 4,090 | |
| Insurance expenses | | | 2,072 | |
| 24f-2 expenses | | | 138 | |
| Repayment of previously waived fees | | | | |
| Class I | | | 2,451 | |
| Class R | | | 2,196 | |
| Miscellaneous expenses | | | 7,947 | |
| Total expenses before waiver/reimbursement | | | 1,147,227 | |
| Less fees waived/reimbursed by Investment Adviser: | | | | |
| Class R Shares | | | (1,430 | ) |
| Net Expenses | | | 1,145,797 | |
| Net Investment Income | | | 4,071,206 | |
See Notes to Financial Statements.
Annual Report | September 30, 2016 | 97 |
RiverNorth/Oaktree High Income Fund
| Statement of Operations | For the Year Ended September 30, 2016 |
| REALIZED AND UNREALIZED GAIN/(LOSS): | | | | |
| Net realized gain/(loss) on: | | | | |
| Investments | | | (3,072,645 | ) |
| Total return swap contracts (See Note 4) | | | 93,105 | |
| Translation of assets and liabilities denominated in foreign currencies and forward foreign currency contracts | | | (198,667 | ) |
| Net realized loss | | | (3,178,207 | ) |
| Long-term capital gain distributions from other investment companies | | | 20,217 | |
| Net change in unrealized depreciation on: | | | | |
| Investments | | | 6,791,410 | |
| Translation of assets and liabilities denominated in foreign currencies and forward foreign currency contracts | | | (26,664 | ) |
| Net change in unrealized depreciation | | | 6,764,746 | |
| Net Realized and Unrealized Gain on Investments, translation of assets and liabilities denominated in foreign currencies and forward foreign currency contracts | | | 3,606,756 | |
| Net Increase in Net Assets Resulting from Operations | | $ | 7,677,962 | |
See Notes to Financial Statements.
| 98 | (888) 848-7569 | www.rivernorth.com |
RiverNorth Core Opportunity Fund
Statements of Changes in Net Assets
| | | For the Year Ended September 30, 2016 | | For the Year Ended September 30, 2015 | |
| NET INCREASE/(DECREASE) IN NET ASSETS FROM OPERATIONS: | | | | | | | |
| Net investment income | | $ | 14,802,435 | | $ | 25,709,936 | |
| Net realized gain on Investments and Total return swap contracts | | | 4,184,469 | | | 15,668,964 | |
| Long-term capital gain distributions from other investment companies | | | 12,375,866 | | | 10,872,696 | |
| Net change in unrealized appreciation/(depreciation)on Investments and Total return swap contracts | | | 72,508,169 | | | (111,328,445 | ) |
| Net increase/(decrease) in net assets resulting from operations | | | 103,870,939 | | | (59,076,849 | ) |
| | | | | | | | |
| DISTRIBUTIONS TO SHAREHOLDERS: | | | | | | | |
| From net investment income: | | | | | | | |
| Class I shares | | | (6,736,524 | ) | | (6,416,433 | ) |
| Class R shares | | | (22,371,981 | ) | | (29,402,363 | ) |
| From net realized gains on investments: | | | | | | | |
| Class I shares | | | (7,344,643 | ) | | (6,161,292 | ) |
| Class R shares | | | (24,391,543 | ) | | (45,545,598 | ) |
| From tax return of capital | | | | | | | |
| Class I shares | | | (1,484,480 | ) | | – | |
| Class R shares | | | (4,929,957 | ) | | – | |
| Net decrease in net assets from distributions to shareholders | | | (67,259,128 | ) | | (87,525,686 | ) |
| | | | | | | | |
| CAPITAL SHARE TRANSACTIONS: | | | | | | | |
| Class I Shares | | | | | | | |
| Proceeds from shares sold | | | 121,823,509 | | | 202,766,378 | |
| Reinvestment of distributions | | | 6,606,226 | | | 4,843,785 | |
| Cost of shares redeemed | | | (103,465,701 | ) | | (51,182,167 | ) |
Redemption fees(a) | | | 30,962 | | | 10,143 | |
| Net increase in net assets from capital share transactions | | | 24,994,996 | | | 156,438,139 | |
| | | | | | | | |
| Class R Shares | | | | | | | |
| Proceeds from shares sold | | | 188,454,090 | | | 162,337,603 | |
| Reinvestment of distributions | | | 51,279,929 | | | 73,689,908 | |
| Cost of shares redeemed | | | (237,125,522 | ) | | (285,230,837 | ) |
Redemption fees(a) | | | 100,098 | | | 40,755 | |
| Net increase/(decrease) in net assets from capital share transactions | | | 2,708,595 | | | (49,162,571 | ) |
| | | | | | | | |
| Net Increase/(Decrease) in Net Assets | | | 64,315,402 | | | (39,326,967 | ) |
See Notes to Financial Statements.
| Annual Report | September 30, 2016 | 99 |
RiverNorth Core Opportunity Fund
Statements of Changes in Net Assets
| | | For the Year Ended September 30, 2016 | | For the Year Ended September 30, 2015 | |
| NET ASSETS: | | | | | | | |
| Beginning of period | | | 705,594,643 | | | 744,921,610 | |
| End of period (including accumulated net investment income/(loss) of $(1,265,521) and $1,499,380, respectively) | | $ | 769,910,045 | | $ | 705,594,643 | |
| | | | | | | | |
| OTHER INFORMATION: | | | | | | | |
| Share Transactions: | | | | | | | |
| Class I Shares | | | | | | | |
| Shares sold | | | 11,289,586 | | | 16,413,130 | |
| Shares issued in reinvestment of distributions | | | 619,966 | | | 412,766 | |
| Shares redeemed | | | (9,635,098 | ) | | (4,325,289 | ) |
| Net increase from share transactions | | | 2,274,454 | | | 12,500,607 | |
| | | | | | | | |
| Class R Shares | | | | | | | |
| Shares sold | | | 17,251,837 | | | 13,252,507 | |
| Shares issued in reinvestment of distributions | | | 4,838,916 | | | 6,195,243 | |
| Shares redeemed | | | (22,055,062 | ) | | (23,342,526 | ) |
| Net increase/(decrease) from share transactions | | | 35,691 | | | (3,894,776 | ) |
(a) | The Fund will impose a 2.00% redemption fee on shares redeemed within 90 days of purchase. |
See Notes to Financial Statements.
| 100 | (888) 848-7569 | www.rivernorth.com |
RiverNorth/DoubleLine Strategic Income Fund
Statements of Changes in Net Assets
| | | For the Year Ended September 30, 2016 | | For the Year Ended September 30, 2015 | |
| NET INCREASE/(DECREASE) IN NET ASSETS FROM OPERATIONS: | | | | | | | |
| Net investment income | | $ | 96,592,250 | | $ | 94,422,803 | |
| Net realized gain on Investments and Total return swap contracts | | | 10,688,426 | | | 2,690,640 | |
| Long-term capital gain distributions from other investment companies | | | 487,125 | | | 746,878 | |
| Net change in unrealized depreciation on Investments and Total return swap contracts | | | 62,525,390 | | | (106,092,893 | ) |
| Net increase/(decrease) in net assets resulting from operations | | | 170,293,191 | | | (8,232,572 | ) |
| | | | | | | | |
| DISTRIBUTIONS TO SHAREHOLDERS: | | | | | | | |
| From net investment income: | | | | | | | |
| Class I shares | | | (106,976,753 | ) | | (76,233,640 | ) |
| Class R shares | | | (13,530,672 | ) | | (11,319,592 | ) |
| From net realized gains on investments: | | | | | | | |
| Class I shares | | | – | | | – | |
| Class R shares | | | – | | | – | |
| From tax return of capital | | | | | | | |
| Class I shares | | | (2,958,882 | ) | | – | |
| Class R shares | | | (374,246 | ) | | – | |
| Net decrease in net assets from distributions to shareholders | | | (123,840,553 | ) | | (87,553,232 | ) |
| | | | | | | | |
| CAPITAL SHARE TRANSACTIONS: | | | | | | | |
| Class I Shares | | | | | | | |
| Proceeds from shares sold | | | 712,566,527 | | | 1,037,758,724 | |
| Reinvestment of distributions | | | 76,214,367 | | | 53,794,861 | |
| Cost of shares redeemed | | | (742,568,835 | ) | | (421,391,306 | ) |
Redemption fees(a) | | | 210,017 | | | 113,913 | |
| Net increase in net assets from capital share transactions | | | 46,422,076 | | | 670,276,192 | |
| | | | | | | | |
| Class R Shares | | | | | | | |
| Proceeds from shares sold | | | 68,010,418 | | | 107,924,068 | |
| Reinvestment of distributions | | | 13,444,782 | | | 11,097,338 | |
| Cost of shares redeemed | | | (88,957,417 | ) | | (106,038,721 | ) |
Redemption fees(a) | | | 27,609 | | | 18,215 | |
| Net increase/(decrease) in net assets from capital share transactions | | | (7,474,608 | ) | | 13,000,900 | |
| | | | | | | | |
| Net Increase in Net Assets | | | 85,400,106 | | | 587,491,288 | |
See Notes to Financial Statements.
| Annual Report | September 30, 2016 | 101 |
RiverNorth/DoubleLine Strategic Income Fund
Statements of Changes in Net Assets
| | | For the Year Ended September 30, 2016 | | For the Year Ended September 30, 2015 | |
| NET ASSETS: | | | | | | | |
| Beginning of period | | | 1,968,426,798 | | | 1,380,935,510 | |
| End of period (including accumulated net investment income/(loss) of $(2,056,291) and $11,957,006, respectively) | | $ | 2,053,826,904 | | $ | 1,968,426,798 | |
| | | | | | | | |
| OTHER INFORMATION: | | | | | | | |
| Share Transactions: | | | | | | | |
| Class I Shares | | | | | | | |
| Shares sold | | | 68,830,101 | | | 95,899,127 | |
| Shares issued in reinvestment of distributions | | | 7,369,921 | | | 5,021,948 | |
| Shares redeemed | | | (71,637,895 | ) | | (39,272,763 | ) |
| Net increase from share transactions | | | 4,562,127 | | | 61,648,312 | |
| | | | | | | | |
| Class R Shares | | | | | | | |
| Shares sold | | | 6,550,575 | | | 9,938,360 | |
| Shares issued in reinvestment of distributions | | | 1,299,306 | | | 1,033,082 | |
| Shares redeemed | | | (8,574,332 | ) | | (9,830,536 | ) |
| Net increase/(decrease) from share transactions | | | (724,451 | ) | | 1,140,906 | |
(a) | The Fund will impose a 2.00% redemption fee on shares redeemed within 90 days of purchase. |
See Notes to Financial Statements.
| 102 | (888) 848-7569 | www.rivernorth.com |
RiverNorth Equity Opportunity Fund
Statements of Changes in Net Assets
| | | For the Year Ended September 30, 2016 | | For the Year Ended September 30, 2015 | |
| NET INCREASE/(DECREASE) IN NET ASSETS FROM OPERATIONS: | | | | | | | |
| Net investment income | | $ | 253,625 | | $ | 731 | |
| Net realized gain on Investments | | | 140,179 | | | 483,988 | |
| Long-term capital gain distributions from other investment companies | | | 483,578 | | | 346,786 | |
| Net change in unrealized appreciation/(depreciation) on Investments | | | 702,535 | | | (1,275,718 | ) |
| Net increase/(decrease) in net assets resulting from operations | | | 1,579,917 | | | (444,213 | ) |
| | | | | | | | |
| DISTRIBUTIONS TO SHAREHOLDERS: | | | | | | | |
| From net investment income: | | | | | | | |
| Class I shares | | | (177,925 | ) | | (29,518 | ) |
| Class R shares | | | (76,836 | ) | | (24,018 | ) |
| From net realized gains on investments: | | | | | | | |
| Class I shares | | | (710,462 | ) | | (320,383 | ) |
| Class R shares | | | (306,806 | ) | | (1,704,766 | ) |
| From tax return of capital | | | | | | | |
| Class I shares | | | (9,571 | ) | | – | |
| Class R shares | | | (4,133 | ) | | – | |
| Net decrease in net assets from distributions to shareholders | | | (1,285,733 | ) | | (2,078,685 | ) |
| | | | | | | | |
| CAPITAL SHARE TRANSACTIONS: | | | | | | | |
| Class I Shares | | | | | | | |
| Proceeds from shares sold | | | 8,564,876 | | | 1,148,288 | |
| Reinvestment of distributions | | | 390,892 | | | 328,670 | |
| Cost of shares redeemed | | | (737,128 | ) | | (1,214,017 | ) |
Redemption fees(a) | | | 1,758 | | | 252 | |
| Net increase in net assets from capital share transactions | | | 8,220,398 | | | 263,193 | |
| | | | | | | | |
| Class R Shares | | | | | | | |
| Proceeds from shares sold | | | 675,651 | | | 1,915,408 | |
| Reinvestment of distributions | | | 386,021 | | | 1,687,207 | |
| Cost of shares redeemed | | | (2,678,352 | ) | | (5,188,659 | ) |
Redemption fees(a) | | | 790 | | | 1,032 | |
| Net decrease in net assets from capital share transactions | | | (1,615,890 | ) | | (1,585,012 | ) |
| | | | | | | | |
| Net Increase/(Decrease) in Net Assets | | | 6,898,692 | | | (3,844,717 | ) |
See Notes to Financial Statements.
| Annual Report | September 30, 2016 | 103 |
RiverNorth Equity Opportunity Fund
Statements of Changes in Net Assets| | | For the Year Ended September 30, 2016 | | For the Year Ended September 30, 2015 | |
| NET ASSETS: | | | | | | | |
| Beginning of period | | | 6,900,162 | | | 10,744,879 | |
| End of period (including accumulated net investment income of $– and $–, respectively) | | $ | 13,798,854 | | $ | 6,900,162 | |
| | | | | | | | |
| OTHER INFORMATION: | | | | | | | |
| Share Transactions: | | | | | | | |
| Class I Shares | | | | | | | |
| Shares sold | | | 907,792 | | | 106,790 | |
| Shares issued in reinvestment of distributions | | | 42,801 | | | 30,817 | |
| Shares redeemed | | | (80,079 | ) | | (114,125 | ) |
| Net increase from share transactions | | | 870,514 | | | 23,482 | |
| | | | | | | | |
| Class R Shares | | | | | | | |
| Shares sold | | | 72,428 | | | 164,600 | |
| Shares issued in reinvestment of distributions | | | 42,205 | | | 157,751 | |
| Shares redeemed | | | (289,985 | ) | | (484,450 | ) |
| Net increase/(decrease) from share transactions | | | (175,352 | ) | | 162,099 | |
(a) | The Fund will impose a 2.00% redemption fee on shares redeemed within 90 days of purchase. |
See Notes to Financial Statements.
| 104 | (888) 848-7569 | www.rivernorth.com |
RiverNorth/Oaktree High Income Fund
Statements of Changes in Net Assets
| | | For the Year Ended September 30, 2016 | | | For the Year Ended September 30, 2015 | |
| NET INCREASE/(DECREASE) IN NET ASSETS FROM OPERATIONS: | | | | | | |
| Net investment income | | $ | 4,071,206 | | | $ | 3,920,855 | |
| Net realized gain/(loss) on Investments, Total return swap contracts, Translation of assets and liabilities denominated in foreign currencies and forward foreign currency contracts | | | (3,178,207 | ) | | | 360,262 | |
| Long‐term capital gain distributions from other investment companies | | | 20,217 | | | | 38,611 | |
| Net change in unrealized depreciation on Investments,Translation of assets and liabilities denominated in foreign currencies and forward foreign currency contracts | | | 6,764,746 | | | | (8,191,290 | ) |
| Net increase/(decrease) in net assets resulting from operations | | | 7,677,962 | | | | (3,871,562 | ) |
| | | | | | | | | |
| DISTRIBUTIONS TO SHAREHOLDERS: | | | | | | | | |
| From net investment income: | | | | | | | | |
| Class I Shares | | | (4,642,974 | ) | | | (745,793 | ) |
| Class R Shares | | | (445,943 | ) | | | (3,939,482 | ) |
| From net realized gains on investments: | | | | | | | | |
| Class I Shares | | | – | | | | (304,183 | ) |
| Class R Shares | | | – | | | | (1,190,086 | ) |
| From tax return of capital | | | | | | | | |
| Class I Shares | | | (210,875 | ) | | | – | |
| Class R Shares | | | (20,254 | ) | | | – | |
| Net decrease in net assets from distributions to shareholders | | | (5,320,046 | ) | | | (6,179,544 | ) |
See Notes to Financial Statements.
| Annual Report | September 30, 2016 | 105 |
RiverNorth/Oaktree High Income Fund
Statements of Changes in Net Assets
| | | For the Year Ended September 30, 2016 | | | For the Year Ended September 30, 2015 | |
| CAPITAL SHARE TRANSACTIONS: | | | | | | |
| Class I Shares | | | | | | |
| Proceeds from shares sold | | | 24,410,340 | | | | 64,465,160 | |
| Reinvestment of distributions | | | 4,118,885 | | | | 4,674,696 | |
| Cost of shares redeemed | | | (45,430,640 | ) | | | (41,658,196 | ) |
Redemption fees(a) | | | 13,755 | | | | 2,642 | |
| Net increase/(decrease) in net assets from capital share transactions | | | (16,887,660 | ) | | | 27,484,302 | |
| | | | | | | | | |
| Class R Shares | | | | | | | | |
| Proceeds from shares sold | | | 1,411,129 | | | | 3,720,620 | |
| Reinvestment of distributions | | | 461,945 | | | | 1,045,115 | |
| Cost of shares redeemed | | | (5,289,180 | ) | | | (9,107,176 | ) |
Redemption fees(a) | | | 1,378 | | | | 563 | |
| Net decrease in net assets from capital share transactions | | | (3,414,728 | ) | | | (4,340,878 | ) |
| | | | | | | | | |
| Net Increase/(Decrease) in Net Assets | | | (17,944,472 | ) | | | 13,092,318 | |
| | | | | | | | | |
| NET ASSETS: | | | | | | | | |
| Beginning of period | | | 98,727,973 | | | | 85,635,655 | |
| End of period (including accumulated net investment income/(loss) of $(316,909) and $804,281, respectively) | | $ | 80,783,501 | | | $ | 98,727,973 | |
| | | | | | | | | |
| OTHER INFORMATION: | | | | | | | | |
| Share Transactions: | | | | | | | | |
| Class I Shares | | | | | | | | |
| Shares sold | | | 2,711,494 | | | | 6,602,226 | |
| Shares issued in reinvestment of distributions | | | 454,857 | | | | 480,890 | |
| Shares redeemed | | | (5,034,866 | ) | | | (4,233,471 | ) |
| Net increase/(decrease) from share transactions | | | (1,868,515 | ) | | | 2,849,645 | |
| | | | | | | | | |
| Class R Shares | | | | | | | | |
| Shares sold | | | 155,491 | | | | 377,548 | |
| Shares issued in reinvestment of distributions | | | 51,076 | | | | 107,244 | |
| Shares redeemed | | | (576,858 | ) | | | (932,206 | ) |
| Net decrease from share transactions | | | (370,291 | ) | | | (447,414 | ) |
| (a) | The Fund will impose a 2.00% redemption fee on shares redeemed within 90 days of purchase. |
See Notes to Financial Statements.
| 106 | (888) 848-7569 | www.rivernorth.com |
Intentionally Left Blank
| RiverNorth Core Opportunity Fund | Class I |
Financial Highlights
| Net asset value ‐ beginning of period |
| Income/(Loss) from investment operations: |
Net investment income(b) |
Net realized and unrealized gain/(loss) on investments(b) |
| Total income/(loss) from investment operations |
| |
| Less distributions: |
| From net investment income |
| From net realized gain on investments |
| From tax return of capital |
| Total distributions |
Paid‐in capital from redemption fees(b) |
| Net increase/(decrease) in net asset value |
| Net asset value ‐ end of period |
| |
Total Return(e) |
| |
| Ratios/Supplemental Data: |
| Net assets, end of period (in thousands) |
Ratio of expenses to average net assets excluding fee waivers and reimbursements(g) |
Ratio of expenses to average net assets including fee waivers and reimbursements(g) |
| |
Ratio of net investment income to average net assets excluding fee waivers and reimbursements(g) |
| |
Ratio of net investment income to average net assets including fee waivers and reimbursements(g) |
| Portfolio turnover rate |
| (a) | Commenced operations on August 11, 2014. |
| (b) | Based on average shares outstanding during the period. |
(c) | The amount shown for a share outstanding throughout the period may not correlate with the Statement of Operations for the period due to the timing of sales and redemptions of Fund shares in relation to realized and unrealized gains and losses on investments of the Fund. |
(d) | Less than $0.005 per share. |
| (e) | Total return in the above table represents the rate that the investor would have earned or lost on an investment in the Fund, assuming reinvestment of dividends. |
| (g) | The ratios exclude the impact of expenses of the underlying funds in which the Fund invests as represented in the Schedule of Investments. |
See Notes to Financial Statements.
| 108 | (888) 848-7569 | www.rivernorth.com |
For a share outstanding throughout the periods presented
For the Year Ended September 30, 2016 | | | For theYear Ended September 30, 2015 | | | For the Period ended September 30, 2014(a) | |
| | | | | | | | | | | |
| $ | 10.74 | | | $ | 13.06 | | | $ | 13.16 | |
| | | | | | | | | | | |
| | 0.23 | | | | 0.44 | | | | 0.08 | |
| | 1.33 | | | | (1.30 | ) | | | (0.18 | )(c) |
| | 1.56 | | | | (0.86 | ) | | | (0.10 | ) |
| | | | | | | | | | | |
| | (0.42 | ) | | | (0.60 | ) | | | – | |
| | (0.45 | ) | | | (0.86 | ) | | | – | |
| | (0.10 | ) | | | – | | | | – | |
| | (0.97 | ) | | | (1.46 | ) | | | – | |
| | 0.00 | (d) | | | 0.00 | (d) | | | – | |
| | 0.59 | | | | (2.32 | ) | | | (0.10 | ) |
| $ | 11.33 | | | $ | 10.74 | | | $ | 13.06 | |
| | | | | | | | | | | |
| | 15.35 | % | | | (7.50 | %) | | | (0.76% | )(f) |
| | | | | | | | | | | |
| $ | 201,712 | | | $ | 166,905 | | | $ | 39,623 | |
| | 1.11 | % | | | 1.11 | % | | | 1.20 | %(h) |
| | 1.11 | % | | | 1.11 | % | | | 1.20 | %(h) |
| | 2.11 | % | | | 3.62 | % | | | 2.93 | %(h) |
| | | | | | | | | | | |
| | 2.11 | % | | | 3.62 | % | | | 2.93 | %(h) |
| | 19 | % | | | 23 | % | | | 46 | %(f) |
| Annual Report | September 30, 2016 | 109 |
| RiverNorth Core Opportunity Fund | Class R |
Financial Highlights
| Net asset value - beginning of period |
| Income/(Loss) from investment operations: |
Net investment income(a) |
Net realized and unrealized gain/(loss) on investments(a) |
| Total income/(loss) from investment operations |
| |
| Less distributions: |
| From net investment income |
| From net realized gain on investments |
| From tax return of capital |
| Total distributions |
Paid-in capital from redemption fees(a) |
| Net increase/ (decrease) in net asset value |
| Net asset value - end of period |
| |
Total Return(c) |
| |
| Ratios/Supplemental Data: |
| Net assets, end of period (in thousands) |
Ratio of expenses to average net assets excluding fee waivers and reimbursements(d) |
Ratio of expenses to average net assets including fee waivers and reimbursements(d) |
| |
Ratio of net investment income to average net assets excluding fee waivers and reimbursements(d) |
| |
Ratio of net investment income to average net assets including fee waivers and reimbursements(d) |
| Portfolio turnover rate |
(a) | Based on average shares outstanding during the period. |
(b) | Less than $0.005 per share. |
(c) | Total return in the above table represents the rate that the investor would have earned or lost on an investment in the Fund, assuming reinvestment of dividends. |
(d) | The ratios exclude the impact of expenses of the underlying funds in which the Fund invests as represented in the Schedule of Investments. |
See Notes to Financial Statements.
| 110 | (888) 848-7569 | www.rivernorth.com |
For a share outstanding throughout the periods presented
| For the Year Ended September 30, 2016 | | For the Year Ended September 30, 2015 | | For the Year Ended September 30, 2014 | | For the Year Ended September 30, 2013 | | For the Year Ended September 30, 2012 | |
| $ | 10.74 | | $ | 13.05 | | $ | 12.65 | | $ | 12.37 | | $ | 11.18 | |
| | | | | | | | | | | | | | | |
| | 0.20 | | | 0.39 | | | 0.32 | | | 0.20 | | | 0.20 | |
| | 1.32 | | | (1.27 | ) | | 1.00 | | | 0.96 | | | 2.01 | |
| | 1.52 | | | (0.88 | ) | | 1.32 | | | 1.16 | | | 2.21 | |
| | | | | | | | | | | | | | | |
| | | | | | | | | | | | | | | |
| | (0.40 | ) | | (0.57 | ) | | (0.24 | ) | | (0.35 | ) | | (0.50 | ) |
| | (0.45 | ) | | (0.86 | ) | | (0.68 | ) | | (0.53 | ) | | (0.52 | ) |
| | (0.09 | ) | | – | | | – | | | – | | | – | |
| | (0.94 | ) | | (1.43 | ) | | (0.92 | ) | | (0.88 | ) | | (1.02 | ) |
| | 0.00 | (b) | | 0.00 | (b) | | 0.00 | (b) | | 0.00 | (b) | | 0.00 | (b) |
| | 0.58 | | | (2.31 | ) | | 0.40 | | | 0.28 | | | 1.19 | |
| $ | 11.32 | | $ | 10.74 | | $ | 13.05 | | $ | 12.65 | | $ | 12.37 | |
| | | | | | | | | | | | | | | |
| | 14.98 | % | | (7.67 | %) | | 10.81 | % | | 10.08 | % | | 21.05 | % |
| | | | | | | | | | | | | | | |
| | | | | | | | | | | | | | | |
| $ | 568,198 | | $ | 538,689 | | $ | 705,299 | | $ | 647,365 | | $ | 569,324 | |
| | 1.36 | % | | 1.35 | % | | 1.37 | % | | 1.35 | % | | 1.36 | % |
| | 1.36 | % | | 1.35 | % | | 1.37 | % | | 1.35 | % | | 1.36 | % |
| | | | | | | | | | | | | | | |
| | 1.90 | % | | 3.16 | % | | 2.60 | % | | 1.66 | % | | 1.74 | % |
| | | | | | | | | | | | | | | |
| | 1.90 | % | | 3.16 | % | | 2.60 | % | | 1.66 | % | | 1.74 | % |
| | 19 | % | | 23 | % | | 46 | % | | 46 | % | | 30 | % |
| Annual Report | September 30, 2016 | 111 |
| RiverNorth/DoubleLine Strategic Income Fund | Class I |
Financial Highlights
| Net asset value - beginning of period |
| Income from investment operations: |
Net investment income(a) |
Net realized and unrealized gain/ (loss) on investments(a) |
| Total income from investment operations |
| |
| Less distributions: |
| From net investment income |
| From net realized gain on investments |
| From tax return of capital |
| Total distributions |
Paid-in capital from redemption fees(a) |
| Net increase/(decrease) in net asset value |
| Net asset value - end of period |
| |
Total Return(c) |
| |
| Ratios/Supplemental Data: |
| Net assets, end of period (in thousands) |
Ratio of expenses to average net assets excluding fee waivers and reimbursements(d) |
Ratio of expenses to average net assets including fee waivers and reimbursements(d) |
| |
Ratio of net investment income to average net assets excluding fee waivers and reimbursements(d) |
| |
Ratio of net investment income to average net assets including fee waivers and reimbursements(d) |
| Portfolio turnover rate |
(a) | Based on average shares outstanding during the period. |
(b) | Less than $0.005 per share. |
(c) | Total return in the above table represents the rate that the investor would have earned or lost on an investment in the Fund, assuming reinvestment of dividends. |
(d) | The ratios exclude the impact of expenses of the underlying funds in which the Fund invests as represented in the Schedule of Investments. |
See Notes to Financial Statements.
| 112 | (888) 848-7569 | www.rivernorth.com |
For a share outstanding throughout the periods presented
| For the Year Ended September 30, 2016 | | | For the Year Ended September 30, 2015 | | | For the Year Ended September 30, 2014 | | | For the Year Ended September 30, 2013 | | | For the Year Ended September 30, 2012 | |
| $ | 10.37 | | | $ | 10.88 | | | $ | 10.62 | | | $ | 11.33 | | | $ | 10.59 | |
| | | | | | | | | | | | | | | | | | | |
| | 0.51 | | | | 0.56 | | | | 0.59 | | | | 0.52 | | | | 0.57 | |
| | 0.39 | | | | (0.55 | ) | | | 0.38 | | | | (0.51 | ) | | | 0.82 | |
| | 0.90 | | | | 0.01 | | | | 0.97 | | | | 0.01 | | | | 1.39 | |
| | | | | | | | | | | | | | | | | | | |
| | | | | | | | | | | | | | | | | | | |
| | (0.64 | ) | | | (0.52 | ) | | | (0.66 | ) | | | (0.63 | ) | | | (0.63 | ) |
| | – | | | | – | | | | (0.05 | ) | | | (0.09 | ) | | | (0.02 | ) |
| | (0.02 | ) | | | – | | | | – | | | | – | | | | – | |
| | (0.66 | ) | | | (0.52 | ) | | | (0.71 | ) | | | (0.72 | ) | | | (0.65 | ) |
| | 0.00 | (b) | | | 0.00 | (b) | | | 0.00 | (b) | | | 0.00 | (b) | | | 0.00 | (b) |
| | 0.24 | | | | (0.51 | ) | | | 0.26 | | | | (0.71 | ) | | | 0.74 | |
| $ | 10.61 | | | $ | 10.37 | | | $ | 10.88 | | | $ | 10.62 | | | $ | 11.33 | |
| | | | | | | | | | | | | | | | | | | |
| | 9.00 | % | | | 0.04 | % | | | 9.38 | % | | | (0.03 | %) | | | 13.56 | % |
| | | | | | | | | | | | | | | | | | | |
| | | | | | | | | | | | | | | | | | | |
| $ | 1,822,874 | | | $ | 1,735,108 | | | $ | 1,148,744 | | | $ | 785,974 | | | $ | 878,631 | |
| | 0.86 | % | | | 0.86 | % | | | 0.91 | % | | | 0.89 | % | | | 0.90 | % |
| | 0.86 | % | | | 0.86 | % | | | 0.91 | % | | | 0.89 | % | | | 0.90 | % |
| | | | | | | | | | | | | | | | | | | |
| | 4.92 | % | | | 5.24 | % | | | 5.47 | % | | | 4.68 | % | | | 5.20 | % |
| | | | | | | | | | | | | | | | | | | |
| | 4.92 | % | | | 5.24 | % | | | 5.47 | % | | | 4.68 | % | | | 5.20 | % |
| | 36 | % | | | 29 | % | | | 56 | % | | | 80 | % | | | 74 | % |
| Annual Report | September 30, 2016 | 113 |
| RiverNorth/DoubleLine Strategic Income Fund | Class R |
Financial Highlights
| Net asset value - beginning of period |
| Income/(loss) from investment operations: |
Net investment income(a) |
Net realized and unrealized gain/ (loss) on investments(a) |
| Total income/(loss) from investment operations |
| |
| Less distributions: |
| From net investment income |
| From net realized gain on investments |
| From tax return of capital |
| Total distributions |
Paid-in capital from redemption fees(a) |
| Net increase/(decrease) in net asset value |
| Net asset value - end of period |
| |
Total Return(c) |
| |
| Ratios/Supplemental Data: |
| Net assets, end of period (in thousands) |
Ratio of expenses to average net assets excluding fee waivers and reimbursements(d) |
Ratio of expenses to average net assets including fee waivers and reimbursements(d) |
| |
Ratio of net investment income to average net assets excluding fee waivers and reimbursements(d) |
| |
Ratio of net investment income to average net assets including fee waivers and reimbursements(d) |
| Portfolio turnover rate |
(a) | Based on average shares outstanding during the period. |
(b) | Less than $0.005 per share. |
(c) | Total return in the above table represents the rate that the investor would have earned or lost on an investment in the Fund, assuming reinvestment of dividends. |
(d) | The ratios exclude the impact of expenses of the underlying funds in which the Fund invests as represented in the Schedule of Investments. |
See Notes to Financial Statements.
| 114 | (888) 848-7569 | www.rivernorth.com |
For a share outstanding throughout the periods presented
| For the Year Ended September 30, 2016 | | | For the Year Ended September 30, 2015 | | | For the Year Ended September 30, 2014 | | | For the Year Ended September 30, 2013 | | | For the Year Ended September 30, 2012 | |
| $ | 10.39 | | | $ | 10.89 | | | $ | 10.63 | | | $ | 11.34 | | | $ | 10.60 | |
| | | | | | | | | | | | | | | | | | | |
| | 0.49 | | | | 0.54 | | | | 0.57 | | | | 0.49 | | | | 0.54 | |
| | 0.37 | | | | (0.55 | ) | | | 0.38 | | | | (0.51 | ) | | | 0.82 | |
| | 0.86 | | | | (0.01 | ) | | | 0.95 | | | | (0.02 | ) | | | 1.36 | |
| | | | | | | | | | | | | | | | | | | |
| | | | | | | | | | | | | | | | | | | |
| | (0.61 | ) | | | (0.49 | ) | | | (0.64 | ) | | | (0.60 | ) | | | (0.61 | ) |
| | – | | | | – | | | | (0.05 | ) | | | (0.09 | ) | | | (0.02 | ) |
| | (0.02 | ) | | | – | | | | – | | | | – | | | | – | |
| | (0.63 | ) | | | (0.49 | ) | | | (0.69 | ) | | | (0.69 | ) | | | (0.63 | ) |
| | 0.00 | (b) | | | 0.00 | (b) | | | 0.00 | (b) | | | 0.00 | (b) | | | 0.01 | |
| | 0.23 | | | | (0.50 | ) | | | 0.26 | | | | (0.71 | ) | | | 0.74 | |
| $ | 10.62 | | | $ | 10.39 | | | $ | 10.89 | | | $ | 10.63 | | | $ | 11.34 | |
| | | | | | | | | | | | | | | | | | | |
| | 8.62 | % | | | (0.12 | %) | | | 9.09 | % | | | (0.29 | %) | | | 13.28 | % |
| | | | | | | | | | | | | | | | | | | |
| | | | | | | | | | | | | | | | | | | |
| $ | 230,953 | | | $ | 233,319 | | | $ | 232,191 | | | $ | 270,560 | | | $ | 453,520 | |
| | 1.11 | % | | | 1.11 | % | | | 1.16 | % | | | 1.14 | % | | | 1.15 | % |
| | 1.11 | % | | | 1.11 | % | | | 1.16 | % | | | 1.14 | % | | | 1.15 | % |
| | | | | | | | | | | | | | | | | | | |
| | 4.67 | % | | | 4.97 | % | | | 5.26 | % | | | 4.40 | % | | | 4.96 | % |
| | | | | | | | | | | | | | | | | | | |
| | 4.67 | % | | | 4.97 | % | | | 5.26 | % | | | 4.40 | % | | | 4.96 | % |
| | 36 | % | | | 29 | % | | | 56 | % | | | 80 | % | | | 74 | % |
| Annual Report | September 30, 2016 | 115 |
| RiverNorth Equity Opportunity Fund | Class I |
Financial Highlights
| Net asset value - beginning of period |
| Income/(loss) from investment operations: |
Net investment income/(loss)(b) |
Net realized and unrealized gain/(loss) on investments(b) |
| Total income/(loss) from investment operations |
| |
| Less distributions: |
| From net investment income |
| From net realized gain on investments |
| From tax return of capital |
| Total distributions |
Paid-in capital from redemption fees(b) |
| Net increase/(decrease) in net asset value |
| Net asset value - end of period |
| |
Total Return(d) |
| |
| Ratios/Supplemental Data: |
| Net assets, end of period (in thousands) |
| |
Ratio of expenses to average net assets excluding fee waivers and reimbursements(f) |
| |
Ratio of expenses to average net assets including fee waivers and reimbursements(f) |
Ratio of net investment income/(loss) to average net assets excluding fee waivers and reimbursements(f) |
Ratio of net investment income/(loss) to average net assets including fee waivers and reimbursements(f) |
(a) | Prior to January 1, 2014, the RiverNorth Equity Opportunity Fund was known as the RiverNorth/Manning & Napier Dividend Income Fund. |
(b) | Based on average shares outstanding during the period. |
(c) | Less than $0.005 per share. |
(d) | Total return in the above table represents the rate that the investor would have earned or lost on an investment in the Fund, assuming reinvestment of dividends. |
(f) | The ratios exclude the impact of expenses of the underlying funds in which the Fund invests as represented in the Schedule of Investments. |
See Notes to Financial Statements.
| 116 | (888) 848-7569 | www.rivernorth.com |
For a share outstanding throughout the periods presented
| For the Year Ended September 30, 2016 | | | For the Year Ended September 30, 2015 | | | For the Year Ended September 30, 2014(a) | | | For the Year Ended September 30, 2013 | | | For the Period July 18, 2012 (Inception) to September 30, 2012 | |
| $ | 9.25 | | | $ | 12.15 | | | $ | 11.68 | | | $ | 10.42 | | | $ | 10.00 | |
| | | | | | | | | | | | | | | | | | | |
| | 0.18 | | | | (0.01 | ) | | | 0.17 | | | | 0.22 | | | | 0.02 | |
| | 1.02 | | | | (0.59 | ) | | | 1.48 | | | | 1.50 | | | | 0.42 | |
| | 1.20 | | | | (0.60 | ) | | | 1.65 | | | | 1.72 | | | | 0.44 | |
| | | | | | | | | | | | | | | | | | | |
| | | | | | | | | | | | | | | | | | | |
| | (0.17 | ) | | | (0.41 | ) | | | (0.55 | ) | | | (0.39 | ) | | | (0.02 | ) |
| | (0.69 | ) | | | (1.89 | ) | | | (0.63 | ) | | | (0.08 | ) | | | – | |
| | (0.01 | ) | | | – | | | | – | | | | – | | | | – | |
| | (0.87 | ) | | | (2.30 | ) | | | (1.18 | ) | | | (0.47 | ) | | | (0.02 | ) |
| | 0.00 | (c) | | | 0.00 | (c) | | | 0.00 | (c) | | | 0.01 | | | | – | |
| | 0.33 | | | | (2.90 | ) | | | 0.47 | | | | 1.26 | | | | 0.42 | |
| $ | 9.58 | | | $ | 9.25 | | | $ | 12.15 | | | $ | 11.68 | | | $ | 10.42 | |
| | | | | | | | | | | | | | | | | | | |
| | 13.60 | % | | | (6.99 | %) | | | 14.52 | % | | | 16.99 | % | | | 4.44 | %(e) |
| | | | | | | | | | | | | | | | | | | |
| | | | | | | | | | | | | | | | | | | |
| $ | 10,079 | | | $ | 1,683 | | | $ | 1,925 | | | $ | 3,067 | | | $ | 1,069 | |
| | 1.74 | % | | | 2.00 | % | | | 2.03 | % | | | 1.98 | % | | | 6.16 | %(g) |
| | 1.35 | % | | | 1.35 | % | | | 1.35 | % | | | 1.35 | % | | | 1.35 | %(g) |
| | 1.55 | % | | | (0.71 | %) | | | 0.76 | % | | | 1.33 | % | | | (3.92 | %)(g) |
| | 1.95 | % | | | (0.05 | %) | | | 1.44 | % | | | 1.96 | % | | | 0.89 | %(g) |
| | 88 | % | | | 51 | % | | | 107 | % | | | 100 | % | | | 13 | %(e) |
| Annual Report | September 30, 2016 | 117 |
| RiverNorth Equity Opportunity Fund | Class R |
Financial Highlights
| Net asset value - beginning of period |
| Income/(loss) from investment operations: |
Net investment income(b) |
Net realized and unrealized gain/(loss) on investments(b) |
| Total income/(loss) from investment operations |
| |
| Less distributions: |
| From net investment income |
| From net realized gain on investments |
| From tax return of capital |
| Total distributions |
Paid-in capital from redemption fees(b) |
| Net increase/(decrease) in net asset value |
| Net asset value - end of period |
| |
Total Return(d) |
| |
| Ratios/Supplemental Data: |
| Net assets, end of period (in thousands) |
| |
Ratio of expenses to average net assets excluding fee waivers and reimbursements(f) |
| |
Ratio of expenses to average net assets including fee waivers and reimbursements(f) |
Ratio of net investment income/(loss) to average net assets excluding fee waivers and reimbursements(f) |
(a) | Prior to January 1, 2014, the RiverNorth Equity Opportunity Fund was known as the RiverNorth/Manning & Napier Dividend Income Fund. |
(b) | Based on average shares outstanding during the period. |
(c) | Less than $0.005 per share. |
(d) | Total return in the above table represents the rate that the investor would have earned or lost on an investment in the Fund, assuming reinvestment of dividends. |
(f) | The ratios exclude the impact of expenses of the underlying funds in which the Fund invests as represented in the Schedule of Investments. |
See Notes to Financial Statements.
| 118 | (888) 848-7569 | www.rivernorth.com |
For a share outstanding throughout the periods presented
| For the Year Ended September 30, 2016 | | | For the Year Ended September 30, 2015 | | | For the Year Ended September 30, 2014(a) | | | For the Year Ended September 30, 2013 | | | For the Period July 18, 2012 (Inception) to September 30, 2012 | |
| $ | 9.25 | | | $ | 12.15 | | | $ | 11.68 | | | $ | 10.42 | | | $ | 10.00 | |
| | | | | | | | | | | | | | | | | | | |
| | 0.15 | | | | 0.00 | (c) | | | 0.13 | | | | 0.19 | | | | 0.01 | |
| | 1.01 | | | | (0.62 | ) | | | 1.48 | | | | 1.51 | | | | 0.44 | |
| | 1.16 | | | | (0.62 | ) | | | 1.61 | | | | 1.70 | | | | 0.45 | |
| | | | | | | | | | | | | | | | | | | |
| | | | | | | | | | | | | | | | | | | |
| | (0.16 | ) | | | (0.39 | ) | | | (0.52 | ) | | | (0.37 | ) | | | (0.03 | ) |
| | (0.67 | ) | | | (1.89 | ) | | | (0.62 | ) | | | (0.08 | ) | | | – | |
| | (0.01 | ) | | | – | | | | – | | | | – | | | | – | |
| | (0.84 | ) | | | (2.28 | ) | | | (1.14 | ) | | | (0.45 | ) | | | (0.03 | ) |
| | 0.00 | (c) | | | 0.00 | (c) | | | 0.00 | (c) | | | 0.01 | | | | 0.00 | (c) |
| | 0.32 | | | | (2.90 | ) | | | 0.47 | | | | 1.26 | | | | 0.42 | |
| $ | 9.57 | | | $ | 9.25 | | | $ | 12.15 | | | $ | 11.68 | | | $ | 10.42 | |
| | | | | | | | | | | | | | | | | | | |
| | 13.22 | % | | | (7.20 | %) | | | 14.22 | % | | | 16.75 | % | | | 4.46 | %(e) |
| | | | | | | | | | | | | | | | | | | |
| | | | | | | | | | | | | | | | | | | |
| $ | 3,720 | | | $ | 5,217 | | | $ | 8,820 | | | $ | 10,923 | | | $ | 6,282 | |
| | | | | | | | | | | | | | | | | | | |
| | 1.99 | % | | | 2.22 | % | | | 2.28 | % | | | 2.21 | % | | | 6.21 | %(g) |
| | | | | | | | | | | | | | | | | | | |
| | 1.60 | % | | | 1.60 | % | | | 1.60 | % | | | 1.60 | % | | | 1.60 | %(g) |
| | | | | | | | | | | | | | | | | | | |
| | 1.20 | % | | | (0.60 | %) | | | 0.41 | % | | | 1.09 | % | | | (4.12 | %)(g) |
| | | | | | | | | | | | | | | | | | | |
| | 1.59 | % | | | 0.02 | % | | | 1.09 | % | | | 1.71 | % | | | 0.49 | %(g) |
| | 88 | % | | | 51 | % | | | 107 | % | | | 100 | % | | | 13 | %(e) |
| Annual Report | September 30, 2016 | 119 |
| RiverNorth/Oaktree High Income Fund | Class I |
| Financial Highlights | For a share outstanding throughout the periods presented |
| | | For the Year Ended September 30, 2016 | | | For the Year Ended September 30, 2015 | | | For the Year Ended September 30, 2014 | | | For the Period December 28, 2012 (Inception) to September 30, 2013 | |
| | | | | | | | | | | | | |
| Net asset value - beginning of period | | $ | 9.18 | | | $ | 10.25 | | | $ | 9.95 | | | $ | 10.00 | |
| Income/(loss) from investment operations: | |
Net investment income(a) | | | 0.44 | | | | 0.43 | | | | 0.47 | | | | 0.22 | |
Net realized and unrealized gain/(loss) on investments(a) | | | 0.44 | | | | (0.77 | ) | | | 0.33 | | | | (0.07 | ) |
| Total income/(loss) from investment operations | | | 0.88 | | | | (0.34 | ) | | | 0.80 | | | | 0.15 | |
| | | | | | | | | | | | | | | | | |
| Less distributions: | |
| From net investment income | | | (0.55 | ) | | | (0.53 | ) | | | (0.50 | ) | | | (0.20 | ) |
| From net realized gain on investments | | | – | | | | (0.20 | ) | | | – | | | | – | |
| From tax return of capital | | | (0.03 | ) | | | – | | | | – | | | | – | |
| Total distributions | | | (0.58 | ) | | | (0.73 | ) | | | (0.50 | ) | | | (0.20 | ) |
Paid-in capital from redemption fees(a) | | | 0.00 | (b) | | | 0.00 | (b) | | | 0.00 | (b) | | | 0.00 | (b) |
| Net increase/(decrease) in net asset value | | | 0.30 | | | | (1.07 | ) | | | 0.30 | | | | (0.05 | ) |
| Net asset value - end of period | | $ | 9.48 | | | $ | 9.18 | | | $ | 10.25 | | | $ | 9.95 | |
| | | | | | | | | | | | | | | | | |
Total Return(c) | | | 10.09 | % | | | (3.50 | %) | | | 8.16 | % | | | 1.52 | %(d) |
See Notes to Financial Statements.
120 | (888) 848-7569 | www.rivernorth.com |
| RiverNorth/Oaktree High Income Fund | Class I |
| Financial Highlights | For a share outstanding throughout the periods presented |
| | | For the Year Ended September 30, 2016 | | | For the Year Ended September 30, 2015 | | | For the Year Ended September 30, 2014 | | | For the Period December 28, 2012 (Inception) to September 30, 2013 | |
| Supplemental Data: | |
| Net assets, end of period (in thousands) | | $ | 73,580 | | | $ | 88,360 | | | $ | 69,473 | | | $ | 25,472 | |
| Ratios to Average Net Assets (including interest expense) | | | | | | | | | | | | | | | | |
Ratio of expenses to average net assets excluding fee waivers and reimbursements(e) | | | 1.34 | %(f) | | | 1.36 | %(f) | | | 1.39 | % | | | 1.58 | %(g) |
Ratio of expenses to average net assets including fee waivers and reimbursements(e) | | | 1.34 | %(f) | | | 1.36 | %(f) | | | 1.35 | % | | | 1.35 | %(g) |
Ratio of net investment income to average net assets excluding fee waivers and reimbursements(e) | | | 4.86 | %(f) | | | 4.40 | %(f) | | | 4.45 | % | | | 2.65 | %(g) |
Ratio of net investment income to average net assets including fee waivers and reimbursements(e) | | | 4.86 | %(f) | | | 4.40 | %(f) | | | 4.49 | % | | | 2.88 | %(g) |
| | | | | | | | | | | | | | | | | |
| Ratios to Average Net Assets (excluding interest expense) | | | | | | | | | | | | | | | | |
Ratio of expenses to average net assets excluding fee waivers and reimbursements(e) | | | 1.34 | %(f) | | | 1.35 | %(f) | | | N/A | | | | N/A | |
Ratio of expenses to average net assets including fee waivers and reimbursements(e) | | | 1.34 | %(f) | | | 1.35 | %(f) | | | N/A | | | | N/A | |
Ratio of net investment income to average net assets excluding fee waivers and reimbursements(e) | | | 4.86 | %(f) | | | 4.41 | %(f) | | | N/A | | | | N/A | |
Ratio of net investment income to average net assets including fee waivers and reimbursements(e) | | | 4.86 | %(f) | | | 4.41 | %(f) | | | N/A | | | | N/A | |
| Portfolio turnover rate | | | 40 | % | | | 70 | % | | | 91 | % | | | 117 | %(d) |
| (a) | Based on average shares outstanding during the period. |
| (b) | Less than $0.005 per share. |
| (c) | Total return in the above table represents the rate that the investor would have earned or lost on an investment in the Fund, assuming reinvestment of dividends. |
Annual Report | September 30, 2016 | 121 |
| RiverNorth/Oaktree High Income Fund | Class I |
| Financial Highlights | For a share outstanding throughout the periods presented |
| (e) | The ratios exclude the impact of expenses of the underlying funds in which the Fund invests as represented in the Schedule of Investments. |
| (f) | The portion of the ratios attributable to recoupments for the year ended September 30, 2015 is 0.06% and 0.00% for the year ended September 30, 2016. |
See Notes to Financial Statements.
122 | (888) 848-7569 | www.rivernorth.com |
| RiverNorth/Oaktree High Income Fund | Class R |
| Financial Highlights | For a share outstanding throughout the periods presented |
| | | For the Year Ended September 30, 2016 | | | For the Year Ended September 30, 2015 | | | For the Year Ended September 30, 2014 | | | For the Period December 28, 2012 (Inception) to September 30, 2013 | |
| | | | | | | | | | | | | |
| Net asset value - beginning of period | | $ | 9.17 | | | $ | 10.24 | | | $ | 9.95 | | | $ | 10.00 | |
| Income/(loss) from investment operations: | |
Net investment income(a) | | | 0.43 | | | | 0.41 | | | | 0.46 | | | | 0.21 | |
Net realized and unrealized gain/(loss) on investments(a) | | | 0.43 | | | | (0.77 | ) | | | 0.31 | | | | (0.07 | ) |
| Total income/(loss) from investment operations | | | 0.86 | | | | (0.36 | ) | | | 0.77 | | | | 0.14 | |
| | | | | | | | | | | | | | | | | |
| Less distributions: | |
| From net investment income | | | (0.54 | ) | | | (0.51 | ) | | | (0.48 | ) | | | (0.19 | ) |
| | | | | | | | | | | | | | | | | |
| From net realized gain on investments | | | – | | | | (0.20 | ) | | | – | | | | – | |
| From tax return of capital | | | (0.02 | ) | | | – | | | | – | | | | – | |
| Total distributions | | | (0.56 | ) | | | (0.71 | ) | | | (0.48 | ) | | | (0.19 | ) |
| | | | | | | | | | | | | | | | | |
Paid-in capital from redemption fees(a) | | | 0.00 | (b) | | | 0.00 | (b) | | | 0.00 | (b) | | | 0.00 | (b) |
| | | | | | | | | | | | | | | | | |
| Net increase/(decrease) in net asset value | | | 0.30 | | | | (1.07 | ) | | | 0.29 | | | | (0.05 | ) |
| Net asset value - end of period | | $ | 9.47 | | | $ | 9.17 | | | $ | 10.24 | | | $ | 9.95 | |
| | | | | | | | | | | | | | | | | |
Total Return(c) | | | 9.83 | % | | | (3.76 | %) | | | 7.78 | % | | | 1.38 | %(d) |
Annual Report | September 30, 2016 | 123 |
| RiverNorth/Oaktree High Income Fund | Class R |
| Financial Highlights | For a share outstanding throughout the periods presented |
| | | For the Year Ended September 30, 2016 | | | For the Year Ended September 30, 2015 | | | For the Year Ended September 30, 2014 | | | For the Period December 28, 2012 (Inception) to September 30, 2013 | |
| Supplemental Data: | |
| | |
| Net assets, end of period (in thousands) | | $ | 7,203 | | | $ | 10,368 | | | $ | 16,163 | | | $ | 22,115 | |
| Ratios to Average Net Assets (including interest expense) | | | | | | | | | | | | | | | | |
Ratio of expenses to average net assets excluding fee waivers and reimbursements(e) | | | 1.62 | %(f) | | | 1.61 | %(f) | | | 1.63 | % | | | 1.80 | %(g) |
Ratio of expenses to average net assets including fee waivers and reimbursements(e) | | | 1.60 | %(f) | | | 1.61 | %(f) | | | 1.60 | % | | | 1.60 | %(g) |
Ratio of net investment income to average net assets excluding fee waivers and reimbursements(e) | | | 4.69 | %(f) | | | 4.14 | %(f) | | | 4.40 | % | | | 2.60 | %(g) |
Ratio of net investment income to average net assets including fee waivers and reimbursements(e) | | | 4.71 | %(f) | | | 4.14 | %(f) | | | 4.43 | % | | | 2.80 | %(g) |
| | | | | | | | | | | | | | | | | |
| Ratios to Average Net Assets (excluding interest expense) | | | | | | | | | | | | | | | | |
Ratio of expenses to average net assets excluding fee waivers and reimbursements(e) | | | 1.62 | %(f) | | | 1.60 | %(f) | | | N/A | | | | N/A | (g) |
Ratio of expenses to average net assets including fee waivers and reimbursements(e) | | | 1.60 | %(f) | | | 1.60 | %(f) | | | N/A | | | | N/A | (g) |
Ratio of net investment income to average net assets excluding fee waivers and reimbursements(e) | | | 4.69 | %(f) | | | 4.15 | %(f) | | | N/A | | | | N/A | (g) |
Ratio of net investment income to average net assets including fee waivers and reimbursements(e) | | | 4.71 | %(f) | | | 4.15 | %(f) | | | N/A | | | | N/A | (g) |
| Portfolio turnover rate | | | 40 | % | | | 70 | % | | | 91 | % | | | 117 | %(d) |
See Notes to Financial Statements.
124 | (888) 848-7569 | www.rivernorth.com |
| RiverNorth/Oaktree High Income Fund | Class R |
| Financial Highlights | For a share outstanding throughout the periods presented |
| (a) | Based on average shares outstanding during the period. |
| (b) | Less than $0.005 per share. |
| (c) | Total return in the above table represents the rate that the investor would have earned or lost on an investment in the Fund, assuming reinvestment of dividends. |
| (e) | The ratios exclude the impact of expenses of the underlying funds in which the Fund invests as represented in the Schedule of Investments. |
| (f) | The portion of the ratios attributable to recoupments for the year ended September 30, 2015 is 0.07% and 0.01% for the year ended September 30, 2016. |
Annual Report | September 30, 2016 | 125 |
RiverNorth Funds | Notes to Financial Statements |
September 30, 2016
1. ORGANIZATION
The RiverNorth Funds (the “Trust” or “Funds”) was established under the laws of Ohio by an Agreement and Declaration of Trust dated July 18, 2006 (the “Trust Agreement”). The Trust is an open-end management investment company registered under the Investment Company Act of 1940, as amended (the “1940 Act”). The Trust Agreement permits the Board of Trustees (the “Board” or “Trustees”) to authorize and issue an unlimited number of shares of beneficial interest of a separate series without par value. All classes of shares for each of the Funds have identical rights to earnings, assets and voting privileges, except for class- specific expenses and exclusive rights to vote on matters affecting only individual classes. The Funds are considered investment companies and therefore follow the Investment Company accounting and reporting guidance of the Financial Accounting Standards Board (“FASB”) Accounting Standards Codification Topic 946 Financial Services Investment Companies.
The RiverNorth Core Opportunity Fund (the “Core Opportunity Fund”) was organized as a diversified series of the Trust on July 18, 2006 and commenced investment operations on December 27, 2006. The Core Opportunity Fund offers two series of shares, Class I Shares and Class R Shares. The investment adviser to the Core Opportunity Fund is RiverNorth Capital Management, LLC (the “Adviser”). The investment objective of the Core Opportunity Fund is to seek long- term capital appreciation and income.
The RiverNorth/DoubleLine Strategic Income Fund (the “Strategic Income Fund”) is a diversified series of the Trust and commenced investment operations on December 30, 2010. The Strategic Income Fund offers two series of shares, Class I Shares and Class R Shares. The investment adviser to the Strategic Income Fund is RiverNorth Capital Management, LLC. The Strategic Income Fund’s sub- adviser is DoubleLine Capital, LP (“DoubleLine”). The investment objective of the Strategic Income Fund is current income and overall total return.
The RiverNorth Equity Opportunity Fund (the “Equity Opportunity Fund”) is a diversified series of the Trust and commenced investment operations on July 18, 2012. The Equity Opportunity Fund offers two series of shares, Class I Shares and Class R Shares. The investment adviser to the Equity Opportunity Fund is RiverNorth Capital Management, LLC. The investment objective of the Equity Opportunity Fund is overall total return consisting of long- term capital appreciation and income. Prior to January 1, 2014 the name of the Equity Opportunity Fund was the RiverNorth/Manning & Napier Dividend Income Fund and the sub- adviser was Manning & Napier, Advisors, LLC. On January 28, 2014 the strategy of the RiverNorth Equity Opportunity Fund changed to permit the RiverNorth Equity Opportunity Fund to gain exposure to the equity markets through exchange-traded funds rather than individual dividend- paying stocks.
The RiverNorth/Oaktree High Income Fund (the “High Income Fund”) is a diversified series of the Trust and commenced investment operations on December 28, 2012. The High Income Fund offers two series of shares, Class I Shares and Class R Shares. The investment adviser to the High Income Fund is RiverNorth Capital Management, LLC. The High Income Fund’s sub-adviser is Oaktree Capital Management, L.P. (“Oaktree Capital,” and with DoubleLine, each a “Sub-Adviser” or collectively, the “Sub-Advisers”). The investment objective of the High Income Fund is overall total return consisting of long- term capital appreciation and income.
126 | (888) 848-7569 | www.rivernorth.com |
RiverNorth Funds | Notes to Financial Statements |
September 30, 2016
2. SIGNIFICANT ACCOUNTING POLICIES
The following is a summary of significant accounting policies followed by the Funds. These policies are in conformity with generally accepted accounting principles in the United States of America (“GAAP”). The preparation of financial statements in accordance with GAAP requires management to make estimates and assumptions that affect the reported amounts and disclosures in the financial statements during the reporting period. Management believes the estimates and security valuations are appropriate; however, actual results may differ from those estimates, and the security valuations reflected in the financial statements may differ from the value the Funds ultimately realize upon sale of the securities. The financial statements have been prepared as of the close of the New York Stock Exchange (“NYSE”) on September 30, 2016.
Security Valuation: The Funds’ assets and other financial instruments are generally valued at their fair value using market quotations. If a market value quotation is unavailable a security may be valued at its estimated fair value as described in Note 3.
Security Transactions and Related Income: The Funds follow industry practice and record security transactions on the trade date basis. The specific identification method is used for determining gains or losses for financial statements and income tax purposes. Dividend income is recorded on the ex-dividend date or for certain foreign securities, when the information becomes available to the Funds and interest income and expenses are recorded on an accrual basis. Discounts and premiums on securities purchased are amortized or accreted using the effective interest method. Withholding taxes on foreign dividends have been provided for in accordance with the Funds’ understanding of the applicable country’s tax rules and rates. The ability of issuers of debt securities held by the Funds to meet their obligations may be affected by economic and political developments in a specific country or region.
Foreign Currency Translation: The books and records of the Funds are maintained in U.S. dollars. Investment valuations and other assets and liabilities initially expressed in foreign currencies are converted each business day into U.S. dollars based upon current exchange rates. Prevailing foreign exchange rates may generally be obtained at the close of the NYSE (normally, 4:00 p.m. Eastern time). The portion of realized and unrealized gains or losses on investments due to fluctuations in foreign currency exchange rates is not separately disclosed and is included in realized and unrealized gains or losses on investments, when applicable.
Foreign Securities: The Funds may directly purchase securities of foreign issuers. Investing in securities of foreign issuers involves special risks not typically associated with investing in securities of U.S. issuers. The risks include possible revaluation of currencies, the ability to repatriate funds, less complete financial information about companies and possible future adverse political and economic developments. Moreover, securities of many foreign issuers and their markets may be less liquid and their prices more volatile than those of securities of comparable U.S. issuers.
Other: The Funds hold certain investments which pay dividends to their shareholders based upon available funds from operations. It is possible for these dividends to exceed the underlying investments’ taxable earnings and profits resulting in the excess portion of such dividends being designated as a return of capital. Distributions received from investments in securities that represent a return of capital or capital gains are recorded as a reduction of the cost of investments or as a realized gain, respectively.
| Annual Report | September 30, 2016 | 127 |
RiverNorth Funds | Notes to Financial Statements |
September 30, 2016
Share Valuation: The net asset value (the “NAV”) is generally calculated as of the close of trading on the New York Stock Exchange (“the Exchange”) (normally 4:00 p.m. Eastern time) every day the Exchange is open. The NAV is calculated by taking the total value of each Fund’s or class’ assets, subtracting their liabilities, and then dividing by the total number of shares outstanding, rounded to the nearest cent. The offering price and redemption price per share is equal to the net asset value per share, except that shares of each Fund are subject to a redemption fee of 2% if redeemed within 90 days of purchase. For the year ended September 30, 2016, the Core Opportunity Fund, Strategic Income Fund, Equity Opportunity Fund and High Income Fund received redemption fees of $131,060, $237,626, $2,548 and $15,133, respectively.
Expenses: Some expenses of the Trust can be directly attributed to a Fund or a Fund specific share class. Expenses which cannot be directly attributed are apportioned among all Funds and Fund series classes in the Trust based on average net assets.
Federal Income Taxes: The Funds make no provision for federal income tax. Each Fund intends to qualify each year as a “regulated investment company” under subchapter M of the Internal Revenue Code of 1986, as amended, by distributing substantially all of its taxable income. If the required amount of net investment income is not distributed, the Funds could incur a tax expense.
As of and during the year ended September 30, 2016, the Funds did not have a liability for any unrecognized tax benefits. The Funds file U.S. federal, state, and local tax returns as required. The Funds’ tax returns are subject to examination by the relevant tax authorities until expiration of the applicable statute of limitations which is generally three years after the filing of the tax return for federal purposes and four years for most state returns. Tax returns for open years have incorporated no uncertain tax positions that require a provision for income taxes.
Distributions to Shareholders: Distributions to shareholders, which are determined in accordance with income tax regulations, are recorded on the ex-dividend date. The treatment for financial reporting purposes of distributions made to shareholders during the year from net investment income or net realized capital gains may differ from their ultimate treatment for federal income tax purposes. These differences are caused primarily by differences in the timing of recognition of certain components of income, expense or realized capital gain for federal income tax purposes. Where such differences are permanent in nature, they are reclassified in the components of the net assets based on their ultimate characterization for federal income tax purposes. Any such reclassification will have no effect on net assets, results of operations or net asset values per share of the Funds.
3. SECURITIES VALUATION AND FAIR VALUE MEASUREMENTS
Fair value is defined as the price that a Fund might reasonably expect to receive upon selling an investment in a timely transaction to an independent buyer in the principal or most advantageous market of the investment. GAAP establishes a three-tier hierarchy to maximize the use of observable market data and minimize the use of unobservable inputs and to establish classification of fair value measurements for disclosure purposes.
128 | (888) 848-7569 | www.rivernorth.com |
RiverNorth Funds | Notes to Financial Statements |
September 30, 2016
Inputs refer broadly to the assumptions that market participants would use in pricing the asset or liability, including assumptions about risk, for example, the risk inherent in a particular valuation technique used to measure fair value including using such a pricing model and/or the risk inherent in the inputs to the valuation technique. Inputs may be observable or unobservable. Observable inputs are inputs that reflect the assumptions market participants would use in pricing the asset or liability developed based on market data obtained from sources independent of the reporting entity. Unobservable inputs are inputs that reflect the reporting entity’s own assumptions about the assumptions market participants would use in pricing the asset or liability developed based on the best information available in the circumstances.
Various inputs are used in determining the value of the Funds’ investments. These inputs are summarized in the three broad levels listed below.
| • | Level 1 – Unadjusted quoted prices in active markets for identical, unrestricted assets or liabilities that a Fund has the ability to access at the measurement date; |
| • | Level 2 – Quoted prices which are not active, quoted prices for similar assets or liabilities in active markets or inputs other than quoted prices that are observable (either directly or indirectly) for substantially the full term of the asset or liability; and |
| • | Level 3 – Significant unobservable prices or inputs (including the Funds’ own assumptions in determining the fair value of investments) where there is little or no market activity for the asset or liability at the measurement date. |
The inputs used to measure fair value may fall into different levels of the fair value hierarchy. In such cases, for disclosure purposes, the level in the fair value hierarchy within which the fair value measurement falls in its entirety, is determined based on the lowest level input that is significant to the fair value measurement in its entirety.
Equity securities, including common stocks, rights, closed-end funds, exchange-traded funds, preferred stocks, business development companies, and business development company senior notes are generally valued by using market quotations, but may be valued on the basis of prices furnished by a pricing service when the Adviser or a Sub-Adviser believes such prices more accurately reflect the fair market value of such securities. Securities that are traded on any stock exchange are generally valued by the pricing service at the last quoted sale price. Lacking a last sale price, an exchange traded security is generally valued by the pricing service at its last bid price. Securities traded in the NASDAQ over-the-counter market are generally valued by the pricing service at the NASDAQ Official Closing Price. When using the market quotations or close prices provided by the pricing service and when the market is considered active, the security will be classified as a Level 1 security. Sometimes, an equity security owned by the Funds will be valued by the pricing service with factors other than market quotations or when the market is considered inactive. When this happens, the security will be classified as a Level 2 security. When market quotations are not readily available, when the Adviser or a Sub-Adviser determines that the market quotation or the price provided by the pricing service does not accurately reflect the current fair value, or when restricted or illiquid securities are being valued, such securities are valued as determined in good faith by the Adviser, Sub-Adviser, or valuation committee in conformity with guidelines adopted by and subject to review by the Board. These securities will be categorized as Level 3 securities.
| Annual Report | September 30, 2016 | 129 |
RiverNorth Funds | Notes to Financial Statements |
September 30, 2016
Investments in mutual funds, including short term investments and open-end funds, are generally priced at the ending net asset value (NAV) provided by the service agent of the funds. These securities will be categorized as Level 1 securities.
Domestic and foreign fixed income securities, including foreign and U.S. corporate bonds, U.S. Government bonds and notes, foreign government bonds and notes, supranationals and foreign agencies, non-agency collateralized mortgage obligations, U.S. Government/Agency mortgage backed securities, bank loans, collateralized loan obligations, contingent convertible securities, municipal bonds, and high yield debt, as well as non-exchange traded derivatives, including forward foreign currency contracts and total return swaps, are normally valued on the basis of quotes obtained from brokers and dealers or independent pricing services. Total Return swaps are valued based on a formula of the underlying asset’s nightly value, the Overnight London-Interbank Offered Rate (“USD-LIBOR”) and an annual fee or various agreed upon inputs. Foreign Currency positions, including forward foreign currency contracts, are priced at the mean between the closing bid and asked prices at 4:00 p.m. eastern time. Prices obtained from independent pricing services typically use information provided by market makers or estimates of market values obtained from yield data relating to investments or securities with similar characteristics. Data used to establish quotes includes analysis of cash flows, pre-payment speeds, default rates, delinquency assumptions and assumptions regarding collateral and loss assumptions. These securities will be classified as Level 2 securities.
Short-term investments in fixed income securities, with maturities of less than 60 days when acquired, or which subsequently are within 60 days of maturity, are valued by using the amortized cost method of valuation, which the Board has determined will represent fair value. These securities will be classified as Level 2 securities.
In accordance with the Funds’ good faith pricing guidelines, the Adviser, Sub-Adviser, or valuation committee is required to consider all appropriate factors relevant to the value of securities for which it has determined other pricing sources are not available or reliable as described above. No single standard exists for determining fair value, because fair value depends upon the circumstances of each individual case. As a general principle, the current fair value of an issue of securities being valued by the Adviser, Sub-Adviser, or valuation committee would appear to be the amount which the owner might reasonably expect to receive for them upon their current sale. Methods which are in accordance with this principle may, for example, be based on (i) a multiple of earnings; (ii) a discount from market of a similar freely traded security (including a derivative security or a basket of securities traded on other markets, exchanges or among dealers); or (iii) yield to maturity with respect to debt issues, or a combination of these and other methods. Good faith pricing is permitted if, in the Adviser’s, a Sub-Adviser’s, or the valuation committee’s opinion, the validity of market quotations appears to be questionable based on factors such as evidence of a thin market in the security based on a small number of quotations, a significant event occurs after the close of a market but before a Funds’ NAV calculation that may affect a security’s value, or the Adviser or a Sub-Adviser is aware of any other data that calls into question the reliability of market quotations.
Good faith pricing may also be used in instances when the bonds the Funds invest in default or otherwise cease to have market quotations readily available. Investments in foreign securities, junk bonds or other thinly traded securities are more likely to trigger good faith pricing than other securities.
130 | (888) 848-7569 | www.rivernorth.com |
RiverNorth Funds | Notes to Financial Statements |
September 30, 2016
The following is a summary of the inputs used at September 30, 2016 in valuing the Funds’ assets and liabilities:
Core Opportunity Fund
| | | Valuation Inputs | | | | |
| Investments in Securities at Value* | | Level 1 | | | Level 2 | | | Level 3 | | | Total | |
| Closed-End Funds | | $ | 465,649,035 | | | $ | – | | | $ | – | | | $ | 465,649,035 | |
| Business Development Companies | | | 11,553,098 | | | | – | | | | – | | | | 11,553,098 | |
| Exchange-Traded Funds | | | 116,606,066 | | | | – | | | | – | | | | 116,606,066 | |
| Open-End Funds | | | 2,765,893 | | | | – | | | | – | | | | 2,765,893 | |
| Preferred Stocks | | | 1,629,861 | | | | – | | | | – | | | | 1,629,861 | |
| Short-Term Investments | | | 163,465,551 | | | | – | | | | – | | | | 163,465,551 | |
| Total | | $ | 761,669,504 | | | $ | – | | | $ | – | | | $ | 761,669,504 | |
| | | Valuation Inputs | | | | | |
| Other Financial Instruments** | | Level 1 | | | Level 2 | | | Level 3 | | | Total | |
| Assets | | | | | | | | | | | | | | | | |
| Total Return Swap Contracts | | $ | – | | | $ | 835,285 | | | $ | – | | | $ | 835,285 | |
| Total | | $ | – | | | $ | 835,285 | | | $ | – | | | $ | 835,285 | |
| Annual Report | September 30, 2016 | 131 |
RiverNorth Funds | Notes to Financial Statements |
September 30, 2016
Strategic Income Fund
| | | Valuation Inputs | | | | | |
| Investments in Securities at Value* | | Level 1 | | | Level 2 | | | Level 3 | | | Total | |
| Closed-End Funds | | $ | 464,657,862 | | | $ | – | | | $ | – | | | $ | 464,657,862 | |
| Business Development Companies | | | 28,694,444 | | | | – | | | | – | | | | 28,694,444 | |
| Open-End Funds | | | 63,701,510 | | | | – | | | | – | | | | 63,701,510 | |
| Preferred Stocks | | | 16,056,385 | | | | – | | | | – | | | | 16,056,385 | |
| Business Development Company Senior Notes | | | 21,806,112 | | | | – | | | | – | | | | 21,806,112 | |
| Foreign Corporate Bonds | | | – | | | | 35,694,889 | | | | – | | | | 35,694,889 | |
| U.S. Corporate Bonds | | | – | | | | 64,511,415 | | | | – | | | | 64,511,415 | |
| Foreign Government Bonds and Notes, Supranationals and Foreign Agencies | | | – | | | | 3,912,496 | | | | – | | | | 3,912,496 | |
| Collateralized Loan Obligations | | | – | | | | 16,150,994 | | | | – | | | | 16,150,994 | |
| Contingent Convertible Securities | | | – | | | | 311,349 | | | | – | | | | 311,349 | |
| Non-Agency Collateralized Mortgage Obligations | | | – | | | | 437,448,566 | | | | – | | | | 437,448,566 | |
| U.S. Government Bonds and Notes | | | – | | | | 106,327,803 | | | | – | | | | 106,327,803 | |
| Municipal Bonds | | | – | | | | 22,857,496 | | | | – | | | | 22,857,496 | |
| U.S. Government / Agency Mortgage Backed Securities | | | – | | | | 235,960,657 | | | | – | | | | 235,960,657 | |
| Short-Term Investments | | | 518,569,809 | | | | – | | | | – | | | | 518,569,809 | |
| Total | | $ | 1,113,486,122 | | | $ | 923,175,665 | | | $ | – | | | $ | 2,036,661,787 | |
| | | Valuation Inputs | | | | | |
| Other Financial Instruments** | | Level 1 | | | Level 2 | | | Level 3 | | | Total | |
| Assets | | | | | | | | | | | | | | | | |
| Total Return Swap Contracts | | $ | – | | | $ | 1,364,980 | | | $ | – | | | $ | 1,364,980 | |
| Total | | $ | – | | | $ | 1,364,980 | | | $ | – | | | $ | 1,364,980 | |
132 | (888) 848-7569 | www.rivernorth.com |
RiverNorth Funds | Notes to Financial Statements |
September 30, 2016
Equity Opportunity Fund
| | | Valuation Inputs | | | | | |
| Investments in Securities at Value* | | Level 1 | | | Level 2 | | | Level 3 | | | Total | |
| Closed-End Funds | | $ | 12,369,411 | | | $ | – | | | $ | – | | | $ | 12,369,411 | |
| Exchange-Traded Funds | | | 751,698 | | | | – | | | | – | | | | 751,698 | |
| Short-Term Investments | | | 689,802 | | | | – | | | | – | | | | 689,802 | |
| Rights | | | – | | | | – | | | | – | | | | – | |
| Total | | $ | 13,810,911 | | | $ | – | | | $ | – | | | $ | 13,810,911 | |
High Income Fund
| | | Valuation Inputs | | | | | |
| Investments in Securities at Value* | | Level 1 | | | Level 2 | | | Level 3 | | | Total | |
| Business Development Companies | | $ | 592,519 | | | $ | – | | | $ | – | | | $ | 592,519 | |
| Closed-End Funds | | | 16,638,166 | | | | – | | | | – | | | | 16,638,166 | |
| Common Stocks | | | – | | | | 2,658 | | | | – | | | | 2,658 | |
| Bank Loans | | | – | | | | 29,932,984 | | | | – | | | | 29,932,984 | |
| High Yield Debt | | | – | | | | 25,559,398 | | | | – | | | | 25,559,398 | |
| Short-Term Investments | | | 10,292,660 | | | | – | | | | – | | | | 10,292,660 | |
| Total | | $ | 27,523,345 | | | $ | 55,495,040 | | | $ | – | | | $ | 83,018,385 | |
| | | Valuation Inputs | | | | | |
| Other Financial Instruments** | | Level 1 | | | Level 2 | | | Level 3 | | | Total | |
| Assets | | | | | | | | | | | | | | | | |
| Forward Foreign Currency Contracts | | $ | – | | | $ | 46,147 | | | $ | – | | | $ | 46,147 | |
| Liabilities | | | | | | | | | | | | | | | | |
| Forward Foreign Currency Contracts | | | – | | | | (99,190 | ) | | | – | | | | (99,190 | ) |
| Total | | $ | – | | | $ | (53,042 | ) | | $ | – | | | $ | (53,042 | ) |
| * | Refer to each Fund’s Schedule of Investments for a listing of securities by type. |
| ** | Other financial instruments are derivative instruments reflected in the Schedule of Investments. The amount represents the unrealized gain or loss on the investment. |
| Annual Report | September 30, 2016 | 133 |
RiverNorth Funds | Notes to Financial Statements |
September 30, 2016
The changes of the fair value of investments for which the Funds have used Level 3 inputs to determine the fair value are as follows:
| Investments in Securities | | Balance
as of September 30, 2015 | | | Accrued discount/
premium | | | Return of Capital | | | Realized
Gain/ (Loss) | | | Change in Unrealized
Appreciation/
(Depreciation) | | | Purchases | | | Sales Proceeds | | | Transfer into Level 3 | | | Transfer
out of Level 3 | | | Balance
as of September 30, 2016 | | | Net change in unrealized
appreciation/
(depreciation) included in the Statement of Operations attributable to Level 3 investments held at
September 30, 2016 | |
| High Income Fund | | | | | | | | | | | | | | | | | | | | | | |
| Bank Loans | | $ | 499,357 | | | $ | 1,045 | | | $ | – | | | $ | (3,652 | ) | | $ | 24,958 | | | $ | – | | | $ | (18,837 | ) | | $ | – | | | $ | (502,871 | ) | | $ | – | | | $ | – | |
| Total | | $ | 499,357 | | | $ | 1,045 | | | $ | – | | | $ | (3,652 | ) | | $ | 24,958 | | | $ | – | | | $ | (18,837 | ) | | $ | – | | | $ | (502,871 | ) | | $ | – | | | $ | – | |
Transfer of securities from Level 3 to Level 2 occurred primarily due to the increase of observable market data due to increased market activity or information for these securities.
There were no transfers into and out of Levels 1 and 2 during the current period presented.
4. DERIVATIVE FINANCIAL INSTRUMENTS
The following discloses the Funds’ use of derivative instruments. The Funds’ investment objectives not only permit the Funds to purchase investment securities, they also allow the Funds to enter into various types of derivative contracts such as total return swap contracts and forward foreign currency contracts. In doing so, the Funds will employ strategies in differing combinations to permit them to increase, decrease, or change the level or types of exposure to market factors. Central to those strategies are features inherent to derivatives that make them more attractive for this purpose than equity or debt securities; they require little or no initial cash investment, they can focus exposure on only certain selected risk factors, and they may not require the ultimate receipt or delivery of the underlying security (or securities) to the contract. This may allow the Funds to pursue their objectives more quickly and efficiently than if they were to make direct purchases or sales of securities capable of affecting a similar response to market factors.
Market Risk Factors: In pursuit of their investment objectives, the Funds may seek to use derivatives to increase or decrease their exposure to the following market risk factors:
Equity Risk: Equity risk relates to the change in value of equity securities as they relate to increases or decreases in the general market.
Foreign Exchange Rate Risk: Foreign exchange rate risk relates to the change in the U.S. dollar value of a security held that is denominated in a foreign currency. The value of a foreign currency denominated security will decrease as the dollar appreciates against the currency, while the value of the foreign currency denominated security will increase as the dollar depreciates against the currency.
134 | (888) 848-7569 | www.rivernorth.com |
RiverNorth Funds | Notes to Financial Statements |
September 30, 2016
Risk of Investing in Derivatives
The Funds’ use of derivatives can result in losses due to unanticipated changes in the market risk factors and the overall market. Derivatives may have little or no initial cash investment relative to their market value exposure and therefore can produce significant gains or losses in excess of their cost. This use of embedded leverage allows the Funds to increase their market value exposure relative to their net assets and can substantially increase the volatility of the Funds’ performance.
Additional associated risks from investing in derivatives also exist and potentially could have significant effects on the valuation of the derivative and the Funds. Typically, the associated risks are not the risks that the Funds are attempting to increase or decrease exposure to, per their investment objectives, but are the additional risks from investing in derivatives.
Examples of these associated risks are liquidity risk, which is the risk that the Funds will not be able to sell the derivative in the open market in a timely manner, and counterparty credit risk, which is the risk that the counterparty will not fulfill its obligation to the Funds.
Forward Foreign Currency Contracts
The Funds may engage in currency transactions with counterparties to hedge the value of portfolio securities denominated in particular currencies against fluctuations in relative value, to gain or reduce exposure to certain currencies, or to generate income or gains. A forward foreign currency contract is an agreement between two parties to buy and sell a currency at a set price on a future date. During the year ended September 30, 2016, the High Income Fund engaged in forward foreign currency contracts. The contracts are marked-to-market daily and the change in value is recorded by the High Income Fund as an unrealized gain or loss. When a forward foreign currency contract is extinguished, through either delivery or offset by entering into another forward foreign currency contract, the High Income Fund records a realized gain or loss equal to the difference between the value of the contract at the time it was opened and the value of the contract at the time it was extinguished.
Forward foreign currency contracts involve elements of market risk in excess of the amounts reflected in the Statement of Assets and Liabilities. The High Income Fund bears the risk of an unfavorable change in the foreign exchange rate underlying the forward foreign currency contract. Risks may also arise upon entering into these contracts from the potential inability of the counterparties to meet the terms of their contracts.
If required by the forward foreign currency contracts, the High income Fund, has segregated sufficient assets as collateral to satisfy the current obligations with respect to forward foreign currency contracts, and this is reflected as Cash segregated at custodian for forward foreign currency contracts on the High Income Fund’s Statement of Assets and Liabilities.
Total Return Swaps
Certain Funds may enter into total return swaps. During the year ended September 30, 2016, the Core Opportunity Fund, the Strategic Income Fund, and the High Income Fund invested in total return swaps. Total return swaps are agreements that provide the Fund with a return based on the performance of an underlying asset (called a “reference asset”), in exchange for fee payments to a counterparty based on a specific rate of return. The difference in the value of these income streams is recorded daily by the Fund, and is settled in cash periodically. The fee paid by the Fund will typically be determined by multiplying the face value of the swap agreement by an agreed upon interest rate. Generally, the basis of the total return swap is the unamortized premium received or paid. The periodic swap payments received or made by the Fund are recorded in the Statement of Operations as realized gains or losses, respectively. Any upfront fees paid are recorded as assets and any upfront fees received are recorded as liabilities and are shown on each Fund’s respective Statement of Assets and Liabilities. When the swap is terminated, the Fund will record a realized gain or loss equal to the difference between the proceeds from (or cost of) the closing transaction and the Fund’s basis in the contract, if any. In addition, if the reference asset declines in value over the term of the swap, the Fund would also be required to pay the dollar value of that decline to the counterparty. Total return swaps could result in losses if the reference asset does not perform as anticipated by the Adviser. The Fund may use its own net asset value or the net asset value of a similar fund as the reference asset in a total return swap. This strategy serves to reduce “cash drag” (the impact of uninvested cash on the Fund’s overall return) by replacing it with the total return of the Fund’s own, or a similar fund’s investment holdings. The Fund records fluctuations in the value of open swap contracts on a daily basis as unrealized gains or losses.
| Annual Report | September 30, 2016 | 135 |
RiverNorth Funds | Notes to Financial Statements |
September 30, 2016
Separate from the total return swap agreement with Goldman Sachs, the Core Opportunity Fund and the Strategic Income Fund entered into a Purchase and Settlement Agreement (“PSA”) on February 18, 2016 with Fifth Street Finance Corp (“FSC”) and affiliated parties. Under the terms of the PSA, which was entered into to resolve a then-pending shareholder activism campaign, upon the close of the total return swap entered into with Goldman Sachs, FSC or its affiliated parties agreed to pay the Funds the difference per share between the final closing price of the FSC common share and $6.25. In addition, the Funds and FSC agreed to split all monthly dividends paid on the FSC common shares through the closing of the total return swap. On September 7, 2016 the Funds received $82,344 in the Core Opportunity Fund and $77,922 in the Strategic Income Fund as final payment in the mutual release of the PSA with FSC and affiliated parties. Realized gains from these transactions are represented on the Statement of Operations and the Statements of Changes in Net Assets. Additional, the Funds and FSC also agreed to no longer split all monthly dividends paid on the FSC common shares. The Funds also agreed not to amend, modify, waive, extend or voluntarily terminate or settle any of the total return swaps entered into with Goldman Sachs unless FSC directs them in writing. If early settlement of the total return swap occurs, the Funds may receive a daily finance charge from FSC or its affiliated parties if payment is not received from FSC or its affiliated parties concurrent with the total return swap settlement.
International Swaps and Derivatives Association, Inc. Master Agreements (“ISDA Master Agreements”) govern OTC financial derivative transactions entered into by a Fund and those counterparties. The ISDA Master Agreements maintain provisions for general obligations, representations, agreements, collateral and events of default or termination. Events of termination include conditions that may entitle counterparties to elect to terminate early and cause settlement of all outstanding transactions under the applicable ISDA Master Agreement. Any election to terminate early could be material to the financial statements.
If required by the swap agreement, the Funds, have segregated sufficient assets as collateral to satisfy the current obligations with respect to total return swaps, and this is reflected as Cash segregated at custodian for total return swap contracts on each Fund’s respective Statement of Assets and Liabilities.
136 | (888) 848-7569 | www.rivernorth.com |
RiverNorth Funds | Notes to Financial Statements |
September 30, 2016
The effect of derivatives instruments on each Fund's Statement of Assets and Liabilities as of September 30, 2016:
| | | | | Asset Derivatives | |
| Fund | | Risk Exposure | | Statement of Assets and Liabilities Location | | Fair Value | |
| Core Opportunity Fund | | Equity Contracts (Total return swap contracts) | | Unrealized appreciation on total return swap contracts | | $ | 835,285 | |
| Strategic Income Fund | | Equity Contracts (Total return swap contracts) | | Unrealized appreciation on total return swap contracts | | $ | 1,364,980 | |
| High Income Fund | | Foreign exchange rate risk (Forward foreign currency contracts) | | Unrealized appreciation on forward foreign currency contracts | | $ | 46,147 | |
| | | | | Liabilities Derivatives | |
| Fund | | Risk Exposure | | Statement of Assets and Liabilities Location | | Fair Value | |
| High Income Fund | | Foreign exchange rate risk (Forward foreign currency contracts) | | Unrealized depreciation on forward foreign currency contracts | | $ | (99,190 | ) |
Annual Report | September 30, 2016 | 137 |
RiverNorth Funds | Notes to Financial Statements |
September 30, 2016
The effect of derivatives instruments on each Fund's Statement of Operations for the year ended September 30, 2016:
| Fund | | Risk Exposure | | Statement of
Operations Location | | Realized Gain/(Loss) on Derivatives Recognized in Income | | | Change in Unrealized Appreciation/ (Depreciation) on Derivatives Recognized in Income | |
| Core Opportunity Fund | | Equity Contracts (Total return swap contracts) | | Net realized gain/(loss) on Total return swap contracts/ Net change in unrealized appreciation on Total return swap contracts | | $ | 7,175,965 | | | $ | 823,239 | |
| Strategic Income Fund | | Equity Contracts (Total return swap contracts) | | Net realized gain/(loss) on Total return swap contracts/ Net change in unrealized depreciation on Total return swap contracts | | $ | 4,048,056 | | | $ | 1,549,064 | |
| High Income Fund | | Equity Contracts (Total return swap contracts) | | Net realized gain/(loss) on Total return swap contracts/ Net change in unrealized appreciation/(depreciation) on Total return swap contracts | | $ | 93,105 | | | $ | – | |
| High Income Fund | | Foreign exchange rate risk (Forward foreign currency contracts) | | Net realized loss on Translation of assets and liabilities denominated in foreign currencies and forward foreign currency contracts/ Net change in unrealized appreciation on Translation of assets and liabilities denominated in foreign currencies and forward foreign currency contracts | | $ | 447,757 | | | $ | (17,251 | ) |
138 | (888) 848-7569 | www.rivernorth.com |
RiverNorth Funds | Notes to Financial Statements |
September 30, 2016
The forward currency contracts and total return swap contracts average notional amount during the year ended September 30, 2016 is noted below.
| Fund | | Average Notional Amount of
Total Return Swap Contracts* | |
| Core Opportunity Fund | | $ | 76,376,473 | |
| Strategic Income Fund | | $ | 41,828,731 | |
| High Income Fund | | $ | 750,000 | |
| * | For the period in which the total return swap was held. |
| Fund | | Average Notional Amount of Forward Foreign Currency Contracts | |
| High Income Fund | | $ | 15,839,582 | |
Offsetting Arrangements: Certain derivative contracts are executed under standardized netting agreements. A derivative netting arrangement creates an enforceable right of set-off that becomes effective, and affects the realization of settlement on individual assets, liabilities and collateral amounts, only following a specified event of default or early termination. Default events may include the failure to make payments or deliver securities timely, material adverse changes in financial condition or insolvency, the breach of minimum regulatory capital requirements, or loss of license, charter or other legal authorization necessary to perform under the contract. These agreements mitigate counterparty credit risk by providing for a single net settlement with a counterparty of all financial transactions covered by the agreement in an event of default as defined under
such agreement.
Annual Report | September 30, 2016 | 139 |
RiverNorth Funds | Notes to Financial Statements |
September 30, 2016
The following table presents derivative financial instruments that are subject to enforceable netting arrangements, collateral arrangements or other similar agreements as of September 30, 2016.
| Offsetting of Derivatives Asset | |
| | | | | | | | | | | | Gross Amounts Not Offset in the Statements of Assets and Liabilities | |
| Description | | Gross Amounts of Recognized Assets | | | Gross Amounts Offset in the Statements of Assets and Liabilities | | | Net Amounts Presented in the Statements of Assets and Liabilities | | | Financial Instruments Available for Offset (a) | | | Cash Collateral Received(a) | | | Net Amount | |
| Core Opportunity Fund | |
| Total Return Swap Contracts | | $ | 835,285 | | | $ | – | | | $ | 835,285 | | | $ | – | | | $ | – | | | $ | 835,285 | |
| Total | | $ | 835,285 | | | $ | – | | | $ | 835,285 | | | $ | – | | | $ | – | | | $ | 835,285 | |
| | | | | | | | | | | | | | | | | | | | | | | | | |
| Strategic Income Fund | |
| Total Return Swap Contracts | | $ | 1,364,980 | | | $ | – | | | $ | 1,364,980 | | | $ | – | | | $ | – | | | $ | 1,364,980 | |
| Total | | $ | 1,364,980 | | | $ | – | | | $ | 1,364,980 | | | $ | – | | | $ | – | | | $ | 1,364,980 | |
| | | | | | | | | | | | | | | | | | | | | | | | | |
| High Income Fund | |
| Forward Foreign Currency Contracts | | $ | 46,147 | | | $ | – | | | $ | 46,147 | | | $ | (46,147 | ) | | $ | – | | | $ | – | |
| Total | | $ | 46,147 | | | $ | – | | | $ | 46,147 | | | $ | (46,147 | ) | | $ | – | | | $ | – | |
140 | (888) 848-7569 | www.rivernorth.com |
RiverNorth Funds | Notes to Financial Statements |
September 30, 2016
| Offsetting of Derivatives Liability | |
| September 30, 2016 | |
| | |
| | | | | | | | | | | | Gross Amounts Not Offset in the Statement of Financial Position | |
| Description | | Gross Amounts of Recognized Liabilities | | | Gross Amounts Offset in the Statement of Assets and Liabilities | | | Net Amounts Presented in the Statement of Assets and Liabilities | | | Financial Instruments Available for Offset (a) | | | Cash Collateral Pledged(a) | | | Net Amount | |
| High Income Fund | |
| Forward Foreign Currency Contracts | | $ | 99,190 | | | $ | – | | | $ | 99,190 | | | $ | (46,147 | ) | | $ | (53,043 | ) | | $ | – | |
| Total | | $ | 99,190 | | | $ | – | | | $ | 99,190 | | | $ | (46,147 | ) | | $ | (53,043 | ) | | $ | – | |
(a) | These amounts are limited to the derivatives asset/liability balance and, accordingly, do not include excess collateral received/pledged. |
5. LOAN PARTICIPATIONS AND ASSIGNMENTS
The High Income Fund may invest in direct debt instruments which are interests in amounts owed to lenders or lending syndicates by corporate, governmental, or other borrowers. The High Income Fund will normally invest in corporate debt issuers in North America and Europe. The High Income Fund investments in loans may be in the form of participations in loans or assignments of all or a portion of loans from third parties. A loan is often administered by a bank or other financial institution (the “lender”) that acts as agent for all holders. The agent administers the terms of the loan, as specified in the loan agreement. The High Income Fund may invest in multiple series or tranches of a loan, which may have varying terms and carry different associated risks. The High Income Fund will generally purchase assignments of these loans, in which case it will typically become a lender for purposes of the relevant loan agreement with direct contractual rights against the borrower, including the right to receive payments of principal and interest. When purchasing participation interests in a loan, the High Income Fund generally has no right to enforce compliance with the terms of the loan agreement with the borrower. As a result, the High Income Fund may be subject to the credit risk of both the borrower and the lender that is selling the loan agreement. The High Income Fund may enter into unfunded loan commitments, which are contractual obligations for future funding. Unfunded loan commitments represent a future obligation in full, even though a percentage of the notional loan amounts may not be utilized by the borrower. When investing in a loan participation, the High Income Fund has the right to receive payments of principal, interest and any fees to which it is entitled only from the lender selling the loan agreement and only upon receipt of payments by the lender from the borrower. The High Income Fund may receive a commitment fee based on the undrawn portion of the underlying line of credit portion of a floating rate loan. In certain circumstances, the High Income Fund may receive a penalty fee upon the prepayment of a floating rate loan by a borrower. Fees earned are recorded as a component of interest income or interest expense, respectively, on the Statement of Operations. At September 30, 2016, the High Income Fund had $3,256,614 in unsettled domestic and foreign loan commitments.
Annual Report | September 30, 2016 | 141 |
RiverNorth Funds | Notes to Financial Statements |
September 30, 2016
6. INVESTMENT ADVISORY FEE AND OTHER TRANSACTIONS WITH AFFILIATES
The Adviser serves as the investment adviser to the Funds. Under the terms of the management agreement (the “Agreement”), the Adviser, subject to the supervision of the Board, provides or arranges to be provided to the Funds such investment advice as it deems advisable and will furnish or arrange to be furnished a continuous investment program for the Funds consistent with the Funds’ investment objectives and policies. As compensation for its management services, the Funds are obligated to pay the Adviser a fee computed and accrued daily and paid monthly in arrears at an annual rate of the average daily net assets of the Funds.
The Chief Compliance Officer (“CCO”) of the Funds is an affiliate of the Funds. For the year ended September 30, 2016, the total related amounts paid by the Funds for CCO fees are included in Compliance expenses on the Statement of Operations.
The following table reflects the Funds’ contractual management fee rates (expressed as an annual rate).
| Fund | Contractual Management Fee |
| Core Opportunity Fund | 1.00% |
| Strategic Income Fund | 0.75% |
| Equity Opportunity Fund | 1.00% |
| High Income Fund | 1.00% |
The Adviser has contractually agreed to defer the collection of the Funds’ management fees and/or reimburse expenses, but only to the extent necessary to limit net annual operating expenses (excluding brokerage fees and commissions; borrowing costs, such as (a) interest and (b) dividends on securities sold short; taxes; indirect expenses incurred by the underlying funds in which the Funds’ invest; and extraordinary expenses), as a percentage of the average daily net assets of the Funds. Each deferral of fees or reimbursements of expenses by the Adviser are subject to repayment by the Fund within the three fiscal years following the fiscal year in which the expenses were incurred, provided that the Fund is able to make the repayment without exceeding the below expense limitations and the repayment is approved by the Board.
| Fund | Class I | Class R | Expiration of Expense Limitation Agreement |
| Core Opportunity Fund | 1.35% | 1.60% | January 31, 2017 |
| Strategic Income Fund | 0.95% | 1.20% | January 31, 2017 |
| Equity Opportunity Fund | 1.35% | 1.60% | January 31, 2017 |
| High Income Fund | 1.35% | 1.60% | January 31, 2017 |
142 | (888) 848-7569 | www.rivernorth.com |
| RiverNorth Funds | Notes to Financial Statements |
September 30, 2016As of the year ended September 30, 2016, reimbursed expenses for each Fund subject to potential recovery by year of expiration are as follows:
| | | Expiring September 30, | |
| | | 2017 | | | 2018 | | | 2019 | |
| Fund/Class | | | | | | | | | |
| Core Opportunity Fund | | | | | | | | | |
| Class I | | | N/A | | | | N/A | | | | N/A | |
| Class R | | | N/A | | | | N/A | | | | N/A | |
| | | | | | | | | | | | | |
| Strategic Income Fund | | | | | | | | | | | | |
| Class I | | | N/A | | | | N/A | | | | N/A | |
| Class R | | | N/A | | | | N/A | | | | N/A | |
| | | | | | | | | | | | | |
| Equity Opportunity Fund | | | | | | | | | | | | |
| Class I | | $ | 17,095 | | | $ | 12,743 | | | $ | 37,790 | |
| Class R | | | 65,618 | | | | 49,847 | | | | 16,671 | |
| Total | | $ | 82,713 | | | $ | 62,590 | | | $ | 54,461 | |
| | | | | | | | | | | | | |
| High Income Fund | | | | | | | | | | | | |
| Class I | | | N/A | | | $ | N/A | | | | N/A | |
| Class R | | $ | 7,302 | | | | N/A | | | | 1,430 | |
| Total | | $ | 7,302 | | | $ | N/A | | | | 1,430 | |
For the year ended September 30, 2016, the High Income Fund repaid previously waived fees of $2,451 in Class I and $2,196 in Class R.
Additionally, for the year ended September 30, 2016 the Adviser opted to forgo $143,078 in management fees in the Strategic Income Fund related to the Fund's investment in an affiliate fund, the High Income Fund.
DoubleLine is the investment sub-adviser to the Strategic Income Fund. Oaktree Capital is the investment sub-adviser to the High Income Fund. Under the terms of the sub-advisory agreements, the Sub-Advisers, subject to the supervision of the Adviser and the Board of the Trust, provide or arrange to be provided to the Strategic Income Fund and the High Income Fund such investment advice as deemed advisable and will furnish or arrange to be furnished a continuous investment program for the portion of assets managed in the respective Fund consistent with the respective Fund's investment objective and policies. As compensation for its sub-advisory services, the Adviser is obligated to pay each Sub-Adviser a fee computed and accrued daily and paid monthly in arrears based on an annual rate of the average daily net assets of the Strategic Income Fund and the High Income Fund.
ALPS Fund Services, Inc. (“ALPS”) provides the Funds with fund administration and fund accounting services. ALPS also serves as transfer, dividend paying and shareholder servicing agent for the Funds (“Transfer Agent”).
State Street Bank & Trust, Co. serves as the Funds’ custodian.
The Funds have adopted a plan pursuant to Rule 12b-1 under the Investment Company Act of 1940, as amended (the “Plan”). The Plan permits the Funds to pay the Adviser for distribution and promotion expenses related to marketing shares of the Funds. The amount payable annually by the Class R shares of the Core Opportunity Fund, the Class R Shares of the Strategic Income Fund, the Class R Shares of the Equity Opportunity Fund, and the Class R Shares of the High Income Fund is 0.25% of the average daily net assets. Under the Plan the Trust may engage in any activities related to the distribution of Fund shares. The expenses of the Funds’ Plan are reflected as 12b-1 fees in the Statement of Operations.
| Annual Report | September 30, 2016 | 143 |
| RiverNorth Funds | Notes to Financial Statements |
September 30, 2016
The Funds have entered into a Distribution Agreement with ALPS Distributors, Inc., (“the Distributor”) to provide distribution services to the Funds. The Distributor serves as underwriter/distributor of shares of the Funds.
Officers of the Trust and Trustees who are “interested persons” of the Trust or the Adviser received no salary or fees from the Trust. Each Trustee who is not an “interested person” received a fee of $36,000 per year plus $1,500 per meeting attended. The audit committee chairman received an additional $1,000 per year. The Trust reimburses each Trustee and Officer for his or her travel and other expenses relating to attendance at such meetings.
Certain Trustees and Officers of the Trust are also officers of the Adviser, the Distributor or the Administrator.
Tax Basis of Distributions to Shareholders
Tax Basis of Distributions to Shareholders: The character of distributions made during the year from net investment income or net realized gains may differ from its ultimate characterization for federal income tax purposes. Also, due to the timing of dividend distributions, the fiscal year in which amounts are distributed may differ from the fiscal year in which the income or realized gain were recorded by a Fund.
The tax character of distributions paid by the Funds during the fiscal year ended September 30, 2016, was as follows:
| | | Ordinary Income | | | Tax-Exempt Income | | | Distributions paid from Long-Term Capital Gain | | | Return of Capital | | | Total | |
| Core Opportunity Fund* | | $ | 28,127,548 | | | $ | 980,957 | | | $ | 31,736,186 | | | $ | 6,414,437 | | | $ | 67,259,128 | |
| Strategic Income Fund* | | | 120,507,425 | | | | – | | | | – | | | | 3,333,128 | | | | 123,840,553 | |
| Equity Opportunity Fund* | | | 551,535 | | | | – | | | | 720,494 | | | | 13,704 | | | | 1,285,733 | |
| High Income Fund* | | | 5,088,917 | | | | – | | | | – | | | | 231,129 | | | | 5,320,046 | |
The tax character of distributions paid by the Funds during the fiscal year ended September 30, 2015, was as follows:
| | | Ordinary Income | | | Tax-Exempt Income | | | Distributions paid from Long-Term Capital Gain | | | Return of Capital | | | Total | |
| Core Opportunity Fund* | | $ | 37,547,641 | | | $ | 2,424,932 | | | $ | 47,553,113 | | | $ | – | | | $ | 87,525,686 | |
| Strategic Income Fund* | | | 87,553,232 | | | | – | | | | – | | | | – | | | | 87,553,232 | |
| 144 | (888) 848-7569 | www.rivernorth.com |
| RiverNorth Funds | Notes to Financial Statements |
| | | | Ordinary Income | | | | Tax-Exempt Income | | | | Distributions paid from Long-Term Capital Gain | | | | Return of Capital | | | | Total | |
| Equity Opportunity Fund* | | | 363,478 | | | | – | | | | 1,715,207 | | | | – | | | | 2,078,685 | |
| High Income Fund* | | | 6,000,750 | | | | – | | | | 178,794 | | | | – | | | | 6,179,544 | |
| * | Classification of Distributions: Net investment income and net realized gain may differ for financial statement and tax purposes. The character of distributions made during the year from net investment income or net realized gains may differ from its ultimate characterization for federal income tax purposes. |
Components of Distributable Earnings on a Tax Basis: The tax components of distributable earnings are determined in accordance with income tax regulations which may differ from the composition of net assets reported under GAAP. Accordingly, for the year ended September 30, 2016, certain differences were reclassified. These differences were primarily due to book/tax distribution differences and to the different tax treatment of certain other investments; the amounts reclassified did not affect net assets. The reclassifications were as follows:
| | | Paid-in Capital | | | Accumulated Net Investment Income/(Loss) | | | Accumulated Net Realized Gain/(Loss) | |
| Core Opportunity Fund | | $ | – | | | $ | 11,541,169 | | | $ | (11,541,169 | ) |
| Strategic Income Fund | | | – | | | | 9,901,878 | | | | (9,901,878 | ) |
| Equity Opportunity Fund | | | – | | | | 1,136 | | | | (1,136 | ) |
| High Income Fund | | | – | | | | (103,479 | ) | | | 103,479 | |
At September 30, 2016, the components of distributable earnings on a tax basis for the Funds were as follows:
| | | Undistributed Ordinary Income | | | Accumulated Capital Gains/(Losses) | | | Net Unrealized Appreciation/ (Depreciation) | | | Other Cumulative Effect of Timing Differences | | | Total | |
| Core Opportunity Fund | | $ | – | | | $ | (1,180,132 | ) | | $ | 27,946,429 | | | $ | (835,285 | ) | | $ | 25,931,012 | |
| Strategic Income Fund | | | – | | | | (6,695,539 | ) | | | (31,676,556 | ) | | | (2,056,291 | ) | | | (40,428,386 | ) |
| Equity Opportunity Fund | | | – | | | | – | | | | 148,038 | | | | – | | | | 148,038 | |
| High Income Fund | | | – | | | | (3,854,645 | ) | | | (2,452,321 | ) | | | (316,909 | ) | | | (6,623,875 | ) |
Capital Losses: As of September 30, 2016 the following Funds had capital loss carryforwards which may reduce the applicable Fund’s taxable income arising from future net realized gains on investments, if any, to the extent permitted by the Code and thus may reduce the amount of the distributions to shareholders which would otherwise be necessary to relieve the Funds of any liability for federal tax pursuant to the Code. The capital loss carryforwards may be carried forward indefinitely.
| Annual Report | September 30, 2016 | 145 |
| RiverNorth Funds | Notes to Financial Statements |
September 30, 2016
The Strategic Income Fund capital loss carryovers used during the period ended September 30, 2016, were $5,106,381.
Capital losses carried forwards were as follows:
| Fund | | Short-Term | | | Long-Term | |
| Strategic Income Fund | | $ | 2,591,573 | | | $ | – | |
| High Income Fund | | | 494,993 | | | | 365,240 | |
The Core Opportunity Fund, Strategic Income Fund and High Income Fund has elected to defer to the year ending September 30, 2017, capital losses recognized during the period November 1, 2015 to September 30, 2016, in the amount of $1,180,132, $4,103,966 and $2,994,412, respectively.
The High Income Fund elected to defer to the period ending September 30, 2017, late ordinary losses in the amount of $368,542.
Unrealized Appreciation and Depreciation on Investments: The amount of net unrealized appreciation/(depreciation) and the cost of investment securities for tax purposes, including short-term securities at September 30, 2016, were as follows:
| Fund | | Gross Appreciation (excess of value over tax) | | | Gross Depreciation (excess of tax cost over value) | | | Net Appreciation/ (Depreciation) on Foreign Currency and Derivatives | | | Net Unrealized Appreciation/ (Depreciation) | | | Cost of Investments for Income Tax Purposes | |
| Core Opportunity Fund* | | $ | 67,315,731 | | | $ | (40,204,587 | ) | | $ | 835,285 | | | $ | 27,946,429 | | | $ | 734,558,360 | |
| Strategic Income Fund* | | | 84,579,406 | | | | (117,620,942 | ) | | | 1,364,980 | | | | (31,676,556 | ) | | | 2,069,703,323 | |
| Equity Opportunity Fund* | | | 534,410 | | | | (386,372 | ) | | | – | | | | 148,038 | | | | 13,662,873 | |
| High Income Fund* | | | 1,677,225 | | | | (4,064,343 | ) | | | (65,203 | ) | | | (2,452,321 | ) | | | 85,405,503 | |
| * | The difference between book and tax basis unrealized appreciation/(depreciation) for the Funds is attributable primarily to PFIC’s, wash sales and tax treatment of certain other investments. |
8. INVESTMENT TRANSACTIONS
Investment transactions for the year ended September 30, 2016, excluding U.S. Government Obligations and short-term investments, were as follows:
| Fund | | Purchases of
Securities | | | Proceeds from
Sales of Securities | |
| Core Opportunity Fund | | $ | 126,630,850 | | | $ | 266,492,032 | |
| Strategic Income Fund | | | 378,728,272 | | | | 558,393,562 | |
| 146 | (888) 848-7569 | www.rivernorth.com |
| RiverNorth Funds | Notes to Financial Statements |
| Fund | | | Purchases of
Securities | | | | Proceeds from
Sales of Securities | |
| Equity Opportunity Fund | | | 17,226,999 | | | | 11,530,057 | |
| High Income Fund | | | 31,374,551 | | | | 54,424,100 | |
Investment Transactions in U.S. Government Obligations for the year ended September 30, 2016 were as follows:
| Fund | | Purchases of Securities | | | Proceeds from Sales of Securities | |
| Strategic Income Fund | | $ | 190,270,183 | | | $ | 171,742,722 | |
Funds may invest in certain securities that are considered securities issued by affiliated companies. As defined by the Investment Company Act of 1940, an affiliated person, including an affiliated company, is one in which a Fund owns 5% or more of the outstanding voting securities, or a company which is under common ownership or control with the Fund. The purchases, sales, dividend income, capital gains, shares and value of investment in affiliated companies for the year ended September 30, 2016 were as follows:
Core Opportunity Fund
| Security Name | | Share Balance at October 1, 2015 | | | Purchases | | | Sales | | | Share Balance at September 30, 2016 | | | Dividends | | | Realized Gains/
(Losses) | | | Market Value September 30, 2016 | |
| Clough Global Equity Fund* | | | 553,130 | | | | 658,454 | | | | – | | | | 1,211,584 | | | $ | 89,310 | | | $ | – | | | $ | 13,787,826 | |
| Clough Global Opportunities Fund | | | 2,863,442 | | | | 189,973 | | | | – | | | | 3,053,415 | | | $ | 211,867 | | | $ | – | | | $ | 29,526,523 | |
| | | | | | | | | | | | | | | | | | | $ | 301,177 | | | $ | – | | | $ | 43,314,349 | |
Strategic Income Fund
| Security Name | | Share Balance at October 1, 2015 | | | Purchases | | | Sales | | | Share Balance at September 30, 2016 | | | Dividends | | | Realized Gains/
(Losses) | | | Market Value September 30, 2016 | |
| RiverNorth/Oaktree High Income Fund, Class I | | | 2,600,690 | | | | 171,706 | | | | – | | | | 2,772,396 | | | $ | 1,555,692 | | | $ | – | | | $ | 26,286,745 | |
| | | | | | | | | | | | | | | | | | | $ | 1,555,692 | | | $ | – | | | $ | 26,286,745 | |
| Annual Report | September 30, 2016 | 147 |
| RiverNorth Funds | Notes to Financial Statements |
September 30, 2016
| * | At October 1, 2015 the Fund owned less than 5% of the outstanding shares of this security. Due to increased purchases within the period, this security is now considered an affiliate as of September 30, 2016. |
The Strategic Income Fund and the High Income Fund engaged in cross trades with each other during the year ended September 30, 2016 pursuant to Rule 17a-7 under the 1940 Act. Generally, cross trading is the buying or selling of portfolio securities between funds to which the Adviser serves as the investment adviser. The Board previously adopted procedures that apply to transactions between the Funds and its affiliates pursuant to Rule 17a-7. At its regularly scheduled meetings, the Board reviews such transactions as of the most current calendar quarter for compliance with the requirements set forth by Rule 17a-7 and the Funds’ procedures. The procedures require that the transactions be a purchase or sale for no consideration other than cash payment against prompt delivery of a security for which market quotations are readily available, and be consistent with the investment policies of each Fund. The Strategic Income Fund purchased secuirites from the High Income Fund in the amount of $3,803,116, resulting in a realized loss of $440,149 in the High Income Fund.
10. REVOLVING LINE OF CREDIT
On April 8, 2014, the Funds entered into a $100,000,000 committed unsecured Revolving Credit Agreement with State Street Bank & Trust, Co. The Revolving Credit Agreement was amended on April 17, 2015 and on April 5, 2016. Borrowings under this arrangement bear interest at the higher of the Federal Funds Rate and the One-Month LIBOR Rate in effect on the day the loan is made plus 1.25%, whichever is greater. From April 17, 2015 through September 30, 2016, the Funds paid a facility fee on unloaned balances equal to the product of $100,000,000 less the principal amount of loans outstanding and 0.25%. The Revolving Credit Agreement expires on April 4, 2017. For the year ended September 30, 2016, the Funds did not borrow under the Agreement.
On September 30, 2016, there were an unlimited number of no par value shares of beneficial interest authorized for each Fund. Transactions in shares of beneficial interest are shown in the Statements of Changes in Net Assets.
The beneficial ownership, either directly or indirectly, of more than 25% of the voting securities of a fund creates a presumption of control of the fund, under Section 2(a)(9) of the Investment Company Act of 1940. Beneficial owners owning more than 25% of the voting securities for the benefit of their customers of each class of each Fund, as of September 30, 2016, are listed below:
| Fund Name | Dealer Name | Percentage |
| Core Opportunity Fund - Class I | BMO HARRIS BANK | 30.05% |
| Core Opportunity Fund - Class I | Charles Schwab & Company, Inc. | 27.41% |
| Core Opportunity Fund - Class R | National Finacial Services Corp | 83.68% |
| Strategic Income Fund - Class I | Charles Schwab & Company, Inc | 27.06% |
| Strategic Income Fund - Class R | Charles Schwab & Company, Inc | 39.33% |
| Equity Opportunity Fund - Class I | BMO HARRIS BANK | 84.27% |
| Equity Opportunity Fund - Class R | Charles Schwab & Company, Inc. | 38.39% |
| Equity Opportunity Fund - Class R | National Financial Services Corp | 25.37% |
| 148 | (888) 848-7569 | www.rivernorth.com |
| RiverNorth Funds | Notes to Financial Statements |
| Fund Name | Dealer Name | Percentage |
| High Income Fund - Class I | RiverNorth/DoubleLine Strategic Income Fund | 35.72% |
| High Income Fund - Class R | Charles Schwab & Company, Inc. | 56.54% |
Under the Trust’s organizational documents, its officers and Trustees are indemnified against certain liability arising out of the performance of their duties to the Trust. Additionally, in the normal course of business, the Trust enters into contracts with service providers that may contain general indemnification clauses. The Trust’s maximum exposure under these arrangements is unknown, as this would involve future claims that may be made against the Trust that have not yet occurred.
On October 31, 2016 the RiverNorth Equity Opportunity Fund was liquidated and the remaining assets were distributed to shareholders.
| Annual Report | September 30, 2016 | 149 |
| RiverNorth Funds | Report of Independent Registered
Public Accounting Firm |
September 30, 2016
To the Shareholders and Board of Trustees of RiverNorth Funds
We have audited the accompanying statements of assets and liabilities, including the schedules of investments of RiverNorth Funds, comprising RiverNorth Core Opportunity Fund, RiverNorth/DoubleLine Strategic Income Fund, RiverNorth Equity Opportunity Fund, and RiverNorth/Oaktree High Income Fund (the “Funds”) as of September 30, 2016, and the related statements of operations for the year then ended, the statements of changes in net assets for each of the two years in the period then ended, and the financial highlights for each of the periods indicated in the period then ended. These financial statements and financial highlights are the responsibility of the Funds’ management. Our responsibility is to express an opinion on these financial statements and financial highlights based on our audits.
We conducted our audits in accordance with the standards of the Public Company Accounting Oversight Board (United States). Those standards require that we plan and perform the audit to obtain reasonable assurance about whether the financial statements and financial highlights are free of material misstatement. An audit includes examining, on a test basis, evidence supporting the amounts and disclosures in the financial statements. Our procedures included confirmation of securities owned as of September 30, 2016, by correspondence with the custodian and brokers, or by other appropriate auditing procedures where replies from brokers were not received. An audit also includes assessing the accounting principles used and significant estimates made by management, as well as evaluating the overall financial statement presentation. We believe that our audits provide a reasonable basis for our opinion.
In our opinion, the financial statements and financial highlights referred to above present fairly, in all material respects, the financial position of each of the Funds constituting RiverNorth Funds as of September 30, 2016, the results of their operations for the year then ended, the changes in their net assets for each of the two years in the period then ended, and the financial highlights for each of the periods indicated in the period then ended, in conformity with accounting principles generally accepted in the United States of America.
As described in Note 13 to the financial statements, subsequent to year end and effective October 31, 2016, RiverNorth Equity Opportunity Fund was liquidated and the remaining assets were distributed to shareholders.
COHEN & COMPANY, LTD.
Cleveland, Ohio
November 29, 2016
| 150 | (888) 848-7569 | www.rivernorth.com |
| RiverNorth Funds | Additional Information |
September 30, 2016 (Unaudited)
PROXY VOTING GUIDELINES
A description of the policies and procedures that the Funds used to determine how to vote proxies relating to portfolio securities and information regarding how the Funds voted proxies during the most recent 12-month period ended June 30, are available without charge upon request by (1) calling the Funds at (888) 848-7569 and (2) from Form N-PX filed by the Funds with the Securities and Exchange Commission (“SEC”) on the SEC’s website at www.sec.gov.
PORTFOLIO HOLDINGS DISCLOSURE POLICY
The Funds file a complete schedule of investments with the SEC for the first and third quarter of each fiscal year on Form N-Q. The Funds’ first and third fiscal quarters end on December 31 and June 30. The Form N-Q filing must be made within 60 days of the end of the quarter, and the Funds’ first Form N-Q was filed with the SEC on February 26, 2007. The Funds’ Forms N-Q are available on the SEC’s website at www.sec.gov, or they may be reviewed and copied at the SEC’s Public Reference Room in Washington, DC (call 1-800-732-0330 for information on the operations of the Public Reference Room). You may also obtain copies by calling the Funds at 1-888-848-7569.
TAX INFORMATION
The RiverNorth Core Opportunity Fund designates the following for federal income tax purposes for the year ended September 30, 2016:
| | | Foreign Taxes Paid | | | Foreign Source Income | |
| RiverNorth Core Opportunity Fund | | | $172,858 | | | | $1,976,682 | |
| | Tax-Exempt Percentage |
| RiverNorth Core Opportunity Fund | 3.37% |
Of the distributions paid by the Funds from ordinary income for the calendar year ended December 31, 2015, the following percentages met the requirements to be treated as qualifying for the corporate dividends received deduction and qualified dividend income:
| | Dividend Received Deduction | Qualified Dividend Income |
| RiverNorth Core Opportunity Fund | - | 18.27% |
| RiverNorth DoubleLine Strategic Income Fund | - | 1.86% |
| RiverNorth Equity Opportunity Fund | - | 26.33% |
| RiverNorth/Oaktree High Income Fund | - | 0.70% |
In early 2016, if applicable, shareholders of record received this information for the distributions paid to them by the Funds during the calendar year 2015 via Form 1099. The Funds will notify shareholders in early 2017 of amounts paid to them by the Funds, if any, during the calendar year 2016.
Pursuant to Section 852(b)(3) of the Internal Revenue Code, RiverNorth Core Opportunity Fund and RiverNorth Equity Opportunity Fund, designated $31,736,186 and $720,494 respectively, as long‐term capital gain dividends.
| Annual Report | September 30, 2016 | 151 |
| RiverNorth Funds | Trustees and Officers |
September 30, 2016 (Unaudited)
The following table provides information regarding each Trustee who is not an “interested person” of the Trust, as defined in the 1940 Act.
| INDEPENDENT TRUSTEES |
Name, Address1 and Year of Birth | Position(s) Held with the Fund | Term of Office/Length of Time Served | Principal Occupation(s) During Past 5 Years | Number of Portfolios
in Fund Complex Overseen by Trustee2 | Other Directorships Held by Trustee During the Past 5 Years |
John K. Carter Y.O.B. 1961 | Trustee | Indefinite/ January 2013 to present | Partner, Law Office of John K. Carter, P.A. (2015 to present); Managing Partner, Global Recruiters of St. Petersburg (a financial services consulting and recruiting firm) (2012 to 2015); Business Unit Head, Transamerica Asset Management (2006 to 2012). | 5 | Director, Chairman of the Board of Directors, Transamerica Funds (120 funds) (2006 to 2012). Board Member, United Way of Tampa Bay (2011 to 2012) |
James G. Kelley Y.O.B. 1948 | Trustee | Indefinite/ December 2006 to present | Certified Business Coach, JGK & Associates (2000 to present). | 4 | N/A |
John S. Oakes Y.O.B. 1943 | Trustee | Indefinite/ December 2010 to present | Principal, Financial Search and Consulting (a recruiting and consulting firm) (2013 to present); Regional Vice President, Securities America (a broker-dealer) (2007 to 2013). | 5 | N/A |
| 152 | (888) 848-7569 | www.rivernorth.com |
| RiverNorth Funds | Trustees and Officers |
September 30, 2016 (Unaudited)
| INDEPENDENT TRUSTEES | | | |
Name, Address1 and Year of Birth | Position(s) Held with the Fund | Term of Office/Length of Time Served | Principal Occupation(s) During Past 5 Years | Number of Portfolios in Fund Complex Overseen by Trustee2 | Other Directorships Held by Trustee During the Past 5 Years |
Fred G. Steingraber Y.O.B. 1938 | Trustee | Indefinite/ January 2013 to present | Chairman, Board Advisors LLC (a consulting firm) (2001 to present). Retired, Chairman Emeritus, A.T. Kearney (a business consulting firm) (2001 to present) | 4 | Director, Diamond Hill Financial Trends Fund (a closed-end fund) (1989 to 2013). Director, Elkay Manufacturing (2004 to present). Director, Talent Intelligence (leadership development) (2004 to present). Chairman Emeritus, A.T. Kearney (management consulting) (2001 to present). Chairman, Board Advisors (Board consulting) (2001
to present) |
| 1 | The mailing address of each Trustee is 325 N. LaSalle Street, Suite 645, Chicago, IL 60654. |
| 2 | The “Fund Complex” consists of the RiverNorth Core Opportunity Fund, the RiverNorth/DoubleLine Strategic Income Fund, the RiverNorth Equity Opportunity Fund and the RiverNorth/Oaktree High Income Fund, each a series of RiverNorth Funds Trust, and the RiverNorth Opportunities Fund, Inc. |
| Annual Report | September 30, 2016 | 153 |
| RiverNorth Funds | Trustees and Officers |
September 30, 2016 (Unaudited)
The following table provides information regarding each Trustee who is an “interested person” of the Trust, as defined in the 1940 Act, and each officer of the Trust.
| INTERESTED TRUSTEE AND OFFICERS |
Name, Address1 and Year of Birth | Position(s) Held with the Fund | Term of Office/Length of Time Served | Principal Occupation(s) During Past 5 Years | Number of Portfolios
in Fund Complex Overseen by Trustee2 | Other Directorships Held by Trustee During the Past 5 Years |
Patrick W. Galley3, Y.O.B. 1975 | President, Principal Executive Officer and Trustee | Indefinite/ July 2006
to present | Chief Investment Officer, RiverNorth Capital Management, LLC. (2004 to present). | 5 | Board of Managers RiverNorth Capital Management, LLC (2010 to present), Board of Managers of RiverNorth Securities, LLC (2010 to 2012) and Board of Directors RiverNorth Holdings, Co. (2010 to present). |
Jonathan M. Mohrhardt Y.O.B. 1974 | Treasurer and Chief Financial Officer | Indefinite/ February 2009 to present | Chief Compliance Officer, RiverNorth Capital Management, LLC. (2009 to 2012); Chief Operating Officer, RiverNorth Capital Management, LLC (2011 to present) and President, Chief Executive Officer and Chief Compliance Officer, RiverNorth Securities, LLC (2010 to 2012). | NA | Board of Managers RiverNorth Capital Management, LLC (2010 to present), Board of Managers of RiverNorth Securities, LLC (2010 to 2012) and Board of Directors RiverNorth Holdings, Co. (2010 to present). |
Marcus L. Collins Y.O.B. 1968 | Chief Compliance Officer | Indefinite/
May 2012
to Present | General Counsel, RiverNorth Capital Management, LLC (2012 to present), Chief Compliance Officer, RiverNorth Capital Management, LLC (2012 to present); Counsel, Thompson Hine, LLP (law firm) (2007 to 2012). | NA | NA |
| 154 | (888) 848-7569 | www.rivernorth.com |
| RiverNorth Funds | Trustees and Officers |
September 30, 2016 (Unaudited)
| INTERESTED TRUSTEE AND OFFICERS |
Name, Address1 and Year of Birth | Position(s) Held with the Fund | Term of Office/Length of Time Served | Principal Occupation(s) During Past 5 Years | Number of Portfolios in Fund Complex Overseen by Trustee2 | Other Directorships Held by Trustee During the Past 5 Years |
Valerie L. Ruppel Y.O.B. 1976 c/o ALPS Fund Services, Inc. 1290 Broadway, Suite 1100 Denver, CO 80203 | Secretary | Indefinite/May 2015 to Present | Vice President & Senior Counsel for ALPS Fund Services, Inc., joined ALPS in 2014. Before joining ALPS, Ms. Ruppel served as Counsel at Great-West Financial from 2009 to 2014. Ms. Ruppel also serves as Assistant Secretary of the RiverNorth Opportunities Fund, Inc. (2015 to present). | NA | NA |
Jennifer Craig Y.O.B. 1973 c/o ALPS Fund Services, Inc. 1290 Broadway, Suite 1100 Denver, CO 80203 | Assistant Secretary | Indefinite/ November 2015 to present | Assistant Vice President, Paralegal Manager, ALPS Fund Services, Inc. (2007 to present). | NA | NA |
Peter Greenly Y.O.B. 1968 c/o ALPS Fund Services, Inc. 1290 Broadway, Suite 1100 Denver, CO 80203 | Assistant Treasurer | Indefinite August 2016 to present | Fund Controller, ALPS Fund Services (2012 to present); Manager of Valuations with Great West Life and Annuity (2011 to 2012). | NA | NA |
1 | The mailing address of each Trustee and officer, unless otherwise noted, is 325 N. LaSalle Street, Suite 645, Chicago, IL 60654. |
| 2 | The Fund Complex consists of the RiverNorth Core Opportunity Fund, the RiverNorth/DoubleLine Strategic Income Fund, the RiverNorth Equity Opportunity Fund and the RiverNorth/Oaktree High Income Fund, each a series of RiverNorth Funds Trust, and the RiverNorth Opportunities Fund, Inc. |
| 3 | Patrick W. Galley is considered an “Interested” Trustee as defined in the 1940 Act, because he is an officer of the Trust and Chief Investment Officer of the Fund’s investment adviser. |
| Annual Report | September 30, 2016 | 155 |
| 156 | (888) 848-7569 | www.rivernorth.com |
RiverNorth Funds
RiverNorth Core Opportunity Fund
RiverNorth/DoubleLine Strategic Income Fund
RiverNorth Equity Opportunity Fund
RiverNorth/Oaktree High Income Fund
Board of Trustees
Patrick W. Galley, CFA, Chairman
James G. Kelley
John S. Oakes
Fred G. Steingraber
John K. Carter
Investment Adviser
RiverNorth Capital Management, LLC
Sub Advisers
DoubleLine Capital LP
Oaktree Capital Management, L.P.
Transfer Agent, Administrator and
Dividend Disbursing Agent
ALPS Fund Services, Inc.
Distributor
ALPS Distributors, Inc.
Custodian
State Street Bank & Trust
Independent Registered
Public Accounting Firm
Cohen & Company, Ltd.
This report is provided for the general information of the shareholders of the RiverNorth Funds. This report is not intended for distribution to prospective investors in the Funds, unless preceded or accompanied by an effective prospectus.
| (a) | The registrant, as of the end of the period covered by this report, has adopted a code of ethics that applies to the registrant's principal executive officer, principal financial officer, principal accounting officer or controller or any persons performing similar functions on behalf of the registrant. |
| (b) | For purposes of this item, “code of ethics” means written standards that are reasonably designed to deter wrongdoing and to promote: |
| (1) | Honest and ethical conduct, including the ethical handling of actual or apparent conflicts of interest between personal and professional relationships; |
| (2) | Full, fair, accurate, timely, and understandable disclosure in reports and documents that a registrant files with, or submits to, the Commission and in other public communications made by the registrant; |
| (3) | Compliance with applicable governmental laws, rules, and regulations; |
| (4) | The prompt internal reporting of violations of the code of ethics to an appropriate person or persons identified in the code of ethics; and |
| (5) | Accountability for adherence to the code of ethics. |
| (c) | Amendments: During the period covered by this report, no amendments were made to the provisions of the code of ethics adopted in 2(a) above. |
| (d) | Waivers: During the period covered by this report, no implicit or explicit waivers to the provisions of the code of ethics adopted in 2(a) above were granted. |
| (e) | Posting: We do not intend to post the code of ethics for the Officers or any amendments or waivers on a website. |
| (f) | Availability: The code of ethics for the Officers can be obtained, free of charge by calling the toll free number for the appropriate Fund. |
| Item 3. | Audit Committee Financial Expert. |
| | The registrant’s board of trustees has determined that the registrant does not have an audit committee financial expert. The committee members and the full Board considered a possibility of adding a member that would qualify as an expert. The audit committee determined that, although none of its members meet the technical definition of an audit committee expert, the committee has sufficient financial expertise to adequately perform its duties under the Audit Committee Charter without the addition of a qualified expert. |
| Item 4. | Principal Accountant Fees and Services. |
Fiscal Year | Audit Fees |
| FY 2016 | $74,500 |
| FY 2015 | $71,500 |
Fiscal Year | Registrant |
| FY 2016 | $0 |
| FY 2015 | $0 |
Fiscal Year | Registrant |
| FY 2016 | $16,000 |
| FY 2015 | $20,000 |
| Nature of the Tax Fees: prepare tax returns |
Fiscal Year | Registrant |
| FY 2016 | $5,500 |
| FY 2015 | $4,500 |
| Nature of the fees: cursory review of Semi-Annual Shareholder report and post-effective amendment consents.. |
(e)
| | (1) Audit Committee’s Pre-Approval Policies |
| | The Audit Committee Charter requires the Audit Committee to be responsible for the selection, retention or termination of auditors and, in connection therewith, to (i) evaluate the proposed fees and other compensation, if any, to be paid to the auditors, (ii) evaluate the independence of the auditors, (iii) pre-approve all audit services and, when appropriate, any non-audit services provided by the independent auditors to the Trust, (iv) pre-approve, when appropriate, any non-audit services provided by the independent auditors to the Trust's investment adviser, or any entity controlling, controlled by, or under common control with the investment adviser and that provides ongoing services to the Trust if the engagement relates directly to the operations and financial reporting of the Trust, and (v) receive the auditors' specific representations as to their independence. |
| | (2) Percentages of Services Approved by the Audit Committee |
Registrant | |
| Audit-Related Fees: | 100% |
| Tax Fees: | 100% |
| All Other Fees: | 100% |
| (f) | During audit of registrant's financial statements for the most recent fiscal year, less than 50 percent of the hours expended on the principal accountant's engagement were attributed to work performed by persons other than the principal accountant’s full-time, permanent employees. |
| (g) | The aggregate non-audit fees billed by the registrant’s accountant for services rendered to the registrant, and rendered to the registrant's investment adviser (not including any sub-adviser whose role is primarily portfolio management and is subcontracted with or overseen by another investment adviser), and any entity controlling, controlled by, or under common control with the adviser that provides ongoing services to the registrant: |
Fiscal Year | Registrant | Adviser |
| FY 2016 | $21,500 | $0 |
| FY 2015 | $24,500 | $0 |
| Item 5. | Audit Committee of Listed Registrants. |
| | NOT APPLICABLE – applies to listed companies only |
| Item 6. | Schedule of Investments. |
| (a) | The schedule of investments is included as part of the Report to Stockholders filed under Item 1 of this report. |
| Item 7. | Disclosure of Proxy Voting Policies and Procedures for Closed-End Management Investment Companies. |
| | NOT APPLICABLE – applies to closed-end funds only |
| Item 8. | Portfolio Managers of Closed-End Management Investment Companies. |
| | NOT APPLICABLE – applies to closed-end funds only |
| Item 9. | Purchases of Equity Securities by Closed-End Management Investment Company and Affiliated Purchasers. |
| | NOT APPLICABLE – applies to closed-end funds only |
| Item 10. | Submission of Matters to Vote of Security Holders. |
| | The registrant has not adopted procedures by which shareholders may recommend nominees to the registrant’s board of trustees. |
| Item 11. | Controls and Procedures. |
| (a) | Based on an evaluation of the registrant's disclosure controls and procedures (as defined in Rule 30a-3(c) under the Investment Company Act of 1940) as of a date within 90 days of the filing date of this Form N-CSR, the disclosure controls and procedures are reasonably designed to ensure that the information required in filings on Forms N-CSR is recorded, processed, summarized, and reported on a timely basis. |
| (b) | There were no significant changes in the registrant's internal control over financial reporting that occurred during the registrant’s second fiscal quarter of the period covered by this report that have materially affected, or are reasonably likely to materially affect, the registrant's internal control over financial reporting. |
| (a)(1) | Code of Ethics is filed herewith. |
| (a)(2) | Certifications by the registrant's principal executive officer and principal financial officer, pursuant to Section 302 of the Sarbanes-Oxley Act of 2002 and required by Rule 30a-2under the Investment Company Act of 1940 are filed herewith. |
| (b) | Certification pursuant to 18 U.S.C. Section 1350, as adopted pursuant to Section 906 of the Sarbanes-Oxley Act of 2002 is filed herewith. |
SIGNATURES
Pursuant to the requirements of the Securities Exchange Act of 1934 and the Investment Company Act of 1940, the registrant has duly caused this report to be signed on its behalf by the undersigned, thereunto duly authorized.
| Registrant: | RiverNorth Funds | |
| | | |
| By: | /s/ Patrick W. Galley | |
| Name: | Patrick W. Galley | |
| Title: | President | |
| | | |
| Date: | November 30, 2016 | |
Pursuant to the requirements of the Securities Exchange Act of 1934 and the Investment Company Act of 1940, this report has been signed below by the following persons on behalf of the registrant and in the capacities and on the dates indicated.
| By: | /s/ Patrick W. Galley | |
| Name: | Patrick W. Galley | |
| Title: | President & Chief Executive Officer | |
| | | |
| Date: | November 30, 2016 | |
| By: | /s/ Jonathan M. Mohrhardt | |
| Name: | Jonathan M. Mohrhardt | |
| Title: | Treasurer & Chief Financial Officer | |
| | | |
| Date: | November 30, 2016 | |