UNITED STATES
SECURITIES AND EXCHANGE COMMISSION
Washington, D.C. 20549
FORM N-CSR
CERTIFIED SHAREHOLDER REPORT OF REGISTERED
MANAGEMENTINVESTMENT COMPANIES
Investment Company Act file number: 811-21934
RiverNorth Funds
(Exact name of registrant as specified in charter)
325 North LaSalle Street, Suite 645
Chicago, IL 60654
(Address of principal executive offices) (Zip code)
Marc L. Collins
325 North LaSalle Street, Suite 645
Chicago, IL 60654
(Name and address of agent for service)
Registrant’s telephone number, including area code: 312-832-1440
Date of fiscal year end: 09/30
Date of reporting period: 09/30/2017
| Item 1. | Reports to Stockholders. |
| RiverNorth Funds | Table of Contents |
| Shareholder Letter | 2 |
| Opportunistic Closed-End Fund Strategies | |
| Portfolio Update | 3 |
| RiverNorth Core Opportunity Fund | 5 |
| RiverNorth/DoubleLine Strategic Income Fund | 11 |
| RiverNorth/Oaktree High Income Fund | 17 |
| RiverNorth Funds Schedule of Investments and Financial Statements | |
| Disclosure of Fund Expenses | 23 |
| Schedule of Investments | |
| RiverNorth Core Opportunity Fund | 25 |
| RiverNorth/DoubleLine Strategic Income Fund | 28 |
| RiverNorth/Oaktree High Income Fund | 63 |
| Statement of Assets and Liabilities | |
| RiverNorth Core Opportunity Fund | 81 |
| RiverNorth/DoubleLine Strategic Income Fund | 83 |
| RiverNorth/Oaktree High Income Fund | 85 |
| Statement of Operations | |
| RiverNorth Core Opportunity Fund | 87 |
| RiverNorth/DoubleLine Strategic Income Fund | 88 |
| RiverNorth/Oaktree High Income Fund | 89 |
| Statements of Changes in Net Assets | |
| RiverNorth Core Opportunity Fund | 90 |
| RiverNorth/DoubleLine Strategic Income Fund | 92 |
| RiverNorth/Oaktree High Income Fund | 94 |
| Financial Highlights | |
| RiverNorth Core Opportunity Fund | 96 |
| RiverNorth/DoubleLine Strategic Income Fund | 104 |
| RiverNorth/Oaktree High Income Fund | 108 |
| Notes to Financial Statements | 115 |
| Report of Independent Registered Public Accounting Firm | 136 |
| Additional Information | 137 |
| Trustees & Officers | 139 |
| RiverNorth Funds | Shareholder Letter |
September 30, 2017 (Unaudited)
Dear Fellow Shareholders,
In 2017, investors had the benefit of strong risk asset returns with little volatility. In fact, volatility as measured by the CBOE Volatility Index (“VIX”) ended the RiverNorth Funds’ fiscal year (September 30, 2017) at 9.51, near an all-time low close of 9.31 going back to 1990. Low volatility resulted in risk assets rallying with the S&P 500 up almost 19% and high yield bonds up roughly 9% during the Funds’ fiscal year.
We believe this continued low volatility world has resulted in unprecedented dollars flowing to passive indexes and out of actively managed mutual funds. As active managers ourselves, most would be surprised to hear we are proponents of passive investing. In fact, our flagship RiverNorth Core Opportunity Fund’s strategy is based on utilizing “cheap beta” vis-à-vis passive exchange traded funds (“ETFs”) in combination with opportunistic investments in closed-end funds (CEF). The basic strategy being: own a diversified basket of asset classes through closed-end funds when discounts are relatively attractive and when they are not, own similar asset classes through ETFs. Time discounts, not the market. This strategy has proven strong results in fiscal year 2017. More important is the Fund’s long term track record. Since the Fund’s inception in 2006, the Fund has beat most major market indices. We accomplished this track record in a much diversified, balanced manner, investing in many asset classes, but adding excess return through opportunistic closed-end fund investments.
While we are subscribers to the use of ETFs and passive index investing, we are also circumspect on the proliferation and asset growth. Last year we stated, “The viscous cycle of assets chasing the same passive strategies resulting in outperformance, resulting in investors pouring more capital into those same outperforming strategies, may one day need to reverse. One thing we do know with certainty is running for the exit is more ferocious than the way in the door.” While this did not come to fruition in 2017, the rubber band has only gotten stretched further.
This brings us to the benefits of closed-end funds. While the closed-end fund initial public offering (IPO) market has slowed (9 IPOs raising $1.7 billion in the Funds’ fiscal year), the closed-end structure can protect the manager’s need to be a forced seller because of redemptions and limits the risk of permanent loss. While the premiums and discounts of closed-end funds can add to volatility, structurally closed-end funds being issued today are no longer perpetual but rather have a finite life (typically 5-10 years), thereby limiting the discount volatility as the funds get closer to their termination. As one of the largest institutional investors in closed-end funds, the playing field remains plentiful despite a slowdown in CEF IPOs. The closed-end fund space is approximately $270 billion in size and still predominately owned by retail investors. We agree with this year’s Nobel Prize winner in economics, Richard H. Thaler, that people are predictably irrational. Closed-end funds, in our opinion, are the perfect medium to exploit and profit from irrational investor behavior.
We are pleased to provide you with the 2017 Annual Report for the RiverNorth Funds. The report reviews our three opportunistic closed-end strategies: the RiverNorth Core Opportunity Fund (ticker: RNCIX and RNCOX), the RiverNorth/DoubleLine Strategic Income Fund (tickers: RNSIX and RNDLX), and the RiverNorth/Oaktree High Income Fund (tickers: RNHIX and RNOTX).
Please visit www.rivernorth.com for additional information.
We thank you for your investment and trust in managing your assets.
Respectfully,
Patrick W. Galley, CFA
President and Chief Investment Officer
RiverNorth Funds
| 2 | (888) 848-7569 | www.rivernorth.com |
| RiverNorth Funds | Portfolio Update |
September 30, 2017 (Unaudited)
Definitions:
Yield – The yield is the income return on an investment, such as the interest or dividends received from holding a particular security.
Special-Purpose Acquisition Company (SPAC) – A special-purpose acquisition company uses an initial public offering (IPO) to raise money it will use to purchase or merge with an existing company.
Discount – The price at which a closed-end fund trades often varies from its net asset value (NAV). The price is said to be a discount to the NAV when it is below the NAV.
Sector Spread – The spread between the interest rate offered in two sectors of the bond market for issues of the same maturity.
Yield – The yield is the income return on an investment. This refers to the interest or dividends received from a security and is usually expressed annually as a percentage based on the investment's cost, its current market value or its face value.
Master Limited Partnership (MLP) – MLPs are publicly traded limited partnerships. Shares of ownership are referred to as units. MLPs generally operate in the natural resource, financial services, and real estate industries.
U.S. Treasury Curve – The U.S. Treasury yield curve compares the yields of short-term Treasury bills with long-term Treasury notes and bonds.
Basis Point (bps or bip) – A common unit of measure for interest rates and other percentages in finance. One basis point is equal to 1/100th of 1%, or 0.01% (0.0001), and is used to denote the percentage change in a financial instrument.
Residential Mortgage-Backed Securities (RMBS) – RMBS are a type of mortgage-backed debt obligation whose cash flows come from residential debt, such as mortgages, home-equity loans and subprime mortgages.
Agency RMBS – Agency RMBS are created by one of three quasi-government agencies: Government National Mortgage Association (known as GNMA or Ginnie Mae), Federal National Mortgage (FNMA or Fannie Mae), and Federal Home Loan Mortgage Corp.
Non-Agency RMBS – Non-Agency RMBS are created by private entities, such as financial institutions. These bonds are not guaranteed by the U.S. government or any government-sponsored enterprise.
Alt-A – Alt-A refers to a a classification of mortgages where the risk profile falls between prime and subprime. The borrowers behind these mortgages will typically have clean credit histories, but the mortgage itself will generally have some issues that increase its risk profile.
Mortgage-Backed Securities (MBS) – MBS are asset-backed securities that are secured by a mortgage or collection of mortgages.
Asset-Backed Securities (ABS) – ABS are bonds or notes backed by financial assets.
| Annual Report | September 30, 2017 | 3 |
| RiverNorth Funds | Portfolio Update |
September 30, 2017 (Unaudited)
Collateralized Mortgage Obligation (CMO) – A CMO refers to a type of mortgage-backed security that contains a pool of mortgages bundled together and sold as an investment.
CCC-Rated Bonds – A credit rating used by the S&P and Fitch credit agencies for long-term bonds. CCC rating represents an extremely high risk bond or investment.
Coupon – A coupon is the annual interest rate paid on a bond, expressed as a percentage of the face value.
Duration – Duration is a measure of the sensitivity of the price of a fixed income investment to a change in interest rates.
Par – Par is a term that refers to a financial instrument that is trading at its face value.
4 | (888) 848-7569 | www.rivernorth.com |
| RiverNorth Funds | Portfolio Update |
September 30, 2017 (Unaudited)
RiverNorth Core Opportunity Fund
What is the Fund's investment strategy?
The RiverNorth Core Opportunity Fund ("the Fund") invests in a broad range of equity, fixed income and short‐term securities. To implement the Fund's tactical asset allocation, the adviser generally invests in closed‐end funds (CEF), exchange‐traded funds (ETF) and business development companies (BDC). Additionally, the Fund has also begun to invest in special-purpose acquisition companies (SPAC).
How did the RiverNorth Core Opportunity Fund perform relative to its benchmark during the reporting period?
For the twelve month period ending September 30, 2017, the Class I share (symbol: RNCIX) returned 14.71% and the Class R share (symbol: RNCOX) returned 14.51%. The unmanaged Blend Index returned 10.9% during the same period. The Blend Index consists of 60% S&P 500 and 40% Bloomberg Barclays Capital U.S. Aggregate Bond Index.
Comparison of a $10,000 Investment in the RiverNorth Core Opportunity Fund Class R, the Blend Index, and the S&P 500® Index.
| Annual Report | September 30, 2017 | 5 |
| RiverNorth Funds | Portfolio Update |
September 30, 2017 (Unaudited)
Comparison of a $10,000 Investment in the RiverNorth Core Opportunity Fund Class I, the Blend Index, and the S&P 500® Index.
Average Annual Total Returns for Periods Ending September 30, 2017
| | 1-Year | 3-Year | 5-Year | 10 Year | Since
Inception(1)(2) |
RiverNorth Core Opportunity Fund – Class I (RNCIX)(3) | 14.71% | 6.97% | 8.46% | 8.13% | 8.27% |
| RiverNorth Core Opportunity Fund – Class R (RNCOX) | 14.51% | 6.72% | 8.20% | 7.87% | 8.01% |
Blend Index(4) | 10.90% | 7.65% | 9.34% | 6.47% | 6.63% |
S&P 500® Index(4) | 18.61% | 10.81% | 14.22% | 7.44% | 7.71% |
| (1) | Inception date of Class R is December 27, 2006. |
| (2) | Inception date of Class I is August 11, 2014. |
| (3) | In presenting performance information for the newer Institutional share class of the Fund, the Fund includes, for periods prior to the offering of the Institutional share class, the operating expense ratio and performance of the Fund’s Retail share class, adjusted to reflect the class-related operating expenses of the Institutional share class. Actual expense differentials across classes will vary over time. The performance of the Fund’s newer Institutional share class would have been substantially similar to the performance of the Fund’s Retail share class because both share classes of the Fund are invested in the same portfolio of securities and would have differed only to the extent that the classes do not have the same expenses (although differences in expenses between share classes may change over time). |
| 6 | (888) 848-7569 | www.rivernorth.com |
| RiverNorth Funds | Portfolio Update |
September 30, 2017 (Unaudited)
| (4) | Blend Index consists of 60% S&P 500® Index and 40% Bloomberg Barclays Capital U.S. Aggregate Bond Index. S&P 500® Index is a capitalization-weighted index of 500 stocks. The Bloomberg Barclays Capital U.S. Aggregate Bond Index is an unmanaged index of investment-grade fixed-rate debt issues with maturities of at least one year. This unmanaged index does not reflect fees and expenses. The S&P 500® and Blend Indices are indices only and cannot be invested
in directly. |
Performance data quoted represents past performance, which is not a guarantee of future results. Current performance may be lower or higher than the performance quoted. The principal value and investment return of an investment will fluctuate so that your shares, when redeemed, may be worth more or less than their original cost. You can obtain performance data current to the most recent month end by calling (888) 848-7569 or www.rivernorth.com. Total return measures net investment income and capital gain or loss from portfolio investments. All performance shown assumes reinvestment of dividends and capital gains distributions and does not reflect the deduction of taxes that a shareholder would pay on fund distributions or the redemption of fund shares.
The Total Annual Fund Operating Expense for the Fund as disclosed in the prospectus dated January 28, 2017: 2.56% (RNCIX), 2.81% (RNCOX). In presenting expense information for the newer Institutional share class of the Fund, the Fund includes, for periods prior to the offering of the Institutional share class, the operating expense ratio of the Fund’s Retail share class, adjusted to reflect the class-related operating expenses of the Institutional share class. Actual expense differentials across share classes will vary over time. The annualized net expense ratio in this annual report dated September 30, 2017 is 1.12% (RNCIX) and 1.37% (RNCOX). The expense ratio as disclosed in the Fund’s annual report dated September 30, 2017 only includes the direct expenses paid by shareholders from their investment. The expense ratio as disclosed in the Fund’s prospectus dated January 28, 2017 is required to include the indirect expenses of investing in underlying funds.
What contributing factors were responsible for the RiverNorth Core Opportunity Fund's relative performance during the period?
Both stocks and bonds performed well and discount narrowing boosted total return. The average discount on our CEF portfolio has narrowed from 12.9% to 8.6%.
With respect to the equity portfolio, our concentrated portfolio of U.S. and global equity closed-end funds contributed to relative performance. Conversely, our below-benchmark allocation to stocks and exposure to commodity related funds detracted from performance. During the period, our equity exposure was roughly 50% versus 60% for the Blend Index.
Our fixed income portfolio outperformed the Bloomberg Barclays Capital U.S. Aggregate Bond Index. The Fund owned bond funds with exposure to corporate, mortgage and government credit. We held minimal exposure to U.S. treasuries and agencies, which dominate the benchmark. Our allocation to spread sectors added meaningful credit risk to the portfolio, but generated strong absolute and relative returns. The primary detractor from relative performance was our cash positon, typically in the range of 15% to 20%. Although the opportunity cost of cash was high during the period, we held cash to offset the leverage in our CEF portfolio.
Annual Report | September 30, 2017 | 7 |
| RiverNorth Funds | Portfolio Update |
September 30, 2017 (Unaudited)
How was the RiverNorth Core Opportunity Fund positioned at the end of September 2017?
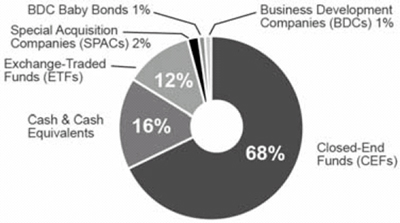
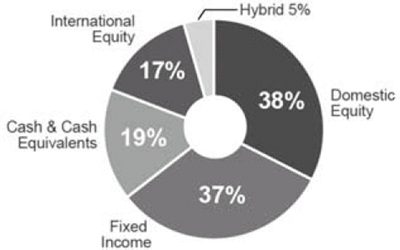
We have allocated 55% of the portfolio to equity, 37% to fixed income, 5% to hybrid securities and 19% to cash. Closed-end fund exposure was 68%. Allocations exceed 100% due to leverage utilized by the underlying funds.
The Fund continues to favor equity CEFs with managed distribution policies. In many cases, we believe equity CEFs can only compete with ETFs when they offer a significant yield advantage – whether or not that yield includes a return of capital. During the period, we increased our exposure to U.S. equity funds with high distributions and have reduced exposure to global equity funds. We anticipate higher turnover in the equity portfolio in the next reporting period due to CEF corporate actions. The Fund has been active in both rights offerings and tender offers, which enable us to efficiently buy and sell large positions.
We have reduced our exposure to high yield corporate credit and increased exposure to both emerging market and municipal bonds. We have also added unsecured notes issued by BDCs. Our closed-end bond fund portfolio remains concentrated in funds with attractive discounts.
We hope to put some cash to work in the fourth quarter of 2017. We believe a number of bank loan funds, BDCs and master limited partnership (MLP) funds are susceptible to tax-loss selling. There may be pressure on municipal funds too. We will look to take advantage of mean reversion trading opportunities near year-end.
Investment Vehicle Allocation(1) (percentages are based on net assets)
The allocation does not add up to 100% due to rounding.
| 8 | (888) 848-7569 | www.rivernorth.com |
| RiverNorth Funds | Portfolio Update |
September 30, 2017 (Unaudited)
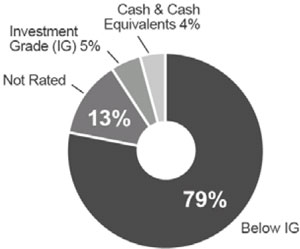
Asset Class Allocation(1) (percentages are based on net assets)
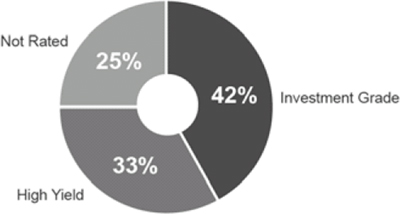
Fixed Income Allocation(1)(2) (percentages are based on net assets)
The allocation does not add up to 100% as it reflects the estimated leverage utilized by the underlying funds and the effects of a total return swap.
Portfolio detail statistics are estimates made by the adviser and are subject to change.
| (1) | Convertible Security Risk – the market value of convertible securities adjusts with interest rates and the value of the underlying stock. Exchange Traded Note Risk – exchange traded notes represent unsecured debt of the issuer and may be influenced by interest rates, credit ratings of the issuer or changes in value of the reference index. Fixed Income Risk – the market value of fixed income securities adjusts with interest rates and the securities are subject to issuer default. Foreign/Emerging Market Risk – foreign securities may be subject to inefficient or volatile markets, different regulatory regimes or different tax policies. These risks may be enhanced in emerging markets. Management Risk – there is no guarantee that the adviser’s investment decisions will produce the desired results. Large Shareholder Purchase and Redemption Risk – The Fund may experience adverse effects when certain large shareholders purchase or redeem large amounts of shares of the Fund. Market Risk – economic conditions, interest rates and political events may affect the securities markets. REIT Risk – the value of REITs changes with the value of the underlying properties and changes in interest rates and are subject to additional fees. Security Risk – The value of the Fund may decrease in response to the activities and financial prospects of individual securities in the Fund’s portfolio. Short Sale Risk – short positions are speculative, are subject to transaction costs and are riskier than long positions in securities. Small-Cap Risk – small-cap companies are more susceptible to failure, are often thinly traded and have more volatile stock prices. Structured Notes Risk – because of the imbedded derivative feature, structured notes are subject to more risk than investing in a simple note or bond. Swap Risk – swap agreements are subject to counterparty default risk and may not perform as intended. Underlying Fund Risk – underlying funds have additional fees, may utilize leverage, may not correlate to an intended index and may trade at a discount to their net asset values. |
Annual Report | September 30, 2017 | 9 |
| RiverNorth Funds | Portfolio Update |
September 30, 2017 (Unaudited)
| (2) | Credit quality allocation reflects a fixed‐income portfolio weighted average of the credit breakdown of each closed‐end fund as provided by the adviser of said closed‐end fund. If a credit breakdown is not provided by the adviser, Bloomberg is used. Investment grade refers to a bond rated BBB‐ or higher by Standard & Poor’s or Baa3 or higher by Moody’s. High yield refers to a bond rate lower than investment grade. For more information about securities ratings, please see the Fund’s Statement of Additional information at www.rivernorth.com. |
| 10 | (888) 848-7569 | www.rivernorth.com |
| RiverNorth Funds | Portfolio Update |
September 30, 2017 (Unaudited)
RiverNorth/DoubleLine Strategic Income Fund
What is the Fund's investment strategy?
The RiverNorth/DoubleLine Strategic Income ("the Fund") invests in a broad range of fixed income securities of U.S. and foreign issuers, including closed‐end funds.
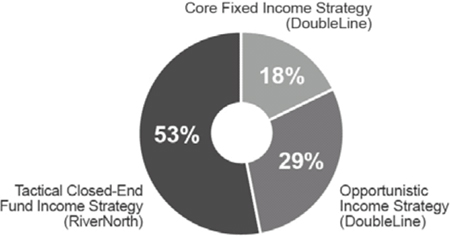
Assets of the Fund are tactically managed across three strategies (or sleeves). RiverNorth oversees the strategy weights and manages the Tactical Closed‐End Fund Income Strategy. The RiverNorth strategy provides diversified exposure to the fixed income market through opportunistic investments in closed‐end bond funds (CEF), business development companies (BDC) and special-purpose acquisition companies (SPAC). Sector allocations are based on RiverNorth's assessment of relative value among asset classes and closed‐end funds. Jeffrey Gundlach, CEO and CIO of DoubleLine, and his team oversee the Opportunistic Income and Core Fixed Income Strategies. The Opportunistic Income Strategy seeks to achieve positive absolute returns and is managed without duration constraints. The Core Fixed Income Strategy incorporates an active asset allocation approach in an effort to mitigate risk and achieve the highest possible risk‐adjusted returns.
How did the RiverNorth/DoubleLine Strategic Income Fund perform relative to its benchmark during the reporting period?
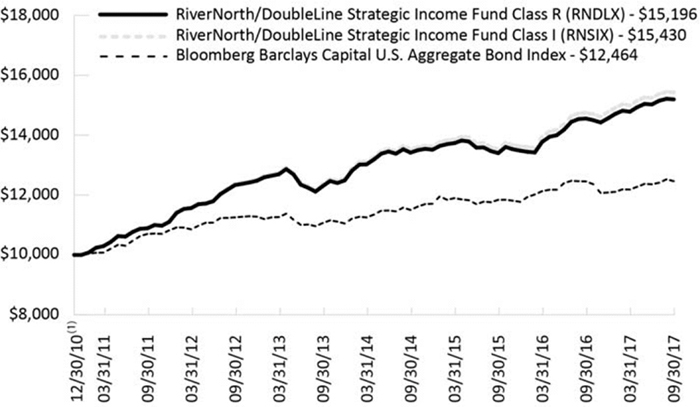
For the twelve month period ending September 30, 2017, the Class I share (symbol: RNSIX) returned 4.67% and the Class R share (symbol: RNDLX) returned 4.40%. The Bloomberg Barclays Capital U.S. Aggregate Bond Index returned 0.1%, during the same period.
Annual Report | September 30, 2017 | 11 |
| RiverNorth Funds | Portfolio Update |
September 30, 2017 (Unaudited)
Comparison of a $10,000 Investment in the RiverNorth/DoubleLine Strategic Income Fund and the Barclays Capital U.S. Aggregate Bond Index
Average Annual Total Returns for Periods Ending September 30, 2017
| | 1-Year | 3-Year | 5-Year | Since Inception(1) |
| RiverNorth/DoubleLine Strategic Income Fund – Class I (RNSIX) | 4.67% | 4.47% | 4.51% | 6.64% |
| RiverNorth/DoubleLine Strategic Income Fund – Class R (RNDLX) | 4.40% | 4.24% | 4.26% | 6.39% |
Bloomberg Barclays Capital U.S. Aggregate Bond Index(2) | 0.07% | 2.71% | 2.06% | 3.32% |
| (1) | Inception date is December 30, 2010. |
| (2) | The Bloomberg Barclays Capital U.S. Aggregate Bond Index is an unmanaged index of investment-grade fixed-rate debt issues with maturities of at least one year. The index cannot be invested in directly and does not reflect fees and expenses. |
Performance data quoted represents past performance, which is not a guarantee of future results. Current performance may be lower or higher than the performance quoted. The principal value and investment return of an investment will fluctuate so that your shares, when redeemed, may be worth more or less than their original cost. You can obtain performance data current to the most recent month end by calling (888) 848-7569 or www.rivernorth.com. Total return measures net investment income and capital gain or loss from portfolio investments. All performance shown assumes reinvestment of dividends and capital gains distributions and does not reflect the deduction of taxes that a shareholder would pay on fund distributions or the redemption of fund shares.
| 12 | (888) 848-7569 | www.rivernorth.com |
| RiverNorth Funds | Portfolio Update |
September 30, 2017 (Unaudited)
The Total Annual Fund Operating Expense for the Fund as disclosed in the prospectus dated January 28, 2017: 1.74% (RNSIX), 1.49% (RNDLX). The annualized net expense ratio in this annual report dated September 30, 2017 is 0.85% (RNSIX) and 1.10% (RNDLX). The expense ratio as disclosed in the Fund’s annual report dated September 30, 2017 only includes the direct expenses paid by shareholders from their investment. The expense ratio as disclosed in the Fund’s prospectus dated January 28, 2017 is required to include the indirect expenses of investing in underlying funds.
What contributing factors were responsible for the RiverNorth/DoubleLine Strategic Income Fund's relative performance during the period?
RiverNorth Tactical Closed‐End Fund Income Sleeve
Spread sectors of the bond market rallied and discount narrowing boosted total return. The average discount on our CEF portfolio has narrowed from 9.4% to 8.6%.
The Tactical Closed-end Fund Strategy outperformed the benchmark during the period. About half of the portfolio, excluding cash, was allocated to high yield corporate credit. In an environment of narrowing credit spreads, closed-end bond funds with corporate credit exposure performed well. Additionally, the portfolio’s exposure to multi-sector, municipal and global income funds contributed to outperformance. The Fund’s cash allocation was the primary detractor from relative performance.
DoubleLine Opportunistic Income Sleeve
The Opportunistic Income Strategy outperformed the benchmark during the period. For the 12-month period ended September 30, 2017, the U.S. treasury curve sold-off with the 2-year and 10-year yields increasing 72 basis points (bps) and 74 bps, respectively. The portfolio outperformed the benchmark largely due to spread tightening across securitized credit. Non-agency residential mortgage-backed securities (RMBS) were the best performers with Alt-A securities leading the sector in returns. Prices were up across the credit spectrum and the sector continued to benefit from robust interest income. Asset-backed securities (ABS) and commercial mortgage-backed securities (CMBS) were also accretive to performance as prices increased during the period. Agency RMBS underperformed due to the sell-off in rates which resulted in a decline in prices. Puerto Rico municipals also detracted from performance as valuations declined due to the island filing for bankruptcy in May when it was unable to reach a deal with its creditors. In addition, the island was hit by the worst storm in nearly a century when Hurricane Maria made landfall in September.
DoubleLine Core Fixed Income Sleeve
The Core Fixed Income Strategy outperformed the benchmark during the period. The outperformance can largely be attributed to strong performance from emerging markets fixed income and collateralized loan obligations. Additionally, the strategy began investing in infrastructure related debt in the latter half of the past year, which posted positive returns, but is still only a small percentage of the portfolio. The strategy increased exposure to non-agency MBS while simultaneously decreasing exposure to agency MBS. Non-agency MBS contributed positively with the largest contributions coming from allocations to Alt-A CMOs and prime mortgages. Other sectors such as investment grade corporate bonds, CMBS, and ABS all posted positive returns as spreads continued to tighten. Over the past 12-months, the US yield curve steepened, with higher rates both in the short and long ends of the curve. As a result of the steeper yield curve, U.S. treasuries, agency MBS, and municipal bonds detracted from the overall performance of the portfolio (although still outperforming their respective benchmarks). Over the past year, the strategy has decreased exposure to these sectors, collectively by more than five percent.
Annual Report | September 30, 2017 | 13 |
| RiverNorth Funds | Portfolio Update |
September 30, 2017 (Unaudited)
How was the RiverNorth/DoubleLine Strategic Income Fund positioned at the end of September 2017?
We have allocated 53%, 29% and 18% to the Tactical Closed-end Fund, Opportunistic Income and Core Fixed Income sleeves, respectively. At the Fund level, we have reduced exposure to corporate credit and increased exposure to both municipal and government bonds.
Strategy (“Sleeve”) Allocation
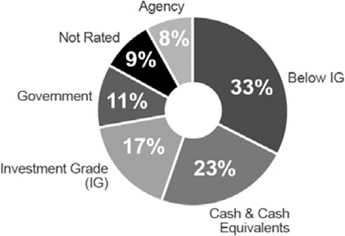
Credit Quality Distribution(1)(2) (percentages are based on net assets)
Totals may not add up to 100% due to rounding.
| 14 | (888) 848-7569 | www.rivernorth.com |
| RiverNorth Funds | Portfolio Update |
September 30, 2017 (Unaudited)
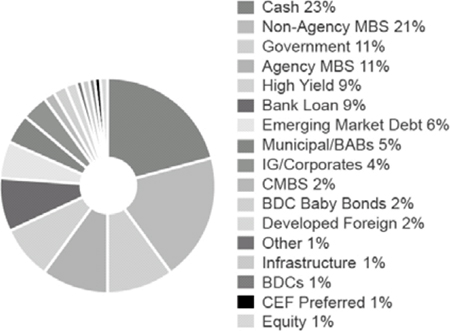
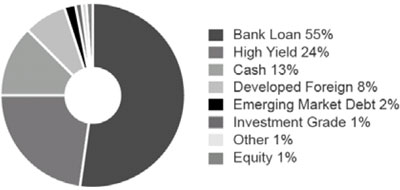
Sector Breakdown(1) (percentages are based on net assets)
The allocation does not add up to 100% as it reflects the estimated leverage utilized by the underlying funds and the effects of a total return swap.
Portfolio detail statistics are estimates made by the adviser and are subject to change.
| (1) | Asset-Backed Security Risk – the risk that the value of the underlying assets will impair the value of the security. Borrowing Risk – borrowings increase fund expenses and are subject to repayment, possibly at inopportune times. Convertible Security Risk – the market value of convertible securities adjusts with interest rates and the value of the underlying stock. Defaulted Securities Risk – defaulted securities carry the risk of uncertainty of repayment. Derivatives Risk – derivatives are subject to counterparty risk. Exchange Traded Note Risk – exchange traded notes represent unsecured debt of the issuer and may be influenced by interest rates, credit ratings of the issuer or changes in value of the reference index. Fixed Income Risk – the market value of fixed income securities adjusts with interest rates and the securities are subject to issuer default. Foreign/Emerging Market Risk – foreign securities may be subject to inefficient or volatile markets, different regulatory regimes or different tax policies. These risks may be enhanced in emerging markets. Liquidity Risk – illiquid investments may be difficult or impossible to sell. Large Shareholder Purchase and Redemption Risk – The Fund may experience adverse effects when certain large shareholders purchase or redeem large amounts of shares of the Fund. Management Risk – there is no guarantee that the adviser’s or sub-adviser’s investment decisions will produce the desired results. Market Risk – economic conditions, interest rates and political events may affect the securities markets. Mortgage-Backed Security Risk – mortgage backed securities are subject to credit risk, pre-payment risk and devaluation of the underlying collateral. Portfolio Turnover Risk – increased portfolio turnover results in higher brokerage expenses and may impact the tax status of distributions. Rating Agency Risk – rating agencies may change their ratings or ratings may not accurately reflect a debt issuer’s creditworthiness. REIT Risk – the value of REITs changes with the value of the underlying properties and changes in interest rates and are subject to additional fees. Security Risk – The value of the Fund may decrease in response to the activities and financial prospects of individual securities in the Fund’s portfolio. Structured Notes Risk – because of the imbedded derivative feature, structured notes are subject to more risk than investing in a simple note or bond. Swap Risk – swap agreements are subject to counterparty default risk and may not perform as intended. Underlying Fund Risk – underlying funds have additional fees, may utilize leverage, may not correlate to an intended index and may trade at a discount to their net asset values. |
Annual Report | September 30, 2017 | 15 |
| RiverNorth Funds | Portfolio Update |
September 30, 2017 (Unaudited)
| (2) | For the sleeve managed by RiverNorth, credit quality allocation reflects a fixed-income portfolio weighted average of the credit breakdown of each closed-end fund as provided by the advisor of said closed-end fund. If a credit breakdown is not provided by the advisor, Bloomberg is used. For the sleeves managed by DoubleLine, credit quality allocation is determined from the highest available credit rating from any Nationally Recognized Statistical Rating Organization (S&P, Moody’s and Fitch). Investment grade refers to a bond rated BBB- or higher by Standard & Poor’s or Baa3 or higher by Moody’s. High yield refers to a bond rated lower than investment grade. For more information about securities ratings, please see the Fund’s Statement of Additional Information at www.rivernorth.com. |
| 16 | (888) 848-7569 | www.rivernorth.com |
| RiverNorth Funds | Portfolio Update |
| | September 30, 2017 (Unaudited) |
RiverNorth/Oaktree High Income Fund
What is the Fund's investment strategy?
The RiverNorth/Oaktree High Income Fund ("the Fund") invests in a broad range of income producing securities including both fixed income and equity securities.
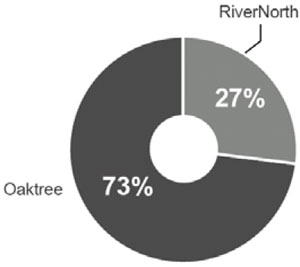
Assets of the Fund are tactically managed across three income strategies (or sleeves). RiverNorth manages the Tactical Closed‐End Fund Strategy. This strategy is designed to provide diversified fixed income and equity income exposure through opportunistic investments in closed‐end funds. Oaktree Capital Management, LP manages the High Yield Bond and Senior Loan Strategies on a global basis. Oaktree will tactically manage the allocation between the High Yield Bond and Senior Loan Strategies based both on market opportunities and the risk and reward trade‐offs between the two asset classes.
How did the RiverNorth/Oaktree High Income Fund perform relative to its benchmark during the reporting period?
For the 12-month period ending September 30, 2017, the Class I share (symbol: RNHIX) returned 7.11% and the Class R share (symbol: RNOTX) returned 6.83%. The BofA ML Non‐ Financial Developed HY Constrained Index and CS Leveraged Loan Index returned 9.8% and 5.4%, respectively, during the same period.
Comparison of a $10,000 Investment in the RiverNorth/Oaktree High Income Fund, BofA ML Non-Financial Developed HY Constrained Index and the CS Leveraged Loan Index
| Annual Report | September 30, 2017 | 17 |
| RiverNorth Funds | Portfolio Update |
| | September 30, 2017 (Unaudited) |
Average Annual Total Returns for the Period Ending September 30, 2017
| | 1-Year | 3-Year | Since Inception(1) |
| RiverNorth/Oaktree High Income Fund – Class I (RNHIX) | 7.11% | 4.40% | 4.79% |
| RiverNorth/Oaktree High Income Fund – Class R (RNOTX) | 6.83% | 4.13% | 4.52% |
BofA ML Non-Financial Developed HY Constrained Index(2) | 9.83% | 5.21% | 5.49% |
CS Leveraged Loan Index(2) | 5.36% | 3.95% | 4.31% |
| (1) | Inception date is December 28, 2012. |
| (2) | The BofA Merrill Lynch Non-Financial Developed Markets High Yield Constrained Index contains all securities in the BofA Merrill Lynch Global High Yield index from developed markets countries but cap issuer exposure at 2%. Developed markets is defined as an FX-G10 member, a Western European nation, or a territory of the U.S. or a Western European nation. The index tracks the performance of USD, CAD, GBP and EUR denominated below investment grade corporate debt publicly issued in the major domestic or Eurobond markets. Qualifying securities must have a below investment grade rating (based on an average of Moody’s, S&P and Fitch). CS Leveraged Loan Index tracks the investable market of the U.S. dollar denominated leveraged loan market. It consists of issues rated “5B” or lower, meaning that the highest rated issues included in this index are Moody’s/S&P ratings of Baa1/BB+ or Ba1/BBB+. All loans are funded term loans with a tenor of at least one year and are made by issuers domiciled in developed countries. The Bofa Merrill Lynch Non-Financial Developed Markets High Yield Constrained and the CS Leveraged Loan Indices are indices only and cannot be invested in directly. |
Performance data quoted represents past performance, which is not a guarantee of future results. Current performance may be lower or higher than the performance quoted. The principal value and investment return of an investment will fluctuate so that your shares, when redeemed, may be worth more or less than their original cost. You can obtain performance data current to the most recent month end by calling (888) 848-7569 or www.rivernorth.com. Total return measures net investment income and capital gain or loss from portfolio investments. All performance shown assumes reinvestment of dividends and capital gains distributions and does not reflect the deduction of taxes that a shareholder would pay on fund distributions or the redemption of fund shares.
The Total Annual Operating Expense for the Fund as disclosed in the prospectus dated January 28, 2017: 1.44% (RNHIX), 1.70% (RNOTX). The adviser has contractually agreed to defer the collection of fees and/or reimburse expenses, but only to the extent necessary to limit Total Annual Fund Operating Expenses (excluding brokerage fees and commissions; borrowing costs, such as (a) interest and (b) dividends on securities sold short; taxes; indirect expenses incurred by the underlying funds in which the Fund invests; and extraordinary expenses) to 1.35% (RNHIX) and 1.60% (RNOTX) of the average daily net assets of the Fund through January 31, 2018. The annualized net expense ratio in this annual report dated September 30, 2017 is 1.35% (RNHIX) and 1.60% (RNOTX). The expense ratio as disclosed in the Fund’s annual report dated September 30, 2017 only includes the direct expenses paid by shareholders from their investment. The expense ratio as disclosed in the Fund’s prospectus dated January 28, 2017 is required to include the indirect expenses of investing in underlying funds.
| 18 | (888) 848-7569 | www.rivernorth.com |
| RiverNorth Funds | Portfolio Update |
| | September 30, 2017 (Unaudited) |
What contributing factors were responsible for the RiverNorth/Oaktree High Income Fund's relative performance during the period?
RiverNorth Tactical Closed‐End Fund Sleeve
The portfolio’s overweighting of high yield closed-end funds compared to bank loan funds contributed to performance. In addition, discount narrowing positively impacted both high yield and bank loan funds over the period. Global income and multi-sector funds also performed well. On average, taxable bond funds were up 10.8% during the reporting period. The Fund’s cash allocation was the primary detractor from relative performance.
Oaktree High Yield Bond & Senior Loan Sleeve
Investors favored higher risk assets during the twelve month period ended September 30, 2017. Bolstered by a resilient U.S. economy and low interest rates around the globe, equities ranked as the top performer, with the S&P 500 returning an impressive 18.6%.
Taking their lead from the rallying equity market, global high yield bonds and senior loans also performed well, trouncing investment grade securities by a wide margin. Reflecting investors’ strong risk appetites, CCC-rated bonds and loans meaningfully outperformed their higher rated counterparts.
With investors bracing for the Federal Reserve to raise U.S. interest rates, it’s fair to consider how high yield bonds and senior loans would fare in such an environment. Thanks to their higher coupon and typically shorter maturities, the duration of high yield bonds is moderate. As a result, it is our belief that high yield bonds should be well positioned to outperform longer duration investment grade bonds in a rising interest rate environment. Similarly, the floating-rate structure of most senior loans, by nature, allows the instruments to outperform most other fixed income asset classes as interest rates rise. In addition, rising interest rates usually imply a growing economy, and a growing economy usually means improving creditworthiness and fewer defaults.
Credit conditions in the high yield bond and senior loan markets were relatively sound during the reporting period, and defaults are expected to remain relatively low in the near-term. Supporting this view is the small percentage of the market trading at or below 70% of par (an indicator of perceived credit weakness).
How was the RiverNorth/Oaktree High Income Fund positioned at the end of September 2017?
The Fund allocation was 27% RiverNorth Tactical Closed‐End Fund and 73% Oaktree High Yield Bond and Senior Loan. The closed‐end fund sleeve is primarily invested in the common shares of closed‐end funds. Over the past year we have increased the Fund's allocation to bank loan closed-end funds and have decreased exposure to multi-sector bond closed-end funds. The Oaktree portfolios remain defensively positioned and constructed to preserve capital in the event of a market downturn. Oaktree believes the key to long-term success is managing credit risk, avoiding dangerous concentrations and minimizing defaults in the portfolio.
| Annual Report | September 30, 2017 | 19 |
| RiverNorth Funds | Portfolio Update |
| | September 30, 2017 (Unaudited) |
Strategy Allocation
Credit Quality Distribution(1)(2) (percentages are based on net assets)
Totals may not add up to 100% due to rounding.
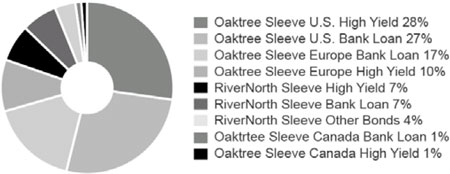
Sector Breakdown(1) (percentages are based on net assets)
The allocation does not add up to 100% as it reflects the leverage utilized by the underlying funds.
| 20 | (888) 848-7569 | www.rivernorth.com |
| RiverNorth Funds | Portfolio Update |
| | September 30, 2017 (Unaudited) |
High Yield & Bank Loan Geographic Breakdown
Totals may not add up to 100% due to rounding.
Portfolio detail statistics are estimates made by the adviser and are subject to change.
| (1) | Borrowing Risk – borrowings increase fund expenses and are subject to repayment, possibly at inopportune times. Closed-End Fund Risk – closed-end funds are exchange traded, may trade at a discount to their net asset values and may deploy leverage. Convertible Security Risk – the market value of convertible securities adjusts with interest rates and the value of the underlying stock. Credit Derivatives Risk – the use of credit derivatives is highly specialized, involves default, counterparty and liquidity risks and may not perfectly correlate to the underlying asset or liability being hedged. Currency Risk – foreign currencies will rise or decline relative to the U.S. dollar. Distressed and Defaulted Securities Risk – defaulted securities carry the risk of uncertainty of repayment. Equity Risk – equity securities may experience volatility and the value of equity securities may move in opposite directions from each other and from other equity markets generally. Fixed Income Risk – the market value of fixed income securities adjusts with interest rates and the securities are subject to issuer default. Foreign/Emerging Market Risk – foreign securities may be subject to inefficient or volatile markets, different regulatory regimes or different tax policies. These risks may be enhanced in emerging markets. Floating Interest Rate Risk – loans pay interest based on the London Interbank Offered Rate (LIBOR) and a decline in LIBOR could negatively impact the Fund’s return. Investment Style Risk – investment strategies may come in and out of favor with investors and may underperform or outperform at times. Large Shareholder Purchase and Redemption Risk – The Fund may experience adverse effects when certain large shareholders purchase or redeem large amounts of shares of the Fund. Loans Risk – loans may be unrated or rated below investment grade and the pledged collateral may lose value. Secondary trading in loans is not fully-developed and may result in illiquidity. Management Risk – there is no guarantee that the adviser’s or sub-adviser’s investment decisions will produce the desired results. Market Risk – economic conditions, interest rates and political events may affect the securities markets. Portfolio Turnover Risk – increased portfolio turnover results in higher brokerage expenses and may impact the tax status of distributions. Preferred Stock Risk – preferred stocks generally pay dividends, but may be less liquid than common stocks, have less priority than debt instruments and may be subject to redemption by the issuer. Security Risk – the value of the Fund may increase or decrease in response to the prospects of the issuers of securities and loans held in the Fund. Swap Risk – swap agreements are subject to counterparty default risk and may not perform as intended. Underlying Fund Risk – underlying funds have additional fees, may utilize leverage, may not correlate to an intended index and may trade at a discount to their net asset values. Valuation Risk – Loans and fixed-income securities are traded “over the counter” and because there is no centralized information regarding trading, the valuation of loans and fixed-income securities may vary. |
| Annual Report | September 30, 2017 | 21 |
| RiverNorth Funds | Portfolio Update |
| | September 30, 2017 (Unaudited) |
| (2) | For the sleeve managed by RiverNorth, credit quality allocation reflects a fixed‐income portfolio weighted average of the credit breakdown of each closed‐end fund as provided by the advisor of said closed‐end fund. If a credit breakdown is not provided by the advisor, Bloomberg is used. For the sleeves ma For the sleeves managed by Oaktree, the sub‐adviser uses a proprietary credit scoring matrix to rank potential investments. This process offers a systematic way of reviewing the key quantitative and qualitative variables impacting credit quality for each investment. Investment grade refers to a bond rated BBB‐ or higher by Standard & Poor’s or Baa3 or higher by Moody’s. High yield refers to a bond rated lower than investment grade. For more information about securities ratings, please see the Fund’s Statement of Additional Information at www.rivernorth.com. |
| 22 | (888) 848-7569 | www.rivernorth.com |
| RiverNorth Funds | Disclosure of Fund Expenses |
| | September 30, 2017 (Unaudited) |
Expense Example
As a shareholder of the RiverNorth Funds (the "Trust" or "Funds"), you incur two types of costs: (1) transaction costs (such as the 2% fee on redemptions of Fund shares made within 90 days of purchase); and (2) ongoing costs, including management fees, distribution and service (12b-1) fees and other Fund expenses. This example is intended to help you understand your ongoing costs (in dollars) of investing in the Funds and to compare these costs with the ongoing costs of investing in other mutual funds. The Example is based on an investment of $1,000 invested at the beginning of the period, April 1, 2017, and held for the six months ended September 30, 2017.
Actual Expenses
The first line of the table below provides information about actual account values and actual expenses. You may use the information in this line, together with the amount you invested, to estimate the expenses that you paid over the period. Simply divide your variable account value by $1,000 (for example, an $8,600 account value divided by $1,000 = 8.6), then multiply the result by the number in the first line under the heading entitled “Expenses Paid During Period” to estimate the expenses you paid on your account during this period.
Hypothetical Example for Comparison Purposes
The second line of the table below provides information about hypothetical account values and hypothetical expenses based on each Fund’s actual expense ratio and an assumed rate of return of 5% per year before expenses, which is not each Fund’s actual return. The hypothetical account values and expenses may not be used to estimate the actual ending account balance or expenses you paid for the period. You may use this information to compare the ongoing costs of investing in each Fund and other funds. To do so, compare these 5% hypothetical examples with the 5% hypothetical examples that appear in the shareholder reports of other funds.
Please note that the expenses shown in the table below are meant to highlight your ongoing costs only and do not reflect any transactional costs, such as redemption fees. Therefore, the second line for each share class of each Fund within the table is useful in comparing ongoing costs only, and will not help you determine the relative total costs of owning different funds. If these transactional costs were included, your costs would have been higher.
| Annual Report | September 30, 2017 | 23 |
| RiverNorth Funds | Disclosure of Fund Expenses |
| | September 30, 2017 (Unaudited) |
| | Beginning
Account Value
04/01/2017 | Ending
Account Value
09/30/2017 | Expense
Ratio(a) | Expenses Paid During Period(b) |
| RiverNorth Core Opportunity Fund |
| Class I Shares | | | | |
| Actual | $1,000.00 | $1,074.30 | 1.14% | $5.93 |
| Hypothetical (5% return before expenses) | $1,000.00 | $1,019.35 | 1.14% | $5.77 |
| Class R Shares | | | | |
| Actual | $1,000.00 | $1,072.90 | 1.39% | $7.22 |
| Hypothetical (5% return before expenses) | $1,000.00 | $1,018.10 | 1.39% | $7.03 |
| RiverNorth/DoubleLine Strategic Income Fund |
| Class I Shares | | | | |
| Actual | $1,000.00 | $1,030.20 | 0.85% | $4.33 |
| Hypothetical (5% return before expenses) | $1,000.00 | $1,020.81 | 0.85% | $4.31 |
| Class R Shares | | | | |
| Actual | $1,000.00 | $1,027.90 | 1.10% | $5.59 |
| Hypothetical (5% return before expenses) | $1,000.00 | $1,019.55 | 1.10% | $5.57 |
| RiverNorth/Oaktree High Income Fund |
| Class I Shares | | | | |
| Actual | $1,000.00 | $1,028.20 | 1.35% | $6.86 |
| Hypothetical (5% return before expenses) | $1,000.00 | $1,018.30 | 1.35% | $6.83 |
| Class R Shares | | | | |
| Actual | $1,000.00 | $1,027.00 | 1.60% | $8.13 |
| Hypothetical (5% return before expenses) | $1,000.00 | $1,017.05 | 1.60% | $8.09 |
(a) | Annualized, based on the Fund's most recent fiscal half-year expenses. |
(b) | Expenses are equal to the Fund's annualized expense ratio multiplied by the average account value over the period, multiplied by the number of days in the most recent fiscal half year (183), then divided by 365. Note this expense example is typically based on a six-month period. |
| 24 | (888) 848-7569 | www.rivernorth.com |
| RiverNorth Core Opportunity Fund | Schedule of Investments |
| Shares/Description | | | | Value | |
| CLOSED-END FUNDS - 67.94% | |
| 784,173 | | Adams Diversified Equity Fund, Inc. | | $ | 11,927,271 | |
| 216,700 | | AllianzGI Equity & Convertible Income Fund | | | 4,485,690 | |
| 589,444 | | AllianzGI NFJ Dividend Interest & Premium Strategy Fund | | | 7,898,550 | |
| 733,783 | | Alpine Total Dynamic Dividend Fund | | | 6,604,047 | |
| 559,197 | | BlackRock Credit Allocation Income Trust | | | 7,588,303 | |
| 141,486 | | BlackRock Debt Strategies Fund, Inc. | | | 1,651,142 | |
| 252,551 | | BlackRock Global Opportunities Equity Trust | | | 3,424,592 | |
| 42,882 | | BlackRock Multi-Sector Income Trust | | | 801,893 | |
| 148,302 | | BlackRock Resources & Commodities Strategy Trust | | | 1,318,405 | |
| 71,849 | | Blackstone/GSO Long-Short Credit Income Fund | | | 1,155,332 | |
| 432,007 | | Boulder Growth & Income Fund, Inc. | | | 4,406,471 | |
| 477,267 | | Central Fund of Canada, Ltd. | | | 6,046,973 | |
| 572,824 | | Clough Global Equity Fund | | | 7,595,646 | |
| 1,521,185 | | Clough Global Opportunities Fund | | | 16,976,425 | |
| 328,979 | | Cornerstone Strategic Value Fund, Inc. | | | 4,872,179 | |
| 20,549 | | Cornerstone Total Return Fund, Inc. | | | 300,632 | |
| 90,182 | | Eaton Vance Limited Duration Income Fund | | | 1,265,253 | |
| 177,027 | | General American Investors Co., Inc. | | | 6,376,513 | |
| 165,186 | | Invesco Dynamic Credit Opportunities Fund | | | 1,969,017 | |
| 287,275 | | Legg Mason BW Global Income Opportunities Fund, Inc. | | | 3,860,976 | |
| 4,691,905 | | Liberty All Star® Equity Fund | | | 28,292,187 | |
| 122,016 | | LMP Capital and Income Fund, Inc. | | | 1,774,113 | |
| 53,534 | | Morgan Stanley Emerging Markets Debt Fund, Inc. | | | 539,087 | |
| 94,788 | | Morgan Stanley Emerging Markets Domestic Debt Fund, Inc. | | | 762,095 | |
| 73,566 | | Neuberger Berman High Yield Strategies Fund, Inc. | | | 894,563 | |
| 144,453 | | NexPoint Credit Strategies Fund | | | 3,329,642 | |
| 271,493 | | Nuveen AMT-Free Municipal Income Fund | | | 3,760,178 | |
| 315,637 | | Nuveen Credit Strategies Income Fund | | | 2,679,758 | |
| 243,465 | | Nuveen Dividend Advantage Municipal Fund | | | 3,454,768 | |
| 238,649 | | Nuveen Intermediate Duration Quality Municipal Term Fund | | | 3,154,940 | |
| 295,716 | | Nuveen Mortgage Opportunity Term Fund | | | 7,499,358 | |
| 89,136 | | Nuveen Mortgage Opportunity Term Fund 2 | | | 2,188,298 | |
| 68,295 | | Prudential Global Short Duration High Yield Fund, Inc. | | | 1,019,644 | |
| 486,399 | | Royce Micro-Cap Trust, Inc. | | | 4,562,423 | |
| 681,293 | | Royce Value Trust, Inc. | | | 10,757,616 | |
| 870,932 | | Sprott Focus Trust, Inc. | | | 6,732,304 | |
| 1,050,184 | | Templeton Global Income Fund | | | 7,078,240 | |
| 359,663 | | Tri-Continental Corp. | | | 9,189,390 | |
| 142,911 | | Virtus Total Return Fund, Inc. | | | 1,863,559 | |
| 857,099 | | Western Asset Emerging Markets Income Fund, Inc. | | | 13,490,738 | |
| 1,196,160 | | Western Asset High Income Opportunity Fund, Inc. | | | 6,136,301 | |
| | | | | | | |
| TOTAL CLOSED-END FUNDS (Cost $191,799,228) | | | 219,684,512 | |
See Notes to Financial Statements. | |
| Annual Report | September 30, 2017 | 25 |
| RiverNorth Core Opportunity Fund | Schedule of Investments |
| Shares/Description | | Value | |
| BUSINESS DEVELOPMENT COMPANIES - 0.65% | |
| 129,257 | | Ares Capital Corp. | | $ | 2,118,522 | |
| | | | | | | |
| TOTAL BUSINESS DEVELOPMENT COMPANIES (Cost $2,144,764) | | | 2,118,522 | |
| | | | | |
| COMMON STOCKS - 1.67% | |
| 317,800 | | Andina Acquisition Corp. II(a) | | | 3,228,848 | |
| 28,425 | | Atlantic Acquisition Corp.(a) | | | 292,209 | |
| 22,174 | | Draper Oakwood Technology Acquisition, Inc.(a) | | | 226,618 | |
| 28,115 | | I-AM Capital Acquisition Co.(a) | | | 288,179 | |
| 29,517 | | Industrea Acquisition Corp.(a) | | | 298,417 | |
| 34,474 | | Osprey Energy Acquisition Corp.(a) | | | 342,327 | |
| 68,873 | | Pensare Acquisition Corp.(a) | | | 711,458 | |
| | | | | | | |
| TOTAL COMMON STOCKS (Cost $5,341,450) | | | 5,388,056 | |
| | | | | |
| EXCHANGE-TRADED FUNDS - 11.95% | |
| 135,594 | | Market Vectors® Gold Miners ETF | | | 3,113,238 | |
| 307,565 | | PowerShares® FTSE RAFI Emerging Markets Portfolio | | | 6,560,361 | |
| 100,632 | | PowerShares® FTSE RAFI US 1000 Portfolio | | | 10,782,719 | |
| 126,277 | | Vanguard® FTSE Developed Markets ETF | | | 5,481,685 | |
| 291,859 | | Vanguard® FTSE Emerging Markets ETF | | | 12,716,297 | |
| | | | | | | |
| TOTAL EXCHANGE-TRADED FUNDS (Cost $34,095,452) | | | 38,654,300 | |
| | | | | |
| PREFERRED STOCKS - 1.57% | |
| 39,580 | | General American Investors Co., Inc., Series B, 5.950% | | | 1,058,464 | |
| 24,695 | | Harvest Capital Credit Corp., 6.125%, 09/15/2022 | | | 627,250 | |
| 66,875 | | KCAP Financial, Inc., 6.125%, 09/30/2022 | | | 1,669,548 | |
| 68,081 | | TriplePoint Venture Growth Corp., 5.750%, 07/15/2022 | | | 1,721,088 | |
| | | | | | | |
| TOTAL PREFERRED STOCKS (Cost $4,927,482) | | | 5,076,350 | |
| | | | | |
| RIGHTS - 0.00%(b) | |
| 258 | | Reaves Utility Income Fund, Strike Price 29.93, Expires 10/06/2017 | | | 96 | |
| | | | | | | |
| TOTAL RIGHTS (Cost $0) | | | 96 | |
See Notes to Financial Statements. | |
| 26 | (888) 848-7569 | www.rivernorth.com |
| RiverNorth Core Opportunity Fund | Schedule of Investments |
| Shares/Description | | Value | |
| SHORT-TERM INVESTMENTS - 16.11% | |
| Money Market Fund | | | |
| 52,084,823 | | State Street Institutional Trust (7 Day Yield 0.92%) | | $ | 52,084,823 | |
| | | | | | | |
| TOTAL SHORT-TERM INVESTMENTS (Cost $52,084,823) | | | 52,084,823 | |
| | | | | |
TOTAL INVESTMENTS - 99.89% (Cost $290,393,199) | | | 323,006,659 | |
| CASH SEGREGATED AT CUSTODIAN FOR TOTAL RETURN SWAP CONTRACTS - 0.12% | | | 400,000 | |
| LIABILITIES IN EXCESS OF OTHER ASSETS - (0.01)% | | | (42,646 | ) |
| NET ASSETS - 100.00% | | $ | 323,364,013 | |
(a) | Non-income producing security. |
See Notes to Financial Statements. | |
| Annual Report | September 30, 2017 | 27 |
| RiverNorth/DoubleLine Strategic Income Fund | Schedule of Investments |
September 30, 2017
| Shares/Description | | | | Value | |
| CLOSED-END FUNDS - 23.94% | |
| 188,366 | | Advent Claymore Convertible Securities and Income Fund | | $ | 3,049,646 | |
| 564,285 | | Advent Claymore Convertible Securities and Income Fund II | | | 3,521,138 | |
| 112,115 | | Advent/Claymore Enhanced Growth & Income Fund | | | 965,310 | |
| 340,090 | | AllianceBernstein National Municipal Income Fund, Inc. | | | 4,747,656 | |
| 585,360 | | Ares Dynamic Credit Allocation Fund, Inc. | | | 9,599,904 | |
| 2,504,865 | | BlackRock Corporate High Yield Fund, Inc. | | | 28,304,975 | |
| 1,764,417 | | BlackRock Credit Allocation Income Trust | | | 23,943,139 | |
| 1,185,775 | | BlackRock Debt Strategies Fund, Inc. | | | 13,837,994 | |
| 227,204 | | BlackRock Limited Duration Income Trust | | | 3,660,257 | |
| 523,862 | | BlackRock Multi-Sector Income Trust | | | 9,796,219 | |
| 431,622 | | BlackRock Muni Intermediate Duration Fund, Inc. | | | 6,116,084 | |
| 718,841 | | Blackstone / GSO Strategic Credit Fund | | | 11,487,079 | |
| 946,039 | | Brookfield Real Assets Income Fund, Inc. | | | 22,506,268 | |
| 453,240 | | Deutsche High Income Opportunities Fund, Inc. | | | 6,857,521 | |
| 606,777 | | Deutsche Multi-Market Income Trust | | | 5,436,722 | |
| 2,376,321 | | Eaton Vance Limited Duration Income Fund | | | 33,339,784 | |
| 924,906 | | Eaton Vance Senior Income Trust | | | 6,122,878 | |
| 65,567 | | Eaton Vance Short Duration Diversified Income Fund | | | 933,674 | |
| 78,435 | | First Trust Aberdeen Global Opportunity Income Fund | | | 924,749 | |
| 1,627,911 | | Invesco Dynamic Credit Opportunities Fund | | | 19,404,699 | |
| 219,867 | | Invesco High Income Trust II | | | 3,319,992 | |
| 2,639,856 | | Invesco Senior Income Trust | | | 11,852,953 | |
| 458,497 | | Legg Mason BW Global Income Opportunities Fund, Inc. | | | 6,162,200 | |
| 785,348 | | MFS Charter Income Trust | | | 6,808,967 | |
| 981,244 | | MFS Multimarket Income Trust | | | 6,122,963 | |
| 483,942 | | Morgan Stanley Emerging Markets Debt Fund, Inc. | | | 4,873,296 | |
| 1,490,864 | | Morgan Stanley Emerging Markets Domestic Debt Fund, Inc. | | | 11,986,547 | |
| 230,385 | | Morgan Stanley Income Securities, Inc. | | | 4,216,046 | |
| 447,751 | | Neuberger Berman High Yield Strategies Fund, Inc. | | | 5,444,652 | |
| 61,376 | | NexPoint Credit Strategies Fund | | | 1,414,717 | |
| 2,513,479 | | Nuveen AMT-Free Municipal Income Fund | | | 34,811,684 | |
| 1,870,041 | | Nuveen Credit Strategies Income Fund | | | 15,876,648 | |
| 1,229,137 | | Nuveen Dividend Advantage Municipal Fund | | | 17,441,454 | |
| 456,712 | | Nuveen Global High Income Fund | | | 7,933,087 | |
| 922,310 | | Prudential Global Short Duration High Yield Fund, Inc. | | | 13,770,088 | |
| 250,440 | | Prudential Short Duration High Yield Fund, Inc. | | | 3,821,714 | |
| 1,258,342 | | Templeton Emerging Markets Income Fund | | | 14,559,017 | |
| 2,166,040 | | Templeton Global Income Fund | | | 14,599,110 | |
| 2,111,144 | | Voya Prime Rate Trust | | | 11,041,283 | |
| 314,671 | | Wells Fargo Advantage Income Opportunities Fund | | | 2,753,371 | |
| 110,653 | | Wells Fargo Multi-Sector Income Fund | | | 1,484,963 | |
| 2,477,031 | | Western Asset Emerging Markets Income Fund, Inc. | | | 38,988,468 | |
| 20,249 | | Western Asset Global Corporate Defined Opportunity Fund, Inc. | | | 369,139 | |
| 1,343,604 | | Western Asset Global High Income Fund, Inc. | | | 13,825,685 | |
| 4,931,482 | | Western Asset High Income Opportunity Fund, Inc. | | | 25,298,503 | |
| 814,688 | | Western Asset High Yield Defined Opportunity Fund, Inc. | | | 12,668,398 | |
See Notes to Financial Statements.
| 28 | (888) 848-7569 | www.rivernorth.com |
| RiverNorth/DoubleLine Strategic Income Fund | Schedule of Investments |
September 30, 2017
| Shares/Description | | Value | |
| 1,795,762 | | Western Asset/Claymore Inflation-Linked Opportunities & Income Fund | | $ | 20,256,195 | |
| 701,628 | | Western Asset/Claymore Inflation-Linked Securities & Income Fund | | | 8,103,803 | |
| | | | | | | |
TOTAL CLOSED-END FUNDS (Cost $524,547,730) | | | 534,360,639 | |
| | | | | |
| BUSINESS DEVELOPMENT COMPANIES - 0.82% | |
| 1,120,537 | | Ares Capital Corp. | | | 18,365,601 | |
| | | | | | | |
TOTAL BUSINESS DEVELOPMENT COMPANIES (Cost $18,478,285) | | | 18,365,601 | |
| | | | | |
| COMMON STOCKS - 0.07% | |
| 1,469 | | Amplify Energy Corp.(a) | | | 15,057 | |
| 32,970 | | Energy XXI Gulf Coast, Inc.(a) | | | 340,910 | |
| 6,082 | | Pacific Rubiales Energy Corp.(a) | | | 212,870 | |
| 52,330 | | SandRidge Energy, Inc.(a) | | | 1,051,312 | |
| | | | | | | |
TOTAL COMMON STOCKS (Cost $4,536,873) | | | 1,620,149 | |
| | | | | |
| OPEN-END FUNDS - 1.26% | |
| 2,893,133 | | RiverNorth/Oaktree High Income Fund, Class I(b) | | | 28,154,818 | |
| | | | | | | |
TOTAL OPEN-END FUNDS (Cost $28,238,128) | | | 28,154,818 | |
| | | | | |
| PREFERRED STOCKS - 1.20% | |
| 120,000 | | Annaly Capital 6.950%, Series F Perp(a) | | | 3,087,600 | |
| 62,871 | | GDL Fund, Series B, 3.000%(a) | | | 3,165,555 | |
| 81,800 | | Gladstone Investment Corp., 6.250%, 09/30/2023(a) | | | 2,083,364 | |
| 128,627 | | Gladstone Investment Corp., Series C, 6.500%(a) | | | 3,297,996 | |
| 125,774 | | Kayne Anderson MLP Investment Co., Series F, 3.500%(a) | | | 3,194,660 | |
| 225,827 | | KCAP Financial, Inc., 6.125%, 09/30/2022(a) | | | 5,637,816 | |
| 247,369 | | TriplePoint Venture Growth Corp., 5.750%, 07/15/2022(a) | | | 6,253,489 | |
| | | | | | | |
TOTAL PREFERRED STOCKS (Cost $26,509,409) | | | 26,720,480 | |
| Shares/Description | Rate | Maturity | | | Value | |
| BUSINESS DEVELOPMENT COMPANY NOTES - 0.67% | |
| United States - 0.67% | |
| 58,358 | | Fifth Street Finance Corp.(a) | 6.13% | 04/30/2028 | | | 1,480,542 | |
See Notes to Financial Statements.
| Annual Report | September 30, 2017 | 29 |
| RiverNorth/DoubleLine Strategic Income Fund | Schedule of Investments |
September 30, 2017
| Shares/Description | Rate | Maturity | | | Value | |
| 56,444 | | Hercules Capital, Inc.(a) | 6.25% | 07/30/2024 | | $ | 1,434,931 | |
| 147,345 | | Main Street Capital Corp.(a) | 6.13% | 04/01/2023 | | | 3,816,015 | |
| 90,502 | | MVC Capital, Inc.(a) | 7.25% | 01/15/2023 | | | 2,280,650 | |
| 124,486 | | THL Credit, Inc.(a) | 6.75% | 11/15/2021 | | | 3,134,557 | |
| 112,010 | | THL Credit, Inc.(a) | 6.75% | 12/30/2022 | | | 2,895,190 | |
| | | | | | 15,041,885 | |
| |
TOTAL BUSINESS DEVELOPMENT COMPANY NOTES (Cost $14,596,035) | | | | | 15,041,885 | |
| Principal Amount/Description | Rate | Maturity | | Value | |
| FOREIGN CORPORATE BONDS - 2.00% | | | | | | |
| Argentina - 0.01% | | | | | | |
| $ | 150,000 | | Aeropuertos Argentina 2000 SA(c) | 6.88% | 02/01/2027 | | | 160,275 | |
| Australia - 0.18% | | | | | | |
| | 1,000,000 | | APT Pipelines, Ltd.(c) | 4.25% | 07/15/2027 | | | 1,030,400 | |
| | 585,000 | | Australia & New Zealand Banking Group, Ltd.(c) | 4.88% | 01/12/2021 | | | 632,508 | |
| | 750,000 | | Commonwealth Bank of Australia(c) | 2.75% | 03/10/2022 | | | 757,219 | |
| | 500,000 | | Sydney Airport Finance Co. Pty, Ltd.(c) | 3.38% | 04/30/2025 | | | 499,382 | |
| | 500,000 | | Sydney Airport Finance Co. Pty, Ltd.(c) | 3.63% | 04/28/2026 | | | 506,137 | |
| | 320,000 | | Westpac Banking Corp. | 2.60% | 11/23/2020 | | | 324,259 | |
| | 175,000 | | Westpac Banking Corp. | 2.00% | 08/19/2021 | | | 172,828 | |
| | 50,000 | | Westpac Banking Corp. | 2.50% | 06/28/2022 | | | 50,004 | |
| | | | | | | | | 3,972,737 | |
| Bermuda - 0.04% | | | | | | |
| | 200,000 | | Digicel Group, Ltd.(c) | 7.13% | 04/01/2022 | | | 182,250 | |
| | 400,000 | | Digicel Group, Ltd.(d) | 7.13% | 04/01/2022 | | | 364,336 | |
| | 400,000 | | Ooredoo International Finance, Ltd.(d) | 3.88% | 01/31/2028 | | | 403,807 | |
| | | | | | | | | 950,393 | |
| Brazil - 0.04% | | | | | | |
| | 200,000 | | Globo Comunicacao e Participacoes SA(c) | 5.13% | 03/31/2027 | | | 202,500 | |
| | 1,500,000 | | OAS Finance, Ltd.(c)(e)(f) | 8.88% | Perpetual Maturity | | | 118,125 | |
| | 450,000 | | Vale Overseas, Ltd. | 5.88% | 06/10/2021 | | | 496,688 | |
| | | | | | | | | 817,313 | |
| British Virgin Islands - 0.01% | | | | | | |
| | 300,000 | | CNOOC Finance 2011, Ltd.(d) | 4.25% | 01/26/2021 | | | 315,829 | |
| | | | | | | | | | |
| Canada - 0.11% | | | | | | |
| | 325,000 | | 1011778 BC ULC / New Red Finance, Inc.(c) | 4.25% | 05/15/2024 | | | 327,031 | |
| | 80,000 | | 1011778 BC ULC / New Red Finance, Inc.(c) | 5.00% | 10/15/2025 | | | 81,800 | |
| | 765,000 | | Canadian Natural Resources, Ltd. | 2.95% | 01/15/2023 | | | 761,199 | |
See Notes to Financial Statements.
| 30 | (888) 848-7569 | www.rivernorth.com |
| RiverNorth/DoubleLine Strategic Income Fund | Schedule of Investments |
September 30, 2017
| Principal Amount/Description | Rate | Maturity | | Value | |
| $ | 500,000 | | Fortis, Inc. | 2.10% | 10/04/2021 | | $ | 491,263 | |
| | 340,000 | | Kronos Acquisition Holdings, Inc.(c) | 9.00% | 08/15/2023 | | | 332,350 | |
| | 140,000 | | MEG Energy Corp.(c) | 7.00% | 03/31/2024 | | | 120,750 | |
| | 185,000 | | Seven Generations Energy, Ltd.(c) | 5.38% | 09/30/2025 | | | 186,619 | |
| | 210,000 | | Telesat Canada / Telesat LLC(c) | 8.88% | 11/15/2024 | | | 237,037 | |
| | | | | | | | | 2,538,049 | |
| Cayman Islands - 0.22% | | | | | | |
| | 200,000 | | CK Hutchison International 17, Ltd.(c) | 2.25% | 09/29/2020 | | | 199,573 | |
| | 200,000 | | CK Hutchison International 17, Ltd.(c) | 3.50% | 04/05/2027 | | | 202,564 | |
| | 200,000 | | CK Hutchison International 17, Ltd.(d) | 2.88% | 04/05/2022 | | | 201,232 | |
| | 514,150 | | Guanay Finance, Ltd.(d) | 6.00% | 12/15/2020 | | | 529,574 | |
| | 200,000 | | Hutchison Whampoa International 12 II, Ltd.(d) | 3.25% | 11/08/2022 | | | 204,975 | |
| | 600,000 | | Industrial Senior Trust(c) | 5.50% | 11/01/2022 | | | 612,000 | |
| | 1,151,613 | | Interoceanica IV Finance, Ltd.(d)(g) | 0.00% | 11/30/2025 | | | 990,387 | |
| | 1,000,000 | | Lima Metro Line 2 Finance, Ltd.(c) | 5.88% | 07/05/2034 | | | 1,105,000 | |
| | 250,000 | | Madison Park Funding XIV, Ltd.(c)(h) | 3M US L + 4.75% | 07/20/2026 | | | 249,478 | |
| | 20,000 | | Noble Holding International, Ltd. | 7.75% | 01/15/2024 | | | 17,850 | |
| | 400,000 | | SPARC EM SPC Panama Metro Line 2 SP(c)(g) | 0.00% | 12/05/2022 | | | 365,600 | |
| | 200,000 | | SPARC EM SPC Panama Metro Line 2 SP(d)(g) | 0.00% | 12/05/2022 | | | 182,800 | |
| | | | | | | | | 4,861,033 | |
| Chile - 0.17% | | | | | | |
| | 200,000 | | Banco de Credito e Inversiones(d) | 4.00% | 02/11/2023 | | | 212,655 | |
| | 300,000 | | Banco del Estado de Chile(d) | 4.13% | 10/07/2020 | | | 316,762 | |
| | 150,000 | | Banco del Estado de Chile(d) | 3.88% | 02/08/2022 | | | 159,003 | |
| | 100,000 | | Celulosa Arauco y Constitucion SA | 5.00% | 01/21/2021 | | | 106,773 | |
| | 300,000 | | Colbun SA(d) | 6.00% | 01/21/2020 | | | 326,014 | |
| | 500,000 | | Embotelladora Andina SA(d) | 5.00% | 10/01/2023 | | | 552,287 | |
| | 900,000 | | Empresa de Transporte de Pasajeros Metro SA(c) | 5.00% | 01/25/2047 | | | 992,016 | |
| | 300,000 | | Engie Energia Chile SA(d) | 5.63% | 01/15/2021 | | | 328,697 | |
| | 800,000 | | Itau CorpBanca(d) | 3.88% | 09/22/2019 | | | 827,012 | |
| | | | | | | | | 3,821,219 | |
| China - 0.07% | | | | | | |
| | 800,000 | | CNPC HK Overseas Capital, Ltd.(d) | 4.50% | 04/28/2021 | | | 851,394 | |
| | 800,000 | | Sinopec Group Overseas Development 2016, Ltd.(d) | 2.75% | 09/29/2026 | | | 763,593 | |
| | | | | | | | | 1,614,987 | |
| Costa Rica - 0.01% | | | | | | |
| | 200,000 | | Banco de Costa Rica(d) | 5.25% | 08/12/2018 | | | 203,620 | |
| Curacao - 0.01% | | | | | | |
| | 167,000 | | Teva Pharmaceutical Finance Co. BV | 2.95% | 12/18/2022 | | | 162,354 | |
See Notes to Financial Statements.
| Annual Report | September 30, 2017 | 31 |
| RiverNorth/DoubleLine Strategic Income Fund | Schedule of Investments |
September 30, 2017
| Principal Amount/Description | Rate | Maturity | | Value | |
| Dominican Republic - 0.01% | |
| $ | 300,000 | | Banco de Reservas de la Republica Dominicana(c) | 7.00% | 02/01/2023 | | $ | 316,500 | |
| | | | | | | | |
| France - 0.03% | |
| | 631,000 | | Orange SA | 2.75% | 02/06/2019 | | | 638,719 | |
| | | | | | | | |
| Great Britain - 0.13% | |
| | 155,000 | | AstraZeneca PLC | 2.38% | 11/16/2020 | | | 155,893 | |
| | 255,000 | | AstraZeneca PLC | 2.38% | 06/12/2022 | | | 253,034 | |
| | 1,188,000 | | British Telecommunications PLC | 5.95% | 01/15/2018 | | | 1,202,505 | |
| | 330,000 | | Delphi Jersey Holdings PLC(c) | 5.00% | 10/01/2025 | | | 336,600 | |
| | 200,000 | | MARB BondCo PLC(c) | 7.00% | 03/15/2024 | | | 197,500 | |
| | 765,000 | | Royal Bank of Scotland Group PLC(h) | 3M US L + 1.48% | 05/15/2023 | | | 770,492 | |
| | | | | | | 2,916,024 | |
| Guatemala - 0.01% | |
| | 200,000 | | Energuate Trust(c) | 5.88% | 05/03/2027 | | | 207,750 | |
| | | | | | | | |
| India - 0.06% | |
| | 300,000 | | Bharti Airtel, Ltd.(d) | 4.38% | 06/10/2025 | | | 304,282 | |
| | 200,000 | | Export-Import Bank of India | 3.13% | 07/20/2021 | | | 202,577 | |
| | 300,000 | | Export-Import Bank of India | 4.00% | 01/14/2023 | | | 314,715 | |
| | 200,000 | | Indian Oil Corp., Ltd. | 5.63% | 08/02/2021 | | | 220,250 | |
| | 200,000 | | Indian Oil Corp., Ltd. | 5.75% | 08/01/2023 | | | 226,208 | |
| | | | | | | 1,268,032 | |
| Ireland - 0.02% | |
| | 415,000 | | Shire Acquisitions Investments Ireland DAC | 2.88% | 09/23/2023 | | | 413,362 | |
| Isle Of Man - 0.03% | |
| | 600,000 | | Gohl Capital, Ltd. | 4.25% | 01/24/2027 | | | 619,603 | |
| Israel - 0.04% | |
| | 900,000 | | Israel Electric Corp., Ltd.(c) | 5.00% | 11/12/2024 | | | 977,400 | |
| Japan - 0.05% | |
| | 355,000 | | Mizuho Financial Group, Inc.(h) | 3M US L + 0.88% | 09/11/2022 | | | 356,242 | |
| | 350,000 | | Sumitomo Mitsui Financial Group, Inc. | 2.93% | 03/09/2021 | | | 355,839 | |
| | 310,000 | | Sumitomo Mitsui Financial Group, Inc. | 2.06% | 07/14/2021 | | | 304,934 | |
| | | | | | | 1,017,015 | |
| Luxembourg - 0.04% | |
| | 270,000 | | Actavis Funding SCS | 2.35% | 03/12/2018 | | | 270,809 | |
| | 80,000 | | Camelot Finance SA(c) | 7.88% | 10/15/2024 | | | 86,400 | |
| | 220,000 | | Dana Financing Luxembourg Sarl(c) | 5.75% | 04/15/2025 | | | 232,650 | |
| | 245,000 | | Intelsat Jackson Holdings SA | 7.25% | 10/15/2020 | | | 237,037 | |
| | | | | | | 826,896 | |
| Malaysia - 0.07% | |
| | 600,000 | | Axiata SPV2 Bhd | 3.47% | 11/19/2020 | | | 615,352 | |
See Notes to Financial Statements.
| 32 | (888) 848-7569 | www.rivernorth.com |
| RiverNorth/DoubleLine Strategic Income Fund | Schedule of Investments |
September 30, 2017
| Principal Amount/Description | Rate | Maturity | | Value | |
| $ | 200,000 | | Malayan Banking Bhd | 3.91 | 10/29/2026 | | $ | 205,893 | |
| | 300,000 | | Petronas Capital, Ltd.(d) | 3.50% | 03/18/2025 | | | 309,623 | |
| | 500,000 | | Petronas Global Sukuk, Ltd.(d) | 2.71% | 03/18/2020 | | | 504,534 | |
| | | | | | | 1,635,402 | |
| Mexico - 0.08% | |
| | 100,000 | | America Movil SAB de CV | 5.00% | 03/30/2020 | | | 107,073 | |
| | 200,000 | | Grupo Idesa SA de CV(c) | 7.88% | 12/18/2020 | | | 200,000 | |
| | 200,000 | | Grupo Idesa SA de CV(d) | 7.88% | 12/18/2020 | | | 200,000 | |
| | 950,000 | | Mexico City Airport Trust(c) | 4.25% | 10/31/2026 | | | 978,500 | |
| | 310,000 | | Petroleos Mexicanos | 6.75% | 09/21/2047 | | | 330,584 | |
| | | | | | | 1,816,157 | |
| Netherlands - 0.11% | |
| | 400,000 | | AES Andres BV / Dominican Power Partners / Empresa Generadora de Electricidad It(c) | 7.95% | 05/11/2026 | | | 434,800 | |
| | 300,000 | | CIMPOR Financial Operations BV(c) | 5.75% | 07/17/2024 | | | 283,500 | |
| | 200,000 | | Petrobras Global Finance BV | 7.38% | 01/17/2027 | | | 220,600 | |
| | 600,000 | | Petrobras Global Finance BV | 7.25% | 03/17/2044 | | | 627,000 | |
| | 505,000 | | Shell International Finance BV | 1.38% | 05/10/2019 | | | 503,263 | |
| | 385,000 | | Teva Pharmaceutical Finance Netherlands III BV | 2.80% | 07/21/2023 | | | 368,528 | |
| | | | | | | 2,437,691 | |
| Panama - 0.12% | |
| | 398,154 | | Aeropuerto Internacional de Tocumen SA | 5.75% | 10/09/2023 | | | 438,467 | |
| | 200,000 | | Autoridad del Canal de Panama(d) | 4.95% | 07/29/2035 | | | 222,750 | |
| | 500,000 | | Banco de Credito del Peru/Panama(d) | 2.25% | 10/25/2019 | | | 501,750 | |
| | 100,000 | | Banco de Credito del Peru/Panama(d) | 5.38% | 09/16/2020 | | | 109,250 | |
| | 500,000 | | Banco Internacional del Peru SAA/Panama(d) | 5.75% | 10/07/2020 | | | 550,300 | |
| | 150,000 | | Banco Latinoamericano de Comercio Exterior SA(d) | 3.25% | 05/07/2020 | | | 153,750 | |
| | 600,000 | | Global Bank Corp.(d) | 5.13% | 10/30/2019 | | | 628,200 | |
| | | | | | | 2,604,467 | |
| Peru - 0.08% | |
| | 100,000 | | BBVA Banco Continental SA(d) | 5.00% | 08/26/2022 | | | 109,250 | |
| | 80,000 | | Camposol SA(c) | 10.50% | 07/15/2021 | | | 87,200 | |
| | 200,000 | | Fondo MIVIVIENDA SA(c) | 3.50% | 01/31/2023 | | | 205,300 | |
| | 350,000 | | Fondo MIVIVIENDA SA(d) | 3.50% | 01/31/2023 | | | 359,275 | |
| | 200,000 | | Pesquera Exalmar SAA(d) | 7.38% | 01/31/2020 | | | 196,000 | |
| | 800,000 | | Transportadora de Gas del Peru SA(d) | 4.25% | 04/30/2028 | | | 832,000 | |
| | | | | | | 1,789,025 | |
| Philippines - 0.01% | |
| | 150,000 | | BDO Unibank, Inc. | 5.63% | 10/24/2021 | | | 149,619 | |
See Notes to Financial Statements.
| Annual Report | September 30, 2017 | 33 |
| RiverNorth/DoubleLine Strategic Income Fund | Schedule of Investments |
September 30, 2017
| Principal Amount/Description | Rate | Maturity | | Value | |
| Singapore - 0.19% | |
| $ | 600,000 | | BPRL International Singapore Pte. Ltd. | 4.38% | 01/18/2027 | | $ | 626,167 | |
| | 700,000 | | DBS Group Holdings, Ltd.(c)(h) | 3M US L + 0.62% | 07/25/2022 | | | 702,667 | |
| | 200,000 | | ONGC Videsh Vankorneft Pte, Ltd. | 2.88% | 01/27/2022 | | | 198,873 | |
| | 600,000 | | ONGC Videsh Vankorneft Pte, Ltd. | 3.75% | 07/27/2026 | | | 599,435 | |
| | 282,000 | | Oversea-Chinese Banking Corp. Ltd.(d) | 4.00 | 10/15/2024 | | | 289,644 | |
| | 200,000 | | SingTel Group Treasury Pte, Ltd. | 4.50% | 09/08/2021 | | | 215,079 | |
| | 750,000 | | Temasek Financial I, Ltd.(d) | 2.38% | 01/23/2023 | | | 751,055 | |
| | 400,000 | | United Overseas Bank Ltd. | 3.75 | 09/19/2024 | | | 409,506 | |
| | 400,000 | | United Overseas Bank, Ltd. | 3.50 | 09/16/2026 | | | 407,440 | |
| | | | | | | 4,199,866 | |
| South Korea - 0.02% | |
| | 550,000 | | Korea Expressway Corp.(c)(h) | 3M US L + 0.70% | 04/20/2020 | | | 549,601 | |
| | | | | | | | |
| Switzerland - 0.02% | |
| | 530,000 | | Credit Suisse Group AG(c)(h) | 3M US L + 1.20% | 12/14/2023 | | | 534,338 | |
| | | | | | | | |
| United Arab Emirates - 0.01% | |
| | 230,000 | | DAE Funding LLC(c) | 5.00% | 08/01/2024 | | | 236,325 | |
| | | | | | | | | | |
| TOTAL FOREIGN CORPORATE BONDS (Cost $45,320,421) | | | | | 44,571,601 | |
| | | | | | | | |
| U.S. CORPORATE BONDS - 2.81% | |
| Advertising - 0.03% | |
| | 635,000 | | Omnicom Group, Inc. | 3.60% | 04/15/2026 | | | 641,038 | |
| | | | | | | | | | |
| Aerospace/Defense - 0.05% | |
| | 365,000 | | Lockheed Martin Corp. | 4.70% | 05/15/2046 | | | 409,683 | |
| | 336,000 | | The Boeing Co. | 6.88% | 03/15/2039 | | | 487,879 | |
| | 175,000 | | Triumph Group, Inc.(c) | 7.75% | 08/15/2025 | | | 184,625 | |
| | | | | | | | | 1,082,187 | |
| Agriculture - 0.02% | |
| | 95,000 | | BAT Capital Corp.(c)(h) | 3M US L + 0.88% | 08/15/2022 | | | 95,375 | |
| | 390,000 | | Reynolds American, Inc. | 4.00% | 06/12/2022 | | | 412,323 | |
| | | | | | | | | 507,698 | |
| Airlines - 0.01% | |
| | 215,000 | | Delta Air Lines, Inc. | 3.63% | 03/15/2022 | | | 221,139 | |
| | 80,000 | | United Continental Holdings, Inc. | 4.25% | 10/01/2022 | | | 80,700 | |
| | | | | | | | | 301,839 | |
| Auto Manufacturers - 0.06% | |
| | 305,000 | | Ford Motor Co. | 7.45% | 07/16/2031 | | | 395,726 | |
| | 185,000 | | General Motors Co.(h) | 3M US L + 0.80% | 08/07/2020 | | | 185,243 | |
See Notes to Financial Statements.
| 34 | (888) 848-7569 | www.rivernorth.com |
| RiverNorth/DoubleLine Strategic Income Fund | Schedule of Investments |
September 30, 2017
| Principal Amount/Description | Rate | Maturity | | Value | |
| $ | 755,000 | | General Motors Financial Co., Inc. | 3.95% | 04/13/2024 | | $ | 774,062 | |
| | | | | | | | | 1,355,031 | |
| Banks - 0.21% | |
| | 285,000 | | Bank of America Corp. | 2.50% | 10/21/2022 | | | 282,559 | |
| | 330,000 | | Bank of America Corp.(h) | 3M US L + 1.02 | 04/24/2023 | | | 331,688 | |
| | 755,000 | | Citigroup, Inc.(h) | 3M US L + 1.10% | 05/17/2024 | | | 757,266 | |
| | 410,000 | | JPMorgan Chase & Co. | 2.97% | 01/15/2023 | | | 416,532 | |
| | 375,000 | | JPMorgan Chase & Co. | 4.25% | 10/01/2027 | | | 397,045 | |
| | 505,000 | | Morgan Stanley | 2.75% | 05/19/2022 | | | 507,232 | |
| | 520,000 | | Morgan Stanley(h) | 3M US L + 1.34% | 07/22/2028 | | | 521,339 | |
| | 110,000 | | MUFG Americas Holdings Corp. | 2.25% | 02/10/2020 | | | 110,223 | |
| | 35,000 | | The Goldman Sachs Group, Inc. | 3.00% | 04/26/2022 | | | 35,404 | |
| | 375,000 | | The Goldman Sachs Group, Inc.(h) | 3M US L + 1.053% | 06/05/2023 | | | 374,998 | |
| | 495,000 | | Wells Fargo & Co. | 3.07% | 01/24/2023 | | | 503,647 | |
| | 515,000 | | Wells Fargo & Co.(h) | 3M US L + 1.31% | 05/22/2028 | | | 522,056 | |
| | | | | | | | | 4,759,989 | |
| Beverages - 0.02% | |
| | 300,000 | | Anheuser-Busch InBev Finance, Inc. | 4.90% | 02/01/2046 | | | 342,790 | |
| | | | | | | | | | |
| Chemicals - 0.03% | |
| | 315,000 | | Ashland, Inc. | 4.75% | 08/15/2022 | | | 333,506 | |
| | 340,000 | | Hexion, Inc.(c) | 10.38% | 02/01/2022 | | | 328,100 | |
| | | | | | | | | 661,606 | |
| Coal - 0.01% | |
| | 240,000 | | Peabody Securities Finance Corp.(c) | 6.00% | 03/31/2022 | | | 248,700 | |
| Commercial Services - 0.01% | |
| | 295,000 | | Prime Security Services Borrower LLC / Prime Finance, Inc.(c) | 9.25% | 05/15/2023 | | | 326,288 | |
| Computers - 0.01% | |
| | 175,000 | | Riverbed Technology, Inc.(c) | 0.00% | 03/01/2023 | | | 167,344 | |
| Cosmetics/Personal Care - 0.02% | |
| | 425,000 | | Unilever Capital Corp. | 2.90% | 05/05/2027 | | | 420,162 | |
| Distribution/Wholesale - 0.02% | |
| | 165,000 | | Avantor, Inc.(c) | 6.00% | 10/01/2024 | | | 169,125 | |
| | 165,000 | | Avantor, Inc.(c) | 9.00% | 10/01/2025 | | | 168,919 | |
| | | | | | | | | 338,044 | |
| Diversified Financial Services - 0.21% | |
| | 568,000 | | Air Lease Corp. | 3.75% | 02/01/2022 | | | 592,717 | |
| | 645,000 | | Ally Financial, Inc. | 4.13% | 03/30/2020 | | | 665,962 | |
| | 40,000 | | Ally Financial, Inc. | 4.25% | 04/15/2021 | | | 41,500 | |
| | 415,000 | | American Express Co. | 2.50% | 08/01/2022 | | | 414,867 | |
| | 450,000 | | American Express Credit Corp. | 2.70% | 03/03/2022 | | | 455,506 | |
See Notes to Financial Statements.
| Annual Report | September 30, 2017 | 35 |
| RiverNorth/DoubleLine Strategic Income Fund | Schedule of Investments |
September 30, 2017
| Principal Amount/Description | Rate | Maturity | | Value | |
| $ | 340,000 | | ASP AMC Merger Sub, Inc.(c) | 8.00% | 05/15/2025 | | $ | 328,950 | |
| | 640,000 | | Discover Financial Services | 4.10% | 02/09/2027 | | | 651,266 | |
| | 485,000 | | National Rural Utilities Cooperative Finance Corp. | 2.00% | 01/27/2020 | | | 485,894 | |
| | 235,000 | | NFP Corp.(c) | 6.88% | 07/15/2025 | | | 239,113 | |
| | 499,000 | | Synchrony Financial | 3.00% | 08/15/2019 | | | 507,321 | |
| | 225,000 | | Tempo Acquisition LLC / Tempo Acquisition Finance Corp.(c) | 6.75% | 06/01/2025 | | | 227,813 | |
| | | | | | | | | 4,610,909 | |
| Electric - 0.26% | |
| | 787,000 | | Berkshire Hathaway Energy Co. | 6.50% | 09/15/2037 | | | 1,054,428 | |
| | 230,000 | | Duke Energy Corp. | 3.75% | 09/01/2046 | | | 222,381 | |
| | 215,000 | | Duke Energy Corp. | 3.95% | 08/15/2047 | | | 213,920 | |
| | 450,000 | | Duke Energy Progress LLC | 4.15% | 12/01/2044 | | | 480,870 | |
| | 315,000 | | Exelon Corp. | 3.40% | 04/15/2026 | | | 317,195 | |
| | 1,100,000 | | ITC Holdings Corp. | 3.25% | 06/30/2026 | | | 1,089,187 | |
| | 250,000 | | NextEra Energy Capital Holdings, Inc. | 3.55% | 05/01/2027 | | | 256,909 | |
| | 330,000 | | NextEra Energy Operating Partners LP(c) | 4.50% | 09/15/2027 | | | 337,013 | |
| | 115,000 | | NRG Energy, Inc. | 7.25% | 05/15/2026 | | | 123,913 | |
| | 655,000 | | The Southern Co. | 2.45% | 09/01/2018 | | | 659,704 | |
| | 1,000,000 | | Virginia Electric & Power Co. | 3.50% | 03/15/2027 | | | 1,038,627 | |
| | | | | | | | | 5,794,147 | |
| Electronics - 0.01% | |
| | 265,000 | | Arrow Electronics, Inc. | 3.88% | 01/12/2028 | | | 264,871 | |
| Engineering & Construction - 0.02% | |
| | 400,000 | | SBA Tower Trust(c) | 3.17% | 04/15/2022 | | | 400,039 | |
| Entertainment - 0.06% | |
| | 335,000 | | Eldorado Resorts, Inc. | 6.00% | 04/01/2025 | | | 353,492 | |
| | 220,000 | | GLP Capital LP / GLP Financing II, Inc. | 5.38% | 04/15/2026 | | | 240,625 | |
| | 400,000 | | Pinnacle Entertainment, Inc. | 5.63% | 05/01/2024 | | | 411,000 | |
| | 230,000 | | Six Flags Entertainment Corp.(c) | 4.88% | 07/31/2024 | | | 234,600 | |
| | | | | | | | | 1,239,717 | |
| Environmental Control - 0.01% | |
| | 275,000 | | Waste Management, Inc. | 4.10% | 03/01/2045 | | | 291,577 | |
| Financial - 0.01% | |
| | 125,000 | | SBA Communications Corp.(c) | 4.00% | 10/01/2022 | | | 125,625 | |
| Food - 0.13% | |
| | 270,000 | | JBS USA LLC / JBS USA Finance, Inc.(c) | 7.25% | 06/01/2021 | | | 276,750 | |
| | 50,000 | | JBS USA LUX SA / JBS USA Finance, Inc.(c) | 7.25% | 06/01/2021 | | | 51,250 | |
| | 500,000 | | Kraft Heinz Foods Co. | 2.00% | 07/02/2018 | | | 501,108 | |
| | 225,000 | | Pilgrim's Pride Corp.(c) | 5.75% | 03/15/2025 | | | 232,875 | |
| | 320,000 | | Post Holdings, Inc.(c) | 5.50% | 03/01/2025 | | | 332,800 | |
See Notes to Financial Statements.
| 36 | (888) 848-7569 | www.rivernorth.com |
| RiverNorth/DoubleLine Strategic Income Fund | Schedule of Investments |
September 30, 2017
| Principal Amount/Description | Rate | Maturity | | Value | |
| $ | 490,000 | | Smithfield Foods, Inc.(c) | 4.25% | 02/01/2027 | | $ | 507,305 | |
| | 515,000 | | Sysco Corp. | 3.25% | 07/15/2027 | | | 514,237 | |
| | 515,000 | | The Kroger Co. | 3.40% | 04/15/2022 | | | 529,747 | |
| | | | | | | | | 2,946,072 | |
| Forest Products & Paper - 0.05% | |
| | 885,000 | | Georgia-Pacific LLC(c) | 3.60% | 03/01/2025 | | | 915,087 | |
| | 290,000 | | International Paper Co. | 3.00% | 02/15/2027 | | | 282,166 | |
| | | | | | | | | 1,197,253 | |
| Gas - 0.01% | |
| | 235,000 | | NGL Energy Partners LP / NGL Energy Finance Corp. | 7.50% | 11/01/2023 | | | 235,000 | |
| Healthcare-Products - 0.05% | |
| | 760,000 | | Becton Dickinson & Co. | 2.89% | 06/06/2022 | | | 762,451 | |
| | 225,000 | | Universal Hospital Services, Inc. | 7.63% | 08/15/2020 | | | 228,938 | |
| | 180,000 | | Zimmer Biomet Holdings, Inc. | 2.70% | 04/01/2020 | | | 181,873 | |
| | | | | | | | | 1,173,262 | |
| Healthcare-Services - 0.08% | |
| | 658,000 | | Anthem, Inc. | 2.30% | 07/15/2018 | | | 660,966 | |
| | 275,000 | | Centene Corp. | 4.75% | 01/15/2025 | | | 286,000 | |
| | 230,000 | | CHS/Community Health Systems, Inc. | 6.25% | 03/31/2023 | | | 227,987 | |
| | 305,000 | | MPH Acquisition Holdings LLC(c) | 7.13% | 06/01/2024 | | | 328,638 | |
| | 220,000 | | Tenet Healthcare Corp. | 8.13% | 04/01/2022 | | | 224,400 | |
| | | | | | | | | 1,727,991 | |
| Holding Companies-Diversified - 0.01% | |
| | 140,000 | | MUFG Americas Holdings Corp. | 1.63% | 02/09/2018 | | | 140,004 | |
| | 210,000 | | Petsmart, Inc.(c) | 7.13% | 03/15/2023 | | | 164,388 | |
| | | | | | | | | 304,392 | |
Industrial - 0.00%(i) | |
| | 15,000 | | Multi-Color Corp.(c) | 4.88% | 11/01/2025 | | | 15,225 | |
| Insurance - 0.18% | |
| | 300,000 | | Alliant Holdings Intermediate LLC / Alliant Holdings Co- Issuer(c) | 8.25% | 08/01/2023 | | | 317,937 | |
| | 325,000 | | AssuredPartners, Inc.(c) | 7.00% | 08/15/2025 | | | 333,531 | |
| | 450,000 | | Athene Global Funding(c) | 3.00% | 07/01/2022 | | | 448,346 | |
| | 515,000 | | Brighthouse Financial, Inc.(c) | 3.70% | 06/22/2027 | | | 506,469 | |
| | 855,000 | | Liberty Mutual Group, Inc.(c) | 6.50% | 05/01/2042 | | | 1,117,931 | |
| | 185,000 | | New York Life Global Funding(c) | 2.30% | 06/10/2022 | | | 184,369 | |
| | 415,000 | | New York Life Global Funding(c) | 2.90% | 01/17/2024 | | | 420,405 | |
| | 660,000 | | Nuveen Finance LLC(c) | 2.95% | 11/01/2019 | | | 671,233 | |
| | | | | | | | | 4,000,221 | |
| Internet - 0.07% | |
| | 515,000 | | Amazon.com, Inc.(c) | 4.05% | 08/22/2047 | | | 522,965 | |
| | 510,000 | | eBay, Inc. | 2.75% | 01/30/2023 | | | 508,851 | |
| | 530,000 | | Expedia, Inc.(c) | 3.80% | 02/15/2028 | | | 526,196 | |
| | | | | | | | | 1,558,012 | |
See Notes to Financial Statements.
| Annual Report | September 30, 2017 | 37 |
| RiverNorth/DoubleLine Strategic Income Fund | Schedule of Investments |
September 30, 2017
| Principal Amount/Description | Rate | Maturity | | Value | |
| Investment Companies - 0.11% | |
| $ | 2,500,000 | | FS Investment Corp. | 4.25% | 01/15/2020 | | $ | 2,563,441 | |
| Iron/Steel - 0.01% | |
| | 210,000 | | Signode Industrial Group Lux SA/Signode Industrial Group US, Inc.(c) | 6.38% | 05/01/2022 | | | 218,925 | |
| Leisure Time - 0.02% | |
| | 115,000 | | Constellation Merger Sub, Inc.(c) | 8.50% | 09/15/2025 | | | 113,275 | |
| | 320,000 | | Viking Cruises, Ltd.(c) | 5.88% | 09/15/2027 | | | 321,904 | |
| | | | | | | | | 435,179 | |
| Lodging - 0.01% | |
| | 230,000 | | Hilton Domestic Operating Co., Inc. | 4.25% | 09/01/2024 | | | 235,175 | |
| Machinery-Construction & Mining - 0.01% | |
| | 220,000 | | Blueline Rental Finance Corp. / Blueline Rental LLC(c) | 9.25% | 03/15/2024 | | | 237,325 | |
| Media - 0.07% | |
| | 200,000 | | CCO Holdings LLC / CCO Holdings Capital Corp.(c) | 5.00% | 02/01/2028 | | | 201,000 | |
| | 280,000 | | Cengage Learning, Inc.(c) | 9.50% | 06/15/2024 | | | 247,100 | |
| | 605,000 | | Charter Communications Operating LLC / Charter Communications Operating Capital | 4.91% | 07/23/2025 | | | 647,559 | |
| | 480,000 | | Comcast Corp. | 4.40% | 08/15/2035 | | | 521,137 | |
| | | | | | | | | 1,616,796 | |
| Oil & Gas - 0.13% | |
| | 400,000 | | CNOOC Finance 2015 USA LLC | 3.50% | 05/05/2025 | | | 406,805 | |
| | 510,000 | | EQT Corp. | 3.90% | 10/01/2027 | | | 510,913 | |
| | 178,000 | | FTS International, Inc. | 6.25% | 05/01/2022 | | | 163,760 | |
| | 263,000 | | Phillips 66 | 5.88% | 05/01/2042 | | | 324,488 | |
| | 500,000 | | Reliance Holding USA, Inc.(d) | 5.40% | 02/14/2022 | | | 549,937 | |
| | 405,000 | | Sanchez Energy Corp. | 6.13% | 01/15/2023 | | | 350,325 | |
| | 145,000 | | Schlumberger Holdings Corp.(c) | 2.35% | 12/21/2018 | | | 145,864 | |
| | 245,000 | | SM Energy Co. | 5.00% | 01/15/2024 | | | 232,137 | |
| | 210,000 | | Valero Energy Corp. | 6.63% | 06/15/2037 | | | 265,641 | |
| | | | | | | | | 2,949,870 | |
| Packaging & Containers - 0.01% | |
| | 225,000 | | Flex Acquisition Co., Inc.(c) | 6.88% | 01/15/2025 | | | 234,000 | |
| Pharmaceuticals - 0.06% | |
| | 405,000 | | AbbVie, Inc. | 4.70% | 05/14/2045 | | | 442,994 | |
| | 495,000 | | Cardinal Health, Inc. | 4.37% | 06/15/2047 | | | 508,642 | |
| | 390,000 | | Express Scripts Holding Co. | 3.40% | 03/01/2027 | | | 385,079 | |
| | | | | | | | | 1,336,715 | |
| Pipelines - 0.09% | |
| | 330,000 | | Cheniere Energy Partners LP(c) | 5.25% | 10/01/2025 | | | 338,250 | |
| | 505,000 | | Enable Midstream Partners LP | 4.40% | 03/15/2027 | | | 514,401 | |
See Notes to Financial Statements.
| 38 | (888) 848-7569 | www.rivernorth.com |
| RiverNorth/DoubleLine Strategic Income Fund | Schedule of Investments |
September 30, 2017
| Principal Amount/Description | Rate | Maturity | | Value | |
| $ | 480,000 | | Energy Transfer LP | 4.75% | 01/15/2026 | | $ | 505,910 | |
| | 340,000 | | Kinder Morgan Energy Partners LP | 6.95% | 01/15/2038 | | | 413,431 | |
| | 250,000 | | Williams Partners LP/ ACMP Finance Corp. | 3.75% | 06/15/2027 | | | 250,034 | |
| | | | | | | | | 2,022,026 | |
| Private Equity - 0.01% | |
| | 225,000 | | Icahn Enterprises LP / Icahn Enterprises Finance Corp. | 6.25% | 02/01/2022 | | | 235,125 | |
| | | | | | | | | | |
| REITS - 0.19% | |
| | 800,000 | | American Tower Corp. | 3.38% | 10/15/2026 | | | 791,977 | |
| | 515,000 | | American Tower Corp. | 3.55% | 07/15/2027 | | | 512,519 | |
| | 625,000 | | Boston Properties LP | 4.13% | 05/15/2021 | | | 661,268 | |
| | 800,000 | | Crown Castle International Corp. | 3.70% | 06/15/2026 | | | 806,909 | |
| | 515,000 | | Crown Castle International Corp. | 3.65% | 09/01/2027 | | | 515,552 | |
| | 400,000 | | Digital Realty Trust LP | 3.70% | 08/15/2027 | | | 404,746 | |
| | 233,000 | | ESH Hospitality, Inc.(c) | 5.25% | 05/01/2025 | | | 241,446 | |
| | 340,000 | | MPT Operating Partnership LP / MPT Finance Corp. | 5.00% | 10/15/2027 | | | 349,350 | |
| | | | | | | | | 4,283,767 | |
| Retail - 0.05% | |
| | 200,000 | | Landry's, Inc.(c) | 6.75% | 10/15/2024 | | | 202,750 | |
| | 230,000 | | Lowe's Cos., Inc. | 3.10% | 05/03/2027 | | | 228,882 | |
| | 120,000 | | PetSmart, Inc.(c) | 5.88% | 06/01/2025 | | | 105,300 | |
| | 505,000 | | The Home Depot, Inc. | 3.00% | 04/01/2026 | | | 507,117 | |
| | | | | | | | | 1,044,049 | |
| Semiconductors - 0.04% | |
| | 250,000 | | Applied Materials, Inc. | 4.35% | 04/01/2047 | | | 268,039 | |
| | 290,000 | | Broadcom Corp. / Broadcom Cayman Finance, Ltd.(c) | 3.63% | 01/15/2024 | | | 298,236 | |
| | 255,000 | | Maxim Integrated Products, Inc. | 3.45% | 06/15/2027 | | | 256,941 | |
| | | | | | | | | 823,216 | |
| Software - 0.12% | |
| | 148,000 | | Fidelity National Information Services, Inc. | 3.63% | 10/15/2020 | | | 154,193 | |
| | 220,000 | | Genesys Telecommunications Laboratories, Inc./Greeneden Lux 3 Sarl/Greeneden US Ho(c) | 10.00% | 11/30/2024 | | | 249,150 | |
| | 230,000 | | Informatica LLC(c) | 7.13% | 07/15/2023 | | | 232,300 | |
| | 380,000 | | Microsoft Corp. | 4.45% | 11/03/2045 | | | 428,764 | |
| | 355,000 | | Oracle Corp. | 4.13% | 05/15/2045 | | | 373,955 | |
| | 330,000 | | S&P Global, Inc. | 4.40% | 02/15/2026 | | | 357,609 | |
| | 90,000 | | Solera LLC / Solera Finance, Inc.(c) | 10.50% | 03/01/2024 | | | 102,911 | |
| | 220,000 | | Sophia LP / Sophia Finance, Inc.(c) | 9.00% | 09/30/2023 | | | 229,075 | |
| | 620,000 | | VMware, Inc. | 2.95% | 08/21/2022 | | | 622,774 | |
| | | | | | | | | 2,750,731 | |
See Notes to Financial Statements.
| Annual Report | September 30, 2017 | 39 |
| RiverNorth/DoubleLine Strategic Income Fund | Schedule of Investments |
September 30, 2017
| Principal Amount/Description | Rate | Maturity | | Value | |
| Special Purpose Banks - 0.02% | |
| $ | 340,000 | | CRC Escrow Issuer LLC / CRC Finco Inc.(c) | 5.25% | 10/15/2025 | | $ | 342,125 | |
| | | | | | | | | | |
| Telecommunications - 0.09% | |
| | 495,000 | | AT&T, Inc. | 3.80% | 03/01/2024 | | | 509,708 | |
| | 80,000 | | CB Escrow Corp.(c) | 8.00% | 10/15/2025 | | | 80,800 | |
| | 225,000 | | Cincinnati Bell, Inc.(c) | 7.00% | 07/15/2024 | | | 220,500 | |
| | 220,000 | | Frontier Communications Corp. | 8.50% | 04/15/2020 | | | 213,950 | |
| | 210,000 | | GTT Communications, Inc.(c) | 7.88% | 12/31/2024 | | | 223,650 | |
| | 660,000 | | Verizon Communications, Inc. | 4.40% | 11/01/2034 | | | 665,688 | |
| | | | | | | | | 1,914,296 | |
| Toys/Games/Hobbies - 0.01% | |
| | 150,000 | | Hasbro, Inc. | 3.50% | 09/15/2027 | | | 148,505 | |
| Transportation - 0.09% | |
| | 465,000 | | Burlington Northern Santa Fe LLC | 4.55% | 09/01/2044 | | | 516,660 | |
| | 420,000 | | CSX Corp. | 3.80% | 11/01/2046 | | | 405,378 | |
| | 550,000 | | FedEx Corp. | 4.75% | 11/15/2045 | | | 601,013 | |
| | 500,000 | | Union Pacific Corp. | 3.00% | 04/15/2027 | | | 503,398 | |
| | | | | | | | | 2,026,449 | |
| Trucking & Leasing - 0.01% | |
| | 245,000 | | Penske Truck Leasing Co. Lp / PTL Finance Corp.(c) | 4.20% | 04/01/2027 | | | 257,340 | |
| | | | | | | | | | |
TOTAL U.S. CORPORATE BONDS (Cost $61,387,766) | | | | | 62,712,084 | |
| | | | | | | | |
| FOREIGN GOVERNMENT BONDS AND NOTES, SUPRANATIONALS AND FOREIGN AGENCIES - 0.44% | |
| | 250,000 | | Argentine Republic Government International Bond | 6.88% | 01/26/2027 | | | 270,375 | |
| | 300,000 | | Brazilian Government International Bond | 5.63% | 01/07/2041 | | | 303,000 | |
| | 500,000 | | Chile Government International Bond | 3.13% | 03/27/2025 | | | 516,000 | |
| | 600,000 | | Chile Government International Bond | 3.13% | 01/21/2026 | | | 616,500 | |
| | 200,000 | | Chile Government International Bond | 3.86% | 06/21/2047 | | | 204,375 | |
| | 400,000 | | Costa Rica Government International Bond(d) | 10.00% | 08/01/2020 | | | 466,000 | |
| | 400,000 | | Dominican Republic International Bond(c) | 5.95% | 01/25/2027 | | | 431,000 | |
| | 400,000 | | Indonesia Government International Bond(d) | 4.88% | 05/05/2021 | | | 431,861 | |
| | 200,000 | | Israel Government International Bond | 4.00% | 06/30/2022 | | | 214,982 | |
| | 600,000 | | Israel Government International Bond | 2.88% | 03/16/2026 | | | 606,514 | |
| | 200,000 | | Malaysia Sovereign Sukuk Bhd International Bond(d) | 3.04% | 04/22/2025 | | | 201,480 | |
See Notes to Financial Statements.
| 40 | (888) 848-7569 | www.rivernorth.com |
| RiverNorth/DoubleLine Strategic Income Fund | Schedule of Investments |
September 30, 2017
| Principal Amount/Description | Rate | Maturity | | Value | |
| $ | 250,000 | | Malaysia Sukuk Global Bhd International Bond(d) | 3.18% | 04/27/2026 | | $ | 252,883 | |
| | 100,000 | | Mexico Government International Bond | 4.00% | 10/02/2023 | | | 105,970 | |
| | 400,000 | | Mexico Government International Bond | 4.13% | 01/21/2026 | | | 421,900 | |
| | 1,140,000 | | Mexico Government International Bond | 4.15% | 03/28/2027 | | | 1,199,622 | |
| | 100,000 | | Mexico Government International Bond | 4.75% | 03/08/2044 | | | 103,300 | |
| | 200,000 | | Panama Government International Bond | 4.00% | 09/22/2024 | | | 214,000 | |
| | 900,000 | | Panama Government International Bond | 3.88% | 03/17/2028 | | | 945,000 | |
| | 200,000 | | Panama Government International Bond | 4.50% | 05/15/2047 | | | 211,500 | |
| | 800,000 | | Perusahaan Penerbit SBSN Indonesia III International Bond(c) | 4.15% | 03/29/2027 | | | 827,000 | |
| | 700,000 | | Philippine Government International Bond | 4.20% | 01/21/2024 | | | 770,284 | |
| | 600,000 | | Philippine Government International Bond | 3.70% | 02/02/2042 | | | 599,636 | |
| | | | | | | | | | |
| TOTAL FOREIGN GOVERNMENT BONDS AND NOTES, SUPRANATIONALS AND FOREIGN AGENCIES (Cost $9,653,503) | | | | | 9,913,182 | |
| | | | | | | | |
| COLLATERALIZED LOAN OBLIGATIONS - 0.54% | |
| | | | Adams Mill CLO, Ltd. | | | | | | |
| | 500,000 | | Series 2014-1A(c)(h) | 3M US L + 3.50% | 07/15/2026 | | | 502,486 | |
| | 250,000 | | Series 2014-1A(c)(h) | 3M US L + 5.00% | 07/15/2026 | | | 242,212 | |
| | | | Apidos CLO XVIII | | | | | | |
| | 250,000 | | Series 2014-18A(c)(h) | 3M US L + 5.20% | 07/22/2026 | | | 251,902 | |
| | | | Avery Point II CLO, Ltd. | | | | | | |
| | 500,000 | | Series 2013-2A(c)(h) | 3M US L + 3.45% | 07/17/2025 | | | 500,092 | |
| | | | Babson CLO, Ltd. | | | | | | |
| | 500,000 | | Series 2015-2A(c)(h) | 3M US L + 3.80% | 07/20/2027 | | | 502,374 | |
| | 500,000 | | Series 2015-IA(c)(h) | 3M US L + 3.45% | 04/20/2027 | | | 502,030 | |
See Notes to Financial Statements.
| Annual Report | September 30, 2017 | 41 |
| RiverNorth/DoubleLine Strategic Income Fund | Schedule of Investments |
September 30, 2017
| Principal Amount/Description | Rate | Maturity | | Value | |
| | | | Barings CLO, Ltd. | | | | | | |
| $ | 500,000 | | Series 2017-1A(c)(h) | 3M US L + 3.60% | 07/18/2029 | | $ | 504,746 | |
| | | | Barings CLO, Ltd. 2016-III | | | | | | |
| | 500,000 | | Series 2016-3A(c)(h) | 3M US L + 3.95% | 01/15/2028 | | | 504,409 | |
| | | | Betony CLO, Ltd. | | | | | | |
| | 500,000 | | Series 2015-1A(c)(h) | 3M US L + 3.60% | 04/15/2027 | | | 501,097 | |
| | | | Birchwood Park CLO, Ltd. | | | | | | |
| | 250,000 | | Series 2014-1A(c)(h) | 3M US L + 6.40% | 07/15/2026 | | | 250,548 | |
| | | | BlueMountain CLO, Ltd. | | | | | | |
| | 500,000 | | Series 2015-3A(c)(h) | 3M US L + 3.10% | 10/20/2027 | | | 500,617 | |
| | 500,000 | | Series 2015-3A(c)(h) | 3M US L + 3.55% | 10/20/2027 | | | 508,033 | |
| | | | Brookside Mill CLO, Ltd. | | | | | | |
| | 250,000 | | Series 2013-1A(c)(h) | 3M US L + 2.70% | 04/17/2025 | | | 250,739 | |
| | 500,000 | | Series 2013-1A(c)(h) | 3M US L + 3.05% | 04/17/2025 | | | 493,657 | |
| | 500,000 | | Series 2013-1A(c)(h) | 3M US L + 4.40% | 04/17/2025 | | | 471,250 | |
| | | | Canyon Capital CLO, Ltd. | | | | | | |
| | 500,000 | | Series 2017-1A(c)(h) | 3M US L + 3.60% | 07/15/2030 | | | 499,871 | |
| | | | Catamaran CLO, Ltd. | | | | | | |
| | 500,000 | | Series 2015-1A(c)(h) | 3M US L + 3.10% | 04/22/2027 | | | 500,638 | |
| | | | Dorchester Park CLO, Ltd. | | | | | | |
| | 250,000 | | Series 2015-1A(c)(h) | 3M US L + 3.20% | 01/20/2027 | | | 252,225 | |
| | 250,000 | | Series 2015-1A(c)(h) | 3M US L + 3.55% | 01/20/2027 | | | 249,902 | |
| | | | Flatiron CLO, Ltd. | | | | | | |
| | 250,000 | | Series 2014-1A(c)(h) | 3M US L + 3.30% | 07/17/2026 | | | 248,609 | |
| | | | Galaxy XV CLO, Ltd. | | | | | | |
| | 500,000 | | Series 2013-15A(c)(h) | 3M US L + 3.40% | 04/15/2025 | | | 503,737 | |
| | | | Halcyon Loan Advisors Funding, Ltd. | | | | | | |
| | 250,000 | | Series 2013-2A(c)(h) | 3M US L + 2.70% | 08/01/2025 | | | 252,219 | |
See Notes to Financial Statements.
| 42 | (888) 848-7569 | www.rivernorth.com |
| RiverNorth/DoubleLine Strategic Income Fund | Schedule of Investments |
September 30, 2017
| Principal Amount/Description | Rate | Maturity | | Value | |
| | | | LCM XIV LP | | | | | |
| $ | 500,000 | | Series 2013-14A(c)(h) | 3M US L + 3.50% | 07/15/2025 | | $ | 502,495 | |
| | | | Octagon Investment Partners XVI, Ltd. | | | | | | |
| | 500,000 | | Series 2013-1A(c)(h) | 3M US L + 3.35% | 07/17/2025 | | | 501,260 | |
| | 500,000 | | Series 2013-1A(c)(h) | 3M US L + 4.50% | 07/17/2025 | | | 496,043 | |
| | | | THL Credit Wind River 2017-1 CLO Ltd. | | | | | | |
| | 500,000 | | Series 2017-1A(c)(h) | 3M US L + 3.75% | 04/18/2029 | | | 500,608 | |
| | | | Venture XII CLO, Ltd. | | | | | | |
| | 1,000,000 | | Series 2017-12A(c)(h) | 3M US L + 3.70% | 02/28/2026 | | | 1,004,672 | |
| | | | | | | | | | |
| TOTAL COLLATERALIZED LOAN OBLIGATIONS (Cost $11,736,356) | | | | | 11,998,471 | |
| | | | | | | | |
| NON-AGENCY COLLATERALIZED MORTGAGE OBLIGATIONS - 23.05% | |
| | | | Adjustable Rate Mortgage Trust | | | | | | |
| | 962,278 | | Series 2005-1(h) | 3.65% | 05/25/2035 | | | 983,270 | |
| | 4,802,354 | | Series 2005-10(h) | 3.65% | 01/25/2036 | | | 4,294,297 | |
| | 619,745 | | Series 2005-7(h) | 3.61% | 10/25/2035 | | | 553,943 | |
| | | | ALM XII, Ltd. | | | | | | |
| | 500,000 | | Series 2017-12A(c)(h) | 3M US L + 3.20% | 04/16/2027 | | | 502,535 | |
| | | | Alternative Loan Trust | | | | | | |
| | 411,821 | | Series 2005-20CB | 5.50% | 07/25/2035 | | | 392,125 | |
| | 158,242 | | Series 2005-54CB | 5.50% | 11/25/2035 | | | 140,867 | |
| | 741,457 | | Series 2005-6CB | 5.50% | 04/25/2035 | | | 756,505 | |
| | 347,983 | | Series 2005-85CB(h) | 21.63% - 1M US L | 02/25/2036 | | | 445,232 | |
| | 1,647,769 | | Series 2005-85CB(h) | 1M US L + 1.10% | 02/25/2036 | | | 1,386,832 | |
| | 398,190 | | Series 2005-86CB | 5.50% | 02/25/2036 | | | 356,912 | |
| | 427,180 | | Series 2005-9CB(h) | 1M US L + 0.50% | 05/25/2035 | | | 371,763 | |
| | 758,671 | | Series 2005-9CB(h) | 5.05% - 1M US L | 05/25/2035 | | | 77,987 | |
| | 368,631 | | Series 2006-12CB(h) | 1M US L + 5.75% | 05/25/2036 | | | 302,294 | |
| | 1,731,513 | | Series 2006-15CB | 6.50% | 06/25/2036 | | | 1,399,238 | |
| | 222,174 | | Series 2006-30T1 | 6.25% | 11/25/2036 | | | 200,548 | |
| | 180,109 | | Series 2006-32CB | 5.50% | 11/25/2036 | | | 156,936 | |
| | 363,484 | | Series 2006-36T2(h) | 28.06% - 1M US L | 12/25/2036 | | | 451,366 | |
See Notes to Financial Statements.
| Annual Report | September 30, 2017 | 43 |
| RiverNorth/DoubleLine Strategic Income Fund | Schedule of Investments |
September 30, 2017
| Principal Amount/Description | Rate | Maturity | | Value | |
| $ | 16,248,656 | | Series 2006-J7 | 6.25% | 11/25/2036 | | $ | 13,384,574 | |
| | 1,402,672 | | Series 2007-19 | 6.00% | 08/25/2037 | | | 1,154,409 | |
| | 5,045,761 | | Series 2007-20 | 6.25% | 08/25/2047 | | | 4,285,673 | |
| | 1,451,596 | | Series 2007-23CB(h) | 1M US L + 0.50% | 09/25/2037 | | | 916,038 | |
| | 1,386,032 | | Series 2007-23CB(h) | 6.50% - 1M US L | 09/25/2037 | | | 319,987 | |
| | 8,568,008 | | Series 2007-HY2(h) | 3.32% | 03/25/2047 | | | 7,930,362 | |
| | | | American Home Mortgage Investment Trust | | | | | | |
| | 178,765 | | Series 2007-A(c)(j) | 6.60% | 01/25/2037 | | | 92,523 | |
| | | | Atrium IX | | | | | | |
| | 500,000 | | Series 2017-9A(c)(h) | 3M US L + 3.60% | 05/28/2030 | | | 499,874 | |
| | | | BAMLL Commercial Mortgage Securities Trust | | | | | | |
| | 400,000 | | Series 2014-IP(c)(h) | 2.81% | 06/15/2028 | | | 396,759 | |
| | 17,000,000 | | Series 2015-200P(c)(h) | 0.50% | 04/14/2033 | | | 456,062 | |
| | | | Banc of America Alternative Loan Trust | | | | | | |
| | 60,172 | | Series 2005-6 | 6.00% | 07/25/2035 | | | 59,942 | |
| | 117,263 | | Series 2005-6 | 5.50% | 07/25/2035 | | | 106,741 | |
| | | | Banc of America Commercial Mortgage Trust | | | | | | |
| | 298,729 | | Series 2007-5(h) | 5.77% | 10/10/2017 | | | 298,937 | |
| | | | Banc of America Funding Corp. | | | | | | |
| | 504,348 | | Series 2008-R2(c) | 6.00% | 09/25/2037 | | | 520,737 | |
| | | | Banc of America Funding Trust | | | | | | |
| | 3,000,000 | | Series 2005-B(h) | 1M US L + 0.45% | 04/20/2035 | | | 2,552,631 | |
| | 339,999 | | Series 2006-2 | 5.50% | 03/25/2036 | | | 336,368 | |
| | 938,235 | | Series 2006-A(h) | 3.50% | 02/20/2036 | | | 906,586 | |
| | 7,506,170 | | Series 2007-4(h) | 5.77% | 05/25/2037 | | | 7,549,236 | |
| | 6,308,386 | | Series 2010-R5(c)(h) | 6.00% | 10/26/2037 | | | 5,731,652 | |
| | | | BBCMS Mortgage Trust | | | | | | |
| | 4,114,941 | | Series 2017-C1(h) | 1.69% | 02/15/2050 | | | 443,936 | |
| | | | BCAP LLC Trust | | | | | | |
| | 173,933 | | Series 2007-AA2(h) | 7.50% | 04/25/2037 | | | 167,753 | |
| | 112,851 | | Series 2007-AA2 | 6.00% | 04/25/2037 | | | 99,042 | |
| | 3,112,252 | | Series 2009-RR1(c)(h) | 6.00% | 10/26/2036 | | | 3,044,535 | |
| | 7,469,425 | | Series 2010-RR6(c)(h) | 6.00% | 07/26/2036 | | | 6,196,827 | |
| | | | Bear Stearns ALT-A Trust | | | | | | |
| | 1,554,753 | | Series 2004-11(h) | 3.31% | 11/25/2034 | | | 1,434,425 | |
| | 1,629,418 | | Series 2005-3(h) | 3.28% | 04/25/2035 | | | 1,345,321 | |
| | 12,041,274 | | Series 2006-3(h) | 3.24% | 05/25/2036 | | | 9,811,018 | |
| | 7,353,292 | | Series 2006-4(h) | 3.88% | 07/25/2036 | | | 6,788,122 | |
See Notes to Financial Statements.
| 44 | (888) 848-7569 | www.rivernorth.com |
| RiverNorth/DoubleLine Strategic Income Fund | Schedule of Investments |
September 30, 2017
| Principal Amount/Description | Rate | Maturity | | Value | |
| $ | 1,497,999 | | Series 2006-6(h) | 3.44% | 11/25/2036 | | $ | 1,369,550 | |
| | | | Bear Stearns Asset Backed Securities I Trust | | | | | | |
| | 11,674,567 | | Series 2007-HE2(h) | 1M US L + 0.23% | 02/25/2037 | | | 10,068,882 | |
| | | | Bear Stearns Asset-Backed Securities Trust | | | | | | |
| | 260,137 | | Series 2005-HE3(h) | 1M US L + 1.02% | 03/25/2035 | | | 262,133 | |
| | 2,623,859 | | Series 2006-AC1(j) | 6.25% | 02/25/2036 | | | 2,089,076 | |
| | | | BX Trust 2017 | | | | | | |
| | 192,000 | | Series 2017-SLCT(c)(h) | 1M US L + 2.05% | 07/15/2034 | | | 192,440 | |
| | 315,000 | | Series 2017-SLCT(c)(h) | 1M US L + 3.15% | 07/15/2034 | | | 316,991 | |
| | | | Carrington Mortgage Loan Trust | | | | | | |
| | 2,600,000 | | Series 2006-NC4(h) | 1M US L + 0.16% | 10/25/2036 | | | 2,253,864 | |
| | | | CFCRE Commercial Mortgage Trust | | | | | | |
| | 5,179,693 | | Series 2016-C3(h) | 1.24% | 12/10/2025 | | | 368,052 | |
| | 501,000 | | Series 2016-C3(c)(h) | 3.05% | 01/10/2048 | | | 373,361 | |
| | 486,000 | | Series 2016-C7 | 3.84% | 12/10/2054 | | | 510,371 | |
| | | | Chase Mortgage Finance Trust | | | | | | |
| | 5,593,444 | | Series 2007-S2 | 6.00% | 03/25/2037 | | | 4,980,883 | |
| | 11,363,011 | | Series 2007-S2 | 6.00% | 03/25/2037 | | | 10,172,610 | |
| | 614,075 | | Series 2007-S3 | 5.50% | 05/25/2037 | | | 505,755 | |
| | | | Chicago Skyscraper Trust | | | | | | |
| | 193,000 | | Series 2017-SKY(c)(h) | 1M US L + 1.10% | 02/15/2019 | | | 193,327 | |
| | 107,000 | | Series 2017-SKY(c)(h) | 1M US L + 1.25% | 02/15/2019 | | | 107,184 | |
| | | | CIM Trust | | | | | | |
| | 12,000,000 | | Series 2016-1RR(h) | 12.32% | 07/26/2055 | | | 11,188,484 | |
| | 12,000,000 | | Series 2016-2RR B2(h) | 24.65% | 02/27/2056 | | | 10,973,009 | |
| | 12,000,000 | | Series 2016-3RR B2(c)(h) | 11.02% | 02/27/2056 | | | 11,051,821 | |
| | 11,430,000 | | Series 2016-3RR B2(h) | 12.17% | 01/27/2057 | | | 12,646,128 | |
| | 4,933,918 | | Series 2017-6 A1 | 3.02% | 06/25/2057 | | | 4,899,034 | |
| | | | Citicorp Mortgage Securities Trust | | | | | | |
| | 995,192 | | Series 2007-1 | 6.00% | 01/25/2037 | | | 1,003,893 | |
| | 113,525 | | Series 2007-2 | 5.50% | 02/25/2037 | | | 114,163 | |
| | | | Citigroup Commercial Mortgage Trust | | | | | | |
| | 3,962,795 | | Series 2014-GC25(h) | 1.20% | 10/10/2047 | | | 231,300 | |
| | 355,500 | | Series 2015-GC27(c)(h) | 4.58% | 01/10/2025 | | | 295,139 | |
| | 400,000 | | Series 2015-GC31(h) | 4.20% | 06/10/2025 | | | 390,111 | |
| | 420,000 | | Series 2015-GC35(h) | 4.65% | 11/10/2025 | | | 423,442 | |
See Notes to Financial Statements.
| Annual Report | September 30, 2017 | 45 |
| RiverNorth/DoubleLine Strategic Income Fund | Schedule of Investments |
September 30, 2017
| Principal Amount/Description | Rate | Maturity | | Value | |
| $ | 5,490,413 | | Series 2015-GC35(h) | 1.04% | 11/10/2048 | | $ | 269,885 | |
| | 488,000 | | Series 2016-P4 | 2.90% | 07/10/2026 | | | 483,389 | |
| | 3,346,349 | | Series 2016-P4(h) | 2.17% | 07/10/2049 | | | 418,188 | |
| | 388,000 | | Series 2016-P6(h) | 3.72% | 12/10/2049 | | | 408,495 | |
| | 494,000 | | Series 2016-SMPLC D(c) | 3.52% | 09/10/2021 | | | 494,283 | |
| | | | Citigroup Mortgage Loan Trust | | | | | | |
| | 1,038,105 | | Series 2006-WF1(j) | 5.03% | 03/25/2036 | | | 765,000 | |
| | 1,493,029 | | Series 2007-OPX1(j) | 6.33% | 01/25/2037 | | | 1,056,764 | |
| | 1,616,490 | | Series 2008-AR4(c)(h) | 3.61% | 11/25/2038 | | | 1,622,931 | |
| | 1,400,000 | | Series 2008-AR4(c)(h) | 3.45% | 11/25/2038 | | | 1,446,584 | |
| | 1,020,817 | | Series 2010-8(c)(h) | 6.00% | 11/25/2036 | | | 1,050,815 | |
| | 3,039,631 | | Series 2010-8(c)(h) | 6.00% | 12/25/2036 | | | 3,056,714 | |
| | | | CitiMortgage Alternative Loan Trust | | | | | | |
| | 842,361 | | Series 2007-A1 | 6.00% | 01/25/2037 | | | 795,263 | |
| | 165,923 | | Series 2007-A1(h) | 5.40% - 1M US L | 01/25/2037 | | | 21,430 | |
| | 274,931 | | Series 2007-A3(h) | 5.40% - 1M US L | 03/25/2037 | | | 38,639 | |
| | 119,467 | | Series 2007-A3(h) | 6.00% | 03/25/2037 | | | 111,809 | |
| | 1,000,957 | | Series 2007-A4 | 5.75% | 04/25/2037 | | | 890,627 | |
| | 865,324 | | Series 2007-A6 | 5.50% | 06/25/2037 | | | 778,383 | |
| | | | CLNS Trust | | | | | | |
| | 168,000 | | Series 2017-IKPR(c)(h) | 1M US L + 3.15% | 06/11/2032 | | | 168,142 | |
| | 168,000 | | Series 2017-IKPR(c)(h) | 1M US L + 3.50% | 06/11/2032 | | | 168,706 | |
| | 168,000 | | Series 2017-IKPR(c)(h) | 1M US L + 4.50% | 06/11/2032 | | | 169,055 | |
| | | | COBALT CMBS Commercial Mortgage Trust | | | | | | |
| | 292,070 | | Series 2007-C2(h) | 5.57% | 04/15/2047 | | | 297,673 | |
| | | | Coinstar Funding LLC | | | | | | |
| | 5,985,000 | | Series 2017-1A(c) | 5.22% | 04/25/2047 | | | 6,228,503 | |
| | | | Cold Storage Trust | | | | | | |
| | 301,000 | | Series 2017-ICE3(c)(h) | 1M US L + 1.00% | 04/15/2024 | | | 302,519 | |
| | 367,000 | | Series 2017-ICE3(c)(h) | 1M US L + 1.35% | 04/15/2024 | | | 370,078 | |
| | | | Commercial Mortgage Pass-Through Certificates | | | | | | |
| | 329,970 | | Series 2010-C1(c)(h) | 1.80% | 07/10/2046 | | | 587 | |
| | 312,400 | | Series 2014-CR19(h) | 4.87% | 08/10/2047 | | | 318,833 | |
| | 400,000 | | Series 2014-CR20(h) | 4.66% | 11/10/2047 | | | 409,309 | |
| | 5,797,416 | | Series 2014-UBS4(c) | 3.75% | 08/10/2047 | | | 1,790,068 | |
| | 11,000 | | Series 2014-UBS4(c)(h)(k) | 0.00% | 08/10/2047 | | | 0 | |
| | 2,705,400 | | Series 2014-UBS4(c) | 3.75% | 08/10/2047 | | | 1,816,484 | |
| | 3,091,920 | | Series 2014-UBS4(c) | 3.75% | 08/10/2047 | | | 1,888,192 | |
See Notes to Financial Statements.
| 46 | (888) 848-7569 | www.rivernorth.com |
| RiverNorth/DoubleLine Strategic Income Fund | Schedule of Investments |
September 30, 2017
| Principal Amount/Description | Rate | Maturity | | Value | |
| $ | 3,904,634 | | Series 2015-CR22(h) | 1.13% | 03/10/2025 | | $ | 192,851 | |
| | 475,000 | | Series 2015-CR25(h) | 4.70% | 08/10/2025 | | | 486,486 | |
| | 5,036,044 | | Series 2015-CR26(h) | 1.20% | 09/10/2025 | | | 302,709 | |
| | 419,000 | | Series 2015-LC23(h) | 4.80% | 10/10/2025 | | | 435,573 | |
| | 3,697,344 | | Series 2016-DC2(h) | 1.22% | 10/10/2025 | | | 240,801 | |
| | 249,000 | | Series 2016-DC2(h) | 4.80% | 02/10/2026 | | | 245,095 | |
| | | | Commercial Mortgage Trust | | | | | | |
| | 659,000 | | Series 2012-CR4(c)(h) | 4.74% | 10/15/2045 | | | 575,909 | |
| | | | Consumer Credit Origination Loan Trust | | | | | | |
| | 1,253,219 | | Series 2015-1(c) | 5.21% | 03/15/2021 | | | 1,255,327 | |
| | | | Cosmopolitan Hotel Trust | | | | | | |
| | 245,000 | | Series 2016-CSMO(c)(h) | 1M US L + 2.65% | 11/15/2033 | | | 246,515 | |
| | | | Countrywide Home Loan Mortgage Pass-Through Trust | | | | | | |
| | 3,530,154 | | Series 2005-HYB7(h) | 3.08% | 11/20/2035 | | | 3,228,254 | |
| | 90,766 | | Series 2005-J4 | 5.50% | 11/25/2035 | | | 89,204 | |
| | 2,803,742 | | Series 2006-18 | 6.00% | 12/25/2036 | | | 2,558,857 | |
| | 445,798 | | Series 2007-17 | 6.00% | 10/25/2037 | | | 427,216 | |
| | 476,192 | | Series 2007-3 | 6.00% | 04/25/2037 | | | 424,863 | |
| | 535,236 | | Series 2007-7 | 5.75% | 06/25/2037 | | | 496,205 | |
| | | | Credit Suisse First Boston Mortgage Securities Corp. | | | | | | |
| | 98,792 | | Series 2005-10 | 5.50% | 11/25/2035 | | | 97,037 | |
| | 3,183,907 | | Series 2005-11 | 6.00% | 12/25/2035 | | | 3,079,713 | |
| | 76,439 | | Series 2005-8 | 5.50% | 08/25/2025 | | | 77,071 | |
| | 6,006,959 | | Series 2005-9 | 6.00% | 10/25/2035 | | | 3,892,258 | |
| | | | Credit Suisse Mortgage Capital Certificates | | | | | | |
| | 4,900,688 | | Series 2006-2 | 5.75% | 03/25/2036 | | | 4,458,837 | |
| | | | Credit-Based Asset Servicing & Securitization LLC | | | | | | |
| | 14,778,659 | | Series 2007-CB6(c)(h) | 1M US L + 0.22% | 07/25/2037 | | | 9,868,985 | |
| | | | CSAB Mortgage-Backed Trust | | | | | | |
| | 8,781,274 | | Series 2006-2(j) | 5.70% | 09/25/2036 | | | 1,874,531 | |
| | 163,490 | | Series 2007-1(h) | 5.90% | 05/25/2037 | | | 83,326 | |
| | | | CSAIL Commercial Mortgage Trust | | | | | | |
| | 5,891,207 | | Series 2015-C1(h) | 1.09% | 01/15/2025 | | | 296,299 | |
| | 419,000 | | Series 2015-C4(h) | 4.74% | 01/15/2025 | | | 418,008 | |
| | 5,941,189 | | Series 2017-C8(h) | 1.41% | 06/15/2050 | | | 489,367 | |
| | | | CSMC Mortgage-Backed Trust | | | | | | |
| | 244,936 | | Series 2006-1 | 6.00% | 02/25/2036 | | | 188,962 | |
| | 57,007 | | Series 2006-4 | 5.50% | 05/25/2021 | | | 53,921 | |
See Notes to Financial Statements.
| Annual Report | September 30, 2017 | 47 |
| RiverNorth/DoubleLine Strategic Income Fund | Schedule of Investments |
September 30, 2017
| Principal Amount/Description | Rate | Maturity | | Value | |
| $ | 941,762 | | Series 2006-5 | 6.25% | 06/25/2036 | | $ | 490,864 | |
| | 124,395 | | Series 2006-9 | 6.00% | 11/25/2036 | | | 105,076 | |
| | 2,764,138 | | Series 2007-1 | 6.00% | 02/25/2037 | | | 2,527,705 | |
| | 15,301 | | Series 2007-2 | 5.00% | 03/25/2037 | | | 15,164 | |
| | 610,840 | | Series 2007-3(h) | 5.84% | 04/25/2037 | | | 319,947 | |
| | 46,901 | | Series 2007-4 | 6.00% | 06/25/2037 | | | 44,136 | |
| | 4,646,090 | | Series 2009-16R(c)(h) | 6.00% | 07/26/2037 | | | 4,522,093 | |
| | 1,297,283 | | Series 2010-7R(c)(h) | 6.00% | 04/26/2037 | | | 1,258,066 | |
| | 5,659,154 | | Series 2016-PR1(c)(j) | 5.50% | 07/25/2056 | | | 5,686,857 | |
| | | | CSMC Trust 2017 | | | | | | |
| | 253,000 | | Series 2017-CHOP(c)(h) | 1M US L + 1.90% | 07/15/2032 | | | 253,441 | |
| | 253,000 | | Series 2017-CHOP(c)(h) | 1M US L + 3.30% | 07/15/2032 | | | 253,603 | |
| | | | CWABS Asset-Backed Certificates Trust | | | | | | |
| | 2,600,000 | | Series 2005-14(h) | 1M US L + 0.73% | 04/25/2036 | | | 2,296,300 | |
| | | | Deutsche Alt-A Securities, Inc. Mortgage Loan Trust | | | | | | |
| | 430,950 | | Series 2005-6(h) | 5.08% - 1M US L | 12/25/2035 | | | 63,860 | |
| | 188,841 | | Series 2005-6(h) | 1M US L + 1.40% | 12/25/2035 | | | 149,216 | |
| | 599,009 | | Series 2007-1(h) | 1M US L + 0.14% | 08/25/2037 | | | 584,954 | |
| | | | Deutsche Mortgage Securities, Inc. Mortgage Loan Trust | | | | | | |
| | 203,690 | | Series 2006-PR1(c)(h) | 12.12% - 1M US L | 04/15/2036 | | | 220,516 | |
| | | | Earnest Student Loan Program | | | | | | |
| | 35,000 | | Series 2016-D(c) | 0.00% | 01/25/2041 | | | 3,135,541 | |
| | | | Element Rail Leasing II LLC | | | | | | |
| | 1,783,459 | | Series 2016-1A(c) | 5.05% | 03/19/2046 | | | 1,893,338 | |
| | | | First Horizon Alternative Mortgage Securities Trust | | | | | | |
| | 94,291 | | Series 2005-FA6 | 5.50% | 09/25/2035 | | | 82,917 | |
| | 1,219,190 | | Series 2005-FA6 | 5.50% | 09/25/2035 | | | 1,072,127 | |
| | 100,453 | | Series 2006-FA7 | 6.25% | 12/25/2036 | | | 87,074 | |
| | 195,636 | | Series 2007-FA2 | 6.00% | 04/25/2037 | | | 153,043 | |
| | | | First Horizon Mortgage Pass-Through Trust | | | | | | |
| | 3,085,138 | | Series 2007-AR3(h) | 3.27% | 11/25/2037 | | | 2,941,315 | |
| | | | Freddie Mac Multifamily Structured Pass Through Certificates | | | | | | |
| | 3,619,319 | | Series 2016-K722(h) | 1.44% | 03/25/2023 | | | 210,711 | |
See Notes to Financial Statements.
| 48 | (888) 848-7569 | www.rivernorth.com |
| RiverNorth/DoubleLine Strategic Income Fund | Schedule of Investments |
September 30, 2017
| Principal Amount/Description | Rate | Maturity | | Value | |
| | | | GE Commercial Mortgage Corp. Trust | | | | | |
| $ | 489,000 | | Series 2007-C1(h) | 5.61% | 12/10/2049 | | $ | 497,555 | |
| | | | GRACE Mortgage Trust | | | | | | |
| | 400,000 | | Series 2014-GRCE(c) | 3.37% | 06/10/2028 | | | 414,138 | |
| | | | Great Wolf Trust | | | | | | |
| | 152,000 | | Series 2017-WOLF(c)(h) | 1M US L + 2.10% | 09/15/2034 | | | 152,333 | |
| | 235,000 | | Series 2017-WOLF(c)(h) | 1M US L + 3.10% | 09/15/2034 | | | 235,591 | |
| | 125,000 | | Series 2017-WOLF(c)(h) | 1M US L + 4.07% | 09/15/2034 | | | 125,353 | |
| | | | GS Mortgage Securities Trust | | | | | | |
| | 88,599 | | Series 2006-GG6(c)(h) | 0.00% | 04/10/2038 | | | 1 | |
| | 329,005 | | Series 2011-GC3(c)(h) | 0.84% | 03/10/2021 | | | 6,023 | |
| | 2,369,757 | | Series 2011-GC5(c)(h) | 1.52% | 08/10/2044 | | | 99,694 | |
| | 1,331,000 | | Series 2014-GC26(c)(h) | 4.66% | 11/10/2047 | | | 1,152,964 | |
| | 7,413,216 | | Series 2015-GS1(h) | 0.97% | 11/10/2048 | | | 390,503 | |
| | 5,941,786 | | Series 2017-GS7(h) | 1.29% | 08/10/2050 | | | 504,824 | |
| | | | GSAA Home Equity Trust | | | | | | |
| | 2,818,241 | | Series 2006-13(h) | 6.04% | 07/25/2036 | | | 1,682,090 | |
| | 635,266 | | Series 2006-18(j) | 5.68% | 11/25/2036 | | | 320,722 | |
| | 196,209 | | Series 2006-6(h) | 5.69% | 03/25/2036 | | | 105,609 | |
| | 1,062,499 | | Series 2007-2(j) | 6.10% | 03/25/2037 | | | 500,657 | |
| | | | GSR Mortgage Loan Trust | | | | | | |
| | 659,081 | | Series 2005-AR4(h) | 3.54% | 07/25/2035 | | | 664,007 | |
| | 2,139,290 | | Series 2006-2F | 5.25% | 02/25/2036 | | | 1,771,443 | |
| | 1,293,606 | | Series 2007-2F | 5.75% | 02/25/2037 | | | 1,230,563 | |
| | 4,281,473 | | Series 2007-2F | 6.00% | 03/25/2037 | | | 4,223,776 | |
| | 1,936,718 | | Series 2007-AR2(h) | 3.61% | 05/25/2037 | | | 1,720,727 | |
| | | | Helios Issuer LLC Series | | | | | | |
| | 1,466,814 | | Series 2017-1A(c) | 4.94% | 09/20/2049 | | | 1,487,341 | |
| | | | HSI Asset Loan Obligation Trust | | | | | | |
| | 83,434 | | Series 2007-2 | 5.50% | 09/25/2037 | | | 81,153 | |
| | | | IndyMac IMJA Mortgage Loan Trust | | | | | | |
| | 1,573,425 | | Series 2007-A1 | 6.00% | 08/25/2037 | | | 1,348,388 | |
| | | | IndyMac IMSC Mortgage Loan Trust | | | | | | |
| | 4,941,670 | | Series 2007-F2 | 6.50% | 07/25/2037 | | | 3,339,564 | |
| | | | IndyMac Index Mortgage Loan Trust | | | | | | |
| | 3,794,203 | | Series 2005-AR31(h) | 3.15% | 01/25/2036 | | | 3,636,193 | |
| | 1,485,087 | | Series 2005-AR35(h) | 3.27% | 02/25/2036 | | | 1,276,719 | |
| | 4,290,151 | | Series 2006-AR25(h) | 3.32% | 09/25/2036 | | | 4,029,567 | |
| | 248,276 | | Series 2007-FLX1(h) | 1M US L + 0.18% | 02/25/2037 | | | 250,529 | |
| | | | JP Morgan Alternative Loan Trust | | | | | | |
| | 394,541 | | Series 2005-S1 | 6.00% | 12/25/2035 | | | 383,296 | |
See Notes to Financial Statements.
| Annual Report | September 30, 2017 | 49 |
| RiverNorth/DoubleLine Strategic Income Fund | Schedule of Investments |
September 30, 2017
| Principal Amount/Description | Rate | Maturity | | Value | |
| $ | 56,912 | | Series 2006-S1 | 5.00% | 02/25/2021 | | $ | 56,973 | |
| | 443,735 | | Series 2006-S3(j) | 6.12% | 08/25/2036 | | | 442,278 | |
| | | | JP Morgan BB Commercial Mortgage Securities Trust | | | | | | |
| | 400,000 | | Series 2014-C21(h) | 4.82% | 08/15/2047 | | | 408,219 | |
| | 388,000 | | Series 2014-C26(h) | 4.57% | 12/15/2024 | | | 383,066 | |
| | 627,390 | | Series 2015-C27(c)(h) | 3.99% | 02/15/2025 | | | 505,338 | |
| | 5,908,986 | | Series 2015-C28(h) | 1.33% | 03/15/2025 | | | 316,473 | |
| | 10,302,503 | | Series 2015-C30(h) | 0.83% | 07/15/2025 | | | 342,363 | |
| | 3,943,679 | | Series 2015-C31(h) | 1.15% | 08/15/2025 | | | 213,521 | |
| | 200,000 | | Series 2015-C32(h) | 4.82% | 10/15/2025 | | | 198,557 | |
| | 489,000 | | Series 2015-C33(h) | 4.77% | 11/15/2025 | | | 509,669 | |
| | 414,000 | | Series 2016-C1(h) | 4.91% | 02/15/2026 | | | 435,171 | |
| | | | JP Morgan Chase Commercial Mortgage Securities Corp. | | | | | | |
| | 187,933 | | Series 2006-LDP8(h) | 0.53% | 05/15/2045 | | | 3 | |
| | 162,128 | | Series 2006-LDP9 | 5.37% | 05/15/2047 | | | 162,023 | |
| | 27,699 | | Series 2007-CB19(h) | 5.99% | 02/12/2049 | | | 27,773 | |
| | 16,920 | | Series 2007-CB20(h) | 6.46% | 02/12/2051 | | | 16,933 | |
| | 4,000,000 | | Series 2007-CH1(j) | 4.97% | 11/25/2036 | | | 3,938,256 | |
| | 187,670 | | Series 2007-LD11(h) | 6.17% | 06/15/2049 | | | 191,931 | |
| | 152,030 | | Series 2007-LDPX(h) | 5.46% | 01/15/2049 | | | 151,907 | |
| | 3,196,763 | | Series 2012-C8(h) | 1.97% | 10/15/2045 | | | 220,135 | |
| | 400,000 | | Series 2014-DSTY(c) | 3.43% | 06/10/2027 | | | 404,391 | |
| | 262,000 | | Series 2015-JP1(c)(h) | 4.90% | 01/15/2049 | | | 186,704 | |
| | 119,000 | | Series 2016-JP2(h) | 3.95% | 07/15/2026 | | | 117,345 | |
| | 155,000 | | Series 2016-JP2 | 3.46% | 07/15/2026 | | | 152,220 | |
| | 129,000 | | Series 2017-MAUI(c)(h) | 1M US L + 1.25% | 07/15/2034 | | | 129,064 | |
| | 121,000 | | Series 2017-MAUI(c)(h) | 1M US L + 1.95% | 07/15/2034 | | | 121,292 | |
| | 107,000 | | Series 2017-MAUI(c)(h) | 1M US L + 2.95% | 07/15/2034 | | | 107,639 | |
| | 151,000 | | Series 2017-MAUI(c)(h) | 1M US L + 3.75% | 07/15/2034 | | | 152,217 | |
| | | | JP Morgan Mortgage Acquisition Corp. | | | | | | |
| | 377,408 | | Series 2006-CH2(j) | 5.46% | 09/25/2029 | | | 323,942 | |
| | | | JP Morgan Mortgage Trust | | | | | | |
| | 9,132,433 | | Series 2005-S3 | 6.50% | 01/25/2036 | | | 7,903,246 | |
| | 233,666 | | Series 2007-S3 | 6.00% | 08/25/2037 | | | 209,589 | |
| | 1,299,505 | | Series 2007-S3 | 6.00% | 08/25/2037 | | | 1,167,550 | |
| | 3,702,560 | | Series 2015-3(c)(h) | 3.50% | 05/25/2045 | | | 3,792,612 | |
| | | | JP Morgan Resecuritization Trust | | | | | | |
| | 1,952,051 | | Series 2011-1(c)(h) | 6.00% | 06/26/2037 | | | 1,914,365 | |
See Notes to Financial Statements.
| 50 | (888) 848-7569 | www.rivernorth.com |
| RiverNorth/DoubleLine Strategic Income Fund | Schedule of Investments |
September 30, 2017
| Principal Amount/Description | Rate | Maturity | | Value | |
| | | | Labrador Aviation Finance, Ltd. | | | | | | |
| $ | 11,979,167 | | Series 2016-1A(c) | 5.68% | 01/15/2042 | | $ | 12,328,084 | |
| | | | LB-UBS Commercial Mortgage Trust | | | | | | |
| | 307,850 | | Series 2006-C7(c)(h) | 0.91% | 11/15/2038 | | | 703 | |
| | 230,888 | | Series 2006-C7(c)(h) | 0.91% | 11/15/2038 | | | 527 | |
| | 400,000 | | Series 2007-C7(h) | 6.39% | 09/15/2045 | | | 406,386 | |
| | | | Lehman Mortgage Trust | | | | | | |
| | 8,458,421 | | Series 2006-1(h) | 5.56% | 02/25/2036 | | | 8,139,871 | |
| | 773,626 | | Series 2006-6 | 5.50% | 10/25/2036 | | | 694,140 | |
| | 3,942,613 | | Series 2006-7(h) | 1M US L + 0.25% | 11/25/2036 | | | 357,264 | |
| | 3,942,613 | | Series 2006-7(h) | 7.75% - 1M US L | 11/25/2036 | | | 904,888 | |
| | 1,697,206 | | Series 2006-8(h) | 1M US L + 0.42% | 12/25/2036 | | | 796,870 | |
| | 1,697,206 | | Series 2006-8(h) | 6.58% - 1M US L | 12/25/2036 | | | 384,674 | |
| | 1,007,437 | | Series 2007-10 | 6.00% | 01/25/2038 | | | 997,223 | |
| | 404,501 | | Series 2007-10 | 6.50% | 01/25/2038 | | | 304,351 | |
| | | | Lehman XS Trust | | | | | | |
| | 223,544 | | Series 2006-5(j) | 5.89% | 04/25/2036 | | | 216,139 | |
| | | | Master Asset Backed Securities Trust | | | | | | |
| | 18,952,604 | | Series 2006-NC3(h) | 1M US L + 0.21% | 10/25/2036 | | | 12,576,859 | |
| | | | Merrill Lynch Alternative Note Asset Trust | | | | | | |
| | 887,932 | | Series 2007-F1 | 6.00% | 03/25/2037 | | | 444,113 | |
| | | | Morgan Stanley Bank of America Merrill Lynch Trust | | | | | | |
| | 3,525,655 | | Series 2012-C5(c)(h) | 1.64% | 08/15/2045 | | | 200,206 | |
| | 450,000 | | Series 2014-C19 | 4.00% | 12/15/2024 | | | 428,038 | |
| | 380,000 | | Series 2015-C25(h) | 4.68% | 09/15/2025 | | | 394,207 | |
| | 600,000 | | Series 2015-C26(c) | 3.06% | 10/15/2025 | | | 488,331 | |
| | 350,000 | | Series 2015-C27(h) | 4.69% | 11/15/2025 | | | 340,183 | |
| | 502,000 | | Series 2015-C27(c)(h) | 3.24% | 11/15/2025 | | | 371,507 | |
| | 404,000 | | Series 2016-C32 | 3.72% | 12/15/2049 | | | 424,492 | |
| | | | Morgan Stanley Capital I Trust | | | | | | |
| | 149,914 | | Series 2007-HQ11(h) | 5.51% | 02/12/2044 | | | 149,931 | |
| | 3,855,852 | | Series 2011-C1(c)(h) | 0.60% | 09/15/2047 | | | 39,842 | |
| | 400,000 | | Series 2014-MP(c)(h) | 3.82% | 08/11/2021 | | | 407,398 | |
| | 6,895,695 | | Series 2015-UBS8(h) | 1.12% | 12/15/2025 | | | 412,781 | |
| | 426,000 | | Series 2015-XLF2(c)(h) | 1M US L + 3.00% | 08/15/2026 | | | 424,001 | |
| | 1,434,150 | | Series 2016-UB11 XA(h) | 1.81% | 08/15/2026 | | | 144,131 | |
| | 379,000 | | Series 2017-PRME(c)(h) | 1M US L + 3.40% | 02/15/2034 | | | 382,278 | |
See Notes to Financial Statements.
| Annual Report | September 30, 2017 | 51 |
| RiverNorth/DoubleLine Strategic Income Fund | Schedule of Investments |
September 30, 2017 | Principal Amount/Description | Rate | Maturity | | Value | |
| | | | Morgan Stanley Mortgage Loan Trust | | | | | | |
| $ | 3,549,717 | | Series 2005-3AR(h) | 3.27% | 07/25/2035 | | $ | 3,325,718 | |
| | 244,018 | | Series 2006-11 | 6.00% | 08/25/2036 | | | 201,839 | |
| | 1,291,731 | | Series 2006-7(h) | 5.08% | 06/25/2036 | | | 1,151,677 | |
| | 1,336,942 | | Series 2006-7 | 6.00% | 06/25/2036 | | | 1,193,400 | |
| | 500,980 | | Series 2007-3XS(j) | 5.70% | 01/25/2047 | | | 309,810 | |
| | | | Morgan Stanley Re-REMIC Trust | | | | | | |
| | 430,419 | | Series 2011-R1(c)(h) | 5.94% | 02/26/2037 | | | 473,149 | |
| | | | Mosaic Solar Loans | | | | | | |
| | 236,341 | | Series 2017-1A(c) | 4.45% | 06/20/2042 | | | 239,444 | |
| | | | MSCG Trust | | | | | | |
| | 300,000 | | Series 2016-SNR(c) | 5.21% | 11/15/2034 | | | 307,395 | |
| | | | Nationstar HECM Loan Trust | | | | | | |
| | 12,000,000 | | Series 2017-2A(c)(h) | 3.97% | 09/25/2027 | | | 12,000,000 | |
| | | | New Century Home Equity Loan Trust | | | | | | |
| | 15,015,000 | | Series 2005-3(h) | 1M US L + 0.70% | 07/25/2035 | | | 13,118,876 | |
| | | | Nomura Asset Acceptance Corp. Alternative Loan Trust | | | | | | |
| | 1,572,410 | | Series 2005-AP3(h) | 5.32% | 08/25/2035 | | | 965,187 | |
| | | | Octagon Investment Partners XIV, Ltd. | | | | | | |
| | 500,000 | | Series 2017-1A(c)(h) | 3M US L + 4.00% | 07/15/2029 | | | 504,921 | |
| | | | Octagon Investment Partners XXII, Ltd. | | | | | | |
| | 500,000 | | Series 2014-1A(c)(h) | 3M US L + 5.25% | 11/25/2025 | | | 498,189 | |
| | | | OneMain Financial Issuance Trust | | | | | | |
| | 2,000,000 | | Series 2015-1A(c) | 3.19% | 03/18/2026 | | | 2,022,013 | |
| | | | PFP, Ltd. | | | | | | |
| | 174,135 | | Series 2017-3(c)(h) | 1M US L + 1.05% | 01/14/2035 | | | 175,779 | |
| | 146,000 | | Series 2017-3(c)(h) | 1M US L + 1.30% | 01/14/2035 | | | 147,772 | |
| | 84,000 | | Series 2017-3(c)(h) | 1M US L + 1.75% | 01/14/2035 | | | 84,930 | |
| | 88,000 | | Series 2017-3(c)(h) | 1M US L + 2.50% | 01/14/2035 | | | 88,973 | |
| | | | PHH Alternative Mortgage Trust | | | | | | |
| | 1,691,676 | | Series 2007-2 | 6.00% | 05/25/2037 | | | 1,516,556 | |
| | | | PR Mortgage Loan Trust | | | | | | |
| | 13,300,211 | | Series 2014-1(c)(h) | 5.92% | 10/25/2049 | | | 13,585,879 | |
| | | | Prime Mortgage Trust | | | | | | |
| | 79,875 | | Series 2006-1 | 5.50% | 06/25/2036 | | | 85,721 | |
| | 109,856 | | Series 2006-DR1(c) | 5.50% | 05/25/2035 | | | 105,696 | |
See Notes to Financial Statements.
| 52 | (888) 848-7569 | www.rivernorth.com |
| RiverNorth/DoubleLine Strategic Income Fund | Schedule of Investments |
September 30, 2017
| Principal Amount/Description | Rate | Maturity | | Value | |
| | | | RAIT Trust | | | | | | |
| $ | 394,973 | | Series 2017-FL7(c)(h) | 1M US L + 0.95% | 06/15/2025 | | $ | 395,273 | |
| | 111,000 | | Series 2017-FL7(c)(h) | 1M US L + 1.30% | 06/15/2025 | | | 111,063 | |
| | | | RBSGC Structured Trust | | | | | | |
| | 288,505 | | Series 2008-B(c) | 6.00% | 06/25/2037 | | | 254,090 | |
| | | | Residential Accredit Loans, Inc. | | | | | | |
| | 140,388 | | Series 2004-QS15 | 5.25% | 11/25/2034 | | | 142,074 | |
| | 2,345,158 | | Series 2005-QS17 | 6.00% | 12/25/2035 | | | 2,289,304 | |
| | 5,543,426 | | Series 2006-QA5(h) | 1M US L + 0.22% | 07/25/2036 | | | 3,933,024 | |
| | 3,588,353 | | Series 2006-QS10 | 6.50% | 08/25/2036 | | | 3,231,422 | |
| | 1,323,661 | | Series 2006-QS4 | 6.00% | 04/25/2036 | | | 1,213,554 | |
| | 856,432 | | Series 2006-QS6 | 6.00% | 06/25/2036 | | | 801,044 | |
| | 1,201,994 | | Series 2006-QS6 | 6.00% | 06/25/2036 | | | 1,124,258 | |
| | 372,019 | | Series 2006-QS7(h) | 5.60% - 1M US L | 06/25/2036 | | | 60,345 | |
| | 124,006 | | Series 2006-QS7(h) | 1M US L + 0.40% | 06/25/2036 | | | 90,299 | |
| | 2,358,794 | | Series 2006-QS7 | 6.00% | 06/25/2036 | | | 2,149,683 | |
| | 463,313 | | Series 2006-QS8(h) | 5.55% - 1M US L | 08/25/2036 | | | 69,306 | |
| | 154,438 | | Series 2006-QS8(h) | 1M US L + 0.45% | 08/25/2036 | | | 115,497 | |
| | 3,155,739 | | Series 2007-QS3 | 6.50% | 02/25/2037 | | | 2,931,756 | |
| | 95,197 | | Series 2007-QS6 | 6.25% | 04/25/2037 | | | 91,838 | |
| | 13,413 | | Series 2007-QS6(h) | 55.00% - 1M US L | 04/25/2037 | | | 26,900 | |
| | 4,578,508 | | Series 2007-QS9 | 6.50% | 07/25/2037 | | | 4,168,757 | |
| | 380,476 | | Series 2008-QR1 | 6.00% | 08/25/2036 | | | 279,509 | |
| | | | Residential Asset Mortgage Products Trust | | | | | | |
| | 10,896 | | Series 2004-RS4(h) | 5.07% | 04/25/2034 | | | 11,185 | |
| | | | Residential Asset Securitization Trust | | | | | | |
| | 599,943 | | Series 2006-A1 | 6.00% | 04/25/2036 | | | 518,478 | |
| | 1,228,898 | | Series 2006-A2 | 6.00% | 01/25/2046 | | | 942,632 | |
| | 1,042,598 | | Series 2006-A6 | 6.50% | 07/25/2036 | | | 606,356 | |
| | 5,597,774 | | Series 2006-A7CB | 6.25% | 07/25/2036 | | | 5,465,521 | |
| | 168,056 | | Series 2006-A8 | 6.50% | 08/25/2036 | | | 105,525 | |
| | 487,821 | | Series 2006-A8 | 6.00% | 08/25/2036 | | | 436,076 | |
| | 355,823 | | Series 2006-A8(h) | 5.90% - 1M US L | 08/25/2036 | | | 93,961 | |
| | 1,813,512 | | Series 2007-A1 | 6.00% | 03/25/2037 | | | 1,308,452 | |
| | 2,917,499 | | Series 2007-A2 | 6.00% | 04/25/2037 | | | 2,659,469 | |
| | 102,322 | | Series 2007-A6 | 6.00% | 06/25/2037 | | | 96,410 | |
| | 3,154,985 | | Series 2007-A7 | 6.00% | 07/25/2037 | | | 2,354,241 | |
| | 11,236,516 | | Series 2007-A8 | 6.00% | 08/25/2037 | | | 9,519,358 | |
See Notes to Financial Statements.
| Annual Report | September 30, 2017 | 53 |
| RiverNorth/DoubleLine Strategic Income Fund | Schedule of Investments |
September 30, 2017
| Principal Amount/Description | Rate | Maturity | | Value | |
| | | | Residential Funding Mortgage Securities I Trust | | | | | | |
| $ | 1,449,585 | | Series 2006-S3 | 5.50% | 03/25/2036 | | $ | 1,335,716 | |
| | 316,252 | | Series 2006-S6 | 6.00% | 07/25/2036 | | | 309,508 | |
| | 2,241,017 | | Series 2006-S6 | 6.00% | 07/25/2036 | | | 2,193,224 | |
| | 579,240 | | Series 2007-S3 | 6.00% | 03/25/2037 | | | 555,317 | |
| | 434,395 | | Series 2007-S6 | 6.00% | 06/25/2037 | | | 412,225 | |
| | | | Sequoia Mortgage Trust | | | | | | |
| | 3,164,222 | | Series 2007-3(h) | 3.51% | 07/20/2037 | | | 3,069,274 | |
| | | | SoFi Consumer Loan Program LLC | | | | | | |
| | 191,792 | | Series 2017-2(c) | 3.28% | 02/25/2026 | | | 194,446 | |
| | | | SoFi Professional Loan Program LLC | | | | | | |
| | 300,000 | | Series 2017-D(c) | 3.61% | 09/25/2040 | | | 298,583 | |
| | | | Springleaf Funding Trust | | | | | | |
| | 2,500,000 | | Series 2015-AA(c) | 3.16% | 11/15/2024 | | | 2,517,959 | |
| | | | Structured Adjustable Rate Mortgage Loan Trust | | | | | | |
| | 1,323,426 | | Series 2005-15(h) | 3.41% | 07/25/2035 | | | 1,073,422 | |
| | | | Structured Asset Securities Corp. | | | | | | |
| | 278,460 | | Series 2005-RF1(c)(h) | 1M US L + 0.35% | 03/25/2035 | | | 249,899 | |
| | 279,680 | | Series 2005-RF1(c)(h) | 3.82% | 03/25/2035 | | | 35,730 | |
| | | | Suntrust Alternative Loan Trust | | | | | | |
| | 8,996,640 | | Series 2005-1F | 6.50% | 12/25/2035 | | | 8,608,411 | |
| | | | Sutherland Commercial Mortgage Loans LLC | | | | | | |
| | 141,059 | | Series 2015-SBC4(c) | 4.00% | 06/25/2039 | | | 140,508 | |
| | | | TAL Advantage LLC | | | | | | |
| | 961,690 | | Series 17-1A(c) | 4.50% | 04/20/2042 | | | 998,304 | |
| | | | TBW Mortgage-Backed Trust | | | | | | |
| | 1,518,764 | | Series 2006-2 | 7.00% | 07/25/2036 | | | 691,834 | |
| | | | Tmcl 2017 Tmcl | | | | | | |
| | 961,100 | | Series 2017-1A(c) | 3.72% | 05/20/2042 | | | 973,560 | |
| | | | TRIP Rail Master Funding LLC | | | | | | |
| | 490,291 | | Series 2017-1A(c) | 2.71% | 08/15/2047 | | | 492,055 | |
| | | | Wachovia Bank Commercial Mortgage Trust | | | | | | |
| | 189,586 | | Series 2006-C28(h) | 5.63% | 10/15/2048 | | | 192,516 | |
| | 147,634 | | Series 2006-C29(h) | 0.44% | 11/15/2048 | | | 2 | |
| | 257,273 | | Series 2007-C33(h) | 6.22% | 02/15/2051 | | | 257,056 | |
| | | | Wachovia Mortgage Loan Trust LLC Series Trust | | | | | | |
| | 1,165,038 | | Series 2005-B(h) | 3.50% | 10/20/2035 | | | 1,121,972 | |
See Notes to Financial Statements.
| 54 | (888) 848-7569 | www.rivernorth.com |
| RiverNorth/DoubleLine Strategic Income Fund | Schedule of Investments |
September 30, 2017
| Principal Amount/Description | Rate | Maturity | | Value | |
| | | | Washington Mutual Alternative Mortgage Pass-Through Certificates | | | | | | |
| $ | 2,021,574 | | Series 2005-1 | 6.00% | 03/25/2035 | | $ | 2,061,291 | |
| | 86,202 | | Series 2005-9 | 5.50% | 11/25/2035 | | | 75,803 | |
| | 660,189 | | Series 2006-5 | 6.00% | 07/25/2036 | | | 565,684 | |
| | | | Washington Mutual Mortgage Pass-Through Certificates Trust | | | | | | |
| | 1,216,919 | | Series 2006-2 | 6.00% | 03/25/2036 | | | 1,177,519 | |
| | | | Wells Fargo Alternative Loan Trust | | | | | | |
| | 839,323 | | Series 2007-PA2(h) | 1M US L + 0.43% | 06/25/2037 | | | 668,202 | |
| | 839,323 | | Series 2007-PA2(h) | 6.07% - 1M US L | 06/25/2037 | | | 118,127 | |
| | 324,066 | | Series 2007-PA3 | 5.75% | 07/25/2037 | | | 302,052 | |
| | 1,065,836 | | Series 2007-PA3 | 6.25% | 07/25/2037 | | | 1,023,705 | |
| | 6,433,067 | | Series 2007-PA5 | 6.25% | 11/25/2037 | | | 6,267,168 | |
| | | | Wells Fargo Commercial Mortgage Trust | | | | | | |
| | 525,000 | | Series 2014-LC16(c) | 3.94% | 06/15/2024 | | | 432,173 | |
| | 6,058,710 | | Series 2015-C31(h) | 1.25% | 07/15/2025 | | | 398,318 | |
| | 420,000 | | Series 2015-C31(h) | 4.76% | 11/15/2025 | | | 436,677 | |
| | 340,000 | | Series 2015-LC22(h) | 4.69% | 09/15/2058 | | | 342,073 | |
| | 380,000 | | Series 2015-NXS3(h) | 4.64% | 09/15/2057 | | | 378,375 | |
| | 420,000 | | Series 2015-NXS4(h) | 4.75% | 12/15/2048 | | | 434,172 | |
| | | | Wells Fargo Mortgage-Backed Securities Trust | | | | | | |
| | 1,968,585 | | Series 2005-12 | 5.50% | 11/25/2035 | | | 2,014,790 | |
| | 585,985 | | Series 2006-11 | 6.00% | 09/25/2036 | | | 563,919 | |
| | 83,329 | | Series 2006-2 | 5.75% | 03/25/2036 | | | 83,629 | |
| | 216,819 | | Series 2006-2 | 5.50% | 03/25/2036 | | | 219,540 | |
| | 739,650 | | Series 2007-13 | 6.00% | 09/25/2037 | | | 746,891 | |
| | 817,343 | | Series 2007-14 | 6.00% | 10/25/2037 | | | 810,839 | |
| | 691,602 | | Series 2007-2 | 6.00% | 03/25/2037 | | | 689,349 | |
| | | | WF-RBS Commercial Mortgage Trust | | | | | | |
| | 2,605,490 | | Series 2012-C9(c)(h) | 2.17% | 11/15/2045 | | | 190,871 | |
| | 4,391,713 | | Series 2014-C21(h) | 1.29% | 08/15/2047 | | | 241,336 | |
| | 4,868,418 | | Series 2014-C22(h) | 1.07% | 09/15/2057 | | | 219,720 | |
| | | | | | | | | |
TOTAL NON-AGENCY COLLATERALIZED MORTGAGE OBLIGATIONS (Cost $493,229,806) | | | 514,549,949 | |
| | | | | | | | |
| U.S. GOVERNMENT BONDS AND NOTES - 8.65% | |
| | 2,043,317 | | U.S. Treasury Bonds | 0.13% | 04/15/2022 | | | 2,043,258 | |
| | 510,000 | | U.S. Treasury Bonds | 1.63% | 05/15/2026 | | | 483,613 | |
| | 6,290,000 | | U.S. Treasury Bonds | 2.38% | 05/15/2027 | | | 6,314,447 | |
See Notes to Financial Statements.
| Annual Report | September 30, 2017 | 55 |
| RiverNorth/DoubleLine Strategic Income Fund | Schedule of Investments |
September 30, 2017
| Principal Amount/Description | Rate | Maturity | | Value | |
| $ | 9,320,000 | | U.S. Treasury Bonds | 2.75% | 11/15/2042 | | $ | 9,196,583 | |
| | 5,780,000 | | U.S. Treasury Bonds | 2.88% | 08/15/2045 | | | 5,803,707 | |
| | 7,500,000 | | U.S. Treasury Notes | 0.88% | 01/31/2018 | | | 7,492,956 | |
| | 7,500,000 | | U.S. Treasury Notes | 0.75% | 02/28/2018 | | | 7,487,988 | |
| | 8,000,000 | | U.S. Treasury Notes | 0.88% | 03/31/2018 | | | 7,985,371 | |
| | 7,500,000 | | U.S. Treasury Notes | 0.75% | 04/30/2018 | | | 7,478,730 | |
| | 1,080,000 | | U.S. Treasury Notes | 1.00% | 05/15/2018 | | | 1,078,545 | |
| | 7,500,000 | | U.S. Treasury Notes | 1.00% | 05/31/2018 | | | 7,487,256 | |
| | 8,000,000 | | U.S. Treasury Notes | 1.38% | 06/30/2018 | | | 8,005,312 | |
| | 7,500,000 | | U.S. Treasury Notes | 1.38% | 07/31/2018 | | | 7,502,930 | |
| | 7,500,000 | | U.S. Treasury Notes | 1.50% | 08/31/2018 | | | 7,509,961 | |
| | 8,000,000 | | U.S. Treasury Notes | 0.75% | 09/30/2018 | | | 7,952,344 | |
| | 24,690,000 | | U.S. Treasury Notes | 0.75% | 10/31/2018 | | | 24,526,043 | |
| | 7,500,000 | | U.S. Treasury Notes | 1.38% | 11/30/2018 | | | 7,498,535 | |
| | 8,000,000 | | U.S. Treasury Notes | 1.25% | 12/31/2018 | | | 7,985,937 | |
| | 8,000,000 | | U.S. Treasury Notes | 1.13% | 01/31/2019 | | | 7,970,000 | |
| | 770,000 | | U.S. Treasury Notes | 1.75% | 12/31/2020 | | | 771,369 | |
| | 11,580,000 | | U.S. Treasury Notes | 2.25% | 03/31/2021 | | | 11,784,686 | |
| | 12,170,000 | | U.S. Treasury Notes | 2.00% | 08/31/2021 | | | 12,264,127 | |
| | 13,380,000 | | U.S. Treasury Notes | 1.75% | 03/31/2022 | | | 13,302,124 | |
| | 660,000 | | U.S. Treasury Notes | 1.50% | 02/28/2023 | | | 643,062 | |
| | 12,670,000 | | U.S. Treasury Notes | 1.88% | 08/31/2024 | | | 12,440,604 | |
| | | |
TOTAL U.S. GOVERNMENT BONDS AND NOTES (Cost $193,454,610) | | | | | 193,009,488 | |
| | | | | | | | |
| MUNICIPAL BONDS - 0.75% | |
| | 33,700,000 | | Commonwealth of Puerto Rico, Series A Revenue Bonds(e) | 8.00% | 07/01/2035 | | | 16,428,750 | |
| | 200,000 | | North Texas State Municipal Water District Water System, Revenue Bonds | 5.00% | 09/01/2035 | | | 236,734 | |
| | | |
TOTAL MUNICIPAL BONDS (Cost $26,244,980) | | | | | 16,665,484 | |
| | | | | | | | |
| U.S. GOVERNMENT / AGENCY MORTGAGE BACKED SECURITIES - 10.14% | |
| | | | Fannie Mae-Aces | | | | | | |
| | 413,000 | | Series 2016-M3 | 2.70% | 02/25/2026 | | | 410,202 | |
| | | | Federal Home Loan Mortgage Corp. Multifamily Structured Pass Through Certificates | | | | | | |
| | 311,000 | | Series 2015-K050(h) | 3.33% | 08/25/2025 | | | 325,736 | |
| | 412,000 | | Series 2016-K053 | 3.00% | 12/25/2025 | | | 421,018 | |
See Notes to Financial Statements.
| 56 | (888) 848-7569 | www.rivernorth.com |
| RiverNorth/DoubleLine Strategic Income Fund | Schedule of Investments |
September 30, 2017
| Principal Amount/Description | Rate | Maturity | | Value | |
| | | | Federal Home Loan Mortgage Corp. Pool | | | | | | |
| $ | 391,997 | | Series Pool #G01840 | 5.00% | 07/01/2035 | | $ | 430,186 | |
| | 148,395 | | Series Pool #G04817 | 5.00% | 09/01/2038 | | | 162,767 | |
| | | | Federal Home Loan Mortgage Corp. REMICS | | | | | | |
| | 1,862,030 | | Series 2003-2722(h) | 9.89% - 1M US L | 12/15/2033 | | | 2,109,280 | |
| | 355,669 | | Series 2005-R003 | 5.50% | 10/15/2035 | | | 402,549 | |
| | 2,480,625 | | Series 2006-3244(h) | 6.66% - 1M US L | 11/15/2036 | | | 472,547 | |
| | 115,295 | | Series 2007-3261(h) | 6.43% - 1M US L | 01/15/2037 | | | 20,417 | |
| | 287,643 | | Series 2007-3262(h) | 6.40% - 1M US L | 01/15/2037 | | | 32,236 | |
| | 1,174,298 | | Series 2007-3301(h) | 6.10% - 1M US L | 04/15/2037 | | | 176,643 | |
| | 897,972 | | Series 2007-3303(h) | 6.10% - 1M US L | 04/15/2037 | | | 147,811 | |
| | 1,693,319 | | Series 2007-3303(h) | 6.08% - 1M US L | 04/15/2037 | | | 256,287 | |
| | 513,148 | | Series 2007-3382(h) | 6.00% - 1M US L | 11/15/2037 | | | 59,712 | |
| | 731,437 | | Series 2007-3384(h) | 6.31% - 1M US L | 08/15/2036 | | | 104,642 | |
| | 504,801 | | Series 2007-3384(h) | 6.39% - 1M US L | 11/15/2037 | | | 59,627 | |
| | 572,913 | | Series 2008-3417(h) | 6.18% - 1M US L | 02/15/2038 | | | 71,513 | |
| | 4,573,048 | | Series 2008-3419(h) | 6.43% - 1M US L | 02/15/2038 | | | 734,624 | |
| | 518,507 | | Series 2008-3423(h) | 5.65% - 1M US L | 03/15/2038 | | | 61,490 | |
| | 10,844,863 | | Series 2008-3423(h) | 6.00% - 1M US L | 03/15/2038 | | | 101,935 | |
| | 8,450,097 | | Series 2008-3435(h) | 5.98% - 1M US L | 04/15/2038 | | | 1,249,097 | |
| | 2,429,553 | | Series 2009-3510(h) | 6.75% - 1M US L | 02/15/2037 | | | 454,217 | |
| | 659,716 | | Series 2009-3523(h) | 6.00% - 1M US L | 04/15/2039 | | | 98,068 | |
| | 123,040 | | Series 2009-3524 | 3.88% | 06/15/2038 | | | 127,069 | |
| | 39,517 | | Series 2009-3549(h) | 5.80% - 1M US L | 07/15/2039 | | | 4,840 | |
| | 1,595,213 | | Series 2009-3560(h) | 6.40% - 1M US L | 11/15/2036 | | | 222,222 | |
| | 573,940 | | Series 2010-3641 | 4.50% | 03/15/2040 | | | 618,972 | |
| | 733,490 | | Series 2010-3726(h) | 6.05% - 1M US L | 09/15/2040 | | | 111,316 | |
| | 4,361,536 | | Series 2010-3728(h) | 4.45% - 1M US L | 09/15/2040 | | | 352,490 | |
| | 232,408 | | Series 2010-3779 | 4.00% | 12/15/2030 | | | 245,733 | |
| | 750,000 | | Series 2010-3779 | 3.50% | 12/15/2030 | | | 777,671 | |
| | 511,383 | | Series 2010-3779 | 4.50% | 12/15/2040 | | | 537,628 | |
| | 80,029 | | Series 2011-3786(h) | 9.50% - 1M US L | 01/15/2041 | | | 84,352 | |
| | 1,305,026 | | Series 2011-3795 | 4.00% | 01/15/2041 | | | 1,398,647 | |
| | 73,624 | | Series 2011-3798(h) | 9.50% - 1M US L | 11/15/2040 | | | 81,708 | |
| | 600,000 | | Series 2011-3808 | 3.50% | 02/15/2031 | | | 620,910 | |
| | 39,198 | | Series 2011-3809(h) | 9.50% - 1M US L | 02/15/2041 | | | 40,477 | |
| | 1,389,925 | | Series 2011-3815(h) | 5.85% - 1M US L | 02/15/2041 | | | 215,500 | |
| | 500,000 | | Series 2011-3824 | 3.50% | 03/15/2031 | | | 529,787 | |
| | 724,765 | | Series 2011-3824(h) | 7.10% - 1M US L | 08/15/2036 | | | 136,949 | |
| | 889,798 | | Series 2011-3863 | 5.50% | 08/15/2034 | | | 968,733 | |
| | 646,115 | | Series 2011-3864(h) | 9.20% - 1M US L | 05/15/2041 | | | 664,856 | |
| | 946,688 | | Series 2011-3871 | 5.50% | 06/15/2041 | | | 1,076,118 | |
| | 1,014,252 | | Series 2011-3872(h) | 5.95% - 1M US L | 06/15/2041 | | | 147,610 | |
See Notes to Financial Statements.
| Annual Report | September 30, 2017 | 57 |
| RiverNorth/DoubleLine Strategic Income Fund | Schedule of Investments |
September 30, 2017
| Principal Amount/Description | Rate | Maturity | | Value | |
| $ | 2,065,142 | | Series 2011-3888 | 4.00% | 07/15/2041 | | $ | 2,192,014 | |
| | 3,191,575 | | Series 2011-3894 | 4.50% | 07/15/2041 | | | 3,367,468 | |
| | 2,709,277 | | Series 2011-3910 | 5.00% | 08/15/2041 | | | 3,110,268 | |
| | 1,992,756 | | Series 2011-3924(h) | 6.00% - 1M US L | 09/15/2041 | | | 322,668 | |
| | 4,322,141 | | Series 2011-3924(h) | 6.00% - 1M US L | 09/15/2041 | | | 608,797 | |
| | 1,269,445 | | Series 2011-3925 | 3.00% | 09/15/2021 | | | 50,202 | |
| | 6,242,189 | | Series 2012-3(h) | 5.95% - 1M US L | 02/25/2042 | | | 964,366 | |
| | 3,699,742 | | Series 2012-4057 | 4.00% | 06/15/2042 | | | 3,937,230 | |
| | 9,718,102 | | Series 2013-4196(h) | 5.40% - 1M US L | 03/15/2043 | | | 8,508,432 | |
| | 10,007,793 | | Series 2013-4218 | 2.50% | 02/15/2043 | | | 8,738,843 | |
| | 7,676,076 | | Series 2013-4239(g) | 0.00% | 07/15/2043 | | | 5,567,432 | |
| | 4,993,224 | | Series 2014-4302(h) | 6.15% - 1M US L | 02/15/2044 | | | 785,017 | |
| | 4,416,364 | | Series 2014-4413 | 3.50% | 11/15/2044 | | | 4,429,161 | |
| | 10,065,536 | | Series 2015-4427(h) | 5.60% - 1M US L | 07/15/2044 | | | 1,545,588 | |
| | 3,241,433 | | Series 2015-4434 | 3.00% | 02/15/2045 | | | 3,021,270 | |
| | 3,199,928 | | Series 2015-4440 | 2.50% | 02/15/2045 | | | 2,803,095 | |
| | | | Federal National Mortgage Association Pool | | | | | | |
| | 109,855 | | Series Pool #555743 | 5.00% | 09/01/2033 | | | 121,114 | |
| | 133,580 | | Series Pool #735382 | 5.00% | 04/01/2035 | | | 147,243 | |
| | 345,071 | | Series Pool #735383 | 5.00% | 04/01/2035 | | | 380,442 | |
| | 241,017 | | Series Pool #735484 | 5.00% | 05/01/2035 | | | 265,713 | |
| | 100,723 | | Series Pool #AH4437 | 4.00% | 01/01/2041 | | | 105,103 | |
| | 3,695,701 | | Series Pool #AL9238 | 3.00% | 10/01/2041 | | | 3,727,352 | |
| | 3,885,820 | | Series Pool #AS4645 | 3.00% | 03/01/2045 | | | 3,904,392 | |
| | 4,523,987 | | Series Pool #AS7661 | 3.00% | 08/01/2046 | | | 4,520,756 | |
| | 440,455 | | Series Pool #MA0264 | 4.50% | 12/01/2029 | | | 474,086 | |
| | 6,827,492 | | Series Pool #MA2737 | 3.00% | 09/01/2046 | | | 6,853,155 | |
| | 1,066,888 | | Series Pool #MA3894 | 4.00% | 09/01/2031 | | | 1,133,298 | |
| | | | Federal National Mortgage Association REMICS | | | | | | |
| | 141,821 | | Series 2004-46(h) | 6.00% - 1M US L | 03/25/2034 | | | 16,003 | |
| | 417,415 | | Series 2006-101(h) | 6.58% - 1M US L | 10/25/2036 | | | 84,801 | |
| | 1,248,034 | | Series 2006-123(h) | 6.32% - 1M US L | 01/25/2037 | | | 212,194 | |
| | 5,785,253 | | Series 2006-92(h) | 6.58% - 1M US L | 10/25/2036 | | | 1,027,873 | |
| | 171,478 | | Series 2007-102(h) | 6.40% - 1M US L | 11/25/2037 | | | 28,154 | |
| | 136,277 | | Series 2007-108(h) | 6.36% - 1M US L | 12/25/2037 | | | 14,734 | |
| | 37,018 | | Series 2007-30(h) | 6.11% - 1M US L | 04/25/2037 | | | 4,555 | |
| | 514,521 | | Series 2007-38(h) | 6.08% - 1M US L | 05/25/2037 | | | 63,708 | |
| | 32,012 | | Series 2007-51(h) | 6.10% - 1M US L | 06/25/2037 | | | 4,268 | |
| | 86,135 | | Series 2007-53(h) | 6.10% - 1M US L | 06/25/2037 | | | 10,740 | |
| | 849,859 | | Series 2007-57(h) | 6.62% - 1M US L | 10/25/2036 | | | 144,353 | |
| | 256,660 | | Series 2007-68(h) | 6.65% - 1M US L | 07/25/2037 | | | 31,438 | |
| | 954,279 | | Series 2008-3(h) | 6.46% - 1M US L | 02/25/2038 | | | 148,656 | |
| | 465,865 | | Series 2008-56(h) | 6.06% - 1M US L | 07/25/2038 | | | 64,226 | |
See Notes to Financial Statements.
| 58 | (888) 848-7569 | www.rivernorth.com |
| RiverNorth/DoubleLine Strategic Income Fund | Schedule of Investments |
September 30, 2017
| Principal Amount/Description | Rate | Maturity | | Value | |
| $ | 197,570 | | Series 2008-81 | 5.50% | 09/25/2038 | | $ | 213,097 | |
| | 606,026 | | Series 2009-111 | 5.00% | 01/25/2040 | | | 636,265 | |
| | 473,128 | | Series 2009-111(h) | 6.25% - 1M US L | 01/25/2040 | | | 64,603 | |
| | 1,753,431 | | Series 2009-12(h) | 6.60% - 1M US L | 03/25/2036 | | | 329,830 | |
| | 59,064 | | Series 2009-28(h) | 6.00% - 1M US L | 04/25/2037 | | | 7,798 | |
| | 521,594 | | Series 2009-41 | 4.50% | 06/25/2039 | | | 550,433 | |
| | 265,668 | | Series 2009-42(h) | 6.00% - 1M US L | 06/25/2039 | | | 36,833 | |
| | 476,039 | | Series 2009-47(h) | 6.10% - 1M US L | 07/25/2039 | | | 51,923 | |
| | 297,368 | | Series 2009-62(h) | 6.10% - 1M US L | 08/25/2039 | | | 34,602 | |
| | 131,742 | | Series 2009-66(h) | 5.80% - 1M US L | 02/25/2038 | | | 17,372 | |
| | 120,630 | | Series 2009-68(h) | 5.25% - 1M US L | 09/25/2039 | | | 13,872 | |
| | 18,497 | | Series 2010-109(h) | 55.00% - 1M US L | 10/25/2040 | | | 71,786 | |
| | 874,373 | | Series 2010-11(h) | 4.80% - 1M US L | 02/25/2040 | | | 85,296 | |
| | 111,749 | | Series 2010-111(h) | 6.00% - 1M US L | 10/25/2040 | | | 12,369 | |
| | 179,276 | | Series 2010-112 | 4.00% | 10/25/2040 | | | 184,589 | |
| | 457,368 | | Series 2010-115(h) | 6.60% - 1M US L | 11/25/2039 | | | 60,483 | |
| | 2,968,734 | | Series 2010-115(h) | 6.00% - 1M US L | 10/25/2040 | | | 545,374 | |
| | 6,922,171 | | Series 2010-123(h) | 6.05% - 1M US L | 11/25/2040 | | | 1,235,949 | |
| | 1,236,217 | | Series 2010-15(h) | 4.95% - 1M US L | 03/25/2040 | | | 143,375 | |
| | 191,447 | | Series 2010-34(h) | 4.93% - 1M US L | 04/25/2040 | | | 22,346 | |
| | 112,575 | | Series 2010-4(h) | 6.23% - 1M US L | 02/25/2040 | | | 16,594 | |
| | 156,728 | | Series 2010-58(h) | 12.47% - 1M US L | 06/25/2040 | | | 178,521 | |
| | 3,127,141 | | Series 2010-75 | 4.50% | 07/25/2040 | | | 3,371,074 | |
| | 668,927 | | Series 2010-9(h) | 4.75% - 1M US L | 02/25/2040 | | | 70,201 | |
| | 126,133 | | Series 2010-9(h) | 5.30% - 1M US L | 02/25/2040 | | | 13,514 | |
| | 42,757 | | Series 2010-90(h) | 6.00% - 1M US L | 08/25/2040 | | | 5,243 | |
| | 500,000 | | Series 2011-16 | 3.50% | 03/25/2031 | | | 526,192 | |
| | 2,676,903 | | Series 2011-2 | 4.00% | 02/25/2041 | | | 2,819,573 | |
| | 1,000,000 | | Series 2011-25 | 3.00% | 04/25/2026 | | | 1,028,977 | |
| | 500,000 | | Series 2011-29 | 3.50% | 04/25/2031 | | | 515,771 | |
| | 417,766 | | Series 2011-48(h) | 9.20% - 1M US L | 06/25/2041 | | | 440,705 | |
| | 854,068 | | Series 2011-5(h) | 6.40% - 1M US L | 11/25/2040 | | | 81,964 | |
| | 14,841,640 | | Series 2011-51(h) | 6.00% - 1M US L | 06/25/2041 | | | 2,166,462 | |
| | 1,741,366 | | Series 2011-58(h) | 6.55% - 1M US L | 07/25/2041 | | | 324,482 | |
| | 5,841,502 | | Series 2012-106(h) | 6.16% - 1M US L | 10/25/2042 | | | 969,545 | |
| | 1,194,654 | | Series 2012-124(h) | 7.79% - 1M US L | 11/25/2042 | | | 1,182,299 | |
| | 9,795,601 | | Series 2012-128(h) | 6.00% - 1M US L | 11/25/2042 | | | 8,440,661 | |
| | 9,723,774 | | Series 2012-20 | 3.50% | 03/25/2042 | | | 9,975,236 | |
| | 572,789 | | Series 2012-29(h) | 6.00% - 1M US L | 04/25/2042 | | | 72,440 | |
| | 1,341,785 | | Series 2012-32 | 5.00% | 04/25/2042 | | | 277,497 | |
| | 5,609,247 | | Series 2012-65(h) | 5.98% - 1M US L | 06/25/2042 | | | 968,571 | |
| | 5,245,260 | | Series 2012-92 | 3.50% | 08/25/2042 | | | 5,374,882 | |
| | 3,866,365 | | Series 2013-19(h) | 5.40% - 1M US L | 03/25/2043 | | | 3,293,264 | |
See Notes to Financial Statements.
| Annual Report | September 30, 2017 | 59 |
| RiverNorth/DoubleLine Strategic Income Fund | Schedule of Investments |
September 30, 2017
| Principal Amount/Description | Rate | Maturity | | Value | |
| $ | 9,646,208 | | Series 2013-51(h) | 5.40% - 1M US L | 04/25/2043 | | $ | 8,379,161 | |
| | 12,046,798 | | Series 2014-50(h) | 6.20% - 1M US L | 08/25/2044 | | | 1,811,870 | |
| | 6,632,882 | | Series 2014-73(h) | 6.20% - 1M US L | 11/25/2044 | | | 1,139,785 | |
| | 3,140,678 | | Series 2015-59 | 3.00% | 06/25/2041 | | | 3,187,553 | |
| | 9,620,529 | | Series 2015-79 | 3.00% | 11/25/2045 | | | 8,983,178 | |
| | 2,855,432 | | Series 2015-9 | 3.00% | 01/25/2045 | | | 2,908,518 | |
| | 13,486,399 | | Series 2016-72 | 3.00% | 10/25/2046 | | | 12,230,942 | |
| | | | Freddie Mac Gold Pool | | | | | | |
| | 5,597,546 | | Series Pool #GO8721 | 3.00% | 09/01/2046 | | | 5,622,188 | |
| | | | Freddie Mac REMICS | | | | | | |
| | 11,654,102 | | Series 2017-4686 | 4.00% | 03/15/2047 | | | 12,408,651 | |
| | | | Government National Mortgage Association | | | | | | |
| | 88,685 | | Series 2004-83(h) | 6.08% - 1M US L | 10/20/2034 | | | 13,528 | |
| | 78,094 | | Series 2008-6(h) | 6.46% - 1M US L | 02/20/2038 | | | 13,269 | |
| | 73,480 | | Series 2008-67(h) | 6.00% - 1M US L | 08/20/2038 | | | 9,557 | |
| | 1,153,623 | | Series 2008-69(h) | 7.63% - 1M US L | 08/20/2038 | | | 231,981 | |
| | 93,971 | | Series 2009-10(h) | 6.65% - 1M US L | 02/16/2039 | | | 17,431 | |
| | 1,528,293 | | Series 2009-35 | 4.50% | 05/20/2039 | | | 1,648,570 | |
| | 5,702,857 | | Series 2009-58(h) | 6.25% - 1M US L | 06/20/2039 | | | 782,620 | |
| | 83,256 | | Series 2009-6(h) | 5.95% - 1M US L | 02/20/2038 | | | 12,666 | |
| | 2,955,338 | | Series 2009-75 | 5.00% | 09/20/2039 | | | 3,200,120 | |
| | 7,135,926 | | Series 2010-121(h) | 6.00% - 1M US L | 09/20/2040 | | | 1,084,046 | |
| | 4,518,310 | | Series 2010-26(h) | 6.25% - 1M US L | 02/20/2040 | | | 786,178 | |
| | 10,420,430 | | Series 2010-35(h) | 5.68% - 1M US L | 03/20/2040 | | | 1,382,789 | |
| | 122,605 | | Series 2010-61(h) | 6.55% - 1M US L | 09/20/2039 | | | 18,962 | |
| | 306,018 | | Series 2010-98(h) | 5.79% | 03/20/2039 | | | 37,760 | |
| | 2,150,473 | | Series 2011-45 | 4.50% | 03/20/2041 | | | 2,267,845 | |
| | 1,042,780 | | Series 2011-69(g) | 0.00% | 05/20/2041 | | | 895,141 | |
| | 2,658,107 | | Series 2011-71 | 4.50% | 02/20/2041 | | | 2,833,264 | |
| | 1,925,267 | | Series 2011-71(h) | 5.40% - 1M US L | 05/20/2041 | | | 261,517 | |
| | 597,987 | | Series 2011-72(h) | 6.15% - 1M US L | 05/20/2041 | | | 93,597 | |
| | 3,099,214 | | Series 2011-89(h) | 5.45% - 1M US L | 06/20/2041 | | | 393,213 | |
| | 793,289 | | Series 2012-105(h) | 6.20% - 1M US L | 01/20/2041 | | | 58,413 | |
| | 8,250,222 | | Series 2013-102(h) | 6.15% - 1M US L | 03/20/2043 | | | 1,236,083 | |
| | 9,225,877 | | Series 2013-113(h) | 6.25% - 1M US L | 03/20/2043 | | | 1,252,794 | |
| | 11,312,928 | | Series 2013-122(h) | 6.10% - 1M US L | 08/16/2043 | | | 1,870,289 | |
| | 6,607,937 | | Series 2013-148(h) | 5.68% - 1M US L | 10/16/2043 | | | 1,022,767 | |
| | 12,543,272 | | Series 2013-186(h) | 6.25% - 1M US L | 02/16/2043 | | | 1,733,019 | |
| | 7,871,649 | | Series 2014-156(h) | 6.25% - 1M US L | 10/20/2044 | | | 1,243,245 | |
| | 15,036,521 | | Series 2014-3(h) | 6.10% - 1M US L | 01/20/2044 | | | 2,517,383 | |
| | 15,867,279 | | Series 2014-4(h) | 6.10% - 1M US L | 01/16/2044 | | | 2,627,705 | |
| | 11,154,133 | | Series 2014-5(h) | 6.15% - 1M US L | 07/20/2043 | | | 1,496,216 | |
See Notes to Financial Statements.
60 | (888) 848-7569 | www.rivernorth.com |
| RiverNorth/DoubleLine Strategic Income Fund | Schedule of Investments |
September 30, 2017
| Principal Amount/Description | Rate | Maturity | | Value | |
| $ | 9,024,070 | | Series 2014-95(h) | 6.25% - 1M US L | 06/16/2044 | | $ | 1,467,926 | |
| | | | | | | | | | |
| TOTAL U.S. GOVERNMENT / AGENCY MORTGAGE BACKED SECURITIES (Cost $284,196,281) | | | | 226,380,003 | |
| Shares/Description | | | Value | |
WARRANTS - 0.00%(i) | |
| | 672 | | Energy XXI Gulf Coast, Inc., Strike Price 43.66, Expires 12/31/2021 | | | 202 | |
| | | | | | | | |
| TOTAL WARRANTS (Cost $0) | | | 202 | |
| Shares/Description | | | | Value | |
| SHORT-TERM INVESTMENTS - 23.32% | |
| Money Market Fund | | | | | | |
| | 508,743,172 | | State Street Institutional Trust (7 Day Yield 0.92%) | | | 508,743,172 | |
| U.S. Treasury | | | | | | |
| | 6,710,000 | | United States Treasury Bills | 0.93% | 12/07/2017 | | | 6,697,943 | |
| | 5,290,000 | | United States Treasury Bills | 0.98% | 03/08/2018 | | | 5,263,571 | |
| | | | | | | | | 11,961,514 | |
| | | | | | | | | | |
| TOTAL SHORT-TERM INVESTMENTS (Cost $520,705,266) | | | | | 520,704,686 | |
| | | | | | | | |
TOTAL INVESTMENTS - 99.66% (Cost $2,262,835,449) | | | | | 2,224,768,722 | |
| CASH SEGREGATED AT CUSTODIAN FOR TOTAL RETURN SWAP CONTRACTS - 0.02% | | | 400,000 | |
| OTHER ASSETS IN EXCESS OF LIABILITIES - 0.32% | | | 7,116,305 | |
| NET ASSETS - 100.00% | | | $ | 2,232,285,027 | |
| Investment Abbreviations: |
| LIBOR - London Interbank Offered Rate |
| |
| Libor Rates: |
| 1M US L - 1 Month LIBOR as of September 30, 2017 was 1.23% |
| 3M US L - 3 Month LIBOR as of September 30, 2017 was 1.33% |
| (a) | Non-income producing security. |
| (b) | Affiliated company. See Note 9 to Notes to Financial Statements. |
See Notes to Financial Statements.
Annual Report | September 30, 2017 | 61 |
| RiverNorth/DoubleLine Strategic Income Fund | Schedule of Investments |
September 30, 2017
| (c) | Security exempt from registration under Rule 144A of the Securities Act of 1933. These securities have been deemed liquid under procedures approved by the Fund's Board of Trustees and may normally be sold to qualified institutional buyers in transactions exempt from registration. Total fair value of Rule 144A securities amounts to $188,086,881, which represents approximately 8.43% of net assets as of September 30, 2017. |
| (d) | Securities were purchased pursuant to Regulation S under the Securities Act of 1933, which exempts securities offered and sold outside of the United States from registration. Such securities cannot be sold in the United States without either an effective registration statement filed pursuant to the Securities Act of 1933, or pursuant to an exemption from registration. These securities have been deemed liquid under procedures approved by the Fund's Board of Trustees. As of September 30, 2017, the aggregate fair value of those securities was $15,657,800, representing 0.70% of net assets. |
| (e) | Security is currently in default. |
| (f) | Security has no contractual maturity date, is not redeemable and contractually pays an indefinite stream of interest. |
| (g) | Issued with a zero coupon. Income is recognized through the accretion of discount. |
| (h) | Variable rate investment. Interest rates reset periodically. Interest rate shown reflects the rate in effect at September 30, 2017. For securities based on a published reference rate and spread, the reference rate and spread are indicated in the description above. Certain variable rate securities are not based on a published reference rate and spread but are determined by the issuer or agent and are based on current market conditions. These securities do not indicate a reference rate and spread in their description above. |
| (j) | Step bond. Coupon changes periodically based upon a predetermined schedule. Interest rate disclosed is that which is in effect at September 30, 2017. |
| (k) | Security does not have a market value or rate. Security will not be entitled to distributions in respect of principal or interest other than excess interest paid with respect to the mortgage loans. |
See Notes to Financial Statements.
62 | (888) 848-7569 | www.rivernorth.com |
| RiverNorth/Oaktree High Income Fund | Schedule of Investments |
September 30, 2017
| Shares/Description | | Value | |
| CLOSED-END FUNDS - 14.06% | |
| | 48,195 | | Ares Dynamic Credit Allocation Fund, Inc. | | $ | 790,398 | |
| | 74,539 | | BlackRock Corporate High Yield Fund, Inc. | | | 842,291 | |
| | 94,365 | | BlackRock Debt Strategies Fund, Inc. | | | 1,101,239 | |
| | 1,443 | | Brookfield Real Assets Income Fund, Inc. | | | 34,329 | |
| | 33,924 | | Eaton Vance Limited Duration Income Fund | | | 475,954 | |
| | 18,412 | | Invesco High Income Trust II | | | 278,021 | |
| | 69,373 | | Invesco Senior Income Trust | | | 311,485 | |
| | 40,832 | | Legg Mason BW Global Income Opportunities Fund, Inc. | | | 548,782 | |
| | 11,842 | | NexPoint Credit Strategies Fund | | | 272,958 | |
| | 204,374 | | Nuveen Credit Strategies Income Fund | | | 1,735,135 | |
| | 27,384 | | Prudential Global Short Duration High Yield Fund, Inc. | | | 408,843 | |
| | 55,988 | | Western Asset Emerging Markets Income Fund, Inc. | | | 881,251 | |
| | 83,003 | | Western Asset Global High Income Fund, Inc. | | | 854,101 | |
| | 296,175 | | Western Asset High Income Opportunity Fund, Inc. | | | 1,519,378 | |
| | | | | | | | |
| TOTAL CLOSED-END FUNDS (Cost $10,075,607) | | | 10,054,165 | |
| | | | | | |
| COMMON STOCKS - 0.04% | |
| | 3,002 | | Ultra Petroleum Corp.(a) | | | 26,027 | |
| | | | | | | | |
| TOTAL COMMON STOCKS (Cost $51,695) | | | 26,027 | |
| | | | | | |
| PREFERRED STOCKS - 0.34% | |
| | 6,767 | | KCAP Financial, Inc., 6.125%, 09/30/2022(a) | | | 168,940 | |
| | 75 | | Sequa Corp.(a)(b)(c) | | | 75,000 | |
| | | | | | | | |
| TOTAL PREFERRED STOCKS (Cost $244,233) | | | 243,940 | |
| Principal Amount/Description | Rate | Maturity | | Value | |
BANK LOANS - 48.05%(d) | |
| Australia - 0.06% | |
| $ | 39,800 | | Culligan NewCo Ltd., Tranche B-1 First Lien Term Loan | 3M US L + 4.00%, 1.00% Floor | 12/13/2023 | | | 40,024 | |
| | | | | | | | |
| Austria - 0.07% | |
| | 49,500 | | Constantia Flex First Lien, Term B3 Loan | 3M US L + 3.00%, 1.00% Floor | 04/30/2022 | | | 49,500 | |
| | | | | | | | |
| Canada - 0.45% | |
| | 79,200 | | GFL Environmental, Inc., Initial Term Loan | 3M US L + 2.75%, 1.00% Floor | 09/29/2023 | | | 79,670 | |
See Notes to Financial Statements.
Annual Report | September 30, 2017 | 63 |
| RiverNorth/Oaktree High Income Fund | Schedule of Investments |
September 30, 2017
| Principal Amount/Description | Rate | Maturity | | Value | |
| $ | 144,931 | | Hudson's Bay Company, Initial Term Loan | 3M US L + 3.25%, 1.00% Floor | 09/30/2022 | | $ | 141,308 | |
| | 99,292 | | New Red Finance, Inc. (aka Burger King/Tim Hortons), Term B-3 Loan | 3M US L + 2.25%, 2.00% Floor | 02/16/2024 | | | 99,267 | |
| | | | | | | 320,245 | |
| Denmark - 0.68% | |
| | 364,560 | | Faerch Plast Group A/S, Second Lien Term Loan | 3M EUR L + 8.00%, 0.50% Floor | 07/24/2024 | | | 488,511 | |
| | | | | | | | |
| France - 3.95% | |
| | 300,000 | | Cerba Healthcare (Newco SAB Bidco SASU), First Lien Term Loan | 3M EUR L + 3.00% | 04/22/2024 | | | 354,028 | |
| | 235,000 | | Ceva Sante Animale SA (Financiere Top Mendel), First Lien Term B Loan | 3M EUR L + 3.00% | 06/30/2021 | | | 278,845 | |
| | 130,000 | | Financiere Labeyrie Fine Foods, Facility B1 Loan | 3M EUR L + 4.25% | 05/23/2023 | | | 155,760 | |
| | 410,000 | | Financiere Verdi II S.A.S., Term Loan(e) | 3M GBP L + 4.75% | 07/21/2023 | | | 555,009 | |
| | 144,380 | | Generale de Sante, Facility B1A Term Loan | 3M EUR L + 3.125% | 10/03/2022 | | | 173,683 | |
| | 245,000 | | Oberthur Technologies Holdings S.A.S., Facility B1 Term Loan | 3M EUR L + 3.75% | 01/10/2024 | | | 285,205 | |
| | 207,050 | | SAM Bidco., Facility B3B Assignment | 3M EUR L + 3.50% | 12/17/2021 | | | 245,980 | |
| | 228,961 | | SAM Bidco., Facility B6 Assignment | 3M US L + 3.25%, 1.00% Floor | 12/17/2021 | | | 229,248 | |
| | 199,500 | | SFR Group S.A. (Ypso France SAS), Term B11 Loan | 3M US L + 2.75% | 07/31/2025 | | | 199,101 | |
| | 295,000 | | Verallia Packaging S.A.S. (fka Horizon Holdings III), Facility B Loan | 3M EUR L + 3.00% | 10/31/2022 | | | 349,501 | |
| | | | | | | 2,826,360 | |
| Germany - 2.03% | |
| | 130,240 | | Coherent Holding GmbH, Euro Term Loan | 3M EUR L + 2.25%, 0.75% Floor | 11/07/2023 | | | 155,868 | |
| | 107,854 | | Orion Engineered Carbons GmbH (OEC Finance US LLC), Initial Euro Term Loan | 3M EUR L + 2.75% | 07/25/2021 | | | 129,199 | |
| | 750,000 | | Techem GmbH, Term B Loan(e) | 3M EUR L + 3.00% | 07/26/2024 | | | 892,968 | |
| | 230,000 | | Tele Columbus AG, Facility A Loan | 3M EUR L + 3.25% | 10/18/2024 | | | 273,953 | |
| | | | | | | 1,451,988 | |
| Great Britain - 2.47% | |
| | 99,750 | | Belmond Interfin, Ltd. (fka Orient-Express Hotels Interfin, Ltd.), Euro Term Loan | 3M EUR L + 3.00% | 07/03/2024 | | | 119,074 | |
See Notes to Financial Statements.
64 | (888) 848-7569 | www.rivernorth.com |
| RiverNorth/Oaktree High Income Fund | Schedule of Investments |
September 30, 2017
| Principal Amount/Description | Rate | Maturity | | Value | |
| $ | 399,801 | | Ineos Finance PLC, New 2022 Euro Term Loan | 3M EUR L + 2.50%, 0.75% Floor | 03/31/2022 | | $ | 475,727 | |
| | 250,000 | | International Car Wash Group Ltd., Term Loan(e) | 3M US L + 3.50%, 1.00% Floor | 09/25/2024 | | | 251,485 | |
| | 215,000 | | Intervias Finco, Ltd. (fka Optima Sub-Finco, Inc.), Facility D1 Great Britain Term Loan | 3M US L + 5.00% | 01/30/2023 | | | 290,860 | |
| | 200,000 | | LSF9 Robin Investments Limited, Facility B3 Term Loan | 3M US L + 4.00% | 12/14/2023 | | | 270,211 | |
| | 155,000 | | Onex Eagle Acquisition Company Ltd., Facility B Tranche 2 Term Loan | 3M EUR L + 4.25% | 03/12/2022 | | | 176,325 | |
| | 155,000 | | Shilton Bidco Ltd., Facility B1 Term Loan | 3M EUR L + 3.25% | 07/12/2024 | | | 184,149 | |
| | | | | | | 1,767,831 | |
| Italy - 0.44% | |
| | 267,391 | | Inter Media and Communications S.a.r.l., Term Loan B | 3M EUR L + 5.50% | 05/27/2019 | | | 317,610 | |
| | | | | | | | |
| Luxembourg - 3.59% | |
| | 282,766 | | Auris Luxembourg III S.A.R.L. (aka Siemens Audiology), Facility B7 Term Loan | 3M US L + 3.00%, 1.00% Floor | 01/17/2022 | | | 284,357 | |
| | 400,000 | | Delta 2 (Lux) S.A.R.L., Facility B3 Term Loan | 3M US L + 3.25%, 2.00% Floor | 02/01/2024 | | | 402,950 | |
| | 464,000 | | Intelsat Jackson Holdings SA, Tranche B-2 Term Loan | 3M US L + 2.75%, 1.00% Floor | 06/30/2019 | | | 463,176 | |
| | 300,000 | | Invent Farma, First Lien Term B Loan | 3M EUR L + 3.75% | 08/24/2023 | | | 352,798 | |
| | 331,500 | | SIG Combibloc Holdings SCA (fka Onex Wizard Acquisition Company II SCA), Initial Euro Term Loan | 3M EUR L + 3.75% | 03/11/2022 | | | 394,739 | |
| | 106,425 | | Signode Industrial Group Lux S.A. (Signode Industrial Group US, Inc.), Initial Euro Term Loan | 3M EUR L + 3.00%, 1.00% Floor | 05/01/2021 | | | 126,884 | |
| | 450,000 | | Telenet International Finance S.a r.l, AH Facility Term Loan | 3M EUR L + 3.00% | 03/31/2026 | | | 537,339 | |
| | | | | | | 2,562,243 | |
| Netherlands - 2.83% | |
| | 283,418 | | Action Holding BV (fka Peer Holdings BV), Term B Loan | 3M EUR L + 3.50% | 02/25/2022 | | | 339,072 | |
| | 360,000 | | Fugue Finance BV, Initial Term Loan(e) | 3M EUR L + 3.25% | 06/26/2024 | | | 427,510 | |
| | 43,748 | | Jacobs Douwe Egberts International BV (f/k/a Charger OpCo BV), Term B-5 EUR Loan | 3M EUR L + 2.00%, 0.75% Floor | 07/01/2022 | | | 52,322 | |
| | 75,000 | | Jacobs Douwe Egberts International BV (f/k/a Charger OpCo BV), Term B-5 USD Loan | 3M US L + 2.25% | 07/04/2022 | | | 75,500 | |
See Notes to Financial Statements.
Annual Report | September 30, 2017 | 65 |
| RiverNorth/Oaktree High Income Fund | Schedule of Investments |
September 30, 2017
| Principal Amount/Description | Rate | Maturity | | Value | |
| $ | 416,108 | | MacDermid Agricultural Solutions Holdings BV, Euro Tranche C-5 Term Loan | 3M EUR L + 2.75%, 0.75% Floor | 06/07/2023 | | $ | 496,101 | |
| | 226,565 | | Mediq B.V. (fka Media N.V.), Facility B3 Loan | 3M EUR L + 4.50% | 02/28/2022 | | | 269,408 | |
| | 219,450 | | NEP Europe Finco B.V., First Lien Euro Term Loan | 3M EUR L + 3.00%, 0.75% Floor | 01/03/2024 | | | 261,962 | |
| | 99,750 | | Playa Resorts Holding BV, Initial Term Loan(e) | 3M US L + 3.00%, 1.00% Floor | 04/29/2024 | | | 99,326 | |
| | | | | | | 2,021,201 | |
| Spain - 0.30% | |
| | 180,000 | | Ufinet Telecom Holdings S.L.U. (fka Livister Investments S.L.U.), Facility B Term Loan Retired | 3M EUR L + 3.50% | 06/30/2023 | | | 213,894 | |
| | | | | | | | |
| Sweden - 1.47% | |
| | 220,000 | | Diaverum Holding S.a.r.l. (fka Velox Bidco SARL), Facility B Term Loan | 3M EUR L + 3.25% | 06/10/2024 | | | 259,681 | |
| | 370,000 | | Unilabs Diagnostics AB, Term B Loan | 3M EUR L + 3.00% | 04/19/2024 | | | 435,093 | |
| | 300,000 | | Verisure Holding AB, Facility B1E Loan | 3M EUR L + 3.00% | 10/21/2022 | | | 355,599 | |
| | | | | | | 1,050,373 | |
| United Kingdom - 0.65% | |
| | 250,000 | | LGC Science Holdings, Ltd. (fka Figaro Bidco, Ltd.), Facility Term B-3 Loan | 3M US L + 3.75% | 03/08/2023 | | | 251,875 | |
| | 160,000 | | Richmond UK Holdco, Ltd., Facility B Term Loan | 3M US L + 4.25% | 03/03/2024 | | | 215,115 | |
| | | | | | | 466,990 | |
| United States - 29.06% | |
| | 266,358 | | Access CIG LLC, First Lien Term B Loan | 3M US L + 5.00%, 1.00% Floor | 10/18/2021 | | | 268,222 | |
| | 343,100 | | Acuity Specialty Products, Inc. (aka Zep, Inc.), First Lien Term Loan | 3M US L + 4.00%, 1.00% Floor | 08/12/2024 | | | 344,673 | |
| | 99,239 | | ADMI Corp. (aka Aspen Dental), Initial Term Loan | 3M US L + 3.75%, 1.00% Floor | 04/29/2022 | | | 100,386 | |
| | 99,745 | | Air Medical Group Holdings, Inc., Initial Term Loan(e) | 3M US L + 3.25%, 1.00% Floor | 04/28/2022 | | | 99,171 | |
| | 99,748 | | Air Medical Group Holdings, Inc., New Term Loan | 3M US L + 4.00%, 1.00% Floor | 04/28/2022 | | | 99,798 | |
| | 79,400 | | A-L Parent LLC (aka Learfield Communications), First Lien Term Loan | 3M US L + 3.25%, 1.00% Floor | 12/01/2023 | | | 79,971 | |
| | 99,500 | | AlixPartners LLP, Refinancing Term Loan | 3M US L + 3.00%, 1.00% Floor | 04/04/2024 | | | 99,889 | |
| | 99,248 | | Allnex (Luxembourg) & Cy S.C.A. (fka Al Chem & Cy S.C.A.), Tranche B-2 Term Loan | 3M US L + 3.25%, 0.75% Floor | 09/13/2023 | | | 99,662 | |
See Notes to Financial Statements.
66 | (888) 848-7569 | www.rivernorth.com |
| RiverNorth/Oaktree High Income Fund | Schedule of Investments |
September 30, 2017
| Principal Amount/Description | Rate | Maturity | | Value | |
| $ | 100,000 | | Alphabet Holding Company, Inc. (aka Nature's Bounty), First Lien Initial Term Loan(e) | 3M US L + 3.50% | 09/26/2024 | | $ | 98,979 | |
| | 99,750 | | Altice US Finance I Corp., Refinancing Term Loan | 3M US L + 2.25% | 07/28/2025 | | | 99,451 | |
| | 39,800 | | AMC Entertainment Holdings, Inc. (fka AMC Entertainment, Inc.), Incremental Term Loan | 3M US L + 2.25% | 12/15/2023 | | | 39,696 | |
| | 104,475 | | American Builders & Contractors Supply Co., Inc., Term B-1 Loan | 3M US L + 2.50%, 0.75% Floor | 10/31/2023 | | | 105,030 | |
| | 248,046 | | American Renal Holdings, Inc., Term B Loan | 3M US L + 3.25% | 06/22/2024 | | | 247,116 | |
| | 140,444 | | American Rock Salt Co. LLC, First Lien Term Loan | 3M US L + 3.75%, 1.00% Floor | 05/20/2021 | | | 140,444 | |
| | 150,000 | | Applied Systems, Inc., First Lien Term B Loan(e) | 3M US L + 3.25%, 1.00% Floor | 09/18/2024 | | | 151,746 | |
| | 100,000 | | Ascend Learning, LLC, Term B Loan | 3M US L + 3.25%, 1.00% Floor | 07/12/2024 | | | 100,700 | |
| | 182,764 | | Asurion, LLC (fka Asurion Corporation), Amendment No. 14 Term Loan(e) | 3M US L + 2.75% | 08/04/2022 | | | 183,518 | |
| | 150,000 | | Atlantic Broadband Finance LLC, Term Loan(e) | 3M US L + 2.38% | 08/09/2024 | | | 149,296 | |
| | 250,000 | | Avantor Performance Materials Holdings, Inc., Covenant Lite Term Loan(e) | 3M US L + 4.00%, 1.00% Floor | 09/20/2024 | | | 251,043 | |
| | 150,000 | | Badger Finance, LLC, Initial Term Loan(e) | 3M US L + 4.00%, 1.00% Floor | 09/30/2024 | | | 151,220 | |
| | 365,000 | | Bass Pro Group LLC, Initial Term Loan | 3M US L + 5.00%, 0.75% Floor | 12/15/2023 | | | 344,772 | |
| | 200,000 | | BCP Renaissance Parent L.L.C., Term B Loan(e) | 3M US L + 4.00%, 1.00% Floor | 09/19/2024 | | | 202,406 | |
| | 203,975 | | BCPE Eagle Buyer LLC, Initial First LienTerm Loan | 3M US L + 4.25%, 1.00% Floor | 03/16/2024 | | | 202,955 | |
| | 1,000,000 | | Beacon Roofing Supply, Inc., Bridge Loan(e) | 3M US L + 4.75% | 08/24/2018 | | | 1,000,000 | |
| | 100,000 | | Big River Steel LLC, Closing Date Term Loan | 3M US L + 5.00%, 1.00% Floor | 08/23/2023 | | | 101,500 | |
| | 97,522 | | Boyd Gaming Corp., Refinancing Term B Loan | 3M US L + 2.50% | 09/15/2023 | | | 97,961 | |
| | 24,875 | | Bright Horizons Family Solutions LLC (fka Bright Horizons Family Solutions, Inc.), Term B Loan | 3M US L + 2.25%, 0.75% Floor | 11/07/2023 | | | 25,037 | |
| | 150,000 | | Caesars Entertainment Operating Co., Inc. (fka Harrah's Operating Co., Inc.), Term Loan(e) | 3M US L + 2.50% | 04/04/2024 | | | 150,313 | |
See Notes to Financial Statements.
Annual Report | September 30, 2017 | 67 |
| RiverNorth/Oaktree High Income Fund | Schedule of Investments |
September 30, 2017
| Principal Amount/Description | Rate | Maturity | | Value | |
| $ | 79,202 | | Camelot U.S. Acquisition 1 Co. (aka Thomson Reuters Intellectual Property & Science), New Term Loan | 3M US L + 3.50%, 1.00% Floor | 10/03/2023 | | $ | 79,623 | |
| | 150,000 | | Canyon Valor Companies, Inc. (fka GTCR Valor Companies, Inc.), First Lien Initial Dollar Term Loan | 3M US L + 4.25% | 06/16/2023 | | | 152,093 | |
| | 130,000 | | Canyon Valor Companies, Inc. (fka GTCR Valor Companies, Inc.), Initial Euro Term Loan(e) | 3M EUR L + 4.25% | 06/16/2023 | | | 155,631 | |
| | 99,500 | | Caraustar Industries, Inc., Refinancing Term Loan | 3M US L + 5.50%, 1.00% Floor | 03/14/2022 | | | 99,811 | |
| | 193,503 | | Catalent Pharma Solutions, Inc. (fka Cardinal Health 409, Inc.), Euro Term Loan | 3M EUR L + 2.50%, 1.00% Floor | 05/20/2021 | | | 231,973 | |
| | 221,608 | | Cengage Learning, Inc., Refinancing Term Loan | 3M US L + 4.25%, 1.00% Floor | 06/07/2023 | | | 204,908 | |
| | 300,000 | | Centurylink, Inc., Initial Term B Loan | 3M US L + 2.75% | 01/15/2025 | | | 291,187 | |
| | 200,000 | | Cincinnati Bell Inc., Term Loan(e) | 3M US L + 3.75%, 1.00% Floor | 08/16/2024 | | | 202,000 | |
| | 76,808 | | CityCenter Holdings LLC, Term B Loan | 3M US L + 2.50%, 0.75% Floor | 04/18/2024 | | | 77,225 | |
| | 298,734 | | Communications Sales & Leasing, Inc., Shortfall Term Loan | 3M US L + 3.00%, 1.00% Floor | 10/24/2022 | | | 276,775 | |
| | 199,500 | | Cypress Intermediate Holdings III, Inc. (fka Jaguar Holding Inc.), First Lien Initial Term Loan(e) | 3M US L + 3.00%, 1.00% Floor | 04/29/2024 | | | 199,500 | |
| | 97,644 | | DH Publishing L.P., Term B-5 Loan | 3M US L + 2.50% | 08/21/2023 | | | 98,029 | |
| | 100,000 | | Diamond (BC) B.V. Initial Term Loan | 3M US L + 3.00% | 09/06/2024 | | | 99,835 | |
| | 220,000 | | Diamond (BC) B.V., Initial Euro Term Loan(e) | 3M EUR L + 3.25% | 09/06/2024 | | | 259,978 | |
| | 100,000 | | Digicert Holdings Inc., Second Lien Term Loan(e) | 3M US L + 8.00%, 1.00% Floor | 09/19/2025 | | | 101,104 | |
| | 250,000 | | Digicert Holdings, Inc., First Lien Term Loan(e) | 3M US L + 4.75%, 1.00% Floor | 09/20/2024 | | | 252,812 | |
| | 100,000 | | Element Materials Technology Group US Holdings, Inc., Term B2 Loan | 3M US L + 3.50%, 1.00% Floor | 06/28/2024 | | | 101,063 | |
| | 76,433 | | Emmis Operating Co., Term Loan | 3M US L + 7.00%, 1.00% Floor | 04/18/2019 | | | 74,235 | |
| | 435,375 | | Encompass Digital Media, Inc., First Lien Tranche B Term Loan | 3M US L + 4.50%, 1.00% Floor | 06/06/2021 | | | 416,872 | |
| | 150,000 | | Encompass Digital Media, Inc., Second Lien Tranche B Term Loan | 3M US L + 7.75%, 1.00% Floor | 06/06/2022 | | | 140,250 | |
| | 511,138 | | Envision Healthcare Corp. (fka Emergency Medical Corporation), Initial Term Loan | 3M US L + 3.00%, 0.75% Floor | 12/01/2023 | | | 513,215 | |
See Notes to Financial Statements.
68 | (888) 848-7569 | www.rivernorth.com |
| RiverNorth/Oaktree High Income Fund | Schedule of Investments |
September 30, 2017
| Principal Amount/Description | Rate | Maturity | | Value | |
| $ | 148,875 | | ESH Hospitality, Inc., Repriced Term Loan | 3M US L + 2.50% | 08/30/2023 | | $ | 149,687 | |
| | 99,250 | | Examworks Group Inc. (fka Gold Merger Co., Inc.), Term B-1 Loan | 3M US L + 3.25%, 1.00% Floor | 07/27/2023 | | | 99,970 | |
| | 99,747 | | Explorer Holdings, Inc., Initial Term Loan | 3M US L + 5.00%, 1.00% Floor | 05/02/2023 | | | 100,512 | |
| | 98,750 | | Freedom Mortgage Corp., Initial Term Loan | 3M US L + 5.50%, 1.00% Floor | 02/23/2022 | | | 100,602 | |
| | 163,979 | | GCI Holdings, Term B Loan | 3M US L + 3.00%, 1.00% Floor | 02/02/2022 | | | 164,543 | |
| | 54,451 | | Genoa, a QoL Healthcare Company, LLC, Amendment No.1 First LienTerm Loan | 3M US L + 3.25%, 1.00% Floor | 10/30/2023 | | | 54,826 | |
| | 99,643 | | Go Daddy Operating Co. (GD Finance Co., Inc.), Initial Term Loan | 3M US L + 2.50% | 02/15/2024 | | | 100,060 | |
| | 159,069 | | GOBP Holdings, Inc., First Lien Incremental Term Loan | 3M US L + 3.50%, 1.00% Floor | 10/21/2021 | | | 158,870 | |
| | 238,066 | | Golden Nugget, Inc. (aka Landry's Inc.), Initial Term B Loan(e) | 3M US L + 3.25% | 10/04/2023 | | | 239,604 | |
| | 164,735 | | Greeneden U.S. Holdings I, LLC, Tranche B-2 Dollar Term Loan | 3M US L + 3.75% | 12/01/2023 | | | 166,118 | |
| | 150,000 | | Hanjin International (aka Wilshire Grand Center), Term B Loan(e) | 3M US L + 2.50% | 09/20/2020 | | | 150,375 | |
| | 217,772 | | HD Supply, Inc., Term B-3 Loan | 3M US L + 2.25% | 08/13/2021 | | | 218,963 | |
| | 221,950 | | Hi-Crush Partners LP, Advance Term Loan | 3M US L + 3.75%, 1.00% Floor | 04/28/2021 | | | 218,250 | |
| | 498,708 | | HUB International, Ltd., Initial Term Loan(e) | 3M US L + 3.25%, 1.00% Floor | 10/02/2020 | | | 502,583 | |
| | 150,000 | | Innoviva, Inc., Initial Term Loan | 3M US L + 4.50%, 1.00% Floor | 08/18/2022 | | | 151,875 | |
| | 150,000 | | Intrawest Resort Holdings, Inc., Term B1 Loan | 3M US L + 3.25%, 1.00% Floor | 07/31/2024 | | | 150,985 | |
| | 671,258 | | Jaguar Holding Co. I LLC (fka Jaguar Holding Co. I), Term Loan | 3M US L + 2.75%, 1.00% Floor | 08/18/2022 | | | 675,383 | |
| | 248,750 | | JBS USA Lux S.A. (fka JBS USA LLC), Initial Term Loan | 3M US L + 2.50%, 0.75% Floor | 10/30/2022 | | | 246,159 | |
| | 273,175 | | Lifetime Fitness, Inc., Refinancing Term Loan | 3M US L + 3.00%, 1.00% Floor | 06/10/2022 | | | 274,478 | |
| | 184,075 | | Mallinckrodt International Finance S.A., 2017 Term B Loan | 3M US L + 2.75%, 0.75% Floor | 09/24/2024 | | | 184,242 | |
| | 300,000 | | Mcafee LLC, Term B Loan(e) | 3M US L + 4.50% | 09/27/2024 | | | 301,762 | |
| | 150,000 | | MH Sub I, LLC (Micro Holding Corp.), Amendment No.2 First Lien Initial Term Loan | 3M US L + 3.50% | 09/13/2024 | | | 149,437 | |
| | 162,859 | | Michaels Stores, Inc., New Replacement Term B-1 Loan | 3M US L + 2.75%, 3.00% Floor | 01/30/2023 | | | 162,946 | |
See Notes to Financial Statements.
Annual Report | September 30, 2017 | 69 |
| RiverNorth/Oaktree High Income Fund | Schedule of Investments |
September 30, 2017
| Principal Amount/Description | Rate | Maturity | | Value | |
| $ | 64,350 | | Monitronics International, Inc., Term B-2 Loan | 3M US L + 5.50%, 1.00% Floor | 09/21/2022 | | $ | 64,012 | |
| | 100,000 | | MRC Global (US) Inc., Term B Loan(e) | 3M US L + 3.50%, 1.00% Floor | 09/13/2024 | | | 101,250 | |
| | 200,000 | | Multi-Color Corp., Term B Loan(e) | 3M US L + 2.25% | 09/20/2024 | | | 201,000 | |
| | 144,632 | | Navistar, Inc., Tranche B Term Loan | 3M US L + 4.00%, 1.00% Floor | 08/07/2020 | | | 145,626 | |
| | 335,575 | | Neiman Marcus Group, Inc., Other Term Loan | 3M US L + 3.25%, 1.00% Floor | 10/25/2020 | | | 251,037 | |
| | 250,000 | | NVA Holdings, Inc., First Lien Term B-2 Loan(e) | 3M US L + 3.50%, 1.00% Floor | 08/14/2021 | | | 252,344 | |
| | 99,500 | | Onvoy LLC, First Lien Initial Term Loan | 3M US L + 4.50%, 1.00% Floor | 02/10/2024 | | | 99,531 | |
| | 99,741 | | Optiv, Inc., First Lien Initial Term Loan(e) | 3M US L + 3.25%, 1.00% Floor | 02/01/2024 | | | 93,965 | |
| | 50,000 | | OSG Bulk Ships, Inc. Initial Term Loan | 3M US L + 4.25%, 1.00% Floor | 08/05/2019 | | | 47,687 | |
| | 250,000 | | Playcore Inc., First Lien Term Loan(e) | 3M US L + 3.75%, 1.00% Floor | 09/18/2024 | | | 252,187 | |
| | 199,500 | | Post Holdings, Inc., Series A Incremental Term Loan | 3M US L + 2.25% | 05/24/2024 | | | 200,206 | |
| | 64,675 | | ProAmpac PG Borrower LLC, First Lien Initial Term Loan | 3M US L + 4.00%, 1.00% Floor | 11/20/2023 | | | 65,393 | |
| | 178,650 | | Quikrete Holdings, Inc., First Lien Initial Term Loan | 3M US L + 2.75% | 11/15/2023 | | | 178,853 | |
| | 200,000 | | Ring Container Technologies Group LLC, First Lien Term Loan(e) | 3M US L + 2.75% | 10/31/2024 | | | 200,500 | |
| | 99,197 | | RPI Finance Trust, Initial Term B-6 Loan | 3M US L + 2.00% | 03/27/2023 | | | 99,583 | |
| | 150,000 | | Securus Technologies Holdings, Inc., Term Loan(e) | 3M US L + 4.50%, 1.00% Floor | 06/20/2024 | | | 151,718 | |
| | 250,000 | | Sedgwick Claims Management Services, Inc., Second Lien Term Loan | 3M US L + 5.75%, 1.00% Floor | 02/28/2022 | | | 252,812 | |
| | 173,688 | | Servicemaster Company, LLC, Tranche C Term Loan | 3M US L + 2.50% | 11/08/2023 | | | 174,643 | |
| | 100,000 | | Shutterfly Inc., Delay Draw Term Loan(e) | 3M US L + 2.50% | 08/17/2024 | | | 99,625 | |
| | 115,395 | | SIG Combibloc Holdings SCA (fka Onex Wizard Acquisition Company II SCA), Initial Euro Term Loan | 3M US L + 3.00%, 1.00% Floor | 03/11/2022 | | | 115,972 | |
| | 197,500 | | Solenis International LP, Tranche C Term Loan | 3M EUR L + 4.00%, 1.00% Floor | 07/31/2021 | | | 238,240 | |
| | 270,875 | | Solera LLC, Euro Term Loan | 3M EUR L + 3.00%, 0.75% Floor | 03/03/2023 | | | 324,250 | |
See Notes to Financial Statements.
70 | (888) 848-7569 | www.rivernorth.com |
| RiverNorth/Oaktree High Income Fund | Schedule of Investments |
September 30, 2017
| Principal Amount/Description | Rate | Maturity | | Value | |
| $ | 150,000 | | Staples, Inc., Closing Date Term Loan(e) | 3M US L + 4.00%, 1.00% Floor | 09/12/2024 | | $ | 149,504 | |
| | 99,500 | | Team Health Holdings, Inc., Initial Term Loan | 3M US L + 2.75%, 1.00% Floor | 02/06/2024 | | | 97,884 | |
| | 100,000 | | TMK Hawk Parent, Corp., First Lien Initial Term Loan(e) | 3M US L + 3.50% | 08/28/2024 | | | 100,828 | |
| | 213,538 | | Toys "R" US Property Co. I LLC, Initial Term Loan | 3M US L + 5.00%, 1.00% Floor | 08/21/2019 | | | 202,709 | |
| | 107,785 | | Trans Union LLC, Replacement Term B-3 Loan | 3M US L + 2.00% | 04/10/2023 | | | 107,718 | |
| | 449,053 | | TransDigm, Inc., Tranche E Term Loan | 3M US L + 3.00%, 0.75% Floor | 05/14/2022 | | | 450,661 | |
| | 180,000 | | Traverse Midstream Partners LLC, Advance Term Loan(e) | 3M US L + 4.00%, 1.00% Floor | 09/27/2024 | | | 182,475 | |
| | 200,000 | | Tronox Finance LLC (Tronox Blocked Borrower LLC), Initial Dollar Term Loan(e) | 3M US L + 3.00% | 09/23/2024 | | | 200,979 | |
| | 99,195 | | Univision Communications, 2017 Replacement Term Loan | 3M US L + 2.75%, 1.00% Floor | 03/15/2024 | | | 98,440 | |
| | 150,000 | | UPC Financing Partnership, Facility AP Term Loan | 3M US L + 2.75% | 04/15/2025 | | | 150,645 | |
| | 171,938 | | US Renal Care, Inc., First Lien Initial Term Loan | 3M US L + 4.25%, 1.00% Floor | 12/30/2022 | | | 166,908 | |
| | 149,963 | | Utex Industries, Inc., First Lien Initial Term Loan | 3M US L + 4.00%, 1.00% Floor | 05/21/2021 | | | 135,341 | |
| | 200,000 | | Valeant Pharmaceuticals International, Inc., Series F Tranche B Term Loan(e) | 3M US L + 4.75%, 0.75% Floor | 04/01/2022 | | | 203,791 | |
| | 55,000 | | Vantiv, LLC (aka Fifth Third Processing Solutions, LLC), Term B1 Loan(e) | 3M US L + 2.00% | 10/14/2023 | | | 55,126 | |
| | 195,000 | | Vantiv, LLC (fka Fifth Third Processing Solutions, LLC), Term B Loan(e) | 3M US L + 2.25% | 10/14/2023 | | | 195,447 | |
| | 129,350 | | Veritas US, Inc. Euro Term B Loan | 3M EUR L + 4.50%, 1.00% Floor | 01/27/2023 | | | 154,615 | |
| | 36,907 | | Vestcom Parent Holdings, Inc., L/C Collateralized Loan | 3M US L + 4.25%, 1.00% Floor | 12/19/2023 | | | 37,184 | |
| | 167,180 | | Welbilt, Inc. (fka Manitowoc Foodservice, Inc.), Term B Loan | 3M US L + 3.00%, 1.00% Floor | 03/03/2023 | | | 168,468 | |
| | 257,400 | | Windstream Services LLC (fka Windstream Corp.), Tranche B-6 Term Loan | 3M US L + 4.00%, 0.75% Floor | 03/29/2021 | | | 231,016 | |
| | 150,000 | | Wrangler Buyer Corp. (aka Waste Industries USA, Inc.), Initial Term Loan(e) | 3M US L + 3.00% | 09/27/2024 | | | 150,968 | |
See Notes to Financial Statements.
Annual Report | September 30, 2017 | 71 |
| RiverNorth/Oaktree High Income Fund | Schedule of Investments |
September 30, 2017| Principal Amount/Description | Rate | Maturity | | Value | |
| $ | 134,967 | | York Risk Services Holding Corp., Term Loan | 3M US L + 3.75%, 1.00% Floor | 10/01/2021 | | $ | 133,010 | |
| | | | | | | 20,769,455 | |
| | | | | | | | | | |
| TOTAL BANK LOANS (Cost $33,753,754) | | | | | 34,346,225 | |
| Principal Amount/Description | Rate | Maturity | | | Value | |
| HIGH YIELD DEBT- 24.67% | |
| Canada - 0.86% | |
| $ | 40,000 | | Baytex Energy Corp.(f) | 5.13% | 06/01/2021 | | | 37,500 | |
| | 100,000 | | Cascades, Inc.(f) | 5.50% | 07/15/2022 | | | 104,250 | |
| | 10,000 | | Cascades, Inc.(f) | 5.75% | 07/15/2023 | | | 10,550 | |
| | 20,000 | | First Quantum Minerals, Ltd.(f) | 7.25% | 05/15/2022 | | | 20,675 | |
| | 20,000 | | First Quantum Minerals, Ltd.(f) | 7.25% | 04/01/2023 | | | 20,650 | |
| | 80,000 | | Open Text Corp.(f) | 5.63% | 01/15/2023 | | | 84,200 | |
| | 15,000 | | Open Text Corp.(f) | 5.88% | 06/01/2026 | | | 16,500 | |
| | 20,927 | | Precision Drilling Corp. | 6.63% | 11/15/2020 | | | 21,110 | |
| | 35,000 | | Precision Drilling Corp. | 7.75% | 12/15/2023 | | | 35,875 | |
| | 240,000 | | Valeant Pharmaceuticals International, Inc.(f) | 5.63% | 12/01/2021 | | | 225,600 | |
| | 15,000 | | Valeant Pharmaceuticals International, Inc.(f) | 6.50% | 03/15/2022 | | | 15,863 | |
| | 25,000 | | Valeant Pharmaceuticals International, Inc.(f) | 5.88% | 05/15/2023 | | | 22,156 | |
| | | | | | | 614,929 | |
| Cayman Islands - 0.22% | |
| | 125,000 | | UPCB Finance IV, Ltd.(g) | 4.00% | 01/15/2027 | | | 155,771 | |
| | | | | | | | |
| France - 0.87% | |
| | 110,000 | | Crown European Holdings SA(f) | 2.63% | 09/30/2024 | | | 133,269 | |
| | 290,000 | | Numericable-SFR SAS(g) | 5.63% | 05/15/2024 | | | 371,229 | |
| | 100,000 | | SPCM SA(g) | 2.88% | 06/15/2023 | | | 121,588 | |
| | | | | | | 626,086 | |
| Germany - 0.57% | |
| | 120,000 | | IHO Verwaltungs GmbH(h) | 3.25% | 09/15/2023 | | | 147,729 | |
| | 205,000 | | Unitymedia Hessen GmbH & Co. KG / Unitymedia NRW GmbH(g) | 4.00% | 01/15/2025 | | | 257,244 | |
| | | | | | | 404,973 | |
| Great Britain - 1.03% | |
| | 150,000 | | Arqiva Broadcast Finance PLC(g) | 9.50% | 03/31/2020 | | | 214,045 | |
| | 200,000 | | Inmarsat Finance PLC(f) | 6.50% | 10/01/2024 | | | 216,000 | |
| | 80,000 | | Inovyn Finance PLC(f) | 6.25% | 05/15/2021 | | | 98,337 | |
| | 130,000 | | Synlab Bondco PLC(f) | 6.25% | 07/01/2022 | | | 164,053 | |
See Notes to Financial Statements.
| 72 | (888) 848-7569 | www.rivernorth.com |
| RiverNorth/Oaktree High Income Fund | Schedule of Investments |
September 30, 2017| Principal Amount/Description | Rate | Maturity | | Value | |
| $ | 45,000 | | Tronox Finance PLC(f) | 5.75% | 10/01/2025 | | $ | 46,237 | |
| | | | | | | 738,672 | |
| Ireland - 1.02% | |
| | 90,000 | | Ardagh Packaging Finance PLC / Ardagh Holdings USA, Inc.(f) | 4.63% | 05/15/2023 | | | 92,786 | |
| | 130,000 | | Ardagh Packaging Finance PLC / Ardagh Holdings USA, Inc.(f) | 4.75% | 07/15/2027 | | | 176,054 | |
| | 35,000 | | Endo Dac / Endo Finance LLC / Endo Finco, Inc.(f) | 6.00% | 07/15/2023 | | | 29,050 | |
| | 30,000 | | Park Aerospace Holdings, Ltd.(f) | 4.50% | 03/15/2023 | | | 30,033 | |
| | 55,000 | | Park Aerospace Holdings, Ltd.(f) | 5.50% | 02/15/2024 | | | 57,888 | |
| | 250,000 | | Virgin Media Receivables Financing Notes I DAC(g) | 5.50% | 09/15/2024 | | | 344,001 | |
| | | | | | | 729,812 | |
| Italy - 0.20% | |
| | 110,000 | | LKQ Italia Bondco SpA(f) | 3.88% | 04/01/2024 | | | 143,247 | |
| | | | | | | | |
| Jersey - 0.83% | |
| | 150,000 | | AA Bond Co., Ltd.(f) | 5.50% | 07/31/2022 | | | 207,910 | |
| | 100,000 | | CPUK Finance, Ltd.(f) | 4.88% | 08/28/2025 | | | 136,630 | |
| | 100,000 | | LHC3 PLC(f)(h) | 4.13%(9.00%) | 08/15/2024 | | | 120,417 | |
| | 100,000 | | Lincoln Finance, Ltd.(f) | 6.88% | 04/15/2021 | | | 125,702 | |
| | | | | | | 590,659 | |
| Luxembourg - 1.65% | |
| | 105,000 | | Altice Luxembourg SA(g) | 6.25% | 02/15/2025 | | | 134,924 | |
| | 90,000 | | ArcelorMittal | 6.13% | 06/01/2025 | | | 103,950 | |
| | 150,000 | | Ard Finance Sa Argid | 6.58% | 09/15/2023 | | | 189,474 | |
| | 90,000 | | Dana Financing Luxembourg Sarl(f) | 5.75% | 04/15/2025 | | | 95,175 | |
| | 125,000 | | Hanesbrands Finance Luxembourg SCA(f) | 3.50% | 06/15/2024 | | | 158,980 | |
| | 80,000 | | Intelsat Jackson Holdings SA(f) | 8.00% | 02/15/2024 | | | 86,200 | |
| | 35,000 | | Telecom Italia Capital SA | 6.38% | 11/15/2033 | | | 40,469 | |
| | 100,000 | | Telenet Finance VI Luxembourg SCA(g) | 4.88% | 07/15/2027 | | | 130,409 | |
| | 230,000 | | Wind Acquisition Finance SA(f) | 7.38% | 04/23/2021 | | | 239,344 | |
| | | | | | | 1,178,925 | |
| Netherlands - 0.31% | |
| | 175,000 | | Ziggo Bond Finance BV(g) | 4.63% | 01/15/2025 | | | 219,563 | |
| | | | | | | | |
| Spain - 0.23% | |
| | 135,000 | | Grifols SA(f) | 3.20% | 05/01/2025 | | | 162,708 | |
| | | | | | | | |
| Sweden - 0.17% | |
| | 105,000 | | Intrum Justitia AB(g) | 3.13% | 07/15/2024 | | | 125,553 | |
See Notes to Financial Statements.
| Annual Report | September 30, 2017 | 73 |
| RiverNorth/Oaktree High Income Fund | Schedule of Investments |
September 30, 2017| Principal Amount/Description | Rate | Maturity | | Value | |
| United States - 16.71% | |
| $ | 65,000 | | Acadia Healthcare Co., Inc. | 5.13% | 07/01/2022 | | $ | 67,626 | |
| | 70,000 | | Acadia Healthcare Co., Inc. | 5.63% | 02/15/2023 | | | 73,850 | |
| | 10,000 | | Acadia Healthcare Co., Inc. | 6.50% | 03/01/2024 | | | 10,787 | |
| | 45,000 | | ACCO Brands Corp.(f) | 5.25% | 12/15/2024 | | | 46,800 | |
| | 55,000 | | AECOM | 5.75% | 10/15/2022 | | | 57,585 | |
| | 70,000 | | AES Corp. | 6.00% | 05/15/2026 | | | 75,600 | |
| | 35,000 | | AES Corp. | 5.13% | 09/01/2027 | | | 35,962 | |
| | 45,000 | | Albertsons Cos. LLC / Safeway, Inc. / New Albertson's, Inc. / Albertson's LLC | 6.63% | 06/15/2024 | | | 42,131 | |
| | 65,000 | | Albertsons Cos. LLC / Safeway, Inc. / New Albertson's, Inc. / Albertson's LLC | 5.75% | 03/15/2025 | | | 57,525 | |
| | 80,000 | | AmeriGas Partners LP / AmeriGas Finance Corp. | 5.63% | 05/20/2024 | | | 84,700 | |
| | 30,000 | | AmeriGas Partners LP / AmeriGas Finance Corp. | 5.50% | 05/20/2025 | | | 30,975 | |
| | 65,000 | | Amsurg Corp. | 5.63% | 07/15/2022 | | | 68,006 | |
| | 20,000 | | Antero Resources Corp. | 5.38% | 11/01/2021 | | | 20,600 | |
| | 10,000 | | Antero Resources Corp. | 5.13% | 12/01/2022 | | | 10,275 | |
| | 20,000 | | Antero Resources Corp. | 5.63% | 06/01/2023 | | | 20,950 | |
| | 55,000 | | Apex Tool Group LLC(f) | 7.00% | 02/01/2021 | | | 51,150 | |
| | 55,000 | | Ascent Resources Utica Holdings LLC / ARU Finance Corp.(f) | 10.00% | 04/01/2022 | | | 59,262 | |
| | 10,000 | | Ashtead Capital, Inc.(f) | 5.63% | 10/01/2024 | | | 10,800 | |
| | 20,000 | | Ashtead Capital, Inc.(f) | 4.38% | 08/15/2027 | | | 20,625 | |
| | 115,000 | | Axalta Coating Systems(g) | 4.25% | 08/15/2024 | | | 145,383 | |
| | 5,000 | | B&G Foods, Inc. | 4.63% | 06/01/2021 | | | 5,106 | |
| | 45,000 | | B&G Foods, Inc. | 5.25% | 04/01/2025 | | | 46,013 | |
| | 30,000 | | Booz Allen Hamilton, Inc.(f) | 5.13% | 05/01/2025 | | | 30,375 | |
| | 85,000 | | Boyd Gaming Corp. | 6.38% | 04/01/2026 | | | 92,969 | |
| | 25,000 | | Building Materials Corp. of America(f) | 5.38% | 11/15/2024 | | | 26,695 | |
| | 55,000 | | Carrizo Oil & Gas, Inc. | 6.25% | 04/15/2023 | | | 56,100 | |
| | 45,000 | | CCO Holdings LLC / CCO Holdings Capital Corp.(f) | 5.13% | 05/01/2023 | | | 46,968 | |
| | 25,000 | | CCO Holdings LLC / CCO Holdings Capital Corp.(f) | 5.88% | 04/01/2024 | | | 26,594 | |
| | 65,000 | | CCO Holdings LLC / CCO Holdings Capital Corp.(f) | 5.00% | 02/01/2028 | | | 65,325 | |
| | 25,000 | | Centene Corp. | 6.13% | 02/15/2024 | | | 27,094 | |
| | 65,000 | | CenturyLink, Inc. | 5.63% | 04/01/2025 | | | 62,481 | |
| | 80,000 | | Change Healthcare Holdings LLC / Change Healthcare Finance, Inc.(f) | 5.75% | 03/01/2025 | | | 81,800 | |
| | 40,000 | | Chemours Co. | 5.38% | 05/15/2027 | | | 41,700 | |
| | 60,000 | | Cheniere Corpus Christi Holdings LLC | 7.00% | 06/30/2024 | | | 68,475 | |
See Notes to Financial Statements.
| 74 | (888) 848-7569 | www.rivernorth.com |
| RiverNorth/Oaktree High Income Fund | Schedule of Investments |
September 30, 2017 | Principal Amount/Description | Rate | Maturity | | Value | |
| $ | 10,000 | | Cheniere Corpus Christi Holdings LLC(f) | 5.13% | 06/30/2027 | | $ | 10,350 | |
| | 50,000 | | Chesapeake Energy Corp. | 5.38% | 06/15/2021 | | | 47,875 | |
| | 65,000 | | Chesapeake Energy Corp.(f) | 8.00% | 01/15/2025 | | | 65,812 | |
| | 20,000 | | CHS/Community Health Systems, Inc. | 5.13% | 08/01/2021 | | | 19,800 | |
| | 105,000 | | CHS/Community Health Systems, Inc. | 6.88% | 02/01/2022 | | | 82,819 | |
| | 65,000 | | CHS/Community Health Systems, Inc. | 6.25% | 03/31/2023 | | | 64,431 | |
| | 190,000 | | CITGO Petroleum Corp.(f) | 6.25% | 08/15/2022 | | | 196,650 | |
| | 65,000 | | CommScope Technologies LLC(f) | 5.00% | 03/15/2027 | | | 65,325 | |
| | 45,000 | | CommScope, Inc.(f) | 5.50% | 06/15/2024 | | | 47,250 | |
| | 10,000 | | CoreCivic, Inc. | 5.00% | 10/15/2022 | | | 10,450 | |
| | 60,000 | | CoreCivic, Inc. | 4.63% | 05/01/2023 | | | 61,650 | |
| | 100,000 | | Cott Corp.(g) | 5.50% | 07/01/2024 | | | 129,935 | |
| | 95,000 | | Covanta Holding Corp. | 6.38% | 10/01/2022 | | | 97,850 | |
| | 10,000 | | Covanta Holding Corp. | 5.88% | 07/01/2025 | | | 9,862 | |
| | 115,000 | | CSC Holdings LLC(f) | 5.50% | 04/15/2027 | | | 119,887 | |
| | 75,000 | | DaVita HealthCare Partners, Inc. | 5.13% | 07/15/2024 | | | 74,812 | |
| | 5,000 | | DaVita HealthCare Partners, Inc. | 5.00% | 05/01/2025 | | | 4,944 | |
| | 85,000 | | DBP Holding Corp.(f) | 7.75% | 10/15/2020 | | | 46,325 | |
| | 25,000 | | Denbury Resources, Inc.(f) | 9.00% | 05/15/2021 | | | 24,531 | |
| | 100,000 | | Diamond BC BV(f) | 5.63% | 08/15/2025 | | | 120,345 | |
| | 35,000 | | DISH DBS Corp. | 5.88% | 07/15/2022 | | | 37,275 | |
| | 5,000 | | DISH DBS Corp. | 5.88% | 11/15/2024 | | | 5,257 | |
| | 35,000 | | DISH DBS Corp. | 7.75% | 07/01/2026 | | | 40,250 | |
| | 45,000 | | DISH DBS Corp. | 5.00% | 03/15/2023 | | | 46,322 | |
| | 55,000 | | Dynegy, Inc. | 6.75% | 11/01/2019 | | | 57,062 | |
| | 85,000 | | Eldorado Resorts, Inc. | 6.00% | 04/01/2025 | | | 89,692 | |
| | 50,000 | | Endo Finance LLC(f) | 5.75% | 01/15/2022 | | | 44,125 | |
| | 80,000 | | Energizer SpinCo, Inc.(f) | 5.50% | 06/15/2025 | | | 84,400 | |
| | 5,000 | | Energy Transfer Equity LP | 5.88% | 01/15/2024 | | | 5,394 | |
| | 70,000 | | EnerSys(f) | 5.00% | 04/30/2023 | | | 73,062 | |
| | 70,000 | | Envision Healthcare Corp.(f) | 5.13% | 07/01/2022 | | | 72,975 | |
| | 90,000 | | ESH Hospitality, Inc.(f) | 5.25% | 05/01/2025 | | | 93,262 | |
| | 50,000 | | Extraction Oil & Gas, Inc.(f) | 7.38% | 05/15/2024 | | | 52,250 | |
| | 20,000 | | FBM Finance, Inc.(f) | 8.25% | 08/15/2021 | | | 21,500 | |
| | 45,000 | | First Data Corp.(f) | 7.00% | 12/01/2023 | | | 48,163 | |
| | 185,000 | | First Data Corp.(f) | 5.75% | 01/15/2024 | | | 194,250 | |
| | 80,000 | | First Quality Finance Co., Inc.(f) | 4.63% | 05/15/2021 | | | 81,224 | |
| | 10,000 | | First Quality Finance Co., Inc.(f) | 5.00% | 07/01/2025 | | | 10,337 | |
| | 25,000 | | Flex Acquisition Co., Inc.(f) | 6.88% | 01/15/2025 | | | 26,000 | |
| | 85,000 | | Flexi-Van Leasing, Inc.(f) | 7.88% | 08/15/2018 | | | 85,425 | |
| | 120,000 | | Frontier Communications Corp. | 6.88% | 01/15/2025 | | | 90,300 | |
| | 40,000 | | Gates Global LLC / Gates Global Co.(f) | 6.00% | 07/15/2022 | | | 41,300 | |
| | 70,000 | | GEO Group, Inc. | 5.13% | 04/01/2023 | | | 71,225 | |
| | 35,000 | | GLP Capital LP / GLP Financing II, Inc. | 5.38% | 04/15/2026 | | | 38,281 | |
See Notes to Financial Statements.
| Annual Report | September 30, 2017 | 75 |
| RiverNorth/Oaktree High Income Fund | Schedule of Investments |
September 30, 2017 | Principal Amount/Description | Rate | Maturity | | Value | |
| $ | 50,000 | | Grinding Media, Inc. / MC Grinding Media Canada, Inc.(f) | 7.38% | 12/15/2023 | | $ | 54,375 | |
| | 70,000 | | Gulfport Energy Corp. | 6.63% | 05/01/2023 | | | 71,225 | |
| | 80,000 | | H&E Equipment Services, Inc.(f) | 5.63% | 09/01/2025 | | | 84,600 | |
| | 135,000 | | HCA Healthcare, Inc. | 6.25% | 02/15/2021 | | | 146,475 | |
| | 10,000 | | HCA, Inc. | 5.25% | 06/15/2026 | | | 10,800 | |
| | 110,000 | | HCA, Inc. | 5.88% | 05/01/2023 | | | 119,900 | |
| | 100,000 | | HD Supply, Inc.(f) | 5.75% | 04/15/2024 | | | 107,250 | |
| | 5,000 | | HealthSouth Corp. | 5.13% | 03/15/2023 | | | 5,192 | |
| | 80,000 | | HealthSouth Corp. | 5.75% | 11/01/2024 | | | 82,310 | |
| | 45,000 | | HUB International, Ltd.(f) | 7.88% | 10/01/2021 | | | 46,912 | |
| | 220,000 | | IMS Health, Inc.(f) | 4.13% | 04/01/2023 | | | 273,567 | |
| | 110,000 | | Ingles Markets, Inc. | 5.75% | 06/15/2023 | | | 108,075 | |
| | 50,000 | | Intrepid Aviation Group Holdings LLC / Intrepid Finance Co.(f) | 6.88% | 02/15/2019 | | | 49,313 | |
| | 65,000 | | Iron Mountain Inc.(f) | 4.88% | 09/15/2027 | | | 66,544 | |
| | 100,000 | | Iron Mountain, Inc.(f) | 3.00% | 01/15/2025 | | | 119,747 | |
| | 60,000 | | Jaguar Holding Co. II / Pharmaceutical Product Development LLC(f) | 6.38% | 08/01/2023 | | | 62,925 | |
| | 10,000 | | JBS USA LUX SA / JBS USA Finance, Inc.(f) | 8.25% | 02/01/2020 | | | 10,150 | |
| | 70,000 | | JBS USA LUX SA / JBS USA Finance, Inc.(f) | 7.25% | 06/01/2021 | | | 71,750 | |
| | 85,000 | | Kennedy-Wilson, Inc. | 5.88% | 04/01/2024 | | | 87,869 | |
| | 55,000 | | KFC Holding Co./Pizza Hut Holdings LLC/Taco Bell of America LLC(f) | 5.00% | 06/01/2024 | | | 58,094 | |
| | 50,000 | | Kraton Polymers LLC / Kraton Polymers Capital Corp.(f) | 7.00% | 04/15/2025 | | | 53,875 | |
| | 55,000 | | Lamar Media Corp. | 5.75% | 02/01/2026 | | | 59,881 | |
| | 70,000 | | Landry's, Inc.(f) | 6.75% | 10/15/2024 | | | 70,963 | |
| | 5,000 | | Laredo Petroleum, Inc. | 5.63% | 01/15/2022 | | | 5,063 | |
| | 45,000 | | Laredo Petroleum, Inc. | 6.25% | 03/15/2023 | | | 46,575 | |
| | 80,000 | | Level 3 Financing, Inc. | 5.13% | 05/01/2023 | | | 81,550 | |
| | 20,000 | | Level 3 Financing, Inc. | 5.38% | 01/15/2024 | | | 20,525 | |
| | 100,000 | | Levi Strauss & Co. | 3.38% | 03/15/2027 | | | 121,723 | |
| | 30,000 | | LifePoint Health, Inc. | 5.88% | 12/01/2023 | | | 31,809 | |
| | 75,000 | | LifePoint Health, Inc. | 5.38% | 05/01/2024 | | | 78,188 | |
| | 55,000 | | Masonite International Corp.(f) | 5.63% | 03/15/2023 | | | 57,835 | |
| | 55,000 | | MGM Growth Properties Operating Partnership LP / MGP Finance Co.-Issuer, Inc. | 5.63% | 05/01/2024 | | | 59,872 | |
| | 70,000 | | MPT Operating Partnership LP / MPT Finance Corp. | 6.38% | 03/01/2024 | | | 75,863 | |
| | 95,000 | | Neiman Marcus Group, Ltd. LLC(f)(h) | 8.75% (9.50%) | 10/15/2021 | | | 45,125 | |
| | 65,000 | | Nielsen Finance LLC / Nielsen Finance Co.(f) | 5.00% | 04/15/2022 | | | 67,519 | |
See Notes to Financial Statements.
| 76 | (888) 848-7569 | www.rivernorth.com |
| RiverNorth/Oaktree High Income Fund | Schedule of Investments |
September 30, 2017 | Principal Amount/Description | Rate | Maturity | | Value | |
| $ | 35,000 | | Novelis Corp.(f) | 6.25% | 08/15/2024 | | $ | 36,582 | |
| | 40,000 | | Novelis Corp.(f) | 5.88% | 09/30/2026 | | | 40,700 | |
| | 40,000 | | NRG Energy, Inc. | 6.63% | 03/15/2023 | | | 41,450 | |
| | 85,000 | | NRG Yield Operating LLC | 5.00% | 09/15/2026 | | | 88,825 | |
| | 70,000 | | Oasis Petroleum, Inc. | 6.88% | 03/15/2022 | | | 71,575 | |
| | 20,000 | | Oasis Petroleum, Inc. | 6.88% | 01/15/2023 | | | 20,400 | |
| | 60,000 | | Olin Corp. | 5.13% | 09/15/2027 | | | 62,850 | |
| | 95,000 | | Party City Holdings, Inc.(f) | 6.13% | 08/15/2023 | | | 99,275 | |
| | 60,000 | | Performance Food Group, Inc.(f) | 5.50% | 06/01/2024 | | | 62,100 | |
| | 65,000 | | Petsmart, Inc.(f) | 7.13% | 03/15/2023 | | | 50,882 | |
| | 60,000 | | PetSmart, Inc.(f) | 5.88% | 06/01/2025 | | | 52,650 | |
| | 25,000 | | PetSmart, Inc.(f) | 8.88% | 06/01/2025 | | | 19,906 | |
| | 65,000 | | PHI, Inc. | 5.25% | 03/15/2019 | | | 63,375 | |
| | 40,000 | | Pilgrim's Pride Corp.(f) | 5.75% | 03/15/2025 | | | 41,400 | |
| | 95,000 | | Plantronics, Inc.(f) | 5.50% | 05/31/2023 | | | 98,800 | |
| | 85,000 | | Plastipak Holdings, Inc.(f) | 6.50% | 10/01/2021 | | | 87,928 | |
| | 50,000 | | Post Holdings, Inc.(f) | 6.00% | 12/15/2022 | | | 52,563 | |
| | 20,000 | | Post Holdings, Inc.(f) | 5.50% | 03/01/2025 | | | 20,800 | |
| | 40,000 | | Post Holdings, Inc.(f) | 5.00% | 08/15/2026 | | | 40,025 | |
| | 80,000 | | Prestige Brands, Inc.(f) | 5.38% | 12/15/2021 | | | 82,700 | |
| | 100,000 | | PSPC Escrow Corp.(g) | 6.00% | 02/01/2023 | | | 124,517 | |
| | 15,000 | | Quicken Loans, Inc.(f) | 5.75% | 05/01/2025 | | | 15,825 | |
| | 30,000 | | Range Resources Corp.(f) | 5.00% | 08/15/2022 | | | 30,113 | |
| | 20,000 | | Range Resources Corp. | 4.88% | 05/15/2025 | | | 19,800 | |
| | 25,000 | | Rent-A-Center, Inc. | 6.63% | 11/15/2020 | | | 23,625 | |
| | 45,000 | | Rent-A-Center, Inc. | 4.75% | 05/01/2021 | | | 40,950 | |
| | 40,000 | | Reynolds Group Issuer, Inc. / Reynolds Group Issuer LLC(f) | 5.13% | 07/15/2023 | | | 41,794 | |
| | 35,000 | | Reynolds Group Issuer, Inc. / Reynolds Group Issuer LLC(f) | 7.00% | 07/15/2024 | | | 37,341 | |
| | 85,000 | | Reynolds Group Issuer, Inc. / Reynolds Group Issuer LLC | 5.75% | 10/15/2020 | | | 86,598 | |
| | 70,000 | | RHP Hotel Properties LP / RHP Finance Corp. | 5.00% | 04/15/2023 | | | 72,800 | |
| | 95,000 | | Rite Aid Corp.(f) | 6.13% | 04/01/2023 | | | 92,744 | |
| | 100,000 | | SBA Communications Corp. | 4.88% | 09/01/2024 | | | 103,125 | |
| | 95,000 | | Scientific Games International, Inc.(f) | 7.00% | 01/01/2022 | | | 101,056 | |
| | 15,000 | | SESI LLC | 7.13% | 12/15/2021 | | | 15,375 | |
| | 50,000 | | SESI LLC(f) | 7.75% | 09/15/2024 | | | 51,875 | |
| | 150,000 | | Silgan Holdings, Inc.(f) | 3.25% | 03/15/2025 | | | 182,426 | |
| | 70,000 | | Sirius XM Radio, Inc.(f) | 5.00% | 08/01/2027 | | | 71,750 | |
| | 85,000 | | Six Flags Entertainment Corp.(f) | 4.88% | 07/31/2024 | | | 86,700 | |
| | 20,000 | | SM Energy Co. | 6.13% | 11/15/2022 | | | 20,150 | |
| | 10,000 | | SM Energy Co. | 5.00% | 01/15/2024 | | | 9,475 | |
| | 10,000 | | SM Energy Co. | 5.63% | 06/01/2025 | | | 9,550 | |
See Notes to Financial Statements.
| Annual Report | September 30, 2017 | 77 |
| RiverNorth/Oaktree High Income Fund | Schedule of Investments |
September 30, 2017 | Principal Amount/Description | Rate | Maturity | | Value | |
| $ | 10,000 | | SM Energy Co. | 6.75% | 09/15/2026 | | $ | 10,050 | |
| | 35,000 | | Sonic Automotive, Inc. | 6.13% | 03/15/2027 | | | 36,050 | |
| | 70,000 | | Southwestern Energy Co. | 7.50% | 04/01/2026 | | | 72,800 | |
| | 100,000 | | Sprint Communications, Inc. | 6.00% | 11/15/2022 | | | 107,970 | |
| | 225,000 | | Sprint Corp. | 7.25% | 09/15/2021 | | | 250,594 | |
| | 65,000 | | SS&C Technologies Holdings, Inc. | 5.88% | 07/15/2023 | | | 68,928 | |
| | 35,000 | | Standard Industries, Inc.(f) | 5.50% | 02/15/2023 | | | 37,144 | |
| | 90,000 | | Standard Industries, Inc.(f) | 6.00% | 10/15/2025 | | | 98,636 | |
| | 70,000 | | Suburban Propane Partners LP/Suburban Energy Finance Corp. | 5.88% | 03/01/2027 | | | 69,650 | |
| | 115,000 | | Summit Materials LLC / Summit Materials Finance Corp. | 6.13% | 07/15/2023 | | | 121,900 | |
| | 85,000 | | SunCoke Energy Partners LP / SunCoke Energy Partners Finance Corp.(f) | 7.50% | 06/15/2025 | | | 88,188 | |
| | 65,000 | | Targa Resources Partners LP / Targa Resources Partners Finance Corp. | 6.75% | 03/15/2024 | | | 70,850 | |
| | 25,000 | | Targa Resources Partners LP / Targa Resources Partners Finance Corp. | 5.13% | 02/01/2025 | | | 25,836 | |
| | 10,000 | | Tempur Sealy International, Inc. | 5.63% | 10/15/2023 | | | 10,563 | |
| | 95,000 | | Tempur Sealy International, Inc. | 5.50% | 06/15/2026 | | | 97,375 | |
| | 65,000 | | Tenet Healthcare Corp.(f) | 7.50% | 01/01/2022 | | | 68,981 | |
| | 45,000 | | Tenet Healthcare Corp. | 6.75% | 06/15/2023 | | | 43,256 | |
| | 115,000 | | Tenet Healthcare Corp.(f) | 5.13% | 05/01/2025 | | | 113,707 | |
| | 50,000 | | Tenneco, Inc. | 5.38% | 12/15/2024 | | | 52,750 | |
| | 65,000 | | TerraForm Power Operating LLC(f)(i) | 6.38% | 02/01/2023 | | | 67,925 | |
| | 25,000 | | T-Mobile USA, Inc. | 6.00% | 03/01/2023 | | | 26,406 | |
| | 85,000 | | T-Mobile USA, Inc. | 6.00% | 04/15/2024 | | | 90,419 | |
| | 55,000 | | TMS International Corp.(f) | 7.25% | 08/15/2025 | | | 56,375 | |
| | 55,000 | | TransDigm, Inc. | 6.50% | 05/15/2025 | | | 56,788 | |
| | 55,000 | | TreeHouse Foods, Inc.(f) | 6.00% | 02/15/2024 | | | 59,056 | |
| | 55,000 | | TriMas Corp.(f) | 4.88% | 10/15/2025 | | | 55,550 | |
| | 80,000 | | Tronox Finance LLC(f) | 7.50% | 03/15/2022 | | | 84,700 | |
| | 15,000 | | Ultra Resources, Inc.(f) | 6.88% | 04/15/2022 | | | 15,319 | |
| | 80,000 | | United Rentals North America, Inc. | 5.50% | 07/15/2025 | | | 86,196 | |
| | 40,000 | | United Rentals North America, Inc. | 5.88% | 09/15/2026 | | | 43,600 | |
| | 110,000 | | Univision Communications, Inc.(f) | 5.13% | 05/15/2023 | | | 112,475 | |
| | 10,000 | | USG Corp.(f) | 5.50% | 03/01/2025 | | | 10,738 | |
| | 55,000 | | ViaSat, Inc.(f) | 5.63% | 09/15/2025 | | | 55,622 | |
| | 60,000 | | Walter Investment Management Corp. | 7.88% | 12/15/2021 | | | 32,100 | |
| | 100,000 | | Watco Cos. LLC / Watco Finance Corp.(f) | 6.38% | 04/01/2023 | | | 104,250 | |
| | 40,000 | | Weatherford International, Ltd. | 7.75% | 06/15/2021 | | | 41,750 | |
| | 5,000 | | Weatherford International, Ltd. | 4.50% | 04/15/2022 | | | 4,675 | |
See Notes to Financial Statements.
| 78 | (888) 848-7569 | www.rivernorth.com |
| RiverNorth/Oaktree High Income Fund | Schedule of Investments |
September 30, 2017 | Principal Amount/Description | Rate | Maturity | | Value | |
| $ | 5,000 | | Weatherford International, Ltd. | 8.25% | 06/15/2023 | | $ | 5,163 | |
| | 120,000 | | WMG Acquisition Corp.(f) | 4.13% | 11/01/2024 | | | 150,781 | |
| | 70,000 | | Wynn Las Vegas LLC / Wynn Las Vegas Capital Corp.(f) | 5.25% | 05/15/2027 | | | 71,399 | |
| | | | | | | 11,940,850 | |
| | | | | | | | | | |
TOTAL HIGH YIELD DEBT (Cost $17,063,818) | | | | | 17,631,748 | |
| Shares/Description | | | | | Value | |
| SHORT-TERM INVESTMENTS - 21.05% | |
| | 15,043,307 | | State Street Institutional Trust (7 Day Yield 0.92%) | | | 15,043,307 | |
| | | | | | | | | | |
TOTAL SHORT-TERM INVESTMENTS (Cost $15,043,307) | | | | | 15,043,307 | |
| | | | | | | | |
TOTAL INVESTMENTS - 108.21% (Cost $76,232,414) | | | | | 77,345,412 | |
CASH SEGREGATED AT CUSTODIAN FOR FORWARD FOREIGN CURRENCY CONTRACTS AND TOTAL RETURN SWAP CONTRACTS - 0.49% | | | 352,000 | |
| LIABILITIES IN EXCESS OF OTHER ASSETS - (8.70)% | | | (6,220,992 | ) |
| NET ASSETS - 100.00% | | | $ | 71,476,420 | |
| Investment Abbreviations: |
| LIBOR - London Interbank Offered Rate |
| Libor Rates: |
| 3M US L - 3 Month LIBOR as of September 30, 2017 was 1.33% |
| 3M EUR L - 3 Month EURIBOR as of September 30, 2017 was -0.38% |
(a) | Non‐income producing security. |
(b) | Security determined to be illiquid under the procedures approved by the Fund’s Board of Trustees. Total fair value of the security is $75,000, which represents approximately 0.10% of net assets as of September 30, 2017. |
(c) | The level 3 assets were a result of unavailable quoted prices from an active market or the unavailability of other significant observable inputs. |
(d) | Variable rate investment. Interest rates reset periodically. Interest rate shown reflects the rate in effect at September 30, 2017. For securities based on a published reference rate and spread, the reference rate and spread are indicated the description above. Certain variable rate securities are not based on a published reference rate and spread but are determined by the issuer or agent and are based on current market conditions. These securities do not indicate a reference rate and spread in their description above. |
See Notes to Financial Statements.
| Annual Report | September 30, 2017 | 79 |
| RiverNorth/Oaktree High Income Fund | Schedule of Investments |
September 30, 2017
(e) | All or a portion of this position has not settled as of September 30, 2017. The interest rate shown represents the stated spread over the London Interbank Offered Rate ("LIBOR" or "L") or the Euro Interbank Offered Rate ("EURIBOR" or "E") or the applicable LIBOR/EURIBOR floor; the Fund will not accrue interest until the settlement date, at which point LIBOR/EURIBOR will be established. |
(f) | Security exempt from registration under Rule 144A of the Securities Act of 1933. These securities have been deemed liquid under procedures approved by the Fund's Board of Trustees and may normally be sold to qualified institutional buyers in transactions exempt from registration. Total fair value of Rule 144A securities amounts to $9,218,431, which represents approximately 12.90% of net assets as of September 30, 2017. |
(g) | Securities were purchased pursuant to Regulation S under the Securities Act of 1933, which exempts securities offered and sold outside of the United States from registration. Such securities cannot be sold in the United States without either an effective registration statement filed pursuant to the Securities Act of 1933, or pursuant to an exemption from registration. These securities have been deemed liquid under procedures approved by the Fund's Board of Trustees. As of September 30, 2017, the aggregate fair value of those securities was $2,474,161, representing 3.46% of net assets. |
(h) | Pay‐in‐kind securities ‐ Rate paid in‐kind is shown in parenthesis. |
(i) | Step bond. Coupon changes periodically based upon a predetermined schedule. Interest rate disclosed is that which is in effect at September 30, 2017. |
OUTSTANDING FORWARD FOREIGN CURRENCY CONTRACTS
| Counterparty | Foreign Currency | | Contracted Amount* | | Contract Type | Settlement Date | | Current Value | | | Unrealized Appreciation/(Depreciation) | |
| State Street Boston | GBP | | | 391,325 | | Purchase | 10/06/2017 | | $ | 524,428 | | | $ | 4,925 | |
| State Street Boston | EUR | | | 13,441,907 | | Sale | 10/06/2017 | | | 15,889,618 | | | | 129,802 | |
| | | | | | | | | | | | | | $ | 134,727 | |
| State Street Boston | EUR | | | 1,625,221 | | Purchase | 10/06/2017 | | $ | 1,921,167 | | | $ | (24,496 | ) |
| State Street Boston | GBP | | | 2,690,050 | | Sale | 10/06/2017 | | | 3,605,033 | | | | (111,488 | ) |
| | | | | | | | | | | | | | $ | (135,985 | ) |
* | The contracted amount is stated in the currency in which the security is denominated. |
See Notes to Financial Statements.
| 80 | (888) 848-7569 | www.rivernorth.com |
RiverNorth Core Opportunity Fund
| Statement of Assets and Liabilities | September 30, 2017 |
| ASSETS: | | | |
| Investment in securities: | | | |
| At cost | | $ | 290,393,199 | |
| At value | | $ | 323,006,659 | |
| Receivable for fund investments sold | | | 726,478 | |
| Cash segregated at custodian for total return swap contracts | | | 400,000 | |
| Dividends receivable | | | 347,022 | |
| Receivable for fund shares sold | | | 120,150 | |
| Interest receivable | | | 40,981 | |
| Prepaid expenses and other assets | | | 18,776 | |
| Total Assets | | | 324,660,066 | |
| | | | | |
| LIABILITIES: | | | | |
| Facility loan fee payable | | | 7,743 | |
| Payable for fund investments purchased | | | 769,833 | |
| Payable for fund shares redeemed | | | 130,829 | |
| Payable to Adviser | | | 266,409 | |
| Payable for Fund Accounting and Administration fees | | | 18,638 | |
| Accrued 12b-1 fees - Class R Shares | | | 43,734 | |
| Payable for Custodian fees | | | 4,210 | |
| Payable for Audit fees | | | 21,963 | |
| Payable to Transfer agency | | | 8,448 | |
| Payable to Trustees and Officers | | | 2,532 | |
| Other accrued expenses | | | 21,714 | |
| Total Liabilities | | | 1,296,053 | |
| Net Assets | | $ | 323,364,013 | |
| | | | | |
| NET ASSETS CONSIST OF: | | | | |
| Paid-in capital | | $ | 255,061,527 | |
| Accumulated net investment loss | | | (242,114 | ) |
| Accumulated undistributed net realized gain/(loss) | | | 35,931,140 | |
| Net unrealized appreciation/(depreciation) | | | 32,613,460 | |
| Net Assets | | $ | 323,364,013 | |
See Notes to Financial Statements.
| Annual Report | September 30, 2017 | 81 |
RiverNorth Core Opportunity Fund
| Statement of Assets and Liabilities | September 30, 2017 |
| PRICING OF SHARES: | | | | |
| Class I Shares | | | | |
| Net Assets | | $ | 109,627,020 | |
| Shares of beneficial interest outstanding (unlimited number of shares, no par value) | | | 8,863,942 | |
| Net Asset Value Per Share, Offering and Redemption Price Per Share | | $ | 12.37 | |
Minimum Redemption Price Per Share(a) | | $ | 12.12 | |
| Class R Shares | | | | |
| Net Assets | | $ | 213,736,993 | |
| Shares of beneficial interest outstanding (unlimited number of shares, no par value) | | | 17,278,126 | |
| Net Asset Value Per Share, Offering and Redemption Price Per Share | | $ | 12.37 | |
Minimum Redemption Price Per Share(a) | | $ | 12.12 | |
| (a) | The Fund will impose a 2.00% redemption fee on shares redeemed within 90 days of purchase. |
See Notes to Financial Statements.
| 82 | (888) 848-7569 | www.rivernorth.com |
RiverNorth/DoubleLine Strategic Income Fund
| Statement of Assets and Liabilities | September 30, 2017 |
| ASSETS: | | | |
| Investment in securities: | | | |
| At cost | | $ | 2,234,597,321 | |
| At value | | $ | 2,196,613,904 | |
| Investment in affiliates: | | | | |
| At cost | | | 28,238,128 | |
| At value | | | 28,154,818 | |
| Receivable for fund investments sold | | | 7,825,387 | |
| Interest receivable | | | 6,095,543 | |
| Receivable for fund shares sold | | | 2,615,363 | |
| Dividends receivable | | | 1,792,912 | |
| Cash segregated at custodian for total return swap contracts | | | 400,000 | |
| Prepaid expenses and other assets | | | 44,116 | |
| Total Assets | | | 2,243,542,043 | |
| | | | | |
| LIABILITIES: | | | | |
| Facility loan fee payable | | | 52,857 | |
| Payable for fund investments purchased | | | 8,268,342 | |
| Payable for fund shares redeemed | | | 1,009,383 | |
| Payable to Adviser | | | 1,359,814 | |
| Payable for Fund Accounting and Administration fees | | | 313,421 | |
| Accrued 12b-1 fees - Class R Shares | | | 42,865 | |
| Payable for Custodian fees | | | 17,702 | |
| Payable for Audit fees | | | 32,963 | |
| Payable to Transfer agency | | | 52,360 | |
| Payable to Trustees and Officers | | | 3,343 | |
| Other accrued expenses | | | 103,966 | |
| Total Liabilities | | | 11,257,016 | |
| Net Assets | | $ | 2,232,285,027 | |
| | | | | |
| NET ASSETS CONSIST OF: | | | | |
| Paid-in capital | | $ | 2,269,876,326 | |
| Accumulated net investment loss | | | (3,379,439 | ) |
| Accumulated undistributed net realized gain/(loss) | | | 3,854,867 | |
| Net unrealized appreciation/(depreciation) | | | (38,066,727 | ) |
| Net Assets | | $ | 2,232,285,027 | |
See Notes to Financial Statements.
| Annual Report | September 30, 2017 | 83 |
RiverNorth/DoubleLine Strategic Income Fund
| Statement of Assets and Liabilities | September 30, 2017 |
| PRICING OF SHARES: | | | | |
| Class I Shares | | | | |
| Net Assets | | $ | 2,024,142,488 | |
| Shares of beneficial interest outstanding (unlimited number of shares, no par value) | | | 190,864,265 | |
| Net Asset Value Per Share, Offering and Redemption Price Per Share | | $ | 10.61 | |
Minimum Redemption Price Per Share(a) | | $ | 10.40 | |
| Class R Shares | | | | |
| Net Assets | | $ | 208,142,539 | |
| Shares of beneficial interest outstanding (unlimited number of shares, no par value) | | | 19,598,275 | |
| Net Asset Value Per Share, Offering and Redemption Price Per Share | | $ | 10.62 | |
Minimum Redemption Price Per Share(a) | | $ | 10.41 | |
| (a) | The Fund will impose a 2.00% redemption fee on shares redeemed within 90 days of purchase. |
See Notes to Financial Statements.
| 84 | (888) 848-7569 | www.rivernorth.com |
RiverNorth/Oaktree High Income Fund
| Statement of Assets and Liabilities | September 30, 2017 |
| ASSETS: | | | |
| Investment in securities: | | | |
| At cost | | $ | 76,232,414 | |
| At value | | $ | 77,345,412 | |
| Foreign currency, at value (Cost 408,618) | | | 408,530 | |
| Receivable for fund investments sold | | | 2,880,561 | |
| Interest receivable | | | 413,096 | |
| Cash segregated at custodian for total return swap contracts | | | 200,000 | |
| Cash segregated at custodian for forward foreign currency contracts | | | 152,000 | |
| Unrealized appreciation on forward foreign currency contracts | | | 134,727 | |
| Dividends receivable | | | 35,656 | |
| Receivable for fund shares sold | | | 32,904 | |
| Prepaid expenses and other assets | | | 6,953 | |
| Total Assets | | | 81,609,839 | |
| | | | | |
| LIABILITIES: | | | | |
| Facility loan fee payable | | | 1,900 | |
| Payable for fund investments purchased | | | 9,797,752 | |
| Payable for fund shares redeemed | | | 23,606 | |
| Unrealized depreciation on forward foreign currency contracts | | | 135,985 | |
| Payable to Adviser | | | 58,813 | |
| Payable for Fund Accounting and Administration fees | | | 65,025 | |
| Accrued 12b-1 fees - Class R Shares | | | 1,757 | |
| Payable for Custodian fees | | | 4,629 | |
| Payable for Audit fees | | | 30,962 | |
| Payable to Transfer agency | | | 5,190 | |
| Payable to Trustees and Officers | | | 2,138 | |
| Other accrued expenses | | | 5,662 | |
| Total Liabilities | | | 10,133,419 | |
| Net Assets | | $ | 71,476,420 | |
| | | | | |
| NET ASSETS CONSIST OF: | | | | |
| Paid-in capital | | $ | 75,534,572 | |
| Accumulated net investment loss | | | (1,791,575 | ) |
| Accumulated undistributed net realized gain/(loss) | | | (3,335,495 | ) |
| Net unrealized appreciation/(depreciation) | | | 1,068,918 | |
| Net Assets | | $ | 71,476,420 | |
See Notes to Financial Statements.
| Annual Report | September 30, 2017 | 85 |
RiverNorth/Oaktree High Income Fund
| Statement of Assets and Liabilities | September 30, 2017 |
| PRICING OF SHARES: | | | | |
| Class I Shares | | | | |
| Net Assets | | $ | 63,841,676 | |
| Shares of beneficial interest outstanding (unlimited number of shares, no par value) | | | 6,560,222 | |
| Net Asset Value Per Share, Offering and Redemption Price Per Share | | $ | 9.73 | |
Minimum Redemption Price Per Share(a) | | $ | 9.54 | |
| Class R Shares | | | | |
| Net Assets | | $ | 7,634,744 | |
| Shares of beneficial interest outstanding (unlimited number of shares, no par value) | | | 785,253 | |
| Net Asset Value Per Share, Offering and Redemption Price Per Share | | $ | 9.72 | |
Minimum Redemption Price Per Share(a) | | $ | 9.53 | |
| (a) | The Fund will impose a 2.00% redemption fee on shares redeemed within 90 days of purchase. |
See Notes to Financial Statements.
| 86 | (888) 848-7569 | www.rivernorth.com |
RiverNorth Core Opportunity Fund
| Statement of Operations | For the Year Ended September 30, 2017 |
| INVESTMENT INCOME: | |
| Dividend income | | $ | 12,883,608 | |
| Dividend income from affiliated securities | | | 773,615 | |
| Foreign taxes withheld | | | (1,106 | ) |
| Total Investment Income | | | 13,656,117 | |
| | | | | |
| EXPENSES: | |
| Investment Adviser fee | | | 5,067,019 | |
| 12b-1 fees - Class R Shares | | | 892,847 | |
| Accounting and administration fee | | | 159,286 | |
| Registration expenses | | | 59,846 | |
| Transfer agent expenses | | | 58,965 | |
| Compliance expenses | | | 53,758 | |
| Facility loan fee | | | 44,634 | |
| Printing expenses | | | 44,438 | |
| Trustee expenses | | | 36,720 | |
| Legal expenses | | | 31,949 | |
| Audit expenses | | | 31,454 | |
| Custodian expenses | | | 23,967 | |
| Insurance expenses | | | 14,044 | |
| Interest expense | | | 6,210 | |
| 24f-2 expenses | | | 236 | |
| Miscellaneous expenses | | | 34,352 | |
| Total Expenses | | | 6,559,725 | |
| Net Investment Income | | | 7,096,392 | |
| | | | | |
| REALIZED AND UNREALIZED GAIN/(LOSS): | | | | |
| Net realized gain/(loss) on: | | | | |
| Investments | | | 42,925,635 | |
| Investments - affiliated investments | | | (346,815 | ) |
| Total return swap contracts | | | 752,677 | |
| Net realized gain | | | 43,331,497 | |
| Long-term capital gain distributions from other investment companies | | | 8,411,842 | |
| Net change in unrealized appreciation/depreciation on: | | | | |
| Investments | | | (3,854,558 | ) |
| Affiliated Investments | | | 7,410,238 | |
| Total return swap contracts | | | (835,285 | ) |
| Net change in unrealized appreciation/depreciation | | | 2,720,395 | |
| Net Realized and Unrealized Gain on Investments and Total return swap contracts | | | 54,463,734 | |
| Net Increase in Net Assets Resulting from Operations | | $ | 61,560,126 | |
See Notes to Financial Statements.
| Annual Report | September 30, 2017 | 87 |
RiverNorth/DoubleLine Strategic Income Fund
| Statement of Operations | For the Year Ended September 30, 2017 |
| INVESTMENT INCOME: | |
| Dividend income | | $ | 33,904,585 | |
| Dividend income from affiliated securities | | | 1,081,970 | |
| Interest income | | | 64,741,315 | |
| Other income | | | 1,624 | |
| Foreign taxes withheld | | | 4,009 | |
| Total Investment Income | | | 99,733,503 | |
| | | | | |
| EXPENSES: | |
| Investment Adviser fee | | | 15,910,799 | |
| Accounting and administration fee | | | 945,170 | |
| 12b-1 fees - Class R Shares | | | 542,957 | |
| Compliance expenses | | | 242,929 | |
| Transfer agent expenses | | | 231,869 | |
| Facility loan fee | | | 200,715 | |
| Legal expenses | | | 135,206 | |
| Trustee expenses | | | 132,668 | |
| Printing expenses | | | 121,109 | |
| Registration expenses | | | 69,997 | |
| Custodian expenses | | | 69,406 | |
| Insurance expenses | | | 43,537 | |
| Audit expenses | | | 42,454 | |
| Miscellaneous expenses | | | 97,782 | |
| Net Expenses | | | 18,786,598 | |
| Net Investment Income | | | 80,946,905 | |
| | | | | |
| REALIZED AND UNREALIZED GAIN/(LOSS): | | | | |
| Net realized gain on: | | | | |
| Investments | | | 21,532,380 | |
| Total return swap contracts | | | 1,077,134 | |
| Net realized gain | | | 22,609,514 | |
| Long-term capital gain distributions from other investment companies | | | 439,705 | |
| Net change in unrealized appreciation/depreciation on: | | | | |
| Investments | | | (6,454,161 | ) |
| Affiliated Investments | | | 786,103 | |
| Total return swap contracts | | | (1,364,980 | ) |
| Net change in unrealized appreciation/depreciation | | | (7,033,038 | ) |
| Net Realized and Unrealized Gain on Investments and Total return swap contracts | | | 16,016,181 | |
| Net Increase in Net Assets Resulting from Operations | | $ | 96,963,086 | |
See Notes to Financial Statements.
| 88 | (888) 848-7569 | www.rivernorth.com |
RiverNorth/Oaktree High Income Fund
| Statement of Operations | For the Year Ended September 30, 2017 |
| INVESTMENT INCOME: | |
| Dividend income | | $ | 1,346,290 | |
| Interest income | | | 2,721,157 | |
| Other income | | | 23,990 | |
| Foreign taxes withheld | | | (1,548 | ) |
| Total Investment Income | | | 4,089,889 | |
| | | | | |
| EXPENSES: | |
| Investment Adviser fee | | | 828,853 | |
| Accounting and administration fee | | | 127,543 | |
| Registration expenses | | | 39,414 | |
| Audit expenses | | | 32,954 | |
| Transfer agent expenses | | | 32,209 | |
| 12b-1 fees - Class R Shares | | | 20,816 | |
| Compliance expenses | | | 15,526 | |
| Facility loan fee | | | 7,842 | |
| Custodian expenses | | | 7,740 | |
| Printing expenses | | | 5,645 | |
| Legal expenses | | | 5,301 | |
| Trustee expenses | | | 5,221 | |
| Insurance expenses | | | 1,588 | |
| Repayment of previously waived fees Class R | | | 2,518 | |
| Miscellaneous expenses | | | 8,501 | |
| Less fees waived/reimbursed by Investment Adviser: | | | | |
| Class R Shares | | | (2,773 | ) |
| Net Expenses | | | 1,138,898 | |
| Net Investment Income | | | 2,950,991 | |
| | | | | |
| REALIZED AND UNREALIZED GAIN/(LOSS): | | | | |
| Net realized gain/(loss) on: | | | | |
| Investments | | | 724,299 | |
| Forward Currency Contracts | | | (1,320,032 | ) |
| Translation of assets and liabilities denominated in foreign currencies | | | (107,459 | ) |
| Net realized loss | | | (703,192 | ) |
| Long-term capital gain distributions from other investment companies | | | 3,320 | |
| Net change in unrealized appreciation/depreciation on: | | | | |
| Investments | | | 3,439,977 | |
| Forward foreign currency contracts | | | 51,785 | |
| Translation of assets and liabilities denominated in foreign currencies | | | (30,661 | ) |
| Net change in unrealized appreciation/depreciation | | | 3,461,101 | |
| Net Realized and Unrealized Gain on Investments, translation of assets and liabilities denominated in foreign currencies and forward foreign currency contracts | | | 2,761,229 | |
| Net Increase in Net Assets Resulting from Operations | | $ | 5,712,220 | |
See Notes to Financial Statements.
| Annual Report | September 30, 2017 | 89 |
RiverNorth Core Opportunity Fund
Statements of Changes in Net Assets
| | | For the
Year Ended
September 30, 2017 | | | For the
Year Ended
September 30, 2016 | |
| NET INCREASE/(DECREASE) IN NET ASSETS FROM OPERATIONS: | |
| Net investment income | | $ | 7,096,392 | | | $ | 14,802,435 | |
| Net realized gain/(loss) | | | 43,331,497 | | | | 4,184,469 | |
| Long-term capital gain distributions from other investment companies | | | 8,411,842 | | | | 12,375,866 | |
| Net change in unrealized appreciation/depreciation | | | 2,720,395 | | | | 72,508,169 | |
| Net increase in net assets resulting from operations | | | 61,560,126 | | | | 103,870,939 | |
| | | | | | | | | |
| DISTRIBUTIONS TO SHAREHOLDERS: | |
| From net investment income: | | | | | | | | |
| Class I shares | | | (3,872,978 | ) | | | (6,736,524 | ) |
| Class R shares | | | (9,630,040 | ) | | | (22,371,981 | ) |
| From net realized gains on investments: | | | | | | | | |
| Class I shares | | | (2,919,148 | ) | | | (7,344,643 | ) |
| Class R shares | | | (7,258,372 | ) | | | (24,391,543 | ) |
| From tax return of capital | | | | | | | | |
| Class I shares | | | – | | | | (1,484,480 | ) |
| Class R shares | | | – | | | | (4,929,957 | ) |
| Net decrease in net assets from distributions to shareholders | | | (23,680,538 | ) | | | (67,259,128 | ) |
| | | | | | | | | |
| CAPITAL SHARE TRANSACTIONS: | | | | | | | | |
| Class I Shares | | | | | | | | |
| Proceeds from shares sold | | | 46,546,239 | | | | 121,823,509 | |
| Reinvestment of distributions | | | 4,512,884 | | | | 6,606,226 | |
| Cost of shares redeemed | | | (154,520,350 | ) | | | (103,465,701 | ) |
Redemption fees(a) | | | 38,263 | | | | 30,962 | |
| Net increase/(decrease) in net assets from capital share transactions | | | (103,422,964 | ) | | | 24,994,996 | |
| | | | | | | | | |
| Class R Shares | | | | | | | �� | |
| Proceeds from shares sold | | | 41,626,713 | | | | 188,454,090 | |
| Reinvestment of distributions | | | 16,755,567 | | | | 51,279,929 | |
| Cost of shares redeemed | | | (439,389,198 | ) | | | (237,125,522 | ) |
Redemption fees(a) | | | 4,262 | | | | 100,098 | |
| Net increase/(decrease) in net assets from capital share transactions | | | (381,002,656 | ) | | | 2,708,595 | |
| | | | | | | | | |
| Net Increase/(Decrease) in Net Assets | | | (446,546,032 | ) | | | 64,315,402 | |
| | | | | | | | | |
| NET ASSETS: | |
| Beginning of period | | $ | 769,910,045 | | | $ | 705,594,643 | |
| End of period (including accumulated net investment loss of $(242,114) and $(1,265,521)) | | | 323,364,013 | | | | 769,910,045 | |
See Notes to Financial Statements.
| 90 | (888) 848-7569 | www.rivernorth.com |
RiverNorth Core Opportunity Fund
Statements of Changes in Net Assets
| | | For the
Year Ended
September 30, 2017 | | | For the
Year Ended
September 30, 2016 | |
| OTHER INFORMATION: | | | | | | | | |
| Share Transactions: | | | | | | | | |
| Class I Shares | | | | | | | | |
| Shares sold | | | 3,996,698 | | | | 11,289,586 | |
| Shares issued in reinvestment of distributions | | | 387,331 | | | | 619,966 | |
| Shares redeemed | | | (13,330,076 | ) | | | (9,635,098 | ) |
| Net increase/(decrease) from share transactions | | | (8,946,047 | ) | | | 2,274,454 | |
| | | | | | | | | |
| Class R Shares | | | | | | | | |
| Shares sold | | | 3,608,158 | | | | 17,251,837 | |
| Shares issued in reinvestment of distributions | | | 1,446,579 | | | | 4,838,916 | |
| Shares redeemed | | | (37,956,954 | ) | | | (22,055,062 | ) |
| Net increase/(decrease) from share transactions | | | (32,902,217 | ) | | | 35,691 | |
(a) | The Fund will impose a 2.00% redemption fee on shares redeemed within 90 days of purchase. |
| Annual Report | September 30, 2017 | 91 |
RiverNorth/DoubleLine Strategic Income Fund
Statements of Changes in Net Assets
| | | For the
Year Ended
September 30, 2017 | | | For the
Year Ended
September 30, 2016 | |
| NET INCREASE/(DECREASE) IN NET ASSETS FROM OPERATIONS: | |
| Net investment income | | $ | 80,946,905 | | | $ | 96,592,250 | |
| Net realized gain/(loss) | | | 22,609,514 | | | | 10,688,426 | |
| Long-term capital gain distributions from other investment companies | | | 439,705 | | | | 487,125 | |
| Net change in unrealized appreciation/depreciation | | | (7,033,038 | ) | | | 62,525,390 | |
| Net increase in net assets resulting from operations | | | 96,963,086 | | | | 170,293,191 | |
| | | | | | | | | |
| DISTRIBUTIONS TO SHAREHOLDERS: | |
| From net investment income: | | | | | | | | |
| Class I shares | | | (82,645,047 | ) | | | (106,976,753 | ) |
| Class R shares | | | (8,704,470 | ) | | | (13,530,672 | ) |
| From net realized gains on investments: | | | | | | | | |
| Class I shares | | | (5,580,341 | ) | | | – | |
| Class R shares | | | (587,741 | ) | | | – | |
| From tax return of capital | | | | | | | | |
| Class I shares | | | – | | | | (2,958,882 | ) |
| Class R shares | | | – | | | | (374,246 | ) |
| Net decrease in net assets from distributions to shareholders | | | (97,517,599 | ) | | | (123,840,553 | ) |
| | | | | | | | | |
| CAPITAL SHARE TRANSACTIONS: | | | | | | | | |
| Class I Shares | | | | | | | | |
| Proceeds from shares sold | | | 663,829,940 | | | | 712,566,527 | |
| Reinvestment of distributions | | | 64,580,225 | | | | 76,214,367 | |
| Cost of shares redeemed | | | (526,765,934 | ) | | | (742,568,835 | ) |
| Redemption fees(a) | | | 69,874 | | | | 210,017 | |
| Net increase in net assets from capital share transactions | | | 201,714,105 | | | | 46,422,076 | |
| | | | | | | | | |
| Class R Shares | | | | | | | | |
| Proceeds from shares sold | | | 63,167,525 | | | | 68,010,418 | |
| Reinvestment of distributions | | | 8,954,389 | | | | 13,444,782 | |
| Cost of shares redeemed | | | (94,841,502 | ) | | | (88,957,417 | ) |
| Redemption fees(a) | | | 18,119 | | | | 27,609 | |
| Net decrease in net assets from capital share transactions | | | (22,701,469 | ) | | | (7,474,608 | ) |
| | | | | | | | | |
| Net Increase in Net Assets | | | 178,458,123 | | | | 85,400,106 | |
| | | | | | | | | |
| NET ASSETS: | |
| Beginning of period | | $ | 2,053,826,904 | | | $ | 1,968,426,798 | |
| End of period (including accumulated net investment loss of $(3,379,439) and $(2,056,291)) | | | 2,232,285,027 | | | | 2,053,826,904 | |
See Notes to Financial Statements.
| 92 | (888) 848-7569 | www.rivernorth.com |
RiverNorth/DoubleLine Strategic Income Fund
Statements of Changes in Net Assets
| | | For the
Year Ended
September 30, 2017 | | | For the
Year Ended
September 30, 2016 | |
| OTHER INFORMATION: | | | | | | |
| Share Transactions: | | | | | | |
| Class I Shares | | | | | | |
| Shares sold | | | 62,769,675 | | | | 68,830,101 | |
| Shares issued in reinvestment of distributions | | | 6,112,222 | | | | 7,369,921 | |
| Shares redeemed | | | (49,854,167 | ) | | | (71,637,895 | ) |
| Net increase from share transactions | | | 19,027,730 | | | | 4,562,127 | |
| | | | | | | | | |
| Class R Shares | | | | | | | | |
| Shares sold | | | 5,966,271 | | | | 6,550,575 | |
| Shares issued in reinvestment of distributions | | | 846,326 | | | | 1,299,306 | |
| Shares redeemed | | | (8,955,376 | ) | | | (8,574,332 | ) |
| Net decrease from share transactions | | | (2,142,779 | ) | | | (724,451 | ) |
(a) | The Fund will impose a 2.00% redemption fee on shares redeemed within 90 days of purchase. |
See Notes to Financial Statements.
| Annual Report | September 30, 2017 | 93 |
RiverNorth/Oaktree High Income Fund
Statements of Changes in Net Assets
| | | For the
Year Ended
September 30, 2017 | | | For the
Year Ended
September 30, 2016 | |
| NET INCREASE/(DECREASE) IN NET ASSETS FROM OPERATIONS: | |
| Net investment income | | $ | 2,950,991 | | | $ | 4,071,206 | |
| Net realized gain/(loss) | | | (703,192 | ) | | | (3,178,207 | ) |
| Long-term capital gain distributions from other investment companies | | | 3,320 | | | | 20,217 | |
| Net change in unrealized appreciation/depreciation | | | 3,461,101 | | | | 6,764,746 | |
| Net increase in net assets resulting from operations | | | 5,712,220 | | | | 7,677,962 | |
| | | | | | | | | |
| DISTRIBUTIONS TO SHAREHOLDERS: | |
| From net investment income: | | | | | | | | |
| Class I Shares | | | (2,921,176 | ) | | | (4,642,974 | ) |
| Class R Shares | | | (302,770 | ) | | | (445,943 | ) |
| From tax return of capital | | | | | | | | |
| Class I Shares | | | (259,165 | ) | | | (210,875 | ) |
| Class R Shares | | | (26,861 | ) | | | (20,254 | ) |
| Net decrease in net assets from distributions to shareholders | | | (3,509,972 | ) | | | (5,320,046 | ) |
| | | | | | | | | |
| CAPITAL SHARE TRANSACTIONS: | | | | | | | | |
| Class I Shares | | | | | | | | |
| Proceeds from shares sold | | | 14,250,482 | | | | 24,410,340 | |
| Reinvestment of distributions | | | 2,709,105 | | | | 4,118,885 | |
| Cost of shares redeemed | | | (28,702,824 | ) | | | (45,430,640 | ) |
| Redemption fees(a) | | | 6,279 | | | | 13,755 | |
| Net decrease in net assets from capital share transactions | | | (11,736,958 | ) | | | (16,887,660 | ) |
| | | | | | | | | |
| Class R Shares | | | | | | | | |
| Proceeds from shares sold | | | 3,096,004 | | | | 1,411,129 | |
| Reinvestment of distributions | | | 325,388 | | | | 461,945 | |
| Cost of shares redeemed | | | (3,194,299 | ) | | | (5,289,180 | ) |
| Redemption fees(a) | | | 536 | | | | 1,378 | |
| Net increase/(decrease) in net assets from capital share transactions | | | 227,629 | | | | (3,414,728 | ) |
| | | | | | | | | |
| Net Decrease in Net Assets | | | (9,307,081 | ) | | | (17,944,472 | ) |
| | | | | | | | | |
| NET ASSETS: | |
| Beginning of period | | $ | 80,783,501 | | | $ | 98,727,973 | |
| End of period (including accumulated net investment income/(loss) of $(1,791,575) and $(316,909)) | | | 71,476,420 | | | | 80,783,501 | |
See Notes to Financial Statements.
| 94 | (888) 848-7569 | www.rivernorth.com |
RiverNorth/Oaktree High Income Fund
Statements of Changes in Net Assets
| | | For the
Year Ended
September 30, 2017 | | | For the
Year Ended
September 30, 2016 | |
| OTHER INFORMATION: | | | | | | |
| Share Transactions: | | | | | | |
| Class I Shares | | | | | | |
| Shares sold | | | 1,480,726 | | | | 2,711,494 | |
| Shares issued in reinvestment of distributions | | | 281,131 | | | | 454,857 | |
| Shares redeemed | | | (2,962,599 | ) | | | (5,034,866 | ) |
| Net decrease from share transactions | | | (1,200,742 | ) | | | (1,868,515 | ) |
| | | | | | | | | |
| Class R Shares | | | | | | | | |
| Shares sold | | | 320,980 | | | | 155,491 | |
| Shares issued in reinvestment of distributions | | | 33,780 | | | | 51,076 | |
| Shares redeemed | | | (330,097 | ) | | | (576,858 | ) |
| Net increase/(decrease) from share transactions | | | 24,663 | | | | (370,291 | ) |
(a) | The Fund will impose a 2.00% redemption fee on shares redeemed within 90 days of purchase. |
See Notes to Financial Statements.
| Annual Report | September 30, 2017 | 95 |
| RiverNorth Core Opportunity Fund | Class I |
Financial Highlights
| |
| Net asset value - beginning of period |
| Income/(Loss) from investment operations: |
| Net investment income(b) |
| Net realized and unrealized gain/(loss) on investments(b) |
| Total income/(loss) from investment operations |
| Less distributions: |
| From net investment income |
| From net realized gain on investments |
| From tax return of capital |
| Total distributions |
| Paid-in capital from redemption fees(b) |
| Net increase/(decrease) in net asset value |
| Net asset value - end of period |
| Total Return(e) |
| Ratios/Supplemental Data: |
| Net assets, end of period (in thousands) |
| |
| Ratios to Average Net Assets (including interest expense): |
| |
| Ratio of expenses to average net assets excluding fee waivers and reimbursements(g) |
| Ratio of expenses to average net assets including fee waivers and reimbursements(g) |
| Ratio of net investment income to average net assets excluding fee waivers and reimbursements(g) |
| Ratio of net investment income to average net assets including fee waivers and reimbursements(g) |
| |
| Ratios to Average Net Assets (excluding interest expense): |
| |
| Ratio of expenses to average net assets excluding fee waivers and reimbursements(g) |
| Ratio of expenses to average net assets including fee waivers and reimbursements(g) |
| Ratio of net investment income to average net assets excluding fee waivers and reimbursements(g) |
| Ratio of net investment income to average net assets including fee waivers and reimbursements(g) |
| Portfolio turnover rate |
See Notes to Financial Statements.
| 96 | (888) 848-7569 | www.rivernorth.com |
For a share outstanding throughout the periods presented
For the
Year Ended
September 30, 2017 | | | For the
Year Ended
September 30, 2016 | | | For the
Year Ended
September 30, 2015 | | | For the Period ended
September 30, 2014(a) | |
| $ | 11.33 | | | $ | 10.74 | | | $ | 13.06 | | | $ | 13.16 | |
| | |
| | 0.17 | | | | 0.23 | | | | 0.44 | | | | 0.08 | |
| | 1.45 | | | | 1.33 | | | | (1.30 | ) | | | (0.18 | )(c) |
| | 1.62 | | | | 1.56 | | | | (0.86 | ) | | | (0.10 | ) |
| | |
| | (0.30 | ) | | | (0.42 | ) | | | (0.60 | ) | | | – | |
| | (0.28 | ) | | | (0.45 | ) | | | (0.86 | ) | | | – | |
| | – | | | | (0.10 | ) | | | – | | | | – | |
| | (0.58 | ) | | | (0.97 | ) | | | (1.46 | ) | | | – | |
| | 0.00 | (d) | | | 0.00 | (d) | | | 0.00 | (d) | | | – | |
| | 1.04 | | | | 0.59 | | | | (2.32 | ) | | | (0.10 | ) |
| $ | 12.37 | | | $ | 11.33 | | | $ | 10.74 | | | $ | 13.06 | |
| | 14.71 | % | | | 15.35 | % | | | (7.50 | %) | | | (0.76% | )(f) |
| | |
| $ | 109,627 | | | $ | 201,712 | | | $ | 166,905 | | | $ | 39,623 | |
| | | | | | | | | | | | | | | |
| | 1.12 | % | | | N/A | % | | | N/A | % | | | N/A | % |
| | 1.12 | % | | | N/A | % | | | N/A | % | | | N/A | % |
| | 1.45 | % | | | N/A | % | | | N/A | % | | | N/A | % |
| | 1.45 | % | | | N/A | % | | | N/A | % | | | N/A | % |
| | | | | | | | | | | | | | | |
| | 1.12 | % | | | 1.11 | % | | | 1.11 | % | | | 1.20 | %(h) |
| | 1.12 | % | | | 1.11 | % | | | 1.11 | % | | | 1.20 | %(h) |
| | 1.45 | % | | | 2.11 | % | | | 3.62 | % | | | 2.93 | %(h) |
| | 1.45 | % | | | 2.11 | % | | | 3.62 | % | | | 2.93 | %(h) |
| | 39 | %(i) | | | 19 | % | | | 23 | % | | | 46 | %(f) |
| Annual Report | September 30, 2017 | 97 |
| RiverNorth Core Opportunity Fund | Class I |
Financial Highlights | For a share outstanding throughout the periods presented |
(a) | Commenced operations on August 11, 2014. |
(b) | Based on average shares outstanding during the period. |
(c) | The amount shown for a share outstanding throughout the period may not correlate with the Statement of Operations for the period due to the timing of sales and redemptions of Fund shares in relation to realized and unrealized gains and losses on investments of the Fund. |
(d) | Less than $0.005 per share. |
(e) | Total return in the above table represents the rate that the investor would have earned or lost on an investment in the Fund, assuming reinvestment of dividends. |
(g) | The ratios exclude the impact of expenses of the underlying funds in which the Fund invests as represented in the Schedule of Investments. |
(i) | Portfolio turnover does not include redemptions in-kind. |
See Notes to Financial Statements.
| 98 | (888) 848-7569 | www.rivernorth.com |
Intentionally Left Blank
| RiverNorth Core Opportunity Fund | Class R |
Financial Highlights
| |
| Net asset value - beginning of period |
| Income/(Loss) from investment operations: |
| Net investment income(a) |
| Net realized and unrealized gain/(loss) on investments(a) |
| Total income/(loss) from investment operations |
| Less distributions: |
| From net investment income |
| From net realized gain on investments |
| From tax return of capital |
| Total distributions |
| Paid-in capital from redemption fees(a) |
| Net increase/ (decrease) in net asset value |
| Net asset value - end of period |
| Total Return(c) |
| Ratios/Supplemental Data: |
| Net assets, end of period (in thousands) |
| Ratios to Average Net Assets (including interest expense): |
| |
Ratio of expenses to average net assets excluding fee waivers and reimbursements(d) |
Ratio of expenses to average net assets including fee waivers and reimbursements(d) |
Ratio of net investment income to average net assets excluding fee waivers and reimbursements(d) |
Ratio of net investment income to average net assets including fee waivers and reimbursements(d) |
| Ratios to Average Net Assets (excluding interest expense): |
| |
| Ratio of expenses to average net assets excluding fee waivers and reimbursements(d) |
| Ratio of expenses to average net assets including fee waivers and reimbursements(d) |
| Ratio of net investment income to average net assets excluding fee waivers and reimbursements(d) |
| Ratio of net investment income to average net assets including fee waivers and reimbursements(d) |
| Portfolio turnover rate |
See Notes to Financial Statements.
| 100 | (888) 848-7569 | www.rivernorth.com |
For a share outstanding throughout the periods presented
For the
Year Ended
September 30, 2017 | | | For the
Year Ended
September 30, 2016 | | | For the
Year Ended
September 30, 2015 | | | For the
Year Ended
September 30, 2014 | | | For the
Year Ended
September 30, 2013 | |
| $ | 11.32 | | | $ | 10.74 | | | $ | 13.05 | | | $ | 12.65 | | | $ | 12.37 | |
| | |
| | 0.16 | | | | 0.20 | | | | 0.39 | | | | 0.32 | | | | 0.20 | |
| | 1.44 | | | | 1.32 | | | | (1.27 | ) | | | 1.00 | | | | 0.96 | |
| | 1.60 | | | | 1.52 | | | | (0.88 | ) | | | 1.32 | | | | 1.16 | |
| | |
| | (0.27 | ) | | | (0.40 | ) | | | (0.57 | ) | | | (0.24 | ) | | | (0.35 | ) |
| | (0.28 | ) | | | (0.45 | ) | | | (0.86 | ) | | | (0.68 | ) | | | (0.53 | ) |
| | – | | | | (0.09 | ) | | | – | | | | – | | | | – | |
| | (0.55 | ) | | | (0.94 | ) | | | (1.43 | ) | | | (0.92 | ) | | | (0.88 | ) |
| | 0.00 | (b) | | | 0.00 | (b) | | | 0.00 | (b) | | | 0.00 | (b) | | | 0.00 | (b) |
| | 1.05 | | | | 0.58 | | | | (2.31 | ) | | | 0.40 | | | | 0.28 | |
| $ | 12.37 | | | $ | 11.32 | | | $ | 10.74 | | | $ | 13.05 | | | $ | 12.65 | |
| | 14.51 | % | | | 14.98 | % | | | (7.67 | %) | | | 10.81 | % | | | 10.08 | % |
| | |
| $ | 213,737 | | | $ | 568,198 | | | $ | 538,689 | | | $ | 705,299 | | | $ | 647,365 | |
| | | | | | | | | | | | | | | | | | | |
| | 1.37 | % | | | N/A | % | | | N/A | % | | | N/A | % | | | N/A | % |
| | 1.37 | % | | | N/A | % | | | N/A | % | | | N/A | % | | | N/A | % |
| | 1.38 | % | | | N/A | % | | | N/A | % | | | N/A | % | | | N/A | % |
| | 1.38 | % | | | N/A | % | | | N/A | % | | | N/A | % | | | N/A | % |
| | | | | | | | | | | | | | | | | | | |
| | 1.37 | % | | | 1.36 | % | | | 1.35 | % | | | 1.37 | % | | | 1.35 | % |
| | 1.37 | % | | | 1.36 | % | | | 1.35 | % | | | 1.37 | % | | | 1.35 | % |
| | 1.38 | % | | | 1.90 | % | | | 3.16 | % | | | 2.60 | % | | | 1.66 | % |
| | 1.38 | % | | | 1.90 | % | | | 3.16 | % | | | 2.60 | % | | | 1.66 | % |
| | 39 | %(e) | | | 19 | % | | | 23 | % | | | 46 | % | | | 46 | % |
| Annual Report | September 30, 2017 | 101 |
| RiverNorth Core Opportunity Fund | Class R |
Financial Highlights | For a share outstanding throughout the periods presented |
(a) | Based on average shares outstanding during the period. |
(b) | Less than $0.005 per share. |
(c) | Total return in the above table represents the rate that the investor would have earned or lost on an investment in the Fund, assuming reinvestment of dividends. |
(d) | The ratios exclude the impact of expenses of the underlying funds in which the Fund invests as represented in the Schedule of Investments. |
(e) | Portfolio turnover does not include redemptions in-kind. |
See Notes to Financial Statements.
| 102 | (888) 848-7569 | www.rivernorth.com |
Intentionally Left Blank
| RiverNorth/DoubleLine Strategic Income Fund | Class I |
| Net asset value - beginning of period |
| Income from investment operations: |
| Net investment income(a) |
| Net realized and unrealized gain/ (loss) on investments(a) |
| Total income from investment operations |
| |
| Less distributions: |
| From net investment income |
| From net realized gain on investments |
| From tax return of capital |
| Total distributions |
| Paid-in capital from redemption fees(a) |
| Net increase/(decrease) in net asset value |
| Net asset value - end of period |
| |
| Total Return(c) |
| |
| Ratios/Supplemental Data: |
| Net assets, end of period (in thousands) |
| Ratio of expenses to average net assets excluding fee waivers and reimbursements(d) |
| Ratio of expenses to average net assets including fee waivers and reimbursements(d) |
| |
| Ratio of net investment income to average net assets excluding fee waivers and reimbursements(d) |
| |
| Ratio of net investment income to average net assets including fee waivers and reimbursements(d) |
| Portfolio turnover rate |
(a) | Based on average shares outstanding during the period. |
(b) | Less than $0.005 per share. |
(c) | Total return in the above table represents the rate that the investor would have earned or lost on an investment in the Fund, assuming reinvestment of dividends. |
(d) | The ratios exclude the impact of expenses of the underlying funds in which the Fund invests as represented in the Schedule of Investments. |
See Notes to Financial Statements. | |
| 104 | (888) 848-7569 | www.rivernorth.com |
For a share outstanding throughout the periods presented
For the
Year Ended
September 30, 2017 | | | For the
Year Ended
September 30, 2016 | | | For the
Year Ended
September 30, 2015 | | | For the
Year Ended
September 30, 2014 | | | For the
Year Ended
September 30, 2013 | |
| $ | 10.61 | | | $ | 10.37 | | | $ | 10.88 | | | $ | 10.62 | | | $ | 11.33 | |
| | |
| | 0.40 | | | | 0.51 | | | | 0.56 | | | | 0.59 | | | | 0.52 | |
| | 0.08 | | | | 0.39 | | | | (0.55 | ) | | | 0.38 | | | | (0.51 | ) |
| | 0.48 | | | | 0.90 | | | | 0.01 | | | | 0.97 | | | | 0.01 | |
| | |
| | (0.45 | ) | | | (0.64 | ) | | | (0.52 | ) | | | (0.66 | ) | | | (0.63 | ) |
| | (0.03 | ) | | | – | | | | – | | | | (0.05 | ) | | | (0.09 | ) |
| | – | | | | (0.02 | ) | | | – | | | | – | | | | – | |
| | (0.48 | ) | | | (0.66 | ) | | | (0.52 | ) | | | (0.71 | ) | | | (0.72 | ) |
| | 0.00 | (b) | | | 0.00 | (b) | | | 0.00 | (b) | | | 0.00 | (b) | | | 0.00 | (b) |
| | – | | | | 0.24 | | | | (0.51 | ) | | | 0.26 | | | | (0.71 | ) |
| $ | 10.61 | | | $ | 10.61 | | | $ | 10.37 | | | $ | 10.88 | | | $ | 10.62 | |
| | | | | | | | | | | | | | | | | | | |
| | 4.67 | % | | | 9.00 | % | | | 0.04 | % | | | 9.38 | % | | | (0.03 | %) |
| | | | | | | | | | | | | | | | | | | |
| | |
| $ | 2,024,142 | | | $ | 1,822,874 | | | $ | 1,735,108 | | | $ | 1,148,744 | | | $ | 785,974 | |
| | 0.85 | % | | | 0.86 | % | | | 0.86 | % | | | 0.91 | % | | | 0.89 | % |
| | 0.85 | % | | | 0.86 | % | | | 0.86 | % | | | 0.91 | % | | | 0.89 | % |
| | | | | | | | | | | | | | | | | | | |
| | 3.80 | % | | | 4.92 | % | | | 5.24 | % | | | 5.47 | % | | | 4.68 | % |
| | | | | | | | | | | | | | | | | | | |
| | 3.80 | % | | | 4.92 | % | | | 5.24 | % | | | 5.47 | % | | | 4.68 | % |
| | 50 | % | | | 36 | % | | | 29 | % | | | 56 | % | | | 80 | % |
| Annual Report | September 30, 2017 | 105 |
| RiverNorth/DoubleLine Strategic Income Fund | Class R |
| Net asset value - beginning of period |
| Income/(loss) from investment operations: |
| Net investment income(a) |
| Net realized and unrealized gain/ (loss) on investments(a) |
| Total income/(loss) from investment operations |
| |
| Less distributions: |
| From net investment income |
| From net realized gain on investments |
| From tax return of capital |
| Total distributions |
| Paid-in capital from redemption fees(a) |
| Net increase/(decrease) in net asset value |
| Net asset value - end of period |
| |
| Total Return(c) |
| |
| Ratios/Supplemental Data: |
| Net assets, end of period (in thousands) |
| Ratio of expenses to average net assets excluding fee waivers and reimbursements(d) |
| Ratio of expenses to average net assets including fee waivers and reimbursements(d) |
| |
| Ratio of net investment income to average net assets excluding fee waivers and reimbursements(d) |
| |
| Ratio of net investment income to average net assets including fee waivers and reimbursements(d) |
| Portfolio turnover rate |
(a) | Based on average shares outstanding during the period. |
(b) | Less than $0.005 per share. |
(c) | Total return in the above table represents the rate that the investor would have earned or lost on an investment in the Fund, assuming reinvestment of dividends. |
(d) | The ratios exclude the impact of expenses of the underlying funds in which the Fund invests as represented in the Schedule of Investments. |
See Notes to Financial Statements. | |
| 106 | (888) 848-7569 | www.rivernorth.com |
For a share outstanding throughout the periods presented
For the
Year Ended
September 30, 2017 | | | For the
Year Ended
September 30, 2016 | | | For the
Year Ended
September 30, 2015 | | | For the
Year Ended
September 30, 2014 | | | For the
Year Ended
September 30, 2013 | |
| $ | 10.62 | | | $ | 10.39 | | | $ | 10.89 | | | $ | 10.63 | | | $ | 11.34 | |
| | |
| | 0.38 | | | | 0.49 | | | | 0.54 | | | | 0.57 | | | | 0.49 | |
| | 0.08 | | | | 0.37 | | | | (0.55 | ) | | | 0.38 | | | | (0.51 | ) |
| | 0.46 | | | | 0.86 | | | | (0.01 | ) | | | 0.95 | | | | (0.02 | ) |
| | |
| | (0.43 | ) | | | (0.61 | ) | | | (0.49 | ) | | | (0.64 | ) | | | (0.60 | ) |
| | (0.03 | ) | | | – | | | | – | | | | (0.05 | ) | | | (0.09 | ) |
| | – | | | | (0.02 | ) | | | – | | | | – | | | | – | |
| | (0.46 | ) | | | (0.63 | ) | | | (0.49 | ) | | | (0.69 | ) | | | (0.69 | ) |
| | 0.00 | (b) | | | 0.00 | (b) | | | 0.00 | (b) | | | 0.00 | (b) | | | 0.00 | (b) |
| | – | | | | 0.23 | | | | (0.50 | ) | | | 0.26 | | | | (0.71 | ) |
| $ | 10.62 | | | $ | 10.62 | | | $ | 10.39 | | | $ | 10.89 | | | $ | 10.63 | |
| | | | | | | | | | | | | | | | | | | |
| | 4.40 | % | | | 8.62 | % | | | (0.12 | %) | | | 9.09 | % | | | (0.29 | %) |
| | | | | | | | | | | | | | | | | | | |
| | |
| $ | 208,143 | | | $ | 230,953 | | | $ | 233,319 | | | $ | 232,191 | | | $ | 270,560 | |
| | 1.10 | % | | | 1.11 | % | | | 1.11 | % | | | 1.16 | % | | | 1.14 | % |
| | 1.10 | % | | | 1.11 | % | | | 1.11 | % | | | 1.16 | % | | | 1.14 | % |
| | | | | | | | | | | | | | | | | | | |
| | 3.56 | % | | | 4.67 | % | | | 4.97 | % | | | 5.26 | % | | | 4.40 | % |
| | | | | | | | | | | | | | | | | | | |
| | 3.56 | % | | | 4.67 | % | | | 4.97 | % | | | 5.26 | % | | | 4.40 | % |
| | 50 | % | | | 36 | % | | | 29 | % | | | 56 | % | | | 80 | % |
| Annual Report | September 30, 2017 | 107 |
| RiverNorth/Oaktree High Income Fund | Class I |
| Net asset value - beginning of period |
| Income/(loss) from investment operations: |
| Net investment income(a) |
| Net realized and unrealized gain/(loss) on investments(a) |
| Total income/(loss) from investment operations |
| |
| Less distributions: |
| From net investment income |
| From net realized gain on investments |
| From tax return of capital |
| Total distributions |
| Paid-in capital from redemption fees(a) |
| Net increase/(decrease) in net asset value |
| Net asset value - end of period |
| |
| Total Return(c) |
| |
| Supplemental Data: |
| Net assets, end of period (in thousands) |
| Ratios to Average Net Assets (including interest expense) |
| Ratio of expenses to average net assets excluding fee waivers and reimbursements(e) |
| Ratio of expenses to average net assets including fee waivers and reimbursements(e) |
| |
| Ratio of net investment income to average net assets excluding fee waivers and reimbursements(e) |
| |
| Ratio of net investment income to average net assets including fee waivers and reimbursements(e) |
| |
| Ratios to Average Net Assets (excluding interest expense) |
| Ratio of expenses to average net assets excluding fee waivers and reimbursements(e) |
| Ratio of expenses to average net assets including fee waivers and reimbursements(e) |
| |
| Ratio of net investment income to average net assets excluding fee waivers and reimbursements(e) |
| |
| Ratio of net investment income to average net assets including fee waivers and reimbursements(e) |
| Portfolio turnover rate |
See Notes to Financial Statements. | |
| 108 | (888) 848-7569 | www.rivernorth.com |
For a share outstanding throughout the periods presented
For the
Year Ended
September 30, 2017 | | | For the
Year Ended
September 30, 2016 | | | For the
Year Ended
September 30, 2015 | | | For the
Year Ended
September 30, 2014 | | | For the Period
December 28, 2012
(Inception) to
September 30, 2013 | |
| | | | | | | | | | | | | | |
| $ | 9.48 | | | $ | 9.18 | | | $ | 10.25 | | | $ | 9.95 | | | $ | 10.00 | |
| | |
| | 0.35 | | | | 0.44 | | | | 0.43 | | | | 0.47 | | | | 0.22 | |
| | 0.31 | | | | 0.44 | | | | (0.77 | ) | | | 0.33 | | | | (0.07 | ) |
| | 0.66 | | | | 0.88 | | | | (0.34 | ) | | | 0.80 | | | | 0.15 | |
| | |
| | (0.38 | ) | | | (0.55 | ) | | | (0.53 | ) | | | (0.50 | ) | | | (0.20 | ) |
| | – | | | | – | | | | (0.20 | ) | | | – | | | | – | |
| | (0.03 | ) | | | (0.03 | ) | | | – | | | | – | | | | – | |
| | (0.41 | ) | | | (0.58 | ) | | | (0.73 | ) | | | (0.50 | ) | | | (0.20 | ) |
| | 0.00 | (b) | | | 0.00 | (b) | | | 0.00 | (b) | | | 0.00 | (b) | | | 0.00 | (b) |
| | 0.25 | | | | 0.30 | | | | (1.07 | ) | | | 0.30 | | | | (0.05 | ) |
| $ | 9.73 | | | $ | 9.48 | | | $ | 9.18 | | | $ | 10.25 | | | $ | 9.95 | |
| | | | | | | | | | | | | | | | | | | |
| | 7.11 | % | | | 10.09 | % | | | (3.50 | %) | | | 8.16 | % | | | 1.52 | %(d) |
| | | | | | | | | | | | | | | | | | | |
| | |
| $ | 63,842 | | | $ | 73,580 | | | $ | 88,360 | | | $ | 69,473 | | | $ | 25,472 | |
| | | | | | | | | | | | | | | | | | | |
| | 1.35 | %(f) | | | 1.34 | %(f) | | | 1.36 | %(f) | | | 1.39 | % | | | 1.58 | %(g) |
| | 1.35 | %(f) | | | 1.34 | %(f) | | | 1.36 | %(f) | | | 1.35 | % | | | 1.35 | %(g) |
| | 3.59 | %(f) | | | 4.86 | %(f) | | | 4.40 | %(f) | | | 4.45 | % | | | 2.65 | %(g) |
| | 3.59 | %(f) | | | 4.86 | %(f) | | | 4.40 | %(f) | | | 4.49 | % | | | 2.88 | %(g) |
| | | | | | | | | | | | | | | | | | | |
| | | | | | | | | | | | | | | | | | | |
| | 1.35 | %(f) | | | 1.34 | %(f) | | | 1.35 | %(f) | | | N/A | | | | N/A | |
| | 1.35 | %(f) | | | 1.34 | %(f) | | | 1.35 | %(f) | | | N/A | | | | N/A | |
| | 3.59 | %(f) | | | 4.86 | %(f) | | | 4.41 | %(f) | | | N/A | | | | N/A | |
| | 3.59 | %(f) | | | 4.86 | %(f) | | | 4.41 | %(f) | | | N/A | | | | N/A | |
| | 121 | % | | | 40 | % | | | 70 | % | | | 91 | % | | | 117 | %(d) |
| Annual Report | September 30, 2017 | 109 |
| RiverNorth/Oaktree High Income Fund | Class I |
| Financial Highlights | For a share outstanding throughout the periods presented |
(a) | Based on average shares outstanding during the period. |
(b) | Less than $0.005 per share. |
(c) | Total return in the above table represents the rate that the investor would have earned or lost on an investment in the Fund, assuming reinvestment of dividends. |
(e) | The ratios exclude the impact of expenses of the underlying funds in which the Fund invests as represented in the Schedule of Investments. |
(f) | The portion of the ratios attributable to recoupments for the periods ended September 30, 2017, September 30, 2016 and September 30, 2015 were 0.00%, 0.00% and 0.06%, respectively. |
See Notes to Financial Statements. | |
| 110 | (888) 848-7569 | www.rivernorth.com |
Intentionally Left Blank
| RiverNorth/Oaktree High Income Fund | Class R |
Financial Highlights
| Net asset value - beginning of period |
| Income/(loss) from investment operations: |
| Net investment income(a) |
| Net realized and unrealized gain/(loss) on investments(a) |
| Total income/(loss) from investment operations |
| |
| Less distributions: |
| From net investment income |
| From net realized gain on investments |
| From tax return of capital |
| Total distributions |
| Paid-in capital from redemption fees(a) |
| Net increase/(decrease) in net asset value |
| Net asset value - end of period |
| |
| Total Return(c) |
| |
| Supplemental Data: |
| Net assets, end of period (in thousands) |
| Ratios to Average Net Assets (including interest expense) |
| Ratio of expenses to average net assets excluding fee waivers and reimbursements(e) |
| Ratio of expenses to average net assets including fee waivers and reimbursements(e) |
| |
| Ratio of net investment income to average net assets excluding fee waivers and reimbursements(e) |
| |
| Ratio of net investment income to average net assets including fee waivers and reimbursements(e) |
| |
| Ratios to Average Net Assets (excluding interest expense) |
| Ratio of expenses to average net assets excluding fee waivers and reimbursements(e) |
| Ratio of expenses to average net assets including fee waivers and reimbursements(e) |
| |
| Ratio of net investment income to average net assets excluding fee waivers and reimbursements(e) |
| |
| Ratio of net investment income to average net assets including fee waivers and reimbursements(e) |
| Portfolio turnover rate |
See Notes to Financial Statements.
| 112 | (888) 848-7569 | www.rivernorth.com |
For a share outstanding throughout the periods presented
For the Year Ended September 30, 2017 | | | For the Year Ended September 30, 2016 | | | For the Year Ended September 30, 2015 | | | For the Year Ended September 30, 2014 | | | For the Period December 28, 2012 (Inception) to September 30, 2013 | |
| $ | 9.47 | | | $ | 9.17 | | | $ | 10.24 | | | $ | 9.95 | | | $ | 10.00 | |
| | | |
| | 0.32 | | | | 0.43 | | | | 0.41 | | | | 0.46 | | | | 0.21 | |
| | 0.32 | | | | 0.43 | | | | (0.77 | ) | | | 0.31 | | | | (0.07 | ) |
| | 0.64 | | | | 0.86 | | | | (0.36 | ) | | | 0.77 | | | | 0.14 | |
| | | | | | | | | | | | | | | | | | | |
| | | |
| | (0.36 | ) | | | (0.54 | ) | | | (0.51 | ) | | | (0.48 | ) | | | (0.19 | ) |
| | – | | | | – | | | | (0.20 | ) | | | – | | | | – | |
| | (0.03 | ) | | | (0.02 | ) | | | – | | | | – | | | | – | |
| | (0.39 | ) | | | (0.56 | ) | | | (0.71 | ) | | | (0.48 | ) | | | (0.19 | ) |
| | 0.00 | (b) | | | 0.00 | (b) | | | 0.00 | (b) | | | 0.00 | (b) | | | 0.00 | (b) |
| | 0.25 | | | | 0.30 | | | | (1.07 | ) | | | 0.29 | | | | (0.05 | ) |
| $ | 9.72 | | | $ | 9.47 | | | $ | 9.17 | | | $ | 10.24 | | | $ | 9.95 | |
| | | | | | | | | | | | | | | | | | | |
| | 6.83 | % | | | 9.83 | % | | | (3.76 | %) | | | 7.78 | % | | | 1.38 | %(d) |
| | | | | | | | | | | | | | | | | | | |
| | | |
| $ | 7,635 | | | $ | 7,203 | | | $ | 10,368 | | | $ | 16,163 | | | $ | 22,115 | |
| | | | | | | | | | | | | | | | | | | |
| | 1.63 | %(f) | | | 1.62 | %(f) | | | 1.61 | %(f) | | | 1.63 | % | | | 1.80 | %(g) |
| | 1.60 | %(f) | | | 1.60 | %(f) | | | 1.61 | %(f) | | | 1.60 | % | | | 1.60 | %(g) |
| | 3.29 | %(f) | | | 4.69 | %(f) | | | 4.14 | %(f) | | | 4.40 | % | | | 2.60 | %(g) |
| | 3.33 | %(f) | | | 4.71 | %(f) | | | 4.14 | %(f) | | | 4.43 | % | | | 2.80 | %(g) |
| | | | | | | | | | | | | | | | | | | |
| | | | | | | | | | | | | | | | | | | |
| | 1.63 | %(f) | | | 1.62 | %(f) | | | 1.60 | %(f) | | | N/A | | | | N/A | |
| | 1.60 | %(f) | | | 1.60 | %(f) | | | 1.60 | %(f) | | | N/A | | | | N/A | |
| | 3.29 | %(f) | | | 4.69 | %(f) | | | 4.15 | %(f) | | | N/A | | | | N/A | |
| | 3.33 | %(f) | | | 4.71 | %(f) | | | 4.15 | %(f) | | | N/A | | | | N/A | |
| | 121 | % | | | 40 | % | | | 70 | % | | | 91 | % | | | 117 | %(d) |
| Annual Report | September 30, 2017 | 113 |
| RiverNorth/Oaktree High Income Fund | Class R |
| Financial Highlights | For a share outstanding throughout the periods presented |
(a) | Based on average shares outstanding during the period. |
(b) | Less than $0.005 per share. |
(c) | Total return in the above table represents the rate that the investor would have earned or lost on an investment in the Fund, assuming reinvestment of dividends. |
(e) | The ratios exclude the impact of expenses of the underlying funds in which the Fund invests as represented in the Schedule of Investments. |
(f) | The portion of the ratios attributable to recoupments for the periods ended September 30, 2017, September 30, 2016 and September 30, 2015 were 0.00%, 0.01% and 0.07%, respectively. |
See Notes to Financial Statements.
| 114 | (888) 848-7569 | www.rivernorth.com |
| RiverNorth Funds | Notes to Financial Statements |
September 30, 2017
1. ORGANIZATION
The RiverNorth Funds (the “Trust” or “Funds”) was established under the laws of Ohio by an Agreement and Declaration of Trust dated July 18, 2006 (the “Trust Agreement”). The Trust is an open-end management investment company registered under the Investment Company Act of 1940, as amended (the “1940 Act”). The Trust Agreement permits the Board of Trustees (the “Board” or “Trustees”) to authorize and issue an unlimited number of shares of beneficial interest of a separate series without par value. All classes of shares for each of the Funds have identical rights to earnings, assets and voting privileges, except for class-specific expenses and exclusive rights to vote on matters affecting only individual classes. The Funds are considered investment companies and therefore follow the Investment Company accounting and reporting guidance of the Financial Accounting Standards Board (“FASB”) Accounting Standards Codification Topic 946 Financial Services Investment Companies.
The RiverNorth Core Opportunity Fund (the “Core Opportunity Fund”) was organized as a diversified series of the Trust on July 18, 2006 and commenced investment operations on December 27, 2006. The Core Opportunity Fund offers two series of shares, Class I Shares and Class R Shares. The investment adviser to the Core Opportunity Fund is RiverNorth Capital Management, LLC (the “Adviser”). The investment objective of the Core Opportunity Fund is to seek long-term capital appreciation and income.
The RiverNorth/DoubleLine Strategic Income Fund (the “Strategic Income Fund”) is a diversified series of the Trust and commenced investment operations on December 30, 2010. The Strategic Income Fund offers two series of shares, Class I Shares and Class R Shares. The investment adviser to the Strategic Income Fund is RiverNorth Capital Management, LLC. The Strategic Income Fund’s sub-adviser is DoubleLine Capital, LP (“DoubleLine”). The investment objective of the Strategic Income Fund is current income and overall total return.
The RiverNorth/Oaktree High Income Fund (the “High Income Fund”) is a diversified series of the Trust and commenced investment operations on December 28, 2012. The High Income Fund offers two series of shares, Class I Shares and Class R Shares. The investment adviser to the High Income Fund is RiverNorth Capital Management, LLC. The High Income Fund’s sub-adviser is Oaktree Capital Management, L.P. (“Oaktree Capital,” and with DoubleLine, each a “Sub-Adviser” or collectively, the “Sub-Advisers”). The investment objective of the High Income Fund is overall total return consisting of long-term capital appreciation and income.
2. SIGNIFICANT ACCOUNTING POLICIES
The following is a summary of significant accounting policies followed by the Funds. These policies are in conformity with generally accepted accounting principles in the United States of America (“GAAP”). The financial statements are prepared in accordance with GAAP, which requires management to make estimates and assumptions that affect the reported amounts and disclosures in the financial statements during the reporting period. Management believes the estimates and security valuations are appropriate; however, actual results may differ from those estimates, and the security valuations reflected in the financial statements may differ from the value the Funds ultimately realize upon sale of the securities. The financial statements have been prepared as of the close of the New York Stock Exchange (“NYSE”) on fiscal year end of the Funds.
| Annual Report | September 30, 2017 | 115 |
| RiverNorth Funds | Notes to Financial Statements |
September 30, 2017
Security Valuation: The Funds’ assets and other financial instruments are generally valued at their fair value using market quotations. If a market value quotation is unavailable a security may be valued at its estimated fair value as described in Note 3.
Security Transactions and Related Income: The Funds follow industry practice and record security transactions on the trade date basis. The specific identification method is used for determining gains or losses for financial statements and income tax purposes. Dividend income is recorded on the ex-dividend date or for certain foreign securities, when the information becomes available to the Funds, and interest income and expenses are recorded on an accrual basis. Discounts and premiums on securities purchased are amortized or accreted using the effective interest method. Withholding taxes on foreign dividends have been provided for in accordance with the Funds’ understanding of the applicable country’s tax rules and rates. The ability of issuers of debt securities held by the Funds to meet their obligations may be affected by economic and political developments in a specific country or region.
Foreign Currency Translation: The books and records of the Funds are maintained in U.S. dollars. Investment valuations and other assets and liabilities initially expressed in foreign currencies are converted each business day into U.S. dollars based upon current exchange rates. Prevailing foreign exchange rates may generally be obtained at the close of the NYSE (normally, 4:00 p.m. Eastern time). The portion of realized and unrealized gains or losses on investments due to fluctuations in foreign currency exchange rates is not separately disclosed and is included in realized and unrealized gains or losses on investments, when applicable.
Foreign Securities: The Funds may directly purchase securities of foreign issuers. Investing in securities of foreign issuers involves special risks not typically associated with investing in securities of U.S. issuers. The risks include possible revaluation of currencies, the ability to repatriate funds, less complete financial information about companies and possible future adverse political and economic developments. Moreover, securities of many foreign issuers and their markets may be less liquid and their prices more volatile than those of securities of comparable U.S. issuers.
Certain foreign countries impose a capital gains tax which is accrued by the Funds based on the unrealized appreciation, if any, on affected securities. Any accrual would reduce a Fund’s NAV. The tax is paid when the gain is realized and is included in capital gains tax in the Statements
of Operations.
Other: The Funds hold certain investments which pay dividends to their shareholders based upon available funds from operations. It is possible for these dividends to exceed the underlying investments’ taxable earnings and profits resulting in the excess portion of such dividends being designated as a return of capital. Distributions received from investments in securities that represent a return of capital or capital gains are recorded as a reduction of the cost of investments or as a realized gain, respectively.
Share Valuation: The net asset value (the “NAV”) is generally calculated as of the close of trading on the New York Stock Exchange (“the Exchange”) (normally 4:00 p.m. Eastern time) every day the Exchange is open. The NAV is calculated by taking the total value of each Fund’s or class’ assets, subtracting their liabilities, and then dividing by the total number of shares outstanding, rounded to the nearest cent. The offering price and redemption price per share is equal to the net asset value per share, except that shares of each Fund are subject to a redemption fee of 2% if redeemed within 90 days of purchase. For the year ended September 30, 2017, the Core Opportunity Fund, Strategic Income Fund, and High Income Fund received redemption fees of $42,525, $87,993, and $6,815, respectively.
| 116 | (888) 848-7569 | www.rivernorth.com |
| RiverNorth Funds | Notes to Financial Statements |
Expenses: Some expenses of the Trust can be directly attributed to a Fund or a Fund specific share class. Expenses which cannot be directly attributed are apportioned among all Funds and Fund series classes in the Trust based on average net assets.
Federal Income Taxes: The Funds make no provision for federal income tax. Each Fund intends to qualify each year as a “regulated investment company” under subchapter M of the Internal Revenue Code of 1986, as amended, by distributing substantially all of its taxable income. If the required amount of net investment income is not distributed, the Funds could incur a
tax expense.
As of and during the year ended September 30, 2017, the Funds did not have a liability for any unrecognized tax benefits. The Funds file U.S. federal, state, and local tax returns as required. The Funds’ tax returns are subject to examination by the relevant tax authorities until expiration of the applicable statute of limitations which is generally three years after the filing of the tax return for federal purposes and four years for most state returns. Tax returns for open years have incorporated no uncertain tax positions that require a provision for income taxes.
Distributions to Shareholders: Distributions to shareholders, which are determined in accordance with income tax regulations, are recorded on the ex-dividend date. The treatment for financial reporting purposes of distributions made to shareholders during the year from net investment income or net realized capital gains may differ from their ultimate treatment for federal income tax purposes. These differences are caused primarily by differences in the timing of recognition of certain components of income, expense, or realized capital gain for federal income tax purposes. Where such differences are permanent in nature, they are reclassified in the components of the net assets based on their ultimate characterization for federal income tax purposes. Any such reclassification will have no effect on net assets, results of operations or net asset values per share of the Funds.
3. SECURITIES VALUATION AND FAIR VALUE MEASUREMENTS
Fair value is defined as the price that a Fund might reasonably expect to receive upon selling an investment in a timely transaction to an independent buyer in the principal or most advantageous market of the investment. GAAP establishes a three-tier hierarchy to maximize the use of observable market data and minimize the use of unobservable inputs and to establish classification of fair value measurements for disclosure purposes.
Inputs refer broadly to the assumptions that market participants would use in pricing the asset or liability, including assumptions about risk, for example, the risk inherent in a particular valuation technique used to measure fair value including using such a pricing model and/or the risk inherent in the inputs to the valuation technique. Inputs may be observable or unobservable. Observable inputs are inputs that reflect the assumptions market participants would use in pricing the asset or liability developed based on market data obtained from sources independent of the reporting entity. Unobservable inputs are inputs that reflect the reporting entity’s own assumptions about the assumptions market participants would use in pricing the asset or liability developed based on the best information available in the circumstances.
| Annual Report | September 30, 2017 | 117 |
| RiverNorth Funds | Notes to Financial Statements |
September 30, 2017
Various inputs are used in determining the value of the Funds’ investments. These inputs are summarized in the three broad levels listed below.
| | • | Level 1 – Unadjusted quoted prices in active markets for identical, unrestricted assets or liabilities that a Fund has the ability to access at the measurement date; |
| | • | Level 2 – Quoted prices which are not active, quoted prices for similar assets or liabilities in active markets or inputs other than quoted prices that are observable (either directly or indirectly) for substantially the full term of the asset or liability; and |
| | • | Level 3 – Significant unobservable prices or inputs (including the Funds’ own assumptions in determining the fair value of investments) where there is little or no market activity for the asset or liability at the measurement date. |
The inputs used to measure fair value may fall into different levels of the fair value hierarchy. In such cases, for disclosure purposes, the level in the fair value hierarchy within which the fair value measurement falls in its entirety is determined based on the lowest level input that is significant to the fair value measurement in its entirety.
Equity securities, including common stocks, rights, warrants, closed-end funds, exchange-traded funds, preferred stocks, business development companies, and business development company notes are generally valued by using market quotations, but may be valued on the basis of prices furnished by a pricing service when the Adviser or a Sub-Adviser believes such prices more accurately reflect the fair market value of such securities. Securities that are traded on any stock exchange are generally valued by the pricing service at the last quoted sale price. Lacking a last sale price, an exchange traded security is generally valued by the pricing service at its last bid price. Securities traded in the NASDAQ over-the-counter market are generally valued by the pricing service at the NASDAQ Official Closing Price. When using the market quotations or close prices provided by the pricing service and when the market is considered active, the security will be classified as a Level 1 security. Sometimes, an equity security owned by the Funds will be valued by the pricing service with factors other than market quotations or when the market is considered inactive. When this happens, the security will be classified as a Level 2 security. When market quotations are not readily available, when the Adviser or a Sub-Adviser determines that the market quotation or the price provided by the pricing service does not accurately reflect the current fair value, or when restricted or illiquid securities are being valued, such securities are valued as determined in good faith by the Adviser, Sub-Adviser, or valuation committee in conformity with guidelines adopted by and subject to review by the Board. These securities will be categorized as Level 3 securities.
Investments in mutual funds, including short-term investments and open-end funds, are generally priced at the ending net asset value (NAV) provided by the service agent of the funds. These securities will be categorized as Level 1 securities.
Domestic and foreign fixed income securities, including foreign and U.S. corporate bonds, U.S. Government bonds and notes, foreign government bonds and notes, supranationals and foreign agencies, non-agency collateralized mortgage obligations, U.S. Government/Agency mortgage backed securities, bank loans, collateralized loan obligations, municipal bonds, and high yield debt, as well as non-exchange traded derivatives, including forward foreign currency contracts and total return swaps, are normally valued on the basis of quotes obtained from brokers and dealers or independent pricing services. Total Return swaps are valued based on a formula of the underlying asset’s nightly value, the Overnight London‐Interbank Offered Rate (“USD‐LIBOR”) and an annual fee or various agreed upon inputs. Foreign currency positions, including forward foreign currency contracts, are priced at the mean between the closing bid and asked prices at 4:00 p.m. Eastern time. Prices obtained from independent pricing services typically use information provided by market makers or estimates of market values obtained from yield data relating to investments or securities with similar characteristics. Data used to establish quotes includes analysis of cash flows, pre-payment speeds, default rates, delinquency assumptions and assumptions regarding collateral and loss assumptions. These securities will be classified as Level 2 securities.
| 118 | (888) 848-7569 | www.rivernorth.com |
| RiverNorth Funds | Notes to Financial Statements |
Short-term investments in fixed income securities, with maturities of less than 60 days when acquired, or which subsequently are within 60 days of maturity, are valued by using the amortized cost method of valuation, which the Board has determined will represent fair value. These securities will be classified as Level 2 securities.
In accordance with the Funds’ good faith pricing guidelines, the Adviser, Sub-Adviser, or valuation committee is required to consider all appropriate factors relevant to the value of securities for which it has determined other pricing sources are not available or reliable as described above. No single standard exists for determining fair value, because fair value depends upon the circumstances of each individual case. As a general principle, the current fair value of an issue of securities being valued by the Adviser, Sub-Adviser, or valuation committee would appear to be the amount which the owner might reasonably expect to receive for them upon their current sale. Methods which are in accordance with this principle may, for example, be based on (i) a multiple of earnings; (ii) discounted cash flow models; (iii) weighted average cost or weighted average price; (iv) a discount from market of a similar freely traded security (including a derivative security or a basket of securities traded on other markets, exchanges or among dealers); or (v) yield to maturity with respect to debt issues, or a combination of these and other methods. Good faith pricing is permitted if, in the Adviser’s, a Sub-Adviser’s, or the valuation committee’s opinion, the validity of market quotations appears to be questionable based on factors such as evidence of a thin market in the security based on a small number of quotations, a significant event occurs after the close of a market but before a Funds’ NAV calculation that may affect a security’s value, or the Adviser or a Sub-Adviser is aware of any other data that calls into question the reliability of market quotations.
Good faith pricing may also be used in instances when the bonds in which the Funds invest default or otherwise cease to have market quotations readily available. Investments in foreign securities, junk bonds, or other thinly traded securities are more likely to trigger good faith pricing than other securities.
| Annual Report | September 30, 2017 | 119 |
| RiverNorth Funds | Notes to Financial Statements |
The following is a summary of the inputs used at September 30, 2017 in valuing the Funds’ assets and liabilities:
| | | Valuation Inputs | | | | |
| Investments in Securities at Value* | | Level 1 | | | Level 2 | | | Level 3 | | | Total | |
| Closed‐End Funds | | $ | 219,684,512 | | | $ | – | | | $ | – | | | $ | 219,684,512 | |
| Business Development Companies | | | 3,172,307 | | | | – | | | | – | | | | 3,172,307 | |
| Common Stocks | | | 4,334,271 | | | | – | | | | – | | | | 4,334,271 | |
| Exchange‐Traded Funds | | | 38,654,300 | | | | – | | | | – | | | | 38,654,300 | |
| Preferred Stocks | | | 5,076,350 | | | | – | | | | – | | | | 5,076,350 | |
| Rights | | | 96 | | | | – | | | | – | | | | 96 | |
| Short‐Term Investments | | | 52,084,823 | | | | – | | | | – | | | | 52,084,823 | |
| Total | | $ | 323,006,659 | | | $ | – | | | $ | – | | | $ | 323,006,659 | |
Strategic Income Fund
| | | Valuation Inputs | | | | |
| Investments in Securities at Value* | | Level 1 | | | Level 2 | | | Level 3 | | | Total | |
| Closed‐End Funds | | $ | 534,360,639 | | | $ | – | | | $ | – | | | $ | 534,360,639 | |
| Business Development Companies | | | 18,365,601 | | | | – | | | | – | | | | 18,365,601 | |
| Business Development Company Notes | | | 15,041,885 | | | | – | | | | – | | | | 15,041,885 | |
| Common Stocks | | | 1,620,149 | | | | – | | | | – | | | | 1,620,149 | |
| Open‐End Funds | | | 28,154,818 | | | | – | | | | – | | | | 28,154,818 | |
| Preferred Stocks | | | 26,720,480 | | | | – | | | | – | | | | 26,720,480 | |
| Foreign Corporate Bonds | | | – | | | | 44,571,601 | | | | – | | | | 44,571,601 | |
| U.S. Corporate Bonds | | | – | | | | 62,712,084 | | | | – | | | | 62,712,084 | |
| Foreign Government Bonds and Notes, Supranationals and Foreign Agencies | | | – | | | | 9,913,182 | | | | – | | | | 9,913,182 | |
| Collateralized Loan Obligations | | | – | | | | 11,998,471 | | | | – | | | | 11,998,471 | |
| Non‐Agency Collateralized Mortgage Obligations | | | – | | | | 514,549,949 | | | | – | | | | 514,549,949 | |
| U.S. Government Bonds and Notes | | | – | | | | 193,009,488 | | | | – | | | | 193,009,488 | |
| Municipal Bonds | | | – | | | | 16,665,484 | | | | – | | | | 16,665,484 | |
| U.S. Government / Agency Mortgage Backed Securities | | | – | | | | 226,380,003 | | | | – | | | | 226,380,003 | |
| Short‐Term Investments | | | 508,743,172 | | | | 11,961,514 | | | | – | | | | 520,704,686 | |
| Warrants | | | 202 | | | | – | | | | – | | | | 202 | |
| Total | | $ | 1,133,006,946 | | | $ | 1,091,761,776 | | | $ | – | | | $ | 2,224,768,722 | |
| 120 | (888) 848-7569 | www.rivernorth.com |
| RiverNorth Funds | Notes to Financial Statements |
September 30, 2017
High Income Fund
| | | Valuation Inputs | | | |
| Investments in Securities at Value* | | Level 1 | | | Level 2 | | | Level 3 | | | Total | |
| Closed‐End Funds | | $ | 10,054,165 | | | $ | – | | | $ | – | | | $ | 10,054,165 | |
| Common Stocks | | | 26,027 | | | | – | | | | – | | | | 26,027 | |
| Preferred Stocks | | | 168,940 | | | | – | | | | 75,000 | | | | 243,940 | |
| Bank Loans | | | – | | | | 34,346,225 | | | | – | | | | 34,346,225 | |
| High Yield Debt | | | – | | | | 17,631,748 | | | | – | | | | 17,631,748 | |
| Short‐Term Investments | | | 15,043,307 | | | | – | | | | – | | | | 15,043,307 | |
| Total | | $ | 25,292,439 | | | $ | 51,977,973 | | | $ | 75,000 | | | $ | 77,345,412 | |
| | | | | | | | | | | | | |
| | | Valuation Inputs | | | | |
| Other Financial Instruments** | | Level 1 | | | Level 2 | | | Level 3 | | | Total | |
| Assets | | | | | | | | | | | | |
| Forward Foreign Currency Contracts | | $ | – | | | $ | 134,727 | | | $ | – | | | $ | 134,727 | |
| Liabilities | | | | | | | | | | | | | | | | |
| Forward Foreign Currency Contracts | | | – | | | | (135,985 | ) | | | – | | | | (135,985 | ) |
| Total | | $ | – | | | $ | (1,258 | ) | | $ | – | | | $ | (1,258 | ) |
| * | Refer to each Fund’s Schedule of Investments for a listing of securities by type. |
| ** | Other financial instruments are derivative instruments reflected in the Schedule of Investments. |
The changes of the fair value of investments for which the Funds have used Level 3 inputs to determine the fair value are as follows:
| Investments in Securities | | Balance as of October 1, 2017 | | | Change in Unrealized Appreciation/
Deperciation | | | Purchases | | | Sales Proceeds | | | Transfer into
Level 3 | | | Transfer Out of Level 3 | | | Balance
as of September
30, 2017 | | | Net change in unrealized
appreciation/
(depreciation) included in the Statements of Operations attributable to
Level 3
investments
held at
September
30, 2017 | |
| High Income Fund | | | | | | | | | | | | | | | | | | | | | | |
| Preferred Stock | | $ | - | | | $ | ( 58 | ) | | $ | 75,058 | | | $ | - | | | $ | 0 | | | $ | - | | | $ | 75,000 | | | $ | ( 58 | ) |
| | | $ | - | | | $ | ( 58 | ) | | $ | 75,058 | | | $ | - | | | $ | 0 | | | $ | - | | | $ | 75,000 | | | $ | ( 58 | ) |
| Annual Report | September 30, 2017 | 121 |
| RiverNorth Funds | Notes to Financial Statements |
The Table below provides additional information about the Level 3 Fair Value Measurements as of September 30, 2017:
Quantitative Information about Level 3 Fair Value Measurements
High Income Fund
| Asset Class | | Fair Value (USD) | | Valuation Technique | Unobservable Inputs(a) |
| Preferred Stock | | $ | 75,000 | | Last Transaction Price | Transaction Price |
(a) | A change to the unobservable input may result in a significant change to the value of the investment as follows: |
| Unobservable Input | Impact to Value if Input Increases | Impact to Value if Input Decreases |
| Transaction Price | Increase | Decrease |
It is the Funds’ policy to recognize transfers into and out of all levels at the end of the reporting period. There were no transfers between levels during the period.
4. DERIVATIVE FINANCIAL INSTRUMENTS
The following discloses the Funds’ use of derivative instruments. The Funds’ investment objectives not only permit the Funds to purchase investment securities, they also allow the Funds to enter into various types of derivative contracts such as total return swap contracts and forward foreign currency contracts. In doing so, the Funds will employ strategies in differing combinations to permit them to increase, decrease, or change the level or types of exposure to market factors. Central to those strategies are features inherent to derivatives that make them more attractive for this purpose than equity or debt securities; they require little or no initial cash investment, they can focus exposure on only certain selected risk factors, and they may not require the ultimate receipt or delivery of the underlying security (or securities) to the contract. This may allow the Funds to pursue their objectives more quickly and efficiently than if they were to make direct purchases or sales of securities capable of affecting a similar response to market factors.
Market Risk Factors: In pursuit of their investment objectives, the Funds may seek to use derivatives to increase or decrease their exposure to the following market risk factors:
Equity Risk: Equity risk relates to the change in value of equity securities as they relate to increases or decreases in the general market.
Foreign Exchange Rate Risk: Foreign exchange rate risk relates to the change in the U.S. dollar value of a security held that is denominated in a foreign currency. The value of a foreign currency denominated security will decrease as the dollar appreciates against the currency, while the value of the foreign currency denominated security will increase as the dollar depreciates against the currency.
| 122 | (888) 848-7569 | www.rivernorth.com |
| RiverNorth Funds | Notes to Financial Statements |
September 30, 2017Risk of Investing in Derivatives
The Funds’ use of derivatives can result in losses due to unanticipated changes in the market risk factors and the overall market. Derivatives may have little or no initial cash investment relative to their market value exposure and therefore can produce significant gains or losses in excess of their cost. This use of embedded leverage allows the Funds to increase their market value exposure relative to their net assets and can substantially increase the volatility of the Funds’ performance.
Additional associated risks from investing in derivatives also exist and potentially could have significant effects on the valuation of the derivative and the Funds. Typically, the associated risks are not the risks that the Funds are attempting to increase or decrease exposure to, per their investment objectives, but are the additional risks from investing in derivatives.
Examples of these associated risks are liquidity risk, which is the risk that the Funds will not be able to sell the derivative in the open market in a timely manner, and counterparty credit risk, which is the risk that the counterparty will not fulfill its obligation to the Funds.
Forward Foreign Currency Contracts
The Funds may engage in currency transactions with counterparties to hedge the value of portfolio securities denominated in particular currencies against fluctuations in relative value, to gain or reduce exposure to certain currencies, or to generate income or gains. A forward foreign currency contract is an agreement between two parties to buy and sell a currency at a set price on a future date. During the year ended September 30, 2017, the High Income Fund engaged in forward foreign currency contracts. The contracts are marked-to-market daily and the change in value is recorded by the High Income Fund as an unrealized gain or loss. When a forward foreign currency contract is extinguished, through either delivery or offset by entering into another forward foreign currency contract, the High Income Fund records a realized gain or loss equal to the difference between the value of the contract at the time it was opened and the value of the contract at the time it was extinguished.
Forward foreign currency contracts involve elements of market risk in excess of the amounts reflected in the Statement of Assets and Liabilities. The High Income Fund bears the risk of an unfavorable change in the foreign exchange rate underlying the forward foreign currency contract. Risks may also arise upon entering into these contracts from the potential inability of the counterparties to meet the terms of their contracts.
If required by the forward foreign currency contracts, the High Income Fund has segregated sufficient assets as collateral to satisfy the current obligations with respect to forward foreign currency contracts, and this is reflected as Cash segregated at custodian for forward foreign currency contracts on the High Income Fund’s Statement of Assets and Liabilities.
Total Return Swaps
Certain Funds may enter into total return swaps. During the year ended September 30, 2017, the Core Opportunity Fund and the Strategic Income Fund invested in total return swaps. Total return swaps are agreements that provide the Funds with a return based on the performance of an underlying asset (called a “reference asset”), in exchange for fee payments to a counterparty based on a specific rate of return. The difference in the value of these income streams is recorded daily by the Funds, and is settled in cash periodically. The fee paid by the Funds will typically be determined by multiplying the face value of the swap agreement by an agreed upon interest rate. Generally, the basis of the total return swap is the unamortized premium received or paid. The periodic swap payments received or made by the Funds are recorded in the Statement of Operations as realized gains or losses, respectively. When the swap is terminated, the Funds will record a realized gain or loss equal to the difference between the proceeds from (or cost of) the closing transaction and the Fund’s basis in the contract, if any. In addition, if the reference asset declines in value over the term of the swap, the Funds would also be required to pay the dollar value of that decline to the counterparty. Total return swaps could result in losses if the reference asset does not perform as anticipated by the Adviser. The Funds may use its own net asset value or the net asset value of a similar fund as the reference asset in a total return swap. This strategy serves to reduce “cash drag” (the impact of uninvested cash on the Fund’s overall return) by replacing it with the total return of the Fund’s own, or a similar fund’s investment holdings. The Funds record fluctuations in the value of open swap contracts on a daily basis as unrealized gains or losses.
Annual Report | September 30, 2017 | 123 |
| RiverNorth Funds | Notes to Financial Statements |
September 30, 2017
International Swaps and Derivatives Association, Inc. Master Agreements (“ISDA Master Agreements”) govern OTC financial derivative transactions entered into by a Fund and those counterparties. The ISDA Master Agreements maintain provisions for general obligations, representations, agreements, collateral and events of default or termination. Events of termination include conditions that may entitle counterparties to elect to terminate early and cause settlement of all outstanding transactions under the applicable ISDA Master Agreement.
If required by the swap agreement, the Funds have segregated sufficient assets as collateral to satisfy the current obligations with respect to total return swaps, and this is reflected as Cash segregated at custodian for total return swap contracts on each Fund's respective Statement of Assets and Liabilities.
The effect of derivatives instruments on each Fund's Statement of Assets and Liabilities as of September 30, 2017:
| | | Asset Derivatives | |
| Fund | Risk Exposure | Statement of Assets and Liabilities Location | | Fair Value | |
| High Income Fund | Foreign exchange rate risk (Forward foreign currency contracts) | Unrealized appreciation on forward foreign currency contracts | | $ | 134,727 | |
| | | Liabilities Derivatives | |
| Fund | Risk Exposure | Statement of Assets and Liabilities Location | | Fair Value | |
| High Income Fund | Foreign exchange rate risk (Forward foreign currency contracts) | Unrealized depreciation on forward foreign currency contracts | | $ | (135,985 | ) |
124 | (888) 848-7569 | www.rivernorth.com |
| RiverNorth Funds | Notes to Financial Statements |
September 30, 2017
The effect of derivatives instruments on each Fund's Statement of Operations for the year ended September 30, 2017:
| Fund | Risk Exposure | Statement of Operations Location | | Realized Gain/(Loss) on Derivatives Recognized in Income | | | Change in Unrealized Appreciation/ (Depreciation) on Derivatives Recognized in Income | |
| Core Opportunity Fund | Equity Contracts (Total return swap contracts) | Net realized gain/(loss) on Total return swap contracts/ Net change in unrealized appreciation/depreciation on Total return swap contracts | | $ | 752,677 | | | $ | (835,285 | ) |
| Strategic Income Fund | Equity Contracts (Total return swap contracts) | Net realized gain/(loss) on Affiliated Investments and Total return swap contracts/ Net change in unrealized appreciation/depreciation on Affiliated Investments and Total return swap contracts | | $ | 1,077,134 | | | $ | (1,364,980 | ) |
| High Income Fund | Foreign exchange rate risk (Forward foreign currency contracts) | Net realized gain/(loss) Translation of assets and liabilities denominated in foreign currencies and forward foreign currency contracts/ Net change in unrealized appreciation/ depreciation on Translation of assets and liabilities denominated in foreign currencies and forward foreign currency contracts | | $ | (1,320,032 | ) | | $ | 51,785 | |
Annual Report | September 30, 2017 | 125 |
| RiverNorth Funds | Notes to Financial Statements |
September 30, 2017
The forward currency contracts and total return swap contracts average notional amount during the year ended September 30, 2017 is noted below.
| Fund | | Average Notional Amount of Total Return Swap Contracts | |
| Core Opportunity Fund | | $ | 16,345,761 | |
| Strategic Income Fund | | $ | 1,350,286 | |
| Fund | | Average Notional Amount of Forward Foreign Currency Contracts | |
| High Income Fund | | $ | 17,274,238 | |
Offsetting Arrangements: Certain derivative contracts are executed under standardized netting agreements. A derivative netting arrangement creates an enforceable right of set-off that becomes effective, and affects the realization of settlement on individual assets, liabilities and collateral amounts, only following a specified event of default or early termination. Default events may include the failure to make payments or deliver securities timely, material adverse changes in financial condition or insolvency, the breach of minimum regulatory capital requirements, or loss of license, charter or other legal authorization necessary to perform under the contract. These agreements mitigate counterparty credit risk by providing for a single net settlement with a counterparty of all financial transactions covered by the agreement in an event of default as defined under
such agreement.
126 | (888) 848-7569 | www.rivernorth.com |
| RiverNorth Funds | Notes to Financial Statements |
September 30, 2017
The following table presents derivative financial instruments that are subject to enforceable netting arrangements, collateral arrangements or other similar agreements as of September 30, 2017.
| Offsetting of Derivatives Asset |
| | | | | | | | | | | | | | | Gross Amounts Not Offset in the Statements of Assets and Liabilities | | | | |
| | | Gross Amounts of Recognized Assets | | | Gross Amounts Offset in the Statements of Assets and Liabilities | | | Net Amounts Presented in the Statements of Assets and Liabilities | | | Financial Instruments Available for Offset(a) | | | Cash Collateral Received(a) | | | Net Amount | |
| High Income Fund | |
| Forward Foreign Currency Contracts | | $ | 134,727 | | | $ | – | | | $ | 134,727 | | | $ | (134,727 | ) | | $ | – | | | $ | – | |
| Total | | $ | 134,727 | | | $ | – | | | $ | 134,727 | | | $ | (134,727 | ) | | $ | – | | | $ | – | |
| Offsetting of Derivatives Liability |
| | | | | | | | | | | | | | | Gross Amounts Not Offset in the Statement of Assets and Liabilities | | | | |
| | | Gross Amounts of Recognized Liabilities | | | Gross Amounts Offset in the Statement of Assets and Liabilities | | | Net Amounts Presented in the Statement of Assets and Liabilities | | | Financial Instruments Available for Offset(a) | | | Cash Collateral Pledged(a) | | | Net Amount | |
| High Income Fund | |
| Forward Foreign Currency Contracts | | $ | 135,985 | | | | | | $ | 135,985 | | | $ | (134,727 | ) | | $ | (1,258 | ) | | $ | – | |
| Total | | $ | 135,985 | | | $ | – | | | $ | 135,985 | | | $ | (134,727 | ) | | $ | (1,258 | ) | | $ | – | |
(a) | These amounts are limited to the derivatives asset/liability balance and, accordingly, do not include excess collateral received/pledged. |
Annual Report | September 30, 2017 | 127 |
| RiverNorth Funds | Notes to Financial Statements |
September 30, 2017
5. loan participations and assignments
The High Income Fund may invest in direct debt instruments which are interests in amounts owed to lenders or lending syndicates by corporate, governmental, or other borrowers. The High Income Fund will normally invest in corporate debt issuers in North America and Europe. The High Income Fund investments in loans may be in the form of participations in loans or assignments of all or a portion of loans from third parties. A loan is often administered by a bank or other financial institution (the “lender”) that acts as agent for all holders. The agent administers the terms of the loan, as specified in the loan agreement. The High Income Fund may invest in multiple series or tranches of a loan, which may have varying terms and carry different associated risks. The High Income Fund will generally purchase assignments of these loans, in which case it will typically become a lender for purposes of the relevant loan agreement with direct contractual rights against the borrower, including the right to receive payments of principal and interest. When purchasing participation interests in a loan, the High Income Fund generally has no right to enforce compliance with the terms of the loan agreement with the borrower. As a result, the High Income Fund may be subject to the credit risk of both the borrower and the lender that is selling the loan agreement. The High Income Fund may enter into unfunded loan commitments, which are contractual obligations for future funding. Unfunded loan commitments represent a future obligation in full, even though a percentage of the notional loan amounts may not be utilized by the borrower. When investing in a loan participation, the High Income Fund has the right to receive payments of principal, interest and any fees to which it is entitled only from the lender selling the loan agreement and only upon receipt of payments by the lender from the borrower. The High Income Fund may receive a commitment fee based on the undrawn portion of the underlying line of credit portion of a floating rate loan. In certain circumstances, the High Income Fund may receive a penalty fee upon the prepayment of a floating rate loan by a borrower. Fees earned are recorded as a component of interest income or interest expense, respectively, on the Statement of Operations. At September 30, 2017, the High Income Fund had $9,282,763 in unsettled domestic and foreign loan commitments.
6. Advisory Fees, Trustee Fees and other agreements
The Adviser serves as the investment adviser to the Funds. Under the terms of the management agreement (the “Agreement”), the Adviser, subject to the supervision of the Board, provides or arranges to be provided to the Funds such investment advice as it deems advisable and will furnish or arrange to be furnished a continuous investment program for the Funds consistent with the Funds’ investment objectives and policies. As compensation for its management services, the Funds are obligated to pay the Adviser a fee computed and accrued daily and paid monthly in arrears at an annual rate of the average daily net assets of the Funds.
The Chief Compliance Officer (“CCO”) of the Funds is an affiliate of the Funds. For the year ended September 30, 2017, the total related amounts paid by the Funds for CCO fees are included in Compliance expenses on the Statement of Operations.
128 | (888) 848-7569 | www.rivernorth.com |
| RiverNorth Funds | Notes to Financial Statements |
September 30, 2017
The following table reflects the Funds’ contractual management fee rates (expressed as an annual rate).
| Fund | Contractual Management Fee |
| Core Opportunity Fund | 1.00% |
| Strategic Income Fund | 0.75% |
| High Income Fund | 1.00% |
The Adviser has contractually agreed to waive High Income Fund’s management fees and/or reimburse expenses (excluding brokerage fees and commissions; borrowing costs such as (a) interest and (b) dividends on securities sold short; taxes; indirect expenses incurred by the underlying funds in which the Fund invests; and extraordinary expenses) of the High Income Fund until at least January 31, 2019 in order to maintain the Total Annual Fund Operating Expenses After Fee Deferral and/or Reimbursement at 1.60% and 1.35% for the Class R shares and Class I shares, respectively. This agreement may be terminated by the Fund’s Board of Trustees on 60 days written notice to the Adviser. Any waiver or reimbursement is subject to repayment by the High Income Fund within three years following the fiscal year in which the expenses occurred if the Fund is able to make the repayment without exceeding its current expense limitation and the repayment is approved by the Board of Trustees.
As of the year ended September 30, 2017, reimbursed expenses for the High Income Fund subject to potential recovery by year of expiration are as follows:
| | | Expiring September 30, | |
| | | 2018 | | | 2019 | | | 2020 | |
| High Income Fund | | | | | | | | | |
| Class I | | | N/A | | | | N/A | | | | N/A | |
| Class R | | $ | N/A | | | | 1,430 | | | $ | 2,773 | |
| Total | | $ | N/A | | | | 1,430 | | | $ | 2,773 | |
For the year ended September 30, 2017, the Adviser opted to forgo $158,441 in management fees in the Strategic Income Fund related to the Fund's investment in an affiliate fund, the High Income Fund.
DoubleLine is the investment sub-adviser to the Strategic Income Fund. Oaktree Capital is the investment sub-adviser to the High Income Fund. Under the terms of the sub-advisory agreements, the Sub-Advisers, subject to the supervision of the Adviser and the Board of the Trust, provide to the Strategic Income Fund and the High Income Fund such investment advice as deemed advisable and will furnish a continuous investment program for the portion of assets managed in the respective Fund consistent with the respective Fund's investment objective and policies. As compensation for its sub-advisory services, the Adviser is obligated to pay each Sub-Adviser a fee computed and accrued daily and paid monthly in arrears based on an annual rate of the average daily net assets of the Strategic Income Fund and the High Income Fund.
ALPS Fund Services, Inc. (“ALPS”) provides the Funds with fund administration and fund accounting services. ALPS also serves as transfer agent, dividend paying and shareholder servicing agent for the Funds (“Transfer Agent”).
State Street Bank & Trust, Co. serves as the Funds’ custodian.
The Funds have adopted a plan pursuant to Rule 12b-1 under the Investment Company Act of 1940, as amended (the “Plan”). The Plan permits the Funds to pay the Adviser for distribution and promotion expenses related to marketing shares of the Funds. The amount payable annually by the Class R shares of the Core Opportunity Fund, the Class R Shares of the Strategic Income Fund, and the Class R Shares of the High Income Fund is 0.25% of the average daily net assets. Under the Plan the Trust may engage in any activities related to the distribution of Fund shares. The expenses of the Funds’ Plan are reflected as 12b-1 fees in the Statements of Operations.
Annual Report | September 30, 2017 | 129 |
| RiverNorth Funds | Notes to Financial Statements |
September 30, 2017
The Funds have entered into a Distribution Agreement with ALPS Distributors, Inc. (“the Distributor”), an affiliate of ALPS, to provide distribution services to the Funds. The Distributor serves as underwriter/distributor of shares of the Funds.
Officers of the Trust and Trustees who are “interested persons” of the Trust or the Adviser received no salary or fees from the Trust. Effective October 1, 2016, each Trustee who is not an “interested person” receives a fee of $16,500 per year, plus $1,500 per meeting attended from the Trust. In addition, the chair of the audit committee receives $500 annually and the lead independent Trustee receives $250 annually. The Trust reimburses each Trustee and Officer for his or her travel and other expenses relating to attendance at such meetings. The Trustees are also compensated for their services as independent directors of other funds within the fund complex.1
Certain Trustees and Officers of the Trust are also officers of the Adviser, the Distributor or ALPS Fund Services, Inc.
1 | The Fund Complex consists of the RiverNorth Core Opportunity Fund, the RiverNorth/DoubleLine Strategic Income Fund, and the RiverNorth/Oaktree High Income Fund, each a series of the RiverNorth Funds Trust, and the RiverNorth Opportunities Fund, Inc., RiverNorth/DoubleLine Strategic Opportunity Fund, Inc. and the RiverNorth Marketplace Lending Corporation. |
7. TAX BASIS INFORMATION
Tax Basis of Distributions to Shareholders: The character of distributions made during the year from net investment income or net realized gains may differ from its ultimate characterization for federal income tax purposes. Also, due to the timing of dividend distributions, the fiscal year in which amounts are distributed may differ from the fiscal year in which the income or realized gain were recorded by a Fund.
The tax character of distributions paid by the Funds during the fiscal year ended September 30, 2017, was as follows:
| | | Ordinary Income | | | Tax-Exempt Income | | | Distributions paid from Long-Term Capital Gain | | | Return of Capital | | | Total | |
| Core Opportunity Fund* | | $ | 13,479,295 | | | $ | 23,723 | | | $ | 10,177,520 | | | $ | – | | | $ | 23,680,538 | |
| Strategic Income Fund* | | | 95,846,805 | | | | 529,827 | | | | 1,140,967 | | | | – | | | | 97,517,599 | |
| High Income Fund* | | | 3,223,946 | | | | – | | | | – | | | | 286,026 | | | | 3,509,972 | |
130 | (888) 848-7569 | www.rivernorth.com |
| RiverNorth Funds | Notes to Financial Statements |
September 30, 2017
The tax character of distributions paid by the Funds during the fiscal year ended September 30, 2016, was as follows:
| | | Ordinary Income | | | Tax-Exempt Income | | | Distributions paid from Long-Term Capital Gain | | | Return of Capital | | | Total | |
| Core Opportunity Fund* | | $ | 28,127,548 | | | $ | 980,957 | | | $ | 31,736,186 | | | $ | 6,414,437 | | | $ | 67,259,128 | |
| Strategic Income Fund* | | | 120,507,425 | | | | – | | | | – | | | | 3,333,128 | | | | 123,840,553 | |
| High Income Fund* | | | 5,088,917 | | | | – | | | | – | | | | 231,129 | | | | 5,320,046 | |
| | | | | | | | | | | | | | | | | | | | | |
* | Classification of Distributions: Net investment income and net realized gain may differ for financial statement and tax purposes. The character of distributions made during the year from net investment income or net realized gains may differ from its ultimate characterization for federal income tax purposes. |
Components of Distributable Earnings on a Tax Basis: The tax components of distributable earnings are determined in accordance with income tax regulations which may differ from the composition of net assets reported under GAAP. Accordingly, for the year ended September 30, 2017, certain differences were reclassified. These differences were primarily due to book/tax distribution differences, tax treatment of passive foreign investment companies, principle payments, and to the different tax treatment of certain other investments; the amounts reclassified did not affect net assets. The reclassifications were as follows:
| | | Paid-in Capital | | | Accumulated Net Investment Income/(Loss) | | | Accumulated Net Realized Gain/(Loss) | |
| Core Opportunity Fund | | $ | (4,491,886 | ) | | $ | 7,430,033 | | | $ | (2,938,147 | ) |
| Strategic Income Fund | | | (3,391,600 | ) | | | 9,079,464 | | | | (5,687,864 | ) |
| High Income Fund | | | (77,449 | ) | | | (1,201,711 | ) | | | 1,279,160 | |
At September 30, 2017, the components of distributable earnings on a tax basis for the Funds were as follows:
| | | Undistributed Ordinary Income | | | Accumulated Capital Gains/(Losses) | | | Net Unrealized Appreciation/ (Depreciation) | | | Other Cumulative Effect of Timing Differences | | | Total | |
| Core Opportunity Fund | | $ | – | | | $ | 37,470,920 | | | $ | 30,832,550 | | | $ | (984 | ) | | $ | 68,302,486 | |
| Strategic Income Fund | | | – | | | | 6,518,434 | | | | (40,730,294 | ) | | | (3,379,439 | ) | | | (37,591,299 | ) |
| High Income Fund | | | – | | | | (3,148,874 | ) | | | 882,297 | | | | (1,791,575 | ) | | | (4,058,152 | ) |
Capital Losses: As of September 30, 2017 the following Funds had capital loss carryforwards which may reduce the applicable Fund’s taxable income arising from future net realized gains on investments, if any, to the extent permitted by the Code and thus may reduce the amount of the distributions to shareholders which would otherwise be necessary to relieve the Funds of any liability for federal tax pursuant to the Code. The capital loss carryforwards may be carried forward indefinitely. Other cumulative effect of timing differences were primarily due to treatment of defaulted security, late ordinary loss, and to the different tax treatment of certain other investments.
| Annual Report | September 30, 2017 | 131 |
| RiverNorth Funds | Notes to Financial Statements |
September 30, 2017
The Strategic Income Fund capital loss carryovers used during the year ended September 30, 2017 were $2,222,288.
Capital losses carried forwards were as follows:
| Fund | | Non-Expiring Short-Term | | | Non-Expiring Long-Term | |
| High Income Fund | | $ | 721,365 | | | $ | 2,099,273 | |
The High Income Fund has elected to defer to the year ending September 30, 2018, capital losses recognized during the period November 1, 2016 to September 30, 2017, in the amount of $328,236.
The High Income Fund elected to defer to the year ending September 30, 2018, late ordinary losses in the amount of $1,792,659.
Unrealized Appreciation and Depreciation on Investments: The amount of net unrealized appreciation/(depreciation) and the cost of investment securities for tax purposes, including short-term securities at September 30, 2017, were as follows:
| Fund | | Gross Appreciation (excess of value over tax) | | | Gross Depreciation (excess of tax cost over value) | | | Net Appreciation/ (Depreciation) on Foreign Currency and Derivatives | | | Net Unrealized Appreciation/ (Depreciation) | | | Cost of Investments for Income Tax Purposes | |
| Core Opportunity Fund* | | $ | 35,917,341 | | | $ | (5,084,791 | ) | | $ | – | | | $ | 30,832,550 | | | $ | 292,174,109 | |
| Strategic Income Fund* | | | 70,925,556 | | | | (111,655,850 | ) | | | – | | | | (40,730,294 | ) | | | 2,265,499,016 | |
| High Income Fund* | | | 1,888,920 | | | | (962,543 | ) | | | (44,080 | ) | | | 882,297 | | | | 76,419,035 | |
* | The difference between book and tax basis unrealized appreciation/(depreciation) for the Funds is attributable primarily to PFIC’s, wash sales and tax treatment of certain other investments. |
| 132 | (888) 848-7569 | www.rivernorth.com |
| RiverNorth Funds | Notes to Financial Statements |
September 30, 2017
8. INVESTMENT TRANSACTIONS
Investment transactions for the year ended September 30, 2017, excluding U.S. Government Obligations and short-term investments, were as follows:
| Fund | | Purchases of
Securities | | | Proceeds from
Sales of Securities | |
| Core Opportunity Fund | | $ | 160,214,450 | | | $ | 364,488,103 | * |
| Strategic Income Fund | | | 670,088,045 | | | | 599,643,813 | |
| High Income Fund | | | 92,189,784 | | | | 105,797,558 | |
* | Does not include redemption in-kind. |
Investment Transactions in U.S. Government Obligations for the year ended September 30, 2017 were as follows:
| Fund | | Purchases of Securities | | | Proceeds from Sales of Securities | |
| Strategic Income Fund | | $ | 315,203,569 | | | $ | 208,049,810 | |
9. Investments in affiliated Companies
Funds may invest in certain securities that are considered securities issued by affiliated companies. As defined by the Investment Company Act of 1940, an affiliated person, including an affiliated company, is one in which a Fund owns 5% or more of the outstanding voting securities, or a company which is under common ownership or control with the Fund. The purchases, sales, dividend income, capital gains, shares and value of investment in affiliated companies for the year ended September 30, 2017 were as follows:
Core Opportunity Fund
| Security Name | | Share Balance
as of October 1, 2016 | | | Purchases | | | Sales | | Share
Balance
as of September 30, 2017 | | Market
Value
as of September 30, 2017 | | Dividends | | | Change
in Unrealized Gain
(Loss) | | | Realized Gain(Loss) | |
| Clough Global Opportunities Fund* | | | 3,053,415 | | | | 224,968 | | | | (1,757,198 | ) | | 1,521,185 | | $ | 16,976,425 | | $ | 540,635 | | | $ | 5,680,568 | | | $ | (523,424 | ) |
| Clough Global Equity Fund* | | | 1,211,584 | | | | 89,794 | | | | (728,554 | ) | | 572,824 | | $ | 7,595,646 | | $ | 232,980 | | | | 1,729,670 | | | $ | 176,609 | |
| | | | | | | | | | | | | | | | | $ | 24,572,071 | | $ | 773,615 | | | $ | 7,410,238 | | | $ | (346,815 | ) |
| Annual Report | September 30, 2017 | 133 |
| RiverNorth Funds | Notes to Financial Statements |
September 30, 2017
Strategic Income Fund
| Security Name | | Share Balance as of October 1, 2016 | | | Purchases | | Share Balance as of September 30, 2017 | | Market Value as of September
30, 2017 | | Dividends | | | Change in Unrealized Gain (Loss) | | | Realized Gain (Loss) | |
RiverNorth/
Oaktree High Income Fund, Class I | | | 2,772,396 | | | | 120,738 | | | 2,893,133 | | $ | 28,154,818 | | $ | 1,081,970 | | | $ | 786,103 | | | $ | – | |
| | | | | | | | | | | | | $ | 28,154,818 | | $ | 1,081,970 | | | $ | 786,103 | | | $ | – | |
* | At October 1, 2016 the Fund owned more than 5% of the outstanding shares of this security. Due to sales within the period, this security is not considered an affiliate as of September 30, 2017. |
10. Related Party Transactions
The Funds are permitted to purchase and sell securities from or to certain affiliates under specific conditions outlined in the Rule 17a-7 procedures adopted by the Board. The procedures are designed to ensure that any purchase or sale of securities by a Fund from or to another fund that is or could be considered an affiliate by virtue of having a common investment adviser (or affiliated investment advisers), common trustees and/or common officers complies with Rule 17a-7 under the 1940 Act. Each transaction is effected at the current market price as defined in the Rule 17a-7 procedures. During the year ended September 30, 2017, the RiverNorth Core Opportunity Fund made in-kind redemptions of securities with the Brinker Destinations Multi-Strategy Alternatives Fund (the “Brinker Fund”), which is an affiliated fund due to the Adviser’s engagement as a subadviser to the Brinker Fund. The intent of the transactions was to save on transaction costs for both the Brinker Fund and for the RiverNorth Core Opportunity Fund on the sale of assets. The in-kind redemption transactions were in the amount of $206,766,833, of which $161,101,678 was the market value of securities, with a realized gain of $7,580,877.
The Core Opportunity Fund and the RiverNorth Equity Opportunity Fund engaged in cross trades with each other during the year ended September 30, 2017 pursuant to Rule 17a-7 under the 1940 Act. Generally, cross trading is the buying or selling of portfolio securities between funds to which the Adviser serves as the investment adviser. The Board previously adopted procedures that apply to transactions between the Funds and its affiliates pursuant to Rule 17a-7. At its regularly scheduled meetings, the Board reviews such transactions as of the most current calendar quarter for compliance with the requirements set forth by Rule 17a-7 and the Funds’ procedures. The procedures require that the transactions be a purchase or sale for no consideration other than cash payment against prompt delivery of a security for which market quotations are readily available, and be consistent with the investment policies of each Fund. The Core Opportunity Fund purchased securities from the RiverNorth Equity Opportunity Fund in the amount of $3,940,741, resulting in a realized loss of $415,140 in the RiverNorth Equity Opportunity Fund.
| 134 | (888) 848-7569 | www.rivernorth.com |
| RiverNorth Funds | Notes to Financial Statements |
September 30, 2017
11. REVOLVING LINE OF CREDIT
On April 8, 2014, the Funds entered into a $100,000,000 committed unsecured Revolving Credit Agreement with State Street Bank & Trust, Co. The Revolving Credit Agreement was amended on April 17, 2015, April 5, 2016 and on April 4, 2017. The Revolving Credit Agreement expires on April 3, 2018. Borrowings under this arrangement bear interest at the higher of the Federal Funds Rate and the One-Month LIBOR Rate in effect on the day the loan is made plus 1.25%, which is 2.48% as of September 30, 2017. From October 1, 2016 through September 30, 2017, the Funds paid a facility fee on unloaned balances equal to the product of $100,000,000 less the principal amount of loans outstanding and 0.25%. For the year ended September 30, 2017, the Core Opportunity Fund borrowed $100,000,000 from April 5, 2017 to April 6, 2017 at an interest rate of 2.24%. These amounts reflect the average borrowing amount and interest rate during the year for the days the Fund borrowed. No other Fund borrowed under the agreement during the year presented.
12. BENEFICIAL OWNERSHIP
On September 30, 2017, there were an unlimited number of no par value shares of beneficial interest authorized for each Fund. Transactions in shares of beneficial interest are shown in the Statements of Changes in Net Assets.
The beneficial ownership, either directly or indirectly, of more than 25% of the voting securities of a fund creates a presumption of control of the fund, under Section 2(a)(9) of the Investment Company Act of 1940. Beneficial owners owning more than 25% of the voting securities for the benefit of their customers of each class of each Fund, as of September 30, 2017, are listed below:
| Fund | Shareholder Name | Percentage Interest |
| Core Opportunity Fund - Class I | National Financial Services, LLC | 37.85% |
| Core Opportunity Fund - Class I | Charles Schwab & Company, Inc. | 35.51% |
| Core Opportunity Fund - Class R | National Financial Services, LLC | 63.90% |
| Strategic Income Fund - Class I | Charles Schwab & Company, Inc. | 32.53% |
| Strategic Income Fund - Class R | Charles Schwab & Company, Inc. | 42.36% |
| High Income Fund - Class I | RiverNorth/DoubleLine Strategic Income Fund | 44.10% |
| High Income Fund - Class R | Charles Schwab & Company, Inc. | 58.09% |
13. INDEMNIFICATIONS
Under the Trust’s organizational documents, its officers and Trustees are indemnified against certain liability arising out of the performance of their duties to the Trust. Additionally, in the normal course of business, the Trust enters into contracts with service providers that may contain general indemnification clauses. The Trust’s maximum exposure under these arrangements is unknown, as this would involve future claims that may be made against the Trust that have not yet occurred.
| Annual Report | September 30, 2017 | 135 |
| RiverNorth Funds | Report of Independent Registered Public Accounting Firm |
September 30, 2017
To the Shareholders and Board of Trustees of
RiverNorth Funds
We have audited the accompanying statements of assets and liabilities, including the schedules of investments, of RiverNorth Funds, comprising RiverNorth Core Opportunity Fund, RiverNorth/DoubleLine Strategic Income Fund, and RiverNorth/Oaktree High Income Fund (the “Funds”) as of September 30, 2017, and the related statements of operations for the year then ended, the statements of changes in net assets for each of the two years in the period then ended, and the financial highlights for each of the five periods in the period then ended. These financial statements and financial highlights are the responsibility of the Funds’ management. Our responsibility is to express an opinion on these financial statements and financial highlights based on our audits.
We conducted our audits in accordance with the standards of the Public Company Accounting Oversight Board (United States). Those standards require that we plan and perform the audit to obtain reasonable assurance about whether the financial statements and financial highlights are free of material misstatement. An audit includes examining, on a test basis, evidence supporting the amounts and disclosures in the financial statements. Our procedures included confirmation of securities owned as of September 30, 2017, by correspondence with the custodian, agent banks, and brokers, or by other appropriate auditing procedures where replies from agent banks or brokers were not received. An audit also includes assessing the accounting principles used and significant estimates made by management, as well as evaluating the overall financial statement presentation. We believe that our audits provide a reasonable basis for our opinion.
In our opinion, the financial statements and financial highlights referred to above present fairly, in all material respects, the financial position of each of the Funds constituting RiverNorth Funds as of September 30, 2017, the results of their operations for the year then ended, the changes in their net assets for each of the two years in the period then ended, and the financial highlights for each of the five periods in the period then ended, in conformity with accounting principles generally accepted in the United States of America.

COHEN & COMPANY, LTD.
Cleveland, Ohio
November 29, 2017
| 136 | (888) 848-7569 | www.rivernorth.com |
| RiverNorth Funds | Additional Information |
September 30, 2017 (Unaudited)
PROXY VOTING GUIDELINES
A description of the policies and procedures that the Funds used to determine how to vote proxies relating to portfolio securities and information regarding how the Funds voted proxies during the most recent 12-month period ended June 30, are available without charge upon request by (1) calling the Funds at (888) 848-7569 and (2) from Form N-PX filed by the Funds with the Securities and Exchange Commission (“SEC”) on the SEC’s website at www.sec.gov.
PORTFOLIO HOLDINGS DISCLOSURE POLICY
The Funds file a complete schedule of investments with the SEC for the first and third quarter of each fiscal year on Form N-Q. The Funds’ first and third fiscal quarters end on December 31 and June 30. The Form N-Q filing must be made within 60 days of the end of the quarter. The Funds’ Forms N-Q are available on the SEC’s website at www.sec.gov, or they may be reviewed and copied at the SEC’s Public Reference Room in Washington, DC (call 1-800-732-0330 for information on the operations of the Public Reference Room). You may also obtain copies by calling the Funds at 1-888-848-7569.
TAX INFORMATION
The RiverNorth Core Opportunity and RiverNorth DoubleLine Strategic Income Funds designate the following for federal income tax purposes for the year ended September 30, 2017:
| | Foreign Taxes Paid | Foreign Source Income |
| RiverNorth Core Opportunity Fund | $159,198 | $1,501,960 |
| RiverNorth DoubleLine Strategic Income Fund | $55,217 | $460,328 |
| | Tax-Exempt Percentage |
| RiverNorth Core Opportunity Fund | 0.28% |
| RiverNorth DoubleLine Strategic Income Fund | 0.58% |
Of the distributions paid by the Funds from ordinary income for the calendar year ended December 31, 2016, the following percentages met the requirements to be treated as qualifying for the corporate dividends received deduction and qualified dividend income:
| | Dividend Received Deduction | Qualified Dividend Income |
| RiverNorth Core Opportunity Fund | - | 30.75% |
| RiverNorth DoubleLine Strategic Income Fund | - | 0.93% |
| RiverNorth/Oaktree High Income Fund | - | 0.43% |
| Annual Report | September 30, 2017 | 137 |
| RiverNorth Funds | Additional Information |
September 30, 2017 (Unaudited)
In early 2017, if applicable, shareholders of record received this information for the distributions paid to them by the Funds during the calendar year 2016 via Form 1099. The Funds will notify shareholders in early 2018 of amounts paid to them by the Funds, if any, during the calendar year 2017.
Pursuant to Section 852(b)(3) of the Internal Revenue Code, RiverNorth Core Opportunity Fund and RiverNorth DoubleLine Strategic Income Fund, designated $10,177,520 and $1,140,968 respectively, as long-term capital gain dividends.
| 138 | (888) 848-7569 | www.rivernorth.com |
| RiverNorth Funds | Trustees and Officers |
September 30, 2017 (Unaudited)
The following table provides information regarding each Trustee who is not an “interested person” of the Trust, as defined in the 1940 Act.
| INDEPENDENT TRUSTEES |
Name, Address1 and Year of Birth | Position(s) Held with the Fund | Term of Office/ Length of Time Served | Principal Occupation(s) During Past 5 Years | Number of Portfolios in Fund Complex Overseen by Trustee2 | Other Directorships Held by Trustee During the Past 5 Years |
John K. Carter Y.O.B. 1961 | Trustee | Indefinite/ January 2013 to present | Partner, Law Office of John K. Carter, P.A. (2015 to present); Managing Partner, Global Recruiters of St. Petersburg (a financial services consulting and recruiting firm) (2012 to 2015); Business Unit Head, Transamerica Asset Management (2006 to 2012). | 6 | Trustee, Eagle Series Trust (16 portfolios) (open-end mutual funds) (2016 to present). Director, Chairman of the Board of Directors, Transamerica Funds (120 funds) (2006 to 2012). Board Member, United Way of Tampa Bay (2011 to 2012) |
James G. Kelley Y.O.B. 1948 | Trustee | Indefinite/ December 2006 to present | Certified Business Coach, JGK & Associates (2000 to present). | 5 | N/A |
John S. Oakes Y.O.B. 1943 | Trustee; Lead Independent Trustee | Indefinite/ December 2010 to present | Principal, Financial Search and Consulting (a recruiting and consulting firm) (2013 to present); Regional Vice President, Securities America (a broker-dealer) (2007
to 2013). | 6 | N/A |
| Annual Report | September 30, 2017 | 139 |
| RiverNorth Funds | Trustees and Officers |
September 30, 2017 (Unaudited) | INDEPENDENT TRUSTEES |
Name, Address1 and Year of Birth | Position(s) Held with the Fund | Term of Office/ Length of Time Served | Principal Occupation(s) During Past 5 Years | Number of Portfolios in Fund Complex Overseen by Trustee2 | Other Directorships Held by Trustee During the Past 5 Years |
Fred G. Steingraber Y.O.B. 1938 | Trustee | Indefinite/ January 2013 to present | Chairman, Board Advisors LLC (a consulting firm) (2001 to present). Retired, Chairman Emeritus, A.T. Kearney (a business consulting firm) (2001 to present) | 5 | Director, Diamond Hill Financial Trends Fund (a closed-end fund) (1989 to 2013). Director, Elkay Manufacturing (2004 to present). Director, Talent Intelligence (leadership development) (2004 to present). Chairman Emeritus, A.T. Kearney (management consulting) (2001 to present). Chairman, Board Advisors (Board consulting) (2001 to present) |
1 | The mailing address of each Trustee is 325 N. LaSalle Street, Suite 645, Chicago, IL 60654. |
2 | The Fund Complex consists of the RiverNorth Core Opportunity Fund, the RiverNorth/DoubleLine Strategic Income Fund, and the RiverNorth/Oaktree High Income Fund, each a series of the RiverNorth Funds Trust, and the RiverNorth Opportunities Fund, Inc., RiverNorth DoubleLine Strategic Opportunity Fund, Inc. and the RiverNorth Marketplace Lending Corporation. |
| 140 | (888) 848-7569 | www.rivernorth.com |
| RiverNorth Funds | Trustees and Officers |
September 30, 2017 (Unaudited)
The following table provides information regarding each Trustee who is an “interested person” of the Trust, as defined in the 1940 Act, and each officer of the Trust.
| INTERESTED TRUSTEE AND OFFICERS |
Name, Address1 and Year of Birth | Position(s) Held with the Fund | Term of Office/ Length of Time Served | Principal Occupation(s) During Past 5 Years | Number of Portfolios
in Fund Complex Overseen by Trustee2 | Other Directorships Held by Trustee During the Past 5 Years |
Patrick W. Galley3, Y.O.B. 1975 | President, Principal Executive Officer and Trustee | Indefinite/ July 2006
to present | Chief Investment Officer, RiverNorth Capital Management, LLC. (2004 to present). | 6 | Board of Managers RiverNorth Capital Management, LLC (2010 to present), Board of Managers of RiverNorth Securities, LLC (2010 to 2012) and Board of Directors RiverNorth Holdings, Co. (2010 to present). |
Jonathan M. Mohrhardt Y.O.B. 1974 | Treasurer and Chief Financial Officer | Indefinite/ February 2009 to present | Chief Compliance Officer, RiverNorth Capital Management, LLC. (2009 to 2012); Chief Operating Officer, RiverNorth Capital Management, LLC (2011 to present) and President, Chief Executive Officer and Chief Compliance Officer, RiverNorth Securities, LLC (2010
to 2012). | NA | Board of Managers RiverNorth Capital Management, LLC (2010 to present), Board of Managers of RiverNorth Securities, LLC (2010 to 2012) and Board of Directors RiverNorth Holdings, Co. (2010 to present). |
Marcus L. Collins Y.O.B. 1968 | Chief Compliance Officer; Secretary | Indefinite/ May 2012 to Present; Indefinite/ January 2017 to Present | General Counsel, RiverNorth Capital Management, LLC (2012 to present), Chief Compliance Officer, RiverNorth Capital Management, LLC (2012 to present); Counsel, Thompson Hine, LLP (law firm) (2007 to 2012). | NA | NA |
| Annual Report | September 30, 2017 | 141 |
| RiverNorth Funds | Trustees and Officers |
September 30, 2017 (Unaudited)
| INTERESTED TRUSTEE AND OFFICERS |
Name, Address1 and Year of Birth | Position(s) Held with the Fund | Term of Office/ Length of Time Served | Principal Occupation(s) During Past 5 Years | Number of Portfolios
in Fund Complex Overseen by Trustee2 | Other Directorships Held by Trustee During the Past 5 Years |
Allen G. French Y.O.B. 1959 c/o ALPS Fund Services, Inc. 1290 Broadway, Suite 1100 Denver, CO 80203 | Assistant Secretary | Indefinite/ November 2016 to present | Mr. French has been Assistant Vice President and Paralegal Manager since June 2017, and Senior Investment Company Act Paralegal from September 2016 to May 2017 of ALPS Fund Services, Inc. Prior to that Mr. French was Manager, Investment Company Act Products, Transamerica Asset Management, Inc. from 2015 to 2016; Senior Paralegal, ALPS Fund Services, Inc. from 2012 to 2015; and Legal Operations Manager, Old Mutual Capital, Inc. from 2006 to 2012. Mr. French is also the Assistant Secretary of the RiverNorth Opportunities Fund. | NA | NA |
Peter Greenly Y.O.B. 1968 c/o ALPS Fund Services, Inc. 1290 Broadway, Suite 1100 Denver, CO 80203 | Assistant Treasurer | Indefinite/ August 2016 to present | Fund Controller, ALPS Fund Services (2012 to present); Manager of Valuations with Great West Life and Annuity (2011 to 2012). | NA | NA |
1 | The mailing address of each Trustee and officer, unless otherwise noted, is 325 N. LaSalle Street, Suite 645, Chicago, IL 60654. |
2 | The Fund Complex consists of the RiverNorth Core Opportunity Fund, the RiverNorth/DoubleLine Strategic Income Fund, and the RiverNorth/Oaktree High Income Fund, each a series of the RiverNorth Funds Trust, and the RiverNorth Opportunities Fund, Inc., RiverNorth DoubleLine Strategic Opportunity Fund, Inc. and the RiverNorth Marketplace Lending Corporation. |
3 | Patrick W. Galley is considered an "Interested” Trustee as defined in the Investment Company Act of 1940, as amended, because he is an officer of the Trust and Chief Investment Officer of the Fund's investment adviser |
The Statement of Additional Information includes additional information about the Trust’s Trustees and is available, without charge, upon request by calling (toll-free) 1-888-848-7569
| 142 | (888) 848-7569 | www.rivernorth.com |
RiverNorth Funds
RiverNorth Core Opportunity Fund
RiverNorth/DoubleLine Strategic Income Fund
RiverNorth/Oaktree High Income Fund
Board of Trustees
Patrick W. Galley, CFA, Chairman
James G. Kelley
John S. Oakes
Fred G. Steingraber
John K. Carter
Investment Adviser
RiverNorth Capital Management, LLC
Sub Advisers
DoubleLine Capital LP
Oaktree Capital Management, L.P.
Transfer Agent, Administrator and
Dividend Disbursing Agent
ALPS Fund Services, Inc.
Distributor
ALPS Distributors, Inc.
Custodian
State Street Bank & Trust
Independent Registered
Public Accounting Firm
Cohen & Company, Ltd.
This report is provided for the general information of the shareholders of the RiverNorth Funds. This report is not intended for distribution to prospective investors in the Funds, unless preceded or accompanied by an effective prospectus.
| (a) | The registrant, as of the end of the period covered by this report, has adopted a code of ethics that applies to the registrant’s principal executive officer, principal financial officer, principal accounting officer or controller or any persons performing similar functions on behalf of the registrant. |
| (b) | For purposes of this item, “code of ethics” means written standards that are reasonably designed to deter wrongdoing and to promote: |
| (1) | Honest and ethical conduct, including the ethical handling of actual or apparent conflicts of interest between personal and professional relationships; |
| (2) | Full, fair, accurate, timely, and understandable disclosure in reports and documents that a registrant files with, or submits to, the Commission and in other public communications made by the registrant; |
| (3) | Compliance with applicable governmental laws, rules, and regulations; |
| (4) | The prompt internal reporting of violations of the code of ethics to an appropriate person or persons identified in the code of ethics; and |
| (5) | Accountability for adherence to the code of ethics. |
| (c) | Amendments: During the period covered by this report, no amendments were made to the provisions of the code of ethics adopted in 2(a) above. |
| (d) | Waivers: During the period covered by this report, no implicit or explicit waivers to the provisions of the code of ethics adopted in 2(a) above were granted. |
| (e) | Posting: We do not intend to post the code of ethics for the Officers or any amendments or waivers on a website. |
| (f) | Availability: The code of ethics for the Officers can be obtained, free of charge by calling the toll free number for the appropriate Fund. |
| Item 3. | Audit Committee Financial Expert. |
The registrant’s board of trustees has determined that the registrant does not have an audit committee financial expert. The committee members and the full Board considered a possibility of adding a member that would qualify as an expert. The audit committee determined that, although none of its members meet the technical definition of an audit committee expert, the committee has sufficient financial expertise to adequately perform its duties under the Audit Committee Charter without the addition of a qualified expert.
| Item 4. | Principal Accountant Fees and Services. |
| (a) | Audit Fees | |
| | Fiscal Year | Audit Fees |
| | FY 2017 | $68,000 |
| | FY 2016 | $74,500 |
| | | |
| (b) | Audit-Related Fees | |
| | Fiscal Year | Registrant |
| | FY 2017 | $0 |
| | FY 2016 | $0 |
| | | |
| (c) | Tax Fees | |
| | Fiscal Year | Registrant |
| | FY 2017 | $15,000 |
| | FY 2016 | $16,000 |
| | Nature of the Tax Fees: prepare tax returns |
| | | |
| (d) | All Other Fees | |
| | Fiscal Year | Registrant |
| | FY 2017 | $4,550 |
| | FY 2016 | $5,500 |
| | Nature of the fees: cursory review of Semi-Annual Shareholder report and post-effective amendment consents.. |
(e)
(1) Audit Committee’s Pre-Approval Policies
The Audit Committee Charter requires the Audit Committee to be responsible for the selection, retention or termination of auditors and, in connection therewith, to (i) evaluate the proposed fees and other compensation, if any, to be paid to the auditors, (ii) evaluate the independence of the auditors, (iii) pre-approve all audit services and, when appropriate, any non-audit services provided by the independent auditors to the Trust, (iv) pre-approve, when appropriate, any non-audit services provided by the independent auditors to the Trust’s investment adviser, or any entity controlling, controlled by, or under common control with the investment adviser and that provides ongoing services to the Trust if the engagement relates directly to the operations and financial reporting of the Trust, and (v) receive the auditors’ specific representations as to their independence.
(2) Percentages of Services Approved by the Audit Committee
| Registrant | |
| Audit-Related Fees: | 100% |
| Tax Fees: | 100% |
| All Other Fees: | 100% |
| (f) | During audit of registrant’s financial statements for the most recent fiscal year, less than 50 percent of the hours expended on the principal accountant’s engagement were attributed to work performed by persons other than the principal accountant’s full-time, permanent employees. |
| (g) | The aggregate non-audit fees billed by the registrant’s accountant for services rendered to the registrant, and rendered to the registrant’s investment adviser (not including any sub-adviser whose role is primarily portfolio management and is subcontracted with or overseen by another investment adviser), and any entity controlling, controlled by, or under common control with the adviser that provides ongoing services to the registrant: |
| Fiscal Year | Registrant | Adviser |
| FY 2017 | $19,550 | $0 |
| FY 2016 | $21,500 | $0 |
| Item 5. | Audit Committee of Listed Registrants. |
NOT APPLICABLE – applies to listed companies only
| Item 6. | Schedule of Investments. |
| (a) | The schedule of investments is included as part of the Report to Stockholders filed under Item 1 of this report. |
| Item 7. | Disclosure of Proxy Voting Policies and Procedures for Closed-End Management Investment Companies. |
NOT APPLICABLE – applies to closed-end funds only
| Item 8. | Portfolio Managers of Closed-End Management Investment Companies. |
NOT APPLICABLE – applies to closed-end funds only
| Item 9. | Purchases of Equity Securities by Closed-End Management Investment Company and Affiliated Purchasers. |
NOT APPLICABLE – applies to closed-end funds only
| Item 10. | Submission of Matters to Vote of Security Holders. |
The registrant has not adopted procedures by which shareholders may recommend nominees to the registrant’s board of trustees.
| Item 11. | Controls and Procedures. |
| (a) | Based on an evaluation of the registrant’s disclosure controls and procedures (as defined in Rule 30a-3(c) under the Investment Company Act of 1940) as of a date within 90 days of the filing date of this Form N-CSR, the disclosure controls and procedures are reasonably designed to ensure that the information required in filings on Forms N-CSR is recorded, processed, summarized, and reported on a timely basis. |
| (b) | There were no significant changes in the registrant’s internal control over financial reporting that occurred during the registrant’s second fiscal quarter of the period covered by this report that have materially affected, or are reasonably likely to materially affect, the registrant’s internal control over financial reporting. |
| (a)(1) | Code of Ethics is filed herewith. |
| (a)(2) | Certifications by the registrant’s principal executive officer and principal financial officer, pursuant to Section 302 of the Sarbanes-Oxley Act of 2002 and required by Rule 30a-2under the Investment Company Act of 1940 are filed herewith. |
| (b) | Certification pursuant to 18 U.S.C. Section 1350, as adopted pursuant to Section 906 of the Sarbanes-Oxley Act of 2002 is filed herewith. |
SIGNATURES
Pursuant to the requirements of the Securities Exchange Act of 1934 and the Investment Company Act of 1940, the registrant has duly caused this report to be signed on its behalf by the undersigned, thereunto duly authorized.
| Registrant: RiverNorth Funds |
| By: | /s/ Patrick W. Galley | |
| Name: | Patrick W. Galley | |
| Title: | President | |
| | | |
| Date: | November 29, 2017 | |
Pursuant to the requirements of the Securities Exchange Act of 1934 and the Investment Company Act of 1940, this report has been signed below by the following persons on behalf of the registrant and in the capacities and on the dates indicated.
| By: | /s/ Patrick W. Galley | |
| Name: | Patrick W. Galley | |
| Title: | President & Chief Executive Officer | |
| | | |
| Date: | November 29, 2017 | |
| By: | /s/ Jonathan M. Mohrhardt | |
| Name: | Jonathan M. Mohrhardt | |
| Title: | Treasurer & Chief Financial Officer | |
| | | |
| Date: | November 29, 2017 | |