UNITED STATES
SECURITIES AND EXCHANGE COMMISSION
Washington, D.C. 20549
FORM N-CSR
CERTIFIED SHAREHOLDER REPORT OF REGISTERED
MANAGEMENT INVESTMENT COMPANIES
Investment Company Act file number:811-21934
RiverNorth Funds
(Exact name of registrant as specified in charter)
325 North LaSalle Street, Suite 645
Chicago, IL 60654
(Address of principal executive offices) (Zip code)
Marc L. Collins
325 North LaSalle Street, Suite 645
Chicago, IL 60654
(Name and address of agent for service)
Registrant's telephone number, including area code:312-832-1440
Date of fiscal year end:09/30
Date of reporting period:09/30/2019
| Item 1. | Reports to Stockholders. |
| RiverNorth Funds | Table of Contents |
| Shareholder Letter | 2 |
| Opportunistic Closed-End Fund Strategies | |
| Portfolio Update | 4 |
| RiverNorth Core Opportunity Fund | 6 |
| RiverNorth/DoubleLine Strategic Income Fund | 11 |
| RiverNorth/Oaktree High Income Fund | 16 |
| RiverNorth Funds Schedule of Investments and Financial Statements | |
| Disclosure of Fund Expenses | 23 |
| Schedule of Investments | |
| RiverNorth Core Opportunity Fund | 25 |
| RiverNorth/DoubleLine Strategic Income Fund | 29 |
| RiverNorth/Oaktree High Income Fund | 73 |
| Statement of Assets and Liabilities | |
| RiverNorth Core Opportunity Fund | 89 |
| RiverNorth/DoubleLine Strategic Income Fund | 90 |
| RiverNorth/Oaktree High Income Fund | 91 |
| Statement of Operations | |
| RiverNorth Core Opportunity Fund | 92 |
| RiverNorth/DoubleLine Strategic Income Fund | 93 |
| RiverNorth/Oaktree High Income Fund | 94 |
| Statements of Changes in Net Assets | |
| RiverNorth Core Opportunity Fund | 95 |
| RiverNorth/DoubleLine Strategic Income Fund | 97 |
| RiverNorth/Oaktree High Income Fund | 99 |
| Financial Highlights | |
| RiverNorth Core Opportunity Fund | 102 |
| RiverNorth/DoubleLine Strategic Income Fund | 110 |
| RiverNorth/Oaktree High Income Fund | 118 |
| Notes to Financial Statements | 125 |
| Report of Independent Registered Public Accounting Firm | 145 |
| Additional Information | 146 |
| Board Considerations Regarding Approval of Investment Advisory and Sub-Advisory Agreements | 147 |
| Trustees & Officers | 151 |
| RiverNorth Funds | Shareholder Letter |
September 30, 2019 (Unaudited)
Dear Fellow Shareholders,
“It’s Alive!”
For most of 2018, the closed-end fund initial public offering (IPO) market didn’t see a new IPO. Between the Department of Labor fiduciary standard, prior years’ discount widening, and financial advisor dissatisfaction with closed-end funds’ performance, the closed-end fund IPO market was stagnant. However, in October 2018, RiverNorth Capital Management, LLC ("RiverNorth") launched the RiverNorth Opportunistic Municipal Income Fund (ticker “RMI”). With the launch of RMI, RiverNorth subsidized the upfront costs, including commissions and underwriting fees needed to launch a new closed-end fund. Historically, those fees were paid by the shareholder.
Given the continued trend in financial advisors shifting from brokerage (i.e. commission) to fee-based immediately after a closed-end fund goes public, we believe there is now new appetite for buying closed-end fund shares because the security is trading at its net asset value vs. the historical 5% premium that created a supply/demand imbalance out of the gate. Since the launch of RMI, the closed-end fund market has seen a pick-up in new launches and size of dollars raised, including a $1.4Bn fund raised in 2019. Not only may 2019 be the best closed-end fund IPO market we’ve seen in years, but the calendar for 2020 appears strong. While the health of the closed-end fund IPO market is not necessarily critical to RiverNorth’s strategies, we do believe the number of investors trading in the space helps create discount volatility and opportunities for RiverNorth to potentially exploit.
Fortunately for RiverNorth, the one constant is the focus on yield versus total return by most investors. Historically, when volatility has been low, the focus on yield has resulted in the narrowing of discounts until there is uncertainty, at which point the closed-end fund discounts have widened. We see no end in sight to this vicious cycle, and with it brings the potential for vast trading opportunities. The irrationality of investors focusing on yield vs. total return can be illustrated by the fact that the top decile of highest distributing funds trade at a premium to net asset value on average. Conversely, the bottom decile with the lowest distribution rates trade at a double digit discount on average. This appears to show that distribution rate is the primary driver in an investor's selection process for closed-end funds rather than total return, cost or the performance of the manager.
Looking forward, we are excited about the uncertainty over interest rates. Last year at this time the market was pricing in numerous rate increases. Instead, the Federal Reserve has reversed course and is now on a path of cutting interest rates. This uncertainty leads to opportunity for RiverNorth to potentially exploit overreaction by investors in closed-end funds, making next year’s outlook exciting.
We are pleased to provide you with the 2019 Annual Report for the RiverNorth Funds. The report reviews our three opportunistic closed-end strategies: the RiverNorth Core Opportunity Fund (ticker: RNCIX and RNCOX), the RiverNorth/DoubleLine Strategic Income Fund (tickers: RNSIX and RNDLX), and the RiverNorth/Oaktree High Income Fund (tickers: RNHIX and RNOTX).
| 2 | (888) 848-7569 | www.rivernorth.com |
| RiverNorth Funds | Shareholder Letter |
September 30, 2019 (Unaudited)
Please visit www.rivernorth.com for additional information.
We thank you for your investment and trust in managing your assets.
Respectfully,
Patrick W. Galley, CFA
President and Chief Investment Officer
RiverNorth Funds
Opinions and estimates offered constitute our judgement and are subject to change.
Definitions:
Alpha– Alpha is a measure of the performance on a risk-adjusted basis. The excess return of a fund relative to the return of the benchmark index is a fund's alpha.
Market Price– The market price at which a closed-end fund trades often varies from its net asset value. Some funds have market prices below their net asset values, referred to as a discount. Conversely, some funds have market prices above their net asset values, referred to as a premium.
Shareholder activism– A way in which shareholders can influence a corporation's behavior by exercising their rights as owners. Although shareholders don't run a company, there are ways for them to influence the board of directors and management. These can range from dialogue with management to voice their concerns about a particular issue to formal proposals that are voted on by all shareholders at a company's annual meetings.
Yield– Yield is the income return on an investment. This refers to the interest or dividends received from a security and is usually expressed annually as a percentage based on the investment's cost, its current market value or its face value.
| Annual Report | September 30, 2019 | 3 |
| RiverNorth Funds | Portfolio Update |
September 30, 2019 (Unaudited)
Closed-End Fund Market Overview
The closed-end fund (CEF) initial public offering (IPO) market has bounced back. In the past twelve months, seven new CEFs were launched. The aggregate capital raise was over $4 billion. Investment managers have been absorbing most, if not all, of the upfront fees and expenses associated with CEF IPOs. The elimination of the fee burden to IPO investors has strengthened the primary market.
The secondary market has also been strong. In the past twelve months, the average CEF(1)reported a market price total return of 9.8%. The asset class category returns for equity(1), hybrid(1), taxable bond(1) and municipal bond(1) funds were positive 1.1%, 4.4%, 10.2% and 17.0%, respectively.
The road to riches over the past twelve months included a deep valley in the fourth quarter of 2018. For example, the S&P 500 experienced its worst fourth quarter since the Great Recession and its worst December since the Great Depression. The bond market did not provide refuge. Closed-end fund investors were gripped with fear. On Christmas Eve, closed-end funds were priced in the 99th percentile of cheapness over the past twenty years. This turned out to be an extraordinary buying opportunity for contrarian investors.
On September 30, 2019, the average discount on equity, hybrid, taxable bond and municipal bond funds were 6.2%, 3.4%, 2.3% and 4.4%, respectively. Year over year, the average discount narrowed by 0.1%, 0.2%, 2.4% and 4.8%, respectively. Although most CEFs are trading well, many bond funds with US and/or emerging markets credit exposure are trading at or near double digit discounts. Non-US equity funds are also trading wider than the average.
Wide discounts on some bond funds, both taxable and municipal, have motivated a few institutional investors to become active. Three of the top five fund sponsors have recently engaged in proxy contests with activist investors. We anticipate that corporate actions will ultimately resolve the conflict.
CEF distributions for bond funds have continued to decline, but at a decelerating pace. Although borrowing costs have recently declined, reinvestment rates have pressured earnings. Interestingly, and counter to the trend of lower distributions, a few funds have implemented managed distributions with higher payouts. In most cases, the managed distribution policies are expected to include a return of capital. RiverNorth believes that managed or level distribution policies are an effective solution to wide discounts.
Recently, volatility in the rates market has been the primary driver of changes in CEF discounts. In our view, rate uncertainty and volatility bring pockets of opportunity across the CEF market. As investor sentiment shifts in either direction, this increases the supply of actionable trade ideas.
| (1) | Source: RiverNorth. Derived from Morningstar and Bloomberg data. |
| 4 | (888) 848-7569 | www.rivernorth.com |
| RiverNorth Funds | Portfolio Update |
September 30, 2019 (Unaudited)
Definitions:
Equity Closed-End Funds– Domestic equity closed-end funds are defined as funds investing their assets primarily in U.S. equity securities; generally, these funds are seeking long-term capital appreciation rather than income.
Hybrid Closed-End Funds– Hybrid closed-end funds are funds investing in both equity and fixed income securities in U.S. and foreign countries, with an emphasis on developed countries. Funds are categorized into this peer group if they have a policy of investing no more than 70% of their assets in either equities or fixed income.
Municipal Bond Closed-End Funds– Municipal bond closed-end funds are defined as funds that invest in a diversified portfolio of investment grade municipal bonds in a variety of sectors and States.
Taxable Bond Closed-End Funds– Taxable bond closed-end funds are defined as funds that invest in debt securities whose return is subject to taxes at the local, state or federal level, or some combination thereof.
| Annual Report | September 30, 2019 | 5 |
| RiverNorth Funds | Portfolio Update |
September 30, 2019 (Unaudited)
RiverNorth Core Opportunity Fund
What is the Fund's investment strategy?
The RiverNorth Core Opportunity Fund ("the Fund") invests in a broad range of equity, fixed income and short-term securities. To implement the Fund's tactical asset allocation, the adviser generally invests in closed-end funds (CEF), exchange-traded funds (ETF) and business development companies (BDC). Additionally, the Fund also invests in special-purpose acquisition companies (SPAC).
How did the RiverNorth Core Opportunity Fund perform relative to its benchmark during the reporting period?
For the twelve month period ended September 30, 2019, the Class I share (symbol: RNCIX) returned 3.51% and the Class R share (symbol: RNCOX) returned 3.23%. The S&P 500 Index returned 4.25% and the Morningstar U.S. Fund Allocation Category - 50% to 70% Equity returned 3.40% during the same period. Funds in allocation categories seek to provide both income and capital appreciation by investing in multiple asset classes, including stocks, bonds, and cash. These portfolios are dominated by domestic holdings and have equity exposures between 50% and 70%.
Comparison of a $10,000 Investment in the RiverNorth Core Opportunity Fund Class R, the Blend Index, and the S&P 500® Index.

| 6 | (888) 848-7569 | www.rivernorth.com |
| RiverNorth Funds | Portfolio Update |
September 30, 2019 (Unaudited)
Comparison of a $5,000,000 Investment in the RiverNorth Core Opportunity Fund Class I, the Blend Index, and the S&P 500® Index.
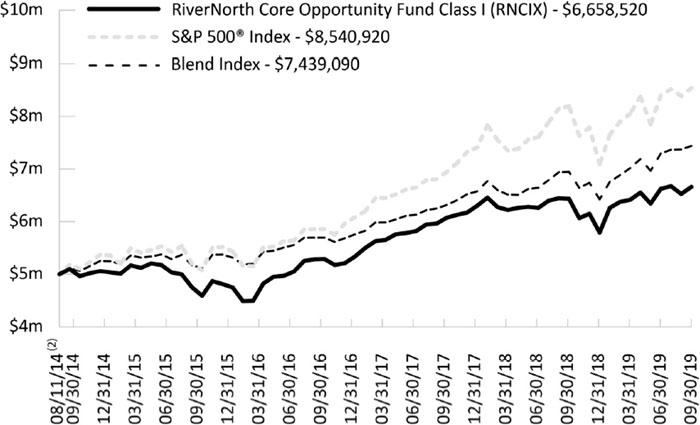
Average Annual Total Returns for Periods Ended September 30, 2019
| | 1-Year | 3-Year | 5-Year | 10 Year | Since
Inception(1)(2) |
| RiverNorth Core Opportunity Fund – Class I (RNCIX)(3) | 3.51% | 7.97% | 6.06% | 8.55% | 7.71% |
| RiverNorth Core Opportunity Fund – Class R (RNCOX) | 3.23% | 7.71% | 5.81% | 8.29% | 7.44% |
| Blend Index(4) | 7.10% | 9.32% | 8.00% | 9.59% | 6.93% |
| S&P 500® Index(4) | 4.25% | 13.39% | 10.84% | 13.24% | 8.20% |
| (1) | Inception date of Class R is December 27, 2006. |
| (2) | Inception date of Class I is August 11, 2014. |
| (3) | In presenting performance information for the newer Institutional share class of the Fund, the Fund includes, for periods prior to the offering of the Institutional share class, the operating expense ratio and performance of the Fund’s Retail share class, adjusted to reflect the class-related operating expenses of the Institutional share class. Actual expense differentials across classes will vary over time. The performance of the Fund’s newer Institutional share class would have been substantially similar to the performance of the Fund’s Retail share class because both share classes of the Fund are invested in the same portfolio of securities and would have differed only to the extent that the classes do not have the same expenses (although differences in expenses between share classes may change over time). |
| Annual Report | September 30, 2019 | 7 |
| RiverNorth Funds | Portfolio Update |
September 30, 2019 (Unaudited)
| (4) | Blend Index consists of 60% S&P 500® Index and 40% Bloomberg Barclays Capital U.S. Aggregate Bond Index. S&P 500® Index is a capitalization-weighted index of 500 stocks. The Bloomberg Barclays Capital U.S. Aggregate Bond Index is an unmanaged index of investment-grade fixed-rate debt issues with maturities of at least one year. This unmanaged index does not reflect fees and expenses. The S&P 500®and Blend Indices are indices only and cannot be invested in directly. |
Performance data quoted represents past performance, which is not a guarantee of future results. Current performance may be lower or higher than the performance quoted. The principal value and investment return of an investment will fluctuate so that your shares, when redeemed, may be worth more or less than their original cost. You can obtain performance data current to the most recent month end by calling (888) 848-7569 or visiting www.rivernorth.com. Total return measures net investment income and capital gain or loss from portfolio investments. All performance shown assumes reinvestment of dividends and capital gains distributions and does not reflect the deduction of taxes that a shareholder would pay on fund distributions or the redemption of fund shares.
The Total Annual Fund Operating Expense for the Fund as disclosed in the prospectus dated January 28, 2019: 2.30% (RNCIX); 2.54% (RNCOX).In presenting expense information for the newer Institutional share class of the Fund, the Fund includes, for periods prior to the offering of the Institutional share class, the operating expense ratio of the Fund’s Retail share class, adjusted to reflect the class-related operating expenses of the Institutional share class. Actual expense differentials across share classes will vary over time. The annualized net expense ratio in this annual report dated September 30, 2019 is 1.22% (RNCIX); 1.48% (RNCOX). The expense ratio as disclosed in the Fund’s annual report dated September 30, 2019 only includes the direct expenses paid by shareholders from their investment. The expense ratio as disclosed in the Fund’s prospectus dated January 28, 2019 is required to include the indirect expenses of investing in underlying funds.
What contributing factors were responsible for the RiverNorth Core Opportunity Fund's relative performance during the period?
With respect to the equity portion of the portfolio, US equity focused closed-end funds contributed to performance over the period. The biggest detractor from performance was the Fund’s exposure to closed-end funds that held energy related securities.
With respect to the fixed income portion of the portfolio, relative performance benefited from discount narrowing among high yield bond and municipal bond focused closed-end funds. Discount widening among bank loan closed-end funds detracted from performance.
How was the RiverNorth Core Opportunity Fund positioned at the end of September 2019?
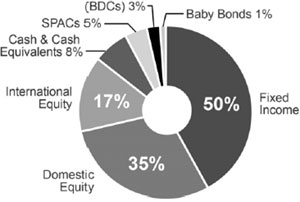
We have allocated 51% of the portfolio to equity, 50% to fixed income, 5% to special purpose acquisition companies and 8% to cash. Closed-end fund exposure was 65%. Allocations exceed 100% due to leverage utilized by the underlying funds.
We have increased our exposure to closed-end funds over the past year, and decreased exposure to exchange-traded funds.
| 8 | (888) 848-7569 | www.rivernorth.com |
| RiverNorth Funds | Portfolio Update |
September 30, 2019 (Unaudited)
Investment Vehicle Allocation(1)(percentages are based on net assets)
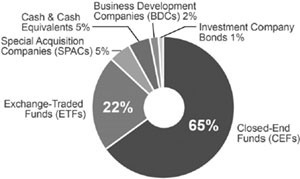
The allocation does not add up to 100% due to rounding.
Asset Class Allocation(1)(percentages are based on net assets)
Fixed Income Allocation(1)(2)(percentages are based on net assets)
Portfolio detail statistics are estimates made by the adviser and are subject to change.
| (1) | Convertible Security Risk– the market value of convertible securities adjusts with interest rates and the value of the underlying stock.Exchange Traded Note Risk– exchange traded notes represent unsecured debt of the issuer and may be influenced by interest rates, credit ratings of the issuer or changes in value of the reference index.Fixed Income Risk– the market value of fixed income securities adjusts with interest rates and the securities are subject to issuer default.Foreign/Emerging Market Risk– foreign securities may be subject to inefficient or volatile markets, different regulatory regimes or different tax policies. These risks may be enhanced in emerging markets.Management Risk– there is no guarantee that the adviser’s investment decisions will produce the desired results.Large Shareholder Purchase and Redemption Risk– The Fund may experience adverse effects when certain large shareholders purchase or redeem large amounts of shares of the Fund.Market Risk– economic conditions, interest rates and political events may affect the securities markets.REIT Risk– the value of REITs changes with the value of the underlying properties and changes in interest rates and are subject to additional fees.Security Risk– The value of the Fund may decrease in response to the activities and financial prospects of individual securities in the Fund’s portfolio.Short Sale Risk– short positions are speculative, are subject to transaction costs and are riskier than long positions in securities.Small-Cap Risk– small cap companies are more susceptible to failure, are often thinly traded and have more volatile stock prices.Structured Notes Risk– because of the imbedded derivative feature, structured notes are subject to more risk than investing in a simple note or bond.Swap Risk– swap agreements are subject to counterparty default risk and may not perform as intended.Underlying Fund Risk– underlying funds have additional fees, may utilize leverage, may not correlate to an intended index and may trade at a discount to their net asset values. |
| Annual Report | September 30, 2019 | 9 |
| RiverNorth Funds | Portfolio Update |
September 30, 2019 (Unaudited)
| (2) | Credit quality allocation reflects a fixed-income portfolio weighted average of the credit breakdown of each closed-end fund as provided by the adviser of said closed-end fund. If a credit breakdown is not provided by the adviser, Bloomberg is used. Investment grade refers to a bond rated BBB- or higher by Standard & Poor’s or Baa3 or higher by Moody’s. High yield refers to a bond rate lower than investment grade. For more information about securities ratings, please see the Fund’s Statement of Additional information at www.rivernorth.com. |
| 10 | (888) 848-7569 | www.rivernorth.com |
| RiverNorth Funds | Portfolio Update |
September 30, 2019 (Unaudited)
RiverNorth/DoubleLine Strategic Income Fund
What is the Fund's investment strategy?
The RiverNorth/DoubleLine Strategic Income ("the Fund") invests in a broad range of fixed income securities of U.S. and foreign issuers, including closed-end funds.
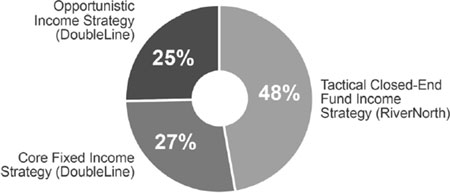
Assets of the Fund are tactically managed across three strategies (or sleeves). RiverNorth oversees the strategy weights and manages the Tactical Closed-End Fund Income Strategy. The RiverNorth strategy provides diversified exposure to the fixed income market through opportunistic investments in closed-end bond funds (CEF), and business development companies (BDC). Sector allocations are based on RiverNorth Capital Management, LLC's ("RiverNorth") assessment of relative value among asset classes and closed-end funds. Jeffrey Gundlach, CEO and CIO of DoubleLine Capital, LP ("DoubleLine"), and his team oversee the Opportunistic Income and Core Fixed Income Strategies. The Opportunistic Income Strategy seeks to achieve positive absolute returns and is managed without duration constraints. The Core Fixed Income Strategy incorporates an active asset allocation approach in an effort to mitigate risk and achieve the highest possible risk-adjusted returns.
How did the RiverNorth/DoubleLine Strategic Income Fund perform relative to its benchmark during the reporting period?
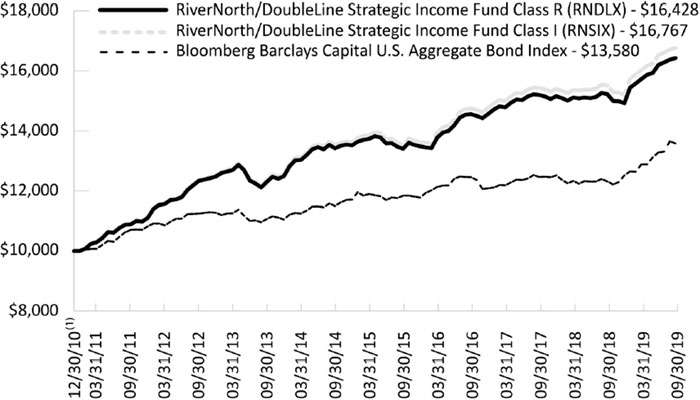
For the twelve month period ended September 30, 2019, the Class I share (symbol: RNSIX) returned 8.21% and the Class R share (symbol: RNDLX) returned 8.03 %. The Bloomberg Barclays Capital U.S. Aggregate Bond Index returned 10.30%, during the same period.
Comparison of a $10,000 Investment in the RiverNorth/DoubleLine Strategic Income Fund and the Barclays Capital U.S. Aggregate Bond Index
| Annual Report | September 30, 2019 | 11 |
| RiverNorth Funds | Portfolio Update |
September 30, 2019 (Unaudited)
Average Annual Total Returns for Periods Ended September 30, 2019
| | 1-Year | 3-Year | 5-Year | Since
Inception(1) |
| RiverNorth/DoubleLine Strategic Income Fund – Class I (RNSIX) | 8.21% | 4.39% | 4.38% | 6.08% |
| RiverNorth/DoubleLine Strategic Income Fund – Class R (RNDLX) | 8.03% | 4.12% | 4.13% | 5.84% |
| Bloomberg Barclays Capital U.S. Aggregate Bond Index(2) | 10.30% | 2.92% | 3.38% | 3.56% |
| (1) | Inception date is December 30, 2010. |
| (2) | The Bloomberg Barclays Capital U.S. Aggregate Bond Index is an unmanaged index of investment-grade fixed-rate debt issues with maturities of at least one year. The index cannot be invested in directly and does not reflect fees and expenses. |
Performance data quoted represents past performance, which is not a guarantee of future results. Current performance may be lower or higher than the performance quoted. The principal value and investment return of an investment will fluctuate so that your shares, when redeemed, may be worth more or less than their original cost. You can obtain performance data current to the most recent month end by calling (888) 848-7569 or visiting www.rivernorth.com. Total return measures net investment income and capital gain or loss from portfolio investments. All performance shown assumes reinvestment of dividends and capital gains distributions and does not reflect the deduction of taxes that a shareholder would pay on fund distributions or the redemption of fund shares.
The Total Annual Fund Operating Expense for the Fund as disclosed in the prospectus dated January 28, 2019: 1.45% (RNSIX), 1.70% (RNDLX).The annualized net expense ratio in this annual report dated September 30, 2019 is 0.86% (RNSIX) and 1.11% (RNDLX). The expense ratio as disclosed in the Fund’s annual report dated September 30, 2019 only includes the direct expenses paid by shareholders from their investment. The expense ratio as disclosed in the Fund’s prospectus dated January 28, 2019 is required to include the indirect expenses of investing in underlying funds.
What contributing factors were responsible for the RiverNorth/DoubleLine Strategic Income Fund's relative performance during the period?
RiverNorth Tactical Closed-End Fund Income Sleeve
The RiverNorth sleeve’s performance benefited from exposure to closed-end funds that invest in municipal bonds and closed-end funds that invest in high yield bonds as funds in both of these sectors experienced discount narrowing on average in addition to positive net asset value (NAV) performance. Discount widening among bank loan closed-end funds detracted from performance.
DoubleLine Opportunistic Income Sleeve
For the 12-month period ended September 30, 2019, the portfolio underperformed the Bloomberg Barclays US Aggregate Bond Index return of 10.30%. The relative underperformance was primarily driven by duration positioning as the 5-year US Treasury yield fell by 141 basis points (bps) over this period and the portfolio consistently maintained a shorter duration than the benchmark. Nonetheless, every sector within the portfolio generated positive total returns over this period. Agency mortgage-backed securities (Agency MBS) and non-agency residential mortgage-backed securities (NA RMBS) generated the largest contributions to return. The Agency MBS allocation outperformed the benchmark due to the usage of inverse-interest only (Inverse IOs) and inverse-floater securities. These are some of the longest-duration securities within the portfolio and thus performed the best as rates fell. As for the NA RMBS allocation, these securities maintained a relatively low duration compared to the benchmark but still generated strong returns via interest distributions from their above market coupon rates. Collateralized loan obligations (CLOs) detracted from performance as they underperformed during this time period; their floating rate coupons fell out of favor with investors when short-term interest rates began falling at the start of 2019.
| 12 | (888) 848-7569 | www.rivernorth.com |
| RiverNorth Funds | Portfolio Update |
September 30, 2019 (Unaudited)
DoubleLine Core Fixed Income Sleeve
For the 12-month period ended September 30, 2019, the portfolio underperformed the Bloomberg Barclays U.S. Aggregate Bond Index’s return of 10.30%. The portfolio’s short duration positioning relative to the benchmark was the primary detractor of performance as rates rallied across all tenors of the U.S. Treasury curve with 2-year and 10-year yields falling by 120 bps and 140 bps, respectively. Sectors that outperformed the benchmark over the period, such as investment grade corporates and U.S. treasuries, benefitted from having a longer duration profile than other assets as rates decreased significantly. Floating rate securities, such as collateralized loan obligations (CLOs), had the worst performance over the period driven by lower perceived future income due to the decline in short term rates. Despite posting positive returns over the year, the remainder of the structured products in the portfolio underperformed because each of these sectors maintained a duration shorter than the benchmark over the period. Overall, the portfolio continues to maintain more credit risk and a shorter duration than the benchmark.
How was the RiverNorth/DoubleLine Strategic Income Fund positioned at the end of September 2019?
We have allocated 48%, 27% and 25% to the Tactical Closed-End Fund, Core Fixed Income, and Opportunistic Income sleeves, respectively. Compared to one year ago, the Fund has a higher exposure to U.S. government, and bank loans, and a lower exposure to Non-Agency MBS, and Agency MBS.
Strategy (“Sleeve”) Allocation
| Annual Report | September 30, 2019 | 13 |
| RiverNorth Funds | Portfolio Update |
September 30, 2019 (Unaudited)
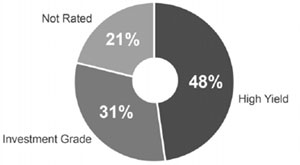
Credit Quality Distribution(1)(2)(percentages are based on net assets)
Totals may not add up to 100% due to rounding.
Sector Breakdown(1)(percentages are based on net assets)

The allocation does not add up to 100% as it reflects the estimated leverage utilized by the underlying funds.
Portfolio detail statistics are estimates made by the adviser and are subject to change.
| (1) | Asset-Backed Security Risk– the risk that the value of the underlying assets will impair the value of the security.Borrowing Risk– borrowings increase fund expenses and are subject to repayment, possibly at inopportune times.Convertible Security Risk– the market value of convertible securities adjusts with interest rates and the value of the underlying stock.Defaulted Securities Risk– defaulted securities carry the risk of uncertainty of repayment.Derivatives Risk– derivatives are subject to counterparty risk.Exchange Traded Note Risk– exchange traded notes represent unsecured debt of the issuer and may be influenced by interest rates, credit ratings of the issuer or changes in value of the reference index.Fixed Income Risk– the market value of fixed income securities adjusts with interest rates and the securities are subject to issuer default.Foreign/Emerging Market Risk– foreign securities may be subject to inefficient or volatile markets, different regulatory regimes or different tax policies. These risks may be enhanced in emerging markets.Liquidity Risk– illiquid investments may be difficult or impossible to sell.Large Shareholder Purchase and Redemption Risk– The Fund may experience adverse effects when certain large shareholders purchase or redeem large amounts of shares of the Fund.Management Risk– there is no guarantee that the adviser’s or sub-adviser’s investment decisions will produce the desired results.Market Risk– economic conditions, interest rates and political events may affect the securities markets.Mortgage-Backed Security Risk– mortgage backed securities are subject to credit risk, pre-payment risk and devaluation of the underlying collateral.Portfolio Turnover Risk– increased portfolio turnover results in higher brokerage expenses and may impact the tax status of distributions.Rating Agency Risk– rating agencies may change their ratings or ratings may not accurately reflect a debt issuer’s creditworthiness.REIT Risk– the value of REITs changes with the value of the underlying properties and changes in interest rates and are subject to additional fees.Security Risk–The value of the Fund may decrease in response to the activities and financial prospects of individual securities in the Fund’s portfolio.Structured Notes Risk– because of the imbedded derivative feature, structured notes are subject to more risk than investing in a simple note or bond.Swap Risk– swap agreements are subject to counterparty default risk and may not perform as intended.Underlying Fund Risk– underlying funds have additional fees, may utilize leverage, may not correlate to an intended index and may trade at a discount to their net asset values. |
| 14 | (888) 848-7569 | www.rivernorth.com |
| RiverNorth Funds | Portfolio Update |
September 30, 2019 (Unaudited)
| (2) | For the sleeve managed by RiverNorth, credit quality allocation reflects a fixed-income portfolio weighted average of the credit breakdown of each closed-end fund as provided by the advisor of said closed-end fund. If a credit breakdown is not provided by the advisor, Bloomberg is used. For the sleeves managed by DoubleLine, credit quality allocation is determined from the highest available credit rating from any Nationally Recognized Statistical Rating Organization (S&P, Moody’s and Fitch). Investment grade refers to a bond rated BBB- or higher by Standard & Poor’s or Baa3 or higher by Moody’s. High yield refers to a bond rated lower than investment grade. For more information about securities ratings, please see the Fund’s Statement of Additional Information at www.rivernorth.com. |
| Annual Report | September 30, 2019 | 15 |
| RiverNorth Funds | Portfolio Update |
September 30, 2019 (Unaudited)
RiverNorth/Oaktree High Income Fund
What is the Fund's investment strategy?
The RiverNorth/Oaktree High Income Fund ("the Fund") invests in a broad range of income producing securities including both fixed income and equity securities.
Assets of the Fund are tactically managed across three income strategies (or sleeves). RiverNorth Capital Management, LLC ("RiverNorth") manages the Tactical Closed-End Fund Strategy. This strategy is designed to provide diversified fixed income and equity income exposure through opportunistic investments in closed-end funds. Oaktree Capital Management, LP ("Oaktree") manages the High Yield Bond and Senior Loan Strategies on a global basis. Oaktree will tactically manage the allocation between the High Yield Bond and Senior Loan Strategies based both on market opportunities and the risk and reward tradeoffs between the two asset classes.
How did the RiverNorth/Oaktree High Income Fund perform relative to its benchmark during the reporting period?
For the 12-month period ended September 30, 2019, the Class I share (symbol: RNHIX) returned 4.85% and the Class R share (symbol: RNOTX) returned 4.48%. The Bank of America Merrill Lynch Non-Financial Developed High Yield Constrained Index ("BofA ML Non-Financial Developed HY Constrained Index") and CSFB Leveraged Loan Index returned 4.38% and 3.11%, respectively, during the same period.
Comparison of a $10,000 Investment in the RiverNorth/Oaktree High Income Fund, BofA ML Non-Financial Developed HY Constrained Index and the CSFB Leveraged Loan Index

| 16 | (888) 848-7569 | www.rivernorth.com |
| RiverNorth Funds | Portfolio Update |
September 30, 2019 (Unaudited)
Average Annual Total Returns for the Period Ended September 30, 2019
| | 1-Year | 3-Year | 5-Year | Since
Inception(1) |
| RiverNorth/Oaktree High Income Fund – Class I (RNHIX) | 4.85% | 4.71% | 4.05% | 4.42% |
| RiverNorth/Oaktree High Income Fund – Class R (RNOTX) | 4.48% | 4.44% | 3.79% | 4.15% |
| BofA ML Non-Financial Developed HY Constrained Index(2) | 4.38% | 5.38% | 4.41% | 4.81% |
| CSFB Leveraged Loan Index(2) | 3.11% | 4.57% | 4.04% | 4.27% |
| (1) | Inception date is December 28, 2012. |
| (2) | The BofA ML Non-Financial Developed Markets HY Constrained Index contains all securities in the BofA Merrill Lynch Global High Yield Index from developed markets countries but cap issuer exposure at 2%. Developed markets is defined as an FX-G10 member, a Western European nation, or a territory of the U.S. or a Western European nation. The index tracks the performance of USD, CAD, GBP and EUR denominated below investment grade corporate debt publicly issued in the major domestic or Eurobond markets. Qualifying securities must have a below investment grade rating (based on an average of Moody’s, S&P and Fitch). CSFB Leveraged Loan Index tracks the investable market of the U.S. dollar denominated leveraged loan market. It consists of issues rated “5B” or lower, meaning that the highest rated issues included in this index are Moody’s/S&P ratings of Baa1/BB+ or Ba1/BBB+. All loans are funded term loans with a tenor of at least one year and are made by issuers domiciled in developed countries. The BofA ML Non-Financial Developed Markets HY Constrained and the CSFB Leveraged Loan Indices are indices only and cannot be invested in directly. |
Performance data quoted represents past performance, which is not a guarantee of future results. Current performance may be lower or higher than the performance quoted. The principal value and investment return of an investment will fluctuate so that your shares, when redeemed, may be worth more or less than their original cost. You can obtain performance data current to the most recent month end by calling (888) 848-7569 or visiting www.rivernorth.com. Total return measures net investment income and capital gain or loss from portfolio investments. All performance shown assumes reinvestment of dividends and capital gains distributions and does not reflect the deduction of taxes that a shareholder would pay on fund distributions or the redemption of fund shares.
The Total Annual Operating Expense for the Fund as disclosed in the prospectus dated January 28, 2019: 1.68% (RNHIX), 1.93% (RNOTX).The adviser has contractually agreed to defer the collection of fees and/or reimburse expenses, but only to the extent necessary to limit Total Annual Fund Operating Expenses (excluding brokerage fees and commissions; borrowing costs, such as (a) interest and (b) dividends on securities sold short; taxes; indirect expenses incurred by the underlying funds in which the Fund invests; and extraordinary expenses) to 1.35% (RNHIX) and 1.60% (RNOTX) of the average daily net assets of the Fund through January 31, 2020. The annualized net expense ratio in this annual report dated September 30, 2018 is 1.36% (RNHIX) and 1.61% (RNOTX). The expense ratio as disclosed in the Fund’s annual report dated September 30, 2019 only includes the direct expenses paid by shareholders from their investment. The expense ratio as disclosed in the Fund’s prospectus dated January 28, 2019 is required to include the indirect expenses of investing in underlying funds.
| Annual Report | September 30, 2019 | 17 |
| RiverNorth Funds | Portfolio Update |
September 30, 2019 (Unaudited)
What contributing factors were responsible for the RiverNorth/Oaktree High Income Fund's relative performance during the period?
RiverNorth Tactical Closed-End Fund Sleeve
The RiverNorth sleeve’s performance benefited from exposure to closed-end funds that invest in high yield bonds as these funds experienced discount narrowing on average in addition to positive NAV performance. Discount widening among bank loan closed-end funds detracted from performance.
Oaktree High Yield Bond & Senior Loan Sleeve
After selling-off in the fourth quarter of 2018, equities and high yield bonds posted outsized returns in the first two quarters of 2019. The prospect of future Federal Reserve rate cuts also put traditional fixed income investors in a bullish mood.
Senior loans posted a solid absolute return in the first six months of the year, but trailed the more interest rate sensitive portion of the market in the falling rate environment. Risk aversion increased in the third quarter of 2019. As a result, the more aggressive asset categories cooled off, while higher quality credits performed strongly. Additionally, default activity picked up a bit in the third quarter. All told, eight high yield bond and senior loan issuers defaulted on a total of $15.7 billion. Energy issuers comprised all but two of the defaulting issuers. In this bifurcated environment, we were pleased to see our senior loan allocation hold up well during periods of increased volatility and high yield bonds outperform during the rally in the first six months of the year. Our allocation continues to be skewed towards the higher quality loan market.
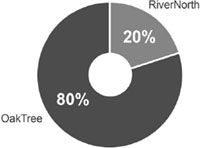
How was the RiverNorth/Oaktree High Income Fund positioned at the end of September 2019?
The Fund allocation was 20% RiverNorth Tactical Closed-End Fund and 80% Oaktree High Yield Bond and Senior Loan. The closed-end fund sleeve is primarily invested in the common shares of closed-end funds. Over the past year we have decreased cash and increased the Fund's allocation to high yield and bank loans.
Oaktree High Yield Bond & Senior Loan Sleeve
Reflecting our risk-controlled approach, the portfolio is defensively positioned, built to preserve capital in the event of a market downturn. As we begin the fourth quarter, we believe the credit fundamentals in your portfolio remain sound. While the energy sector remains under pressure, we anticipate the market default rate will remain below the long-term average for the next twelve months. At the same time, the unresolved trade war between U.S. and China remains a threat to global economic growth, particularly at a time when the macro-economic outlook is so unsettled.
Bond rating disclosure: A bond rating is a grade given to a bond that indicates its credit quality. Private independent rating services provide these evaluations of a bond issuer's financial strength or its ability to pay a bond's principal and interest in a timely fashion. Bond ratings are expressed as letters ranging from "AAA," which is the highest grade, to "C" or "D" ("junk"), which is the lowest grade.
| 18 | (888) 848-7569 | www.rivernorth.com |
| RiverNorth Funds | Portfolio Update |
September 30, 2019 (Unaudited)
Strategy Allocation
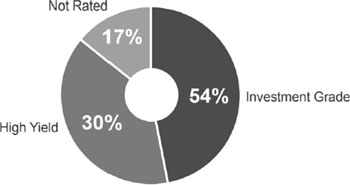
Credit Quality Distribution(1)(2)(percentages are based on net assets)
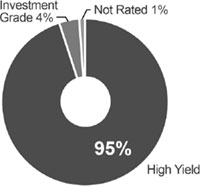
Totals may not add up to 100% due to rounding.
Sector Breakdown(1)(percentages are based on net assets)
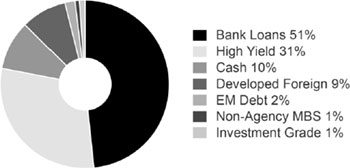
The allocation does not add up to 100% as it reflects the leverage utilized by the underlying funds.
| Annual Report | September 30, 2019 | 19 |
| RiverNorth Funds | Portfolio Update |
September 30, 2019 (Unaudited)
High Yield & Bank Loan Geographic Breakdown
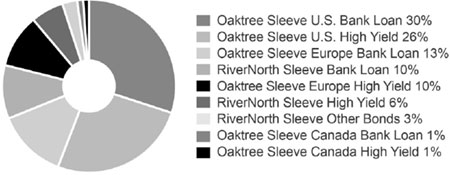
Totals may not add up to 100% due to rounding.
Portfolio detail statistics are estimates made by the adviser and are subject to change.
| (1) | Borrowing Risk– borrowings increase fund expenses and are subject to repayment, possibly at inopportune times.Closed- End Fund Risk– closed-end funds are exchange traded, may trade at a discount to their net asset values and may deploy leverage.Convertible Security Risk– the market value of convertible securities adjusts with interest rates and the value of the underlying stock.Credit Derivatives Risk– the use of credit derivatives is highly specialized, involves default, counterparty and liquidity risks and may not perfectly correlate to the underlying asset or liability being hedged.Currency Risk– foreign currencies will rise or decline relative to the U.S. dollar.Distressed and Defaulted Securities Risk– defaulted securities carry the risk of uncertainty of repayment.Equity Risk– equity securities may experience volatility and the value of equity securities may move in opposite directions from each other and from other equity markets generally.Fixed Income Risk– the market value of fixed income securities adjusts with interest rates and the securities are subject to issuer default.Foreign/Emerging Market Risk– foreign securities may be subject to inefficient or volatile markets, different regulatory regimes or different tax policies. These risks may be enhanced in emerging markets.Floating Interest Rate Risk– loans pay interest based on the London Interbank Offered Rate (LIBOR) and a decline in LIBOR could negatively impact the Fund’s return.Investment Style Risk– investment strategies may come in and out of favor with investors and may underperform or outperform at times.Large Shareholder Purchase and Redemption Risk– The Fund may experience adverse effects when certain large shareholders purchase or redeem large amounts of shares of the Fund.Loans Risk– loans may be unrated or rated below investment grade and the pledged collateral may lose value. Secondary trading in loans is not fully-developed and may result in illiquidity.Management Risk– there is no guarantee that the adviser’s or sub-adviser’s investment decisions will produce the desired results.Market Risk– economic conditions, interest rates and political events may affect the securities markets.Portfolio Turnover Risk– increased portfolio turnover results in higher brokerage expenses and may impact the tax status of distributions.Preferred Stock Risk– preferred stocks generally pay dividends, but may be less liquid than common stocks, have less priority than debt instruments and may be subject to redemption by the issuer.Security Risk– the value of the Fund may increase or decrease in response to the prospects of the issuers of securities and loans held in the Fund.Swap Risk– swap agreements are subject to counterparty default risk and may not perform as intended.Underlying Fund Risk– underlying funds have additional fees, may utilize leverage, may not correlate to an intended index and may trade at a discount to their net asset values.Valuation Risk– Loans and fixed-income securities are traded “over the counter” and because there is no centralized information regarding trading, the valuation of loans and fixed-income securities may vary. |
| 20 | (888) 848-7569 | www.rivernorth.com |
| RiverNorth Funds | Portfolio Update |
September 30, 2019 (Unaudited)
| (2) | For the sleeve managed by RiverNorth, credit quality allocation reflects a fixed-income portfolio weighted average of the credit breakdown of each closed-end fund as provided by the advisor of said closed-end fund. If a credit breakdown is not provided by the advisor, Bloomberg is used. For the sleeves managed by Oaktree, the sub-adviser uses a proprietary credit scoring matrix to rank potential investments. This process offers a systematic way of reviewing the key quantitative and qualitative variables impacting credit quality for each investment. Investment grade refers to a bond rated BBB- or higher by Standard & Poor’s or Baa3 or higher by Moody’s. High yield refers to a bond rated lower than investment grade. For more information about securities ratings, please see the Fund’s Statement of Additional Information at www.rivernorth.com. |
Definitions:
Agency Mortgage-Backed Securities (Agency MBS)– Agency MBS are mortgage-backed securities issued by government-sponsored enterprises such as Government National Mortgage Association (GNMA or Ginnie Mae), Federal National Mortgage Association (FNMA or Fannie Mae) or Federal Home Loan Mortgage Corporation (Freddie Mac).
Basis Point (bps)– A common unit of measure for interest rates and other percentages in finance. One basis point is equal to 1/100th of 1%, or 0.01% (0.0001), and is used to denote the percentage change in a financial instrument.
Collateralized Loan Obligation (CLO)– A CLO is a security backed by a pool of debt, often low-rated corporate loans. The investor receives scheduled debt payments from the underlying loans but assumes most of the risk in the event that borrowers default.
Coupon– A coupon is the annual interest rate paid on a bond, expressed as a percentage of the face value.
Floating Rate Coupons– Floating rate coupons are derived from financial instruments paying a variable or floating interest rate.
Inverse-Floater Securities –An inverse-floater is a bond or other type of debt whose coupon rate has an inverse relationship to a benchmark rate. An inverse floater adjusts its coupon payment as the interest rate changes.
Inverse-Interest Only Securities (Inverse IOs)– Inverse IOs are interest only securities that pay a coupon inversely related to market rates (i.e., it moves in the opposite direction of interest rates).
Mortgage-Backed Securities (MBS)– MBS are asset-backed securities that are secured by a mortgage or collection of mortgages.
| Annual Report | September 30, 2019 | 21 |
| RiverNorth Funds | Portfolio Update |
September 30, 2019 (Unaudited)
Non-Agency Residential Mortgage-Backed Securities (Non-Agency RMBS)– Non-Agency RMBS are mortgage-backed securities sponsored by private companies other than the government sponsored enterprises such as Fannie Mae, Ginnie Mae, or Freddie Mac.
Residential Mortgage-Backed securities (RMBS)– RMBS are a type of mortgage-backed debt obligation whose cash flows come from residential debt, such as mortgages, home-equity loans and subprime mortgages.
Risk aversion– The subjective tendency of investors to avoid unnecessary risk.
| 22 | (888) 848-7569 | www.rivernorth.com |
| RiverNorth Funds | Disclosure of Fund Expenses |
September 30, 2019 (Unaudited)
Expense Example
As a shareholder of the RiverNorth Funds (the "Trust" or "Funds"), you incur two types of costs: (1) transaction costs; and (2) ongoing costs, including management fees, distribution and service (12b-1) fees and other Fund expenses. This example is intended to help you understand your ongoing costs (in dollars) of investing in the Funds and to compare these costs with the ongoing costs of investing in other mutual funds. The Example is based on an investment of $1,000 invested at the beginning of the period, April 1, 2019, and held for the six months ended September 30, 2019.
Actual Expenses
The first line of the table below provides information about actual account values and actual expenses. You may use the information in this line, together with the amount you invested, to estimate the expenses that you paid over the period. Simply divide your variable account value by $1,000 (for example, an $8,600 account value divided by $1,000 = 8.6), then multiply the result by the number in the first line under the heading entitled “Expenses Paid During Period” to estimate the expenses you paid on your account during this period.
Hypothetical Example for Comparison Purposes
The second line of the table below provides information about hypothetical account values and hypothetical expenses based on each Fund’s actual expense ratio and an assumed rate of return of 5% per year before expenses, which is not each Fund’s actual return. The hypothetical account values and expenses may not be used to estimate the actual ending account balance or expenses you paid for the period. You may use this information to compare the ongoing costs of investing in each Fund and other funds. To do so, compare these 5% hypothetical examples with the 5% hypothetical examples that appear in the shareholder reports of other funds.
Please note that the expenses shown in the table below are meant to highlight your ongoing costs only and do not reflect any transactional costs, such as redemption fees. Therefore, the second line for each share class of each Fund within the table is useful in comparing ongoing costs only, and will not help you determine the relative total costs of owning different funds. If these transactional costs were included, your costs would have been higher.
| Annual Report | September 30, 2019 | 23 |
| RiverNorth Funds | Disclosure of Fund Expenses |
September 30, 2019 (Unaudited)
| | Beginning Account Value 04/01/2019 | Ending Account Value 09/30/2019 | Expense Ratio(a) | Expenses Paid During Period(b) |
| RiverNorth Core Opportunity Fund | | |
| Class I Shares | | | | |
| Actual | $1,000.00 | $1,038.10 | 1.20% | $6.13 |
| Hypothetical (5% return before expenses) | $1,000.00 | $1,019.05 | 1.20% | $6.07 |
| Class R Shares | | | | |
| Actual | $1,000.00 | $1,036.70 | 1.45% | $7.40 |
| Hypothetical (5% return before expenses) | $1,000.00 | $1,017.80 | 1.45% | $7.33 |
| RiverNorth/DoubleLine Strategic Income Fund | | |
| Class I Shares | | | | |
| Actual | $1,000.00 | $1,046.00 | 0.85% | $4.36 |
| Hypothetical (5% return before expenses) | $1,000.00 | $1,020.81 | 0.85% | $4.31 |
| Class R Shares | | | | |
| Actual | $1,000.00 | $1,044.60 | 1.10% | $5.64 |
| Hypothetical (5% return before expenses) | $1,000.00 | $1,019.55 | 1.10% | $5.57 |
| RiverNorth/Oaktree High Income Fund | | |
| Class I Shares | | | | |
| Actual | $1,000.00 | $1,033.60 | 1.35% | $6.88 |
| Hypothetical (5% return before expenses) | $1,000.00 | $1,018.30 | 1.35% | $6.83 |
| Class R Shares | | | | |
| Actual | $1,000.00 | $1,032.30 | 1.60% | $8.15 |
| Hypothetical (5% return before expenses) | $1,000.00 | $1,017.05 | 1.60% | $8.09 |
| (a) | Annualized, based on the Fund's most recent fiscal half-year expenses. |
| (b) | Expenses are equal to the Fund's annualized expense ratio multiplied by the average account value over the period, multiplied by the number of days in the most recent fiscal half year (183), then divided by 365. Note this expense example is typically based on a six-month period. |
| 24 | (888) 848-7569 | www.rivernorth.com |
| RiverNorth Core Opportunity Fund | Schedule of Investments |
September 30, 2019
| Shares/Description | | | | | Value | |
| CLOSED-END FUNDS - 64.92% | | | | |
| | 358,671 | | | Aberdeen Emerging Markets Equity Income Fund, Inc. | | $ | 2,496,350 | |
| | 840,596 | | | Aberdeen Total Dynamic Dividend Fund | | | 7,010,570 | |
| | 566,842 | | | AllianzGI NFJ Dividend Interest & Premium Strategy Fund | | | 6,926,809 | |
| | 52,929 | | | BlackRock Floating Rate Income Strategies Fund, Inc. | | | 667,964 | |
| | 103,042 | | | BlackRock Floating Rate Income Trust | | | 1,264,325 | |
| | 40,580 | | | BlackRock Global Opportunities Equity Trust | | | 423,249 | |
| | 134,102 | | | Blackrock International Growth | | | 728,174 | |
| | 193,151 | | | BrandywineGLOBAL - Global Income Opportunities Fund, Inc. | | | 2,337,127 | |
| | 3 | | | Clough Global Equity Fund | | | 34 | |
| | 363,003 | | | Clough Global Opportunities Fund | | | 3,317,847 | |
| | 115,569 | | | Cornerstone Strategic Value Fund, Inc. | | | 1,312,864 | |
| | 4,835 | | | Cornerstone Total Return Fund, Inc. | | | 53,137 | |
| | 169,821 | | | Eaton Vance Limited Duration Income Fund | | | 2,122,763 | |
| | 136,900 | | | Highland Income Fund | | | 1,827,615 | |
| | 151,061 | | | Invesco Dynamic Credit Opportunities Fund | | | 1,663,182 | |
| | 54,969 | | | Invesco Municipal Opportunity Trust | | | 687,662 | |
| | 47,471 | | | Kayne Anderson MLP/Midstream Investment Co. | | | 686,431 | |
| | 65,897 | | | Neuberger Berman High Yield Strategies Fund, Inc. | | | 795,377 | |
| | 474,900 | | | Nuveen Credit Strategies Income Fund | | | 3,552,252 | |
| | 65,216 | | | Nuveen Floating Rate Income Fund | | | 633,900 | |
| | 116,043 | | | Nuveen Intermediate Duration Quality Municipal Term Fund | | | 1,586,308 | |
| | 180,389 | | | Nuveen Mortgage Opportunity Term Fund | | | 4,159,770 | |
| | 25,074 | | | Nuveen Mortgage Opportunity Term Fund 2 | | | 555,891 | |
| | 154,505 | | | Nuveen Quality Municipal Income Fund | | | 2,218,692 | |
| | 60,315 | | | PGIM Global High Yield Fund, Inc. | | | 866,727 | |
| | 31,818 | | | Putnam Municipal Opportunities Trust | | | 415,861 | |
| | 167,669 | | | Royce Value Trust, Inc. | | | 2,307,125 | |
| | 569,056 | | | Sprott Focus Trust, Inc. | | | 3,835,437 | |
| | 596,022 | | | Templeton Global Income Fund | | | 3,659,575 | |
| | 38,085 | | | Tortoise MLP Fund, Inc. | | | 468,065 | |
| | 132,002 | | | Voya Emerging Markets High Income Dividend Equity Fund | | | 946,454 | |
| | 60,535 | | | Voya Global Equity Dividend and Premium Opportunity Fund | | | 363,210 | |
| | 150,688 | | | Western Asset Emerging Markets Debt Fund, Inc. | | | 2,093,056 | |
| | 277,307 | | | Western Asset Global High Income Fund, Inc. | | | 2,753,659 | |
| | 159,427 | | | Western Asset High Income Fund II, Inc. | | | 1,080,915 | |
| | 723,218 | | | Western Asset High Income Opportunity Fund, Inc. | | | 3,652,251 | |
| | | | | | | | | |
| TOTAL CLOSED-END FUNDS | | | | |
| (Cost $68,353,496) | | | 69,470,628 | |
See Notes to Financial Statements.
| Annual Report | September 30, 2019 | 25 |
| RiverNorth Core Opportunity Fund | Schedule of Investments |
September 30, 2019
| Shares/Description | | | Value | |
| BUSINESS DEVELOPMENT COMPANIES - 1.50% | | | | |
| | 157,820 | | | Barings BDC, Inc. | | $ | 1,601,873 | |
| | | | | | | | | |
| TOTAL BUSINESS DEVELOPMENT COMPANIES | | | | |
| (Cost $1,538,934) | | | 1,601,873 | |
| | | | | | | | | |
| COMMON STOCKS - 4.91% | | | | |
| | 13,110 | | | Agba Acquisition, Ltd.(a) | | | 133,329 | |
| | 35,274 | | | Big Rock Partners Acquisition Corp.(a) | | | 373,199 | |
| | 29,944 | | | Churchill Capital Corp. II(a) | | | 314,711 | |
| | 9,711 | | | Far Point Acquisition Corp., Class A(a) | | | 99,246 | |
| | 75,837 | | | Gordon Pointe Acquisition Corp.(a) | | | 794,013 | |
| | 14,758 | | | Health Sciences Acquisitions Corp.(a) | | | 158,353 | |
| | 29,414 | | | Legacy Acquisition Corp., Class A(a) | | | 300,023 | |
| | 41,844 | | | Leisure Acquisition Corp.(a) | | | 427,646 | |
| | 12,752 | | | LF Capital Acquisition Corp., Class A(a) | | | 130,836 | |
| | 82,651 | | | Opes Acquisition Corp.(a) | | | 856,678 | |
| | 32,603 | | | Pure Acquisition Corp.(a) | | | 334,181 | |
| | 19,571 | | | South Mountain Merger Corp.(a) | | | 205,496 | |
| | 37,631 | | | Tiberius Acquisition Corp.(a) | | | 385,341 | |
| | 19,178 | | | Trident Acquisitions Corp.(a) | | | 199,068 | |
| | 15,528 | | | Trinity Merger Corp., Class A(a) | | | 162,112 | |
| | 19,229 | | | Twelve Seas Investment Co.(a) | | | 196,905 | |
| | 18,162 | | | VectoIQ Acquisition Corp.(a) | | | 185,434 | |
| | | | | | | | | |
| TOTAL COMMON STOCKS | | | | |
| (Cost $4,870,126) | | | 5,256,571 | |
| | | | | | | | | |
| EXCHANGE TRADED FUNDS - 22.04% | | | | |
| | 178,753 | | | Invesco FTSE RAFI Emerging Markets ETF | | | 3,589,360 | |
| | 58,499 | | | Invesco FTSE RAFI US 1000 ETF | | | 6,894,692 | |
| | 31,196 | | | SPDR® S&P 500® ETF Trust | | | 9,258,037 | |
| | 33,904 | | | Vanguard® FTSE Developed Markets ETF | | | 1,392,777 | |
| | 60,746 | | | Vanguard® FTSE Emerging Markets ETF | | | 2,445,634 | |
| | | | | | | | | |
| TOTAL EXCHANGE TRADED FUNDS | | | | |
| (Cost $19,665,946) | | | 23,580,500 | |
| | | | | | | | | |
| PREFERRED STOCKS - 0.74% | | | | |
| | 31,946 | | | PennantPark Investment Corp., 5.500%, 10/15/2024 | | | 794,497 | |
| | | | | | | | | |
| TOTAL PREFERRED STOCKS | | | | |
| (Cost $797,303) | | | 794,497 | |
See Notes to Financial Statements.
| 26 | (888) 848-7569 | www.rivernorth.com |
| RiverNorth Core Opportunity Fund | Schedule of Investments |
September 30, 2019
| Shares/Description | | Rate | | Maturity | | Value | |
| BUSINESS DEVELOPMENT COMPANY NOTES - 0.65% | | | | | | | | |
| United States - 0.65% | | | | | | | | |
| | 26,717 | | TriplePoint Venture Growth BDC Corp. | | 5.75% | | 07/15/2022 | | $ | 694,375 | |
| | | | | | | | | | | |
| TOTAL BUSINESS DEVELOPMENT COMPANY NOTES | | | | | | | | |
| (Cost $667,925) | | | | | | | 694,375 | |
| Shares/Description | | Value | |
| RIGHTS - 0.03%(a) | | | | |
| | 35,274 | | Big Rock Partners Acquisition Corp., Strike Price 11.50, Expires 12/31/2049 | | | 6,702 | |
| | 56,421 | | Pensare Acquisition Corp., Strike Price 11.50, Expires 08/08/2022 | | | 16,921 | |
| | 19,229 | | Twelve Seas Investment Co., Strike Price 11.50, Expires 07/14/2023 | | | 6,153 | |
| | | | | | | | |
| TOTAL RIGHTS | | | | |
| (Cost $43,977) | | | 29,776 | |
| | | | | | |
| WARRANTS - 0.16%(a) | | | | |
| | 33,739 | | Allied Esports Entertainment, Inc., Strike Price 11.50, Expires 10/25/2024 | | | 7,085 | |
| | 17,637 | | Big Rock Partners Acquisition Corp., Strike Price 11.50, Expires 12/01/2022 | | | 2,998 | |
| | 3,237 | | Far Point Acquisition Corp., Strike Price 11.50, Expires 06/03/2025 | | | 3,884 | |
| | 75,837 | | Gordon Pointe Acquisition Corp., Strike Price 11.50, Expires 07/30/2024 | | | 30,335 | |
| | 29,414 | | Legacy Acquisition Corp., Strike Price 11.50, Expires 12/01/2022 | | | 10,295 | |
| | 20,922 | | Leisure Acquisition Corp., Strike Price 11.50, Expires 12/28/2022 | | | 15,064 | |
| | 12,752 | | LF Capital Acquisition Corp., Strike Price 11.50, Expires 06/28/2023 | | | 4,081 | |
| | 82,651 | | Opes Acquisition Corp., Strike Price 11.50, Expires 01/16/2023 | | | 14,877 | |
| | 28,211 | | Pensare Acquisition Corp., Strike Price 11.50, Expires 08/08/2022 | | | 6,206 | |
| | 16,301 | | Pure Acquisition Corp., Strike Price 11.50, Expires 04/17/2023 | | | 17,116 | |
| | 37,631 | | Tiberius Acquisition Corp., Strike Price 11.50, Expires 04/10/2023 | | | 22,202 | |
| | 19,178 | | Trident Acquisitions Corp., Strike Price 11.50, Expires 06/14/2021 | | | 2,877 | |
| | 15,528 | | Trinity Merger Corp., Strike Price 11.50, Expires 06/01/2023 | | | 19,721 | |
| | 19,229 | | Twelve Seas Investment Co., Strike Price 11.50, Expires 07/14/2023 | | | 6,149 | |
| | 18,162 | | VectoIQ Acquisition Corp., Strike Price 11.50, Expires 06/12/2023 | | | 7,810 | |
| | | | | | | | |
| TOTAL WARRANTS | | | | |
| (Cost $209,002) | | | 170,700 | |
See Notes to Financial Statements.
| Annual Report | September 30, 2019 | 27 |
| RiverNorth Core Opportunity Fund | Schedule of Investments |
September 30, 2019
| Shares/Description | | Value | |
| SHORT-TERM INVESTMENTS - 4.97% | | | | |
| Money Market Fund - 4.97% | | | | |
| | 5,325,285 | | State Street Institutional Trust (7 Day Yield 1.95%) | | $ | 5,325,285 | |
| | | | | | | | |
TOTAL SHORT-TERM INVESTMENTS
| | | | |
| (Cost $5,325,285) | | | 5,325,285 | |
| | | | | |
| TOTAL INVESTMENTS - 99.92% | | | | |
| (Cost $101,471,994) | | | 106,924,205 | |
| OTHER ASSETS IN EXCESS OF LIABILITIES - 0.08% | | | 81,315 | |
| NET ASSETS - 100.00% | | $ | 107,005,520 | |
| (a) | Non-income producing security. |
See Notes to Financial Statements.
| 28 | (888) 848-7569 | www.rivernorth.com |
| RiverNorth/DoubleLine Strategic Income Fund | Schedule of Investments |
g
| Shares/Description | | Value | |
| CLOSED-END FUNDS - 28.38% | | | | |
| 672,488 | | | Advent Convertible and Income | | $ | 9,804,875 | |
| 892,986 | | | AllianceBernstein Global High Income Fund, Inc. | | | 10,706,902 | |
| 217,697 | | | AllianceBernstein National Municipal Income Fund, Inc. | | | 2,999,865 | |
| 534,193 | | | Ares Dynamic Credit Allocation Fund, Inc. | | | 7,959,476 | |
| 115,910 | | | BlackRock Corporate High Yield Fund, Inc. | | | 1,246,033 | |
| 1,759,610 | | | BlackRock Credit Allocation Income Trust | | | 23,965,888 | |
| 1,165,906 | | | BlackRock Debt Strategies Fund, Inc. | | | 12,533,490 | |
| 214,390 | | | BlackRock Floating Rate Income Trust | | | 2,630,565 | |
| 179,741 | | | BlackRock Limited Duration Income Trust | | | 2,809,352 | |
| 658,098 | | | BlackRock Multi-Sector Income Trust | | | 11,292,962 | |
| 96,793 | | | BlackRock MuniHoldings California Quality Fund, Inc. | | | 1,366,717 | |
| 202,799 | | | BlackRock MuniYield California Quality Fund, Inc. | | | 2,918,278 | |
| 74,969 | | | BlackRock MuniYield New York Quality Fund, Inc. | | | 979,095 | |
| 257,487 | | | BlackRock MuniYield Quality Fund III, Inc. | | | 3,494,099 | |
| 869,783 | | | BrandywineGLOBAL - Global Income Opportunities Fund, Inc. | | | 10,524,374 | |
| 887,024 | | | Eaton Vance Floating-Rate Income Trust | | | 11,726,457 | |
| 2,826,748 | | | Eaton Vance Limited Duration Income Fund | | | 35,334,350 | |
| 737,206 | | | Eaton Vance Senior Floating-Rate Trust | | | 9,613,166 | |
| 1,083,410 | | | Eaton Vance Senior Income Trust | | | 6,630,469 | |
| 700,277 | | | First Trust High Income Long/Short Fund | | | 10,616,199 | |
| 1,047,077 | | | Highland Income Fund | | | 13,978,478 | |
| 2,030,535 | | | Invesco Dynamic Credit Opportunities Fund | | | 22,356,190 | |
| 2,375,401 | | | Invesco Senior Income Trust | | | 9,976,684 | |
| 479,530 | | | Morgan Stanley Emerging Markets Debt Fund, Inc. | | | 4,406,881 | |
| 60,650 | | | Morgan Stanley Emerging Markets Domestic Debt Fund, Inc. | | | 399,684 | |
| 421,186 | | | Neuberger Berman High Yield Strategies Fund, Inc. | | | 5,083,715 | |
| 2,132,785 | | | Nuveen AMT-Free Quality Municipal Income Fund | | | 30,520,153 | |
| 1,790,170 | | | Nuveen Credit Strategies Income Fund | | | 13,390,472 | |
| 956,645 | | | Nuveen Floating Rate Income Fund | | | 9,298,589 | |
| 354,387 | | | Nuveen Floating Rate Income Opportunity Fund | | | 3,380,852 | |
| 592,348 | | | Nuveen Global High Income Fund | | | 9,216,935 | |
| 257,257 | | | Nuveen Mortgage Opportunity Term Fund | | | 5,932,346 | |
| 3,057,459 | | | Nuveen Quality Municipal Income Fund | | | 43,905,111 | |
| 922,310 | | | PGIM Global High Yield Fund, Inc. | | | 13,253,595 | |
| 813,747 | | | PGIM High Yield Bond Fund, Inc. | | | 12,165,518 | |
| 394,464 | | | Putnam Municipal Opportunities Trust | | | 5,155,645 | |
| 274,972 | | | Templeton Emerging Markets Income Fund | | | 2,496,746 | |
| 3,387,061 | | | Templeton Global Income Fund | | | 20,796,555 | |
| 2,865,792 | | | Voya Prime Rate Trust | | | 13,497,880 | |
| 348,463 | | | Wells Fargo Income Opportunities Fund | | | 2,871,335 | |
| 2,915,707 | | | Western Asset Emerging Markets Debt Fund, Inc. | | | 40,499,170 | |
| 156,495 | | | Western Asset Global Corporate Defined Opportunity Fund, Inc. | | | 2,726,143 | |
| 1,677,258 | | | Western Asset Global High Income Fund, Inc. | | | 16,655,172 | |
| 1,490,909 | | | Western Asset High Income Fund II, Inc. | | | 10,108,363 | |
| 8,163,967 | | | Western Asset High Income Opportunity Fund, Inc. | | | 41,228,033 | |
| See Notes to Financial Statements. | | | |
| Annual Report | September 30, 2019 | | | 29 |
| RiverNorth/DoubleLine Strategic Income Fund | Schedule of Investments |
| Shares/Description | | | Value | |
| 689,265 | | | Western Asset High Yield Defined Opportunity Fund, Inc. | | $ | 10,449,257 | |
| 2,674,150 | | | Western Asset Inflation-Linked Opportunities & Income Fund | | | 29,629,582 | |
| 199,133 | | | Western Asset Inflation-Linked Securities & Income Fund | | | 2,307,951 | |
| | | | | | | | |
| TOTAL CLOSED-END FUNDS | | | | |
| (Cost $572,192,503) | | | 574,839,647 | |
| | | | | | | | |
| BUSINESS DEVELOPMENT COMPANIES - 0.23% | | | | |
| 450,876 | | | Barings BDC, Inc. | | | 4,576,391 | |
| | | | | | | | |
| TOTAL BUSINESS DEVELOPMENT COMPANIES | | | | |
| (Cost $4,517,237) | | | 4,576,391 | |
| | | | | | | | |
| COMMON STOCKS - 0.32% | | | | |
| 12,164 | | | Frontera Energy Corp. | | | 117,504 | |
| 1,079,879 | | | FS KKR Capital Corp. | | | 6,295,695 | |
| | | | | | | | |
| TOTAL COMMON STOCKS | | | | |
| (Cost $7,208,586) | | | 6,413,199 | |
| | | | | | | | |
| OPEN-END FUNDS - 1.49% | | | | |
| 3,159,165 | | | RiverNorth/Oaktree High Income Fund, Class I(a) | | | 30,156,442 | |
| | | | | | | | |
| TOTAL OPEN-END FUNDS | | | | |
| (Cost $29,923,731) | | | 30,156,442 | |
| | | | | | | | |
| PREFERREDSTOCKS - 2.00% | | | | |
| 333,994 | | | Allianzgi Convertible & Income Fund, Series A, 5.625%(b) | | | 8,777,362 | |
| 103,000 | | | Annaly Capital, Series G, 6.500%(b) | | | 2,579,120 | |
| 150,000 | | | GDL Fund, Series C, 4.000%, 03/26/2025 | | | 7,590,000 | |
| 19,793 | | | Gladstone Investment Corp., 6.250%, 09/30/2023 | | | 500,961 | |
| 315,636 | | | Hercules Capital, Inc., 5.250%, 04/30/2025 | | | 7,963,496 | |
| 176,329 | | | Kayne Anderson MLP/Midstream Investment Co., Series F, 3.500%, 04/15/2020 | | | 4,431,148 | |
| 156,840 | | | New Mountain Finance Corp., 5.750%, 10/01/2023 | | | 4,033,925 | |
| 185,737 | | | PennantPark Investment Corp., 5.500%, 10/15/2024 | | | 4,619,279 | |
| | | | | | | | |
| TOTAL PREFERRED STOCKS | | | | |
| (Cost $39,583,589) | | | 40,495,291 | |
| Shares/Description | | | Rate | | | Maturity | | | Value | |
| BUSINESS DEVELOPMENT COMPANY NOTES - 1.17% | | | | | | | | | | | | |
| United States - 1.17% | | | | | | | | | | | | |
| 172,306 | | | MVC Capital, Inc. | | | 6.25% | | | | 11/30/2022 | | | | 4,376,573 | |
| 195,082 | | | Portman Ridge Finance Corp. | | | 6.13% | | | | 09/30/2022 | | | | 4,886,804 | |
| See Notes to Financial Statements. | |
| 30 | (888) 848-7569 | www.rivernorth.com |
| RiverNorth/DoubleLine Strategic Income Fund | Schedule of Investments |
| Shares/Description | | | Rate | Maturity | | Value | |
| 120,856 | | | THL Credit, Inc. | | 6.75% | | 12/30/2022 | | $ | 3,056,448 | |
| 189,913 | | | THL Credit, Inc. | | 6.13% | | 10/30/2023 | | | 4,937,738 | |
| 244,476 | | | TriplePoint Venture Growth BDC Corp. | | 5.75% | | 07/15/2022 | | | 6,353,931 | |
| | | | | | | | | | | 23,611,494 | |
| | | | | | | | | |
| TOTAL BUSINESS DEVELOPMENT COMPANY NOTES | | | | | | | | |
| (Cost $23,011,046) | | | | | | | 23,611,494 | |
| Principal Amount/Description | | Rate | | Maturity | | Value | |
| FOREIGN CORPORATE BONDS - 4.73% | | | | | | | |
| Argentina - 0.16% | | | | | | | | |
| $ | 750,000 | | | Banco Macro SA(c)(d) | | 6.75% | | 11/04/2026 | | | 519,375 | |
| | 650,000 | | | Cia General de Combustibles SA(d) | | 9.50% | | 11/07/2021 | | | 495,625 | |
| | 150,000 | | | Pampa Energia SA(e) | | 9.13% | | 04/15/2029 | | | 119,342 | |
| | 500,000 | | | Pampa Energia SA(d) | | 7.50% | | 01/24/2027 | | | 381,250 | |
| | 1,018,420 | | | Stoneway Capital Corp.(d) | | 10.00% | | 03/01/2027 | | | 613,598 | |
| | 300,000 | | | Telecom Argentina SA(e) | | 8.00% | | 07/18/2026 | | | 263,250 | |
| | 100,000 | | | YPF SA(e) | | 8.50% | | 06/27/2029 | | | 79,500 | |
| | 700,000 | | | YPF SA(d) | | 8.50% | | 07/28/2025 | | | 553,007 | |
| | 200,000 | | | YPF SA(d) | | 6.95% | | 07/21/2027 | | | 153,240 | |
| | | | | | | | | | | | 3,178,187 | |
| Australia - 0.21% | | | | | | | | | | | |
| | 1,000,000 | | | APT Pipelines, Ltd.(e) | | 4.25% | | 07/15/2027 | | | 1,076,342 | |
| | 650,000 | | | Commonwealth Bank of Australia(e) | | 4.32% | | 01/10/2048 | | | 717,446 | |
| | 110,000 | | | Macquarie Group, Ltd.(c)(e) | | 3M US L + 1.02% | | 11/28/2023 | | | 112,241 | |
| | 545,000 | | | Macquarie Group, Ltd.(c)(e) | | 3M US L + 1.33% | | 03/27/2024 | | | 575,327 | |
| | 500,000 | | | Sydney Airport Finance Co. Pty, Ltd.(e) | | 3.38% | | 04/30/2025 | | | 515,185 | |
| | 500,000 | | | Sydney Airport Finance Co. Pty, Ltd.(e) | | 3.63% | | 04/28/2026 | | | 522,439 | |
| | 710,000 | | | Westpac Banking Corp.(c) | | 3M US L + 0.72% | | 05/15/2023 | | | 714,512 | |
| | | | | | | | | | | | 4,233,492 | |
| Austria - 0.08% | | | | | | | | | | | |
| | 500,000 | | | JBS Investments II GmbH(e) | | 7.00% | | 01/15/2026 | | | 540,745 | |
| | 500,000 | | | JBS Investments II GmbH(e) | | 5.75% | | 01/15/2028 | | | 521,875 | |
| | 600,000 | | | Klabin Austria GmbH(d) | | 7.00% | | 04/03/2049 | | | 639,780 | |
| | | | | | | | | | | | 1,702,400 | |
| Brazil - 0.16% | | | | | | | | | | | |
| | 1,650,000 | | | Banco do Brasil SA(b)(c)(d) | | 6.25% | | Perpetual Maturity | | | 1,629,375 | |
| | 1,050,000 | | | CSN Islands XII Corp.(b)(d) | | 7.00% | | Perpetual Maturity | | | 919,417 | |
| | 300,000 | | | CSN Resources SA(e) | | 7.63% | | 04/17/2026 | | | 312,034 | |
| | 200,000 | | | CSN Resources SA(d) | | 7.63% | | 02/13/2023 | | | 209,250 | |
| See Notes to Financial Statements. | | | |
| Annual Report | September 30, 2019 | | | 31 |
| RiverNorth/DoubleLine Strategic Income Fund | Schedule of Investments |
| Principal Amount/Description | | Rate | | Maturity | | Value | |
| $ | 200,000 | | | Nexa Resources SA(d) | | 5.38% | | 05/04/2027 | | $ | 212,925 | |
| | | | | | | | | | | | 3,283,001 | |
| British Virgin Islands - 0.06% | | | | | | | | |
| | 300,000 | | | C10 Capital SPV, Ltd.(b)(c)(d) | | 3M US L + 4.71% | | Perpetual Maturity | | | 298,500 | |
| | 100,000 | | | C5 Capital SPV, Ltd.(b)(c)(d) | | 3M US L + 4.28% | | Perpetual Maturity | | | 98,316 | |
| | 800,000 | | | Radiant Access, Ltd.(b) | | 4.60% | | Perpetual Maturity | | | 785,000 | |
| | | | | | | | | | | | 1,181,816 | |
| Canada - 0.36% | | | | | | | | |
| | 325,000 | | | 1011778 BC ULC / New Red Finance, Inc.(e) | | 5.00% | | 10/15/2025 | | | 336,538 | |
| | 525,000 | | | Bank of Montreal(c) | | 3.80% | | 12/15/2032 | | | 544,966 | |
| | 490,000 | | | Bank of Nova Scotia | | 3.40% | | 02/11/2024 | | | 511,886 | |
| | 140,000 | | | Bombardier, Inc.(e) | | 6.00% | | 10/15/2022 | | | 140,525 | |
| | 1,500,000 | | | Canacol Energy, Ltd.(d) | | 7.25% | | 05/03/2025 | | | 1,592,625 | |
| | 310,000 | | | Cenovus Energy, Inc. | | 5.40% | | 06/15/2047 | | | 349,766 | |
| | 762,000 | | | Fortis, Inc. | | 2.10% | | 10/04/2021 | | | 759,690 | |
| | 165,000 | | | Garda World Security Corp.(e) | | 8.75% | | 05/15/2025 | | | 170,296 | |
| | 120,000 | | | GFL Environmental, Inc.(e) | | 8.50% | | 05/01/2027 | | | 133,350 | |
| | 600,000 | | | Gran Tierra Energy, Inc.(e) | | 7.75% | | 05/23/2027 | | | 565,500 | |
| | 650,000 | | | Nutrien, Ltd. | | 4.20% | | 04/01/2029 | | | 716,339 | |
| | 145,000 | | | Parkland Fuel Corp.(e) | | 5.88% | | 07/15/2027 | | | 152,512 | |
| | 90,000 | | | Telesat Canada / Telesat LLC(e) | | 8.88% | | 11/15/2024 | | | 96,642 | |
| | 60,000 | | | Telesat Canada / Telesat LLC(e) | | 6.50% | | 10/15/2027 | | | 61,200 | |
| | 280,000 | | | Tervita Corp.(e) | | 7.63% | | 12/01/2021 | | | 285,950 | |
| | 750,000 | | | TransCanada PipeLines, Ltd. | | 4.25% | | 05/15/2028 | | | 829,939 | |
| | | | | | | | | | | | 7,247,724 | |
| Cayman Islands - 0.45% | | | | | | | | |
| | 910,000 | | | Banco BTG Pactual SA(c)(e) | | 7.75% | | 02/15/2029 | | | 950,950 | |
| | 600,000 | | | Banco BTG Pactual SA(c)(d) | | 7.75% | | 02/15/2029 | | | 627,000 | |
| | 200,000 | | | Banco Mercantil del Norte SA/Grand Cayman(b)(e) | | 7.50% | | Perpetual Maturity | | | 203,250 | |
| | 1,650,000 | | | Banco Mercantil del Norte SA/Grand Cayman(b)(c)(d) | | 7.63% | | Perpetual Maturity | | | 1,689,204 | |
| | 1,000,000 | | | CK Hutchison Capital Securities 17, Ltd.(b)(c)(d) | | 4.00% | | Perpetual Maturity | | | 1,002,481 | |
| | 200,000 | | | Comunicaciones Celulares SA Via Comcel Trust(d) | | 6.88% | | 02/06/2024 | | | 206,500 | |
| | 200,000 | | | Global Aircraft Leasing Co., Ltd.(e)(f) | | 6.50% (7.25%) | | 09/15/2024 | | | 203,000 | |
| | 624,000 | | | Gran Tierra Energy International Holdings, Ltd.(d) | | 6.25% | | 02/15/2025 | | | 561,600 | |
| | 200,000 | | | Grupo Aval, Ltd.(d) | | 4.75% | | 09/26/2022 | | | 207,200 | |
| | 976,475 | | | Interoceanica IV Finance, Ltd.(d)(g) | | 0.00% | | 11/30/2025 | | | 898,357 | |
| See Notes to Financial Statements. | |
| 32 | (888) 848-7569 | www.rivernorth.com |
| RiverNorth/DoubleLine Strategic Income Fund | Schedule of Investments |
| Principal Amount/Description | | Rate | | Maturity | | Value | |
| $ | 500,000 | | | Itau Unibanco Holding SA Island(b)(c)(d) | | 6.50% | | Perpetual Maturity | | $ | 516,100 | |
| | 200,000 | | | Latam Finance, Ltd.(e) | | 7.00% | | 03/01/2026 | | | 213,634 | |
| | 200,000 | | | Latam Finance, Ltd.(d) | | 6.88% | | 04/11/2024 | | | 210,650 | |
| | 900,000 | | | Latam Finance, Ltd.(d) | | 7.00% | | 03/01/2026 | | | 961,353 | |
| | 300,000 | | | Lima Metro Line 2 Finance, Ltd.(e) | | 5.88% | | 07/05/2034 | | | 331,028 | |
| | 71,200 | | | Transocean Guardian, Ltd.(e) | | 5.88% | | 01/15/2024 | | | 71,912 | |
| | 210,000 | | | Transocean Poseidon, Ltd.(e) | | 6.88% | | 02/01/2027 | | | 217,350 | |
| | | | | | | | | | | | 9,071,569 | |
| Chile - 0.40% | | | | | | | | | | | |
| | 600,000 | | | AES Gener SA(c)(e) | | 7.13% | | 03/26/2079 | | | 630,750 | |
| | 200,000 | | | AES Gener SA(c)(d) | | 7.13% | | 03/26/2079 | | | 210,250 | |
| | 400,000 | | | Celulosa Arauco y Constitucion SA(e) | | 5.50% | | 04/30/2049 | | | 444,500 | |
| | 200,000 | | | Colbun SA(d) | | 3.95% | | 10/11/2027 | | | 208,127 | |
| | 900,000 | | | Empresa de Transporte de Pasajeros Metro SA(e) | | 5.00% | | 01/25/2047 | | | 1,053,000 | |
| | 347,800 | | | Empresa Electrica Angamos SA(d) | | 4.88% | | 05/25/2029 | | | 364,701 | |
| | 400,000 | | | Empresa Electrica Guacolda SA(d) | | 4.56% | | 04/30/2025 | | | 362,017 | |
| | 200,000 | | | Engie Energia Chile SA(d) | | 4.50% | | 01/29/2025 | | | 214,500 | |
| | 1,400,000 | | | Geopark, Ltd.(d) | | 6.50% | | 09/21/2024 | | | 1,445,500 | |
| | 650,000 | | | GNL Quintero SA(d) | | 4.63% | | 07/31/2029 | | | 697,944 | |
| | 200,000 | | | Inversiones CMPC SA(d) | | 4.75% | | 09/15/2024 | | | 214,714 | |
| | 200,000 | | | Sociedad Quimica y Minera de Chile SA(d) | | 4.38% | | 01/28/2025 | | | 212,250 | |
| | 750,000 | | | Transelec SA(d) | | 3.88% | | 01/12/2029 | | | 772,507 | |
| | 200,000 | | | VTR Finance BV(e) | | 6.88% | | 01/15/2024 | | | 206,500 | |
| | 1,000,000 | | | VTR Finance BV(d) | | 6.88% | | 01/15/2024 | | | 1,032,500 | |
| | | | | | | | | | | | 8,069,760 | |
| China - 0.01% | | | | | | | | | | | |
| | 300,000 | | | Sinopec Group Overseas Development 2016, Ltd.(d) | | 2.75% | | 09/29/2026 | | | 300,070 | |
| | | | | | | | | | | | | |
| Colombia - 0.13% | | | | | | | | | | | |
| | 200,000 | | | Banco Bilbao Vizcaya Argentaria Colombia SA(d) | | 4.88% | | 04/21/2025 | | | 214,750 | |
| | 500,000 | | | Bancolombia SA | | 5.13% | | 09/11/2022 | | | 526,880 | |
| | 100,000 | | | Ecopetrol SA | | 5.88% | | 09/18/2023 | | | 111,600 | |
| | | | | | | | | | | | | |
| | 200,000 | | | Empresas Publicas de Medellin ESP(e) | | 4.25% | | 07/18/2029 | | | 210,780 | |
| | 200,000 | | | Fideicomiso PA Pacifico Tres(d) | | 8.25% | | 01/15/2035 | | | 228,000 | |
| | 150,000 | | | Gilex Holding Sarl(e) | | 8.50% | | 05/02/2023 | | | 161,439 | |
| | 750,000 | | | Gilex Holding Sarl(d) | | 8.50% | | 05/02/2023 | | | 807,195 | |
| | 200,000 | | | SURA Asset Management SA(d) | | 4.88% | | 04/17/2024 | | | 215,750 | |
| | 200,000 | | | Tecnoglass, Inc.(d) | | 8.20% | | 01/31/2022 | | | 216,500 | |
| | | | | | | | | | | | 2,692,894 | |
| See Notes to Financial Statements. | | | |
| Annual Report | September 30, 2019 | | | 33 |
| RiverNorth/DoubleLine Strategic Income Fund | Schedule of Investments |
| Principal Amount/Description | | Rate | Maturity | | | Value | |
| Dominican Republic - 0.05% | | | | | | | | | |
| $ | 600,000 | | | Aeropuertos Dominicanos Siglo XXI SA(d) | | 6.75% | | 03/30/2029 | | | $ | 632,550 | |
| | 300,000 | | | Banco de Reservas de la Republica Dominicana(e) | | 7.00% | | 02/01/2023 | | | | 315,378 | |
| | | | | | | | | | | | | 947,928 | |
| France - 0.04% | | | | | | | | | |
| | 725,000 | | | BNP Paribas SA(e) | | 3.38% | | 01/09/2025 | | | | 750,292 | |
| | | | | | | | | | | | | | |
| Great Britain - 0.31% | | | | | | | | | | | |
| | 710,000 | | | Anglo American Capital PLC(e) | | 4.50% | | 03/15/2028 | | | | 754,544 | |
| | 689,000 | | | AstraZeneca PLC | | 2.38% | | 06/12/2022 | | | | 694,316 | |
| | 590,000 | | | Barclays PLC(c) | | 3M US L + 1.38% | | 05/16/2024 | | | | 587,424 | |
| | 510,000 | | | Credit Agricole SA/London(e) | | 3.75% | | 04/24/2023 | | | | 533,408 | |
| | 1,030,000 | | | HSBC Holdings PLC(c) | | 3M US L + 1.38% | | 09/12/2026 | | | | 1,038,997 | |
| | 350,000 | | | Imperial Brands Finance PLC(e) | | 3.50% | | 07/26/2026 | | | | 350,345 | |
| | 730,000 | | | Lloyds Banking Group PLC(c) | | 3M US L + 1.21% | | 11/07/2028 | | | | 745,374 | |
| | 200,000 | | | MARB BondCo PLC(d) | | 7.00% | | 03/15/2024 | | | | 209,002 | |
| | 500,000 | | | MARB BondCo PLC(d) | | 6.88% | | 01/19/2025 | | | | 524,000 | |
| | 255,000 | | | Royal Bank of Scotland Group PLC(c) | | 3M US L + 1.48% | | 05/15/2023 | | | | 258,528 | |
| | 450,000 | | | Vedanta Resources Finance II PLC(e) | | 9.25% | | 04/23/2026 | | | | 448,988 | |
| | 200,000 | | | Vedanta Resources Finance II PLC(d) | | 9.25% | | 04/23/2026 | | | | 199,550 | |
| | | | | | | | | | | | | 6,344,476 | |
| Guatemala - 0.01% | | | | | | | | | | | |
| | 200,000 | | | Energuate Trust(e) | | 5.88% | | 05/03/2027 | | | | 201,000 | |
| | | | | | | | | | | | | | |
| India - 0.07% | | | | | | | | | | | |
| | 400,000 | | | Adani Ports & Special Economic Zone, Ltd.(d) | | 3.95% | | 01/19/2022 | | | | 409,625 | |
| | 200,000 | | | Indian Oil Corp., Ltd. | | 5.75% | | 08/01/2023 | | | | 220,454 | |
| | 800,000 | | | Vedanta Resources, Ltd.(d) | | 6.13% | | 08/09/2024 | | | | 739,115 | |
| | | | | | | | | | | | | 1,369,194 | |
| Indonesia - 0.18% | | | | | | | | | | | |
| | 1,000,000 | | | Pertamina Persero PT(d) | | 4.88% | | 05/03/2022 | | | | 1,057,023 | |
| | 1,000,000 | | | Perusahaan Listrik Negara PT(d) | | 5.50% | | 11/22/2021 | | | | 1,062,500 | |
| | 1,389,100 | | | Star Energy Geothermal Wayang Windu, Ltd.(d) | | 6.75% | | 04/24/2033 | | | | 1,451,922 | |
| | | | | | | | | | | | | 3,571,445 | |
| Ireland - 0.19% | | | | | | | | | | | |
| | 760,000 | | | AerCap Ireland Capital DAC / AerCap Global Aviation Trust | | 3.50% | | 01/15/2025 | | | | 776,189 | |
| | 205,000 | | | Avolon Holdings Funding, Ltd.(e) | | 5.25% | | 05/15/2024 | | | | 220,006 | |
| | 490,000 | | | Avolon Holdings Funding, Ltd.(e) | | 3.95% | | 07/01/2024 | | | | 503,206 | |
| | 200,000 | | | C&W Senior Financing DAC(e) | | 7.50% | | 10/15/2026 | | | | 211,500 | |
| | 1,400,000 | | | C&W Senior Financing DAC(d) | | 6.88% | | 09/15/2027 | | | | 1,456,000 | |
| See Notes to Financial Statements. | |
| 34 | (888) 848-7569 | www.rivernorth.com |
| RiverNorth/DoubleLine Strategic Income Fund | Schedule of Investments |
| Principal Amount/Description | | Rate | | Maturity | | Value | |
| $ | 715,000 | | | Shire Acquisitions Investments Ireland DAC | | 2.88% | | 09/23/2023 | | $ | 729,822 | |
| | | | | | | | | | | | 3,896,723 | |
| Isle Of Man - 0.04% | | | | | | | | | |
| | 800,000 | | | Gohl Capital, Ltd. | | 4.25% | | 01/24/2027 | | | 838,056 | |
| | | | | | | | | | | | | |
| Israel - 0.07% | | | | | | | | | |
| | 100,000 | | | Delek & Avner Tamar Bond, Ltd.(e) | | 5.08% | | 12/30/2023 | | | 102,909 | |
| | 100,000 | | | Delek & Avner Tamar Bond, Ltd.(e) | | 5.41% | | 12/30/2025 | | | 103,603 | |
| | 1,100,000 | | | Israel Electric Corp., Ltd.(e) | | 5.00% | | 11/12/2024 | | | 1,213,300 | |
| | | | | | | | | | | | 1,419,812 | |
| Jamaica - 0.00%(h) | | | | | | | | | |
| | 602,566 | | | Digicel Group Two, Ltd.(e)(f) | | 7.13% (2.00%) | | 04/01/2024 | | | 63,269 | |
| | | | | | | | | | | | | |
| Japan - 0.09% | | | | | | | | | |
| | 665,000 | | | Mitsubishi UFJ Financial Group, Inc.(c) | | 3M US L + 0.74% | | 03/02/2023 | | | 665,217 | |
| | 1,100,000 | | | Sumitomo Mitsui Financial Group, Inc.(c) | | 3M US L + 0.74% | | 01/17/2023 | | | 1,101,529 | |
| | | | | | | | | | | | 1,766,746 | |
| Luxembourg - 0.21% | | | | | | | | |
| | 1,200,000 | | | JSL Europe SA(d) | | 7.75% | | 07/26/2024 | | | 1,293,036 | |
| | 200,000 | | | Millicom International Cellular SA(e) | | 6.63% | | 10/15/2026 | | | 218,000 | |
| | 450,000 | | | Millicom International Cellular SA(e) | | 6.25% | | 03/25/2029 | | | 492,570 | |
| | 200,000 | | | Millicom International Cellular SA(d) | | 5.13% | | 01/15/2028 | | | 209,270 | |
| | 550,000 | | | Millicom International Cellular SA(d) | | 6.25% | | 03/25/2029 | | | 602,030 | |
| | 400,000 | | | Minerva Luxembourg SA(d) | | 6.50% | | 09/20/2026 | | | 417,580 | |
| | 1,050,000 | | | Minerva Luxembourg SA(d) | | 5.88% | | 01/19/2028 | | | 1,055,460 | |
| | | | | | | | | | | | 4,287,946 | |
| Malaysia - 0.03% | | | | | | | | | |
| | 600,000 | | | Malayan Banking Bhd(c) | | 3.91% | | 10/29/2026 | | | 610,674 | |
| | | | | | | | | | | | | |
| Mauritius - 0.03% | | | | | | | | | |
| | 200,000 | | | UPL Corp., Ltd. | | 4.50% | | 03/08/2028 | | | 207,652 | |
| | 400,000 | | | UPL Corp., Ltd.(d) | | 3.25% | | 10/13/2021 | | | 401,911 | |
| | | | | | | | | | | | 609,563 | |
| Mexico - 0.48% | | | | | | | | | |
| | 200,000 | | | Banco Santander Mexico SA Institucion de Banca Multiple Grupo Financiero Santand(c)(e) | | 5.95% | | 10/01/2028 | | | 214,950 | |
| | 500,000 | | | Banco Santander Mexico SA Institucion de Banca Multiple Grupo Financiero Santand(b) | | 8.50% | | Perpetual Maturity | | | 527,500 | |
| | 1,450,000 | | | BBVA Bancomer SA(c)(d) | | 5.13% | | 01/18/2033 | | | 1,386,563 | |
| | 200,000 | | | Cemex SAB de CV(d) | | 7.75% | | 04/16/2026 | | | 217,252 | |
| See Notes to Financial Statements. | | | |
| Annual Report | September 30, 2019 | | | 35 |
| RiverNorth/DoubleLine Strategic Income Fund | Schedule of Investments |
| Principal Amount/Description | | Rate | | Maturity | | Value | |
| $ | 1,657,500 | | | Cometa Energia SA de CV(d) | | 6.38% | | 04/24/2035 | | $ | 1,769,381 | |
| | 200,000 | | | Controladora Mabe SA de CV(d) | | 5.60% | | 10/23/2028 | | | 216,002 | |
| | 200,000 | | | Credito Real SAB de CV SOFOM ER(e) | | 9.50% | | 02/07/2026 | | | 231,000 | |
| | 1,200,000 | | | Credito Real SAB de CV SOFOM ER(b)(c)(d) | | 9.13% | | Perpetual Maturity | | | 1,236,012 | |
| | 800,000 | | | Docuformas SAPI de CV(e) | | 10.25% | | 07/24/2024 | | | 791,560 | |
| | 200,000 | | | El Puerto de Liverpool SAB de CV(d) | | 3.88% | | 10/06/2026 | | | 203,752 | |
| | 600,000 | | | Financiera Independencia SAB de CV SOFOM ENR(d) | | 8.00% | | 07/19/2024 | | | 556,506 | |
| | 200,000 | | | Grupo Bimbo SAB de CV(b)(c)(d) | | 5.95% | | Perpetual Maturity | | | 211,400 | |
| | 200,000 | | | Grupo Idesa SA de CV(e) | | 7.88% | | 12/18/2020 | | | 147,000 | |
| | 200,000 | | | Grupo Idesa SA de CV(d) | | 7.88% | | 12/18/2020 | | | 147,000 | |
| | 600,000 | | | Grupo Posadas SAB de CV(d) | | 7.88% | | 06/30/2022 | | | 603,006 | |
| | 1,400,000 | | | Unifin Financiera SAB de CV SOFOM ENR(b)(c)(d) | | 8.88% | | Perpetual Maturity | | | 1,249,514 | |
| | | | | | | | | | | | 9,708,398 | |
| Netherlands - 0.26% | | | | | | | | | |
| | 400,000 | | | AES Andres BV / Dominican Power Partners / Empresa Generadora de Electricidad It(e) | | 7.95% | | 05/11/2026 | | | 427,500 | |
| | 500,000 | | | Bharti Airtel International Netherlands BV(d) | | 5.13% | | 03/11/2023 | | | 526,861 | |
| | 400,000 | | | Cimpor Financial Operations(d) | | 5.75% | | 07/17/2024 | | | 301,000 | |
| | 600,000 | | | Minejesa Capital BV(d) | | 4.63% | | 08/10/2030 | | | 618,975 | |
| | 400,000 | | | Minejesa Capital BV(d) | | 5.63% | | 08/10/2037 | | | 433,471 | |
| | 335,000 | | | NXP BV / NXP Funding LLC / NXP USA, Inc.(e) | | 3.88% | | 06/18/2026 | | | 352,784 | |
| | 600,000 | | | Petrobras Global Finance BV | | 5.75% | | 02/01/2029 | | | 663,228 | |
| | 950,000 | | | Petrobras Global Finance BV | | 6.90% | | 03/19/2049 | | | 1,091,550 | |
| | 200,000 | | | Syngenta Finance NV | | 4.38% | | 03/28/2042 | | | 183,827 | |
| | 600,000 | | | Syngenta Finance NV(d) | | 5.68% | | 04/24/2048 | | | 621,272 | |
| | | | | | | | | | | | 5,220,468 | |
| New Zealand - 0.03% | | | | | | | | | | |
| | 645,000 | | | Bank of New Zealand(e) | | 3.50% | | 02/20/2024 | | | 675,978 | |
| | | | | | | | | | | | | |
| Panama - 0.10% | | | | | | | | | | |
| | 200,000 | | | Aeropuerto Internacional de Tocumen SA(d) | | 5.63% | | 05/18/2036 | | | 235,002 | |
| | 300,000 | | | Banco General SA(d) | | 4.13% | | 08/07/2027 | | | 315,564 | |
| | 400,000 | | | Empresa de Transmision Electrica SA(e) | | 5.13% | | 05/02/2049 | | | 461,750 | |
| | 800,000 | | | Global Bank Corp.(c)(e) | | 3M US L + 3.30% | | 04/16/2029 | | | 849,600 | |
| See Notes to Financial Statements. | |
| 36 | (888) 848-7569 | www.rivernorth.com |
| RiverNorth/DoubleLine Strategic Income Fund | Schedule of Investments |
| Principal Amount/Description | | Rate | | Maturity | | Value | |
| $ | 200,000 | | | Global Bank Corp.(d) | | 4.50% | | 10/20/2021 | | $ | 206,376 | |
| | | | | | | | | | | | 2,068,292 | |
| Paraguay - 0.02% | | | | | | | | | |
| | 400,000 | | | Telefonica Celular del Paraguay SA(e) | | 5.88% | | 04/15/2027 | | | 429,100 | |
| | | | | | | | | | | | | |
| Peru - 0.04% | | | | | | | | | |
| | 100,000 | | | Banco BBVA Peru SA(d) | | 5.00% | | 08/26/2022 | | | 106,850 | |
| | 150,000 | | | Banco Internacional del Peru SAA Interbank(d) | | 3.38% | | 01/18/2023 | | | 152,063 | |
| | 400,000 | | | Inkia Energy, Ltd.(d) | | 5.88% | | 11/09/2027 | | | 416,504 | |
| | 200,000 | | | Orazul Energy Egenor SCA(d) | | 5.63% | | 04/28/2027 | | | 207,125 | |
| | | | | | | | | | | | 882,542 | |
| Philippines - 0.05% | | | | | | | | | |
| | 600,000 | | | BDO Unibank, Inc. | | 2.95% | | 03/06/2023 | | | 608,604 | |
| | 400,000 | | | Union Bank of the Philippines | | 3.37% | | 11/29/2022 | | | 410,232 | |
| | | | | | | | | | | | 1,018,836 | |
| Singapore - 0.21% | | | | | | | | | |
| | 515,000 | | | BOC Aviation, Ltd.(c)(e) | | 3M US L + 1.13% | | 09/26/2023 | | | 517,768 | |
| | 600,000 | | | BPRL International Singapore Pte, Ltd. | | 4.38% | | 01/18/2027 | | | 642,462 | |
| | 1,200,000 | | | DBS Group Holdings, Ltd.(b)(c) | | 3.60% | | Perpetual Maturity | | | 1,206,000 | |
| | 395,280 | | | LLPL Capital Pte, Ltd.(e) | | 6.88% | | 02/04/2039 | | | 460,442 | |
| | 600,000 | | | ONGC Videsh Vankorneft Pte, Ltd. | | 3.75% | | 07/27/2026 | | | 623,641 | |
| | 200,000 | | | Oversea-Chinese Banking Corp., Ltd.(d) | | 4.25% | | 06/19/2024 | | | 212,625 | |
| | 500,000 | | | United Overseas Bank, Ltd.(b)(c) | | 3.88% | | Perpetual Maturity | | | 504,259 | |
| | | | | | | | | | | | 4,167,197 | |
| South Korea - 0.03% | | | | | | | | | |
| | 550,000 | | | Korea Expressway Corp.(c)(e) | | 3M US L + 0.70% | | 04/20/2020 | | | 551,107 | |
| Spain - 0.09% | | | | | | | | | |
| | 800,000 | | | AI Candelaria Spain SLU(e) | | 7.50% | | 12/15/2028 | | | 911,008 | |
| | 250,000 | | | AI Candelaria Spain SLU(d) | | 7.50% | | 12/15/2028 | | | 284,690 | |
| | 600,000 | | | Banco Santander SA(c) | | 3M US L + 1.09% | | 02/23/2023 | | | 600,515 | |
| | | | | | | | | | | | 1,796,213 | |
| Switzerland - 0.04% | | | | | | | | | |
| | 750,000 | | | Credit Suisse Group AG(c)(e) | | 3M US L + 1.24% | | 06/12/2024 | | | 755,227 | |
| See Notes to Financial Statements. | | | |
| Annual Report | September 30, 2019 | | | 37 |
| RiverNorth/DoubleLine Strategic Income Fund | Schedule of Investments |
| Principal Amount/Description | | Rate | | Maturity | | Value | |
| Thailand - 0.04% | | | | | | | | |
| $ | 800,000 | | | Pttep Treasury Center Co., Ltd.(b)(c)(d) | | 4.60% | | Perpetual Maturity | | $ | 819,758 | |
| | | | | | | | | | | | | |
| TOTAL FOREIGN CORPORATE BONDS | | | | | | | | |
| (Cost $92,891,784) | | | | | | | 95,731,153 | |
| Principal Amount/Description | | Rate | | Maturity | | Value | |
| U.S. CORPORATE BONDS - 4.61% | | | | | |
| Advertising - 0.04% | | | | | | | | |
| | 645,000 | | | Interpublic Group of Cos., Inc. | | 5.40% | | 10/01/2048 | | | 769,329 | |
| Aerospace/Defense - 0.05% | | | | | | | | |
| | 590,000 | | | Lockheed Martin Corp. | | 4.70% | | 05/15/2046 | | | 751,282 | |
| | 170,000 | | | TransDigm, Inc.(e) | | 6.25% | | 03/15/2026 | | | 182,963 | |
| | 75,000 | | | TransDigm, Inc. | | 6.38% | | 06/15/2026 | | | 79,125 | |
| | | | | | | | | | | | 1,013,370 | |
| Agriculture - 0.09% | | | | | | | | |
| | 645,000 | | | Altria Group, Inc. | | 4.80% | | 02/14/2029 | | | 707,904 | |
| | 1,120,000 | | | BAT Capital Corp. | | 3.46% | | 09/06/2029 | | | 1,098,251 | |
| | | | | | | | | | | | 1,806,155 | |
| Airlines - 0.03% | | | | | | | | |
| | 640,000 | | | Delta Air Lines, Inc. | | 3.80% | | 04/19/2023 | | | 664,293 | |
| Asset Management - 0.00%(h) | | | | | | | | |
| | 95,000 | | | Icahn Enterprises Holdings LP | | 6.38% | | 12/15/2025 | | | 100,131 | |
| Auto Manufacturers - 0.10% | | | | | | | | |
| | 150,000 | | | Ford Motor Co. | | 7.45% | | 07/16/2031 | | | 172,226 | |
| | 185,000 | | | General Motors Co.(c) | | 3M US L + 0.80% | | 08/07/2020 | | | 185,375 | |
| | 865,000 | | | General Motors Financial Co., Inc.(c) | | 3M US L + 0.99% | | 01/05/2023 | | | 853,572 | |
| | 755,000 | | | Volkswagen Group of America Finance LLC(e) | | 4.25% | | 11/13/2023 | | | 804,972 | |
| | | | | | | | | | | | 2,016,145 | |
| Auto Parts & Equipment - 0.01% | | | | | | | | |
| | 160,000 | | | Panther BF Aggregator 2 LP / Panther Finance Co., Inc.(e) | | 6.25% | | 05/15/2026 | | | 168,800 | |
| Banks - 0.20% | | | | | | | | |
| | 655,000 | | | Bank of America Corp.(c) | | 3M US L + 1.21% | | 02/07/2030 | | | 717,629 | |
| | 300,000 | | | BBVA Bancomer SA(c)(d) | | 5.40% | | 11/12/2029 | | | 299,253 | |
| | 1,080,000 | | | Citigroup, Inc.(c) | | 3M US L + 1.10% | | 05/17/2024 | | | 1,089,987 | |
| | 140,000 | | | Goldman Sachs Group, Inc.(c) | | 3M US L + 0.78% | | 10/31/2022 | | | 140,446 | |
| | 675,000 | | | Goldman Sachs Group, Inc.(c) | | 3M US L + 1.17% | | 05/15/2026 | | | 678,955 | |
| | 750,000 | | | Morgan Stanley(c) | | 3M US L + 1.34% | | 07/22/2028 | | | 791,699 | |
| | 320,000 | | | Wells Fargo & Co.(c) | | 3M US L + 1.17% | | 06/17/2027 | | | 330,935 | |
| | | | | | | | | | | | 4,048,904 | |
| See Notes to Financial Statements. | |
| 38 | (888) 848-7569 | www.rivernorth.com |
| RiverNorth/DoubleLine Strategic Income Fund | Schedule of Investments |
| Principal Amount/Description | | Rate | | Maturity | | | Value | |
| Beverages - 0.06% | | | | | | | | | |
| $ | 140,000 | | | Anheuser-Busch InBev Worldwide, Inc. | | 4.90% | | 02/01/2046 | | | $ | 166,803 | |
| | 550,000 | | | Anheuser-Busch InBev Worldwide, Inc. | | 4.60% | | 04/15/2048 | | | | 635,063 | |
| | 175,000 | | | Constellation Brands, Inc. | | 3.15% | | 08/01/2029 | | | | 179,586 | |
| | 210,000 | | | Cott Holdings, Inc.(e) | | 5.50% | | 04/01/2025 | | | | 218,669 | |
| | | | | | | | | | | | | 1,200,121 | |
| Biotechnology - 0.04% | | | | | | | | | |
| | 620,000 | | | Celgene Corp. | | 4.35% | | 11/15/2047 | | | | 719,745 | |
| Building Materials - 0.03% | | | | | | | | | |
| | 183,000 | | | Builders FirstSource, Inc.(e) | | 5.63% | | 09/01/2024 | | | | 191,006 | |
| | 375,000 | | | Owens Corning | | 4.40% | | 01/30/2048 | | | | 346,046 | |
| | | | | | | | | | | | | 537,052 | |
| Chemicals - 0.07% | | | | | | | | | |
| | 560,000 | | | DuPont de Nemours, Inc. | | 5.42% | | 11/15/2048 | | | | 711,944 | |
| | 640,000 | | | Mosaic Co. | | 4.05% | | 11/15/2027 | | | | 665,589 | |
| | | | | | | | | | | | | 1,377,533 | |
| Coal - 0.02% | | | | | | | | | |
| | 225,000 | | | Peabody Energy Corp.(e) | | 6.00% | | 03/31/2022 | | | | 227,250 | |
| | 110,000 | | | SunCoke Energy Partners LP / SunCoke Energy Partners Finance Corp.(e) | | 7.50% | | 06/15/2025 | | | | 98,313 | |
| | | | | | | | | | | | | 325,563 | |
| Commercial Services - 0.05% | | | | | | | | | |
| | 270,000 | | | Refinitiv US Holdings, Inc.(e) | | 6.25% | | 05/15/2026 | | | | 290,247 | |
| | 165,000 | | | United Rentals North America, Inc. | | 6.50% | | 12/15/2026 | | | | 180,386 | |
| | 160,000 | | | United Rentals North America, Inc. | | 5.25% | | 01/15/2030 | | | | 168,301 | |
| | 307,000 | | | Verscend Escrow Corp.(e) | | 9.75% | | 08/15/2026 | | | | 328,067 | |
| | | | | | | | | | | | | 967,001 | |
| Containers and Packaging - 0.01% | | | | | | | | | |
| | 205,000 | | | Packaging Corp. of America | | 3.40% | | 12/15/2027 | | | | 212,960 | |
| Diversified Financial Services - 0.23% | | | | | | | | | |
| | 343,000 | | | Air Lease Corp. | | 3.75% | | 02/01/2022 | | | | 352,685 | |
| | 180,000 | | | Allied Universal Holdco LLC / Allied Universal Finance Corp.(e) | | 6.63% | | 07/15/2026 | | | | 190,575 | |
| | 665,000 | | | American Express Co. | | 2.50% | | 08/01/2022 | | | | 671,950 | |
| | 220,000 | | | Capital One Financial Corp.(c) | | 3M US L + 0.72% | | 01/30/2023 | | | | 219,372 | |
| | 690,000 | | | Charles Schwab Corp. | | 3.55% | | 02/01/2024 | | | | 730,046 | |
| | 855,000 | | | Discover Financial Services | | 4.10% | | 02/09/2027 | | | | 910,722 | |
| | 140,000 | | | Nationstar Mortgage Holdings, Inc.(e) | | 8.13% | | 07/15/2023 | | | | 146,300 | |
| | 275,000 | | | NFP Corp.(e) | | 6.88% | | 07/15/2025 | | | | 273,969 | |
| | 165,000 | | | Springleaf Finance Corp. | | 6.63% | | 01/15/2028 | | | | 177,837 | |
| See Notes to Financial Statements. | | | |
| Annual Report | September 30, 2019 | | | 39 |
| RiverNorth/DoubleLine Strategic Income Fund | Schedule of Investments |
September 30, 2019
| Principal Amount/Description | | Rate | | Maturity | | Value | |
| $ | 745,000 | | | Synchrony Financial | | | 3.95% | | | 12/01/2027 | | $ | 764,534 | |
| | 265,000 | | | Tempo Acquisition LLC / Tempo Acquisition Finance Corp.(e) | | | 6.75% | | | 06/01/2025 | | | 274,275 | |
| | | | | | | | | | | | | | 4,712,265 | |
| Electric - 0.37% | | | | | | | | | | |
| | 240,000 | | | Calpine Corp.(e) | | | 5.25% | | | 06/01/2026 | | | 249,300 | |
| | 55,000 | | | Duke Energy Corp. | | | 3.75% | | | 09/01/2046 | | | 56,818 | |
| | 485,000 | | | Duke Energy Corp. | | | 3.95% | | | 08/15/2047 | | | 520,284 | |
| | 535,000 | | | Duke Energy Progress LLC | | | 4.15% | | | 12/01/2044 | | | 613,573 | |
| | 580,000 | | | General Electric Co. | | | 5.88% | | | 01/14/2038 | | | 697,798 | |
| | 715,000 | | | Georgia Power Co. | | | 2.20% | | | 09/15/2024 | | | 707,524 | |
| | 1,100,000 | | | ITC Holdings Corp. | | | 3.25% | | | 06/30/2026 | | | 1,143,041 | |
| | 275,000 | | | Monongahela Power Co.(e) | | | 5.40% | | | 12/15/2043 | | | 369,369 | |
| | 375,000 | | | NextEra Energy Capital Holdings, Inc. | | | 3.55% | | | 05/01/2027 | | | 397,875 | |
| | 190,000 | | | NRG Energy, Inc.(e) | | | 5.25% | | | 06/15/2029 | | | 205,019 | |
| | 705,000 | | | Oncor Electric Delivery Co. LLC(e) | | | 3.10% | | | 09/15/2049 | | | 704,169 | |
| | 465,000 | | | PSEG Power LLC | | | 3.85% | | | 06/01/2023 | | | 492,032 | |
| | 335,000 | | | Southern California Edison Co. | | | 4.00% | | | 04/01/2047 | | | 360,985 | |
| | 1,000,000 | | | Virginia Electric & Power Co. | | | 3.50% | | | 03/15/2027 | | | 1,070,946 | |
| | | | | | | | | | | | | | 7,588,733 | |
| Electronics - 0.01% | | | | | | | | | | |
| | 290,000 | | | Arrow Electronics, Inc. | | | 3.88% | | | 01/12/2028 | | | 297,598 | |
| Engineering & Construction - 0.03% | | | | | | | | | |
| | 215,000 | | | AECOM | | | 5.13% | | | 03/15/2027 | | | 226,825 | |
| | 400,000 | | | SBA Tower Trust(e) | | | 3.17% | | | 04/11/2022 | | | 404,231 | |
| | | | | | | | | | | | | | 631,056 | |
| Entertainment - 0.03% | | | | | | | | | | |
| | 150,000 | | | Cedar Fair LP(e) | | | 5.25% | | | 07/15/2029 | | | 161,062 | |
| | 160,000 | | | Eldorado Resorts, Inc. | | | 6.00% | | | 04/01/2025 | | | 169,200 | |
| | 210,000 | | | Lions Gate Capital Holdings LLC(e) | | | 6.38% | | | 02/01/2024 | | | 222,575 | |
| | | | | | | | | | | | | | 552,837 | |
| Environmental Control - 0.05% | | | | | | | |
| | 130,000 | | | Clean Harbors, Inc.(e) | | | 4.88% | | | 07/15/2027 | | | 136,012 | |
| | 685,000 | | | Waste Management, Inc. | | | 4.00% | | | 07/15/2039 | | | 779,926 | |
| | | | | | | | | | | | | | 915,938 | |
| Food - 0.21% | | | | | | | | |
| | 240,000 | | | Albertsons Cos. Inc / Safeway, Inc. / New Albertsons LP / Albertsons LLC(e) | | | 5.88% | | | 02/15/2028 | | | 254,626 | |
| | 245,000 | | | Aramark Services, Inc.(e) | | | 5.00% | | | 04/01/2025 | | | 253,575 | |
| | 215,000 | | | B&G Foods, Inc. | | | 5.25% | | | 04/01/2025 | | | 220,375 | |
| | 120,000 | | | B&G Foods, Inc. | | | 5.25% | | | 09/15/2027 | | | 122,862 | |
See Notes to Financial Statements.
| 40 | (888) 848-7569 | www.rivernorth.com |
| RiverNorth/DoubleLine Strategic Income Fund | Schedule of Investments |
September 30, 2019
| Principal Amount/Description | | Rate | | Maturity | | Value | |
| $ | 40,000 | | | JBS USA LUX SA / JBS USA Finance, Inc.(e) | | | 5.88% | | | 07/15/2024 | | $ | 41,277 | |
| | 25,000 | | | JBS USA LUX SA / JBS USA Finance, Inc.(e) | | | 5.75% | | | 06/15/2025 | | | 26,139 | |
| | 230,000 | | | JBS USA LUX SA / JBS USA Finance, Inc.(e) | | | 6.75% | | | 02/15/2028 | | | 255,587 | |
| | 150,000 | | | JBS USA LUX SA / JBS USA Finance, Inc.(e) | | | 6.50% | | | 04/15/2029 | | | 166,875 | |
| | 675,000 | | | Kroger Co. | | | 3.40% | | | 04/15/2022 | | | 696,756 | |
| | 850,000 | | | NBM US Holdings, Inc.(e) | | | 7.00% | | | 05/14/2026 | | | 894,094 | |
| | 55,000 | | | Pilgrim’s Pride Corp.(e) | | | 5.75% | | | 03/15/2025 | | | 57,062 | |
| | 210,000 | | | Pilgrim’s Pride Corp.(e) | | | 5.88% | | | 09/30/2027 | | | 226,328 | |
| | 235,000 | | | Post Holdings, Inc.(e) | | | 5.50% | | | 03/01/2025 | | | 247,044 | |
| | 80,000 | | | Post Holdings, Inc.(e) | | | 5.50% | | | 12/15/2029 | | | 83,700 | |
| | 665,000 | | | Smithfield Foods, Inc.(e) | | | 4.25% | | | 02/01/2027 | | | 689,507 | |
| | | | | | | | | | | | | | 4,235,807 | |
| Hand/Machine Tools - 0.02% | | | | | | | | | |
| | 90,000 | | | Colfax Corp.(e) | | | 6.00% | | | 02/15/2024 | | | 95,589 | |
| | 200,000 | | | Colfax Corp.(e) | | | 6.38% | | | 02/15/2026 | | | 215,437 | |
| | | | | | | | | | | | | | 311,026 | |
| Healthcare-Products - 0.06% | | | | | | | | | | |
| | 160,000 | | | Avantor, Inc.(e) | | | 9.00% | | | 10/01/2025 | | | 180,200 | |
| | 1,010,000 | | | Becton Dickinson and Co. | | | 2.89% | | | 06/06/2022 | | | 1,025,763 | |
| | | | | | | | | | | | | | 1,205,963 | |
| Healthcare-Services - 0.11% | | | | | | | | |
| | 360,000 | | | Anthem, Inc. | | | 2.38% | | | 01/15/2025 | | | 358,308 | |
| | 187,000 | | | Centene Corp. | | | 4.75% | | | 01/15/2025 | | | 192,423 | |
| | 140,000 | | | Centene Corp.(e) | | | 5.38% | | | 06/01/2026 | | | 147,000 | |
| | 135,000 | | | Eagle Holding Co. II LLC(e)(f) | | | 7.75% (8.50%) | | | 05/15/2022 | | | 136,350 | |
| | 145,000 | | | HCA, Inc. | | | 5.38% | | | 09/01/2026 | | | 159,674 | |
| | 350,000 | | | HCA, Inc. | | | 4.13% | | | 06/15/2029 | | | 367,190 | |
| | 195,000 | | | MPH Acquisition Holdings LLC(e) | | | 7.13% | | | 06/01/2024 | | | 180,619 | |
| | 175,000 | | | Select Medical Corp.(e) | | | 6.25% | | | 08/15/2026 | | | 183,312 | |
| | 200,000 | | | Tenet Healthcare Corp.(e) | | | 5.13% | | | 11/01/2027 | | | 206,920 | |
| | 305,000 | | | WellCare Health Plans, Inc.(e) | | | 5.38% | | | 08/15/2026 | | | 326,289 | |
| | 55,000 | | | West Street Merger Sub, Inc.(e) | | | 6.38% | | | 09/01/2025 | | | 50,875 | |
| | | | | | | | | | | | | | 2,308,960 | |
| Home Furnishings - 0.02% | | | | | | | | | | |
| | 312,000 | | | Tempur Sealy International, Inc. | | | 5.50% | | | 06/15/2026 | | | 326,430 | |
| Insurance - 0.17% | | | | | | | | | | |
| | 180,000 | | | Alliant Holdings Intermediate LLC / Alliant Holdings Co.-Issuer(e) | | | 8.25% | | | 08/01/2023 | | | 184,275 | |
| | 715,000 | | | Athene Global Funding(e) | | | 3.00% | | | 07/01/2022 | | | 727,866 | |
| | 635,000 | | | AXA Equitable Holdings, Inc. | | | 3.90% | | | 04/20/2023 | | | 664,424 | |
See Notes to Financial Statements.
| Annual Report | September 30, 2019 | 41 |
| RiverNorth/DoubleLine Strategic Income Fund | Schedule of Investments |
September 30, 2019
| Principal Amount/Description | | Rate | | Maturity | | Value | |
| $ | 800,000 | | | Liberty Mutual Group, Inc.(e) | | | 3.95% | | | 10/15/2050 | | $ | 803,672 | |
| | 340,000 | | | Prudential Financial, Inc. | | | 3.91% | | | 12/07/2047 | | | 365,857 | |
| | 685,000 | | | Willis North America, Inc. | | | 4.50% | | | 09/15/2028 | | | 760,041 | |
| | | | | | | | | | | | | | 3,506,135 | |
| Internet - 0.02% | | | | | | | | | | |
| | 350,000 | | | Expedia Group, Inc. | | | 3.80% | | | 02/15/2028 | | | 366,676 | |
| | 125,000 | | | Uber Technologies, Inc.(e) | | | 7.50% | | | 09/15/2027 | | | 125,000 | |
| | | | | | | | | | | | | | 491,676 | |
| Investment Companies - 0.64% | | | | | | | | | | |
| | 5,000,000 | | | Business Development Corp. of America(e)(i) | | | 5.38% | | | 05/30/2023 | | | 5,050,000 | |
| | 2,500,000 | | | FS KKR Capital Corp. | | | 4.25% | | | 01/15/2020 | | | 2,506,437 | |
| | 5,000,000 | | | FS KKR Capital Corp. | | | 4.75% | | | 05/15/2022 | | | 5,131,106 | |
| | 230,000 | | | Icahn Enterprises LP / Icahn Enterprises Finance Corp.(e) | | | 6.25% | | | 05/15/2026 | | | 241,500 | |
| | | | | | | | | | | | | | 12,929,043 | |
| Leisure Time - 0.03% | | | | | | | | | | |
| | 300,000 | | | Royal Caribbean Cruises, Ltd. | | | 3.70% | | | 03/15/2028 | | | 307,799 | |
| | 325,000 | | | Viking Cruises, Ltd.(e) | | | 5.88% | | | 09/15/2027 | | | 345,183 | |
| | | | | | | | | | | | | | 652,982 | |
| Lodging - 0.02% | | | | | | | | | | |
| | 375,000 | | | Hilton Domestic Operating Co., Inc. | | | 4.25% | | | 09/01/2024 | | | 382,969 | |
| Machinery-Diversified - 0.02% | | | | | | | | | | |
| | 290,000 | | | John Deere Capital Corp. | | | 3.45% | | | 01/10/2024 | | | 305,763 | |
| Media - 0.18% | | | | | | | | | | |
| | 300,000 | | | CCO Holdings LLC / CCO Holdings Capital Corp.(e) | | | 5.75% | | | 02/15/2026 | | | 317,250 | |
| | 170,000 | | | CCO Holdings LLC / CCO Holdings Capital Corp.(e) | | | 5.00% | | | 02/01/2028 | | | 176,162 | |
| | 160,000 | | | Cengage Learning, Inc.(e) | | | 9.50% | | | 06/15/2024 | | | 147,200 | |
| | 635,000 | | | Charter Communications Operating LLC / Charter Communications Operating Capital | | | 4.91% | | | 07/23/2025 | | | 698,381 | |
| | 165,000 | | | Clear Channel Worldwide Holdings, Inc.(e) | | | 5.13% | | | 08/15/2027 | | | 172,318 | |
| | 695,000 | | | Comcast Corp. | | | 3.95% | | | 10/15/2025 | | | 757,292 | |
| | 390,000 | | | CSC Holdings LLC | | | 5.25% | | | 06/01/2024 | | | 420,225 | |
| | 115,000 | | | Diamond Sports Group LLC / Diamond Sports Finance Co.(e) | | | 5.38% | | | 08/15/2026 | | | 119,600 | |
| | 265,000 | | | Gray Television, Inc.(e) | | | 7.00% | | | 05/15/2027 | | | 292,149 | |
| | 55,000 | | | iHeartCommunications, Inc. | | | 6.38% | | | 05/01/2026 | | | 59,675 | |
| | 35,000 | | | iHeartCommunications, Inc. | | | 8.38% | | | 05/01/2027 | | | 37,975 | |
| | 125,000 | | | iHeartCommunications, Inc.(e) | | | 5.25% | | | 08/15/2027 | | | 130,313 | |
| | 255,000 | | | Sirius XM Radio, Inc.(e) | | | 5.38% | | | 07/15/2026 | | | 268,671 | |
See Notes to Financial Statements.
| 42 | (888) 848-7569 | www.rivernorth.com |
| RiverNorth/DoubleLine Strategic Income Fund | Schedule of Investments |
September 30, 2019
| Principal Amount/Description | | Rate | | Maturity | | Value | |
| $ | 115,000 | | | Sirius XM Radio, Inc.(e) | | | 5.50% | | | 07/01/2029 | | $ | 123,050 | |
| | | | | | | | | | | | | | 3,720,261 | |
| Mining - 0.07% | | | | | | | | | | |
| | 450,000 | | | Freeport-McMoRan, Inc. | | | 5.40% | | | 11/14/2034 | | | 429,750 | |
| | 1,200,000 | | | Freeport-McMoRan, Inc. | | | 5.45% | | | 03/15/2043 | | | 1,086,456 | |
| | | | | | | | | | | | | | 1,516,206 | |
| Oil & Gas - 0.20% | | | | | | | | | | |
| | 625,000 | | | Brooklyn Union Gas Co.(e) | | | 4.49% | | | 03/04/2049 | | | 761,641 | |
| | 715,000 | | | CNOOC Finance 2015 USA, LLC | | | 3.75% | | | 05/02/2023 | | | 744,856 | |
| | 400,000 | | | CNOOC Finance 2015 USA, LLC | | | 3.50% | | | 05/05/2025 | | | 417,628 | |
| | 205,000 | | | Gulfport Energy Corp. | | | 6.38% | | | 05/15/2025 | | | 146,575 | |
| | 125,000 | | | Hilcorp Energy I LP / Hilcorp Finance Co.(e) | | | 6.25% | | | 11/01/2028 | | | 116,875 | |
| | 65,000 | | | Indigo Natural Resources LLC(e) | | | 6.88% | | | 02/15/2026 | | | 58,906 | |
| | 630,000 | | | Marathon Petroleum Corp. | | | 5.13% | | | 12/15/2026 | | | 708,819 | |
| | 170,000 | | | Oasis Petroleum, Inc. | | | 6.88% | | | 03/15/2022 | | | 159,375 | |
| | 145,000 | | | Parsley Energy LLC / Parsley Finance Corp.(e) | | | 5.63% | | | 10/15/2027 | | | 150,437 | |
| | 140,000 | | | QEP Resources, Inc. | | | 5.63% | | | 03/01/2026 | | | 121,100 | |
| | 130,000 | | | Sunoco LP / Sunoco Finance Corp. | | | 5.50% | | | 02/15/2026 | | | 136,002 | |
| | 110,000 | | | Sunoco LP / Sunoco Finance Corp. | | | 6.00% | | | 04/15/2027 | | | 116,875 | |
| | 110,000 | | | Transocean, Inc.(e) | | | 7.25% | | | 11/01/2025 | | | 97,350 | |
| | 345,000 | | | USA Compression Partners LP / USA Compression Finance Corp.(e) | | | 6.88% | | | 09/01/2027 | | | 357,938 | |
| | | | | | | | | | | | | | 4,094,377 | |
| Packaging & Containers - 0.04% | | | | | | | | | | |
| | 115,000 | | | Flex Acquisition Co., Inc.(e) | | | 6.88% | | | 01/15/2025 | | | 105,467 | |
| | 676,000 | | | WRKCo, Inc. | | | 3.75% | | | 03/15/2025 | | | 712,147 | |
| | | | | | | | | | | | | | 817,614 | |
| Pharmaceuticals - 0.12% | | | | | | | | | | |
| | 700,000 | | | AbbVie, Inc. | | | 4.70% | | | 05/14/2045 | | | 749,078 | |
| | 60,000 | | | Bausch Health Cos., Inc.(e) | | | 5.75% | | | 08/15/2027 | | | 65,000 | |
| | 155,000 | | | Bausch Health Cos., Inc.(e) | | | 7.00% | | | 01/15/2028 | | | 167,338 | |
| | 155,000 | | | Bausch Health Cos., Inc.(e) | | | 7.25% | | | 05/30/2029 | | | 169,694 | |
| | 355,000 | | | Cigna Corp.(c) | | | 3M US L + 0.89% | | | 07/15/2023 | | | 355,988 | |
| | 340,000 | | | Cigna Corp. | | | 4.90% | | | 12/15/2048 | | | 390,485 | |
| | 330,000 | | | CVS Health Corp. | | | 5.05% | | | 03/25/2048 | | | 375,878 | |
| | 125,000 | | | Valeant Pharmaceuticals International, Inc.(e) | | | 7.00% | | | 03/15/2024 | | | 131,682 | |
| | | | | | | | | | | | | | 2,405,143 | |
| Pipelines - 0.17% | | | | | | | | | | |
| | 130,000 | | | Antero Midstream Partners LP / Antero Midstream Finance Corp.(e) | | | 5.75% | | | 03/01/2027 | | | 108,872 | |
| | 265,000 | | | Cheniere Energy Partners LP | | | 5.25% | | | 10/01/2025 | | | 276,660 | |
See Notes to Financial Statements.
| Annual Report | September 30, 2019 | 43 |
| RiverNorth/DoubleLine Strategic Income Fund | Schedule of Investments |
September 30, 2019
| Principal Amount/Description | Rate | | Maturity | | Value | |
| $ | 130,000 | | | Cheniere Energy Partners LP | | | 5.63% | | | 10/01/2026 | | $ | 138,600 | |
| | 90,000 | | | Cheniere Energy Partners LP(e) | | | 4.50% | | | 10/01/2029 | | | 92,419 | |
| | 285,000 | | | Enable Midstream Partners LP | | | 4.40% | | | 03/15/2027 | | | 286,215 | |
| | 675,000 | | | Energy Transfer Operating LP | | | 4.75% | | | 01/15/2026 | | | 732,356 | |
| | 598,000 | | | Kinder Morgan Energy Partners LP | | | 6.95% | | | 01/15/2038 | | | 782,019 | |
| | 105,000 | | | NGL Energy Partners LP / NGL Energy Finance Corp.(e) | | | 7.50% | | | 04/15/2026 | | | 105,735 | |
| | 180,000 | | | ONEOK, Inc. | | | 3.40% | | | 09/01/2029 | | | 178,514 | |
| | 635,000 | | | Sabine Pass Liquefaction LLC | | | 5.00% | | | 03/15/2027 | | | 701,993 | |
| | | | | | | | | | | | | | 3,403,383 | |
| REITS - 0.45% | | | | | | | | | | |
| | 555,000 | | | Alexandria Real Estate Equities, Inc. | | | 4.00% | | | 01/15/2024 | | | 592,612 | |
| | 1,000,000 | | | American Tower Corp. | | | 3.38% | | | 10/15/2026 | | | 1,042,058 | |
| | 705,000 | | | American Tower Corp. | | | 3.60% | | | 01/15/2028 | | | 743,655 | |
| | 685,000 | | | Boston Properties LP | | | 3.40% | | | 06/21/2029 | | | 717,583 | |
| | 800,000 | | | Crown Castle International Corp. | | | 3.70% | | | 06/15/2026 | | | 848,420 | |
| | 900,000 | | | Crown Castle International Corp. | | | 3.65% | | | 09/01/2027 | | | 954,292 | |
| | 1,000,000 | | | Digital Realty Trust LP | | | 3.70% | | | 08/15/2027 | | | 1,050,487 | |
| | 350,000 | | | ERP Operating LP | | | 2.50% | | | 02/15/2030 | | | 345,268 | |
| | 313,000 | | | ESH Hospitality, Inc.(e) | | | 5.25% | | | 05/01/2025 | | | 324,346 | |
| | 90,000 | | | ESH Hospitality, Inc.(e) | | | 4.63% | | | 10/01/2027 | | | 90,450 | |
| | 145,000 | | | Iron Mountain, Inc.(e) | | | 4.88% | | | 09/15/2029 | | | 147,581 | |
| | 265,000 | | | MPT Operating Partnership LP / MPT Finance Corp. | | | 5.25% | | | 08/01/2026 | | | 278,648 | |
| | 115,000 | | | MPT Operating Partnership LP / MPT Finance Corp. | | | 4.63% | | | 08/01/2029 | | | 118,666 | |
| | 715,000 | | | Public Storage | | | 3.39% | | | 05/01/2029 | | | 767,657 | |
| | 355,000 | | | Simon Property Group LP | | | 2.45% | | | 09/13/2029 | | | 347,867 | |
| | 695,000 | | | Welltower, Inc. | | | 3.95% | | | 09/01/2023 | | | 736,684 | |
| | | | | | | | | | | | | | 9,106,274 | |
| Retail - 0.12% | | | | | | | | | | |
| | 295,000 | | | Beacon Roofing Supply, Inc.(e) | | | 4.88% | | | 11/01/2025 | | | 290,575 | |
| | 105,000 | | | Carvana Co.(e) | | | 8.88% | | | 10/01/2023 | | | 108,643 | |
| | 665,000 | | | Dollar Tree, Inc. | | | 4.00% | | | 05/15/2025 | | | 705,628 | |
| | 235,000 | | | Golden Nugget, Inc.(e) | | | 6.75% | | | 10/15/2024 | | | 241,463 | |
| | 335,000 | | | Home Depot, Inc. | | | 3.90% | | | 06/15/2047 | | | 384,410 | |
| | 325,000 | | | McDonald’s Corp. | | | 4.45% | | | 03/01/2047 | | | 374,006 | |
| | 120,000 | | | PetSmart, Inc.(e) | | | 7.13% | | | 03/15/2023 | | | 113,400 | |
| | 71,000 | | | PetSmart, Inc.(e) | | | 5.88% | | | 06/01/2025 | | | 71,000 | |
| | 185,000 | | | Staples, Inc.(e) | | | 7.50% | | | 04/15/2026 | | | 191,068 | |
| | | | | | | | | | | | | | 2,480,193 | |
| Semiconductors - 0.03% | | | | | | | | | | |
| | 670,000 | | | Marvell Technology Group, Ltd. | | | 4.20% | | | 06/22/2023 | | | 702,743 | |
See Notes to Financial Statements.
| 44 | (888) 848-7569 | www.rivernorth.com |
| RiverNorth/DoubleLine Strategic Income Fund | Schedule of Investments |
September 30, 2019
| Principal Amount/Description | | Rate | | Maturity | | Value | |
| Software - 0.03% | | | | | | | | |
| $ | 70,000 | | | CDK Global, Inc.(e) | | | 5.25% | | | 05/15/2029 | | $ | 72,538 | |
| | 160,000 | | | Dun & Bradstreet Corp.(e) | | | 6.88% | | | 08/15/2026 | | | 174,700 | |
| | 190,000 | | | Genesys Telecommunications Laboratories, Inc./Greeneden Lux 3 Sarl/Greeneden US Ho(e) | | | 10.00% | | | 11/30/2024 | | | 205,876 | |
| | 230,000 | | | Informatica LLC(e) | | | 7.13% | | | 07/15/2023 | | | 234,600 | |
| | | | | | | | | | | | | | 687,714 | |
| Special Purpose Banks - 0.01% | | | | | | | | | | |
| | 160,000 | | | Caesars Resort Collection LLC / CRC Finco, Inc.(e) | | | 5.25% | | | 10/15/2025 | | | 163,984 | |
| Telecommunications - 0.24% | | | | | | | | | | |
| | 940,000 | | | AT&T, Inc. | | | 5.25% | | | 03/01/2037 | | | 1,108,405 | |
| | 75,000 | | | Cincinnati Bell, Inc.(e) | | | 7.00% | | | 07/15/2024 | | | 69,750 | |
| | 120,000 | | | CommScope, Inc.(e) | | | 5.50% | | | 03/01/2024 | | | 124,050 | |
| | 30,000 | | | CommScope, Inc.(e) | | | 6.00% | | | 03/01/2026 | | | 31,194 | |
| | 675,000 | | | Corning, Inc. | | | 4.38% | | | 11/15/2057 | | | 696,832 | |
| | 155,000 | | | Frontier Communications Corp.(e) | | | 8.00% | | | 04/01/2027 | | | 163,864 | |
| | 190,000 | | | Gogo Intermediate Holdings LLC / Gogo Finance Co., Inc.(e) | | | 9.88% | | | 05/01/2024 | | | 203,775 | |
| | 100,000 | | | GTT Communications, Inc.(e) | | | 7.88% | | | 12/31/2024 | | | 57,000 | |
| | 260,000 | | | Level 3 Financing, Inc. | | | 5.38% | | | 01/15/2024 | | | 265,811 | |
| | 180,000 | | | Level 3 Financing, Inc.(e) | | | 4.63% | | | 09/15/2027 | | | 182,079 | |
| | 215,000 | | | Sprint Capital Corp. | | | 6.88% | | | 11/15/2028 | | | 234,931 | |
| | 200,000 | | | Sprint Corp. | | | 7.13% | | | 06/15/2024 | | | 216,060 | |
| | 315,000 | | | Sprint Spectrum Co. LLC / Sprint Spectrum Co II LLC / Sprint Spectrum Co III LLC(e) | | | 4.74% | | | 03/20/2025 | | | 335,636 | |
| | 720,000 | | | Verizon Communications, Inc. | | | 4.40% | | | 11/01/2034 | | | 821,944 | |
| | 305,000 | | | Verizon Communications, Inc. | | | 4.27% | | | 01/15/2036 | | | 344,041 | |
| | | | | | | | | | | | | | 4,855,372 | |
| Toys/Games/Hobbies - 0.04% | | | | | | | | | | |
| | 712,000 | | | Hasbro, Inc. | | | 3.50% | | | 09/15/2027 | | | 729,712 | |
| Transportation - 0.05% | | | | | | | | | | |
| | 715,000 | | | CSX Corp. | | | 3.80% | | | 11/01/2046 | | | 751,902 | |
| | 330,000 | | | FedEx Corp. | | | 4.75% | | | 11/15/2045 | | | 354,944 | |
| | | | | | | | | | | | | | 1,106,846 | |
| Trucking & Leasing - 0.02% | | | | | | | | | |
| | 305,000 | | | Penske Truck Leasing Co. LP / PTL Finance Corp.(e) | | | 4.20% | | | 04/01/2027 | | | 324,892 | |
| | | | | | | | | | | | | | | |
| TOTAL U.S. CORPORATE BONDS | | | | | | | | | | |
| (Cost $88,750,755) | | | | | | | | | 93,396,997 | |
See Notes to Financial Statements.
| Annual Report | September 30, 2019 | 45 |
| RiverNorth/DoubleLine Strategic Income Fund | Schedule of Investments |
September 30, 2019
| Principal Amount/Description | | Rate | | Maturity | | Value | |
| CONVERTIBLE CORPORATE BONDS - 0.38% | | | | | | | | | | |
| $ | 2,500,000 | | | BlackRock TCP Capital Corp. | | | 5.25% | | | 12/15/2019 | | $ | 2,522,375 | |
| | 5,000,000 | | | New Mountain Finance Corp. | | | 5.75% | | | 08/15/2023 | | | 5,251,171 | |
| | | | | | | | | | | | | | | |
| TOTAL CONVERTIBLE CORPORATE BONDS | | | | | | | |
| (Cost $7,533,067) | | | | | | | | | 7,773,546 | |
| | | | | | | | | | | | | | | |
| FOREIGN GOVERNMENT BONDS AND NOTES, SUPRANATIONALS AND FOREIGN AGENCIES - 0.25% |
| | 400,000 | | | Costa Rica Government International Bond(d) | | | 10.00% | | | 08/01/2020 | | | 421,504 | |
| | 800,000 | | | Dominican Republic International Bond(e) | | | 6.40% | | | 06/05/2049 | | | 854,008 | |
| | 200,000 | | | Export Import Bank of Thailand(c) | | | 3M US L + 0.90% | | | 11/20/2023 | | | 200,956 | |
| | 1,000,000 | | | Indonesia Government International Bond(d) | | | 3.75% | | | 04/25/2022 | | | 1,032,498 | |
| | 200,000 | | | Israel Government International Bond | | | 2.88% | | | 03/16/2026 | | | 210,803 | |
| | 285,000 | | | Mexico Government International Bond | | | 4.15% | | | 03/28/2027 | | | 302,388 | |
| | 675,000 | | | Mexico Government International Bond | | | 3.75% | | | 01/11/2028 | | | 696,431 | |
| | 600,000 | | | Perusahaan Penerbit SBSN Indonesia III(e) | | | 4.15% | | | 03/29/2027 | | | 643,200 | |
| | 700,000 | | | Philippine Government International Bond | | | 4.20% | | | 01/21/2024 | | | 760,163 | |
| | | | | | | | | | | | | | | |
| TOTAL FOREIGN GOVERNMENT BONDS AND NOTES, SUPRANATIONALS AND FOREIGN AGENCIES | | | |
| (Cost $4,953,303) | | | | | | | | | | 5,121,951 | |
| | | | | | | | | | | | | | | |
| BANK LOANS - 1.17%(c) | | | | | | | | | | |
| Canada - 0.03% | | | | | | | | | | |
| | 503,576 | | | GW Honos Security Corp., First Lien B Term Loan | | | 3M US L + 2.50%, 1.00% Floor | | | 05/24/2024 | | | 504,676 | |
| | | | | | | | | | | | | | | |
| Great Britain - 0.01% | | | | | | | | |
| | 250,000 | | | Inmarsat PLC, First Lien B Term Loan(j) | | | L + 4.50% | | | 09/23/2026 | | | 246,504 | |
| | | | | | | | | | | |
| Jersey - 0.02% | | | | | | | | | | |
| | 480,590 | | | Capri Acquisitions BidCo, Ltd., First Lien Initial Dollar Term Loan | | | 3M US L + 3.00% | | | 11/01/2024 | | | 475,633 | |
See Notes to Financial Statements.
| 46 | (888) 848-7569 | www.rivernorth.com |
| RiverNorth/DoubleLine Strategic Income Fund | Schedule of Investments |
September 30, 2019
| Principal Amount/Description | | Rate | | Maturity | | Value | |
| Luxembourg- 0.01% | | | | | | | | | | |
| $ | 248,750 | | | Auris Luxembourg III S.a r.l., First Lien Facility B2 Term Loan | | | 1M US L + 3.75% | | | 02/27/2026 | | $ | 247,739 | |
| United States - 1.10% | | | | | | | | | | |
| | 475,687 | | | Acrisure LLC, First Lien 2017-2 Refinancing Term Loan | | | 1M US L + 4.25%, 1.00% Floor | | | 11/22/2023 | | | 474,350 | |
| | 1,172,003 | | | Air Methods Corp., First Lien Initial Term Loan | | | 3M US L + 3.50%, 1.00% Floor | | | 04/22/2024 | | | 957,526 | |
| | 93,985 | | | Albertson’s LLC, First Lien 2019-1 B-7 Term Loan | | | 1M US L + 2.75%, 0.75% Floor | | | 11/17/2025 | | | 94,667 | |
| | 22,072 | | | Allied Universal Holdco LLC, First Lien Delayed Draw Term Loan(j) | | | L + 4.25% | | | 07/10/2026 | | | 22,131 | |
| | 222,928 | | | Allied Universal Holdco LLC, First Lien Initial Term Loan | | | 3M US L + 4.25% | | | 07/10/2026 | | | 223,520 | |
| | 1,216,948 | | | American Tire Distributors, Inc., First Lien Initial Term Loan | | | 3M US L + 7.50%, 1.00% Floor | | | 09/02/2024 | | | 1,075,782 | |
| | 482,876 | | | AssuredPartners, Inc., First Lien 2017 September Refinancing Term Loan | | | 1M US L + 3.50% | | | 10/22/2024 | | | 481,594 | |
| | 288,550 | | | Athenahealth, Inc., First Lien B Term Loan | | | 3M US L + 4.50% | | | 02/11/2026 | | | 288,280 | |
| | 243,149 | | | Axalta Coating Systems Dutch Holding B B.V., First Lien B-3 Dollar Term Loan | | | 3M US L + 1.75% | | | 06/01/2024 | | | 243,566 | |
| | 138,947 | | | BJ’s Wholesale Club, Inc., First Lien Tranche B Term Loan | | | 1M US L + 2.75% | | | 02/03/2024 | | | 139,555 | |
| | 153,832 | | | Blackhawk Network Holdings, Inc., First Lien Term Loan | | | 1M US L + 3.00% | | | 06/15/2025 | | | 153,575 | |
| | 350,543 | | | Brookfield WEC Holdings, Inc., First Lien Initial Term Loan | | | 1M US L + 3.50%, 0.75% Floor | | | 08/01/2025 | | | 352,100 | |
| | 597,986 | | | Canyon Valor Companies, Inc., First Lien Initial Dollar Term Loan | | | 3M US L + 2.75% | | | 06/16/2023 | | | 597,986 | |
| | 1,027,345 | | | Cengage Learning, Inc., First Lien 2016 Refinancing Term Loan | | | 1M US L + 4.25%, 1.00% Floor | | | 06/07/2023 | | | 975,696 | |
| | 493,392 | | | CHG Healthcare Services, Inc., First Lien 2017 New Term Loan | | | 1M US L + 3.00%, 1.00% Floor | | | 06/07/2023 | | | 493,856 | |
| | 490,939 | | | Cvent, Inc., First Lien Term Loan | | | 1M US L + 3.75%, 1.00% Floor | | | 11/29/2024 | | | 485,571 | |
| | 426,734 | | | Equinox Holdings, Inc., First Lien Incremental B-1 Term Loan | | | 1M US L + 3.00%, 1.00% Floor | | | 03/08/2024 | | | 427,534 | |
| | 471,687 | | | Filtration Group Corp., First Lien Initial Dollar Term Loan | | | 1M US L + 3.00% | | | 03/29/2025 | | | 473,539 | |
| | 188,575 | | | Forest City Enterprises LP, First Lien Initial Term Loan | | | 1M US L + 4.00% | | | 12/08/2025 | | | 190,196 | |
See Notes to Financial Statements.
| Annual Report | September 30, 2019 | 47 |
| RiverNorth/DoubleLine Strategic Income Fund | Schedule of Investments |
September 30, 2019
| Principal Amount/Description | | | Rate | | Maturity | | Value | |
| $ | 1,075,000 | | | Forterra Finance LLC, First Lien Replacement Term Loan | | | 1M US L + 3.00%, 1.00% Floor | | | 10/25/2023 | | $ | 1,019,906 | |
| | 473,295 | | | Gentiva Health Services, Inc., First Lien Closing Date Initial Term Loan | | | 1M US L + 3.75% | | | 07/02/2025 | | | 476,549 | |
| | 176,966 | | | GOBP Holdings, Inc., First Lien 2019 Term Loan | | | 3M US L + 3.50% | | | 10/22/2025 | | | 178,128 | |
| | 480,000 | | | Granite Holdings US Acquisition Co., First Lien B Term Loan(j) | | | L + 5.25% | | | 09/25/2026 | | | 468,600 | |
| | 486,969 | | | Greeneden U.S. Holdings I LLC, First Lien Tranche B-3 Dollar Term Loan | | | 1M US L + 3.25% | | | 12/01/2023 | | | 484,938 | |
| | 1,381,528 | | | Gulf Finance LLC, First Lien Tranche B Term Loan | | | 1M US L + 5.25%, 1.00% Floor | | | 08/25/2023 | | | 1,058,602 | |
| | 478,743 | | | Hayward Industries, Inc., First Lien Initial Term Loan | | | 1M US L + 3.50% | | | 08/05/2024 | | | 463,782 | |
| | 473,337 | | | Hyland Software, Inc., First Lien 2018 Refinancing Term Loan | | | 1M US L + 3.25%, 0.75% Floor | | | 07/01/2024 | | | 473,870 | |
| | 481,326 | | | Intrawest Resort Holdings, Inc., Term B1 Loan, First Lien Initial Bluebird Term Loan | | | 1M US L + 3.00%, 1.00% Floor | | | 07/31/2024 | | | 483,583 | |
| | 495,750 | | | IRB Holding Corp., First Lien B Term Loan | | | 3M US L + 3.25%, 1.00% Floor | | | 02/05/2025 | | | 494,235 | |
| | 480,802 | | | Life Time Fitness, Inc., First Lien 2017 Refinancing Term Loan | | | 3M US L + 2.75%, 1.00% Floor | | | 06/10/2022 | | | 481,540 | |
| | 304,238 | | | Lower Cadence Holdings LLC, First Lien Initial Term Loan | | | 1M US L + 4.00% | | | 05/22/2026 | | | 297,298 | |
| | 493,747 | | | McDermott International, Inc., First Lien Term Loan | | | 3M US L + 5.00%, 1.00% Floor | | | 05/09/2025 | | | 314,270 | |
| | 1,147,118 | | | Minotaur Acquisition, Inc., First Lien B Term Loan | | | 1M US L + 5.00% | | | 03/27/2026 | | | 1,117,006 | |
| | 499,667 | | | Misys, Ltd., First Lien Dollar Term Loan | | | 3M US L + 3.50%, 1.00% Floor | | | 06/13/2024 | | | 487,201 | |
| | 217,789 | | | Mitchell International, Inc., First Lien Initial Term Loan, First Lien Initial Term Loan | | | 1M US L + 3.25% | | | 11/29/2024 | | | 209,232 | |
| | 478,832 | | | MLN US HoldCo LLC, First Lien B Term Loan | | | 1M US L + 4.50% | | | 11/30/2025 | | | 446,511 | |
| | 1,150,000 | | | MPH Acquisition Holdings LLC, First Lien Initial Term Loan | | | 3M US L + 2.75%, 1.00% Floor | | | 06/07/2023 | | | 1,098,727 | |
| | 195,000 | | | Nexstar Broadcasting, Inc., First Lien B-4 Term Loan | | | 3M US L + 2.75% | | | 09/18/2026 | | | 196,112 | |
| | 180,000 | | | Option Care Health, Inc., First Lien B Term Loan | | | 1M US L + 4.50% | | | 08/06/2026 | | | 180,000 | |
| | 247,448 | | | Panther BF Aggregator 2 L P, First Lien Initial Dollar Term Loan | | | 1M US L + 3.50% | | | 04/30/2026 | | | 245,825 | |
See Notes to Financial Statements.
| 48 | (888) 848-7569 | www.rivernorth.com |
| RiverNorth/DoubleLine Strategic Income Fund | Schedule of Investments |
September 30, 2019
| Principal Amount/Description | | | Rate | | Maturity | | Value | |
| $ | 396,992 | | | Ply Gem Midco, Inc., First Lien Initial Term Loan | | | 1M US L + 3.75% | | | 04/12/2025 | | $ | 389,549 | |
| | 368,857 | | | Project Alpha Intermediate Holding, Inc., First Lien Term Loan | | | 3M US L + 3.50%, 1.00% Floor | | | 04/26/2024 | | | 364,707 | |
| | 188,571 | | | Radiology Partners, Inc., First Lien B Term Loan | | | 3M US L + 4.75% | | | 07/09/2025 | | | 186,383 | |
| | 456,650 | | | Refinitiv US Holdings, Inc., First Lien Initial Dollar Term Loan | | | 1M US L + 3.75% | | | 10/01/2025 | | | 459,599 | |
| | 259,204 | | | Securus Technologies Holdings, Inc., First Lien Initial Term Loan | | | 1M US L + 4.50%, 1.00% Floor | | | 11/01/2024 | | | 229,612 | |
| | 462,519 | | | Sophia LP, First Lien B Term Loan | | | 3M US L + 3.25%,1.00% Floor | | | 09/30/2022 | | | 463,195 | |
| | 168,300 | | | Travel Leaders Group LLC, First Lien 2018 Refinancing Term Loan | | | 1M US L + 4.00% | | | 01/25/2024 | | | 168,861 | |
| | 366,300 | | | Verscend Holding Corp., First Lien B Term Loan | | | 1M US L + 4.50% | | | 08/27/2025 | | | 368,208 | |
| | 421,981 | | | Vertafore, Inc., First Lien Initial Term Loan | | | 1M US L + 3.25% | | | 07/02/2025 | | | 410,906 | |
| | 227,169 | | | Web.com Group, Inc., First Lien Initial Term Loan | | | 1M US L + 3.75% | | | 10/10/2025 | | | 223,858 | |
| | 165,000 | | | Zelis Healthcare Corp., First Lien B Term Loan(j) | | | L + 4.75% | | | 09/10/2026 | | | 163,969 | |
| | | | | | | | | | | | | | 22,255,786 | |
| | | | | | | | | | | | | | | |
| TOTAL BANK LOANS | | | | | | | | | | |
| (Cost $24,172,215) | | | | | | | | | 23,730,338 | |
| | | | | | | | | | | | | | | |
| COLLATERALIZED LOAN OBLIGATIONS - 2.12% | | | | | | | | | | |
| | | | | Adams Mill CLO, Ltd. | | | | | | | | | | |
| | 500,000 | | | Series 2014-1A(c)(e) | | | 3M US L + 3.50% | | | 07/15/2026 | | | 500,122 | |
| | | | | AIMCO CLO | | | | | | | | | | |
| | 500,000 | | | Series 2018-AA(c)(e) | | | 3M US L + 2.55% | | | 04/17/2031 | | | 458,040 | |
| | | | | AIMCO CLO 10, Ltd. | | | | | | | | | | |
| | 1,000,000 | | | Series 2019-10A(c)(e) | | | 3.55% - 3M US L | | | 07/22/2032 | | | 999,721 | |
| | | | | Apidos CLO XII | | | | | | | | | | |
| | 500,000 | | | Series 2018-12A(c)(e) | | | 3M US L + 2.60% | | | 04/15/2031 | | | 470,875 | |
| | | | | Apidos CLO XX | | | | | | | | | | |
| | 500,000 | | | Series 2018-20A(c)(e) | | | 3M US L + 2.95% | | | 07/16/2031 | | | 486,255 | |
| | | | | Apidos CLO XXI | | | | | | | | | | |
| | 500,000 | | | Series 2018-21A(c)(e) | | | 3M US L + 2.45% | | | 07/18/2027 | | | 489,265 | |
| | 1,000,000 | | | Series 2018-21A(c)(e) | | | 3M US L + 8.25% | | | 07/18/2027 | | | 964,989 | |
| | | | | Apidos CLO XXIV | | | | | | | | | | |
| | 1,000,000 | | | Series 2018-24A(c)(e) | | | 3M US L + 5.80% | | | 10/20/2030 | | | 939,146 | |
| | | | | Avery Point VI CLO, Ltd. | | | | | | | | | | |
| | 500,000 | | | Series 2018-6A(c)(e) | | | 3M US L + 1.05% | | | 08/05/2027 | | | 500,050 | |
See Notes to Financial Statements.
| Annual Report | September 30, 2019 | 49 |
| RiverNorth/DoubleLine Strategic Income Fund | Schedule of Investments |
September 30, 2019
| Principal Amount/Description | | Rate | | Maturity | | | Value | |
| | | | | Babson CLO, Ltd. | | | | | | | | | | |
| $ | 500,000 | | | Series 2018-IA(c)(e) | | 3M US L + 2.60% | | | 01/20/2031 | | | $ | 465,916 | |
| | | | | Barings CLO, Ltd. | | | | | | | | | | |
| | 500,000 | | | Series 2017-1A(c)(e) | | 3M US L + 3.60% | | | 07/18/2029 | | | | 500,236 | |
| | 500,000 | | | Series 2018-4A(c)(e) | | 3M US L + 5.82% | | | 10/15/2030 | | | | 461,683 | |
| | 1,000,000 | | | Series 2019-1A(c)(e) | | 3M US L + 6.68% | | | 04/15/2031 | | | | 976,069 | |
| | 500,000 | | | Series 2019-2A(c)(e) | | 3.85% - 3M US L | | | 04/15/2031 | | | | 500,628 | |
| | | | | BlueMountain CLO, Ltd. | | | | | | | | | | |
| | 500,000 | | | Series 2018-3A(c)(e) | | 3M US L + 2.60% | | | 04/20/2031 | | | | 461,402 | |
| | | | | Buttermilk Park CLO, Ltd. | | | | | | | | | | |
| | 1,000,000 | | | Series 2018-1A(c)(e) | | 3M US L + 5.75% | | | 10/15/2031 | | | | 933,767 | |
| | | | | Canyon Capital CLO, Ltd. | | | | | | | | | | |
| | 500,000 | | | Series 2017-1A(c)(e) | | 3M US L + 3.60% | | | 07/15/2030 | | | | 500,648 | |
| | 1,000,000 | | | Series 2018-1A(c)(e) | | 3M US L + 2.75% | | | 01/30/2031 | | | | 929,107 | |
| | 1,500,000 | | | Series 2018-1A(c)(e) | | 3M US L + 5.50% | | | 01/30/2031 | | | | 1,336,329 | |
| | 1,000,000 | | | Series 2018-1A(c)(e) | | 3M US L + 5.75% | | | 07/15/2031 | | | | 898,866 | |
| | 500,000 | | | Series 2018-1A(c)(e) | | 3M US L + 2.80% | | | 07/15/2031 | | | | 474,396 | |
| | 500,000 | | | Series 2018-1RA(c)(e) | | 3M US L + 3.00% | | | 07/15/2030 | | | | 482,689 | |
| | | | | Canyon CLO, Ltd. | | | | | | | | | | |
| | 500,000 | | | Series 2018-1A(c)(e) | | 3M US L + 2.90% | | | 07/15/2031 | | | | 476,997 | |
| | | | | Carlyle Global Market Strategies CLO, Ltd. | | | | | | | | | | |
| | 1,000,000 | | | Series 2018-2RA(c)(e) | | 3M US L + 5.35% | | | 05/15/2031 | | | | 864,550 | |
| | 500,000 | | | Series 2018-3A(c)(e) | | 3M US L + 2.85% | | | 07/28/2028 | | | | 485,453 | |
| | | | | Chenango Park CLO, Ltd. | | | | | | | | | | |
| | 500,000 | | | Series 2018-1A(c)(e) | | 3M US L + 3.00% | | | 04/15/2030 | | | | 477,248 | |
| | 1,000,000 | | | Series 2018-1A(c)(e) | | 3M US L + 5.80% | | | 04/15/2030 | | | | 921,252 | |
| | | | | Cook Park CLO, Ltd. | | | | | | | | | | |
| | 500,000 | | | Series 2018-1A(c)(e) | | 3M US L + 2.60% | | | 04/17/2030 | | | | 471,498 | |
| | | | | Dorchester Park CLO DAC | | | | | | | | | | |
| | 500,000 | | | Series 2018-1A(c)(e) | | 3M US L + 2.40% | | | 04/20/2028 | | | | 490,975 | |
| | 875,000 | | | Series 2018-1A(c)(e) | | 3M US L + 5.00% | | | 04/20/2028 | | | | 819,230 | |
| | | | | Dryden 57 CLO, Ltd. | | | | | | | | | | |
| | 500,000 | | | Series 2018-57A(c)(e) | | 3M US L + 2.55% | | | 05/15/2031 | | | | 467,203 | |
| | | | | Dryden 60 CLO, Ltd. | | | | | | | | | | |
| | 1,000,000 | | | Series 2018-60A(c)(e) | | 3M US L + 3.00% | | | 07/15/2031 | | | | 966,842 | |
| | | | | Elmwood CLO II, Ltd. | | | | | | | | | | |
| | 1,000,000 | | | Series 2019-2A(c)(e) | | 3M US L + 2.10% | | | 04/20/2031 | | | | 999,915 | |
| | | | | Fillmore Park CLO, Ltd. | | | | | | | | | | |
| | 500,000 | | | Series 2018-1A(c)(e) | | 3M US L + 2.90% | | | 07/15/2030 | | | | 481,099 | |
| | 1,000,000 | | | Series 2018-1A(c)(e) | | 3M US L + 5.40% | | | 07/15/2030 | | | | 915,902 | |
| | | | | Gilbert Park CLO, Ltd. | | | | | | | | | | |
| | 1,000,000 | | | Series 2017-1A(c)(e) | | 3M US L + 6.40% | | | 10/15/2030 | | | | 975,500 | |
See Notes to Financial Statements.
| 50 | (888) 848-7569 | www.rivernorth.com |
| RiverNorth/DoubleLine Strategic Income Fund | Schedule of Investments |
September 30, 2019
| Principal Amount/Description | | Rate | | Maturity | | | Value | |
| | | | | Goldentree Loan Management US CLO, Ltd. | | | | | | | | | | |
| $ | 500,000 | | | Series 2018-3A(c)(e) | | 3M US L + 2.85% | | | 04/20/2030 | | | $ | 480,768 | |
| | | | | Myers Park CLO, Ltd. | | | | | | | | | | |
| | 500,000 | | | Series 2018-1A(c)(e) | | 3M US L + 3.05% | | | 10/20/2030 | | | | 485,476 | |
| | 1,000,000 | | | Series 2018-1A(c)(e) | | 3M US L + 5.50% | | | 10/20/2030 | | | | 928,093 | |
| | | | | Neuberger Berman CLO XXIII, Ltd. | | | | | | | | | | |
| | 1,000,000 | | | Series 2018-23A(c)(e) | | 3M US L + 5.75% | | | 10/17/2027 | | | | 942,009 | |
| | | | | PPM CLO 3, Ltd. | | | | | | | | | | |
| | 1,000,000 | | | Series 2019-3A(c)(e) | | 3.70% - 3M US L | | | 07/17/2030 | | | | 996,322 | |
| | | | | Stewart Park CLO, Ltd. | | | | | | | | | | |
| | 500,000 | | | Series 2018-1A(c)(e) | | 3M US L + 2.60% | | | 01/15/2030 | | | | 468,750 | |
| | | | | Symphony CLO XVII, Ltd. | | | | | | | | | | |
| | 1,500,000 | | | Series 2018-17A(c)(e) | | 3M US L + 2.65% | | | 04/15/2028 | | | | 1,475,422 | |
| | | | | THL Credit Wind River CLO, Ltd. | | | | | | | | | | |
| | 500,000 | | | Series 2017-1A(c)(e) | | 3M US L + 3.75% | | | 04/18/2029 | | | | 500,709 | |
| | 500,000 | | | Series 2018-1A(c)(e) | | 2.90% - 3M US L | | | 07/15/2030 | | | | 463,109 | |
| | 2,000,000 | | | Series 2018-1A(c)(e) | | 5.50% - 3M US L | | | 07/15/2030 | | | | 1,727,110 | |
| | 1,000,000 | | | Series 2018-1A(c)(e) | | 3M US L + 3.00% | | | 07/18/2031 | | | | 919,768 | |
| | 1,000,000 | | | Series 2018-2A(c)(e) | | 3M US L + 5.75% | | | 07/15/2030 | | | | 890,828 | |
| | 1,000,000 | | | Series 2018-3A(c)(e) | | 3M US L + 6.22% | | | 10/22/2031 | | | | 887,674 | |
| | | | | Tryon Park CLO, Ltd. | | | | | | | | | | |
| | 1,000,000 | | | Series 2018-1A(c)(e) | | 3M US L + 5.95% | | | 04/15/2029 | | | | 960,402 | |
| | | | | VERDE CLO, Ltd. | | | | | | | | | | |
| | 1,000,000 | | | Series 2019-1A(c)(e) | | 3.80% - 3M US L | | | 04/15/2032 | | | | 1,001,598 | |
| | | | | Voya CLO, Ltd. | | | | | | | | | | |
| | 500,000 | | | Series 2018-1A(c)(e) | | 3M US L + 2.80% | | | 04/18/2031 | | | | 468,692 | |
| | 1,000,000 | | | Series 2018-2A(c)(e) | | 3M US L + 2.75% | | | 07/15/2031 | | | | 952,054 | |
| | 1,000,000 | | | Series 2018-2A(c)(e) | | 3M US L + 5.25% | | | 07/15/2031 | | | | 911,728 | |
| | | | | Webster Park CLO, Ltd. | | | | | | | | | | |
| | 1,000,000 | | | Series 2018-1A(c)(e) | | 5.50% - 3M US L | | | 07/20/2030 | | | | 918,479 | |
| | | | | Wellfleet CLO, Ltd. | | | | | | | | | | |
| | 1,000,000 | | | Series 2018-3A(c)(e) | | 3M US L + 1.25% | | | 01/20/2032 | | | | 1,001,947 | |
| | | | | Westcott Park CLO, Ltd. | | | | | | | | | | |
| | 1,000,000 | | | Series 2019-1A(c)(e) | | 3M US L + 3.25% | | | 07/20/2028 | | | | 993,755 | |
| | | | | | | | | | | | | | | |
| TOTAL COLLATERALIZED LOAN OBLIGATIONS | | | | | | | | | | |
(Cost $45,291,551) | | | | | | | | | 42,918,556 | |
See Notes to Financial Statements.
| Annual Report | September 30, 2019 | 51 |
| RiverNorth/DoubleLine Strategic Income Fund | Schedule of Investments |
September 30, 2019
| Principal Amount/Description | | Rate | | Maturity | | | Value | |
| EQUITY - LINKED NOTES - 0.00%(h) | | | | | | | | | | |
| $ | 263,093 | | | Inverpamplona SA(g)(i) | | 0.00% | | | 12/30/2028 | | | $ | 11,250 | |
| | | | | | | | | | | | | | | |
| TOTAL EQUITY - LINKED NOTES | | | | | | | | | | |
| (Cost $11,250) | | | | | | | | | 11,250 | |
| | | | | | | | | | | | | | | |
| NON-AGENCY COLLATERALIZED MORTGAGE OBLIGATIONS - 20.28% | |
| | | | | AASET, Ltd. | | | | | | | | | | |
| | 772,407 | | | Series 2018-1A(e) | | 3.84% | | | 09/16/2023 | | | | 778,554 | |
| | | | | Adjustable Rate Mortgage Trust | | | | | | | | | | |
| | 395,072 | | | Series 2005-1(c) | | 4.70% | | | 05/25/2035 | | | | 406,312 | |
| | 3,348,879 | | | Series 2005-10(c) | | 4.41% | | | 01/25/2036 | | | | 2,906,444 | |
| | 212,285 | | | Series 2005-7(c) | | 4.28% | | | 10/25/2035 | | | | 189,696 | |
| | | | | ALM XII, Ltd. | | | | | | | | | | |
| | 500,000 | | | Series 2018-12A(c)(e) | | 3M US L + 2.65% | | | 04/16/2027 | | | | 491,386 | |
| | | | | Alternative Loan Trust | | | | | | | | | | |
| | 295,373 | | | Series 2005-20CB | | 5.50% | | | 07/25/2035 | | | | 286,427 | |
| | 107,057 | | | Series 2005-54CB | | 5.50% | | | 11/25/2035 | | | | 91,566 | |
| | 543,298 | | | Series 2005-6CB | | 5.50% | | | 04/25/2035 | | | | 557,853 | |
| | 245,684 | | | Series 2005-85CB(c) | | 21.63% - 3.67 x 1M US L | | | 02/25/2036 | | | | 338,876 | |
| | 1,163,364 | | | Series 2005-85CB(c) | | 1M US L + 1.10% | | | 02/25/2036 | | | | 1,007,139 | |
| | 306,118 | | | Series 2005-86CB | | 5.50% | | | 02/25/2036 | | | | 267,721 | |
| | 560,767 | | | Series 2005-9CB(c) | | 5.05% - 1M US L | | | 05/25/2035 | | | | 65,037 | |
| | 315,747 | | | Series 2005-9CB(c) | | 1M US L + 0.50% | | | 05/25/2035 | | | | 292,466 | |
| | 299,729 | | | Series 2006-12CB(c) | | 1M US L + 5.75% | | | 05/25/2036 | | | | 240,509 | |
| | 1,427,402 | | | Series 2006-15CB | | 6.50% | | | 06/25/2036 | | | | 1,078,390 | |
| | 175,315 | | | Series 2006-30T1 | | 6.25% | | | 11/25/2036 | | | | 161,709 | |
| | 144,410 | | | Series 2006-32CB | | 5.50% | | | 11/25/2036 | | | | 120,193 | |
| | 310,171 | | | Series 2006-36T2(c) | | 28.06% - 4.6 x 1M US L | | | 12/25/2036 | | | | 528,270 | |
| | 1,145,855 | | | Series 2007-19 | | 6.00% | | | 08/25/2037 | | | | 930,341 | |
| | 3,907,497 | | | Series 2007-20 | | 6.25% | | | 08/25/2047 | | | | 3,302,800 | |
| | 1,056,792 | | | Series 2007-23CB(c) | | 6.50% - 1M US L | | | 09/25/2037 | | | | 353,788 | |
| | 1,106,782 | | | Series 2007-23CB(c) | | 1M US L + 0.50% | | | 09/25/2037 | | | | 628,164 | |
| | | | | American Home Mortgage Investment Trust | | | | | | | | | | |
| | 170,373 | | | Series 2007-A(e)(k) | | 6.60% | | | 01/25/2037 | | | | 70,344 | |
| | | | | Applebee's Funding LLC / IHOP Funding LLC | | | | | | | | | | |
| | 750,000 | | | Series 2019-1A(e) | | 4.19% | | | 06/05/2024 | | | | 768,083 | |
| | | | | AREIT Trust | | | | | | | | | | |
| | 1,265,000 | | | Series 2019-CRE3(c)(e) | | 1M US L + 2.65% | | | 07/14/2022 | | | | 1,271,799 | |
See Notes to Financial Statements.
| 52 | (888) 848-7569 | www.rivernorth.com |
| RiverNorth/DoubleLine Strategic Income Fund | Schedule of Investments |
September 30, 2019
| Principal Amount/Description | | Rate | | Maturity | | | Value | |
| | | | | Atlas Senior Loan Fund X, Ltd. | | | | | | | | | | |
| $ | 500,000 | | | Series 2018-10A(c)(e) | | 3M US L + 1.09% | | | 01/15/2031 | | | $ | 497,250 | |
| | | | | Atrium Hotel Portfolio Trust | | | | | | | | | | |
| | 1,309,000 | | | Series 2018-ATRM(c)(e) | | 1M US L + 3.40% | | | 06/15/2021 | | | | 1,321,525 | |
| | | | | Atrium IX | | | | | | | | | | |
| | 500,000 | | | Series 2017-9A(c)(e) | | 3M US L + 3.60% | | | 05/28/2030 | | | | 500,324 | |
| | | | | Atrium XIII | | | | | | | | | | |
| | 1,000,000 | | | Series 2017-13A(c)(e) | | 3M US L + 6.05% | | | 11/21/2030 | | | | 948,259 | |
| | | | | Atrium XIV LLC | | | | | | | | | | |
| | 1,000,000 | | | Series 2018-14A(c)(e) | | 3M US L + 5.65% | | | 08/23/2030 | | | | 931,921 | |
| | | | | BAMLL Commercial Mortgage Securities Trust | | | | | | | | | | |
| | 683,000 | | | Series 2019-AHT(c)(e) | | 4.53% | | | 03/15/2021 | | | | 686,513 | |
| | | | | Banc of America Funding Corp. | | | | | | | | | | |
| | 207,415 | | | Series 2008-R2(e) | | 6.00% | | | 09/25/2037 | | | | 213,305 | |
| | | | | Banc of America Funding Trust | | | | | | | | | | |
| | 178,112 | | | Series 2006-2 | | 5.50% | | | 03/25/2036 | | | | 177,854 | |
| | 4,429,592 | | | Series 2010-R5(c)(e) | | 6.00% | | | 10/26/2037 | | | | 4,342,808 | |
| | | | | Bancorp Commercial Mortgage Trust | | | | | | | | | | |
| | 605,000 | | | Series 2019-CRE5(c)(e) | | 1M US L + 1.50% | | | 01/15/2022 | | | | 605,670 | |
| | 1,312,000 | | | Series 2019-CRE5(c)(e) | | 1M US L + 2.35% | | | 02/15/2022 | | | | 1,315,753 | |
| | | | | BANK | | | | | | | | | | |
| | 463,000 | | | Series 2018-BN10(c) | | 4.08% | | | 01/15/2028 | | | | 503,100 | |
| | 463,000 | | | Series 2018-BN13(c) | | 4.69% | | | 07/15/2028 | | | | 523,412 | |
| | 203,000 | | | Series 2019-BN17(c) | | 4.67% | | | 04/15/2029 | | | | 224,908 | |
| | | | | Barclays Commercial Mortgage Trust | | | | | | | | | | |
| | 697,000 | | | Series 2019-C3 | | 3.90% | | | 05/15/2029 | | | | 772,144 | |
| | 697,000 | | | Series 2019-C3 | | 4.10% | | | 05/15/2029 | | | | 765,604 | |
| | | | | BBCMS Trust | | | | | | | | | | |
| | 3,000,000 | | | Series 2018-CBM(c)(e) | | 1M US L + 3.15% | | | 07/15/2020 | | | | 3,013,250 | |
| | | | | BCAP, LLC Trust | | | | | | | | | | |
| | 139,237 | | | Series 2007-AA2(c) | | 7.50% | | | 04/25/2037 | | | | 123,145 | |
| | 90,339 | | | Series 2007-AA2 | | 6.00% | | | 04/25/2037 | | | | 74,729 | |
| | 6,211,125 | | | Series 2010-RR6(c)(e) | | 6.00% | | | 07/26/2036 | | | | 4,925,966 | |
| | | | | Bear Stearns ALT-A Trust | | | | | | | | | | |
| | 1,180,440 | | | Series 2004-11(c) | | 3.42% | | | 11/25/2034 | | | | 1,166,196 | |
| | 1,172,888 | | | Series 2005-3(c) | | 3.97% | | | 04/25/2035 | | | | 1,113,005 | |
| | 9,139,982 | | | Series 2006-3(c) | | 3.98% | | | 05/25/2036 | | | | 7,375,522 | |
| | 1,151,694 | | | Series 2006-6(c) | | 3.99% | | | 11/25/2036 | | | | 1,069,042 | |
| | | | | Bear Stearns Asset-Backed Securities Trust | | | | | | | | | | |
| | 2,152,132 | | | Series 2006-AC1(k) | | 6.25% | | | 02/25/2036 | | | | 1,598,503 | |
See Notes to Financial Statements.
| Annual Report | September 30, 2019 | 53 |
| RiverNorth/DoubleLine Strategic Income Fund | Schedule of Investments |
September 30, 2019
| Principal Amount/Description | | Rate | | Maturity | | | Value | |
| | | | | Bellemeade Real Estate, Ltd. | | | | | | | | | | |
| $ | 4,500,000 | | | Series 2019-2A(c)(e) | | 1M US L + 1.45% | | | 04/25/2029 | | | $ | 4,502,400 | |
| | | | | BENCHMARK Mortgage Trust | | | | | | | | | | |
| | 203,000 | | | Series 2019-B10 | | 3.75% | | | 03/15/2029 | | | | 212,704 | |
| | | | | BF Mortgage Trust | | | | | | | | | | |
| | 705,000 | | | Series 2019-NYT(c)(e) | | 1M US L + 3.00% | | | 12/15/2020 | | | | 712,843 | |
| | | | | BHP Trust | | | | | | | | | | |
| | 761,000 | | | Series 2019-BXHP(c)(e) | | 1M US L + 2.56768% | | | 08/15/2021 | | | | 761,938 | |
| | | | | Braemar Hotels & Resorts Trust | | | | | | | | | | |
| | 688,000 | | | Series 2018-PRME(c)(e) | | 1M US L + 2.90% | | | 12/15/2019 | | | | 691,077 | |
| | | | | BX Commercial Mortgage Trust | | | | | | | | | | |
| | 700,000 | | | Series 2019-IMC(c)(e) | | 1M US L + 1.90% | | | 04/15/2021 | | | | 702,627 | |
| | | | | BX Trust | | | | | | | | | | |
| | 760,000 | | | Series 2019-MMP(c)(e) | | 1M US L + 2.79211% | | | 08/15/2021 | | | | 761,897 | |
| | | | | CAL Funding III, Ltd. | | | | | | | | | | |
| | 841,667 | | | Series 2018-1A(e) | | 3.96% | | | 02/25/2028 | | | | 849,842 | |
| | | | | Cantor Commercial Real Estate Lending | | | | | | | | | | |
| | 652,000 | | | Series 2019-CF1(c)(e) | | 4.12% | | | 04/15/2024 | | | | 658,437 | |
| | | | | Carbon Capital VI Commercial Mortgage Trust | | | | | | | | | | |
| | 680,000 | | | Series 2019-FL2(c)(e) | | 1M US L + 2.85% | | | 11/15/2021 | | | | 685,972 | |
| | | | | Carrington Mortgage Loan Trust | | | | | | | | | | |
| | 2,057,917 | | | Series 2006-NC4(c) | | 1M US L + 0.16% | | | 10/25/2036 | | | | 1,926,355 | |
| | | | | Castlelake Aircraft Securitization Trust | | | | | | | | | | |
| | 3,099,496 | | | Series 2018-1(e) | | 6.63% | | | 06/15/2025 | | | | 3,124,330 | |
| | | | | Castlelake Aircraft Structured Trust | | | | | | | | | | |
| | 722,028 | | | Series 2019-1A(e) | | 3.97% | | | 04/15/2026 | | | | 739,907 | |
| | 2,750,000 | | | Series 2019-1A(e)(g) | | 0.00% | | | 04/15/2039 | | | | 2,773,599 | |
| | | | | CF Trust | | | | | | | | | | |
| | 1,518,000 | | | Series 2019-MF1(c)(e) | | 1M US L + 2.95% | | | 08/21/2021 | | | | 1,521,806 | |
| | | | | Chase Mortgage Finance Trust | | | | | | | | | | |
| | 13,861,833 | | | Series 2007-S2 | | 6.00% | | | 03/25/2037 | | | | 10,778,420 | |
| | 504,283 | | | Series 2007-S3 | | 5.50% | | | 05/25/2037 | | | | 130,982 | |
| | | | | CIM Trust | | | | | | | | | | |
| | 12,000,000 | | | Series 2016-1RR(c)(e) | | 6.96% | | | 07/26/2055 | | | | 12,019,962 | |
| | 12,000,000 | | | Series 2016-2RR B2(c)(e) | | 7.09% | | | 02/25/2056 | | | | 12,171,505 | |
| | 12,000,000 | | | Series 2016-3RR B2(c)(e) | | 8.14% | | | 02/27/2056 | | | | 12,108,661 | |
| | 11,430,000 | | | Series 2016-3RR B2(c)(e) | | 10.97% | | | 01/27/2057 | | | | 11,872,741 | |
| | 3,515,854 | | | Series 2017-6 A1(c)(e) | | 3.02% | | | 06/25/2057 | | | | 3,537,661 | |
| | | | | Citicorp Mortgage Securities Trust | | | | | | | | | | |
| | 664,585 | | | Series 2007-1 | | 6.00% | | | 01/25/2037 | | | | 660,459 | |
See Notes to Financial Statements.
| 54 | (888) 848-7569 | www.rivernorth.com |
| RiverNorth/DoubleLine Strategic Income Fund | Schedule of Investments |
September 30, 2019
| Principal Amount/Description | | Rate | | Maturity | | | Value | |
| $ | 4,292 | | | Series 2007-2 | | 5.50% | | | 02/25/2037 | | | $ | 4,209 | |
| | | | | Citigroup Commercial Mortgage Trust | | | | | | | | | | |
| | 3,828,529 | | | Series 2014-GC25(c) | | 1.15% | | | 10/10/2047 | | | | 164,051 | |
| | 866,000 | | | Series 2015-GC27(c)(e) | | 4.58% | | | 01/10/2025 | | | | 829,001 | |
| | 400,000 | | | Series 2015-GC31(c) | | 4.19% | | | 06/10/2025 | | | | 407,136 | |
| | 420,000 | | | Series 2015-GC35(c) | | 4.65% | | | 11/10/2025 | | | | 445,046 | |
| | 5,394,495 | | | Series 2015-GC35(c) | | 1.01% | | | 11/10/2048 | | | | 190,382 | |
| | 480,000 | | | Series 2016-GC36(e) | | 2.85% | | | 01/10/2026 | | | | 419,612 | |
| | 464,000 | | | Series 2017-C4(c) | | 4.10% | | | 10/12/2027 | | | | 501,935 | |
| | 463,000 | | | Series 2018-B2(c) | | 4.28% | | | 03/10/2028 | | | | 509,108 | |
| | 515,000 | | | Series 2018-C5(c) | | 4.88% | | | 06/10/2028 | | | | 562,210 | |
| | 901,000 | | | Series 2019-SST2(c)(e) | | 1M US L + 1.60% | | | 02/15/2022 | | | | 904,205 | |
| | 901,000 | | | Series 2019-SST2(c)(e) | | 1M US L + 2.00% | | | 02/15/2022 | | | | 904,194 | |
| | | | | Citigroup Mortgage Loan Trust | | | | | | | | | | |
| | 832,267 | | | Series 2006-WF1(k) | | 4.88% | | | 03/25/2036 | | | | 556,440 | |
| | 1,294,964 | | | Series 2007-OPX1(k) | | 6.33% | | | 01/25/2037 | | | | 663,862 | |
| | 650,876 | | | Series 2008-AR4(c)(e) | | 4.57% | | | 11/25/2038 | | | | 654,309 | |
| | 618,170 | | | Series 2010-8(c)(e) | | 6.00% | | | 11/25/2036 | | | | 625,702 | |
| | 1,858,090 | | | Series 2010-8(c)(e) | | 6.00% | | | 12/25/2036 | | | | 1,869,596 | |
| | | | | CitiMortgage Alternative Loan Trust | | | | | | | | | | |
| | 616,604 | | | Series 2007-A1 | | 6.00% | | | 01/25/2037 | | | | 609,428 | |
| | 121,455 | | | Series 2007-A1(c) | | 5.40% - 1M US L | | | 01/25/2037 | | | | 18,616 | |
| | 87,941 | | | Series 2007-A3(c) | | 6.00% | | | 03/25/2037 | | | | 88,857 | |
| | 202,379 | | | Series 2007-A3(c) | | 5.40% - 1M US L | | | 03/25/2037 | | | | 37,904 | |
| | 714,405 | | | Series 2007-A4 | | 5.75% | | | 04/25/2037 | | | | 700,897 | |
| | 640,379 | | | Series 2007-A6 | | 5.50% | | | 06/25/2037 | | | | 617,276 | |
| | | | | CLI Funding VI LLC | | | | | | | | | | |
| | 963,573 | | | Series 2019-1A(e) | | 3.71% | | | 05/18/2029 | | | | 983,399 | |
| | | | | CLNS Trust | | | | | | | | | | |
| | 168,000 | | | Series 2017-IKPR(c)(e) | | 1M US L + 3.15% | | | 06/11/2022 | | | | 168,104 | |
| | 168,000 | | | Series 2017-IKPR(c)(e) | | 1M US L + 3.50% | | | 06/11/2022 | | | | 168,558 | |
| | | | | COMM Mortgage Trust | | | | | | | | | | |
| | 887,000 | | | Series 2013-CR11(c) | | 5.28% | | | 09/10/2023 | | | | 965,777 | |
| | 500,000 | | | Series 2016-GCT(c)(e) | | 3.58% | | | 08/10/2021 | | | | 495,053 | |
| | | | | Commercial Mortgage Pass-Through Certificates | | | | | | | | | | |
| | 242,400 | | | Series 2014-CR19(c) | | 4.91% | | | 08/10/2024 | | | | 259,376 | |
| | 400,000 | | | Series 2014-CR20(c) | | 4.66% | | | 10/10/2024 | | | | 427,681 | |
| | 8,629,084 | | | Series 2014-UBS4(e) | | 3.75% | | | 08/10/2024 | | | | 1,869,278 | |
| | 11,000 | | | Series 2014-UBS4(c)(e) | | 0.00% | | | 08/10/2047 | | | | 1 | |
| | 3,780,455 | | | Series 2015-CR22(c) | | 1.09% | | | 03/10/2025 | | | | 126,728 | |
| | 4,709,539 | | | Series 2015-CR26(c) | | 1.10% | | | 09/10/2025 | | | | 221,765 | |
| | 419,000 | | | Series 2015-LC23(c) | | 4.80% | | | 10/10/2025 | | | | 451,669 | |
See Notes to Financial Statements.
| Annual Report | September 30, 2019 | 55 |
| RiverNorth/DoubleLine Strategic Income Fund | Schedule of Investments |
September 30, 2019
| Principal Amount/Description | | Rate | | Maturity | | | Value | |
| $ | 249,000 | | | Series 2016-DC2(c) | | 4.79% | | | 02/10/2026 | | | $ | 263,446 | |
| | | | | Commercial Mortgage Trust | | | | | | | | | | |
| | 659,000 | | | Series 2012-CR4(c)(e) | | 4.72% | | | 11/15/2022 | | | | 271,541 | |
| | | | | CORE Mortgage Trust | | | | | | | | | | |
| | 540,000 | | | Series 2019-CORE(c)(e) | | 1M US L + 1.90% | | | 12/15/2020 | | | | 541,126 | |
| | 540,000 | | | Series 2019-CORE(c)(e) | | 1M US L + 2.35% | | | 12/15/2020 | | | | 541,511 | |
| | | | | Countrywide Home Loan Mortgage Pass-Through Trust | | | | | | | | | | |
| | 2,555,958 | | | Series 2005-HYB7(c) | | 3.78% | | | 11/20/2035 | | | | 2,352,392 | |
| | 45,520 | | | Series 2005-J4 | | 5.50% | | | 11/25/2035 | | | | 43,976 | |
| | 2,125,463 | | | Series 2006-18 | | 6.00% | | | 12/25/2036 | | | | 1,821,745 | |
| | 343,996 | | | Series 2007-17 | | 6.00% | | | 10/25/2037 | | | | 312,006 | |
| | 343,123 | | | Series 2007-3 | | 6.00% | | | 04/25/2037 | | | | 289,060 | |
| | 380,849 | | | Series 2007-7 | | 5.75% | | | 06/25/2037 | | | | 322,946 | |
| | | | | Credit Suisse First Boston Mortgage Securities Corp. | | | | | | | | | | |
| | 77,833 | | | Series 2005-10 | | 5.50% | | | 11/25/2035 | | | | 75,075 | |
| | 2,243,106 | | | Series 2005-11 | | 6.00% | | | 12/25/2035 | | | | 2,216,249 | |
| | 68,507 | | | Series 2005-8 | | 5.50% | | | 08/25/2025 | | | | 69,645 | |
| | 4,862,675 | | | Series 2005-9 | | 6.00% | | | 10/25/2035 | | | | 2,687,800 | |
| | | | | Credit Suisse Mortgage Capital Certificates | | | | | | | | | | |
| | 4,030,556 | | | Series 2006-2 | | 5.75% | | | 03/25/2036 | | | | 3,559,307 | |
| | | | | CSAB Mortgage-Backed Trust | | | | | | | | | | |
| | 8,781,274 | | | Series 2006-2(k) | | 5.70% | | | 09/25/2036 | | | | 1,369,341 | |
| | 147,247 | | | Series 2007-1(c) | | 5.90% | | | 05/25/2037 | | | | 63,082 | |
| | | | | CSAIL Commercial Mortgage Trust | | | | | | | | | | |
| | 5,610,011 | | | Series 2015-C1(c) | | 1.00% | | | 01/15/2025 | | | | 204,334 | |
| | 419,000 | | | Series 2015-C4(c) | | 4.73% | | | 11/15/2025 | | | | 449,775 | |
| | 214,000 | | | Series 2018-C14(c) | | 5.06% | | | 10/15/2028 | | | | 242,858 | |
| | | | | CSMC Mortgage-Backed Trust | | | | | | | | | | |
| | 188,914 | | | Series 2006-1 | | 6.00% | | | 02/25/2036 | | | | 128,292 | |
| | 24,836 | | | Series 2006-4 | | 5.50% | | | 05/25/2021 | | | | 22,478 | |
| | 811,393 | | | Series 2006-5 | | 6.25% | | | 06/25/2036 | | | | 332,423 | |
| | 103,097 | | | Series 2006-9 | | 6.00% | | | 11/25/2036 | | | | 67,492 | |
| | 2,186,300 | | | Series 2007-1 | | 6.00% | | | 02/25/2037 | | | | 1,943,115 | |
| | 11,388 | | | Series 2007-2 | | 5.00% | | | 03/25/2037 | | | | 11,150 | |
| | 552,745 | | | Series 2007-3(c) | | 5.84% | | | 04/25/2037 | | | | 249,337 | |
| | 33,955 | | | Series 2007-4 | | 6.00% | | | 06/25/2037 | | | | 30,486 | |
| | 2,585,288 | | | Series 2009-16R(c)(e) | | 6.00% | | | 07/26/2037 | | | | 2,679,248 | |
| | 604,000 | | | Series 2017-CALI(c)(e) | | 3.90% | | | 11/10/2024 | | | | 630,855 | |
| | 253,000 | | | Series 2017-CHOP(c)(e) | | 1M US L + 1.90% | | | 07/15/2032 | | | | 253,892 | |
| | 253,000 | | | Series 2017-CHOP(c)(e) | | 1M US L + 3.30% | | | 07/15/2032 | | | | 254,867 | |
| | 856,870 | | | Series 2018-RPL2(e)(k) | | 4.03% | | | 08/25/2062 | | | | 863,424 | |
See Notes to Financial Statements.
| 56 | (888) 848-7569 | www.rivernorth.com |
| RiverNorth/DoubleLine Strategic Income Fund | Schedule of Investments |
September 30, 2019
| Principal Amount/Description | | Rate | | Maturity | | | Value | |
| $ | 1,753,731 | | | Series 2018-RPL8(c)(e) | | 4.13% | | | 07/25/2058 | | | $ | 1,773,242 | |
| | | | | DB Master Finance LLC | | | | | | | | | | |
| | 997,500 | | | Series 2019-1A(e) | | 3.79% | | | 02/20/2024 | | | | 1,030,055 | |
| | | | | DBUBS Mortgage Trust | | | | | | | | | | |
| | 468,000 | | | Series 2017-BRBK(c)(e) | | 3.65% | | | 10/10/2024 | | | | 466,360 | |
| | | | | Deutsche Alt-A Securities, Inc. Mortgage Loan Trust | | | | | | | | | | |
| | 344,807 | | | Series 2005-6(c) | | 5.08% - 1M US L | | | 12/25/2035 | | | | 56,633 | |
| | 151,119 | | | Series 2005-6(c) | | 1M US L + 1.40% | | | 12/25/2035 | | | | 127,026 | |
| | | | | Deutsche Mortgage Securities, Inc. Mortgage Loan Trust | | | | | | | | | | |
| | 173,187 | | | Series 2006-PR1(c)(e) | | 12.12% - 1M US L | | | 04/15/2036 | | | | 171,204 | |
| | | | | Dryden 40 Senior Loan Fund | | | | | | | | | | |
| | 1,000,000 | | | Series 2018-40A(c)(e) | | 3M US L + 5.75% | | | 08/15/2031 | | | | 925,834 | |
| | 500,000 | | | Series 2018-40A(c)(e) | | 3M US L + 3.10% | | | 08/15/2031 | | | | 489,624 | |
| | | | | Earnest Student Loan Program | | | | | | | | | | |
| | 35,000 | | | Series 2016-D(e) | | 0.00% | | | 05/25/2025 | | | | 1,038,940 | |
| | | | | Ellington Financial Mortgage Trust | | | | | | | | | | |
| | 1,111,617 | | | Series 2018-1(c)(e) | | 4.39% | | | 10/25/2058 | | | | 1,128,640 | |
| | | | | First Horizon Alternative Mortgage Securities Trust | | | | | | | | | | |
| | 908,542 | | | Series 2005-FA6 | | 5.50% | | | 09/25/2035 | | | | 778,917 | |
| | 139,193 | | | Series 2007-FA2 | | 6.00% | | | 04/25/2037 | | | | 94,553 | |
| | | | | First Horizon Mortgage Pass-Through Trust | | | | | | | | | | |
| | 1,455,705 | | | Series 2007-AR3(c) | | 4.28% | | | 11/25/2037 | | | | 1,302,745 | |
| | | | | Global SC Finance IV, Ltd. | | | | | | | | | | |
| | 427,850 | | | Series 2018-1A(e) | | 4.29% | | | 05/17/2028 | | | | 443,983 | |
| | | | | GPMT, Ltd. | | | | | | | | | | |
| | 474,000 | | | Series 2019-FL2(c)(e) | | 1M US L + 2.95% | | | 11/15/2023 | | | | 478,622 | |
| | | | | Great Wolf Trust | | | | | | | | | | |
| | 152,000 | | | Series 2017-WOLF(c)(e) | | 1M US L + 2.10% | | | 09/15/2034 | | | | 152,211 | |
| | 235,000 | | | Series 2017-WOLF(c)(e) | | 1M US L + 3.10% | | | 09/15/2034 | | | | 235,657 | |
| | 125,000 | | | Series 2017-WOLF(c)(e) | | 1M US L + 4.07% | | | 09/15/2034 | | | | 125,515 | |
| | | | | GS Mortgage Securities Trust | | | | | | | | | | |
| | 296,417 | | | Series 2011-GC3(c)(e) | | 0.81% | | | 03/10/2021 | | | | 2,007 | |
| | 2,239,490 | | | Series 2011-GC5(c)(e) | | 1.50% | | | 08/10/2044 | | | | 39,564 | |
| | 3,986,000 | | | Series 2014-GC26(c)(e) | | 4.67% | | | 11/10/2047 | | | | 3,516,926 | |
| | 438,000 | | | Series 2015-GC34 | | 2.98% | | | 10/10/2025 | | | | 399,043 | |
| | 7,257,037 | | | Series 2015-GS1(c) | | 0.94% | | | 11/10/2025 | | | | 301,225 | |
| | 656,000 | | | Series 2017-GS6 | | 3.87% | | | 05/10/2027 | | | | 704,688 | |
| | 407,000 | | | Series 2017-GS8(c) | | 4.48% | | | 11/10/2027 | | | | 441,833 | |
| | 796,000 | | | Series 2018-FBLU(c)(e) | | 1M US L + 3.25% | | | 11/15/2020 | | | | 801,053 | |
| | 1,954,000 | | | Series 2018-TWR(c)(e) | | 1M US L + 3.92% | | | 07/15/2021 | | | | 1,972,328 | |
See Notes to Financial Statements.
| Annual Report | September 30, 2019 | 57 |
| RiverNorth/DoubleLine Strategic Income Fund | Schedule of Investments |
September 30, 2019
| Principal Amount/Description | | Rate | | Maturity | | | Value | |
| | | | | GSAA Home Equity Trust | | | | | | | | | | |
| $ | 2,501,644 | | | Series 2006-13(c) | | 6.04% | | | 07/25/2036 | | | $ | 1,367,047 | |
| | 561,185 | | | Series 2006-18(k) | | 5.68% | | | 11/25/2036 | | | | 257,972 | |
| | 175,828 | | | Series 2006-6(c) | | 5.69% | | | 03/25/2036 | | | | 85,782 | |
| | 949,592 | | | Series 2007-2(k) | | 6.10% | | | 03/25/2037 | | | | 353,717 | |
| | | | | GSCG Trust | | | | | | | | | | |
| | 628,000 | | | Series 2019-600C(e) | | 3.76% | | | 09/06/2024 | | | | 639,764 | |
| | 1,303,000 | | | Series 2019-600C(c)(e) | | 4.12% | | | 09/06/2024 | | | | 1,266,577 | |
| | | | | GSR Mortgage Loan Trust | | | | | | | | | | |
| | 289,992 | | | Series 2005-AR4(c) | | 4.64% | | | 07/25/2035 | | | | 297,571 | |
| | 1,577,808 | | | Series 2006-2F | | 5.25% | | | 02/25/2036 | | | | 1,225,961 | |
| | 610,926 | | | Series 2007-2F | | 5.75% | | | 02/25/2037 | | | | 972,814 | |
| | 3,097,474 | | | Series 2007-2F | | 6.00% | | | 03/25/2037 | | | | 2,691,819 | |
| | 1,225,924 | | | Series 2007-AR2(c) | | 4.26% | | | 05/25/2037 | | | | 1,053,770 | |
| | | | | Halcyon Loan Advisors Funding, Ltd. | | | | | | | | | | |
| | 11,097 | | | Series 2013-1A(c)(e) | | 3M US L + 1.15% | | | 04/15/2025 | | | | 11,107 | |
| | 250,000 | | | Series 2013-2A(c)(e) | | 3M US L + 2.70% | | | 08/01/2025 | | | | 249,859 | |
| | | | | Harley Marine Financing LLC | | | | | | | | | | |
| | 954,473 | | | Series 2018-1A(e) | | 5.68% | | | 05/15/2022 | | | | 848,719 | |
| | | | | Hawaii Hotel Trust | | | | | | | | | | |
| | 1,391,000 | | | Series 2019-MAUI(c)(e) | | 1M US L + 2.75% | | | 05/15/2021 | | | | 1,399,271 | |
| | | | | Hayfin Kingsland X, Ltd. | | | | | | | | | | |
| | 500,000 | | | Series 2019-1A(c)(e) | | 3M US L + 2.25% | | | 04/28/2031 | | | | 499,854 | |
| | | | | Helios Issuer, LLC Series | | | | | | | | | | |
| | 1,322,667 | | | Series 2017-1A(e) | | 4.94% | | | 09/20/2023 | | | | 1,386,733 | |
| | | | | Highbridge Loan Management 2013-2, Ltd. | | | | | | | | | | |
| | 500,000 | | | Series 2017-2A(c)(e) | | 3M US L + 6.60% | | | 10/20/2029 | | | | 485,000 | |
| | | | | Highbridge Loan Management, Ltd. | | | | | | | | | | |
| | 500,000 | | | Series 2018-2016(c)(e) | | 3M US L + 2.90% | | | 07/20/2030 | | | | 468,164 | |
| | | | | HPLY Trust | | | | | | | | | | |
| | 690,937 | | | Series 2019-HIT(c)(e) | | 1M US L + 3.15% | | | 11/15/2021 | | | | 692,664 | |
| | 1,376,924 | | | Series 2019-HIT(c)(e) | | 1M US L + 3.90% | | | 11/15/2021 | | | | 1,380,366 | |
| | | | | HPS Loan Management, Ltd. | | | | | | | | | | |
| | 500,000 | | | Series 2017-17(c)(e) | | 3M US L + 1.26% | | | 05/06/2030 | | | | 500,542 | |
| | | | | HSI Asset Loan Obligation Trust | | | | | | | | | | |
| | 19,446 | | | Series 2007-2 | | 5.50% | | | 09/25/2037 | | | | 18,168 | |
| | | | | IMT Trust | | | | | | | | | | |
| | 360,000 | | | Series 2017-APTS(c)(e) | | 1M US L + 1.10% | | | 06/15/2034 | | | | 360,100 | |
| | | | | IndyMac IMJA Mortgage Loan Trust | | | | | | | | | | |
| | 1,273,764 | | | Series 2007-A1 | | 6.00% | | | 08/25/2037 | | | | 900,341 | |
| | | | | IndyMac IMSC Mortgage Loan Trust | | | | | | | | | | |
| | 4,751,473 | | | Series 2007-F2 | | 6.50% | | | 07/25/2037 | | | | 2,805,013 | |
See Notes to Financial Statements.
| 58 | (888) 848-7569 | www.rivernorth.com |
| RiverNorth/DoubleLine Strategic Income Fund | Schedule of Investments |
September 30, 2019
| Principal Amount/Description | | Rate | | Maturity | | | Value | |
| | | | | IndyMac Index Mortgage Loan Trust | | | | | | | | | | |
| $ | 1,973,937 | | | Series 2005-AR31(c) | | 3.98% | | | 01/25/2036 | | | $ | 1,889,527 | |
| | 1,128,779 | | | Series 2005-AR35(c) | | 3.64% | | | 02/25/2036 | | | | 1,027,303 | |
| | 2,801,777 | | | Series 2006-AR25(c) | | 3.47% | | | 09/25/2036 | | | | 2,680,600 | |
| | | | | Invitation Homes | | | | | | | | | | |
| | 995,000 | | | Series 2018-SFR1(c)(e) | | 1M US L + 1.25% | | | 03/17/2020 | | | | 993,966 | |
| | 650,000 | | | Series 2018-SFR1(c)(e) | | 1M US L + 1.45% | | | 03/17/2020 | | | | 649,349 | |
| | | | | JOL Air, Ltd. | | | | | | | | | | |
| | 960,298 | | | Series 2019-1(e) | | 3.97% | | | 04/15/2026 | | | | 970,679 | |
| | | | | JP Morgan Alternative Loan Trust | | | | | | | | | | |
| | 303,302 | | | Series 2005-S1 | | 6.00% | | | 12/25/2035 | | | | 287,540 | |
| | 4,984 | | | Series 2006-S1 | | 5.00% | | | 02/25/2021 | | | | 4,939 | |
| | 190,525 | | | Series 2006-S3(k) | | 6.12% | | | 08/25/2036 | | | | 183,607 | |
| | | | | JP Morgan BB Commercial Mortgage Securities Trust | | | | | | | | | | |
| | 652,000 | | | Series 2013-C17(c) | | 5.06% | | | 12/15/2023 | | | | 704,500 | |
| | 400,000 | | | Series 2014-C21(c) | | 4.81% | | | 07/15/2024 | | | | 418,891 | |
| | 867,000 | | | Series 2014-C23(c)(e) | | 3.36% | | | 10/15/2024 | | | | 736,965 | |
| | 388,000 | | | Series 2014-C26(c) | | 4.52% | | | 12/15/2024 | | | | 412,823 | |
| | 5,432,164 | | | Series 2015-C28(c) | | 1.25% | | | 03/15/2025 | | | | 201,090 | |
| | 542,000 | | | Series 2015-C28 | | 3.99% | | | 03/15/2025 | | | | 572,287 | |
| | 9,190,219 | | | Series 2015-C30(c) | | 0.67% | | | 07/15/2025 | | | | 242,255 | |
| | 3,802,590 | | | Series 2015-C31(c) | | 1.07% | | | 08/15/2025 | | | | 150,991 | |
| | 414,000 | | | Series 2016-C1(c) | | 4.90% | | | 02/15/2026 | | | | 450,090 | |
| | | | | JP Morgan Chase Commercial Mortgage Securities Trust | | | | | | | | | | |
| | 82,549 | | | Series 2006-LDP8(c) | | 0.31% | | | 05/15/2045 | | | | 131 | |
| | 4,000,000 | | | Series 2007-CH1(k) | | 4.89% | | | 11/25/2036 | | | | 4,315,548 | |
| | 1,157,000 | | | Series 2011-C3(c)(e) | | 5.85% | | | 03/15/2021 | | | | 1,120,952 | |
| | 2,535,911 | | | Series 2012-C8(c) | | 1.92% | | | 09/15/2022 | | | | 108,205 | |
| | 1,000,000 | | | Series 2014-C20(c)(e) | | 4.75% | | | 06/15/2024 | | | | 938,839 | |
| | 119,000 | | | Series 2016-JP2(c) | | 3.94% | | | 07/15/2026 | | | | 123,359 | |
| | 1,010,000 | | | Series 2018-WPT(e) | | 5.54% | | | 07/05/2023 | | | | 1,050,018 | |
| | 887,000 | | | Series 2019-COR4(c) | | 4.44% | | | 12/10/2028 | | | | 1,000,263 | |
| | 704,000 | | | Series 2019-MFP(c)(e) | | 1M US L + 3.10% | | | 07/15/2024 | | | | 708,461 | |
| | 235,000 | | | Series 2019-UES(e) | | 4.34% | | | 05/05/2024 | | | | 250,321 | |
| | 1,135,000 | | | Series 2019-UES(c)(e) | | 4.60% | | | 05/05/2024 | | | | 1,151,843 | |
| | | | | JP Morgan Mortgage Acquisition Corp. | | | | | | | | | | |
| | 293,607 | | | Series 2006-CH2(k) | | 5.46% | | | 09/25/2029 | | | | 236,345 | |
| | | | | JP Morgan Mortgage Trust | | | | | | | | | | |
| | 1,174,093 | | | Series 2007-S3 | | 6.00% | | | 07/25/2037 | | | | 928,479 | |
See Notes to Financial Statements.
| Annual Report | September 30, 2019 | 59 |
| RiverNorth/DoubleLine Strategic Income Fund | Schedule of Investments |
September 30, 2019
| Principal Amount/Description | | Rate | | Maturity | | | Value | |
| | | | | JP Morgan Resecuritization Trust | | | | | | | | | | |
| $ | 1,357,956 | | | Series 2011-1(c)(e) | | 6.00% | | | 06/26/2037 | | | $ | 1,289,965 | |
| | | | | Labrador Aviation Finance, Ltd. | | | | | | | | | | |
| | 2,916,666 | | | Series 2016-1A(e) | | 5.68% | | | 01/15/2024 | | | | 3,005,823 | |
| | | | | LB-UBS Commercial Mortgage Trust | | | | | | | | | | |
| | 436,533 | | | Series 2006-C7(c)(e) | | 0.88% | | | 11/15/2038 | | | | 95 | |
| | | | | LCM 28, Ltd. | | | | | | | | | | |
| | 1,000,000 | | | Series 2018-28A(c)(e) | | 3M US L + 5.75% | | | 10/20/2030 | | | | 915,041 | |
| | | | | LCM Loan Income Fund I Income Note Issuer, Ltd. | | | | | | | | | | |
| | 500,000 | | | Series 2018-27A(c)(e) | | 3M US L + 5.60% | | | 07/16/2031 | | | | 444,334 | |
| | | | | LCM XIV LP | | | | | | | | | | |
| | 1,000,000 | | | Series 2018-14A(c)(e) | | 3M US L + 2.75% | | | 07/20/2031 | | | | 936,334 | |
| | 750,000 | | | Series 2018-14A(c)(e) | | 3M US L + 5.50% | | | 07/20/2031 | | | | 644,074 | |
| | | | | LCM XVII LP | | | | | | | | | | |
| | 1,000,000 | | | Series 2018-17A(c)(e) | | 3M US L + 6.00% | | | 10/15/2031 | | | | 909,593 | |
| | | | | LCM XX LP | | | | | | | | | | |
| | 1,000,000 | | | Series 2018-20A(c)(e) | | 3M US L + 5.45% | | | 10/20/2027 | | | | 952,817 | |
| | | | | Lehman Mortgage Trust | | | | | | | | | | |
| | 5,658,393 | | | Series 2006-1(c) | | 5.39% | | | 02/25/2036 | | | | 5,726,541 | |
| | 633,910 | | | Series 2006-6 | | 5.50% | | | 10/25/2036 | | | | 556,236 | |
| | 3,900,054 | | | Series 2006-7(c) | | 1M US L + 0.25% | | | 11/25/2036 | | | | 325,645 | |
| | 3,900,054 | | | Series 2006-7(c) | | 7.75% - 1M US L | | | 11/25/2036 | | | | 810,124 | |
| | 1,471,096 | | | Series 2006-8(c) | | 1M US L + 0.42% | | | 12/25/2036 | | | | 530,739 | |
| | 1,471,096 | | | Series 2006-8(c) | | 6.58% - 1M US L | | | 12/25/2036 | | | | 414,524 | |
| | 710,195 | | | Series 2007-10 | | 6.00% | | | 01/25/2038 | | | | 743,957 | |
| | 344,977 | | | Series 2007-10 | | 6.50% | | | 01/25/2038 | | | | 226,154 | |
| | | | | Lehman XS Trust | | | | | | | | | | |
| | 80,444 | | | Series 2006-5(k) | | 5.89% | | | 04/25/2036 | | | | 78,638 | |
| | | | | LoanCore Issuer, Ltd. | | | | | | | | | | |
| | 1,193,000 | | | Series 2019-CRE3(c)(e) | | 1M US L + 2.50% | | | 04/15/2024 | | | | 1,197,921 | |
| | | | | Madison Park Funding XIV, Ltd. | | | | | | | | | | |
| | 1,000,000 | | | Series 2018-14A(c)(e) | | 3M US L + 2.95% | | | 10/22/2030 | | | | 966,439 | |
| | 1,000,000 | | | Series 2018-14A(c)(e) | | 3M US L + 5.80% | | | 10/22/2030 | | | | 915,158 | |
| | | | | Mello Warehouse Securitization Trust | | | | | | | | | | |
| | 750,000 | | | Series 2019-1(c)(e) | | 1M US L + 5.50% | | | 05/14/2021 | | | | 753,257 | |
| | | | | Merrill Lynch Alternative Note Asset Trust | | | | | | | | | | |
| | 757,257 | | | Series 2007-F1 | | 6.00% | | | 03/25/2037 | | | | 249,662 | |
| | | | | Monarch Beach Resort Trust | | | | | | | | | | |
| | 5,000,000 | | | Series 2018-MBMZ(c)(e) | | 1M US L + 4.96% | | | 07/15/2025 | | | | 5,029,016 | |
See Notes to Financial Statements.
| 60 | (888) 848-7569 | www.rivernorth.com |
| RiverNorth/DoubleLine Strategic Income Fund | Schedule of Investments |
September 30, 2019
| Principal Amount/Description | | Rate | | Maturity | | Value | |
| | | | Morgan Stanley Bank of America Merrill Lynch Trust | | | | | | | | |
| $ | 3,274,648 | | Series 2012-C5(c)(e) | | 1.60% | | 07/15/2022 | | $ | 106,937 | |
| | 450,000 | | Series 2014-C19 | | 4.00% | | 12/15/2024 | | | 465,180 | |
| | 380,000 | | Series 2015-C25(c) | | 4.68% | | 09/15/2025 | | | 411,790 | |
| | 350,000 | | Series 2015-C27(c) | | 4.68% | | 11/15/2025 | | | 365,855 | |
| | | | Morgan Stanley Capital I Trust | | | | | | | | |
| | 2,990,672 | | Series 2011-C1(c)(e) | | 0.52% | | 09/15/2020 | | | 9,890 | |
| | 1,382,542 | | Series 2016-UB11 XA(c) | | 1.77% | | 08/15/2026 | | | 107,635 | |
| | 1,000,000 | | Series 2018-SUN(c)(e) | | 1M US L + 3.05% | | 07/15/2020 | | | 1,003,636 | |
| | 706,000 | | Series 2019-H6 | | 3.70% | | 05/15/2029 | | | 755,817 | |
| | | | Morgan Stanley Mortgage Loan Trust | | | | | | | | |
| | 2,220,721 | | Series 2005-3AR(c) | | 4.17% | | 07/25/2035 | | | 2,084,356 | |
| | 3,807,294 | | Series 2006-11 | | 6.00% | | 08/25/2036 | | | 3,542,451 | |
| | 997,011 | | Series 2006-7(c) | | 5.04% | | 06/25/2036 | | | 862,479 | |
| | 1,066,173 | | Series 2006-7 | | 6.00% | | 06/25/2036 | | | 916,439 | |
| | 431,629 | | Series 2007-3XS(k) | | 5.70% | | 01/25/2047 | | | 252,506 | |
| | | | Morgan Stanley Re-REMIC Trust | | | | | | | | |
| | 289,522 | | Series 2011-R1(c)(e) | | 5.94% | | 02/26/2037 | | | 312,465 | |
| | | | Mosaic Solar Loan Trust | | | | | | | | |
| | 146,112 | | Series 2017-1A(e) | | 4.45% | | 06/20/2042 | | | 152,678 | |
| | 543,718 | | Series 2018-1A(e) | | 4.01% | | 08/20/2030 | | | 564,542 | |
| | 777,613 | | Series 2018-2GS(e) | | 4.20% | | 10/21/2030 | | | 806,330 | |
| | | | MSCG Trust | | | | | | | | |
| | 255,000 | | Series 2016-SNR(e) | | 5.21% | | 11/13/2021 | | | 260,535 | |
| | 2,154,000 | | Series 2018-SELF(c)(e) | | 1M US L + 3.05% | | 10/15/2020 | | | 2,162,182 | |
| | | | Natixis Commercial Mortgage Securities Trust | | | | | | | | |
| | 345,000 | | Series 2018-FL1(c)(e) | | 1M US L + 2.20% | | 06/15/2022 | | | 342,262 | |
| | | | Navient Private Education Refi Loan Trust | | | | | | | | |
| | 500,000 | | Series 2018-A(e) | | 3.68% | | 11/17/2025 | | | 523,560 | |
| | | | New Residential Mortgage Loan Trust | | | | | | | | |
| | 4,080,426 | | Series 2019-RPL1(e)(k) | | 4.34% | | 02/26/2024 | | | 4,118,421 | |
| | | | Nomura Asset Acceptance Corp. Alternative Loan Trust | | | | | | | | |
| | 1,267,326 | | Series 2005-AP3(c) | | 5.32% | | 08/25/2035 | | | 817,390 | |
| | | | OCTAGON INVESTMENT PARTNERS 20-R, Ltd. | | | | | | | | |
| | 1,000,000 | | Series 2019-4A(c)(e) | | 3M US L + 6.80% | | 05/12/2031 | | | 975,012 | |
| | | | Octagon Investment Partners 26, Ltd. | | | | | | | | |
| | 1,000,000 | | Series 2018-1A(c)(e) | | 3M US L + 8.09% | | 07/15/2030 | | | 908,272 | |
See Notes to Financial Statements.
| Annual Report | September 30, 2019 | 61 |
| RiverNorth/DoubleLine Strategic Income Fund | Schedule of Investments |
September 30, 2019
| Principal Amount/Description | | Rate | | Maturity | | Value | |
| | | | Octagon Investment Partners 37, Ltd. | | | | | | | | |
| $ | 500,000 | | Series 2018-2A(c)(e) | | 3M US L + 2.85% | | 07/25/2030 | | $ | 471,134 | |
| | | | Octagon Investment Partners XVI, Ltd. | | | | | | | | |
| | 500,000 | | Series 2018-1A(c)(e) | | 3M US L + 3.00% | | 07/17/2030 | | | 476,061 | |
| | 1,000,000 | | Series 2018-1A(c)(e) | | 3M US L + 5.75% | | 07/17/2030 | | | 896,515 | |
| | | | Octagon Investment Partners XXII, Ltd. | | | | | | | | |
| | 500,000 | | Series 2018-1A(c)(e) | | 3M US L + 5.45% | | 01/22/2030 | | | 447,068 | |
| | | | OHA Credit Funding 1, Ltd. | | | | | | | | |
| | 500,000 | | Series 2018-1A(c)(e) | | 3M US L + 3.05% | | 10/20/2030 | | | 483,527 | |
| | | | OHA Credit Funding 3, Ltd. | | | | | | | | |
| | 1,000,000 | | Series 2019-3A(c)(e) | | 3.55% - 3M US L | | 07/20/2032 | | | 997,881 | |
| | | | One Market Plaza Trust | | | | | | | | |
| | 688,000 | | Series 2017-1MKT(e) | | 4.14% | | 02/10/2024 | | | 695,625 | |
| | | | PHH Alternative Mortgage Trust | | | | | | | | |
| | 1,082,113 | | Series 2007-2 | | 6.00% | | 05/25/2037 | | | 1,004,934 | |
| | | | PR Mortgage Loan Trust | | | | | | | | |
| | 10,906,617 | | Series 2014-1(c)(e) | | 5.91% | | 09/25/2047 | | | 10,672,929 | |
| | | | Pretium Mortgage Credit Partners I LLC | | | | | | | | |
| | 860,701 | | Series 2019-NPL2(e)(k) | | 3.84% | | 12/25/2058 | | | 865,375 | |
| | | | Prime Mortgage Trust | | | | | | | | |
| | 44,129 | | Series 2006-1 | | 5.50% | | 06/25/2036 | | | 44,405 | |
| | 88,477 | | Series 2006-DR1(e) | | 5.50% | | 05/25/2035 | | | 77,845 | |
| | | | Primose Funding LLC | | | | | | | | |
| | 1,000,000 | | Series 2019-1A(e) | | 4.48% | | 07/30/2026 | | | 1,001,863 | |
| | | | RBSGC Structured Trust | | | | | | | | |
| | 213,506 | | Series 2008-B(e) | | 6.00% | | 06/25/2037 | | | 216,923 | |
| | | | Residential Accredit Loans, Inc. | | | | | | | | |
| | 1,734,126 | | Series 2005-QS17 | | 6.00% | | 12/25/2035 | | | 1,711,414 | |
| | 4,513,361 | | Series 2006-QA5(c) | | 1M US L + 0.22% | | 07/25/2036 | | | 2,877,892 | |
| | 2,499,611 | | Series 2006-QS10 | | 6.50% | | 08/25/2036 | | | 2,399,835 | |
| | 942,572 | | Series 2006-QS4 | | 6.00% | | 04/25/2036 | | | 901,740 | |
| | 1,464,555 | | Series 2006-QS6 | | 6.00% | | 06/25/2036 | | | 1,377,904 | |
| | 1,610,203 | | Series 2006-QS7 | | 6.00% | | 06/25/2036 | | | 1,510,397 | |
| | 84,651 | | Series 2006-QS7(c) | | 1M US L + 0.40% | | 06/25/2036 | | | 64,667 | |
| | 253,954 | | Series 2006-QS7(c) | | 5.60% - 1M US L | | 06/25/2036 | | | 38,139 | |
| | 106,745 | | Series 2006-QS8(c) | | 1M US L + 0.45% | | 08/25/2036 | | | 84,349 | |
| | 320,234 | | Series 2006-QS8(c) | | 5.55% - 1M US L | | 08/25/2036 | | | 45,494 | |
| | 2,349,745 | | Series 2007-QS3 | | 6.50% | | 02/25/2037 | | | 2,235,874 | |
| | 69,936 | | Series 2007-QS6 | | 6.25% | | 04/25/2037 | | | 67,945 | |
| | 9,854 | | Series 2007-QS6(c) | | 55.00% - 8.33 x 1M US L | | 04/25/2037 | | | 21,205 | |
See Notes to Financial Statements.
| 62 | (888) 848-7569 | www.rivernorth.com |
| RiverNorth/DoubleLine Strategic Income Fund | Schedule of Investments |
September 30, 2019
| Principal Amount/Description | | Rate | | Maturity | | Value | |
| $ | 3,332,780 | | Series 2007-QS9 | | 6.50% | | 07/25/2037 | | $ | 3,198,817 | |
| | 339,325 | | Series 2008-QR1 | | 6.00% | | 08/25/2036 | | | 298,651 | |
| | | | Residential Asset Securitization Trust | | | | | | | | |
| | 506,379 | | Series 2006-A1 | | 6.00% | | 04/25/2036 | | | 408,189 | |
| | 1,063,077 | | Series 2006-A2 | | 6.00% | | 05/25/2036 | | | 757,649 | |
| | 916,938 | | Series 2006-A6 | | 6.50% | | 07/25/2036 | | | 424,790 | |
| | 412,635 | | Series 2006-A8 | | 6.00% | | 08/25/2036 | | | 367,330 | |
| | 153,588 | | Series 2006-A8 | | 6.50% | | 08/25/2036 | | | 81,182 | |
| | 325,189 | | Series 2006-A8(c) | | 5.90% - 1M US L | | 08/25/2036 | | | 93,742 | |
| | 1,545,730 | | Series 2007-A1 | | 6.00% | | 03/25/2037 | | | 896,558 | |
| | 81,743 | | Series 2007-A6 | | 6.00% | | 06/25/2037 | | | 71,778 | |
| | 2,785,924 | | Series 2007-A7 | | 6.00% | | 07/25/2037 | | | 1,745,839 | |
| | | | Residential Funding Mortgage Securities I Trust | | | | | | | | |
| | 956,963 | | Series 2006-S3 | | 5.50% | | 03/25/2036 | | | 932,353 | |
| | 1,728,245 | | Series 2006-S6 | | 6.00% | | 07/25/2036 | | | 1,746,632 | |
| | 381,824 | | Series 2007-S3 | | 6.00% | | 03/25/2037 | | | 361,056 | |
| | 302,189 | | Series 2007-S6 | | 6.00% | | 06/25/2037 | | | 284,772 | |
| | | | Sequoia Mortgage Trust | | | | | | | | |
| | 2,135,209 | | Series 2007-3(c) | | 4.02% | | 07/20/2037 | | | 2,022,451 | |
| | | | SERVPRO Master Issuer LLC | | | | | | | | |
| | 500,000 | | Series 2019-1A(e) | | 3.88% | | 10/25/2026 | | | 505,875 | |
| | | | SLIDE | | | | | | | | |
| | 3,169,564 | | Series 2018-FUN(c)(e) | | 1M US L + 3.00% | | 06/15/2021 | | | 3,203,236 | |
| | | | SMB Private Education Loan Trust | | | | | | | | |
| | 500,000 | | Series 2018-B(c)(e) | | 1M US L + 0.72% | | 08/15/2027 | | | 499,303 | |
| | | | SoFi Consumer Loan Program, LLC | | | | | | | | |
| | 56,559 | | Series 2017-2(e) | | 3.28% | | 02/25/2026 | | | 57,009 | |
| | | | SoFi Professional Loan Program, LLC | | | | | | | | |
| | 300,000 | | Series 2017-D(e) | | 3.61% | | 09/25/2040 | | | 314,302 | |
| | 56,760 | | Series 2019-B(e) | | 0.00% | | 08/17/2048 | | | 2,097,404 | |
| | | | Sprite, Ltd. | | | | | | | | |
| | 350,347 | | Series 2017-1(e) | | 4.25% | | 12/15/2024 | | | 354,444 | |
| | | | Stack Infrastructure Issuer LLC | | | | | | | | |
| | 994,167 | | Series 2019-1A(e) | | 4.54% | | 02/26/2024 | | | 1,043,197 | |
| | | | Start, Ltd. | | | | | | | | |
| | 762,248 | | Series 2018-1(e) | | 4.09% | | 05/15/2025 | | | 780,309 | |
| | 1,205,357 | | Series 2019-1(e) | | 4.09% | | 03/15/2026 | | | 1,231,700 | |
| | 2,500,000 | | Stru Jp-2334(l) | | 2.14% | | 10/25/2029 | | | 2,488,000 | |
| | 3,000,000 | | Stru Jpm-2336(l) | | 2.14% | | 10/25/2029 | | | 2,985,600 | |
See Notes to Financial Statements.
| Annual Report | September 30, 2019 | 63 |
| RiverNorth/DoubleLine Strategic Income Fund | Schedule of Investments |
September 30, 2019
| Principal Amount/Description | | Rate | | Maturity | | Value | |
| | | | Structured Adjustable Rate Mortgage Loan Trust | | | | | | | | |
| $ | 827,889 | | Series 2005-15(c) | | 4.15% | | 07/25/2035 | | $ | 670,310 | |
| | | | Structured Asset Securities Corp. | | | | | | | | |
| | 222,336 | | Series 2005-RF1(c)(e) | | 1M US L + 0.35% | | 03/25/2035 | | | 202,253 | |
| | 223,555 | | Series 2005-RF1(c)(e) | | 2.77% | | 03/25/2035 | | | 37,829 | |
| | | | TAL Advantage, LLC | | | | | | | | |
| | 756,367 | | Series 17-1A(e) | | 4.50% | | 04/20/2042 | | | 780,146 | |
| | | | TBW Mortgage-Backed Trust | | | | | | | | |
| | 1,368,396 | | Series 2006-2 | | 7.00% | | 07/25/2036 | | | 456,491 | |
| | | | Textainer Marine Containers V, Ltd. | | | | | | | | |
| | 780,948 | | Series 2017-1A(e) | | 3.72% | | 01/20/2026 | | | 781,753 | |
| | | | Textainer Marine Containers VII, Ltd. | | | | | | | | |
| | 483,333 | | Series 2019-1A(e) | | 3.96% | | 10/20/2026 | | | 491,893 | |
| | | | Thunderbolt II Aircraft Lease, Ltd. | | | | | | | | |
| | 4,642,857 | | Series 2018-A(e)(k) | | 5.07% | | 09/15/2038 | | | 4,748,561 | |
| | | | TRIP Rail Master Funding, LLC | | | | | | | | |
| | 288,626 | | Series 2017-1A(e) | | 2.71% | | 07/15/2021 | | | 289,116 | |
| | | | UBS Commercial Mortgage Trust | | | | | | | | |
| | 464,000 | | Series 2017-C6(c) | | 4.15% | | 12/15/2027 | | | 507,219 | |
| | 513,000 | | Series 2017-C6(c) | | 4.60% | | 12/15/2027 | | | 560,165 | |
| | 656,000 | | Series 2017-C7(c) | | 4.74% | | 01/15/2028 | | | 716,729 | |
| | 511,000 | | Series 2018-C8(c) | | 4.86% | | 02/15/2028 | | | 564,078 | |
| | 610,000 | | Series 2019-C16(c) | | 4.32% | | 03/15/2029 | | | 677,347 | |
| | | | Vantage Data Centers Issuer, LLC | | | | | | | | |
| | 738,125 | | Series 2018-1A(e) | | 4.07% | | 02/15/2023 | | | 767,853 | |
| | | | VB-S1 Issuer, LLC | | | | | | | | |
| | 3,000,000 | | Series 2018-1A(e) | | 5.25% | | 02/15/2023 | | | 3,020,880 | |
| | | | VCATT, LLC | | | | | | | | |
| | 4,615,393 | | Series 2019-NPL1(e)(k) | | 4.36% | | 02/25/2022 | | | 4,665,339 | |
| | | | Velocity Commercial Capital Loan Trust | | | | | | | | |
| | 4,082,771 | | Series 2017-2(c)(e) | | 3.07% | | 07/25/2026 | | | 4,124,318 | |
| | 811,439 | | Series 2018-2(c)(e) | | 4.05% | | 09/25/2024 | | | 828,213 | |
| | 1,434,390 | | Series 2019-1(c)(e) | | 3.94% | | 11/25/2025 | | | 1,467,171 | |
| | 397,711 | | Series 2019-1(c)(e) | | 4.01% | | 04/25/2026 | | | 407,075 | |
| | 394,913 | | Series 2019-1(c)(e) | | 4.12% | | 09/25/2026 | | | 404,305 | |
| | | | Vericrest Opportunity Loan Trust | | | | | | | | |
| | 973,418 | | Series 2019-NPL3(e)(k) | | 3.97% | | 03/25/2022 | | | 981,291 | |
| | | | VOLT LXIX LLC | | | | | | | | |
| | 789,376 | | Series 2018-NPL5(e)(k) | | 4.21% | | 08/25/2048 | | | 793,400 | |
See Notes to Financial Statements.
| 64 | (888) 848-7569 | www.rivernorth.com |
| RiverNorth/DoubleLine Strategic Income Fund | Schedule of Investments |
September 30, 2019
| Principal Amount/Description | | Rate | | Maturity | | Value | |
| | | | Wachovia Bank Commercial Mortgage Trust | | | | | | | | |
| $ | 44,236 | | Series 2006-C29(c) | | 0.48% | | 11/15/2048 | | $ | 1 | |
| | | | Wachovia Mortgage Loan Trust, LLC Series Trust | | | | | | | | |
| | 770,398 | | Series 2005-B(c) | | 4.45% | | 10/20/2035 | | | 765,346 | |
| | | | Washington Mutual Alternative Mortgage Pass-Through Certificates | | | | | | | | |
| | 1,559,718 | | Series 2005-1 | | 6.00% | | 03/25/2035 | | | 1,598,875 | |
| | 64,158 | | Series 2005-9 | | 5.50% | | 11/25/2035 | | | 57,369 | |
| | 483,228 | | Series 2006-5 | | 6.00% | | 07/25/2036 | | | 400,778 | |
| | | | Washington Mutual Mortgage Pass-Through Certificates Trust | | | | | | | | |
| | 937,102 | | Series 2006-2 | | 6.00% | | 03/25/2036 | | | 922,213 | |
| | | | WAVE 2019-1 LLC | | | | | | | | |
| | 1,000,000 | | Series 2019-1(e) | | 3.60% | | 09/15/2027 | | | 999,956 | |
| | 1,000,000 | | Series 2019-1(e) | | 6.41% | | 09/15/2027 | | | 999,980 | |
| | | | Wells Fargo Alternative Loan Trust | | | | | | | | |
| | 559,576 | | Series 2007-PA2(c) | | 1M US L + 0.43% | | 06/25/2037 | | | 462,630 | |
| | 559,576 | | Series 2007-PA2(c) | | 6.07% - 1M US L | | 06/25/2037 | | | 72,296 | |
| | 204,500 | | Series 2007-PA3 | | 5.75% | | 07/25/2037 | | | 199,631 | |
| | 721,641 | | Series 2007-PA3 | | 6.25% | | 07/25/2037 | | | 697,605 | |
| | 3,756,997 | | Series 2007-PA5 | | 6.25% | | 11/25/2037 | | | 3,746,467 | |
| | | | Wells Fargo Commercial Mortgage Trust | | | | | | | | |
| | 525,000 | | Series 2014-LC16(e) | | 3.94% | | 06/15/2024 | | | 432,346 | |
| | 420,000 | | Series 2015-C31(c) | | 4.76% | | 11/15/2025 | | | 451,145 | |
| | 340,000 | | Series 2015-LC22(c) | | 4.70% | | 09/15/2058 | | | 360,896 | |
| | 380,000 | | Series 2015-NXS3(c) | | 4.64% | | 09/15/2025 | | | 406,657 | |
| | 420,000 | | Series 2015-NXS4(c) | | 4.75% | | 11/15/2025 | | | 455,464 | |
| | 655,000 | | Series 2015-SG1 | | 4.05% | | 08/15/2025 | | | 705,511 | |
| | 1,000,000 | | Series 2016-C33(e) | | 3.12% | | 03/15/2059 | | | 933,424 | |
| | 5,628,945 | | Series 2016-C37(c)(e) | | 1.60% | | 12/15/2049 | | | 442,053 | |
| | 695,000 | | Series 2016-LC25(c) | | 4.57% | | 11/15/2026 | | | 766,888 | |
| | 518,000 | | Series 2018-C45 | | 4.73% | | 06/15/2028 | | | 564,375 | |
| | 165,000 | | Series 2018-C46(c) | | 5.15% | | 08/15/2051 | | | 187,811 | |
| | 523,000 | | Series 2018-C47(c) | | 5.10% | | 10/15/2028 | | | 578,565 | |
| | 436,000 | | Series 2018-C48(c) | | 5.29% | | 12/15/2028 | | | 500,041 | |
| | 901,000 | | Series 2019-C49 | | 4.55% | | 02/15/2029 | | | 1,014,043 | |
| | 901,000 | | Series 2019-C49(c) | | 4.87% | | 02/15/2029 | | | 1,006,505 | |
| | | | Wells Fargo Mortgage-Backed Securities Trust | | | | | | | | |
| | 1,297,664 | | Series 2005-12 | | 5.50% | | 11/25/2035 | | | 1,309,430 | |
| | 131,582 | | Series 2006-2 | | 5.50% | | 03/25/2036 | | | 129,792 | |
See Notes to Financial Statements.
| Annual Report | September 30, 2019 | 65 |
| RiverNorth/DoubleLine Strategic Income Fund | Schedule of Investments |
September 30, 2019
| Principal Amount/Description | | Rate | | Maturity | | Value | |
| $ | 43,301 | | Series 2006-2 | | 5.75% | | 03/25/2036 | | $ | 42,923 | |
| | 380,909 | | Series 2007-13 | | 6.00% | | 09/25/2037 | | | 382,116 | |
| | 462,036 | | Series 2007-14 | | 6.00% | | 10/25/2037 | | | 461,999 | |
| | | | WF-RBS Commercial Mortgage Trust | | | | | | | | |
| | 2,064,803 | | Series 2012-C9(c)(e) | | 2.06% | | 11/15/2045 | | | 98,826 | |
| | 3,621,773 | | Series 2014-C21(c) | | 1.20% | | 08/15/2047 | | | 148,264 | |
| | 4,387,041 | | Series 2014-C22(c) | | 0.96% | | 09/15/2057 | | | 143,033 | |
| | 2,700,000 | | Zephyrus Capital Aviation Tl | | 4.61% | | 10/15/2038 | | | 2,720,852 | |
| | | | | | | | | | | | |
| TOTAL NON-AGENCY COLLATERALIZED MORTGAGE OBLIGATIONS | | | | | | |
| (Cost $409,221,750) | | | | | | | 410,644,284 | |
| | | | | | | | | | | | |
| U.S. GOVERNMENT BONDS AND NOTES - 13.29% | | | | | | | | |
| | 5,780,000 | | U.S. Treasury Bonds | | 2.38% | | 05/15/2027 | | | 6,091,465 | |
| | 8,175,000 | | U.S. Treasury Bonds | | 2.25% | | 08/15/2027 | | | 8,548,304 | |
| | 7,310,000 | | U.S. Treasury Bonds | | 2.25% | | 11/15/2027 | | | 7,648,659 | |
| | 3,576,531 | | U.S. Treasury Bonds | | 0.88% | | 01/15/2029 | | | 3,803,936 | |
| | 640,000 | | U.S. Treasury Bonds | | 2.75% | | 11/15/2042 | | | 718,887 | |
| | 4,650,000 | | U.S. Treasury Bonds | | 3.13% | | 02/15/2043 | | | 5,551,119 | |
| | 3,720,000 | | U.S. Treasury Bonds | | 3.63% | | 08/15/2043 | | | 4,802,215 | |
| | 3,660,000 | | U.S. Treasury Bonds | | 3.75% | | 11/15/2043 | | | 4,818,762 | |
| | 7,005,522 | | U.S. Treasury Bonds | | 1.00% | | 02/15/2046 | | | 7,825,096 | |
| | 4,980,000 | | U.S. Treasury Bonds | | 2.75% | | 11/15/2047 | | | 5,646,269 | |
| | 50,000,000 | | U.S. Treasury Notes | | 1.50% | | 10/31/2019 | | | 49,976,000 | |
| | 25,000,000 | | U.S. Treasury Notes | | 1.00% | | 11/30/2019 | | | 24,957,239 | |
| | 50,000,000 | | U.S. Treasury Notes | | 1.50% | | 11/30/2019 | | | 49,955,045 | |
| | 4,380,000 | | U.S. Treasury Notes | | 2.75% | | 08/15/2021 | | | 4,466,402 | |
| | 10,160,000 | | U.S. Treasury Notes | | 2.88% | | 10/15/2021 | | | 10,409,634 | |
| | 11,455,000 | | U.S. Treasury Notes | | 1.75% | | 11/30/2021 | | | 11,482,519 | |
| | 3,910,000 | | U.S. Treasury Notes | | 2.50% | | 01/15/2022 | | | 3,986,291 | |
| | 8,590,000 | | U.S. Treasury Notes | | 2.63% | | 02/28/2023 | | | 8,888,637 | |
| | 7,080,000 | | U.S. Treasury Notes | | 2.50% | | 03/31/2023 | | | 7,304,569 | |
| | 6,940,000 | | U.S. Treasury Notes | | 2.75% | | 04/30/2023 | | | 7,223,022 | |
| | 5,730,000 | | U.S. Treasury Notes | | 1.63% | | 05/31/2023 | | | 5,742,758 | |
| | 2,960,000 | | U.S. Treasury Notes | | 1.88% | | 08/31/2024 | | | 3,004,458 | |
| | 7,310,000 | | U.S. Treasury Notes | | 2.13% | | 09/30/2024 | | | 7,504,886 | |
| | 8,045,000 | | U.S. Treasury Notes | | 2.25% | | 10/31/2024 | | | 8,311,333 | |
| | 3,820,000 | | U.S. Treasury Notes | | 2.75% | | 02/28/2025 | | | 4,051,140 | |
| | 5,150,000 | | U.S. Treasury Notes | | 3.00% | | 09/30/2025 | | | 5,559,485 | |
See Notes to Financial Statements.
| 66 | (888) 848-7569 | www.rivernorth.com |
| RiverNorth/DoubleLine Strategic Income Fund | Schedule of Investments |
September 30, 2019
| Principal Amount/Description | | Rate | | Maturity | | Value | |
| $ | 915,000 | | U.S. Treasury Notes | | 2.63% | | 01/31/2026 | | $ | 970,615 | |
| | | | | | | | | | | | |
| TOTAL U.S. GOVERNMENT BONDS AND NOTES | | | | | | | | |
| (Cost $263,119,516) | | | | | | | 269,248,745 | |
| | | | | | | | | | | | |
| MUNICIPAL BONDS - 0.02% | | | | | | | | |
| | 120,000 | | Missouri Highway & Transportation Commission, Revenue Bonds | | 5.06% | | 05/01/2024 | | | 135,325 | |
| | 165,000 | | State of California, General Obligation Bonds | | 7.55% | | 04/01/2039 | | | 273,323 | |
| | | | | | | | | | | | |
| TOTAL MUNICIPAL BONDS | | | | | | | | |
| (Cost $369,625) | | | | | | | 408,648 | |
| | | | | | | | | | | | |
| U.S. GOVERNMENT / AGENCY MORTGAGE BACKED SECURITIES - 10.70% | | | | |
| | | | Connecticut Avenue Securities Trust | | | | | | | | |
| | 5,000,000 | | Series 2019-R05(c)(e) | | 1M US L + 4.10% | | 07/25/2039 | | | 5,139,265 | |
| | | | Federal Home Loan Mortgage Corp. Multifamily Structured Pass-Through Certificates | | | | | | | | |
| | 16,100,000 | | Series 2013-K713(e) | | 0.10% | | 05/20/2020 | | | 7,395 | |
| | 7,400,000 | | Series 2013-K713(e)(g) | | 0.00% | | 05/25/2020 | | | 7,160,506 | |
| | 3,425,205 | | Series 2016-K722(c) | | 1.44% | | 03/25/2023 | | | 125,584 | |
| | | | Federal Home Loan Mortgage Corp. Pool | | | | | | | | |
| | 268,680 | | Series Pool #G01840 | | 5.00% | | 07/01/2035 | | | 297,117 | |
| | 101,233 | | Series Pool #G04817 | | 5.00% | | 09/01/2038 | | | 111,864 | |
| | | | Federal Home Loan Mortgage Corp. REMICS | | | | | | | | |
| | 1,336,497 | | Series 2003-2722(c) | | 9.89% - 1M US L | | 12/15/2033 | | | 1,632,354 | |
| | 250,499 | | Series 2005-R003 | | 5.50% | | 10/15/2035 | | | 282,742 | |
| | 1,805,299 | | Series 2006-3244(c) | | 6.66% - 1M US L | | 11/15/2036 | | | 347,492 | |
| | 87,905 | | Series 2007-3261(c) | | 6.43% - 1M US L | | 01/15/2037 | | | 15,407 | |
| | 201,262 | | Series 2007-3262(c) | | 6.40% - 1M US L | | 01/15/2037 | | | 27,712 | |
| | 791,241 | | Series 2007-3301(c) | | 6.10% - 1M US L | | 04/15/2037 | | | 88,981 | |
| | 599,676 | | Series 2007-3303(c) | | 6.10% - 1M US L | | 04/15/2037 | | | 85,023 | |
| | 199,543 | | Series 2007-3382(c) | | 6.00% - 1M US L | | 11/15/2037 | | | 17,636 | |
| | 500,825 | | Series 2007-3384(c) | | 6.31% - 1M US L | | 08/15/2036 | | | 73,953 | |
| | 193,217 | | Series 2007-3384(c) | | 6.39% - 1M US L | | 11/15/2037 | | | 23,709 | |
| | 236,444 | | Series 2008-3417(c) | | 6.18% - 1M US L | | 02/15/2038 | | | 23,703 | |
| | 256,754 | | Series 2008-3423(c) | | 5.65% - 1M US L | | 03/15/2038 | | | 28,844 | |
| | 5,068,370 | | Series 2008-3423(c) | | 6.00% - 1M US L | | 03/15/2038 | | | 38,757 | |
| | 1,779,161 | | Series 2009-3510(c) | | 6.75% - 1M US L | | 02/15/2037 | | | 351,342 | |
See Notes to Financial Statements.
| Annual Report | September 30, 2019 | 67 |
| RiverNorth/DoubleLine Strategic Income Fund | Schedule of Investments |
September 30, 2019
| Principal Amount/Description | | Rate | | Maturity | | Value | |
| $ | 435,338 | | Series 2009-3523(c) | | 6.00% - 1M US L | | 04/15/2039 | | $ | 70,034 | |
| | 85,936 | | Series 2009-3524 | | 3.60% | | 06/15/2038 | | | 88,841 | |
| | 16,515 | | Series 2009-3549(c) | | 5.80% - 1M US L | | 07/15/2039 | | | 1,647 | |
| | 1,047,469 | | Series 2009-3560(c) | | 6.40% - 1M US L | | 11/15/2036 | | | 138,460 | |
| | 411,793 | | Series 2010-3641 | | 4.50% | | 03/15/2040 | | | 453,589 | |
| | 508,372 | | Series 2010-3726(c) | | 6.05% - 1M US L | | 09/15/2040 | | | 81,853 | |
| | 2,670,170 | | Series 2010-3728(c) | | 4.45% - 1M US L | | 09/15/2040 | | | 211,891 | |
| | 750,000 | | Series 2010-3779 | | 3.50% | | 12/15/2030 | | | 790,061 | |
| | 162,994 | | Series 2010-3779 | | 4.00% | | 12/15/2030 | | | 173,459 | |
| | 499,324 | | Series 2010-3779 | | 4.50% | | 12/15/2040 | | | 556,378 | |
| | 78,997 | | Series 2011-3786(c) | | 9.50% - 1M US L | | 01/15/2041 | | | 92,584 | |
| | 1,294,867 | | Series 2011-3795 | | 4.00% | | 01/15/2041 | | | 1,382,530 | |
| | 69,792 | | Series 2011-3798(c) | | 9.50% - 1M US L | | 11/15/2040 | | | 74,805 | |
| | 539,876 | | Series 2011-3808 | | 3.50% | | 02/15/2031 | | | 559,762 | |
| | 39,198 | | Series 2011-3809(c) | | 9.50% - 1M US L | | 02/15/2041 | | | 43,075 | |
| | 920,911 | | Series 2011-3815(c) | | 5.85% - 1M US L | | 02/15/2041 | | | 139,084 | |
| | 449,127 | | Series 2011-3824 | | 3.50% | | 03/15/2031 | | | 474,955 | |
| | 511,014 | | Series 2011-3824(c) | | 7.10% - 1M US L | | 08/15/2036 | | | 79,406 | |
| | 585,919 | | Series 2011-3863 | | 5.50% | | 08/15/2034 | | | 646,422 | |
| | 646,114 | | Series 2011-3864(c) | | 9.20% - 1M US L | | 05/15/2041 | | | 776,133 | |
| | 647,198 | | Series 2011-3871 | | 5.50% | | 06/15/2041 | | | 746,622 | |
| | 613,926 | | Series 2011-3872(c) | | 5.95% - 1M US L | | 06/15/2041 | | | 85,159 | |
| | 2,993,592 | | Series 2011-3910 | | 5.00% | | 08/15/2041 | | | 3,427,536 | |
| | 2,867,269 | | Series 2011-3924(c) | | 6.00% - 1M US L | | 09/15/2041 | | | 390,034 | |
| | 392,684 | | Series 2011-3925 | | 3.00% | | 09/15/2021 | | | 7,932 | |
| | 3,969,978 | | Series 2012-3(c) | | 5.95% - 1M US L | | 02/25/2042 | | | 566,610 | |
| | 4,007,349 | | Series 2012-4057 | | 4.00% | | 06/15/2042 | | | 4,446,232 | |
| | 3,625,087 | | Series 2013-4170(c) | | 4.05% - 1M US L | | 01/15/2033 | | | 3,570,545 | |
| | 10,520,356 | | Series 2013-4218 | | 2.50% | | 02/15/2043 | | | 10,447,027 | |
| | 7,197,154 | | Series 2013-4239(g) | | 0.00% | | 07/15/2043 | | | 5,924,164 | |
| | 4,736,104 | | Series 2014-4413 | | 3.50% | | 11/15/2044 | | | 5,003,152 | |
| | 3,441,615 | | Series 2015-4434 | | 3.00% | | 02/15/2045 | | | 3,504,218 | |
| | 3,363,817 | | Series 2015-4440 | | 2.50% | | 02/15/2045 | | | 3,263,348 | |
| | | | Federal Home Loan Mortgage Corp. Strips | | | | | | | | |
| | 2,695,513 | | Series 2017-358 | | 3.00% | | 10/15/2047 | | | 2,769,152 | |
| | | | Federal National Mortgage Association Pool | | | | | | | | |
| | 74,733 | | Series Pool #555743 | | 5.00% | | 09/01/2033 | | | 82,545 | |
| | 90,768 | | Series Pool #735382 | | 5.00% | | 04/01/2035 | | | 100,274 | |
| | 244,897 | | Series Pool #735383 | | 5.00% | | 04/01/2035 | | | 270,541 | |
| | 165,893 | | Series Pool #735484 | | 5.00% | | 05/01/2035 | | | 183,238 | |
| | 81,049 | | Series Pool #AH4437 | | 4.00% | | 01/01/2041 | | | 83,814 | |
| | 4,293,811 | | Series Pool #BM4094 | | 3.00% | | 10/01/2046 | | | 4,334,964 | |
See Notes to Financial Statements.
| 68 | (888) 848-7569 | www.rivernorth.com |
| RiverNorth/DoubleLine Strategic Income Fund | Schedule of Investments |
September 30, 2019
| Principal Amount/Description | | Rate | | Maturity | | Value | |
| $ | 8,543,015 | | Series Pool #BM5299 | | 3.00% | | 12/01/2046 | | $ | 8,754,448 | |
| | 4,249,802 | | Series Pool #CA1875 | | 3.50% | | 06/01/2048 | | | 4,384,153 | |
| | 11,404,082 | | Series Pool #MA2777 | | 3.00% | | 03/01/2043 | | | 11,756,851 | |
| | | | Federal National Mortgage Association REMICS | | | | | | | | |
| | 87,338 | | Series 2004-46(c) | | 6.00% - 1M US L | | 03/25/2034 | | | 8,883 | |
| | 284,641 | | Series 2006-101(c) | | 6.58% - 1M US L | | 10/25/2036 | | | 56,417 | |
| | 845,341 | | Series 2006-123(c) | | 6.32% - 1M US L | | 01/25/2037 | | | 161,502 | |
| | 4,067,613 | | Series 2006-92(c) | | 6.58% - 1M US L | | 10/25/2036 | | | 815,392 | |
| | 101,065 | | Series 2007-102(c) | | 6.40% - 1M US L | | 11/25/2037 | | | 17,923 | |
| | 84,806 | | Series 2007-108(c) | | 6.36% - 1M US L | | 12/25/2037 | | | 9,962 | |
| | 18,388 | | Series 2007-30(c) | | 6.11% - 1M US L | | 04/25/2037 | | | 1,991 | |
| | 394,777 | | Series 2007-38(c) | | 6.08% - 1M US L | | 05/25/2037 | | | 43,674 | |
| | 12,122 | | Series 2007-51(c) | | 6.10% - 1M US L | | 06/25/2037 | | | 1,122 | |
| | 43,556 | | Series 2007-53(c) | | 6.10% - 1M US L | | 06/25/2037 | | | 4,002 | |
| | 568,885 | | Series 2007-57(c) | | 6.62% - 1M US L | | 10/25/2036 | | | 77,559 | |
| | 109,689 | | Series 2007-68(c) | | 6.65% - 1M US L | | 07/25/2037 | | | 7,013 | |
| | 658,712 | | Series 2008-3(c) | | 6.46% - 1M US L | | 02/25/2038 | | | 117,442 | |
| | 243,414 | | Series 2008-56(c) | | 6.06% - 1M US L | | 07/25/2038 | | | 28,629 | |
| | 54,375 | | Series 2008-81 | | 5.50% | | 09/25/2038 | | | 59,364 | |
| | 375,306 | | Series 2009-111 | | 5.00% | | 01/25/2040 | | | 413,802 | |
| | 176,085 | | Series 2009-111(c) | | 6.25% - 1M US L | | 01/25/2040 | | | 22,630 | |
| | 1,022,971 | | Series 2009-12(c) | | 6.60% - 1M US L | | 03/25/2036 | | | 176,721 | |
| | 34,307 | | Series 2009-28(c) | | 6.00% - 1M US L | | 04/25/2037 | | | 4,131 | |
| | 468,498 | | Series 2009-41 | | 4.50% | | 06/25/2039 | | | 489,007 | |
| | 98,306 | | Series 2009-42(c) | | 6.00% - 1M US L | | 06/25/2039 | | | 11,528 | |
| | 230,807 | | Series 2009-47(c) | | 6.10% - 1M US L | | 07/25/2039 | | | 26,420 | |
| | 139,563 | | Series 2009-62(c) | | 6.10% - 1M US L | | 08/25/2039 | | | 12,866 | |
| | 71,750 | | Series 2009-66(c) | | 5.80% - 1M US L | | 02/25/2038 | | | 8,877 | |
| | 50,584 | | Series 2009-68(c) | | 5.25% - 1M US L | | 09/25/2039 | | | 4,672 | |
| | 300,202 | | Series 2010-11(c) | | 4.80% - 1M US L | | 02/25/2040 | | | 26,183 | |
| | 43,798 | | Series 2010-111(c) | | 6.00% - 1M US L | | 10/25/2040 | | | 1,753 | |
| | 134,321 | | Series 2010-112 | | 4.00% | | 10/25/2040 | | | 137,511 | |
| | 183,964 | | Series 2010-115(c) | | 6.60% - 1M US L | | 11/25/2039 | | | 24,941 | |
| | 2,142,531 | | Series 2010-115(c) | | 6.00% - 1M US L | | 10/25/2040 | | | 393,011 | |
| | 4,984,679 | | Series 2010-123(c) | | 6.05% - 1M US L | | 11/25/2040 | | | 935,895 | |
| | 826,549 | | Series 2010-15(c) | | 4.95% - 1M US L | | 03/25/2040 | | | 89,917 | |
| | 129,835 | | Series 2010-34(c) | | 4.93% - 1M US L | | 04/25/2040 | | | 13,491 | |
| | 72,864 | | Series 2010-4(c) | | 6.23% - 1M US L | | 02/25/2040 | | | 10,895 | |
| | 110,447 | | Series 2010-58(c) | | 12.47% - 1M US L | | 06/25/2040 | | | 127,994 | |
| | 3,387,184 | | Series 2010-75 | | 4.50% | | 07/25/2040 | | | 3,657,649 | |
| | 255,000 | | Series 2010-9(c) | | 4.75% - 1M US L | | 02/25/2040 | | | 17,762 | |
| | 61,557 | | Series 2010-9(c) | | 5.30% - 1M US L | | 02/25/2040 | | | 7,137 | |
| | 15,042 | | Series 2010-90(c) | | 6.00% - 1M US L | | 08/25/2040 | | | 1,740 | |
See Notes to Financial Statements.
| Annual Report | September 30, 2019 | 69 |
| RiverNorth/DoubleLine Strategic Income Fund | Schedule of Investments |
September 30, 2019
| Principal Amount/Description | | Rate | | Maturity | | Value | |
| $ | 456,642 | | Series 2011-16 | | 3.50% | | 03/25/2031 | | $ | 479,531 | |
| | 723,708 | | Series 2011-25 | | 3.00% | | 04/25/2026 | | | 739,692 | |
| | 471,617 | | Series 2011-29 | | 3.50% | | 04/25/2031 | | | 487,341 | |
| | 306,666 | | Series 2011-48(c) | | 9.20% - 1M US L | | 06/25/2041 | | | 321,014 | |
| | 570,043 | | Series 2011-5(c) | | 6.40% - 1M US L | | 11/25/2040 | | | 40,292 | |
| | 3,947,196 | | Series 2012-106(c) | | 6.16% - 1M US L | | 10/25/2042 | | | 712,632 | |
| | 1,194,654 | | Series 2012-124(c) | | 7.79% - 1M US L | | 11/25/2042 | | | 1,282,288 | |
| | 9,795,601 | | Series 2012-128(c) | | 6.00% - 1M US L | | 11/25/2042 | | | 9,691,941 | |
| | 237,385 | | Series 2012-29(c) | | 6.00% - 1M US L | | 04/25/2042 | | | 21,390 | |
| | 917,183 | | Series 2012-32 | | 5.00% | | 04/25/2042 | | | 139,448 | |
| | 4,048,082 | | Series 2012-65(c) | | 5.98% - 1M US L | | 06/25/2042 | | | 580,292 | |
| | 3,290,061 | | Series 2013-19(c) | | 5.40% - 1M US L | | 03/25/2043 | | | 3,240,501 | |
| | 9,646,208 | | Series 2013-51(c) | | 5.40% - 1M US L | | 04/25/2043 | | | 9,288,436 | |
| | 2,277,493 | | Series 2015-59 | | 3.00% | | 06/25/2041 | | | 2,298,576 | |
| | 10,214,665 | | Series 2015-79 | | 3.00% | | 11/25/2045 | | | 10,276,033 | |
| | 1,880,177 | | Series 2015-9 | | 3.00% | | 01/25/2045 | | | 1,931,713 | |
| | 19,318,351 | | Series 2016-72 | | 3.00% | | 10/25/2046 | | | 18,990,409 | |
| | 3,499,379 | | Series 2018-21(g) | | 0.00% | | 04/25/2048 | | | 3,210,390 | |
| | 2,840,117 | | Series 2018-27 | | 3.00% | | 12/25/2047 | | | 2,878,169 | |
| | 3,235,902 | | Series 2018-36 | | 3.00% | | 06/25/2048 | | | 3,323,472 | |
| | 4,738,867 | | Series 2019-12 | | 3.00% | | 04/25/2049 | | | 4,897,110 | |
| | | | FMC GMSR Issuer Trust | | | | | | | | |
| | 500,000 | | Series 2019-GT1(c)(e) | | 5.66% | | 05/25/2024 | | | 517,258 | |
| | 5,000,000 | | Series 2019-GT2(c)(e) | | 4.72% | | 09/25/2024 | | | 5,044,340 | |
| | | | Government National Mortgage Association | | | | | | | | |
| | 63,509 | | Series 2004-83(c) | | 6.08% - 1M US L | | 10/20/2034 | | | 12,281 | |
| | 54,796 | | Series 2008-6(c) | | 6.46% - 1M US L | | 02/20/2038 | | | 6,518 | |
| | 51,269 | | Series 2008-67(c) | | 6.00% - 1M US L | | 08/20/2038 | | | 6,142 | |
| | 810,367 | | Series 2008-69(c) | | 7.63% - 1M US L | | 08/20/2038 | | | 133,195 | |
| | 69,654 | | Series 2009-10(c) | | 6.65% - 1M US L | | 02/16/2039 | | | 13,487 | |
| | 1,047,639 | | Series 2009-35 | | 4.50% | | 05/20/2039 | | | 1,145,742 | |
| | 4,162,315 | | Series 2009-58(c) | | 6.25% - 1M US L | | 06/20/2039 | | | 622,625 | |
| | 58,417 | | Series 2009-6(c) | | 5.95% - 1M US L | | 02/20/2038 | | | 6,312 | |
| | 1,983,078 | | Series 2009-75 | | 5.00% | | 09/20/2039 | | | 2,164,578 | |
| | 4,762,308 | | Series 2010-121(c) | | 6.00% - 1M US L | | 09/20/2040 | | | 872,995 | |
| | 81,461 | | Series 2010-61(c) | | 6.55% - 1M US L | | 09/20/2039 | | | 10,296 | |
| | 160,421 | | Series 2010-98(c) | | 5.71% | | 03/20/2039 | | | 18,984 | |
| | 671,324 | | Series 2011-69(g) | | 0.00% | | 05/20/2041 | | | 625,197 | |
| | 2,012,793 | | Series 2011-71 | | 4.50% | | 02/20/2041 | | | 2,179,336 | |
| | 1,303,290 | | Series 2011-71(c) | | 5.40% - 1M US L | | 05/20/2041 | | | 214,465 | |
| | 394,316 | | Series 2011-72(c) | | 6.15% - 1M US L | | 05/20/2041 | | | 63,478 | |
| | 2,113,092 | | Series 2011-89(c) | | 5.45% - 1M US L | | 06/20/2041 | | | 311,948 | |
| | 451,050 | | Series 2012-105(c) | | 6.20% - 1M US L | | 01/20/2041 | | | 19,380 | |
See Notes to Financial Statements.
| 70 | (888) 848-7569 | www.rivernorth.com |
| RiverNorth/DoubleLine Strategic Income Fund | Schedule of Investments |
September 30, 2019
| Principal Amount/Description | | Rate | | Maturity | | Value | |
| $ | 5,905,199 | | Series 2013-113(c) | | 6.25% - 1M US L | | 03/20/2043 | | $ | 797,959 | |
| | 7,776,712 | | Series 2013-122(c) | | 6.10% - 1M US L | | 08/16/2043 | | | 1,365,920 | |
| | 4,667,824 | | Series 2013-148(c) | | 5.68% - 1M US L | | 10/16/2043 | | | 821,136 | |
| | 8,446,638 | | Series 2013-186(c) | | 6.25% - 1M US L | | 02/16/2043 | | | 1,096,754 | |
| | 5,285,901 | | Series 2014-156(c) | | 6.25% - 1M US L | | 10/20/2044 | | | 864,530 | |
| | 10,562,826 | | Series 2014-4(c) | | 6.10% - 1M US L | | 01/16/2044 | | | 1,836,451 | |
| | 7,256,486 | | Series 2014-5(c) | | 6.15% - 1M US L | | 07/20/2043 | | | 975,711 | |
| | 6,353,643 | | Series 2014-95(c) | | 6.25% - 1M US L | | 06/16/2044 | | | 1,230,478 | |
| | 8,560,504 | | Series 2018-153(c) | | 6.15% - 1M US L | | 11/20/2048 | | | 1,072,242 | |
| | 23,779,174 | | Series 2018-164(c) | | 6.10% - 1M US L | | 12/20/2048 | | | 3,473,702 | |
| | 20,472,379 | | Series 2018-97(c) | | 6.20% - 1M US L | | 07/20/2048 | | | 3,061,313 | |
| | 22,083,406 | | Series 2019-92(c) | | 6.10% - 1M US L | | 07/20/2049 | | | 2,922,226 | |
| | | | Toorak Mortgage Corp., Ltd. | | | | | | | | |
| | 3,500,000 | | Series 2019-2(k) | | 4.21% | | 09/25/2022 | | | 3,531,570 | |
| | | | | | | | | | | | |
| TOTAL U.S. GOVERNMENT / AGENCY MORTGAGE BACKED SECURITIES | | | | | | | | |
| (Cost $261,228,168) | | | | | | | 216,713,541 | |
| Shares/Description | | Value | |
| WARRANTS - 0.00%(m) | | | | |
| | 219,520 | | Oas SA, Strike Price 1.00, Expires 05/16/2039(i) | | | 0 | |
| | | | | | | | |
| TOTAL WARRANTS | | | | |
| (Cost $0) | | | | 0 | |
| | | | | | | | |
| SHORT-TERM INVESTMENTS - 9.15% | | | | |
| Money Market Fund - 5.08% | | | | |
| | 102,812,472 | | State Street Institutional Trust (7 Day Yield 1.95%) | | | 102,812,472 | |
| Principal Amount/Description | | Rate | | Maturity | | Value | |
| U.S. Treasury - 4.07% | | | | | | | | |
| | 365,000 | | United States Treasury Bill(n) | | 2.29% | | 11/07/2019 | | | 364,357 | |
| | 7,300,000 | | United States Treasury Bill(n) | | 1.75% | | 09/10/2020 | | | 7,180,546 | |
| | 75,000,000 | | United States Treasury Bill(n) | | 1.97% | | 10/29/2019 | | | 74,890,771 | |
| | | | | | | | | | | 82,435,674 | |
| | | | | | | | | | | | |
| TOTAL SHORT-TERM INVESTMENTS | | | | | | | | |
| (Cost $185,238,909) | | | | | | | 185,248,146 | |
| | | | | | | | | | | | |
TOTAL INVESTMENTS-100.29% | | | | | | | | |
| (Cost $2,059,218,585) | | | | | | | 2,031,039,619 | |
| LIABILITIES IN EXCESS OF OTHER ASSETS - (0.29)% | | | | | | | (5,794,858 | ) |
| NET ASSETS - 100.00% | | | | $ | 2,025,244,761 | |
See Notes to Financial Statements.
| Annual Report | September 30, 2019 | 71 |
| RiverNorth/DoubleLine Strategic Income Fund | Schedule of Investments |
September 30, 2019
Investment Abbreviations:
LIBOR - London Interbank Offered Rate
Libor Rates:
1M US L - 1 Month LIBOR as of September 30, 2019 was 2.02%
3M US L - 3 Month LIBOR as of September 30, 2019 was 2.09%
| (a) | Affiliated company. See Note 9 to Notes to Financial Statements. |
| (b) | Security has no contractual maturity date, is not redeemable and contractually pays an indefinite stream of interest. |
| (c) | Variable rate investment. Interest rates reset periodically. Interest rate shown reflects the rate in effect at September 30, 2019. For securities based on a published reference rate and spread, the reference rate and spread are indicated in the description above. Certain variable rate securities are not based on a published reference rate and spread but are determined by the issuer or agent and are based on current market conditions. These securities do not indicate a reference rate and spread in their description above. |
| (d) | Securities were purchased pursuant to Regulation S under the Securities Act of 1933, which exempts securities offered and sold outside of the United States from registration. Such securities cannot be sold in the United States without either an effective registration statement filed pursuant to the Securities Act of 1933, or pursuant to an exemption from registration. These securities have been deemed liquid under procedures approved by the Fund's Board of Trustees. As of September 30, 2019, the aggregate fair value of those securities was $49,642,356, representing 2.45% of net assets. |
| (e) | Security exempt from registration under Rule 144A of the Securities Act of 1933. These securities have been deemed liquid under procedures approved by the Fund's Board of Trustees and may normally be sold to qualified institutional buyers in transactions exempt from registration. Total fair value of Rule 144A securities amounts to $343,794,891, which represents approximately 16.98% of net assets as of September 30, 2019. |
| (f) | Pay-in-kind securities - Rate paid in-kind is shown in parenthesis. |
| (g) | Issued with a zero coupon. Income is recognized through the accretion of discount. |
| (i) | The level 3 assets were a result of unavailable quoted prices from an active market or the unavailability of other significant observable inputs. |
| (j) | All or a portion of this position has not settled as of September 30, 2019. The interest rate shown represents the stated spread over the London Interbank Offered Rate ("LIBOR" or "L") or the Euro Interbank Offered Rate ("EURIBOR" or "E") or the applicable LIBOR/EURIBOR floor; the Fund will not accrue interest until the settlement date, at which point LIBOR/EURIBOR will be established. |
| (k) | Step bond. Coupon changes periodically based upon a predetermined schedule. Interest rate disclosed is that which is in effect at September 30, 2019. |
| (l) | When - Issued Security/Forward Commitment Security. |
| (m) | Non-income producing security. |
| (n) | Rate shown represents the bond equivalent yield to maturity at date of purchase. |
See Notes to Financial Statements.
| 72 | (888) 848-7569 | www.rivernorth.com |
| RiverNorth/Oaktree High Income Fund | Schedule of Investments |
September 30, 2019
| Shares/Description | | | Value | |
| CLOSED-END FUNDS - 19.64% | | | | |
| | 24,266 | | BlackRock Corporate High Yield Fund, Inc. | | $ | 260,860 | |
| | 16,571 | | BlackRock Debt Strategies Fund, Inc. | | | 178,138 | |
| | 68,069 | | BlackRock Floating Rate Income Strategies Fund, Inc. | | | 859,031 | |
| | 36,542 | | BrandywineGLOBAL - Global Income Opportunities Fund, Inc. | | | 442,158 | |
| | 38,883 | | Eaton Vance Floating-Rate Income Trust | | | 514,033 | |
| | 41,314 | | Eaton Vance Limited Duration Income Fund | | | 516,425 | |
| | 43,457 | | First Trust Senior Floating Rate 2022 Target Term Fund | | | 384,594 | |
| | 244,466 | | Invesco Senior Income Trust | | | 1,026,757 | |
| | 192,170 | | Nuveen Credit Strategies Income Fund | | | 1,437,432 | |
| | 31,758 | | Nuveen Mortgage Opportunity Term Fund | | | 732,340 | |
| | 49,877 | | PGIM Global High Yield Fund, Inc. | | | 716,733 | |
| | 42,554 | | PGIM High Yield Bond Fund, Inc. | | | 636,182 | |
| | 19,415 | | Western Asset Emerging Markets Debt Fund, Inc. | | | 269,674 | |
| | 59,317 | | Western Asset Global High Income Fund, Inc. | | | 589,018 | |
| | 297,666 | | Western Asset High Income Opportunity Fund, Inc. | | | 1,503,213 | |
| | | | | | | | |
| TOTAL CLOSED-END FUNDS | | | | |
| (Cost $9,975,536) | | | 10,066,588 | |
| | | | | | | | |
| COMMON STOCKS - 0.06% | | | | |
| | 999 | | David's Bridal(a)(b) | | | – | |
| | 2,343 | | PHI Group, Inc.(a)(b) | | | 24,039 | |
| | 599 | | Phi, Inc.(a)(b) | | | 6,146 | |
| | 3,002 | | Ultra Petroleum Corp.(b) | | | 675 | |
| | | | | | | | |
| TOTAL COMMON STOCKS | | | | |
| (Cost $216,146) | | | 30,860 | |
| | | | | | | |
| PREFERRED STOCKS - 0.18% | | | | |
| | 11 | | Ditech Holding Corp., 0.000%(a)(b)(c)(d) | | | – | |
| | 92 | | Sequa Corp., 7.000%(a)(b) | | | 92,000 | |
| | | | | | | | |
| TOTAL PREFERRED STOCKS | | | | |
| (Cost $111,004) | | | 92,000 | |
| Principal Amount/Description | | Rate | | Maturity | | | Value | |
| BANK LOANS - 38.24%(e) | | | | | | | | |
| Canada - 0.58% | | | | | | | | |
| $ | 296,662 | | GFL Environmental, Inc., First Lien Effective Date Incremental Term Loan | | 1M US L + 3.00%, 1.00% Floor | | 05/30/2025 | | | 294,623 | |
See Notes to Financial Statements.
| Annual Report | September 30, 2019 | 73 |
| RiverNorth/Oaktree High Income Fund | Schedule of Investments |
September 30, 2019
| Principal Amount/Description | | Rate | | Maturity | | Value | |
| Denmark - 0.66% | | | | | | | | |
| $ | 229,305 | | Nets Holdco 4 ApS, First Lien Facility B1E Term Loan | | 3M EUR L + 3.25% | | 02/06/2025 | | $ | 248,614 | |
| | 81,941 | | TDC A/S, First Lien Facility B3 Term Loan | | 1M EUR L + 2.75% | | 06/04/2025 | | | 89,916 | |
| | | | | | | | | | | 338,530 | |
| Finland - 0.21% | | | | | | | | |
| | 100,000 | | Mascot Bidco Oy, First Lien Facility B Term Loan | | 3M EUR L + 4.50% | | 03/30/2026 | | | 109,421 | |
| | | | | | | | | | | | |
| France - 1.42% | | | | | | | | |
| | 99,250 | | Altice France S.A., First Lien USD TLB-13 Incremental Term Loan | | 1M US L + 4.00% | | 08/14/2026 | | | 99,188 | |
| | 100,000 | | CAB, First Lien Facility B Term Loan | | 3M EUR L + 3.75% | | 04/25/2026 | | | 109,728 | |
| | 300,000 | | Constantin Investissement 4 S.A.S., First Lien Facility B Term Loan | | 3M EUR L + 3.00% | | 04/22/2024 | | | 328,314 | |
| | 195,500 | | Numericable U.S. LLC, First Lien USD TLB-11 Term Loan | | 1M US L + 2.75% | | 07/31/2025 | | | 191,223 | |
| | | | | | | | | | | 728,453 | |
| Germany - 1.30% | | | | | | | | |
| | 190,000 | | Alpha Group, SARL, First Lien Facility B Term Loan | | 3M EUR L + 3.75% | | 01/31/2025 | | | 205,969 | |
| | 120,000 | | Befesa S.A., First Lien Facility B Term Loan | | 6M EUR L + 2.50% | | 07/09/2026 | | | 132,573 | |
| | 157,130 | | CTC AcquiCo GmbH, First Lien Facility B2 Term Loan | | 3M US L + 2.75% | | 03/07/2025 | | | 153,987 | |
| | 59,145 | | EG Group Limited Tlb1, First Lien Term Loan | | L + 3.50% | | 07/31/2025 | | | 65,190 | |
| | 100,000 | | Marcel Lux IV SARL, First Lien Facility B2 (EUR) Term Loan | | 3M EUR L + 3.50% | | 03/16/2026 | | | 109,186 | |
| | | | | | | | | | | 666,905 | |
| Great Britain - 3.18% | | | | | | | | |
| | 98,997 | | EG Group, Ltd., First Lien Facility B (EUR) Term Loan | | 3M US L + 4.00% | | 02/07/2025 | | | 105,899 | |
| | 175,772 | | Formula One Management, Ltd., First Lien Facility B3 Term Loan | | 1M US L + 2.50%, 1.00% Floor | | 02/01/2024 | | | 173,970 | |
| | 210,000 | | Franklin UK Midco, Ltd., First Lien Facility B1 Term Loan | | 3M EUR L + 4.00% | | 12/18/2024 | | | 231,465 | |
| | 130,000 | | Froneri International PLC, First Lien Facility B3 Term Loan | | 1M US L + 3.25% | | 01/31/2025 | | | 160,290 | |
| | 300,000 | | Genesis Specialist Care Finance UK, Ltd., First Lien Facility B2 Term Loan | | 3M EUR L + 3.50% | | 10/30/2025 | | | 330,392 | |
| | 181,182 | | Lernen Bidco, Ltd., First Lien Facility B1 (EUR) Term Loan | | 6M EUR L + 4.25% | | 10/25/2025 | | | 200,442 | |
| | 250,000 | | LGC Science Holdings, Ltd., First Lien Facility B3 Term Loan | | 1M US L + 3.50% | | 03/08/2023 | | | 248,229 | |
See Notes to Financial Statements.
| 74 | (888) 848-7569 | www.rivernorth.com |
| RiverNorth/Oaktree High Income Fund | Schedule of Investments |
September 30, 2019
| Principal Amount/Description | | Rate | | Maturity | | Value | |
| $ | 149,837 | | Richmond UK Holdco, Ltd., First Lien Facility B Term Loan | | 1M US L + 4.25% | | 03/03/2024 | | $ | 179,318 | |
| | | | | | | | | | | 1,630,005 | |
| Luxembourg - 1.49% | | | | | | | | |
| | 147,375 | | Altice Financing S.A., First Lien October 2017 USD Term Loan | | 1M US L + 2.75% | | 01/31/2026 | | | 144,022 | |
| | 80,000 | | Auris Luxembourg III S.a r.l., First Lien Facility B1A Term Loan | | 3M US L + 4.00% | | 02/27/2026 | | | 88,019 | |
| | 190,000 | | CCP Lux Holdings S.a. r.l., First Lien Senior EUR Facility B Term Loan | | 3M EUR L + 3.75% | | 01/10/2025 | | | 209,162 | |
| | 300,000 | | Neuraxpharm Holdco S.A.R.L., First Lien Facility B2 Term Loan | | 3M EUR L + 3.75% | | 08/24/2023 | | | 322,901 | |
| | | | | | | | | | | 764,104 | |
| Netherlands - 1.73% | | | | | | | | |
| | 216,150 | | Diamond B.V., First Lien Initial Euro Term Loan | | 3M EUR L + 3.25% | | 09/06/2024 | | | 229,017 | |
| | 39,700 | | NEP Group, Inc., First Lien Initial Euro Term Loan | | 3M EUR L + 3.50% | | 10/20/2025 | | | 43,271 | |
| | 283,418 | | Peer Holdings III B.V., First Lien Facility B Term Loan | | 3M EUR L + 3.25% | | 03/07/2025 | | | 310,281 | |
| | 250,000 | | Sigma Holdco B.V., First Lien Facility B4 (GBP) Term Loan | | 1M US L + 4.00% | | 07/02/2025 | | | 304,440 | |
| | | | | | | | | | | 887,009 | |
| Sweden - 0.43% | | | | | | | | |
| | 200,000 | | Verisure Holding AB, First Lien Facility B1F Term Loan | | 3M EUR L + 3.50% | | 10/21/2022 | | | 219,422 | |
| | | | | | | | | | | | |
| United States - 27.24% | | | | | | | | |
| | 246,458 | | Access CIG LLC, First Lien B Term Loan | | 1M US L + 3.75% | | 02/27/2025 | | | 243,840 | |
| | 336,238 | | Acuity Specialty Products, Inc., First Lien Initial Term Loan | | 3M US L + 4.00%, 1.00% Floor | | 08/12/2024 | | | 266,327 | |
| | 148,125 | | Adtalem Global Education, Inc., First Lien B Term Loan | | 1M US L + 3.00% | | 04/11/2025 | | | 148,743 | |
| | 39,000 | | AI Aqua Merger Sub, Inc., First Lien Tranche B-1 Term Loan | | 1M US L + 3.25%, 1.00% Floor | | 12/13/2023 | | | 37,359 | |
| | 195,504 | | Air Medical Group Holdings, Inc., First Lien 2018 Term Loan | | 1M US L + 3.25%, 1.00% Floor | | 04/28/2022 | | | 183,489 | |
| | 43,612 | | Allnex & Cy S.C.A., First Lien Tranche B-2 Term Loan | | 3M US L + 3.25%, 0.75% Floor | | 09/13/2023 | | | 41,731 | |
| | 243,072 | | American Renal Holdings, Inc., First Lien B Term Loan | | 1M US L + 5.00% | | 06/21/2024 | | | 237,224 | |
| | 238,342 | | American Rock Salt Company LLC, First Lien Initial Term Loan | | 1M US L + 3.75%, 1.00% Floor | | 03/21/2025 | | | 238,641 | |
| | 148,125 | | Amynta Agency Borrower, Inc., First Lien B Term Loan | | 1M US L + 4.50% | | 02/28/2025 | | | 144,299 | |
See Notes to Financial Statements.
| Annual Report | September 30, 2019 | 75 |
| RiverNorth/Oaktree High Income Fund | Schedule of Investments |
September 30, 2019
| Principal Amount/Description | | Rate | | Maturity | | Value | |
| $ | 147,000 | | Applied Systems, Inc., First Lien Closing Date Term Loan | | 3M US L + 3.00%, 1.00% Floor | | 09/19/2024 | | $ | 146,959 | |
| | 144,245 | | Asurion LLC, First Lien Amendment No. 14 Replacement B-4 Term Loan | | 1M US L + 3.00% | | 08/04/2022 | | | 144,966 | |
| | 248,125 | | Atlantic Aviation FBO, Inc., First Lien B Term Loan | | 1M US L + 3.75% | | 12/06/2025 | | | 250,296 | |
| | 96,446 | | Avantor Funding, Inc., First Lien Initial B-2 Euro Term Loan | | 1M EUR L + 3.25% | | 11/21/2024 | | | 106,445 | |
| | 167,538 | | Aveanna Healthcare LLC, First Lien Initial Term Loan | | 1M US L + 4.25%, 1.00% Floor | | 03/18/2024 | | | 165,261 | |
| | 147,000 | | Badger Finance LLC, First Lien 2018 Refinancing Term Loan | | 1M US L + 3.50%, 1.00% Floor | | 09/30/2024 | | | 126,420 | |
| | 181,170 | | BCP Renaissance Parent LLC, First Lien Initial Term Loan | | 3M US L + 3.50%, 1.00% Floor | | 10/31/2024 | | | 173,471 | |
| | 197,000 | | Beacon Roofing Supply, Inc., First Lien Initial Term Loan | | 1M US L + 2.25% | | 01/02/2025 | | | 196,795 | |
| | 147,375 | | Belron Finance US LLC, First Lien Initial B Term Loan | | 3M US L + 2.25% | | 11/07/2024 | | | 148,020 | |
| | 98,000 | | Big River Steel LLC, First Lien Closing Date Term Loan | | 3M US L + 5.00%, 1.00% Floor | | 08/23/2023 | | | 97,510 | |
| | 245,634 | | Boing US Holdco, Inc., First Lien B Term Loan | | 1M US L + 3.25%, 1.00% Floor | | 10/03/2024 | | | 241,132 | |
| | 83,684 | | Boyd Gaming Corp., First Lien Refinancing B Term Loan | | 1W US L + 2.25% | | 09/15/2023 | | | 84,050 | |
| | 247,500 | | Bracket Intermediate Holding Corp., First Lien Initial Term Loan | | 3M US L + 4.25% | | 09/05/2025 | | | 247,036 | |
| | 248,126 | | Brookfield WEC Holdings, Inc., First Lien Initial Term Loan | | 1M US L + 3.50%, 0.75% Floor | | 08/01/2025 | | | 249,228 | |
| | 245,625 | | Caesars Resort Collection LLC, First Lien B Term Loan | | 1M US L + 2.75% | | 12/23/2024 | | | 244,290 | |
| | 43,483 | | Camelot U.S. Acquisition 1 Co., First Lien New Term Loan | | 1M US L + 3.25%, 1.00% Floor | | 10/03/2023 | | | 43,805 | |
| | 119,807 | | Canyon Valor Companies, Inc., First Lien Initial Dollar Term Loan | | 3M US L + 2.75% | | 06/16/2023 | | | 119,807 | |
| | 127,400 | | Canyon Valor Companies, Inc., First Lien Initial Euro Term Loan | | 3M EUR L + 3.00% | | 06/16/2023 | | | 139,034 | |
| | 219,616 | | Cengage Learning, Inc., First Lien 2016 Refinancing Term Loan | | 1M US L + 4.25%, 1.00% Floor | | 06/07/2023 | | | 208,575 | |
| | 248,125 | | CentralSquare Technologies LLC, First Lien Initial Term Loan | | 1M US L + 3.75% | | 08/29/2025 | | | 233,238 | |
| | 294,750 | | CenturyLink, Inc., First Lien Initial B Term Loan | | 1M US L + 2.75% | | 01/31/2025 | | | 293,195 | |
| | 105,243 | | CEOC LLC, First Lien B Term Loan | | 1M US L + 2.00% | | 10/07/2024 | | | 105,308 | |
| | 245,625 | | Charter Communications Operating LLC, First Lien B Term Loan | | 1M US L + 2.00% | | 04/30/2025 | | | 247,391 | |
| | 98,489 | | Charter NEX US, Inc., First Lien Initial Term Loan | | 1M US L + 3.00%, 1.00% Floor | | 05/16/2024 | | | 97,689 | |
See Notes to Financial Statements.
| 76 | (888) 848-7569 | www.rivernorth.com |
| RiverNorth/Oaktree High Income Fund | Schedule of Investments |
September 30, 2019
| Principal Amount/Description | | Rate | | Maturity | | Value | |
| $ | 149,248 | | CHG Healthcare Services, Inc., First Lien 2017 New Term Loan | | 1M US L + 3.00%, 1.00% Floor | | 06/07/2023 | | $ | 149,389 | |
| | 148,125 | | Cogeco Communications II LP, First Lien B Term Loan | | 1M US L + 2.25% | | 01/03/2025 | | | 148,403 | |
| | 246,875 | | Covia Holdings Corp., First Lien Initial Term Loan | | 3M US L + 4.00%, 1.00% Floor | | 06/01/2025 | | | 202,634 | |
| | 173,430 | | Cypress Intermediate Holdings III, Inc., First Lien Initial Term Loan | | 1M US L + 2.75%, 1.00% Floor | | 04/29/2024 | | | 172,934 | |
| | 11,635 | | David's Bridal, Inc., First Lien Priority Term Loan(a) | | L + 7.50%, 1.00% Floor | | 07/18/2023 | | | 9,308 | |
| | 44,211 | | David's Bridal, Inc. Takeback Tl(a) | | L + 8.00% | | 01/17/2024 | | | 11,053 | |
| | 147,751 | | EG Group, Ltd., First Lien Additional Facility Term Loan | | 3M US L + 4.00% | | 02/07/2025 | | | 146,329 | |
| | 97,253 | | ExamWorks Group, Inc., First Lien B-1 Term Loan | | 1M US L + 3.25%, 1.00% Floor | | 07/27/2023 | | | 97,760 | |
| | 97,727 | | Explorer Holdings, Inc., First Lien Initial Term Loan | | 3M US L + 3.75%, 1.00% Floor | | 05/02/2023 | | | 97,681 | |
| | 246,875 | | Flynn Restaurant Group LP, First Lien Initial Term Loan | | 1M US L + 3.50% | | 06/27/2025 | | | 238,029 | |
| | 125,000 | | Flynn Restaurant Group LP, Second Lien Initial Term Loan | | 1M US L + 7.00% | | 06/29/2026 | | | 120,521 | |
| | 247,500 | | Franklin Square Holdings LP, First Lien Initial Term Loan | | 1M US L + 2.50% | | 08/01/2025 | | | 248,738 | |
| | 137,335 | | Gentiva Health Services, Inc., First Lien Closing Date Initial Term Loan | | 1M US L + 3.75% | | 07/02/2025 | | | 138,279 | |
| | 216,562 | | Globallogic Holdings, Inc., First Lien Initial Term Loan | | 1M US L + 3.25% | | 08/01/2025 | | | 217,645 | |
| | 206,454 | | Golden Nugget, Inc., First Lien Initial B Term Loan | | 1M US L + 2.75%, 0.75% Floor | | 10/04/2023 | | | 206,519 | |
| | 129,861 | | Graftech International, Ltd., First Lien Initial Term Loan | | 1M US L + 3.50%, 1.00% Floor | | 02/12/2025 | | | 126,668 | |
| | 161,756 | | Greeneden U.S. Holdings I LLC, First Lien Tranche B-3 Dollar Term Loan | | 1M US L + 3.25% | | 12/01/2023 | | | 161,081 | |
| | 98,250 | | Greenrock Finance, Inc., First Lien Initial USD B Term Loan | | 3M US L + 3.50%, 1.00% Floor | | 06/28/2024 | | | 98,419 | |
| | 148,125 | | Hub International, Ltd., First Lien Initial Term Loan | | 3M US L + 3.00% | | 04/25/2025 | | | 146,652 | |
| | 8,250 | | Innoviva, INC., First Lien Initial Term Loan | | 3M US L + 4.50%, 1.00% Floor | | 08/18/2022 | | | 8,126 | |
| | 657,524 | | Jaguar Holding Company I LLC, First Lien 2018 Term Loan | | 1M US L + 2.50%, 1.00% Floor | | 08/18/2022 | | | 658,793 | |
| | 99,500 | | JBS USA Lux S.A., First Lien New Term Loan | | 1M US L + 2.50% | | 05/01/2026 | | | 100,081 | |
| | 77,800 | | Learfield Communications LLC, First Lien Initial Term Loan | | 1M US L + 3.25%, 1.00% Floor | | 12/01/2023 | | | 78,170 | |
| | 230,146 | | Life Time Fitness, Inc., First Lien 2017 Refinancing Term Loan | | 3M US L + 2.75%, 1.00% Floor | | 06/10/2022 | | | 230,499 | |
See Notes to Financial Statements.
| Annual Report | September 30, 2019 | 77 |
| RiverNorth/Oaktree High Income Fund | Schedule of Investments |
September 30, 2019
| Principal Amount/Description | | Rate | | Maturity | | Value | |
| $ | 291,471 | | McAfee LLC, First Lien B USD Term Loan | | 1M US L + 3.75% | | 09/30/2024 | | $ | 292,481 | |
| | 496,250 | | Natgasoline LLC, First Lien Initial Term Loan | | 3M US L + 3.50% | | 11/14/2025 | | | 496,870 | |
| | 246,263 | | NVA Holdings, Inc., First Lien B-3 Term Loan | | 1M US L + 2.75%, 1.00% Floor | | 02/02/2025 | | | 246,288 | |
| | 97,500 | | Onvoy LLC, First Lien Initial Term Loan | | 1M US L + 4.50%, 1.00% Floor | | 02/10/2024 | | | 81,778 | |
| | 144,000 | | OpenLink International Holdings, Inc., First Lien Replacement Euro Term Loan | | 1M EUR L + 3.75%, 1.00% Floor | | 03/21/2025 | | | 156,887 | |
| | 147,977 | | PetVet Care Centers LLC, First Lien Initial Term Loan(f) | | 1M US L + 2.75% | | 02/14/2025 | | | 143,723 | |
| | 97,753 | | Playa Resorts Holding B.V., First Lien Initial Term Loan | | 1M US L + 2.75%, 1.00% Floor | | 04/29/2024 | | | 95,309 | |
| | 235,898 | | Recess Holdings, Inc., First Lien Initial Term Loan | | 1M US L + 3.75%, 1.00% Floor | | 09/30/2024 | | | 232,877 | |
| | 99,250 | | Refinitiv US Holdings, Inc., First Lien Initial Euro Term Loan | | 6M EUR L + 4.00% | | 10/01/2025 | | | 109,628 | |
| | 194,650 | | Ring Container Technologies Group LLC, First Lien Initial Term Loan | | 1M US L + 2.75% | | 10/31/2024 | | | 193,372 | |
| | 92,773 | | RPI Finance Trust, First Lien Initial B -6 Term Loan | | 1M US L + 2.00% | | 03/27/2023 | | | 93,367 | |
| | 147,750 | | Scientific Games International, Inc., First Lien Initial B-5 Term Loan | | 2M US L + 2.75% | | 08/14/2024 | | | 146,716 | |
| | 248,125 | | Sedgwick Claims Management Services, Inc., First Lien Initial Term Loan | | 1M US L + 3.25% | | 12/31/2025 | | | 244,383 | |
| | 241,006 | | St. George's University Scholastic Services LLC, First Lien Term Loan | | 1M US L + 3.50% | | 07/17/2025 | | | 241,760 | |
| | 147,375 | | Strategic Materials Holding Corp., First Lien Initial Term Loan | | 1M US L + 3.75%, 1.00% Floor | | 11/01/2024 | | | 130,427 | |
| | 87,994 | | Trans Union LLC, First Lien 2017 Replacement B-3 Term Loan | | 1M US L + 2.00% | | 04/10/2023 | | | 88,404 | |
| | 440,106 | | Transdigm, Inc., First Lien 2018 New Tranche E Term Loan | | 1M US L + 2.50% | | 05/30/2025 | | | 438,930 | |
| | 248,750 | | Tunnel Hill Partners LP, First Lien Initial Term Loan | | 1M US L + 3.50% | | 02/06/2026 | | | 247,974 | |
| | 292,714 | | Uniti Group, Inc., First Lien Shortfall Term Loan | | 1M US L + 5.00%, 1.00% Floor | | 10/24/2022 | | | 286,082 | |
| | 146,863 | | Utex Industries, Inc., First Lien Initial Term Loan | | 1M US L + 4.00%, 1.00% Floor | | 05/21/2021 | | | 125,567 | |
| | 35,761 | | Vestcom Parent Holdings, Inc., First Lien L/C Collaterilized Term Loan | | 1M US L + 4.00%, 1.00% Floor | | 12/19/2023 | | | 33,705 | |
| | 227,681 | | Windstream Services LLC, First Lien 2016 Tranche B-6 Term Loan(g) | | 1M US L + 4.00%, 0.75% Floor | | 03/29/2021 | | | 231,974 | |
See Notes to Financial Statements.
| 78 | (888) 848-7569 | www.rivernorth.com |
| RiverNorth/Oaktree High Income Fund | Schedule of Investments |
September 30, 2019
| Principal Amount/Description | | Rate | | Maturity | | Value | �� |
| $ | 132,684 | | YI LLC, First Lien Initial Term Loan | | 3M US L + 4.00%, 1.00% Floor | | 11/07/2024 | | $ | 132,353 | |
| | | | | | | | | | | 13,956,140 | |
| | | | | | | | | | | | |
| TOTAL BANK LOANS | | | | | | | | |
| (Cost $20,194,311) | | | | | | | 19,594,612 | |
| | | | | | | | | | | | |
| HIGH YIELD DEBT- 31.66% | | | | | | | | |
| Australia - 0.27% | | | | | | | | |
| | 40,000 | | Mineral Resources, Ltd.(h) | | 8.13% | | 05/01/2027 | | | 41,272 | |
| | 100,000 | | Nufarm Australia, Ltd. / Nufarm Americas, Inc.(h) | | 5.75% | | 04/30/2026 | | | 99,250 | |
| | | | | | | | | | | 140,522 | |
| Canada - 0.97% | | | | | | | | |
| | 5,000 | | Baytex Energy Corp.(h) | | 5.63% | | 06/01/2024 | | | 4,625 | |
| | 65,000 | | Cascades, Inc.(h) | | 5.50% | | 07/15/2022 | | | 66,137 | |
| | 36,000 | | Cascades, Inc.(h) | | 5.75% | | 07/15/2023 | | | 36,630 | |
| | 60,000 | | Eldorado Gold Corp.(h) | | 9.50% | | 06/01/2024 | | | 65,100 | |
| | 25,000 | | First Quantum Minerals, Ltd.(h) | | 7.25% | | 05/15/2022 | | | 24,886 | |
| | 20,000 | | First Quantum Minerals, Ltd.(h) | | 7.25% | | 04/01/2023 | | | 19,800 | |
| | 25,000 | | GFL Environmental, Inc.(h) | | 5.63% | | 05/01/2022 | | | 25,687 | |
| | 15,000 | | GFL Environmental, Inc.(h) | | 5.38% | | 03/01/2023 | | | 15,260 | |
| | 80,000 | | goeasy, Ltd.(h) | | 7.88% | | 11/01/2022 | | | 83,400 | |
| | 40,000 | | Mercer International, Inc. | | 5.50% | | 01/15/2026 | | | 38,650 | |
| | 4,722 | | Precision Drilling Corp. | | 6.50% | | 12/15/2021 | | | 4,651 | |
| | 35,000 | | Precision Drilling Corp. | | 7.75% | | 12/15/2023 | | | 34,176 | |
| | 15,000 | | Precision Drilling Corp.(h) | | 7.13% | | 01/15/2026 | | | 13,950 | |
| | 65,000 | | Vermilion Energy, Inc.(h) | | 5.63% | | 03/15/2025 | | | 62,400 | |
| | | | | | | | | | | 495,352 | |
| Cayman Islands - 0.22% | | | | | | | | |
| | 110,000 | | Global Aircraft Leasing Co., Ltd.(h)(i) | | 6.50% (7.25%) | | 09/15/2024 | | | 111,650 | |
| | | | | | | | | | | | |
| Denmark - 0.23% | | | | | | | | |
| | 100,000 | | DKT Finance ApS(j) | | 7.00% | | 06/17/2023 | | | 116,905 | |
| | | | | | | | | | | | |
| Finland - 0.08% | | | | | | | | |
| | 40,000 | | Nokia Oyj | | 4.38% | | 06/12/2027 | | | 41,900 | |
| | | | | | | | | | | | |
| France - 0.59% | | | | | | | | |
| | 60,000 | | Altice France SA(j) | | 5.63% | | 05/15/2024 | | | 67,421 | |
| | 100,000 | | Altice France SA(j) | | 5.88% | | 02/01/2027 | | | 120,872 | |
| | 100,000 | | Constantin Investissement 3 SASU(j) | | 5.38% | | 04/15/2025 | | | 112,747 | |
| | | | | | | | | | | 301,040 | |
See Notes to Financial Statements.
| Annual Report | September 30, 2019 | 79 |
| RiverNorth/Oaktree High Income Fund | Schedule of Investments |
September 30, 2019
| Principal Amount/Description | | Rate | | Maturity | | Value | |
| Germany - 0.92% | | | | | | | | |
| $ | 120,000 | | Nidda Healthcare Holding GmbH(j) | | 3.50% | | 09/30/2024 | | $ | 136,115 | |
| | 100,000 | | Techem Verwaltungsgesellschaft 674 mbH(j) | | 6.00% | | 07/30/2026 | | | 118,253 | |
| | 100,000 | | Tele Columbus AG(j) | | 3.88% | | 05/02/2025 | | | 104,587 | |
| | 100,000 | | WEPA Hygieneprodukte GmbH(j) | | 3.75% | | 05/15/2024 | | | 111,250 | |
| | | | | | | | | | | 470,205 | |
| Great Britain - 0.51% | | | | | | | | |
| | 100,000 | | Arqiva Broadcast Finance PLC | | 6.75% | | 09/30/2023 | | | 131,634 | |
| | 100,000 | | Nomad Foods Bondco PLC(j) | | 3.25% | | 05/15/2024 | | | 112,645 | |
| | 20,000 | | Tronox Finance PLC(h) | | 5.75% | | 10/01/2025 | | | 19,015 | |
| | | | | | | | | | | 263,294 | |
| Ireland - 0.66% | | | | | | | | |
| | 200,000 | | Ardagh Packaging Finance PLC /Ardagh Holdings USA, Inc.(h) | | 5.25% | | 08/15/2027 | | | 203,000 | |
| | 10,000 | | Avolon Holdings Funding, Ltd.(h) | | 5.50% | | 01/15/2023 | | | 10,695 | |
| | 100,000 | | Virgin Media Receivables Financing Notes I DAC(j) | | 5.50% | | 09/15/2024 | | | 126,121 | |
| | | | | | | | | | | 339,816 | |
| Italy - 1.33% | | | | | | | | |
| | 100,000 | | Bormioli Pharma Bidco SpA(e)(j) | | 3M EUR L + 3.50% | | 11/15/2024 | | | 95,229 | |
| | 100,000 | | Guala Closures SpA(e)(h) | | 3M EUR L + 3.50% | | 04/15/2024 | | | 110,667 | |
| | 100,000 | | LKQ Italia Bondco SpA(j) | | 3.88% | | 04/01/2024 | | | 123,492 | |
| | 120,000 | | Nexi Capital SpA(h) | | 4.13% | | 11/01/2023 | | | 134,508 | |
| | 200,000 | | Telecom Italia SpA(h) | | 5.30% | | 05/30/2024 | | | 216,440 | |
| | | | | | | | | | | 680,336 | |
| Jersey - 0.47% | | | | | | | | |
| | 100,000 | | CPUK Finance, Ltd.(j) | | 4.25% | | 08/28/2022 | | | 125,288 | |
| | 100,000 | | LHC3 PLC(h)(i) | | 4.13% (9.00%) | | 08/15/2024 | | | 113,799 | |
| | | | | | | | | | | 239,087 | |
| Luxembourg - 1.16% | | | | | | | | |
| | 105,000 | | Altice Luxembourg SA(j) | | 6.25% | | 02/15/2025 | | | 119,815 | |
| | 35,000 | | Connect Finco SARL / Connect US Finco LLC(h) | | 6.75% | | 10/01/2026 | | | 35,700 | |
| | 85,000 | | Dana Financing Luxembourg Sarl(h) | | 5.75% | | 04/15/2025 | | | 87,197 | |
| | 100,000 | | Samsonite Finco Sarl(j) | | 3.50% | | 05/15/2026 | | | 110,758 | |
| | 100,000 | | SES SA | | 5.63% | | 12/31/2069 | | | 123,270 | |
| | 100,000 | | Telenet Finance Luxembourg Notes Sarl(j) | | 3.50% | | 03/01/2028 | | | 117,808 | |
| | | | | | | | | | | 594,548 | |
| Netherlands - 1.13% | | | | | | | | |
| | 10,000 | | Alcoa Nederland Holding BV(h) | | 6.13% | | 05/15/2028 | | | 10,674 | |
| | 100,000 | | Intertrust Group BV(j) | | 3.38% | | 11/15/2025 | | | 115,003 | |
| | 100,000 | | InterXion Holding NV(h) | | 4.75% | | 06/15/2025 | | | 118,396 | |
| | 100,000 | | Sigma Holdco BV(j) | | 5.75% | | 05/15/2026 | | | 108,227 | |
See Notes to Financial Statements.
| 80 | (888) 848-7569 | www.rivernorth.com |
| RiverNorth/Oaktree High Income Fund | Schedule of Investments |
September 30, 2019
| Principal Amount/Description | | Rate | | Maturity | | Value |
| $ | 100,000 | | Trivium Packaging Finance BV(h) | | 3.75% | | 08/15/2026 | | $ | 115,603 | |
| | 100,000 | | Ziggo Bond Co. BV(j) | | 4.63% | | 01/15/2025 | | | 112,429 | |
| | | | | | | | | | | 580,332 | |
| Spain - 0.22% | | | | | | | | |
| | 100,000 | | Grifols SA(j) | | 3.20% | | 05/01/2025 | | | 112,276 | |
| | | | | | | | | | | | |
| Sweden - 0.22% | | | | | | | | |
| | 100,000 | | Verisure Midholding AB(j) | | 5.75% | | 12/01/2023 | | | 112,688 | |
| | | | | | | | | | | | |
| Switzerland - 0.20% | | | | | | | | |
| | 90,000 | | UPCB Finance IV, Ltd.(j) | | 4.00% | | 01/15/2027 | | | 103,930 | |
| | | | | | | | | | | | |
| United States - 22.48% | | | | | | | | |
| | 65,000 | | Acadia Healthcare Co., Inc. | | 5.13% | | 07/01/2022 | | | 65,731 | |
| | 10,000 | | Acadia Healthcare Co., Inc. | | 5.63% | | 02/15/2023 | | | 10,238 | |
| | 55,000 | | Acadia Healthcare Co., Inc. | | 6.50% | | 03/01/2024 | | | 57,475 | |
| | 50,000 | | ACCO Brands Corp.(h) | | 5.25% | | 12/15/2024 | | | 51,875 | |
| | 35,000 | | Acrisure LLC / Acrisure Finance, Inc.(h) | | 10.13% | | 08/01/2026 | | | 36,662 | |
| | 20,000 | | Adient US LLC(h) | | 7.00% | | 05/15/2026 | | | 20,950 | |
| | 80,000 | | AES Corp. | | 6.00% | | 05/15/2026 | | | 85,200 | |
| | 40,000 | | Albertsons Cos. Inc / Safeway, Inc. / New Albertsons LP / Albertsons LLC | | 5.75% | | 03/15/2025 | | | 41,400 | |
| | 60,000 | | Albertsons Cos. Inc / Safeway, Inc. / New Albertsons LP / Albertsons LLC(h) | | 7.50% | | 03/15/2026 | | | 67,050 | |
| | 35,000 | | Albertsons Cos. Inc / Safeway, Inc. / New Albertsons LP / Albertsons LLC(h) | | 5.88% | | 02/15/2028 | | | 37,133 | |
| | 45,000 | | Allied Universal Holdco LLC / Allied Universal Finance Corp.(h) | | 6.63% | | 07/15/2026 | | | 47,644 | |
| | 85,000 | | AmeriGas Partners LP / AmeriGas Finance Corp. | | 5.63% | | 05/20/2024 | | | 91,428 | |
| | 20,000 | | Aramark Services, Inc. | | 5.13% | | 01/15/2024 | | | 20,700 | |
| | 15,000 | | Aramark Services, Inc.(h) | | 5.00% | | 02/01/2028 | | | 15,600 | |
| | 40,000 | | Archrock Partners LP / Archrock Partners Finance Corp.(h) | | 6.88% | | 04/01/2027 | | | 42,648 | |
| | 45,000 | | Ascent Resources Utica Holdings LLC / ARU Finance Corp.(h) | | 7.00% | | 11/01/2026 | | | 37,800 | |
| | 41,000 | | Avis Budget Car Rental LLC / Avis Budget Finance, Inc. | | 5.50% | | 04/01/2023 | | | 41,769 | |
| | 100,000 | | Axalta Coating Systems LLC(j) | | 4.25% | | 08/15/2024 | | | 112,649 | |
| | 35,000 | | B&G Foods, Inc. | | 5.25% | | 04/01/2025 | | | 35,875 | |
| | 5,000 | | Bausch Health Americas, Inc.(h) | | 8.50% | | 01/31/2027 | | | 5,624 | |
| | 227,000 | | Bausch Health Cos., Inc.(h) | | 6.13% | | 04/15/2025 | | | 236,080 | |
| | 55,000 | | Bausch Health Cos., Inc.(h) | | 7.00% | | 01/15/2028 | | | 59,378 | |
See Notes to Financial Statements.
| Annual Report | September 30, 2019 | 81 |
| RiverNorth/Oaktree High Income Fund | Schedule of Investments |
September 30, 2019
| Principal Amount/Description | | Rate | | Maturity | | Value |
| $ | 35,000 | | BBA US Holdings, Inc.(h) | | 5.38% | | 05/01/2026 | | $ | 36,837 | |
| | 30,000 | | Berry Petroleum Co. LLC(h) | | 7.00% | | 02/15/2026 | | | 28,875 | |
| | 20,000 | | BMC East LLC(h) | | 5.50% | | 10/01/2024 | | | 20,857 | |
| | 95,000 | | Boyd Gaming Corp. | | 6.38% | | 04/01/2026 | | | 101,056 | |
| | 10,000 | | Boyd Gaming Corp. | | 6.00% | | 08/15/2026 | | | 10,587 | |
| | 55,000 | | Brookfield Property REIT, Inc. / BPR Cumulus LLC / BPR Nimbus LLC / GGSI Sellco LL(h) | | 5.75% | | 05/15/2026 | | | 57,681 | |
| | 25,000 | | Builders FirstSource, Inc.(h) | | 6.75% | | 06/01/2027 | | | 27,062 | |
| | 30,000 | | Cablevision Systems Corp. | | 8.00% | | 04/15/2020 | | | 30,937 | |
| | 10,000 | | Callon Petroleum Co. | | 6.13% | | 10/01/2024 | | | 9,900 | |
| | 60,000 | | Callon Petroleum Co. | | 6.38% | | 07/01/2026 | | | 58,851 | |
| | 90,000 | | Cardtronics, Inc. / Cardtronics USA, Inc.(h) | | 5.50% | | 05/01/2025 | | | 91,800 | |
| | 55,000 | | Carriage Services, Inc.(h) | | 6.63% | | 06/01/2026 | | | 56,622 | |
| | 100,000 | | Catalent Pharma Solutions, Inc.(j) | | 4.75% | | 12/15/2024 | | | 112,533 | |
| | 30,000 | | CCO Holdings LLC / CCO Holdings Capital Corp.(h) | | 5.88% | | 04/01/2024 | | | 31,379 | |
| | 30,000 | | CCO Holdings LLC / CCO Holdings Capital Corp.(h) | | 5.50% | | 05/01/2026 | | | 31,497 | |
| | 45,000 | | CCO Holdings LLC / CCO Holdings Capital Corp.(h) | | 5.00% | | 02/01/2028 | | | 46,631 | |
| | 15,000 | | CCO Holdings LLC / CCO Holdings Capital Corp.(h) | | 5.38% | | 06/01/2029 | | | 16,012 | |
| | 110,000 | | CCO Holdings LLC / CCO Holdings Capital Corp.(h) | | 4.75% | | 03/01/2030 | | | 111,788 | |
| | 20,000 | | Cedar Fair LP(h) | | 5.25% | | 07/15/2029 | | | 21,475 | |
| | 25,000 | | Centene Corp. | | 6.13% | | 02/15/2024 | | | 26,099 | |
| | 50,000 | | Central Garden & Pet Co. | | 5.13% | | 02/01/2028 | | | 51,250 | |
| | 45,000 | | CenturyLink, Inc. | | 7.50% | | 04/01/2024 | | | 50,438 | |
| | 75,000 | | CenturyLink, Inc. | | 5.63% | | 04/01/2025 | | | 78,000 | |
| | 45,000 | | Chaparral Energy, Inc.(h) | | 8.75% | | 07/15/2023 | | | 18,225 | |
| | 60,000 | | Cheniere Corpus Christi Holdings LLC | | 7.00% | | 06/30/2024 | | | 69,075 | |
| | 35,000 | | Cheniere Corpus Christi Holdings LLC | | 5.13% | | 06/30/2027 | | | 38,412 | |
| | 30,000 | | Cheniere Energy Partners LP | | 5.25% | | 10/01/2025 | | | 31,320 | |
| | 35,000 | | Cheniere Energy Partners LP(h) | | 4.50% | | 10/01/2029 | | | 35,941 | |
| | 60,000 | | Chesapeake Energy Corp. | | 7.00% | | 10/01/2024 | | | 43,275 | |
| | 15,000 | | Chesapeake Energy Corp. | | 8.00% | | 01/15/2025 | | | 10,912 | |
| | 35,000 | | Churchill Downs, Inc.(h) | | 5.50% | | 04/01/2027 | | | 37,100 | |
| | 20,000 | | Citgo Holding, Inc.(h) | | 9.25% | | 08/01/2024 | | | 21,300 | |
| | 130,000 | | CITGO Petroleum Corp.(h) | | 6.25% | | 08/15/2022 | | | 131,950 | |
| | 15,000 | | Clean Harbors, Inc.(h) | | 5.13% | | 07/15/2029 | | | 15,937 | |
| | 95,000 | | Clearway Energy Operating LLC | | 5.38% | | 08/15/2024 | | | 97,731 | |
| | 15,000 | | Clearway Energy Operating LLC | | 5.00% | | 09/15/2026 | | | 15,413 | |
| | 5,000 | | CommScope Technologies LLC(h) | | 6.00% | | 06/15/2025 | | | 4,537 | |
See Notes to Financial Statements.
| 82 | (888) 848-7569 | www.rivernorth.com |
| RiverNorth/Oaktree High Income Fund | Schedule of Investments |
September 30, 2019
| Principal Amount/Description | | Rate | | Maturity | | Value |
| $ | 30,000 | | CommScope Technologies LLC(h) | | 5.00% | | 03/15/2027 | | $ | 24,900 | |
| | 70,000 | | CommScope, Inc.(h) | | 5.50% | | 03/01/2024 | | | 72,362 | |
| | 75,000 | | CommScope, Inc.(h) | | 5.50% | | 06/15/2024 | | | 70,851 | |
| | 50,000 | | Comstock Resources, Inc. | | 9.75% | | 08/15/2026 | | | 42,000 | |
| | 100,000 | | Cott Corp.(j) | | 5.50% | | 07/01/2024 | | | 113,778 | |
| | 100,000 | | Covanta Holding Corp. | | 6.00% | | 01/01/2027 | | | 105,750 | |
| | 65,000 | | CrownRock LP / CrownRock Finance, Inc.(h) | | 5.63% | | 10/15/2025 | | | 65,649 | |
| | 100,000 | | DaVita, Inc. | | 5.13% | | 07/15/2024 | | | 101,875 | |
| | 50,000 | | Diamond Sports Group LLC / Diamond Sports Finance Co.(h) | | 5.38% | | 08/15/2026 | | | 52,000 | |
| | 60,000 | | Diamond Sports Group LLC / Diamond Sports Finance Co.(h) | | 6.63% | | 08/15/2027 | | | 62,313 | |
| | 35,000 | | DISH DBS Corp. | | 7.75% | | 07/01/2026 | | | 35,752 | |
| | 38,371 | | Ditech Holding Corp.(a)(g)(i)(k) | | 9.00% (1.80%) | | 12/31/2024 | | | – | |
| | 105,000 | | Eldorado Resorts, Inc. | | 6.00% | | 04/01/2025 | | | 111,037 | |
| | 23,000 | | Encompass Health Corp. | | 5.75% | | 11/01/2024 | | | 23,327 | |
| | 75,000 | | Encompass Health Corp. | | 4.50% | | 02/01/2028 | | | 76,012 | |
| | 100,000 | | Energizer Gamma Acquisition BV(j) | | 4.63% | | 07/15/2026 | | | 115,562 | |
| | 100,000 | | Equinix, Inc. | | 2.88% | | 02/01/2026 | | | 113,738 | |
| | 125,000 | | ESH Hospitality, Inc.(h) | | 5.25% | | 05/01/2025 | | | 129,531 | |
| | 50,000 | | Extraction Oil & Gas, Inc.(h) | | 7.38% | | 05/15/2024 | | | 33,000 | |
| | 45,000 | | FirstCash, Inc.(h) | | 5.38% | | 06/01/2024 | | | 46,575 | |
| | 25,000 | | Forum Energy Technologies, Inc. | | 6.25% | | 10/01/2021 | | | 20,875 | |
| | 70,000 | | Frontier Communications Corp.(h) | | 8.50% | | 04/01/2026 | | | 70,168 | |
| | 35,000 | | Frontier Communications Corp.(h) | | 8.00% | | 04/01/2027 | | | 37,002 | |
| | 35,000 | | Go Daddy Operating Co. LLC / GD Finance Co, Inc.(h) | | 5.25% | | 12/01/2027 | | | 36,925 | |
| | 110,000 | | Golden Nugget, Inc.(h) | | 6.75% | | 10/15/2024 | | | 113,025 | |
| | 45,000 | | Greystar Real Estate Partners LLC(h) | | 5.75% | | 12/01/2025 | | | 46,406 | |
| | 70,000 | | Grinding Media, Inc. / Moly-Cop AltaSteel, Ltd.(h) | | 7.38% | | 12/15/2023 | | | 67,200 | |
| | 70,000 | | Gulfport Energy Corp. | | 6.63% | | 05/01/2023 | | | 54,950 | |
| | 60,000 | | H&E Equipment Services, Inc. | | 5.63% | | 09/01/2025 | | | 61,989 | |
| | 45,000 | | HAT Holdings I LLC / HAT Holdings II LLC(h) | | 5.25% | | 07/15/2024 | | | 47,419 | |
| | 115,000 | | HCA, Inc. | | 5.38% | | 02/01/2025 | | | 125,925 | |
| | 35,000 | | HCA, Inc. | | 5.88% | | 02/15/2026 | | | 39,217 | |
| | 40,000 | | HCA, Inc. | | 5.38% | | 09/01/2026 | | | 44,048 | |
| | 70,000 | | Herc Holdings, Inc.(h) | | 5.50% | | 07/15/2027 | | | 72,975 | |
| | 60,000 | | HUB International, Ltd.(h) | | 7.00% | | 05/01/2026 | | | 61,875 | |
| | 100,000 | | Hunt Cos., Inc.(h) | | 6.25% | | 02/15/2026 | | | 98,250 | |
| | 40,000 | | IAA, Inc.(h) | | 5.50% | | 06/15/2027 | | | 42,300 | |
| | 110,000 | | iHeartCommunications, Inc.(h) | | 5.25% | | 08/15/2027 | | | 114,675 | |
| | 45,000 | | Ingles Markets, Inc. | | 5.75% | | 06/15/2023 | | | 46,069 | |
See Notes to Financial Statements.
| Annual Report | September 30, 2019 | 83 |
| RiverNorth/Oaktree High Income Fund | Schedule of Investments |
September 30, 2019
| Principal Amount/Description | | Rate | | Maturity | | Value |
| $ | 50,000 | | Intelsat Jackson Holdings SA(h) | | 8.00% | | 02/15/2024 | | $ | 52,062 | |
| | 100,000 | | IQVIA, Inc.(j) | | 2.88% | | 09/15/2025 | | | 112,251 | |
| | 105,000 | | Iron Mountain, Inc.(h) | | 4.88% | | 09/15/2029 | | | 106,869 | |
| | 30,000 | | Itron, Inc.(h) | | 5.00% | | 01/15/2026 | | | 30,984 | |
| | 105,000 | | Jaguar Holding Co. II / Pharmaceutical Product Development LLC(h) | | 6.38% | | 08/01/2023 | | | 108,806 | |
| | 35,000 | | JBS USA LUX SA / JBS USA Finance, Inc.(h) | | 6.50% | | 04/15/2029 | | | 38,938 | |
| | 55,000 | | JBS USA LUX SA / JBS USA Food Co. / JBS USA Finance, Inc.(h) | | 5.50% | | 01/15/2030 | | | 58,436 | |
| | 90,000 | | KAR Auction Services, Inc.(h) | | 5.13% | | 06/01/2025 | | | 93,600 | |
| | 135,000 | | Kennedy-Wilson, Inc. | | 5.88% | | 04/01/2024 | | | 139,177 | |
| | 75,000 | | Lamar Media Corp. | | 5.75% | | 02/01/2026 | | | 79,575 | |
| | 25,000 | | Laredo Petroleum, Inc. | | 5.63% | | 01/15/2022 | | | 23,625 | |
| | 30,000 | | Laredo Petroleum, Inc. | | 6.25% | | 03/15/2023 | | | 26,475 | |
| | 30,000 | | Level 3 Financing, Inc. | | 5.13% | | 05/01/2023 | | | 30,423 | |
| | 55,000 | | Level 3 Financing, Inc. | | 5.38% | | 01/15/2024 | | | 56,229 | |
| | 50,000 | | Level 3 Financing, Inc.(h) | | 4.63% | | 09/15/2027 | | | 50,578 | |
| | 60,000 | | Matador Resources Co. | | 5.88% | | 09/15/2026 | | | 60,414 | |
| | 140,000 | | Mauser Packaging Solutions Holding Co.(h) | | 5.50% | | 04/15/2024 | | | 144,872 | |
| | 25,000 | | MEDNAX, Inc.(h) | | 5.25% | | 12/01/2023 | | | 25,475 | |
| | 60,000 | | MEDNAX, Inc.(h) | | 6.25% | | 01/15/2027 | | | 59,696 | |
| | 50,000 | | Mercer International, Inc. | | 7.38% | | 01/15/2025 | | | 52,205 | |
| | 45,000 | | Mercer International, Inc.(h) | | 7.38% | | 01/15/2025 | | | 46,985 | |
| | 95,000 | | MGM Resorts International | | 5.50% | | 04/15/2027 | | | 104,343 | |
| | 105,000 | | MPH Acquisition Holdings LLC(h) | | 7.13% | | 06/01/2024 | | | 97,256 | |
| | 30,000 | | MPT Operating Partnership LP / MPT Finance Corp. | | 5.50% | | 05/01/2024 | | | 30,825 | |
| | 45,000 | | Nabors Industries, Inc. | | 5.50% | | 01/15/2023 | | | 37,238 | |
| | 25,000 | | Nationstar Mortgage Holdings, Inc.(h) | | 8.13% | | 07/15/2023 | | | 26,125 | |
| | 70,000 | | NCR Corp. | | 6.38% | | 12/15/2023 | | | 72,100 | |
| | 35,000 | | NCR Corp.(h) | | 5.75% | | 09/01/2027 | | | 36,356 | |
| | 40,000 | | NCR Corp.(h) | | 6.13% | | 09/01/2029 | | | 42,312 | |
| | 40,000 | | New Enterprise Stone & Lime Co., Inc.(h) | | 6.25% | | 03/15/2026 | | | 41,000 | |
| | 35,000 | | Nexstar Escrow, Inc.(h) | | 5.63% | | 07/15/2027 | | | 36,750 | |
| | 85,000 | | Novelis Corp.(h) | | 6.25% | | 08/15/2024 | | | 89,038 | |
| | 40,000 | | Novelis Corp.(h) | | 5.88% | | 09/30/2026 | | | 42,050 | |
| | 19,000 | | Oasis Petroleum, Inc. | | 6.88% | | 03/15/2022 | | | 17,813 | |
| | 30,000 | | Oasis Petroleum, Inc. | | 6.88% | | 01/15/2023 | | | 27,600 | |
| | 20,000 | | Oasis Petroleum, Inc.(h) | | 6.25% | | 05/01/2026 | | | 16,300 | |
| | 65,000 | | Olin Corp. | | 5.00% | | 02/01/2030 | | | 65,348 | |
| | 40,000 | | Outfront Media Capital LLC / Outfront Media Capital Corp. | | 5.63% | | 02/15/2024 | | | 41,300 | |
See Notes to Financial Statements.
| 84 | (888) 848-7569 | www.rivernorth.com |
| RiverNorth/Oaktree High Income Fund | Schedule of Investments |
September 30, 2019
| Principal Amount/Description | | Rate | | Maturity | | Value |
| $ | 20,000 | | Outfront Media Capital LLC / Outfront Media Capital Corp.(h) | | 5.00% | | 08/15/2027 | | $ | 21,050 | |
| | 15,000 | | PDC Energy, Inc. | | 6.13% | | 09/15/2024 | | | 15,000 | |
| | 55,000 | | PDC Energy, Inc. | | 5.75% | | 05/15/2026 | | | 54,318 | |
| | 40,000 | | Performance Food Group, Inc.(h) | | 5.50% | | 06/01/2024 | | | 41,000 | |
| | 45,000 | | Performance Food Group, Inc.(h) | | 5.50% | | 10/15/2027 | | | 47,475 | |
| | 55,000 | | Pilgrim's Pride Corp.(h) | | 5.75% | | 03/15/2025 | | | 57,063 | |
| | 125,000 | | Plantronics, Inc.(h) | | 5.50% | | 05/31/2023 | | | 125,625 | |
| | 60,000 | | Platform Specialty Products Corp.(h) | | 5.88% | | 12/01/2025 | | | 63,096 | |
| | 60,000 | | Post Holdings, Inc.(h) | | 5.50% | | 03/01/2025 | | | 63,075 | |
| | 10,000 | | Post Holdings, Inc.(h) | | 5.00% | | 08/15/2026 | | | 10,409 | |
| | 70,000 | | Prestige Brands, Inc.(h) | | 6.38% | | 03/01/2024 | | | 73,150 | |
| | 16,000 | | Prime Security Services Borrower LLC / Prime Finance, Inc.(h) | | 9.25% | | 05/15/2023 | | | 16,851 | |
| | 70,000 | | Prime Security Services Borrower LLC / Prime Finance, Inc.(h) | | 5.75% | | 04/15/2026 | | | 73,066 | |
| | 35,000 | | PTC, Inc. | | 6.00% | | 05/15/2024 | | | 36,750 | |
| | 35,000 | | Quicken Loans, Inc.(h) | | 5.75% | | 05/01/2025 | | | 36,269 | |
| | 100,000 | | Refinitiv US Holdings, Inc.(h) | | 4.50% | | 05/15/2026 | | | 117,677 | |
| | 58,146 | | Reynolds Group Issuer, Inc. / Reynolds Group Issuer LLC / Reynolds Group Issuer Lu | | 5.75% | | 10/15/2020 | | | 58,341 | |
| | 70,000 | | Reynolds Group Issuer, Inc. / Reynolds Group Issuer LLC / Reynolds Group Issuer Lu(h) | | 7.00% | | 07/15/2024 | | | 72,669 | |
| | 25,000 | | Reynolds Group Issuer, Inc. / Reynolds Group Issuer, LLC(h) | | 5.13% | | 07/15/2023 | | | 25,656 | |
| | 55,000 | | Ryman Hospitality Properties, Inc.(h) | | 4.75% | | 10/15/2027 | | | 56,721 | |
| | 120,000 | | Scientific Games International, Inc.(j) | | 3.38% | | 02/15/2026 | | | 134,134 | |
| | 100,000 | | Silgan Holdings, Inc. | | 3.25% | | 03/15/2025 | | | 111,988 | |
| | 90,000 | | Sirius XM Radio, Inc.(h) | | 4.63% | | 07/15/2024 | | | 93,540 | |
| | 35,000 | | Sirius XM Radio, Inc.(h) | | 5.38% | | 04/15/2025 | | | 36,400 | |
| | 5,000 | | Sirius XM Radio, Inc.(h) | | 5.50% | | 07/01/2029 | | | 5,350 | |
| | 15,000 | | SM Energy Co. | | 6.13% | | 11/15/2022 | | | 14,450 | |
| | 20,000 | | SM Energy Co. | | 5.00% | | 01/15/2024 | | | 18,050 | |
| | 30,000 | | SM Energy Co. | | 5.63% | | 06/01/2025 | | | 25,869 | |
| | 10,000 | | Southwestern Energy Co. | | 4.95% | | 01/23/2025 | | | 8,900 | |
| | 20,000 | | Southwestern Energy Co. | | 7.75% | | 10/01/2027 | | | 17,538 | |
| | 75,000 | | Sprint Communications, Inc. | | 11.50% | | 11/15/2021 | | | 87,469 | |
| | 100,000 | | Sprint Communications, Inc. | | 6.00% | | 11/15/2022 | | | 106,500 | |
| | 85,000 | | Sprint Corp. | | 7.88% | | 09/15/2023 | | | 93,582 | |
| | 50,000 | | Sprint Corp. | | 7.13% | | 06/15/2024 | | | 54,015 | |
| | 70,000 | | SS&C Technologies, Inc.(h) | | 5.50% | | 09/30/2027 | | | 73,283 | |
| | 45,000 | | Standard Industries, Inc.(h) | | 5.50% | | 02/15/2023 | | | 46,013 | |
| | 40,000 | | Stevens Holding Co., Inc.(h) | | 6.13% | | 10/01/2026 | | | 42,750 | |
See Notes to Financial Statements.
| Annual Report | September 30, 2019 | 85 |
| RiverNorth/Oaktree High Income Fund | Schedule of Investments |
September 30, 2019
| Principal Amount/Description | | Rate | | Maturity | | Value |
| $ | 30,000 | | Suburban Propane Partners LP/Suburban Energy Finance Corp. | | 5.50% | | 06/01/2024 | | $ | 30,750 | |
| | 65,000 | | Suburban Propane Partners LP/Suburban Energy Finance Corp. | | 5.75% | | 03/01/2025 | | | 66,570 | |
| | 65,000 | | Summit Materials LLC / Summit Materials Finance Corp. | | 6.13% | | 07/15/2023 | | | 66,463 | |
| | 30,000 | | Summit Materials LLC / Summit Materials Finance Corp.(h) | | 5.13% | | 06/01/2025 | | | 30,825 | |
| | 60,000 | | SunCoke Energy Partners LP / SunCoke Energy Partners Finance Corp.(h) | | 7.50% | | 06/15/2025 | | | 53,625 | |
| | 5,000 | | Talen Energy Supply LLC(h) | | 7.25% | | 05/15/2027 | | | 5,106 | |
| | 25,000 | | Talen Energy Supply LLC(h) | | 6.63% | | 01/15/2028 | | | 24,688 | |
| | 35,000 | | Targa Resources Partners LP / Targa Resources Partners Finance Corp. | | 5.88% | | 04/15/2026 | | | 37,100 | |
| | 30,000 | | Targa Resources Partners LP / Targa Resources Partners Finance Corp. | | 5.38% | | 02/01/2027 | | | 31,163 | |
| | 70,000 | | Tenet Healthcare Corp. | | 6.75% | | 06/15/2023 | | | 73,775 | |
| | 120,000 | | Tenet Healthcare Corp. | | 5.13% | | 05/01/2025 | | | 121,956 | |
| | 25,000 | | Tenet Healthcare Corp.(h) | | 6.25% | | 02/01/2027 | | | 26,029 | |
| | 15,000 | | Tenet Healthcare Corp.(h) | | 5.13% | | 11/01/2027 | | | 15,519 | |
| | 35,000 | | Tennant Co. | | 5.63% | | 05/01/2025 | | | 36,575 | |
| | 50,000 | | Tenneco, Inc. | | 5.38% | | 12/15/2024 | | | 43,750 | |
| | 35,000 | | T-Mobile USA, Inc. | | 6.00% | | 04/15/2024 | | | 36,400 | |
| | 55,000 | | Tms International Holding Corp.(h) | | 7.25% | | 08/15/2025 | | | 47,300 | |
| | 25,000 | | TPC Group, Inc.(h) | | 10.50% | | 08/01/2024 | | | 26,188 | |
| | 20,000 | | TransDigm, Inc. | | 6.50% | | 07/15/2024 | | | 20,700 | |
| | 35,000 | | TransDigm, Inc. | | 6.50% | | 05/15/2025 | | | 36,444 | |
| | 70,000 | | TransDigm, Inc.(h) | | 6.25% | | 03/15/2026 | | | 75,337 | |
| | 45,000 | | TreeHouse Foods, Inc.(h) | | 6.00% | | 02/15/2024 | | | 46,800 | |
| | 50,000 | | Tronox, Inc.(h) | | 6.50% | | 04/15/2026 | | | 47,875 | |
| | 100,000 | | UGI International LLC(h) | | 3.25% | | 11/01/2025 | | | 115,519 | |
| | 10,113 | | Ultra Resources, Inc.(i) | | 11.00% (11.00%) | | 07/12/2024 | | | 1,466 | |
| | 80,000 | | United Rentals North America, Inc. | | 6.50% | | 12/15/2026 | | | 87,460 | |
| | 75,000 | | US Foods, Inc.(h) | | 5.88% | | 06/15/2024 | | | 77,531 | |
| | 43,000 | | USA Compression Partners LP / USA Compression Finance Corp. | | 6.88% | | 04/01/2026 | | | 44,827 | |
| | 5,000 | | USA Compression Partners LP / USA Compression Finance Corp.(h) | | 6.88% | | 09/01/2027 | | | 5,188 | |
| | 70,000 | | ViaSat, Inc.(h) | | 5.63% | | 09/15/2025 | | | 70,875 | |
| | 105,000 | | Watco Cos. LLC / Watco Finance Corp.(h) | | 6.38% | | 04/01/2023 | | | 107,100 | |
| | 35,000 | | William Carter Co.(h) | | 5.63% | | 03/15/2027 | | | 37,581 | |
| | 108,000 | | WMG Acquisition Corp.(h) | | 4.13% | | 11/01/2024 | | | 121,953 | |
See Notes to Financial Statements.
| 86 | (888) 848-7569 | www.rivernorth.com |
| RiverNorth/Oaktree High Income Fund | Schedule of Investments |
September 30, 2019
| Principal Amount/Description | | Rate | | Maturity | | Value | |
| $ | 90,000 | | Wynn Resorts Finance LLC / Wynn Resorts Capital Corp.(h) | | 5.13% | | 10/01/2029 | | $ | 94,480 | |
| | | | | | | | | | | 11,518,948 | |
| | | | | | | | | | | | |
| TOTAL HIGH YIELD DEBT | | | | | | | | |
| (Cost $16,193,634) | | | | | | | 16,222,829 | |
| Shares/Description | Value | |
| WARRANTS - 0.01%(b) | | |
| | 394 | | David's Bridal, Strike Price 219.47, Expires 01/18/2024(a) | | – | |
| | 362 | | Phi, Inc., Strike Price 0.01, Expires 09/05/2044(a) | | 3,714 | |
| | 210 | | Ultra Petroleum Corp, Strike Price 0.01, Expires 07/14/2025 | | 2 | |
| | | | | | | |
| TOTAL WARRANTS | | | |
| (Cost $3,012) | | 3,716 | |
| | | | | | | |
| SHORT-TERM INVESTMENTS - 8.92% | | | |
| | 4,573,097 | | State Street Institutional Trust (7 Day Yield 1.95%) | | 4,573,097 | |
| | | | | | | |
| TOTAL SHORT-TERM INVESTMENTS | | | |
| (Cost $4,573,097) | | 4,573,097 | |
| | | | | | | |
| TOTAL INVESTMENTS - 98.71% | | | |
| (Cost $51,266,740) | | 50,583,702 | |
| CASH SEGREGATED AT CUSTODIAN FOR FORWARD FOREIGN CURRENCY CONTRACTS - 0.10% | | 50,000 | |
| OTHER ASSETS IN EXCESS OF LIABILITIES - 1.19% | | 609,626 | |
| NET ASSETS - 100.00% | $ | 51,243,328 | |
Investment Abbreviations:
EURIBOR - Euro Interbank Offered Rate
LIBOR - London Interbank Offered Rate
Libor Rates:
1W US L - 1 Week LIBOR as of September 30, 2019 was 1.91%
1M US L - 1 Month LIBOR as of September 30, 2019 was 2.02%
3M US L - 3 Month LIBOR as of September 30, 2019 was 2.09%
1M EUR L - 1 Month EURIBOR as of September 30, 2019 was -0.46%
3M EUR L - 3 Month EURIBOR as of September 30, 2019 was -0.42%
6M EUR L - 6 Month EURIBOR as of September 30, 2019 was -0.39%
See Notes to Financial Statements.
| Annual Report | September 30, 2019 | 87 |
| RiverNorth/Oaktree High Income Fund | Schedule of Investments |
September 30, 2019
| (a) | The level 3 assets were a result of unavailable quoted prices from an active market or the unavailability of other significant observable inputs. |
| (b) | Non-income producing security. |
| (c) | Security has no contractual maturity date, is not redeemable and contractually pays an indefinite stream of interest. |
| (d) | Issued with a zero coupon. Income is recognized through the accretion of discount. |
| (e) | Variable rate investment. Interest rates reset periodically. Interest rate shown reflects the rate in effect at September 30, 2019. For securities based on a published reference rate and spread, the reference rate and spread are indicated in the description above. Certain variable rate securities are not based on a published reference rate and spread but are determined by the issuer or agent and are based on current market conditions. These securities do not indicate a reference rate and spread in their description above. |
| (f) | All or a portion of this position has not settled as of September 30, 2019. The interest rate shown represents the stated spread over the London Interbank Offered Rate ("LIBOR" or "L") or the Euro Interbank Offered Rate ("EURIBOR" or "E") or the applicable LIBOR/EURIBOR floor; the Fund will not accrue interest until the settlement date, at which point LIBOR/EURIBOR will be established. |
| (g) | Security is currently in default. |
| (h) | Security exempt from registration under Rule 144A of the Securities Act of 1933. These securities have been deemed liquid under procedures approved by the Fund's Board of Trustees and may normally be sold to qualified institutional buyers in transactions exempt from registration. Total fair value of Rule 144A securities amounts to $8,185,287, which represents approximately 15.97% of net assets as of September 30, 2019. |
| (i) | Pay-in-kind securities - Rate paid in-kind is shown in parenthesis. |
| (j) | Securities were purchased pursuant to Regulation S under the Securities Act of 1933, which exempts securities offered and sold outside of the United States from registration. Such securities cannot be sold in the United States without either an effective registration statement filed pursuant to the Securities Act of 1933, or pursuant to an exemption from registration. These securities have been deemed liquid under procedures approved by the Fund's Board of Trustees. As of September 30, 2019, the aggregate fair value of those securities was $3,184,766, representing 6.21% of net assets. |
| (k) | Security does not have a market value or rate. Security will not be entitled to distributions in respect of principal or interest other than excess interest paid with respect to the mortgage loans. |
OUTSTANDING FORWARD FOREIGN CURRENCY CONTRACTS
| Counterparty | Settlement Date | | Fund Receiving | | | U.S. $ Value at September 30, 2019 | | | Fund Delivering | | U.S. $ Value at September 30, 2019 | | | Unrealized Appreciation/ (Depreciation) | |
| State Street Boston | | 10/7/2019 | | USD | | | 4,257,608 | | | EUR | | | 4,204,782 | | | $ | 52,826 | |
| State Street Boston | | 10/7/2019 | | USD | | | 4,408,188 | | | EUR | | | 4,353,494 | | | | 54,694 | |
| State Street Boston | | 10/7/2019 | | USD | | | 93,497 | | | EUR | | | 92,324 | | | | 1,173 | |
| | | | | | | | | | | | | | | | | $ | 108,693 | |
| State Street Boston | | 10/7/2019 | | USD | | | 405,866 | | | GBP | | | 408,492 | | | | (2,626 | ) |
| State Street Boston | | 10/7/2019 | | USD | | | 672,257 | | | GBP | | | 676,607 | | | | (4,350 | ) |
| | | | | | | | | | | | | | | | | $ | (6,976 | ) |
See Notes to Financial Statements.
| 88 | (888) 848-7569 | www.rivernorth.com |
| RiverNorth Core Opportunity Fund | |
| Statement of Assets and Liabilities | September 30, 2019 |
| ASSETS: | | | |
| Investment in securities: | | | | |
| At cost | | $ | 101,471,994 | |
| At value | | $ | 106,924,205 | |
| | | | | |
| Cash | | | 16,152 | |
| Dividends receivable | | | 252,038 | |
| Receivable for fund shares sold | | | 88,958 | |
| Prepaid expenses and other assets | | | 13,205 | |
| Total Assets | | | 107,294,558 | |
| LIABILITIES: | | | | |
| Facility loan fee payable | | | 3,076 | |
| Payable for fund shares redeemed | | | 134,113 | |
| Payable to Adviser | | | 86,868 | |
| Payable for Fund Accounting and Administration fees | | | 11,727 | |
| Accrued 12b-1 fees - Class R Shares | | | 8,304 | |
| Payable for Custodian fees | | | 4,310 | |
| Payable for Audit fees | | | 24,729 | |
| Payable to Transfer Agency | | | 7,534 | |
| Payable to Trustees and Officers | | | 1,910 | |
| Other accrued expenses | | | 6,467 | |
| Total Liabilities | | | 289,038 | |
| Net Assets | | $ | 107,005,520 | |
| NET ASSETS CONSIST OF: | | | | |
| Paid-in capital | | $ | 102,281,441 | |
| Total distributable earnings | | | 4,724,079 | |
| Net Assets | | $ | 107,005,520 | |
| PRICING OF SHARES: | | | | |
| Class I Shares | | | | |
| Net Assets | | $ | 66,662,020 | |
| Shares of beneficial interest outstanding (unlimited number of shares, no par value) | | | 8,277,263 | |
| Net Asset Value Per Share, Offering and Redemption Price Per Share | | $ | 8.05 | |
| Class R Shares | | | | |
| Net Assets | | $ | 40,343,500 | |
| Shares of beneficial interest outstanding (unlimited number of shares, no par value) | | | 5,003,746 | |
| Net Asset Value Per Share, Offering and Redemption Price Per Share | | $ | 8.06 | |
See Notes to Financial Statements.
| Annual Report | September 30, 2019 | 89 |
| RiverNorth/DoubleLine Strategic Income Fund | |
| Statement of Assets and Liabilities | September 30, 2019 |
| ASSETS: | | | |
| Investment in securities: | | | | |
| At cost | | $ | 2,029,294,854 | |
| At value | | $ | 2,000,883,177 | |
| | | | | |
| Investment in affiliates: | | | | |
| At cost | | | 29,923,731 | |
| At value | | | 30,156,442 | |
| Cash | | | 3,695,580 | |
| Interest receivable | | | 7,465,858 | |
| Receivable for fund shares sold | | | 2,695,791 | |
| Dividends receivable | | | 2,321,495 | |
| Receivable for fund investments sold | | | 1,248,015 | |
| Prepaid expenses and other assets | | | 45,818 | |
| Total Assets | | | 2,048,512,176 | |
| LIABILITIES: | | | | |
| Facility loan fee payable | | | 58,649 | |
| Payable for fund investments purchased | | | 16,022,761 | |
| Payable for fund shares redeemed | | | 5,488,928 | |
| Payable to Adviser | | | 1,232,760 | |
| Payable for Fund Accounting and Administration fees | | | 247,462 | |
| Accrued 12b-1 fees - Class R Shares | | | 34,228 | |
| Payable for Custodian fees | | | 16,558 | |
| Payable for Audit fees | | | 40,729 | |
| Payable to Transfer Agency | | | 34,714 | |
| Payable to Trustees and Officers | | | 1,910 | |
| Other accrued expenses | | | 88,716 | |
| Total Liabilities | | | 23,267,415 | |
| Net Assets | | $ | 2,025,244,761 | |
| NET ASSETS CONSIST OF: | | | | |
| Paid-in capital | | $ | 2,124,076,818 | |
| Total distributable earnings/(accumulated deficit) | | | (98,832,057 | ) |
| Net Assets | | $ | 2,025,244,761 | |
| PRICING OF SHARES: | | | | |
| Class I Shares | | | | |
| Net Assets | | $ | 1,858,103,381 | |
| Shares of beneficial interest outstanding (unlimited number of shares, no par value) | | | 179,918,510 | |
| Net Asset Value Per Share, Offering and Redemption Price Per Share | | $ | 10.33 | |
| Class R Shares | | | | |
| Net Assets | | $ | 167,141,380 | |
| Shares of beneficial interest outstanding (unlimited number of shares, no par value) | | | 16,155,305 | |
| Net Asset Value Per Share, Offering and Redemption Price Per Share | | $ | 10.35 | |
See Notes to Financial Statements.
| 90 | (888) 848-7569 | www.rivernorth.com |
| RiverNorth/Oaktree High Income Fund | |
| Statement of Assets and Liabilities | September 30, 2019 |
| ASSETS: | | | |
| Investment in securities: | | | | |
| At cost | | $ | 51,266,740 | |
| At value | | $ | 50,583,702 | |
| | | | | |
| Cash | | | 214,214 | |
| Foreign currency, at value (Cost 226,398) | | | 225,967 | |
| Interest receivable | | | 316,850 | |
| Receivable for fund investments sold | | | 155,137 | |
| Unrealized appreciation on forward foreign currency contracts | | | 108,693 | |
| Cash segregated at custodian for forward foreign currency contracts | | | 50,000 | |
| Dividends receivable | | | 48,520 | |
| Receivable for fund shares sold | | | 33,361 | |
| Prepaid expenses and other assets | | | 12,270 | |
| Total Assets | | | 51,748,714 | |
| LIABILITIES: | | | | |
| Facility loan fee payable | | | 1,469 | |
| Payable for fund investments purchased | | | 369,548 | |
| Unrealized depreciation on forward foreign currency contracts | | | 6,976 | |
| Payable to Adviser | | | 32,850 | |
| Payable for Fund Accounting and Administration fees | | | 43,903 | |
| Accrued 12b-1 fees - Class R Shares | | | 1,220 | |
| Payable for Custodian fees | | | 3,569 | |
| Payable for Audit fees | | | 30,729 | |
| Payable to Transfer Agency | | | 5,546 | |
| Payable to Trustees and Officers | | | 1,910 | |
| Other accrued expenses | | | 7,666 | |
| Total Liabilities | | | 505,386 | |
| Net Assets | | $ | 51,243,328 | |
| NET ASSETS CONSIST OF: | | | | |
| Paid-in capital | | $ | 55,759,793 | |
| Total distributable earnings/(accumulated deficit) | | | (4,516,465 | ) |
| Net Assets | | $ | 51,243,328 | |
| PRICING OF SHARES: | | | | |
| Class I Shares | | | | |
| Net Assets | | $ | 45,306,063 | |
| Shares of beneficial interest outstanding (unlimited number of shares, no par value) | | | 4,746,033 | |
| Net Asset Value Per Share, Offering and Redemption Price Per Share | | $ | 9.55 | |
| Class R Shares | | | | |
| Net Assets | | $ | 5,937,265 | |
| Shares of beneficial interest outstanding (unlimited number of shares, no par value) | | | 622,563 | |
| Net Asset Value Per Share, Offering and Redemption Price Per Share | | $ | 9.54 | |
See Notes to Financial Statements.
| Annual Report | September 30, 2019 | 91 |
| RiverNorth Core Opportunity Fund | |
| Statement of Operations | For the Year Ended September 30, 2019 |
| INVESTMENT INCOME: | | | |
| Dividend income | | $ | 4,940,960 | |
| Interest income | | | 111,730 | |
| Total Investment Income | | | 5,052,690 | |
| | | | | |
| EXPENSES: | | | | |
| Investment Adviser fee | | | 1,232,074 | |
| 12b-1 fees - Class R Shares | | | 131,154 | |
| Accounting and administration fee | | | 55,212 | |
| Transfer agent expenses | | | 43,238 | |
| Registration expenses | | | 38,863 | |
| Compliance expenses | | | 33,047 | |
| Audit expenses | | | 26,063 | |
| Printing expenses | | | 18,278 | |
| Facility loan fee | | | 15,584 | |
| Trustee expenses | | | 10,914 | |
| Custodian expenses | | | 8,630 | |
| Legal expenses | | | 6,653 | |
| Insurance expenses | | | 4,530 | |
| Interest expense | | | 2,920 | |
| Miscellaneous expenses | | | 15,570 | |
| Total Expenses | | | 1,642,730 | |
| Net Investment Income | | | 3,409,960 | |
| | | | | |
| REALIZED AND UNREALIZED GAIN/(LOSS): | | | | |
| Net realized gain/(loss) on: | | | | |
| Investments | | | 1,887,614 | |
| Net realized gain | | | 1,887,614 | |
| Long-term capital gain distributions from other investment companies | | | 1,209,202 | |
| Net change in unrealized appreciation/depreciation on: | | | | |
| Investments | | | (2,628,004 | ) |
| Net change in unrealized appreciation/depreciation | | | (2,628,004 | ) |
| Net Realized and Unrealized Gain on Investments | | | 468,812 | |
| Net Increase in Net Assets Resulting from Operations | | $ | 3,878,772 | |
See Notes to Financial Statements.
| 92 | (888) 848-7569 | www.rivernorth.com |
RiverNorth/DoubleLine Strategic Income Fund
| Statement of Operations | For the Year Ended September 30, 2019 |
| INVESTMENT INCOME: | | | |
| Dividend income | | $ | 45,237,829 | |
| Dividend income from affiliated securities | | | 1,460,626 | |
| Interest income | | | 65,612,367 | |
| Other income | | | 367,707 | |
| Foreign taxes withheld | | | (6,784 | ) |
| Total Investment Income | | | 112,671,745 | |
| | | | | |
| EXPENSES: | | | | |
| Investment Adviser fee | | | 13,928,544 | |
| Accounting and administration fee | | | 912,222 | |
| 12b-1 fees - Class R Shares | | | 405,763 | |
| Facility loan fee | | | 230,946 | |
| Transfer agent expenses | | | 177,885 | |
| Compliance expenses | | | 177,305 | |
| Trustee expenses | | | 158,849 | |
| Printing expenses | | | 156,703 | |
| Legal expenses | | | 86,489 | |
| Custodian expenses | | | 77,265 | |
| Registration expenses | | | 75,796 | |
| Insurance expenses | | | 42,446 | |
| Audit expenses | | | 42,063 | |
| Interest expense | | | 4,631 | |
| Miscellaneous expenses | | | 110,765 | |
| Total Expenses | | | 16,587,672 | |
| Net Investment Income | | | 96,084,073 | |
| | | | | |
| REALIZED AND UNREALIZED GAIN/(LOSS): | | | | |
| Net realized gain/(loss) on: | | | | |
| Investments | | | (50,206,791 | ) |
| Net realized loss | | | (50,206,791 | ) |
| Long-term capital gain distributions from other investment companies | | | 188,448 | |
| Net change in unrealized appreciation/depreciation on: | | | | |
| Investments | | | 95,828,440 | |
| Affiliated Investments | | | 628,720 | |
| Net change in unrealized appreciation/depreciation | | | 96,457,160 | |
| Net Realized and Unrealized Gain on Investments | | | 46,438,817 | |
| Net Increase in Net Assets Resulting from Operations | | $ | 142,522,890 | |
See Notes to Financial Statements.
| Annual Report | September 30, 2019 | 93 |
| RiverNorth/Oaktree High Income Fund | |
| Statement of Operations | For the Year Ended September 30, 2019 |
| INVESTMENT INCOME: | | | |
| Dividend income | | $ | 801,461 | |
| Interest income | | | 2,023,039 | |
| Other income | | | 41,661 | |
| Foreign taxes withheld | | | (3,776 | ) |
| Total Investment Income | | | 2,862,385 | |
| | | | | |
| EXPENSES: | | | | |
| Investment Adviser fee | | | 529,260 | |
| Accounting and administration fee | | | 111,876 | |
| Registration expenses | | | 37,342 | |
| Transfer agent expenses | | | 32,720 | |
| Audit expenses | | | 32,063 | |
| Compliance expenses | | | 28,063 | |
| Custodian expenses | | | 15,881 | |
| 12b-1 fees - Class R Shares | | | 15,410 | |
| Legal expenses | | | 13,528 | |
| Printing expenses | | | 9,433 | |
| Facility loan fee | | | 6,533 | |
| Trustee expenses | | | 4,598 | |
| Interest expense | | | 2,866 | |
| Insurance expenses | | | 1,206 | |
| Miscellaneous expenses | | | 10,653 | |
| Total expenses | | | 851,432 | |
| Less fees waived/reimbursed by Investment Adviser: | | | (118,856 | ) |
| Class I Shares | | | (104,992 | ) |
| Class R Shares | | | (13,864 | ) |
| Net Expenses | | | 732,576 | |
| Net Investment Income | | | 2,129,809 | |
| | | | | |
| REALIZED AND UNREALIZED GAIN/(LOSS): | | | | |
| Net realized gain/(loss) on: | | | | |
| Investments | | | (624,890 | ) |
| Forward Foreign Currency Contracts | | | 850,342 | |
| Translation of assets and liabilities denominated in foreign currencies | | | (14,724 | ) |
| Net realized gain | | | 210,728 | |
| Long-term capital gain distributions from other investment companies | | | 2,473 | |
| Net change in unrealized appreciation/depreciation on: | | | | |
| Investments | | | (104,967 | ) |
| Forward Foreign Currency Contracts | | | 67,527 | |
| Translation of assets and liabilities denominated in foreign currencies | | | 14,403 | |
| Net change in unrealized appreciation/depreciation | | | (23,037 | ) |
| Net Realized and Unrealized Gain on Investments, translation of assets and liabilities denominated in foreign currencies and forward foreign currency contracts | | | 190,164 | |
| Net Increase in Net Assets Resulting from Operations | | $ | 2,319,973 | |
See Notes to Financial Statements.
| 94 | (888) 848-7569 | www.rivernorth.com |
RiverNorth Core Opportunity Fund
Statements of Changes in Net Assets
| | | For the
Year Ended
September 30, 2019 | | | For the
Year Ended
September 30, 2018 | |
| NET INCREASE/(DECREASE) IN NET ASSETS FROM OPERATIONS: | | | | | | | | |
| Net investment income | | $ | 3,409,960 | | | $ | 5,214,167 | |
| Net realized gain | | | 1,887,614 | | | | 29,617,643 | |
| Long-term capital gain distributions from other investment companies | | | 1,209,202 | | | | 4,619,375 | |
| Net change in unrealized appreciation/depreciation | | | (2,628,004 | ) | | | (24,533,245 | ) |
| Net increase in net assets resulting from operations | | | 3,878,772 | | | | 14,917,940 | |
| | | | | | | | | |
| DISTRIBUTIONS TO SHAREHOLDERS: | | | | | | | | |
| Class I shares | | | (17,381,143 | ) | | | (17,414,020 | ) |
| Class R shares | | | (15,707,897 | ) | | | (31,988,487 | ) |
| Net decrease in net assets from distributions to shareholders | | | (33,089,040 | ) | | | (49,402,507 | ) |
| | | | | | | | | |
| CAPITAL SHARE TRANSACTIONS: | | | | | | | | |
| Class I Shares | | | | | | | | |
| Proceeds from shares sold | | | 42,934,744 | | | | 37,578,872 | |
| Reinvestment of distributions | | | 11,770,344 | | | | 10,189,389 | |
| Cost of shares redeemed | | | (39,179,988 | ) | | | (80,063,488 | ) |
| Redemption fees(a) | | | 1,733 | | | | 13,320 | |
| Net increase/(decrease) in net assets from capital share transactions | | | 15,526,833 | | | | (32,281,907 | ) |
| | | | | | | | | |
| Class R Shares | | | | | | | | |
| Proceeds from shares sold | | | 9,464,344 | | | | 11,398,807 | |
| Reinvestment of distributions | | | 15,268,961 | | | | 31,627,486 | |
| Cost of shares redeemed | | | (36,835,297 | ) | | | (166,833,549 | ) |
| Redemption fees(a) | | | 184 | | | | 480 | |
| Net decrease in net assets from capital share transactions | | | (12,101,808 | ) | | | (123,806,776 | ) |
| | | | | | | | | |
| Net Decrease in Net Assets | | | (25,785,243 | ) | | | (190,573,250 | ) |
| | | | | | | | | |
| NET ASSETS: | | | | | | | | |
| Beginning of period | | $ | 132,790,763 | | | $ | 323,364,013 | |
| End of period | | | 107,005,520 | | | | 132,790,763 | |
See Notes to Financial Statements.
| Annual Report | September 30, 2019 | 95 |
RiverNorth Core Opportunity Fund
Statements of Changes in Net Assets
| | | For the
Year Ended
September 30, 2019 | | | For the
Year Ended
September 30, 2018 | |
| OTHER INFORMATION: | | | | | | | | |
| Share Transactions: | | | | | | | | |
| Class I Shares | | | | | | | | |
| Shares sold | | | 5,361,367 | | | | 3,214,606 | |
| Shares issued in reinvestment of distributions | | | 1,595,372 | | | | 944,429 | |
| Shares redeemed | | | (4,705,712 | ) | | | (6,996,741 | ) |
| Net increase/(decrease) from share transactions | | | 2,251,027 | | | | (2,837,706 | ) |
| | | | | | | | | |
| Class R Shares | | | | | | | | |
| Shares sold | | | 1,202,806 | | | | 1,008,872 | |
| Shares issued in reinvestment of distributions | | | 2,084,044 | | | | 2,929,289 | |
| Shares redeemed | | | (4,453,626 | ) | | | (15,045,765 | ) |
| Net decrease from share transactions | | | (1,166,776 | ) | | | (11,107,604 | ) |
| (a) | The Fund imposed a 2.00% redemption fee on shares redeemed within 90 days of purchase. The redemption fee was eliminated on March 4, 2019. |
See Notes to Financial Statements.
| 96 | (888) 848-7569 | www.rivernorth.com |
RiverNorth/DoubleLine Strategic Income Fund
Statements of Changes in Net Assets
| | | For the
Year Ended
September 30, 2019 | | | For the
Year Ended
September 30, 2018 | |
| NET INCREASE/(DECREASE) IN NET ASSETS FROM OPERATIONS: | | | | | | | | |
| Net investment income | | $ | 96,084,073 | | | $ | 92,634,178 | |
| Net realized loss | | | (50,206,791 | ) | | | (1,825,140 | ) |
| Long-term capital gain distributions from other investment companies | | | 188,448 | | | | 73,380 | |
| Net change in unrealized appreciation/depreciation | | | 96,457,160 | | | | (86,569,399 | ) |
| Net increase in net assets resulting from operations | | | 142,522,890 | | | | 4,313,019 | |
| | | | | | | | | |
| DISTRIBUTIONS TO SHAREHOLDERS: | | | | | | | | |
| Class I shares | | | (92,689,814 | ) | | | (97,793,631 | ) |
| Class R shares | | | (8,384,063 | ) | | | (9,571,898 | ) |
| From tax return of capital | | | | | | | | |
| Class I shares | | | – | | | | (1,730,567 | ) |
| Class R shares | | | – | | | | (169,385 | ) |
| Net decrease in net assets from distributions to shareholders | | | (101,073,877 | ) | | | (109,265,481 | ) |
| | | | | | | | | |
| CAPITAL SHARE TRANSACTIONS: | | | | | | | | |
| Class I Shares | | | | | | | | |
| Proceeds from shares sold | | | 860,449,587 | | | | 445,909,981 | |
| Reinvestment of distributions | | | 73,340,573 | | | | 76,135,927 | |
| Cost of shares redeemed | | | (828,839,766 | ) | | | (735,657,272 | ) |
| Redemption fees(a) | | | 67,075 | | | | 60,895 | |
| Net increase/(decrease) in net assets from capital share transactions | | | 105,017,469 | | | | (213,550,469 | ) |
| | | | | | | | | |
| Class R Shares | | | | | | | | |
| Proceeds from shares sold | | | 53,658,489 | | | | 58,318,144 | |
| Reinvestment of distributions | | | 8,047,792 | | | | 9,393,059 | |
| Cost of shares redeemed | | | (63,914,017 | ) | | | (100,541,570 | ) |
| Redemption fees(a) | | | 19,243 | | | | 15,043 | |
| Net decrease in net assets from capital share transactions | | | (2,188,493 | ) | | | (32,815,324 | ) |
| | | | | | | | | |
| Net Increase/(Decrease) in Net Assets | | | 144,277,989 | | | | (351,318,255 | ) |
| | | | | | | | | |
| NET ASSETS: | | | | | | | | |
| Beginning of period | | $ | 1,880,966,772 | | | $ | 2,232,285,027 | |
| End of period | | | 2,025,244,761 | | | | 1,880,966,772 | |
See Notes to Financial Statements.
| Annual Report | September 30, 2019 | 97 |
RiverNorth/DoubleLine Strategic Income Fund
Statements of Changes in Net Assets
| | | For the
Year Ended
September 30, 2019 | | | For the
Year Ended
September 30, 2018 | |
| OTHER INFORMATION: | | | | | | | | |
| Share Transactions: | | | | | | | | |
| Class I Shares | | | | | | | | |
| Shares sold | | | 85,244,983 | | | | 43,253,978 | |
| Shares issued in reinvestment of distributions | | | 7,258,179 | | | | 7,419,361 | |
| Shares redeemed | | | (82,788,383 | ) | | | (71,333,873 | ) |
| Net increase/(decrease) from share transactions | | | 9,714,779 | | | | (20,660,534 | ) |
| | | | | | | | | |
| Class R Shares | | | | | | | | |
| Shares sold | | | 5,301,831 | | | | 5,605,491 | |
| Shares issued in reinvestment of distributions | | | 795,933 | | | | 913,262 | |
| Shares redeemed | | | (6,334,432 | ) | | | (9,725,055 | ) |
| Net decrease from share transactions | | | (236,668 | ) | | | (3,206,302 | ) |
| (a) | The Fund imposed a 2.00% redemption fee on shares redeemed within 90 days of purchase. The redemption fee was eliminated on March 4, 2019. |
See Notes to Financial Statements.
| 98 | (888) 848-7569 | www.rivernorth.com |
RiverNorth/Oaktree High Income Fund
Statements of Changes in Net Assets
| | | For the
Year Ended
September 30, 2019 | | | For the
Year Ended
September 30, 2018 | |
| NET INCREASE/(DECREASE) IN NET ASSETS FROM OPERATIONS: | | | | | | | | |
| Net investment income | | $ | 2,129,809 | | | $ | 2,428,802 | |
| Net realized gain | | | 210,728 | | | | 521,914 | |
| Long-term capital gain distributions from other investment companies | | | 2,473 | | | | – | |
| Net change in unrealized appreciation/depreciation | | | (23,037 | ) | | | (1,629,307 | ) |
| Net increase in net assets resulting from operations | | | 2,319,973 | | | | 1,321,409 | |
| | | | | | | | | |
| DISTRIBUTIONS TO SHAREHOLDERS: | | | | | | | | |
| Class I Shares | | | (2,340,774 | ) | | | (1,337,107 | ) |
| Class R Shares | | | (295,137 | ) | | | (166,196 | ) |
| From tax return of capital | | | | | | | | |
| Class I Shares | | | – | | | | (650,715 | ) |
| Class R Shares | | | – | | | | (80,881 | ) |
| Net decrease in net assets from distributions to shareholders | | | (2,635,911 | ) | | | (2,234,899 | ) |
| | | | | | | | | |
| CAPITAL SHARE TRANSACTIONS: | | | | | | | | |
| Class I Shares | | | | | | | | |
| Proceeds from shares sold | | | 1,386,595 | | | | 3,307,159 | |
| Reinvestment of distributions | | | 2,297,811 | | | | 1,930,632 | |
| Cost of shares redeemed | | | (7,975,638 | ) | | | (18,416,586 | ) |
| Redemption fees(a) | | | 16,396 | | | | 257 | |
| Net decrease in net assets from capital share transactions | | | (4,274,836 | ) | | | (13,178,538 | ) |
| | | | | | | | | |
| Class R Shares | | | | | | | | |
| Proceeds from shares sold | | | 687,413 | | | | 859,168 | |
| Reinvestment of distributions | | | 287,836 | | | | 241,660 | |
| Cost of shares redeemed | | | (1,755,228 | ) | | | (1,871,291 | ) |
| Redemption fees(a) | | | 129 | | | | 23 | |
| Net decrease in net assets from capital share transactions | | | (779,850 | ) | | | (770,440 | ) |
| | | | | | | | | |
| Net Decrease in Net Assets | | | (5,370,624 | ) | | | (14,862,468 | ) |
| | | | | | | | | |
| NET ASSETS: | | | | | | | | |
| Beginning of period | | $ | 56,613,952 | | | $ | 71,476,420 | |
| End of period | | | 51,243,328 | | | | 56,613,952 | |
See Notes to Financial Statements.
| Annual Report | September 30, 2019 | 99 |
RiverNorth/Oaktree High Income Fund
Statements of Changes in Net Assets
| | | For the
Year Ended
September 30, 2019 | | | For the
Year Ended
September 30, 2018 | |
| OTHER INFORMATION: | | | | | | | | |
| Share Transactions: | | | | | | | | |
| Class I Shares | | | | | | | | |
| Shares sold | | | 146,904 | | | | 341,685 | |
| Shares issued in reinvestment of distributions | | | 244,757 | | | | 200,668 | |
| Shares redeemed | | | (847,134 | ) | | | (1,901,069 | ) |
| Net decrease from share transactions | | | (455,473 | ) | | | (1,358,716 | ) |
| | | | | | | | | |
| Class R Shares | | | | | | | | |
| Shares sold | | | 73,019 | | | | 89,276 | |
| Shares issued in reinvestment of distributions | | | 30,715 | | | | 25,140 | |
| Shares redeemed | | | (186,885 | ) | | | (193,955 | ) |
| Net decrease from share transactions | | | (83,151 | ) | | | (79,539 | ) |
| (a) | The Fund imposed a 2.00% redemption fee on shares redeemed within 90 days of purchase. The redemption fee was eliminated on March 4, 2019. |
See Notes to Financial Statements.
| 100 | (888) 848-7569 | www.rivernorth.com |
Intentionally Left Blank
| RiverNorth Core Opportunity Fund | Class I |
Financial Highlights
| Net asset value - beginning of period |
| Income/(Loss) from investment operations: |
| Net investment income(a) |
| Net realized and unrealized gain/(loss) on investments |
| Total income/(loss) from investment operations |
| Less distributions: |
| From net investment income |
| From net realized gain on investments |
| From tax return of capital |
| Total distributions |
| Paid-in capital from redemption fees(a) |
| Net increase/(decrease) in net asset value |
| Net asset value - end of period |
| Total Return(d) |
| Ratios/Supplemental Data: |
| Net assets, end of period (in thousands) |
| Ratios to Average Net Assets (including interest expense): |
| |
| Ratio of expenses to average net assets excluding fee waivers and reimbursements(e) |
| |
| Ratio of expenses to average net assets including fee waivers and reimbursements(e) |
| Ratio of net investment income to average net assets excluding fee waivers and reimbursements(e) |
| Ratio of net investment income to average net assets including fee waivers and reimbursements(e) |
| Ratios to Average Net Assets (excluding interest expense): |
| |
| Ratio of expenses to average net assets excluding fee waivers and reimbursements(e) |
| |
| Ratio of expenses to average net assets including fee waivers and reimbursements(e) |
| Ratio of net investment income to average net assets excluding fee waivers and reimbursements(e) |
| Ratio of net investment income to average net assets including fee waivers and reimbursements(e) |
| Portfolio turnover rate |
See Notes to Financial Statements.
| 102 | (888) 848-7569 | www.rivernorth.com |
| For a share outstanding throughout the periods presented |
For the
Year Ended
September 30, 2019 | | For the
Year Ended
September 30, 2018 | | For the
Year Ended
September 30, 2017 | | For the
Year Ended
September 30, 2016 | | For the
Year Ended
September 30, 2015 | |
| $ | 10.88 | | | $ | 12.37 | | | $ | 11.33 | | | $ | 10.74 | | | $ | 13.06 | |
| | | | | | | | | | | | | | | | | | | |
| | 0.24 | | | | 0.27 | | | | 0.17 | | | | 0.23 | | | | 0.44 | |
| | (0.25 | )(b) | | | 0.42 | | | | 1.45 | | | | 1.33 | | | | (1.30 | ) |
| | (0.01 | ) | | | 0.69 | | | | 1.62 | | | | 1.56 | | | | (0.86 | ) |
| | | | | | | | | | | | | | | | | | | |
| | (0.18 | ) | | | (0.40 | ) | | | (0.30 | ) | | | (0.42 | ) | | | (0.60 | ) |
| | (2.64 | ) | | | (1.78 | ) | | | (0.28 | ) | | | (0.45 | ) | | | (0.86 | ) |
| | – | | | | – | | | | – | | | | (0.10 | ) | | | – | |
| | (2.82 | ) | | | (2.18 | ) | | | (0.58 | ) | | | (0.97 | ) | | | (1.46 | ) |
| | 0.00 | (c) | | | 0.00 | (c) | | | 0.00 | (c) | | | 0.00 | (c) | | | 0.00 | (c) |
| | (2.83 | ) | | | (1.49 | ) | | | 1.04 | | | | 0.59 | | | | (2.32 | ) |
| $ | 8.05 | | | $ | 10.88 | | | $ | 12.37 | | | $ | 11.33 | | | $ | 10.74 | |
| | 3.51 | % | | | 5.92 | % | | | 14.71 | % | | | 15.35 | % | | | (7.50 | %) |
| | | | | | | | | | | | | | | | | | | |
| $ | 66,662 | | | $ | 65,592 | | | $ | 109,627 | | | $ | 201,712 | | | $ | 166,905 | |
| | | | | | | | | | | | | | | | | | | |
| | | | | | | | | | | | | | | | | | | |
| | 1.22 | % | | | N/A | | | | 1.12 | % | | | N/A | | | | N/A | |
| | | | | | | | | | | | | | | | | | | |
| | 1.22 | % | | | N/A | | | | 1.12 | % | | | N/A | | | | N/A | |
| | | | | | | | | | | | | | | | | | | |
| | 2.88 | % | | | N/A | | | | 1.45 | % | | | N/A | | | | N/A | |
| | | | | | | | | | | | | | | | | | | |
| | 2.88 | % | | | N/A | | | | 1.45 | % | | | N/A | | | | N/A | |
| | | | | | | | | | | | | | | | | | | |
| | | | | | | | | | | | | | | | | | | |
| | 1.22 | % | | | 1.17 | % | | | 1.12 | % | | | 1.11 | % | | | 1.11 | % |
| | | | | | | | | | | | | | | | | | | |
| | 1.22 | % | | | 1.17 | % | | | 1.12 | % | | | 1.11 | % | | | 1.11 | % |
| | | | | | | | | | | | | | | | | | | |
| | 2.88 | % | | | 2.37 | % | | | 1.45 | % | | | 2.11 | % | | | 3.62 | % |
| | | | | | | | | | | | | | | | | | | |
| | 2.88 | % | | | 2.37 | % | | | 1.45 | % | | | 2.11 | % | | | 3.62 | % |
| | 36 | % | | | 58 | %(f) | | | 39 | %(f) | | | 19 | % | | | 23 | % |
| Annual Report | September 30, 2019 | 103 |
| RiverNorth Core Opportunity Fund | Class I |
| Financial Highlights | For a share outstanding throughout the periods presented |
| (a) | Based on average shares outstanding during the period. |
| (b) | Realized and unrealized gains and losses per share in this caption are balancing amounts necessary to reconcile the change in net asset value per share for the period, and may not reconcile with the aggregate gains and losses in the Statement of Operations due to share transactions for the period. |
| (c) | Less than $0.005 per share. |
| (d) | Total return in the above table represents the rate that the investor would have earned or lost on an investment in the Fund, assuming reinvestment of dividends. |
| (e) | The ratios exclude the impact of expenses of the underlying funds in which the Fund invests as represented in the Schedule of Investments. |
| (f) | Portfolio turnover does not include redemptions in-kind. |
See Notes to Financial Statements.
| 104 | (888) 848-7569 | www.rivernorth.com |
Intentionally Left Blank
| RiverNorth Core Opportunity Fund | Class R |
Financial Highlights
| Net asset value - beginning of period |
| Income/(Loss) from investment operations: |
| Net investment income(a) |
| Net realized and unrealized gain/(loss) on investments |
| Total income/(loss) from investment operations |
| Less distributions: |
| From net investment income |
| From net realized gain on investments |
| From tax return of capital |
| Total distributions |
| Paid-in capital from redemption fees(a) |
| Net increase/ (decrease) in net asset value |
| Net asset value - end of period |
| Total Return(d) |
| Ratios/Supplemental Data: |
| Net assets, end of period (in thousands) |
| Ratios to Average Net Assets (including interest expense): |
| Ratio of expenses to average net assets excluding fee waivers and reimbursements(e) |
| Ratio of expenses to average net assets including fee waivers and reimbursements(e) |
| Ratio of net investment income to average net assets excluding fee waivers and reimbursements(e) |
| |
| Ratio of net investment income to average net assets including fee waivers and reimbursements(e) |
| Ratios to Average Net Assets (excluding interest expense): |
| Ratio of expenses to average net assets excluding fee waivers and reimbursements(e) |
| Ratio of expenses to average net assets including fee waivers and reimbursements(e) |
| Ratio of net investment income to average net assets excluding fee waivers and reimbursements(e) |
| Ratio of net investment income to average net assets including fee waivers and reimbursements(e) |
| Portfolio turnover rate |
See Notes to Financial Statements.
| 106 | (888) 848-7569 | www.rivernorth.com |
| For a share outstanding throughout the periods presented |
For the
Year Ended
September 30, 2019 | | For the
Year Ended
September 30, 2018 | | For the
Year Ended
September 30, 2017 | | For the
Year Ended
September 30, 2016 | | For the
Year Ended
September 30, 2015 | |
| $ | 10.89 | | | $ | 12.37 | | | $ | 11.32 | | | $ | 10.74 | | | $ | 13.05 | |
| | | | | | | | | | | | | | | | | | | |
| | 0.22 | | | | 0.23 | | | | 0.16 | | | | 0.20 | | | | 0.39 | |
| | (0.26 | )(b) | | | 0.44 | | | | 1.44 | | | | 1.32 | | | | (1.27 | ) |
| | (0.04 | ) | | | 0.67 | | | | 1.60 | | | | 1.52 | | | | (0.88 | ) |
| | | | | | | | | | | | | | | | | | | |
| | (0.17 | ) | | | (0.37 | ) | | | (0.27 | ) | | | (0.40 | ) | | | (0.57 | ) |
| | (2.62 | ) | | | (1.78 | ) | | | (0.28 | ) | | | (0.45 | ) | | | (0.86 | ) |
| | – | | | | – | | | | – | | | | (0.09 | ) | | | – | |
| | (2.79 | ) | | | (2.15 | ) | | | (0.55 | ) | | | (0.94 | ) | | | (1.43 | ) |
| | 0.00 | (c) | | | 0.00 | (c) | | | 0.00 | (c) | | | 0.00 | (c) | | | 0.00 | (c) |
| | (2.83 | ) | | | (1.48 | ) | | | 1.05 | | | | 0.58 | | | | (2.31 | ) |
| $ | 8.06 | | | $ | 10.89 | | | $ | 12.37 | | | $ | 11.32 | | | $ | 10.74 | |
| | 3.23 | % | | | 5.70 | % | | | 14.51 | % | | | 14.98 | % | | | (7.67 | %) |
| | | | | | | | | | | | | | | | | | | |
| $ | 40,344 | | | $ | 67,199 | | | $ | 213,737 | | | $ | 568,198 | | | $ | 538,689 | |
| | | | | | | | | | | | | | | | | | | |
| | | | | | | | | | | | | | | | | | | |
| | 1.48 | % | | | N/A | | | | 1.37 | % | | | N/A | | | | N/A | |
| | 1.48 | % | | | N/A | | | | 1.37 | % | | | N/A | | | | N/A | |
| | | | | | | | | | | | | | | | | | | |
| | 2.62 | % | | | N/A | | | | 1.38 | % | | | N/A | | | | N/A | |
| | | | | | | | | | | | | | | | | | | |
| | | | | | | | | | | | | | | | | | | |
| | 2.62 | % | | | N/A | | | | 1.38 | % | | | N/A | | | | N/A | |
| | | | | | | | | | | | | | | | | | | |
| | | | | | | | | | | | | | | | | | | |
| | 1.48 | % | | | 1.41 | % | | | 1.37 | % | | | 1.36 | % | | | 1.35 | % |
| | 1.48 | % | | | 1.41 | % | | | 1.37 | % | | | 1.36 | % | | | 1.35 | % |
| | | | | | | | | | | | | | | | | | | |
| | | | | | | | | | | | | | | | | | | |
| | 2.62 | % | | | 2.02 | % | | | 1.38 | % | | | 1.90 | % | | | 3.16 | % |
| | | | | | | | | | | | | | | | | | | |
| | | | | | | | | | | | | | | | | | | |
| | 2.62 | % | | | 2.02 | % | | | 1.38 | % | | | 1.90 | % | | | 3.16 | % |
| | 36 | % | | | 58 | %(f) | | | 39 | %(f) | | | 19 | % | | | 23 | % |
| Annual Report | September 30, 2019 | 107 |
| RiverNorth Core Opportunity Fund | Class R |
| Financial Highlights | For a share outstanding throughout the periods presented |
| (a) | Based on average shares outstanding during the period. |
| (b) | Realized and unrealized gains and losses per share in this caption are balancing amounts necessary to reconcile the change in net asset value per share for the period, and may not reconcile with the aggregate gains and losses in the Statement of Operations due to share transactions for the period. |
| (c) | Less than $0.005 per share. |
| (d) | Total return in the above table represents the rate that the investor would have earned or lost on an investment in the Fund, assuming reinvestment of dividends. |
| (e) | The ratios exclude the impact of expenses of the underlying funds in which the Fund invests as represented in the Schedule of Investments. |
| (f) | Portfolio turnover does not include redemptions in-kind. |
See Notes to Financial Statements.
| 108 | (888) 848-7569 | www.rivernorth.com |
Intentionally Left Blank
| RiverNorth/DoubleLine Strategic Income Fund | Class I |
Financial Highlights
| Net asset value - beginning of period |
| Income from investment operations: |
| Net investment income(a) |
| Net realized and unrealized gain/(loss) on investments |
| Total income from investment operations |
| |
| Less distributions: |
| From net investment income |
| From net realized gain on investments |
| From tax return of capital |
| Total distributions |
| Paid-in capital from redemption fees(a) |
| Net increase/(decrease) in net asset value |
| Net asset value - end of period |
| |
| Total Return(c) |
| |
| Ratios/Supplemental Data: |
| Net assets, end of period (in thousands) |
| Ratios to Average Net Assets (including interest expense): |
| Ratio of expenses to average net assets excluding fee waivers and reimbursements(d) |
| Ratio of expenses to average net assets including fee waivers and reimbursements(d) |
| |
| Ratio of net investment income to average net assets excluding fee waivers and reimbursements(d) |
| |
| Ratio of net investment income to average net assets including fee waivers and reimbursements(d) |
| Ratios to Average Net Assets (excluding interest expense): |
| Ratio of expenses to average net assets excluding fee waivers and reimbursements(d) |
| Ratio of expenses to average net assets including fee waivers and reimbursements(d) |
| |
| Ratio of net investment income to average net assets excluding fee waivers and reimbursements(d) |
| |
| Ratio of net investment income to average net assets including fee waivers and reimbursements(d) |
| Portfolio turnover rate |
See Notes to Financial Statements.
| 110 | (888) 848-7569 | www.rivernorth.com |
| For a share outstanding throughout the periods presented |
For the
Year Ended
September 30, 2019 | | For the
Year Ended
September 30, 2018 | | For the
Year Ended
September 30, 2017 | | For the
Year Ended
September 30, 2016 | | For the
Year Ended
September 30, 2015 | |
| $ | 10.08 | | | $ | 10.61 | | | $ | 10.61 | | | $ | 10.37 | | | $ | 10.88 | |
| | | | | | | | | | | | | | | | | | | |
| | 0.52 | | | | 0.47 | | | | 0.40 | | | | 0.51 | | | | 0.56 | |
| | 0.28 | | | | (0.44 | ) | | | 0.08 | | | | 0.39 | | | | (0.55 | ) |
| | 0.80 | | | | 0.03 | | | | 0.48 | | | | 0.90 | | | | 0.01 | |
| | | | | | | | | | | | | | | | | | | |
| | | | | | | | | | | | | | | | | | | |
| | (0.55 | ) | | | (0.51 | ) | | | (0.45 | ) | | | (0.64 | ) | | | (0.52 | ) |
| | – | | | | (0.04 | ) | | | (0.03 | ) | | | – | | | | – | |
| | – | | | | (0.01 | ) | | | – | | | | (0.02 | ) | | | – | |
| | (0.55 | ) | | | (0.56 | ) | | | (0.48 | ) | | | (0.66 | ) | | | (0.52 | ) |
| | 0.00 | (b) | | | 0.00 | (b) | | | 0.00 | (b) | | | 0.00 | (b) | | | 0.00 | (b) |
| | 0.25 | | | | (0.53 | ) | | | – | | | | 0.24 | | | | (0.51 | ) |
| $ | 10.33 | | | $ | 10.08 | | | $ | 10.61 | | | $ | 10.61 | | | $ | 10.37 | |
| | | | | | | | | | | | | | | | | | | |
| | 8.21 | % | | | 0.33 | % | | | 4.67 | % | | | 9.00 | % | | | 0.04 | % |
| | | | | | | | | | | | | | | | | | | |
| | | | | | | | | | | | | | | | | | | |
| $ | 1,858,103 | | | $ | 1,715,495 | | | $ | 2,024,142 | | | $ | 1,822,874 | | | $ | 1,735,108 | |
| | | | | | | | | | | | | | | | | | | |
| | | | | | | | | | | | | | | | | | | |
| | 0.86 | % | | | N/A | | | | N/A | | | | N/A | | | | N/A | |
| | 0.86 | % | | | N/A | | | | N/A | | | | N/A | | | | N/A | |
| | | | | | | | | | | | | | | | | | | |
| | | | | | | | | | | | | | | | | | | |
| | 5.13 | % | | | N/A | | | | N/A | | | | N/A | | | | N/A | |
| | | | | | | | | | | | | | | | | | | |
| | | | | | | | | | | | | | | | | | | |
| | 5.13 | % | | | N/A | | | | N/A | | | | N/A | | | | N/A | |
| | | | | | | | | | | | | | | | | | | |
| | | | | | | | | | | | | | | | | | | |
| | 0.86 | % | | | 0.86 | % | | | 0.85 | % | | | 0.86 | % | | | 0.86 | % |
| | 0.86 | % | | | 0.86 | % | | | 0.85 | % | | | 0.86 | % | | | 0.86 | % |
| | | | | | | | | | | | | | | | | | | |
| | | | | | | | | | | | | | | | | | | |
| | 5.13 | % | | | 4.60 | % | | | 3.80 | % | | | 4.92 | % | | | 5.24 | % |
| | | | | | | | | | | | | | | | | | | |
| | | | | | | | | | | | | | | | | | | |
| | 5.13 | % | | | 4.60 | % | | | 3.80 | % | | | 4.92 | % | | | 5.24 | % |
| | 60 | % | | | 37 | % | | | 50 | % | | | 36 | % | | | 29 | % |
| Annual Report | September 30, 2019 | 111 |
| RiverNorth/DoubleLine Strategic Income Fund | Class I |
| Financial Highlights | For a share outstanding throughout the periods presented |
| (a) | Based on average shares outstanding during the period. |
| (b) | Less than $0.005 per share. |
| (c) | Total return in the above table represents the rate that the investor would have earned or lost on an investment in the Fund, assuming reinvestment of dividends. |
| (d) | The ratios exclude the impact of expenses of the underlying funds in which the Fund invests as represented in the Schedule of Investments. |
See Notes to Financial Statements.
| 112 | (888) 848-7569 | www.rivernorth.com |
Intentionally Left Blank
| RiverNorth/DoubleLine Strategic Income Fund | Class R |
Financial Highlights
| Net asset value - beginning of period |
| Income/(loss) from investment operations: |
| Net investment income(a) |
| Net realized and unrealized gain/(loss) on investments |
| Total income/(loss) from investment operations |
| |
| Less distributions: |
| From net investment income |
| From net realized gain on investments |
| From tax return of capital |
| Total distributions |
| Paid-in capital from redemption fees(a) |
| Net increase/(decrease) in net asset value |
| Net asset value - end of period |
| |
| Total Return(c) |
| |
| Ratios/Supplemental Data: |
| Net assets, end of period (in thousands) |
| Ratios to Average Net Assets (including interest expense): |
| Ratio of expenses to average net assets excluding fee waivers and reimbursements(d) |
| Ratio of expenses to average net assets including fee waivers and reimbursements(d) |
| |
| Ratio of net investment income to average net assets excluding fee waivers and reimbursements(d) |
| |
| Ratio of net investment income to average net assets including fee waivers and reimbursements(d) |
| Ratios to Average Net Assets (excluding interest expense): |
| Ratio of expenses to average net assets excluding fee waivers and reimbursements(d) |
| Ratio of expenses to average net assets including fee waivers and reimbursements(d) |
| |
| Ratio of net investment income to average net assets excluding fee waivers and reimbursements(d) |
| |
| Ratio of net investment income to average net assets including fee waivers and reimbursements(d) |
| Portfolio turnover rate |
See Notes to Financial Statements.
| 114 | (888) 848-7569 | www.rivernorth.com |
For a share outstanding throughout the periods presented
For the
Year Ended
September 30,
2019 | | | For the
Year Ended
September 30,
2018 | | | For the
Year Ended
September 30,
2017 | | | For the
Year Ended
September 30,
2016 | | | For the
Year Ended
September 30,
2015 | |
| $ | 10.09 | | | $ | 10.62 | | | $ | 10.62 | | | $ | 10.39 | | | $ | 10.89 | |
| | | | | | | | | | | | | | | | | | | |
| | 0.50 | | | | 0.45 | | | | 0.38 | | | | 0.49 | | | | 0.54 | |
| | 0.28 | | | | (0.45 | ) | | | 0.08 | | | | 0.37 | | | | (0.55 | ) |
| | 0.78 | | | | – | | | | 0.46 | | | | 0.86 | | | | (0.01 | ) |
| | | | | | | | | | | | | | | | | | | |
| | | | | | | | | | | | | | | | | | | |
| | (0.52 | ) | | | (0.48 | ) | | | (0.43 | ) | | | (0.61 | ) | | | (0.49 | ) |
| | – | | | | (0.04 | ) | | | (0.03 | ) | | | – | | | | – | |
| | – | | | | (0.01 | ) | | | – | | | | (0.02 | ) | | | – | |
| | (0.52 | ) | | | (0.53 | ) | | | (0.46 | ) | | | (0.63 | ) | | | (0.49 | ) |
| | 0.00 | (b) | | | 0.00 | (b) | | | 0.00 | (b) | | | 0.00 | (b) | | | 0.00 | (b) |
| | 0.26 | | | | (0.53 | ) | | | – | | | | 0.23 | | | | (0.50 | ) |
| $ | 10.35 | | | $ | 10.09 | | | $ | 10.62 | | | $ | 10.62 | | | $ | 10.39 | |
| | | | | | | | | | | | | | | | | | | |
| | 8.03 | % | | | 0.07 | % | | | 4.40 | % | | | 8.62 | % | | | (0.12 | %) |
| | | | | | | | | | | | | | | | | | | |
| | | | | | | | | | | | | | | | | | | |
| $ | 167,141 | | | $ | 165,472 | | | $ | 208,143 | | | $ | 230,953 | | | $ | 233,319 | |
| | | | | | | | | | | | | | | | | | | |
| | 1.11 | % | | | N/A | | | | N/A | | | | N/A | | | | N/A | |
| | 1.11 | % | | | N/A | | | | N/A | | | | N/A | | | | N/A | |
| | | | | | | | | | | | | | | | | | | |
| | 4.90 | % | | | N/A | | | | N/A | | | | N/A | | | | N/A | |
| | | | | | | | | | | | | | | | | | | |
| | 4.90 | % | | | N/A | | | | N/A | | | | N/A | | | | N/A | |
| | | | | | | | | | | | | | | | | | | |
| | 1.11 | % | | | 1.11 | % | | | 1.10 | % | | | 1.11 | % | | | 1.11 | % |
| | 1.11 | % | | | 1.11 | % | | | 1.10 | % | | | 1.11 | % | | | 1.11 | % |
| | | | | | | | | | | | | | | | | | | |
| | 4.90 | % | | | 4.34 | % | | | 3.56 | % | | | 4.67 | % | | | 4.97 | % |
| | | | | | | | | | | | | | | | | | | |
| | 4.90 | % | | | 4.34 | % | | | 3.56 | % | | | 4.67 | % | | | 4.97 | % |
| | 60 | % | | | 37 | % | | | 50 | % | | | 36 | % | | | 29 | % |
| Annual Report | September 30, 2019 | 115 |
| RiverNorth/DoubleLine Strategic Income Fund | Class R |
| Financial Highlights | For a share outstanding throughout the periods presented |
| (a) | Based on average shares outstanding during the period. |
| (b) | Less than $0.005 per share. |
| (c) | Total return in the above table represents the rate that the investor would have earned or lost on an investment in the Fund, assuming reinvestment of dividends. |
| (d) | The ratios exclude the impact of expenses of the underlying funds in which the Fund invests as represented in the Schedule of Investments. |
See Notes to Financial Statements.
| 116 | (888) 848-7569 | www.rivernorth.com |
Intentionally Left Blank
| RiverNorth/Oaktree High Income Fund | Class I |
Financial Highlights
| Net asset value - beginning of period |
| Income/(loss) from investment operations: |
| Net investment income(a) |
| Net realized and unrealized gain/(loss) on investments |
| Total income/(loss) from investment operations |
| |
| Less distributions: |
| From net investment income |
| From net realized gain on investments |
| From tax return of capital |
| Total distributions |
| Paid-in capital from redemption fees(a) |
| Net increase/(decrease) in net asset value |
| Net asset value - end of period |
| |
| Total Return(c) |
| |
| Supplemental Data: |
| Net assets, end of period (in thousands) |
| Ratios to Average Net Assets (including interest expense) |
| Ratio of expenses to average net assets excluding fee waivers and reimbursements(d) |
| Ratio of expenses to average net assets including fee waivers and reimbursements(d) |
| |
| Ratio of net investment income to average net assets excluding fee waivers and reimbursements(d) |
| |
| Ratio of net investment income to average net assets including fee waivers and reimbursements(d) |
| |
| Ratios to Average Net Assets (excluding interest expense) |
| Ratio of expenses to average net assets excluding fee waivers and reimbursements(d) |
| Ratio of expenses to average net assets including fee waivers and reimbursements(d) |
| |
| Ratio of net investment income to average net assets excluding fee waivers and reimbursements(d) |
| |
| Ratio of net investment income to average net assets including fee waivers and reimbursements(d) |
| Portfolio turnover rate |
See Notes to Financial Statements.
| 118 | (888) 848-7569 | www.rivernorth.com |
For a share outstanding throughout the periods presented
For the
Year Ended
September 30, 2019 | | | For the
Year Ended
September 30, 2018 | | | For the
Year Ended
September 30, 2017 | | | For the
Year Ended
September 30, 2016 | | | For the
Year Ended
September 30, 2015 | |
| $ | 9.58 | | | $ | 9.73 | | | $ | 9.48 | | | $ | 9.18 | | | $ | 10.25 | |
| | | | | | | | | | | | | | | | | | | |
| | 0.38 | | | | 0.39 | | | | 0.35 | | | | 0.44 | | | | 0.43 | |
| | 0.07 | | | | (0.18 | ) | | | 0.31 | | | | 0.44 | | | | (0.77 | ) |
| | 0.45 | | | | 0.21 | | | | 0.66 | | | | 0.88 | | | | (0.34 | ) |
| | | | | | | | | | | | | | | | | | | |
| | | | | | | | | | | | | | | | | | | |
| | (0.48 | ) | | | (0.24 | ) | | | (0.38 | ) | | | (0.55 | ) | | | (0.53 | ) |
| | – | | | | – | | | | – | | | | – | | | | (0.20 | ) |
| | – | | | | (0.12 | ) | | | (0.03 | ) | | | (0.03 | ) | | | – | |
| | (0.48 | ) | | | (0.36 | ) | | | (0.41 | ) | | | (0.58 | ) | | | (0.73 | ) |
| | 0.00 | (b) | | | 0.00 | (b) | | | 0.00 | (b) | | | 0.00 | (b) | | | 0.00 | (b) |
| | (0.03 | ) | | | (0.15 | ) | | | 0.25 | | | | 0.30 | | | | (1.07 | ) |
| $ | 9.55 | | | $ | 9.58 | | | $ | 9.73 | | | $ | 9.48 | | | $ | 9.18 | |
| | | | | | | | | | | | | | | | | | | |
| | 4.85 | % | | | 2.22 | % | | | 7.11 | % | | | 10.09 | % | | | (3.50 | %) |
| | | | | | | | | | | | | | | | | | | |
| | | | | | | | | | | | | | | | | | | |
| $ | 45,306 | | | $ | 49,856 | | | $ | 63,842 | | | $ | 73,580 | | | $ | 88,360 | |
| | | | | | | | | | | | | | | | | | | |
| | 1.58 | %(e) | | | 1.54 | %(e) | | | 1.35 | %(e) | | | 1.34 | %(e) | | | 1.36 | %(e) |
| | 1.36 | %(e) | | | 1.36 | %(e) | | | 1.35 | %(e) | | | 1.34 | %(e) | | | 1.36 | %(e) |
| | | | | | | | | | | | | | | | | | | |
| | 3.83 | %(e) | | | 3.84 | %(e) | | | 3.59 | %(e) | | | 4.86 | %(e) | | | 4.40 | %(e) |
| | | | | | | | | | | | | | | | | | | |
| | 4.05 | %(e) | | | 4.02 | %(e) | | | 3.59 | %(e) | | | 4.86 | %(e) | | | 4.40 | %(e) |
| | | | | | | | | | | | | | | | | | | |
| | | | | | | | | | | | | | | | | | | |
| | 1.57 | %(e) | | | 1.53 | %(e) | | | 1.35 | %(e) | | | 1.34 | %(e) | | | 1.35 | %(e) |
| | 1.35 | %(e) | | | 1.35 | %(e) | | | 1.35 | %(e) | | | 1.34 | %(e) | | | 1.35 | %(e) |
| | | | | | | | | | | | | | | | | | | |
| | 3.84 | %(e) | | | 3.83 | %(e) | | | 3.59 | %(e) | | | 4.86 | %(e) | | | 4.41 | %(e) |
| | | | | | | | | | | | | | | | | | | |
| | 4.06 | %(e) | | | 4.01 | %(e) | | | 3.59 | %(e) | | | 4.86 | %(e) | | | 4.41 | %(e) |
| | 52 | % | | | 76 | % | | | 121 | % | | | 40 | % | | | 70 | % |
| Annual Report | September 30, 2019 | 119 |
| RiverNorth/Oaktree High Income Fund | Class I |
| Financial Highlights | For a share outstanding throughout the periods presented |
| (a) | Based on average shares outstanding during the period. |
| (b) | Less than $0.005 per share. |
| (c) | Total return in the above table represents the rate that the investor would have earned or lost on an investment in the Fund, assuming reinvestment of dividends. |
| (d) | The ratios exclude the impact of expenses of the underlying funds in which the Fund invests as represented in the Schedule of Investments. |
| (e) | The portion of the ratios attributable to recoupments for the years ended September 30, 2019, September 30, 2018, September 30, 2017, September 30, 2016 and September 30, 2015 were 0.00% 0.00%, 0.00%, 0.00% and 0.06%, respectively. |
See Notes to Financial Statements.
| 120 | (888) 848-7569 | www.rivernorth.com |
Intentionally Left Blank
| RiverNorth/Oaktree High Income Fund | Class R |
Financial Highlights
| Net asset value - beginning of period |
| Income/(loss) from investment operations: |
| Net investment income(a) |
| Net realized and unrealized gain/(loss) on investments |
| Total income/(loss) from investment operations |
| |
| Less distributions: |
| From net investment income |
| From net realized gain on investments |
| From tax return of capital |
| Total distributions |
| Paid-in capital from redemption fees(a) |
| Net increase/(decrease) in net asset value |
| Net asset value - end of period |
| |
| Total Return(c) |
| |
| Supplemental Data: |
| Net assets, end of period (in thousands) |
| Ratios to Average Net Assets (including interest expense) |
| Ratio of expenses to average net assets excluding fee waivers and reimbursements(d) |
| Ratio of expenses to average net assets including fee waivers and reimbursements(d) |
| |
| Ratio of net investment income to average net assets excluding fee waivers and reimbursements(d) |
| |
| Ratio of net investment income to average net assets including fee waivers and reimbursements(d) |
| |
| Ratios to Average Net Assets (excluding interest expense) |
| Ratio of expenses to average net assets excluding fee waivers and reimbursements(d) |
| Ratio of expenses to average net assets including fee waivers and reimbursements(d) |
| |
| Ratio of net investment income to average net assets excluding fee waivers and reimbursements(d) |
| |
| Ratio of net investment income to average net assets including fee waivers and reimbursements(d) |
| Portfolio turnover rate |
See Notes to Financial Statements.
| 122 | (888) 848-7569 | www.rivernorth.com |
For a share outstanding throughout the periods presented
For the
Year Ended
September 30, 2019 | | | For the
Year Ended
September 30, 2018 | | | For the
Year Ended
September 30, 2017 | | | For the
Year Ended
September 30, 2016 | | | For the
Year Ended
September 30, 2015 | |
| $ | 9.58 | | | $ | 9.72 | | | $ | 9.47 | | | $ | 9.17 | | | $ | 10.24 | |
| | | | | | | | | | | | | | | | | | | |
| | 0.36 | | | | 0.36 | | | | 0.32 | | | | 0.43 | | | | 0.41 | |
| | 0.05 | | | | (0.16 | ) | | | 0.32 | | | | 0.43 | | | | (0.77 | ) |
| | 0.41 | | | | 0.20 | | | | 0.64 | | | | 0.86 | | | | (0.36 | ) |
| | | | | | | | | | | | | | | | | | | |
| | | | | | | | | | | | | | | | | | | |
| | (0.45 | ) | | | (0.23 | ) | | | (0.36 | ) | | | (0.54 | ) | | | (0.51 | ) |
| | – | | | | – | | | | – | | | | – | | | | (0.20 | ) |
| | – | | | | (0.11 | ) | | | (0.03 | ) | | | (0.02 | ) | | | – | |
| | (0.45 | ) | | | (0.34 | ) | | | (0.39 | ) | | | (0.56 | ) | | | (0.71 | ) |
| | 0.00 | (b) | | | 0.00 | (b) | | | 0.00 | (b) | | | 0.00 | (b) | | | 0.00 | (b) |
| | (0.04 | ) | | | (0.14 | ) | | | 0.25 | | | | 0.30 | | | | (1.07 | ) |
| $ | 9.54 | | | $ | 9.58 | | | $ | 9.72 | | | $ | 9.47 | | | $ | 9.17 | |
| | | | | | | | | | | | | | | | | | | |
| | 4.48 | % | | | 2.07 | % | | | 6.83 | % | | | 9.83 | % | | | (3.76 | %) |
| | | | | | | | | | | | | | | | | | | |
| | | | | | | | | | | | | | | | | | | |
| $ | 5,937 | | | $ | 6,758 | | | $ | 7,635 | | | $ | 7,203 | | | $ | 10,368 | |
| | | | | | | | | | | | | | | | | | | |
| | 1.83 | %(e) | | | 1.79 | %(e) | | | 1.63 | %(e) | | | 1.62 | %(e) | | | 1.61 | %(e) |
| | 1.61 | %(e) | | | 1.61 | %(e) | | | 1.60 | %(e) | | | 1.60 | %(e) | | | 1.61 | %(e) |
| | | | | | | | | | | | | | | | | | | |
| | 3.58 | %(e) | | | 3.60 | %(e) | | | 3.29 | %(e) | | | 4.69 | %(e) | | | 4.14 | %(e) |
| | | | | | | | | | | | | | | | | | | |
| | 3.80 | %(e) | | | 3.78 | %(e) | | | 3.33 | %(e) | | | 4.71 | %(e) | | | 4.14 | %(e) |
| | | | | | | | | | | | | | | | | | | |
| | | | | | | | | | | | | | | | | | | |
| | 1.82 | %(e) | | | 1.78 | %(e) | | | 1.63 | %(e) | | | 1.62 | %(e) | | | 1.60 | %(e) |
| | 1.60 | %(e) | | | 1.60 | %(e) | | | 1.60 | %(e) | | | 1.60 | %(e) | | | 1.60 | %(e) |
| | | | | | | | | | | | | | | | | | | |
| | 3.59 | %(e) | | | 3.59 | %(e) | | | 3.29 | %(e) | | | 4.69 | %(e) | | | 4.15 | %(e) |
| | | | | | | | | | | | | | | | | | | |
| | 3.81 | %(e) | | | 3.77 | %(e) | | | 3.33 | %(e) | | | 4.71 | %(e) | | | 4.15 | %(e) |
| | 52 | % | | | 76 | % | | | 121 | % | | | 40 | % | | | 70 | % |
| Annual Report | September 30, 2019 | 123 |
| RiverNorth/Oaktree High Income Fund | Class R |
| Financial Highlights | For a share outstanding throughout the periods presented |
| (a) | Based on average shares outstanding during the period. |
| (b) | Less than $0.005 per share. |
| (c) | Total return in the above table represents the rate that the investor would have earned or lost on an investment in the Fund, assuming reinvestment of dividends. |
| (d) | The ratios exclude the impact of expenses of the underlying funds in which the Fund invests as represented in the Schedule of Investments. |
| (e) | The portion of the ratios attributable to recoupments for the periods ended September 30, 2019, September 30, 2018, September 30, 2017, September 30, 2016 and September 30, 2015 were 0.00%, 0.00%, 0.00%, 0.01% and 0.07%, respectively. |
See Notes to Financial Statements.
| 124 | (888) 848-7569 | www.rivernorth.com |
| RiverNorth Funds | Notes to Financial Statements |
September 30, 2019
1. ORGANIZATION
The RiverNorth Funds (the “Trust” or “Funds”) was established under the laws of Ohio by an Agreement and Declaration of Trust dated July 18, 2006 (the “Trust Agreement”). The Trust is an open-end management investment company registered under the Investment Company Act of 1940, as amended (the “1940 Act”). The Trust Agreement permits the Board of Trustees (the “Board” or “Trustees”) to authorize and issue an unlimited number of shares of beneficial interest of a separate series without par value. All classes of shares for each of the Funds have identical rights to earnings, assets and voting privileges, except for class-specific expenses and exclusive rights to vote on matters affecting only individual classes. The Funds are considered investment companies and therefore follow the Investment Company accounting and reporting guidance of the Financial Accounting Standards Board (“FASB”) Accounting Standards Codification Topic 946 Financial Services Investment Companies.
The RiverNorth Core Opportunity Fund (the “Core Opportunity Fund”) was organized as a diversified series of the Trust on July 18, 2006 and commenced investment operations on December 27, 2006. The Core Opportunity Fund offers two classes of shares, Class I Shares (inception date of August 11, 2014) and Class R Shares (inception date of December 27, 2006). The investment adviser to the Core Opportunity Fund is RiverNorth Capital Management, LLC ("RiverNorth" or the “Adviser”). The investment objective of the Core Opportunity Fund is to seek long-term capital appreciation and income.
The RiverNorth/DoubleLine Strategic Income Fund (the “Strategic Income Fund”) is a diversified series of the Trust and commenced investment operations on December 30, 2010. The Strategic Income Fund offers two classes of shares, Class I Shares and Class R Shares. The investment adviser to the Strategic Income Fund is RiverNorth. The Strategic Income Fund’s sub-adviser is DoubleLine Capital, LP (“DoubleLine”). The investment objective of the Strategic Income Fund is current income and overall total return.
The RiverNorth/Oaktree High Income Fund (the “High Income Fund”) is a diversified series of the Trust and commenced investment operations on December 28, 2012. The High Income Fund offers two classes of shares, Class I Shares and Class R Shares. The investment adviser to the High Income Fund is RiverNorth. The High Income Fund’s sub-adviser is Oaktree Capital Management, L.P. (“Oaktree Capital,” and with DoubleLine, each a “Sub-Adviser” or collectively, the “Sub-Advisers”). The investment objective of the High Income Fund is overall total return consisting of long-term capital appreciation and income.
2. SIGNIFICANT ACCOUNTING POLICIES
The following is a summary of significant accounting policies followed by the Funds. These policies are in conformity with generally accepted accounting principles in the United States of America (“GAAP”). The financial statements are prepared in accordance with GAAP, which requires management to make estimates and assumptions that affect the reported amounts and disclosures, including the disclosure of contingent assets and liabilities, in the financial statements during the reporting period. Management believes the estimates and security valuations are appropriate; however, actual results may differ from those estimates, and the security valuations reflected in the financial statements may differ from the value the Funds ultimately realize upon sale of the securities. The financial statements have been prepared as of the close of the New York Stock Exchange (“NYSE”) on the fiscal period end of the Funds.
| Annual Report | September 30, 2019 | 125 |
| RiverNorth Funds | Notes to Financial Statements |
September 30, 2019
Security Valuation:The Funds’ assets and other financial instruments are recorded at their estimated fair value as described in Note 3.
Security Transactions and Related Income:The Funds follow industry practice and record security transactions on the trade date basis. The specific identification method is used for determining gains or losses for financial statements and income tax purposes. Dividend income is recorded on the ex-dividend date or for certain foreign securities, when the information becomes available to the Funds, and interest income and expenses are recorded on an accrual basis. Discounts and premiums on securities purchased are amortized or accreted using the effective interest method. Withholding taxes on foreign dividends have been provided for in accordance with the Funds’ understanding of the applicable country’s tax rules and rates. The ability of issuers of debt securities held by the Funds to meet their obligations may be affected by economic and political developments in a specific country or region. Settlement on bank loans transactions may be in excess of seven business days. Interest only stripped mortgage backed securities ("IO Strips") are securities that receive only interest payments from a pool of mortgage loans. Little to no principal will be received by the Funds upon maturity of an IO Strip. Periodic adjustments are recorded to reduce the cost of the security until maturity, which are included in interest income.
Foreign Currency Translation:The books and records of the Funds are maintained in U.S. dollars. Investment valuations and other assets and liabilities initially expressed in foreign currencies are converted each business day into U.S. dollars based upon current exchange rates. Prevailing foreign exchange rates may generally be obtained at the close of the NYSE (normally, 4:00 p.m. Eastern time). The portion of realized and unrealized gains or losses on investments due to fluctuations in foreign currency exchange rates is not separately disclosed and is included in realized and unrealized gains or losses on investments, when applicable.
Foreign Securities:The Funds may directly purchase securities of foreign issuers. Investing in securities of foreign issuers involves special risks not typically associated with investing in securities of U.S. issuers. The risks include possible revaluation of currencies, the ability to repatriate funds, less complete financial information about companies and possible future adverse political and economic developments. Moreover, securities of many foreign issuers and their markets may be less liquid and their prices more volatile than those of securities of comparable U.S. issuers.
Certain foreign countries impose a capital gains tax which is accrued by the Funds based on the unrealized appreciation, if any, on affected securities. Any accrual would reduce a Fund’s net asset value ("NAV"). The tax is paid when the gain is realized and is included in capital gains tax in the Statements of Operations.
Other:The Funds hold certain investments which pay dividends to their shareholders based upon available funds from operations. It is possible for these dividends to exceed the underlying investments’ taxable earnings and profits resulting in the excess portion of such dividends being designated as a return of capital. Distributions received from investments in securities that represent a return of capital or capital gains are recorded as a reduction of the cost of investments or as a realized gain, respectively.
| 126 | (888) 848-7569 | www.rivernorth.com |
| RiverNorth Funds | Notes to Financial Statements |
September 30, 2019
Principal Investment Risks:All mutual funds carry a certain amount of risk. For more information on the related risks of investing in the Funds please refer to the prospectus of each Fund.
Share Valuation:The NAV is generally calculated as of the close of trading on the NYSE (normally 4:00 p.m. Eastern Time) every day the Exchange is open. The NAV is calculated by taking the total value of each Fund’s or class’ assets, subtracting its liabilities, and then dividing by the total number of shares outstanding, rounded to the nearest cent. The offering price and redemption price per share is equal to the NAV per share, except that shares of each Fund were subject to a redemption fee of 2% if redeemed within 90 days of purchase until March 4, 2019 when the redemption fee was eliminated. For the year ended September 30, 2019, the Core Opportunity Fund, Strategic Income Fund, and High Income Fund received redemption fees of $1,917, $86,318, and $16,525, respectively.
Expenses:Some expenses of the Trust can be directly attributed to a Fund or a Fund specific share class. Expenses which cannot be directly attributed are apportioned among all Funds and Fund series classes in the Trust based on average net assets or another method approved by the Board.
Federal Income Taxes:The Funds make no provision for federal income tax. Each Fund intends to qualify each year as a “regulated investment company” under subchapter M of the Internal Revenue Code of 1986, as amended, by distributing substantially all of its taxable income. If the required amount of net investment income is not distributed, the Funds could incur a tax expense.
As of and during the year ended September 30, 2019, the Funds did not have a liability for any unrecognized tax benefits. The Funds file U.S. federal, state, and local tax returns as required. The Funds’ tax returns are subject to examination by the relevant tax authorities until expiration of the applicable statute of limitations which is generally three years after the filing of the tax return for federal purposes and four years for most state returns. Tax returns for open years have incorporated no uncertain tax positions that require a provision for income taxes.
The Funds recognize interest and penalties, if any, related to unrecognized tax benefits as income tax expenses in the Statements of Operations. During the year ended September 30, 2019, the Funds did not incur any interest or penalties.
Distributions to Shareholders:Distributions to shareholders, which are determined in accordance with income tax regulations, are recorded on the ex-dividend date. The treatment for financial reporting purposes of distributions made to shareholders during the year from net investment income or net realized capital gains may differ from their ultimate treatment for federal income tax purposes. These differences are caused primarily by differences in the timing of recognition of certain components of income, expense, or realized capital gain for federal income tax purposes. Where such differences are permanent in nature, they are reclassified in the components of the net assets based on their ultimate characterization for federal income tax purposes. Any such reclassification will have no effect on net assets, results of operations or net asset values per share of the Funds.
| Annual Report | September 30, 2019 | 127 |
| RiverNorth Funds | Notes to Financial Statements |
September 30, 2019
3. SECURITIES VALUATION AND FAIR VALUE MEASUREMENTS
Fair value is defined as the price that a Fund might reasonably expect to receive upon selling an investment in a timely transaction to an independent buyer in the principal or most advantageous market of the investment. GAAP establishes a three-tier hierarchy to maximize the use of observable market data and minimize the use of unobservable inputs and to establish classification of fair value measurements for disclosure purposes.
Inputs refer broadly to the assumptions that market participants would use in pricing the asset or liability, including assumptions about risk, for example, the risk inherent in a particular valuation technique used to measure fair value including using such a pricing model and/or the risk inherent in the inputs to the valuation technique. Inputs may be observable or unobservable. Observable inputs are inputs that reflect the assumptions market participants would use in pricing the asset or liability developed based on market data obtained from sources independent of the reporting entity. Unobservable inputs are inputs that reflect the reporting entity’s own assumptions about the assumptions market participants would use in pricing the asset or liability developed based on the best information available in the circumstances.
Various inputs are used in determining the value of the Funds’ investments. These inputs are summarized in the three broad levels listed below.
| ● | Level 1 – Unadjusted quoted prices in active markets for identical, unrestricted assets or liabilities that a Fund has the ability to access at the measurement date; |
| ● | Level 2 – Quoted prices which are not active, quoted prices for similar assets or liabilities in active markets or inputs other than quoted prices that are observable (either directly or indirectly) for substantially the full term of the asset or liability; and |
| ● | Level 3 – Significant unobservable prices or inputs (including the Funds’ own assumptions in determining the fair value of investments) where there is little or no market activity for the asset or liability at the measurement date. |
The inputs used to measure fair value may fall into different levels of the fair value hierarchy. In such cases, for disclosure purposes, the level in the fair value hierarchy within which the fair value measurement falls in its entirety is determined based on the lowest level input that is significant to the fair value measurement in its entirety.
Equity securities, including common stocks, rights and warrants, closed-end funds, exchange-traded funds, preferred stocks and business development companies are generally valued by using market quotations, but may be valued on the basis of prices furnished by a pricing service when the Adviser or a Sub-Adviser believes such prices more accurately reflect the fair market value of such securities. Securities that are traded on any stock exchange are generally valued by the pricing service at the last quoted sale price. Lacking a last sale price, an exchange traded security is generally valued by the pricing service at its last bid price. Securities traded in the NASDAQ over-the-counter market are generally valued by the pricing service at the NASDAQ Official Closing Price. When using the market quotations or close prices provided by the pricing service and when the market is considered active, the security will be classified as a Level 1 security. Sometimes, an equity security owned by the Funds will be valued by the pricing service with factors other than market quotations or when the market is considered inactive. When this happens, the security will be classified as a Level 2 security. When market quotations are not readily available, when the Adviser or a Sub-Adviser determines that the market quotation or the price provided by the pricing service does not accurately reflect the current fair value, or when restricted or illiquid securities are being valued, such securities are valued as determined in good faith by the Adviser, Sub-Adviser, or valuation committee in conformity with guidelines adopted by and subject to review by the Board. These securities will be categorized as Level 3 securities.
| 128 | (888) 848-7569 | www.rivernorth.com |
| RiverNorth Funds | Notes to Financial Statements |
September 30, 2019
Investments in mutual funds, including short-term investments and open-end funds, are generally priced at the ending NAV provided by the service agent of the funds. These securities will be categorized as Level 1 securities.
Domestic and foreign fixed income securities, including foreign and U.S. corporate bonds, convertible corporate bonds, U.S. Government bonds and notes, foreign government bonds and notes, supranationals and foreign agencies, non-agency collateralized mortgage obligations, U.S. Government/Agency mortgage backed securities, business development company notes, bank loans, collateralized loan obligations, municipal bonds, and high yield debt, as well as non-exchange traded derivatives, including forward foreign currency contracts, are normally valued on the basis of quotes obtained from brokers and dealers or independent pricing services. Foreign currency positions, including forward foreign currency contracts, are priced at the mean between the closing bid and asked prices at 4:00 p.m. Eastern Time. Prices obtained from independent pricing services typically use information provided by market makers or estimates of market values obtained from yield data relating to investments or securities with similar characteristics. Data used to establish quotes includes analysis of cash flows, pre-payment speeds, default rates, delinquency assumptions and assumptions regarding collateral and loss assumptions. These securities will be classified as Level 2 securities.
Short-term investments in fixed income securities, with maturities of less than 60 days when acquired, or which subsequently are within 60 days of maturity, are valued by using the amortized cost method of valuation, which the Board has determined will represent fair value. These securities will be classified as Level 2 securities.
In accordance with the Funds’ good faith pricing guidelines, the Adviser, Sub-Adviser, or valuation committee is required to consider all appropriate factors relevant to the value of securities for which it has determined other pricing sources are not available or reliable as described above. No single standard exists for determining fair value, because fair value depends upon the circumstances of each individual case. As a general principle, the current fair value of an issue of securities being valued by the Adviser, Sub-Adviser, or valuation committee would appear to be the amount which the owner might reasonably expect to receive for them upon their current sale. Methods which are in accordance with this principle may, for example, be based on (i) a multiple of earnings; (ii) discounted cash flow models; (iii) weighted average cost or weighted average price; (iv) a discount from market of a similar freely traded security (including a derivative security or a basket of securities traded on other markets, exchanges or among dealers); or (v) yield to maturity with respect to debt issues, or a combination of these and other methods. Good faith pricing is permitted if, in the Adviser’s, a Sub-Adviser’s, or the valuation committee’s opinion, the validity of market quotations appears to be questionable based on factors such as evidence of a thin market in the security based on a small number of quotations, a significant event occurs after the close of a market but before a Fund’s NAV calculation that may affect a security’s value, or the Adviser or a Sub-Adviser is aware of any other data that calls into question the reliability of market quotations.
| Annual Report | September 30, 2019 | 129 |
| RiverNorth Funds | Notes to Financial Statements |
September 30, 2019
Good faith pricing may also be used in instances when the bonds in which the Funds invest default or otherwise cease to have market quotations readily available. Investments in foreign securities, junk bonds, or other thinly traded securities are more likely to trigger good faith pricing than other securities.
The following is a summary of the inputs used at September 30, 2019 in valuing the Funds’ assets and liabilities:
Core Opportunity Fund
| | | Valuation Inputs | | | | | |
| Investments in Securities at Value* | | Level 1 | | | Level 2 | | | Level 3 | | | Total | |
| Closed-End Funds | | $ | 69,470,628 | | | $ | – | | | $ | – | | | $ | 69,470,628 | |
| Business Development Companies | | | 1,601,873 | | | | – | | | | – | | | | 1,601,873 | |
| Common Stocks | | | 5,256,571 | | | | – | | | | – | | | | 5,256,571 | |
| Exchange Traded Funds | | | 23,580,500 | | | | – | | | | – | | | | 23,580,500 | |
| Preferred Stocks | | | 794,497 | | | | – | | | | – | | | | 794,497 | |
| Business Development Company Notes | | | 694,375 | | | | – | | | | – | | | | 694,375 | |
| Rights | | | 29,776 | | | | – | | | | – | | | | 29,776 | |
| Warrants | | | 170,700 | | | | – | | | | – | | | | 170,700 | |
| Short-Term Investments | | | 5,325,285 | | | | – | | | | – | | | | 5,325,285 | |
| Total | | $ | 106,924,205 | | | $ | – | | | $ | – | | | $ | 106,924,205 | |
Strategic Income Fund
| | | Valuation Inputs | | | | | |
| Investments in Securities at Value* | | Level 1 | | | Level 2 | | | Level 3 | | | Total | |
| Closed-End Funds | | $ | 574,839,647 | | | $ | – | | | $ | – | | | $ | 574,839,647 | |
| Business Development Companies | | | 4,576,391 | | | | – | | | | – | | | | 4,576,391 | |
| Common Stocks | | | 6,413,199 | | | | – | | | | – | | | | 6,413,199 | |
| Open-End Funds | | | 30,156,442 | | | | – | | | | – | | | | 30,156,442 | |
| Preferred Stocks | | | 40,495,291 | | | | – | | | | – | | | | 40,495,291 | |
| Business Development Company Notes | | | 23,611,494 | | | | – | | | | – | | | | 23,611,494 | |
| Foreign Corporate Bonds | | | – | | | | 95,731,153 | | | | – | | | | 95,731,153 | |
| U.S. Corporate Bonds | | | – | | | | 88,346,997 | | | | 5,050,000 | | | | 93,396,997 | |
| Convertible Corporate Bonds | | | – | | | | 7,773,546 | | | | – | | | | 7,773,546 | |
| Foreign Government Bonds and Notes, Supranationals and Foreign Agencies | | | – | | | | 5,121,951 | | | | – | | | | 5,121,951 | |
| Bank Loans | | | – | | | | 23,730,338 | | | | – | | | | 23,730,338 | |
| Collateralized Loan Obligations | | | – | | | | 42,918,556 | | | | – | | | | 42,918,556 | |
| Equity - Linked Notes | | | – | | | | – | | | | 11,250 | | | | 11,250 | |
| Non-Agency Collateralized Mortgage Obligations | | | – | | | | 410,644,284 | | | | – | | | | 410,644,284 | |
| U.S. Government Bonds and Notes | | | – | | | | 269,248,745 | | | | – | | | | 269,248,745 | |
| Municipal Bonds | | | – | | | | 408,648 | | | | – | | | | 408,648 | |
| U.S. Government / Agency Mortgage Backed Securities | | | – | | | | 216,713,541 | | | | – | | | | 216,713,541 | |
| Warrants | | | – | | | | – | | | | – | | | | – | |
| Short-Term Investments | | | 102,812,472 | | | | 82,435,674 | | | | – | | | | 185,248,146 | |
| Total | | $ | 782,904,936 | | | $ | 1,243,073,433 | | | $ | 5,061,250 | | | $ | 2,031,039,619 | |
| 130 | (888) 848-7569 | www.rivernorth.com |
| RiverNorth Funds | Notes to Financial Statements |
September 30, 2019
High Income Fund
| | | Valuation Inputs | | | | | |
| Investments in Securities at Value* | | Level 1 | | | Level 2 | | | Level 3 | | | Total | |
| Closed-End Funds | | $ | 10,066,588 | | | $ | – | | | $ | – | | | $ | 10,066,588 | |
| Common Stocks | | | 675 | | | | – | | | | 30,185 | | | | 30,860 | |
| Preferred Stocks | | | – | | | | – | | | | 92,000 | | | | 92,000 | |
| Bank Loans | | | – | | | | 19,574,251 | | | | 20,361 | | | | 19,594,612 | |
| High Yield Debt | | | – | | | | 16,222,829 | | | | – | | | | 16,222,829 | |
| Warrants | | | 2 | | | | – | | | | 3,714 | | | | 3,716 | |
| Short-Term Investments | | | 4,573,097 | | | | – | | | | – | | | | 4,573,097 | |
| Total | | $ | 14,640,362 | | | $ | 35,797,080 | | | $ | 146,260 | | | $ | 50,583,702 | |
| | | Valuation Inputs | | | | | |
| Other Financial Instruments** | | Level 1 | | | Level 2 | | | Level 3 | | | Total | |
| Assets | | | | | | | | | | | | | | | | |
| Forward Foreign Currency Contracts | | $ | – | | | $ | 108,693 | | | $ | – | | | $ | 108,693 | |
| Liabilities | | | | | | | | | | | | | | | | |
| Forward Foreign Currency Contracts | | $ | – | | | $ | (6,976 | ) | | $ | – | | | $ | (6,976 | ) |
| Total | | $ | – | | | $ | 101,717 | | | $ | – | | | $ | 101,717 | |
| * | Refer to each Fund’s Schedule of Investments for a listing of securities by type. |
| ** | Other financial instruments are derivative instruments reflected in the Schedule of Investments. |
| Annual Report | September 30, 2019 | 131 |
| RiverNorth Funds | Notes to Financial Statements |
September 30, 2019
The changes of the fair value of investments for which the Funds have used Level 3 inputs to determine the fair value are as follows:
| Asset Type | | Balance as of September 30, 2018 | | | Accrued Discount/ premium | | | Corporate Action | | | Realized Gain/ (Loss) | | | Change in Unrealized Appreciation/ Depreciation | | | Purchases | | | Sales Proceeds | | | Transfer into Level 3 | | | Transfer Out of Level 3 | | | Balance as of September 30, 2019 | | | Net change in unrealized appreciation/ (depreciation) included in the Statements of Operations attributable to Level 3 investments held at September 30, 2019 | |
| Strategic Income Fund | | | | | | | | | | | | | | | | | | | | | | | | | | | | | | | |
| U.S. Corporate Bonds | | $ | – | | | $ | – | | | $ | – | | | $ | – | | | $ | – | | | $ | – | | | $ | – | | | $ | 5,050,000 | (a) | | $ | – | | | $ | 5,050,000 | | | $ | 72,400 | |
| Equity-Linked Notes | | | – | | | | – | | | | 11,250 | | | | – | | | | – | | | | – | | | | – | | | | – | | | | – | | | | 11,250 | | | | – | |
| | | $ | – | | | $ | – | | | $ | 11,250 | | | $ | – | | | $ | – | | | $ | – | | | $ | – | | | $ | 5,050,000 | | | $ | – | | | $ | 5,061,250 | | | $ | 72,400 | |
| | | | | | | | | | | | | | | | | | | | | | | | | | | | | | | | | | | | | | | | | | | | | |
| High Income Fund | | | | | | | | | | | | | | | | | | | | | | | | | | | | | | | | | | | | | | | | | | | | |
| Preferred Stocks | | $ | 75,000 | | | $ | – | | | $ | – | | | $ | – | | | $ | – | | | $ | 17,000 | | | $ | – | | | $ | – | | | $ | – | | | $ | 92,000 | | | $ | – | |
| Bank Loans | | | – | | | | (1,639 | ) | | | – | | | | (183 | ) | | | (46,909 | ) | | | 69,942 | | | | (850 | ) | | | – | | | | – | | | | 20,361 | | | | (46,909 | ) |
| Common Stocks | | | – | | | | – | | | | – | | | | – | | | | (31,315 | ) | | | 61,500 | | | | – | | | | – | | | | – | | | | 30,185 | | | | (31,315 | ) |
| High Yield Debt | | | – | | | | – | | | | – | | | | – | | | | – | | | | – | | | | – | | | | – | | | | – | | | | – | | | | (28,912 | ) |
| Warrants | | | – | | | | – | | | | – | | | | – | | | | 1,352 | | | | 2,362 | | | | – | | | | – | | | | – | | | | 3,714 | | | | 1,352 | |
| | | $ | 75,000 | | | $ | (1,639 | ) | | $ | – | | | $ | (183 | ) | | $ | (76,872 | ) | | $ | 150,804 | | | $ | (850 | ) | | $ | – | | | $ | – | | | $ | 146,260 | | | $ | (105,784 | ) |
| (a) | Transferred from Level 2 to Level 3 because of a lack of observable market data |
The table below provides additional information about the Level 3 Fair Value Measurements as of September 30, 2019:
Quantitative Information about Level 3 Fair Value Measurements
Strategic Income Fund
| Asset Class | Fair Value (USD) | Valuation Technique | Unobservable Inputs(a) | Value/Range (Weighted Average) |
| U.S. Corporate Bonds | $5,050,000 | Vendor Price | Broker Quote | N/A |
| Equity-Linked Note | 11,250 | Vendor Price | Broker Quote | N/A |
| 132 | (888) 848-7569 | www.rivernorth.com |
| RiverNorth Funds | Notes to Financial Statements |
September 30, 2019
High Income Fund
| Asset Class | Fair Value (USD) | Valuation
Technique | Unobservable Inputs(a) | Value/Range
(Weighted Average) |
| Preferred Stocks | $92,000 | Market Approach | EBITDA Multiple | 9x |
| | | Market Approach | Discount for lack of marketability | 16.43% |
| Bank Loans | 20,361 | Vendor Price | Broker Quote | N/A |
| Common Stocks | 30,185 | Vendor Price | Broker Quote | N/A |
| Warrants | 3,714 | Implied Equity Value | Enterprise Value | $487.5 million |
| (a) | A change to the unobservable input may result in a significant change to the value of the investment as follows: |
| Unobservable Inputs | Impact to Value if Input Increases | Impact to Value if Input Decreases |
| Broker Quote | Increase | Decrease |
| EBITDA Multiple | Increase | Decrease |
| Enterprise Value | Increase | Decrease |
| Discount for lack of marketability | Decrease | Increase |
4. DERIVATIVE FINANCIAL INSTRUMENTS
The following discloses the Funds’ use of derivative instruments. The Funds’ investment objectives not only permit the Funds to purchase investment securities, they also allow the Funds to enter into various types of derivative contracts such as forward foreign currency contracts. In doing so, the Funds will employ strategies in differing combinations to permit them to increase, decrease, or change the level or types of exposure to market factors. Central to those strategies are features inherent to derivatives that make them more attractive for this purpose than equity or debt securities; they require little or no initial cash investment, they can focus exposure on only certain selected risk factors, and they may not require the ultimate receipt or delivery of the underlying security (or securities) to the contract. This may allow the Funds to pursue their objectives more quickly and efficiently than if they were to make direct purchases or sales of securities capable of affecting a similar response to market factors.
Market Risk Factors: In pursuit of their investment objectives, the Funds may seek to use derivatives to increase or decrease their exposure to the following market risk factors:
Foreign Exchange Rate Risk: Foreign exchange rate risk relates to the change in the U.S. dollar value of a security held that is denominated in a foreign currency. The value of a foreign currency denominated security will decrease as the dollar appreciates against the currency, while the value of the foreign currency denominated security will increase as the dollar depreciates against the currency.
| Annual Report | September 30, 2019 | 133 |
| RiverNorth Funds | Notes to Financial Statements |
September 30, 2019
Risk of Investing in Derivatives
The Funds’ use of derivatives can result in losses due to unanticipated changes in the market risk factors and the overall market. Derivatives may have little or no initial cash investment relative to their market value exposure and therefore can produce significant gains or losses in excess of their cost. This use of embedded leverage allows the Funds to increase their market value exposure relative to their net assets and can substantially increase the volatility of the Funds’ performance. Additional associated risks from investing in derivatives also exist and potentially could have significant effects on the valuation of the derivative and the Funds. Typically, the associated risks are not the risks that the Funds are attempting to increase or decrease exposure to, per their investment objectives, but are the additional risks from investing in derivatives.
Examples of these associated risks are liquidity risk, which is the risk that the Funds will not be able to sell the derivative in the open market in a timely manner, and counterparty credit risk, which is the risk that the counterparty will not fulfill its obligation to the Funds.
Forward Foreign Currency Contracts
The Funds may engage in currency transactions with counterparties to hedge the value of portfolio securities denominated in particular currencies against fluctuations in relative value, to gain or reduce exposure to certain currencies, or to generate income or gains. A forward foreign currency contract is an agreement between two parties to buy and sell a currency at a set price on a future date. During the year ended September 30, 2019, the High Income Fund engaged in forward foreign currency contracts. The contracts are marked-to-market daily and the change in value is recorded by the High Income Fund as an unrealized gain or loss. When a forward foreign currency contract is extinguished, through either delivery or offset by entering into another forward foreign currency contract, the High Income Fund records a realized gain or loss equal to the difference between the value of the contract at the time it was opened and the value of the contract at the time it was extinguished.
Forward foreign currency contracts involve elements of market risk in excess of the amounts reflected in the Statement of Assets and Liabilities. The High Income Fund bears the risk of an unfavorable change in the foreign exchange rate underlying the forward foreign currency contract. Risks may also arise upon entering into these contracts from the potential inability of the counterparties to meet the terms of their contracts.
If required by the forward foreign currency contracts, the High Income Fund has segregated sufficient assets as collateral to satisfy the current obligations with respect to forward foreign currency contracts, and this is reflected as Cash segregated at custodian for forward foreign currency contracts on the High Income Fund’s Statement of Assets and Liabilities.
| 134 | (888) 848-7569 | www.rivernorth.com |
| RiverNorth Funds | Notes to Financial Statements |
September 30, 2019
The effect of derivatives instruments on each Fund's Statement of Assets and Liabilities as of September 30, 2019:
| | | | | Asset Derivatives | |
| Fund | | Risk Exposure | | Statement of Assets
and Liabilities Location | | | Fair Value | |
| High Income Fund | | Foreign exchange rate risk (Forward foreign currency contracts) | | Unrealized appreciation on forward foreign currency contracts | | $ | 108,693 | |
| | | | | Liabilities Derivatives | |
| Fund | | Risk Exposure | | Statement of Assets
and Liabilities Location | | | Fair Value | |
| High Income Fund | | Foreign exchange rate risk (Forward foreign currency contracts) | | Unrealized depreciation on forward foreign currency contracts | | $ | (6,976 | ) |
The effect of derivatives instruments on each Fund's Statement of Operations for the year ended September 30, 2019:
| Fund | | Risk Exposure | | Statement of Operations
Location | | Realized
Gain/(Loss)
on
Derivatives
Recognized
in Income | | | Change in
Unrealized
Appreciation/
(Depreciation)
on Derivatives
Recognized in
Income | |
| High Income Fund | | Foreign exchange rate risk (Forward foreign currency contracts) | | Net realized gain/(loss) on Forward Foreign Currency Contracts/ Net change in unrealized appreciation/ depreciation on Forward Foreign Currency Contracts | | $ | 850,342 | | | $ | 67,527 | |
The forward currency contracts average notional amount during the year ended September 30, 2019, is noted below.
| Fund | | Average Notional Amount of Forward Foreign Currency Contracts | |
| High Income Fund | | $ | 8,649,261 | |
Offsetting Arrangements: Certain derivative contracts are executed under standardized netting agreements. A derivative netting arrangement creates an enforceable right of set-off that becomes effective, and affects the realization of settlement on individual assets, liabilities and collateral amounts, only following a specified event of default or early termination. Default events may include the failure to make payments or deliver securities timely, material adverse changes in financial condition or insolvency, the breach of minimum regulatory capital requirements, or loss of license, charter or other legal authorization necessary to perform under the contract. These agreements mitigate counterparty credit risk by providing for a single net settlement with a counterparty of all financial transactions covered by the agreement in an event of default as defined under such agreement.
| Annual Report | September 30, 2019 | 135 |
| RiverNorth Funds | Notes to Financial Statements |
September 30, 2019
The following table presents derivative financial instruments that are subject to enforceable netting arrangements, collateral arrangements or other similar agreements as of September 30, 2019.
Offsetting of Derivatives Asset
| | | | | | | | | | | Gross Amounts Not
Offset in the Statements
of Assets and Liabilities | | | | |
| | | Gross
Amounts of
Recognized
Assets | | | Gross
Amounts
Offset in the
Statements
of Assets
and
Liabilities | | | Net Amounts
Presented in
the
Statements
of Assets
and
Liabilities | | | Financial
Instruments
Available for
Offset(a) | | | Cash
Collateral
Received(a) | | | Net Amount | |
| High Income Fund | | | | | | | | | | | | | | | | | | |
| Forward Foreign Currency Contracts | | $ | 108,693 | | | $ | – | | | $ | 108,693 | | | $ | (6,976 | ) | | $ | – | | | $ | 101,717 | |
| Total | | $ | 108,693 | | | $ | – | | | $ | 108,693 | | | $ | (6,976 | ) | | $ | – | | | $ | 101,717 | |
Offsetting of Derivatives Liability
| | | | | | | | | | | Gross Amounts Not
Offset in the Statement of
Assets and Liabilities | | | | |
| | | Gross
Amounts of
Recognized
Liabilities | | | Gross
Amounts
Offset in the
Statement
of Assets
and
Liabilities | | | Net Amounts
Presented in
the
Statement of
Assets and
Liabilities | | | Financial
Instruments
Available for
Offset(a) | | | Cash
Collateral
Pledged(a) | | | Net Amount | |
| High Income Fund | | | | | | | | | | | | | | | | | | |
| Forward Foreign Currency Contracts | | $ | 6,976 | | | | | | | $ | 6,976 | | | $ | (6,976 | ) | | $ | – | | | $ | – | |
| Total | | $ | 6,976 | | | $ | – | | | $ | 6,976 | | | $ | (6,976 | ) | | $ | – | | | $ | – | |
| (a) | These amounts are limited to the derivatives asset/liability balance and, accordingly, do not include excess collateral received/pledged. |
| 136 | (888) 848-7569 | www.rivernorth.com |
| RiverNorth Funds | Notes to Financial Statements |
September 30, 2019
5. LOAN PARTICIPATIONS AND ASSIGNMENTS
The Strategic Income Fund and High Income Fund may each invest in direct debt instruments which are interests in amounts owed to lenders or lending syndicates by corporate, governmental, or other borrowers. The Strategic Income Fund and High Income Fund will normally invest in corporate debt issuers in North America and Europe. The Strategic Income Fund’s and High Income Fund’s investments in loans may be in the form of participations in loans or assignments of all or a portion of loans from third parties. A loan is often administered by a bank or other financial institution (the “lender”) that acts as agent for all holders. The agent administers the terms of the loan, as specified in the loan agreement. The Strategic Income Fund and High Income Fund may each invest in multiple series or tranches of a loan, which may have varying terms and carry different associated risks. The Strategic Income Fund and High Income Fund will generally purchase assignments of these loans, in which case they will typically become lenders for purposes of the relevant loan agreement with direct contractual rights against the borrower, including the right to receive payments of principal and interest. When purchasing participation interests in a loan, the Strategic Income Fund and High Income Fund generally have no right to enforce compliance with the terms of the loan agreement with the borrower. As a result, the Strategic Income Fund and High Income Fund may each be subject to the credit risk of both the borrower and the lender that is selling the loan agreement. The Strategic Income Fund and High Income Fund may each enter into unfunded loan commitments, which are contractual obligations for future funding. Unfunded loan commitments represent a future obligation in full, even though a percentage of the notional loan amounts may not be utilized by the borrower. When investing in a loan participation, the Strategic Income Fund and High Income Fund have the right to receive payments of principal, interest and any fees to which they are entitled only from the lender selling the loan agreement and only upon receipt of payments by the lender from the borrower. The Strategic Income Fund and High Income Fund may each receive a commitment fee based on the undrawn portion of the underlying line of credit portion of a floating rate loan. In certain circumstances, the Strategic Income Fund and High Income Fund may each receive a penalty fee upon the prepayment of a floating rate loan by a borrower. Fees earned are recorded as a component of interest income or interest expense, respectively, on the Statements of Operations. At September 30, 2019, the Strategic Income Fund and High Income Fund had $895,801 and $8,129 , respectively, in unsettled domestic and foreign loan commitments.
6. ADVISORY FEES, TRUSTEE FEES AND OTHER AGREEMENTS
The Adviser serves as the investment adviser to the Funds. Under the terms of the management agreement (the “Agreement”), the Adviser, subject to the supervision of the Board, provides or arranges to be provided to the Funds such investment advice as it deems advisable and will furnish or arrange to be furnished a continuous investment program for the Funds consistent with the Funds’ investment objectives and policies. As compensation for its management services, the Funds are obligated to pay the Adviser a fee computed and accrued daily and paid monthly in arrears at an annual rate of the average daily net assets of the Funds.
The Chief Compliance Officer (“CCO”) of the Funds is an affiliate of the Funds. For the year ended September 30, 2019, the total related amounts paid by the Funds for CCO fees are included in Compliance expenses on each Fund’s Statement of Operations.
| Annual Report | September 30, 2019 | 137 |
| RiverNorth Funds | Notes to Financial Statements |
September 30, 2019
The following table reflects the Funds’ contractual management fee rates (expressed as an annual rate).
| Fund | Contractual Management Fee |
| Core Opportunity Fund | 1.00% |
| Strategic Income Fund | 0.75% |
| High Income Fund | 1.00% |
The Adviser has contractually agreed to waive the High Income Fund’s management fees and/or reimburse expenses (excluding brokerage fees and commissions; borrowing costs such as (a) interest and (b) dividends on securities sold short; taxes; indirect expenses incurred by the underlying funds in which the Fund invests; and extraordinary expenses) of the High Income Fund until at least January 31, 2020 in order to maintain the Total Annual Fund Operating Expenses After Fee Deferral and/or Reimbursement at 1.60% and 1.35% for the Class R shares and Class I shares, respectively. This agreement may be terminated by the Fund’s Board of Trustees on 60 days written notice to the Adviser. Any waiver or reimbursement is subject to repayment by the High Income Fund within three years following the fiscal year in which the expenses occurred if the Fund is able to make the repayment without exceeding its current expense limitation and the repayment is approved by the Board of Trustees.
As of the year ended September 30, 2019, reimbursed expenses for the High Income Fund subject to potential recovery by year of expiration are as follows:
| | | Expiring September 30, | |
| | | 2020 | | | 2021 | | | 2022 | |
| High Income Fund | | | | | | | | | |
| Class I | | | N/A | | | $ | 98,502 | | | $ | 104,992 | |
| Class R | | $ | 2,773 | | | $ | 13,126 | | | $ | 13,864 | |
| Total | | $ | 2,773 | | | $ | 111,628 | | | $ | 118,856 | |
For the year ended September 30, 2019, the Adviser opted to forgo $169,201 in management fees in the Strategic Income Fund related to the Fund's investment in an affiliate fund, the High Income Fund. This waiver of affiliated management fees is reflected net within the Investment Adviser Fee on the Statement of Operations.
DoubleLine is the investment sub-adviser to the Strategic Income Fund. Oaktree Capital is the investment sub-adviser to the High Income Fund. Under the terms of the sub-advisory agreements, the Sub-Advisers, subject to the supervision of the Adviser and the Board of Trustees, provide to the Strategic Income Fund and the High Income Fund such investment advice as deemed advisable and will furnish a continuous investment program for the portion of assets managed in the respective Fund consistent with the respective Fund's investment objective and policies. As compensation for its sub-advisory services, the Adviser, out of its own fee, is obligated to pay each Sub-Adviser a fee computed and accrued daily and paid monthly in arrears based on an annual rate of the average daily net assets of the Strategic Income Fund and the High Income Fund.
| 138 | (888) 848-7569 | www.rivernorth.com |
| RiverNorth Funds | Notes to Financial Statements |
September 30, 2019
ALPS Fund Services, Inc. (“ALPS”) provides the Funds with fund administration and fund accounting services. ALPS also serves as transfer agent, dividend paying and shareholder servicing agent for the Funds (“Transfer Agent”).
State Street Bank & Trust, Co. serves as the Funds’ custodian.
The Funds have adopted a plan pursuant to Rule 12b-1 under the Investment Company Act of 1940, as amended (the “Plan”). The Plan permits the Funds to pay the Adviser for distribution and promotion expenses related to marketing shares of the Funds. The amount payable annually by the Class R shares of the Core Opportunity Fund, the Class R Shares of the Strategic Income Fund, and the Class R Shares of the High Income Fund is 0.25% of the average daily net assets. Under the Plan the Trust may engage in any activities related to the distribution of Fund shares. The expenses of the Funds’ Plan are reflected as 12b-1 fees in the Statements of Operations.
The Funds have entered into a Distribution Agreement with ALPS Distributors, Inc. (“the Distributor”), an affiliate of ALPS, to provide distribution services to the Funds. The Distributor serves as underwriter/distributor of shares of the Funds.
Officers of the Trust and Trustees who are “interested persons” of the Trust or the Adviser received no salary or fees from the Trust except for the Chief Compliance Officer for compliance expenses. Each Trustee who is not an “interested person” receives a fee of $36,000 per year, plus $1,500 per meeting attended from the Trust. In addition, the chair of the audit committee receives $500 annually and the lead independent Trustee receives $250 annually. The Trust reimburses each Trustee and Officer for his or her travel and other expenses relating to attendance at such meetings. The Trustees are also compensated for their services as independent directors of other funds within the fund complex.1
A Trustee and certain Officers of the Trust are also employees of the Adviser, the Distributor or ALPS Fund Services, Inc.
| 1 | The Fund Complex consists of the RiverNorth Core Opportunity Fund, the RiverNorth/DoubleLine Strategic Income Fund, and the RiverNorth/Oaktree High Income Fund, each a series of the RiverNorth Funds Trust, and the RiverNorth Opportunities Fund, Inc., RiverNorth/DoubleLine Strategic Opportunity Fund, Inc., the RiverNorth Marketplace Lending Corporation, RiverNorth Opportunistic Municipal Income Fund, Inc., and RiverNorth Managed Duration Municipal Income Fund, Inc. |
7. TAX BASIS INFORMATION
Tax Basis of Distributions to Shareholders: The character of distributions made during the year from net investment income or net realized gains may differ from its ultimate characterization for federal income tax purposes. Also, due to the timing of dividend distributions, the fiscal year in which amounts are distributed may differ from the fiscal year in which the income or realized gain were recorded by a Fund.
| Annual Report | September 30, 2019 | 139 |
| RiverNorth Funds | Notes to Financial Statements |
September 30, 2019
The tax character of distributions paid by the Funds during the fiscal year ended September 30, 2019, was as follows:
| | | Ordinary
Income | | | Tax-Exempt
Income | | | Distributions
paid from
Long-Term
Capital Gain | | | Return of
Capital | | | Total | |
| Core Opportunity Fund | | $ | 5,255,331 | | | $ | 189,479 | | | $ | 27,644,230 | | | $ | – | | | $ | 33,089,040 | |
| Strategic Income Fund | | | 101,073,877 | | | | – | | | | – | | | | – | | | | 101,073,877 | |
| High Income Fund | | | 2,635,911 | | | | – | | | | – | | | | – | | | | 2,635,911 | |
The tax character of distributions paid by the Funds during the fiscal year ended September 30, 2018, was as follows:
| | | Ordinary
Income | | | Tax-Exempt
Income | | | Distributions
paid from
Long-Term
Capital Gain | | | Return of
Capital | | | Total | |
| Core Opportunity Fund | | $ | 7,867,901 | | | $ | 135,673 | | | $ | 41,398,933 | | | $ | – | | | $ | 49,402,507 | |
| Strategic Income Fund | | | 100,095,220 | | | | – | | | | 7,270,309 | | | | 1,899,952 | | | | 109,265,481 | |
| High Income Fund | | | 1,503,303 | | | | – | | | | – | | | | 731,596 | | | | 2,234,899 | |
Components of Distributable Earnings on a Tax Basis: The tax components of distributable earnings are determined in accordance with income tax regulations which may differ from the composition of net assets reported under GAAP. The amounts reclassified did not affect net assets. The reclassifications were as follows:
| | | Paid-in Capital | | | Total Distributable
Earnings | |
| Core Opportunity Fund | | $ | (46,875 | ) | | $ | 46,875 | |
| Strategic Income Fund | | | (362,739 | ) | | | 362,739 | |
| High Income Fund | | | (25,002 | ) | | | 25,002 | |
| 140 | (888) 848-7569 | www.rivernorth.com |
| RiverNorth Funds | Notes to Financial Statements |
At September 30, 2019, the components of distributable earnings on a tax basis for the Funds were as follows:
| | | Undistributed
Ordinary
Income | | | Accumulated
Capital
Gains/(Losses) | | | Net Unrealized
Appreciation/
(Depreciation) | | | Other
Cumulative
Effect of Timing
Differences | | | Total | |
| Core Opportunity Fund | | $ | 176,274 | | | $ | – | | | $ | 4,547,805 | | | $ | – | | | $ | 4,724,079 | |
| Strategic Income Fund | | | 229,488 | | | | (69,035,490 | ) | | | (30,026,055 | ) | | | – | | | | (98,832,057 | ) |
| High Income Fund | | | 365,328 | | | | (4,145,544 | ) | | | (634,532 | ) | | | (101,717 | ) | | | (4,516,465 | ) |
Capital Losses: As of September 30, 2019, the following Funds had capital loss carryforwards which may reduce the applicable Fund’s taxable income arising from future net realized gains on investments, if any, to the extent permitted by the Code and thus may reduce the amount of the distributions to shareholders which would otherwise be necessary to relieve the Funds of any liability for federal tax pursuant to the Code. The capital loss carryforwards may be carried forward indefinitely.
Capital losses carried forward were as follows:
| Fund | | Non-Expiring Short-Term | | | Non-Expiring Long-Term | |
| Strategic Income Fund | | $ | 1,501,663 | | | $ | 8,076,781 | |
| High Income Fund | | | 813,679 | | | | 2,785,464 | |
The Strategic Income Fund and the High Income Fund have elected to defer to the year ending September 30, 2019, capital losses recognized during the period November 1, 2018 to September 30, 2019, in the amount of $59,457,046 and $546,401.
Unrealized Appreciation and Depreciation on Investments: The amount of net unrealized appreciation/(depreciation) and the cost of investment securities for tax purposes, including short-term securities at September 30, 2019, were as follows:
| Fund | | Gross
Appreciation
(excess of
value over tax) | | | Gross
Depreciation
(excess of tax
cost over
value) | | | Net
Appreciation
on Foreign
Currency and
Derivatives | | | Net Unrealized
Appreciation/
(Depreciation) | | | Cost of
Investments
for Income
Tax Purposes | |
| Core Opportunity Fund* | | $ | 7,359,993 | | | $ | (2,812,188 | ) | | $ | – | | | $ | 4,547,805 | | | $ | 102,376,400 | |
| Strategic Income Fund* | | | 83,987,555 | | | | (114,013,610 | ) | | | – | | | | (30,026,055 | ) | | | 2,061,065,674 | |
| High Income Fund* | | | 750,339 | | | | (1,484,483 | ) | | | 99,612 | | | | (634,532 | ) | | | 51,317,846 | |
| * | The difference between book and tax basis unrealized appreciation/(depreciation) for the Funds is attributable primarily to PFIC’s, wash sales, forward contract mark to market, and tax treatment of certain other investments. |
| Annual Report | September 30, 2019 | 141 |
| RiverNorth Funds | Notes to Financial Statements |
8. INVESTMENT TRANSACTIONS
Investment transactions for the year ended September 30, 2019, excluding U.S. Government Obligations and short-term investments, were as follows:
| Fund | | Purchases of
Securities | | | Proceeds from
Sales of Securities | |
| Core Opportunity Fund | | $ | 42,042,566 | | | $ | 64,628,013 | |
| Strategic Income Fund | | | 687,058,312 | | | | 675,382,132 | |
| High Income Fund | | | 25,626,692 | | | | 32,878,075 | |
Investment Transactions in long term U.S. Government Obligations for the year ended September 30, 2019 were as follows:
| Fund | | Purchases of
Securities | | | Proceeds from
Sales of
Securities | |
| Core Opportunity Fund | | $ | – | | | $ | 4,980,878 | |
| Strategic Income Fund | | | 395,683,700 | | | | 393,760,023 | |
9. INVESTMENTS IN AFFILIATED COMPANIES
The Funds may invest in certain securities that are considered securities issued by affiliated companies. As defined by the Investment Company Act of 1940, an affiliated person, including an affiliated company, is one in which a Fund owns 5% or more of the outstanding voting securities, or a company which is under common ownership or control with the Fund. The purchases, sales, dividend income, capital gains, shares and value of investment in affiliated companies for the year ended September 30, 2019 were as follows:
Strategic Income Fund
| Security Name | | Share
Balance as
of September
30, 2018 | | | Purchases | | | Sales | | | Share Balance
as of
September
30, 2019 | | | Market Value
as of
September
30, 2019 | | | Dividends | | | Change in
Unrealized
Gain (Loss) | | | Realized
Gain/Loss | |
| RiverNorth/Oaktree High Income Fund | | | 3,003,658 | | | | 155,507 | | | | – | | | | 3,159,165 | | | $ | 30,156,442 | | | $ | 1,460,626 | | | $ | 628,720 | | | $ | – | |
| | | | | | | | | | | | | | | | | | | $ | 30,156,442 | | | $ | 1,460,626 | | | $ | 628,720 | | | $ | – | |
10. REVOLVING LINE OF CREDIT
On April 8, 2014, the Funds entered into a $100,000,000 committed, unsecured Revolving Credit Agreement with State Street Bank & Trust, Co. The Revolving Credit Agreement was amended on April 17, 2015, April 5, 2016, April 4, 2017, April 3, 2018 and on April 2, 2019. The Revolving Credit Agreement expires on March 31, 2020. Borrowings under this arrangement bear interest at the higher of the Federal Funds Rate and the One-Month LIBOR Rate in effect on the day the loan is made plus 1.25%, which is 3.27% at September 30, 2019. From October 1, 2018 through September 30, 2019, the Funds paid a facility fee on unloaned balances equal to the product of $100,000,000 less the principal amount of loans outstanding and 0.25%.
| 142 | (888) 848-7569 | www.rivernorth.com |
| RiverNorth Funds | Notes to Financial Statements |
For the year ended September 30, 2019, the Funds’ borrowings under the Revolving Credit Agreement were as follows:
| | Dates of Borrowing | Maximum
Borrowed
Amount | Average Loan
Balance
Outstanding | Average
Interest Rate |
| Core Opportunity Fund | December 31, 2018 - January 3, 2019 | $9,000,000 | $7,000,000 | 3.81% |
| Strategic Income Fund | December 13, 2018 | 45,000,000 | 45,000,000 | 3.76% |
| High Income Fund | November 29, 2018 - December 26, 2018 | 1,000,000 | 1,000,000 | 3.74% |
11. BENEFICIAL OWNERSHIP
On September 30, 2019, there were an unlimited number of no par value shares of beneficial interest authorized for each Fund. Transactions in shares of beneficial interest are shown in the Statements of Changes in Net Assets.
The beneficial ownership, either directly or indirectly, of more than 25% of the voting securities of a fund creates a presumption of control of the fund, under Section 2(a)(9) of the Investment Company Act of 1940. Beneficial owners owning more than 25% of the voting securities for the benefit of their customers of each class of each Fund, as of September 30, 2019, are listed below:
| Fund | Shareholder Name | Percentage Interest |
| Core Opportunity Fund – Class I | Wells Fargo Clearing Services, Inc. | 27.97% |
| Core Opportunity Fund – Class R | Charles Schwab & Company, Inc. | 35.60% |
| Strategic Income Fund – Class I | Charles Schwab & Company, Inc. | 35.97% |
| Strategic Income Fund – Class R | Charles Schwab & Company, Inc. | 39.04% |
| High Income Fund – Class I | RiverNorth/DoubleLine Strategic Income Fund | 66.56% |
| High Income Fund – Class R | Charles Schwab & Company, Inc. | 55.14% |
12. INDEMNIFICATIONS
Under the Trust’s organizational documents, its officers and Trustees are indemnified against certain liability arising out of the performance of their duties to the Trust. Additionally, in the normal course of business, the Trust enters into contracts with service providers that may contain general indemnification clauses. The Trust’s maximum exposure under these arrangements is unknown, as this would involve future claims that may be made against the Trust that have not yet occurred.
| Annual Report | September 30, 2019 | 143 |
| RiverNorth Funds | Notes to Financial Statements |
13. RECENT ACCOUNTING PRONOUNCEMENTS
In March 2017, the Financial Accounting Standards Board (“FASB”) issued Accounting Standards Update No. 2017-08 (“ASU 2017-08”), “Receivables—Nonrefundable Fees and Other Costs (Subtopic 310-20): Premium Amortization on Purchased Callable Debt Securities.” ASU 2017-08 changed the amortization period for certain callable debt securities held at a premium. Specifically, it required the premium to be amortized to the earliest call date. The Funds have adopted and applied ASU 2017-08 on a modified retrospective basis through a cumulative-effect adjustment as of the beginning of the period of adoption. As a result of the adoption of ASU 2017-08, as of January 1, 2019, the amortized cost basis of investments was reduced by $15,696 and $11,170 for RiverNorth/DoubleLine Strategic Income Fund and RiverNorth Oaktree High Income Fund respectively, and unrealized appreciation of investments was increased by corresponding amounts. The adoption of ASU 2017-08 had no material impact on beginning net assets, the current period results from operations, or any prior period information presented in the financial statements.
In August 2018, the FASB issued ASU 2018-13, Fair Value Measurement (Topic 820): Disclosure Framework - Changes to the Disclosure Requirements for Fair Value Measurements, which amended guidance on the disclosure requirements for fair value measurement. The update to Topic 820 includes added, eliminated and modified disclosure requirements for investments measured at fair value. ASU 2018-13 is effective for fiscal years beginning after December 15, 2019, including interim periods. Early adoption is permitted for any eliminated or modified disclosures. The impact of the amended guidance on the Funds was the removal of the requirements to disclose (a) amount of and reasons for transfers between Level 1 and 2 (b) the valuation processes for Level 3 fair value measurements, and (c) the policy for timing of transfers between levels. Management has evaluated the impact of this ASU and has adopted the changes into the Funds’ financial statements.
| 144 | (888) 848-7569 | www.rivernorth.com |
| RiverNorth Funds | Report of Independent Registered
Public Accounting Firm |
To the Shareholders and Board of Trustees of
RiverNorth Funds
Opinion on the Financial Statements
We have audited the accompanying statements of assets and liabilities, including the schedules of investments, of RiverNorth Funds, comprising RiverNorth Core Opportunity Fund, RiverNorth/DoubleLine Strategic Income Fund, and RiverNorth/Oaktree High Income Fund (the “Funds”), as of September 30, 2019, and the related statements of operations for the year then ended, the statements of changes in net assets for each of the two years in the period then ended, including the related notes, and the financial highlights for each of the five years in the period then ended (collectively referred to as the “financial statements”). In our opinion, the financial statements present fairly, in all material respects, the financial position of the each of the Funds as of September 30, 2019, the results of their operations for the year then ended, the changes in their net assets for each of the two years in the period then ended, and the financial highlights for each of the five years in the period then ended, in conformity with accounting principles generally accepted in the United States of America.
Basis for Opinion
These financial statements are the responsibility of the Funds’ management. Our responsibility is to express an opinion on the Funds’ financial statements based on our audits. We are a public accounting firm registered with the Public Company Accounting Oversight Board (United States) (“PCAOB”) and are required to be independent with respect to the Funds in accordance with the U.S. federal securities laws and the applicable rules and regulations of the Securities and Exchange Commission and the PCAOB.
We conducted our audits in accordance with the standards of the PCAOB. Those standards require that we plan and perform the audit to obtain reasonable assurance about whether the financial statements are free of material misstatement, whether due to error or fraud.
Our audits included performing procedures to assess the risks of material misstatement of the financial statements, whether due to error or fraud, and performing procedures that respond to those risks. Such procedures included examining, on a test basis, evidence regarding the amounts and disclosures in the financial statements. Our procedures included confirmation of securities owned as of September 30, 2019, by correspondence with the custodian, brokers and agent banks, or by other appropriate auditing procedures where replies from brokers or counterparties were not received. Our audits also included evaluating the accounting principles used and significant estimates made by management, as well as evaluating the overall presentation of the financial statements. We believe that our audits provide a reasonable basis for our opinion.
We have served as the auditor of one or more of RiverNorth Capital Management, LLC’s investment companies since 2006.

COHEN & COMPANY, LTD.
Cleveland, Ohio
November 27, 2019
| Annual Report | September 30, 2019 | 145 |
| RiverNorth Funds | Additional Information |
| | September 30, 2019 (Unaudited) |
PROXY VOTING GUIDELINES
A description of the policies and procedures that the Funds used to determine how to vote proxies relating to portfolio securities and information regarding how the Funds voted proxies during the most recent 12-month period ended June 30, are available without charge upon request by (1) calling the Funds at (888) 848-7569 and (2) from Form N-PX filed by the Funds with the Securities and Exchange Commission (“SEC”) on the SEC’s website at www.sec.gov.
PORTFOLIO HOLDINGS DISCLOSURE POLICY
The Funds file a complete schedule of investments with the SEC for the first and third quarter of each fiscal year on Part F of N-PORT. The Funds’ first and third fiscal quarters end on December 31 and June 30. The Form N-PORT (and its predecessor Form, Form N-Q) must be made within 60 days of the end of the quarter. The Funds’ Form N-PORT is available on the SEC’s website at www.sec.gov. You may also obtain copies by calling the Funds at 1-888-848-7569.
UNAUDITED TAX INFORMATION
The RiverNorth Core Opportunity Fund designated the following for federal income tax purposes for the year ended September 30, 2019:
| | Foreign Taxes Paid | Foreign Source Income |
| RiverNorth Core Opportunity Fund | $79,448 | $562,003 |
| | Tax-Exempt Percentage |
| RiverNorth Core Opportunity Fund | 3.48% |
Of the distributions paid by the Funds from ordinary income for the calendar year ended December 31, 2018, the following percentages met the requirements to be treated as qualifying for the corporate dividends received deduction and qualified dividend income:
| | Dividend Received
Deduction | Qualified Dividend
Income |
| RiverNorth Core Opportunity Fund | 41.63% | 41.19% |
| RiverNorth/DoubleLine Strategic Income Fund | 1.18% | 1.57% |
| RiverNorth/Oaktree High Income Fund | – | 0.36% |
In early 2019, if applicable, shareholders of record received this information for the distributions paid to them by the Funds during the calendar year 2018 via Form 1099. The Funds will notify shareholders in early 2020 of amounts paid to them by the Funds, if any, during the calendar year 2019.
Pursuant to Section 852(b)(3) of the Internal Revenue Code, RiverNorth Core Opportunity Fund designated $27,644,230 as long-term capital gain dividends.
| 146 | (888) 848-7569 | www.rivernorth.com |
| RiverNorth Funds | Board Considerations Regarding Approval of
Investment Advisory and Sub-Advisory Agreements |
| | September 30, 2019 (Unaudited) |
Approval of a New Sub-Advisory Agreement for Oaktree Capital with respect to the RiverNorth/Oaktree High Income Fund
The Board of Trustees met in person on May 15, 2019 to evaluate, among other things, whether approving a new sub-advisory agreement (the “New Sub-Advisory Agreement”) among the Trust, on behalf of the RiverNorth/Oaktree High Income Fund (“Fund”), RiverNorth Capital Management, LLC (“RiverNorth Capital” or “Adviser”) and Oaktree Capital Management, L.P. (“Oaktree Capital” or “Sub-Adviser”) that that would replace the current sub-advisory agreement with the Sub-Adviser (the “Current Sub-Advisory Agreement”) was in the best interests of the Fund’s shareholders. This Sub-Advisory Agreement was being considered due to a potential change of control of Oaktree Capital relating to a merger (the “Merger”) with Brookfield Asset Management Inc. ("Brookfield"). At this Board meeting and throughout the consideration process, the Board, including a majority of the Independent Trustees, was advised by counsel.
During its discussions, the Board recalled that it had recently considered the renewal of the Current Sub-Advisory Agreement at the Board’s November 2018 meeting (the “November Meeting”). The Board reviewed materials (the “May Oaktree Materials”) provided by Oaktree Capital that primarily focused on information regarding the Merger, Brookfield and details of any changes expected to occur following the Merger with regard to Oaktree Capital, its operations, and the services provided to the Fund. The Board also considered the materials provided in connection with the most recent renewal of the Current Sub-Advisory Agreement that occurred at the November Meeting and determined that the information provided at the November Meeting (the “November Oaktree Materials”) remained materially accurate, except as supplemented by the May Oaktree Materials. The Board discussed details of the May Oaktree Materials and the November Oaktree Materials amongst themselves and counsel.
The Board considered the following factors, among others, in reaching its determination to approve the New Sub-Advisory Agreement: (i) the investment performance of the Fund and the investment performance of Oaktree Capital, (ii) the nature, extent and quality of the services provided by Oaktree Capital to the Fund, (iii) the experience and qualifications of the personnel providing such services, (iv) the costs of the services provided and the profits to be realized by Oaktree Capital and any of its affiliates from the relationship with the Fund, (v) the extent to which economies of scale will be realized by Oaktree Capital with respect to the services provided to the Fund as it grows, and (vi) whether the fee structure appropriately shared the economies of scale with Fund shareholders. The Board also recalled its deliberations that had occurred at the November Meeting, agreeing that such deliberations continued to be appropriate except with regard to the Merger.
In voting to approve the New Sub-Advisory Agreement, the Board did not identify any single factor as all-important or controlling. The following summary does not identify all the matters considered by the Board, but provides a summary of the principal matters the Board considered.
Nature, Extent, and Quality of the Services
The Board considered that the Merger was not expected to affect the nature, extent and quality of the services to be provided by Oaktree Capital under the terms of the New Sub-Advisory Agreement. The Board recalled its prior deliberations where it noted that Oaktree Capital was subject to the supervision of the Adviser and the Board, and would provide to the Fund such investment advice that it, in its discretion, deemed to be advisable, as well as an investment program for the Fund consistent with its investment objective and policies. The Board reviewed details regarding the experience of Oaktree Capital’s investment personnel, operations, and experience managing other investment accounts. Based on the foregoing information, the Board, including the Independent Trustees, concluded that Oaktree Capital could be expected to continue to provide quality services to the Fund.
| Annual Report | September 30, 2019 | 147 |
| RiverNorth Funds | Board Considerations Regarding Approval of
Investment Advisory and Sub-Advisory Agreements |
| | September 30, 2019 (Unaudited) |
Investment Sub-Advisory Fee Rate
The Board considered that the fee that the Adviser pays Oaktree Capital would not change under the New Sub-Advisory Agreement. The Board recalled that it had previously determined and continued to believe that the fee paid to Oaktree Capital was reasonable given the fees Oaktree Capital charges other clients to manage similar strategies, as well as the overall reasonableness of the Fund’s sub-advisory fee as compared to a peer group and universe of peer funds selected by an independent third party (the “Peer Groups”). The Board also considered that it reviewed the extent to which economies of scale will be realized by the Fund as it grows.
Performance
The Board recalled its most recent review of the performance of the Fund and the tranche of the portfolio managed by Oaktree Capital, noting that it was generally satisfied with its returns in consideration of the overall market and as compared to the Peer Groups. The Board agreed that the Merger was not expected to cause any changes that were or could be expected to materially affect the performance of Oaktree Capital’s sleeve.
Costs of Services, Benefits Derived and Profits Realized
As to the cost of the services to be provided and the profits to be realized by Oaktree Capital, the Board reviewed Oaktree Capital’s financial condition before and after the Merger, noting that Oaktree Capital would be expected to benefit from the financial backing of Brookfield, a large public company. The Board also noted that Oaktree Capital was and would continue to be a part of a publically owned company, and accordingly, did not provide specific, non-public financial information, including profitability information that was not otherwise made publically available. The Board acknowledged that Oaktree Capital was not expected to receive any ancillary benefits other than the reputational and relationship benefits from its work with the Fund. Accordingly, the Trustees agreed that Oaktree Capital’s compensation was reasonable and its financial condition continued to be stable.
The Merger
After receiving substantial information, the Board was satisfied that the Merger would not result in any adverse consequences for the Fund. The Board noted representations from Oaktree Capital that the consummation of the Merger was not expected to result in any changes to the services the Sub-Adviser provides to the Fund, or the personnel providing those services.
Based on its evaluation of the considerations, the Board unanimously voted to approve the New Sub-Advisory Agreement, and to recommend to the Shareholders that they approve the New Sub-Advisory Agreement.
| 148 | (888) 848-7569 | www.rivernorth.com |
| RiverNorth Funds | Board Considerations Regarding Approval of
Investment Advisory and Sub-Advisory Agreements |
| | September 30, 2019 (Unaudited) |
Section 15(f) of the 1940 Act
The Board was informed that Brookfield and Oaktree Capital will use reasonable best efforts to assure compliance with the conditions of Section 15(f) of the 1940 Act with respect to the Fund from and after the Closing, which provides that when a sale of securities or a controlling interest in a sub-adviser occurs, the sub-adviser or any of its affiliated persons cannot receive any amount or benefit in connection with the sale unless two conditions are satisfied:
| (1) | for three years following the consummation of the Merger, at least seventy-five percent (75%) of the Board must not be “interested persons” (as such term is defined in Section 2(a)(19) of the 1940 Act) of Oaktree Capital, and |
| (2) | during the two years after the Merger, an “unfair burden” must not be imposed on the investment company as a result of the sale of such interest. |
The Board of Trustees noted that the approval was intended to come within the safe harbor provided by Section 15(f) of the 1940 Act. Based on the information provided by Oaktree Capital, the Board determined that the Merger will not result in the imposition of an “unfair burden” on the Fund.
The Interim Agreement
The Board, including the Independent Trustees, held an in-person meeting on August 21, 2019 during which it approved an interim sub-advisory agreement among the trust, on behalf of the Fund, RiverNorth and Oaktree Capital (the “Interim Agreement”).
The board considered that the final closing date of the Merger had not yet been determined and that the Interim Agreement would provide Oaktree Capital with flexibility on the closing date and would ensure that the Fund continues to receive Oaktree Capital’s sub-advisory services should the Merger close prior to obtaining shareholder approval of the New Sub-Advisory Agreement. The Board also considered that, pursuant to Rule 15a-4 under the Investment Company Act of 1940, the Interim Agreement would be materially identical to the Current Sub-Advisory Agreement, except that (i) its term would end on the earlier of the 151st calendar day following the effective date of the Interim Agreement; and (ii) it would contain a provision requiring that all fees earned be kept in escrow until approval of the New Sub-Advisory Agreement is obtained (or, if such approval is not obtained, Oaktree Capital would receive the lesser amount of the escrowed fees or costs incurred by Oaktree Capital during the term of the Interim Agreement).
The board recalled its deliberations at the May 2019 meeting in approving the New Sub-Advisory Agreement and noted that the materials related to the prior deliberations were included in the August 2019 meeting materials. Specifically considering its discussions with respect to the Interim Agreement and its discussions at the May 2019 meeting with respect to the New Sub-Advisory Agreement, the Board considered the following factors, among others, in reaching its determination to approve the Interim Agreement: (i) the investment performance of the Fund and the investment performance of Oaktree capital; (ii) the nature, extent and quality of the services provided by Oaktree Capital to the Fund; (iii) the experience and qualifications of the personnel providing such services; (iv) the costs of the services provided and the profits to be realized by Oaktree Capital and any of its affiliates from the relationship with the Fund; (v) the extent to which economies of scale will be realized by Oaktree Capital as the Fund grows; and (vi) whether the fee structure appropriately shared the economies of scale with Fund shareholders.
| Annual Report | September 30, 2019 | 149 |
| RiverNorth Funds | Board Considerations Regarding Approval of
Investment Advisory and Sub-Advisory Agreements |
| | September 30, 2019 (Unaudited) |
Based on its evaluation of the considerations, the board determined that the approval of the Interim Agreement was in the best interest of shareholders of the Fund and unanimously voted to approve the Interim Agreement.
| 150 | (888) 848-7569 | www.rivernorth.com |
| RiverNorth Funds | Trustees and Officers |
| | September 30, 2019 (Unaudited) |
The following table provides information regarding each Trustee who is not an “interested person” of the Trust, as defined in the 1940 Act.
INDEPENDENT TRUSTEES
Name,
Address1
and Year
of Birth | Position(s)
Held with
the Fund | Term of
Office/
Length
of Time
Served | Principal Occupation(s)
During Past 5 Years | Number of
Portfolios
in Fund
Complex
Overseen
by Trustee2 | Other Directorships
Held by Trustee During
the Past 5 Years |
John K. Carter
Y.O.B. 1961 | Trustee | Indefinite/ January 2013 to present | Partner, Law Office of Carter Reymann Law, P.A. (a general practice and corporate law firm) (2018 to present); Law Office of John K. Carter, P.A. (a general practice and corporate law firm) (2015 to 2018); Managing Partner, Global Recruiters of St. Petersburg (a financial services consulting and recruiting firm) (2012 to 2015). | 8 | Rivernorth Managed Duration Municipal Income Fund Inc. (1 fund) (2019 to present); RiverNorth Opportunistic Municipal Income Fund (1 fund) (2018-present); Carillon Mutual Funds (12 funds) (2016 to present); RiverNorth Marketplace Lending Corporation (1 fund) (2016 to present); RiverNorth/ DoubleLine Strategic Opportunity Fund, Inc. (1 fund) (2016 to present); RiverNorth Opportunities Fund, Inc. (1 fund) (2013 to present). |
James G. Kelley
Y.O.B. 1948 | Trustee | Indefinite/ December 2006 to present | Certified Business Coach, JGK & Associates (2000 to present). | 3 | Member, Illinois Board of Examiners (2012 to present); Chair (2017 to present). |
| Annual Report | September 30, 2019 | 151 |
| RiverNorth Funds | Trustees and Officers |
| | September 30, 2019 (Unaudited) |
INDEPENDENT TRUSTEES
Name,
Address1
and Year
of Birth | Position(s)
Held with
the Fund | Term of
Office/
Length
of Time
Served | Principal Occupation(s)
During Past 5 Years | Number of
Portfolios
in Fund
Complex
Overseen
by Trustee2 | Other Directorships
Held by Trustee During
the Past 5 Years |
John S. Oakes
Y.O.B. 1943 | Trustee; Lead Independent Trustee | Indefinite/ December 2010 to present | Principal, Financial Search and Consulting (a recruiting and consulting firm) (2013 to 2017); Regional Vice President, Securities America (a broker-dealer) (2007 to 2013). | 8 | Rivernorth Managed Duration Municipal Income Fund Inc. (1 fund) (2019 to present); RiverNorth Opportunistic Municipal Income Fund (1 fund) (2018-present); RiverNorth Marketplace Lending Corporation (1 fund) (2016 to present); RiverNorth/ DoubleLine Strategic Opportunity Fund, Inc. (1 fund) (2016 to present); RiverNorth Opportunities Fund, Inc. (1 fund) (2013 to present). |
| 152 | (888) 848-7569 | www.rivernorth.com |
| RiverNorth Funds | Trustees and Officers |
| | September 30, 2019 (Unaudited) |
INDEPENDENT TRUSTEES
Name,
Address1
and Year
of Birth | Position(s)
Held with
the Fund | Term of
Office/
Length
of Time
Served | Principal Occupation(s)
During Past 5 Years | Number of
Portfolios
in Fund
Complex
Overseen
by Trustee2 | Other Directorships
Held by Trustee During
the Past 5 Years |
David M. Swanson
Y.O.B. 1957 | Trustee | Indefinite/ November 2018 to present | Founder & Managing Partner of Swan Dog Strategic Marketing (2006 to present). | 8 | RiverNorth Managed Duration Municipal Income Fund Inc. (1 fund) (2019 to present); RiverNorth Marketplace Lending Corporation (1 fund) (2018 to present); RiverNorth/DoubleLine Strategic Opportunity Fund, Inc. (1 fund) (2018 to present); RiverNorth Opportunities Fund, Inc. (1 fund) (2013 to present); RiverNorth Opportunistic Municipal Income Fund, Inc. (1 fund) (2018 to present); Managed Portfolio Series (39 funds) (2011 to present); ALPS Variable Investment Trust (9 funds) (2006 to present). |
| 1 | The mailing address of each Trustee is 325 N. LaSalle Street, Suite 645, Chicago, IL 60654. |
| 2 | The Fund Complex consists of each series of the RiverNorth Funds Trust, RiverNorth Opportunities Fund, Inc., RiverNorth DoubleLine Strategic Opportunity Fund, Inc., RiverNorth Opportunistic Municipal Income Fund, Inc., RiverNorth Managed Duration Municipal Income Fund, Inc., and the RiverNorth Marketplace Lending Corporation. |
| Annual Report | September 30, 2019 | 153 |
| RiverNorth Funds | Trustees and Officers |
| | September 30, 2019 (Unaudited) |
The following table provides information regarding each Trustee who is an “interested person” of the Trust, as defined in the 1940 Act, and each officer of the Trust.
INTERESTED TRUSTEE AND OFFICERS
Name,
Address1 and
Year of Birth | Position(s)
Held with
the Fund | Term of
Office/
Length
of Time
Served | Principal Occupation(s)
During Past 5 Years | Number of
Portfolios
in Fund
Complex
Overseen
by Trustee2 | Other Directorships
Held by Trustee During
the Past 5 Years |
Patrick W. Galley3
Y.O.B. 1975 | President, Principal Executive Officer and Trustee | Indefinite/ July 2006 to present | Chief Investment Officer, RiverNorth Capital Management, LLC (2004 to present). | 8 | Rivernorth Managed Duration Municipal Income Fund Inc. (1 fund) (2019 to present); RiverNorth Opportunistic Municipal Income Fund (1 fund) (2018-present); RiverNorth Marketplace Lending Corporation (1 fund) (2016 to present); RiverNorth/ DoubleLine Strategic Opportunity Fund, Inc. (1 fund) (2016 to present); RiverNorth Opportunities Fund, Inc. (1 fund) (2013 to present); Board of Managers of RiverNorth Capital Management, LLC (since 2010) and RiverNorth Financial Holdings, LLC (2014 to present) and Board of Directors RiverNorth Holdings, Co. (since 2010). |
Jonathan M. Mohrhardt
Y.O.B. 1974 | Treasurer and Chief Financial Officer | Indefinite/ February 2009 to present | Chief Operating Officer, RiverNorth Capital Management, LLC (2011 to present). | N/A | N/A |
| 154 | (888) 848-7569 | www.rivernorth.com |
| RiverNorth Funds | Trustees and Officers |
| | September 30, 2019 (Unaudited) |
INTERESTED TRUSTEE AND OFFICERS
Name,
Address1and
Year of Birth | Position(s)
Held with
the Fund | Term of
Office/
Length
of Time
Served | Principal Occupation(s)
During Past 5 Years | Number of
Portfolios
in Fund
Complex
Overseen
by Trustee2 | Other Directorships
Held by Trustee During
the Past 5 Years |
Marcus L. Collins
Y.O.B. 1968 | Chief Compliance Officer; Secretary | Indefinite/ May 2012 to Present; Indefinite/ January 2017 to Present | General Counsel, RiverNorth Capital Management, LLC (2012 to present), Chief Compliance Officer, RiverNorth Capital Management, LLC (2012 to present). | N/A | N/A |
Christopher A. Moore
Y.O.B. 1984 | Assistant Secretary | Indefinite/ May 2019 to present | Vice President and Senior Counsel of SS&C ALPS (2016 to present); associate at Thompson Hine LLP (2013 to 2016); Counsel at DSW, Inc. (2012 to 2013); CPA for Ernst & Young (2007 to 2009). | N/A | N/A |
| 1 | The mailing address of each Trustee and officer is 325 N. LaSalle Street, Suite 645, Chicago, IL 60654. |
| 2 | The Fund Complex consists of each series of the RiverNorth Funds Trust, RiverNorth Opportunities Fund, Inc., RiverNorth DoubleLine Strategic Opportunity Fund, Inc., RiverNorth Opportunistic Municipal Income Fund, Inc., RiverNorth Managed Duration Municipal Income Fund, Inc., and the RiverNorth Marketplace Lending Corporation. |
| 3 | Patrick W. Galley is considered an "Interested” Trustee as defined in the Investment Company Act of 1940, as amended, because he is an officer of the Trust and Chief Investment Officer of the Fund's investment adviser. |
The Statement of Additional Information includes additional information about the Trust’s Trustees and is available, without charge, upon request by calling (toll-free) 1-888-848-7569
| Annual Report | September 30, 2019 | 155 |
Intentionally Left Blank
Intentionally Left Blank
Intentionally Left Blank
Intentionally Left Blank
| RiverNorth Funds |
| RiverNorth Core Opportunity Fund |
| RiverNorth/DoubleLine Strategic Income Fund |
| RiverNorth/Oaktree High Income Fund |
| |
| Board of Trustees |
| Patrick W. Galley, CFA, Chairman |
| James G. Kelley |
| John S. Oakes |
| David M. Swanson |
| John K. Carter |
| |
| Investment Adviser |
| RiverNorth Capital Management, LLC |
| |
| Sub Advisers |
| DoubleLine Capital LP |
| Oaktree Capital Management, L.P. |
| |
| Transfer Agent, Administrator and |
| Dividend Disbursing Agent |
| ALPS Fund Services, Inc. |
| |
| Distributor |
| ALPS Distributors, Inc. |
| |
| Custodian |
| State Street Bank & Trust |
| |
| Independent Registered |
| Public Accounting Firm |
| Cohen & Company, Ltd. |
This report is provided for the general information of the shareholders of the RiverNorth Funds. This report is not intended for distribution to prospective investors in the Funds, unless preceded or accompanied by an effective prospectus.
| (a) | The registrant, as of the end of the period covered by this report, has adopted a code of ethics that applies to the registrant's principal executive officer, principal financial officer, principal accounting officer or controller or any persons performing similar functions on behalf of the registrant. |
| (b) | For purposes of this item, “code of ethics” means written standards that are reasonably designed to deter wrongdoing and to promote: |
| (1) | Honest and ethical conduct, including the ethical handling of actual or apparent conflicts of interest between personal and professional relationships; |
| (2) | Full, fair, accurate, timely, and understandable disclosure in reports and documents that a registrant files with, or submits to, the Commission and in other public communications made by the registrant; |
| (3) | Compliance with applicable governmental laws, rules, and regulations; |
| (4) | The prompt internal reporting of violations of the code of ethics to an appropriate person or persons identified in the code of ethics; and |
| (5) | Accountability for adherence to the code of ethics. |
| (c) | Amendments: During the period covered by this report, no amendments were made to the provisions of the code of ethics adopted in 2(a) above. |
| (d) | Waivers: During the period covered by this report, no implicit or explicit waivers to the provisions of the code of ethics adopted in 2(a) above were granted. |
| (e) | Posting: We do not intend to post the code of ethics for the Officers or any amendments or waivers on a website. |
| (f) | Availability: The code of ethics for the Officers can be obtained, free of charge by calling the toll free number for the appropriate Fund listed in that Fund’s prospectus . |
| Item 3. | Audit Committee Financial Expert. |
The registrant’s board of trustees has determined that the registrant does not have an audit committee financial expert. The committee members and the full Board considered a possibility of adding a member that would qualify as an expert. The audit committee determined that, although none of its members meet the technical definition of an audit committee expert, the committee has sufficient financial expertise to adequately perform its duties under the Audit Committee Charter without the addition of a qualified expert.
| Item 4. | Principal Accountant Fees and Services. |
| (a) | Audit Fees | |
| | Fiscal Year | Audit Fees |
| | FY 2019 | $79,000 |
| | FY 2018 | $68,000 |
| (b) | Audit-Related Fees | |
| | Fiscal Year | Registrant |
| | FY 2019 | $0 |
| | FY 2018 | $0 |
| (c) | Tax Fees | |
| | Fiscal Year | Registrant |
| | FY 2019 | $15,000 |
| | FY 2018 | $15,000 |
| | Nature of the Tax Fees: prepare tax returns |
| (d) | All Other Fees | |
| | Fiscal Year | Registrant |
| | FY 2019 | $3,547 |
| | FY 2018 | $3,350 |
| | Nature of the fees: cursory review of Semi-Annual Shareholder report and post-effective amendment consents. |
(1) Audit Committee’s Pre-Approval Policies
The Audit Committee Charter requires the Audit Committee to be responsible for the selection, retention or termination of auditors and, in connection therewith, to (i) evaluate the proposed fees and other compensation, if any, to be paid to the auditors, (ii) evaluate the independence of the auditors, (iii) pre-approve all audit services and, when appropriate, any non-audit services provided by the independent auditors to the Trust, (iv) pre-approve, when appropriate, any non-audit services provided by the independent auditors to the Trust's investment adviser, or any entity controlling, controlled by, or under common control with the investment adviser and that provides ongoing services to the Trust if the engagement relates directly to the operations and financial reporting of the Trust, and (v) receive the auditors’ specific representations as to their independence.
(2) Percentages of Services Approved by the Audit Committee pursuant to paragraph (c)(7)(i)(C) of Rule 2-01 of Regulation S-X.
| | Registrant | |
| | Audit-Related Fees: | 0% |
| | Tax Fees: | 0% |
| | All Other Fees: | 0% |
| (f) | During audit of registrant's financial statements for the most recent fiscal year, less than 50 percent of the hours expended on the principal accountant's engagement were attributed to work performed by persons other than the principal accountant's full-time, permanent employees. |
| (g) | The aggregate non-audit fees billed by the registrant's accountant for services rendered to the registrant, and rendered to the registrant's investment adviser (not including any sub-adviser whose role is primarily portfolio management and is subcontracted with or overseen by another investment adviser), and any entity controlling, controlled by, or under common control with the adviser that provides ongoing services to the registrant: |
| | Fiscal Year | Registrant | Adviser |
| | FY 2019 | $0 | $0 |
| | FY 2018 | $0 | $0 |
| Item 5. | Audit Committee of Listed Registrants. |
NOT APPLICABLE – applies to listed companies only
| Item 6. | Schedule of Investments. |
| (a) | The schedule of investments is included as part of the Report to Stockholders filed under Item 1 of this report. |
| Item 7. | Disclosure of Proxy Voting Policies and Procedures for Closed-End Management Investment Companies. |
NOT APPLICABLE – applies to closed-end funds only
| Item 8. | Portfolio Managers of Closed-End Management Investment Companies. |
NOT APPLICABLE – applies to closed-end funds only
| Item 9. | Purchases of Equity Securities by Closed-End Management Investment Company and Affiliated Purchasers. |
NOT APPLICABLE – applies to closed-end funds only
| Item 10. | Submission of Matters to Vote of Security Holders. |
The registrant has not adopted procedures by which shareholders may recommend nominees to the registrant’s board of trustees.
| Item 11. | Controls and Procedures. |
| (a) | Based on an evaluation of the registrant's disclosure controls and procedures (as defined in Rule 30a-3(c) under the Investment Company Act of 1940) as of a date within 90 days of the filing date of this Form N-CSR, the disclosure controls and procedures are reasonably designed to ensure that the information required in filings on Forms N-CSR is recorded, processed, summarized, and reported on a timely basis. |
| (b) | There were no significant changes in the registrant’s internal control over financial reporting that occurred during the registrant’s second fiscal quarter of the period covered by this report that have materially affected, or are reasonably likely to materially affect, the registrant’s internal control over financial reporting. |
| Item 12. | Disclosure of Securities Lending Activities for Closed-End Management Investment Companies. |
NOT APPLICABLE – applies to closed-end funds only
| (a)(1) | Certifications pursuant to Rule 30a-2(b) under the Act (17 CFR 30a-2(b)) and Section 1350 of Chapter 63 of Title 18 of the United States Code (18 U.S.C. 1350) are attached hereto. |
| (a)(2) | Certifications pursuant to Rule 30a-2(a) under the Act (17 CFR 30a-2(a)) are attached hereto. |
| (b) | Certifications pursuant to Rule 30a-2(b) under the Act (17 CFR 30a-2(b)) and Section 1350 of Chapter 63 of Title 18 of the United States Code (18 U.S.C. 1350) are attached hereto. |
SIGNATURES
Pursuant to the requirements of the Securities Exchange Act of 1934 and the Investment Company Act of 1940, the registrant has duly caused this report to be signed on its behalf by the undersigned, thereunto duly authorized.
Registrant:RiverNorth Funds
| By: | /s/ Patrick W. Galley | |
| Name: | Patrick W. Galley | |
| Title: | President | |
| | | |
| Date: | December 9, 2019 | �� |
Pursuant to the requirements of the Securities Exchange Act of 1934 and the Investment Company Act of 1940, this report has been signed below by the following persons on behalf of the registrant and in the capacities and on the dates indicated.
| By: | /s/ Patrick W. Galley | |
| Name: | Patrick W. Galley | |
| Title: | President & Chief Executive Officer | |
| | | |
| Date: | December 9, 2019 | |
| By: | /s/ Jonathan M. Mohrhardt | |
| Name: | Jonathan M. Mohrhardt | |
| Title: | Treasurer & Chief Financial Officer | |
| | | |
| Date: | December 9, 2019 | |