Marc L. Collins
| Shareholder Letter | 3 |
| | |
| Opportunistic Closed‐End Fund Strategies | |
| Portfolio Update | 7 |
| RiverNorth Core Opportunity Fund | 10 |
RiverNorth/DoubleLine® Strategic Income Fund | 15 |
| RiverNorth Equity Opportunity Fund | 20 |
| RiverNorth/Oaktree High Income Fund | 24 |
| | |
| Managed Volatility Strategy | |
| Portfolio Update | 31 |
| RiverNorth Managed Volatility Fund | 31 |
| | |
| RiverNorth Funds Schedule of Investments and Financial Statements | |
| Disclosure of Fund Expenses | 39 |
| Schedule of Investments | |
| RiverNorth Core Opportunity Fund | 42 |
RiverNorth/DoubleLine® Strategic Income Fund | 46 |
| RiverNorth Equity Opportunity Fund | 73 |
| RiverNorth/Oaktree High Income Fund | 75 |
| RiverNorth Managed Volatility Fund | 89 |
| Schedule of Written Options | |
| RiverNorth Managed Volatility Fund | 92 |
| | |
| Statement of Assets and Liabilities | |
| RiverNorth Core Opportunity Fund | 95 |
RiverNorth/DoubleLine® Strategic Income Fund | 97 |
| RiverNorth Equity Opportunity Fund | 99 |
| RiverNorth/Oaktree High Income Fund | 100 |
| RiverNorth Managed Volatility Fund | 102 |
| | |
| Statement of Operations | |
| RiverNorth Core Opportunity Fund | 103 |
RiverNorth/DoubleLine® Strategic Income Fund | 104 |
| RiverNorth Equity Opportunity Fund | 105 |
| RiverNorth/Oaktree High Income Fund | 106 |
| RiverNorth Managed Volatility Fund | 107 |
| | |
| Statements of Changes in Net Assets | |
| RiverNorth Core Opportunity Fund | 108 |
RiverNorth/DoubleLine® Strategic Income Fund | 110 |
| RiverNorth Equity Opportunity Fund | 112 |
| RiverNorth/Oaktree High Income Fund | 114 |
| RiverNorth Managed Volatility Fund | 116 |
| | |
| Financial Highlights | |
| RiverNorth Core Opportunity Fund | 117 |
RiverNorth/DoubleLine® Strategic Income Fund | 120 |
| RiverNorth Equity Opportunity Fund | 124 |
| RiverNorth Funds | Table of Contets |
| RiverNorth/Oaktree High Income Fund | 126 |
| RiverNorth Managed Volatility Fund | 128 |
| | |
| Notes to Financial Statements | 130 |
| | |
| Report of Independent Registered Public Accounting Firm | 151 |
| | |
| Additional Information | 152 |
| | |
| Trustees and Officers | 154 |
| RiverNorth Funds | Shareholder Letter |
| | September 30, 2014 (Unaudited) |
Dear Fellow Shareholders,
We are pleased to provide you with the 2014 Annual Report for RiverNorth Funds. This report covers our four opportunistic closed‐end fund strategies: The RiverNorth Core Opportunity Fund (tickers: RNCIX and RNCOX), the RiverNorth/DoubleLine Strategic Income Fund (tickers: RNSIX and RNDLX), the RiverNorth Equity Opportunity Fund (tickers: RNDIX and RNEOX) and our managed volatility strategy, the RiverNorth Managed Volatility Fund (ticker: RNBWX).
In the 2014 fiscal year, the RiverNorth Funds Family had the following noteworthy events:
| | • | As of January 1, 2014, the RiverNorth/Manning & Napier Equity Income Fund changed its name to the RiverNorth Equity Opportunity Fund. In addition, RiverNorth became the sole adviser to the Fund and continues its opportunistic approach for investing in equity‐based closed‐end funds ("CEFs") and utilizing exchange traded funds (“ETFs”) in its tactical allocation to the equity markets. |
| | • | The RiverNorth Dynamic Buy‐Write Fund changed its name to the RiverNorth Managed Volatility Fund as of January 1, 2014. The strategy remains the same, taking advantage of option pricing inefficiencies while managing the Fund’s volatility to both equity and fixed income markets. The name change gives the Fund more flexibility in implementing its strategy. |
| | • | Last, our flagship fund, the RiverNorth Core Opportunity Fund, launched an institutional share class (ticker: RNCIX) in 2014, offering a lower expense ratio to those investors committing to a minimum of $5 million. The retail share class remains closed to new investors. Existing investors have the ability to exchange shares of their retail share class to the new institutional share class (RNCOX to RNCIX), provided the investment minimum is met. |
We started our 2013 letter with the following quote from Warren Buffett: “Be fearful when others are greedy and greedy when others are fearful”. The 2014 fiscal year gave RiverNorth the ability to execute on the latter half of Mr. Buffet’s words of wisdom. Amid interest rate fears and uncertainty, many of the RiverNorth Funds were able to extract excess return, or alpha, from others’ fear. We believe fear and market uncertainty is upon us for the foreseeable future, an environment conducive to our investment approach and philosophy.
The RiverNorth Funds offers investors a complete product suite to those looking for an opportunistic alternative to traditional asset classes. Suited for investors with a like minded approach to investing, we believe the RiverNorth Funds are well positioned to take advantage of market uncertainty and inefficiencies.
Please visit www.rivernorth.com for additional information.
We thank you for your investment and trust in managing your assets.
Respectfully,
Patrick W. Galley, CFA
President and Chief Investment Officer
RiverNorth Funds
| RiverNorth Funds | Portfolio Update |
| | September 30, 2014 (Unaudited) |
Closed‐End Fund Market Overview and Outlook
Bond Funds
To begin this year’s commentary on bond funds – we will revisit our conclusion from last year’s outlook:
“Having waited patiently for interest rate volatility to drive discounts wider, we are now excited about today’s opportunity set. We share this enthusiasm with fixed income luminary, Jeffrey Gundlach, CEO/CIO of DoubleLine Capital, LP and co‐Portfolio Manager of our Strategic Income Fund. While there is no guarantee that discounts will narrow, we have confidence that market participants like a good deal. We believe well‐managed bond funds trading at historically wide discounts do not sit on the bargain counter for long; especially when bond funds are priced to yield 7.0%, on average.” – September 30, 2013
Closed‐end funds were attractively priced and RiverNorth was putting money to work. By December 31, 2013, we had increased our closed‐end bond fund exposure levels to 40% for RiverNorth Core Opportunity, 40% for RiverNorth/DoubleLine Strategic Income and 36% for RiverNorth/Oaktree High Income. In comparison, on April 30, 2013, just before the sell‐off in May, our closed‐end bond fund exposure levels were 5%, 13% and 12%, respectively.
Our contrarian allocation to closed‐end bond funds, at a time when nearly everyone expected interest rates to rise, has been profitable to date. We highlighted our three favorite closed‐end fund categories in last year’s outlook – high yield, multi‐sector and municipal bond funds. Since September 30, 2013, the average total return for these fund categories has been 6.1%, 9.4% and 13.2%, respectively. In comparison, the average taxable closed‐end bond fund is up 7.4% year‐ over‐year.
Notwithstanding this strong performance, bond fund discounts widened for a second consecutive year. The average discount on closed‐end bond funds (i.e. 367 funds with an aggregate market capitalization of $137 billion) was 7.8% on September 30, 2014 versus 6.0% on September 30, 2013. These average discounts are well below the average premium of 3.3% on September 30, 2012. Over the past two years, the market price total return for the bond fund category has trailed the net asset value (“NAV”) total return by approximately 1,200 basis points. Despite these headwinds, RiverNorth has thrived in this environment because we have tactically managed our exposure to closed‐end funds.
Our current closed‐end bond fund exposure levels are 28% for RiverNorth Core Opportunity, 30% for RiverNorth/DoubleLine Strategic Income and 23% for RiverNorth/Oaktree High Income. These allocations are well below their highs back in December 2013. We had generally reduced our bond fund allocations to current levels by June 30, 2014. Our timing was good because the average taxable closed‐end bond fund was down 3.5% in the third quarter. Now that prices are lower and discounts are wider, we are buying once again.
But why are discounts still wide? And when will they narrow? Our answer boils down to supply and demand. The primary buyers of closed‐end funds – retail investors – are emotionally scarred from their recent experience in the market. The peak‐to‐trough decline for the average bond fund was 16.5% (total return) and 19.4% (price only) in 2013. Much of the negative performance was attributable to discount widening. Once burned, twice shy – these investors are now reluctant to
| RiverNorth Funds | Portfolio Update |
| | September 30, 2014 (Unaudited) |
chase recovering bond funds in 2014. Net asset values have rallied more than market prices; causing discounts to widen further. The new equilibrium price for most bond funds is now somewhere between 5% and 10% below net asset value. Cross‐over buyers (i.e. opportunistic hedge funds and mutual funds) have emerged to buy the most attractively priced bond funds, but these institutional tourists own less than 1% the closed‐end fund market. To date, the incremental demand from these bargain hunters has not caused discounts to narrow. We believe sustained discount narrowing is unlikely to occur without steady retail demand. We are surprised that “well managed bond funds trading at historically wide discounts”(1) are still sitting on the bargain counter, especially when comparable open‐end mutual funds are experiencing net inflows, but we are happy to have the opportunity to put capital to work in such a target rich environment. We cannot predict when retail demand will pick up, but history has shown that the pendulum of investor sentiment swings again and again between fear and greed.
Before moving on, we also thought it would be appropriate to comment on closed‐end fund leverage. Most closed‐end bond funds borrow money to generate additional income. The spread between interest income and interest expense is distributed to shareholders. Leverage also magnifies capital gains (or losses). We believe that leverage is currently attractive for closed‐end funds. The steeper yield curve is favorable and the Federal Open Market Committee projections for the fed funds rate are moderate for the intermediate future. That said, investors can easily “deleverage” a closed‐end bond fund. Instead of purchasing $1,000 of a closed‐end fund with 30% leverage, an investor could buy $667 of the closed‐end fund and hold $333 of cash. The beta profile is the same as owning $1,000 of an unleveraged fund and there is potential to generate alpha if the closed‐end fund discount narrows. Depending on market conditions and valuations, we typically offset some of the closed‐end fund leverage with cash in our mutual funds.
Equity Funds (including Hybrid Funds)
As of September 30, 2014, there were 205 U.S. domiciled equity closed‐end funds with an aggregate market capitalization of $103 billion. Over the past twelve months, the market price total return for this category was positive 13.2% and the net asset value total return was positive 12.4%. The average discount on equity funds was 7.9% on September 30, 2014 versus 8.1% on September 30, 2013.
Equity closed‐end funds are diversified across strategies, sectors and regions. The most popular strategies measured by assets are U.S. large capitalization stocks, covered call and energy infrastructure master limited partnerships. These funds account for about 60% of the aggregate market capitalization of the group. We regularly find opportunities among equity closed‐end funds as their strategies go in and out of favor.
The RiverNorth Core Opportunity Fund had 32% exposure to equity closed‐end funds at September 30, 2014. Over the past twelve months, we reduced our allocation to equity closed‐ end funds from 41% to 32% and purchased exchange‐traded funds (“ETFs”) to replace the equity exposure. We swapped investments for two reasons – 1) some of our equity funds had narrowed and 2) we had significantly increased our allocation to bond funds. Most of these trades were made in the first quarter of 2014.
| (1) | Source: Bloomberg, RiverNorth |
| RiverNorth Funds | Portfolio Update |
| | September 30, 2014 (Unaudited) |
Our dedicated equity fund – the RiverNorth Equity Opportunity Fund – had 73% exposure to equity closed‐end funds at September 30, 2014 versus 39% at September 30, 2013. This fund no longer has a sub‐adviser and does not own individual equities. We are running a concentrated portfolio focused on closed‐end funds likely to conduct shareholder‐friendly corporate actions and those with high distribution rates. We anticipate adding more traditional mean reversion trades when equity market volatility increases.
As we said last year, “We believe that bond funds will continue to grab the headlines, but equity funds should not be overlooked.” Retail investors have been buying everything but equity mutual funds. As a result, many investors are underweight stocks and overweight alternatives. That may change because equities have outperformed most other asset classes in the recent past. If/when retail investors reallocate to equities, we believe that equity closed‐end funds trading at double‐ digit discounts are poised to outperform market indices because their discounts should narrow.
| RiverNorth Funds | Portfolio Update |
| | September 30, 2014 (Unaudited) |
RiverNorth Core Opportunity Fund
Portfolio Management Commentary – Patrick Galley, CFA and Stephen O’Neill, CFA
What is the Fund’s investment strategy?
The RiverNorth Core Opportunity Fund (“the Fund”) invests in a broad range of equity, fixed income and short‐term securities. To implement the Fund’s tactical asset allocation, the adviser generally invests in closed‐end funds and exchange‐traded funds.
How did the RiverNorth Core Opportunity Fund perform relative to its benchmark during the reporting period?
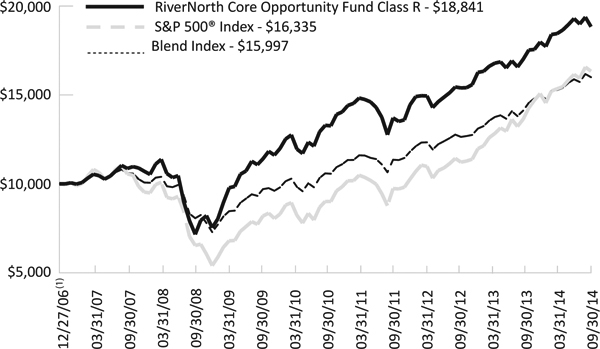
For the twelve month period ending September 30, 2014, the Class R share (symbol: RNCOX) returned 10.81%. The unmanaged Blend Index returned 13.28% during the same period. The Blend Index consists of 60% S&P 500 Index and 40% Barclays Capital U.S. Aggregate Bond Index.
Comparison of a $10,000 Investment in the RiverNorth Core Opportunity Fund Class R, the Blend Index, and the S&P 500® Index.
| RiverNorth Funds | Portfolio Update |
| | September 30, 2014 (Unaudited) |
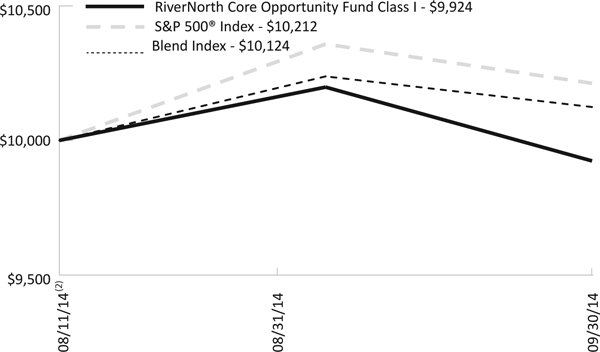
Comparison of a $10,000 Investment in the RiverNorth Core Opportunity Fund Class I, the Blend Index, and the S&P 500® Index.
Average Annual Total Returns for Periods Ending September 30, 2014
| | 1-Year | 3-Year | 5-Year | Since Inception(1)(2) |
RiverNorth Core Opportunity Fund – Class I (RNCIX)(3) | 11.13% | 14.17% | 11.11% | 8.78% |
| RiverNorth Core Opportunity Fund – Class R (RNCOX) | 10.81% | 13.87% | 10.82% | 8.51% |
Blend Index(4) | 13.28% | 14.51% | 11.19% | 6.24% |
S&P 500® Index(4) | 19.73% | 22.99% | 15.70% | 6.53% |
(1) | Inception date of Class R is December 27, 2006. |
(2) | Inception date of Class I is August 11, 2014. |
(3) | In presenting performance information for the newer Institutional share class of the Fund, the Fund includes, for periods prior to the offering of the Institutional share class, the operating expense ratio and performance of the Fund’s Retail share class, adjusted to reflect the class-related operating expenses of the Institutional share class. Actual expense differentials across classes will vary over time. The performance of the Fund’s newer Institutional share class would have been substantially similar to the performance of the Fund’s Retail share class because both share classes of the Fund are invested in the same portfolio of securities and would have differed only to the extent that the classes do not have the same expenses (although differences in expenses between share classes may change over time). |
(4) | Blend Index consists of 60% S&P 500® Index and 40% Barclays Capital U.S. Aggregate Bond Index. S&P 500® Index is a capitalization-weighted index of 500 stocks. The Barclays Capital U.S. Aggregate Bond Index is an unmanaged index of investment-grade fixed-rate debt issues with maturities of at least one year. This unmanaged index does not reflect fees and expenses. The S&P 500® and Blend Indices are indices only and cannot be invested in directly. |
| RiverNorth Funds | Portfolio Update |
| | September 30, 2014 (Unaudited) |
Performance data quoted represents past performance, which is not a guarantee of future results. Current performance may be lower or higher than the performance quoted. The principal value and investment return of an investment will fluctuate so that your shares, when redeemed, may be worth more or less than their original cost. You can obtain performance data current to the most recent month end by calling (888) 848-7569 or www.rivernorthfunds.com. Total return measures net investment income and capital gain or loss from portfolio investments. All performance shown assumes reinvestment of dividends and capital gains distributions.
The Total Annual Fund Operating Expense for the Fund as disclosed in the prospectus dated August 11, 2014: 1.97% (RNCIX), 2.22% (RNCOX). The adviser has contractually agreed to defer the collection of fees and/or reimburse expenses, but only to the extent necessary to limit Total Annual Fund Operating Expenses (excluding brokerage fees and commissions; borrowing costs, such as (a) interest and (b) dividends on securities sold short; taxes; indirect expenses incurred by the underlying funds in which the Fund invests; and extraordinary expenses) to 1.35% (RNCIX) and 1.60% (RNCOX) of the average daily net assets of the Fund through January 31, 2016. The annualized net expense ratio in this annual report dated September 30, 2014 is 1.37% (RNCOX) and 1.20% (RNCIX).
What contributing factors were responsible for the RiverNorth Core Opportunity Fund’s relative performance during the period?
With respect to the equity portion of the portfolio, the Fund’s allocation to international and emerging market equity funds detracted from relative performance. The MSCI All Country World ex USA Index was up 4.77% over the past twelve months versus the S&P 500’s return of 19.73%. Also, our allocation to covered call closed‐end funds contributed to the Fund’s underperformance. Covered call funds sell call options against their underlying positions, which generate income, but limit their upside in a rising market.
With respect to the fixed income portion of the portfolio, our tactical allocation to high yield, multi‐sector and municipal bond funds contributed to our outperformance versus the Barclays Capital U.S. Aggregate Bond Index. Our cash allocation, which averaged approximately 9% over the period, detracted from relative performance.
How was the RiverNorth Core Opportunity Fund positioned at the end of September 2014?
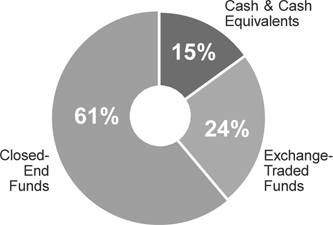
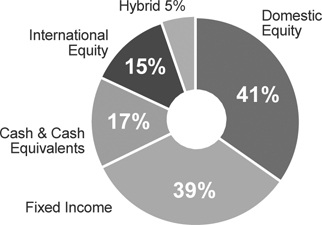
At the aggregate Fund level, we allocated 56% of the portfolio to equities, 39% to fixed income, 5% to hybrid securities (primarily preferred stocks and convertible bonds) and 17% to cash. Allocations exceed 100% due to leverage utilized by some of the closed‐end funds that we own.
Our equity allocation is neutral. We are 56% invested in equities; with 73% domestic and 27% international exposure. Over the past twelve months, we have significantly reduced the Fund’s allocation to covered call closed‐end funds because discounts were narrower. These positions were replaced with general equity closed‐end funds and ETFs.
Our fixed income portfolio continues to be quite different from the Barclays Capital U.S. Aggregate Bond Index. The Fund has minimal exposure to U.S. Treasury bonds and agency mortgage‐backed securities. Our fixed income allocation of 39% (excluding cash) contains mostly high yield bonds, bank loans and municipal bonds.
| RiverNorth Funds | Portfolio Update |
| | September 30, 2014 (Unaudited) |
Investment Vehicle Allocation(1) (percentages are based on net assets)
Asset Class Allocation(1) (percentages are based on net assets)
The allocation does not add up to 100% as it reflects the leverage utilized by the underlying funds.
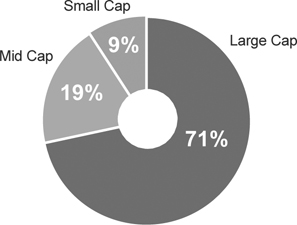
Equity Capitalization Allocation(1) (percentages are based on net assets)
Totals may not add to 100% due to rounding.
| RiverNorth Funds | Portfolio Update |
| | September 30, 2014 (Unaudited) |
Fixed Income Allocation(1)(2) (percentages are based on net assets)
(1) | Convertible Security Risk – the market value of convertible securities adjust with interest rates and the value of the underlying stock. Exchange Traded Note Risk – exchange traded notes represent unsecured debt of the issuer and may be influenced by interest rates, credit ratings of the issuer or changes in value of the reference index. Fixed Income Risk – the market value of fixed income securities adjust with interest rates and are subject to issuer default. Foreign/Emerging Market Risk – foreign securities may be subject to inefficient or volatile markets, different regulatory regimes or different tax policies. These risks may be enhanced in emerging markets. Management Risk – there is no guarantee that the adviser’s or subadviser’s investment decisions will produce the desired results. Market Risk – economic conditions, interest rates and political events may affect the securities markets. Portfolio Turnover Risk – increased portfolio turnover results in higher brokerage expenses and may impact the tax status of distributions. REIT Risk – the value of REITs change with the value of the underlying properties and changes in interest rates and are subject to additional fees. Short Sale Risk – short positions are speculative, are subject to transaction costs and are riskier than long positions in securities. Small‐Cap Risk – small‐cap companies are more susceptible to failure, are often thinly traded and have more volatile stock prices. Structured Notes Risk – because of the imbedded derivative feature, structured notes are subject to more risk than investing in a simple note or bond. Swap Risk – swap agreements are subject to counterparty default risk and may not perform as intended. Underlying Fund Risk – underlying funds have additional fees, may utilize leverage, may not correlate to an intended index and may trade at a discount to their net asset values. |
| (2) | Credit quality allocation reflects a fixed‐income portfolio weighted average of the credit breakdown of each closed‐end fund as provided by the adviser of said closed‐end fund. If a credit breakdown is not provided by the adviser, Bloomberg is used. Investment grade refers to a bond rated BBB‐ or higher by Standard & Poor’s or Baa3 or higher by Moody’s. High yield refers to a bond rated lower than investment grade. For more information about securities ratings, please see the Fund’s Statement of Additional Information at www.rivernorth.com. |
Portfolio detail statistics are estimates made by the Adviser and are subject to change.
| RiverNorth Funds | Portfolio Update |
| | September 30, 2014 (Unaudited) |
RiverNorth/DoubleLine Strategic Income Fund
Portfolio Management Commentary – Patrick Galley, CFA, Stephen O’Neill, CFA and Jeffrey Gundlach
What is the Fund’s investment strategy?
The RiverNorth/DoubleLine Strategic Income (“the Fund”) invests in a broad range of fixed income securities of U.S. and foreign issuers, including closed‐end funds.
Assets of the Fund are tactically managed across three distinct fixed income strategies (or sleeves). RiverNorth oversees the strategy weights and manages the Tactical Closed‐End Fund Income Strategy. The RiverNorth strategy provides diversified exposure to the fixed income market through opportunistic investments in closed‐end bond funds. Sector allocations may vary based on RiverNorth’s assessment of relative value among asset classes and closed‐end funds. Jeffrey Gundlach, CEO and CIO of DoubleLine Capital, LP oversees the Opportunistic Income and Core Fixed Income Strategies. The Opportunistic Income Strategy seeks to achieve positive absolute returns and is managed without duration constraints. The Core Fixed Income Strategy – the most traditional of the three sleeves – incorporates an active asset allocation approach in an effort to mitigate risk and achieve the highest possible risk‐adjusted returns.
How did the RiverNorth/DoubleLine Strategic Income Fund perform relative to its benchmark during the reporting period?
For the twelve month period ending September 30, 2014, the Class I share (symbol: RNSIX) returned 9.38% and the Class R share (symbol: RNDLX) returned 9.09%. The Barclays Capital U.S. Aggregate Bond Index returned 3.96%, during the same period.
| RiverNorth Funds | Portfolio Update |
| | September 30, 2014 (Unaudited) |
Comparison of a $10,000 Investment in the RiverNorth/DoubleLine Strategic Income Fund and the Barclay’s Capital U.S. Aggregate Bond Index
Average Annual Total Returns for Periods Ending September 30, 2014
| | 1-Year | 3-Year | Since Inception(1) |
| RiverNorth/DoubleLine Strategic Income Fund – Class I (RNSIX) | 9.38% | 7.48% | 8.40% |
| RiverNorth/DoubleLine Strategic Income Fund – Class R (RNDLX) | 9.09% | 7.21% | 8.15% |
Barclays Capital U.S. Aggregate Bond Index(2) | 3.96% | 2.43% | 3.80% |
(1) | Inception date is December 30, 2010. |
(2) | The Barclays Capital U.S. Aggregate Bond Index is an unmanaged index of investment-grade fixed- rate debt issues with maturities of at least one year. The index cannot be invested in directly and does not reflect fees and expenses. |
Performance data quoted represents past performance, which is not a guarantee of future results. Current performance may be lower or higher than the performance quoted. The principal value and investment return of an investment will fluctuate so that your shares, when redeemed, may be worth more or less than their original cost. You can obtain performance data current to the most recent month end by calling (888) 848-7569 or www.rivernorthfunds.com. Total return measures net investment income and capital gain or loss from portfolio investments. All performance shown assumes reinvestment of dividends and capital gains distributions.
| RiverNorth Funds | Portfolio Update |
| | September 30, 2014 (Unaudited) |
The Total Annual Fund Operating Expense for the Fund as disclosed in the prospectus dated January 28, 2014: 1.15% (RNSIX), 1.40% (RNDLX). The adviser has contractually agreed to defer the collection of fees and/or reimburse expenses, but only to the extent necessary to limit Total Annual Fund Operating Expenses (excluding brokerage fees and commissions; borrowing costs, such as (a) interest and (b) dividends on securities sold short; taxes; indirect expenses incurred by the underlying funds in which the Fund invests; and extraordinary expenses) to 0.95% (RNSIX) and 1.20% (RNDLX) of the average daily net assets of the Fund through January 31, 2015. The annualized net expense ratio in this annual report dated September 30, 2014 is 0.91% (RNSIX) and 1.16% (RNDLX).
What contributing factors were responsible for the RiverNorth/DoubleLine Strategic Income Fund’s relative performance during the period?
RiverNorth Tactical Closed‐End Fund Income Sleeve
The RiverNorth sleeve outperformed the benchmark index. The primary contributing factors were – 1) strong NAV performance for closed‐end funds, 2) tactical management of our closed‐end fund exposure and 3) discount narrowing. The sleeve’s overweight exposure to high yield corporate credit and municipal bonds were strong contributors to performance. Exposure to non‐ dollar corporate and government bonds detracted from relative performance.
DoubleLine Core Fixed Income Sleeve
The fixed income market experienced a reversal of 2013’s increase in U.S. interest rates with the 10‐year U.S. Treasury yield declining close to 54 basis points year‐to‐date. The 10‐year U.S. Treasury yield even touched local lows at 2.33% in the month of August 2014. Over the Fund’s fiscal year, longer duration sectors performed well with more credit sensitive sectors, such as high yield and emerging market fixed income, leading the outperformance over the Barclays Capital U.S. Aggregate Bond Index. Investment grade corporate as well as residential mortgage backed securities (“RMBS”) contributed strong returns as well. The RMBS market continues to perform well as tightening supply technicals aid in the valuations of non‐agency RMBS while the declining interest rate environment has helped the agency RMBS sector. Collateralized loan obligations and commercial mortgage backed securities lagged behind other sectors held in the Fund as heavy new issuance within those markets have recently put downward pressure on valuations.
DoubleLine Opportunistic Income Sleeve
Both agency RMBS and non‐agency RMBS contributed strong returns to the portfolio as U.S. Treasury rates experienced heightened intra‐period volatility. The 10‐year U.S. Treasury yield mildly declined by 12 basis points and further flattened over the trailing twelve‐months which allowed for longer duration agency RMBS securities to outperform their shorter duration non‐ agency RMBS counterparts. In addition to the price appreciation, agency inverse floating‐rate products added robust interest income due to low LIBOR levels. Within the non‐agency RMBS space, higher credit quality securities, such as those backed by prime collateral, generally outperformed lower credit quality bonds.
How was the RiverNorth/DoubleLine Strategic Income Fund positioned at the end of September 2014?
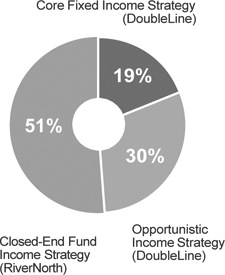
The Fund allocation was 51% RiverNorth Tactical Closed‐End Fund sleeve, 30% DoubleLine Opportunistic Income sleeve and 19% DoubleLine Core Fixed Income sleeve. Year‐over‐year, the most significant change to the portfolio has been the higher allocation to cash and cash equivalents. As of September 30, 2014, the Fund’s cash holdings were 18% compared to 2% at the
| RiverNorth Funds | Portfolio Update |
| | September 30, 2014 (Unaudited) |
beginning of the reporting period. Our allocation to cash offsets some of the leveraged exposure the Fund acquires as a result of holding leveraged closed‐end funds, and also allows the Fund to be opportunistic as we will look to deploy some of the cash when volatility returns to the fixed income markets.
Strategy (“Sleeve”) Allocation
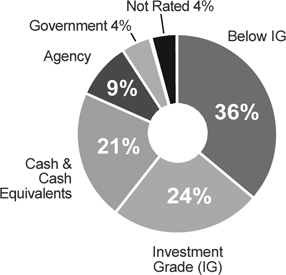
Credit Quality Distribution(1)(2)(percentages are based on net assets)
Totals may not add to 100% due to rounding.
| Holdings subject to change. |
| RiverNorth Funds | Portfolio Update |
| | September 30, 2014 (Unaudited) |
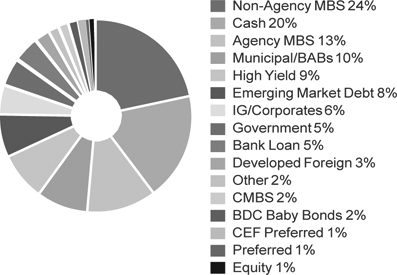
Sector Breakdown(1)(percentages are based on net assets)
The allocation does not add up to 100% as it reflects the leverage utilized by the underlying funds.
| (1) | Asset‐Backed Security Risk – the risk that the value of the underlying assets will impair the value of the security. Borrowing Risk – borrowings increase fund expenses and are subject to repayment, possibly at inopportune times. Convertible Security Risk – the market value of convertible securities adjust with interest rates and the value of the underlying stock. Defaulted Securities Risk – defaulted securities carry the risk of uncertainty of repayment. Derivatives Risk – derivatives are subject to counterparty risk. Exchange Traded Note Risk – exchange traded notes represent unsecured debt of the issuer and may be influenced by interest rates, credit ratings of the issuer or changes in value of the reference index. Fixed Income Risk – the market value of fixed income securities adjust with interest rates and are subject to issuer default. Foreign/Emerging Market Risk – foreign securities may be subject to inefficient or volatile markets, different regulatory regimes or different tax policies. These risks may be enhanced in emerging markets. Liquidity Risk – illiquid investments may be difficult or impossible to sell. Management Risk – there is no guarantee that the adviser’s subadviser’s investment decisions will produce the desired results. Market Risk – economic conditions, interest rates and political events may affect the securities markets. Mortgage‐Backed Security Risk – mortgage backed securities are subject to credit risk, pre‐ payment risk and devaluation of the underlying collateral. Portfolio Turnover Risk – increased portfolio turnover results in higher brokerage expenses and may impact the tax status of distributions. Rating Agency Risk – rating agencies may change their ratings or ratings may not accurately reflect a debt issuer’s creditworthiness. REIT Risk – the value of REITs change with the value of the underlying properties and changes in interest rates and are subject to additional fees. Structured Notes Risk – because of the imbedded derivative feature, structured notes are subject to more risk than investing in a simple note or bond. Swap Risk – swap agreements are subject to counterparty default risk and may not perform as intended. Underlying Fund Risk – underlying funds have additional fees, may utilize leverage, may not correlate to an intended index and may trade at a discount to their net asset values. |
(2) | For the sleeve managed by RiverNorth, credit quality allocation reflects a fixed‐income portfolio weighted average of the credit breakdown of each closed‐end fund as provided by the adviser of said closed‐end fund. If a credit breakdown is not provided by the adviser, Bloomberg is used. For the sleeves managed by DoubleLine, credit quality allocation is determined from the highest available credit rating from any Nationally Recognized Statistical Rating Organization (S&P, Moody’s and Fitch). Investment grade refers to a bond rated BBB‐ or higher by Standard & Poor’s or Baa3 or higher by Moody’s. High yield refers to a bond rated lower than investment grade. For more information about securities ratings, please see the Fund’s Statement of Additional Information at www.rivernorth.com. |
Portfolio detail statistics are estimates made by the Adviser and are subject to change.
| RiverNorth Funds | Portfolio Update |
| | September 30, 2014 (Unaudited) |
RiverNorth Equity Opportunity Fund
Portfolio Manager Commentary – Patrick Galley, CFA, Stephen O’Neill, CFA
What is the Fund’s investment strategy?
The RiverNorth Equity Opportunity Fund (“the Fund”) invests primarily in equity based closed‐end funds and exchange‐traded funds.
How did the RiverNorth Equity Opportunity Fund perform relative to its benchmark during the reporting period?
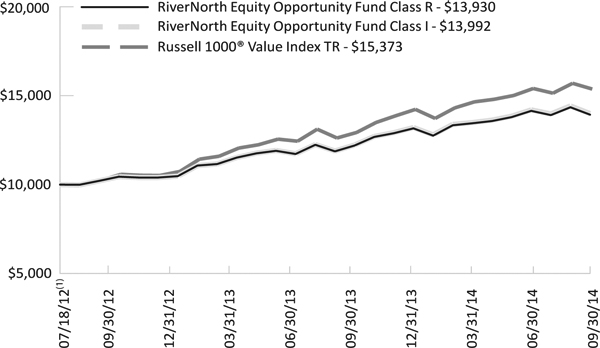
For the twelve month period ending September 30, 2014, the Class I share (symbol: RNDIX) returned 14.52% and the Class R share (symbol: RNEOX) returned 14.22%. The Russell 1000 Value Index returned 18.89% during the same period and the S&P 500 Total Return Index returned 19.73%.
Comparison of a $10,000 Investment in the RiverNorth Equity Opportunity Fund and the Russell 1000 Value Index
| RiverNorth Funds | Portfolio Update |
| | September 30, 2014 (Unaudited) |
Average Annual Total Returns for Periods Ending September 30, 2014
| | 1-Year | Since Inception(1) |
| RiverNorth Equity Opportunity Fund ‐ Class I (RNDIX) | 14.52% | 16.47% |
| RiverNorth Equity Opportunity Fund ‐ Class R (RNEOX) | 14.22% | 16.24% |
Russell 1000® Value Index TR(2) | 18.89% | 21.56% |
| (1) | Inception date is July 18, 2012. |
(2) | The Russell 1000® Value Index measures the performance of the large-cap value segment of the U.S. equity universe. It includes those Russell 1000® Index companies with lower price-to-book ratios and lower expected growth values. The index cannot be invested in directly and does not reflect fees and expenses. |
Performance data quoted represents past performance, which is not a guarantee of future results. Current performance may be lower or higher than the performance quoted. The principal value and investment return of an investment will fluctuate so that your shares, when redeemed, may be worth more or less than their original cost. You can obtain performance data current to the most recent month end by calling (888) 848-7569 or www.rivernorthfunds.com. Total return measures net investment income and capital gain or loss from portfolio investments. All performance shown assumes reinvestment of dividends and capital gains distributions. Prior to 1/1/2014, the Fund was managed in part by a sub-adviser pursuing a different strategy.
The Total Annual Operating Expense for the Fund as disclosed in the prospectus dated January 28, 2014: 2.55% (RNDIX), 2.80% (RNEOX). The adviser has contractually agreed to defer the collection of fees and/or reimburse expenses, but only to the extent necessary to limit Total Annual Fund Operating Expenses (excluding brokerage fees and commissions; borrowing costs, such as (a) interest and (b) dividends on securities sold short; taxes; indirect expenses incurred by the underlying funds in which the Fund invests; and extraordinary expenses) to 1.35% (RNDIX) and 1.60% (RNEOX) of the average daily net assets of the Fund through January 31, 2015. The annualized net expense ratio in this annual report dated September 30, 2014 is 2.03% (RNDIX) and 2.28% (RNEOX).
What contributing factors were responsible for the RiverNorth Equity Opportunity Fund’s relative performance during the period?
Although the Fund generated excess return from discount narrowing (i.e., alpha), the total return of the Fund trailed the benchmarks. Contributing factors were – 1) our beta was less than 1.0 (relative to the S&P 500), 2) we owned closed‐end funds with non‐U.S. equity exposure and 3) we owned closed‐end funds that held less than 100% of their portfolio in stocks. As of September 30, 2014, the weighted average beta of the portfolio was 0.75 (relative to the S&P 500). Beta measures the tendency of the Fund’s return to respond to fluctuations in the benchmark. When markets rise sharply and our beta is less than 1.0, we would generally expect to underperform (and vice versa). Our positions in global equity closed‐end funds also detracted from relative performance. The MSCI All Country World ex USA Index was up 4.77% over the past twelve months versus the S&P 500’s return of 19.73%. Finally, we owned hybrid funds with small allocations to fixed income (notably high yield bonds). Although these funds had positive returns over the reporting period, they trailed the benchmark.
| RiverNorth Funds | Portfolio Update |
| | September 30, 2014 (Unaudited) |
How was the RiverNorth Equity Opportunity Fund positioned at the end of September 2014?
We are 74% invested in closed‐end funds, 23% in ETFs and 3% in cash. The Fund no longer has a sub‐adviser and does not own individual equities. The Fund’s closed‐end fund allocation is primarily to general equity funds along with some hybrid funds that can invest in a range of equity and fixed income securities. The large‐cap U.S. equity ETFs in the portfolio are dry powder for closed‐end fund trading opportunities.
Investment Vehicle Allocation(1) (percentages are based on net assets)
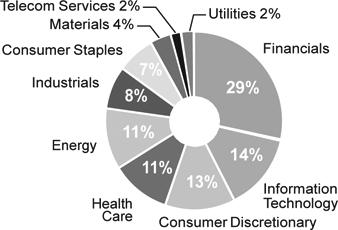
Sector Breakdown(1) (percentages are based on net assets)
Totals may not add up to 100% due to rounding.
Sector weightings are based on Morningstar, Inc. un‐weighted closed‐end fund indices which are an equal‐weighted average of all of the closed‐end funds assigned to the categories noted above.
| RiverNorth Funds | Portfolio Update |
| | September 30, 2014 (Unaudited) |
| (1) | Convertible Security Risk – the market value of convertible securities adjust with interest rates and the value of the underlying stock. Currency Risk – foreign currencies will rise or decline relative to the U.S. dollar. Equity Risk – the value of equity securities change frequently. Fixed Income Risk – the market value of fixed income securities adjust with interest rates and are subject to issuer default. Foreign/Emerging Market Risk – foreign securities may be subject to inefficient or volatile markets, different regulatory regimes or different tax policies. These risks may be enhanced in emerging markets. Investment Style Risk – investment strategies may come in and out of favor with investors and may underperform or outperform at times. Mid‐Cap Risk – mid‐cap companies may be more susceptible to adverse business or economic events than large‐cap companies. Management Risk – there is no guarantee that the adviser’s subadviser’s investment decisions will produce the desired results. Market Risk – economic conditions, interest rates and political events may affect the securities markets. Portfolio Turnover Risk – increased portfolio turnover results in higher brokerage expenses and may impact the tax status of distributions. Preferred Stock Risk – preferred stocks generally pay dividends, but may be less liquid than common stocks, have less priority than debt instruments and may be subject to redemption by the issuer. Small‐Cap Risk – small‐cap companies are more susceptible to failure, are often thinly traded and have more volatile stock prices. Swap Risk – swap agreements are subject to counterparty default risk and may not perform as intended. Tax Risk – new federal or state governmental action could adversely affect the tax‐exempt status of securities held by the Fund, resulting in higher tax liability for shareholders and potentially hurting Fund performance as well. Underlying Fund Risk – underlying funds have additional fees, may utilize leverage, may not correlate to an intended index and may trade at a discount to their net asset values. |
Portfolio detail statistics are estimates made by the Adviser and are subject to change.
| RiverNorth Funds | Portfolio Update |
| | September 30, 2014 (Unaudited) |
RiverNorth/Oaktree High Income Fund
Portfolio Manager Commentary – Patrick Galley, CFA, Stephen O’Neill, CFA, Sheldon Stone, Desmund Shirazi, Shannon Ward, Armen Panossian, and David Rosenberg
What is the Fund’s investment strategy?
The RiverNorth/Oaktree High Income Fund (“the Fund”) invests in a broad range of income producing securities including both fixed income and equity securities.
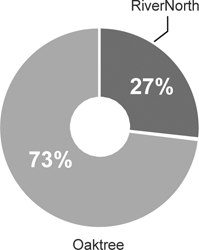
Assets of the Fund are tactically managed across three income strategies (or sleeves). RiverNorth manages the Tactical Closed‐End Fund Strategy. This strategy is designed to provide diversified fixed income and equity income exposure through opportunistic investments in closed‐end funds. Oaktree Capital Management, LP manages the High Yield Bond and Senior Loan Strategies on a global basis. Oaktree will tactically manage the allocation between the High Yield Bond and Senior Loan Strategies based both on market opportunities and the risk and reward trade‐offs between the two asset classes.
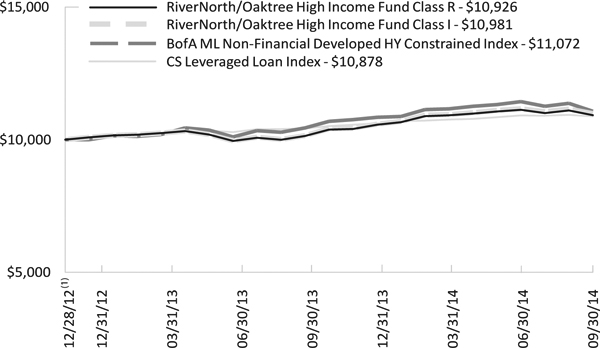
How did the RiverNorth/Oaktree High Income Fund perform relative to its benchmark during the reporting period?
For the twelve month period ending September 30, 2014, the Class I share (symbol: RNHIX) returned 8.16% and the Class R share (symbol: RNOTX) returned 7.78%. The BofA ML Non‐ Financial Developed HY Constrained Index and CSFB Leveraged Loan Index returned 6.03% and 4.30%, respectively, during the same period.
Comparison of a $10,000 Investment in the RiverNorth/Oaktree High Income Fund, BofA ML Non‐Financial Developed HY Constrained Index, and the CS Leveraged Loan Index
| RiverNorth Funds | Portfolio Update |
| | September 30, 2014 (Unaudited) |
Cumulative Total Returns for the Period Ending September 30, 2014
| | 1-Year | Since Inception(1) |
| RiverNorth/Oaktree High Income Fund – Class I (RNHIX) | 8.16% | 5.47% |
| RiverNorth/Oaktree High Income Fund – Class R (RNOTX) | 7.78% | 5.17% |
BofA ML Non‐Financial Developed HY Constrained Index(2) | 6.03% | 5.97% |
CS Leveraged Loan Index(2) | 4.30% | 4.91% |
| (1) | Inception date is December 28, 2012. |
(2) | The BofA Merrill Lynch Developed Markets High Yield Constrained Index contains all securities in the BofA Merrill Lynch Global High Yield index from developed markets countries but cap issuer exposure at 2%. Developed markets is defined as an FX-G10 member, a Western European nation, or a territory of the U.S. or a Western European nation. The index tracks the performance of USD, CAD, GBP and EUR denominated below investment grade corporate debt publicly issued in the major domestic or Eurobond markets. Qualifying securities must have a below investment grade rating (based on an average of Moody’s, S&P and Fitch). CS Leveraged Loan Index tracks the investable market of the U.S. dollar denominated leveraged loan market. It consists of issues rated “5B” or lower, meaning that the highest rated issues included in this index are Moody’s/S&P ratings of Baa1/BB+ or Ba1/BBB+. All loans are funded term loans with a tenor of at least one year and are made by issuers domiciled in developed countries. The Bofa Merrill Lynch Developed Markets High Yield Constrained and the CS Leveraged Loan Indices are indices only and cannot be invested in directly. |
Performance data quoted represents past performance, which is not a guarantee of future results. Current performance may be lower or higher than the performance quoted. The principal value and investment return of an investment will fluctuate so that your shares, when redeemed, may be worth more or less than their original cost. You can obtain performance data current to the most recent month end by calling (888) 848-7569 or www.rivernorthfunds.com. Total return measures net investment income and capital gain or loss from portfolio investments. All performance shown assumes reinvestment of dividends and capital gains distributions.
The Total Annual Operating Expense for the Fund as disclosed in the prospectus dated January 28, 2014: 1.91% (RNHIX), 2.16% (RNOTX). The adviser has contractually agreed to defer the collection of fees and/or reimburse expenses, but only to the extent necessary to limit Total Annual Fund Operating Expenses (excluding brokerage fees and commissions; borrowing costs, such as (a) interest and (b) dividends on securities sold short; taxes; indirect expenses incurred by the underlying funds in which the Fund invests; and extraordinary expenses) to 1.35% (RNHIX) and 1.60% (RNOTX) of the average daily net assets of the Fund through January 31, 2015. The annualized net expense ratio in this annual report dated September 30, 2014 is 1.39% (RNHIX) and 1.63% (RNOTX).
What contributing factors were responsible for the RiverNorth/Oaktree High Income Fund’s relative performance during the period?
RiverNorth Tactical Closed‐End Fund Strategy Sleeve
The closed‐end fund portion benefitted from an overweighting of high yield funds relative to bank loan funds. Also, the leverage used by many of the closed‐end funds amplified their positive NAV returns as the closed‐end funds on average had better performance than the indices. In addition, the Fund benefitted from discount narrowing over the period.
Oaktree High Yield Bond & Senior Loan Sleeve
The High Yield Bond and Senior Loans portfolios performed well over the reporting period. However, following a somewhat tranquil nine‐month period in financial markets, investor sentiment turned decidedly negative in the third quarter of 2014 amid concern over slowing global
| RiverNorth Funds | Portfolio Update |
| | September 30, 2014 (Unaudited) |
growth and geopolitical tensions. In this challenging quarter, high yield bonds and senior loans were punished, turning in their first negative performance since the Fund’s inception. While the recent volatility has been painful, the selloff has made the high yield bond and loan markets quite a bit more attractive. Yields are at their highest levels in over a year, and the price of the average bond has dropped, allowing more room for capital appreciation. In our view, the average spreads at quarter‐end provide generous compensation for bearing credit risk, particularly given the benign default outlook.
How was the RiverNorth/Oaktree High Income Fund positioned at the end of September 2014?
The Fund allocation was 27% RiverNorth Tactical Closed‐End Fund and 73% Oaktree High Yield Bond and Senior Loan.
The closed‐end fund sleeve is primarily invested in the common shares of closed‐end funds. Over the past year, the sleeve’s holdings in closed‐end fund preferred shares and business development company baby bonds were significantly reduced because we found better opportunities among closed‐end fund common shares trading at wide discounts.
The High Yield Bond and Senior Loan portfolios remain defensively positioned and constructed to preserve capital in the event of a market downturn. Over the years, it has been demonstrated that the key to long‐term success is managing credit risk, avoiding dangerous concentrations and minimizing defaults in the portfolio.
Strategy Allocation
| RiverNorth Funds | Portfolio Update |
| | September 30, 2014 (Unaudited) |
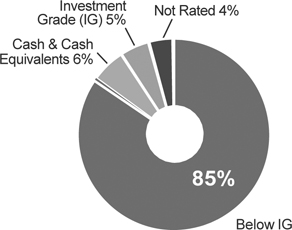
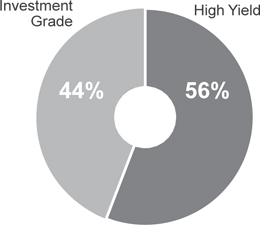
Credit Quality Distribution(1)(2)(percentages are based on net assets)
| (1) | Holdings subject to change. |
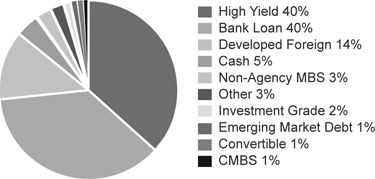
Sector Breakdown(1) (percentages are based on net assets)
The allocation does not add up to 100% due to leverage utilized by the underlying funds.
| (1) | Borrowing Risk – borrowings increase fund expenses and are subject to repayment, possibly at inopportune times. Closed‐End Fund Risk – closed‐end funds are exchange traded, may trade at a discount to their net asset values and may deploy leverage. Convertible Security Risk – the market value of convertible securities adjusts with interest rates and the value of the underlying stock. Credit Derivatives Risk – the use of credit derivatives is high specialized, involves default, counterparty and liquidity risks and may not perfectly correlate to the underlying asset or liability being hedged. Currency Risk – foreign currencies will rise or decline relative to the U.S. dollar. Distressed and Defaulted Securities Risk – defaulted securities carry the risk of uncertainty of repayment. Equity Risk – equity securities may experience volatility and the value of equity securities may move in opposite directions from each other and from other equity markets generally. Fixed Income Risk – the market value of fixed income securities adjusts with interest rates and the securities are subject to issuer default. Foreign/Emerging Market Risk – foreign securities may be subject to inefficient or volatile markets, different regulatory regimes or different tax policies. These risks may be enhanced in emerging markets. Floating Interest Rate Risk – loans pay interest based on the London Interbank Offered Rate (LIBOR) and a decline in LIBOR could negatively impact the Fund’s return. Investment Style Risk – investment strategies may come in and out of favor with investors and may underperform or outperform at times. Loans Risk – loans may be unrated or rated below investment grade and the pledged collateral may lose value. |
| RiverNorth Funds | Portfolio Update |
| | September 30, 2014 (Unaudited) |
Secondary trading in loans is not fully‐developed and may result in illiquidity. Management Risk – there is no guarantee that the adviser’s or sub‐adviser’s investment decisions will produce the desired results. Market Risk – economic conditions, interest rates and political events may affect the securities markets. Portfolio Turnover Risk – increased portfolio turnover results in higher brokerage expenses and may impact the tax status of distributions. Preferred Stock Risk – preferred stocks generally pay dividends, but may be less liquid than common stocks, have less priority than debt instruments and may be subject to redemption by the issuer. Security Risk – the value of the Fund may increase or decrease in response to the prospects of the issuers of securities and loans held in the Fund. Swap Risk – swap agreements are subject to counterparty default risk and may not perform as intended. Underlying Fund Risk – underlying funds have additional fees, may utilize leverage, may not correlate to an intended index and may trade at a discount to their net asset values. Valuation Risk – Loans and fixed‐income securities are traded “over the counter” and because there is no centralized information regarding trading, the valuation of loans and fixed‐ income securities may vary.
(2) | For the sleeve managed by RiverNorth, credit quality allocation reflects a fixed‐income portfolio weighted average of the credit breakdown of each closed‐end fund as provided by the adviser of said closed‐end fund. If a credit breakdown is not provided by the adviser, Bloomberg is used. For the sleeves managed by Oaktree, the sub‐adviser uses a proprietary credit scoring matrix to rank potential investments. This process offers a systematic way of reviewing the key quantitative and qualitative variables impacting credit quality for each investment. Investment grade refers to a bond rated BBB‐ or higher by Standard & Poor’s or Baa3 or higher by Moody’s. High yield refers to a bond rated lower than investment grade. For more information about securities ratings, please see the Fund’s Statement of Additional Information at www.rivernorth.com. |
Portfolio detail statistics are estimates made by the Adviser and are subject to change.
| RiverNorth Funds | Portfolio Update |
| | September 30, 2014 (Unaudited) |
Equity and Volatility Markets Overview and Outlook
The previous fiscal year exhibited some rather drastic dislocations underneath the surface of the broad market indices. January and February saw brief periods of market volatility, which quickly rescinded after the markets “v‐shape” recovery. The small/mid cap indices (IWM) retraced almost a quarter of the previous year’s gains, while simultaneously dislocating from the S&P 500 as it continued to make new highs. In fact, the speed (14.41 % over 151 days) at which this divergence occurred was one of the largest in history on a price and percentage basis. By definition, that is volatility. Interestingly, this occurred with the VIX trading between 12‐ 14 in the second/third quarter of 2014.
Looking forward, the macro climate continues to be driven by global quantitative easing in an effort to debase local currencies and stave off deflation. Here at home, the Fed has stated they are data dependent but have their eye on exiting sooner rather than later. While QE exit fears may cause brief periods of volatility the markets have this on the radar, it’s the unknown that cause significant volatility expansions. It is important to note, that the fund constructs it portfolio opportunistically with respect to the volatility landscape. The fund targets an S&P like beta of .3 by purchasing options that are deemed too cheap and selling the options that are deemed too expensive. This allows the fund to capitalize on the inherent nature of volatility expansion and contraction.
Looking specifically at equity volatility, the VIX Index (the broadest and most common measure of equity volatility), traded in a range of 10.32 to 21.44 during the fiscal year, which is approximately the same range as 2013. Closing at about 16.3 on September 30, 2014, the VIX is still below its long run average of approximately 20. Going forward, absent an unforeseen macro shock, volatility levels for the coming months will likely be driven by quality of earnings and subsequent guidance contained in fourth quarter earnings reports. Volatility sentiment can always change faster than portfolio managers or computers can react. Regardless, we remain ready for any unforeseen increases in volatility levels.
RiverNorth Managed Volatility Fund
Portfolio Management Commentary – Eric Metz, CFA
What is the Fund’s investment strategy?
The RiverNorth Managed Volatility Fund (“RNBWX”; “the Fund”) seeks to achieve greater risk‐ adjusted returns than The CBOE Buy‐Write Index (“BXM”). In addition, the Fund seeks to provide investors with total return and lower volatility than the S&P 500 Index by constructing a portfolio of single security, ETF and index options with the greatest potential alpha coming from volatility, as opposed to stock selection. The volatility management aspect of the Fund is typically only available in a hedge fund structure. The portfolio is typically comprised of 100‐150 securities which are chosen based upon the opportunity in the security’s options and then expressed as a collar, protective put, buy‐write, or equivalently, as a cash secured put option. The Fund’s strategy can be viewed as alternative in nature in that it seeks to provide low beta exposure to the broad equity markets with a standard deviation similar to traditional fixed income investments.
| RiverNorth Funds | Portfolio Update |
| | September 30, 2014 (Unaudited) |
How did the RiverNorth Managed Volatility Fund perform relative to its benchmark during the reporting period?
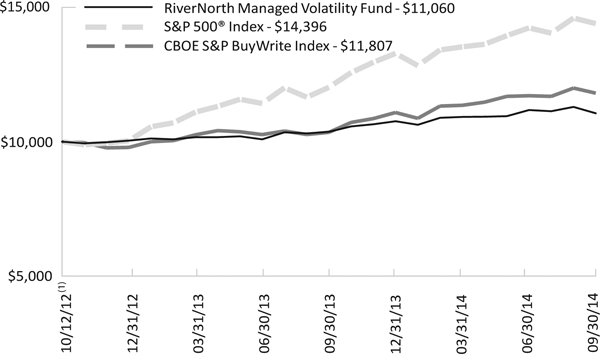
For the twelve month period ending September 30, 2014, the RiverNorth Managed Volatility Fund returned 6.65%. The CBOE Buy‐Write Index returned 14.10%, during the same period.
In addition, the Fund’s standard deviation (daily annualized) was 4.32% for the period, while the standard deviation (daily annualized) of the CBOE Buy‐Write Index was 7.58% during the same period.
Comparison of a $10,000 Investment in the RiverNorth Managed Volatility Fund, the S&P 500 Index, and the CBOE S&P Buy‐Write Index
Cumulative Total Returns for the Period Ending September 30, 2014
| | 1-Year | Since Inception(1) | Standard Deviation(3) | Sharpe(4) | Beta(5) |
| RiverNorth Managed Volatility Fund (RNBWX) | 6.65% | 5.26% | 4.32% | 1.53 | 0.44 |
CBOE S&P 500® BuyWrite Index (BXM)(2) | 14.10% | 8.81% | 7.58% | 1.86 | 0.55 |
S&P 500® Index(2) | 19.73% | 20.35% | 10.30% | 1.91 | 1.00 |
| (1) | Inception date is October 12, 2012. |
(2) | The CBOE S&P 500 BuyWrite Index (BXM) is a benchmark index designed to track the performance of a hypothetical buy-write strategy on the S&P 500® Index. Standard and Poor's 500® Index is a capitalization-weighted index of 500 stocks. The index is designed to measure performance of the broad domestic economy through changes in the aggregate market value of 500 stocks representing all major industries. The S&P 500® and CBOE S&P 500® BuyWrite Indices are indices only and cannot be invested in directly. |
| RiverNorth Funds | Portfolio Update |
| | September 30, 2014 (Unaudited) |
(3) | Standard deviation is a measure of the volatility of a fund's returns. |
(4) | Sharpe ratio measures risk-adjusted performance using the 90 day T-bill return as the risk-free rate. |
(5) | Beta reflects the sensitivity of a fund's return to fluctuations in the market index. A beta of 0.5 reflects ½ the market's volatility as represented by the Fund's primary benchmark, while a beta of 2.0 reflects twice the volatility. |
Performance data quoted represents past performance, which is not a guarantee of future results. Current performance may be lower or higher than the performance quoted. The principal value and investment return of an investment will fluctuate so that your shares, when redeemed, may be worth more or less than their original cost. You can obtain performance data current to the most recent month end by calling (888) 848-7569 or www.rivernorthfunds.com. Total return measures net investment income and capital gain or loss from portfolio investments. All performance shown assumes reinvestment of dividends and capital gains distributions.
The Total Annual Operating Expense for the Fund as disclosed in the prospectus dated 1.28.2014: 2.19%. The adviser has contractually agreed to defer the collection of fees and/or reimburse expenses, but only to the extent necessary to limit Total Annual Fund Operating Expenses (excluding brokerage fees and commissions; borrowing costs, such as (a) interest and (b) dividends on securities sold short; taxes; indirect expenses incurred by the underlying funds in which the Fund invests; and extraordinary expenses) to 1.80% of the average daily net assets of the Fund through 1.31.2015. The annualized net expense ratio in this annual report dated September 30, 2014 is 1.94%.
What contributing factors were responsible for the RiverNorth Managed Volatility Fund’s relative performance during the period?
The largest determining factor of relative performance was the Fund’s relative beta, or market risk, positioning. While the Fund actively manages its beta, a target of .3 with a range of .2‐ .5, it is a much lower beta than the BXM Index. Due to the broad indices being up over the fiscal year, the fund should lag because of the inherent lower beta. In any event, the fund mildly outperformed its target beta of .3 over the fiscal year. This is explained by superior options selection. It is important to note that because of the tendency of markets to rally slower than they sell off, relative performance should quickly catch up in market corrections. This is also the time in which the opportunity sets are the greatest. The fund is waiting patiently for those opportunities.
Detracting from performance was security selection, as some individual companies exhibited far more volatility than expected at the time the position was introduced to the portfolio. As part of this, the Fund was not particularly aggressive in taking short option positions over the balance of the period, as overall equity market volatility has been subdued for quite some time. We believe it to be a far more prudent strategy to save some dry powder for better opportunities in the future.
Contributing to Fund relative performance was sector selection as overweighting the Materials, Information Technology and Telecommunications sectors proved to be successful.
| RiverNorth Funds | Portfolio Update |
| | September 30, 2014 (Unaudited) |
How was the RiverNorth Managed Volatility Fund positioned at the end of September 2014?
Given the current levels of volatility for both the broad equity market and for individual stocks, we remain cautious with the Fund’s short volatility positioning. Regardless, the Fund’s beta is near the long‐run target of 0.3 simply because there have not been enough attractive opportunities in the short volatility arena. If opportunities arise, the Fund has ample cash to attempt to capitalize and position accordingly.
From a sector perspective, the Fund has taken an overweight position in the small/mid‐cap etf IWM, and has found the energy sector attractive from a volatility perspective, and hence has a minor overweight in energy. Sector ETFs are being used as placeholders until more attractive opportunities present themselves. The Fund’s largest relative sector exposures are Energy and Materials. The largest sector underweight is Health Care.
The largest single security positions in the Fund are IWM, GDX, KRE, XLF, XLI, COP, INTC, and YHOO (on a pure common stock basis without taking account of option deltas; this is akin to what will be reported on the 13‐F filing); IWM, OIH, GDX, KRE, XLE, EWZ, XLF, YHOO, XLI and KR (on a purely exposure basis taking account of all option exposures, etc. Like the sector overweights, these are all positions where we believe that implied volatility was too high at the time of the option writing and that implied volatility will compress or realize a volatility less than its implied over the life of that option, ideally creating excess return for the Fund.
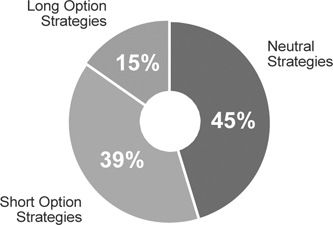
Risk‐Based Strategy Weights
Totals may not add to 100% due to rounding.
| RiverNorth Funds | Portfolio Update |
| | September 30, 2014 (Unaudited) |
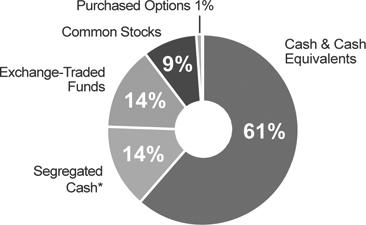
Investment Vehicle Breakdown(1)
Totals may not add to 100% due to rounding.
* Includes short option positions.
(1) | Exchange Traded Fund Risk – exchange traded funds may not correlate to designated indices and have additional fees and expenses, including the duplication of management fees. Focused Security Risk – the value of the Fund may decrease in response to the activities and financial prospects of individual securities in the Fund’s portfolio. Foreign Investing/ADR Risk – foreign securities may be subject to inefficient or volatile markets, different regulatory regimes or different tax policies. Large Company Risk – the Fund may have fewer investment opportunities than funds that invest in companies of all capitalization ranges. Management Risk – there is no guarantee that the adviser’s investment decisions will produce the desired results. Market Risk – economic conditions, interest rates and political events may affect the securities markets. Mid Cap Risk – the Fund may invest in mid cap companies and bears the risk that the Fund’s investment in mid cap companies may be subject to greater earnings and price volatility in comparison to larger companies. New Fund Risk – The Fund is a new mutual fund with a limited operating history. Non‐Diversified Risk – changes in the market value of a single investment could cause greater fluctuations in share price than would occur in a diversified fund. Options Risk – using options involves the exercise of skill and judgment. Options may expire worthless or not perform as expected. Portfolio Turnover Risk – increased portfolio turnover results in higher brokerage expenses and may impact the tax status of distributions. Tax Risk – gains distributed will be categorized as short‐term capital gains, which are subject to higher tax rates than long‐term capital gains. Current tax laws are subject to change. Transaction Cost Risk – the expected high rate of portfolio turnover will likely cause the Fund to incur higher brokerage charges than those associated with an average equity mutual fund. |
Portfolio detail statistics are estimates made by the Adviser and are subject to change.
| RiverNorth Funds | Disclosure of Fund Expenses |
| | September 30, 2014 (Unaudited) |
Expense Example
As a shareholder of the RiverNorth Funds, you incur two types of costs: (1) transaction costs (such as the 2% fee on redemption of Fund shares made within 90 days of purchase); and (2) ongoing costs, including management fees, distribution and service (12b‐1) fees and other Fund expenses. This example is intended to help you understand your ongoing costs (in dollars) of investing in the Funds and to compare these costs with the ongoing costs of investing in other mutual funds. The Example is based on an investment of $1,000 invested at the beginning of the period, October 1, 2013 and held for the year ended September 30, 2014.
Actual Expenses
The first line of the table below provides information about actual account values and actual expenses. You may use the information in this line, together with the amount you invested, to estimate the expenses that you paid over the period. Simply divide your account value by $1,000 (for example, an $8,600 account value divided by $1,000 = 8.6), then multiply the result by the number in the first line under the heading entitled “Expenses Paid During Period” to estimate the expenses you paid on your account during this period.
Hypothetical Example for Comparison Purposes
The second line of the table below provides information about hypothetical account values and hypothetical expenses based on each Fund’s actual expense ratio and an assumed rate of return of 5% per year before expenses, which is not each Fund’s actual return. The hypothetical account values and expenses may not be used to estimate the actual ending account balance or expenses you paid for the period. You may use this information to compare the ongoing costs of investing in each Fund and other funds. To do so, compare these 5% hypothetical examples with the 5% hypothetical examples that appear in the shareholder reports of other funds.
Please note that the expenses shown in the table below are meant to highlight your ongoing costs only and do not reflect any transactional costs, such as redemption fees. Therefore, the second line for each share class of each Fund within the table is useful in comparing ongoing costs only, and will not help you determine the relative total costs of owning different funds. If these transactional costs were included, your costs would have been higher.
| RiverNorth Funds | Disclosure of Fund Expenses |
| | September 30, 2014 (Unaudited) |
| | Beginning Account Value 04/01/2014 | Ending Account Value 09/30/2014 | Expense Ratio(a) | Expenses Paid During Period(b) |
| | | | | |
| RiverNorth Core Opportunity Fund | | | | |
| Class I Shares | | | | |
Actual(c) | $1,000.00 | $992.40 | 1.20% | $1.64 |
| Hypothetical (5% return before expenses) | $1,000.00 | $1,019.05 | 1.20% | $6.07 |
| Class R Shares | | | | |
| Actual | $1,000.00 | $1,021.10 | 1.37% | $6.94 |
| Hypothetical (5% return before expenses) | $1,000.00 | $1,018.20 | 1.37% | $6.93 |
| RiverNorth/DoubleLine Strategic Income Fund | | | | |
| Class I Shares | | | | |
| Actual | $1,000.00 | $1,031.40 | 0.90% | $4.58 |
| Hypothetical (5% return before expenses) | $1,000.00 | $1,020.56 | 0.90% | $4.56 |
| Class R Shares | | | | |
| Actual | $1,000.00 | $1,030.00 | 1.15% | $5.85 |
| Hypothetical (5% return before expenses) | $1,000.00 | $1,019.30 | 1.15% | $5.82 |
| RiverNorth Equity Opportunity Fund | | | | |
| Class I Shares | | | | |
| Actual | $1,000.00 | $1,037.70 | 1.35% | $6.90 |
| Hypothetical (5% return before expenses) | $1,000.00 | $1,018.30 | 1.35% | $6.83 |
| Class R Shares | | | | |
| Actual | $1,000.00 | $1,036.10 | 1.60% | $8.17 |
| Hypothetical (5% return before expenses) | $1,000.00 | $1,017.05 | 1.60% | $8.09 |
| RiverNorth/Oaktree High Income Fund | | | | |
| Class I Shares | | | | |
| Actual | $1,000.00 | $1,003.20 | 1.35% | $6.78 |
Hypothetical (5% return before expenses) | $1,000.00 | $1,018.30 | 1.35% | $6.83 |
| Class R Shares | | | | |
| Actual | $1,000.00 | $1,000.90 | 1.60% | $8.03 |
| Hypothetical (5% return before expenses) | $1,000.00 | $1,017.05 | 1.60% | $8.09 |
| RiverNorth Funds | Disclosure of Fund Expenses |
| | September 30, 2014 (Unaudited) |
| | Beginning Account Value 04/01/2014 | Ending Account Value 09/30/2014 | Expense Ratio(a) | Expenses Paid During Period(b) |
| | | | | |
| RiverNorth Managed Volatility Fund | | | | |
| Actual | $1,000.00 | $1,012.70 | 1.80% | $9.08 |
| Hypothetical (5% return before expenses) | $1,000.00 | $1,016.04 | 1.80% | $9.10 |
(a) | Annualized, based on the Fund's most recent fiscal half-year expenses. |
(b) | Expenses are equal to the Fund's annualized ratio multiplied by the average account value over the period, multiplied by the number of days in the most recent fiscal half year (183), then divided by 365. Note this expense example is typically based on a six-month period. |
(c) | Commenced operations on August 11, 2014. |
RiverNorth Core Opportunity Fund | Schedule of Investments |
| | September 30, 2014 |
Shares/Description | | | | Value | |
| CLOSED‐END FUNDS ‐ 60.79% | | | |
| | 237,987 | | Aberdeen Emerging Markets Smaller Company Opportunities Fund, Inc. | | $ | 3,303,260 | |
| | 1,695,252 | | Adams Express Co. | | | 23,631,813 | |
| | 798,276 | | AllianzGI Equity & Convertible Income Fund | | | 15,861,744 | |
| | 1,863,606 | | Alpine Total Dynamic Dividend Fund | | | 15,859,287 | |
| | 192,226 | | Apollo Tactical Income Fund, Inc. | | | 3,326,279 | |
| | 203,749 | | Avenue Income Credit Strategies Fund | | | 3,422,983 | |
| | 1,519,314 | | BlackRock Credit Allocation Income Trust | | | 20,222,069 | |
| | 366,218 | | BlackRock Debt Strategies Fund, Inc. | | | 1,398,953 | |
| | 610,188 | | BlackRock Enhanced Equity Dividend Trust | | | 5,003,542 | |
| | 34,661 | | BlackRock Floating Rate Income Strategies Fund, Inc. | | | 487,334 | |
| | 967,642 | | BlackRock Global Opportunities Equity Trust | | | 13,653,429 | |
| | 350,079 | | BlackRock Multi‐Sector Income Trust | | | 6,210,401 | |
| | 183,270 | | BlackRock Municipal Target Term Trust | | | 3,641,575 | |
| | 277,978 | | Blackstone/GSO Long‐Short Credit Income Fund | | | 4,642,233 | |
| | 169,293 | | Blackstone/GSO Strategic Credit Fund | | | 2,840,737 | |
| | 653,052 | | Boulder Growth & Income Fund, Inc. | | | 5,772,980 | |
| | 329,103 | | Boulder Total Return Fund, Inc. | | | 8,668,573 | |
| | 398,024 | | CBRE Clarion Global Real Estate Income Fund | | | 3,335,441 | |
| | 148,802 | | Central Europe, Russia and Turkey Fund, Inc. | | | 3,694,754 | |
| | 571,703 | | Central Fund of Canada Ltd. ‐ Class A | | | 7,037,664 | |
| | 66,022 | | Central Securities Corp. | | | 1,517,186 | |
| | 265,271 | | Clough Global Allocation Fund | | | 3,795,763 | |
| | 502,718 | | Clough Global Equity Fund | | | 7,203,949 | |
| | 1,510,478 | | Clough Global Opportunities Fund | | | 18,020,003 | |
| | 293,004 | | Cohen & Steers REIT and Preferred Income Fund, Inc. | | | 5,118,780 | |
| | 138,758 | | Deutsche High Income Trust | | | 1,240,496 | |
| | 86,854 | | Eaton Vance Limited Duration Income Fund | | | 1,266,331 | |
| | 150,939 | | Eaton Vance Short Duration Diversified Income Fund | | | 2,214,275 | |
| | 337,897 | | First Trust High Income Long/Short Fund | | | 5,774,660 | |
| | 362,950 | | Franklin Limited Duration Income Trust | | | 4,493,321 | |
| | 349,234 | | General American Investors Co., Inc.(a) | | | 12,942,612 | |
| | 147,755 | | Global High Income Fund, Inc. | | | 1,427,313 | |
| | 317,086 | | Invesco Dynamic Credit Opportunities Fund | | | 3,916,012 | |
| | 603,864 | | Invesco Municipal Opportunity Trust | | | 7,566,416 | |
| | 284,634 | | Invesco Municipal Trust | | | 3,572,157 | |
| | 26,450 | | Invesco Quality Municipal Income Trust | | | 320,574 | |
| | 46,752 | | Invesco Trust for Investment Grade Municipals | | | 612,919 | |
| | 194,964 | | Ivy High Income Opportunities Fund | | | 3,370,928 | |
| | 3,505,917 | | Liberty All Star® Equity Fund | | | 20,439,496 | |
| | 325,000 | | LMP Real Estate Income Fund, Inc. | | | 3,649,750 | |
| | 98,044 | | Macquarie Global Infrastructure Total Return Fund, Inc. | | | 2,425,609 | |
| | 51,390 | | Madison Strategic Sector Premium Fund | | | 636,722 | |
| | 114,382 | | MFS Charter Income Trust | | | 1,013,424 | |
| | 338,399 | | MFS Multimarket Income Trust | | | 2,172,522 | |
See Notes to Financial Statements.
RiverNorth Core Opportunity Fund | Schedule of Investments |
| | |
Shares/Description | | | | Value | |
| | 120,149 | | Morgan Stanley Emerging Markets Debt Fund, Inc. | | $ | 1,165,445 | |
| | 512,795 | | Morgan Stanley Emerging Markets Domestic Debt Fund, Inc. | | | 6,056,109 | |
| | 51,980 | | Neuberger Berman High Yield Strategies Fund, Inc. | | | 671,062 | |
| | 918,945 | | Neuberger Berman Real Estate Securities Income Fund, Inc. | | | 4,429,315 | |
| | 1,364,062 | | NexPoint Credit Strategies Fund | | | 14,486,338 | |
| | 322,279 | | Nuveen Build American Bond TermFund | | | 6,571,269 | |
| | 93,497 | | Nuveen California AMT‐Free Municipal Income Fund | | | 1,302,413 | |
| | 958,935 | | Nuveen Credit Strategies Income Fund | | | 8,563,290 | |
| | 105,913 | | Nuveen Dividend Advantage Municipal Fund | | | 1,465,836 | |
| | 593,930 | | Nuveen Intermediate Duration Municipal Term Fund | | | 7,406,307 | |
| | 417,195 | | Nuveen Mortgage Opportunity Term Fund | | | 9,908,381 | |
| | 145,788 | | Nuveen Mortgage Opportunity Term Fund | | | 2 3,395,402 | |
| | 216,127 | | Nuveen Municipal Advantage Fund, Inc. | | | 2,915,553 | |
| | 130,123 | | Nuveen Municipal Market Opportunity Fund, Inc. | | | 1,725,431 | |
| | 337,234 | | Nuveen Municipal Opportunity Fund, Inc. | | | 4,805,584 | |
| | 390,639 | | Nuveen Preferred Income Opportunities Fund | | | 3,593,879 | |
| | 56,255 | | Nuveen Premier Municipal Income Fund, Inc. | | | 756,630 | |
| | 409,122 | | Nuveen Premium Income Municipal Fund 2, Inc. | | 5,625,427 | |
| | 89,419 | | Nuveen Premium Income Municipal Fund, Inc. | | | 1,198,215 | |
| | 40,203 | | Nuveen Quality Income Municipal Fund, Inc. | | | 550,379 | |
| | 125,818 | | Nuveen Quality Preferred Income Fund III | | | 1,053,097 | |
| | 28,993 | | Nuveen Select Quality Municipal Fund, Inc. | | | 396,334 | |
| | 597,267 | | PIMCO Dynamic Credit Income Fund | | | 13,420,589 | |
| | 97,500 | | Putnam Municipal Opportunities Trust | | | 1,140,750 | |
| | 378,278 | | Putnam Premier Income Trust | | | 2,072,963 | |
| | 554,416 | | Royce Focus Trust, Inc. | | | 4,363,254 | |
| | 72,902 | | Royce Global Value Trust, Inc.(a) | | | 634,976 | |
| | 1,422,724 | | Royce Value Trust, Inc. | | | 20,629,498 | |
| | 581,423 | | Templeton Global Income Fund | | | 4,622,313 | |
| | 19,893 | | The Denali Fund, Inc. | | | 431,877 | |
| | 1,044,196 | | Tri‐Continental Corp. | | | 21,792,370 | |
| | 83,331 | | Virtus Global Multi‐Sector Income Fund | | | 1,422,460 | |
| | 412,922 | | Wells Fargo Advantage Multi‐Sector Income Fund | | | 5,764,391 | |
| | 280,465 | | Western Asset Emerging Markets Income Fund, Inc. | | | 3,373,994 | |
| | 231,317 | | Western Asset Global Corporate Defined Opportunity Fund, Inc. | | | 4,207,656 | |
| | 90,597 | | Western Asset Managed High Income Fund, Inc. | | | 501,001 | |
| | 310,455 | | Western Asset Worldwide Income Fund, Inc. | | | 3,799,969 | |
| | 715,174 | | Zweig Total Return Fund, Inc. | | | 9,905,160 | |
| | | | | | | | |
TOTAL CLOSED‐END FUNDS (Cost $402,713,340) | | | 452,851,186 | |
| | | | | | | | |
| EXCHANGE‐TRADED FUNDS ‐ 24.15% | | | | |
| | 94,701 | | Guggenheim Russell Top 50® Mega Cap ETF | | | 13,080,102 | |
| | 20,000 | | iShares® Russell 2000® ETF | | | 2,187,000 | |
See Notes to Financial Statements.
RiverNorth Core Opportunity Fund | Schedule of Investments |
| | |
| Shares/Description | | | | Value | |
| | 250,000 | | iShares® S&P 100® Fund | | $ | 22,040,000 | |
| | 209,517 | | Market Vectors® Gold Miners ETF | | | 4,474,655 | |
| | 467,645 | | PowerShares® FTSE RAFI Emerging Markets Portfolio | | | 9,465,135 | |
| | 240,668 | | PowerShares® FTSE RAFI US 1000 Portfolio | | | 21,159,530 | |
| | 278,167 | | SPDR® S&P 500® ETF Trust | | | 54,804,462 | |
| | 608,753 | | Vanguard® FTSE Developed Markets ETF | | | 24,197,932 | |
| | 682,375 | | Vanguard® FTSE Emerging Markets ETF | | | 28,461,861 | |
| | | | | | | | |
TOTAL EXCHANGE‐TRADED FUNDS (Cost $163,214,117) | | | 179,870,677 | |
| | | | | | | |
| HOLDING & INVESTMENT MANAGEMENT COMPANIES ‐ 0.33% | | | | |
| | 12,100 | | Affiliated Managers Group, Inc. | | | 2,424,356 | |
| | | | | | | | |
TOTAL HOLDING & INVESTMENT MANAGEMENT COMPANIES (Cost $634,253) | | | 2,424,356 | |
| | | | | | | |
| PREFERRED STOCKS ‐ 0.21% | | | | |
| | 61,158 | | General American Investors Co., Inc., Series B, 5.950% | | | 1,572,984 | |
| | | | | |
TOTAL PREFERRED STOCKS (Cost $1,444,152) | | | 1,572,984 | |
| | | | | | | |
| SHORT‐TERM INVESTMENTS ‐ 14.89% | | | | |
| | 110,923,286 | | State Street Institutional Trust (7 Day Yield 0.00%) | | | 110,923,286 | |
| | | | | | | | |
TOTAL SHORT‐TERM INVESTMENTS (Cost $110,923,286) | | | 110,923,286 | |
| | | | | | | |
TOTAL INVESTMENTS ‐ 100.37% (Cost $678,929,148) | | | 747,642,489 | |
| LIABILITIES IN EXCESS OF OTHER ASSETS ‐ (0.37)% | | (2,720,879 | ) |
| NET ASSETS ‐ 100.00% | | $ | 744,921,610 | |
| (a) | Non-income producing security. |
See Notes to Financial Statements.
RiverNorth Core Opportunity Fund | Schedule of Investments |
| | |
Common Abbreviations:
ETF - Exchange Traded Fund.
FTSE - Financial Times Stock Exchange.
Ltd. - Limited.
RAFI - Research Affiliates Fundamental Index.
REIT - Real Estate Investment Trust.
S&P – Standard & Poor’s.
SPDR - Standard and Poor's Depositary Receipt.
See Notes to Financial Statements.
RiverNorth/DoubleLine Strategic Income Fund | Schedule of Investments |
| | |
Shares/Description | | | | Value | |
| CLOSED‐END FUNDS ‐ 30.55% | | | |
| | 1,171,169 | | Aberdeen Asia‐Pacific Income Fund, Inc. | | $ | 6,909,897 | |
| | 333,668 | | Advent Claymore Convertible Securities and Income Fund II | | | 2,265,606 | |
| | 318,207 | | Advent/Claymore Enhanced Growth & Income Fund | | | 3,019,784 | |
| | 2,489,106 | | AllianceBernstein Income Fund, Inc. | | | 18,668,295 | |
| | 840,484 | | BlackRock Corporate High Yield Fund, Inc. | | | 9,942,926 | |
| | 1,672,446 | | BlackRock Credit Allocation Income Trust | | | 22,260,256 | |
| | 3,016,220 | | BlackRock Debt Strategies Fund, Inc. | | | 11,521,960 | |
| | 488,894 | | BlackRock Multi‐Sector Income Trust | | | 8,672,980 | |
| | 197,370 | | BlackRock Municipal Target Term Trust | | | 3,921,742 | |
| | 49,311 | | Blackstone/GSO Senior Floating Rate Term Fund | | | 846,670 | |
| | 423,956 | | Blackstone/GSO Strategic Credit Fund | | | 7,113,982 | |
| | 96,614 | | Brookfield High Income Fund, Inc. | | | 905,275 | |
| | 357,311 | | Brookfield Mortgage Opportunity Income Fund, Inc. | | | 6,070,714 | |
| | 205,534 | | Deutsche Global High Income Fund, Inc. | | | 1,664,825 | |
| | 455,060 | | Deutsche High Income Opportunities Fund, Inc. | | | 6,662,078 | |
| | 179,160 | | Diversified Real Asset Income Fund | | | 3,176,507 | |
| | 175,294 | | Eaton Vance Limited Duration Income Fund | | | 2,555,787 | |
| | 31,021 | | Eaton Vance Municipal Bond Fund | | | 388,383 | |
| | 214,591 | | Eaton Vance Senior Income Trust | | | 1,396,987 | |
| | 138,649 | | Eaton Vance Short Duration Diversified Income Fund | | | 2,033,981 | |
| | 248,309 | | Federated Enhanced Treasury Income Fund | | | 3,344,722 | |
| | 279,801 | | First Trust High Income Long/Short Fund | | | 4,781,799 | |
| | 157,303 | | First Trust Intermediate Duration Preferred & Income Fund | | | 3,416,621 | |
| | 20,700 | | Fort Dearborn Income Securities, Inc. | | | 299,529 | |
| | 245,264 | | Franklin Limited Duration Income Trust | | | 3,036,368 | |
| | 171,446 | | Global High Income Fund, Inc. | | | 1,656,168 | |
| | 148,336 | | Invesco Advantage Municipal Income Trust II | | | 1,688,064 | |
| | 33,073 | | Invesco California Value Municipal Income Trust | | | 403,821 | |
| | 514,636 | | Invesco Municipal Opportunity Trust | | | 6,448,389 | |
| | 664,717 | | Invesco Municipal Trust | | | 8,342,198 | |
| | 232,723 | | Invesco Quality Municipal Income Trust | | | 2,820,603 | |
| | 50,400 | | Invesco Senior Income Trust | | | 239,400 | |
| | 114,503 | | Invesco Trust for Investment Grade Municipals | | | 1,501,134 | |
| | 441,021 | | Legg Mason BW Global Income Opportunities Fund, Inc. | | | 7,462,075 | |
| | 837,644 | | MFS Charter Income Trust | | | 7,421,526 | |
| | 82,437 | | MFS InterMarket Income Trust I | | | 688,349 | |
| | 668,428 | | MFS Multimarket Income Trust | | | 4,291,308 | |
| | 269,079 | | Morgan Stanley Emerging Markets Debt Fund, Inc. | | | 2,610,066 | |
| | 941,070 | | Morgan Stanley Emerging Markets Domestic Debt Fund, Inc. | | | 11,114,037 | |
| | 88,958 | | Neuberger Berman High Yield Strategies Fund, Inc. | | | 1,148,448 | |
| | 414,875 | | NexPoint Credit Strategies Fund | | | 4,405,973 | |
| | 210,615 | | Nuveen Build America Bond Opportunity Fund | | | 4,465,038 | |
| | 237,248 | | Nuveen California AMT‐Free Municipal Income Fund | | | 3,304,865 | |
| | 54,400 | | Nuveen California Dividend Advantage Municipal Fund | | | 775,200 | |
| | 1,881,566 | | Nuveen Credit Strategies Income Fund | | | 16,802,384 | |
See Notes to Financial Statements.
RiverNorth/DoubleLine Strategic Income Fund | Schedule of Investments |
| | |
| Shares/Description | | | | Value | |
| | 1,366,318 | | Nuveen Diversified Currency Opportunities Fund | | $ | 14,564,950 | |
| | 509,012 | | Nuveen Dividend Advantage Municipal Fund | | | 7,044,726 | |
| | 23,372 | | Nuveen Dividend Advantage Municipal Fund 3 | | | 319,495 | |
| | 17,384 | | Nuveen Dividend Advantage Municipal Income Fund | | | 245,288 | |
| | 258,147 | | Nuveen Global Income Opportunities Fund | | | 3,190,697 | |
| | 389,031 | | Nuveen Intermediate Duration Municipal Term Fund | | | 4,851,217 | |
| | 554,555 | | Nuveen Municipal Advantage Fund, Inc. | | | 7,480,947 | |
| | 387,941 | | Nuveen Municipal Market Opportunity Fund, Inc. | | | 5,144,098 | |
| | 179,870 | | Nuveen Municipal Opportunity Fund, Inc. | | | 2,563,148 | |
| | 146,744 | | Nuveen Performance Plus Municipal Fund, Inc. | | | 2,127,788 | |
| | 46,329 | | Nuveen Preferred & Income Term Fund | | | 1,061,397 | |
| | 321,806 | | Nuveen Preferred Income Opportunities Fund | | | 2,960,615 | |
| | 82,350 | | Nuveen Premier Municipal Income Fund, Inc. | | | 1,107,608 | |
| | 713,276 | | Nuveen Premium Income Municipal Fund 2, Inc. | | | 9,807,545 | |
| | 424,433 | | Nuveen Premium Income Municipal Fund, Inc. | | | 5,687,402 | |
| | 125,527 | | Nuveen Quality Preferred Income Fund III | | | 1,050,661 | |
| | 158,217 | | Nuveen Select Quality Municipal Fund, Inc. | | | 2,162,826 | |
| | 299,201 | | Nuveen Senior Income Fund | | | 2,001,655 | |
| | 1,365,575 | | PIMCO Dynamic Credit Income Fund | | | 30,684,470 | |
| | 124,510 | | PIMCO Dynamic Income Fund | | | 3,929,536 | |
| | 408,736 | | PIMCO Income Strategy Fund | | | 4,880,308 | |
| | 1,184,549 | | PIMCO Income Strategy Fund II | | | 12,473,301 | |
| | 21,630 | | PIMCO Municipal Income Fund II | | | 251,990 | |
| | 852,839 | | Putnam Master Intermediate Income Trust | | | 4,289,780 | |
| | 152,500 | | Putnam Municipal Opportunities Trust | | | 1,784,250 | |
| | 2,258,809 | | Putnam Premier Income Trust | | | 12,378,273 | |
| | 513,307 | | Strategic Global Income Fund, Inc. | | | 4,532,501 | |
| | 34,016 | | Templeton Emerging Markets Income Fund | | | 432,684 | |
| | 1,559,216 | | Templeton Global Income Fund | | | 12,395,767 | |
| | 287,415 | | The GDL Fund | | | 3,030,877 | |
| | 276,872 | | The New America High Income Fund, Inc. | | | 2,605,366 | |
| | 229,691 | | Virtus Global Multi‐Sector Income Fund | | | 3,920,825 | |
| | 288,801 | | Wells Fargo Advantage Multi‐Sector Income Fund | | | 4,031,662 | |
| | 150,752 | | Western Asset Emerging Markets Debt Fund, Inc. | | | 2,579,367 | |
| | 456,030 | | Western Asset Emerging Markets Income Fund, Inc. | | | 5,486,041 | |
| | 144,034 | | Western Asset Global Corporate Defined Opportunity Fund, Inc. | | | 2,619,978 | |
| | 350,799 | | Western Asset High Yield Defined Opportunity Fund, Inc. | | | 5,826,771 | |
| | 147,102 | | Western Asset Managed High Income Fund, Inc. | | | 813,474 | |
| | 67,584 | | Western Asset Worldwide Income Fund, Inc. | | | 827,228 | |
| | 540,457 | | Western Asset/Claymore Inflation‐Linked Opportunities & Income Fund | | | 6,263,897 | |
| | | | | |
TOTAL CLOSED‐END FUNDS (Cost $421,311,622) | | | 421,877,129 | |
See Notes to Financial Statements.
RiverNorth/DoubleLine Strategic Income Fund | Schedule of Investments |
| | |
| Shares/Description | | | Value | |
| PREFERRED STOCKS - 1.44% | | | |
| | 80,225 | | Apollo Commercial Real Estate Finance, Inc., Series A, 8.625% | | $ | 2,082,641 | |
| | 136,092 | | Kayne Anderson MLP Investment Co., Series F, 3.500% | | | 3,392,774 | |
| | 331,835 | | Kayne Anderson MLP Investment Co., Series E, 4.250% | | | 8,355,605 | |
| | 76,371 | | The GDL Fund, Series B, 3.000%(a) | | | 3,873,537 | |
| | 212,850 | | Tortoise Energy InfraStructure Corp., Series C, 3.950% | | | 2,181,713 | |
| | | | | | | | |
| TOTAL PREFERRED STOCKS (Cost $19,854,695) | | | 19,886,270 | |
| Shares/Description | | Rate | Maturity | | Value | |
| BUSINESS DEVELOPMENT COMPANY SENIOR NOTES - 1.65% | | | |
| | 322,476 | | Fifth Street Finance Corp. | | | 6.13 | % | 04/30/2028 | | | 7,852,290 | |
| | 275,146 | | Main Street Capital Corp. | | | 6.13 | % | 04/01/2023 | | | 6,853,887 | |
| | 187,096 | | Medley Capital Corp. | | | 6.13 | % | 03/30/2023 | | | 4,552,046 | |
| | 62,565 | | MVC Capital, Inc. | | | 7.25 | % | 01/15/2023 | | | 1,565,376 | |
| | 77,538 | | PennantPark Investment Corp. | | | 6.25 | % | 02/01/2025 | | | 1,940,001 | |
| | | | | | | | | | | | | |
| TOTAL BUSINESS DEVELOPMENT COMPANY SENIOR NOTES (Cost $23,077,669) | | | 22,763,600 | |
| Principal Amount/Description | | Rate | Maturity | | Value | |
| FOREIGN CORPORATE BONDS - 3.31% | | | | | | | |
| Australia - 0.06% | | | | | | | |
| $ | 730,000 | | Australia & New Zealand Banking Group Ltd.(b) | 4.88 | % | 01/12/2021 | | | 818,212 | |
| Austria - 0.06% | | | | | | | | |
| | 200,000 | | ESAL GmbH(b) | | | 6.25 | % | 02/05/2023 | | | 195,000 | |
| | 600,000 | | ESAL GmbH(c) | | | 6.25 | % | 02/05/2023 | | | 585,000 | |
| | | | | | | | | | | | 780,000 | |
| Barbados - 0.05% | | | | | | | | | |
| | 400,000 | | Columbus International, Inc.(b) | | | 7.38 | % | 03/30/2021 | | | 417,500 | |
| | 200,000 | | Columbus International, Inc.(c) | | | 7.38 | % | 03/30/2021 | | | 208,750 | |
| | | | | | | | | | | | 626,250 | |
| Bermuda - 0.06% | | | | | | | | | |
| | 600,000 | | Digicel Group Ltd.(b) | | | 7.13 | % | 04/01/2022 | | | 600,300 | |
| | 200,000 | | Digicel Group Ltd.(c) | | | 7.13 | % | 04/01/2022 | | | 200,100 | |
| | | | | | | | | | | | 800,400 | |
| Brazil - 0.10% | | | | | | | | | |
| | 1,500,000 | | OAS Finance Ltd.(a)(b)(d) | | | 8.88 | % | | | | 1,398,750 | |
See Notes to Financial Statements.
RiverNorth/DoubleLine Strategic Income Fund | Schedule of Investments |
| | |
| Principal Amount/Description | | Rate | Maturity | | Value | |
| British Virgin Islands - 0.03% | |
| $ | 400,000 | | Magnesita Finance | | | 8.63 | % | Perpetual Maturity | | $ | 400,000 | |
| Canada - 0.10% | |
| | 820,000 | | Bank of Montreal | | | 1.40 | % | 09/11/2017 | | | 818,444 | |
| | 200,000 | | Seven Generations Energy Ltd.(b) | | | 8.25 | % | 05/15/2020 | | | 217,000 | |
| | 380,000 | | TransCanada PipeLines Ltd. | | | 4.63 | % | 03/01/2034 | | | 391,112 | |
| | | | | | | | | | | | 1,426,556 | |
| Cayman Islands - 0.44% | |
| | 300,000 | | AES Andres Dominicana Ltd.(b) | | | 9.50 | % | 11/12/2020 | | | 322,125 | |
| | 1,000,000 | | AES Andres Dominicana Ltd.(c) | | | 9.50 | % | 11/12/2020 | | | 1,073,750 | |
| | 500,000 | | Agromercantil Senior Trust(b) | | | 6.25 | % | 04/10/2019 | | | 520,625 | |
| | 300,000 | | Agromercantil Senior Trust(c) | | | 6.25 | % | 04/10/2019 | | | 312,375 | |
| | 150,000 | | Bantrab Senior Trust(c) | | | 9.00 | % | 11/14/2020 | | | 159,188 | |
| | 400,000 | | Cementos Progreso Trust(b) | | | 7.13 | % | 11/06/2023 | | | 430,000 | |
| | 200,000 | | Cementos Progreso Trust(c) | | | 7.13 | % | 11/06/2023 | | | 215,000 | |
| | 300,000 | | Comcel Trust(b) | | | 6.88 | % | 02/06/2024 | | | 317,250 | |
| | 500,000 | | Grupo Aval Ltd.(c) | | | 4.75 | % | 09/26/2022 | | | 496,250 | |
| | 1,000,000 | | InduStrial Senior Trust(b) | | | 5.50 | % | 11/01/2022 | | | 992,500 | |
| | 500,000 | | InduStrial Senior Trust(c) | | | 5.50 | % | 11/01/2022 | | | 496,250 | |
| | 810,000 | | Seagate HDD Cayman(b) | | | 4.75 | % | 01/01/2025 | | | 810,000 | |
| | | | | | | | | | | | 6,145,313 | |
| Chile - 0.10% | |
| | 800,000 | | CorpGroup Banking SA(b) | | | 6.75 | % | 03/15/2023 | | | 802,781 | |
| | 400,000 | | ENTEL Chile SA(b) | | | 4.75 | % | 08/01/2026 | | | 400,956 | |
| | 200,000 | | GNL Quintero SA(b) | | | 4.63 | % | 07/31/2029 | | | 199,878 | |
| | | | | | | | | | | | 1,403,615 | |
| Colombia - 0.17% | |
| | 200,000 | | Avianca Holdings SA / Avianca Leasing LLC / Grupo Taca Holdings Ltd.(c) | | | 8.38 | % | 05/10/2020 | | | 214,500 | |
| | 500,000 | | Banco Davivienda SA(c) | | | 5.88 | % | 07/09/2022 | | | 506,250 | |
| | 250,000 | | Banco GNB Sudameris SA(c) | | | 7.50 | % | 07/30/2022 | | | 272,500 | |
| | 300,000 | | Ecopetrol SA | | | 4.13 | % | 01/16/2025 | | | 291,000 | |
| | 600,000 | | Pacific Rubiales Energy Corp.(b) | | | 5.13 | % | 03/28/2023 | | | 576,180 | |
| | 100,000 | | Pacific Rubiales Energy Corp.(b) | | | 5.63 | % | 01/19/2025 | | | 96,345 | |
| | 400,000 | | Pacific Rubiales Energy Corp.(c) | | | 5.13 | % | 03/28/2023 | | | 384,120 | |
| | | | | | | | | | | | 2,340,895 | |
| Costa Rica - 0.11% | |
| | 200,000 | | Banco Nacional de Costa Rica(c) | | | 6.25 | % | 11/01/2023 | | | 201,500 | |
| | 600,000 | | Instit Costa de Electric(b) | | | 6.95 | % | 11/10/2021 | | | 639,000 | |
| | 600,000 | | Instit Costa de Electric(c) | | | 6.95 | % | 11/10/2021 | | | 639,000 | |
| | | | | | | | | | | | 1,479,500 | |
See Notes to Financial Statements.
RiverNorth/DoubleLine Strategic Income Fund | Schedule of Investments |
| | |
| Principal Amount/Description | | Rate | Maturity | | Value | |
| Curacao - 0.08% | |
| $ | 500,000 | | SUAM Finance BV(b) | | | 4.88 | % | 04/17/2024 | | $ | 510,000 | |
| | 200,000 | | SUAM Finance BV(c) | | | 4.88 | % | 04/17/2024 | | | 204,000 | |
| | 425,000 | | Teva Pharmaceutical Finance Co. BV | | | 2.95 | % | 12/18/2022 | | | 405,821 | |
| | | | | | | | | | | | 1,119,821 | |
| Dominican Repubiic - 0.01% | |
| | 200,000 | | Aeropuertos Dominicanos Siglo XXI SA(c)(e) | | | 9.25 | % | 11/13/2019 | | | 195,000 | |
| European Union - 0.06% | |
| | 848,000 | | Corp. Andina de Fomento | | | 3.75 | % | 01/15/2016 | | | 878,190 | |
| France - 0.03% | |
| | 390,000 | | Orange SA | | | 2.75 | % | 09/14/2016 | | | 401,887 | |
| Great Britain - 0.21% | |
| | 88,000 | | BP Capital Markets PLC | | | 4.75 | % | 03/10/2019 | | | 97,040 | |
| | 325,000 | | BP Capital Markets PLC | | | 2.50 | % | 11/06/2022 | | | 306,017 | |
| | 738,000 | | British Telecommunications PLC | | | 5.95 | % | 01/15/2018 | | | 833,713 | |
| | 245,000 | | Diageo Capital PLC | | | 1.50 | % | 05/11/2017 | | | 246,400 | |
| | 1,000,000 | | Vedanta Resources PLC(b) | | | 7.13 | % | 05/31/2023 | | | 1,028,750 | |
| | 300,000 | | Vedanta Resources PLC(c) | | | 8.25 | % | 06/07/2021 | | | 332,063 | |
| | | | | | | | | | | | 2,843,983 | |
| Guatemaia - 0.03% | |
| | 400,000 | | Comcel Trust(c) | | | 6.88 | % | 02/06/2024 | | | 423,000 | |
| India - 0.04% | |
| | 500,000 | | Reliance InduStries Ltd.(c)(d) | | | 5.88 | % | Perpetual Maturity | | | 491,875 | |
| Israel - 0.03% | |
| | 300,000 | | B Communications Ltd.(b) | | | 7.38 | % | 02/15/2021 | | | 320,625 | |
| | 160,000 | | Delek & Avner Tamar Bond Ltd.(b) | | | 5.41 | % | 12/30/2025 | | | 163,525 | |
| | | | | | | | | | | | 484,150 | |
| Luxembourg - 0.28% | |
| | 410,000 | | Actavis Funding SCS(b) | | | 4.85 | % | 06/15/2044 | | | 386,660 | |
| | 525,000 | | Covidien International Finance SA | | | 2.95 | % | 06/15/2023 | | | 508,123 | |
| | 200,000 | | Gol LuxCo SA(b) | | | 8.88 | % | 01/24/2022 | | | 197,100 | |
| | 230,000 | | Intelsat Jackson Holdings SA | | | 5.50 | % | 08/01/2023 | | | 220,513 | |
| | 300,000 | | Klabin Finance SA(b) | | | 5.25 | % | 07/16/2024 | | | 294,090 | |
| | 600,000 | | Millicom International Cellular SA(c) | | | 4.75 | % | 05/22/2020 | | | 574,500 | |
| | 550,000 | | Millicom International Cellular SA(c) | | | 6.63 | % | 10/15/2021 | | | 573,375 | |
| | 200,000 | | Minerva Luxembourg SA(b) | | | 7.75 | % | 01/31/2023 | | | 204,100 | |
| | 650,000 | | Minerva Luxembourg SA(a)(b)(d) | | | 8.75 | % | Perpetual Maturity | | | 664,625 | |
| | 200,000 | | Minerva Luxembourg SA(c) | | | 7.75 | % | 01/31/2023 | | | 204,100 | |
| | | | | | | | | | | | 3,827,186 | |
See Notes to Financial Statements.
RiverNorth/DoubleLine Strategic Income Fund | Schedule of Investments |
| | September 30, 2014 |
| Principal Amount/Description | | Rate | Maturity | | Value | |
| Marshall Islands - 0.05% | | | | | | | |
| $ | 274,223 | | Nakilat, Inc.(c) | | | 6.27 | % | 12/31/2033 | | $ | 311,244 | |
| | 300,000 | | Nakilat, Inc.(c) | | | 6.07 | % | 12/31/2033 | | | 341,625 | |
| | | | | | | | | | | | 652,869 | |
| Mexico - 0.49% | | | | | | | | | |
| | 300,000 | | Banco Inbursa SA Institucion de Banca Multiple(b) | | | 4.13 | % | 06/06/2024 | | | 291,000 | |
| | 600,000 | | Cemex SAB de CV(b) | | | 5.70 | % | 01/11/2025 | | | 579,600 | |
| | 400,000 | | Credito Real SAB de CV(b) | | | 7.50 | % | 03/13/2019 | | | 429,000 | |
| | 750,000 | | Fermaca Enterprises S de RL de CV(b) | | | 6.38 | % | 03/30/2038 | | | 789,375 | |
| | 200,000 | | Grupo Cementos de Chihuahua SAB de CV(c) | | | 8.13 | % | 02/08/2020 | | | 217,000 | |
| | 600,000 | | Grupo Idesa SA de CV(b) | | | 7.88 | % | 12/18/2020 | | | 642,000 | |
| | 300,000 | | Grupo KUO SAB de CV(c) | | | 6.25 | % | 12/04/2022 | | | 308,385 | |
| | 150,000 | | Metalsa SA de CV(c) | | | 4.90 | % | 04/24/2023 | | | 146,250 | |
| | 800,000 | | Mexichem SAB de CV(c) | | | 6.75 | % | 09/19/2042 | | | 858,400 | |
| | 1,000,000 | | Mexico Generadora de Energia S de rl(c) | | | 5.50 | % | 12/06/2032 | | | 1,002,500 | |
| | 685,000 | | Petroleos Mexicanos | | | 6.63 | % | 06/15/2035 | | | 798,368 | |
| | 400,000 | | TV Azteca SAB de CV(c) | | | 7.63 | % | 09/18/2020 | | | 427,000 | |
| | 250,000 | | Unifin Financiera SAPI de CV SOFOM ENR(b) | | | 6.25 | % | 07/22/2019 | | | 244,375 | |
| | | | | | | | | | | | 6,733,253 | |
| Morocco - 0.01% | | | | | | | | | |
| | 200,000 | | OCP SA(b) | | | 5.63 | % | 04/25/2024 | | | 208,540 | |
| Netherlands - 0.16% | | | | | | | | | |
| | 250,000 | | Ajecorp BV(c) | | | 6.50 | % | 05/14/2022 | | | 228,875 | |
| | 300,000 | | CIMPOR Financial Operations BV(b) | | | 5.75 | % | 07/17/2024 | | | 291,000 | |
| | 572,000 | | Koninklijke KPN NV | | | 8.38 | % | 10/01/2030 | | | 791,087 | |
| | 700,000 | | Marfrig Holding Europe BV(b) | | | 6.88 | % | 06/24/2019 | | | 682,850 | |
| | 200,000 | | VTR Finance BV(c) | | | 6.88 | % | 01/15/2024 | | | 207,500 | |
| | | | | | | | | | | | 2,201,312 | |
| Norway - 0.04% | | | | | | | | | |
| | 600,000 | | Corp. Pesquera Inca SAC(c) | | | 9.00 | % | 02/10/2017 | | | 594,000 | |
| Panama - 0.07% | | | | | | | | | |
| | 200,000 | | Aeropuerto Internacional de Tocumen SA | | | 5.75 | % | 10/09/2023 | | | 205,800 | |
| | 400,000 | | AES El Salvador Trust II(c) | | | 6.75 | % | 03/28/2023 | | | 387,832 | |
| | 400,000 | | Avianca Holdings SA / Avianca Leasing LLC / Grupo Taca Holdings Ltd.(b) | | | 8.38 | % | 05/10/2020 | | | 429,000 | |
| | | | | | | | | | | | 1,022,632 | |
| Paraguay - 0.08% | | | | | | | | | |
| | 150,000 | | Banco Regional SAECA(b) | | | 8.13 | % | 01/24/2019 | | | 165,000 | |
| | 450,000 | | Banco Regional SAECA(c) | | | 8.13 | % | 01/24/2019 | | | 495,000 | |
See Notes to Financial Statements.
RiverNorth/DoubleLine Strategic Income Fund | Schedule of Investments |
| | |
| Principal Amount/Description | | Rate | Maturity | | Value | |
| $ | 400,000 | | Telefonica Celular del Paraguay SA(c) | | | 6.75 | % | 12/13/2022 | | $ | 416,200 | |
| | | | | | | | | | | | 1,076,200 | |
| Peru - 0.30% | | | | | | | | | | | |
| | 600,000 | | Abengoa Transmision Sur SA(b) | | | 6.88 | % | 04/30/2043 | | | 669,000 | |
| | 200,000 | | Abengoa Transmision Sur SA(c) | | | 6.88 | % | 04/30/2043 | | | 223,000 | |
| | 250,000 | | Banco de Credito del Peru(a)(b) | | | 6.13 | % | 04/24/2027 | | | 268,125 | |
| | 200,000 | | Banco Internacional del Peru SAA(a)(b) | | | 5.99 | % | 03/19/2029 | | | 218,000 | |
| | 400,000 | | Banco Internacional del Peru SAA(a)(c) | | | 8.50 | % | 04/23/2070 | | | 454,600 | |
| | 180,000 | | Camposol SA(b) | | | 9.88 | % | 02/02/2017 | | | 189,900 | |
| | 400,000 | | Corp. Azucarera del Peru SA(c) | | | 6.38 | % | 08/02/2022 | | | 370,000 | |
| | 200,000 | | Corp. Financiera de Desarrollo SA(a)(b) | | | 5.25 | % | 07/15/2029 | | | 203,250 | |
| | 100,000 | | Corp. Pesquera Inca SAC(b) | | | 9.00 | % | 02/10/2017 | | | 99,000 | |
| | 100,000 | | InRetail Shopping Malls(b) | | | 6.50 | % | 07/09/2021 | | | 104,750 | |
| | 200,000 | | InRetail Shopping Malls(c) | | | 6.50 | % | 07/09/2021 | | | 209,500 | |
| | 200,000 | | MaeStro Peru SA(c) | | | 6.75 | % | 09/26/2019 | | | 217,190 | |
| | 500,000 | | Pesquera Exalmar SAA(b) | | | 7.38 | % | 01/31/2020 | | | 461,250 | |
| | 500,000 | | Pesquera Exalmar SAA(c) | | | 7.38 | % | 01/31/2020 | | | 461,250 | |
| | | | | | | | | | | | 4,148,815 | |
| South Korea - 0.06% | | | | | | | | | |
| | 235,000 | | The Korea Development Bank | | | 4.38 | % | 08/10/2015 | | | 242,384 | |
| | 550,000 | | The Korea Development Bank | | | 3.25 | % | 03/09/2016 | | | 567,022 | |
| | | | | | | | | | | | 809,406 | |
| | | | | | | | | | |
| TOTAL FOREIGN CORPORATE BONDS (Cost $45,240,519) | | | | | | | | 45,731,610 | |
| | | | | | | | | | |
| U.S. CORPORATE BONDS - 3.05% | | | | | | | | | |
| Aerospace/Defense - 0.07% | | | | | | | | | |
| | 281,000 | | The Boeing Co. | | | 6.88 | % | 03/15/2039 | | | 396,320 | |
| | 215,000 | | TransDigm, Inc.(b) | | | 6.00 | % | 07/15/2022 | | | 212,581 | |
| | 300,000 | | United Technologies Corp. | | | 3.10 | % | 06/01/2022 | | | 300,416 | |
| | | | | | | | | | | | 909,317 | |
| Agriculture - 0.06% | | | | | | | | | |
| | 890,000 | | Altria Group, Inc. | | | 2.85 | % | 08/09/2022 | | | 854,171 | |
| Airlines - 0.04% | | | | | | | | | |
| | 490,000 | | Southwest Airlines Co. | | | 5.13 | % | 03/01/2017 | | | 529,205 | |
| Auto Manufacturers - 0.06% | | | | | | | | | |
| | 615,000 | | Ford Motor Co. | | | 7.45 | % | 07/16/2031 | | | 814,144 | |
| Auto Parts & Equipment - 0.05% | | | | | | | | | |
| | 120,000 | | American Axle & Manufacturing, Inc. | | | 6.63 | % | 10/15/2022 | | | 126,900 | |
| | 370,000 | | Delphi Corp. | | | 4.15 | % | 03/15/2024 | | | 378,273 | |
See Notes to Financial Statements.
RiverNorth/DoubleLine Strategic Income Fund | Schedule of Investments |
| | |
| Principal Amount/Description | | Rate | Maturity | | Value | |
| $ | 205,000 | | The Goodyear Tire & Rubber Co. | | | 7.00 | % | 05/15/2022 | | $ | 220,631 | |
| | | | | | | | | | | | 725,804 | |
| Banks - 0.32% | | | | | | | | | |
| | 610,000 | | Bank of America Corp. | | | 2.00 | % | 01/11/2018 | | | 607,921 | |
| | 405,000 | | BB&T Corp. | | | 2.25 | % | 02/01/2019 | | | 405,947 | |
| | 610,000 | | Citigroup, Inc. | | | 1.75 | % | 05/01/2018 | | | 602,094 | |
| | 810,000 | | JPMorgan Chase & Co. | | | 3.63 | % | 05/13/2024 | | | 809,705 | |
| | 395,000 | | Morgan Stanley | | | 3.75 | % | 02/25/2023 | | | 395,294 | |
| | 60,000 | | PNC Funding Corp. | | | 4.38 | % | 08/11/2020 | | | 65,511 | |
| | 340,000 | | PNC Funding Corp. | | | 3.30 | % | 03/08/2022 | | | 342,449 | |
| | 345,000 | | The Goldman Sachs Group, Inc. | | | 5.75 | % | 01/24/2022 | | | 393,006 | |
| | 415,000 | | Wells Fargo & Co. | | | 4.60 | % | 04/01/2021 | | | 455,480 | |
| | 335,000 | | Wells Fargo & Co. | | | 3.50 | % | 03/08/2022 | | | 342,839 | |
| | | | | | | | | | | | 4,420,246 | |
Beverages - 0.03% | | | | | | | | | |
| | 400,000 | | The Coca-Cola Co. | | | 1.80 | % | 09/01/2016 | | | 408,594 | |
| Biotechnology - 0.04% | | | | | | | | | |
| | 585,000 | | Gilead Sciences, Inc. | | | 3.70 | % | 04/01/2024 | | | 597,012 | |
| Building Materials - 0.03% | | | | | | | | | |
| | 200,000 | | Cemex Finance LLC(c) | | | 6.00 | % | 04/01/2024 | | | 199,940 | |
| | 205,000 | | Louisiana-Pacific Corp. | | | 7.50 | % | 06/01/2020 | | | 219,350 | |
| | | | | | | | | | | | 419,290 | |
| Chemicals - 0.11% | | | | | | | | | |
| | 135,000 | | Ashland, Inc. | | | 4.75 | % | 08/15/2022 | | | 132,300 | |
| | 400,000 | | Braskem America Finance Co.(c) | | | 7.13 | % | 07/22/2041 | | | 398,000 | |
| | 395,000 | | Ecolab, Inc. | | | 3.00 | % | 12/08/2016 | | | 410,239 | |
| | 210,000 | | Hexion US Finance Corp. | | | 6.63 | % | 04/15/2020 | | | 212,100 | |
| | 415,000 | | The Dow Chemical Co. | | | 3.00 | % | 11/15/2022 | | | 400,462 | |
| | | | | | | | | | | | 1,553,101 | |
| Commercial Services - 0.07% | | | | | | | | | |
| | | | Avis Budget Car Rental LLC / Avis | | | | | | | | | |
| | 215,000 | | Budget Finance, Inc. | | | 5.50 | % | 04/01/2023 | | | 214,462 | |
| | 195,000 | | RR Donnelley & Sons Co. Safway Group Holding LLC / Safway | | | 7.88 | % | 03/15/2021 | | | 214,987 | |
| | 210,000 | | Finance Corp.(b) | | | 7.00 | % | 05/15/2018 | | | 214,725 | |
| | 130,000 | | Service Corp. International | | | 5.38 | % | 01/15/2022 | | | 131,950 | |
| | 205,000 | | United Rentals North America, Inc. | | | 7.63 | % | 04/15/2022 | | | 224,988 | |
| | | | | | | | | | | | 1,001,112 | |
| Cosmetics/Personal Care - 0.02% | | | | | | | | | |
| | 220,000 | | Revlon Consumer Products Corp. | | | 5.75 | % | 02/15/2021 | | | 216,700 | |
| Distribution/Wholesale - 0.04% | | | | | | | | | |
| | 330,000 | | Arrow Electronics, Inc. | | | 3.38 | % | 11/01/2015 | | | 338,571 | |
| | 205,000 | | HD Supply, Inc. | | | 7.50 | % | 07/15/2020 | | | 213,713 | |
| | | | | | | | | | | | 552,284 | |
See Notes to Financial Statements.
RiverNorth/DoubleLine Strategic Income Fund | Schedule of Investments |
| | |
| Principal Amount/Description | | Rate | Maturity | | Value | |
| Diversified Financial Services - 0.27% | | | | | | | |
| $ | 535,000 | | American Express Credit Corp. | | | 2.13 | % | 03/18/2019 | | $ | 533,484 | |
| | 275,000 | | American Express Credit Corp. | | | 2.25 | % | 08/15/2019 | | | 273,201 | |
| | 785,000 | | General Electric Capital Corp. | | | 2.90 | % | 01/09/2017 | | | 815,801 | |
| | 520,000 | | General Motors Financial Co., Inc. Icahn Enterprises LP / Icahn Enterprises | | | 3.00 | % | 09/25/2017 | | | 525,850 | |
| | 215,000 | | Finance Corp. National Rural Utilities Cooperative | | | 4.88 | % | 03/15/2019 | | | 213,388 | |
| | 754,000 | | Finance Corp. | | | 10.38 | % | 11/01/2018 | | | 993,906 | |
| | 400,000 | | Synchrony Financial | | | 3.00 | % | 08/15/2019 | | | 401,450 | |
| | | | | | | | | | | | 3,757,080 | |
| Electric - 0.11% | | | | | | | | | |
| | 462,000 | | Berkshire Hathaway Energy Co. | | | 6.50 | % | 09/15/2037 | | | 599,353 | |
| | 390,000 | | Duke Energy Corp. | | | 3.55 | % | 09/15/2021 | | | 404,870 | |
| | 510,000 | | Southern Power Co. | | | 4.88 | % | 07/15/2015 | | | 527,612 | |
| | | | | | | | | | | | 1,531,835 | |
| Entertainment - 0.03% | | | | | | | | | |
| | 200,000 | | Cinemark USA, Inc. | | | 7.38 | % | 06/15/2021 | | | 215,000 | |
| | 220,000 | | Regal Entertainment Group | | | 5.75 | % | 03/15/2022 | | | 221,650 | |
| | | | | | | | | | | | 436,650 | |
| Environmental Control - 0.04% | | | | | | | | | |
| | 485,000 | | Waste Management, Inc. | | | 6.13 | % | 11/30/2039 | | | 602,159 | |
| Food - 0.18% | | | | | | | | | |
| | 90,000 | | HJ Heinz Co. | | | 4.25 | % | 10/15/2020 | | | 89,662 | |
| | 305,000 | | Kellogg Co. | | | 7.45 | % | 04/01/2031 | | | 401,180 | |
| | 215,000 | | Post Holdings, Inc. | | | 7.38 | % | 02/15/2022 | | | 213,388 | |
| | 130,000 | | Smithfield Foods, Inc.(b) | | | 5.88 | % | 08/01/2021 | | | 131,950 | |
| | 160,000 | | Sysco Corp. | | | 1.45 | % | 10/02/2017 | | | 160,346 | |
| | 600,000 | | The Kroger Co. | | | 3.40 | % | 04/15/2022 | | | 602,740 | |
| | 850,000 | | Tyson Foods, Inc. | | | 3.95 | % | 08/15/2024 | | | 853,425 | |
| | | | | | | | | | | | 2,452,691 | |
| Hand/Machine Tools - 0.02% | | | | | | | | | |
| | 210,000 | | Milacron LLC / Mcron Finance Corp.(b) | | | 7.75 | % | 02/15/2021 | | | 222,075 | |
| Healthcare-Products - 0.07% | | | | | | | | | |
| | 215,000 | | Alere, Inc. | | | 6.50 | % | 06/15/2020 | | | 215,537 | |
| | 595,000 | | Becton Dickinson and Co. | | | 3.13 | % | 11/08/2021 | | | 610,093 | |
| | 85,000 | | Biomet, Inc. | | | 6.50 | % | 08/01/2020 | | | 90,313 | |
| | | | | | | | | | | | 915,943 | |
| Healthcare-Services - 0.05% | | | | | | | | | |
| | 130,000 | | LifePoint Hospitals, Inc. | | | 5.50 | % | 12/01/2021 | | | 132,275 | |
| | 210,000 | | Select Medical Corp. | | | 6.38 | % | 06/01/2021 | | | 211,050 | |
| | 398,000 | | WellPoint, Inc. | | | 2.30 | % | 07/15/2018 | | | 399,460 | |
| | | | | | | | | | | | 742,785 | |
See Notes to Financial Statements.
RiverNorth/DoubleLine Strategic Income Fund | Schedule of Investments |
| | September 30, 2014 (Unaudited) |
| Principal Amount/Description | | Rate | Maturity | | Value | |
| Home Builders - 0.01% | | | | | | | |
| $ | 175,000 | | WCI Communities, Inc. | | | 6.88 | % | 08/15/2021 | | $ | 176,312 | |
| | 35,000 | | WCI Communities, Inc.(b) | | | 6.88 | % | 08/15/2021 | | | 35,263 | |
| | | | | | | | | | | | 211,575 | |
| Household Products - 0.03% | | | | | | | | | |
| | | | Reynolds Group Issuer, Inc. / Reynolds | | | | | | | | | |
| | 210,000 | | Group Issuer LLC | | | 9.00 | % | 04/15/2019 | | | 219,712 | |
| | 155,000 | | Spectrum Brands, Inc. | | | 6.63 | % | 11/15/2022 | | | 163,525 | |
| | | | | | | | | | | | 383,237 | |
| Insurance - 0.10% | | | | | | | | | |
| | 505,000 | | Liberty Mutual Group, Inc.(b) | | | 6.50 | % | 05/01/2042 | | | 619,924 | |
| | 100,000 | | MetLife, Inc. | | | 6.38 | % | 06/15/2034 | | | 128,484 | |
| | 275,000 | | MetLife, Inc. | | | 5.88 | % | 02/06/2041 | | | 324,478 | |
| | 361,000 | | MetLife, Inc. | | | 4.13 | % | 08/13/2042 | | | 343,231 | |
| | | | | | | | | | | | 1,416,117 | |
| Internet - 0.01% | | | | | | | | | |
| | 120,000 | | Equinix, Inc. | | | 7.00 | % | 07/15/2021 | | | 129,000 | |
| Iron/Steel - 0.07% | | | | | | | | | |
| | 595,000 | | Glencore Funding LLC(b) Signode InduStrial Group Lux | | | 3.13 | % | 04/29/2019 | | | 596,636 | |
| | | | SA/Signode InduStrial Group US, | | | | | | | | | |
| | 220,000 | | Inc.(b) | | | 6.38 | % | 05/01/2022 | | | 211,750 | |
| | 135,000 | | Steel Dynamics, Inc.(b) | | | 5.13 | % | 10/01/2021 | | | 137,025 | |
| | | | | | | | | | | | 945,411 | |
| Leisure Time - 0.02% | | | | | | | | | |
| | 85,000 | | NCL Corp. Ltd. | | | 5.00 | % | 02/15/2018 | | | 86,275 | |
| | 195,000 | | Viking Cruises Ltd.(b) | | | 8.50 | % | 10/15/2022 | | | 213,037 | |
| | | | | | | | | | | | 299,312 | |
| Lodging - 0.04% | | | | | | | | | |
| | 200,000 | | MGM Resorts International | | | 6.63 | % | 12/15/2021 | | | 212,000 | |
| | 315,000 | | Wynn Las Vegas LLC | | | 7.75 | % | 08/15/2020 | | | 335,869 | |
| | | | | | | | | | | | 547,869 | |
| Machinery-Construction & Mining - 0.01% | | | | | | | | | |
| | 125,000 | | Terex Corp. | | | 6.00 | % | 05/15/2021 | | | 130,625 | |
| Machinery-Diversified - 0.01% | | | | | | | | | |
| | 120,000 | | The Manitowoc Co., Inc. | | | 8.50 | % | 11/01/2020 | | | 129,600 | |
| Media - 0.15% | | | | | | | | | |
| | 610,000 | | 21st Century Fox America, Inc.(b) CCO Holdings LLC / CCO Holdings | | | 4.75 | % | 09/15/2044 | | | 614,904 | |
| | 220,000 | | Capital Corp. | | | 5.25 | % | 09/30/2022 | | | 216,150 | |
| | 400,000 | | Comcast Corp. DIRECTV Holdings LLC / DIRECTV | | | 4.20 | % | 08/15/2034 | | | 397,892 | |
| | 380,000 | | Financing Co., Inc. | | | 4.45 | % | 04/01/2024 | | | 397,090 | |
| | 225,000 | | Gannett Co., Inc.(b) | | | 4.88 | % | 09/15/2021 | | | 218,250 | |
See Notes to Financial Statements.
RiverNorth/DoubleLine Strategic Income Fund | Schedule of Investments |
| | September 30, 2014 (Unaudited) |
| Principal Amount/Description | | Rate | Maturity | | Value | |
| $ | 205,000 | | Gray Television, Inc. | | | 7.50 | % | 10/01/2020 | | $ | 210,638 | |
| | | | | | | | | | | | 2,054,924 | |
| Mining - 0.10% | | | | | | | | | |
| | 375,000 | | Freeport-McMoRan, Inc. | | | 3.10 | % | 03/15/2020 | | | 372,615 | |
| | 200,000 | | Southern Copper Corp. | | | 6.75 | % | 04/16/2040 | | | 224,336 | |
| | 850,000 | | Southern Copper Corp. | | | 5.25 | % | 11/08/2042 | | | 806,752 | |
| | | | | | | | | | | | 1,403,703 | |
| Miscellaneous Manufacturing - 0.04% | | | | | | | | | |
| | 225,000 | | Gates Global LLC / Gates Global Co.(b) | | | 6.00 | % | 07/15/2022 | | | 212,625 | |
| | 340,000 | | Illinois Tool Works, Inc. | | | 3.38 | % | 09/15/2021 | | | 353,709 | |
| | | | | | | | | | | | 566,334 | |
| Office/Business Equipment - 0.05% | | | | | | | | | |
| | 225,000 | | CDW LLC / CDW Finance Corp. | | | 6.00 | % | 08/15/2022 | | | 234,562 | |
| | 400,000 | | Xerox Corp. | | | 2.95 | % | 03/15/2017 | | | 414,280 | |
| | | | | | | | | | | | 648,842 | |
| Oil & Gas - 0.27% | | | | | | | | | |
| | 185,000 | | Athlon Holdings LP / Athlon Finance Corp. | | | 7.38 | % | 04/15/2021 | | | 202,112 | |
| | 310,000 | | ConocoPhillips | | | 6.50 | % | 02/01/2039 | | | 407,215 | |
| | 700,000 | | Devon Energy Corp. | | | 6.30 | % | 01/15/2019 | | | 810,528 | |
| | 215,000 | | Energy XXI Gulf Coast, Inc. | | | 7.50 | % | 12/15/2021 | | | 211,775 | |
| | 317,000 | | Halliburton Co. | | | 6.15 | % | 09/15/2019 | | | 373,461 | |
| | 135,000 | | Hilcorp Energy I LP / Hilcorp Finance Co.(b) | | | 5.00 | % | 12/01/2024 | | | 130,106 | |
| | 230,000 | | Memorial Production Partners LP / Memorial Production Finance Corp.(b) | | | 6.88 | % | 08/01/2022 | | | 220,800 | |
| | 120,000 | | Oasis Petroleum, Inc. | | | 6.88 | % | 03/15/2022 | | | 127,200 | |
| | 345,000 | | Phillips 66 | | | 5.88 | % | 05/01/2042 | | | 410,340 | |
| | 322,000 | | Plains Exploration & Production Co. | | | 6.50 | % | 11/15/2020 | | | 353,434 | |
| | 215,000 | | Sanchez Energy Corp.(b) | | | 6.13 | % | 01/15/2023 | | | 213,689 | |
| | 215,000 | | Ultra Petroleum Corp.(b) | | | 5.75 | % | 12/15/2018 | | | 217,150 | |
| | | | | | | | | | | | 3,677,810 | |
| Packaging & Containers - 0.03% | | | | | | | | | |
| | 225,000 | | Berry Plastics Corp. | | | 5.50 | % | 05/15/2022 | | | 216,844 | |
| | 210,000 | | Plastipak Holdings, Inc.(b) | | | 6.50 | % | 10/01/2021 | | | 214,200 | |
| | | | | | | | | | | | 431,044 | |
| Pipelines - 0.08% | | | | | | | | | |
| | 235,000 | | Atlas Pipeline Partners LP / Atlas Pipeline Finance Corp. | | | 4.75 | % | 11/15/2021 | | | 220,019 | |
| | 265,000 | | Kinder Morgan Energy Partners LP | | | 6.95 | % | 01/15/2038 | | | 310,076 | |
| | 25,000 | | Kinder Morgan Energy Partners LP | | | 6.50 | % | 09/01/2039 | | | 27,968 | |
| | 355,000 | | ONEOK Partners LP | | | 6.13 | % | 02/01/2041 | | | 405,164 | |
| | 130,000 | | Southern Star Central Corp.(b) | | | 5.13 | % | 07/15/2022 | | | 129,675 | |
| | | | | | | | | | | | 1,092,902 | |
See Notes to Financial Statements.
RiverNorth/DoubleLine Strategic Income Fund | Schedule of Investments |
| | |
| Principal Amount/Description | | Rate | Maturity | | Value | |
| REITS - 0.09% | | | | | | | |
| $ | 385,000 | | Boston Properties LP | | | 4.13 | % | 05/15/2021 | | $ | 408,808 | |
| | 415,000 | | ERP Operating LP | | | 4.50 | % | 07/01/2044 | | | 410,324 | |
| | 45,000 | | MPT Operating Partnership LP / MPT Finance Corp. | | | 6.38 | % | 02/15/2022 | | | 48,263 | |
| | 345,000 | | Simon Property Group LP | | | 5.65 | % | 02/01/2020 | | | 397,625 | |
| | | | | | | | | | | | 1,265,020 | |
| Retail - 0.04% | | | | | | | | | |
| | 460,000 | | Macy's Retail Holdings, Inc. | | | 2.88 | % | 02/15/2023 | | | 439,965 | |
| | 125,000 | | Sally Holdings LLC / Sally Capital, Inc. | | | 5.75 | % | 06/01/2022 | | | 128,125 | |
| | | | | | | | | | | | 568,090 | |
| Software - 0.07% | | | | | | | | | |
| | 125,000 | | Activision Blizzard, Inc.(b) | | | 5.63 | % | 09/15/2021 | | | 130,312 | |
| | 800,000 | | Oracle Corp. | | | 2.38 | % | 01/15/2019 | | | 811,530 | |
| | | | | | | | | | | | 941,842 | |
| Telecommunications - 0.06% | | | | | | | | | |
| | 90,000 | | CommScope, Inc.(b) | | | 5.00 | % | 06/15/2021 | | | 88,650 | |
| | 190,000 | | Frontier Communications Corp. | | | 8.50 | % | 04/15/2020 | | | 211,850 | |
| | 125,000 | | SBA Communications Corp. | | | 5.63 | % | 10/01/2019 | | | 127,500 | |
| | 408,000 | | Verizon Communications, Inc.(b) | | | 2.63 | % | 02/21/2020 | | | 403,483 | |
| | | | | | | | | | | | 831,483 | |
| Toys/Games/Hobbies - 0.03% | | | | | | | | | |
| | 395,000 | | Mattel, Inc. | | | 2.50 | % | 11/01/2016 | | | 405,573 | |
| Transportation - 0.03% | | | | | | | | | |
| | 400,000 | | Burlington Northern Santa Fe LLC | | | 4.55 | % | 09/01/2044 | | | 401,332 | |
| | | | | | | | | | | | | |
| TOTAL U.S. CORPORATE BONDS (Cost $42,202,467) | | | 42,143,843 | |
| | | | | |
| FOREIGN GOVERNMENT BONDS AND NOTES, SUPRANATIONALS AND FOREIGN AGENCIES - 0.06% | |
| | 200,000 | | Costa Rica Government International Bond(b) | | | 7.00 | % | 04/04/2044 | | | 201,500 | |
| | 580,000 | | Mexico Government International Bond | | | 4.00 | % | 10/02/2023 | | | 600,155 | |
| | | | | |
TOTAL FOREIGN GOVERNMENT BONDS AND NOTES, SUPRANATIONALS AND FOREIGN AGENCIES (Cost $783,964) | | | 801,655 | |
| | |
| COLLATERALIZED LOAN OBLIGATIONS - 0.93% | |
| | 500,000 | | Adams Mill CLO Ltd. Series 2014-1A(a)(b) | | | 3.70 | % | 07/15/2026 | | | 473,695 | |
See Notes to Financial Statements.
RiverNorth/DoubleLine Strategic Income Fund | Schedule of Investments |
| | September 30, 2014 |
| Principal Amount/Description | | Rate | Maturity | | Value | |
| $ | 250,000 | | Series 2014-1A(a)(b) | | | 5.20 | % | 07/15/2026 | | $ | 227,723 | |
| | | | Apidos CLO XVIII | | | | | | | | | |
| | 500,000 | | Series 2014-18A(a)(b) | | | 3.88 | % | 07/22/2026 | | | 479,602 | |
| | 250,000 | | Series 2014-18A(a)(b) | | | 5.43 | % | 07/22/2026 | | | 230,772 | |
| | | | ARES CLO Ltd. | | | | | | | | | |
| | 500,000 | | Series 2012-2A(a)(b) | | | 4.93 | % | 10/12/2023 | | | 501,241 | |
| | | | Avery Point II CLO Ltd. | | | | | | | | | |
| | 250,000 | | Series 2013-2A(a)(b) | | | 2.98 | % | 07/17/2025 | | | 244,323 | |
| | 500,000 | | Series 2013-2A(a)(b) | | | 3.68 | % | 07/17/2025 | | | 477,478 | |
| | | | Birchwood Park CLO Ltd. | | | | | | | | | |
| | 250,000 | | Series 2014-1A(a)(b) | | | 6.63 | % | 07/15/2026 | | | 250,000 | |
| | 250,000 | | Series 2014-1A(a)(b) | | | 3.38 | % | 07/15/2026 | | | 249,175 | |
| | 250,000 | | Series 2014-1A(a)(b) | | | 1.43 | % | 07/15/2026 | | | 248,375 | |
| | | | BlueMountain CLO Ltd. | | | | | | | | | |
| | 500,000 | | Series 2012-1A(a)(b) | | | 5.73 | % | 07/20/2023 | | | 484,090 | |
| | | | Brookside Mill CLO Ltd. | | | | | | | | | |
| | 250,000 | | Series 2013-1A(a)(b) | | | 2.93 | % | 04/17/2025 | | | 245,046 | |
| | 500,000 | | Series 2013-1A(a)(b) | | | 3.28 | % | 04/17/2025 | | | 464,067 | |
| | 500,000 | | Series 2013-1A(a)(b) | | | 4.63 | % | 04/17/2025 | | | 446,742 | |
| | | | Carlyle Global Market Strategies CLO Ltd. | | | | | | | | | |
| | 250,000 | | Series 2014-3A(a)(b) | | | 3.38 | % | 07/27/2026 | | | 250,000 | |
| | 500,000 | | Series 2014-3A(a)(b) | | | 4.43 | % | 07/27/2026 | | | 498,825 | |
| | | | Emerson Park CLO Ltd. | | | | | | | | | |
| | 250,000 | | Series 2013-1A(a)(b) | | | 2.98 | % | 07/15/2025 | | | 246,991 | |
| | | | Flatiron CLO Ltd. | | | | | | | | | |
| | 250,000 | | Series 2014-1A(a)(b) | | | 3.08 | % | 07/17/2026 | | | 246,742 | |
| | 250,000 | | Series 2014-1A(a)(b) | | | 3.53 | % | 07/17/2026 | | | 236,026 | |
| | | | Galaxy XV CLO Ltd. | | | | | | | | | |
| | 500,000 | | Series 2013-15A(a)(b) | | | 3.63 | % | 04/15/2025 | | | 477,830 | |
| | | | GoldenTree Loan Opportunities IV Ltd. | | | | | | | | | |
| | 250,000 | | Series 2007-4A(a)(b) | | | 4.48 | % | 08/18/2022 | | | 248,102 | |
| | | | Halcyon Loan Advisors Funding Ltd. | | | | | | | | | |
| | 250,000 | | Series 2013-2A(a)(b) | | | 2.94 | % | 08/01/2025 | | | 242,479 | |
| | 250,000 | | Series 2014-1A(a)(b) | | | 3.28 | % | 04/18/2026 | | | 247,880 | |
| | | | ING IM CLO Ltd. | | | | | | | | | |
| | 250,000 | | Series 2013-3A(a)(b) | | | 2.94 | % | 01/18/2026 | | | 244,859 | |
| | | | LCM XIV LP | | | | | | | | | |
| | 500,000 | | Series 2013-14A(a)(b) | | | 3.73 | % | 07/15/2025 | | | 478,433 | |
| | | | LCM XV LP | | | | | | | | | |
| | 250,000 | | Series 2014-15A(a)(b) | | | 3.33 | % | 08/25/2024 | | | 250,037 | |
| | | | Madison Park Funding XIII Ltd. | | | | | | | | | |
| | 250,000 | | Series 2014-13A(a)(b) | | | 3.58 | % | 01/19/2025 | | | 238,172 | |
See Notes to Financial Statements.
RiverNorth/DoubleLine Strategic Income Fund | Schedule of Investments |
| | |
| Principal Amount/Description | | Rate | Maturity | | Value | |
| | | Madison Park Funding XIV Ltd. | | | | | | | |
| $ | 250,000 | | Series 2014-14A(a)(b) | | | 3.83 | % | 07/20/2026 | | $ | 239,890 | |
| | 250,000 | | Series 2014-14A(a)(b) | | | 4.98 | % | 07/20/2026 | | | 226,874 | |
| | | | Magnetite CLO Ltd. | | | | | | | | | |
| | 500,000 | | Series 2012-7A(a)(b) | | | 5.48 | % | 01/15/2025 | | | 480,493 | |
| | | | Nomad CLO Ltd. | | | | | | | | | |
| | 250,000 | | Series 2013-1A(a)(b) | | | 3.18 | % | 01/15/2025 | | | 244,946 | |
| | 250,000 | | Series 2013-1A(a)(b) | | | 3.73 | % | 01/15/2025 | | | 238,514 | |
| | | | Octagon Investment Partners XVI Ltd. | | | | | | | | | |
| | 500,000 | | Series 2013-1A(a)(b) | | | 3.58 | % | 07/17/2025 | | | 475,641 | |
| | 500,000 | | Series 2013-1A(a)(b) | | | 4.73 | % | 07/17/2025 | | | 450,896 | |
| | | | OHA Intrepid Leveraged Loan Fund Ltd. | | | | | | | | | |
| | 500,000 | | Series 2013-1AR(a)(b) | | | 3.28 | % | 04/20/2021 | | | 500,420 | |
| | | | Venture X CLO Ltd. | | | | | | | | | |
| | 500,000 | | Series 2012-10A(a)(b) | | | 4.43 | % | 07/20/2022 | | | 494,812 | |
| | | | WhiteHorse III Ltd. Corp. | | | | | | | | | |
| | 500,000 | | Series 2006-1A(a)(b) | | | 2.09 | % | 05/01/2018 | | | 497,967 | |
| TOTAL COLLATERALIZED LOAN OBLIGATIONS (Cost $12,849,823) | | | | | | | | 12,779,158 | |
| | | | | | | | | | |
| CONTINGENT CONVERTIBLE SECURITIES - 0.05% | | | | | | | | | |
| | 700,000 | | Banco do Brasil SA(a)(b)(d) | | | 9.00 | % | Perpetual Maturity | | | 682,290 | |
| | | | | | | | | | |
| TOTAL CONTINGENT CONVERTIBLE SECURITIES (Cost $700,000) | | | | | | | | 682,290 | |
| | | | | | | | | | |
NON-AGENCY COLLATERALIZED MORTGAGE OBLIGATIONS - 23.51% | | | | | | |
| | | | Adjustable Rate Mortgage Trust | | | | | | | | | |
| | 2,508,737 | | Series 2005-1(a) | | | 2.78 | % | 05/25/2035 | | | 2,457,448 | |
| | 2,050,097 | | Series 2005-7(a) | | | 3.03 | % | 10/25/2035 | | | 1,842,599 | |
| | | | Alternative Loan Trust | | | | | | | | | |
| | 738,789 | | Series 2005-20CB | | | 5.50 | % | 07/25/2035 | | | 689,049 | |
| | 301,278 | | Series 2005-54CB | | | 5.50 | % | 11/25/2035 | | | 284,319 | |
| | 1,000,000 | | Series 2005-6CB | | | 5.50 | % | 04/25/2035 | | | 1,007,928 | |
| | 601,620 | | Series 2005-85CB(a) | | | 21.07 | % | 02/25/2036 | | | 769,425 | |
| | 2,848,790 | | Series 2005-85CB(a) | | | 1.26 | % | 02/25/2036 | | | 2,402,080 | |
| | 730,956 | | Series 2005-86CB | | | 5.50 | % | 02/25/2036 | | | 656,214 | |
| | 1,457,971 | | Series 2005-9CB(a) | | | 4.90 | % | 05/25/2035 | | | 187,028 | |
| | 820,929 | | Series 2005-9CB(a) | | | 0.66 | % | 05/25/2035 | | | 671,685 | |
| | 566,086 | | Series 2006-12CB(a) | | | 5.75 | % | 05/25/2036 | | | 466,395 | |
See Notes to Financial Statements.
RiverNorth/DoubleLine Strategic Income Fund | Schedule of Investments |
| | September 30, 2014 (Unaudited) |
| Principal Amount/Description | | Rate | Maturity | | Value | |
| $ | 2,594,112 | | Series 2006-15CB | | | 6.50 | % | 06/25/2036 | | $ | 2,105,325 | |
| | 345,817 | | Series 2006-30T1 | | | 6.25 | % | 11/25/2036 | | | 329,016 | |
| | 288,154 | | Series 2006-32CB | | | 5.50 | % | 11/25/2036 | | | 257,368 | |
| | 547,508 | | Series 2006-36T2(a) | | | 27.35 | % | 12/25/2036 | | | 748,719 | |
| | 2,065,217 | | Series 2007-19 | | | 6.00 | % | 08/25/2037 | | | 1,744,276 | |
| | 7,118,819 | | Series 2007-20 | | | 6.25 | % | 08/25/2047 | | | 6,276,407 | |
| | 2,279,300 | | Series 2007-23CB(a) | | | 6.35 | % | 09/25/2037 | | | 537,685 | |
| | 2,387,118 | | Series 2007-23CB(a) | | | 0.66 | % | 09/25/2037 | | | 1,691,634 | |
| | | | American Home Mortgage Investment Trust | | | | | | | | | |
| | 224,003 | | Series 2007-A(b)(e) | | | 6.10 | % | 01/25/2037 | | | 123,781 | |
| | | | BAMLL Commercial Mortgage Securities Trust | | | | | | | | | |
| | 400,000 | | Series 2014-IP(a)(b) | | | 2.81 | % | 06/15/2028 | | | 394,996 | |
| | | | Banc of America Alternative Loan Trust | | | | | | | | | |
| | 125,153 | | Series 2005-6 | | | 6.00 | % | 07/25/2035 | | | 118,272 | |
| | 220,739 | | Series 2005-6 | | | 5.50 | % | 07/25/2035 | | | 208,597 | |
| | | | Banc of America Commercial Mortgage Trust | | | | | | | | | |
| | 500,000 | | Series 2007-5(a) | | | 5.77 | % | 10/10/2017 | | | 536,218 | |
| | | | Banc of America Funding Corp. | | | | | | | | | |
| | 827,311 | | Series 2006-2 | | | 5.50 | % | 03/25/2036 | | | 845,558 | |
| | 2,348,790 | | Series 2006-A(a) | | | 2.74 | % | 02/20/2036 | | | 1,989,289 | |
| | 1,353,088 | | Series 2008-R2(b) | | | 6.00 | % | 09/25/2037 | | | 1,416,132 | |
| | | | BCAP LLC Trust | | | | | | | | | |
| | 285,602 | | Series 2007-AA2(a) | | | 7.50 | % | 04/25/2037 | | | 266,331 | |
| | 185,304 | | Series 2007-AA2 | | | 6.00 | % | 04/25/2037 | | | 161,367 | |
| | 356,299 | | Series 2010-RR6(a)(b) | | | 5.56 | % | 11/26/2014 | | | 357,014 | |
| | | | Bear Stearns ALT-A Trust | | | | | | | | | |
| | 2,562,923 | | Series 2004-11(a) | | | 2.72 | % | 11/25/2034 | | | 2,316,849 | |
| | 2,536,348 | | Series 2005-3(a) | | | 2.74 | % | 04/25/2035 | | | 2,008,630 | |
| | 2,515,168 | | Series 2006-6(a) | | | 4.40 | % | 11/25/2036 | | | 1,956,039 | |
| | | | Bear Stearns Asset-Backed Securities Trust | | | | | | | | | |
| | 741,724 | | Series 2005-HE3(a) | | | 1.18 | % | 03/25/2035 | | | 736,937 | |
| | 3,771,085 | | Series 2006-AC1(e) | | | 5.75 | % | 02/25/2036 | | | 3,230,028 | |
| | | | Bear Stearns Commercial Mortgage Securities | | | | | | | | | |
| | 500,000 | | Series 2006-PW13(a) | | | 5.61 | % | 08/11/2016 | | | 518,237 | |
| | | | Chase Mortgage Finance Trust | | | | | | | | | |
| | 946,811 | | Series 2007-S3 | | | 5.50 | % | 05/25/2037 | | | 910,227 | |
| | | | Citicorp Mortgage Securities Trust | | | | | | | | | |
| | 1,583,367 | | Series 2007-1 | | | 6.00 | % | 01/25/2037 | | | 1,624,509 | |
| | 738,950 | | Series 2007-2 | | | 5.50 | % | 02/25/2037 | | | 739,028 | |
See Notes to Financial Statements.
RiverNorth/DoubleLine Strategic Income Fund | Schedule of Investments |
| | |
| Principal Amount/Description | | Rate | Maturity | | Value | |
| | | Citigroup Mortgage Loan Trust, Inc. | | | | | | | |
| $ | 1,440,174 | | Series 2006-WF1(e) | | | 5.51 | % | 03/25/2036 | | $ | 1,081,496 | |
| | 2,022,430 | | Series 2007-OPX1(e) | | | 6.33 | % | 01/25/2037 | | | 1,256,281 | |
| | 2,000,000 | | Series 2008-AR4(a)(b) | | | 2.73 | % | 11/25/2038 | | | 1,829,274 | |
| | 1,400,000 | | Series 2008-AR4(a)(b) | | | 2.73 | % | 11/25/2038 | | | 1,348,578 | |
| | 1,373,344 | | Series 2010-8(a)(b) | | | 8.00 | % | 11/25/2036 | | | 1,213,503 | |
| | 4,089,456 | | Series 2010-8(a)(b) | | | 7.49 | % | 12/25/2036 | | | 3,502,302 | |
| | | | Citigroup/Deutsche Bank Commercial Mortgage Trust | | | | | | | | | |
| | 500,000 | | Series 2007-CD4(a) | | | 5.37 | % | 12/11/2049 | | | 525,126 | |
| | 24,644,893 | | Series 2007-CD5(a)(b) | | | 0.30 | % | 11/15/2044 | | | 6,211 | |
| | | | CitiMortgage Alternative Loan Trust | | | | | | | | | |
| | 1,401,057 | | Series 2007-A1 | | | 6.00 | % | 01/25/2037 | | | 1,173,316 | |
| | 275,972 | | Series 2007-A1(a) | | | 5.25 | % | 01/25/2037 | | | 38,435 | |
| | 488,266 | | Series 2007-A3(a) | | | 5.25 | % | 03/25/2037 | | | 77,811 | |
| | 212,168 | | Series 2007-A3(a) | | | 6.00 | % | 03/25/2037 | | | 188,340 | |
| | 1,730,813 | | Series 2007-A4 | | | 5.75 | % | 04/25/2037 | | | 1,508,871 | |
| | 1,481,524 | | Series 2007-A6 | | | 5.50 | % | 06/25/2037 | | | 1,216,390 | |
| | | | COBALT CMBS Commercial Mortgage Trust | | | | | | | | | |
| | 500,000 | | Series 2007-C2(a) | | | 5.57 | % | 04/15/2047 | | | 510,831 | |
| | | | Commercial Mortgage Pass-Through Certificates | | | | | | | | | |
| | 925,323 | | Series 2010-C1(a)(b) | | | 2.46 | % | 07/10/2046 | | | 23,980 | |
| | 500,000 | | Series 2014-CR15(a)(b) | | | 4.92 | % | 02/10/2047 | | | 480,249 | |
| | 500,000 | | Series 2014-CR19(a) | | | 4.78 | % | 08/10/2047 | | | 511,191 | |
| | 5,797,416 | | Series 2014-UBS4(b) | | | 3.75 | % | 08/10/2047 | | | 1,637,770 | |
| | 11,000 | | Series 2014-UBS4(a)(b)(f) | | | 0.00 | % | 08/10/2047 | | | 0 | |
| | 2,705,400 | | Series 2014-UBS4(b) | | | 3.75 | % | 08/10/2047 | | | 1,885,934 | |
| | 3,091,920 | | Series 2014-UBS4(b) | | | 3.75 | % | 08/10/2047 | | | 1,489,378 | |
| | | | Commercial Mortgage Trust | | | | | | | | | |
| | 500,000 | | Series 2007-GG11(a) | | | 6.26 | % | 12/10/2049 | | | 522,805 | |
| | 400,000 | | Series 2007-GG9 | | | 5.48 | % | 03/10/2039 | | | 427,020 | |
| | | | Countrywide Asset-Backed Certificates | | | | | | | | | |
| | 2,500,000 | | Series 2005-12(e) | | | 5.56 | % | 02/25/2036 | | | 2,530,140 | |
| | | | Countrywide Home Loan Mortgage Pass-Through Trust | | | | | | | | | |
| | 278,484 | | Series 2005-J4 | | | 5.50 | % | 11/25/2035 | | | 281,430 | |
| | 5,882,415 | | Series 2006-18 | | | 6.00 | % | 12/25/2036 | | | 5,508,576 | |
| | 848,465 | | Series 2007-17 | | | 6.00 | % | 10/25/2037 | | | 816,934 | |
| | 863,931 | | Series 2007-3 | | | 6.00 | % | 04/25/2037 | | | 802,502 | |
| | 1,155,481 | | Series 2007-7 | | | 5.75 | % | 06/25/2037 | | | 1,076,365 | |
See Notes to Financial Statements.
RiverNorth/DoubleLine Strategic Income Fund | Schedule of Investments |
| | |
| Principal Amount/Description | | Rate | Maturity | | Value | |
| | | Credit Suisse First Boston Mortgage Securities Corp. | | | | | | | |
| $ | 173,779 | | Series 1998-C2(a)(b) | | | 6.75 | % | 11/15/2030 | | $ | 179,482 | |
| | 156,259 | | Series 2005-10 | | | 5.50 | % | 11/25/2035 | | | 138,326 | |
| | 137,851 | | Series 2005-8 | | | 5.50 | % | 08/25/2025 | | | 132,990 | |
| | 8,922,002 | | Series 2005-9 | | | 6.00 | % | 10/25/2035 | | | 6,726,770 | |
| | | | CSAB Mortgage-Backed Trust | | | | | | | | | |
| | 8,781,274 | | Series 2006-2(e) | | | 5.70 | % | 09/25/2036 | | | 3,213,524 | |
| | 201,800 | | Series 2007-1(a) | | | 5.90 | % | 05/25/2037 | | | 121,085 | |
| | | | CSMC Mortgage-Backed Trust | | | | | | | | | |
| | 365,102 | | Series 2006-1 | | | 6.00 | % | 02/25/2036 | | | 279,606 | |
| | 200,168 | | Series 2006-4 | | | 5.50 | % | 05/25/2021 | | | 191,036 | |
| | 1,368,594 | | Series 2006-5 | | | 6.25 | % | 06/25/2036 | | | 840,900 | |
| | 163,981 | | Series 2006-9 | | | 6.00 | % | 11/25/2036 | | | 160,377 | |
| | 5,019,576 | | Series 2007-1 | | | 6.00 | % | 02/25/2037 | | | 4,552,143 | |
| | 40,863 | | Series 2007-2 | | | 5.00 | % | 03/25/2037 | | | 40,533 | |
| | 739,679 | | Series 2007-3(a) | | | 5.84 | % | 04/25/2037 | | | 411,737 | |
| | 110,002 | | Series 2007-4 | | | 6.00 | % | 06/25/2037 | | | 100,232 | |
| | 500,000 | | Series 2007-C4(a) | | | 6.10 | % | 09/15/2039 | | | 543,032 | |
| | 2,601,516 | | Series 2010-7R(a)(b) | | | 6.52 | % | 04/26/2037 | | | 2,501,745 | |
| | | | Del Coronado Trust | | | | | | | | | |
| | 500,000 | | Series 2013-HDC D(a)(b) | | | 2.10 | % | 03/15/2018 | | | 498,979 | |
| | 500,000 | | Series 2013-HDC E(a)(b) | | | 2.80 | % | 03/15/2018 | | | 497,546 | |
| | | | Deutsche Alt-A Securities, Inc. Mortgage Loan Trust | | | | | | | | | |
| | 711,420 | | Series 2005-6(a) | | | 4.93 | % | 12/25/2035 | | | 119,214 | |
| | 315,567 | | Series 2005-6(a) | | | 1.56 | % | 12/25/2035 | | | 241,164 | |
| | 3,668,237 | | Series 2007-1(a) | | | 0.30 | % | 08/25/2037 | | | 3,126,849 | |
| | | | Deutsche Mortgage Securities, Inc. Mortgage Loan Trust | | | | | | | | | |
| | 251,810 | | Series 2006-PR1(a)(b) | | | 11.91 | % | 04/15/2036 | | | 297,541 | |
| | | | First Horizon Alternative Mortgage Securities Trust | | | | | | | | | |
| | 177,824 | | Series 2005-FA6 | | | 5.50 | % | 09/25/2035 | | | 165,776 | |
| | 2,299,275 | | Series 2005-FA6 | | | 5.50 | % | 09/25/2035 | | | 2,096,504 | |
| | 188,769 | | Series 2006-FA7 | | | 6.25 | % | 12/25/2036 | | | 161,893 | |
| | 324,560 | | Series 2007-FA2 | | | 6.00 | % | 04/25/2037 | | | 252,823 | |
| | | | First Horizon Mortgage Pass-Through Trust | | | | | | | | | |
| | 4,735,683 | | Series 2007-AR3(a) | | | 2.40 | % | 11/25/2037 | | | 4,135,487 | |
| | | | GRACE Mortgage Trust | | | | | | | | | |
| | 400,000 | | Series 2014-GRCE(b) | | | 3.37 | % | 06/10/2028 | | | 410,998 | |
| | | | GS Mortgage Securities Trust | | | | | | | | | |
| | 400,000 | | Series 2006-GG6(a) | | | 5.76 | % | 02/10/2016 | | | 413,286 | |
See Notes to Financial Statements.
RiverNorth/DoubleLine Strategic Income Fund | Schedule of Investments |
| | |
| Principal Amount/Description | | Rate | Maturity | | Value | |
| $ | 13,237,647 | | Series 2006-GG6(a)(b) | | | 0.14 | % | 04/10/2038 | | $ | 6,645 | |
| | 400,000 | | Series 2006-GG8 | | | 5.62 | % | 11/10/2039 | | | 411,165 | |
| | 522,280 | | Series 2011-GC3(a)(b) | | | 1.19 | % | 03/10/2021 | | | 16,404 | |
| | 3,834,619 | | Series 2011-GC5(a)(b) | | | 1.87 | % | 08/10/2044 | | | 238,590 | |
| | | | GSAA Home Equity Trust | | | | | | | | | |
| | 304,788 | | Series 2005-7(a) | | | 4.48 | % | 05/25/2035 | | | 312,080 | |
| | 3,670,272 | | Series 2006-13(a) | | | 6.04 | % | 07/25/2036 | | | 2,447,734 | |
| | 752,454 | | Series 2006-18(e) | | | 5.68 | % | 11/25/2036 | | | 417,446 | |
| | 247,764 | | Series 2006-6(a) | | | 5.69 | % | 03/25/2036 | | | 153,674 | |
| | 1,292,866 | | Series 2007-2(e) | | | 6.10 | % | 03/25/2037 | | | 760,576 | |
| | 3,483,630 | | Series 2007-8(a) | | | 0.51 | % | 08/25/2037 | | | 3,119,884 | |
| | | | GSR Mortgage Loan Trust | | | | | | | | | |
| | 1,420,751 | | Series 2005-AR4(a) | | | 5.23 | % | 07/25/2035 | | | 1,422,263 | |
| | 4,030,523 | | Series 2006-2F | | | 5.25 | % | 02/25/2036 | | | 3,282,961 | |
| | 3,692,047 | | Series 2007-2F | | | 5.75 | % | 02/25/2037 | | | 3,501,497 | |
| | 3,222,329 | | Series 2007-AR2(a) | | | 2.72 | % | 05/25/2037 | | | 2,698,903 | |
| | | | HSI Asset Loan Obligation Trust | | | | | | | | | |
| | 342,357 | | Series 2007-2 | | | 5.50 | % | 09/25/2037 | | | 337,522 | |
| | | | IndyMac IMJA Mortgage Loan Trust | | | | | | | | | |
| | 2,898,673 | | Series 2007-A1 | | | 6.00 | % | 08/25/2037 | | | 2,544,556 | |
| | | | IndyMac IMSC Mortgage Loan Trust | | | | | | | | | |
| | 5,908,565 | | Series 2007-F2 | | | 6.50 | % | 07/25/2037 | | | 4,135,735 | |
| | | | IndyMac Index Mortgage Loan Trust | | | | | | | | | |
| | 6,869,266 | | Series 2005-AR31(a) | | | 2.43 | % | 01/25/2036 | | | 6,020,492 | |
| | 2,471,562 | | Series 2005-AR35(a) | | | 4.41 | % | 02/25/2036 | | | 2,025,408 | |
| | 7,010,037 | | Series 2006-AR25(a) | | | 2.59 | % | 09/25/2036 | | | 5,374,939 | |
| | 1,529,720 | | Series 2007-FLX1(a) | | | 0.34 | % | 02/25/2037 | | | 1,472,373 | |
| | | | JP Morgan Alternative Loan Trust | | | | | | | | | |
| | 656,251 | | Series 2005-S1 | | | 6.00 | % | 12/25/2035 | | | 599,489 | |
| | 151,991 | | Series 2006-S1 | | | 5.00 | % | 02/25/2021 | | | 146,786 | |
| | 1,466,170 | | Series 2006-S3(e) | | | 6.12 | % | 08/25/2036 | | | 1,403,746 | |
| | | | JP Morgan BB Commercial Mortgage Securities Trust | | | | | | | | | |
| | 400,000 | | Series 2014-C21(a) | | | 4.82 | % | 08/15/2047 | | | 409,331 | |
| | | | JP Morgan Chase Commercial Mortgage Securities Corp. | | | | | | | | | |
| | 400,000 | | Series 2005-CB12(a) | | | 5.15 | % | 09/12/2037 | | | 386,663 | |
| | 7,024,984 | | Series 2006-LDP8(a) | | | 0.72 | % | 05/15/2045 | | | 62,635 | |
| | 500,000 | | Series 2006-LDP8 | | | 5.44 | % | 05/15/2045 | | | 536,098 | |
| | 494,130 | | Series 2006-LDP9 | | | 5.37 | % | 05/15/2047 | | | 514,589 | |
| | 600,000 | | Series 2007-CB19(a) | | | 5.89 | % | 05/12/2017 | | | 644,845 | |
| | 400,000 | | Series 2007-CB20(a) | | | 6.28 | % | 02/12/2051 | | | 425,444 | |
| | 4,000,000 | | Series 2007-CH1(e) | | | 5.37 | % | 05/25/2015 | | | 3,870,372 | |
| | 4,276,382 | | Series 2012-C8(a) | | | 2.29 | % | 09/15/2022 | | | 451,116 | |
See Notes to Financial Statements.
RiverNorth/DoubleLine Strategic Income Fund | Schedule of Investments |
| | |
| Principal Amount/Description | | Rate | Maturity | | Value | |
| $ | 400,000 | | Series 2014-DSTY(b) | | | 3.43 | % | 06/10/2027 | | $ | 409,263 | |
| | | | JP Morgan Mortgage Acquisition Corp. | | | | | | | | | |
| | 480,599 | | Series 2006-CH2(e) | | | 5.46 | % | 10/25/2036 | | | 392,740 | |
| | | | JP Morgan Mortgage Trust | | | | | | | | | |
| | 12,823,561 | | Series 2005-S3 | | | 6.50 | % | 01/25/2036 | | | 11,023,544 | |
| | 384,761 | | Series 2007-S3 | | | 6.00 | % | 07/25/2037 | | | 345,138 | |
| | 2,139,026 | | Series 2007-S3 | | | 6.00 | % | 07/25/2037 | | | 1,920,881 | |
| | | | JP Morgan Resecuritization Trust | | | | | | | | | |
| | 3,525,436 | | Series 2011-1(a)(b) | | | 6.22 | % | 06/26/2037 | | | 3,024,615 | |
| | | | LB-UBS Commercial Mortgage Trust | | | | | | | | | |
| | 4,547,405 | | Series 2006-C7(a)(b) | | | 0.85 | % | 11/15/2038 | | | 55,346 | |
| | 3,410,554 | | Series 2006-C7(a)(b) | | | 0.85 | % | 11/15/2038 | | | 41,510 | |
| | 400,000 | | Series 2007-C2(a) | | | 5.49 | % | 02/15/2040 | | | 425,968 | |
| | | | Lehman Mortgage Trust | | | | | | | | | |
| | 1,245,686 | | Series 2006-6 | | | 5.50 | % | 10/25/2036 | | | 1,022,292 | |
| | 4,191,666 | | Series 2006-7(a) | | | 0.41 | % | 11/25/2036 | | | 519,850 | |
| | 4,191,666 | | Series 2006-7(a) | | | 7.60 | % | 11/25/2036 | | | 1,263,786 | |
| | 2,397,487 | | Series 2006-8(a) | | | 0.58 | % | 12/25/2036 | | | 1,242,292 | |
| | 2,397,487 | | Series 2006-8(a) | | | 6.43 | % | 12/25/2036 | | | 616,015 | |
| | 2,407,566 | | Series 2007-10 | | | 6.00 | % | 01/25/2038 | | | 2,393,174 | |
| | 664,131 | | Series 2007-10 | | | 6.50 | % | 01/25/2038 | | | 592,052 | |
| | | | Lehman XS Trust | | | | | | | | | |
| | 961,742 | | Series 2006-5(a) | | | 5.89 | % | 04/25/2036 | | | 915,254 | |
| | | | MASTR Asset Securitization Trust | | | | | | | | | |
| | 135,214 | | Series 2003-1 | | | 5.75 | % | 02/25/2033 | | | 135,263 | |
| | 180,705 | | Series 2003-2 | | | 5.75 | % | 04/25/2033 | | | 179,116 | |
| | | | Merrill Lynch Alternative Note Asset Trust | | | | | | | | | |
| | 1,203,102 | | Series 2007-F1 | | | 6.00 | % | 03/25/2037 | | | 815,532 | |
| | | | ML-CFC Commercial Mortgage Trust | | | | | | | | | |
| | 30,465 | | Series 2007-8(a) | | | 5.75 | % | 03/12/2017 | | | 30,697 | |
| | | | Morgan Stanley Bank of America Merrill Lynch Trust | | | | | | | | | |
| | 4,857,584 | | Series 2012-C5(a)(b) | | | 2.02 | % | 07/15/2022 | | | 420,516 | |
| | 300,000 | | Series 2014-C14(a)(b) | | | 5.00 | % | 02/15/2024 | | | 285,616 | |
| | | | Morgan Stanley Capital I Trust | | | | | | | | | |
| | 500,000 | | Series 2006-HQ8(a) | | | 5.68 | % | 03/12/2044 | | | 518,574 | |
| | 500,000 | | Series 2007-HQ11(a) | | | 5.51 | % | 02/12/2044 | | | 524,884 | |
| | 21,365 | | Series 2007-HQ12(a) | | | 0.41 | % | 04/12/2049 | | | 21,286 | |
| | 500,000 | | Series 2007-IQ13 | | | 5.41 | % | 03/15/2017 | | | 539,058 | |
| | 9,484,163 | | Series 2011-C1(a)(b) | | | 1.08 | % | 09/15/2047 | | | 171,085 | |
| | | | Morgan Stanley Mortgage Loan Trust | | | | | | | | | |
| | 6,186,521 | | Series 2005-3AR(a) | | | 2.54 | % | 07/25/2035 | | | 5,402,985 | |
| | 355,644 | | Series 2006-11 | | | 6.00 | % | 08/25/2036 | | | 295,879 | |
See Notes to Financial Statements.
RiverNorth/DoubleLine Strategic Income Fund | Schedule of Investments |
| | |
| Principal Amount/Description | | Rate | Maturity | | Value | |
| $ | 2,140,170 | | Series 2006-7(a) | | | 5.39 | % | 06/25/2036 | | $ | 1,854,274 | |
| | 1,882,938 | | Series 2006-7 | | | 6.00 | % | 06/25/2036 | | | 1,726,430 | |
| | 658,155 | | Series 2007-3XS(e) | | | 5.70 | % | 01/25/2047 | | | 493,044 | |
| | | | Morgan Stanley Re-REMIC Trust | | | | | | | | | |
| | 701,397 | | Series 2011-R1(a)(b) | | | 5.94 | % | 02/26/2037 | | | 740,687 | |
| | | | Nomura Asset Acceptance Corp. Alternative Loan Trust | | | | | | | | | |
| | 2,000,000 | | Series 2005-AP3(a) | | | 5.32 | % | 08/25/2035 | | | 1,539,500 | |
| | | | PHH Alternative Mortgage Trust | | | | | | | | | |
| | 2,753,405 | | Series 2007-2 | | | 6.00 | % | 05/25/2037 | | | 2,348,170 | |
| | | | PR Mortgage Loan Trust | | | | | | | | | |
| | 9,943,228 | | Series 2014-1(b) | | | 5.93 | % | 10/25/2049 | | | 9,987,973 | |
| | | | Prime Mortgage Trust | | | | | | | | | |
| | 220,398 | | Series 2006-1 | | | 5.50 | % | 06/25/2036 | | | 208,305 | |
| | 140,401 | | Series 2006-DR1(b) | | | 5.50 | % | 05/25/2035 | | | 141,443 | |
| | | | RALI Series Trust | | | | | | | | | |
| | 5,769,743 | | Series 2006-QS10 | | | 6.50 | % | 08/25/2036 | | | 5,054,324 | |
| | | | RBSGC Structured Trust | | | | | | | | | |
| | 475,037 | | Series 2008-B(b) | | | 6.00 | % | 06/25/2037 | | | 423,964 | |
| | | | Residential Accredit Loans, Inc. | | | | | | | | | |
| | 458,091 | | Series 2004-QS15 | | | 5.25 | % | 11/25/2034 | | | 479,544 | |
| | 3,964,993 | | Series 2005-QS17 | | | 6.00 | % | 12/25/2035 | | | 3,513,562 | |
| | 7,433,524 | | Series 2006-QA5(a) | | | 0.38 | % | 07/25/2036 | | | 5,055,376 | |
| | 2,182,652 | | Series 2006-QS4 | | | 6.00 | % | 04/25/2036 | | | 1,882,271 | |
| | 2,142,227 | | Series 2006-QS6 | | | 6.00 | % | 06/25/2036 | | | 1,748,434 | |
| | 1,526,356 | | Series 2006-QS6 | | | 6.00 | % | 06/25/2036 | | | 1,245,775 | |
| | 613,012 | | Series 2006-QS7(a) | | | 5.45 | % | 06/25/2036 | | | 104,360 | |
| | 204,337 | | Series 2006-QS7‘a) | | | 0.56 | % | 06/25/2036 | | | 131,870 | |
| | 3,886,815 | | Series 2006-QS7 | | | 6.00 | % | 06/25/2036 | | | 3,167,413 | |
| | 783,692 | | Series 2006-QS8(a) | | | 5.40 | % | 08/25/2036 | | | 134,676 | |
| | 261,231 | | Series 2006-QS8(a) | | | 0.61 | % | 08/25/2036 | | | 165,158 | |
| | 5,090,819 | | Series 2007-QS3 | | | 6.50 | % | 02/25/2037 | | | 4,209,583 | |
| | 160,495 | | Series 2007-QS6 | | | 6.25 | % | 04/25/2037 | | | 134,699 | |
| | 22,613 | | Series 2007-QS6(a) | | | 53.71 | % | 04/25/2037 | | | 51,333 | |
| | 7,038,365 | | Series 2007-QS9 | | | 6.50 | % | 07/25/2037 | | | 5,966,302 | |
| | 450,824 | | Series 2008-QR1 | | | 6.00 | % | 08/25/2036 | | | 351,592 | |
| | | | Residential Asset Mortgage Products, Inc. | | | | | | | | | |
| | 66,809 | | Series 2004-RS4(a) | | | 5.07 | % | 04/25/2034 | | | 68,587 | |
| | 942,199 | | Series 2006-RS5(a) | | | 0.33 | % | 09/25/2036 | | | 914,086 | |
| | | | Residential Asset Securities Corp. | | | | | | | | | |
| | 5,676,146 | | Series 2006-EMX6(a) | | | 0.31 | % | 05/25/2036 | | | 5,181,243 | |
| | 1,899,562 | | Series 2007-KS4(a) | | | 0.34 | % | 05/25/2037 | | | 1,891,342 | |
See Notes to Financial Statements.
RiverNorth/DoubleLine Strategic Income Fund | Schedule of Investments |
| | |
| Principal Amount/Description | | Rate | Maturity | | Value | |
| | | Residential Asset Securitization Trust | | | | | | | |
| $ | 886,313 | | Series 2006-A1 | | | 6.00 | % | 04/25/2036 | | $ | 718,014 | |
| | 1,785,785 | | Series 2006-A2 | | | 6.00 | % | 05/25/2036 | | | 1,474,013 | |
| | 1,223,899 | | Series 2006-A6 | | | 6.50 | % | 07/25/2036 | | | 768,813 | |
| | 8,208,560 | | Series 2006-A7CB | | | 6.25 | % | 07/25/2036 | | | 7,854,303 | |
| | 447,901 | | Series 2006-A8(a) | | | 5.75 | % | 08/25/2036 | | | 111,928 | |
| | 817,384 | | Series 2006-A8 | | | 6.00 | % | 08/25/2036 | | | 755,182 | |
| | 211,543 | | Series 2006-A8 | | | 6.50 | % | 08/25/2036 | | | 147,242 | |
| | 2,546,385 | | Series 2007-A1 | | | 6.00 | % | 03/25/2037 | | | 1,969,804 | |
| | 4,465,261 | | Series 2007-A2 | | | 6.00 | % | 04/25/2037 | | | 3,911,694 | |
| | 160,207 | | Series 2007-A6 | | | 6.00 | % | 06/25/2037 | | | 148,882 | |
| | 4,227,394 | | Series 2007-A7 | | | 6.00 | % | 07/25/2037 | | | 3,198,662 | |
| | | | Residential Funding Mortgage Securities I, Inc. | | | | | | | | | |
| | 2,543,787 | | Series 2006-S3 | | | 5.50 | % | 03/25/2036 | | | 2,351,902 | |
| | 604,333 | | Series 2006-S6 | | | 6.00 | % | 07/25/2036 | | | 559,975 | |
| | 4,282,411 | | Series 2006-S6 | | | 6.00 | % | 07/25/2036 | | | 3,904,934 | |
| | 1,060,800 | | Series 2007-S3 | | | 6.00 | % | 03/25/2037 | | | 979,905 | |
| | 847,746 | | Series 2007-S6 | | | 6.00 | % | 06/25/2037 | | | 777,657 | |
| | | | Sequoia Mortgage Trust | | | | | | | | | |
| | 4,917,790 | | Series 2007-3(a) | | | 2.42 | % | 07/20/2037 | | | 4,072,914 | |
| | | | Structured Adjustable Rate Mortgage Loan Trust | | | | | | | | | |
| | 2,101,059 | | Series 2005-15(a) | | | 2.54 | % | 07/25/2035 | | | 1,763,427 | |
| | | | Structured Asset Securities Corp. | | | | | | | | | |
| | 403,058 | | Series 2005-RF1(a)(b) | | | 0.51 | % | 03/25/2035 | | | 341,666 | |
| | 405,910 | | Series 2005-RF1(a)(b) | | | 5.23 | % | 03/25/2035 | | | 58,254 | |
| | | | TBW Mortgage-Backed Trust | | | | | | | | | |
| | 1,836,385 | | Series 2006-2 | | | 7.00 | % | 07/25/2036 | | | 873,407 | |
| | | | Wachovia Bank Commercial Mortgage Trust | | | | | | | | | |
| | 16,732,634 | | Series 2006-C27(a)(b) | | | 0.45 | % | 07/15/2045 | | | 85,805 | |
| | 400,000 | | Series 2006-C28(a) | | | 5.63 | % | 10/15/2048 | | | 409,853 | |
| | 1,539,038 | | Series 2006-C29(a) | | | 0.53 | % | 11/15/2048 | | | 11,988 | |
| | 400,000 | | Series 2007-C30(a) | | | 5.41 | % | 12/15/2043 | | | 413,009 | |
| | 500,000 | | Series 2007-C33(a) | | | 6.14 | % | 07/15/2017 | | | 546,884 | |
| | | | Wachovia Mortgage Loan Trust LLC Series Trust | | | | | | | | | |
| | 2,892,551 | | Series 2005-B(a) | | | 2.54 | % | 10/20/2035 | | | 2,544,482 | |
| | | | Washington Mutual Alternative Mortgage Pass-Through Certificates | | | | | | | | | |
| | 3,934,102 | | Series 2005-1 | | | 6.00 | % | 03/25/2035 | | | 4,102,785 | |
| | 149,442 | | Series 2005-9 | | | 5.50 | % | 11/25/2035 | | | 125,712 | |
| | 1,036,351 | | Series 2006-5 | | | 6.00 | % | 07/25/2036 | | | 807,033 | |
See Notes to Financial Statements.
RiverNorth/DoubleLine Strategic Income Fund | Schedule of Investments |
| | |
| Principal Amount/Description | | Rate | | Maturity | | Value | |
| | | Washington Mutual Mortgage PassThrough Certificates Trust | | | | | | | |
| $ | 1,811,626 | | Series 2006-2 | | | 6.00 | % | 03/25/2036 | | $ | 1,600,044 | |
| | | | Wells Fargo Alternative Loan Trust | | | | | | | | | |
| | 1,700,126 | | Series 2007-PA2(a) | | | 0.59 | % | 06/25/2037 | | | 1,250,538 | |
| | 1,700,126 | | Series 2007-PA2(a) | | | 5.92 | % | 06/25/2037 | | | 306,276 | |
| | 698,637 | | Series 2007-PA3 | | | 5.75 | % | 07/25/2037 | | | 637,434 | |
| | 1,972,886 | | Series 2007-PA3 | | | 6.25 | % | 07/25/2037 | | | 1,813,045 | |
| | | | Wells Fargo Mortgage-Backed Securities Trust | | | | | | | | | |
| | 4,892,708 | | Series 2005-12 | | | 5.50 | % | 11/25/2035 | | | 4,961,984 | |
| | 1,643,537 | | Series 2006-11 | | | 6.00 | % | 09/25/2036 | | | 1,609,429 | |
| | 511,862 | | Series 2006-2 | | | 5.50 | % | 03/25/2036 | | | 493,673 | |
| | 211,183 | | Series 2006-2 | | | 5.75 | % | 03/25/2036 | | | 215,346 | |
| | 1,815,592 | | Series 2007-13 | | | 6.00 | % | 09/25/2037 | | | 1,854,028 | |
| | 1,932,777 | | Series 2007-14 | | | 6.00 | % | 10/25/2037 | | | 1,966,554 | |
| | 1,772,732 | | Series 2007-2 | | | 6.00 | % | 03/25/2037 | | | 1,742,938 | |
| | 807,963 | | Series 2007-5 | | | 5.50 | % | 05/25/2037 | | | 854,717 | |
| | | | WF-RBS Commercial Mortgage Trust | | | | | | | | | |
| | 4,820,176 | | Series 2012-C9(a)(b) | | | 2.39 | % | 11/15/2045 | | | 557,420 | |
| | 4,964,350 | | Series 2014-C19(a) | | | 1.50 | % | 03/15/2047 | | | 400,871 | |
| | 6,964,318 | | Series 2014-C22(a) | | | 0.97 | % | 09/15/2057 | | | 460,731 | |
| | | | | |
| TOTAL NON-AGENCY COLLATERALIZED MORTGAGE OBLIGATIONS (Cost $291,711,289) | | | 324,731,905 | |
| | | | | |
| U.S. GOVERNMENT BONDS AND NOTES - 2.84% | | | | |
| | 5,550,000 | | U.S. Treasury Bonds | | | 1.63 | % | 08/15/2022 | | | 5,272,716 | |
| | 1,900,000 | | U.S. Treasury Bonds | | | 2.75 | % | 11/15/2023 | | | 1,948,243 | |
| | 6,000,000 | | U.S. Treasury Bonds | | | 3.63 | % | 02/15/2044 | | | 6,486,564 | |
| | 3,450,000 | | U.S. Treasury Notes | | | 0.25 | % | 10/31/2014 | | | 3,450,742 | |
| | 5,400,000 | | U.S. Treasury Notes | | | 0.25 | % | 01/31/2015 | | | 5,404,007 | |
| | 850,000 | | U.S. Treasury Notes | | | 0.25 | % | 03/31/2015 | | | 850,913 | |
| | 4,350,000 | | U.S. Treasury Notes | | | 1.00 | % | 06/30/2019 | | | 4,201,147 | |
| | 6,000,000 | | U.S. Treasury Notes | | | 1.00 | % | 08/31/2019 | | | 5,777,346 | |
| | 5,800,000 | | U.S. Treasury Notes | | | 1.88 | % | 06/30/2020 | | | 5,770,095 | |
| | | | | | | | | | | | | |
| TOTAL U.S. GOVERNMENT BONDS AND NOTES (Cost $38,753,932) | | | | | | | | 39,161,773 | |
See Notes to Financial Statements.
RiverNorth/DoubleLine Strategic Income Fund | Schedule of Investments |
| | |
| Principal Amount/Description | | Rate | Maturity | | Value | |
| U.S. GOVERNMENT / AGENCY MORTGAGE BACKED SECURITIES - 12.03% | |
| | | Federal Home Loan Mortgage Corp. Pool | | | | | | | |
| $ | 861,111 | | Series Pool #G01840 | | | 5.00 | % | 07/01/2035 | | $ | 952,819 | |
| | 365,866 | | Series Pool #G04817 | | | 5.00 | % | 09/01/2038 | | | 402,891 | |
| | | | Federal Home Loan Mortgage Corp. REMICS | | | | | | | | | |
| | 3,813,947 | | Series 2003-2722(a) | | | 9.72 | % | 12/15/2033 | | | 4,544,276 | |
| | 773,010 | | Series 2005-R003 | | | 5.50 | % | 10/15/2035 | | | 858,181 | |
| | 4,191,869 | | Series 2006-3244(a) | | | 6.51 | % | 11/15/2036 | | | 748,802 | |
| | 215,609 | | Series 2007-3261(a) | | | 6.28 | % | 01/15/2037 | | | 36,464 | |
| | 1,470,680 | | Series 2007-3262(a) | | | 6.25 | % | 01/15/2037 | | | 207,641 | |
| | 2,675,097 | | Series 2007-3301(a) | | | 5.95 | % | 04/15/2037 | | | 347,733 | |
| | 2,020,645 | | Series 2007-3303(a) | | | 5.95 | % | 04/15/2037 | | | 317,981 | |
| | 3,810,360 | | Series 2007-3303(a) | | | 5.93 | % | 04/15/2037 | | | 597,163 | |
| | 1,699,048 | | Series 2007-3382(a) | | | 5.85 | % | 11/15/2037 | | | 198,926 | |
| | 1,916,205 | | Series 2007-3384(a) | | | 6.16 | % | 08/15/2036 | | | 283,384 | |
| | 1,282,651 | | Series 2007-3384(a) | | | 6.24 | % | 11/15/2037 | | | 195,554 | |
| | 1,419,814 | | Series 2008-3417(a) | | | 6.03 | % | 02/15/2038 | | | 155,626 | |
| | 9,643,346 | | Series 2008-3419(a) | | | 6.28 | % | 02/15/2038 | | | 1,497,390 | |
| | 37,288,030 | | Series 2008-3423(a) | | | 0.35 | % | 03/15/2038 | | | 383,135 | |
| | 1,716,736 | | Series 2008-3423(a) | | | 5.50 | % | 03/15/2038 | | | 180,477 | |
| | 17,901,395 | | Series 2008-3435(a) | | | 5.83 | % | 04/15/2038 | | | 2,566,129 | |
| | 4,285,109 | | Series 2009-3510(a) | | | 6.60 | % | 02/15/2037 | | | 789,514 | |
| | 1,346,230 | | Series 2009-3523(a) | | | 5.85 | % | 04/15/2039 | | | 192,837 | |
| | 260,426 | | Series 2009-3524 | | | 5.01 | % | 06/15/2038 | | | 266,697 | |
| | 151,395 | | Series 2009-3549(a) | | | 5.65 | % | 07/15/2039 | | | 15,492 | |
| | 2,958,353 | | Series 2009-3560(a) | | | 6.25 | % | 11/15/2036 | | | 515,099 | |
| | 1,175,351 | | Series 2010-3630(a) | | | 1.93 | % | 03/15/2017 | | | 23,251 | |
| | 1,206,972 | | Series 2010-3641 | | | 4.50 | % | 03/15/2040 | | | 1,300,269 | |
| | 205,424 | | Series 2010-3688 | | | 4.00 | % | 07/15/2029 | | | 208,636 | |
| | 1,760,021 | | Series 2010-3726(a) | | | 5.90 | % | 09/15/2040 | | | 270,279 | |
| | 10,593,250 | | Series 2010-3728(a) | | | 4.30 | % | 09/15/2040 | | | 1,048,181 | |
| | 32,446 | | Series 2010-3745(a) | | | 9.69 | % | 10/15/2040 | | | 32,022 | |
| | 141,975 | | Series 2010-3766(a) | | | 9.69 | % | 11/15/2040 | | | 142,195 | |
| | 750,000 | | Series 2010-3779 | | | 3.50 | % | 12/15/2030 | | | 768,457 | |
| | 250,000 | | Series 2010-3779 | | | 4.00 | % | 12/15/2030 | | | 264,349 | |
| | 474,745 | | Series 2010-3779 | | | 4.50 | % | 12/15/2040 | | | 475,770 | |
| | 135,821 | | Series 2011-3786(a) | | | 9.19 | % | 01/15/2041 | | | 136,081 | |
| | 1,157,686 | | Series 2011-3795 | | | 4.00 | % | 01/15/2041 | | | 1,168,304 | |
| | 190,370 | | Series 2011-3798(a) | | | 9.19 | % | 11/15/2040 | | | 191,002 | |
| | 34,232 | | Series 2011-3805(a) | | | 9.19 | % | 02/15/2041 | | | 33,094 | |
| | 600,000 | | Series 2011-3808 | | | 3.50 | % | 02/15/2031 | | | 602,491 | |
| | 61,392 | | Series 2011-3809(a) | | | 9.19 | % | 02/15/2041 | | | 62,040 | |
See Notes to Financial Statements.
RiverNorth/DoubleLine Strategic Income Fund | Schedule of Investments |
| | |
| Principal Amount/Description | | Rate | Maturity | | Value | |
| $ | 3,010,735 | | Series 2011-3815(a) | | | 5.70 | % | 02/15/2041 | | $ | 372,747 | |
| | 500,000 | | Series 2011-3824 | | | 3.50 | % | 03/15/2031 | | | 513,899 | |
| | 1,603,492 | | Series 2011-3824(a) | | | 6.95 | % | 08/15/2036 | | | 272,246 | |
| | 701,466 | | Series 2011-3857(a) | | | 8.95 | % | 05/15/2041 | | | 690,319 | |
| | 1,417,764 | | Series 2011-3863 | | | 5.50 | % | 08/15/2034 | | | 1,564,478 | |
| | 901,689 | | Series 2011-3864(a) | | | 8.89 | % | 05/15/2041 | | | 903,213 | |
| | 1,195,234 | | Series 2011-3871 | | | 5.50 | % | 06/15/2041 | | | 1,391,790 | |
| | 2,545,726 | | Series 2011-3872(a) | | | 5.80 | % | 06/15/2041 | | | 344,829 | |
| | 2,042,639 | | Series 2011-3888 | | | 4.00 | % | 07/15/2041 | | | 2,157,235 | |
| | 3,227,968 | | Series 2011-3894 | | | 4.50 | % | 07/15/2041 | | | 3,505,606 | |
| | 2,332,623 | | Series 2011-3910 | | | 5.00 | % | 08/15/2041 | | | 2,535,583 | |
| | 8,400,031 | | Series 2011-3924(a) | | | 5.85 | % | 09/15/2041 | | | 1,272,596 | |
| | 3,357,711 | | Series 2011-3924(a) | | | 5.85 | % | 09/15/2041 | | | 411,189 | |
| | 46,615 | | Series 2011-3924(a) | | | 9.25 | % | 09/15/2041 | | | 45,274 | |
| | 3,811,231 | | Series 2011-3925 | | | 3.00 | % | 09/15/2021 | | | 267,545 | |
| | 3,282,032 | | Series 2012-4057 | | | 4.00 | % | 06/15/2042 | | | 3,292,839 | |
| | 9,718,101 | | Series 2013-4196(a) | | | 5.21 | % | 03/15/2043 | | | 8,071,291 | |
| | 9,569,243 | | Series 2013-4239(g) | | | 0.00 | % | 07/15/2043 | | | 5,772,273 | |
| | 8,835,090 | | Series 2014-4302(a) | | | 6.00 | % | 02/15/2044 | | | 1,447,020 | |
| | 3,963,817 | | Series 2014-4377 | | | 3.00 | % | 06/15/2039 | | | 4,068,458 | |
| | | | Federal National Mortgage Association Pool | | | | | | | | | |
| | 239,887 | | Series Pool #555743 | | | 5.00 | % | 09/01/2033 | | | 265,471 | |
| | 287,868 | | Series Pool #735382 | | | 5.00 | % | 04/01/2035 | | | 318,521 | |
| | 746,143 | | Series Pool #735383 | | | 5.00 | % | 04/01/2035 | | | 825,742 | |
| | 536,667 | | Series Pool #735484 | | | 5.00 | % | 05/01/2035 | | | 593,975 | |
| | 196,945 | | Series Pool #AH4437 | | | 4.00 | % | 01/01/2041 | | | 205,821 | |
| | 911,069 | | Series Pool #MA0264 | | | 4.50 | % | 12/01/2029 | | | 992,011 | |
| | 2,195,564 | | Series Pool #MA3894 | | | 4.00 | % | 09/01/2031 | | | 2,348,175 | |
| | | | Federal National Mortgage Association REMICS | | | | | | | | | |
| | 292,921 | | Series 2004-46(a) | | | 5.85 | % | 03/25/2034 | | | 39,017 | |
| | 1,514,471 | | Series 2005-104(a) | | | 6.55 | % | 12/25/2033 | | | 109,124 | |
| | 779,622 | | Series 2006-101(a) | | | 6.43 | % | 10/25/2036 | | | 132,606 | |
| | 2,237,490 | | Series 2006-123(a) | | | 6.17 | % | 01/25/2037 | | | 397,875 | |
| | 10,500,947 | | Series 2006-92(a) | | | 6.43 | % | 10/25/2036 | | | 1,894,077 | |
| | 375,437 | | Series 2007-102(a) | | | 6.25 | % | 11/25/2037 | | | 58,304 | |
| | 696,648 | | Series 2007-108(a) | | | 6.21 | % | 12/25/2037 | | | 93,958 | |
| | 105,385 | | Series 2007-30(a) | | | 5.96 | % | 04/25/2037 | | | 13,418 | |
| | 1,467,742 | | Series 2007-38(a) | | | 5.93 | % | 05/25/2037 | | | 213,360 | |
| | 115,344 | | Series 2007-51(a) | | | 5.95 | % | 06/25/2037 | | | 15,880 | |
| | 229,391 | | Series 2007-53(a) | | | 5.95 | % | 06/25/2037 | | | 35,784 | |
| | 1,770,833 | | Series 2007-57(a) | | | 6.47 | % | 10/25/2036 | | | 281,292 | |
| | 1,608,942 | | Series 2007-68(a) | | | 6.50 | % | 07/25/2037 | | | 216,486 | |
See Notes to Financial Statements.
RiverNorth/DoubleLine Strategic Income Fund | Schedule of Investments |
| | |
| Principal Amount/Description | | Rate | | Maturity | | Value | |
| $ | 2,367,273 | | Series 2008-3(a) | | | 6.31 | % | 02/25/2038 | | $ | 331,866 | |
| | 1,434,913 | | Series 2008-56(a) | | | 5.91 | % | 07/25/2038 | | | 171,366 | |
| | 674,194 | | Series 2008-81 | | | 5.50 | % | 09/25/2038 | | | 729,041 | |
| | 1,722,249 | | Series 2009-111 | | | 5.00 | % | 01/25/2040 | | | 1,841,256 | |
| | 1,554,238 | | Series 2009-111(a) | | | 6.10 | % | 01/25/2040 | | | 194,617 | |
| | 2,657,170 | | Series 2009-12(a) | | | 6.45 | % | 03/25/2036 | | | 525,971 | |
| | 211,757 | | Series 2009-28(a) | | | 5.85 | % | 04/25/2037 | | | 26,342 | |
| | 1,222,842 | | Series 2009-41 | | | 4.50 | % | 06/25/2039 | | | 1,295,632 | |
| | 825,094 | | Series 2009-42(a) | | | 5.85 | % | 06/25/2039 | | | 92,114 | |
| | 2,107,441 | | Series 2009-47(a) | | | 5.95 | % | 07/25/2039 | | | 285,352 | |
| | 1,241,626 | | Series 2009-62(a) | | | 5.95 | % | 08/25/2039 | | | 163,926 | |
| | 409,233 | | Series 2009-66(a) | | | 5.65 | % | 02/25/2038 | | | 57,907 | |
| | 399,719 | | Series 2009-68(a) | | | 5.10 | % | 09/25/2039 | | | 36,382 | |
| | 18,497 | | Series 2010-109(a) | | | 53.30 | % | 10/25/2040 | | | 71,236 | |
| | 2,701,879 | | Series 2010-11(a) | | | 4.65 | % | 02/25/2040 | | | 267,243 | |
| | 342,157 | | Series 2010-111(a) | | | 5.85 | % | 10/25/2040 | | | 39,515 | |
| | 540,281 | | Series 2010-112 | | | 4.00 | % | 10/25/2040 | | | 564,435 | |
| | 1,196,521 | | Series 2010-115(a) | | | 6.45 | % | 11/25/2039 | | | 168,715 | |
| | 5,128,666 | | Series 2010-115(a) | | | 5.85 | % | 10/25/2040 | | | 969,892 | |
| | 12,725,468 | | Series 2010-123(a) | | | 5.90 | % | 11/25/2040 | | | 2,503,888 | |
| | 2,637,106 | | Series 2010-15(a) | | | 4.80 | % | 03/25/2040 | | | 253,384 | |
| | 507,092 | | Series 2010-34(a) | | | 4.78 | % | 04/25/2040 | | | 51,066 | |
| | 204,351 | | Series 2010-4(a) | | | 6.08 | % | 02/25/2040 | | | 37,232 | |
| | 507,535 | | Series 2010-58(a) | | | 12.07 | % | 06/25/2040 | | | 576,547 | |
| | 2,732,923 | | Series 2010-75 | | | 4.50 | % | 07/25/2040 | | | 2,950,980 | |
| | 2,899,145 | | Series 2010-9(a) | | | 4.60 | % | 02/25/2040 | | | 275,981 | |
| | 388,573 | | Series 2010-9(a) | | | 5.15 | % | 02/25/2040 | | | 47,357 | |
| | 114,137 | | Series 2010-90(a) | | | 5.85 | % | 08/25/2040 | | | 15,017 | |
| | 500,000 | | Series 2011-16 | | | 3.50 | % | 03/25/2031 | | | 494,827 | |
| | 2,894,214 | | Series 2011-2 | | | 4.00 | % | 02/25/2041 | | | 2,920,945 | |
| | 1,000,000 | | Series 2011-25 | | | 3.00 | % | 04/25/2026 | | | 1,000,115 | |
| | 500,000 | | Series 2011-29 | | | 3.50 | % | 04/25/2031 | | | 496,281 | |
| | 1,200,000 | | Series 2011-48(a) | | | 8.89 | % | 06/25/2041 | | | 1,210,832 | |
| | 2,824,936 | | Series 2011-5(a) | | | 6.25 | % | 11/25/2040 | | | 380,443 | |
| | 3,200,922 | | Series 2011-58(a) | | | 6.40 | % | 07/25/2041 | | | 558,513 | |
| | 11,384,305 | | Series 2012-106(a) | | | 6.01 | % | 10/25/2042 | | | 1,866,776 | |
| | 2,214,330 | | Series 2012-124(a) | | | 7.52 | % | 11/25/2042 | | | 2,229,100 | |
| | 9,795,601 | | Series 2012-128(a) | | | 5.77 | % | 11/25/2042 | | | 7,630,333 | |
| | 703,456 | | Series 2012-140(a) | | | 7.60 | % | 12/25/2042 | | | 688,777 | |
| | 8,755,890 | | Series 2012-20 | | | 3.50 | % | 03/25/2042 | | | 8,274,946 | |
| | 3,002,528 | | Series 2012-29(a) | | | 5.85 | % | 04/25/2042 | | | 367,086 | |
| | 2,801,728 | | Series 2012-32 | | | 5.00 | % | 04/25/2042 | | | 581,843 | |
| | 600,306 | | Series 2012-55(a) | | | 6.71 | % | 05/25/2042 | | | 590,160 | |
| | 11,036,248 | | Series 2012-65(a) | | | 5.83 | % | 06/25/2042 | | | 2,024,544 | |
See Notes to Financial Statements.
RiverNorth/DoubleLine Strategic Income Fund | Schedule of Investments |
| | |
| Principal Amount/Description | | Rate | Maturity | | Value | |
| $ | 4,723,158 | | Series 2012-92 | | | 3.50 | % | 08/25/2042 | | $ | 4,343,052 | |
| | 6,990,885 | | Series 2013-19(a) | | | 5.21 | % | 03/25/2043 | | | 5,864,053 | |
| | 9,646,208 | | Series 2013-51(a) | | | 5.21 | % | 04/25/2043 | | | 8,046,944 | |
| | 23,900,823 | | Series 2014-50(a) | | | 6.05 | % | 08/25/2044 | | | 3,811,990 | |
| | | | Government National Mortgage Association | | | | | | | | | |
| | 166,463 | | Series 2004-83(a) | | | 5.92 | % | 10/20/2034 | | | 24,073 | |
| | 167,109 | | Series 2008-6(a) | | | 6.30 | % | 02/20/2038 | | | 25,621 | |
| | 156,062 | | Series 2008-67(a) | | | 5.84 | % | 08/20/2038 | | | 21,097 | |
| | 2,399,498 | | Series 2008-69(a) | | | 7.47 | % | 08/20/2038 | | | 451,300 | |
| | 155,926 | | Series 2009-10(a) | | | 6.50 | % | 02/16/2039 | | | 27,835 | |
| | 2,541,357 | | Series 2009-35 | | | 4.50 | % | 05/20/2039 | | | 2,735,789 | |
| | 13,066,612 | | Series 2009-58(a) | | | 6.09 | % | 06/20/2039 | | | 1,963,481 | |
| | 178,154 | | Series 2009-6(a) | | | 5.79 | % | 02/20/2038 | | | 23,797 | |
| | 4,491,755 | | Series 2009-75 | | | 5.00 | % | 09/20/2039 | | | 5,007,588 | |
| | 10,366,853 | | Series 2010-26(a) | | | 6.09 | % | 02/20/2040 | | | 1,922,512 | |
| | 288,168 | | Series 2010-61(a) | | | 6.39 | % | 09/20/2039 | | | 39,468 | |
| | 1,453,631 | | Series 2010-98(a) | | | 5.91 | % | 03/20/2039 | | | 155,864 | |
| | 24,496 | | Series 2011-12(g) | | | 0.00 | % | 12/20/2040 | | | 17,401 | |
| | 2,925,590 | | Series 2011-45 | | | 4.50 | % | 03/20/2041 | | | 3,093,800 | |
| | 2,683,930 | | Series 2011-69(g) | | | 0.00 | % | 05/20/2041 | | | 2,357,642 | |
| | 2,323,017 | | Series 2011-71 | | | 4.50 | % | 02/20/2041 | | | 2,497,773 | |
| | 4,568,371 | | Series 2011-71(a) | | | 5.24 | % | 05/20/2041 | | | 557,136 | |
| | 1,269,608 | | Series 2011-72(a) | | | 5.99 | % | 05/20/2041 | | | 198,965 | |
| | 7,198,345 | | Series 2011-89(a) | | | 5.29 | % | 06/20/2041 | | | 941,594 | |
| | 3,111,923 | | Series 2012-105(a) | | | 6.04 | % | 01/20/2041 | | | 450,597 | |
| | 11,774,041 | | Series 2013-148(a) | | | 5.53 | % | 10/16/2043 | | | 1,864,619 | |
| | 16,453,785 | | Series 2014-95(a) | | | 6.10 | % | 06/16/2044 | | | 2,948,436 | |
| | | | | |
TOTAL U.S. GOVERNMENT / AGENCY MORTGAGE BACKED SECURITIES (Cost $187,723,606) | | | 166,184,167 | |
| Shares/Description | | Value | |
| SHORT-TERM INVESTMENTS - 19.70% | | | |
| | 272,070,916 | | State Street Institutional Trust (7 Day Yield 0.00%) | | | 272,070,916 | |
| | | | | |
TOTAL SHORT-TERM INVESTMENTS (Cost $272,070,916) | | | 272,070,916 | |
See Notes to Financial Statements.
RiverNorth/DoubleLine Strategic Income Fund | Schedule of Investments |
| | September 30, 2014 (Unaudited) |
| Shares/Description | | Value | |
| TOTAL INVESTMENTS - 99.12% | | | |
| (Cost $1,356,280,502) | | $ | 1,368,814,316 | |
| OTHER ASSETS IN EXCESS OF LIABILITIES - 0.88% | | | 12,121,194 | |
| NET ASSETS - 100.00% | | $ | 1,380,935,510 | |
| (a) | Floating or variable Rate security. Interest Rate disclosed is that which is in effect at September 30, 2014. |
| (b) | Security exempt from regiStration under Rule 144A of the Securities Act of 1933. The.se securities have been deemed liquid under procedures approved by the Fund's Board of Trustees and may normally be sold to qualified institutional buyers in transactions exempt from regiStration. Total market Value of Rule 144A securities amounts to $76,642,845, which represents approximately 5.55% of net assets as of September 30, 2014. |
| (c) | Securities were purchased pursuant to Regulation S under the Securities Act of 1933, which exempts securities offered and .sold outside of the United States from regiStration. Such securities cannot be sold in the United States without either an effective registration statement filed pursuant to the Securities Act of 1933, or pursuant to an exemption from regiStration. These securities have been deemed liquid under procedures approved by the Fund's Board of Trustees. As of September 30, 2014, the aggregate market Value of those securities was $17,837,737, representing 1.29%o of net assets. |
| (d) | This security has no contractual Maturity date, is not redeemable and contractually pays an indefinite Stream of interest. |
| (e) | Step bond. Coupon increases periodically based upon a predetermined .schedule. Interest Rate disclosed is that which is in effect at September 30, 2014. |
| (f) | Security will not have a principal balance, market Value or Rate. Security will not be entitled to diStributions in respect of principal or intere.st other than excess interest paid with respect to the mortgage loans. |
| (g) | Zero coupon bond reflects effective yield on the date of purchase. |
Common Abbreviations:
BV - Besloten Vennootschap a Dutch private limited liability company.
CLO - Collateralized Loan Obligation.
GmbH - Gesellschaft mit beschrankter Haftung is the German term for a company with limited liability.
LLC - Limited Liability Corp.
LP - Limited Partnership.
Ltd. - Limited.
MLP – Master Limited Partnership.
NV - Naamloze Vennootschap is the Dutch term for a public limited liability corporation.
PLC - Public Limited Co.
REMICS - Real Estate Mortgage Investment Conduits.
SA - Generally designates corporations in various countries, mostly those employing the civil law.
SAA - Sociedad Anónima Abierta - A publicly traded corporation.
SA de CV - Sociedad Anónima de Capital Variable - A variable capital company.
SAB de CV - Sociedad Anónima Bursátil de Capital Variable - A variable capital company.
SAC - Sociedad Anónima Cerrada - A privately held corporation.
S de rl - Sociedad de Responsabilidad.
S de RL de CV - Sociedad de Responsabilidad Limitada de Capital Variable.
SCS - Société en commandite simple.
See Notes to Financial Statements.
RiverNorth Equity Opportunity Fund | Schedule of Investments |
| | |
| Shares/Description | | Value | |
| CLOSED-END FUNDS - 73.50% | | | |
| | 51,119 | | Adams Express Co. | | $ | 712,599 | |
| | 32,638 | | ANianzGI Equity & Convertible Income Fund | | | 648,517 | |
| | 49,497 | | Alpine Total Dynamic Dividend Fund | | | 421,219 | |
| | 35,163 | | Boulder Growth & Income Fund, Inc. | | | 310,841 | |
| | 35,385 | | Boulder Total Return Fund, Inc. | | | 932,041 | |
| | 14,200 | | CBRE Clarion Global Real Estate Income Fund | | | 118,996 | |
| | 14,373 | | Central Securities Corp. | | | 330,292 | |
| | 39,121 | | Clough Global Allocation Fund | | | 559,782 | |
| | 41,200 | | Clough Global Opportunities Fund | | | 491,516 | |
| | 49,628 | | Cornerstone Progressive Return Fund | | | 203,971 | |
| | 15,570 | | General American Investors Co., Inc. | | | 577,024 | |
| | 64,120 | | Liberty All Star® Equity Fund | | | 373,820 | |
| | 5,710 | | Madison Strategic Sector Premium Fund | | | 70,747 | |
| | 47,114 | | Neuberger Berman Real Estate Securities Income Fund, Inc. | | | 227,090 | |
| | 79,163 | | Royce Focus Trust, Inc. | | | 623,013 | |
| | 10,350 | | Royce Value Trust, Inc. | | | 150,075 | |
| | 1,500 | | Source Capital, Inc. | | | 97,485 | |
| | 13,106 | | The Denali Fund, Inc. | | | 284,531 | |
| | 9,618 | | The Gabelli Dividend & Income Trust | | | 204,863 | |
| | 26,786 | | Tri-Continental Corp. | | | 559,024 | |
| | | | | |
TOTAL CLOSED-END FUNDS (Cost $7,329,875) | | | 7,897,446 | |
| | | | | |
| EXCHANGE-TRADED FUNDS - 23.24% | | | | |
| | 17,375 | | iShares® Russell 1000® Value ETF | | | 1,739,063 | |
| | 3,846 | | SPDR® S&P 500® ETF Trust | | | 757,739 | |
| | | | | |
TOTAL EXCHANGE‐TRADED FUNDS (Cost $2,343,152) | | | 2,496,802 | |
| | | | | |
| SHORT-TERM INVESTMENTS - 0.87% | | | | |
| | 93,927 | | State Street Institutional Trust (7 Day Yield 0.00%) | | | 93,927 | |
| | | | | |
TOTAL SHORT-TERM INVESTMENTS (Cost $93,927) | | | 93,927 | |
See Notes to Financial Statements.
RiverNorth Equity Opportunity Fund | Schedule of Investments |
| | September 30, 2014 |
| Shares/Description | | Value | |
| TOTAL INVESTMENTS - 97.61% | | | |
| (Cost $9,766,954) | | $ | 10,488,175 | |
| OTHER ASSETS IN EXCESS OF LIABILITIES - 2.39% | | | 256,704 | |
| NET ASSETS - 100.00% | | $ | 10,744,879 | |
Common Abbreviations:
ETF - Exchange Traded Fund.
S&P - Standard and Poor's.
SPDR - Standard and Poor's Depositary Receipt.
See Notes to Financial Statements.
RiverNorth/Oaktree High Income Fund | Schedule of Investments |
| | |
| Shares/Description | | Value | |
| CLOSED-END FUNDS - 22.96% | | | |
| | 46,016 | | Apollo Tactical Income Fund, Inc. | | $ | 796,261 | |
| | 23,849 | | Ares Multi-Strategy Credit Fund, Inc. | | | 495,821 | |
| | 41,798 | | Bancroft Fund Ltd. | | | 825,928 | |
| | 74,942 | | BlackRock CorpoRate High Yield Fund, Inc. | | | 886,564 | |
| | 33,518 | | BlackRock Credit Allocation Income Trust | | | 446,125 | |
| | 458,434 | | BlackRock Debt Strategies Fund, Inc. | | | 1,751,218 | |
| | 101,514 | | BlackRock Multi-Sector Income Trust | | | 1,800,858 | |
| | 34,376 | | Blackstone/GSO Long-Short Credit Income Fund | | | 574,079 | |
| | 10,174 | | Blackstone/GSO Senior Floating Rate Term Fund | | | 174,688 | |
| | 33,674 | | Blackstone/GSO Strategic Credit Fund | | | 565,050 | |
| | 91,275 | | Brookfield Mortgage Opportunity Income Fund, Inc. | | | 1,550,762 | |
| | 44,005 | | Deutsche High Income Opportunities Fund, Inc. | | | 644,233 | |
| | 40,669 | | Deutsche High Income Trust | | | 363,581 | |
| | 53,559 | | Eaton Vance Floating-Rate Income Plus Fund | | | 923,357 | |
| | 19,485 | | Eaton Vance Senior Income Trust | | | 126,847 | |
| | 16,474 | | First Trust High Income Long/Short Fund | | | 281,541 | |
| | 2,284 | | Franklin Limited Duration Income Trust | | | 28,276 | |
| | 33,100 | | Invesco Senior Income Trust | | | 157,225 | |
| | 55,745 | | Ivy High Income Opportunities Fund | | | 963,831 | |
| | 39,065 | | Legg Mason BW Global Income Opportunities Fund, Inc. | | | 660,980 | |
| | 3,201 | | MFS InterMarket Income Trust I | | | 26,728 | |
| | 177,812 | | Nuveen Credit Strategies Income Fund | | | 1,587,861 | |
| | 18,903 | | Nuveen Global Income Opportunities Fund | | | 233,641 | |
| | 24,899 | | Nuveen Mortgage Opportunity Term Fund | | | 591,351 | |
| | 14,338 | | Nuveen Short Duration Credit Opportunities Fund | | | 245,467 | |
| | 56,269 | | PIMCO Dynamic Credit Income Fund | | | 1,264,364 | |
| | 6,942 | | PIMCO Income Strategy Fund II | | | 73,099 | |
| | 2,100 | | Prudential Global Short Duration High Yield Fund, Inc. | | | 34,650 | |
| | 93,495 | | The New America High Income Fund, Inc. | | | 879,788 | |
| | 8,653 | | Virtus Global Multi-Sector Income Fund | | | 147,707 | |
| | 16,196 | | Western Asset Global CorpoRate Defined Opportunity Fund, Inc. | | | 294,605 | |
| | 5,100 | | Western Asset High Yield Defined Opportunity Fund, Inc. | | | 84,711 | |
| | 32,613 | | Western Asset Managed High Income Fund, Inc. | | | 180,350 | |
| | | | | |
TOTAL CLOSED-END FUNDS (Cost $20,022,680) | | | 19,661,547 | |
| Principal Amount/Description | | Rate | Maturity | | Value | |
| BANK LOANS - 30.44% | | | | | | | |
Bermuda - 0.24% | | | | | | | |
| $ | 79,600 | | Belmond Interfin Ltd., Dollar Term Loan | | | 4.00 | % | 03/19/2021 | | | 78,671 | |
| | 99,500 | | Belmond Interfin Ltd., Euro Term Loan | | | 4.25 | % | 03/19/2021 | | | 126,198 | |
| | | | | | | | | | | | 204,869 | |
See Notes to Financial Statements.
RiverNorth/Oaktree High Income Fund | Schedule of Investments |
| | |
| Principal Amount/Description | | Rate | Maturity | | Value | |
| Denmark - 0.51% | | | | | | | |
| $ | 350,000 | | Nassa Midco AS, Facility B Term Loan | | | 4.25 | % | 07/09/2021 | | $ | 439,124 | |
| France -1.33% | | | | | | | | | |
| | 235,000 | | Financiere Chopin (aka Ceva Sante Animale), Term B Loan | | | 4.50 | % | 06/16/2021 | | | 297,930 | |
| | 235,000 | | Generale de Sante Development International Services Ltd., Facility B1A Loan(a) | | | L+3.50 | % | 07/29/2020 | | | 297,857 | |
| | 200,000 | | Numericable Group SA, Euro Denominated Tranche B-1 Loan | | | 4.50 | % | 05/21/2020 | | | 253,099 | |
| | 230,000 | | Sebia SAS, Term Loan(a) | | | L+3.25 | % | 07/23/2021 | | | 291,351 | |
| | | | | | | | | | | | 1,140,237 | |
| Germany -1.00% | | | | | | | | | |
| | 187,206 | | Braas Monier Building Group Holding S.A.R.L., Facility B Term Loan | | | 4.70 | % | 10/15/2020 | | | 238,521 | |
| | 120,000 | | CD&R Millennium Holdco 6 S.A.R.L., First Lien Initial Term Loan | | | 4.75 | % | 07/31/2021 | | | 151,368 | |
| | 300,000 | | INA Beteiligungsgesellschaft MitBeschrankter Haftung (fka Schaeffler AG), Facility E Term Loan | | | 3.75 | % | 05/15/2020 | | | 297,939 | |
| | 130,000 | | Orion Engineered Carbons GmbH (OEC Finance US LLC), Initial Euro Term Loan | | | 5.00 | % | 07/25/2021 | | | 165,388 | |
| | | | | | | | | | | | 853,216 | |
| Great Britain -1.05% | | | | | | | | | |
| | 199,500 | | Devix Topco (fka Rexam Healthcare), First Lien Term B Loan | | | 4.25 | % | 05/03/2021 | | | 198,378 | |
| | 240,000 | | Expro Financial Services S.A.R.L., Initial Term Loan(a) | | | L+4.75 | % | 09/02/2021 | | | 239,299 | |
| | 100,000 | | Frontier Bidco Ltd., Facility B Term Loan | | | 5.63 | % | 11/27/2020 | | | 157,656 | |
| | 309,225 | | TI Group Automotive Systems LLC, Facility Term Loan | | | 4.25 | % | 07/02/2021 | | | 305,554 | |
| | | | | | | | | | | | 900,887 | |
| Ireland - 0.25% | | | | | | | | | |
| | 218,900 | | Mallinckrodt International Finance SA, Initial Term B Loan | | | 3.50 | % | 03/19/2021 | | | 215,924 | |
| Italy - 0.44% | | | | | | | | | |
| | 300,000 | | Inter Media and Communications S.r.l., Term Loan B(a) | | | L+0.00 | % | 06/05/2019 | | | 373,233 | |
| Luxembourg -1.49% | | | | | | | | | |
| | 340,000 | | Capsugel Finance Co. SCA, Euro Term Loan | | | 3.75 | % | 07/30/2021 | | | 425,145 | |
| | 200,000 | | Delta 2 (Lux) S.A.R.L., Facility B3 Term Loan 4.75% | | 07/30/2021 | | | 197,875 | |
See Notes to Financial Statements.
RiverNorth/Oaktree High Income Fund | Schedule of Investments |
| | |
| Principal Amount/Description | | Rate | Maturity | | Value | |
| $ | 100,000 | | Delta 2 (Lux) S.A.R.L., Second Lien Facility Term Loan | | | 7.75 | % | 07/29/2022 | | $ | 99,812 | |
| | 405,000 | | Evergreen Skills Lux S.A.R.L., First Lien Initial Term Loan | | | 4.50 | % | 04/28/2021 | | | 398,251 | |
| | 165,000 | | Evergreen Skills Lux S.A.R.L., Second Lien Initial Term Loan | | | 7.75 | % | 04/28/2022 | | | 159,431 | |
| | | | | | | | | | | | 1,280,514 | |
| Netherlands - 0.83% | | | | | | | | | |
| | 330,000 | | Charger OpCo BV, Term B-1 Euro Term Loan(a) | | | E+3.50 | % | 07/02/2021 | | | 414,508 | |
| | 235,000 | | Platform Specialty Products, Term Loan(a) | | | E+3.25 | % | 06/07/2020 | | | 297,189 | |
| | | | | | | | | | | | 711,697 | |
| Singapore - 0.64% | | | | | | | | | |
| | 314,213 | | Avago Technologies Cayman Ltd., Term Loan | | | 3.75 | % | 05/06/2021 | | | 311,818 | |
| | 235,000 | | IBC Capital I Ltd., First Lien Initial Term Loan | | | 4.75 | % | 09/09/2021 | | | 234,413 | |
| | | | | | | | | | | | 546,231 | |
| South Korea - 0.29% | | | | | | | | | |
| | 244,388 | | Doosan Infracore International, Inc., Tranche B Term Loan | | | 4.50 | % | 05/28/2021 | | | 244,388 | |
| Spain - 0.13% | | | | | | | | | |
| | 114,425 | | Grifols Worldwide Operations Ltd., Tranche B Term Loan | | | 3.15 | % | 02/27/2021 | | | 112,584 | |
| United States - 22.24% | | | | | | | | | |
| | 260,000 | | Advantage Sales & Marketing, Inc., First Lien Initial Term Loan | | | 4.25 | % | 07/23/2021 | | | 255,892 | |
| | 270,000 | | Aecom Technology Corp., Term Loan B(a) | | | L+3.00 | % | 09/17/2021 | | | 269,758 | |
| | 218,237 | | Alaska Communications Systems Holdings, Inc., Term Loan | | | 6.25 | % | 10/21/2016 | | | 217,473 | |
| | 563,588 | | American Rock Salt Co. LLC, First Lien Term Loan | | | 4.75 | % | 05/20/2021 | | | 558,797 | |
| | 240,000 | | American Rock Salt Co. LLC, Second Lien Delayed Draw Loan | | | 8.00 | % | 05/20/2022 | | | 243,000 | |
| | 165,000 | | Anchor Glass Container Corp., Term Loan B | | | 4.25 | % | 06/30/2021 | | | 163,900 | |
| | 248,101 | | Arch Coal, Inc., Term Loan | | | 6.25 | % | 05/16/2018 | | | 227,788 | |
| | 175,000 | | AssuredPartners Capital, Inc., First Lien Initial Term Loan | | | 4.50 | % | 04/02/2021 | | | 173,032 | |
| | 224,438 | | Atkore International, Inc., First Lien Initial Term Loan | | | 4.50 | % | 04/09/2021 | | | 222,754 | |
| | 357,300 | | Caesars Entertainment Resort Properties LLC, Term B Loan | | | 7.00 | % | 10/11/2020 | | | 343,008 | |
See Notes to Financial Statements.
RiverNorth/Oaktree High Income Fund | Schedule of Investments |
| | |
| Principal Amount/Description | | Rate | Maturity | | Value | |
| $ | 74,813 | | Catalent Pharma Solutions, Inc. (fka Cardinal Health 409, Inc.), Dollar Term Loan | | | 4.50 | % | 05/20/2021 | | $ | 74,516 | |
| | 199,500 | | Catalent Pharma Solutions, Inc. (fka Cardinal Health 409, Inc.), Extended Euro Term Loan | | | 4.50 | % | 05/20/2021 | | | 253,555 | |
| | 606,950 | | Cengage Learning Acquisitions, Inc. (aka Thomson Learning Acquisitions, Inc.), Term Loan | | | 7.00 | % | 03/31/2020 | | | 607,709 | |
| | 94,029 | | Chrysler Group LLC, Tranche B Term Loan | | | 3.25 | % | 12/31/2018 | | | 92,530 | |
| | 375,000 | | ClubCorp Club Operations, Inc., Term Loan | | | 4.50 | % | 07/24/2020 | | | 372,343 | |
| | 375,000 | | CPI Buyer, LLC, First Lien Initial Term Loan | | | 5.50 | % | 08/16/2021 | | | 371,250 | |
| | 164,175 | | CPI International Acquisition, Inc., Term B Loan | | | 4.25 | % | 11/17/2017 | | | 163,098 | |
| | 190,000 | | Emmis Operating Co., Term Loan | | | 5.75 | % | 06/10/2021 | | | 189,762 | |
| | 448,875 | | Encompass Digital Media, Inc., First Lien Tranche B Term Loan | | | 5.50 | % | 06/06/2021 | | | 448,875 | |
| | 150,000 | | Encompass Digital Media, Inc., Second Lien Tranche B Term Loan | | | 8.75 | % | 06/06/2022 | | | 152,250 | |
| | 445,000 | | Energy Future Intermediate Holding Co. LLC (EFIH Finance, Inc.), Term Loan | | | 4.25 | % | 06/19/2016 | | | 443,703 | |
| | 221,641 | | Entegris, Inc., Tranche B Term Loan | | | 3.50 | % | 04/30/2021 | | | 218,316 | |
| | 248,120 | | Excelitas Technology Corp., Term B Loan | | | 6.00 | % | 11/02/2020 | | | 248,326 | |
| | 420,000 | | Fieldwood Energy LLC, Second Lien Term Loan | | | 8.38 | % | 09/30/2020 | | | 422,205 | |
| | 700,000 | | First Data Corp., Term Loan | | | 3.66 | % | 03/23/2018 | | | 687,533 | |
| | 180,000 | | Gas Natural Fenosa Telecoms, Term Loan B(a) | | | E+4.75 | % | 07/30/2021 | | | 226,015 | |
| | 320,917 | | Getty Images, Inc., Initial Term Loan | | | 4.75 | % | 10/18/2019 | | | 295,244 | |
| | 390,000 | | Grede Holdings LLC, Initial Term Loan | | | 4.75 | % | 06/02/2021 | | | 389,474 | |
| | 228,850 | | Hi-Crush Partners LP, Advance Term Loan | | | 4.75 | % | 04/28/2021 | | | 227,706 | |
| | 298,500 | | HUB International Ltd., Initial Term Loan | | | 4.25 | % | 10/02/2020 | | | 292,530 | |
| | 248,750 | | Hudson Products Holdings, Inc., Term Loan | | | 5.00 | % | 03/15/2019 | | | 246,884 | |
| | 184,075 | | IMS Health, Inc., Term B Dollar Loan | | | 3.50 | % | 03/17/2021 | | | 180,624 | |
| | 289,275 | | Interactive Data Corp., Term Loan | | | 4.75 | % | 05/02/2021 | | | 288,416 | |
| | 185,000 | | Jonah Energy LLC, Second Lien Initial Term Loan | | | 7.50 | % | 05/12/2021 | | | 183,612 | |
| | 124,266 | | KAR Auction Services, Inc., Tranche B-2 Term Loan | | | 3.50 | % | 03/11/2021 | | | 122,764 | |
| | 100,000 | | Michaels Stores, Inc., Incremental Term Loan | | | 4.00 | % | 01/28/2020 | | | 99,111 | |
| | 95,000 | | Midas Intermediate Holdco II LLC, Term Loan(a) | | | L+3.75 | % | 08/18/2021 | | | 94,882 | |
| | 364,088 | | Millennium Health LLC, Tranche B Term Loan | | | 5.25 | % | 04/16/2021 | | | 363,632 | |
See Notes to Financial Statements.
RiverNorth/Oaktree High Income Fund | Schedule of Investments |
| | |
| Principal Amount/Description | | Rate | Maturity | | Value | |
| $ | 283,698 | | Minerals Technologies, Inc., Initial Term Loan | | | 4.00 | % | 05/07/2021 | | $ | 281,926 | |
| | 284,693 | | MTL Publishing LLC (aka EMI Music Publishing Group North America Holdings, Inc.), Term B Loan | | | 3.75 | % | 06/29/2018 | | | 280,601 | |
| | 552,225 | | Neiman Marcus Group, Inc., Term Loan | | | 4.25 | % | 10/25/2020 | | | 543,596 | |
| | 389,025 | | Ortho-Clinical Diagnostics Holdings Luxembourg S.A.R.L., Initial Term Loan | | | 4.75 | % | 06/30/2021 | | | 385,012 | |
| | 230,000 | | Paragon Offshore Finance Co., Term Loan | | | 3.75 | % | 07/16/2021 | | | 215,913 | |
| | 140,000 | | PEG GmbH, Tranche C Term Loan | | | 4.50 | % | 08/30/2021 | | | 177,270 | |
| | 189,050 | | Pelican Products, Inc., First Lien Term Loan | | | 5.25 | % | 04/10/2020 | | | 189,404 | |
| | 213,371 | | PQ Corp., Term Loan | | | 4.00 | % | 08/07/2017 | | | 211,276 | |
| | 250,000 | | Quicksilver Resources, Inc., Second Lien Term Loan | | | 7.00 | % | 06/21/2019 | | | 228,125 | |
| | 119,100 | | Realogy Group LLC (fka Realogy Corp.), Initial Term B Loan | | | 3.75 | % | 03/05/2020 | | | 117,165 | |
| | 213,925 | | Rent-A-Center, Inc., Term Loan | | | 3.75 | % | 03/19/2021 | | | 211,786 | |
| | 124,375 | | Road InfraStructure Investment LLC, First Lien Term Loan | | | 4.25 | % | 03/31/2021 | | | 121,266 | |
| | 239,356 | | Sandy Creek Energy Associates LP, Term Loan | | | 5.00 | % | 11/09/2020 | | | 239,107 | |
| | 630,000 | | Scientific Games International, Inc., Incremental Term Loan B2(a) | | | L+5.00 | % | 09/17/2021 | | | 618,748 | |
| | 250,000 | | Sedgwick Claims Management Services, Inc., Second Lien Initial Loan(a) | | | L+5.75 | % | 02/28/2022 | | | 244,845 | |
| | 109,725 | | Signode InduStrial Group Lux SA, Initial Euro Term Loan | | | 4.25 | % | 05/01/2021 | | | 138,633 | |
| | 185,000 | | Solenis International LP (Solenis Holdings 3 LLC), Initial Euro Term Loan | | | 4.50 | % | 07/31/2021 | | | 233,739 | |
| | 525,000 | | Stater Bros. Markets, Term B Loan | | | 4.75 | % | 05/12/2021 | | | 524,346 | |
| | 228,850 | | Sungard Availability Services Capital, Inc., Tranche B Term Loan | | | 6.00 | % | 03/29/2019 | | | 212,373 | |
| | 130,620 | | Tekni-Plex, Inc., Term Loan | | | 4.75 | % | 08/10/2019 | | | 130,293 | |
| | 195,000 | | Telenet International Finance SA, Y Facility Term Loan | | | 3.51 | % | 06/30/2023 | | | 245,971 | |
| | 374,253 | | Texas Competitive Electric Holdings Co. LLC, Delayed Draw Term Loan | | | 3.75 | % | 05/05/2016 | | | 376,593 | |
| | 294,263 | | Time, Inc., Term Loan | | | 4.25 | % | 04/26/2021 | | | 291,688 | |
| | 243,163 | | Toys "R" US Property Co. I LLC, Initial Term Loan | | | 6.00 | % | 08/21/2019 | | | 234,530 | |
| | 447,750 | | Trans Union LLC, Term Loan | | | 4.00 | % | 04/09/2021 | | | 441,455 | |
| | 322,820 | | Tronox Pigments BV, Term Loan | | | 4.00 | % | 03/19/2020 | | | 320,904 | |
| | 138,942 | | United Airlines, Inc. (fka Continental Airlines, Inc.), Term B Loan | | | 3.50 | % | 04/01/2019 | | | 136,728 | |
See Notes to Financial Statements.
RiverNorth/Oaktree High Income Fund | Schedule of Investments |
| | |
| Principal Amount/Description | | Rate | Maturity | | Value | |
| | | | | | | | | | |
| $ | 154,613 | | UTEX InduStries, Inc., First Lien Initial Term Loan | | | 5.00 | % | 05/21/2021 | | $ | 154,323 | |
| | 246,925 | | Windsor Quality Food Co. Ltd., Term B Loan | | | 5.00 | % | 12/26/2020 | | | 246,514 | |
| | 179,550 | | WP Mustang Holdings LLC, First Lien Term Loan | | | 5.50 | % | 05/29/2021 | | | 179,475 | |
| | 223,875 | | XO Communications LLC, Initial Term Loan | | | 4.25 | % | 03/20/2021 | | | 221,916 | |
| | 225,000 | | York Risk Services Group, Inc., Term Loan(a) | | | L+3.75 | % | 10/01/2021 | | | 224,439 | |
| | 238,183 | | Zuffa LLC, Initial Term Loan | | | 3.75 | % | 02/25/2020 | | | 235,503 | |
| | | | | | | | | | | | 19,047,730 | |
| | | | | | | | | | | | |
| TOTAL BANK LOANS (Cost $26,581,759) | | | | | | | | 26,070,634 | |
| Shares/Description | | Rate | Maturity | | Value | |
| BUSINESS DEVELOPMENT COMPANY SENIOR NOTES - 0.15% | | | |
| | 5,224 | | Medley Capital Corp. | | | 6.13 | % | 03/30/2023 | | | 127,100 | |
| | | | | | | |
TOTAL BUSIINESS DEVELOPMENT COMPANY SENIOR NOTES (Cost $130,550) | | | | | 127,100 | |
| Principal Amount/Description | | Rate | Maturity | | Value | |
| HIGH YIELD DEBT- 41.70% | | | | | | | |
| Australia - 0.17% | | | | | | | |
| $ | 140,000 | | FMG Resources August 2006 Pty. Ltd.(b) | | | 6.88 | % | 04/01/2022 | | | 142,975 | |
| Belgium - 0.27% | | | | | | | | | |
| | 170,000 | | Ontex IV SA(c) | | | 9.00 | % | 04/15/2019 | | | 229,750 | |
| Bermuda - 0.23% | | | | | | | | | |
| | 200,000 | | Seadrill Ltd.(b) | | | 6.13 | % | 09/15/2017 | | | 200,250 | |
| Canada -1.51% | | | | | | | | | |
| | 160,000 | | First Quantum Minerals Ltd.(b) | | | 7.25 | % | 05/15/2022 | | | 164,000 | |
| | 285,000 | | Harvest Operations Corp. | | | 6.88 | % | 10/01/2017 | | | 298,538 | |
| | 80,000 | | HudBay Minerals, Inc. | | | 9.50 | % | 10/01/2020 | | | 86,200 | |
| | 130,000 | | Kodiak Oil & Gas Corp. | | | 5.50 | % | 02/01/2022 | | | 131,300 | |
| | 260,000 | | Precision Drilling Corp. | | | 6.63 | % | 11/15/2020 | | | 271,050 | |
| | 100,000 | | Valeant Pharmaceuticals International, Inc.(b) | | | 7.50 | % | 07/15/2021 | | | 107,375 | |
See Notes to Financial Statements.
RiverNorth/Oaktree High Income Fund | Schedule of Investments |
| | September 30, 2014 |
| Principal Amount/Description | | Rate | Maturity | | Value | |
| $ | 235,000 | | Valeant Pharmaceuticals International, Inc.(b) | | | 5.63 | % | 12/01/2021 | | $ | 234,706 | |
| | | | | | | | | | | | 1,293,169 | |
| France -1.59% | | | | | | | | | |
| | 200,000 | | CGG SA | | | 6.50 | % | 06/01/2021 | | | 177,000 | |
| | 100,000 | | Crown European Holdings SA(b) | | | 4.00 | % | 07/15/2022 | | | 128,043 | |
| | 65,000 | | Elior Finance & Co. SCA(c) | | | 6.50 | % | 05/01/2020 | | | 90,087 | |
| | 100,000 | | Holding Medi-Partenaires SAS(c) | | | 7.00 | % | 05/15/2020 | | | 132,621 | |
| | 100,000 | | Kerneos CorpoRate SAS(b) | | | 5.75 | % | 03/01/2021 | | | 132,845 | |
| | 340,000 | | Loxam SAS(b) | | | 4.88 | % | 07/23/2021 | | | 416,019 | |
| | 100,000 | | Loxam SAS(c) | | | 7.38 | % | 01/24/2020 | | | 130,095 | |
| | 125,000 | | Novafives SAS(b)(d) | | | 4.21 | % | 06/30/2020 | | | 157,803 | |
| | | | | | | | | | | | 1,364,513 | |
| Germany -1.12% | | | | | | | | | |
| | 200,000 | | Deutsche Raststaetten Gruppe IV GmbH(b) | | | 6.75 | % | 12/30/2020 | | | 265,873 | |
| | 200,000 | | Techem Energy Metering Service GmbH & Co. KG(c) | | | 7.88 | % | 10/01/2020 | | | 278,504 | |
| | 100,000 | | Trionista TopCo GmbH(b) | | | 6.88 | % | 04/30/2021 | | | 132,836 | |
| | 100,000 | | Unitymedia KabelBW GmbH(c) | | | 9.50 | % | 03/15/2021 | | | 143,041 | |
| | 100,000 | | WEPA Hygieneprodukte GmbH(b) | | | 6.50 | % | 05/15/2020 | | | 135,779 | |
| | | | | | | | | | | | 956,033 | |
| Great Britain - 2.70% | | | | | | | | | |
| | 150,000 | | Arqiva Broadcast Finance PLC(c) | | | 9.50 | % | 03/31/2020 | | | 269,944 | |
| | 190,000 | | IDH Finance PLC(c’'d’ | | | 5.56 | % | 12/01/2018 | | | 311,097 | |
| | 150,000 | | Iron Mountain Europe PLC(b) | | | 6.13 | % | 09/15/2022 | | | 245,214 | |
| | 215,000 | | Pendragon PLC | | | 6.88 | % | 05/01/2020 | | | 368,949 | |
| | 100,000 | | Premier Foods Finance PLC(b)(d' | | | 5.56 | % | 03/15/2020 | | | 150,004 | |
| | 100,000 | | Thames Water Kemble Finance PLC | | | 7.75 | % | 04/01/2019 | | | 176,542 | |
| | 200,000 | | Tullow Oil PLC(b’ | | | 6.00 | % | 11/01/2020 | | | 201,000 | |
| | 150,000 | | Virgin Media Finance PLC(c) | | | 7.00 | % | 04/15/2023 | | | 258,369 | |
| | 100,000 | | Vougeot Bidco PLC(b) | | | 7.88 | % | 07/15/2020 | | | 163,695 | |
| | 100,000 | | Vougeot Bidco PLC(c) | | | 7.88 | % | 07/15/2020 | | | 163,694 | |
| | | | | | | | | | | | 2,308,508 | |
| Ireland -1.23% | | | | | | | | | |
| | 285,000 | | AerCap Ireland Capital Ltd. / AerCap Global Aviation Trust(b) | | | 5.00 | % | 10/01/2021 | | | 284,287 | |
| | 120,000 | | Ardagh Glass Finance PLC(c) | | | 8.75 | % | 02/01/2020 | | | 159,145 | |
| | 115,000 | | Ardagh Packaging Finance PLC / Ardagh Holdings USA, Inc.(b) | | | 4.25 | % | 01/15/2022 | | | 141,702 | |
| | 310,000 | | Grifols Worldwide Operations Ltd.(b) | | | 5.25 | % | 04/01/2022 | | | 306,900 | |
| | 125,000 | | Smurfit Kappa Acquisitions(c) | | | 3.25 | % | 06/01/2021 | | | 157,290 | |
| | | | | | | | | | | | 1,049,324 | |
See Notes to Financial Statements.
RiverNorth/Oaktree High Income Fund | Schedule of Investments |
| | |
| Principal Amount/Description | | Rate | Maturity | | Value | |
| Italy - 0.59% | | | | | | | |
| $ | 100,000 | | Enel SpA(d) | | | 6.50 | % | 01/10/2074 | | $ | 138,275 | |
| | 200,000 | | Telecom Italia SpA | | | 5.38 | % | 01/29/2019 | | | 281,898 | |
| | 50,000 | | Telecom Italia SpA | | | 6.38 | % | 06/24/2019 | | | 88,245 | |
| | | | | | | | | | | | 508,418 | |
| Jersey - 0.42% | | | | | | | | | |
| | 200,000 | | AA Bond Co. Ltd.(c) | | | 9.50 | % | 07/31/2019 | | | 357,461 | |
| Luxembourg - 4.57% | | | | | | | | | |
| | 100,000 | | Altice SA(b) | | | 7.25 | % | 05/15/2022 | | | 131,200 | |
| | 250,000 | | APERAM(b) | | | 7.75 | % | 04/01/2018 | | | 260,938 | |
| | 405,000 | | ArcelorMittal | | | 5.50 | % | 03/01/2021 | | | 427,275 | |
| | 150,000 | | Capsugel SA(b)(e) | | | 7.00 | % | 05/15/2019 | | | 149,906 | |
| | 400,000 | | ConvaTec Finance International SA(b)(e) | | | 8.25 | % | 01/15/2019 | | | 407,250 | |
| | 100,000 | | Dufry Finance SCA(b) | | | 4.50 | % | 07/15/2022 | | | 131,584 | |
| | 230,000 | | Galapagos SA/Luxembourg(b)(d) | | | 4.83 | % | 06/15/2021 | | | 286,942 | |
| | 215,000 | | Mallinckrodt International Finance SA/Mallinckrodt CB LLC(b) | | | 5.75 | % | 08/01/2022 | | | 217,419 | |
| | 200,000 | | Matterhorn Midco & Cy SCA(c) | | | 7.75 | % | 02/15/2020 | | | 267,642 | |
| | 200,000 | | Monitchem HoldCo 3 SA(b)(d) | | | 4.83 | % | 06/15/2021 | | | 252,927 | |
| | 100,000 | | Telenet Finance Luxembourg SCA(c) | | | 6.38 | % | 11/15/2020 | | | 134,042 | |
| | 100,000 | | Telenet Finance V Luxembourg SCA(c) | | | 6.25 | % | 08/15/2022 | | | 137,044 | |
| | 173,000 | | Trinseo Materials Operating SCA / Trinseo Materials Finance, Inc. | | | 8.75 | % | 02/01/2019 | | | 182,515 | |
| | 100,000 | | Wind Acquisition Finance SA(b)(d) | | | 4.20 | % | 07/15/2020 | | | 126,306 | |
| | 145,000 | | Wind Acquisition Finance SA(b) | | | 7.00 | % | 04/23/2021 | | | 189,187 | |
| | 275,000 | | Wind Acquisition Finance SA(c)(d) | | | 4.20 | % | 07/15/2020 | | | 347,340 | |
| | 200,000 | | Xella Holdco Finance SA(b)(e) | | | 9.13 | % | 09/15/2018 | | | 266,505 | |
| | | | | | | | | | | | 3,916,022 | |
| Netherlands -1.44% | | | | | | | | | |
| | 155,000 | | Axalta Coating Systems US Holdings, Inc. / Axalta Coating Systems Dutch Holding B(c) | | | 5.75 | % | 02/01/2021 | | | 208,499 | |
| | 100,000 | | Grupo Antolin Dutch BV(b) | | | 4.75 | % | 04/01/2021 | | | 129,021 | |
| | 170,000 | | InterXion Holding NV(c) | | | 6.00 | % | 07/15/2020 | | | 224,618 | |
| | 100,000 | | OI European Group BV(c) | | | 4.88 | % | 03/31/2021 | | | 135,949 | |
| | 100,000 | | Refresco Gerber BV(c) | | | 7.38 | % | 05/15/2018 | | | 132,952 | |
| | 100,000 | | Schaeffler Holding Finance BV(b)(e) | | | 6.88 | % | 08/15/2018 | | | 132,684 | |
| | 100,000 | | Schaeffler Holding Finance BV(c)(e) | | | 6.88 | % | 08/15/2018 | | | 132,684 | |
| | 100,000 | | Telefonica Europe BV(d)(f) | | | 6.50 | % | Perpetual Maturity | | | 137,458 | |
| | | | | | | | | | | | 1,233,865 | |
See Notes to Financial Statements.
RiverNorth/Oaktree High Income Fund | Schedule of Investments |
| | |
| Principal Amount/Description | | Rate | Maturity | | Value | |
| Norway - 0.20% | | | | | | | |
| $ | 140,000 | | Albain Bidco Norway AS(b) | | | 6.75 | % | 11/01/2020 | | $ | 168,906 | |
| Spain - 0.31% | | | | | | | | | |
| | 110,000 | | Obrascon Huarte Lain SA | | | 4.75 | % | 03/15/2022 | | | 140,839 | |
| | 100,000 | | PortAventura Entertainment Barcelona BV(b) | | | 7.25 | % | 12/01/2020 | | | 128,832 | |
| | | | | | | | | | | | 269,671 | |
| United States - 25.35% | | | | | | | | | |
| | 195,000 | | Access MidStream Partners LP | | | 5.88 | % | 04/15/2021 | | | 206,700 | |
| | 260,000 | | ACCO Brands Corp. | | | 6.75 | % | 04/30/2020 | | | 270,400 | |
| | 70,000 | | Accudyne InduStries Borrower LLC(b) | | | 7.75 | % | 12/15/2020 | | | 72,975 | |
| | 225,000 | | ACI Worldwide, Inc.(b) | | | 6.38 | % | 08/15/2020 | | | 234,000 | |
| | 125,000 | | Alpha Natural Resources, Inc. | | | 6.00 | % | 06/01/2019 | | | 76,250 | |
| | 310,000 | | American Builders & Contractors Supply Co., Inc.(b) | | | 5.63 | % | 04/15/2021 | | | 304,575 | |
| | 165,000 | | AmeriGas Finance LLC / AmeriGas Finance Corp. | | | 7.00 | % | 05/20/2022 | | | 173,662 | |
| | 155,000 | | Amsurg Corp.(b) | | | 5.63 | % | 07/15/2022 | | | 154,225 | |
| | 270,000 | | Apex Tool Group LLC(b) | | | 7.00 | % | 02/01/2021 | | | 249,750 | |
| | 225,000 | | Ashtead Capital, Inc.(b) | | | 6.50 | % | 07/15/2022 | | | 239,625 | |
| | 165,000 | | Audatex North America, Inc.(b) | | | 6.00 | % | 06/15/2021 | | | 169,950 | |
| | 175,000 | | Berry Plastics Corp. | | | 5.50 | % | 05/15/2022 | | | 168,656 | |
| | 270,000 | | Biomet, Inc. | | | 6.50 | % | 10/01/2020 | | | 284,175 | |
| | 150,000 | | BlueLine Rental Finance Corp.(b) | | | 7.00 | % | 02/01/2019 | | | 154,500 | |
| | 320,000 | | Building Materials Corp. of America(b) | | | 6.75 | % | 05/01/2021 | | | 336,000 | |
| | 170,000 | | Cablevision Systems Corp. | | | 5.88 | % | 09/15/2022 | | | 165,112 | |
| | 160,000 | | California Resources Corp.(b) | | | 5.50 | % | 09/15/2021 | | | 162,600 | |
| | 130,000 | | Calpine Corp.(b) | | | 7.88 | % | 01/15/2023 | | | 142,675 | |
| | 10,000 | | Calpine Corp. | | | 5.38 | % | 01/15/2023 | | | 9,712 | |
| | 200,000 | | Carlson Travel Holdings, Inc.(b)(e' | | | 7.50 | % | 08/15/2019 | | | 202,500 | |
| | 100,000 | | CCO Holdings LLC / CCO Holdings Capital Corp. | | | 8.13 | % | 04/30/2020 | | | 105,875 | |
| | 125,000 | | CCO Holdings LLC / CCO Holdings Capital Corp. | | | 6.50 | % | 04/30/2021 | | | 130,781 | |
| | 100,000 | | Celanese US Holdings LLC | | | 3.25 | % | 10/15/2019 | | | 127,609 | |
| | 155,000 | | Cequel Communications Holdings I LLC / Cequel Capital Corp.(b) | | | 5.13 | % | 12/15/2021 | | | 149,187 | |
| | 110,000 | | Chesapeake Energy Corp. | | | 5.38 | % | 06/15/2021 | | | 113,162 | |
| | 355,000 | | CHS/Community Health Systems, Inc.(b) | | | 6.88 | % | 02/01/2022 | | | 371,862 | |
| | 135,000 | | CITGO Petroleum Corp.(b) | | | 6.25 | % | 08/15/2022 | | | 140,737 | |
| | 145,000 | | Cott Beverages, Inc.(b) | | | 5.38 | % | 07/01/2022 | | | 140,650 | |
| | 150,000 | | Crimson Merger Sub, Inc.(b) | | | 6.63 | % | 05/15/2022 | | | 136,875 | |
| | 140,000 | | Dana Holding Corp. | | | 5.38 | % | 09/15/2021 | | | 143,150 | |
See Notes to Financial Statements.
RiverNorth/Oaktree High Income Fund | Schedule of Investments |
| | |
| Principal Amount/Description | | Rate | Maturity | | Value | |
| $ | 145,000 | | DaVita Healthcare Partners, Inc. | | | 5.75 | % | 08/15/2022 | | $ | 150,800 | |
| | 285,000 | | DBP Holding Corp.(b) | | | 7.75 | % | 10/15/2020 | | | 250,800 | |
| | 280,000 | | Denali Borrower LLC / Denali Finance Corp.(b) | | | 5.63 | % | 10/15/2020 | | | 288,750 | |
| | 175,000 | | Denbury Resources, Inc. | | | 5.50 | % | 05/01/2022 | | | 173,906 | |
| | 220,000 | | DISH DBS Corp. | | | 5.88 | % | 07/15/2022 | | | 224,950 | |
| | 105,000 | | Endo Finance LLC(b) | | | 5.75 | % | 01/15/2022 | | | 103,950 | |
| | 45,000 | | Endo Finance LLC & Endo Finco, Inc.(b) | | | 7.25 | % | 01/15/2022 | | | 47,587 | |
| | 65,000 | | Energy XXI Gulf Coast, Inc.(b) | | | 6.88 | % | 03/15/2024 | | | 61,262 | |
| | 175,000 | | Envision Healthcare Corp.(b) | | | 5.13 | % | 07/01/2022 | | | 172,812 | |
| | 430,000 | | First Data Corp.(b) | | | 8.25 | % | 01/15/2021 | | | 457,950 | |
| | 115,000 | | Flexi-Van Leasing, Inc.(b) | | | 7.88 | % | 08/15/2018 | | | 120,462 | |
| | 295,000 | | Forum Energy Technologies, Inc. | | | 6.25 | % | 10/01/2021 | | | 304,587 | |
| | 115,000 | | Frontier Communications Corp. | | | 7.63 | % | 04/15/2024 | | | 119,887 | |
| | 190,000 | | Global Brass & Copper, Inc. | | | 9.50 | % | 06/01/2019 | | | 211,850 | |
| | 120,000 | | Halcon Resources Corp. | | | 9.75 | % | 07/15/2020 | | | 122,700 | |
| | 315,000 | | HCA Holdings, Inc. | | | 6.25 | % | 02/15/2021 | | | 330,750 | |
| | 315,000 | | HD Supply, Inc. | | | 7.50 | % | 07/15/2020 | | | 328,388 | |
| | 170,000 | | Hockey Merger Sub 2, Inc.(b) | | | 7.88 | % | 10/01/2021 | | | 174,888 | |
| | 150,000 | | Ingles Markets, Inc. | | | 5.75 | % | 06/15/2023 | | | 151,125 | |
| | 275,000 | | Intelsat Jackson Holdings SA | | | 7.50 | % | 04/01/2021 | | | 294,594 | |
| | 150,000 | | Intrepid Aviation Group Holdings LLC / Intrepid Finance Co.(b) | | | 6.88 | % | 02/15/2019 | | | 150,750 | |
| | 150,000 | | Isle of Capri Casinos, Inc. | | | 8.88 | % | 06/15/2020 | | | 160,125 | |
| | 125,000 | | Jarden Corp.(b) | | | 3.75 | % | 10/01/2021 | | | 160,645 | |
| | 105,000 | | JBS USA LLC / JBS USA Finance, Inc.(b) | | | 7.25 | % | 06/01/2021 | | | 110,775 | |
| | 190,000 | | JBS USA LLC / JBS USA Finance, Inc.(b) | | | 7.25 | % | 06/01/2021 | | | 200,450 | |
| | 15,000 | | Kinder Morgan, Inc.(b) | | | 5.00 | % | 02/15/2021 | | | 15,713 | |
| | 210,000 | | Kinetic Concepts, Inc. / KCI USA, Inc. | | | 10.50 | % | 11/01/2018 | | | 228,900 | |
| | 110,000 | | Kraton Polymers LLC / Kraton Polymers Capital Corp. | | | 6.75 | % | 03/01/2019 | | | 114,469 | |
| | 145,000 | | Level 3 Escrow II, Inc.(b) | | | 5.38 | % | 08/15/2022 | | | 143,188 | |
| | 55,000 | | Level 3 Financing, Inc.(b) | | | 6.13 | % | 01/15/2021 | | | 56,856 | |
| | 90,000 | | Level 3 Financing, Inc. | | | 7.00 | % | 06/01/2020 | | | 95,288 | |
| | 165,000 | | Levi Strauss & Co. | | | 6.88 | % | 05/01/2022 | | | 173,250 | |
| | 135,000 | | LIN Television Corp. | | | 6.38 | % | 01/15/2021 | | | 136,688 | |
| | 10,000 | | Linn Energy LLC / Linn Energy Finance Corp. | | | 6.50 | % | 05/15/2019 | | | 9,850 | |
| | 315,000 | | Linn Energy LLC / Linn Energy Finance Corp. | | | 6.25 | % | 11/01/2019 | | | 309,094 | |
| | 30,000 | | Linn Energy LLC / Linn Energy Finance Corp. | | | 6.50 | % | 09/15/2021 | | | 29,400 | |
| | 115,000 | | Meccanica Holdings USA, Inc.(b) | | | 6.25 | % | 07/15/2019 | | | 124,223 | |
| | 165,000 | | Memorial Resource Development Corp.(b) | | | 5.88 | % | 07/01/2022 | | | 161,700 | |
See Notes to Financial Statements.
RiverNorth/Oaktree High Income Fund | Schedule of Investments |
| | |
| Principal Amount/Description | | Rate | Maturity | | Value | |
| $ | 115,000 | | Michaels Stores, Inc.(b) | | | 5.88 | % | 12/15/2020 | | $ | 114,713 | |
| | 225,000 | | Milacron LLC / Mcron Finance Corp.(b) | | | 7.75 | % | 02/15/2021 | | | 237,938 | |
| | 150,000 | | Natural Resource Partners LP / NRP Finance Corp. | | | 9.13 | % | 10/01/2018 | | | 154,875 | |
| | 25,000 | | Neiman Marcus Group Ltd. LLC(b) | | | 8.00 | % | 10/15/2021 | | | 26,125 | |
| | 220,000 | | Neiman Marcus Group Ltd. LLC(b)(e' | | | 8.75 | % | 10/15/2021 | | | 232,650 | |
| | 240,000 | | Neuberger Berman Group LLC / Neuberger Berman Finance Corp.(b) | | | 5.88 | % | 03/15/2022 | | | 256,200 | |
| | 255,000 | | NRG Energy, Inc.(b) | | | 6.25 | % | 07/15/2022 | | | 262,809 | |
| | 80,000 | | NRG Energy, Inc. | | | 6.63 | % | 03/15/2023 | | | 83,000 | |
| | 115,000 | | Oasis Petroleum, Inc. | | | 6.88 | % | 03/15/2022 | | | 121,900 | |
| | 120,000 | | Oasis Petroleum, Inc. | | | 6.88 | % | 01/15/2023 | | | 126,900 | |
| | 230,000 | | Paragon Offshore PLC(b) | | | 6.75 | % | 07/15/2022 | | | 194,925 | |
| | 80,000 | | Penn Virginia Resource Partners LP / Penn Virginia Resource Finance Corp. | | | 6.50 | % | 05/15/2021 | | | 84,200 | |
| | 210,000 | | PHI, Inc. | | | 5.25 | % | 03/15/2019 | | | 211,838 | |
| | 290,000 | | Pinnacle Entertainment, Inc. | | | 6.38 | % | 08/01/2021 | | | 304,500 | |
| | 180,000 | | Pittsburgh Glass Works LLC(b) | | | 8.00 | % | 11/15/2018 | | | 191,700 | |
| | 100,000 | | Plastipak Holdings, Inc.(b) | | | 6.50 | % | 10/01/2021 | | | 102,000 | |
| | 148,000 | | Polymer Group, Inc. | | | 7.75 | % | 02/01/2019 | | | 153,920 | |
| | 115,000 | | Post Holdings, Inc.(b) | | | 6.00 | % | 12/15/2022 | | | 105,800 | |
| | 160,000 | | Prestige Brands, Inc.(b) | | | 5.38 | % | 12/15/2021 | | | 151,200 | |
| | 145,000 | | Regency Energy Partners LP / Regency Energy Finance Corp. | | | 5.88 | % | 03/01/2022 | | | 151,888 | |
| | 70,000 | | Rent-A-Center, Inc. | | | 6.63 | % | 11/15/2020 | | | 66,080 | |
| | 115,000 | | Reynolds Group Issuer, Inc. / Reynolds Group Issuer LLC | | | 8.25 | % | 02/15/2021 | | | 122,188 | |
| | 230,000 | | Reynolds Group Issuer, Inc. / Reynolds Group Issuer LLC | | | 5.75 | % | 10/15/2020 | | | 235,175 | |
| | 200,000 | | RJS Power Holdings LLC(b) | | | 5.13 | % | 07/15/2019 | | | 199,000 | |
| | 120,000 | | RR Donnelley & Sons Co. | | | 7.00 | % | 02/15/2022 | | | 127,200 | |
| | 105,000 | | RR Donnelley & Sons Co. | | | 6.00 | % | 04/01/2024 | | | 103,950 | |
| | 243,000 | | Sabine Pass Liquefaction LLC | | | 5.63 | % | 02/01/2021 | | | 250,898 | |
| | 175,000 | | Sally Holdings LLC / Sally Capital, Inc. | | | 5.75 | % | 06/01/2022 | | | 179,375 | |
| | 295,000 | | Scientific Games International, Inc. | | | 6.25 | % | 09/01/2020 | | | 247,800 | |
| | 205,000 | | Sequa Corp.(b) | | | 7.00 | % | 12/15/2017 | | | 178,863 | |
| | 195,000 | | Serta Simmons Holdings LLC(b) | | | 8.13 | % | 10/01/2020 | | | 206,700 | |
| | 140,000 | | Seventy Seven Energy, Inc.(b) | | | 6.50 | % | 07/15/2022 | | | 138,250 | |
| | 140,000 | | Sinclair Television Group, Inc. | | | 5.38 | % | 04/01/2021 | | | 138,600 | |
| | 55,000 | | Sinclair Television Group, Inc. | | | 6.38 | % | 11/01/2021 | | | 56,513 | |
| | 235,000 | | Six Flags Entertainment Corp. | | | 5.25 | % | 01/15/2021 | | | 229,125 | |
| | 110,000 | | Smithfield Foods, Inc. | | | 6.63 | % | 08/15/2022 | | | 116,600 | |
| | 120,000 | | Spectrum Brands, Inc. | | | 6.38 | % | 11/15/2020 | | | 125,700 | |
| | 230,000 | | Sprint Communications, Inc. | | | 6.00 | % | 11/15/2022 | | | 223,963 | |
See Notes to Financial Statements.
RiverNorth/Oaktree High Income Fund | Schedule of Investments |
| | September 30, 2014 (Unaudited) |
| Principal Amount/Description | | Rate | Maturity | | Value | |
| $ | 200,000 | | Sprint Corp.(b) | | | 7.25 | % | 09/15/2021 | | $ | 208,750 | |
| | 65,000 | | Steel Dynamics, Inc.(b) | | | 5.13 | % | 10/01/2021 | | | 65,975 | |
| | 60,000 | | Steel Dynamics, Inc.(b) | | | 5.50 | % | 10/01/2024 | | | 60,450 | |
| | 115,000 | | Stone Energy Corp. | | | 7.50 | % | 11/15/2022 | | | 119,060 | |
| | 229,000 | | Suburban Propane Partners LP / Suburban Energy Finance Corp. | | | 7.38 | % | 08/01/2021 | | | 243,885 | |
| | 225,000 | | Summit Materials LLC / Summit Materials Finance Corp. | | | 10.50 | % | 01/31/2020 | | | 249,750 | |
| | 50,000 | | SunCoke Energy Partners LP / SunCoke Energy Partners Finance Corp.(b) | | | 7.38 | % | 02/01/2020 | | | 52,750 | |
| | 115,000 | | Sungard Availability Services Capital, Inc.(b) | | | 8.75 | % | 04/01/2022 | | | 86,250 | |
| | 135,000 | | SunGard Data Systems, Inc. | | | 7.63 | % | 11/15/2020 | | | 141,750 | |
| | 220,000 | | Tempur Sealy International, Inc. | | | 6.88 | % | 12/15/2020 | | | 235,400 | |
| | 105,000 | | Tenet Healthcare Corp. | | | 6.00 | % | 10/01/2020 | | | 111,300 | |
| | 190,000 | | Tesoro Logistics LP / Tesoro Logistics Finance Corp. | | | 6.13 | % | 10/15/2021 | | | 197,125 | |
| | 135,000 | | The ADT Corp. | | | 6.25 | % | 10/15/2021 | | | 140,062 | |
| | 230,000 | | The Goodyear Tire & Rubber Co. | | | 6.50 | % | 03/01/2021 | | | 240,350 | |
| | 160,000 | | Time, Inc.(b) | | | 5.75 | % | 04/15/2022 | | | 153,600 | |
| | 15,000 | | T-Mobile USA, Inc. | | | 6.54 | % | 04/28/2020 | | | 15,431 | |
| | 40,000 | | T-Mobile USA, Inc. | | | 6.63 | % | 04/28/2021 | | | 41,150 | |
| | 120,000 | | T-Mobile USA, Inc. | | | 6.00 | % | 03/01/2023 | | | 120,300 | |
| | 160,000 | | T-Mobile USA, Inc. | | | 6.25 | % | 04/01/2021 | | | 162,200 | |
| | 100,000 | | TMS International Corp.(b) | | | 7.63 | % | 10/15/2021 | | | 105,000 | |
| | 25,000 | | Toys R Us Property Co. II LLC | | | 8.50 | % | 12/01/2017 | | | 25,313 | |
| | 115,000 | | Tronox Finance LLC | | | 6.38 | % | 08/15/2020 | | | 116,150 | |
| | 175,000 | | Univision Communications, Inc.(b) | | | 6.88 | % | 05/15/2019 | | | 182,875 | |
| | 165,000 | | Walter Investment Management Corp.(b) | | | 7.88 | % | 12/15/2021 | | | 163,350 | |
| | 155,000 | | West Corp.(b) | | | 5.38 | % | 07/15/2022 | | | 143,375 | |
| | 70,000 | | WindStream Corp. | | | 7.75 | % | 10/01/2021 | | | 74,900 | |
| | 105,000 | | WindStream Corp. | | | 7.50 | % | 04/01/2023 | | | 108,150 | |
90,000 WMG Acquisition Corp.(c) | | | 6.25 | % | 01/15/2021 | | | 119,086 | |
| | | | | | | | | | | | 21,710,090 | |
| | | | | | | | | | |
TOTAL HIGH YIELD DEBT (Cost $36,308,986) | | | | | | | | 35,708,955 | |
See Notes to Financial Statements.
RiverNorth/Oaktree High Income Fund | Schedule of Investments |
| | |
| Shares/Description | | Value | |
| SHORT-TERM INVESTMENTS - 5.18% | | | |
| | 4,439,626 | | State Street Institutional Trust (7 Day Yield 0.00%) | | $ | 4,439,626 | |
| | | | | |
TOTAL SHORT-TERM INVESTMENTS (Cost $4,439,626) | | | 4,439,626 | |
| | | | | |
TOTAL INVESTMENTS - 100.43% (Cost $87,483,601) | | | 86,007,862 | |
| CASH - 0.10% | | | 89,120 | |
| LIABILITIES IN EXCESS OF OTHER ASSETS - (0.53)% | | | (461,327 | ) |
| NET ASSETS - 100.00% | | $ | 85,635,655 | |
| (a) | All or a portion of this position has not settled as of September 30, 2014. The interest Rate shown represents the stated spread over the London Interbank Offered Rate ("LIBOR" or "L") or the Euro Interbank OfferdRate ("EURIBOR" or "E") or the applicable LIBOR/EURIBOR floor; the Fund will not accrue interest until the settlement date, at which point LIBOR/EURIBOR will be established. |
| (b) | Security exempt from regiStration under Rule 144A of the Securities Act of 1933. These securities have been deemed liquid under procedures approved by the Fund's Board of Trustees and may normally be sold to qualified institutional buyers in transactions exempt from registration. Total market Value of Rule 144A securities amounts to $16,906,733, which represents approximately 19.74%o of net assets as of September 30, 2014. |
| (c) | Securities were purchased pursuant to Regulation S under the Securities Act of 1933, which exempts securities offered and sold outside of the United States from regiStration. Such securities cannot be sold in the United States without either an effective regiStration statement filed pursuant to the Securities Act of 1933, or pursuant to an exemption from regiStration. These securities have been deemed liquid under procedures approved by the Fund's Board of Trustees. As of September 30, 2014, the aggregate market Value of those securities was $4,520,954, representing 5.28% of net assets. |
| (d) | Floating or variable Rate security. Interest Rate disclosed is that which is in effect at September 30, 2014. |
| (e) | Pay-in-kind securities. |
| (f) | This security has no contractual Maturity date, is not redeemable and contractually pays an indefinite Stream of interest. |
See Notes to Financial Statements.
RiverNorth/Oaktree High Income Fund | Schedule of Investments |
| | |
Common Abbreviations:
AG - Aktiengesellschaft is a German term that refers to a corporation that is limited by shares, i.e.,owned by shareholders.
AS - Anonim Sirket is the Turkish term for Incorporation.
BV - Besloten Vennootschap a Dutch private limited liability company.
GmbH - Gesellschaft mit beschrankter Haftung is the German term for a company with limited liability.
KG - Kommanditgesellschaft is the German term for a private limited company.
LLC - Limited Liability Corp.
LP - Limited Partnership.
Ltd. - Limited.
NV - Naamloze Vennootschap is the Dutch term for a public limited liability corporation.
PLC - Public Limited Co.
Pty. - Proprietary.
SA - Generally designates corporations in various countries, mostly those employing the civil law.
S.A.R.L. - Société Anonyme à Responsabilité Limitée (French: Limited Liability Company)
SAS - Societe per actions simplifiee is the French term for a joint stock company.
SCA- Societe en commandite pe actiuni is the Romanian term for limited liability partnership.
SpA - Societa per Azioni.
S.r.l. - Società a Responsabilità Limitata (Italian: limited company)
OUTSTANDING FORWARD FOREIGN CURRENCY CONTRACTS
| Counterparty | Foreign Currency | | Contracted Amount* | | Contract Type | Settlement Date | | Current Value | | | Unrealized Appreciation | |
| State Street Boston | EUR | | 8,892,350 | | Sale | 10/07/2014 | | $ | 11,231,970 | | | $ | 344,186 | |
| State Street Boston | GBP | | 1,828,446 | | Sale | 10/07/2014 | | | 2,964,021 | | | | 36,787 | |
| | | | | | | | | | | | | $ | 380,973 | |
| * | The contracted amount is stated in the currency in which the security is denominated. |
Currency Abbreviations:
EUR - Euro
GBP - British Pound Sterling
See Notes to Financial Statements.
RiverNorth Managed Volatility Fund | Schedule of Investments |
| | |
| Shares/Description | | Value | |
| COMMON STOCKS - 8.75% | | | |
| Apparel - 0.52% | | | |
| | 1,000 | | Deckers Outdoor Corp.(a)(b) | | $ | 97,180 | |
| Beverages -0.32% | | | | |
| | 1,400 | | The Coca-Cola Co.(b) | | | 59,724 | |
| Coal - 0.19% | | | | |
| | 16,690 | | Arch Coal, Inc.(b) | | | 35,383 | |
| Computers -1.44% | | | | |
| | 2,100 | | Apple, Inc.(b) | | | 211,575 | |
| | 2,000 | | EMC Corp.(b) | | | 58,520 | |
| | | | | | | 270,095 | |
| Engineering & Construction - 0.15% | | | | |
| | 500 | | Chicago Bridge & Iron Co. NV(b) | | | 28,925 | |
| Food - 0.37% | | | | |
| | 1,650 | | Campbell Soup Co.(b) | | | 70,504 | |
| Gas - 0.22% | | | | |
| | 1,000 | | NiSource, Inc.(b) | | | 40,980 | |
| Internet -1.60% | | | | |
| | 200 | | Amazon.com, Inc.(a)(b) | | | 64,488 | |
| | 800 | | Rackspace Hosting, Inc.(a)(b) | | | 26,040 | |
| | 1,200 | | SINA Corp.(a) | | | 49,368 | |
| | 1,100 | | TIBCO Software, Inc.(a)(b) | | | 25,993 | |
| | 3,300 | | Yahoo!, Inc.(a)(b) | | | 134,475 | |
| | | | | | | 300,364 | |
| Mining - 0.51% | | | | |
| | 2,000 | | Cameco Corp. | | | 35,320 | |
| | 3,200 | | Teck Resources Ltd. - Class B | | | 60,448 | |
| | | | | | | 95,768 | |
| Oil & Gas -1.02% | | | | |
| | 2,500 | | ConocoPhiNips(b) | | | 191,300 | |
| Pharmaceuticals - 0.38% | | | | |
| | 1,000 | | AStraZeneca PLC - Sponsored ADR(b) | | | 71,440 | |
| Semiconductors - 0.92% | | | | |
| | 5,000 | | Intel Corp.(b) | | | 174,100 | |
| Software - 0.58% | | | | |
| | 300 | | Autodesk, Inc.(a) | | | 16,530 | |
| | 2,000 | | Microsoft Corp. | | | 92,720 | |
| | | | | | | 109,250 | |
See Notes to Financial Statements.
RiverNorth Managed Volatility Fund | Schedule of Investments |
| | |
| Shares/Description | | Value | |
| Telecommunications - 0.53% | | | |
| | 2,000 | | Verizon Communications, Inc. | | $ | 99,980 | |
| | | | | |
TOTAL COMMON STOCKS (Cost $1,652,991) | | | 1,644,993 | |
| EXCHANGE-TRADED FUNDS - 15.01% | | | | |
| | 900 | | Energy Select Sector SPDR® Fund(b) | | | 81,558 | |
| | 12,900 | | Financial Select Sector SPDR® Fund | | | 298,893 | |
| | 4,056 | | InduStrial Select Sector SPDR® Fund | | | 215,577 | |
| | 7,400 | | iShares® Russell 2000® ETF(b) | | | 809,190 | |
| | 34,700 | | Market Vectors® Gold Miners ETF(b) | | | 741,088 | |
| | 300 | | SPDR® S&P 500® ETF Trust(b) | | | 59,106 | |
| | 2,000 | | SPDR® S&P Oil & Gas Exploration & Production ETF(b) | | | 137,660 | |
| | 12,648 | | SPDR® S&P Regional Banking ETF(b) | | | 478,853 | |
| | | | | | | | |
TOTAL EXCHANGE-TRADED FUNDS (Cost $2,944,794) | | | 2,821,925 | |
| Number of Contracts | | Description | | Exercise Price | | Expiration Date | | Value | |
| PURCHASED OPTIONS - 1.30% | | | | | | | |
| Purchased Call Options - 0.59% | | | | | | | |
| | 50 | | Akamai Technologies, Inc. | | $ | 62.50 | | 11/22/2014 | | | 9,900 | |
| | 21 | | Apple, Inc. | | | 95.00 | | 04/17/2015 | | | 21,368 | |
| | 35 | | Chevron Corp. | | | 135.00 | | 12/20/2014 | | | 577 | |
| | 100 | | Cisco Systems, Inc. | | | 25.00 | | 01/17/2015 | | | 10,700 | |
| | 5 | | Deere & Co. | | | 87.50 | | 12/20/2014 | | | 395 | |
| | 10 | | DISH Network Corp. | | | 75.00 | | 12/20/2014 | | | 850 | |
| | 20 | | Energy Select Sector SPDR® Fund | | | 110.00 | | 01/17/2015 | | | 120 | |
| | 50 | | General Electric Co. | | | 26.00 | | 10/18/2014 | | | 1,150 | |
| | 25 | | InduStrial Select Sector SPDR® Fund | | | 56.00 | | 12/20/2014 | | | 763 | |
| | 10 | | International Business Machines Corp. | | | 195.00 | | 10/18/2014 | | | 1,410 | |
| | 14 | | JC Penney Co., Inc. | | | 10.00 | | 11/22/2014 | | | 1,225 | |
| | 14 | | Juniper Networks, Inc. | | | 24.00 | | 01/17/2015 | | | 777 | |
| | 20 | | Lennar Corp. | | | 43.00 | | 11/22/2014 | | | 760 | |
| | 20 | | Macy's, Inc. | | | 60.00 | | 11/22/2014 | | | 2,620 | |
| | 18 | | NCR Corp. | | | 33.00 | | 10/18/2014 | | | 1,980 | |
| | 100 | | Newmont Mining Corp. | | | 26.00 | | 10/18/2014 | | | 400 | |
| | 25 | | Peabody Energy Corp. | | | 18.00 | | 12/20/2014 | | | 87 | |
| | 58 | | Red Hat, Inc. | | | 65.00 | | 12/20/2014 | | | 3,045 | |
| | 100 | | Tenaris SA | | | 50.00 | | 12/20/2014 | | | 4,000 | |
| | 14 | | The Coca-Cola Co. | | | 41.00 | | 10/18/2014 | | | 2,534 | |
See Notes to Financial Statements.
RiverNorth Managed Volatility Fund | Schedule of Investments |
| | |
| Number of Contracts | | Description | | Exercise Price | | Expiration Date | | Value | |
| | 20 | | The Interpublic Group of Cos, Inc. | | $ | 19.00 | | 10/18/2014 | | $ | 700 | |
| | 70 | | The Kroger Co. | | | 48.00 | | 10/18/2014 | | | 28,350 | |
| | 44 | | Wells Fargo & Co. | | | 52.50 | | 10/18/2014 | | | 2,244 | |
| | 80 | | Wells Fargo & Co. | | | 55.00 | | 10/18/2014 | | | 400 | |
| | 96 | | Yahoo!, Inc. | | | 40.00 | | 10/18/2014 | | | 14,832 | |
| | 100 | | Yahoo!, Inc. | | | 50.00 | | 10/18/2014 | | | 350 | |
| | | | | | | | | | | | | |
TOTAL PURCHASED CALL OPTIONS (Cost $137,552) | | | | | | | | 111,537 | |
| | | | | | | | | | |
| Purchased Put Options - 0.71% | | | | | | | | | |
| | 50 | | American International Group, Inc. | | | 52.50 | | 11/22/2014 | | | 4,775 | |
| | 30 | | SPDR® S&P 500® ETF Trust | | | 199.00 | | 10/03/2014 | | | 6,945 | |
| | 20 | | SPDR® S&P 500® ETF Trust | | | 196.00 | | 10/18/2014 | | | 4,180 | |
| | 60 | | SPDR® S&P 500® ETF Trust | | | 197.00 | | 10/18/2014 | | | 14,640 | |
| | 15 | | SPDR® S&P 500® ETF Trust | | | 199.00 | | 10/18/2014 | | | 5,040 | |
| | 40 | | SPDR® S&P 500® ETF Trust | | | 200.00 | | 10/18/2014 | | | 15,760 | |
| | 100 | | SPDR® S&P 500® ETF Trust | | | 201.00 | | 10/18/2014 | | | 46,150 | |
| | 80 | | SPDR® S&P 500® ETF Trust | | | 190.00 | | 11/22/2014 | | | 17,840 | |
| | 20 | | SPDR® S&P 500® ETF Trust | | | 196.00 | | 11/22/2014 | | | 7,650 | |
| | 67 | | Xilinx, Inc. | | | 41.00 | | 12/20/2014 | | | 9,447 | |
| | | | | | | | | | |
TOTAL PURCHASED PUT OPTIONS (Cost $98,525) | | | | | | | | 132,427 | |
| | | | | | | | | | |
TOTAL PURCHASED OPTIONS (Cost $236,077) | | | | | | | | 243,964 | |
| Shares/Description | | Value | |
| SHORT-TERM INVESTMENTS - 61.32% | | | |
| | 11,529,893 | | State Street Institutional Trust (7 Day Yield 0.00%) | | | 11,529,893 | |
| | | | | |
TOTAL SHORT-TERM INVESTMENTS (Cost $11,529,893) | | | 11,529,893 | |
| | | | | |
TOTAL INVESTMENTS - 86.38% (Cost $16,363,755) | | | 16,240,775 | |
| CASH HELD AS COLLATERAL FOR WRITTEN OPTIONS - 14.43% | | | 2,712,788 | |
| LIABILITIES IN EXCESS OF OTHER ASSETS - (0.81)% | | | (152,838 | ) |
| NET ASSETS - 100.00% | | $ | 18,800,725 | |
See Notes to Financial Statements.
RiverNorth Managed Volatility Fund | Schedule of Investments |
| | |
(a) | Non-income producing security. |
| (b) | All or a portion of this .security may be .subject to written call options. |
Common Abbreviations:
ADR - American Depositary Receipt.
ETF - Exchange-Traded Fund.
Ltd. - Limited.
MSCI - Morgan Stanley Capital International.
NV - Naamloze Vennootschap is the Dutch term for a public limited liability corporation.
PLC - Public Limited Co.
SA - Generally designates corporations in various countries, mostly those employing the civil law. S&P - Standard and Poor's.
SPDR - Standard and Poor's Depositary Receipt.
SCHEDULE OF WRITTEN OPTIONS
Number of Contracts | | Description | | Exercise Price | | Expiration Date | | Value | |
| Written Call Options | | | | | | | |
| | (2 | ) | Amazon.com, Inc. | | $ | 350.00 | | 10/18/2014 | | $ | (112 | ) |
| | (42 | ) | Apple, Inc. | | | 120.00 | | 01/15/2016 | | | (23,205 | ) |
| | (6 | ) | Arch Coal, Inc. | | | 4.00 | | 10/18/2014 | | | (9 | ) |
| | (26 | ) | Arch Coal, Inc. | | | 6.00 | | 10/18/2014 | | | (26 | ) |
| | (10 | ) | AStraZeneca PLC - Sponsored ADR | | | 75.00 | | 10/18/2014 | | | (750 | ) |
| | (3 | ) | Autodesk, Inc. | | | 62.50 | | 11/22/2014 | | | (271 | ) |
| | (10 | ) | Campbell Soup Co. | | | 44.00 | | 10/18/2014 | | | (150 | ) |
| | (5 | ) | Chicago Bridge & Iron Co. NV | | | 65.00 | | 11/22/2014 | | | (312 | ) |
| | (25 | ) | ConocoPhillips | | | 87.50 | | 11/22/2014 | | | (238 | ) |
| | (10 | ) | Deckers Outdoor Corp. | | | 100.00 | | 10/18/2014 | | | (1,425 | ) |
| | (20 | ) | EMC Corp. | | | 31.00 | | 01/17/2015 | | | (1,880 | ) |
| | (9 | ) | Energy Select Sector SPDR® Fund | | | 93.00 | | 10/18/2014 | | | (513 | ) |
| | (50 | ) | Intel Corp. | | | 33.00 | | 10/18/2014 | | | (10,700 | ) |
| | (64 | ) | iShares® Russell 2000® ETF | | | 113.50 | | 10/18/2014 | | | (2,080 | ) |
| | (10 | ) | Macy's, Inc. | | | 65.00 | | 10/18/2014 | | | (30 | ) |
| | (86 | ) | Market Vectors® Gold Miners ETF | | | 25.00 | | 12/20/2014 | | | (2,580 | ) |
| | (15 | ) | Market Vectors® Gold Miners ETF | | | 33.00 | | 01/15/2016 | | | (998 | ) |
| | (18 | ) | NCR Corp. | | | 35.00 | | 10/18/2014 | | | (540 | ) |
| | (10 | ) | NiSource, Inc. | | | 40.00 | | 10/18/2014 | | | (1,350 | ) |
| | (4 | ) | Rackspace Hosting, Inc. | | | 35.00 | | 10/18/2014 | | | (120 | ) |
| | (29 | ) | SPDR® S&P 500® ETF Trust | | | 192.00 | | 12/20/2014 | | | (24,636 | ) |
| | (20 | ) | SPDR® S&P Oil & Gas Exploration & Production ETF | | | 74.00 | | 10/18/2014 | | | (550 | ) |
| | (50 | ) | SPDR® S&P Regional Banking ETF | | | 41.00 | | 10/18/2014 | | | (150 | ) |
| | (28 | ) | The Coca-Cola Co. | | | 43.00 | | 10/18/2014 | | | (1,092 | ) |
| | (60 | ) | The Kroger Co. | | | 52.50 | | 10/18/2014 | | | (3,000 | ) |
| | (11 | ) | TIBCO Software, Inc. | | | 21.00 | | 10/18/2014 | | | (2,943 | ) |
| | (5 | ) | Yahoo!, Inc. | | | 44.00 | | 10/18/2014 | | | (132 | ) |
| | (212 | ) | Yahoo!, Inc. | | | 45.00 | | 10/18/2014 | | | (3,604 | ) |
See Notes to Financial Statements.
RiverNorth Managed Volatility Fund | Schedule of Investments |
| | September 30, 2014 |
| Number of Contracts | | Description | | Exercise Price | | Expiration Date | | Value | |
| | (12 | ) | Yahoo!, Inc. | | $ | 46.00 | | 01/17/2015 | | $ | (1,476 | ) |
| | | | | | | | | | | | | |
| Total Written Call Options (Premiums received $86,625) | | $ | (84,872 | ) |
| | | | | |
| Written Put Options | | | | | | | | | |
| | (50 | ) | American International Group, Inc. | | | 52.50 | | 10/31/2014 | | | (2,850 | ) |
| | (6 | ) | Anadarko Petroleum Corp. | | | 105.00 | | 10/18/2014 | | | (3,150 | ) |
| | (5 | ) | ANN, Inc. | | | 38.00 | | 10/18/2014 | | | (100 | ) |
| | (10 | ) | ANN, Inc. | | | 40.00 | | 10/18/2014 | | | (625 | ) |
| | (6 | ) | Autodesk, Inc. | | | 50.00 | | 10/18/2014 | | | (309 | ) |
| | (3 | ) | Autodesk, Inc. | | | 50.00 | | 11/22/2014 | | | (359 | ) |
| | (42 | ) | Cliffs Natural Resources, Inc. | | | 11.00 | | 10/18/2014 | | | (4,389 | ) |
| | (120 | ) | Consumer Staples Select Sector SPDR® Fund | | | 44.00 | | 12/20/2014 | | | (8,280 | ) |
| | (50 | ) | Energy Select Sector SPDR® Fund | | | 89.00 | | 10/18/2014 | | | (4,950 | ) |
| | (50 | ) | Energy Select Sector SPDR® Fund | | | 89.00 | | 11/22/2014 | | | (10,100 | ) |
| | (3 | ) | Gilead Sciences, Inc. | | | 100.00 | | 10/18/2014 | | | (372 | ) |
| | (15 | ) | Hertz Global Holdings, Inc. | | | 26.00 | | 10/18/2014 | | | (1,875 | ) |
| | (30 | ) | iShares® MSCI® Brazil Capped ETF | | | 41.00 | | 10/18/2014 | | | (1,920 | ) |
| | (180 | ) | iShares® MSCI® Brazil Capped ETF | | | 43.00 | | 10/18/2014 | | | (24,930 | ) |
| | (84 | ) | iShares® Russell 2000® ETF | | | 108.00 | | 10/18/2014 | | | (12,180 | ) |
| | (45 | ) | iShares® Russell 2000® ETF | | | 110.00 | | 10/18/2014 | | | (10,102 | ) |
| | (60 | ) | iShares® Russell 2000® ETF | | | 111.00 | | 10/18/2014 | | | (16,590 | ) |
| | (240 | ) | iShares® Russell 2000® ETF | | | 112.00 | | 10/18/2014 | | | (81,240 | ) |
| | (105 | ) | iShares® Russell 2000® ETF | | | 113.00 | | 10/18/2014 | | | (43,155 | ) |
| | (200 | ) | iShares® Russell 2000® ETF | | | 105.00 | | 11/22/2014 | | | (38,800 | ) |
| | (86 | ) | Market Vectors® Gold Miners ETF | | | 20.50 | | 12/20/2014 | | | (6,923 | ) |
| | (120 | ) | Market Vectors® Oil Service ETF | | | 51.00 | | 10/03/2014 | | | (17,700 | ) |
| | (124 | ) | Market Vectors® Oil Service ETF | | | 52.00 | | 10/18/2014 | | | (32,550 | ) |
| | (5 | ) | McDonald's Corp. | | | 94.00 | | 10/18/2014 | | | (503 | ) |
| | (10 | ) | Molson Coors Brewing Co. | | | 65.00 | | 10/18/2014 | | | (50 | ) |
| | (10 | ) | Mylan, Inc. | | | 40.00 | | 10/18/2014 | | | (75 | ) |
| | (15 | ) | NRG Energy, Inc. | | | 27.00 | | 12/20/2014 | | | (712 | ) |
| | (25 | ) | Peabody Energy Corp. | | | 15.00 | | 10/18/2014 | | | (6,762 | ) |
| | (10 | ) | Petroleo Brasileiro SA | | | 14.50 | | 10/03/2014 | | | (590 | ) |
| | (20 | ) | Petroleo Brasileiro SA | | | 13.00 | | 11/22/2014 | | | (2,060 | ) |
| | (11 | ) | Petroleo Brasileiro SA | | | 16.00 | | 11/22/2014 | | | (3,108 | ) |
| | (10 | ) | QUALCOMM, Inc. | | | 65.00 | | 10/18/2014 | | | (55 | ) |
| | (10 | ) | QUALCOMM, Inc. | | | 67.50 | | 10/18/2014 | | | (100 | ) |
| | (10 | ) | Spansion, Inc. | | | 20.00 | | 10/18/2014 | | | (400 | ) |
| | (30 | ) | SPDR® S&P Oil & Gas Exploration & Production ETF | | | 66.50 | | 10/18/2014 | | | (2,865 | ) |
| | (50 | ) | SPDR® S&P Regional Banking ETF | | | 39.00 | | 10/18/2014 | | | (6,725 | ) |
| | (10 | ) | Sysco Corp. | | | 36.00 | | 10/18/2014 | | | (425 | ) |
| | (10 | ) | United Continental Holdings, Inc. | | | 42.00 | | 12/20/2014 | | | (1,805 | ) |
See Notes to Financial Statements.
RiverNorth Managed Volatility Fund | Schedule of Investments |
| | September 30, 2014 |
Number of Contracts | | Description | | Exercise Price | | Expiration Date | | Value | |
| | (25 | ) | Utilities Select Sector SPDR® Fund | | $ | 41.00 | | 10/18/2014 | | $ | (462 | ) |
| | (134 | ) | Xilinx, Inc. | | | 40.00 | | 10/18/2014 | | | (5,963 | ) |
| | (20 | ) | Xilinx, Inc. | | | 38.00 | | 12/20/2014 | | | (1,170 | ) |
| | | | | | | | | | | | | |
| Total Written Put Options (Premiums received $214,522) | | $ | (357,279 | ) |
| | | | | |
| Total Written Options (Premiums received $301,147) | | $ | (442,151 | ) |
See Notes to Financial Statements.
RiverNorth Core Opportunity Fund | |
| Statement of Assets and Liabilities | September 30, 2014 |
ASSETS: | | | |
Investment in securities: | | | |
At cost | | $ | 678,929,148 | |
At value | | $ | 747,642,489 | |
Dividends receivable | | | 1,147,460 | |
Receivable for fund shares sold | | | 1,042,571 | |
Receivable for fund investments sold | | | 139,955 | |
Prepaid expenses and other assets | | | 44,593 | |
| Total Assets | | | 750,017,068 | |
LIABILITIES: | | | | |
Facility loan fee payable | | | 8,019 | |
Payable for fund investments purchased | | | 3,787,623 | |
Payable for fund shares redeemed | | | 380,806 | |
Payable to Adviser | | | 618,225 | |
Payable for Fund Accounting and Administration fees | | | 49,819 | |
Accrued 12b-1 fees - Class R Shares | | | 149,575 | |
Payable for Custodian fees | | | 25,655 | |
Payable for Audit fees | | | 18,865 | |
Payable to Transfer agency | | | 5,754 | |
Payable to Trustees and Officers | | | 4,049 | |
Other accrued expenses | | | 47,068 | |
| Total Liabilities | | | 5,095,458 | |
| Net Assets | | $ | 744,921,610 | |
NET ASSETS CONSIST OF: | | | | |
Paid-in capital | | $ | 615,414,311 | |
Accumulated net investment income | | | 12,332,698 | |
Accumulated net realized gain on investments | | | 48,461,260 | |
Net unrealized appreciation on investments | | | 68,713,341 | |
| | $ | 744,921,610 | |
PRICING OF SHARES: | | | | |
Class I Shares(a) | | | | |
Net Assets | | $ | 39,622,563 | |
Shares of beneficial interest outstanding (unlimited number of shares, no par Value) | | | 3,034,928 | |
Net Asset Value Per Share, Offering and Redemption Price Per Share | | $ | 13.06 | |
Minimum Redemption Price Per Share(b) | | $ | 12.80 | |
Class R Shares | | | | |
Net Assets | | $ | 705,299,047 | |
Shares of beneficial interest outstanding (unlimited number of shares, no par Value) | | | 54,039,428 | |
Net Asset Value Per Share, Offering and Redemption Price Per Share | | $ | 13.05 | |
Minimum Redemption Price Per Share(b) | | $ | 12.79 | |
See Notes to Financial Statements.
RiverNorth Core Opportunity Fund | |
| Statement of Assets and Liabilities | September 30, 2014 |
(a) | Commenced operations on August 11, 2014. |
| (b) | The Fund will impose a 2.00% redemption fee on shares redeemed within 90 days of purchase. |
See Notes to Financial Statements.
RiverNorth/DoubleLine Strategic Income Fund | |
| Statement of Assets and Liabilities | September 30, 2014 |
ASSETS: | | | |
Investment in securities: | | | |
At cost | | $ | 1,356,280,502 | |
At value | | $ | 1,368,814,316 | |
Receivable for fund shares sold | | | 7,976,321 | |
Interest receivable | | | 3,982,573 | |
Receivable for fund investments sold | | | 2,148,523 | |
Dividends receivable | | | 1,864,974 | |
Prepaid expenses and other assets | | | 72,238 | |
| Total Assets | | | 1,384,858,945 | |
LIABILITIES: | | | | |
Facility loan fee payable | | | 14,072 | |
Payable for fund investments purchased | | | 1,763,992 | |
Payable for fund shares redeemed | | | 917,819 | |
Payable to Adviser | | | 835,702 | |
Payable for Fund Accounting and Administration fees | | | 122,986 | |
Accrued 12b-1 fees - Class R Shares | | | 63,660 | |
Payable for Custodian fees | | | 48,382 | |
Payable for Audit fees | | | 22,765 | |
Payable to Transfer agency | | | 29,854 | |
Payable to Trustees and Officers | | | 7,893 | |
Other accrued expenses | | | 96,310 | |
| Total Liabilities | | | 3,923,435 | |
| Net Assets | | $ | 1,380,935,510 | |
NET ASSETS CONSIST OF: | | | | |
Paid-in capital | | $ | 1,375,363,859 | |
Accumulated net investment income | | | 259,043 | |
Accumulated net realized loss on investments | | | (7,221,206 | ) |
Net unrealized appreciation on investments | | | 12,533,814 | |
| Net Assets | | $ | 1,380,935,510 | |
See Notes to Financial Statements.
RiverNorth/DoubleLine Strategic Income Fund | |
| Statement of Assets and Liabilities | September 30, 2014 |
PRICING OF SHARES: | | | |
| Class I Shares | | | |
Net Assets | | $ | 1,148,744,415 | |
Shares of beneficial interest outstanding (unlimited number of shares, no par Value) | | | 105,626,096 | |
Net Asset Value Per Share, Offering and Redemption Price Per Share | | $ | 10.88 | |
Minimum Redemption Price Per Share(a) | | $ | 10.66 | |
| Class R Shares | | | | |
Net Assets | | $ | 232,191,095 | |
Shares of beneficial interest outstanding (unlimited number of shares, no par Value) | | | 21,324,599 | |
Net Asset Value Per Share, Offering and Redemption Price Per Share | | $ | 10.89 | |
Minimum Redemption Price Per Share(a) | | $ | 10.67 | |
(a) | The Fund will impose a 2.00% redemption fee on shares redeemed within 90 days of purchase. |
See Notes to Financial Statements.
RiverNorth Equity Opportunity Fund | |
| Statement of Assets and Liabilities | September 30, 2014 |
ASSETS: | | | |
Investment in securities: | | | |
At cost | | $ | 9,766,954 | |
At value | | $ | 10,488,175 | |
Receivable for fund shares sold | | | 256,500 | |
Dividends receivable | | | 15,951 | |
Prepaid expenses and other assets | | | 16,947 | |
| Total Assets | | | 10,777,573 | |
LIABILITIES: | | | | |
Facility loan fee payable | | | 115 | |
Payable to Adviser | | | 3,643 | |
Payable for Fund Accounting and Administration fees | | | 962 | |
Accrued 12b-1 fees - Class R Shares | | | 1,805 | |
Payable for Custodian fees | | | 4,941 | |
Payable for Audit fees | | | 17,765 | |
Payable to Transfer agency | | | 2,574 | |
Payable to Trustees and Officers | | | 39 | |
Other accrued expenses | | | 850 | |
| Total Liabilities | | | 32,694 | |
| Net Assets | | $ | 10,744,879 | |
NET ASSETS CONSIST OF: | | | | |
Paid-in capital | | $ | 8,381,831 | |
Accumulated net realized gain on investments | | | 1,641,827 | |
Net unrealized appreciation on investments | | | 721,221 | |
| | $ | 10,744,879 | |
PRICING OF SHARES: | | | | |
| Class I Shares | | | | |
Net Assets | | $ | 1,924,719 | |
Shares of beneficial interest outstanding (unlimited number of shares, no par Value) | | | 158,387 | |
| Net Asset Value Per Share, Offering and Redemption Price Per Share | | $ | 12.15 | |
Minimum Redemption Price Per Share(a) | | $ | 11.91 | |
| Class R Shares | | | | |
Net Assets | | $ | 8,820,160 | |
Shares of beneficial interest outstanding (unlimited number of shares, no par Value) | | | 725,999 | |
Net Asset Value Per Share, Offering and Redemption Price Per Share | | $ | 12.15 | |
Minimum Redemption Price Per Share(a) | | $ | 11.91 | |
| (a) | The Fund will impose a 2.00% redemption fee on shares redeemed within 90 days of purchase. |
See Notes to Financial Statements.
RiverNorth/Oaktree High Income Fund | |
| Statement of Assets and Liabilities | September 30, 2014 |
ASSETS: | | | |
Investment in securities: | | | |
At cost | | $ | 87,483,601 | |
At Value | | $ | 86,007,862 | |
Cash | | | 89,120 | |
Foreign currency, at Value (Cost $236,604) | | | 228,354 | |
Receivable for fund investments sold | | | 2,661,637 | |
Interest receivable | | | 763,555 | |
Unrealized appreciation on forward foreign currency contracts | | | 380,973 | |
Dividends receivable | | | 40,930 | |
Receivable for fund shares sold | | | 36,168 | |
Prepaid expenses and other assets | | | 9,293 | |
| Total Assets | | | 90,217,892 | |
LIABILITIES: | | | | |
Facility loan fee payable | | | 938 | |
Payable for fund investments purchased | | | 4,382,746 | |
Payable for fund shares redeemed | | | 69,316 | |
Payable to Adviser | | | 56,112 | |
Payable for Fund Accounting and Administration fees | | | 17,279 | |
Accrued 12b-1 fees - Class R Shares | | | 4,889 | |
Payable for Custodian fees | | | 15,184 | |
Payable for Audit fees | | | 22,765 | |
Payable to Transfer agency | | | 3,784 | |
Payable to Trustees and Officers | | | 518 | |
Other accrued expenses | | | 8,706 | |
| Total Liabilities | | | 4,582,237 | |
| Net Assets | | $ | 85,635,655 | |
NET ASSETS CONSIST OF: | | | | |
Paid-in capital | | $ | 84,797,469 | |
Accumulated net investment income | | | 324,092 | |
Accumulated net realized gain on investments and forward foreign currency contracts | | | 1,479,733 | |
Net unrealized depreciation on investments | | | (965,639 | ) |
Net Assets | | $ | 85,635,655 | |
See Notes to Financial Statements.
RiverNorth/Oaktree High Income Fund | |
| Statement of Assets and Liabilities | September 30, 2014 |
PRICING OF SHARES: | | | |
| Class I Shares | | | |
Net Assets | | $ | 69,473,025 | |
Shares of beneficial interest outstanding (unlimited number of shares, no par Value) | | | 6,779,834 | |
| Net Asset Value Per Share, Offering and Redemption Price Per Share | | $ | 10.25 | |
Minimum Redemption Price Per Share(a) | | $ | 10.05 | |
| Class R Shares | | | | |
Net Assets | | $ | 16,162,630 | |
Shares of beneficial interest outstanding (unlimited number of shares, no par Value) | | | 1,578,295 | |
Net Asset Value Per Share, Offering and Redemption Price Per Share | | $ | 10.24 | |
Minimum Redemption Price Per Share(a) | | $ | 10.04 | |
| (a) | The Fund will impose a 2.00% redemption fee on shares redeemed within 90 days of purchase. |
See Notes to Financial Statements.
RiverNorth Managed Volatility Fund | |
| Statement of Assets and Liabilities | September 30, 2014 |
ASSETS: | | | |
Investment in securities: | | | |
At cost | | $ | 16,363,755 | |
At value | | $ | 16,240,775 | |
Cash held as collateral for written options | | | 2,712,788 | |
Deposit with broker for written options | | | 624,393 | |
Receivable for fund investments sold | | | 555,915 | |
Dividends receivable | | | 3,440 | |
Receivable for fund shares sold | | | 3,240 | |
Prepaid expenses and other assets | | | 15,105 | |
| Total Assets | | | 20,155,656 | |
LIABILITIES: | | | | |
Facility loan fee payable | | | 189 | |
Written options, at Value (Premiums received $301,147) | | | 442,151 | |
Payable for fund investments purchased | | | 864,093 | |
Payable to Adviser | | | 12,857 | |
Payable for Fund Accounting and Administration fees | | | 2,667 | |
Accrued 12b-1 fees | | | 3,838 | |
Payable for Custodian fees | | | 5,429 | |
Payable for Audit fees | | | 19,765 | |
Payable to Trustees and Officers | | | 83 | |
Other accrued expenses | | | 3,859 | |
| Total Liabilities | | | 1,354,931 | |
| Net Assets | | $ | 18,800,725 | |
NET ASSETS CONSIST OF: | | | | |
Paid-in capital | | $ | 18,143,573 | |
Accumulated net realized gain on investments, securities sold short and written options | | | 921,136 | |
Net unrealized depreciation on investments and written options | | | (263,984 | ) |
Net Assets | | $ | 18,800,725 | |
PRICING OF SHARES: | | | | |
Net Assets | | $ | 18,800,725 | |
Shares of beneficial interest outstanding (unlimited number of shares, no par Value) | | | 1,815,259 | |
| Net Asset Value Per Share, Offering and Redemption Price Per Share | | $ | 10.36 | |
Minimum Redemption Price Per Share(a) | | $ | 10.15 | |
| (a) | The Fund will impose a 2.00% redemption fee on shares redeemed within 90 days of purchase. |
See Notes to Financial Statements.
RiverNorth Core Opportunity Fund | |
| Statement of Assets and Liabilities | September 30, 2014 |
INVESTMENT INCOME: | | | |
Dividend income | | $ | 27,571,005 | �� |
Foreign taxes withheld | | | (858 | ) |
| Total Investment Income | | | 27,570,147 | |
| | | | | |
EXPENSES: | | | | |
Investment Adviser fee | | | 6,930,474 | |
12b-1 fees - Class R Shares | | | 1,726,064 | |
Accounting and administration fee | | | 286,979 | |
Custodian expenses | | | 79,816 | |
Printing expenses | | | 74,615 | |
Compliance expenses | | | 61,173 | |
Facility loan fee | | | 60,499 | |
Trustee expenses | | | 56,026 | |
Transfer agent expenses | | | 54,830 | |
Legal expenses | | | 50,949 | |
Registration expenses | | | 35,713 | |
Insurance expenses | | | 20,926 | |
Audit expenses | | | 20,605 | |
24f-2 expenses | | | 8,070 | |
Miscellaneous expenses | | | 48,682 | |
| Total Expenses | | | 9,515,421 | |
| Net Investment Income | | | 18,054,726 | |
REALIZED AND UNREALIZED GAIN/(LOSS): | | | | |
Net realized gain on: | | | | |
Investments | | | 47,028,796 | |
Total return swap contracts | | | 249,168 | |
Net realized gain | | | 47,277,964 | |
Long-term capital gain distributions from other investment companies | | | 11,542,203 | |
Net change in unrealized appreciation on: Investments | | | (9,289,320 | ) |
Net Realized and Unrealized Gain on Investments and Total return swap contracts | | | 49,530,847 | |
Net Increase in Net Assets Resulting from Operations | | $ | 67,585,573 | |
See Notes to Financial Statements.
RiverNorth/DoubleLine Strategic Income Fund | |
| For the Year Ended September 30, 2014 |
INVESTMENT INCOME: | | | |
Dividend income | | $ | 28,451,985 | |
Interest income | | | 43,391,800 | |
Other income | | | 38,012 | |
| Total Investment Income | | | 71,881,797 | |
EXPENSES: | |
Investment Adviser fee | | | 8,436,507 | |
12b-1 fees - Class R Shares | | | 729,462 | |
Accounting and administration fee | | | 643,256 | |
Transfer agent expenses | | | 289,513 | |
Custodian expenses | | | 136,258 | |
Printing expenses | | | 100,753 | |
Compliance expenses | | | 99,625 | |
Facility loan fee | | | 97,540 | |
Trustee expenses | | | 89,643 | |
Legal expenses | | | 84,663 | |
Registration expenses | | | 83,455 | |
Insurance expenses | | | 42,385 | |
24f-2 expenses | | | 30,034 | |
Audit expenses | | | 24,105 | |
Miscellaneous expenses | | | 73,760 | |
| Total Expenses | | | 10,960,959 | |
| Net Investment Income | | | 60,920,838 | |
| | | | | |
REALIZED AND UNREALIZED GAIN: | | | | |
Net realized gain on: | | | | |
Investments | | | 9,312,669 | |
Long-term capital gain distributions from other investment companies | | | 69,538 | |
Net change in unrealized appreciation on: Investments | | | 22,778,299 | |
Net Realized and Unrealized Gain on Investments | | | 32,160,506 | |
| Net Increase in Net Assets Resulting from Operations | | $ | 93,081,344 | |
See Notes to Financial Statements.
RiverNorth Equity Opportunity Fund | |
| For the Year Ended September 30, 2014 |
INVESTMENT INCOME: | | | |
Dividend income | | $ | 332,347 | |
Foreign taxes withheld | | | (2,048 | ) |
Total Investment Income | | | 330,299 | |
| | | | | |
EXPENSES: | | | | |
Investment Adviser fee | | | 121,722 | |
Registration expenses | | | 43,105 | |
Transfer agent expenses | | | 26,507 | |
12b-1 fees - Class R Shares | | | 24,142 | |
Audit expenses | | | 19,105 | |
Custodian expenses | | | 15,476 | |
Accounting and administration fee | | | 7,740 | |
Printing expenses | | | 5,111 | |
Compliance expenses | | | 1,029 | |
Trustee expenses | | | 1,022 | |
Facility loan fee | | | 986 | |
Legal expenses | | | 885 | |
Insurance expenses | | | 550 | |
Miscellaneous expenses | | | 3,800 | |
Total expenses before waiver/reimbursement | | | 271,180 | |
Less fees waived/reimbursed by Investment Adviser: | | | | |
Class I Shares | | | (17,095 | ) |
Class R Shares | | | (65,618 | ) |
| Net Expenses | | | 188,467 | |
| Net Investment Income | | | 141,832 | |
| | | | | |
REALIZED AND UNREALIZED GAIN/(LOSS): | | | | |
Net realized gain on: | | | | |
Investments | | | 1,780,553 | |
Long-term capital gain distributions from other investment companies | | | 257,146 | |
Net change in unrealized appreciation on: Investments | | | (486,735 | ) |
Net Realized and Unrealized Gain on Investments | | | 1,550,964 | |
Net Increase in Net Assets Resulting from Operations | | $ | 1,692,796 | |
See Notes to Financial Statements.
RiverNorth/Oaktree High Income Fund | |
| For the Year Ended September 30, 2014 |
INVESTMENT INCOME: | | | |
Dividend income | | $ | 1,583,455 | |
Interest income | | | 2,771,956 | |
Other income | | | 32,829 | |
| Total Investment Income | | | 4,388,240 | |
| | | | | |
EXPENSES: | | | | |
Investment Adviser fee | | | 742,641 | |
Accounting and administration fee | | | 82,883 | |
12b-1 fees - Class R Shares | | | 69,009 | |
Custodian expenses | | | 46,114 | |
Transfer agent expenses | | | 35,721 | |
Registration expenses | | | 35,016 | |
Audit expenses | | | 24,105 | |
Offering costs | | | 13,679 | |
Printing expenses | | | 10,692 | |
Facility loan fee | | | 7,513 | |
Legal expenses | | | 5,830 | |
Trustee expenses | | | 5,686 | |
Compliance expenses | | | 5,574 | |
24f-2 expenses | | | 4,231 | |
Insurance expenses | | | 1,410 | |
Miscellaneous expenses | | | 8,657 | |
Total expenses before waiver/reimbursement | | | 1,098,761 | |
| Less fees waived/reimbursed by Investment Adviser: | | | | |
| Class I Shares | | | (19,885 | ) |
| Class R Shares | | | (7,302 | ) |
| Net Expenses | | | 1,071,574 | |
| Net Investment Income | | | 3,316,666 | |
| | | | | |
REALIZED AND UNREALIZED GAIN/(LOSS): | | | | |
Net realized gain on: | | | | |
Investments | | | 1,509,031 | |
Foreign currency transactions | | | 172,767 | |
Net realized gain | | | 1,681,798 | |
Long-term capital gain distributions from other investment companies | | | 172,777 | |
Net change in unrealized depreciation on: | | | | |
| Investments | | | (1,129,501 | ) |
Translation of assets and liabilities denominated in foreign currencies | | | 740,038 | |
Net unrealized depreciation | | | (389,463 | ) |
Net Realized and Unrealized Gain on Investments and translation of assets and liabilities denominated in foreign currencies | | | 1,465,112 | |
Net Increase in Net Assets Resulting from Operations | | $ | 4,781,778 | |
See Notes to Financial Statements.
RiverNorth Managed Volatility Fund | |
| For the Year Ended September 30, 2014 |
INVESTMENT INCOME: | | | |
Dividend income | | $ | 111,430 | |
Foreign taxes withheld | | | (240 | ) |
Total Investment Income | | | 111,190 | |
| | | | | |
EXPENSES: | | | | |
Investment Adviser fee | | | 174,653 | |
12 b-1 fees | | | 43,663 | |
Transfer agent expenses | | | 26,457 | |
Audit expenses | | | 23,105 | |
Registration expenses | | | 22,448 | |
Accounting and administration fee | | | 16,748 | |
Custodian expenses | | | 15,104 | |
Printing expenses | | | 5,026 | |
Dividend expense - short sales | | | 2,939 | |
Facility loan fee | | | 1,691 | |
Legal expenses | | | 1,429 | |
Compliance expenses | | | 1,417 | |
Trustee expenses | | | 1,410 | |
Offering costs | | | 772 | |
Insurance expenses | | | 704 | |
24f-2 expenses | | | 189 | |
Miscellaneous expenses | | | 3,649 | |
Total expenses before waiver/reimbursement | | | 341,404 | |
Less fees waived/reimbursed by Investment Adviser: | | | (24,089 | ) |
| Net Expenses | | | 317,315 | |
| Net Investment Loss | | | (206,125 | ) |
| | | | | |
REALIZED AND UNREALIZED GAIN/(LOSS): | | | | |
Net realized gain/(loss) on: | | | | |
Investments | | | 97,762 | |
Securities sold short | | | (180,345 | ) |
Written options | | | 1,607,039 | |
Net realized gain | | | 1,524,456 | |
| Net change in unrealized depreciation on: | | | | |
| Investments | | | (182,157 | ) |
| Written options | | | (60,046 | ) |
| Net unrealized depreciation | | | (242,203 | ) |
Net Realized and Unrealized Gain on Investments, securities sold short and written options | | | 1,282,253 | |
Net Increase in Net Assets Resulting from Operations | | $ | 1,076,128 | |
See Notes to Financial Statements.
RiverNorth Core Opportunity Fund | |
Statements of Changes in Net Assets | |
| | | For the Year Ended September 30, 2014 | | | For the Year Ended September 30, 2013 | |
NET INCREASE IN NET ASSETS FROM OPERATIONS: | | | | |
Net investment income | | $ | 18,054,726 | | | $ | 9,822,459 | |
Net realized gain on investments and total return swap contracts | | | 47,277,964 | | | | 32,697,013 | |
Long-term capital gain distributions from other investment companies | | | 11,542,203 | | | | 3,933,171 | |
Net change in unrealized appreciation on investments | | | (9,289,320 | ) | | | 8,612,286 | |
Net increase in net assets resulting from operations | | | 67,585,573 | | | | 55,064,929 | |
| | | | | | | | | |
DISTRIBUTIONS TO SHAREHOLDERS: | | | | | | | | |
From net investment income: | | | | | | | | |
Class I Shares(a) | | | - | | | | - | |
| Class R Shares | | | (11,486,483 | ) | | | (15,103,234 | ) |
| From net realized gains on investments: | | | | | | | | |
Class I Shares(a) | | | - | | | | - | |
| Class R Shares | | | (33,304,287 | ) | | | (23,100,259 | ) |
| Net decrease in net assets from distributions to shareholders | | | (44,790,770 | ) | | | (38,203,493 | ) |
| | | | | | | | | |
| CAPITAL SHARE TRANSACTIONS: | | | | | | | | |
Class I Shares(a) | | | | | | | | |
| Proceeds from shares sold | | | 40,246,635 | | | | - | |
| Cost of shares redeemed | | | (34,543 | ) | | | - | |
| Net increase in net assets from capital share transactions | | | 40,212,092 | | | | - | |
| | | | | | | | | |
| Class R Shares | | | | | | | | |
| Proceeds from shares sold | | | 237,141,950 | | | | 178,658,565 | |
| Reinvestment of distributions | | | 44,203,084 | | | | 37,586,237 | |
| Cost of shares redeemed | | | (246,827,216 | ) | | | (155,089,762 | ) |
Redemption fees(b) | | | 31,701 | | | | 24,918 | |
Net increase in net assets from capital share transactions | | | 34,549,519 | | | | 61,179,958 | |
| Net Increase in Net Assets | | | 97,556,414 | | | | 78,041,394 | |
| | | | | | | | | |
NET ASSETS: | | | | | | | | |
Beginning of period | | | 647,365,196 | | | | 569,323,802 | |
End of period (including accumulated net investment income of $12,332,698 and $1,159) | | $ | 744,921,610 | | | $ | 647,365,196 | |
See Notes to Financial Statements.
RiverNorth Core Opportunity Fund |
Statements of Changes in Net Assets |
| | | For the Year Ended September 30, 2014 | | | For the Year Ended September 30, 2013 | |
OTHER INFORMATION: | | | | | | |
| | | | | | |
Class I Shares(a) | | | | | | |
Shares sold | | | 3,037,552 | | | | - | |
Shares redeemed | | | (2,624 | ) | | | - | |
Net increase from share transactions | | | 3,034,928 | | | | - | |
| | | | | | | | | |
| Class R Shares | | | | | | | | |
Shares sold | | | 18,345,450 | | | | 14,487,987 | |
Shares issued in reinvestment of distributions | | | 3,556,161 | | | | 3,271,213 | |
Shares redeemed | | | (19,038,395 | ) | | | (12,600,804 | ) |
Net increase from share transactions | | | 2,863,216 | | | | 5,158,396 | |
| (a) | Commenced operations on August 11, 2014. |
| (b) | The Fund will impose a 2.00% redemption fee on shares redeemed within 90 days of purchase. |
See Notes to Financial Statements.
RiverNorth/DoubleLine Strategic Income Fund |
Statements of Changes in Net Assets |
| | | For the Year Ended September 30, 2014 | | | For the Year Ended September 30, 2013 | |
NET INCREASE/(DECREASE) IN NET ASSETS FROM OPERATIONS: | |
Net investment income | | $ | 60,920,838 | | | $ | 62,290,394 | |
| Net realized gain on investments | | | 9,312,669 | | | | 7,045,020 | |
| Long-term capital gain distributions from other investment companies | | | 69,538 | | | | 1,595,279 | |
| Net change in unrealized appreciation/(depreciation) on investments | | | 22,778,299 | | | | (71,829,885 | ) |
| Net increase/(decrease) in net assets resulting from operations | | | 93,081,344 | | | | (899,192 | ) |
| | | | | | | | | |
| DISTRIBUTIONS TO SHAREHOLDERS: | | | | | | | | |
| From net investment income: | | | | | | | | |
| Class I Shares | | | (50,992,234 | ) | | | (53,073,880 | ) |
| Class R Shares | | | (16,781,869 | ) | | | (20,673,415 | ) |
| From net realized gains on investments: | | | | | | | | |
| Class I Shares | | | (3,325,361 | ) | | | (7,261,076 | ) |
| Class R Shares | | | (1,206,293 | ) | | | (3,482,436 | ) |
| Net decrease in net assets from distributions to shareholders | | | (72,305,757 | ) | | | (84,490,807 | ) |
| | | | | | | | | |
| CAPITAL SHARE TRANSACTIONS: | | | | | | | | |
| Class I Shares | | | | | | | | |
| Proceeds from shares sold | | | 598,815,316 | | | | 391,117,558 | |
| Reinvestment of distributions | | | 39,127,768 | | | | 44,278,773 | |
| Cost of shares redeemed | | | (289,941,452 | ) | | | (466,135,625 | ) |
Redemption fees(a) | | | 66,088 | | | | 147,578 | |
| Net increase/(decrease) in net assets from capital share transactions | | | 348,067,720 | | | | (30,591,716 | ) |
| | | | | | | | | |
| Class R Shares | | | | | | | | |
| Proceeds from shares sold | | | 190,917,165 | | | | 125,949,097 | |
| Reinvestment of distributions | | | 17,494,663 | | | | 23,633,983 | |
| Cost of shares redeemed | | | (252,876,310 | ) | | | (309,260,010 | ) |
Redemption fees(a) | | | 23,147 | | | | 41,736 | |
| Net decrease in net assets from capital share transactions | | | (44,441,335 | ) | | | (159,635,194 | ) |
| Net Increase/(Decrease) in Net Assets | | | 324,401,972 | | | | (275,616,909 | ) |
| | | | | | | | | |
| NET ASSETS: | | | | | | | | |
| Beginning of period | | | 1,056,533,538 | | | | 1,332,150,447 | |
End of period (including accumulated net investment income/(loss) of $259,043 and $(109,120)) | | $ | 1,380,935,510 | | | $ | 1,056,533,538 | |
See Notes to Financial Statements.
RiverNorth/DoubleLine Strategic Income Fund |
Statements of Changes in Net Assets |
| | | For the Year Ended September 30, 2014 | | | For the Year Ended September 30, 2013 | |
OTHER INFORMATION: | | | | | | |
| Share Transactions: | | | | | | |
| Class I Shares | | | | | | |
Shares sold | | | 54,921,971 | | | | 34,901,898 | |
| Shares issued in reinvestment of distributions | | | 3,603,782 | | | | 3,992,459 | |
| Shares redeemed | | | (26,917,896 | ) | | | (42,413,050 | ) |
| Net increase/(decrease) from share transactions | | | 31,607,857 | | | | (3,518,693 | ) |
| | | | | | | | | |
| Class R Shares | | | | | | | | |
| Shares sold | | | 17,485,985 | | | | 11,239,657 | |
| Shares issued in reinvestment of distributions | | | 1,609,616 | | | | 2,125,093 | |
| Shares redeemed | | | (23,220,388 | ) | | | (27,893,110 | ) |
| Net decrease from share transactions | | | (4,124,787 | ) | | | (14,528,360 | ) |
| (a) | The Fund will impose a 2.00% redemption fee on shares redeemed within 90 days of purchase. |
See Notes to Financial Statements.
RiverNorth Equity Opportunity Fund |
Statements of Changes in Net Assets |
| | | For the Year Ended September 30, 2014(a) | | | For the Year Ended September 30, 2013 | |
NET INCREASE IN NET ASSETS FROM OPERATIONS: | |
Net investment income | | $ | 141,832 | | | $ | 243,968 | |
| Net realized gain on investments | | | 1,780,553 | | | | 872,669 | |
| Long-term capital gain distributions from other investment companies | | | 257,146 | | | | 42,003 | |
| Net change in unrealized appreciation on investments | | | (486,735 | ) | | | 1,057,181 | |
| Net increase in net assets resulting from operations | | | 1,692,796 | | | | 2,215,821 | |
| | | | | | | | | |
| DISTRIBUTIONS TO SHAREHOLDERS: | | | | | | | | |
| From net investment income: | | | | | | | | |
| Class I Shares | | | (112,441 | ) | | | (116,174 | ) |
| Class R Shares | | | (398,073 | ) | | | (362,781 | ) |
| From net realized gains on investments: | | | | | | | | |
| Class I Shares | | | (154,414 | ) | | | (19,020 | ) |
| Class R Shares | | | (539,682 | ) | | | (67,585 | ) |
| Net decrease in net assets from distributions to shareholders | | | (1,204,610 | ) | | | (565,560 | ) |
| | | | | | | | | |
| CAPITAL SHARE TRANSACTIONS: | | | | | | | | |
| Class I Shares | | | | | | | | |
| Proceeds from shares sold | | | 405,372 | | | | 3,742,082 | |
| Reinvestment of distributions | | | 260,497 | | | | 133,382 | |
| Cost of shares redeemed | | | (1,904,952 | ) | | | (2,268,152 | ) |
Redemption fees(b) | | | 509 | | | | 2,026 | |
| Net increase/(decrease) in net assets from capital share transactions | | | (1,238,574 | ) | | | 1,609,338 | |
| Class R Shares | | | | | | | | |
| Proceeds from shares sold | | | 2,051,639 | | | | 7,200,285 | |
| Reinvestment of distributions | | | 927,068 | | | | 421,675 | |
| Cost of shares redeemed | | | (5,474,787 | ) | | | (4,255,463 | ) |
Redemption fees(b) | | | 1,955 | | | | 12,299 | |
| Net increase/(decrease) in net assets from capital share transactions | | | (2,494,125 | ) | | | 3,378,796 | |
| Net Increase/(Decrease) in Net Assets | | | (3,244,513 | ) | | | 6,638,395 | |
| | | | | | | | | |
| NET ASSETS: | | | | | | | | |
| Beginning of period | | | 13,989,392 | | | | 7,350,997 | |
| End of period (including accumulated net investment income of $- and $-) | | $ | 10,744,879 | | | $ | 13,989,392 | |
See Notes to Financial Statements.
RiverNorth Equity Opportunity Fund |
Statements of Changes in Net Assets |
| | | For the Year Ended September 30, 2014(a) | | | For the Year Ended September 30, 2013 | |
OTHER INFORMATION: | | | | | | |
| Share Transactions: | | | | | | |
| Class I Shares | | | | | | |
Shares sold | | | 33,780 | | | | 349,602 | |
| Shares issued in reinvestment of distributions | | | 21,922 | | | | 12,225 | |
| Shares redeemed | | | (159,846 | ) | | | (201,919 | ) |
| Net increase/(decrease) from share transactions | | | (104,144 | ) | | | 159,908 | |
| | | | | | | | | |
| Class R Shares | | | | | | | | |
| Shares sold | | | 170,141 | | | | 665,867 | |
| Shares issued in reinvestment of distributions | | | 77,996 | | | | 38,761 | |
| Shares redeemed | | | (457,453 | ) | | | (372,349 | ) |
| Net increase/(decrease) from share transactions | | | (209,316 | ) | | | 332,279 | |
| (a) | Prior to December 31, 2013, the RiverNorth Equity Opportunity Fund was known as the RiverNorth/Manning & Napier Dividend Income Fund. |
| (b) | The Fund will impose a 2.00% redemption fee on shares redeemed within 90 days of purchase. |
See Notes to Financial Statements.
RiverNorth/Oaktree High Income Fund |
Statements of Changes in Net Assets |
| | | For the Year Ended September 30, 2014 | | | For the Period December 28, 2012 (Inception) to September 30, 2013 | |
NET INCREASE/(DECREASE) IN NET ASSETS FROM OPERATIONS: | | | | |
Net investment income | | $ | 3,316,666 | | | $ | 610,025 | |
Net realized gain/(loss) on investments and forward foreign currency contracts | | | 1,681,798 | | | | (59,661 | ) |
Long-term capital gain distributions from other investment companies | | | 172,777 | | | | 11,511 | |
Net change in unrealized depreciation on investments and forward foreign currency contracts | | | (389,463 | ) | | | (576,176 | ) |
| Net increase/(decrease) in net assets resulting from operations | | | 4,781,778 | | | | (14,301 | ) |
| | | | | | | | | |
| DISTRIBUTIONS TO SHAREHOLDERS: | | | | | | | | |
| From net investment income: | | | | | | | | |
| Class I Shares | | | (2,286,995 | ) | | | (381,295 | ) |
| Class R Shares | | | (1,266,786 | ) | | | (324,649 | ) |
| Net decrease in net assets from distributions to shareholders | | | (3,553,781 | ) | | | (705,944 | ) |
| | | | | | | | | |
| CAPITAL SHARE TRANSACTIONS: | | | | | | | | |
| Class I Shares | | | | | | | | |
| Proceeds from shares sold | | | 49,829,646 | | | | 32,486,635 | |
| Reinvestment of distributions | | | 2,066,244 | | | | 346,851 | |
| Cost of shares redeemed | | | (8,300,097 | ) | | | (7,072,680 | ) |
Redemption fees(a) | | | 6,483 | | | | 4,428 | |
| Net increase in net assets from capital share transactions | | | 43,602,276 | | | | 25,765,234 | |
| Class R Shares | | | | | | | | |
| Proceeds from shares sold | | | 20,137,356 | | | | 27,496,607 | |
| Reinvestment of distributions | | | 1,251,067 | | | | 322,553 | |
| Cost of shares redeemed | | | (28,173,487 | ) | | | (5,282,259 | ) |
Redemption fees(a) | | | 3,835 | | | | 4,721 | |
| Net increase/(decrease) in net assets from capital share transactions | | | (6,781,229 | ) | | | 22,541,622 | |
| Net Increase in Net Assets | | | 38,049,044 | | | | 47,586,611 | |
| | | | | | | | | |
| NET ASSETS: | | | | | | | | |
| Beginning of period | | | 47,586,611 | | | | - | |
| End of period (including accumulated net investment income of $324,092 and $231,462) | | $ | 85,635,655 | | | $ | 47,586,611 | |
See Notes to Financial Statements.
RiverNorth/Oaktree High Income Fund |
Statements of Changes in Net Assets |
| | | For the Year Ended September 30, 2014 | | | For the Period December 28, 2012 (Inception) to September 30, 2013 | |
OTHER INFORMATION: | | | | | | |
| Share Transactions: | | | | | | |
| Class I Shares | | | | | | |
| Shares sold | | | 4,821,757 | | | | 3,226,812 | |
| Shares issued in reinvestment of distributions | | | 199,618 | | | | 34,763 | |
| Shares redeemed | | | (800,633 | ) | | | (702,483 | ) |
| Net increase from share transactions | | | 4,220,742 | | | | 2,559,092 | |
| | | | | | | | | |
| Class R Shares | | | | | | | | |
| Shares sold | | | 1,950,384 | | | | 2,715,460 | |
| Shares issued in reinvestment of distributions | | | 121,086 | | | | 32,395 | |
| Shares redeemed | | | (2,716,014 | ) | | | (525,016 | ) |
| Net increase/(decrease) from share transactions | | | (644,544 | ) | | | 2,222,839 | |
| (a) | The Fund will impose a 2.00% redemption fee on shares redeemed within 90 days of purchase. |
See Notes to Financial Statements.
RiverNorth Managed Volatility Fund |
Statements of Changes in Net Assets |
| | | For the Year Ended September 30, 2014(a) | | | For the Period October 12, 2012 (Inception) to September 30, 2013 | |
NET INCREASE IN NET ASSETS FROM OPERATIONS: | | | | | | |
Net investment loss | | $ | (206,125 | ) | | $ | (91,482 | ) |
| Net realized gain on investments, securities sold short and written options | | | 1,524,456 | | | | 842,746 | |
| Long-term capital gain distributions from other investment companies | | | | | | | 157 | |
| Net change in unrealized depreciation on investments and written options | | | (242,203 | ) | | | (21,781 | ) |
| Net increase in net assets resulting from operations | | | 1,076,128 | | | | 729,640 | |
| | | | | | | | | |
| DISTRIBUTIONS TO SHAREHOLDERS: | | | | | | | | |
| From net investment income | | | - | | | | (779 | ) |
| From net realized gains on investments | | | (1,186,667 | ) | | | - | |
| Net decrease in net assets from distributions to shareholders | | | (1,186,667 | ) | | | (779 | ) |
| | | | | | | | | |
| CAPITAL SHARE TRANSACTIONS: | | | | | | | | |
| Proceeds from shares sold | | | 10,668,196 | | | | 22,291,221 | |
| Reinvestment of distributions | | | 1,179,149 | | | | 776 | |
| Cost of shares redeemed | | | (9,737,248 | ) | | | (6,227,539 | ) |
Redemption fees(b) | | | 3,289 | | | | 4,559 | |
| Net increase in net assets from capital share transactions | | | 2,113,386 | | | | 16,069,017 | |
| Net Increase in Net Assets | | | 2,002,847 | | | | 16,797,878 | |
| | | | | | | | | |
| NET ASSETS: | | | | | | | | |
| Beginning of period | | | 16,797,878 | | | | - | |
| End of period (including accumulated net investment income of $- and $-) | | $ | 18,800,725 | | | $ | 16,797,878 | |
| | | | | | | | | |
| OTHER INFORMATION: | | | | | | | | |
| Share Transactions: | | | | | | | | |
| Shares sold | | | 1,028,969 | | | | 2,225,791 | |
| Shares issued in reinvestment of distributions | | | 117,328 | | | | 78 | |
| Shares redeemed | | | (950,469 | ) | | | (606,438 | ) |
| Net increase from share transactions | | | 195,828 | | | | 1,619,431 | |
| (a) | Prior to Janurary 1, 2014, the RiverNorth Managed Volatility Fund was known as the Rivernorth Dynamic Buy-Write Fund. |
| (b) | The Fund will impose a 2.00% redemption fee on shares redeemed within 90 days of purchase. |
See Notes to Financial Statements.
RiverNorth Core Opportunity Fund | Class I |
Financial Highlights | For a share outstanding throughout the periods presented. |
| | | For the Period ended September 30, 2014(a) | |
| Net asset Value - beginning of period | | $ | 13.16 | |
| Income/(Loss) from investment operations: | | | | |
Net investment income(b) | | | 0.08 | |
Net realized and unrealized loss on investments(b) | | | (0.18 | )(c) |
| Total loss from investment operations | | | (0.10 | ) |
| | | | | |
| Less distributions: | | | | |
| From net realized gain on investments | | | - | |
| Total distributions | | | - | |
Paid-in capital from redemption fees(b) | | | - | |
| Net decrease in net asset value | | | (0.10 | ) |
| Net asset Value - end of period | | $ | 13.06 | |
| | | | | |
Total Return(d) | | | (0.76 | %)(e) |
| Ratios/Supplemental Data: | | | | |
| Net assets, end of period (in thousands) | | $ | 39,623 | |
Ratio of expenses to average net assets excluding fee waivers and reimbursements(f) | | | 1.20 | %(g) |
Ratio of expenses to average net assets including fee waivers and reimbursements(f) | | | 1.20 | %(g) |
Ratio of net investment income to average net assets excluding fee waivers and reimbursements(f) | | | 2.93 | %(g) |
Ratio of net investment income to average net assets including fee waivers and reimbursements(f) | | | 2.93 | %(g) |
| Portfolio turnover rate | | | 46 | % |
| (a) | Commenced operations on August 11, 2014. |
| (b) | Based on average shares outstanding during the period. |
| (c) | The amount shown for a .share outstanding throughout the period may not correlate with the Statement of Operations for the period due to the timing of sales and redemptions of Fund shares in relation to realized and unrealized gains and losses on investments of the Fund. |
| (d) | Total return in the above table represents the rate that the investor would have earned or lost on an investment in the Fund, assuming reinvestment of dividends. |
| (e) | Not annualized. |
| (f) | The ratios exclude the impact of expenses of the underlying funds in which the Fund invests as represented in the Schedule of Investments. |
| (g) | Annualized. |
See Notes to Financial Statements.
RiverNorth Core Opportunity Fund | Class R |
Financial Highlights | |
| |
Net asset Value - beginning of period |
| Income/(Loss) from investment operations: |
Net investment income(a) |
Net realized and unrealized gain/(loss) on investments(a) |
Total income/(loss) from investment operations |
| |
| Less distributions: |
From net investment income |
From net realized gain on investments |
Total distributions |
Paid-in capital from redemption fees(a) |
Net increase/(decrease) in net asset Value |
Net asset Value - end of period |
| |
Total Return(c) |
| Ratios/Supplemental Data: |
Net assets, end of period (in thousands) |
Ratio of expenses to average net assets excluding fee waivers and reimbursements(d) |
Ratio of expenses to average net assets including fee waivers and reimbursements(d) |
Ratio of net investment income to average net assets excluding fee waivers and reimbursements(d) |
Ratio of net investment income to average net assets including fee waivers and reimbursements(d) |
Portfolio turnover rate |
| (a) | Based on average shares outstanding during the period. |
| (b) | Less than $0.005per .share. |
| (c) | Total return in the above table represents the rate that the investor would have earned or lost on an investment in the Fund, assuming reinvestment of dividends. |
| (d) | The ratios exclude the impact of expenses of the underlying funds in which the Fund invests as represented in the Schedule of Investments. |
See Notes to Financial Statements.
| |
| For a share outstanding throughout the periods presented. |
| For the Year Ended September 30, 2014 | | | For the Year Ended September 30, 2013 | | | For the Year Ended September 30, 2012 | | | For the Year Ended September 30, 2011 | | | For the Year Ended September 30, 2010 | |
| $ | 12.65 | | | $ | 12.37 | | | $ | 11.18 | | | $ | 11.63 | | | $ | 10.57 | |
| | 0.32 | | | | 0.20 | | | | 0.20 | | | | 0.32 | | | | 0.21 | |
| | 1.00 | | | | 0.96 | | | | 2.01 | | | | (0.45 | ) | | | 1.30 | |
| | 1.32 | | | | 1.16 | | | | 2.21 | | | | (0.13 | ) | | | 1.51 | |
| | | | | | | | | | | | | | | | | | | |
| | (0.24 | ) | | | (0.35 | ) | | | (0.50 | ) | | | (0.32 | ) | | | (0.45 | ) |
| | (0.68 | ) | | | (0.53 | ) | | | (0.52 | ) | | | - | | | | - | |
| | (0.92 | ) | | | (0.88 | ) | | | (1.02 | ) | | | (0.32 | ) | | | (0.45 | ) |
| | 0.00 | (b) | | | 0.00 | (b) | | | 0.00 | (b) | | | 0.00 | (b) | | | 0.00 | (b) |
| | 0.40 | | | | 0.28 | | | | 1.19 | | | | (0.45 | ) | | | 1.06 | |
| $ | 13.05 | | | $ | 12.65 | | | $ | 12.37 | | | $ | 11.18 | | | $ | 11.63 | |
| | | | | | | | | | | | | | | | | | | |
| | 10.81 | % | | | 10.08 | % | | | 21.05 | % | | | (1.33 | %) | | | 14.72 | % |
| | | | | | | | | | | | | | | | | | | |
| $ | 705,299 | | | $ | 647,365 | | | $ | 569,324 | | | $ | 488,195 | | | $ | 392,421 | |
| | 1.37 | % | | | 1.35 | % | | | 1.36 | % | | | 1.45 | % | | | 1.45 | % |
| | 1.37 | % | | | 1.35 | % | | | 1.36 | % | | | 1.45 | % | | | 1.45 | % |
| | 2.60 | % | | | 1.66 | % | | | 1.74 | % | | | 2.57 | % | | | 1.95 | % |
| | 2.60 | % | | | 1.66 | % | | | 1.74 | % | | | 2.57 | % | | | 1.95 | % |
| | 46 | % | | | 46 | % | | | 30 | % | | | 38 | % | | | 38 | % |
RiverNorth/DoubleLine Strategic Income Fund | Class I |
Financial Highlights | |
| |
Net asset Value - beginning of period |
| |
| Income from investment operations: |
Net investment income(a) |
Net realized and unrealized gain/(loss) on investments(a) |
Total income from investment operations |
| |
| Less distributions: |
From net investment income |
From net realized gain on investments |
Total distributions |
Paid-in capital from redemption fees(a) |
Net increase/(decrease) in net asset Value |
Net asset Value - end of period |
| |
Total Return(c) |
| |
| Ratios/Supplemental Data: |
Net assets, end of period (in thousands) |
Ratio of expenses to average net assets excluding fee waivers and reimbursements(e) |
Ratio of expenses to average net assets including fee waivers and reimbursements(e) |
Ratio of net investment income to average net assets excluding fee waivers and reimbursements(e) |
Ratio of net investment income to average net assets including fee waivers and reimbursements(e) |
Portfolio turnover rate |
(a) | Based on average shares outstanding during the period. |
(b) | Less than $0.005per .share. |
(c) | Total return in the above table represents the rate that the investor would have earned or lost on an investment in the Fund, assuming reinvestment of dividends. |
(d) | Not annualized. |
(e) | The ratios exclude the impact of expenses of the underlying funds in which the Fund invests as represented in the Schedule of Investments. |
(f) | Annualized. |
See Notes to Financial Statements.
| |
| For a share outstanding throughout the periods presented. |
For the Year Ended September 30, 2014 | | | For the Year Ended September 30, 2013 | | | For the Year Ended September 30, 2012 | | | For the Period December 30, 2010 (Inception) to September 30, 2011 | |
| $ | 10.62 | | | $ | 11.33 | | | $ | 10.59 | | | $ | 10.00 | |
| | | | | | | | | | | | | | | |
| | 0.59 | | | | 0.52 | | | | 0.57 | | | | 0.42 | |
| | 0.38 | | | | (0.51 | ) | | | 0.82 | | | | 0.46 | |
| | 0.97 | | | | 0.01 | | | | 1.39 | | | | 0.88 | |
| | | | | | | | | | | | | | | |
| | (0.66 | ) | | | (0.63 | ) | | | (0.63 | ) | | | (0.30 | ) |
| | (0.05 | ) | | | (0.09 | ) | | | (0.02 | ) | | | - | |
| | (0.71 | ) | | | (0.72 | ) | | | (0.65 | ) | | | (0.30 | ) |
| | 0.00 | (b) | | | 0.00 | (b) | | | 0.00 | (b) | | | 0.01 | |
| | 0.26 | | | | (0.71 | ) | | | 0.74 | | | | 0.59 | |
| $ | 10.88 | | | $ | 10.62 | | | $ | 11.33 | | | $ | 10.59 | |
| | | | | | | | | | | | | | | |
| | 9.38 | % | | | (0.03 | %) | | | 13.56 | % | | | 8.97 | %(d) |
| | | | | | | | | | | | | | | |
| $ | 1,148,744 | | | $ | 785,974 | | | $ | 878,631 | | | $ | 332,664 | |
| | 0.91 | % | | | 0.89 | % | | | 0.90 | % | | | 1.08 | %(f) |
| | 0.91 | % | | | 0.89 | % | | | 0.90 | % | | | 0.95 | %(f) |
| | 5.47 | % | | | 4.68 | % | | | 5.20 | % | | | 5.18 | %(f) |
| | 5.47 | % | | | 4.68 | % | | | 5.20 | % | | | 5.31 | %(f) |
| | 56 | % | | | 80 | % | | | 74 | % | | | 64 | %(d) |
RiverNorth/DoubleLine Strategic Income Fund | Class R |
Financial Highlights | |
| |
Net asset Value - beginning of period |
| Income/(loss) from investment operations: |
Net investment income(a) |
Net realized and unrealized gain/(loss) on investments(a) |
Total income/(loss) from investment operations |
| |
| Less distributions: |
From net investment income |
From net realized gain on investments |
Total distributions |
Paid-in capital from redemption fees(a) |
Net increase/(decrease) in net asset Value |
Net asset Value - end of period |
| |
|
| |
| Ratios/Supplemental Data: |
Net assets, end of period (in thousands) |
Ratio of expenses to average net assets excluding fee waivers and reimbursements(e) |
Ratio of expenses to average net assets including fee waivers and reimbursements(e) |
Ratio of net investment income to average net assets excluding fee waivers and reimbursements(e) |
Ratio of net investment income to average net assets including fee waivers and reimbursements(e) |
Portfolio turnover rate |
(a) | Based on average shares outstanding during the period. |
(b) | Less than $0.005per .share. |
(c) | Total return in the above table represents the rate that the investor would have earned or lost on an investment in the Fund, assuming reinvestment of dividends. |
(d) | Not annualized. |
(e) | The ratios exclude the impact of expenses of the underlying funds in which the Fund invests as represented in the Schedule of Investments. |
(f) | Annualized. |
See Notes to Financial Statements.
| |
| For a share outstanding throughout the periods presented. |
For the Year Ended September 30, 2014 | | | For the Year Ended September 30, 2013 | | | For the Year Ended September 30, 2012 | | | For the Period December 30, 2010 (Inception) to September 30, 2011 | |
| $ | 10.63 | | | $ | 11.34 | | | $ | 10.60 | | | $ | 10.00 | |
| | | | | | | | | | | | | | | |
| | 0.57 | | | | 0.49 | | | | 0.54 | | | | 0.40 | |
| | 0.38 | | | | (0.51 | ) | | | 0.82 | | | | 0.46 | |
| | 0.95 | | | | (0.02 | ) | | | 1.36 | | | | 0.86 | |
| | | | | | | | | | | | | | | |
| | (0.64 | ) | | | (0.60 | ) | | | (0.61 | ) | | | (0.28 | ) |
| | (0.05 | ) | | | (0.09 | ) | | | (0.02 | ) | | | - | |
| | (0.69 | ) | | | (0.69 | ) | | | (0.63 | ) | | | (0.28 | ) |
| | 0.00 | (b) | | | 0.00 | (b) | | | 0.01 | | | | 0.02 | |
| | 0.26 | | | | (0.71 | ) | | | 0.74 | | | | 0.60 | |
| $ | 10.89 | | | $ | 10.63 | | | $ | 11.34 | | | $ | 10.60 | |
| | | | | | | | | | | | | | | |
| | 9.09 | % | | | (0.29 | %) | | | 13.28 | % | | | 8.88 | %(d) |
| | | | | | | | | | | | | | | |
| $ | 232,191 | | | $ | 270,560 | | | $ | 453,520 | | | $ | 141,779 | |
| | 1.16 | % | | | 1.14 | % | | | 1.15 | % | | | 1.33 | %(f) |
| | 1.16 | % | | | 1.14 | % | | | 1.15 | % | | | 1.20 | %(f) |
| | 5.26 | % | | | 4.40 | % | | | 4.96 | % | | | 4.99 | %(f) |
| | 5.26 | % | | | 4.40 | % | | | 4.96 | % | | | 5.11 | %(f) |
| | 56 | % | | | 80 | % | | | 74 | % | | | 64 | %(d) |
RiverNorth Equity Opportunity Fund | Class I |
Financial Highlights | For a share outstanding throughout the periods presented. |
| | | For the Year Ended September 30, 2014(a) | | | For the Year Ended September 30, 2013 | | | For the Period July 18, 2012 (Inception) to September 30, 2012 | |
Net asset Value - beginning of period | | $ | 11.68 | | | $ | 10.42 | | | $ | 10.00 | |
| Income from investment operations: | | | | | | | | | | | | |
Net investment income(b) | | | 0.17 | | | | 0.22 | | | | 0.02 | |
Net realized and unrealized gain on investments(b) | | | 1.48 | | | | 1.50 | | | | 0.42 | |
| Total income from investment operations | | | 1.65 | | | | 1.72 | | | | 0.44 | |
| | | | | | | | | | | | | |
| Less distributions: | | | | | | | | | | | | |
| From net investment income | | | (0.55 | ) | | | (0.39 | ) | | | (0.02 | ) |
| From net realized gain on investments | | | (0.63 | ) | | | (0.08 | ) | | | - | |
| Total distributions | | | (1.18 | ) | | | (0.47 | ) | | | (0.02 | ) |
Paid-in capital from redemption fees(b) | | | 0.00 | (c) | | | 0.01 | | | | - | |
| Net increase in net asset Value | | | 0.47 | | | | 1.26 | | | | 0.42 | |
| Net asset Value - end of period | | $ | 12.15 | | | $ | 11.68 | | | $ | 10.42 | |
| | | | | | | | | | | | | |
Total Return(d) | | | 14.52 | % | | | 16.99 | % | | | 4.44 | % (e) |
| Ratios/Supplemental Data: | | | | | | | | | | | | |
| Net assets, end of period (in thousands) | | $ | 1,925 | | | $ | 3,067 | | | $ | 1,069 | |
Ratio of expenses to average net assets excluding fee waivers and reimbursements(f) | | | 2.03 | % | | | 1.98 | % | | | 6.16 | %(g) |
Ratio of expenses to average net assets including fee waivers and reimbursements(f) | | | 1.35 | % | | | 1.35 | % | | | 1.35 | %(g) |
Ratio of net investment income/(loss) to average net assets excluding fee waivers and reimbursements(f) | | | 0.76 | % | | | 1.33 | % | | | (3.92 | %)(g) |
Ratio of net investment income to average net assets including fee waivers and reimbursements(f) | | | 1.44 | % | | | 1.96 | % | | | 0.89 | %(g) |
| Portfolio turnover rate | | | 107 | % | | | 100 | % | | | 13 | %(e) |
(a) | Prior to December 31, 2013, the RiverNorth Equity Opportunity Fund was known as the RiverNorth/Manning & Napier Dividend Income Fund. |
(b) | Based on average shares outstanding during the period. |
(c) | Less than $0.005per .share. |
(d) | Total return in the above table represents the rate that the investor would have earned or lost on an investment in the Fund, assuming reinvestment of dividends. |
(e) | Not annualized. |
(f) | The ratios exclude the impact of expenses of the underlying funds in which the Fund invests as represented in the Schedule of Investments. |
(g) | Annualized. |
See Notes to Financial Statements.
| RiverNorth Equity Opportunity Fund | Class R |
| Financial Highlights | For a share outstanding throughout the periods presented. |
| | | For the Year Ended September 30, 2014(a) | | | For the Year Ended September 30, 2013 | | | For the Period July 18, 2012 (Inception) to September 30, 2012 | |
| Net asset Value - beginning of period | | $ | 11.68 | | | $ | 10.42 | | | $ | 10.00 | |
| Income from investment operations: | | | | | | | | | | | | |
Net investment income(b) | | | 0.13 | | | | 0.19 | | | | 0.01 | |
Net realized and unrealized gain on investments(b) | | | 1.48 | | | | 1.51 | | | | 0.44 | |
| Total income from investment operations | | | 1.61 | | | | 1.70 | | | | 0.45 | |
| | | | | | | | | | | | | |
| Less distributions: | | | | | | | | | | | | |
| From net investment income | | | (0.52 | ) | | | (0.37 | ) | | | (0.03 | ) |
| From net realized gain on investments | | | (0.62 | ) | | | (0.08 | ) | | | - | |
| Total distributions | | | (1.14 | ) | | | (0.45 | ) | | | (0.03 | ) |
Paid-in capital from redemption fees(b) | | | 0.00 | (c) | | | 0.01 | | | | 0.00 | (c) |
| Net increase in net asset Value | | | 0.47 | | | | 1.26 | | | | 0.42 | |
| Net asset Value - end of period | | $ | 12.15 | | | $ | 11.68 | | | $ | 10.42 | |
| | | | | | | | | | | | | |
Total Return(d) | | | 14.22 | % | | | 16.75 | % | | | 4.46 | % (e) |
Ratios/Supplemental Data: Net assets, end of period (in thousands) | | $ | 8,820 | | | $ | 10,923 | | | $ | 6,282 | |
Ratio of expenses to average net assets excluding fee waivers and reimbursements(f) | | | 2.28 | % | | | 2.21 | % | | | 6.21 | %(g) |
Ratio of expenses to average net assets including fee waivers and reimbursements(f) | | | 1.60 | % | | | 1.60 | % | | | 1.60 | %(g) |
Ratio of net investment income/(loss) to average net assets excluding fee waivers and reimbursements(f) | | | 0.41 | % | | | 1.09 | % | | | (4.12 | %)(g) |
Ratio of net investment income to average net assets including fee waivers and reimbursements(f) | | | 1.09 | % | | | 1.71 | % | | | 0.49 | %(g) |
| Portfolio turnover rate | | | 107 | % | | | 100 | % | | | 13 | %(e) |
(a) | Prior to December 31, 2013, the RiverNorth Equity Opportunity Fund was known as the RiverNorth/Manning & Napier Dividend Income Fund. |
(b) | Based on average shares outstanding during the period. |
(c) | Less than $0.005per .share. |
(d) | Total return in the above table represents the rate that the investor would have earned or lost on an investment in the Fund, assuming reinvestment of dividends. |
(e) | Not annualized. |
(f) | The ratios exclude the impact of expenses of the underlying funds in which the Fund invests as represented in the Schedule of Investments. |
(g) | Annualized. |
See Notes to Financial Statements.
| RiverNorth/Oaktree High Income Fund | Class I |
| Financial Highlights | For a share outstanding throughout the periods presented. |
| | | For the Year Ended September 30, 2014 | | | For the Period December 28, 2012 (Inception) to September 30, 2013 | |
| Net asset Value - beginning of period | | $ | 9.95 | | | $ | 10.00 | |
| Income from investment operations: | | | | | | | | |
Net investment income(a) | | | 0.47 | | | | 0.22 | |
Net realized and unrealized gain/(loss) on investments(a) | | | 0.33 | | | | (0.07 | ) |
| Total income from investment operations | | | 0.80 | | | | 0.15 | |
| | | | | | | | | |
| Less distributions: | | | | | | | | |
| From net investment income | | | (0.50 | ) | | | (0.20 | ) |
| Total distributions | | | (0.50 | ) | | | (0.20 | ) |
Paid-in capital from redemption fees(a) | | | 0.00 | (b) | | | 0.00 | (b) |
| Net increase/(decrease) in net asset Value | | | 0.30 | | | | (0.05 | ) |
| Net asset Value - end of period | | $ | 10.25 | | | $ | 9.95 | |
| | | | | | | | | |
Total Return(c) | | | 8.16 | % | | | 1.52 | %(d) |
| Ratios/Supplemental Data: | | | | | | | | |
| Net assets, end of period (in thousands) | | $ | 69,473 | | | $ | 25,472 | |
Ratio of expenses to average net assets excluding fee waivers and reimbursements(e) | | | 1.39 | % | | | 1.58 | %(f) |
Ratio of expenses to average net assets including fee waivers and reimbursements(e) | | | 1.35 | % | | | 1.35 | %(f) |
Ratio of net investment income to average net assets excluding fee waivers and reimbursements(e) | | | 4.45 | % | | | 2.65 | %(f) |
Ratio of net investment income to average net assets including fee waivers and reimbursements(e) | | | 4.49 | % | | | 2.88 | %(f) |
| Portfolio turnover rate | | | 91 | % | | | 117 | %(d) |
| (a) | Based on average shares outstanding during the period. |
| (b) | Less than $0.005 per .share. |
| (c) | Total return in the above table represents the rate that the investor would have earned or lost on an investment in the Fund, assuming reinvestment of dividends. |
| (d) | Not annualized. |
| (e) | The ratios exclude the impact of expenses of the underlying funds in which the Fund invests as represented in the Schedule of Investments. |
| (f) | Annualized. |
See Notes to Financial Statements.
| RiverNorth/Oaktree High Income Fund | Class R |
| Financial Highlights | For a share outstanding throughout the periods presented. |
| | | For the Year Ended September 30, 2014 | | | For the Period December 28, 2012 (Inception) to September 30, 2013 | |
Net asset value - beginning of period | | $ | 9.95 | | | $ | 10.00 | |
Income from investment operations: | | | | | | | | |
Net investment income(a) | | | 0.46 | | | | 0.21 | |
Net realized and unrealized gain/(loss) on investments(a) | | | 0.31 | | | | (0.07 | ) |
| Total income from investment operations | | | 0.77 | | | | 0.14 | |
| | | | | | | | | |
| Less distributions: | | | | | | | | |
| From net investment income | | | (0.48 | ) | | | (0.19 | ) |
| Total distributions | | | (0.48 | ) | | | (0.19 | ) |
Paid-in capital from redemption fees(a) | | | 0.00 | (b) | | | 0.00 | (b) |
| Net increase/(decrease) in net asset Value | | | 0.29 | | | | (0.05 | ) |
| Net asset value - end of period | | $ | 10.24 | | | $ | 9.95 | |
| | | | | | | | | |
Total Return(c) | | | 7.78 | % | | | 1.38 | %(d) |
| Ratios/Supplemental Data: | | | | | | | | |
| Net assets, end of period (in thousands) | | $ | 16,163 | | | $ | 22,115 | |
Ratio of expenses to average net assets excluding fee waivers and reimbursements(e) | | | 1.63 | % | | | 1.80 | %(f) |
Ratio of expenses to average net assets including fee waivers and reimbursements(e) | | | 1.60 | % | | | 1.60 | %(f) |
Ratio of net investment income to average net assets excluding fee waivers and reimbursements(e) | | | 4.40 | % | | | 2.60 | %(f) |
Ratio of net investment income to average net assets including fee waivers and reimbursements(e) | | | 4.43 | % | | | 2.80 | %(f) |
| Portfolio turnover rate | | | 91 | % | | | 117 | %(d) |
(a) | Based on average shares outstanding during the period. |
(b) | Less than $0.005per .share. |
(c) | Total return in the above table represents the rate that the investor would have earned or lost on an investment in the Fund, assuming reinvestment of dividends. |
(d) | Not annualized. |
(e) | The ratios exclude the impact of expenses of the underlying funds in which the Fund invests as represented in the Schedule of Investments. |
(f) | Annualized. |
See Notes to Financial Statements.
| RiverNorth Managed Volatility Fund |
| Financial Highlights | For a share outstanding throughout the periods presented. |
| | | For the Year Ended September 30, 2014(a) | | | For the Period October 12, 2012 (Inception) to September 30, 2013 | |
| Net asset Value - beginning of period | | $ | 10.37 | | | $ | 10.00 | |
| Income from investment operations: | | | | | | | | |
Net investment loss(b) | | | (0.12 | ) | | | (0.06 | ) |
Net realized and unrealized gain on investments(b) | | | 0.79 | | | | 0.43 | |
| Total income from investment operations | | | 0.67 | | | | 0.37 | |
| | | | | | | | | |
| Less distributions: | |
| From net investment income | | | - | | | | (0.00 | )(c) |
| From net realized gain on investments | | | (0.68 | ) | | | - | |
| Total distributions | | | (0.68 | ) | | | (0.00 | )(c) |
Paid-in capital from redemption fees(b) | | | 0.00 | (c) | | | 0.00 | (c) |
| Net increase/(decrease) in net asset Value | | | (0.01 | ) | | | 0.37 | |
| Net asset Value - end of period | | $ | 10.36 | | | $ | 10.37 | |
| | | | | | | | | |
Total Return(d) | | | 6.65 | % | | | 3.71 | %(e) |
| Supplemental Data: | |
| Net assets, end of period (in thousands) | | $ | 18,801 | | | $ | 16,798 | |
See Notes to Financial Statements.
RiverNorth Managed Volatility Fund |
Financial Highlights | For a share outstanding throughout the periods presented. |
| | | For the Year Ended September 30, 2014(a) | | | For the Period October 12, 2012 (Inception) to September 30, 2013 | |
Ratios to Average Net Assets (excluding interest expense and dividend expense on securities sold short) | | | | | | |
Ratio of expenses to average net assets excluding fee waivers and reimbursements(f) | | | 1.94 | % | | | 2.19 | %(g) |
Ratio of expenses to average net assets including fee waivers and reimbursements(f) | | | 1.80 | % | | | 1.80 | %(g) |
Ratio of net investment loss to average net assets excluding fee waivers and reimbursements(f) | | | (1.30 | %) | | | (0.98 | %)(g) |
Ratio of net investment loss to average net assets including fee waivers and reimbursements(f) | | | (1.16 | %) | | | (0.59 | %)(g) |
| | | | | | | | | |
Ratios to Average Net Assets (including interest expense and dividend expense on securities sold short) | | | | | | | | |
Ratio of expenses to average net assets excluding fee waivers and reimbursements(f) | | | 1.95 | % | | | N/A | |
Ratio of expenses to average net assets including fee waivers and reimbursements(f) | | | 1.82 | % | | | N/A | |
Ratio of net investment loss to average net assets excluding fee waivers and reimbursements(f) | | | (1.32 | %) | | | N/A | |
Ratio of net investment loss to average net assets including fee waivers and reimbursements(f) | | | (1.18 | %) | | | N/A | |
| Portfolio turnover rate | | | 318 | % | | | 603 | %(e) |
(a) | Prior to Janurary 1, 2014, the RiverNorth Managed Volatility Fund was known as the Rivernorth Dynamic Buy-Write Fund. |
(b) | Based on average shares outstanding during the period. |
(c) | Less than $(0.005) and$0.005per .share. |
(d) | Total return in the above table represents the rate that the investor would have earned or lost on an investment in the Fund, assuming reinvestment of dividends. |
(e) | Not annualized. |
(f) | The ratios exclude the impact of expenses of the underlying funds in which the Fund invests as represented in the Schedule of Investments. |
(g) | Annualized. |
See Notes to Financial Statements.
| RiverNorth Funds | Notes to Financial Statements |
| | September 30, 2014 |
1. ORGANIZATION
The RiverNorth Funds (the “Trust” or “Funds”) was established under the laws of Ohio by an Agreement and Declaration of Trust dated July 18, 2006 (the “Trust Agreement”). The Trust is an open‐end management investment company registered under the Investment Company Act of 1940, as amended (the “1940 Act”). The Trust Agreement permits the Board of Trustees (the “Board’ or “Trustees”) to authorize and issue an unlimited number of shares of beneficial interest of a separate series without par value. All classes of shares for each of the Funds have identical rights to earnings, assets and voting privileges, except for class‐specific expenses and exclusive rights to vote on matters affecting only individual classes.
The RiverNorth Core Opportunity Fund (the “Core Opportunity Fund”) was organized as a diversified series of the Trust on July 18, 2006 and commenced investment operations on December 27, 2006. The Core Opportunity Fund launched an institutional share class on August 11, 2014. The new share class was in addition to the existing R‐share class. The investment adviser to the Core Opportunity Fund is RiverNorth Capital Management, LLC (the “Adviser”). The investment objective of the Core Opportunity Fund is to seek long‐term capital appreciation and income.
The RiverNorth/DoubleLine Strategic Income Fund (the “Strategic Income Fund”) is a diversified series of the Trust and commenced investment operations on December 30, 2010. The Strategic Income Fund offers two series of shares, Class I Shares and Class R Shares. The investment adviser to the Strategic Income Fund is RiverNorth Capital Management, LLC. The Strategic Income Fund’s sub‐adviser is DoubleLine Capital, LP (“DoubleLine”). The investment objective of the Strategic Income Fund is current income and overall total return.
The RiverNorth Equity Opportunity Fund (the “Equity Opportunity Fund”) is a diversified series of the Trust and commenced investment operations on July 18, 2012. The Equity Opportunity Fund offers two series of shares, Class I Shares and Class R Shares. The investment adviser to the Equity Opportunity Fund is RiverNorth Capital Management, LLC. The investment objective of the Equity Opportunity Fund is overall total return consisting of long‐term capital appreciation and income. Prior to January 1, 2014 the name of the Equity Opportunity Fund was the RiverNorth/Manning & Napier Dividend Income Fund and the sub‐adviser was Manning & Napier, Advisors, LLC. On January 28, 2014 the strategy of the RiverNorth Equity Opportunity Fund changed to permit the RiverNorth Equity Opportunity Fund to gain exposure to the equity markets through exchange‐traded funds rather than individual dividend‐paying stocks.
The RiverNorth/Oaktree High Income Fund (the “High Income Fund”) is a diversified series of the Trust and commenced investment operations on December 28, 2012. The High Income Fund offers two series of shares, Class I Shares and Class R Shares. The investment adviser to the High Income Fund is RiverNorth Capital Management, LLC. The High Income Fund’s sub‐adviser is Oaktree Capital Management, L.P. (“Oaktree Capital,” and with DoubleLine, each a “Sub‐Adviser” or collectively, the “Sub‐Advisers”). The investment objective of the High Income Fund is overall total return consisting of long‐term capital appreciation and income.
The RiverNorth Managed Volatility Fund (the “Managed Volatility Fund”) is a non‐diversified series of the Trust and commenced investment operations on October 12, 2012. The investment adviser to the Managed Volatility Fund is RiverNorth Capital Management, LLC. The investment objective of the Managed Volatility Fund is total return with lower volatility than the Standard and Poor’s 500 Index. Prior to January 1, 2014 the name of the Managed Volatility Fund was the RiverNorth Dynamic Buy‐Write Fund. On January 28, 2014 the strategy of the RiverNorth Managed Volatility Fund changed to permit the RiverNorth Managed Volatility Fund to invest less than 80% of its net
| RiverNorth Funds | Notes to Financial Statements |
| | September 30, 2014 |
assets, plus any borrowings for investment purposes, in common stocks, preferred stocks and options on those securities.
2. SIGNIFICANT ACCOUNTING POLICIES
The following is a summary of significant accounting policies followed by the Funds. These policies are in conformity with U.S. generally accepted accounting principles (“GAAP”). The preparation of financial statements in accordance with GAAP requires management to make estimates and assumptions that affect the reported amounts and disclosures in the financial statements during the reporting period. Management believes the estimates and security valuations are appropriate; however, actual results may differ from those estimates, and the security valuations reflected in the financial statements may differ from the value the Funds ultimately realize upon sale of the securities. The financial statements have been prepared as of the close of the New York Stock Exchange (“NYSE”) on September 30, 2014.
Security Valuation: The Funds’ assets are generally valued at their market value using market quotations. If a market value quotation is unavailable a security may be valued at its estimated fair value as described in note 3.
Security Transactions and Related Income: The Funds follow industry practice and record security transactions on the trade date basis. The specific identification method is used for determining gains or losses for financial statements and income tax purposes. Dividend income is recorded on the ex‐dividend date or for certain foreign securities, when the information becomes available to the Funds and interest income is recorded on an accrual basis. Discounts and premiums on securities purchased are amortized or accreted using the effective interest method. Withholding taxes on foreign dividends have been provided for in accordance with the Funds’ understanding of the applicable country’s tax rules and rates. The ability of issuers of debt securities held by the Funds to meet their obligations may be affected by economic and political developments in a specific country or region.
Foreign Currency Translation: The books and records of the Funds are maintained in U.S. dollars. Investment valuations and other assets and liabilities initially expressed in foreign currencies are converted each business day into U.S. dollars based upon current exchange rates. Prevailing foreign exchange rates may generally be obtained at the close of the NYSE (normally, 4:00 p.m. Eastern time). The portion of realized and unrealized gains or losses on investments due to fluctuations in foreign currency exchange rates is not separately disclosed and is included in realized and unrealized gains or losses on investments, when applicable.
Foreign Securities: The Funds may directly purchase securities of foreign issuers. Investing in securities of foreign issuers involves special risks not typically associated with investing in securities of U.S. issuers. The risks include possible revaluation of currencies, the ability to repatriate funds, less complete financial information about companies and possible future adverse political and economic developments. Moreover, securities of many foreign issuers and their markets may be less liquid and their prices more volatile than those of securities of comparable U.S. issuers.
Other: The Funds hold certain investments which pay dividends to their shareholders based upon available funds from operations. It is possible for these dividends to exceed the underlying investments’ taxable earnings and profits resulting in the excess portion of such dividends being designated as a return of capital. Distributions received from investments in securities that represent a return of capital or capital gain are recorded as a reduction of the cost of investments or as a realized gain, respectively.
| RiverNorth Funds | Notes to Financial Statements |
| | September 30, 2014 |
Share Valuation: The net asset value (the “NAV”) is generally calculated as of the close of trading on the New York Stock Exchange (“the Exchange”) (normally 4:00 p.m. Eastern time) every day the Exchange is open. The NAV is calculated by taking the total value of each Fund’s or class’ assets, subtracting their liabilities, and then dividing by the total number of shares outstanding, rounded to the nearest cent. The offering price and redemption price per share is equal to the net asset value per share, except that shares of each Fund are subject to a redemption fee of 2% if redeemed within 90 days of purchase. For the year ended September 30, 2014, the Core Opportunity Fund, Strategic Income Fund, Equity Opportunity Fund, High Income Fund, and Managed Volatility Fund received redemption fees of $31,701, $89,235, $2,464, $10,318, and
$3,289, respectively.
Expenses: Some expenses of the Trust can be directly attributed to a Fund or a Fund specific share class. Expenses which cannot be directly attributed are apportioned among all Funds and Fund series classes in the Trust based on average net assets.
Federal Income Taxes: The Funds make no provision for federal income tax. Each Fund intends to qualify each year as a “regulated investment company” under subchapter M of the Internal Revenue Code of 1986, as amended, by distributing substantially all of its taxable income. If the required amount of net investment income is not distributed, the Funds could incur a tax expense.
As of and during the year ended September 30, 2014, the Funds did not have a liability for any unrecognized tax benefits. The Funds file U.S. federal, state, and local tax returns as required. The Funds’ tax returns are subject to examination by the relevant tax authorities until expiration of the applicable statute of limitations which is generally three years after the filing of the tax return for federal purposes and four years for most state returns. Tax returns for open years have incorporated no uncertain tax positions that require a provision for income taxes.
Distributions to Shareholders: Distributions to shareholders, which are determined in accordance with income tax regulations, are recorded on the ex‐dividend date. The treatment for financial reporting purposes of distributions made to shareholders during the year from net investment income or net realized capital gains may differ from their ultimate treatment for federal income tax purposes. These differences are caused primarily by differences in the timing of recognition of certain components of income, expense or realized capital gain for federal income tax purposes. Where such differences are permanent in nature, they are reclassified in the components of the net assets based on their ultimate characterization for federal income tax purposes. Any such reclassification will have no effect on net assets, results of operations or net asset values per share of the Funds.
3. SECURITIES VALUATION AND FAIR VALUE MEASUREMENTS
Fair value is defined as the price that a Fund might reasonably expect to receive upon selling an investment in a timely transaction to an independent buyer in the principal or most advantageous market of the investment. GAAP establishes a three‐tier hierarchy to maximize the use of observable market data and minimize the use of unobservable inputs and to establish classification of fair value measurements for disclosure purposes.
Inputs refer broadly to the assumptions that market participants would use in pricing the asset or liability, including assumptions about risk, for example, the risk inherent in a particular valuation technique used to measure fair value including such a pricing model and/or the risk inherent in the inputs to the valuation technique. Inputs may be observable or unobservable. Observable inputs are inputs that reflect the assumptions market participants would use in pricing the asset or
| RiverNorth Funds | Notes to Financial Statements |
| | September 30, 2014 |
liability developed based on market data obtained from sources independent of the reporting entity. Unobservable inputs are inputs that reflect the reporting entity’s own assumptions about the assumptions market participants would use in pricing the asset or liability developed based on the best information available in the circumstances.
Various inputs are used in determining the value of the Funds’ investments. These inputs are summarized in the three broad levels listed below.
| | • | Level 1 – Unadjusted quoted prices in active markets for identical, unrestricted assets or liabilities that a Fund has the ability to access at the measurement date; |
| | • | Level 2 – Quoted prices which are not active, quoted prices for similar assets or liabilities in active markets or inputs other than quoted prices that are observable (either directly or indirectly) for substantially the full term of the asset or liability; and |
| | • | Level 3 – Significant unobservable prices or inputs (including the Funds’ own assumptions in determining the fair value of investments) where there is little or no market activity for the asset or liability at the measurement date. |
The inputs used to measure fair value may fall into different levels of the fair value hierarchy. In such cases, for disclosure purposes, the level in the fair value hierarchy within which the fair value measurement falls in its entirety, is determined based on the lowest level input that is significant to the fair value measurement in its entirety.
Equity securities, including common stocks, closed‐end funds, exchange‐traded funds, holding and investment management companies, preferred stocks, and business development company senior notes are generally valued by using market quotations, but may be valued on the basis of prices furnished by a pricing service when the Adviser or a Sub‐Adviser believes such prices more accurately reflect the fair market value of such securities. Securities that are traded on any stock exchange are generally valued by the pricing service at the last quoted sale price. Lacking a last sale price, an exchange traded security is generally valued by the pricing service at its last bid price. Securities traded in the NASDAQ over‐the‐counter market are generally valued by the pricing service at the NASDAQ Official Closing Price. When using the market quotations or close prices provided by the pricing service and when the market is considered active, the security will be classified as a Level 1 security. Sometimes, an equity security owned by the Funds will be valued by the pricing service with factors other than market quotations or when the market is considered inactive. When this happens, the security will be classified as a Level 2 security. When market quotations are not readily available, when the Adviser or a Sub‐Adviser determines that the market quotation or the price provided by the pricing service does not accurately reflect the current fair value, or when restricted or illiquid securities are being valued, such securities are valued as determined in good faith by the Adviser, Sub‐Adviser, or valuation committee in conformity with guidelines adopted by and subject to review by the Board. These securities will be categorized as Level 3 securities.
Investments in mutual funds, including money market mutual funds, are generally priced at the ending net asset value (NAV) provided by the service agent of the funds. These securities will be categorized as Level 1 securities.
Domestic and foreign fixed income securities, including foreign and U.S. corporate bonds, foreign and U.S. government bonds and notes, supranationals and foreign agencies, non‐agency collateralized mortgage obligations, U.S. Government/Agency mortgage backed securities, bank loans, collateralized loan obligations, contingent convertible securities, and high yield debt, as well as non‐exchange traded derivatives, including forward foreign currency contracts and total return swaps, are normally valued on the basis of quotes obtained from brokers and dealers or independent pricing
| RiverNorth Funds | Notes to Financial Statements |
| | September 30, 2014 |
services. Total Return swaps are valued based on a formula of the underlying asset’s nightly value, the Overnight London‐Interbank Offered Rate (“USD‐LIBOR”) and an annual fee or various agreed upon inputs. Foreign Currency positions, including forward currency contracts, are priced at the mean between the closing bid and asked prices at 4:00 p.m. Eastern time. Prices obtained from independent pricing services typically use information provided by market makers or estimates of market values obtained from yield data relating to investments or securities with similar characteristics. Data used to establish quotes includes analysis of cash flows, pre‐payment speeds, default rates, delinquency assumptions and assumptions regarding collateral and loss assumptions. These securities will be classified as Level 2 securities.
Closing bid and ask option contract quotations are considered to be reflective of the option contract values as of the close of the regular session of trading on the New York Stock Exchange (the “stock market close”), and will be used to determine fair value of the option contracts. On days when the closing market quotations for option contracts are not considered to be reflective of their value as of the stock market close, each of the option contracts held by a Fund will be priced at the average of the bid and asked quotations as of the stock market close by reference to time‐stamped quotes obtained from an independent third‐party pricing source. If an acceptable quotation is unavailable for a particular contract, that contract will be priced at the mean of the valuations of the two most widely accepted and well documented methods for deriving prices for option contracts, the Black‐ Scholes model and the binomial model, as of the stock market close.
Short‐term investments in fixed income securities, with maturities of less than 60 days when acquired, or which subsequently are within 60 days of maturity, are valued by using the amortized cost method of valuation, which the Board has determined will represent fair value. These securities will be classified as Level 2 securities.
In accordance with the Funds’ good faith pricing guidelines, the Adviser, Sub‐Adviser, or valuation committee is required to consider all appropriate factors relevant to the value of securities for which it has determined other pricing sources are not available or reliable as described above. No single standard exists for determining fair value, because fair value depends upon the circumstances of each individual case. As a general principle, the current fair value of an issue of securities being valued by the Adviser, Sub‐Adviser, or valuation committee would appear to be the amount which the owner might reasonably expect to receive for them upon their current sale. Methods which are in accordance with this principle may, for example, be based on (i) a multiple of earnings; (ii) a discount from market of a similar freely traded security (including a derivative security or a basket of securities traded on other markets, exchanges or among dealers); or (iii) yield to maturity with respect to debt issues, or a combination of these and other methods. Good faith pricing is permitted if, in the Adviser’s, a Sub‐Adviser’s, or the valuation committee’s opinion, the validity of market quotations appears to be questionable based on factors such as evidence of a thin market in the security based on a small number of quotations, a significant event occurs after the close of a market but before a Funds’ NAV calculation that may affect a security’s value, or the Adviser or a Sub‐Adviser is aware of any other data that calls into question the reliability of market quotations.
Good faith pricing may also be used in instances when the bonds the Funds invest in default or otherwise cease to have market quotations readily available. Investments in foreign securities, junk bonds or other thinly traded securities are more likely to trigger good faith pricing than other securities.
| RiverNorth Funds | Notes to Financial Statements |
| | September 30, 2014 |
The following is a summary of the inputs used at September 30, 2014 in valuing the Funds’ assets and liabilities:
Core Opportunity Fund
| | | Valuation Inputs | | | | |
| Investments in Securities at Value* | | Level 1 | | | Level 2 | | | Level 3 | | | Total | |
| Closed‐End Funds | | $ | 452,851,186 | | | $ | – | | | $ | – | | | $ | 452,851,186 | |
| Exchange‐Traded Funds | | | 179,870,677 | | | | – | | | | – | | | | 179,870,677 | |
| Holding & Investment | | | | | | | | | | | | | | | | |
| Management Companies | | | 2,424,356 | | | | – | | | | – | | | | 2,424,356 | |
| Preferred Stocks | | | 1,572,984 | | | | – | | | | – | | | | 1,572,984 | |
| Short‐Term Investments | | | 110,923,286 | | | | – | | | | – | | | | 110,923,286 | |
| Total | | $ | 747,642,489 | | | | – | | | | – | | | $ | 747,642,489 | |
Strategic Income Fund
| | | Valuation Inputs | | | | |
| Investments in Securities at Value* | | Level 1 | | | Level 2 | | | Level 3 | | | Total | |
| Closed‐End Funds | | $ | 421,877,129 | | | $ | – | | | $ | – | | | $ | 421,877,129 | |
| Preferred Stocks | | | 19,886,270 | | | | – | | | | – | | | | 19,886,270 | |
| Business Development | | | | | | | | | | | | | | | | |
| Company Senior Notes | | | 22,763,600 | | | | – | | | | – | | | | 22,763,600 | |
| Foreign Corporate Bonds | | | – | | | | 45,731,610 | | | | – | | | | 45,731,610 | |
| U.S. Corporate Bonds | | | – | | | | 42,143,843 | | | | – | | | | 42,143,843 | |
| Foreign Government Bonds | | | | | | | | | | | | | | | | |
| and Notes, | | | | | | | | | | | | | | | | |
| Supranationals and | | | | | | | | | | | | | | | | |
| Foreign Agencies | | | – | | | | 801,655 | | | | – | | | | 801,655 | |
| Collateralized Loan | | | | | | | | | | | | | | | | |
| Obligations | | | – | | | | 12,779,158 | | | | – | | | | 12,779,158 | |
| Contingent Convertible | | | | | | | | | | | | | | | | |
| Securities | | | – | | | | 682,290 | | | | – | | | | 682,290 | |
| Non‐Agency Collateralized | | | | | | | | | | | | | | | | |
| Mortgage Obligations | | | – | | | | 324,731,905 | | | | – | | | | 324,731,905 | |
| U.S. Government Bonds | | | | | | | | | | | | | | | | |
| and Notes | | | – | | | | 39,161,773 | | | | – | | | | 39,161,773 | |
| U.S. Government / Agency Mortgage Backed Securities | | | – | | | | 166,184,167 | | | | – | | | | 166,184,167 | |
| Short‐Term Investments | | | 272,070,916 | | | | – | | | | – | | | | 272,070,916 | |
| Total | | $ | 736,597,915 | | | $ | 632,216,401 | | | $ | – | | | $ | 1,368,814,316 | |
| RiverNorth Funds | Notes to Financial Statements |
| | September 30, 2014 |
Equity Opportunity Fund
| | | Valuation Inputs | | | | |
| Investments in Securities at Value* | | Level 1 | | | Level 2 | | | Level 3 | | | Total | |
| Closed‐End Funds | | $ | 7,897,446 | | | $ | – | | | $ | – | | | $ | 7,897,446 | |
| Exchange‐Traded Funds | | | 2,496,802 | | | | – | | | | – | | | | 2,496,802 | |
| Short‐Term Investments | | | 93,927 | | | | – | | | | – | | | | 93,927 | |
| Total | | $ | 10,488,175 | | | $ | – | | | $ | – | | | $ | 10,488,175 | |
High Income Fund
| | | Valuation Inputs | | | | |
| Investments in Securities at Value* | | Level 1 | | | Level 2 | | | Level 3 | | | Total | |
| Closed‐End Funds | | $ | 19,661,547 | | | $ | – | | | $ | – | | | $ | 19,661,547 | |
| Bank Loans | | | – | | | | 25,940,341 | | | | 130,293 | | | | 26,070,634 | |
| Business Development | | | | | | | | | | | | | | | | |
| Company Senior Notes | | | 127,100 | | | | – | | | | – | | | | 127,100 | |
| High Yield Debt | | | – | | | | 35,708,955 | | | | – | | | | 35,708,955 | |
| Short‐Term Investments | | | 4,439,626 | | | | – | | | | – | | | | 4,439,626 | |
| Total | | $ | 24,228,273 | | | $ | 61,649,296 | | | $ | 130,293 | | | $ | 86,007,862 | |
| | | Valuation Inputs | | | | |
| Other Financial Instruments** | | Level 1 | | | Level 2 | | | Level 3 | | | Total | |
| Assets | | | | | | | | | | | | |
Forward Foreign Currency Contracts | | $ | – | | | $ | 380,973 | | | $ | – | | | $ | 380,973 | |
| Total | | $ | – | | | $ | 380,973 | | | $ | – | | | $ | 380,973 | |
Managed Volatility Fund
| | | Valuation Inputs | | | | |
| Investments in Securities at Value* | | Level 1 | | | Level 2 | | | Level 3 | | | Total | |
| Common Stocks | | $ | 1,644,993 | | | $ | – | | | $ | – | | | $ | 1,644,993 | |
| Exchange‐Traded Funds | | | 2,821,925 | | | | – | | | | – | | | | 2,821,925 | |
| Purchased Options | | | 243,964 | | | | – | | | | – | | | | 243,964 | |
| Short‐Term Investments | | | 11,529,893 | | | | – | | | | – | | | | 11,529,893 | |
| Total | | $ | 16,240,775 | | | $ | – | | | $ | – | | | $ | 16,240,775 | |
| | | Valuation Inputs | | | | |
| Other Financial Instruments** | | Level 1 | | | Level 2 | | | Level 3 | | | Total | |
| Liabilities | | | | | | | | | | | | |
| Written Options | | $ | (442,151 | ) | | $ | – | | | $ | – | | | $ | (442,151 | ) |
| Total | | $ | (442,151 | ) | | $ | – | | | $ | – | | | $ | (442,151 | ) |
| * | Refer to each Fund’s Schedule of Investments for a listing of securities by type. |
| ** | Other financial instruments are derivative instruments not reflected in the Schedule of Investments. |
| RiverNorth Funds | Notes to Financial Statements |
| | September 30, 2014 |
The changes of the fair value of investments for which the Funds have used Level 3 inputs to determine the fair value are as follows:
Investments in Securities | | Balance as of September 30, 2013 | | | Accrued discount/ premium | | | Return of Capital | | | Realized Gain/ (Loss) | | | Change in Unrealized Appreciation/ (Depreciation) | | | Purchased | | | Sales Proceeds | | | Transfer into Level 3 | | | Transfer out of Level 3 | | | Balance as of September, 2014 | | | Net change in unrealized appreciation/ (depreciation) included in the Statements of Operations attributable to Level 3 investments held at September 30, 2014 | |
| High Income Fund | | | | | | | | | | | | | | | | | | | | | | | | | | | | |
| Bank Loans | | $ | – | | | $ | 16 | | | $ | – | | | $ | – | | | $ | (37 | ) | | $ | 131,151 | | | $ | (837 | ) | | $ | – | | | $ | – | | | $ | 130,293 | | | $ | (37 | ) |
| Total | | $ | – | | | $ | 16 | | | $ | – | | | $ | – | | | $ | (37 | ) | | $ | 131,151 | | | $ | (837 | ) | | $ | – | | | $ | – | | | $ | 130,293 | | | $ | (37 | ) |
The table below provides additional information about the Level 3 Fair Value Measurements as of September 30, 2014:
Quantitative Information about Level 3 Fair Value Measurements
High Income Fund
| Asset Class | | Fair Value (USD) | | Valuation Technique | Unobservable Inputs(a) |
| Bank Loans | | $ | 130,293 | | Third‐Party Vendor Pricing Service | Vendor Quote |
| (a) | A change to the unobservable input may result in a significant change to the value of the investment as follows: |
| Unobservable Input | Impact to Value if Input Increases | Impact to Value if Input Decreases |
| Vendor Quote | Increase | Decrease |
It is the Funds’ policy to recognize transfers into and out of the Levels 1 and 2 at the end of the reporting period.
There were no transfers into and out of Levels 1 and 2 during the current year presented.
4. DERIVATIVE FINANCIAL INSTRUMENTS
The following discloses the Funds’ use of derivative instruments. The Funds’ investment objectives not only permit the Funds to purchase investment securities, they also allow the Funds to enter into various types of derivative contracts such as purchased and written options, total return swap contracts and forward foreign currency contracts. In doing so, the Funds will employ strategies in differing combinations to permit them to increase, decrease, or change the level or types of exposure to market factors. Central to those strategies are features inherent to derivatives that make them more attractive for this purpose than equity or debt securities; they require little or no initial cash investment, they can focus exposure on only certain selected risk factors, and they may not require the ultimate receipt or delivery of the underlying security (or securities) to the contract. This may allow the Funds to pursue their objectives more quickly and efficiently than if they were to make direct purchases or sales of securities capable of effecting a similar response to market factors.
| RiverNorth Funds | Notes to Financial Statements |
| | September 30, 2014 |
Market Risk Factors: In pursuit of their investment objectives, the Funds may seek to use derivatives to increase or decrease their exposure to the following market risk factors:
Equity Risk: Equity risk relates to the change in value of equity securities as they relate to increases or decreases in the general market.
Foreign Exchange Rate Risk: Foreign exchange rate risk relates to the change in the U.S. dollar value of a security held that is denominated in a foreign currency. The value of a foreign currency denominated security will decrease as the dollar appreciates against the currency, while the value of the foreign currency denominated security will increase as the dollar depreciates against the currency.
Risk of Investing in Derivatives
The Funds’ use of derivatives can result in losses due to unanticipated changes in the market risk factors and the overall market. Derivatives may have little or no initial cash investment relative to their market value exposure and therefore can produce significant gains or losses in excess of their cost. This use of embedded leverage allows the Funds to increase their market value exposure relative to their net assets and can substantially increase the volatility of the Funds’ performance.
Additional associated risks from investing in derivatives also exist and potentially could have significant effects on the valuation of the derivative and the Funds. Typically, the associated risks are not the risks that the Funds are attempting to increase or decrease exposure to, per their investment objectives, but are the additional risks from investing in derivatives.
Examples of these associated risks are liquidity risk, which is the risk that the Funds will not be able to sell the derivative in the open market in a timely manner, and counterparty credit risk, which is the risk that the counterparty will not fulfill its obligation to the Funds.
Option Writing/Purchasing
The Managed Volatility Fund may write or purchase option contracts to adjust risk and return of their overall investment positions. When the Managed Volatility Fund writes or purchases an option, an amount equal to the premium received or paid by the Managed Volatility Fund is recorded as a liability or an asset and is subsequently adjusted to the current market value of the option written or purchased. Premiums received or paid from writing or purchasing options that expire unexercised are treated by the Managed Volatility Fund on the expiration date as realized gains or losses. The difference between the premium and the amount paid or received on effecting a closing purchase or sale transaction, including brokerage commissions, is also treated as a realized gain or loss. If an option is exercised, the premium paid or received is added to the cost of the purchase or proceeds from the sale in determining whether the Managed Volatility Fund has realized a gain or loss on investment transactions. Risks from entering into option transactions arise from the potential inability of counterparties to meet the terms of the contracts, the potential inability to enter into closing transactions because of an illiquid secondary market and from unexpected movements in security values. Cash held as collateral for written option contracts is shown on the Managed Volatility Fund’s Statement of Assets and Liabilities.
Forward Foreign Currency Contracts
The Funds may engage in currency transactions with counterparties to hedge the value of portfolio securities denominated in particular currencies against fluctuations in relative value, to gain or reduce exposure to certain currencies, or to generate income or gains. A forward foreign currency
| RiverNorth Funds | Notes to Financial Statements |
| | September 30, 2014 |
contract is an agreement between two parties to buy and sell a currency at a set price on a future date. During the year ended September 30, 2014, the High Income Fund engaged in forward foreign currency contracts. The contracts are marked‐to‐market daily and the change in value is recorded by the High Income Fund as an unrealized gain or loss. When a forward foreign currency contract is extinguished, through either delivery or offset by entering into another forward foreign currency contract, the High Income Fund records a realized gain or loss equal to the difference between the value of the contract at the time it was opened and the value of the contract at the time it was extinguished.
Forward foreign currency contracts involve elements of market risk in excess of the amounts reflected in the Statements of Assets and Liabilities. The High Income Fund bears the risk of an unfavorable change in the foreign exchange rate underlying the forward foreign currency contract. Risks may also arise upon entering into these contracts from the potential inability of the counterparties to meet the terms of their contracts.
Total Return Swaps
Certain Funds may enter into total return swaps. During the year ended September 30, 2014, the Core Opportunity Fund invested in a total return swap. Total return swaps are agreements that provide the Fund with a return based on the performance of an underlying asset, in exchange for fee payments to a counterparty based on a specific rate. The difference in the value of these income streams is recorded daily by the Fund, and is settled in cash at the end of each month or if the cumulative amount owed to either party is greater than or equal to $250,000. The fee paid by the Fund will typically be determined by multiplying the face value of the swap agreement by an agreed upon interest rate. In addition, if the underlying asset declines in value over the term of the swap, the Fund would also be required to pay the dollar value of that decline to the counterparty. Total return swaps could result in losses if the underlying asset does not perform as anticipated by the Adviser. The Fund may use its own net asset value as the underlying asset in a total return swap. This strategy serves to reduce cash drag (the impact of cash on the Fund’s overall return) by replacing it with the impact of market exposure based upon the Fund’s own investment holdings. The Fund records fluctuations in the value of open swap contracts on a daily basis as unrealized gains or losses. Net amounts received or paid on the swap contracts are recorded as realized gains or losses. The Fund values the total return swaps in which it enters based on a formula of the underlying asset’s nightly value, the Overnight London‐Interbank Offered Rate (“USD‐LIBOR”) and an annual fee or various agreed upon inputs. These securities will be categorized as Level 2 securities. The Core Opportunity Fund has an agreement with ReFlow Fund, LLC to receive the total return of the Fund, based on its daily change in NAV less USD‐LIBOR plus an annualized spread of 1.95%. The agreement terminates November 28, 2014.
At September 30, 2014, the receivable for the open swap agreement was $0. In accordance with the swap contract, the Core Opportunity Fund has the ability to adjust the notional amount on a daily basis. For the year ended September 30, 2014, the change in notional amount of the swap positions in the Core Opportunity Fund is summarized below:
| Beginning of Period | | $ | 0 | |
| Increases | | | 20,000,000 | |
| Decreases | | | (20,000,000 | ) |
| End of Period | | $ | 0 | |
| RiverNorth Funds | Notes to Financial Statements |
| | September 30, 2014 |
The Managed Volatility Fund had the following transactions in written options during the year ended September 30, 2014.
| | | | Number of Contracts | | | | Premiums | |
| Balance as of September 30, 2013 | | | 3,206 | | | $ | 345,925 | |
| Options Written | | | 29,872 | | | | 2,482,801 | |
| Options Expired | | | (20,572 | ) | | | (1,557,777 | ) |
| Options Closed | | | (6,153 | ) | | | (638,514 | ) |
| Options Exercised | | | (3,503 | ) | | | (331,288 | ) |
| Options Split | | | 51 | | | | – | |
| Balance as of September 30, 2014 | | | 2,901 | | | $ | 301,147 | |
The effect of derivatives instruments on each Fund's Statement of Assets and Liabilities as of September 30, 2014:
| | | Asset Derivatives |
| Fund | Risk Exposure | Statement of Assets and Liabilities Location | | Fair Value | |
| High Income Fund | Foreign exchange rate risk (Forward foreign currency contracts) | Unrealized appreciation on forward foreign currency contracts | | $ | 380,973 | |
| Managed Volatility Fund | Equity Contracts (Purchased Options) | Investments in securities, at value | | $ | 243,964 | |
| | | Liabilities Derivatives |
| Fund | Risk Exposure | Statement of Assets and Liabilities Location | | Fair Value | |
| Managed Volatility Fund | Equity Contracts (Purchased Options) | Written options, at value | | $ | (442,151 | ) |
The effect of derivatives instruments on each Fund's Statement of Operations for the year ended September 30, 2014:
| Fund | Risk Exposure | Statement of Operations Location | | Realized Gain/(Loss) on Derivatives Recognized in Income | | | Change in Unrealized Gain/(Loss) on Derivatives Recognized in Income | |
Core Opportunity Fund | Equity Contracts (Total Return Swap Contracts | Net realized gain on Total return swap contracts | | $ | 249,168 | | | $ | – | |
| RiverNorth Funds | Notes to Financial Statements |
| | September 30, 2014 |
| Fund | Risk Exposure | Statement of Operations Location | | Realized Gain/(Loss) on Derivatives Recognized in Income | | | Change in Unrealized Gain/(Loss) on Derivatives Recognized in Income | |
| High Income Fund | Foreign exchange rate risk (Forward foreign currency contracts) | Net realized gain/(loss) on Foreign currency transactions/ Net change in unrealized appreciation on Translation of assets and liabilities denominated in foreign currencies | | $ | 582,554 | | | $ | 616,361 | |
| Managed Volatility Fund | Equity Contracts (Purchased Options) | Net realized gain/(loss) on Investments/Net change in unrealized appreciation/(depreciation) on Investments | | $ | (777,327 | ) | | $ | 6,478 | |
| Managed Volatility Fund | Equity Contracts (Written Options) | Net realized gain/(loss) on Written options/Net change in unrealized appreciation/(depreciation) on Written options | | $ | 1,607,039 | | | $ | (60,046 | ) |
| | | | | $ | 829,712 | | | $ | (53,568 | ) |
The average purchased and written option contracts, forward currency contracts, and total return swap contract notional amount during the year ended September 30, 2014 is noted below.
| Fund | | Average Notional Amount of Total Return Swap Contracts* | |
| Core Opportunity Fund | | $ | 20,000,000 | |
| * | For the period in which the total return swap was held. |
| Fund | | Average Notional Amount of Forward Foreign Currency Contracts | |
| High Income Fund | | $ | 11,519,587 | |
| Fund | Average Purchased Option Contract Volume | Average Written Option Contract Volume |
| Managed Volatility Fund | 1,898 | (3,548) |
Certain derivative contracts are executed under either standardized netting agreements or, for exchange‐traded derivatives, the relevant contracts for a particular exchange which contain enforceable netting provisions. A derivative netting arrangement creates an enforceable right of set‐off that becomes effective, and affects the realization of settlement on individual assets, liabilities and collateral amounts, only following a specified event of default or early termination.
| RiverNorth Funds | Notes to Financial Statements |
| | September 30, 2014 |
Default events may include the failure to make payments or deliver securities timely, material adverse changes in financial condition or insolvency, the breach of minimum regulatory capital requirements, or loss of license, charter or other legal authorization necessary to perform under the contract. Balance Sheet netting was considered and it was determined there are no master netting agreements related to the Funds’ positions in options and forward foreign currency contracts.
5. SHORT SALES
The Managed Volatility Fund may enter into short sales transactions to realize additional gains or hedge investments. Short sales are transactions in which the Managed Volatility Fund sells a security that it may not own. When the Managed Volatility Fund engages in a short sale, it may borrow the security sold short and deliver it to the counterparty. The Managed Volatility Fund will ordinarily have to pay a fee or premium to borrow a security and be obligated to repay the lender of the security any dividend or interest that accrues on the security during the period of the loan. Securities sold in short sale transactions and the dividend or interest payable on such securities, if any, are reflected as payable for short sales on the Statement of Assets and Liabilities. Short sales expose the Managed Volatility Fund to the risk that it will be required to cover its short position at a time when the security or other asset has appreciated in value, thus resulting in losses to the Managed Volatility Fund. A Fund’s loss on a short sale could theoretically be unlimited in cases where the Fund is unable, for whatever reason, to close out its short position.
6. LOAN PARTICIPATIONS AND ASSIGNMENTS
The High Income Fund may invest in direct debt instruments which are interests in amounts owed to lenders or lending syndicates by corporate, governmental, or other borrowers. The High Income Fund will normally invest in corporate debt issuers in North America and Europe. The High Income Fund investments in loans may be in the form of participations in loans or assignments of all or a portion of loans from third parties. A loan is often administered by a bank or other financial institution (the “lender”) that acts as agent for all holders. The agent administers the terms of the loan, as specified in the loan agreement. The High Income Fund may invest in multiple series or tranches of a loan, which may have varying terms and carry different associated risks. The High Income Fund will generally purchase assignments of these loans, in which case it will typically become a lender for purposes of the relevant loan agreement with direct contractual rights against the borrower, including the right to receive payments of principal and interest. When purchasing participation interests in a loan, the High Income Fund generally has no right to enforce compliance with the terms of the loan agreement with the borrower. As a result, the High Income Fund may be subject to the credit risk of both the borrower and the lender that is selling the loan agreement. The High Income Fund may enter into unfunded loan commitments, which are contractual obligations for future funding. Unfunded loan commitments represent a future obligation in full, even though a percentage of the notional loan amounts may not be utilized by the borrower. When investing in a loan participation, the High Income Fund has the right to receive payments of principal, interest and any fees to which it is entitled only from the lender selling the loan agreement and only upon receipt of payments by the lender from the borrower. The High Income Fund may receive a commitment fee based on the undrawn portion of the underlying line of credit portion of a floating rate loan. In certain circumstances, the High Income Fund may receive a penalty fee upon the prepayment of a floating rate loan by a borrower. Fees earned or paid are recorded as a component of interest income or interest expense, respectively, on the Statement of Operations. At September 30, 2014, the High Income Fund had $3,952,730 in unsettled domestic and foreign loan commitments.
| RiverNorth Funds | Notes to Financial Statements |
| | September 30, 2014 |
7. INVESTMENT ADVISORY FEE AND OTHER TRANSACTIONS WITH AFFILIATES
The Adviser serves as the investment adviser to the Funds. Under the terms of the management agreement (the “Agreement”), the Adviser, subject to the supervision of the Board, provides or arranges to be provided to the Funds such investment advice as it deems advisable and will furnish or arrange to be furnished a continuous investment program for the Funds consistent with the Funds’ investment objectives and policies. As compensation for its management services, the Funds are obligated to pay the Adviser a fee computed and accrued daily and paid monthly in arrears at an annual rate of the average daily net assets of the Funds.
The following table reflects the Funds’ contractual management fee rates (expressed as an annual rate).
| Fund | Contractual Management Fee |
| Core Opportunity Fund | 1.00% |
| Strategic Income Fund | 0.75% |
| Equity Opportunity Fund | 1.00% |
| High Income Fund | 1.00% |
| Managed Volatility Fund | 1.00% |
The Adviser has contractually agreed to defer the collection of the Funds’ management fees and/or reimburse expenses, but only to the extent necessary to limit net annual operating expenses (excluding brokerage fees and commissions; borrowing costs, such as (a) interest and (b) dividends on securities sold short; taxes; indirect expenses incurred by the underlying funds in which the Funds’ invest; and extraordinary expenses), including amortized offering costs as a percentage of the average daily net assets of the Funds. Each deferral of fees or reimbursements of expenses by the Adviser are subject to repayment by the Fund within the three fiscal years following the fiscal year in which the expenses were incurred, provided that the Fund is able to make the repayment without exceeding the below expense limitations and the repayment is approved by the Board.
Fund | Class I | Class R | Expiration of Expense Limitation Agreement |
| Core Opportunity Fund | 1.35%* | 1.60% | January 31, 2016 |
| Strategic Income Fund | 0.95% | 1.20% | January 31, 2015 |
| Equity Opportunity Fund | 1.35% | 1.60% | January 31, 2015 |
| High Income Fund | 1.35% | 1.60% | January 31, 2015 |
| Managed Volatility Fund | N/A | 1.80% | January 31, 2015 |
| * | Commenced operations on August 11, 2014. |
| RiverNorth Funds | Notes to Financial Statements |
| | September 30, 2014 |
As of the year ended September 30, 2014, reimbursed expenses for each Fund subject to potential recovery by year of expiration are as follows:
| | | Expiring September 30, | |
| | | 2015 | | | 2016 | | | 2017 | |
| Fund/Class | | | | | | | | | |
| Core Opportunity Fund | | | | | | | | | |
| Class I* | | | N/A | | | | N/A | | | | N/A | |
| Class R | | | N/A | | | | N/A | | | | N/A | |
| | | | | | | | | | | | | |
| Strategic Income Fund | | | | | | | | | | | | |
| Class I* | | | N/A | | | | N/A | | | | N/A | |
| Class R | | | N/A | | | | N/A | | | | N/A | |
| | | | | | | | | | | | | |
| Equity Opportunity Fund | | | | | | | | | | | | |
| Class I | | $ | 5,553 | | | $ | 19,714 | | | $ | 17,095 | |
| Class R | | | 36,038 | | | | 65,892 | | | | 65,618 | |
| Total | | $ | 41,591 | | | $ | 85,606 | | | $ | 82,713 | |
| | | | | | | | | | | | | |
| High Income Fund | | | | | | | | | | | | |
| Class I | | | N/A | | | $ | 26,539 | | | $ | 19,885 | |
| Class R | | | N/A | | | | 20,011 | | | | 7,302 | |
| Total | | | N/A | | | $ | 46,550 | | | $ | 27,187 | |
| | | | | | | | | | | | | |
| Managed Volatility Fund | | | N/A | | | $ | 61,295 | | | $ | 24,089 | |
| * | Commenced operations on August 11, 2014. |
DoubleLine is the investment sub‐adviser to the Strategic Income Fund. Oaktree Capital is the investment sub‐adviser to the High Income Fund. Under the terms of the sub‐advisory agreements, the Sub‐Advisers, subject to the supervision of the Adviser and the Board of the Trust, provide or arrange to be provided to the Strategic Income Fund and the High Income Fund such investment advice as deemed advisable and will furnish or arrange to be furnished a continuous investment program for the portion of assets managed in the respective Fund consistent with the respective Fund's investment objective and policies. As compensation for its sub‐advisory services, the Adviser is obligated to pay each Sub‐Adviser a fee computed and accrued daily and paid monthly in arrears based on an annual rate of the average daily net assets of the Strategic Income Fund and the High Income Fund.
ALPS Fund Services, Inc. (“ALPS”) provides the Funds with fund administration and fund accounting services. ALPS also serves as transfer, dividend paying and shareholder servicing agent for the Funds (“Transfer Agent”).
The Northern Trust Company served as the Funds’ custodian until the transition to State Street Bank & Trust, Co. on March 3, 2014.
The Funds have adopted a plan pursuant to Rule 12b‐1 under the Investment Company Act of 1940, as amended (the “Plan”). The Plan permits the Funds to pay the Adviser for distribution and promotion expenses related to marketing shares of the Funds. The amount payable annually by
| RiverNorth Funds | Notes to Financial Statements |
| | September 30, 2014 |
the Class R shares of the Core Opportunity Fund, the Class R Shares of the Strategic Income Fund, the Class R Shares of the Equity Opportunity Fund, the Managed Volatility Fund, and the Class R Shares of the High Income Fund is 0.25% of the average daily net assets. Under the Plan the Trust may engage in any activities related to the distribution of Fund shares. The expenses of the Funds’ Plan are reflected as 12b‐1 fees in the statement of operations.
The Funds have entered into a Distribution Agreement with ALPS Distributors, Inc (“the Distributor”) to provide distribution services to the Funds. The Distributor serves as underwriter/distributor of shares of the Funds.
Officers of the Trust and Trustees who are “interested persons” of the Trust or the Adviser will receive no salary or fees from the Trust. Each Trustee who is not an “interested person” receives a fee of $36,000 per year. The audit committee chairman receives an additional $1,000 per year. The Trust reimburses each Trustee and Officer for his or her travel and other expenses relating to attendance at such meetings.
Certain Trustees and Officers of the Trust are also officers of the Adviser, the Distributor or the Administrator.
8. TAX BASIS INFORMATION
Tax Basis of Distributions to Shareholders
Tax Basis of Distributions to Shareholders: The character of distributions made during the year from net investment income or net realized gains may differ from its ultimate characterization for federal income tax purposes. Also, due to the timing of dividend distributions, the fiscal year in which amounts are distributed may differ from the fiscal year in which the income or realized gain were recorded by a Fund.
The tax character of distributions paid by the Funds during the fiscal year ended September 30, 2014, was as follows:
| | | Ordinary Income | | | Tax-Exempt Income | | | Distributions paid from Long-Term | | | Return of Capital | | | Total | |
| Core Opportunity Fund* | | $ | 9,263,037 | | | $ | 66,973 | | | $ | 35,460,760 | | | $ | – | | | $ | 44,790,770 | |
| Strategic Income Fund* | | | 67,984,676 | | | | – | | | | 4,321,081 | | | | – | | | | 72,305,757 | |
| Equity Opportunity Fund* | | | 922,410 | | | | – | | | | 282,200 | | | | – | | | | 1,204,610 | |
| High Income Fund* | | | 3,553,781 | | | | – | | | | – | | | | – | | | | 3,553,781 | |
| Managed Volatility Fund* | | | 1,186,667 | | | | – | | | | – | | | | – | | | | 1,186,667 | |
| RiverNorth Funds | Notes to Financial Statements |
| | September 30, 2014 |
The tax character of distributions paid by the Funds during the fiscal year ended September 30, 2013, was as follows:
| | | Ordinary Income | | | Tax-Exempt Income | | | Distributions paid from Long-Term | | | Return of Capital | | | Total | |
| Core Opportunity Fund* | | $ | 15,176,518 | | | $ | – | | | $ | 23,026,975 | | | $ | – | | | $ | 38,203,493 | |
| Strategic Income Fund* | | | 81,042,978 | | | | – | | | | 3,447,829 | | | | – | | | | 84,490,807 | |
| Equity Opportunity Fund* | | | 563,141 | | | | – | | | | 2,419 | | | | – | | | | 565,560 | |
| High Income Fund* | | | 405,890 | | | | – | | | | 11,511 | | | | 288,543 | | | | 705,944 | |
| Managed Volatility Fund* | | | 622 | | | | – | | | | 157 | | | | – | | | | 779 | |
| * | Classifications of Distributions: Net investment income and net realized gain may differ for financial statement and tax purposes. The character of distributions made during the year from net investment income or net realized gains may differ from its ultimate characterization for federal income tax purposes. |
Components of Distributable Earnings on a Tax Basis: The tax components of distributable earnings are determined in accordance with income tax regulations which may differ from the composition of net assets reported under GAAP. Accordingly, for the year ended September 30, 2014, certain differences were reclassified. These differences were primarily due to book/tax distribution differences, to the different tax treatment of organizational costs and certain other investments; the amounts reclassified did not affect net assets. The reclassifications were as follows:
| | | Increase/(Decrease) Paid-in Capital | | | Increase Accumulated Net Investment Income | | | (Decrease) Accumulated Net Realized Gain/(Loss) | |
| Core Opportunity Fund | | $ | – | | | $ | 5,763,296 | | | $ | (5,763,296 | ) |
| Strategic Income Fund | | | – | | | | 7,221,428 | | | | (7,221,428 | ) |
| Equity Opportunity Fund | | | – | | | | 368,682 | | | | (368,682 | ) |
| High Income Fund | | | 808 | | | | 329,745 | | | | (330,553 | ) |
| Managed Volatility Fund | | | (856 | ) | | | 206,125 | | | | (205,269 | ) |
| RiverNorth Funds | Notes to Financial Statements |
| | September 30, 2014 |
At September 30, 2014, the components of distributable earnings on a tax basis for the Funds were as follows:
| | | Undistributed Ordinary Income | | | Accumulated Capital Gains/( Losses) | | | Net Unrealized Appreciation/(Depreciation) | | | Other Cumulative Effect of Timing Differences | | | Total | |
| Core Opportunity Fund | | $ | 16,478,925 | | | $ | 45,605,011 | | | $ | 67,423,363 | | | $ | – | | | $ | 129,507,299 | |
| Strategic Income Fund | | | 346,376 | | | | (6,389,418 | ) | | | 11,702,026 | | | | (87,333 | ) | | | 5,571,651 | |
| Equity OpportunityFund | | | 224,725 | | | | 1,422,327 | | | | 715,996 | | | | – | | | | 2,363,048 | |
| High Income Fund | | | 2,019,918 | | | | 175,456 | | | | (976,033 | ) | | | (381,155 | ) | | | 838,186 | |
| Managed Volatility Fund | | | 1,051,693 | | | | – | | | | (309,479 | ) | | | (85,062 | ) | | | 657,152 | |
Capital Losses: As of September 30, 2014 the following Funds had capital loss carryforwards which may reduce the applicable Fund’s taxable income arising from future net realized gains on investments, if any, to the extent permitted by the Code and thus may reduce the amount of the distributions to shareholders which would otherwise be necessary to relieve the Funds of any liability for federal tax pursuant to the Code.
Capital losses carried forward were as follows:
| Fund | | Short-Term | | | Long-Term | |
| Strategic Income Fund | | $ | 5,059,657 | | | $ | – | |
The Strategic Income Fund has elected to defer to the period ending September 30, 2015 capital losses recognized during the period November 1, 2013 to September 30, 2014 in the amount of $1,329,761.
| RiverNorth Funds | Notes to Financial Statements |
| | September 30, 2014 |
Unrealized Appreciation and Depreciation on Investments: The amount of net unrealized appreciation/(depreciation) and the cost of investment securities for tax purposes, including short‐ term securities at September 30, 2014, were as follows:
| Fund | | Gross Appreciation (excess of value over tax) | | | Gross Depreciation (excess of tax cost over value) | | | Net Appreciation/(Depreciation) on Foreign Currency and Derivatives | | | Net Unrealized Appreciation/(Depreciation) | | | Cost of Investment for Income Tax Purposes | |
| Core OpportunityFund | | $ | 81,915,199 | | | $ | (14,491,836 | ) | | $ | – | | | $ | 67,423,363 | | | $ | 680,219,126 | |
| Strategic Income Fund | | | 58,918,317 | | | | (47,216,291 | ) | | | – | | | | 11,702,026 | | | | 1,357,112,290 | |
| Equity Opportunity Fund | | | 806,181 | | | | (90,185 | ) | | | – | | | | 715,996 | | | | 9,772,179 | |
| High Income Fund | | | 601,150 | | | | (2,087,283 | ) | | | 510,100 | | | | (976,033 | ) | | | 87,493,995 | |
| Managed Volatility Fund | | | 253,107 | | | | (421,582 | ) | | | (141,004 | ) | | | (309,479 | ) | | | 16,409,250 | |
| * | The difference between book and tax basis unrealized appreciation/(depreciation) for the Funds is attributable primarily to PFIC’s, wash sales and tax treatment of certain other invetments. |
9. INVESTMENTS TRANSACTIONS
Investment transactions for the year ended September 30, 2014, excluding U.S. Government Obligations and short‐term investments, were as follows:
| Fund | | Purchases of Securities | | | Proceeds from Sales of Securities | |
| Core Opportunity Fund | | $ | 341,997,561 | | | $ | 285,443,567 | |
| Strategic Income Fund | | | 489,082,353 | | | | 426,348,312 | |
| Equity Opportunity Fund | | | 12,742,352 | | | | 17,146,977 | |
| High Income Fund | | | 99,366,675 | | | | 63,422,994 | |
| Managed Volatility Fund | | | 18,077,715 | | | | 22,719,751 | |
Investment Transactions in U.S. Government Obligations for the year ended September 30, 2014 were as follows:
| Fund | | Purchases of Securities | | | Proceeds from Sales of Securities | |
| Strategic Income Fund | | $ | 124,568,946 | | | $ | 126,854,991 | |
10. REVOLVING LINE OF CREDIT
The Funds had a $100,000,000 Revolving Credit Agreement with The Northern Trust Company prior to the transition of the Funds’ custodian to State Street Bank & Trust, Co. on March 3, 2014. Borrowings under this arrangement were secured by investments held in each Fund’s portfolio and
| RiverNorth Funds | Notes to Financial Statements |
| | September 30, 2014 |
incurred interest at the Federal Funds Rate in effect on the day the loan was made plus 1.15% or a minimum of 1.75%, whichever was greater. For unloaned balances the Funds paid a facility fee equal to the product of $100,000,000 less the principal amount of loans outstanding and 0.15%. This fee is reported on the Statements of Operations as Facility Loan Fee. This contract was terminated with the transition of the Funds’ custodian.
On April 8, 2014 the Funds entered into a $100,000,000 unsecured Revolving Credit Agreement with State Street Bank & Trust, Co. Borrowings under this arrangement bear interest at the higher of the Federal Funds Rate and the One‐Month LIBOR Rate in effect on the day the loan is made plus 1.25%, whichever is greater. For unloaned balances the Funds pay a facility fee equal to the product of $100,000,000 less the principal amount of loans outstanding and 0.10%. The Revolving Credit Agreement expires on April 7, 2015. For the year ended September 30, 2014 the Funds had no borrowings outstanding under either Agreement.
11. BENEFICIAL OWNERSHIP
On September 30, 2014, there were an unlimited number of no par value shares of beneficial interest authorized for each Fund. Transactions in shares of beneficial interest are shown in the Statements of Changes in Net Assets.
The beneficial ownership, either directly or indirectly, of more than 25% of the voting securities of a fund creates a presumption of control of the fund, under Section 2(a)(9) of the Investment Company Act of 1940. Beneficial owners owning more than 25% of the voting securities for the benefit of their customers of each class of each Fund, as of September 30, 2014, are listed below:
| Fund | Shareholder Name | Percentage Interest |
| Core Opportunity Fund ‐ Class I | BMO Harris Bank | 48.45% |
| Core Opportunity Fund ‐ Class I | UBS Financial Services, Inc. | 47.92% |
| Core Opportunity Fund ‐ Class R | National Financial Services LLC | 64.47% |
| Strategic Income Fund ‐ Class R | Charles Schwab & Company, Inc. | 36.52% |
| Equity Opportunity Fund ‐ Class I | National Financial Services LLC | 50.13% |
| Equity Opportunity Fund ‐ Class R | National Financial Services LLC | 35.17% |
| Equity Opportunity Fund ‐ Class R | TD Ameritrade, Inc. | 25.04% |
| Managed Volatility Fund | Charles Schwab & Company, Inc. | 36.05% |
| Managed Volatility Fund | TD Ameritrade, Inc. | 31.47% |
| High Income Fund ‐ Class I | Charles Schwab & Company, Inc. | 26.74% |
| High Income Fund ‐ Class R | Charles Schwab & Company, Inc. | 41.53% |
| High Income Fund ‐ Class R | TD Ameritrade, Inc. | 33.12% |
12. INDEMNIFICATIONS
Under the Trust’s organizational documents, its officers and Trustees are indemnified against certain liability arising out of the performance of their duties to the Trust. Additionally, in the normal course of business, the Trust enters into contracts with service providers that may contain general indemnification clauses. The Trust’s maximum exposure under these arrangements is unknown, as this would involve future claims that may be made against the Trust that have not yet occurred.
| RiverNorth Funds | Notes to Financial Statements |
| | September 30, 2014 |
13. RECENT ACCOUNTING PRONOUNCEMENTS
In June 2013, the Financial Accounting Standards Board (“FASB) issued Accounting Standards Update (“ASU”) No. 2013‐08, Financial Services‐Investment Companies (Topic 946): Amendments to the Scope, Measurement, and Disclosure Requirements. The FASB standard identifies characteristics a company must assess to determine whether it is considered an investment company for financial reporting purposes. This ASU is effective for fiscal years beginning after December 15, 2013. The Funds believe the adoption of this ASU will not have a material impact on their financial statements.
| RiverNorth Funds | Report of Independent Registered Public Accounting Firm |
To the Shareholders and Board of Trustees of RiverNorth Funds
We have audited the accompanying statements of assets and liabilities, including the schedules of investments of RiverNorth Funds, comprising RiverNorth Core Opportunity Fund, RiverNorth/ DoubleLine Strategic Income Fund, RiverNorth Equity Opportunity Fund (formerly RiverNorth/ Manning & Napier Dividend Income Fund), RiverNorth/Oaktree High Income Fund and RiverNorth Managed Volatility Fund (formerly RiverNorth Dynamic Buy‐Write Fund) (the “Funds”) as of September 30, 2014, and the related statements of operations for the year then ended, the statements of changes in net assets for each of the periods indicated in the period then ended, and the financial highlights for each of the periods indicated in the period then ended. These financial statements and financial highlights are the responsibility of the Funds’ management. Our responsibility is to express an opinion on these financial statements and financial highlights based on our audits.
We conducted our audits in accordance with the standards of the Public Company Accounting Oversight Board (United States). Those standards require that we plan and perform the audit to obtain reasonable assurance about whether the financial statements and financial highlights are free of material misstatement. An audit includes examining, on a test basis, evidence supporting the amounts and disclosures in the financial statements. Our procedures included confirmation of securities owned as of September 30, 2014, by correspondence with the custodian and brokers, or by other appropriate auditing procedures where replies from brokers were not received. An audit also includes assessing the accounting principles used and significant estimates made by management, as well as evaluating the overall financial statement presentation. We believe that our audits provide a reasonable basis for our opinion.
In our opinion, the financial statements and financial highlights referred to above present fairly, in all material respects, the financial position of each of the Funds constituting RiverNorth Funds as of September 30, 2014, the results of their operations for the year then ended and the changes in their net assets and the financial highlights for each of the periods indicated in the period then ended, in conformity with accounting principles generally accepted in the United States of America.
COHEN FUND AUDIT SERVICES, LTD.
Cleveland, Ohio
November 26, 2014
| RiverNorth Funds | Additional Information |
| | September 30, 2014 (Unaudited) |
A description of the policies and procedures that the Funds used to determine how to vote proxies relating to portfolio securities and information regarding how the Funds voted proxies during the most recent 12‐month period ended June 30, are available without charge upon request by (1) calling the Funds at (888) 848‐7569 and (2) from Form N‐PX filed by the Funds with the Securities and Exchange Commission (“SEC”) on the SEC’s website at www.sec.gov.
PORTFOLIO HOLDINGS DISCLOSURE POLICY
The Funds file a complete schedule of investments with the SEC for the first and third quarter of each fiscal year on Form N‐Q. The Funds’ first and third fiscal quarters end on December 31 and June 30. The Form N‐Q filing must be made within 60 days of the end of the quarter, and the Funds’ first Form N‐Q was filed with the SEC on February 26, 2007. The Funds’ Forms N‐Q are available on the SEC’s website at www.sec.gov, or they may be reviewed and copied at the SEC’s Public Reference Room in Washington, DC (call 1‐800‐732‐0330 for information on the operations of the Public Reference Room). You may also obtain copies by calling the Funds at 1‐888‐848‐7569.
UNAUDITED TAX INFORMATION
The Core Opportunity Fund designates the following for federal income tax purposes for the year ended September 30, 2014:
| | | Foreign Taxes Paid | | | Foreign Source Income | |
| Core Opportunity Fund | | $ | 317,406 | | | $ | 1,557,783 | |
| | | | | | | | | |
| | | | | | | Tax-Exempt Percentage | |
| Core Opportunity Fund | | | | | | | 1.12 | % |
Of the distributions paid by the Funds from ordinary income for the calendar year ended December 31, 2013, the following percentages met the requirements to be treated as qualifying for the corporate dividends received deduction and qualified dividend income:
| | | Dividend Received Deduction | | | Qualified Dividend Income | |
| Core Opportunity Fund | | | – | | | | 68.95 | % |
| Strategic Income Fund | | | – | | | | 2.08 | % |
| Equity Opportunity Fund | | | 17.73 | % | | | 39.04 | % |
| Managed Volatility Fund | | | – | | | | – | |
| High Income Fund | | | – | | | | 1.80 | % |
In early 2014, if applicable, shareholders of record received this information for the distributions paid to them by the Funds during the calendar year 2013 via Form 1099. The Funds will notify shareholders in early 2015 of amounts paid to them by the Funds, if any, during the calendar year 2014.
| RiverNorth Funds | Additional Information |
| | September 30, 2014 (Unaudited) |
Pursuant to Section 852(b)(3) of the Internal Revenue Code, Core Opportunity Fund, DoubleLine Strategic Income Fund, and Equity Opportunity Fund designated $35,460,760, $4,321,081, and $282,200 respectively, as long‐term capital gain dividends.
| RiverNorth Funds | Trustees and Officers |
| | September 30, 2014 (Unaudited) |
The Board of Trustees supervises the business activities of the Trust and appoints the officers. Each Trustee serves as a trustee until the termination of the Trust unless the Trustee dies, resigns, retires or is removed. The Board generally meets four times a year to review the progress and status of the Funds.
The following table provides information regarding each Trustee who is not an “interested person” of the Trust, as defined in the 1940 Act.
Name, Address and Year of Birth(1) | Position(s) Held with the Fund | Term of Office/Length of Time Served | Principal Occupation(s) During Past 5 Years | Number of Portfolios in Fund Complex Overseen by Trustee(2) | Other Directorships Held by Trustee During the Past 5 Years |
John K. Carter Y.O.B. 1961 | Trustee | Indefinite/ January 2013 to present | Managing Partner, Global Recruiters of St. Petersburg (a financial services consulting and recruiting firm) (2012 to present); Business Unit Head, Transamerica Asset Management (2006 to 2012). | 5 | Director, Chairman of the Board of Directors, Transamerica Funds (120 funds) (2006 to 2012). Board Member, United Way of Tampa Bay (2011 to 2012) |
James G. Kelley Y.O.B. 1948 | Trustee | Indefinite/ December 2006 to present | Certified Business Coach, JGK & Associates (2000 to present); Vice President Finance & Operation, Paymaster Technologies, Inc. (2009 to 2010); Executive Vice President / Chief Operating Officer, The Hedman Company (a manufacturing and distribution company) (1984 to 2010). | 5 | NA |
John S. Oakes Y.O.B. 1943 | Trustee | Indefinite/ December 2010 to present | Principal, Financial Search and Consulting (a recruiting and consulting firm) (2013 to present); Regional Vice President, Securities America (a broker‐dealer) (2007 to 2013). | 5 | Independent Director, Chairman of the Board of Directors, Utopia Funds (4 funds) (2005 to 2009). |
| RiverNorth Funds | Trustees and Officers |
| | September 30, 2014 (Unaudited) |
INDEPENDENT TRUSTEES
Name, Address and Year of Birth(1) | Position(s) Held with the Fund | Term of Office/Length of Time Served | Principal Occupation(s) During Past 5 Years | Number of Portfolios in Fund Complex Overseen by Trustee(2) | Other Directorships Held by Trustee During the Past 5 Years |
Fred G. Steingraber Y.O.B. 1938 | Trustee | Indefinite/ January 2013 to present | Chairman, Board Advisors LLC (a consulting firm) (2001 to present). Retired, Chairman Emeritus, A.T. Kearney (a business consulting firm) (2001 to present) | 5 | Director, Elkay Manufacturing (2004 to present). Director, Talent Intelligence (leadership development) (2004 to present). Director, Continental (automotive electronics and tires) (1999 to 2009). Chairman Emeritus, A.T. Kearney (management consulting) (2001 to present). Chairman, Board Advisors (Board consulting) (2001 to present) |
| (1) | The mailing address of each Trustee is 325 N. LaSalle Street, Suite 645, Chicago, IL 60654. |
(2) | The Fund Complex consists of the RiverNorth Core Opportunity Fund, the RiverNorth/DoubleLine Strategic Income Fund, the RiverNorth Equity Opportunity Fund, the RiverNorth Managed Volatility Fund, and the RiverNorth/Oaktree High Income Fund. |
| RiverNorth Funds | Trustees and Officers |
| | September 30, 2014 (Unaudited) |
The following table provides information regarding each Trustee who is an “interested person” of the Trust, as defined in the 1940 Act, and each officer of the Trust.
INTERESTED TRUSTEE AND OFFICERS
Name, Address and Year of Birth(1) | Position(s) Held with the Fund | Term of Office/Length of Time Served | Principal Occupation(s) During Past 5 Years | Number of Portfolios in Fund Complex Overseen by Trustee(2) | Other Directorships Held by Trustee During the Past 5 Years |
Patrick W. Galley(3) Y.O.B. 1975 | President, Principal Executive Officer and Trustee | Indefinite/ July 2006 to present | Chief Investment Officer, RiverNorth Capital Management, LLC. (2004 to present). | 5 | Board of Managers RiverNorth Capital Management, LLC (2010 to present), Board of Managers of RiverNorth Securities, LLC (2010 to 2012) and Board of Directors RiverNorth Holdings, Co. (2010 to present). |
Jonathan M. Mohrhardt Y.O.B. 1974 | Treasurer and Chief Financial Officer | Indefinite/ February 2009 to present | Chief Compliance Officer, RiverNorth Capital Management, LLC. (2009 to 2012); Chief Operating Officer, RiverNorth Capital Management, LLC (2011 to present) and President, Chief Executive Officer and Chief Compliance Officer, RiverNorth Securities, LLC (2010 to 2012); Utopia Funds, Chief Compliance Officer (2007 to 2009), Treasurer and Chief Financial Officer (2005 to 2009); FIM Group, Director of Mutual Funds (2004 to 2009). | NA | Board of Managers RiverNorth Capital Management, LLC (2010 to present), Board of Managers of RiverNorth Securities, LLC (2010 to 2012) and Board of Directors RiverNorth Holdings, Co. (2010 to present). |
Marcus L. Collins Y.O.B. 1968 | Chief Compliance Officer | Indefinite/ May 2010 to present | General Counsel, RiverNorth Capital Management, LLC (2012 to present), Chief Compliance Officer, RiverNorth Capital Management, LLC (2012 to present); Counsel, Thompson Hine, LLP (2007 to 2012) | NA | NA |
| RiverNorth Funds | Trustees and Officers |
| | September 30, 2014 (Unaudited) |
INTERESTED TRUSTEE AND OFFICERS
Name, Address and Year of Birth(1) | Position(s) Held with the Fund | Term of Office/Length of Time Served | Principal Occupation(s) During Past 5 Years | Number of Portfolios in Fund Complex Overseen by Trustee(2) | Other Directorships Held by Trustee During the Past 5 Years |
Jennifer T. Welsh Y.O.B. 1977 c/o ALPS Fund Services, Inc. 1290 Broadway, Suite 1100 Denver, CO 80203 | Secretary | Indefinite/ November 2014 to present | Ms. Welsh, Vice President & Associate Counsel for ALPS Fund Services, Inc., joined ALPS in 2013. She is also Vice President and Associate Counsel of ALPS Distributors, Inc., ALPS Advisors, Inc. and ALPS Portfolio Solutions Distributors, Inc. and Secretary of Stadion Funds Trust. Before joining ALPS, Ms. Welsh served as Associate General Counsel and Chief Compliance Officer of Boulder Investment Advisers LLC and Rocky Mountain Advisers, LLC, Chief Compliance Officer of Stewart Investment Advisers, Boulder Growth & Income Fund, Inc., Boulder Total Return Fund, Inc., The Denali Fund Inc. and First Opportunity Fund, Inc., and Associate General Counsel of Fund Administrative Services, LLC from 2010 to 2012. Ms. Welsh also was Associate Attorney at Davis, Graham & Stubbs, LLP from 2007 to 2010. | NA | NA |
J. Tison Cory Y.O.B. 1969 c/o ALPS Fund Services, Inc. 1290 Broadway, Suite 1100 Denver, CO 80203 | Assistant Secretary | Indefinite/ December 2010 to present | Senior Paralegal, ALPS Fund Services, Inc. (2005 to present); Adjunct Professor, Metropolitan State College of Denver (2000 to present). | NA | NA |
Gina Meyer Y.O.B. 1980 c/o ALPS Fund Services, Inc. 1290 Broadway, Suite 1100 Denver, CO 80203 | Assistant Treasurer | Indefinite/ August 2013 to present | Fund Controller, ALPS Fund Services (2012 to present); Fund Accounting Manager, Jackson National Asset Management (2008 to 2012). | NA | NA |
| RiverNorth Funds | Trustees and Officers |
| | September 30, 2014 (Unaudited) |
| (1) | The mailing address of each Trustee and officer, unless otherwise noted, is 325 N. LaSalle Street, Suite 645, Chicago, IL 60654. |
| (2) | The Fund Complex consists of the RiverNorth Core Opportunity Fund, the RiverNorth/DoubleLine Strategic Income Fund, the RiverNorth Equity Opportunity Fund, the RiverNorth Managed Volatility Fund, and the RiverNorth/Oaktree High Income Fund. |
| (3) | Patrick W. Galley is considered an "Interested” Trustee as defined in the Investment Company Act of 1940, as amended, because he is an officer of the Trust and Chief Investment Officer of the Fund's investment adviser. |
RiverNorth Funds
RiverNorth Core Opportunity Fund
RiverNorth/DoubleLine Strategic Income Fund
RiverNorth Equity Opportunity Fund
RiverNorth Managed Volatility Fund
RiverNorth/Oaktree High Income Fund
Board of Trustees
Patrick W. Galley, CFA, Chairman
James G. Kelley
John S. Oakes
Fred G. Steingraber
John K. Carter
Investment Adviser
RiverNorth Capital Management, LLC
Sub Advisers
DoubleLine Capital LP
Oaktree Capital Management, L.P.
Transfer Agent, Administrator and
Dividend Disbursing Agent
ALPS Fund Services, Inc.
Fund Counsel
Drinker Biddle & Reath LLP
Distributor
ALPS Distributors, Inc.
Custodian
State Street Bank and Trust, Co.
Independent Registered
Public Accounting Firm
Cohen Fund Audit Services, Ltd
This report is provided for the general information of the shareholders of the RiverNorth Funds. This report is not intended for distribution to prospective investors in the Funds, unless preceded or accompanied by an effective prospectus.
The registrant’s board of trustees has determined that the registrant does not have an audit committee financial expert. The committee members and the full Board considered a possibility of adding a member that would qualify as an expert. The audit committee determined that, although none of its members meet the technical definition of an audit committee expert, the committee has sufficient financial expertise to adequately perform its duties under the Audit Committee Charter without the addition of a qualified expert.
The Audit Committee Charter requires the Audit Committee to be responsible for the selection, retention or termination of auditors and, in connection therewith, to (i) evaluate the proposed fees and other compensation, if any, to be paid to the auditors, (ii) evaluate the independence of the auditors, (iii) pre-approve all audit services and, when appropriate, any non-audit services provided by the independent auditors to the Trust, (iv) pre-approve, when appropriate, any non-audit services provided by the independent auditors to the Trust's investment adviser, or any entity controlling, controlled by, or under common control with the investment adviser and that provides ongoing services to the Trust if the engagement relates directly to the operations and financial reporting of the Trust, and (v) receive the auditors’ specific representations as to their independence.
Schedule included with Item 1.
The registrant has not adopted procedures by which shareholders may recommend nominees to the registrant’s board of trustees.
Pursuant to the requirements of the Securities Exchange Act of 1934 and the Investment Company Act of 1940, the registrant has duly caused this report to be signed on its behalf by the undersigned, thereunto duly authorized.
Pursuant to the requirements of the Securities Exchange Act of 1934 and the Investment Company Act of 1940, this report has been signed below by the following persons on behalf of the registrant and in the capacities and on the dates indicated.