UNITED STATES
SECURITIES AND EXCHANGE COMMISSION
Washington, D.C. 20549
FORM N-CSR
CERTIFIED SHAREHOLDER REPORT OF REGISTERED
MANAGEMENT INVESTMENT COMPANIES
Investment Company Act file number: 811-21934
RIVERNORTH FUNDS
(exact name of registrant as specified in charter)
325 North LaSalle Street, Suite 645, Chicago, IL 60654
(Address of principal executive offices) (Zip code)
Patrick W. Galley
RiverNorth Funds
325 North LaSalle Street
Chicago, IL 60654
(Name and address of agent for service)
| | | | |
| Registrant’s telephone number, including area code: 312-832-1440 |
| |
| Date of fiscal year end: September 30th | | |
|
| Date of reporting period: October 1, 2010 to September 30, 2011 |
| Item 1. | Reports to Stockholders. |
| | |
| RiverNorth Funds | | Table of Contents |
| | |
Annual Report | September 30, 2011 | | 1 |
| | |
RiverNorth Funds | | Shareholder Letter |
| | September 30, 2011 (Unaudited) |
Dear Fellow Shareholders,
We are pleased to provide you with the 2011 Annual Report for the RiverNorth Funds. This report covers the RiverNorth Core Opportunity Fund (ticker: RNCOX) and the RiverNorth/DoubleLine Strategic Income Fund (tickers: RNSIX and RNDLX). Both Funds have a fiscal year end of September 30, 2011.
The RiverNorth Core Opportunity Fund was launched in December 2006 with an investment objective of capital appreciation and income. We tactically manage the Fund’s asset allocation and generally implement the Fund’s objectives by purchasing closed-end funds and exchange-traded funds. We believe that opportunistic, discount-based investments in closed-end fund shares can earn excess returns over the closed-end fund’s benchmark index. In our opinion, the investment strategy has worked well over the past few years. Since inception (December 27, 2006), the RiverNorth Core Opportunity Fund has generated an annualized return of 5.25% (for full performance see page 3). This compares favorably to the Fund’s benchmark, the unmanaged Blend Index1, which has generated an annualized return of 1.45% over the same time period.
The Adviser, RiverNorth Capital Management, LLC, closed the RiverNorth Core Opportunity Fund to new investors on July 1, 2011. Current investors may still purchase shares. The Adviser is committed to monitoring the Fund’s size relative to our ability to effectively execute the Fund’s strategy and achieve its objectives. As of September 30, 2011, the net assets of the Fund were $488 million.
The RiverNorth/DoubleLine Strategic Income Fund was launched in December 2010 with an investment objective of current income and overall total return. We are very excited about the partnership with DoubleLine Capital, LP, a leader in fixed income asset management. RiverNorth Capital Management is the Fund’s Adviser and DoubleLine Capital is the Fund’s Sub-Adviser. Together we are tactically allocating capital across three distinct income-oriented strategies – 1) tactical closed-end fund income, 2) core fixed income and 3) opportunistic income. Although the Fund is young, we are pleased with the outcome of our investment strategy thus far. Since inception (December 30, 2010), the RiverNorth/DoubleLine Strategic Income Fund has generated a total return of 8.97% (RNSIX) and 8.88% (RNDLX). This compares favorably to the Fund’s benchmark, the Barclays Capital U.S. Aggregate Bond Index, which generated a total return of 7.02% over the same time period.
The RiverNorth/DoubleLine Strategic Income Fund has been well received by investors. As of September 30, 2011, the net assets of the Fund were $470 million.
Both Funds are designed to be flexible and opportunistic. We believe these characteristics are necessary for an investment strategy in today’s volatile market environment. Investors are concerned about the slow growth in the U.S., our country’s fiscal deficit and the escalating debt crisis in Europe. This fear and uncertainty may lead to attractive buying opportunities for ably prepared investors. We believe both Funds are well diversified2, balanced and positioned to capitalize on future market volatility.
We thank you for your investment and trust in managing your assets.
Respectfully,
| | |
| Patrick Galley, CFA | | Steve O’Neill, CFA |
1 The Blend Index consists of 60% S&P 500 Index and 40% Barclays Capital U.S. Aggregate Bond Index.
2 Diversification does not eliminate the risk of experiencing investment losses.
| | |
| 2 | | (888) 848-7569 | www.rivernorthfunds.com |
| | |
RiverNorth Funds | | Shareholder Letter |
| | September 30, 2011 (Unaudited) |
RiverNorth Core Opportunity Fund
How did the RiverNorth Core Opportunity Fund perform relative to its benchmark during the reporting period?
For the twelve months ended September 30, 2011, the RiverNorth Core Opportunity Fund (RNCOX; the “Fund”) returned negative 1.33%. The unmanaged Blend Index returned positive 3.06%, during the same period. The Blend Index consists of 60% S&P 500 Index and 40% Barclays Capital U.S. Aggregate Bond Index.
In order to compare the Fund’s performance to the overall taxable closed-end fund market, the Fund’s Adviser maintains the RiverNorth Closed-end Fund Index (“RiverNorth CEF Index”). We believe the RiverNorth CEF Index provides the best representation of the taxable closed-end fund market because it is constructed without discount biases and is designed to capture the broader group’s asset class diversity. Given that RNCOX invests in closed-end funds opportunistically, as opposed to exclusively, its objective is not to outperform the RiverNorth CEF Index. Therefore we encourage investors to use the RiverNorth CEF Index as a point of reference.
The RiverNorth CEF Index returned negative 4.85% over the past twelve months.
Average Annual Total Returns for Periods Ending September 30, 2011
| | | | | | |
| | | 1-Year | | 3-Year | | Since Inception(1) |
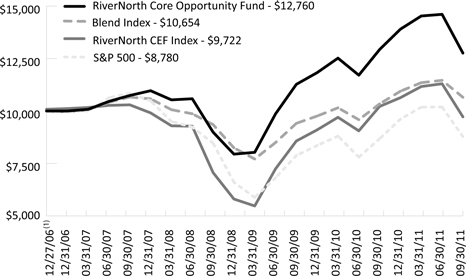
RiverNorth Core Opportunity Fund (RNCOX) | | -1.33% | | 12.37% | | 5.25% |
Blend Index(2) | | 3.06% | | 4.44% | | 1.45% |
S&P 500 Index(2) | | 1.16% | | 1.23% | | -2.55% |
RiverNorth CEF Index(3) | | -4.85% | | 11.23% | | -0.59% |
| (1) | Inception date is December 27, 2006. |
| (2) | Blend Index consists of 60% S&P 500 Index and 40% Barclays Capital U.S. Aggregate Bond Index. S&P 500 Index is a capitalization-weighted index of 500 stocks. The S&P 500 index is designed to measure performance of the broad domestic economy based on the changing aggregate market value of these 500 stocks. The Barclays Capital US Aggregate Bond Index (formerly Lehman Brothers US Aggregate Bond Index) is a benchmark index composed of US securities in Treasury, Government-Related, Corporate, and Securitized sectors. It includes securities that are of investment-grade quality or better, have at least one year to maturity, and have an outstanding par value of at least $250 million. This unmanaged index does not reflect fees and expenses. The index cannot be invested in directly. The S&P 500 and Blend Indices are indices only and cannot be invested in directly. |
| (3) | The RiverNorth CEF Index measures the performance of the taxable closed-end fund market through a representative 75 Funds. The index rebalances every 12 months and is calculated using the total return of the underlying investments. Please see www.rivernorth.com for more information. The RiverNorth CEF Index is an index only and cannot be invested in directly. |
Performance data quoted represents past performance, which is not a guarantee of future results. Current performance may be lower or higher than the performance quoted. The principal value and investment return of an investment will fluctuate so that your shares, when redeemed, may be worth
| | |
Annual Report | September 30, 2011 | | 3 |
| | |
RiverNorth Funds | | Shareholder Letter |
| | September 30, 2011 (Unaudited) |
more or less than their original cost. You can obtain performance data current to the most recent month end by calling (888) 848-7569 or www.rivernorthfunds.com. Total return measures net investment income and capital gain or loss from portfolio investments. All performance shown assumes reinvestment of dividends and capital gains distributions and does not reflect the deduction of taxes that a shareholder would pay on Fund distributions or redemption of Fund shares.
The RiverNorth Core Opportunity Fund’s Total Annual Fund Operating Expenses as disclosed in the prospectus is 2.39%. The Adviser has contractually agreed to defer the collection of fees and/or reimburse expenses, but only to the extent necessary to limit Total Annual Fund Operating Expenses (excluding brokerage fees and commissions; borrowing costs, such as (a) interest and (b) dividends on securities sold short; taxes; indirect expenses incurred by the underlying funds in which the Fund invests; and extraordinary expenses) to 1.60% of the average daily net assets of the Fund through January 31, 2012.
For a longer-term perspective on Fund performance, we refer you to the following chart:
Comparison of a $10,000 Investment in the RiverNorth Core Opportunity Fund, the S&P 500® Index, and the Blend Index
What contributing factors were responsible for the RiverNorth Core Opportunity Fund’s relative performance during the period?
Closed-end fund discounts generally widened during the reporting period. As a reminder, the market price of a closed-end fund can trade at a discount or premium to the fund’s net asset value. Some of the Fund’s long-term mean reversion positions were negative impacted by discount widening.
On the other hand, corporate actions completed by a number of large closed-end fund holdings were beneficial to performance. The most noteworthy corporate action was taken by the Fund’s
| | |
| 4 | | (888) 848-7569 | www.rivernorthfunds.com |
| | |
RiverNorth Funds | | Shareholder Letter |
| | September 30, 2011 (Unaudited) |
second largest holding on September 30, 2010. RNCOX started the fiscal year with 5.33% of assets allocated to NFJ Dividend, Interest & Premium Strategy Fund (“NFJ”). The discount on September 30, 2010 was 14.16%. We were anticipating a distribution increase that would bring the fund’s distribution rate closer to that of its closed-end fund peers. Three months into the fiscal year, NFJ increased its distribution rate by 200%. By June 30, 2011, the discount had narrowed to 1.05% and we had gradually sold our entire position into market strength.
The Fund also participated in a number of profitable tender offers. A closed-end fund tender offer gives shareholders the opportunity to sell shares directly to the fund. The purchase price is often equal to some percentage of the fund’s net asset value (e.g. 98% of net asset value). During the fiscal year, LMP Capital and Income Fund tendered 35%, H&Q Life Sciences Investors tendered 35%, SunAmerica Focused Alpha Growth Fund tendered 30% and DWS High Income Opportunities Fund tendered 25%. In each case, the tender offer was undersubscribed and therefore we received more than our pro-rata share.
In terms of asset allocation, the Fund’s asset class diversification beyond the traditional 60/40 portfolio partially detracted from performance in fiscal year 2011. The Fund’s benchmark, the Blend Index, consists of 60% S&P 500 Index and 40% Barclays Capital US Aggregate Bond Index.
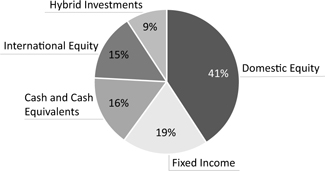
The Fund’s allocation to international equity contributed to the underperformance of the Fund’s equity portfolio relative to the S&P 500 Index (60% of the Fund’s benchmark). The MSCI EAFE and MSCI Emerging Markets indices were down 9.36% and 16.15%, respectively, over the past twelve months. Whereas the total return of the S&P 500 was positive 1.16%. The Fund started the fiscal year with 10% of assets allocated to international equity. We used the sell-off in international equity to increase our allocation to 15% by fiscal year-end. The additional exposure was implemented by purchasing global equity closed-end funds trading at historically wide discounts and exchange-traded funds. Over the long-term, we believe the diversification of the equity portfolio will help improve risk-adjusted returns.
The Fund’s low duration and minimal exposure to U.S. government bonds and mortgage-backed securities contributed to the underperformance of the Fund’s bond portfolio relative to the Barclays Capital U.S. Aggregate Bond Index (40% of the Fund’s benchmark). The Fund held a significant cash position to help to minimize interest rate risk and to provide liquidity for the frequent trading opportunities in the closed-end fund space. Cash also helps counterbalance any incremental asset class exposure the Fund acquires through the underlying leverage found in many closed-end funds.
A tactical allocation to leveraged loan funds worked well during the fiscal year. These funds rallied in the first half of the year and we sold nearly all of our positions by June 30, 2011. Subsequently we repurchased many of the same positions when they sold off in August and September.
What was the closed-end fund environment like for the past twelve months and current outlook?
The one-year trailing average discount on the RiverNorth CEF Index was 2.80% on September 30, 2011. We started the fiscal year with an average discount of 1.57% and ended the year with an average discount of 3.81%. The range of the average discount over the past twelve months was 1.23% to 7.85%. Most of the discount volatility occurred in November/December 2010 and August 2011. Interestingly, discount volatility during these two periods occurred for very different reasons.
| | |
Annual Report | September 30, 2011 | | 5 |
| | |
RiverNorth Funds | | Shareholder Letter |
| | September 30, 2011 (Unaudited) |
The U.S. economy had picked up momentum in the second half of 2010 and with it came a rise in inflation and interest-rate expectations. In the last few months of the year, the yield on the 10-year U.S. Treasury bond jumped 100 basis points (1 basis point equals 1/100th of 1%). Almost overnight, closed-end fund investors began to panic about rising rates and their knee-jerk reaction was to sell closed-end bond funds. Year-end tax loss selling pressure exacerbated the weakness. The average discount widened from 1.57% on September 30, 2010 to 4.88% on December 14, 2010. We welcomed the discount volatility and took advantage of the sell-off by increasing our closed-end fund exposure. When discounts narrowed in early 2011, we booked gains on our short-term mean reversion trades.
The second period of discount volatility occurred under the opposite set of expectations. The U.S. economy showed signs of weakness in the second quarter of 2011. Investors began to fear a double-dip recession. Those concerns were further agitated by the rising awareness of our country’s fiscal deficit, Standard & Poor’s downgrading of U.S. government debt and the escalating debt crisis in Europe. Within a few short months, the yield on the 10-year U.S. Treasury bond dropped nearly 200 basis points. The most acute discount volatility occurred in the first week of August. The average discount widened from 3.18% on August 1, 2011 to 7.85% on August 8, 2011. Once again, we were buying closed-end funds while others were selling. RNCOX added material positions in a number of global equity and covered call funds trading at discounts in the high-teens. As of September 30, 2011, the market prices and discounts on these funds are still well-below their pre-August levels.
Looking forward, we anticipate more discount volatility. Closed-end fund investors have become fair weather fans; indiscriminately selling at the first sign of trouble. Their short-term mentality drives fairly wild swings in the closed-end fund market. That being said, if/when capital markets volatility declines, we believe discounts will narrow to levels that are considered low by historical standards. Taxable closed-end funds are currently offering yields in excess of 8% in a world where the 10-year U.S. Treasury yields less than 2%. Investors hungry for yield should continue to find value in closed-end funds.
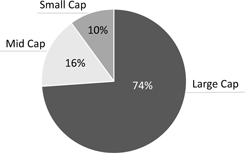
How was the RiverNorth Core Opportunity Fund positioned at the end of September 2011?
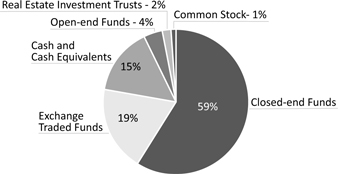
We believe the Fund is well diversified across asset classes with tactical allocations to large-cap equities and lower duration fixed income. We have increased the Fund’s overall equity exposure to 56% of assets and further diversified this exposure into international equities. The Fund’s fixed income exposure was decreased to 19% of assets following the elimination of various closed-end bond funds and exchange-traded funds.
Over the past twelve months, we have increased our cash position to 16% of assets. Given the current level of market volatility (e.g. CBOE Volatility Index above 40) and the low opportunity cost of holding cash relative to short-term bonds, we like holding cash to give us dry powder for closed-end fund trading opportunities.
The Fund’s current allocation to closed-end funds is 59% of assets. We are finding value in general equity and covered call closed-end funds. It is our view that discounts on both groups will narrow if/when Main Street sentiment improves towards stocks and we have been adding to these positions on weakness. We continue to wait for attractive buying opportunities for closed-end bond funds. We are looking for weakness in line with the levels of November/December 2010 and August 2011 before making significant investments.
| | |
| 6 | | (888) 848-7569 | www.rivernorthfunds.com |
| | |
RiverNorth Funds | | Shareholder Letter |
| | September 30, 2011 (Unaudited) |
The charts below further highlight our positioning:
RiverNorth Core Opportunity Fund
Portfolio asset allocations are approximations made by the Adviser.
Investment Vehicle Allocation(1) (percentages are based on net assets)
Asset Class Allocation(1) (percentages are based on net assets)
Equity Capitalization Allocation(1) (percentages are based on net assets)
| | |
Annual Report | September 30, 2011 | | 7 |
| | |
RiverNorth Funds | | Shareholder Letter |
| | September 30, 2011 (Unaudited) |
Fixed Income Allocation(1) (percentages are based on net assets)
| (1) | Investments in international markets present special risks including currency fluctuation, the potential for diplomatic and political instability, regulatory and liquidity risks, foreign taxation and differences in auditing and other financial standards. Risks of foreign investing are generally intensified for investments in emerging markets. The Fund invests in securities (Investment Companies) that have underlying exposure to high yield securities and unrated securities of similar credit quality (commonly known as junk bonds ), as well as derivatives of such securities, and therefore is likely to be subject to greater levels of interest rate, credit and liquidity risk than funds that do not invest in such securities. The underlying securities of these investments are considered predominately speculative with respect to the issuers continuing ability to make principal and interest payments. An economic downturn or period of rising interest rates could adversely affect the market for these underlying securities and therefore the Fund’s investment in securities that have high yield exposure. Small-Cap and Mid-Cap investing involves greater risk not associated with investing in more established companies, such as greater price volatility, business risk, less liquidity and increased competitive threat. Holdings are subject to change. |
RiverNorth/DoubleLine Strategic Income Fund
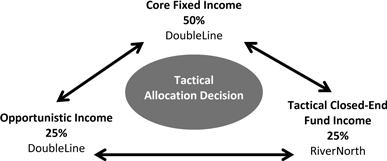
The RiverNorth/DoubleLine Strategic Income Fund (RNSIX and RNDLX; the “Fund”) consists of three distinct fixed income strategies (or sleeves) and the Fund’s exposure to each sleeve is tactically managed.
RiverNorth Capital Management oversees the Tactical Closed-end Fund Income Strategy. The strategy is designed to provide diversified exposure to the fixed income market through opportunistic investments in closed-end funds. RiverNorth utilizes a combination of short-and long-term trading strategies to seek to derive value from the discount and premium spreads associated with closed-end bond funds. RiverNorth uses proprietary screening and algorithmic trading models to enhance the closed-end fund strategy. We believe that opportunistic, discount-based investments in closed-end fund shares can earn excess returns over the closed-end fund’s benchmark index.
The second sleeve is the Opportunistic Income Strategy managed by DoubleLine Capital. The strategy incorporates DoubleLine’s “best ideas” and has a flexible mandate with a current focus on non-agency and agency mortgage-backed securities (“MBS”).
| | |
| 8 | | (888) 848-7569 | www.rivernorthfunds.com |
| | |
RiverNorth Funds | | Shareholder Letter |
| | September 30, 2011 (Unaudited) |
The two niche strategies are combined with a third sleeve, the Core Fixed Income Strategy, also managed by DoubleLine. The Core Fixed Income Strategy incorporates an active asset allocation approach in an effort to mitigate risk and achieve superior risk-adjusted returns within the diverse fixed income universe. DoubleLine’s Asset Allocation Committee, led by Jeffrey Gundlach, determines which fixed income sectors to over- or underweight based upon their qualitative and quantitative analyses.
We believe the combination and the tactical management of these three unique but complementary strategies creates a novel approach to investing in today’s fixed income environment.
How did the RiverNorth/DoubleLine Strategic Income Fund perform relative to its benchmark during the reporting period?
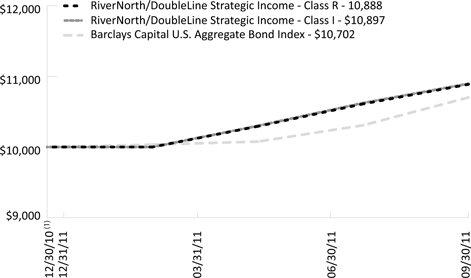
Since inception through September 30, 2011, the Fund returned 8.97% (RNSIX) and 8.88% (RNDLX). The Barclays Capital U.S. Aggregate Bond Index returned 7.02%, during the same period.
| | |
| | | Since Inception(1) |
RiverNorth/DoubleLine Strategic Income Fund – Class I (RNSIX) | | 8.97% |
RiverNorth/DoubleLine Strategic Income Fund – Class R (RNDLX) | | 8.88% |
Barclays Capital U.S. Aggregate Bond Index(2) | | 7.02% |
| (1) | Inception date is December 30, 2010. Since Inception return is cumulative, not annualized. |
| (2) | The Barclays Capital US Aggregate Bond Index (formerly Lehman Brothers US Aggregate Bond Index) is a benchmark index composed of US securities in Treasury, Government-Related, Corporate, and Securitized sectors. It includes securities that are of investment-grade quality or better, have at least one year to maturity, and have an outstanding par value of at least $250 million. This unmanaged index does not reflect fees and expenses. The index cannot be invested in directly. |
Performance data quoted represents past performance, which is not a guarantee of future results. Current performance may be lower or higher than the performance quoted. The principal value and investment return of an investment will fluctuate so that your shares, when redeemed, may be worth more or less than their original cost. You can obtain performance data current to the most recent month end by calling (888) 848-7569 or www.rivernorthfunds.com. Total return measures net investment income and capital gain or loss from portfolio investments. All performance shown assumes reinvestment of dividends and capital gains distributions and does not reflect the deduction of taxes that a shareholder would pay on Fund distributions or redemption of Fund shares.
The RiverNorth/DoubleLine Strategic Income Fund’s Total Annual Operating Expense as disclosed in the prospectus is 1.20% for Class I Shares and 1.45% for Class R Shares. The Adviser has contractually agreed to defer the collection of fees and/or reimburse expenses, but only to the extent necessary to limit Total Annual Fund Operating Expenses (excluding brokerage fees and commissions; borrowing costs, such as (a) interest and (b) dividends on securities sold short; taxes; indirect expenses incurred by the Underlying Funds in which the fund invest; and extraordinary expenses) 0.95% for Class I Shares 1.20% for Class R Shares of the average daily net assets of the Fund through January 31, 2012.
| | |
Annual Report | September 30, 2011 | | 9 |
| | |
RiverNorth Funds | | Shareholder Letter |
| | September 30, 2011 (Unaudited) |
Comparison of a $10,000 Investment in the RiverNorth/DoubleLine Strategic Income Fund and the Barclays Capital U.S. Aggregate Bond Index
What contributing factors were responsible for the RiverNorth/DoubleLine Strategic Income Fund’s relative performance during the period?
RiverNorth Tactical Closed-end Income Sleeve:
Active trading of closed-end funds generated positive returns for the Fund. Additionally, tactical management of the total exposure to closed-end funds helped improve the sleeve’s performance. During the reporting period, the market price return of the closed-end fund portfolio exceeded the net asset value return due to discount narrowing.
DoubleLine Opportunistic Income Sleeve:
Long duration agency collateralized mortgage obligations such as inverse floaters had large price gains in addition to high interest returns. Non-agency MBS were flat to slightly negative in price since inception, however, they experienced high income returns given their fixed coupons and low dollar prices. Of the non-agency MBS subsectors, Prime (conforming mortgages with prime borrowers) was the best performing collateral with lower quality collateral returns lagging.
DoubleLine Core Fixed Income Sleeve:
Due to the significant drop in interest rates over the year, along with a general flight to quality, the U.S. government portion of the portfolio contributed significantly to the portfolio’s outperformance. The MBS portion also outperformed despite having a shorter duration than the Barclays Capital U.S. Aggregate Bond Index. The corporate bonds performed in line with both the
| | |
| 10 | | (888) 848-7569 | www.rivernorthfunds.com |
| | |
RiverNorth Funds | | Shareholder Letter |
| | September 30, 2011(Unaudited) |
credit sector of the benchmark while the allocation to emerging markets detracted from performance, particularly over the 3rd quarter.
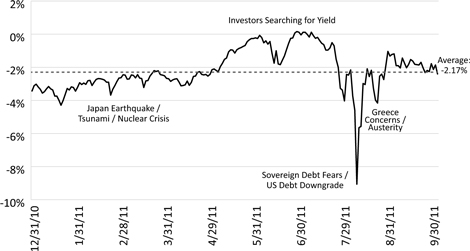
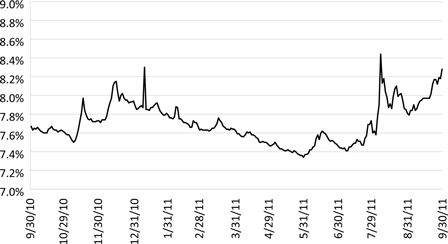
What was the closed-end fund environment like since inception of the RiverNorth/DoubleLine Strategic Income Fund and current outlook?
Since inception, the average discount on taxable bond funds was 2.17% (Morningstar US All Taxable Fixed Income Unweighted Index). As of September 30, 2011, roughly 17% and 49% of taxable bond funds were trading at discounts wider than 10% and 5%, respectively.
Panicky investors caused discount volatility to surge in August 2011. Reasons for the fear included, but were not limited to, the escalating debt crisis in Europe, the slowing U.S. economy and the rising awareness of our country’s fiscal deficit. The intense selling pressure pushed the average taxable bond discount from 2.42% on August 1, 2011 to 9.06% on August 8, 2011. RiverNorth welcomed the discount volatility and opportunistically increased the Fund’s closed-end fund exposure. We believe the best time to buy a closed-end fund is when others are rushing towards the exit.
All Taxable Fixed-Income CEF Discounts
Looking forward, we anticipate more discount volatility. Investors’ risk-on/risk-off mentality to owning closed-end funds drives fairly wild swings in the market. That being said, we believe the volatility will be tempered by investors’ hunger for yield. In today’s low interest rate environment, the relatively high distribution rates on taxable closed-end funds look attractive to many buyers. Closed-end funds utilize leverage to enhance their distribution yields. As of September 30, 2011, the average distribution on taxable closed-end funds was 8.3%. This compares favorably to the 2.4% yield on the Barclays Capital U.S. Aggregate Bond Index.
| | |
Annual Report | September 30, 2011 | | 11 |
| | |
RiverNorth Funds | | Shareholder Letter |
| | September 30, 2011 (Unaudited) |
All Taxable Closed-End Fund Yield
Source: RiverNorth Capital Management LLC and Morningstar
What was the fixed-income environment like since inception of the RiverNorth/DoubleLine Strategic Income Fund and current outlook?
The prevailing sentiment at DoubleLine entering 2011 was one of deflationary forces. Given the continued deterioration in the housing market, DoubleLine’s thoughts were for a low rate environment with potential to add duration to the portfolios at 10-year U.S. Treasury yields of 3.5%-4.0%. 2011 started the year with 10-year U.S. Treasury yields at 3.30% and investors with a risk on mentality – this pushed 10-year yields to roughly 3.75%. DoubleLine took that opportunity to add duration to the Opportunistic Income sleeve in the Fund. Concerns over the Greece’s fiscal house once again resurfaced in late spring which turned investor’s attitude towards risk as a negative and they began to exit the markets in masses returning to the safety of the now downgraded US Treasury market pushing yields to historic lows. Along the way the Federal Reserve announced shorts rates will be anchored until 2013. The third quarter ended with 10-year U.S. Treasury yields at 1.92%. Currently, we still believe rates will remain low for an extended period of time. The housing market has years of bumping along before a recovery. Short-term global monetization programs will continue to create volatility in the markets as risk trades are put on and then taken off.
| | |
| 12 | | (888) 848-7569 | www.rivernorthfunds.com |
| | |
RiverNorth Funds | | Shareholder Letter |
| | September 30, 2011 (Unaudited) |
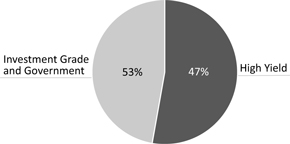
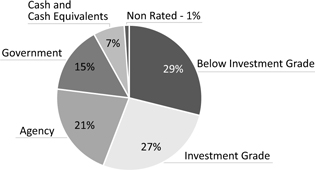
How was the Fund positioned at the end of September 2011?
Portfolio detail statistics are estimates made by the Adviser and are subject to change.
Strategy (“Sleeve”) Allocation
Credit Quality Distribution(1)
Sector Breakdown(1)
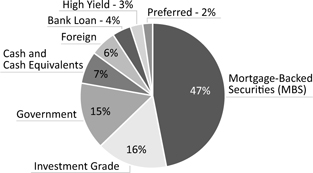
| (1) | Holdings subject to change. |
| | |
Annual Report | September 30, 2011 | | 13 |
| | |
RiverNorth Funds | | Disclosure of Fund Expenses |
| | September 30, 2011 (Unaudited) |
Expense Example
As a shareholder of the RiverNorth Core Opportunity Fund or RiverNorth/DoubleLine Strategic Income Fund, you incur ongoing costs which typically consist of management fees and other Fund expenses. This Example is intended to help you understand your ongoing costs (in dollars) of investing in each Fund and to compare these costs with the ongoing costs of investing in other mutual funds.
The Example is based on an investment of $1,000 invested at the beginning of the period, April 1, 2011 and held for the six months ended September 30, 2011.
Actual Expenses
The first line of the table below provides information about actual account values and actual expenses. You may use the information in this line, together with the amount you invested, to estimate the expenses that you paid over the period. Simply divide your account value by $1,000 (for example, an $8,600 account value divided by $1,000 = 8.6), then multiply the result by the number in the first line under the heading entitled “Expenses Paid During Period” to estimate the expenses you paid on your account during this period.
Hypothetical Example for Comparison Purposes
The second line of the table below provides information about hypothetical account values and hypothetical expenses based on each Fund’s actual expense ratio and an assumed rate of return of 5% per year before expenses, which is not each Fund’s actual return. The hypothetical account values and expenses may not be used to estimate the actual ending account balance or expenses you paid for the period. You may use this information to compare the ongoing costs of investing in each Fund and other funds. To do so, compare these 5% hypothetical examples with the 5% hypothetical examples that appear in the shareholder reports of other funds.
| | | | | | | | |
| | | Beginning Account Value 04/01/2011 | | Ending Account Value 09/30/2011 | | Expense Ratio(a) | | Expenses Paid During Period(b) |
RiverNorth Core Opportunity Fund | | | | | | | | |
Actual | | $1,000.00 | | $878.20 | | 1.45% | | $6.83 |
Hypothetical (5% return before expenses) | | $1,000.00 | | $1,017.80 | | 1.45% | | $7.33 |
RiverNorth/DoubleLine Strategic Income Fund | | | | | | | | |
Class I Shares | | | | | | | | |
Actual | | $1,000.00 | | $1,058.00 | | 0.95% | | $4.90 |
Hypothetical (5% return before expenses) | | $1,000.00 | | $1,020.31 | | 0.95% | | $4.81 |
Class R Shares | | | | | | | | |
Actual | | $1,000.00 | | $1,057.80 | | 1.20% | | $6.19 |
Hypothetical (5% return before expenses) | | $1,000.00 | | $1,019.05 | | 1.20% | | $6.07 |
| (a) | Annualized, based on the Fund’s most recent fiscal half-year expenses. |
| (b) | Expenses are equal to the Fund’s annualized ratio multiplied by the average account value over the period, multiplied by the number of days in the most recent fiscal half year (183), then divided by 365. Note this expense example is typically based on a six-month period. |
| | |
| 14 | | (888) 848-7569 | www.rivernorthfunds.com |
| | |
RiverNorth Core Opportunity Fund | | Schedule of Investments |
| | September 30, 2011 |
| | | | | | | | |
| Shares/Description | | Value | |
| CLOSED-END FUNDS - 57.94% | | | | |
| | 908,104 | | | Adams Express Co. | | $ | 8,363,638 | |
| | 532,382 | | | AllianceBernstein Income Fund, Inc. | | | 4,243,085 | |
| | 57,674 | | | Apollo Senior Floating Rate Fund, Inc. | | | 908,942 | |
| | 681,996 | | | BlackRock Credit Allocation Income Trust II, Inc. | | | 6,369,843 | |
| | 243,789 | | | BlackRock Credit Allocation Income Trust III, Inc. | | | 2,408,635 | |
| | 964,545 | | | BlackRock Credit Allocation Income Trust IV, Inc. | | | 11,072,977 | |
| | 653,052 | | | Boulder Growth & Income Fund, Inc. | | | 3,565,664 | |
| | 273,671 | | | Boulder Total Return Fund, Inc.(a) | | | 3,694,558 | |
| | 268,313 | | | Calamos Convertible and High Income Fund | | | 2,978,274 | |
| | 446,479 | | | Calamos Strategic Total Return Fund | | | 3,553,973 | |
| | 90,000 | | | Central Europe and Russia Fund, Inc. | | | 2,739,600 | |
| | 22,543 | | | ClearBridge Energy MLP Opportunity Fund, Inc. | | | 374,214 | |
| | 535,437 | | | Clough Global Equity Fund | | | 6,248,550 | |
| | 1,213,386 | | | Clough Global Opportunities Fund | | | 12,801,222 | |
| | 367,900 | | | Eaton Vance Enhanced Equity Income Fund | | | 3,598,062 | |
| | 47,537 | | | Eaton Vance Floating-Rate Income Trust | | | 669,796 | |
| | 516,789 | | | Eaton Vance Risk-Managed Diversified Equity Income Fund | | | 5,658,840 | |
| | 52,847 | | | Eaton Vance Senior Floating-Rate Trust | | | 750,956 | |
| | 444,617 | | | Eaton Vance Tax-Managed Buy-Write Opportunities Fund | | | 4,855,218 | |
| | 706,625 | | | Eaton Vance Tax-Managed Diversified Equity Income Fund | | | 6,027,511 | |
| | 1,350,049 | | | Eaton Vance Tax-Managed Global Buy-Write Opportunities Fund | | | 13,176,478 | |
| | 1,579,368 | | | Eaton Vance Tax-Managed Global Diversified Equity Income Fund | | | 12,634,944 | |
| | 357,972 | | | Fifth Street Finance Corp. | | | 3,336,299 | |
| | 11,074 | | | First Trust Senior Floating Rate Income Fund II | | | 148,613 | |
| | 498,033 | | | Gabelli Dividend & Income Trust | | | 6,818,072 | |
| | 388,645 | | | General American Investors Co., Inc. | | | 8,923,289 | |
| | 70,892 | | | Guggenheim Build America Bonds Managed Duration Trust | | | 1,419,967 | |
| | 214,797 | | | H&Q Life Sciences Investors Fund | | | 2,246,777 | |
| | 59,150 | | | Highland Credit Strategies Fund | | | 366,730 | |
| | 344,690 | | | ING Prime Rate Trust | | | 1,764,813 | |
| | 210,602 | | | Invesco Van Kampen Dynamic Credit Opportunities Fund | | | 2,242,911 | |
| | 153,067 | | | Invesco Van Kampen Senior Income Trust | | | 645,943 | |
| | 4,316,281 | | | Liberty All Star Equity Fund | | | 17,696,752 | |
| | 247,506 | | | LMP Capital and Income Fund, Inc. | | | 2,833,944 | |
| | 473,714 | | | Macquarie Global Infrastructure Total Return Fund, Inc. | | | 7,257,298 | |
| | 365,719 | | | Morgan Stanley Emerging Markets Domestic Debt Fund, Inc. | | | 5,291,954 | |
| | 25,682 | | | Nuveen Floating Rate Income Fund | | | 260,159 | |
| | 1,272,560 | | | Nuveen Multi -Strategy Income and Growth Fund | | | 9,544,200 | |
| | 1,817,154 | | | Nuveen Multi-Strategy Income and Growth Fund 2 | | | 14,282,830 | |
| | 229,646 | | | PIMCO Income Opportunity Fund | | | 5,651,588 | |
| | 669,249 | | | PIMCO Income Strategy Fund II | | | 5,869,314 | |
| | 490,419 | | | Royce Focus Trust, Inc. | | | 2,962,131 | |
| | 1,806,506 | | | Royce Value Trust, Inc. | | | 20,016,086 | |
| | 376,477 | | | SunAmerica Focused Alpha Growth Fund,Inc. | | | 6,641,054 | |
| | 1,214,541 | | | TCW Strategic Income Fund, Inc. | | | 6,048,414 | |
| | 100,000 | | | Templeton Emerging Markets Fund | | | 1,681,000 | |
| | |
Annual Report | September 30, 2011 | | 15 |
| | |
RiverNorth Core Opportunity Fund | | Schedule of Investments |
| | September 30, 2011 |
| | | | | | | | |
| Shares/Description | | Value | |
| | 996,396 | | | Tri-Continental Corp. | | $ | 12,674,157 | |
| | 156,599 | | | Wells Fargo Advantage Multi-Sector Income Fund | | | 2,225,272 | |
| | 172,041 | | | Western Asset Global Corporate Defined Opportunity Fund, Inc. | | | 2,974,589 | |
| | 263,992 | | | Western Asset/Claymore Inflation-Linked Opportunities & Income Fund | | | 3,334,219 | |
| | 3,632,391 | | | Zweig Total Return Fund, Inc. | | | 11,005,781 | |
| | | | | | | | |
| |
| | TOTAL CLOSED-END FUNDS (Cost $279,891,203) | | | 282,859,136 | |
| | | | | | | | |
| |
| | MUTUAL FUNDS - 4.32% | | | | |
| | 533,820 | | | Calamos Convertible Fund - Class A | | | 9,603,429 | |
| | 1,111,161 | | | Eaton Vance Floating-Rate Advantaged Fund | | | 11,489,401 | |
| | | | | | | | |
| |
| | TOTAL MUTUAL FUNDS (Cost $15,487,073) | | | 21,092,830 | |
| | | | | | | | |
| |
| | EXCHANGE-TRADED FUNDS - 18.76% | | | | |
| | 100,000 | | | iShares MSCI EAFE Index Fund | | | 4,778,000 | |
| | 176,839 | | | iShares MSCI Emerging Markets Index Fund | | | 6,206,165 | |
| | 60,537 | | | iShares Russell 1000 Growth Index Fund | | | 3,183,035 | |
| | 487,153 | | | iShares S&P 100 Index Fund | | | 25,054,279 | |
| | 30,000 | | | iShares S&P Global 100 Index Fund | | | 1,608,600 | |
| | 327,568 | | | Powershares FTSE RAFI US 1000 Portfolio | | | 16,021,351 | |
| | 118,563 | | | Rydex Russell Top 50 ETF | | | 9,769,591 | |
| | 111,000 | | | SPDR Barclays Capital Convertible Securities ETF | | | 3,954,930 | |
| | 63,914 | | | SPDR S&P 500 ETF | | | 7,231,869 | |
| | 247,860 | | | Vanguard MSCI EAFE ETF | | | 7,468,022 | |
| | 175,300 | | | Vanguard MSCI Emerging Markets ETF | | | 6,280,999 | |
| | | | | | | | |
| |
| | TOTAL EXCHANGE-TRADED FUNDS (Cost $93,317,194) | | | 91,556,841 | |
| | | | | | | | |
| |
| | HOLDING & INVESTMENT MANAGEMENT COMPANIES - 0.19% | | | | |
| | 12,100 | | | Affiliated Managers Group, Inc.(a) | | | 944,405 | |
| | | | | | | | |
| |
| | TOTAL HOLDING & INVESTMENT MANAGEMENT COMPANIES (Cost $634,253) | | | 944,405 | |
| | | | | | | | |
| |
| | PREFERRED STOCKS - 0.82% | | | | |
| | 64,103 | | | General American Investors Co., Inc., Series B, 5.950% | | | 1,639,114 | |
| | |
| 16 | | (888) 848-7569 | www.rivernorthfunds.com |
| | |
RiverNorth Core Opportunity Fund | | Schedule of Investments |
| | September 30, 2011 |
| | | | | | | | |
| Shares/Description | | Value | |
| | 92,500 | | | Kayne Anderson MLP Investment Co., Series D, 4.950% | | $ | 2,359,675 | |
| | | | | | | | |
| |
| | TOTAL PREFERRED STOCKS (Cost $3,825,799) | | | 3,998,789 | |
| | | | | | | | |
| |
| REAL ESTATE INVESTMENT TRUSTS - 1.51% | | | | |
| | 355,035 | | | Apollo Commercial Real Estate Finance, Inc. | | | 4,675,811 | |
| | 208,533 | | | Colony Financial, Inc. | | | 2,694,246 | |
| | | | | | | | |
| |
| | TOTAL REAL ESTATE INVESTMENT TRUSTS (Cost $9,382,783) | | | 7,370,057 | |
| | | | | | | | |
| |
| | TOTAL INVESTMENTS - 83.54% (Cost $402,538,305) | | | 407,822,058 | |
| CASH - 15.48% | | | 75,567,253 | |
| OTHER ASSETS IN EXCESS OF LIABILITIES - 0.98% | | | 4,805,842 | |
| | | | | | | | |
| NET ASSETS - 100.00% | | $ | 488,195,153 | |
| | | | | | | | |
| (a) | Non-income producing security. |
Common Abbreviations:
ETF - Exchange Traded Fund.
MLP – Master Limited Partnership.
MSCI – Morgan Stanley Capital International.
S&P – Standard & Poor’s.
SPDR – Standard & Poor’s Depository Receipts.
See Notes to Financial Statements.
| | |
Annual Report | September 30, 2011 | | 17 |
| | |
RiverNorth/DoubleLine Strategic Income Fund | | Schedule of Investments |
| | September 30, 2011 |
| | | | | | |
| Shares/Description | | Value | |
CLOSED-END FUNDS - 18.48% | | | | |
919,822 | | AllianceBernstein Income Fund, Inc. | | $ | 7,330,981 | |
246,496 | | Apollo Senior Floating Rate Fund, Inc. | | | 3,884,777 | |
309,764 | | BlackRock Build America Bond Trust | | | 6,257,233 | |
257,601 | | BlackRock Credit Allocation Income Trust I, Inc. | | | 2,264,313 | |
197,900 | | BlackRock Credit Allocation Income Trust II, Inc. | | | 1,848,386 | |
283,748 | | BlackRock Credit Allocation Income Trust III, Inc. | | | 2,803,430 | |
451,650 | | BlackRock Credit Allocation Income Trust IV, Inc. | | | 5,184,942 | |
21,048 | | BlackRock Diversified Income Strategies Fund, Inc. | | | 193,431 | |
7,100 | | BlackRock Floating Rate Income Strategies Fund, Inc. | | | 90,383 | |
111,054 | | BlackRock Income Opportunity Trust, Inc. | | | 1,089,440 | |
291,594 | | BlackRock Income Trust, Inc. | | | 2,102,393 | |
95,510 | | BlackRock Limited Duration Income Trust | | | 1,517,654 | |
254,901 | | Calamos Convertible and High Income Fund | | | 2,829,401 | |
66,889 | | Calamos Convertible Opportunities and Income Fund | | | 759,190 | |
187,604 | | DWS Global High Income Fund, Inc. | | | 1,348,873 | |
37,000 | | Eaton Vance Floating-Rate Income Trust | | | 521,330 | |
148,120 | | Eaton Vance Limited Duration Income Fund | | | 2,171,439 | |
90,450 | | Eaton Vance Senior Floating-Rate Trust | | | 1,285,294 | |
10,200 | | Eaton Vance Senior Income Trust | | | 64,362 | |
167,277 | | Eaton Vance Short Duration Diversified Income Fund | | | 2,691,487 | |
49,021 | | Eaton Vance Tax-Advantaged Bond and Options Strategies Fund | | | 811,788 | |
262,641 | | Federated Enhanced Treasury Income Fund | | | 3,939,615 | |
17,815 | | First Trust Senior Floating Rate Income Fund II | | | 239,077 | |
141,450 | | First Trust Strategic High Income Fund | | | 488,003 | |
132,167 | | First Trust Strategic High Income Fund III | | | 524,703 | |
129,838 | | Guggenheim Build America Bonds Managed Duration Trust | | | 2,600,655 | |
11,600 | | Helios Advantage Income Fund, Inc. | | | 87,696 | |
29,876 | | Helios Multi-Sector High Income Fund, Inc. | | | 153,264 | |
76,503 | | Helios Strategic Income Fund, Inc. | | | 406,996 | |
142,301 | | Highland Credit Strategies Fund | | | 882,266 | |
499,867 | | ING Prime Rate Trust | | | 2,559,319 | |
248,532 | | Invesco Van Kampen Dynamic Credit Opportunities Fund | | | 2,646,866 | |
439,051 | | Invesco Van Kampen Senior Income Trust | | | 1,852,795 | |
127,328 | | Montgomery Street Income Securities, Inc. | | | 1,986,317 | |
10,780 | | Morgan Stanley Emerging Markets Debt Fund, Inc. | | | 104,243 | |
285,728 | | Morgan Stanley Emerging Markets Domestic Debt Fund, Inc. | | | 4,134,484 | |
29,058 | | Nuveen Build America Bond Opportunity Fund | | | 614,286 | |
58,900 | | Nuveen Build American Bond Term Fund | | | 1,175,055 | |
47,689 | | Nuveen Floating Rate Income Fund | | | 483,090 | |
76,724 | | Nuveen Multi-Currency Short-Term Government Income Fund | | | 998,179 | |
118,500 | | Nuveen Multi-Strategy Income and Growth Fund | | | 888,750 | |
249,844 | | Nuveen Multi-Strategy Income and Growth Fund 2 | | | 1,963,774 | |
2,891 | | Nuveen Short Duration Credit Opportunities Fund | | | 49,638 | |
56,366 | | PIMCO Income Opportunity Fund | | | 1,387,167 | |
| | |
| 18 | | (888) 848-7569 | www.rivernorthfunds.com |
| | |
RiverNorth/DoubleLine Strategic Income Fund | | Schedule of Investments |
| | September 30, 2011 |
| | | | | | |
| Shares/Description | | Value | |
14,862 | | PIMCO Income Strategy Fund | | $ | 149,066 | |
220,636 | | PIMCO Income Strategy Fund II | | | 1,934,978 | |
31,123 | | Putnam Master Intermediate Income Trust | | | 157,171 | |
347,247 | | Wells Fargo Advantage Multi-Sector Income Fund | | | 4,934,380 | |
121,248 | | Western Asset Global Corporate Defined Opportunity Fund, Inc. | | | 2,096,378 | |
66,631 | | Western Asset Inflation Management Fund, Inc. | | | 1,161,378 | |
| | | | | | |
| |
TOTAL CLOSED-END FUNDS (Cost $91,073,408) | | | 87,650,116 | |
| | | | | | |
| |
PREFERRED STOCKS - 0.88% | | | | |
3,909 | | General American Investors Co., Inc., Series B, 5.950% | | | 99,953 | |
48,014 | | The GDL Fund, Series B, 7.000% | | | 2,496,728 | |
154,100 | | Tortoise Energy Capital Corp., 5.000% | | | 1,568,738 | |
| | | | | | |
| |
TOTAL PREFERRED STOCKS (Cost $4,166,746) | | | 4,165,419 | |
| | | | | | |
| |
REAL ESTATE INVESTMENT TRUSTS - 0.63% | | | | |
150,124 | | Apollo Commercial Real Estate Finance, Inc. | | | 1,977,133 | |
79,048 | | Colony Financial, Inc. | | | 1,021,300 | |
| | | | | | |
| |
TOTAL REAL ESTATE INVESTMENT TRUSTS (Cost 3,630,934) | | | 2,998,433 | |
| | | | | | |
| | | | | | | | | | |
| Principal Amount/Description | | Rate | | Maturity | | Value | |
CORPORATE BONDS - 14.04% | |
Argentina - 0.20% | |
$400,000 | | Pan American Energy LLC(a) | | 7.88% | | 05/07/2021 | | | 404,480 | |
150,000 | | Provincia de Neuquen Argentina(b) | | 7.88% | | 04/26/2021 | | | 142,500 | |
350,000 | | YPF SA | | 10.00% | | 11/02/2028 | | | 390,250 | |
| | | | | | | | | | |
| | | | | | | | | 937,230 | |
| | | | | | | | | | |
Australia - 0.15% | | | | | | |
700,000 | | Australia & New Zealand Banking Group Ltd.(b) | | 4.88% | | 01/12/2021 | | | 728,612 | |
| | | | | | | | | | |
| | | | | | | | | 728,612 | |
| | | | | | | | | | |
Bermuda - 0.21% | | | | | | |
200,000 | | Digicel Ltd.(b) | | 8.25% | | 09/01/2017 | | | 190,000 | |
400,000 | | Inkia Energy Ltd.(a) | | 8.38% | | 04/04/2021 | | | 396,000 | |
| | |
Annual Report | September 30, 2011 | | 19 |
| | |
RiverNorth/DoubleLine Strategic Income Fund | | Schedule of Investments |
| | September 30, 2011 |
| | | | | | | | | | | | |
| Principal Amount/Description | | Rate | | Maturity | | Value | |
| | $400,000 | | | Qtel International Finance Ltd.(a) | | 3.38% | | 10/14/2016 | | $ | 402,250 | |
| | | | | | | | | | | | |
| | | | | | | | | | | 988,250 | |
| | | | | | | | | | | | |
| Brazil - 0.35% | | | | |
| | 400,000 | | | Banco do Nordeste do Brasil SA(a) | | 3.63% | | 11/09/2015 | | | 398,000 | |
| | 600,000 | | | Cosan Overseas Ltd. | | 8.25% | | 12/31/2049 | | | 570,000 | |
| | 200,000 | | | Globo Comunicacao e Participacoes SA(a) | | 7.25% | | 04/26/2022 | | | 208,000 | |
| | 300,000 | | | Globo Comunicacao e Participacoes SA(a)(c) | | 6.25% | | 07/20/2049 | | | 308,250 | |
| | 200,000 | | | JBS SA(a) | | 10.50% | | 08/04/2016 | | | 192,000 | |
| | | | | | | | | | | | |
| | | | | | | | | | | 1,676,250 | |
| | | | | | | | | | | | |
| British Virgin Islands - 0.17% | | | | |
| | 100,000 | | | C10 Capital SPV Ltd.(a)(d) | | 6.72% | | 12/31/2049 | | | 47,500 | |
| | 200,000 | | | Gold Fields Orogen Holding BVI Ltd.(b) | | 4.88% | | 10/07/2020 | | | 184,711 | |
| | 200,000 | | | Gold Fields Orogen Holding BVI Ltd.(a) | | 4.88% | | 10/07/2020 | | | 184,461 | |
| | 400,000 | | | Hongkong Electric Finance Ltd. | | 4.25% | | 12/14/2020 | | | 398,774 | |
| | | | | | | | | | | | |
| | | | | | | | | | | 815,446 | |
| | | | | | | | | | | | |
| Canada - 0.59% | | | | |
| | 250,000 | | | Hydro Quebec | | 2.00% | | 06/30/2016 | | | 255,599 | |
| | 100,000 | | | Hydro Quebec | | 7.50% | | 04/01/2016 | | | 124,389 | |
| | 600,000 | | | Pacific Rubiales Energy Corp.(a) | | 8.75% | | 11/10/2016 | | | 659,250 | |
| | 700,000 | | | Province of Ontario Canada | | 2.30% | | 05/10/2016 | | | 726,429 | |
| | 200,000 | | | PTTEP Canada International Finance Ltd.(a) | | 5.69% | | 04/05/2021 | | | 203,600 | |
| | 800,000 | | | Royal Bank of Canada | | 2.30% | | 07/20/2016 | | | 810,243 | |
| | | | | | | | | | | | |
| | | | | | | | | | | 2,779,510 | |
| | | | | | | | | | | | |
| Cayman Islands - 0.70% | |
| | 200,000 | | | AES Andres Dominicana Ltd.(a) | | 9.50% | | 11/12/2020 | | | 200,000 | |
| | 400,000 | | | EGE Haina Finance Co.(a) | | 9.50% | | 04/26/2017 | | | 406,000 | |
| | 200,000 | | | Hutchison Whampoa International 10 Ltd.(a)(d) | | 6.00% | | 10/28/2049 | | | 192,500 | |
| | 100,000 | | | Industrial Subordinated Trust(b) | | 8.25% | | 07/27/2021 | | | 103,000 | |
| | 100,000 | | | Minerva Overseas II Ltd.(a) | | 10.88% | | 11/15/2019 | | | 80,000 | |
| | 350,000 | | | Odebrecht Finance Ltd.(a) | | 7.50% | | 09/29/2049 | | | 343,438 | |
| | 500,000 | | | Petrobras International Finance Co. - Pifco | | 3.88% | | 01/27/2016 | | | 501,000 | |
| | 950,000 | | | Transocean, Inc. | | 6.00% | | 03/15/2018 | | | 1,013,928 | |
| | 500,000 | | | Vale Overseas Ltd. | | 4.63% | | 09/15/2020 | | | 490,000 | |
| | | | | | | | | | | | |
| | | | | | | | | | | 3,329,866 | |
| | | | | | | | | | | | |
| Chile - 0.28% | | | | |
| | 180,000 | | | AES Gener SA(b) | | 5.25% | | 08/15/2021 | | | 175,387 | |
| | 250,000 | | | Automotores Gildemeister SA(b) | | 8.25% | | 05/24/2021 | | | 239,375 | |
| | |
| 20 | | (888) 848-7569 | www.rivernorthfunds.com |
| | |
RiverNorth/DoubleLine Strategic Income Fund | | Schedule of Investments |
| | September 30, 2011 |
| | | | | | | | | | | | |
| Principal Amount/Description | | Rate | | Maturity | | Value | |
| | $200,000 | | | Automotores Gildemeister SA(a) | | 8.25% | | 05/24/2021 | | $ | 191,500 | |
| | 200,000 | | | Cencosud SA(a) | | 5.50% | | 01/20/2021 | | | 201,314 | |
| | 500,000 | | | Codelco, Inc.(a) | | 3.75% | | 11/04/2020 | | | 499,558 | |
| | | | | | | | | | | | |
| | | | | | | | | | | 1,307,134 | |
| | | | | | | | | | | | |
| Colombia - 0.04% | | | | | | | | |
| | 200,000 | | | BanColombia SA(b) | | 5.95% | | 06/03/2021 | | | 195,500 | |
| | | | | | | | | | | | |
| | | | | | | | | | | 195,500 | |
| | | | | | | | | | | | |
| Cyprus - 0.02% | | | | | | | | |
| | 100,000 | | | Alfa MTN Markets Ltd. for ABH Financial Ltd(a) | | 8.20% | | 06/25/2012 | | | 100,850 | |
| | | | | | | | | | | | |
| | | | | | | | | | | 100,850 | |
| | | | | | | | | | | | |
| El Salvador - 0.02% | | | | | | | | |
| | 100,000 | | | Telemovil Finance Co. Ltd.(a) | | 8.00% | | 10/01/2017 | | | 98,000 | |
| | | | | | | | | | | | |
| | | | | | | | | | | 98,000 | |
| | | | | | | | | | | | |
| European Union - 0.30% | | | | | | | | |
| | 1,100,000 | | | Corp. Andina de Fomento | | 3.75% | | 01/15/2016 | | | 1,119,220 | |
| | 300,000 | | | Eurasian Development Bank(a) | | 7.38% | | 09/24/2014 | | | 306,744 | |
| | | | | | | | | | | | |
| | | | | | | | | | | 1,425,964 | |
| | | | | | | | | | | | |
| France - 0.36% | | | | | | | | |
| | 1,150,000 | | | France Telecom SA | | 2.75% | | 09/14/2016 | | | 1,143,253 | |
| | 550,000 | | | Sanofi | | 2.63% | | 03/29/2016 | | | 569,988 | |
| | | | | | | | | | | | |
| | | | | | | | | | | 1,713,241 | |
| | | | | | | | | | | | |
| Germany - 0.08% | | | | | | | | |
| | 400,000 | | | Deutsche Bank AG | | 3.25% | | 01/11/2016 | | | 392,817 | |
| | | | | | | | | | | | |
| | | | | | | | | | | 392,817 | |
| | | | | | | | | | | | |
| Great Britain - 0.40% | | | | | | | | |
| | 500,000 | | | BP Capital Markets PLC | | 4.75% | | 03/10/2019 | | | 551,050 | |
| | 650,000 | | | British Telecommunications PLC | | 5.95% | | 01/15/2018 | | | 724,516 | |
| | 600,000 | | | HSBC Holdings PLC | | 5.10% | | 04/05/2021 | | | 619,893 | |
| | | | | | | | | | | | |
| | | | | | | | | | | 1,895,459 | |
| | | | | | | | | | | | |
| Ireland - 0.04% | | | | | | | | |
| | 200,000 | | | AK Transneft OJSC Via TransCapitalInvest Ltd.(a) | | 5.67% | | 03/05/2014 | | | 201,400 | |
| | | | | | | | | | | | |
| | | | | | | | | | | 201,400 | |
| | | | | | | | | | | | |
| Kazakhstan - 0.01% | | | | | | | | |
| | 60,000 | | | BTA Bank JSC(a)(c) | | 10.75% | | 07/01/2018 | | | 27,000 | |
| | | | | | | | | | | | |
| | | | | | | | | | | 27,000 | |
| | | | | | | | | | | | |
| Luxembourg - 0.42% | | | | | | | | |
| | 200,000 | | | ArcelorMittal | | 5.38% | | 06/01/2013 | | | 204,181 | |
| | 250,000 | | | ArcelorMittal | | 3.75% | | 08/05/2015 | | | 233,753 | |
| | |
Annual Report | September 30, 2011 | | 21 |
| | |
RiverNorth/DoubleLine Strategic Income Fund | | Schedule of Investments |
| | September 30, 2011 |
| | | | | | | | | | | | |
| Principal Amount/Description | | Rate | | Maturity | | Value | |
| | $100,000 | | | Bank of Moscow OJSC Via Kuznetski Capital(d) | | 5.97% | | 11/25/2015 | | $ | 88,500 | |
| | 660,000 | | | Covidien International Finance SA | | 2.80% | | 06/15/2015 | | | 685,207 | |
| | 500,000 | | | Gazprom OAO Via Gaz Capital SA(a) | | 5.09% | | 11/29/2015 | | | 495,000 | |
| | 200,000 | | | Russian Agricultural Bank OJSC Via RSHB Capital SA(b)(d) | | 6.00% | | 06/03/2021 | | | 172,000 | |
| | 100,000 | | | VTB Bank OJSC Via VTB Capital SA(a) | | 6.55% | | 10/13/2020 | | | 93,065 | |
| | | | | | | | | | | | |
| | | | | | | | | | | 1,971,706 | |
| | | | | | | | | | | | |
| Mexico - 0.52% | | | | | | | | |
| | 100,000 | | | America Movil SAB de CV | | 6.13% | | 03/30/2040 | | | 105,000 | |
| | 200,000 | | | Banco Mercantil del Norte SA(a) | | 4.38% | | 07/19/2015 | | | 201,000 | |
| | 400,000 | | | Banco Mercantil del Norte SA(a)(d) | | 6.86% | | 10/13/2021 | | | 396,000 | |
| | 600,000 | | | Controladora Comercial Mexicana SAB de CV(a) | | 7.00% | | 06/30/2018 | | | 573,000 | |
| | 300,000 | | | Empresas ICA SAB de CV(a) | | 8.90% | | 02/04/2021 | | | 267,000 | |
| | 500,000 | | | Gruma SAB de CV(a) | | 7.75% | | 03/03/2099 | | | 500,000 | |
| | 100,000 | | | Ixe Banco SA(a) | | 9.25% | | 10/14/2020 | | | 111,500 | |
| | 300,000 | | | Sigma Alimentos SA de CV(a) | | 6.88% | | 12/16/2019 | | | 310,500 | |
| | | | | | | | | | | | |
| | | | | | | | | | | 2,464,000 | |
| | | | | | | | | | | | |
| Netherlands - 0.27% | | | | | | | | |
| | 200,000 | | | Banco Continental SA via Continental Trustees Cayman Ltd.(a)(d) | | 7.38% | | 10/07/2020 | | | 194,000 | |
| | 400,000 | | | Koninklijke KPN NV | | 8.38% | | 10/01/2030 | | | 517,232 | |
| | 200,000 | | | Marfrig Holding Europe BV(b) | | 8.38% | | 05/09/2018 | | | 128,000 | |
| | 200,000 | | | VimpelCom Holdings BV(b) | | 7.50% | | 03/01/2022 | | | 161,500 | |
| | 300,000 | | | WPE International Cooperatief UA(a) | | 10.38% | | 09/30/2020 | | | 273,000 | |
| | | | | | | | | | | | |
| | | | | | | | | | | 1,273,732 | |
| | | | | | | | | | | | |
| Norway - 0.08% | | | | | | | | |
| | 400,000 | | | Corp. Pesquera Inca SAC(a) | | 9.00% | | 02/10/2017 | | | 404,000 | |
| | | | | | | | | | | | |
| | | | | | | | | | | 404,000 | |
| | | | | | | | | | | | |
| Panama - 0.02% | | | | | | | | |
| | 100,000 | | | AES El Salvador Trust(a) | | 6.75% | | 02/01/2016 | | | 98,500 | |
| | | | | | | | | | | | |
| | | | | | | | | | | 98,500 | |
| | | | | | | | | | | | |
| Peru - 0.15% | | | | | | | | |
| | 100,000 | | | Banco de Credito del Peru(b)(d) | | 6.88% | | 09/16/2026 | | | 99,000 | |
| | 300,000 | | | Banco de Credito del Peru(a) | | 4.75% | | 03/16/2016 | | | 292,500 | |
| | 100,000 | | | Banco de Credito del Peru(a)(d) | | 9.75% | | 11/06/2069 | | | 113,000 | |
| | 200,000 | | | Banco Internacional del Peru SAA(a)(d) | | 8.50% | | 04/23/2070 | | | 204,000 | |
| | | | | | | | | | | | |
| | | | | | | | | | | 708,500 | |
| | | | | | | | | | | | |
| | |
| 22 | | (888) 848-7569 | www.rivernorthfunds.com |
| | |
RiverNorth/DoubleLine Strategic Income Fund | | Schedule of Investments |
| | September 30, 2011 |
| | | | | | | | | | | | |
| Principal Amount/Description | | Rate | | Maturity | | Value | |
| Qatar - 0.06% | | | | | | | | |
| | $250,000 | | | Ras Laffan Liquefied Natural Gas Co. Ltd. III(a) | | 5.84% | | 09/30/2027 | | $ | 276,250 | |
| | | | | | | | | | | | |
| | | | | | | | | | | 276,250 | |
| | | | | | | | | | | | |
| Singapore - 0.13% | | | | | | | | |
| | 600,000 | | | Oversea-Chinese Banking Corp. Ltd.(d) | | 4.25% | | 11/18/2019 | | | 616,303 | |
| | | | | | | | | | | | |
| | | | | | | | | | | 616,303 | |
| | | | | | | | | | | | |
| South Korea - 0.55% | | | | | | | | |
| | 600,000 | | | Export-Import Bank of Korea | | 3.75% | | 10/20/2016 | | | 588,627 | |
| | 600,000 | | | Industrial Bank of Korea(a) | | 3.75% | | 09/29/2016 | | | 588,030 | |
| | 850,000 | | | Korea Development Bank | | 8.00% | | 01/23/2014 | | | 944,838 | |
| | 300,000 | | | POSCO(b) | | 4.25% | | 10/28/2020 | | | 280,168 | |
| | 200,000 | | | POSCO(b) | | 5.25% | | 04/14/2021 | | | 198,723 | |
| | | | | | | | | | | | |
| | | | | | | | | | | 2,600,386 | |
| | | | | | | | | | | | |
| United States - 7.92% | | | | | | | | |
| | 400,000 | | | 3M Co. | | 5.70% | | 03/15/2037 | | | 526,619 | |
| | 550,000 | | | Alcoa, Inc. | | 6.15% | | 08/15/2020 | | | 558,804 | |
| | 875,000 | | | Altria Group, Inc. | | 9.25% | | 08/06/2019 | | | 1,149,940 | |
| | 500,000 | | | American Airlines 2011-2 Class A Pass Through Trust | | 8.63% | | 10/15/2021 | | | 495,000 | |
| | 800,000 | | | American Express Credit Corp. | | 2.75% | | 09/15/2015 | | | 805,122 | |
| | 500,000 | | | Anheuser-Busch InBev Worldwide, Inc. | | 5.38% | | 11/15/2014 | | | 559,366 | |
| | 550,000 | | | Arrow Electronics, Inc. | | 3.38% | | 11/01/2015 | | | 545,176 | |
| | 75,000 | | | AT&T, Inc.(b) | | 5.35% | | 09/01/2040 | | | 78,904 | |
| | 450,000 | | | AT&T, Inc. | | 5.35% | | 09/01/2040 | | | 473,423 | |
| | 717,000 | | | Berkshire Hathaway, Inc. | | 3.20% | | 02/11/2015 | | | 754,793 | |
| | 400,000 | | | Biogen Idec, Inc. | | 6.88% | | 03/01/2018 | | | 491,170 | |
| | 700,000 | | | Boston Properties LP | | 4.13% | | 05/15/2021 | | | 674,957 | |
| | 711,000 | | | Celgene Corp. | | 3.95% | | 10/15/2020 | | | 722,671 | |
| | 450,000 | | | Citigroup, Inc. | | 6.00% | | 12/13/2013 | | | 472,967 | |
| | 650,000 | | | Comcast Corp. | | 5.85% | | 11/15/2015 | | | 738,419 | |
| | 400,000 | | | ConocoPhillips | | 6.50% | | 02/01/2039 | | | 533,762 | |
| | 100,000 | | | Credit Suisse USA, Inc. | | 4.88% | | 01/15/2015 | | | 105,430 | |
| | 200,000 | | | Credit Suisse USA, Inc. | | 5.38% | | 03/02/2016 | | | 214,362 | |
| | 100,000 | | | Daimler Finance North America LLC | | 6.50% | | 11/15/2013 | | | 109,859 | |
| | 600,000 | | | Daimler Finance North America LLC(b) | | 1.88% | | 09/15/2014 | | | 592,828 | |
| | 965,000 | | | Devon Energy Corp. | | 6.30% | | 01/15/2019 | | | 1,172,891 | |
| | 600,000 | | | DIRECTV Holdings LLC / DIRECTV Financing Co., Inc. | | 5.00% | | 03/01/2021 | | | 636,765 | |
| | 500,000 | | | Drummond Co., Inc | | 7.38% | | 02/15/2016 | | | 508,750 | |
| | 400,000 | | | Duke Energy Corp. | | 3.55% | | 09/15/2021 | | | 400,514 | |
| | 900,000 | | | General Electric Capital Corp. | | 3.75% | | 11/14/2014 | | | 940,653 | |
| | 475,000 | | | Halliburton Co. | | 6.15% | | 09/15/2019 | | | 576,913 | |
| | |
Annual Report | September 30, 2011 | | 23 |
| | |
RiverNorth/DoubleLine Strategic Income Fund | | Schedule of Investments |
| | September 30, 2011 |
| | | | | | | | | | | | |
| Principal Amount/Description | | Rate | | Maturity | | Value | |
| $ | 600,000 | | | Illinois Tool Works, Inc.(b) | | 3.38% | | 09/15/2021 | | $ | 617,069 | |
| | 650,000 | | | Intel Corp. | | 3.30% | | 10/01/2021 | | | 666,485 | |
| | 400,000 | | | International Business Machines Corp. | | 1.95% | | 07/22/2016 | | | 404,252 | |
| | 650,000 | | | JP Morgan Chase & Co. | | 4.95% | | 03/25/2020 | | | 689,450 | |
| | 350,000 | | | Kellogg Co. | | 7.45% | | 04/01/2031 | | | 508,899 | |
| | 500,000 | | | Kinder Morgan Energy Partners LP | | 6.95% | | 01/15/2038 | | | 560,424 | |
| | 500,000 | | | Kraft Foods, Inc. | | 5.38% | | 02/10/2020 | | | 567,562 | |
| | 518,000 | | | Marathon Petroleum Corp.(b) | | 5.13% | | 03/01/2021 | | | 541,208 | |
| | 250,000 | | | MetLife, Inc. | | 6.38% | | 06/15/2034 | | | 294,911 | |
| | 250,000 | | | MetLife, Inc. | | 5.70% | | 06/15/2035 | | | 268,782 | |
| | 150,000 | | | Midamerican Energy Holdings Co. | | 5.95% | | 05/15/2037 | | | 177,570 | |
| | 400,000 | | | Midamerican Energy Holdings Co. | | 6.50% | | 09/15/2037 | | | 503,267 | |
| | 750,000 | | | Motorola Solutions, Inc. | | 6.00% | | 11/15/2017 | | | 831,947 | |
| | 395,000 | | | National Rural Utilities Cooperative Finance Corp. | | 10.38% | | 11/01/2018 | | | 568,920 | |
| | 625,000 | | | News America, Inc. | | 6.65% | | 11/15/2037 | | | 690,826 | |
| | 550,000 | | | Novartis Capital Corp. | | 4.40% | | 04/24/2020 | | | 623,489 | |
| | 450,000 | | | Omnicom Group, Inc. | | 4.45% | | 08/15/2020 | | | 455,439 | |
| | 350,000 | | | ONEOK Partners LP | | 6.13% | | 02/01/2041 | | | 389,496 | |
| | 850,000 | | | Pemex Project Funding Master Trust | | 6.63% | | 06/15/2035 | | | 920,125 | |
| | 650,000 | | | PNC Funding Corp. | | 4.38% | | 08/11/2020 | | | 676,153 | |
| | 400,000 | | | Safeway, Inc. | | 6.25% | | 03/15/2014 | | | 445,604 | |
| | 310,000 | | | Simon Property Group LP | | 5.65% | | 02/01/2020 | | | 340,956 | |
| | 220,000 | | | Southern Copper Corp. | | 6.75% | | 04/16/2040 | | | 218,350 | |
| | 1,100,000 | | | Southern Power Co. | | 4.88% | | 07/15/2015 | | | 1,201,557 | |
| | 200,000 | | | Southwest Airlines Co. | | 5.25% | | 10/01/2014 | | | 214,686 | |
| | 100,000 | | | Southwest Airlines Co. | | 5.75% | | 12/15/2016 | | | 111,058 | |
| | 442,000 | | | Southwest Airlines Co. | | 5.13% | | 03/01/2017 | | | 474,648 | |
| | 300,000 | | | Target Corp. | | 3.88% | | 07/15/2020 | | | 326,299 | |
| | 400,000 | | | The Boeing Co. | | 6.88% | | 03/15/2039 | | | 556,276 | |
| | 925,000 | | | The Coca-Cola Co.(b) | | 1.80% | | 09/01/2016 | | | 929,411 | |
| | 300,000 | | | The Kroger Co. | | 5.50% | | 02/01/2013 | | | 316,032 | |
| | 200,000 | | | The Kroger Co. | | 7.50% | | 01/15/2014 | | | 226,443 | |
| | 426,000 | | | The Procter & Gamble Co. | | 5.55% | | 03/05/2037 | | | 552,011 | |
| | 900,000 | | | Time Warner Cable, Inc. | | 5.00% | | 02/01/2020 | | | 958,927 | |
| | 800,000 | | | United Parcel Service, Inc. | | 3.13% | | 01/15/2021 | | | 838,178 | |
| | 950,000 | | | Valero Energy Corp. | | 6.13% | | 02/01/2020 | | | 1,057,220 | |
| | 900,000 | | | Wal-Mart Stores, Inc. | | 3.25% | | 10/25/2020 | | | 935,553 | |
| | 590,000 | | | Waste Management, Inc. | | 6.13% | | 11/30/2039 | | | 719,727 | |
| | 605,000 | | | WellPoint, Inc. | | 5.25% | | 01/15/2016 | | | 674,471 | |
| | 200,000 | | | WellPoint, Inc. | | 5.88% | | 06/15/2017 | | | 229,230 | |
| | |
| 24 | | (888) 848-7569 | www.rivernorthfunds.com |
| | |
RiverNorth/DoubleLine Strategic Income Fund | | Schedule of Investments |
| | September 30, 2011 |
| | | | | | | | | | |
| Principal Amount/Description | | Rate | | Maturity | | Value | |
$450,000 | | Xerox Corp. | | 4.25% | | 02/15/2015 | | $ | 476,598 | |
| | | | | | | | | | |
| | | | | | | | | 37,599,567 | |
| | | | | | | | | | |
| | | |
TOTAL CORPORATE BONDS (Cost $66,977,053) | | | | | | | 66,625,473 | |
| | | | | | | | | | |
| | | |
COLLATERALIZED MORTGAGE OBLIGATIONS - 23.28% | | | | | | | | |
| | American Home Mortgage Investment Trust | | | | | | | | |
324,823 | | Series 2007-A(b)(c) | | 6.10% | | 01/25/2037 | | | 195,186 | |
| | Banc of America Alternative Loan Trust | | | | | | | | |
195,108 | | Series 2005-6 | | 6.00% | | 07/25/2035 | | | 166,600 | |
1,025,456 | | Series 2005-6 | | 5.50% | | 07/25/2035 | | | 909,547 | |
| | Banc of America Funding Corp. | | | | | | | | |
1,412,502 | | Series 2006-2 | | 5.50% | | 03/25/2036 | | | 1,288,908 | |
| | Banc of America Merrill Lynch Commercial Mortgage, Inc. | | | | | | | | |
51,421,803 | | Series 2005-5(d) | | 0.18% | | 10/10/2045 | | | 48,645 | |
100,000 | | Series 2007-1 | | 5.45% | | 01/15/2017 | | | 107,142 | |
305,000 | | Series 2007-4(d) | | 5.92% | | 02/10/2051 | | | 322,552 | |
| | Banc of America Mortgage Securities, Inc. | | | | | | | | |
675,977 | | Series 2004-8 | | 5.50% | | 09/25/2024 | | | 688,047 | |
| | Bank of America-First Union NB Commercial Mortgage | | | | | | | | |
45,000 | | Series 2001-3(b) | | 6.56% | | 04/11/2037 | | | 44,932 | |
| | BCAP LLC Trust | | | | | | | | |
437,035 | | Series 2007-AA2(d) | | 7.50% | | 04/25/2037 | | | 379,123 | |
283,557 | | Series 2007-AA2 | | 6.00% | | 04/25/2037 | | | 196,482 | |
500,000 | | Series 2010-RR6(b)(d) | | 9.62% | | 08/26/2022 | | | 500,625 | |
| | Bear Stearns Alt-A Trust | | | | | | | | |
3,839,302 | | Series 2006-6(d) | | 5.06% | | 11/25/2036 | | | 2,166,503 | |
| | Bear Stearns Asset Backed Securities Trust | | | | | | | | |
1,379,824 | | Series 2005-HE3(d) | | 0.91% | | 03/25/2035 | | | 989,288 | |
| | Bear Stearns Commercial Mortgage Securities | | | | | | | | |
800,000 | | Series 2001-TOP2(d) | | 6.83% | | 02/15/2035 | | | 797,173 | |
150,000 | | Series 2005-PW10(d) | | 5.45% | | 12/11/2040 | | | 143,588 | |
100,000 | | Series 2006-PW13(d) | | 5.58% | | 08/11/2016 | | | 98,878 | |
| | Chase Mortgage Finance Corp. | | | | | | | | |
1,957,841 | | Series 2007-S3 | | 5.50% | | 05/25/2037 | | | 1,902,333 | |
| | Citigroup Commercial Mortgage Trust | | | | | | | | |
63,000 | | Series 2004-C1(d) | | 5.54% | | 04/15/2040 | | | 61,688 | |
250,000 | | Series 2005-C3(d) | | 4.83% | | 05/15/2043 | | | 253,819 | |
11,895 | | Series 2006-C4(d) | | 5.92% | | 03/15/2049 | | | 11,883 | |
| | Citigroup Mortgage Loan Trust, Inc. | | | | | | | | |
1,800,000 | | Series 2006-WF1(c) | | 6.08% | | 03/25/2036 | | | 1,045,584 | |
2,551,047 | | Series 2007-OPX1(c) | | 6.33% | | 01/25/2037 | | | 1,395,976 | |
| | |
Annual Report | September 30, 2011 | | 25 |
| | |
RiverNorth/DoubleLine Strategic Income Fund | | Schedule of Investments |
| | September 30, 2011 |
| | | | | | | | | | | | |
| Principal Amount/Description | | Rate | | Maturity | | Value | |
| | $2,000,000 | | | Series 2008-AR4(b)(d) | | 5.24% | | 11/25/2038 | | $ | 1,240,000 | |
| | 1,400,000 | | | Series 2008-AR4(b)(d) | | 5.55% | | 11/25/2038 | | | 806,626 | |
| | 1,485,358 | | | Series 2010-8(b)(d) | | 12.29% | | 11/25/2036 | | | 1,142,983 | |
| | | | Citigroup/Deutsche Bank Commercial Mortgage Trust | | | | | | | | |
| | 532,900 | | | Series 2005-CD1(d) | | 0.35% | | 07/15/2044 | | | 526,462 | |
| | 35,000 | | | Series 2006-CD3 | | 5.65% | | 10/15/2048 | | | 30,817 | |
| | 250,000 | | | Series 2007-CD4 | | 5.32% | | 03/11/2012 | | | 258,912 | |
| | | | Citimortgage Alternative Loan Trust | | | | | | | | |
| | 2,171,578 | | | Series 2007-A1 | | 6.00% | | 01/25/2037 | | | 1,492,105 | |
| | 427,744 | | | Series 2007-A1(d) | | 5.17% | | 01/25/2037 | | | 64,000 | |
| | 330,750 | | | Series 2007-A3(d) | | 6.00% | | 03/25/2037 | | | 228,081 | |
| | 752,662 | | | Series 2007-A3(d) | | 5.17% | | 03/25/2037 | | | 113,803 | |
| | 2,276,469 | | | Series 2007-A6 | | 5.50% | | 06/25/2037 | | | 1,641,300 | |
| | | | Commercial Mortgage Asset Trust | | | | | | | | |
| | 250,000 | | | Series 1999-C1(d) | | 7.23% | | 01/17/2032 | | | 262,831 | |
| | | | Commercial Mortgage Pass Through Certificates | | | | | | | | |
| | 25,000 | | | Series 2006-C7(d) | | 5.97% | | 06/10/2046 | | | 23,947 | |
| | 1,231,411 | | | Series 2010-C1(b)(d) | | 2.62% | | 07/10/2046 | | | 96,714 | |
| | 100,000 | | | Series 2011-THL(b) | | 5.95% | | 08/09/2016 | | | 94,104 | |
| | | | Countrywide Alternative Loan Trust | | | | | | | | |
| | 1,256,468 | | | Series 2005-20CB | | 5.50% | | 07/25/2035 | | | 1,009,040 | |
| | 436,771 | | | Series 2005-54CB | | 5.50% | | 11/25/2035 | | | 338,770 | |
| | 1,000,000 | | | Series 2005-6CB | | 5.50% | | 04/25/2035 | | | 820,077 | |
| | 1,148,231 | | | Series 2005-86CB | | 5.50% | | 02/25/2036 | | | 815,648 | |
| | 2,375,123 | | | Series 2005-9CB(d) | | 4.82% | | 05/25/2035 | | | 269,064 | |
| | 1,337,344 | | | Series 2005-9CB(d) | | 0.73% | | 05/25/2035 | | | 977,020 | |
| | 904,870 | | | Series 2006-12CB(d) | | 5.75% | | 05/25/2036 | | | 524,055 | |
| | 4,066,563 | | | Series 2006-15CB | | 6.50% | | 06/25/2036 | | | 2,233,779 | |
| | 621,227 | | | Series 2006-30T1 | | 6.25% | | 11/25/2036 | | | 464,479 | |
| | 426,486 | | | Series 2006-32CB | | 5.50% | | 11/25/2036 | | | 313,712 | |
| | 881,991 | | | Series 2006-36T2(d) | | 26.98% | | 12/25/2036 | | | 1,280,279 | |
| | 3,775,815 | | | Series 2007-23CB(d) | | 0.73% | | 09/25/2037 | | | 1,869,312 | |
| | 3,701,128 | | | Series 2007-23CB(d) | | 6.27% | | 09/25/2037 | | | 841,144 | |
| | | | Countrywide Home Loan Mortgage Pass Through Trust | | | | | | | | |
| | 300,000 | | | Series 2005-J4 | | 5.50% | | 11/25/2035 | | | 272,360 | |
| | 1,587,841 | | | Series 2007-17 | | 6.00% | | 10/25/2037 | | | 1,473,110 | |
| | 1,466,740 | | | Series 2007-3 | | 6.00% | | 04/25/2037 | | | 1,183,770 | |
| | 2,000,000 | | | Series 2007-7 | | 5.75% | | 06/25/2037 | | | 1,660,328 | |
| | | | Credit Suisse First Boston Mortgage Securities Corp. | | | | | | | | |
| | 231,090 | | | Series 2005-10 | | 5.50% | | 11/25/2035 | | | 174,419 | |
| | 215,482 | | | Series 2005-8 | | 5.50% | | 08/25/2025 | | | 192,567 | |
| | | | Credit Suisse Mortgage Capital Certificates | | | | | | | | |
| | 498,461 | | | Series 2006-1 | | 6.00% | | 02/25/2036 | | | 345,576 | |
| | 619,059 | | | Series 2006-4 | | 5.50% | | 05/25/2021 | | | 583,538 | |
| | |
| 26 | | (888) 848-7569 | www.rivernorthfunds.com |
| | |
RiverNorth/DoubleLine Strategic Income Fund | | Schedule of Investments |
| | September 30, 2011 |
| | | | | | | | | | | | |
| Principal Amount/Description | | Rate | | Maturity | | Value | |
| | $1,898,655 | | | Series 2006-5 | | 6.25% | | 06/25/2036 | | $ | 1,034,934 | |
| | 3,519,237 | | | Series 2006-7 | | 5.00% | | 08/25/2036 | | | 2,763,182 | |
| | 210,752 | | | Series 2006-9 | | 6.00% | | 11/25/2036 | | | 189,407 | |
| | 80,000 | | | Series 2006-C3(d) | | 6.01% | | 06/15/2038 | | | 73,042 | |
| | 119,342,587 | | | Series 2006-C4(b)(d) | | 0.75% | | 09/15/2039 | | | 1,392,012 | |
| | 1,129,935 | | | Series 2007-2 | | 5.00% | | 03/25/2037 | | | 1,088,352 | |
| | 860,548 | | | Series 2007-3(d) | | 5.84% | | 04/25/2037 | | | 460,343 | |
| | 199,186 | | | Series 2007-4 | | 6.00% | | 06/25/2037 | | | 173,158 | |
| | | | Crest Dartmouth Street | | | | | | | | |
| | 1,000,000 | | | Series 2003-1A(b)(d) | | 1.86% | | 06/28/2038 | | | 913,750 | |
| | | | CSAB Mortgage Backed Trust | | | | | | | | |
| | 262,877 | | | Series 2007-1(d) | | 5.90% | | 05/25/2037 | | | 143,707 | |
| | | | Deutsche ALT-A Securities, Inc. Alternate Loan Trust | | | | | | | | |
| | 924,958 | | | Series 2005-6(d) | | 4.85% | | 12/25/2035 | | | 107,828 | |
| | 458,194 | | | Series 2005-6(d) | | 1.63% | | 12/25/2035 | | | 275,075 | |
| | | | Deutsche Mortgage Securities, Inc. | | | | | | | | |
| | 331,714 | | | Series 2006-PR1(b)(d) | | 11.80% | | 04/15/2036 | | | 350,062 | |
| | | | First Horizon Alternative Mortgage Securities | | | | | | | | |
| | 248,486 | | | Series 2005-FA6 | | 5.50% | | 09/25/2035 | | | 201,190 | |
| | 297,085 | | | Series 2006-FA7 | | 6.25% | | 12/25/2036 | | | 214,900 | |
| | 501,056 | | | Series 2007-FA2 | | 6.00% | | 04/25/2037 | | | 345,132 | |
| | | | GE Capital Commercial Mortgage Corp. | | | | | | | | |
| | 1,065,000 | | | Series 2002-2A(b)(d) | | 6.31% | | 08/11/2036 | | | 1,069,913 | |
| | | | GMAC Commercial Mortgage Securities, Inc. | | | | | | | | |
| | 200,000 | | | Series 2006-C1(d) | | 5.29% | | 11/10/2045 | | | 191,702 | |
| | | | Greenwich Capital Commercial Funding Corp. | | | | | | | | |
| | 10,000 | | | Series 2004-FL2A(b)(d) | | 0.63% | | 11/05/2019 | | | 9,606 | |
| | 250,000 | | | Series 2007-GG9 | | 5.44% | | 03/10/2039 | | | 260,434 | |
| | | | GS Mortgage Securities Corp. II | | | | | | | | |
| | 250,000 | | | Series 2006-GG6(d) | | 5.62% | | 04/10/2038 | | | 229,500 | |
| | 20,557,154 | | | Series 2006-GG6(b)(d) | | 0.17% | | 04/10/2038 | | | 35,996 | |
| | 20,000 | | | Series 2007-GG10(d) | | 6.00% | | 08/10/2045 | | | 20,880 | |
| | 596,854 | | | Series 2011-GC3(b)(d) | | 1.34% | | 03/10/2044 | | | 35,438 | |
| | | | GSAA Trust | | | | | | | | |
| | 1,055,518 | | | Series 2005-7(d) | | 4.48% | | 05/25/2035 | | | 1,011,543 | |
| | 890,502 | | | Series 2006-18(c) | | 5.68% | | 11/25/2036 | | | 493,752 | |
| | 301,964 | | | Series 2006-6(d) | | 5.32% | | 03/25/2036 | | | 146,183 | |
| | 1,607,043 | | | Series 2007-2(c) | | 6.10% | | 03/25/2037 | | | 952,003 | |
| | | | HSBC Asset Loan Obligation | | | | | | | | |
| | 1,383,937 | | | Series 2007-2 | | 5.50% | | 09/25/2037 | | | 1,341,604 | |
| | | | Indymac IMSC Mortgage Loan Trust | | | | | | | | |
| | 2,869,030 | | | Series 2007-F2 | | 6.50% | | 07/25/2037 | | | 1,409,856 | |
| | | | JP Morgan Alternative Loan Trust | | | | | | | | |
| | 990,368 | | | Series 2005-S1 | | 6.00% | | 12/25/2035 | | | 811,286 | |
| | |
Annual Report | September 30, 2011 | | 27 |
| | |
RiverNorth/DoubleLine Strategic Income Fund | | Schedule of Investments |
| | September 30, 2011 |
| | | | | | | | | | | | |
| Principal Amount/Description | | Rate | | Maturity | | Value | |
| | $352,709 | | | Series 2006-S1 | | 5.00% | | 02/25/2021 | | $ | 300,969 | |
| | 2,657,759 | | | Series 2006-S3(c) | | 6.12% | | 08/25/2036 | | | 2,331,131 | |
| | | | JP Morgan Chase Commercial Mortgage Securities Corp. | | | | | | | | |
| | 948,118 | | | Series 2006-LDP8(d) | | 0.75% | | 05/15/2045 | | | 19,846 | |
| | 200,000 | | | Series 2007-C1 | | 5.72% | | 11/15/2017 | | | 212,666 | |
| | 100,000 | | | Series 2007-CB18(d) | | 5.47% | | 02/12/2017 | | | 89,805 | |
| | 100,000 | | | Series 2007-CB19(d) | | 5.93% | | 05/12/2017 | | | 87,840 | |
| | 50,000 | | | Series 2007-CB19(d) | | 5.93% | | 02/12/2049 | | | 53,249 | |
| | | | JP Morgan Mortgage Acquisition Corp. | | | | | | | | |
| | 500,000 | | | Series 2006-CH2(c) | | 5.46% | | 10/25/2036 | | | 265,859 | |
| | 2,000,000 | | | Series 2007-CH1(c) | | 5.86% | | 05/25/2015 | | | 1,363,010 | |
| | | | JP Morgan Mortgage Trust | | | | | | | | |
| | 1,163,580 | | | Series 2007-S3 | | 6.00% | | 07/25/2037 | | | 1,004,126 | |
| | 710,977 | | | Series 2007-S3 | | 6.00% | | 08/25/2037 | | | 593,826 | |
| | | | LB-UBS Commercial Mortgage Trust | | | | | | | | |
| | 650,000 | | | Series 2001-C2(b) | | 7.29% | | 09/15/2034 | | | 647,245 | |
| | | | Lehman Mortgage Trust | | | | | | | | |
| | 2,046,079 | | | Series 2006-6 | | 5.50% | | 10/25/2036 | | | 1,300,453 | |
| | 5,521,426 | | | Series 2006-7(d) | | 0.48% | | 11/25/2036 | | | 742,577 | |
| | 5,521,426 | | | Series 2006-7(d) | | 7.52% | | 11/25/2036 | | | 1,517,371 | |
| | 3,438,910 | | | Series 2006-8(d) | | 0.65% | | 12/25/2036 | | | 1,505,345 | |
| | 3,438,910 | | | Series 2006-8(d) | | 6.35% | | 12/25/2036 | | | 833,935 | |
| | 1,128,525 | | | Series 2007-10 | | 6.50% | | 01/25/2038 | | | 943,567 | |
| | | | Lehman XS Trust | | | | | | | | |
| | 1,716,957 | | | Series 2006-5(c) | | 5.89% | | 04/25/2036 | | | 1,458,876 | |
| | | | MASTR Asset Securitization Trust | | | | | | | | |
| | 412,908 | | | Series 2003-1 | | 5.75% | | 02/25/2033 | | | 412,406 | |
| | 515,583 | | | Series 2003-2 | | 5.75% | | 04/25/2033 | | | 515,481 | |
| | 567,933 | | | Series 2005-1 | | 5.00% | | 05/25/2035 | | | 568,490 | |
| | | | Merrill Lynch Mortgage Trust | | | | | | | | |
| | 200,000 | | | Series 2005-CKI1(d) | | 5.39% | | 11/12/2037 | | | 195,729 | |
| | | | Merrill Lynch/Countrywide Commercial Mortgage Trust | | | | | | | | |
| | 90,000 | | | Series 2006-3(d) | | 5.46% | | 09/12/2016 | | | 83,906 | |
| | 55,000 | | | Series 2007-8(d) | | 6.10% | | 08/12/2049 | | | 58,277 | |
| | | | Morgan Stanley Capital I | | | | | | | | |
| | 100,000 | | | Series 2006-HQ9 | | 5.69% | | 07/12/2044 | | | 104,250 | |
| | 45,000 | | | Series 2007-HQ11(d) | | 5.45% | | 02/12/2044 | | | 48,482 | |
| | 90,662 | | | Series 2007-HQ12(d) | | 5.77% | | 04/12/2049 | | | 91,762 | |
| | 45,331 | | | Series 2007-HQ12(d) | | 0.48% | | 04/12/2049 | | | 42,929 | |
| | | | Morgan Stanley Dean Witter Capital I | | | | | | | | |
| | 1,042,000 | | | Series 2001-TOP5(b) | | 6.00% | | 10/15/2035 | | | 1,035,682 | |
| | | | Morgan Stanley Mortgage Loan Trust | | | | | | | | |
| | 484,564 | | | Series 2006-11 | | 6.00% | | 08/25/2036 | | | 346,529 | |
| | 2,795,970 | | | Series 2006-7 | | 6.00% | | 06/25/2036 | | | 2,083,517 | |
| | |
| 28 | | (888) 848-7569 | www.rivernorthfunds.com |
| | |
RiverNorth/DoubleLine Strategic Income Fund | | Schedule of Investments |
| | September 30, 2011 |
| | | | | | | | | | | | |
| Principal Amount/Description | | Rate | | Maturity | | Value | |
| | $818,122 | | | Series 2007-3XS(c) | | 5.70% | | 01/25/2047 | | $ | 451,354 | |
| | | | Morgan Stanley Reremic Trust | | | | | | | | |
| | 1,028,606 | | | Series 2011-R1(b)(d) | | 5.94% | | 02/26/2037 | | | 918,031 | |
| | | | Nomura Asset Acceptance Corp. | | | | | | | | |
| | 2,000,000 | | | Series 2005-AP3(d) | | 5.32% | | 08/25/2035 | | | 1,246,382 | |
| | | | N-Star Real Estate CDO Ltd. | | | | | | | | |
| | 265,706 | | | Series 2004-2A(b)(d) | | 0.59% | | 06/28/2039 | | | 251,092 | |
| | | | Prime Mortgage Trust | | | | | | | | |
| | 559,523 | | | Series 2006-1 | | 5.50% | | 06/25/2036 | | | 411,074 | |
| | 190,231 | | | Series 2006-DR1(b) | | 5.50% | | 05/25/2035 | | | 164,654 | |
| | | | RBSGC Mortgage Pass Through Certificates | | | | | | | | |
| | 670,589 | | | Series 2008-B(b) | | 6.00% | | 06/25/2037 | | | 534,793 | |
| | | | Residential Accredit Loans, Inc. | | | | | | | | |
| | 1,010,184 | | | Series 2004-QS15 | | 5.25% | | 11/25/2034 | | | 929,692 | |
| | 1,015,364 | | | Series 2006-QS4 | | 6.00% | | 04/25/2036 | | | 691,196 | |
| | 3,235,410 | | | Series 2006-QS6 | | 6.00% | | 06/25/2036 | | | 2,051,189 | |
| | 2,305,259 | | | Series 2006-QS6 | | 6.00% | | 06/25/2036 | | | 1,461,490 | |
| | 952,766 | | | Series 2006-QS7(d) | | 5.37% | | 06/25/2036 | | | 135,684 | |
| | 317,589 | | | Series 2006-QS7(d) | | 0.63% | | 06/25/2036 | | | 139,983 | |
| | 397,049 | | | Series 2006-QS8(d) | | 0.68% | | 08/25/2036 | | | 190,417 | |
| | 1,191,147 | | | Series 2006-QS8(d) | | 5.32% | | 08/25/2036 | | | 174,123 | |
| | 252,052 | | | Series 2007-QS6 | | 6.25% | | 04/25/2037 | | | 158,461 | |
| | 35,513 | | | Series 2007-QS6(d) | | 53.05% | | 04/25/2037 | | | 73,696 | |
| | 500,000 | | | Series 2008-QR1 | | 6.00% | | 08/25/2036 | | | 252,795 | |
| | | | Residential Asset Mortgage Products, Inc. | | | | | | | | |
| | 298,668 | | | Series 2004-RS4(d) | | 5.07% | | 04/25/2034 | | | 278,321 | |
| | | | Residential Asset Securities Corp. | | | | | | | | |
| | 2,500,000 | | | Series 2004-KS6(d) | | 5.85% | | 07/25/2034 | | | 1,951,805 | |
| | | | Residential Asset Securitization Trust | | | | | | | | |
| | 1,154,101 | | | Series 2006-A1 | | 6.00% | | 04/25/2036 | | | 826,481 | |
| | 2,466,428 | | | Series 2006-A2 | | 6.00% | | 05/25/2036 | | | 1,763,000 | |
| | 1,667,632 | | | Series 2006-A6 | | 6.50% | | 07/25/2036 | | | 1,022,527 | |
| | 266,357 | | | Series 2006-A8 | | 6.50% | | 08/25/2036 | | | 157,805 | |
| | 1,264,403 | | | Series 2006-A8 | | 6.00% | | 08/25/2036 | | | 958,908 | |
| | 563,834 | | | Series 2006-A8(d) | | 5.67% | | 08/25/2036 | | | 108,900 | |
| | 266,350 | | | Series 2007-A6 | | 6.00% | | 06/25/2037 | | | 188,286 | |
| | | | Residential Funding Mortgage Securities I | | | | | | | | |
| | 1,079,294 | | | Series 2006-S6 | | 6.00% | | 07/25/2036 | | | 903,158 | |
| | 1,758,446 | | | Series 2007-S3 | | 6.00% | | 03/25/2037 | | | 1,423,511 | |
| | 1,520,582 | | | Series 2007-S6 | | 6.00% | | 06/25/2037 | | | 1,211,302 | |
| | | | Structured Asset Securities Corp. | | | | | | | | |
| | 574,923 | | | Series 2005-RF1(b)(d) | | 0.58% | | 03/25/2035 | | | 466,280 | |
| | 574,923 | | | Series 2005-RF1(b)(d | | 5.47% | | 03/25/2035 | | | 85,809 | |
| | |
Annual Report | September 30, 2011 | | 29 |
| | |
RiverNorth/DoubleLine Strategic Income Fund | | Schedule of Investments |
| | September 30, 2011 |
| | | | | | | | | | | | |
| Principal Amount/Description | | Rate | | Maturity | | Value | |
| | | | TBW Mortgage Backed Pass Through Certificates | | | | | | | | |
| | $2,516,594 | | | Series 2006-2 | | 7.00% | | 07/25/2036 | | $ | 901,769 | |
| | | | Wachovia Bank Commercial Mortgage Trust | | | | | | | | |
| | 20,316,235 | | | Series 2006-C27(b)(d) | | 0.09% | | 07/15/2045 | | | 167,690 | |
| | 1,931,452 | | | Series 2006-C29(d) | | 0.53% | | 11/15/2048 | | | 31,813 | |
| | | | Washington Mutual Alternative Mortgage Pass Through Certificates | | | | | | | | |
| | 200,000 | | | Series 2005-9 | | 5.50% | | 11/25/2035 | | | 147,369 | |
| | 1,543,674 | | | Series 2006-5 | | 6.00% | | 07/25/2036 | | | 922,724 | |
| | | | Wells Fargo Alternative Loan Trust | | | | | | | | |
| | 2,765,023 | | | Series 2007-PA2 | | 0.66% | | 06/25/2037 | | | 1,425,958 | |
| | 2,765,023 | | | Series 2007-PA2 | | 5.84% | | 06/25/2037 | | | 497,730 | |
| | 1,233,297 | | | Series 2007-PA3 | | 5.75% | | 07/25/2037 | | | 844,743 | |
| | | | Wells Fargo Mortgage Backed Securities Trust | | | | | | | | |
| | 311,650 | | | Series 2006-11 | | 6.00% | | 09/25/2036 | | | 308,990 | |
| | 630,313 | | | Series 2006-2 | | 5.50% | | 03/25/2036 | | | 506,406 | |
| | 440,947 | | | Series 2006-2 | | 5.75% | | 03/25/2036 | | | 431,157 | |
| | 225,182 | | | Series 2006-AR1(d) | | 5.39% | | 03/25/2036 | | | 224,071 | |
| | 1,382,214 | | | Series 2007-10 | | 6.00% | | 07/25/2037 | | | 1,239,074 | |
| | 3,722,059 | | | Series 2007-2 | | 6.00% | | 03/25/2037 | | | 3,219,871 | |
| | | | | | | | | | | | |
| |
| | TOTAL COLLATERALIZED MORTGAGE OBLIGATIONS | | | | |
| (Cost $110,570,555) | | | 110,435,704 | |
| | | | | | | | | | | | |
| |
| FOREIGN GOVERNMENT AGENCY ISSUES - 0.44% | | | | |
| | 1,000,000 | | | Chile Government International Bond | | 3.25% | | 09/14/2021 | | | 977,500 | |
| | 250,000 | | | Development Bank of Kazakhstan JSC | | 6.00% | | 03/23/2026 | | | 219,080 | |
| | 800,000 | | | Mexico Government International Bond | | 5.63% | | 01/15/2017 | | | 895,200 | |
| | | | | | | | | | | | |
| |
| | TOTAL FOREIGN GOVERNMENT AGENCY ISSUES (Cost $2,116,842) | | | 2,091,780 | |
| | | | | | | | | | | | |
| |
| U.S. GOVERNMENT AGENCY OBLIGATIONS - 22.97% | | | | |
| | | | Federal Home Loan Banks | | | | | | | | |
| | 3,050,000 | | | Series 1 | | 0.30% | | 09/10/2012 | | | 3,050,741 | |
| | 1,500,000 | | | Federal Home Loan Mortgage Corp. | | 0.63% | | 12/28/2012 | | | 1,506,112 | |
| | | | Federal Home Loan Mortgage Corp. REMICS | | | | | | | | |
| | 3,813,947 | | | Series 2003-2722(d) | | 9.63% | | 12/15/2033 | | | 4,470,194 | |
| | 899,326 | | | Series 2005-R003 | | 5.50% | | 10/15/2035 | | | 1,042,120 | |
| | 484,031 | | | Series 2007-3261(d) | | 6.20% | | 01/15/2037 | | | 73,497 | |
| | 2,860,358 | | | Series 2007-3382(d) | | 5.77% | | 11/15/2037 | | | 300,172 | |
| | 8,613,772 | | | Series 2008-3423(d) | | 5.42% | | 03/15/2038 | | | 921,381 | |
| | 754,602 | | | Series 2009-3524 | | 6.00% | | 06/15/2038 | | | 803,086 | |
| | |
| 30 | | (888) 848-7569 | www.rivernorthfunds.com |
| | |
RiverNorth/DoubleLine Strategic Income Fund | | Schedule of Investments |
| | September 30, 2011 |
| | | | | | | | | | | | |
| Principal Amount/Description | | Rate | | Maturity | | Value | |
| | $691,045 | | | Series 2009-3549(d) | | 5.57% | | 07/15/2039 | | $ | 78,992 | |
| | 1,452,155 | | | Series 2010-3688 | | 4.00% | | 07/15/2029 | | | 1,511,489 | |
| | 329,029 | | | Series 2010-3738(d) | | 11.50% | | 10/15/2040 | | | 350,149 | |
| | 190,536 | | | Series 2010-3739(d) | | 9.54% | | 11/15/2039 | | | 199,604 | |
| | 253,464 | | | Series 2010-3745(d) | | 9.54% | | 10/15/2040 | | | 256,696 | |
| | 1,947,216 | | | Series 2010-3745(d) | | 9.54% | | 10/15/2040 | | | 2,032,868 | |
| | 907,235 | | | Series 2010-3747(d) | | 14.31% | | 10/15/2040 | | | 982,069 | |
| | 1,276,786 | | | Series 2010-3758(d) | | 5.39% | | 05/15/2039 | | | 1,283,709 | |
| | 238,469 | | | Series 2010-3764(d) | | 9.44% | | 11/15/2040 | | | 246,088 | |
| | 485,532 | | | Series 2010-3766(d) | | 9.54% | | 11/15/2040 | | | 504,767 | |
| | 750,000 | | | Series 2010-3779 | | 3.50% | | 12/15/2030 | | | 778,828 | |
| | 250,000 | | | Series 2010-3779 | | 4.00% | | 12/15/2030 | | | 267,874 | |
| | 481,251 | | | Series 2010-3779 | | 4.50% | | 12/15/2040 | | | 478,018 | |
| | 293,718 | | | Series 2010-3780(d) | | 9.44% | | 12/15/2040 | | | 297,434 | |
| | 240,425 | | | Series 2011-3786(d) | | 9.04% | | 01/15/2041 | | | 241,800 | |
| | 2,423,322 | | | Series 2011-3793(d) | | 9.34% | | 01/15/2041 | | | 2,490,411 | |
| | 1,026,980 | | | Series 2011-3795 | | 4.00% | | 01/15/2041 | | | 1,062,248 | |
| | 185,699 | | | Series 2011-3796(d) | | 9.44% | | 01/15/2041 | | | 189,847 | |
| | 430,046 | | | Series 2011-3798(d) | | 9.04% | | 11/15/2040 | | | 428,859 | |
| | 371,754 | | | Series 2011-3805(d) | | 9.04% | | 02/15/2041 | | | 372,538 | |
| | 1,548,792 | | | Series 2011-3806 | | 5.50% | | 07/15/2034 | | | 1,876,171 | |
| | 600,000 | | | Series 2011-3808 | | 3.50% | | 02/15/2031 | | | 605,625 | |
| | 244,625 | | | Series 2011-3809(d) | | 9.12% | | 02/15/2041 | | | 246,958 | |
| | 500,000 | | | Series 2011-3824 | | 3.50% | | 03/15/2031 | | | 504,687 | |
| | 2,000,000 | | | Series 2011-3824(d) | | 6.87% | | 08/15/2036 | | | 519,366 | |
| | 1,926,702 | | | Series 2011-3838(d) | | 8.40% | | 04/15/2041 | | | 1,884,773 | |
| | 567,955 | | | Series 2011-3857(d) | | 8.80% | | 05/15/2041 | | | 468,690 | |
| | 1,476,776 | | | Series 2011-3863 | | 5.50% | | 08/15/2034 | | | 1,733,114 | |
| | 2,000,000 | | | Series 2011-3864(d) | | 8.82% | | 05/15/2041 | | | 2,026,846 | |
| | 1,013,813 | | | Series 2011-3871 | | 5.50% | | 06/15/2041 | | | 1,236,759 | |
| | 1,800,000 | | | Series 2011-3888 | | 4.00% | | 07/15/2041 | | | 1,826,102 | |
| | 2,821,039 | | | Series 2011-3894 | | 4.50% | | 07/15/2041 | | | 2,916,199 | |
| | 1,893,545 | | | Series 2011-3899(d) | | 12.81% | | 07/15/2041 | | | 1,948,153 | |
| | 2,008,333 | | | Series 2011-3910 | | 5.00% | | 08/15/2041 | | | 2,229,911 | |
| | 1,500,000 | | | Series 2011-3924(d) | | 9.14% | | 09/15/2041 | | | 1,415,436 | |
| | 10,000,000 | | | Series 2011-3925 | | 3.00% | | 09/15/2021 | | | 941,010 | |
| | | | Federal Home Loan Mortgage Pool | | | | | | | | |
| | 2,901,399 | | | Series Pool #G01840 | | 5.00% | | 07/01/2035 | | | 3,127,648 | |
| | 1,326,884 | | | Series Pool #G04587 | | 5.50% | | 08/01/2038 | | | 1,438,093 | |
| | 1,724,448 | | | Series Pool #G04817 | | 5.00% | | 09/01/2038 | | | 1,851,643 | |
| | 1,640,000 | | | Federal National Mortgage Association | | 5.25% | | 08/01/2012 | | | 1,708,139 | |
| | | | Federal National Mortgage Association Pool | | | | | | | | |
| | 826,493 | | | Series Pool #555743 | | 5.00% | | 09/01/2033 | | | 893,370 | |
| | |
Annual Report | September 30, 2011 | | 31 |
| | |
RiverNorth/DoubleLine Strategic Income Fund | | Schedule of Investments |
| | September 30, 2011 |
| | | | | | | | | | | | |
| Principal Amount/Description | | Rate | | Maturity | | Value | |
| | $971,823 | | | Series Pool #735382 | | 5.00% | | 04/01/2035 | | $ | 1,050,155 | |
| | 1,843,828 | | | Series Pool #735484 | | 5.00% | | 05/01/2035 | | | 1,991,008 | |
| | 476,004 | | | Series Pool #AH1140 | | 4.50% | | 12/01/2040 | | | 497,449 | |
| | 490,757 | | | Series Pool #AH4437 | | 4.00% | | 01/01/2041 | | | 508,900 | |
| | 3,223,409 | | | Series Pool #AH7309 | | 4.00% | | 02/01/2031 | | | 3,414,092 | |
| | 1,617,115 | | | Series Pool #MA0353 | | 4.50% | | 03/01/2030 | | | 1,722,312 | |
| | | | Federal National Mortgage Association REMICS | | | | | | | | |
| | 4,490,389 | | | Series 2003-92 | | 5.00% | | 09/25/2033 | | | 5,123,709 | |
| | 659,154 | | | Series 2004-46(d) | | 5.78% | | 03/25/2034 | | | 94,469 | |
| | 1,701,175 | | | Series 2006-101(d) | | 6.36% | | 10/25/2036 | | | 270,567 | |
| | 4,717,040 | | | Series 2006-123(d) | | 6.10% | | 01/25/2037 | | | 635,682 | |
| | 1,232,369 | | | Series 2007-102(d) | | 6.18% | | 11/25/2037 | | | 154,369 | |
| | 2,941,620 | | | Series 2007-108(d) | | 6.14% | | 12/25/2037 | | | 410,315 | |
| | 414,561 | | | Series 2007-30(d) | | 5.89% | | 04/25/2037 | | | 52,491 | |
| | 486,708 | | | Series 2007-51(d) | | 5.88% | | 06/25/2037 | | | 60,571 | |
| | 964,699 | | | Series 2007-53(d) | | 5.88% | | 06/25/2037 | | | 120,724 | |
| | 1,399,892 | | | Series 2008-14 | | 5.50% | | 03/25/2038 | | | 1,633,247 | |
| | 5,633,436 | | | Series 2008-3(d) | | 6.24% | | 02/25/2038 | | | 778,507 | |
| | 1,610,700 | | | Series 2008-81 | | 5.50% | | 09/25/2038 | | | 1,835,998 | |
| | 2,728,110 | | | Series 2009-111 | | 5.00% | | 01/25/2040 | | | 2,928,909 | |
| | 921,747 | | | Series 2009-28(d) | | 5.78% | | 04/25/2037 | | | 101,769 | |
| | 1,665,739 | | | Series 2009-41 | | 4.50% | | 06/25/2039 | | | 1,809,420 | |
| | 3,716,695 | | | Series 2009-42(d) | | 5.78% | | 06/25/2039 | | | 396,408 | |
| | 5,153,549 | | | Series 2009-62(d) | | 5.88% | | 08/25/2039 | | | 632,804 | |
| | 1,719,952 | | | Series 2009-66(d) | | 5.58% | | 02/25/2038 | | | 199,418 | |
| | 2,685,391 | | | Series 2009-68(d) | | 5.03% | | 09/25/2039 | | | 290,898 | |
| | 3,762,000 | | | Series 2009-80 | | 4.50% | | 10/25/2039 | | | 4,088,692 | |
| | 581,467 | | | Series 2010-109(d) | | 52.93% | | 10/25/2040 | | | 867,012 | |
| | 1,895,373 | | | Series 2010-111(d) | | 5.78% | | 10/25/2040 | | | 276,232 | |
| | 520,371 | | | Series 2010-112 | | 4.00% | | 10/25/2040 | | | 517,148 | |
| | 2,285,219 | | | Series 2010-34(d) | | 4.71% | | 04/25/2040 | | | 190,233 | |
| | 468,321 | | | Series 2010-4(d) | | 6.01% | | 02/25/2040 | | | 73,339 | |
| | 1,000,000 | | | Series 2010-58(d) | | 11.91% | | 06/25/2040 | | | 1,128,411 | |
| | 1,797,637 | | | Series 2010-9(d) | | 5.08% | | 02/25/2040 | | | 170,265 | |
| | 401,705 | | | Series 2010-90(d) | | 5.78% | | 08/25/2040 | | | 46,712 | |
| | 500,000 | | | Series 2011-16 | | 3.50% | | 03/25/2031 | | | 504,610 | |
| | 250,000 | | | Series 2011-18(d) | | 9.04% | | 03/25/2041 | | | 247,715 | |
| | 249,625 | | | Series 2011-2(d) | | 9.16% | | 02/25/2041 | | | 253,847 | |
| | 383,588 | | | Series 2011-23(d) | | 8.86% | | 02/25/2041 | | | 379,570 | |
| | 1,000,000 | | | Series 2011-25 | | 3.00% | | 04/25/2026 | | | 1,009,375 | |
| | 500,000 | | | Series 2011-29 | | 3.50% | | 04/25/2031 | | | 504,609 | |
| | 955,797 | | | Series 2011-35(d) | | 8.52% | | 04/25/2041 | | | 951,456 | |
| | 991,465 | | | Series 2011-38(d) | | 8.46% | | 05/25/2041 | | | 983,902 | |
| | |
| 32 | | (888) 848-7569 | www.rivernorthfunds.com |
| | |
RiverNorth/DoubleLine Strategic Income Fund | | Schedule of Investments |
| | September 30, 2011 |
| | | | | | | | | | | | |
| Principal Amount/Description | | Rate | | Maturity | | Value | |
| | $1,200,000 | | | Series 2011-48(d) | | 8.76% | | 06/25/2041 | | $ | 1,150,150 | |
| | 1,161,029 | | | Series 2011-72 | | 5.50% | | 04/25/2037 | | | 1,407,850 | |
| | 1,805,980 | | | Series 2011-77 | | 4.00% | | 08/25/2041 | | | 1,775,737 | |
| | 199,210 | | | Series 2011-8(d) | | 9.16% | | 02/25/2041 | | | 197,458 | |
| | | | Government National Mortgage Association | | | | | | | | |
| | 383,665 | | | Series 2004-83(d) | | 5.85% | | 10/20/2034 | | | 57,309 | |
| | 447,772 | | | Series 2008-6(d) | | 6.23% | | 02/20/2038 | | | 60,755 | |
| | 425,522 | | | Series 2008-67(d) | | 5.77% | | 08/20/2038 | | | 50,119 | |
| | 286,385 | | | Series 2009-10(d) | | 6.42% | | 02/16/2039 | | | 45,901 | |
| | 2,220,985 | | | Series 2009-35 | | 4.50% | | 05/20/2039 | | | 2,412,545 | |
| | 477,368 | | | Series 2009-6(d) | | 5.72% | | 02/20/2038 | | | 59,189 | |
| | 3,867,295 | | | Series 2009-75 | | 5.00% | | 09/20/2039 | | | 4,404,098 | |
| | 892,787 | | | Series 2010-61(d) | | 6.32% | | 09/20/2039 | | | 122,907 | |
| | 300,000 | | | Series 2011-12(e) | | Zero
Coupon | | 12/20/2040 | | | 231,095 | |
| | 3,675,308 | | | Series 2011-72(d) | | 5.92% | | 05/20/2041 | | | 482,167 | |
| | | | | | | | | | | | |
| | TOTAL U.S. GOVERNMENT AGENCY OBLIGATIONS (Cost $103,753,761) | | | | | | | 108,984,883 | |
| | | | | | | | | | | | |
| | | |
| U.S. GOVERNMENT BONDS AND NOTES - 10.70% | | | | | | | | |
| | 4,900,000 | | | U.S. Treasury Bonds | | 0.63% | | 02/28/2013 | | | 4,929,096 | |
| | 4,500,000 | | | U.S. Treasury Bonds | | 8.00% | | 11/15/2021 | | | 7,039,687 | |
| | 1,440,000 | | | U.S. Treasury Bonds | | 6.13% | | 11/15/2027 | | | 2,127,825 | |
| | 4,610,000 | | | U.S. Treasury Bonds | | 4.38% | | 11/15/2039 | | | 5,945,462 | |
| | 5,528,512 | | | U.S. Treasury Inflation Indexed Bonds | | 3.00% | | 07/15/2012 | | | 5,684,864 | |
| | 4,190,000 | | | U.S. Treasury Notes | | 1.88% | | 04/30/2014 | | | 4,351,709 | |
| | 1,980,000 | | | U.S. Treasury Notes | | 1.25% | | 10/31/2015 | | | 2,023,467 | |
| | 6,210,000 | | | U.S. Treasury Notes | | 1.50% | | 07/31/2016 | | | 6,382,240 | |
| | 6,340,000 | | | U.S. Treasury Notes | | 2.75% | | 11/30/2016 | | | 6,904,165 | |
| | 2,160,000 | | | U.S. Treasury Notes | | 2.38% | | 07/31/2017 | | | 2,308,837 | |
| | 2,880,000 | | | U.S. Treasury Notes | | 2.38% | | 05/31/2018 | | | 3,069,665 | |
| | | | | | | | | | | | |
| | | |
| | TOTAL U.S. GOVERNMENT BONDS AND NOTES (Cost $49,861,380) | | | | | | | 50,767,017 | |
| | | | | | | | | | | | |
| | | |
| TOTAL INVESTMENTS - 91.42%
(Cost $432,150,679) | | | | | | | 433,718,825 | |
| CASH - 9.45% | | | | | | | 44,822,663 | |
| LIABILITIES IN EXCESS OF OTHER ASSETS - (0.87)% | | | | | | | (4,098,304) | |
| | | | | | | | | | | | |
| NET ASSETS - 100.00% | | | | | | $ | 474,443,184 | |
| | | | | | | | | | | | |
| | |
Annual Report | September 30, 2011 | | 33 |
| | |
RiverNorth/DoubleLine Strategic Income Fund | | Schedule of Investments |
| | September 30, 2011 |
| (a) | Securities were purchased pursuant to Regulation S under the Securities Act of 1933, which exempts securities offered and sold outside of the United States from registration. Such securities cannot be sold in the United States without either an effective registration statement filed pursuant to the Securities Act of 1933, or pursuant to an exemption from registration. These securities have been deemed liquid under procedures approved by the Fund’s Board of Trustees. As of September 30, 2011, the aggregate market value of those securities was $11,642,440, representing 2.45% of net assets. |
| (b) | Security exempt from registration under Rule 144A of the Securities Act of 1933. These securities have been deemed liquid under procedures approved by the Fund’s Board or Trustees and may normally be sold to qualified institutional buyers in transactions exempt from registration. Total market value of Rule 144A securities amounts to $17,957,119, which represents approximately 3.78% of net assets as of September 30, 2011. |
| (c) | Step bond. Coupon increases periodically based upon a predetermined schedule. Interest rate disclosed is that which is in effect at September 30, 2011. |
| (d) | Floating or variable rate security. Interest rate disclosed is that which is in effect at September 30, 2011. |
| (e) | Zero coupon bond reflects effective yield on the date of purchase. |
Common Abbreviations:
AG - Aktiengesellschaft is a German term that refers to a corporation that is limited by shares, i.e., owned by shareholders.
BV - Besloten Vennootschap a Dutch private limited liability company.
JSC - Joint Stock Company.
LLC - Limited Liability Corp.
NV - Naamloze Vennootschap is the Dutch term for a public limited liability corporation.
OJSC - Open Joint Stock Company.
PLC - Public Limited Co.
REMICS - Real Estate Mortgage Investment Conduits.
SA - Generally designates corporations in various countries, mostly those employing the civil law.
SAA - Sociedad Anónima Abierta - A publicly traded corporation.
SAB de CV - A variable capital company.
SAC - Sociedad Anónima Cerrada - A privately held corporation.
See Notes to Financial Statements.
| | |
| 34 | | (888) 848-7569 | www.rivernorthfunds.com |
| | |
| RiverNorth Core Opportunity Fund | | |
| Statement of Assets and Liabilities | | September 30, 2011 |
| | | | |
ASSETS: | | | | |
Investment in securities: | | | | |
At cost | | $ | 402,538,305 | |
| | | | |
At value | | $ | 407,822,058 | |
Cash | | | 75,567,253 | |
Receivable for fund investments sold | | | 5,720,051 | |
Dividends receivable | | | 1,244,653 | |
Receivable for fund shares sold | | | 485,302 | |
Prepaid expenses and other assets | | | 39,308 | |
| | |
Total Assets | | | 490,878,625 | |
| | |
LIABILITIES: | | | | |
Payable for fund investments purchased | | | 1,587,933 | |
Payable for fund shares redeemed | | | 448,262 | |
Payable to Adviser | | | 422,368 | |
Payable for Fund Accounting and Administration fees | | | 18,420 | |
Accrued 12b-1 fees | | | 105,592 | |
Payable to Trustees and Officers | | | 5,214 | |
Other accrued expenses | | | 95,683 | |
| | |
Total Liabilities | | | 2,683,472 | |
| | |
Net Assets | | $ | 488,195,153 | |
| | |
NET ASSETS CONSIST OF: | | | | |
Paid-in capital | | $ | 454,305,139 | |
Undistributed net investment income | | | 9,549,201 | |
Accumulated net realized gain on investments | | | 19,057,060 | |
Net unrealized appreciation on investments | | | 5,283,753 | |
| | |
Net Assets | | $ | 488,195,153 | |
| | |
PRICING OF SHARES: | | | | |
Net Assets | | $ | 488,195,153 | |
Shares of beneficial interest outstanding (unlimited number of shares, no par value) | | | 43,657,391 | |
| | |
Net Asset Value Per Share and Offering and Redemption Price Per Share | | $ | 11.18 | |
| | |
Minimum Redemption Price Per Share(a) | | $ | 10.96 | |
| | |
| (a) | The Fund will impose a 2.00% redemption fee on shares redeemed within 90 days of purchase. |
See Notes to Financial Statements.
| | |
Annual Report | September 30, 2011 | | 35 |
| | |
RiverNorth/DoubleLine Strategic Income Fund | | |
| Statement of Assets and Liabilities | | September 30, 2011 |
| | | | |
ASSETS: | | | | |
Investment in securities: | | | | |
At cost | | $ | 432,150,679 | |
| | | | |
At value | | $ | 433,718,825 | |
| |
Cash | | | 44,822,663 | |
Receivable for fund investments sold | | | 8,386,623 | |
Receivable for fund shares sold | | | 5,041,793 | |
Interest receivable | | | 2,669,646 | |
Dividends receivable | | | 243,197 | |
Prepaid expenses and other assets | | | 50,649 | |
| | |
Total Assets | | | 494,933,396 | |
| | |
LIABILITIES: | | | | |
Payable for fund investments purchased | | | 19,751,217 | |
Payable for fund shares redeemed | | | 424,646 | |
Payable to Adviser | | | 160,138 | |
Payable for Fund Accounting and Administration fees | | | 34,481 | |
Accrued 12b-1 fees - Class R Shares | | | 24,705 | |
Payable to Trustees and Officers | | | 3,835 | |
Other accrued expenses | | | 91,190 | |
| | |
Total Liabilities | | | 20,490,212 | |
| | |
Net Assets | | $ | 474,443,184 | |
| | |
NET ASSETS CONSIST OF: | | | | |
Paid-in capital | | $ | 471,191,704 | |
Undistributed net investment income | | | 746,673 | |
Accumulated net realized gain on investments | | | 936,661 | |
Net unrealized appreciation on investments | | | 1,568,146 | |
| | |
Net Assets | | $ | 474,443,184 | |
| | |
PRICING OF SHARES: | | | | |
Class I Shares | | | | |
Net Assets | | $ | 332,664,007 | |
Shares of beneficial interest outstanding (unlimited number of shares, no par value) | | | 31,404,478 | |
| | |
Net Asset Value Per Share and Offering and Redemption Price Per Share | | $ | 10.59 | |
| | |
Minimum Redemption Price Per Share(a) | | $ | 10.38 | |
| | |
Class R Shares | | | | |
Net Assets | | $ | 141,779,177 | |
Shares of beneficial interest outstanding (unlimited number of shares, no par value) | | | 13,375,367 | |
| | |
Net Asset Value Per Share and Offering and Redemption Price Per Share | | $ | 10.60 | |
| | |
Minimum Redemption Price Per Share(a) | | $ | 10.39 | |
| | |
| (a) | The Fund will impose a 2.00% redemption fee on shares redeemed within 90 days of purchase. |
See Notes to Financial Statements.
| | |
| 36 | | (888) 848-7569 | www.rivernorthfunds.com |
| | |
RiverNorth Core Opportunity Fund | | |
Statement of Operations | | For the Year Ended September 30, 2011 |
| | | | |
INVESTMENT INCOME: | | | | |
Dividend income | | $ | 19,050,439 | |
Interest income | | | 15,773 | |
| | |
Total Investment Income | | | 19,066,212 | |
| | |
| |
EXPENSES: | | | | |
Investment Adviser fee | | | 4,735,456 | |
12b-1 fees | | | 1,183,864 | |
Administration expenses | | | 250,004 | |
Compliance expenses | | | 104,550 | |
Report printing expenses | | | 99,969 | |
Legal expenses | | | 95,507 | |
Excise tax expenses | | | 79,248 | |
Registration expenses | | | 70,682 | |
Transfer agent expenses | | | 63,358 | |
Custodian expenses | | | 46,428 | |
Insurance expenses | | | 16,872 | |
Audit expenses | | | 16,574 | |
24f-2 expenses | | | 15,276 | |
Trustee expenses | | | 4,048 | |
Miscellaneous expenses | | | 93,133 | |
| | |
Total Expenses | | | 6,874,969 | |
| | |
Net Investment Income | | | 12,191,243 | |
| | |
| |
REALIZED AND UNREALIZED GAIN/(LOSS) ON INVESTMENTS: | | | | |
| |
Net realized gain on: | | | | |
Investments | | | 25,192,772 | |
Total return swap contracts | | | 1,180,509 | |
| | |
Net realized gain | | | 26,373,281 | |
| | |
Long-term capital gain distributions from other investment companies | | | 594,886 | |
| | |
Net change in unrealized depreciation on: | | | | |
Investments | | | (58,239,398 | ) |
| | |
Net Realized and Unrealized Loss on Investments | | | (31,271,231 | ) |
| | |
Net Decrease in Net Assets Resulting from Operations | | $ | (19,079,988 | ) |
| | |
See Notes to Financial Statements.
| | |
Annual Report | September 30, 2011 | | 37 |
| | |
RiverNorth/DoubleLine Strategic Income Fund | | |
Statement of Operations | | For the Period December 30, 2010 (Inception) to September 30, 2011 |
| | | | |
INVESTMENT INCOME: | | | | |
Dividend income | | $ | 1,594,828 | |
Interest income | | | 5,108,871 | |
Other income | | | 990 | |
| | |
Total Investment Income | | | 6,704,689 | |
| | |
| |
EXPENSES: | | | | |
Investment Adviser fee | | | 800,970 | |
Administration expenses | | | 86,288 | |
12b-1 fees - Class R Shares | | | 74,131 | |
Transfer agent expenses | | | 48,402 | |
Registration expenses | | | 47,111 | |
Offering costs | | | 40,094 | |
24f-2 expenses | | | 37,266 | |
Custodian expenses | | | 26,400 | |
Audit expenses | | | 16,975 | |
Compliance expenses | | | 14,148 | |
Legal expenses | | | 13,105 | |
Report printing expenses | | | 12,050 | |
Trustee expenses | | | 1,614 | |
Insurance expenses | | | 708 | |
Miscellaneous expenses | | | 8,393 | |
| | |
Total expenses before waiver/reimbursement | | | 1,227,655 | |
Less fees waived/reimbursed by Investment Adviser: | | | | |
Class I Shares | | | (101,403) | |
Class R Shares | | | (37,560) | |
| | |
Total Net Expenses | | | 1,088,692 | |
| | |
Net Investment Income | | | 5,615,997 | |
| | |
| |
REALIZED AND UNREALIZED GAIN ON INVESTMENTS: | | | | |
Net realized gain on: | | | | |
Investments | | | 1,435,993 | |
Net change in unrealized appreciation on: | | | | |
Investments | | | 1,568,146 | |
| | |
Net Realized and Unrealized Gain on Investments | | | 3,004,139 | |
| | |
Net Increase in Net Assets Resulting from Operations | | $ | 8,620,136 | |
| | |
See Notes to Financial Statements.
| | |
| 38 | | (888) 848-7569 | www.rivernorthfunds.com |
| | |
RiverNorth Core Opportunity Fund | | |
Statements of Changes in Net Assets | | |
| | | | | | | | |
| | For the Year Ended
September 30, 2011 | | | For the Year Ended
September 30, 2010 | |
NET INCREASE/(DECREASE) IN NET ASSETS FROM OPERATIONS: | |
Net investment income | | $ | 12,191,243 | | | $ | 6,340,511 | |
Net realized gain on investments and total return swap contracts | | | 26,373,281 | | | | 13,530,759 | |
Long-term capital gain distributions from other investment companies | | | 594,886 | | | | 88,930 | |
Net change in unrealized appreciation/(depreciation) on investments | | | (58,239,398) | | | | 24,238,064 | |
Net increase/(decrease) in net assets resulting from operations | | | (19,079,988) | | | | 44,198,264 | |
DISTRIBUTIONS TO SHAREHOLDERS: | | | | | | | | |
From net investment income | | | (10,698,525) | | | | (12,070,126) | |
Net decrease in net assets from distributions to shareholders | | | (10,698,525) | | | | (12,070,126) | |
CAPITAL SHARE TRANSACTIONS: | | | | | | | | |
Proceeds from shares sold | | | 269,665,868 | | | | 167,403,045 | |
Reinvestment of distributions | | | 10,615,314 | | | | 12,016,908 | |
Cost of shares redeemed | | | (154,776,438) | | | | (94,689,064) | |
Redemption fees(a) | | | 47,707 | | | | 80,528 | |
Net increase in net assets from capital share transactions | | | 125,552,451 | | | | 84,811,417 | |
Net Increase in Net Assets | | | 95,773,938 | | | | 116,939,555 | |
NET ASSETS: | | | | | | | | |
Beginning of period | | | 392,421,215 | | | | 275,481,660 | |
End of period (including undistributed net investment income of $9,549,201 and $6,798,260, respectively) | | $ | 488,195,153 | | | $ | 392,421,215 | |
| | |
OTHER INFORMATION: | | | | | | | | |
Share Transactions: | | | | | | | | |
Shares sold | | | 21,737,508 | | | | 15,232,456 | |
Shares issued in reinvestment of distributions | | | 874,408 | | | | 1,129,409 | |
Shares redeemed | | | (12,704,972) | | | | (8,668,463) | |
| | |
Net increase from share transactions | | | 9,906,944 | | | | 7,693,402 | |
| | |
| (a) | See Note 2 in the Notes to Financial Statements. |
See Notes to Financial Statements.
| | |
Annual Report | September 30, 2011 | | 39 |
| | |
RiverNorth/DoubleLine Strategic Income Fund | | |
Statement of Changes in Net Assets | | |
| | | | |
| | For the Period
December 30, 2010
(Inception) to
September 30, 2011 | |
NET INCREASE IN NET ASSETS FROM OPERATIONS: | | | | |
Net investment income | | $ | 5,615,997 | |
Net realized gain on investments | | | 1,435,993 | |
Net change in unrealized appreciation on investments | | | 1,568,146 | |
| | |
Net increase in net assets resulting from operations | | | 8,620,136 | |
| | |
| |
DISTRIBUTIONS TO SHAREHOLDERS: | | | | |
From net investment income: | | | | |
Class I Shares | | | (3,907,229) | |
Class R Shares | | | (1,480,090) | |
| | |
Net decrease in net assets from distributions to shareholders | | | (5,387,319) | |
| | |
| |
CAPITAL SHARE TRANSACTIONS: | | | | |
Class I Shares | | | | |
Proceeds from shares sold | | | 336,502,966 | |
Reinvestment of distributions | | | 3,614,658 | |
Cost of shares redeemed | | | (9,964,884) | |
Redemption fees(a) | | | 63,388 | |
| | |
Net increase in net assets from capital share transactions | | | 330,216,128 | |
| | |
| |
Class R Shares | | | | |
Proceeds from shares sold | | | 148,631,281 | |
Reinvestment of distributions | | | 1,458,797 | |
Cost of shares redeemed | | | (9,172,641) | |
Redemption fees(a) | | | 76,802 | |
| | |
Net increase in net assets from capital share transactions | | | 140,994,239 | |
| | |
| |
Net Increase in Net Assets | | | 474,443,184 | |
| |
NET ASSETS: | | | | |
Beginning of period | | | – | |
| | |
End of period (including undistributed net investment income of $746,673) | | $ | 474,443,184 | |
| | |
| | |
| 40 | | (888) 848-7569 | www.rivernorthfunds.com |
| | |
RiverNorth/DoubleLine Strategic Income Fund | | |
Statement of Changes in Net Assets (Continued) | | |
| | | | |
| | For the Period
December 30, 2010
(Inception) to
September 30, 2011 | |
OTHER INFORMATION: | | | | |
Share Transactions: | | | | |
Class I Shares | | | | |
Shares sold | | | 32,006,388 | |
Shares issued in reinvestment of distributions | | | 344,024 | |
Shares redeemed | | | (945,934) | |
| | |
Net increase from share transactions | | | 31,404,478 | |
| | |
| |
Class R Shares | | | | |
Shares sold | | | 14,101,059 | |
Shares issued in reinvestment of distributions | | | 138,616 | |
Shares redeemed | | | (864,308) | |
| | |
Net increase from share transactions | | | 13,375,367 | |
| | |
| (a) | See Note 2 in the Notes to Financial Statements. |
See Notes to Financial Statements.
| | |
Annual Report | September 30, 2011 | | 41 |
| | |
RiverNorth Core Opportunity Fund | | |
Financial Highlights | | |
|
| |
Net asset value - beginning of period |
Income/(Loss) from investment operations: |
Net investment income(a) |
Net realized and unrealized gain/(loss) on investments(a) |
| |
Total income/(loss) from investment operations |
| |
|
Less distributions: |
From net investment income |
From net realized gain on investments |
| |
Total distributions |
| |
Paid-in capital from redemption fees(a) |
| |
Net increase/(decrease) in net asset value |
| |
Net asset value - end of period |
| |
|
| Total Return(c) |
|
| Ratios/Supplemental Data: |
Net assets, end of period (in thousands) |
|
Ratio of expenses to average net assets including fee waivers and reimbursements(e) |
|
Ratio of expenses to average net assets excluding fee waivers and reimbursements(e) |
Ratio of net investment income to average net assets including fee waivers and reimbursements(e) |
Ratio of net investment income to average net assets excluding fee waivers and reimbursements(e) |
Portfolio turnover rate |
| (a) | Based on average shares outstanding during the period. |
| (b) | Less than $0.005 per share. |
| (c) | Total return in the above table represents the rate that the investor would have earned or lost on an investment in the Fund, assuming reinvestment of dividends. |
| (e) | The ratios exclude the impact of expenses of the underlying funds in which the Fund invests as represented in the Schedule of Investments. |
See Notes to Financial Statements.
| | |
| 42 | | (888) 848-7569 | www.rivernorthfunds.com |
| | |
| | |
| | For a share outstanding throughout the period presented. |
| | | | | | | | | | | | | | | | | | | | | | | |
For the Year Ended
September 30, 2011 | | For the Year Ended
September 30, 2010 | | For the Year Ended
September 30, 2009 | | For the Year Ended
September 30, 2008 | | For the Period
December 27, 2006
(Inception) to Period Ended
September 30, 2007 |
| | | | |
| | $ | 11.63 | | | | $ | 10.57 | | | | $ | 8.72 | | | | $ | 10.74 | | | | $ | 10.00 | |
| | | | | | | | | | | | | | | | | | | | | | | | |
| | | 0.32 | | | | | 0.21 | | | | | 0.32 | | | | | 0.42 | | | | | 0.11 | |
| | | (0.45) | | | | | 1.30 | | | | | 1.76 | | | | | (2.10) | | | | | 0.63 | |
| | | | |
| | | (0.13) | | | | | 1.51 | | | | | 2.08 | | | | | (1.68) | | | | | 0.74 | |
| | | | |
| | | | |
| | | | | | | | | | | | | | | | | | | | | | | | |
| | | (0.32) | | | | | (0.45) | | | | | (0.23) | | | | | (0.23) | | | | | – | |
| | | – | | | | | – | | | | | 0.00 | (b) | | | | (0.12) | | | | | – | |
| | | | |
| | | (0.32) | | | | | (0.45) | | | | | (0.23) | | | | | (0.35) | | | | | – | |
| | | | |
| | | 0.00 | (b) | | | | 0.00 | (b) | | | | 0.00 | (b) | | | | 0.01 | | | | | 0.00 | (b) |
| | | | |
| | | (0.45) | | | | | 1.06 | | | | | 1.85 | | | | | (2.02) | | | | | 0.74 | |
| | | | |
| | $ | 11.18 | | | | $ | 11.63 | | | | $ | 10.57 | | | | $ | 8.72 | | | | $ | 10.74 | |
| | | | |
| | | | |
| | | (1.33%) | | | | | 14.72% | | | | | 25.06% | | | | | (16.08%) | | | | | 7.40% | (d) |
| | | | |
| | | | | | | | | | | | | | | | | | | | | | | | |
| | $ | 488,195 | | | | $ | 392,421 | | | | $ | 275,482 | | | | $ | 133,330 | | | | $ | 18,748 | |
| | | | |
| | | 1.45% | | | | | 1.45% | | | | | 1.53% | | | | | 1.65% | | | | | 1.95% | (f) |
| | | | |
| | | 1.45% | | | | | 1.45% | | | | | 1.53% | | | | | 1.59% | | | | | 2.21% | (f) |
| | | 2.57% | | | | | 1.95% | | | | | 3.80% | | | | | 4.15% | | | | | 1.45% | (f) |
| | | 2.57% | | | | | 1.95% | | | | | 3.80% | | | | | 4.21% | | | | | 1.19% | (f) |
| | | 38% | | | | | 38% | | | | | 215% | | | | | 304% | | | | | 75% | (d) |
| | |
Annual Report | September 30, 2011 | | 43 |
| | |
RiverNorth/DoubleLine Strategic Income Fund | | Class I |
| Financial Highlights | | For a share outstanding throughout the period presented. |
| | | | | |
| | | For the Period December 30, 2010 (Inception) to
September 30, 2011 |
| |
Net asset value - beginning of period | | | $ | 10.00 | |
Income from investment operations: | | | | | |
Net investment income(a) | | | | 0.42 | |
Net realized and unrealized gain on investments(a) | | | | 0.46 | |
Total income from investment operations | | | | 0.88 | |
| |
Less distributions: | | | | | |
From net investment income | | | | (0.30) | |
Total distributions | | | | (0.30) | |
Paid-in capital from redemption fees(a) | | | | 0.01 | |
Net increase in net asset value | | | | 0.59 | |
Net asset value - end of period | | | $ | 10.59 | |
| | |
| |
Total Return(b) | | | | 8.97% | (c) |
| |
Ratios/Supplemental Data: | | | | | |
Net assets, end of period (in thousands) | | | $ | 332,664 | |
Ratio of expenses to average net assets including fee waivers and reimbursements(d) | | | | 0.95% | (e) |
Ratio of expenses to average net assets excluding fee waivers and reimbursements(d) | | | | 1.08% | (e) |
Ratio of net investment income to average net assets including fee waivers and reimbursements(d) | | | | 5.31% | (e) |
Ratio of net investment income to average net assets excluding fee waivers and reimbursements(d) | | | | 5.18% | (e) |
Portfolio turnover rate | | | | 64% | (c) |
| (a) | Based on average shares outstanding during the period. |
| (b) | Total return in the above table represents the rate that the investor would have earned or lost on an investment in the Fund, assuming reinvestment of dividends. |
| (d) | The ratios exclude the impact of expenses of the underlying funds in which the Fund invests as represented in the Schedule of Investments. |
See Notes to Financial Statements.
| | |
| 44 | | (888) 848-7569 | www.rivernorthfunds.com |
| | |
RiverNorth/DoubleLine Strategic Income Fund | | Class R |
Financial Highlights | | For a share outstanding throughout the period presented. |
| | | | | |
| | | For the Period
December 30, 2010
(Inception) to
September 30, 2011 |
| |
Net asset value - beginning of period | | | $ | 10.00 | |
Income from investment operations: | | | | | |
Net investment income(a) | | | | 0.40 | |
Net realized and unrealized gain on investments(a) | | | | 0.46 | |
| | |
Total income from investment operations | | | | 0.86 | |
| | |
| |
Less distributions: | | | | | |
From net investment income | | | | (0.28) | |
| | |
Total distributions | | | | (0.28) | |
| | |
Paid-in capital from redemption fees(a) | | | | 0.02 | |
| | |
Net increase in net asset value | | | | 0.60 | |
| | |
Net asset value - end of period | | | $ | 10.60 | |
| | |
| |
Total Return(b) | | | | 8.88% | (c) |
| |
Ratios/Supplemental Data: | | | | | |
Net assets, end of period (in thousands) | | | $ | 141,779 | |
Ratio of expenses to average net assets including fee waivers and reimbursements(d) | | | | 1.20% | (e) |
Ratio of expenses to average net assets excluding fee waivers and reimbursements(d) | | | | 1.33% | (e) |
Ratio of net investment income to average net assets including fee waivers and reimbursements(d) | | | | 5.11% | (e) |
Ratio of net investment income to average net assets excluding fee waivers and reimbursements(d) | | | | 4.99% | (e) |
Portfolio turnover rate | | | | 64% | (c) |
| (a) | Based on average shares outstanding during the period. |
| (b) | Total return in the above table represents the rate that the investor would have earned or lost on an investment in the Fund, assuming reinvestment of dividends. |
| (d) | The ratios exclude the impact of expenses of the underlying funds in which the Fund invests as represented in the Schedule of Investments. |
See Notes to Financial Statements.
| | |
Annual Report | September 30, 2011 | | 45 |
| | |
RiverNorth Funds | | Notes to Financial Statements |
| | September 30, 2011 |
1. ORGANIZATION
The RiverNorth Core Opportunity Fund (the “Core Opportunity Fund”) was organized as a diversified series of RiverNorth Funds (the “Trust” or “Funds”) on July 18, 2006 and commenced investment operations on December 27, 2006. The Trust is an open-end investment company established under the laws of Ohio by an Agreement and Declaration of Trust dated July 18, 2006 (the “Trust Agreement”). The Trust Agreement permits the Board of Trustees (the “Trustees”) to authorize and issue an unlimited number of shares of beneficial interest of a separate series without par value. The investment adviser to the Core Opportunity Fund is RiverNorth Capital Management, LLC (the “Adviser”). The investment objective of the Core Opportunity Fund is to seek long-term capital appreciation and income.
The RiverNorth/DoubleLine Strategic Income Fund (the “Strategic Income Fund”) is a diversified series of the Trust and commenced investment operations on December 30, 2010. The Strategic Income Fund offers two series of shares, Class I Shares and Class R Shares. All classes of shares have identical rights to earnings, assets and voting privileges except, for class-specific expenses and exclusive rights to vote on matter affecting only individual classes. The Trust Agreement permits the Board of Trustees to authorize and issue an unlimited number of shares of beneficial interest of a separate series without par value. The Strategic Income Fund and the Core Opportunity Fund are the only series currently authorized by the Trustees. The investment adviser to the Strategic Income Fund is RiverNorth Capital Management, LLC. The Strategic Income Fund’s sub-adviser is DoubleLine Capital, LP (the “Sub-Adviser”). The investment objective of the Strategic Fund is current income and overall total return.
The following is a summary of significant accounting policies followed by the Funds. These policies are in conformity with U.S. generally accepted accounting principles (“GAAP”). The preparation of financial statements in accordance with GAAP requires management to make estimates and assumptions that affect the reported amounts and disclosures in the financial statements during the reporting period. Management believes the estimates and security valuations are appropriate; however, actual results may differ from those estimates, and the security valuations reflected in the financial statements may differ from the value the Funds ultimately realize upon sale of the securities. The financial statements have been prepared as of the close of the New York Stock Exchange (“NYSE”) on September 30, 2011.
2. SIGNIFICANT ACCOUNTING POLICIES
SECURITY VALUATION: All investments in securities are recorded at their estimated fair value as described in Note 3.
SECURITY TRANSACTIONS AND RELATED INCOME: The Funds follow industry practice and record security transactions on the trade date basis. The specific identification method is used for determining gains or losses for financial statements and income tax purposes. Dividend income is recorded on the ex-dividend date and interest income is recorded on an accrual basis. Discounts and premiums on securities purchased are amortized or accreted using the effective interest method. Withholding taxes on foreign dividends have been provided for in accordance with the Trust’s understanding of the applicable country’s tax rules and rates. The ability of issuers of debt
| | |
| 46 | | (888) 848-7569 | www.rivernorthfunds.com |
| | |
RiverNorth Funds | | Notes to Financial Statements |
| | September 30, 2011 |
securities held by the Trust to meet their obligations may be affected by economic and political developments in a specific country or region.
OTHER: The Funds have held certain investments which pay dividends to their shareholders based upon available funds from operations. It is possible for these dividends to exceed the underlying investments’ taxable earnings and profits resulting in the excess portion of such dividends being designated as a return of capital. Distributions received from investments in securities that represent a return of capital or capital gain are recorded as a reduction of the cost of investments or as a realized gain, respectively.
SHARE VALUATION: The net asset value (the “NAV”) is generally calculated as of the close of trading on the New York Stock Exchange (“the Exchange”) (normally 4:00 p.m. Eastern time) every day the Exchange is open. The NAV is calculated by taking the total value of each Fund’s assets, subtracting their liabilities, and then dividing by the total number of shares outstanding, rounded to the nearest cent. The offering price and redemption price per share is equal to the net asset value per share, except that shares of each Fund are subject to a redemption fee of 2% if redeemed within 90 days of purchase. For the year ended September 30, 2011, the Core Opportunity Fund had redemption fees of $47,707. For the period ended September 30, 2011, the Strategic Income Fund had redemption fees of $140,190.
EXPENSES: Some expenses of the Trust can be directly attributed to the Fund or the Fund specific share class. Expenses which cannot be directly attributed are apportioned among all Funds and Fund series classes in the Trust based on average net assets.
FEDERAL INCOME TAXES: The Funds make no provision for federal income tax. Each Fund intends to qualify each year as a “regulated investment company” under subchapter M of the Internal Revenue Code of 1986, as amended, by distributing substantially all of its taxable income. If the required amount of net investment income is not distributed, the Funds could incur a tax expense.
As of and during the year ended September 30, 2011, neither Fund had a liability for any unrecognized tax benefits. The Funds recognize interest and penalties, if any, related to unrecognized tax benefits as income tax expense in the statement of operations. The Core Opportunity Fund incurred a nominal amount of interest and penalties related to the under distribution of its excise tax requirement and these amounts are included in excise tax expense in the statement of operations. The Funds are not subject to examination by U.S. federal tax authorities for tax years prior to 2007, as applicable.
DISTRIBUTIONS TO SHAREHOLDERS: Distributions to shareholders, which are determined in accordance with income tax regulations, are recorded on the ex-dividend date. The treatment for financial reporting purposes of distributions made to shareholders during the year from net investment income or net realized capital gains may differ from their ultimate treatment for federal income tax purposes. These differences are caused primarily by differences in the timing of recognition of certain components of income, expense or realized capital gain for federal income tax purposes. Where such differences are permanent in nature, they are reclassified in the components of the net assets based on their ultimate characterization for federal income tax purposes. Any such reclassification will have no effect on net assets, results of operations or net asset values per share of the Funds.
| | |
Annual Report | September 30, 2011 | | 47 |
| | |
RiverNorth Funds | | Notes to Financial Statements |
| | September 30, 2011 |
3. SECURITIES VALUATION AND FAIR VALUE MANAGEMENT
Fair value is defined as the price that a Fund would receive upon selling an investment in a timely transaction to an independent buyer in the principal or most advantageous market of the investment. GAAP establishes a three-tier hierarchy to maximize the use of observable market data and minimize the use of unobservable inputs and to establish classification of fair value measurements for disclosure purposes.
Inputs refer broadly to the assumptions that market participants would use in pricing the asset or liability, including assumptions about risk, for example, the risk inherent in a particular valuation technique used to measure fair value including such a pricing model and/or the risk inherent in the inputs to the valuation technique. Inputs may be observable or unobservable. Observable inputs are inputs that reflect the assumptions market participants would use in pricing the asset or liability developed based on market data obtained from sources independent of the reporting entity. Unobservable inputs are inputs that reflect the reporting entity’s own assumptions about the assumptions market participants would use in pricing the asset or liability developed based on the best information available in the circumstances.
Various inputs are used in determining the value of the Trust’s investments. These inputs are summarized in the three broad levels listed below.
| | • | | Level 1 – Unadjusted quoted prices in active markets for identical, unrestricted assets or liabilities that a Fund has the ability to access at the measurement date; |
| | • | | Level 2 – Quoted prices which are not active, quoted prices for similar assets or liabilities in active markets or inputs other than quoted prices that are observable (either directly or indirectly) for substantially the full term of the asset or liability; and |
| | • | | Level 3 – Significant unobservable prices or inputs (including the Fund’s own assumptions in determining the fair value of investments) where there is little or no market activity for the asset or liability at the measurement date. |
The inputs used to measure fair value may fall into different levels of the fair value hierarchy. In such cases, for disclosure purposes, the level in the fair value hierarchy within which the fair value measurement falls in its entirety, is determined based on the lowest level input that is significant to the fair value measurement in its entirety.
Equity securities, including closed-end funds, exchange-traded funds, holding and investment management companies, preferred stocks, and real estate investment trusts are generally valued by using market quotations, but may be valued on the basis of prices furnished by a pricing service when the Adviser believes such prices more accurately reflect the fair value of such securities. Securities that are traded on any stock exchange are generally valued by the pricing service at the last quoted sale price. Lacking a last sale price, an exchange traded security is generally valued by the pricing service at its last bid price. Securities traded in the NASDAQ over-the-counter market are generally valued by the pricing service at the NASDAQ Official Closing Price. When using the market quotations or close prices provided by the pricing service and when the market is considered active, the security will be classified as a Level 1 security. Sometimes, an equity security owned by the Trust will be valued by the pricing service with factors other than
| | |
| 48 | | (888) 848-7569 | www.rivernorthfunds.com |
| | |
RiverNorth Funds | | Notes to Financial Statements |
| | September 30, 2011 |
market quotations or when the market is considered inactive. When this happens, the security will be classified as a Level 2 security. When market quotations are not readily available, when the Adviser or Sub-Adviser determines that the market quotation or the price provided by the pricing service does not accurately reflect the current fair value, or when restricted or illiquid securities are being valued, such securities are valued as determined in good faith by the Adviser or Sub-Adviser, in conformity with guidelines adopted by and subject to review by the Board. These securities will be categorized as Level 3 securities.
Investments in mutual funds, including money market mutual funds, are generally priced at the ending net asset value (NAV) provided by the service agent of the funds. These securities will be categorized as Level 1 securities.
Domestic and foreign fixed income securities and non-exchange traded derivatives are normally valued on the basis of quotes obtained from brokers and dealers or independent pricing services. Prices obtained from independent pricing services typically use information provided by market makers or estimates of market values obtained from yield data relating to investments or securities with similar characteristics. These securities will be classified as Level 2 securities.
Rights are generally valued by using the last sale price, which would result in a classification as a Level 2 security. In the absence of a last sale price, the rights will be fair-valued by the Adviser or Sub-Adviser, which would result in a classification as a Level 3 security.
Short-term investments in fixed income securities, with maturities of less than 60 days when acquired, or which subsequently are within 60 days of maturity, are valued by using the amortized cost method of valuation, which the Board has determined will represent fair value. These securities will be classified as Level 2 securities.
In accordance with the Trust’s good faith pricing guidelines, the Adviser or Sub-Adviser is required to consider all appropriate factors relevant to the value of securities for which it has determined other pricing sources are not available or reliable as described above. No single standard exists for determining fair value, because fair value depends upon the circumstances of each individual case. As a general principle, the current fair value of an issue of securities being valued by the Adviser or Sub-Adviser would appear to be the amount which the owner might reasonably expect to receive for them upon their current sale. Methods which are in accordance with this principle may, for example, be based on (i) a multiple of earnings; (ii) a discount from market of a similar freely traded security (including a derivative security or a basket of securities traded on other markets, exchanges or among dealers); or (iii) yield to maturity with respect to debt issues, or a combination of these and other methods. Good faith pricing is permitted if, in the Adviser’s or Sub-Adviser’s opinion, the validity of market quotations appears to be questionable based on factors such as evidence of a thin market in the security based on a small number of quotations, a significant event occurs after the close of a market but before a Fund’s NAV calculation that may affect a security’s value, or the Adviser or Sub-Adviser is aware of any other data that calls into question the reliability of market quotations.
Good faith pricing may also be used in instances when the bonds the Funds invest in may default or otherwise cease to have market quotations readily available. Investments in foreign securities, junk bonds or other thinly traded securities are more likely to trigger fair valuation than other securities.
| | |
Annual Report | September 30, 2011 | | 49 |
| | |
RiverNorth Funds | | Notes to Financial Statements |
| | September 30, 2011 |
The following is a summary of the inputs used at September 30, 2011 in valuing the Funds’ assets:
| | | | | | | | | | | | | | | | |
| RiverNorth Core Opportunity Fund | |
| | | Valuation Inputs | | | | |
Investments in Securities at Value | | Level 1 | | | Level 2 | | | Level 3 | | | Total | |
Closed-End Funds | | $ | 282,859,136 | | | $ | – | | | $ | – | | | $ | 282,859,136 | |
Mutual Funds | | | 21,092,830 | | | | – | | | | – | | | | 21,092,830 | |
Exchange-Traded Funds | | | 91,556,841 | | | | – | | | | – | | | | 91,556,841 | |
Holding & Investment Management Companies | | | 944,405 | | | | – | | | | – | | | | 944,405 | |
Preferred Stocks | | | 3,998,789 | | | | – | | | | – | | | | 3,998,789 | |
Real Estate Investment Trusts | | | 7,370,057 | | | | – | | | | – | | | | 7,370,057 | |
Total | | $ | 407,822,058 | | | $ | – | | | $ | – | | | $ | 407,822,058 | |
| | |
|
| RiverNorth/DoubleLine Strategic Income Fund | |
| | | Valuation Inputs | | | | |
Investments in Securities at Value | | Level 1 | | | Level 2 | | | Level 3 | | | Total | |
Closed-End Funds | | $ | 87,650,116 | | | $ | – | | | $ | – | | | $ | 87,650,116 | |
Preferred Stocks | | | 4,165,419 | | | | – | | | | – | | | | 4,165,419 | |
Real Estate Investment Trusts | | | 2,998,433 | | | | – | | | | – | | | | 2,998,433 | |
Corporate Bonds | | | – | | | | 66,625,473 | | | | – | | | | 66,625,473 | |
Collateralized Mortgage Obligations | | | – | | | | 110,435,704 | | | | – | | | | 110,435,704 | |
Foreign Government Agency Issues | | | – | | | | 2,091,780 | | | | – | | | | 2,091,780 | |
U.S. Government Agency Obligations | | | – | | | | 108,984,883 | | | | – | | | | 108,984,883 | |
U.S. Government Bonds and Notes | | | – | | | | 50,767,017 | | | | – | | | | 50,767,017 | |
Total | | $ | 94,813,968 | | | $ | 338,904,857 | | | $ | – | | | $ | 433,718,825 | |
| | |
The Funds did not hold any investments at the beginning or end of the period in which significant unobservable inputs were used in determining fair value; therefore, no reconciliation of Level 3 securities is included for this reporting period.
There were no significant transfers into and out of Levels 1 and 2 during the current period presented. It is the Funds’ policy to recognize transfers into and out of the Levels 1 and 2 at the end of the reporting period.
| | |
| 50 | | (888) 848-7569 | www.rivernorthfunds.com |
| | |
RiverNorth Funds | | Notes to Financial Statements |
| | September 30, 2011 |
4. DERIVATIVE TRANSACTIONS
The following discloses the Funds’ use of derivative instruments.
Total Return Swaps: The Funds may enter into total return swaps. Total return swaps are agreements that provide a Fund with a return based on the performance of an underlying asset, in exchange for fee payments to a counterparty based on a specific rate. The fee paid by the Funds will typically be determined by multiplying the face value of the swap agreement by an agreed upon interest rate. In addition, if the underlying asset declines in value over the term of the swap, the Funds would also be required to pay the dollar value of that decline to the counterparty. Total return swaps could result in losses if the underlying asset does not perform as anticipated by the Adviser. The Funds may use their own net asset value as the underlying asset in a total return swap. This strategy serves to reduce cash drag (the impact of cash on the Funds’ overall return) by replacing it with the impact of market exposure based upon the Funds’ own investment holdings. Net amounts received or paid on the swap contracts are recorded as realized gains or losses. Realized gains and losses from terminated swaps are included in net realized gains/losses on swap contracts. The Core Opportunity Fund had an agreement with ReFlow Fund, LLC to receive the total return of the Core Opportunity Fund, based on its daily change in NAV less USD-LIBOR plus an annualized spread of 1.95%.
For the year ended September 30, 2011, the activity of the swap positions in the Core Opportunity Fund is summarized below:
| | | | |
| | Notional Value | |
Beginning of the year | | | 19,000,000 | |
Acquisitions | | | 19,000,000 | |
Settlements | | | (38,000,000) | |
End of the year | | | – | |
| | |
There was no effect of derivative instruments on the Statement of Assets and Liabilities as of September 30, 2011.
The effect of derivative instruments on the Statement of Operations of the Core Opportunity Fund for the year ended September 30, 2011 is as follows:
| | | | | | |
Derivatives Not Accounted for as Hedging Instruments | | Location of Gain/(Loss) On Derivatives Recognized in Income | | Realized Gain On
Derivatives Recognized
in Income | | Change in Unrealized
Gain/(Loss) On
Derivatives Recognized
in Income |
| | Net realized gain on: | | | | |
Equity Contracts (Total Return Swaps) | | Total return swap contracts | | $1,180,509 | | $ – |
Total | | | | $1,180,509 | | $ – |
| |
| | |
Annual Report | September 30, 2011 | | 51 |
| | |
RiverNorth Funds | | Notes to Financial Statements |
| | September 30, 2011 |
5. INVESTMENT ADVISORY FEE AND OTHER TRANSACTIONS WITH AFFILIATES
The Adviser serves as the investment adviser to the Funds. Under the terms of the management agreement (the “Agreement”), the Adviser, subject to the supervision of the Board, provides or arranges to be provided to the Funds such investment advice as it deems advisable and will furnish or arrange to be furnished a continuous investment program for the Funds consistent with the Funds’ investment objectives and policies. As compensation for its management services, the Core Opportunity Fund and the Strategic Income Fund are obligated to pay the Adviser a fee computed and accrued daily and paid monthly in arrears at an annual rate of 1.00% and 0.75%, respectively, of the average daily net assets of the Funds. For the year ended September 30, 2011, the Adviser earned investment advisory fees from the Core Opportunity Fund and Strategic Income Fund of $4,735,456 and $800,970, respectively. At September 30, 2011, the Funds owed the Adviser $422,368 and $160,138 for advisory services to the Core Opportunity Fund and the Strategic Income Fund, respectively.
The Sub-Adviser is the investment sub-adviser to the Strategic Income Fund. Under the terms of the sub-advisory agreement, the Sub-Adviser, subject to the supervision of the Adviser and the Board of Trustees of the Trust, provides or arranges to be provided to the Strategic Income Fund such investment advice as it deems advisable and will furnish or arrange to be furnished a continuous investment program for the portion of assets managed in the Strategic Income Fund consistent with the Strategic Income Fund’s investment objective and policies. As compensation for its sub-advisory services, the Adviser is obligated to pay the Sub-Adviser a fee computed and accrued daily and paid monthly in arrears based on an annual rate of the average daily net assets of the Strategic Income Fund.
The Adviser has contractually agreed to defer the collection of the Core Opportunity Fund fees and/or reimburse expenses, but only to the extent necessary to limit net annual operating expenses (excluding brokerage fees and commissions; borrowing costs, such as (a) interest and (b) dividends on securities sold short; taxes; indirect expenses incurred by the underlying funds in which the Core Opportunity Fund invests; and extraordinary expenses) to 1.60% of the average daily net assets of the Fund through January 31, 2012. Each deferral of fees or reimbursement of an expense by the Adviser is subject to repayment by the Fund within the three fiscal years following the fiscal year in which the expenses were incurred, provided that the Fund is able to make the repayment without exceeding the above expense limitations. For the year ended September 30, 2011, there were no fee deferrals or reimbursements by the Adviser and there were no carryovers from prior years of amounts recoupable to the Adviser.
Effective from the Strategic Income Fund’s inception through January 31, 2012, the Adviser contractually agrees to defer management fees and/or reimburse the Strategic Income Fund for expenses it incurs, but only to the extent necessary to limit the Strategic Income Fund’s total annual operating expenses (excluding brokerage fees and commissions; borrowing costs such as (a) interest and (b) dividends on securities sold short; taxes; indirect expenses incurred by the underlying funds in which the Fund invests; and extraordinary expenses), including amortized offering costs, at 0.95% of the average daily net assets for the Class I shares and 1.20% for the Class R shares for that period. Each deferral of fees or reimbursement of an expense by the Adviser is subject to repayment by the Fund within the three fiscal years following the fiscal year in which the expenses were incurred, provided that the Fund is able to make the repayment without exceeding the above expense limitations. For the period ended September 30, 2011, there were
| | |
| 52 | | (888) 848-7569 | www.rivernorthfunds.com |
| | |
RiverNorth Funds | | Notes to Financial Statements |
| | September 30, 2011 |
$138,963 in fee deferrals or reimbursements by the Adviser that will be available for recoupment in the following fiscal year.
As of December 6, 2010, the Trust retained ALPS Fund Services, Inc. (“ALPS”) to provide the Funds with fund administration and fund accounting services. For the year ended September 30, 2011, ALPS earned fees of $282,731 for administrative services provided to the Funds. At September 30, 2011, ALPS was owed $52,901 from the Funds for administrative services. Certain officers of the Trust are members of management and/or employees of ALPS. Huntington Asset Services, Inc. (“HASI”) served as the Trust’s fund administrator and fund accounting agent until December 5, 2010. For the period ended December 5, 2010, HASI earned fees of $53,561 for administrative services provided to the Trust.
As of December 6, 2010, the Trust retained ALPS to act as the Fund’s transfer agent. For the period ended September 30, 2011, ALPS earned fees of $96,445 for transfer agent services. At September 30, 2011, the Funds owed ALPS $19,586 for transfer agent services. HASI served as the Trust’s transfer agent until December 5, 2010. For the period ended December 5, 2010, HASI earned fees of $15,315 for transfer agent services.
The Funds have adopted a plan pursuant to Rule 12b-1 under the Investment Company Act of 1940, as amended (the “Plan”). The Plan permits the Funds to pay the Adviser for distribution and promotion expenses related to marketing shares of the Funds. The amount payable annually by the Core Opportunity and Strategic Income Fund Class R Shares is 0.25% and 0.25%, respectively, of the average daily net assets. Under the Plan the Trust may engage in any activities related to the distribution of Fund shares. During the year ended September 30, 2011, the Core Opportunity Fund and Strategic Income Fund Class R Shares accrued 12b-1 expenses of $1,183,864 and $74,131, of which $105,592 and $24,705 was unpaid, respectively.
As of December 6, 2010, ALPS Distributors, Inc. (the “Distributor”) acts as the sole distributor of the Funds. There were no payments to the Distributor by the Funds during the period ended September 30, 2011. Unified Financial Securities, Inc. (“UFS”) served as the sole distributor of the Funds until December 5, 2010. There were no payments to the UFS by the Funds during the period from September 30, 2010 to December 5, 2010.
6. INVESTMENTS TRANSACTIONS
Investment transactions for the year ended September 30, 2011, excluding U.S. Government Obligations and temporary short-term investments, were as follows:
| | | | | | | | |
| | | Cost of investments
purchased | | | Proceeds from
investments sold | |
RiverNorth Core Opportunity Fund | | $ | 258,595,188 | | | $ | 152,118,024 | |
RiverNorth/DoubleLine Strategic Income Fund* | | $ | 414,806,939 | | | $ | 41,385,354 | |
| | |
Annual Report | September 30, 2011 | | 53 |
| | |
RiverNorth Funds | | Notes to Financial Statements |
| | September 30, 2011 |
Investment transactions in U.S. Government Obligations for the year ended September 30, 2011 were as follows:
| | | | | | | | |
| | | Cost of investments
purchased | | | Proceeds from
investments sold | |
RiverNorth/DoubleLine Strategic Income Fund* | | $ | 103,752,663 | | | $ | 45,970,338 | |
| *For | the period December 30, 2010 (Inception) to September 30, 2011. |
7. REVOLVING LINE OF CREDIT
The Funds have a $50,000,000 Revolving Credit Agreement with The Northern Trust Company. Borrowings under this arrangement are secured by investments held in each Fund’s portfolio and bear interest at the Federal Funds Rate in effect on the day the loan is made plus 1.15% or a minimum of 1.25%, whichever is greater. As of September 30, 2011, there was no outstanding balance and there were no borrowings made during the year ended.
8. TAX BASIS INFORMATION
Reclassifications: The tax components of distributable earnings are determined in accordance with income tax regulations which may differ from the composition of net assets reported under GAAP. Accordingly, for the year ended September 30, 2011, certain differences were reclassified. These differences were primarily due to the differing tax treatment of wash sales and the treatment of certain expenses; the amounts reclassified did not affect net assets. The reclassifications were as follows:
| | | | | | |
| | | Increase/(Decrease) Paid-in capital | | Increase/(Decrease)
Accumulated net
investment income/(loss) | | Increase/(Decrease)
Accumulated net
realized gain/(loss) |
RiverNorth Core Opportunity Fund | | (52,987) | | 1,258,223 | | (1,205,236) |
RiverNorth/DoubleLine Strategic Income Fund | | (18,663) | | 517,995 | | (499,332) |
Tax Basis of Investments: The amount of net unrealized appreciation (depreciation) and the cost of investment securities for tax purposes, including short-term securities at September 30, 2011, were as follows:
| | | | | | | | |
| | | RiverNorth Core
Opportunity Fund | | | RiverNorth/DoubleLine
Strategic Income Fund | |
Gross appreciation on investments (excess of value over tax cost) | | $ | 35,398,759 | | | $ | 10,046,186 | |
Gross depreciation on investments (excess of value over tax cost) | | | (32,571,286) | | | | (8,598,371) | |
Net unrealized appreciation | | $ | 2,827,473 | | | | 1,447,815 | |
Cost of investments for income tax purposes | | $ | 404,994,585 | | | $ | 432,271,010 | |
| | |
| 54 | | (888) 848-7569 | www.rivernorthfunds.com |
| | |
RiverNorth Funds | | Notes to Financial Statements |
| | September 30, 2011 |
At September 30, 2011, the difference between book and tax basis unrealized appreciation (depreciation) for the Funds is attributable primarily to the tax deferral of losses on wash sales. Capital Loss Carryforwards: At September 30, 2011, neither of the Funds had unused capital loss carryforwards. However, during the year ended September 30, 2011, the RiverNorth Core Opportunity Fund utilized capital loss carryovers of $4,861,884.
Tax Basis of Distributable Earnings: At September 30, 2011, the components of distributable earnings on a tax basis for the Funds were as follows:
| | | | | | | | |
| | | RiverNorth Core
Opportunity Fund | | | RiverNorth/DoubleLine
Strategic Income Fund | |
Undistributed ordinary income | | $ | 9,549,201 | | | $ | 1,803,665 | |
Accumulated capital gains | | | 21,513,340 | | | | 0 | |
Unrealized appreciation | | | 2,827,473 | | | | 1,447,815 | |
Total | | $ | 33,890,014 | | | $ | 3,251,480 | |
| | |
At September 30, 2011, the difference between book and tax basis unrealized appreciation (depreciation) is attributable primarily to the tax deferral of losses on wash sales.
Tax Basis of Distributions to Shareholders: The tax character of distributions paid by the Funds during the fiscal years ended September 30, 2011, and September 30, 2010, was as follows:
| | | | | | | | |
| RiverNorth Core Opportunity Fund | | 2011 | | | 2010 | |
Distributions paid from: | | | | | | | | |
Ordinary income | | $ | 10,698,525 | | | $ | 12,070,126 | |
Total | | $ | 10,698,525 | | | $ | 12,070,126 | |
| | |
| | |
| RiverNorth/DoubleLine Strategic Income Fund | | 2011 | | | 2010 | |
Distributions paid from: | | | | | | | | |
Ordinary income | | $ | 5,387,319 | | | | N/A | |
Total | | $ | 5,387,319 | | | | N/A | |
| | |
|
On October 28, 2011, the Strategic Income Fund paid distributions to shareholders of record on October 27, 2011: | |
| | |
| Distribution | | Per Share | | | Total | |
Class I – Ordinary income | | $ | 0.049762 | | | $ | 1,708,269 | |
Class R – Ordinary income | | $ | 0.047687 | | | $ | 732,647 | |
| | |
Annual Report | September 30, 2011 | | 55 |
| | |
RiverNorth Funds | | Notes to Financial Statements |
| | September 30, 2011 |
9. BENEFICIAL OWNERSHIP
The beneficial ownership, either directly or indirectly, of more than 25% of the voting securities of a fund creates a presumption of control of the fund, under Section 2(a)(9) of the Investment Company Act of 1940. Beneficial owners owning more than 25% of the voting securities for the benefit of their customers of each class of each fund, as of September 30, 2011, are listed below:
| | | | |
| Fund | | Shareholder Name | | Percentage
Interest |
RiverNorth Core Opportunity Fund | | National Financial Services, LLC | | 56.17% |
RiverNorth/DoubleLine Strategic Income Fund - Class I | | Charles Schwab | | 29.55% |
RiverNorth/DoubleLine Strategic Income Fund - Class R | | Charles Schwab | | 31.85% |
10. NEW ACCOUNTING PRONOUNCEMENTS
In May 2011, the FASB issued ASU No. 2011-04 “Amendments to Achieve Common Fair Value Measurement and Disclosure Requirements” in GAAP and the International Financial Reporting Standards (“IFRSs”). ASU No.2011-04 amends FASB ASC Topic 820, “Fair Value Measurements and Disclosures”, to establish common requirements for measuring fair value and for disclosing information about fair value measurements in accordance with GAAP and IFRSs. ASU No.2011-04 is effective for fiscal years beginning after December 15, 2011 and for interim periods within those fiscal years. Management is currently evaluating the impact these amendments may have on the Funds’ financial statements.
On December 22, 2010, The Regulated Investment Company Modernization Act of 2010 (the “Modernization Act”) was signed into law. The Modernization Act is the first major piece of legislation affecting regulated investment companies (“RICs”) since 1986 and it modernizes several of the federal income and excise tax provisions related to RICs. Some highlights of the enacted provisions are as follows:
New capital losses may now be carried forward indefinitely, and retain the character of the original loss. Under pre-enactment law, capital losses could be carried forward for eight years, and carried forward as short-term capital losses, irrespective of the character of the original loss.
The Modernization Act contains simplification provisions, which are aimed at preventing disqualification of a RIC for “inadvertent” failures of the asset diversification and/or qualifying income tests. Additionally, the Modernization Act exempts RICs from the preferential dividend rule, and repealed the 60-day designation requirement for certain types of pay-through income and gains.
Finally, the Modernization Act contains several provisions aimed at preserving the character of distributions made by a fiscal year RIC during the portion of its taxable year ending after October 31 or December 31, reducing the circumstances under which a RIC might be required to file amended Forms 1099 to restate previously reported distributions.
| | |
| 56 | | (888) 848-7569 | www.rivernorthfunds.com |
| | |
| RiverNorth Funds | | Report of Independent Registered Public Accounting Firm |
| | | |
To The Shareholders and Board of Trustees of RiverNorth Funds
We have audited the accompanying statement of assets and liabilities, including the schedules of investments, of RiverNorth Funds, comprising RiverNorth Core Opportunity Fund and RiverNorth/DoubleLine Strategic Income Fund (the “Funds”), as of September 30, 2011, and the related statement of operations for the year then ended, the statements of changes in net assets for each of the two years in the period then ended and financial highlights for each of the five periods in the period then ended for the RiverNorth Core Opportunity Fund, the statement of operations, the statement of changes in net assets and the financial highlights for the period December 30, 2010 (commencement of operations) through September 30, 2011 for the RiverNorth/DoubleLine Strategic Income Fund. These financial statements and financial highlights are the responsibility of Fund management. Our responsibility is to express an opinion on these financial statements and financial highlights based on our audits.
We conducted our audits in accordance with the standards of the Public Company Accounting Oversight Board (United States). Those standards require that we plan and perform the audit to obtain reasonable assurance about whether the financial statements and financial highlights are free of material misstatement. An audit includes examining, on a test basis, evidence supporting the amounts and disclosures in the financial statements. Our procedures included confirmation of securities owned as of September 30, 2011 by correspondence with the Funds’ custodian and brokers or by other appropriate auditing procedures where replies from brokers were not received. An audit also includes assessing the accounting principles used and significant estimates made by management, as well as evaluating the overall financial statement presentation. We believe that our audits provide a reasonable basis for our opinion.
In our opinion, the financial statements and financial highlights referred to above present fairly, in all material respects, the financial position of RiverNorth Funds, comprising the RiverNorth Core Opportunity Fund and RiverNorth/DoubleLine Strategic Income Fund, as of September 30, 2011, the results of their operations, the changes in their net assets and their financial highlights for the periods indicated herein, in conformity with accounting principles generally accepted in the United States of America.
COHEN FUND AUDIT SERVICES, LTD.
Westlake, Ohio
November 29, 2011
| | |
Annual Report | September 30, 2011 | | 57 |
| | |
RiverNorth Funds | | Additional Information |
| | September 30, 2011 (Unaudited) |
PROXY VOTING GUIDELINES
A description of the policies and procedures that the Funds used to determine how to vote proxies relating to portfolio securities and information regarding how the Funds voted proxies during the most recent 12-month period ended June 30, are available without charge upon request by (1) calling the Funds at (888) 848-7569 and (2) from Form N-PX filed by the Funds with the Securities and Exchange Commission (“SEC”) on the SEC’s website at www.sec.gov.
PORTFOLIO HOLDINGS DISCLOSURE POLICY
The Funds file a complete schedule of investments with the SEC for the first and third quarter of each fiscal year on Form N-Q. The Funds’ first and third fiscal quarters end on December 31 and June 30. The Form N-Q filing must be made within 60 days of the end of the quarter, and the Funds’ first Form N-Q was filed with the SEC on February 26, 2007. The Funds’ Forms N-Q are available on the SEC’s website at www.sec.gov, or they may be reviewed and copied at the SEC’s Public Reference Room in Washington, DC (call1-800-732-0330 for information on the operations of the Public Reference Room). You may also obtain copies by calling the Funds at 1-888-848-7569.
UNAUDITED TAX INFORMATION
A percentage of the dividends distributed during the fiscal year qualify for the dividends received deduction for corporate shareholders:
| | | | |
RiverNorth Core Opportunity Fund | | | 0.70 | % |
RiverNorth/DoubleLine Strategic Income Fund | | | 0.90 | % |
A percentage of the dividends distributed during the fiscal year ay be taken into account for purposes of the maximum rate under section1(h)(11) of the internal Revenue Code:
| | | | |
RiverNorth Core Opportunity Fund | | | 0.70 | % |
RiverNorth/DoubleLine Strategic Income Fund | | | 0.90 | % |
The Funds will notify shareholders in January 2012 of amounts for use in preparing 2011 income tax returns.
BOARD CONSIDERATIONS REGARDING APPROVAL OF INVESTMENT
SUB-ADVISORY AGREEMENT
The approval of the Sub-Advisory Agreement (“Agreement”) between RiverNorth Capital Management LLC (the “Adviser”) and DoubleLine Capital, LP (the “Sub-Adviser) with respect to the RiverNorth /DoubleLine Strategic Income Fund (the “Fund”) was considered by the Board of Trustees (the “Board” or the “Trustees”) at an in-person meeting (the “Meeting”) held on November 15, 2010. The Board acknowledged having received materials compiled by the Fund’s administrator including a copy of the Agreement, the Sub-Adviser’s responses to a questionnaire regarding the Sub-Adviser’s profitability, management and operations, a copy of the Sub-Adviser’s Form ADV, and certifications regarding the Sub-Adviser’s compliance programs. The Board acknowledged having received a memorandum from its legal counsel regarding the Trustees’
| | |
| 58 | | (888) 848-7569 | www.rivernorthfunds.com |
| | |
RiverNorth Funds | | Additional Information |
| | September 30, 2011 (Unaudited) |
responsibilities in considering the approval of the Agreement and detailing the specific factors it must consider including: (i) the performance of the Sub-Adviser in managing its retail funds and separate accounts, (ii) the nature, extent and quality of the services provided by the Sub-Adviser to the Fund, (iii) the costs of the services provided and the profits to be realized by the Adviser, Sub-Adviser, and any of their affiliates from their relationship with the Fund, (iv) the extent to which economies of scale will be realized by the Fund as it grows, and (v) whether the Fund’s fee levels were expected to result in economies of scale to the benefit of the Fund’s shareholders.
The Board considered the performance of the Sub-Adviser in managing its retail funds and separate accounts, noting however, that there were no peer funds that exactly replicated the proposed strategy of the Fund. However, the Board noted that Mr. Gundlach, co-portfolio manager of the Fund, had an excellent performance record as a fixed income manager. Given this information, it was observed that both the Adviser and Sub-Adviser had excellent performance track records.
As to the comparative fees and expenses, the Trustees considered the management fee to be paid by the Fund to the Adviser and compared that fee to the management fees paid by funds in a relative peer group, as well as its total expense ratios. The Adviser indicated that the annual operating expenses were estimated for the first year, and from its management fee it would be paying the Sub-Adviser its fee. The Board also noted that the Fund does not have a true peer group as the strategy is unique to the Fund, but the Board determined that the proposed fees were reasonable given the strategy.
As to the nature, extent and quality of the services to be provided by the Adviser and Sub-Adviser to the Fund, the Board considered that under the terms of the Management Agreement, the Adviser would, subject to the supervision of the Board, provide or arrange to be provided to the Fund such investment advice as the Adviser, in its discretion, deems advisable and would furnish or arrange to be furnished a continuous investment program for the Fund consistent with the Fund’s investment objective and policies. As part of the program, the Board noted that the Adviser had retained one of the top fixed income managers (the Sub-Adviser) to manage certain assets of the Fund consistent with the strategy. Based on the foregoing information, the Board concluded that the Adviser and Sub-Adviser would provide quality services for the Fund.
The Board noted that the Adviser and Sub-Adviser have no affiliations with the Fund’s transfer agent fund account, custodian, distributor or any other broker-dealers and therefore would not derive any benefits from the relationships these parties may have with the Fund.
With regard to future growth and achieving economies of scale, The Adviser outlined the marketing plans that include emphasis on marketing to fee-based financial advisers to grow the assets of the Fund. In response to the Board’s comment regarding expenses and management fees, The Adviser indicated that as the Fund’s assets grow they would anticipate reducing further the annual expense ratio of the Fund. Additionally, the Adviser indicated that as economies are realized, the Adviser would consider further reductions in the management fees, but also noted the limited capacity of the strategy.
After additional consideration, the Board commenced an executive session to further consider and discuss the approval of the proposed Sub-Advisory Agreement. After discussion, a majority of the Board of Trustees of RiverNorth Funds, including a majority of the Trustees who are not interested persons of the Trust or interested parties to the Agreement approved the Sub-Advisory Agreement.
| | |
Annual Report | September 30, 2011 | | 59 |
| | |
RiverNorth Funds | | Trustees and Officers |
| | September 30, 2011 (Unaudited) |
The Board of Trustees supervises the business activities of the Trust and appoints the officers. Each Trustee serves as a trustee until the termination of the Trust unless the Trustee dies, resigns, retires or is removed. The Board generally meets four times a year to review the progress and status of the Funds.
The following table provides information regarding each Trustee who is not an “interested person” of the Trust, as defined in the Investment Company Act of 1940, as amended.
| | | | | | | | | | |
Name, Address and Year of Birth(1) | | Positions Held with the Funds | | Term of
Office/Length of Time Served | | Principal Occupation(s) During past 5 Years | | Number of Portfolios in Fund Complex(2)
Overseen by
Trustee | | Other
Directorships
Held by Trustee |
| | | | | |
Kevin M. Hinton Y.O.B 1971 | | Trustee | | Indefinite/ September 2006 to present | | Executive Vice President Associated Destinations Worldwide (2010 – present), Chief Executive Officer, Hinton and Grusich (a hotel sales representation firm) (2009 to 2010), Chief Operating Officer (1999 to 2009). | | 2 | | N/A |
| | | | | |
James G. Kelley Y.O.B 1948 | | Trustee | | Indefinite/ September 2006 to present | | Certified Business & Life Coach, JGK & Associates (2002 to present); Vice President Finance & Operation, Paymaster Technologies, Inc. (2009 to 2010); Executive Vice President / Chief Operating Officer, The Hedman Company (a manufacturing company) (1984 to 2010) | | 2 | | N/A |
| | | | | |
John S. Oakes Y.O.B.: 1943 | | Trustee | | Indefinite/ December 2010 to present | | Regional Vice President, Securities America (a broker-dealer); 2007-present. Business Development Director, First Allied Securities (a broker-dealer); 2005-2007. | | 2 | | Independent Director, Chairman of the Board of Directors, Utopia Funds; 2005-2009 |
| (1) | The mailing address of each Trustee is 325 N. LaSalle Street, Suite 645, Chicago, IL 60654. |
| (2) | The “Fund Complex” consists of RiverNorth Funds. |
| | |
| 60 | | (888) 848-7569 | www.rivernorthfunds.com |
| | |
RiverNorth Funds | | Trustees and Officers |
| | September 30, 2011 (Unaudited) |
The following table provides information regarding each Trustee who is an “interested person” of the Trust, as defined in the Investment Company Act of 1940, as amended, and each officer of the Trust.
| | | | | | | | | | |
Name, Address
and Year of Birth(1) | | Positions
Held with
the Funds | | Term of Office/Length of Time Served | | Principal Occupation(s) During past 5 Years | | Number of
Portfolios in Fund
Complex(2)
Overseen by
Trustee | | Other
Directorships
Held by Trustee |
| | | | | |
Patrick W. Galley(3) Y.O.B.: 1975 | | President and Trustee | | Indefinite/July 2006 to present | | Chief Investment Officer, RiverNorth Capital Management, LLC. (2004 to present) | | 2 | | N/A |
| | | | | |
Jonathan M. Mohrhardt Y.O.B.: 1974 | | Treasurer, Chief Financial Officer, and Chief Compliance Officer | | Indefinite/ February 2009 to present | | Chief Compliance Officer, RiverNorth Capital Management, LLC. (2009 to present); Utopia Funds, Chief Compliance Officer (2007-2009), Treasurer and Chief Financial Officer (2005-2009); FIM Group, Director of Mutual Funds (2004-2009) | | N/A | | N/A |
| (1) | The mailing address of each Trustee and listed Officer is 325 N. LaSalle Street, Suite 645, Chicago, IL 60654. |
| (2) | The “Fund Complex” consists of RiverNorth Funds. |
| (3) | Patrick W. Galley is considered an “Interested” Trustee as defined in the Investment Company Act of 1940, as amended, because he is an officer of the Trust and Chief Investment Officer of the Funds’ investment adviser. |
| | |
Annual Report | September 30, 2011 | | 61 |
| | |
RiverNorth Funds | | Trustees and Officers |
| | September 30, 2011 (Unaudited) |
| | | | | | | | | | |
Name, Address
and Year of Birth(1) | | Positions
Held with
the Funds | | Term of Office/Length of Time Served | | Principal Occupation(s) During past 5 Years | | Number of
Portfolios in Fund
Complex(2) Overseen by Trustee | | Other
Directorships Held by Trustee |
| | | | | |
Paul F. Leone Y.O.B. 1963 c/o ALPS Fund Services, Inc. 1290 Broadway, Suite 1100 Denver, CO 80203 | | Secretary | | Indefinite/ December 2010 to present | | Assistant General Counsel, ALPS Fund Services (2010-present); Deputy Chief Compliance Officer at Old Mutual Capital (2005-2009); General Counsel and Chief Compliance Officer, Wisconsin Capital Management (2003- 2005). Mr. Leone is also Secretary of the Westcore Trust and Caldwell and Orkin Funds, Inc. | | N/A | | N/A |
| | | | | |
J. Tison Cory Y.O.B. 1969 c/o ALPS Fund Services, Inc. 1290 Broadway, Suite 1100 Denver, CO 80203 | | Assistant Secretary | | Indefinite/ December 2010 to present | | Senior Paralegal, ALPS Fund Services, Inc. (2005-present); Paralegal, Oppenheimer Funds, Inc. (2004-2005); Paralegal, INVESCO Funds Group, Inc. (1999- 2004). Mr. Cory is also an Adjunct Professor at Metropolitan State College of Denver since 2000 and Secretary of Reaves Utility Income Fund. | | N/A | | N/A |
| (1) | The mailing address of each Trustee and listed Officer is 325 N. LaSalle Street, Suite 645, Chicago, IL 60654, unless otherwise stated. |
| (2) | The “Fund Complex” consists of RiverNorth Funds. |
| | |
| 62 | | (888) 848-7569 | www.rivernorthfunds.com |
| | |
RiverNorth Funds | | Trustees and Officers |
| | September 30, 2011 (Unaudited) |
| | | | | | | | | | |
Name, Address
and Year of Birth(1) | | Positions
Held with
the Funds | | Term of Office/Length of Time Served | | Principal Occupation(s) During past 5 Years | | Number of
Portfolios in Fund
Complex(2) Overseen by Trustee | | Other
Directorships Held by Trustee |
| | | | | |
Dawn K.C. Cotten Y.O.B. 1977 c/o ALPS Fund Services, Inc. 1290 Broadway, Suite 1100 Denver, CO 80203 | | Assistant Treasurer | | Indefinite/ May 2011 to present | | Fund Controller, ALPS Fund Services (2009- present); Assistant Vice President of Fund Accounting, Madison Capital Management (2009); Financial Reporting Manager, Janus Capital Group (2000-2009). Ms. Cotten is also Assistant Treasurer of the James Advantage Funds, Clough Global Allocation Fund, Clough Global Opportunities Fund, Clough Global Equity Fund, and Stonebridge Funds Trust. | | N/A | | N/A |
| (1) | The mailing address of each Trustee and listed Officer is 325 N. LaSalle Street, Suite 645, Chicago, IL 60654, unless otherwise stated. |
| (2) | The “Fund Complex” consists of RiverNorth Funds. |
| | |
Annual Report | September 30, 2011 | | 63 |
| | |
Annual Report | September 30, 2011 | | 64 |
| | | | | | |
| | | |
| | | | | | |
| | | | | | |
| | RiverNorth Funds RiverNorth Core Opportunity Fund RiverNorth/DoubleLine Strategic Income Fund Board of Trustees Patrick W. Galley, CFA, Chairman Kevin M. Hinton James G. Kelley John S. Oakes Investment Adviser RiverNorth Capital Management, LLC Transfer Agent, Administrator and Dividend Disbursing Agent ALPS Fund Services, Inc. Distributor ALPS Distributors, Inc. | | | | |
| | | |
| | | | | | |
| | Custodian The Northern Trust Company Legal Counsel Thompson Hine LLP Independent Registered Public Accounting Firm Cohen Fund Audit Services, Ltd. This report is provided for the general information of the shareholders of the RiverNorth Funds. This report is not intended for distribution to prospective investors in the Funds, unless preceded or accompanied by an effective prospectus. | | | | |
| (a) | The registrant, as of the end of the period covered by this report, has adopted a code of ethics that applies to the registrant’s principal executive officer, principal financial officer, principal accounting officer or controller or any persons performing similar functions on behalf of the registrant. |
| (b) | For purposes of this item, “code of ethics” means written standards that are reasonably designed to deter wrongdoing and to promote: |
| | (1) | Honest and ethical conduct, including the ethical handling of actual or apparent conflicts of interest between personal and professional relationships; |
| | (2) | Full, fair, accurate, timely, and understandable disclosure in reports and documents that a registrant files with, or submits to, the Commission and in other public communications made by the registrant; |
| | (3) | Compliance with applicable governmental laws, rules, and regulations; |
| | (4) | The prompt internal reporting of violations of the code of ethics to an appropriate person or persons identified in the code of ethics; and |
| | (5) | Accountability for adherence to the code of ethics. |
| (c) | Amendments: During the period covered by this report, no amendments were made to the provisions of the code of ethics adopted in 2(a) above. |
| (d) | Waivers: During the period covered by this report, no implicit or explicit waivers to the provisions of the code of ethics adopted in 2(a) above were granted. |
| (e) | Posting: We do not intend to post the code of ethics for the Officers or any amendments or waivers on a website. |
| (f) | Availability: The code of ethics for the Officers can be obtained, free of charge by calling the toll free number for the appropriate Fund. |
| Item 3. | Audit Committee Financial Expert. |
The registrant’s board of trustees has determined that the registrant does not have an audit committee financial expert. The committee members and the full Board considered a possibility of adding a member that would qualify as an expert. The audit committee determined that, although none of its members meet the technical definition of an audit
committee expert, the committee has sufficient financial expertise to adequately perform its duties under the Audit Committee Charter without the addition of a qualified expert.
| Item 4. | Principal Accountant Fees and Services. |
| | | | | | |
| | Fiscal Year | | Audit Fees | | |
| | FY 2011 | | $24,000 | |
| | FY 2010 | | $12,500 | |
| | | | | | |
| | Fiscal Year | | Registrant | | |
| | FY 2011 | | $0 | |
| | FY 2010 | | $0 | |
| | | | | | |
| | Fiscal Year | | Registrant | | |
| | FY 2011 | | $5,000 | |
| | FY 2010 | | $2,000 | |
Nature of the Tax Fees: prepare tax returns
| | | | | | |
| | Fiscal Year | | Registrant | | |
| | FY 2011 | | $4,750 | |
| | FY 2010 | | $3,500 | |
Nature of the fees: cursory review of Semi-Annual Shareholder report, post-effective amendment consents and distribution calculation review
(1) Audit Committee’s Pre-Approval Policies
The Audit Committee Charter requires the Audit Committee to be responsible for the selection, retention or termination of auditors and, in connection therewith, to (i) evaluate the proposed fees and other compensation, if any, to be paid to the auditors, (ii) evaluate the independence of the auditors, (iii) pre-approve all audit services and, when appropriate, any non-audit services provided by the independent auditors to the Trust, (iv) pre-approve, when appropriate, any non-audit services provided by the independent auditors to the Trust’s investment adviser, or any entity controlling, controlled by, or under common control with the investment adviser and that provides ongoing services to the Trust if the engagement relates directly to the operations and financial reporting of the Trust, and (v) receive the auditors’ specific representations as to their independence.
(2) Percentages of Services Approved by the Audit Committee
| | | | | | |
| | Registrant | | | | |
| | Audit-Related Fees: | | 0% | |
| | Tax Fees: | | 0% | |
| | All Other Fees: | | 0% | |
| (f) | During audit of registrant’s financial statements for the most recent fiscal year, less than 50 percent of the hours expended on the principal accountant’s engagement were attributed to work performed by persons other than the principal accountant’s full-time, permanent employees. |
| (g) | The aggregate non-audit fees billed by the registrant’s accountant for services rendered to the registrant, and rendered to the registrant’s investment adviser (not including any sub-adviser whose role is primarily portfolio management and is subcontracted with or overseen by another investment adviser), and any entity controlling, controlled by, or under common control with the adviser that provides ongoing services to the registrant: |
| | | | | | | | |
| | Fiscal Year | | Registrant | | Adviser | | |
| | FY 2011 | | $9,750 | | $0 | |
| | FY 2010 | | $5,500 | | $0 | |
| (h) | Not applicable. The auditor performed no services for the registrant’s investment adviser or any entity controlling, controlled by, or under common control with the investment adviser that provides ongoing services to the registrant. |
| Item 5. | Audit Committee of Listed Registrants. NOT APPLICABLE – applies to listed companies only |
| Item 6. | Investments. Schedule included with Item 1. |
| Item 7. | Disclosure of Proxy Voting Policies and Procedures for Closed-End Management Investment Companies. NOT APPLICABLE – applies to closed-end funds only |
| Item 8. | Portfolio Managers of Closed-End Management Investment Companies. NOT APPLICABLE – applies to closed-end funds only |
| Item 9. | Purchases of Equity Securities by Closed-End Management Investment Company and Affiliated Purchasers. NOT APPLICABLE – applies to closed-end funds only |
| Item 10. | Submission of Matters to Vote of Security Holders. The registrant has not adopted procedures by which shareholders may recommend nominees to the registrant’s board of trustees. |
| Item 11. | Controls and Procedures. |
(a) Based on an evaluation of the registrant’s disclosure controls and procedures (as defined in Rule 30a-3(c) under the Investment Company Act of 1940) as of a date within 90 days of the filing date of this Form N-CSR, the disclosure controls and procedures are
reasonably designed to ensure that the information required in filings on Forms N-CSR is recorded, processed, summarized, and reported on a timely basis.
(b) There were no significant changes in the registrant’s internal control over financial reporting that occurred during the registrant’s second fiscal quarter of the period covered by this report that have materially affected, or are reasonably likely to materially affect, the registrant’s internal control over financial reporting.
(a)(1) Code is filed herewith
(a)(2) Certifications by the registrant’s principal executive officer and principal financial officer, pursuant to Section 302 of the Sarbanes-Oxley Act of 2002 and required by Rule 30a-2under the Investment Company Act of 1940 are filed herewith.
(a)(3) Not Applicable.
(b) Certification pursuant to 18 U.S.C. Section 1350, as adopted pursuant to Section 906 of the Sarbanes-Oxley Act of 2002 is filed herewith.
SIGNATURES
Pursuant to the requirements of the Securities Exchange Act of 1934 and the Investment Company Act of 1940, the registrant has duly caused this report to be signed on its behalf by the undersigned, thereunto duly authorized.
| | | | |
Registrant | | RiverNorth Funds | | |
| | | | |
By | | /s/ Patrick W. Galley | | |
| | Patrick W. Galley, President | | |
Pursuant to the requirements of the Securities Exchange Act of 1934 and the Investment Company Act of 1940, this report has been signed below by the following persons on behalf of the registrant and in the capacities and on the dates indicated.
| | | | |
By | | /s/ Patrick W. Galley | | |
| | Patrick W. Galley, President & Chief Executive Officer | | |
| | | | |
By | | /s/ Jonathan M. Mohrhardt | | |
| | Jonathan M. Mohrhardt, Treasurer & Chief Financial Officer | | |