UNITED STATES
SECURITIES AND EXCHANGE COMMISSION
WASHINGTON, D.C. 20549
FORM N-CSR
CERTIFIED SHAREHOLDER REPORT OF REGISTERED MANAGEMENT
INVESTMENT COMPANIES
Investment Company Act file number | 811-21934 |
(Exact name of registrant as specified in charter)
325 North LaSalle Street |
Suite 645 |
Chicago, IL | 60654 |
(Address of principal executive offices) | (Zip code) |
Patrick W. Galley
325 North LaSalle Street
Suite 645
(Name and address of agent for service)
Registrant's telephone number, including area code: | 312-832-1440 |
Date of fiscal year end: | 09/30 |
Date of reporting period: | 09/30/09 |
Form N-CSR is to be used by management investment companies to file reports with the Commission not later than 10 days after the transmission to stockholders of any report that is required to be transmitted to stockholders under Rule 30e-1 under the Investment Company Act of 1940 (17 CFR 270.30e-1). The Commission may use the information provided on Form N-CSR in its regulatory, disclosure review, inspection and policymaking roles.
A registrant is required to disclose the information specified by Form N-CSR, and the Commission will make this information public. A registrant is not required to respond to the collection of information contained in Form N-CSR unless the Form displays a currently valid Office of Management and Budget ("OMB") control number. Please direct comments concerning the accuracy of the information collection burden estimate and any suggestions for reducing the burden to Secretary, Securities and Exchange Commission, 450 Fifth Street, NW, Washington, DC 20549-0609. The OMB has reviewed this collection of information under the clearance requirements of 44 U.S.C. § 3507.
Item 1. Reports to Stockholders.
| | | | | | | | |
| | | | | | | | |
| | | | | | | | |
| | | | | | | | |
ANNUAL REPORT |
| | | | | | | | |
| | | | | | | | |
| | | | | | | | |
| | | | | | | | |
| | | | | | | | |
| | | | | | | | |
| | | | | | | | |
| | | | | | | | |
| | | | | | | | |
| | | | | | | | |
RiverNorth Core Opportunity Fund |
| | | | | | | | |
| | | | | | | | |
| | | | | | | | |
| | | | | | | | |
| | | | | | | | |
| | | | | | | | |
| | | | | | | | |
| | | | | | | | |
September 30, 2009 |
| | | | | | | | |
| | | | | | | | |
| | | | | | | | |
| | | | | | | | |
| | | | | | | | |
| | | | | | | | |
| | | | | | | | |
RIVERNORTH CORE OPPORTUNITY FUND |
Dear Fellow Shareholders,We are pleased to provide you with the Annual Report for the RiverNorth Core Opportunity Fund (ticker: RNCOX; the “Fund”) covering the Fund’s fiscal year ending, September 30, 2009.
Market cycles are generally divided into four phases: 1) despair, 2) hope, 3) growth and 4) optimism. In the twelve month period ending September 30, 2009, investors were whipsawed by the phases of despair and hope. From October 2008 to March 2009, extreme risk aversion, deteriorating fundamentals and serious technical conditions drove prices of long-term, risk-based investments to deeply depressed valuations. Market volatility, asset class correlations and the magnitude of investment losses were at levels not seen since the Depression. The market upheaval triggered history’s largest wave of mutual fund and hedge fund redemptions. The negative reinforcing cycle of redemptions and further market declines continued until investor sentiment abruptly recovered in March 2009. Since then, hope and improving technical factors have primarily driven the record-breaking comeback in financial assets. Year-to-date, bank loans, high yield bonds, convertible bonds and emerging markets equities have been among the best performing asset classes.
Over the past twelve months, closed-end fund investors have experienced even greater volatility. The range of the market-cap weighted average discount for the period was 24.4% on October 10, 2008 to 1.9% on August 7, 2009. In comparison, the 10-year average discount is 4.6% and the discount on September 30, 2009 was 2.5%. The Fund welcomed the discount volatility as an opportunity to generate alpha from trading the inefficiencies associated with closed-end funds.
The tremendous market rally has left most risky asset classes trading near their long-term average valuations. Given that risk premium spreads have generally normalized, the next act of the market cycle will need to deliver strong economic and earnings growth to move the markets higher. In response to the market rally, the Fund has been realizing gains on some tactical investments made in late 2008 and early 2009. That being said, we remain optimistic on the return potential for many deep-discount closed-end fund investments in the Fund’s portfolio. We believe these historically wide discounts provide a margin of safety for taking market risk at these levels.
In light of the market volatility, we are especially pleased to report that the Fund performed well over the past twelve months. For the fiscal year 2009, the Fund had a total return of 25.06%. The Fund’s tactical investments in under-priced asset classes and opportunistic investments in closed-end funds generated a significant amount of alpha for investors. Fund performance and net inflows have increased the Fund’s net assets from $133 million to $275 million over the past twelve months.
We thank you for your investment and trust in managing your assets through what is truly a historic period for our country’s economy.
Respectfully,
Patrick W. Galley, CFA | Stephen A. O’Neill, CFA |
RIVERNORTH CORE OPPORTUNITY FUND |
PORTFOLIO MANAGEMENT DISCUSSION AND ANALYSIS (UNAUDITED)
Questions answered by portfolio managers Patrick W. Galley, CFA and Stephen A. O’Neill, CFA
How did the RiverNorth Core Opportunity Fund perform relative to its benchmarks during the twelve months ended September 30, 2009?
For fiscal year 2009, the RiverNorth Core Opportunity Fund (the “Fund”) had a total return of 25.06%. This compares to a -6.93% total return for the S&P 500 and a 0.61% for the blended index consisting of 60% S&P 500 and 40% Barclays Capital (U.S.) Bond Index.
Since the Fund’s investment strategy is predicated on opportunistically investing in closed-end funds, we believe a comparison to the closed-end fund space is warranted. First Trust Advisors, a closed-end fund sponsor, launched four indices earlier this year that enable investors to track the total return performance of the closed-end fund market.
The introduction of the First Trust indices gives us an opportunity to compare the Fund’s performance to a composite of closed-end funds. Blending 60% of the First Trust Equity Closed-end Fund Total Return Index and 40% of the First Trust Taxable Fixed Income Closed-end Fund Total Return Index, the blended closed-end fund index was up 19.41% for the fiscal period of the Fund. What contributing factors were responsible for the Fund’s relative performance during the period? What factors detracted from relative performance?
The Fund benefited primarily from tactical asset allocation decisions and closed-end fund security selection with an emphasis on generating alpha through closed-end fund discount mean reversion trades. Throughout the period we focused on closed-end funds that had what we referred to in last year’s shareholder letter as a “double discount,” a discount in the valuation of the asset class plus an attractive discount on the closed-end fund.
Significant tactical investments, through closed-end funds and exchange-traded funds, included overweight allocations to bank loans, high yield bonds, convertible bonds and emerging market equities. Many of these asset classes where caught in the crosshairs of the grand deleveraging experienced by many hedge funds and other institutional investors in the wake of the credit crisis. With deleveraging, and in many cases forced selling, came a technical imbalance in the pricing of these asset classes. RiverNorth utilized the Fund’s flexibility in asset allocation to overweight these asset classes and produced more favorable risk adjusted returns as compared to domestic equities.
Closed-end fund discount volatility provided the Fund with ample opportunity to generate alpha over the period. Our proprietary quantitative models focused on statistical analysis of closed-end fund discounts continued to uncover attractively priced closed-end funds. As a result of record closed-end fund discount widening in October 2008, the Fund aggressively increased its overall closed-end fund exposure. Although adding closed-end fund exposure increased short-term performance volatility in the fourth quarter of 2008 due to discount movements, the Fund was able to capture alpha from subsequent discount narrowing. In addition to trading closed-end fund discount volatility, the Fund capitalized on numerous corporate action events, specifically tender offers.
Detracting from the Fund’s performance was our cash position. While cash as a position detracted from performance, it afforded us the ability to deploy capital quickly to capitalize on closed-end fund opportunities and mispriced asset classes.
RIVERNORTH CORE OPPORTUNITY FUND |
What was the closed-end fund environment like for the past 12-months?
The market-cap weighted average discount narrowed from 13.4% to 2.5% over the period. While the end result was significant discount narrowing, the ride was a roller coaster for investors. Within the first eight trading days of October 2008, the aggregate market capitalization of the closed-end fund universe plummeted 30% from $170 billion to $120 billion. In the same short time period, closed-end funds focusing on REITs, convertible bonds and high yield bonds suffered more grievous losses: approximately -50%, -40% and -35%, respectively. Shell shocked retail investors and hamstrung institutional investors facing redemptions and/or margin calls were dumping closed-end funds in record volume (3 to 5 times daily averages). The supply and demand imbalance pushed the market-cap weighted average discount to 24.4% on October 10, 2008. Record discounts did not last. By the end of January, the market-cap weighted average discount of all closed-end funds was actually narrower than the 10-year average of 4.6%. Discount volatility spiked again in February and March as the U.S. stock market hit new lows, but the average discount came nowhere near the lows of October 2008. Since March, investor sentiment towards closed-end funds has been buoyed by strong results in the equity and credit markets. Closed-end fund share prices have rallied and the market-cap weighted average discount on September 30, 2009 stood at 2.5%.
Discount volatility aside, severe investment losses incurred by closed-end funds during the bear market forced many funds to deleverage in order to maintain compliance with the Investment Company’s Act’s asset coverage requirements. This forced deleveraging put additional pressure on asset prices and caused many funds to cut or suspend their periodic distributions. Retail investors responded by dumping funds with less predictable distributions. In many cases the discount widening was extreme and irrational.
RIVERNORTH CORE OPPORTUNITY FUND |
Source: RiverNorth Capital Management & FundData
Source: RiverNorth Capital Management & FundData
RIVERNORTH CORE OPPORTUNITY FUND |
How is the current closed-end fund environment?
The market-cap weighted average discount for closed-end funds stood at 2.5% at September 30, 2009. This compares to the long-term average discount of 4.6%. It should be noted that based on an equal-weight analysis of closed-end fund discounts, the average discount was 4.1% as of September 30th. The average market-cap weighted discount is skewed by larger, more liquid funds trading near par and even at premiums. The top 20 closed-end funds by market capitalization are trading at a 4.4% premium on average (equal-weight).
Given the fixed share structure of a closed-end fund, discounts and premiums are generally driven by supply and demand. Extrapolating from open-end mutual fund flows, we see opportunities in closed-end funds within asset classes that have seen little to no inflows (i.e. low demand). Alternatively, asset classes that have seen strong open-end mutual fund flows are currently experiencing narrow discounts (i.e. high demand). Equity mutual fund flows for 2008 were a record-breaking negative $234 billion and only positive $2 billion year-to-date. It is not surprising to us that U.S. focused closed-end equity funds offer the most compelling opportunities today. These funds are in many cases trading at discounts wider than 15% to their net asset value. Well known managers such as Tom Marsico, Ron Barron and Chuck Royce are at the helm of some of these funds trading at attractive discounts.
How was the Fund positioned at the end of September 2009? |
As of September 30, 2009, the Fund was underweight equities and tactically overweight corporate credit, including convertibles and bank loans. From a closed-end fund perspective, the Fund maintained an emphasis on deep discount U.S. focused equity closed-end funds. While on a fundamental basis we believe most equity markets are priced at fair valuation levels given the economic backdrop, we believe the attractive discounts on many closed-end funds give investors a margin of safety for maintaining equity exposure.
The below charts further highlight our positioning.
RIVERNORTH CORE OPPORTUNITY FUND |

RIVERNORTH CORE OPPORTUNITY FUND |

Portfolio asset allocations are approximations made by the Adviser and include the effects of a total return swap with ReFlow LLC.
Portfolio asset allocations as of September 30, 2009 and are subject to change.
| 1. | Investments in international markets present special risks including currency fluctuation, the potential for diplomatic and political instability, regulatory and liquidity risks, foreign taxation and differences in auditing and other financial standards. Risks of foreign investing are generally intensified for investments in emerging markets. |
| 2. | Small-Cap and Mid-Cap investing involves greater risk not associated with investing in more established companies, such as greater price volatility, business risk, less liquidity and increased competitive threat. |
| 3. | The Fund invests in securities (Investment Companies) that have underlying exposure to high yield securities and unrated securities of similar credit quality (commonly known as junk bonds), as well as derivatives of such securities, and therefore is likely to be subject to greater levels of interest rate, credit and liquidity risk than funds that do not invest in such securities. The underlying securities of these investments are considered predominately speculative with respect to the issuers continuing ability to make principal and interest payments. An economic downturn or period of rising interest rates could adversely affect the market for these underlying securities and therefore the Fund’s investment in securities that have high yield exposure. |
| 4. | Asset allocation does not assure a profit or guarantee against loss. |
| 5. | Investments in closed end funds are subject to investment risk, including the possible loss of the entire principal amount that you invest. The value of these securities, like other market investments, may move up or down, sometimes rapidly and unpredictably. At any point in time an investment may be worth less than the original investment, even after considering the reinvestment of fund dividends and distributions. Closed-end funds also carry price risk, or the risk that shares may trade at prices different from their net asset values. |
| 6. | An investment in an exchange-traded fund (ETF) generally presents the same primary risks as an investment in a conventional fund (i.e., one that is not exchange traded) that has the same investment objectives, strategies, and policies. The price of an ETF can fluctuate up or down, and the Fund could lose money investing in an ETF if the prices of the securities owned by the ETF go down. In addition, ETFs may be subject to the following risks that do not apply to conventional funds: (i) the market price of an ETF’s shares may trade above or below their net asset value; (ii) an active trading market for an ETF’s shares may not develop or be maintained; or (iii) trading of an ETF’s shares may be halted if the listing exchange’s officials deem such action appropriate, the shares are delisted from the exchange, or the activation of market-wide “circuit breakers” (which are tied to large decreases in stock prices) halts stock trading generally. |
RIVERNORTH CORE OPPORTUNITY FUND |

**Blend Index consists of 60% S&P 500 Index and 40% Barclays Capital (U.S.) Bond Index.
The performance quoted represents past performance, which does not guarantee future results. The investment return and principal value of an investment will fluctuate so that an investor’s shares, when redeemed, may be worth more or less than their original cost. The returns shown do not reflect deduction of taxes that a shareholder would pay on Fund distributions or the redemption of Fund shares. Current performance of the Fund may be lower or higher than the performance quoted. For more information on the Fund, and to obtain performance data current to the most recent month end or to request a prospectus, please call 888-848-7569.
*Return figures reflect any change in price per share and assume the reinvestment of all distributions.
**The Blend Index and the S&P 500 Index are unmanaged benchmarks that assume reinvestment of all distributions and exclude the effect of taxes and fees. The S&P 500 Index is a widely recognized unmanaged index of equity prices and is representative of a broader market and range of securities than is found in the Fund’s portfolio. Individuals cannot invest directly in the Index, however, an individual can invest in ETF’s or other investment vehicles that attempt to track the performance of a benchmark index.
The Fund’s investment objectives, risks, charges and expenses must be considered carefully before investing. The prospectus contains this and other important information about the investment company and may be obtained by calling the same number as above. Please read it carefully before investing. The Fund is distributed by Unified Financial Securities, Inc. Member FINRA.
RIVERNORTH CORE OPPORTUNITY FUND |
.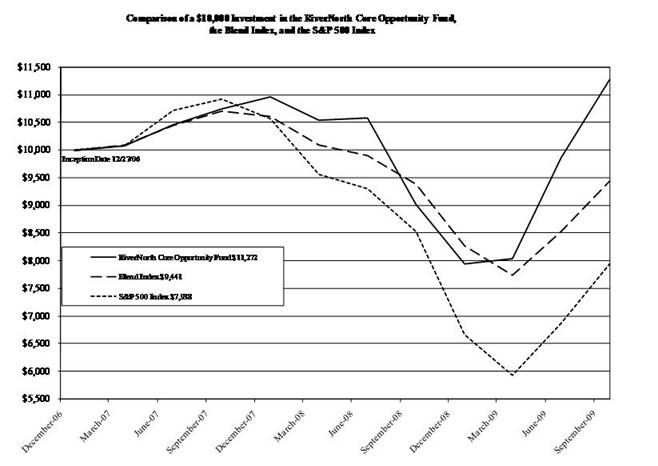
The chart above assumes an initial investment of $10,000 made on December 27, 2006 (commencement of operations) and held through September 30, 2009. The Blend Index and the S&P 500 Index are unmanaged benchmarks that assume reinvestment of all distributions and excludes the effect of taxes and fees. The chart also assumes reinvestment of all dividends and distributions on the reinvestment dates during the period. THE FUND’S RETURN REPRESENTS PAST PERFORMANCE AND DOES NOT GUARANTEE FUTURE RESULTS. The returns shown do not reflect deduction of taxes that a shareholder would pay on Fund distributions or the redemption of Fund shares. Investment returns and principal values will fluctuate so that your shares, when redeemed, may be worth more or less than their original purchase price.
Current performance may be lower or higher than the performance data quoted. For more information on the Fund, and to obtain performance data current to the most recent month end or to request a prospectus, please call (888) 848-7569. You should carefully consider the investment objectives, potential risks, management fees, and charges and expenses of the Fund before investing. The Fund’s prospectus contains this and other information about the Fund, and should be read carefully before investing.
The Fund is distributed by Unified Financial Securities, Inc., member FINRA.
RIVERNORTH CORE OPPORTUNITY FUND |
EXPENSE ILLUSTRATION
SEPTEMBER 30, 2009 | (UNAUDITED) |
Expense Example
As a shareholder of the RiverNorth Core Opportunity Fund, you incur ongoing costs which typically consist of management fees and other Fund expenses. This Example is intended to help you understand your ongoing costs (in dollars) of investing in the Fund and to compare these costs with the ongoing costs of investing in other mutual funds.
The Example is based on an investment of $1,000 invested at the beginning of the period, April 1, 2009 and held for the entire six month period ended September 30, 2009.
Actual Expenses
The first line of the table below provides information about actual account values and actual expenses. You may use the information in this line, together with the amount you invested, to estimate the expenses that you paid over the period. Simply divide your account value by $1,000 (for example, an $8,600 account value divided by $1,000 = 8.6), then multiply the result by the number in the first line under the heading entitled “Expenses Paid During the Period” to estimate the expenses you paid on your account during this period.
Hypothetical Example for Comparison Purposes
The second line of the table below provides information about hypothetical account values and hypothetical expenses based on the Fund’s actual expense ratio and an assumed rate of return of 5% per year before expenses, which is not the Fund’s actual return. The hypothetical account values and expenses may not be used to estimate the actual ending account balance or expenses you paid for the period. You may use this information to compare the ongoing costs of investing in this Fund and other funds. To do so, compare this 5% hypothetical example with the 5% hypothetical example that appear in the shareholder reports of other funds.
| Beginning | Ending | During the Period* |
| Account Value | Account Value | April 1, 2009 to |
| April 1, 2009 | September 30, 2009 | September 30, 2009 |
Actual | $1,000.00 | $1,403.72 | $9.00 |
Hypothetical
(5% return | $1,000.00 | $1,017.58 | $7.55 |
before expenses)
______
*Expenses are equal to the Fund’s annualized expense ratio of 1.49%, multiplied by the average account value over the period, multiplied by 183/365 (to reflect the partial year period).
| | | |
RIVERNORTH CORE OPPORTUNITY FUND |
| | | |
SCHEDULE OF INVESTMENTS |
SEPTEMBER 30, 2009 | |
| | | |
Shares/Description/Percentage of Net Assets | Fair Value |
| | | |
CLOSED-END FUNDS - 59.62% |
89,068 | | ASA Ltd. | $ 6,751,354 |
563,588 | | Boulder Growth & Income Fund, Inc. | 3,161,729 |
39,280 | | Boulder Total Return Fund, Inc. | 471,753 |
78,441 | | Central Europe and Russia Fund, Inc. / The | 2,547,764 |
107,561 | | China Fund, Inc. | 2,597,598 |
141,677 | | Claymore Dividend & Income Fund | 1,977,811 |
363,795 | | Clough Global Equity Fund | 5,045,837 |
968,056 | | Clough Global Opportunities Fund | 12,274,950 |
594,360 | | DWS Dreman Value Income Edge Fund | 6,644,945 |
88,785 | | DWS Global Commodities Stock Fund, Inc. | 698,738 |
264,658 | | Eaton Vance Senior Income Trust | 1,471,498 |
618,507 | | First Trust/Four Corners Senior Floating Rate Income Fund II | 6,853,058 |
79,555 | | Gabelli Dividend & Income Trust | 985,686 |
65,648 | | Gabelli Global Gold Natural Resources & Income Trust | 1,016,231 |
68,375 | | General American Investors Company, Inc. | 1,626,915 |
97,366 | | H&Q Life Sciences Investors | 898,688 |
687,380 | | Highland Credit Strategies Fund | 4,364,863 |
120,161 | | Insured Municipal Income Fund | 1,699,077 |
2,463,890 | | Liberty All-Star Equity Fund | 10,422,255 |
847,025 | | LMP Capital and Income Fund, Inc. | 8,131,440 |
184,276 | | LMP Corporate Loan Fund, Inc. | 1,791,163 |
186,388 | | Macquarie Global Infrastructure Total Return Fund, Inc. | 2,810,731 |
226,234 | | Morgan Stanley China A Share Fund | 7,282,472 |
256,537 | | Morgan Stanley Emerging Markets Domestic Debt Fund, Inc. | 3,632,564 |
1,386,957 | | NFJ Dividend, Interest & Premium Strategy Fund | 18,585,224 |
326,597 | | Nuveen Floating Rate Income Fund | 3,089,608 |
25,987 | | Nuveen Floating Rate Income Opportunity Fund | 246,876 |
899,438 | | Nuveen Multi-Strategy Income and Growth Fund | 6,215,117 |
1,388,733 | | Nuveen Multi-Strategy Income and Growth Fund 2 | 10,012,765 |
1,529,058 | | Royce Value Trust, Inc. | 15,801,285 |
604,243 | | SunAmerica Focused Alpha Growth Fund, Inc. | 7,293,213 |
1,191,858 | | TCW Strategic Income Fund, Inc. | 5,041,559 |
235,285 | | Western Asset/Claymore Inflation-Linked Opportunities & Income Fund | 2,797,539 |
| | | |
TOTAL FOR CLOSED-END FUNDS (Cost $132,603,488) | 164,242,306 |
| | | |
MUTUAL FUNDS - 7.26% | |
517,542 | | Calamos Convertible Fund - Class A | 9,538,306 |
1,064,717 | | Eaton Vance Floating-Rate Advantage Fund | 10,476,811 |
| | | |
TOTAL FOR MUTUAL FUNDS (Cost $14,673,923) | 20,015,117 |
*See accompanying notes which are an integral part to these financial statements.
RIVERNORTH CORE OPPORTUNITY FUND |
| | | |
SCHEDULE OF INVESTMENTS - continued |
SEPTEMBER 30, 2009 | |
| | | |
Shares/Description/Percentage of Net Assets | Fair Value |
| | | |
EXCHANGE-TRADED FUNDS - 13.02% |
54,100 | | iShares Barclays US Treasury Inflation Protected Securities Fund | $ 5,565,808 |
4,000 | | iShares iBoxx $ High Yield Corporate Bond Fund | 345,400 |
32,294 | | iShares iBoxx $ Investment Grade Corporate Bond Fund | 3,445,124 |
172,839 | | iShares MSCI Emerging Markets Index | 6,725,165 |
60,537 | | iShares Russell 1000 Growth Index Fund | 2,803,468 |
136,168 | | PowerShares FTSE RAFI US 1000 Portfolio | 6,403,981 |
151,455 | | Proshares UltraShort 20+ Year Treasury (a) | 6,665,535 |
108,000 | | SPDR Barclays Capital Convertible Bond ETF | 3,913,920 |
| | | |
TOTAL FOR EXCHANGE-TRADED FUNDS (Cost $31,424,263) | 35,868,401 |
| | | |
EXCHANGE-TRADED NOTES - 1.59% |
87,670 | | iPath S&P 500 VIX Short-Term Futures ETN (a) | 4,382,623 |
| | | |
TOTAL FOR EXCHANGE-TRADED NOTES (Cost $6,561,994) | 4,382,623 |
| | | |
HOLDING & INVESTMENT MANAGEMENT COMPANIES - 0.42% |
12,100 | | Affiliated Managers Group, Inc. (a) | 786,621 |
11,736 | | Legg Mason, Inc. | 364,168 |
| | | |
TOTAL FOR HOLDING & INVESTMENT MANAGEMENT COMPANIES (Cost $1,272,030) | 1,150,789 |
| | | |
PREFERRED STOCKS - 1.30% |
40,000 | | Gabelli Global Deal Fund - Series A, 8.500%, callable on 11/06/2009 @ $50 | 2,112,400 |
59,938 | | General American Investors Company, Inc. - Series B, 5.950%, callable on 11/06/2009 @ $25 | 1,459,490 |
| | | |
TOTAL FOR PREFERRED STOCKS (Cost $3,410,341) | 3,571,890 |
| | | |
SHORT-TERM INVESTMENTS - 18.05% |
49,722,594 | | Fidelity Institutional Money Market Portfolio - Class I, 0.46% (b) | 49,722,594 |
| | | |
TOTAL FOR SHORT-TERM INVESTMENTS (Cost $49,722,594) | 49,722,594 |
| | | |
TOTAL INVESTMENTS (Cost $239,668,633) - 101.26% | $278,953,720 |
| | | |
LIABILITIES IN EXCESS OF OTHER ASSETS - (1.26)% | (3,472,060) |
| | | |
NET ASSETS - 100.00% | $275,481,660 |
(a) Non-income producing. | |
(b) Variable rate security; the money market rate shown represents the rate at September 30, 2009. |
*See accompanying notes which are an integral part to these financial statements.
RIVERNORTH CORE OPPORTUNITY FUND |
| | | | | |
TOTAL RETURN SWAPS | | | |
SEPTEMBER 30, 2009 | | | |
| | | | | Unrealized |
| | | Notional | Termination | Appreciation |
| | | Amount | Date | (Depreciation) |
| | | | | |
ReFlow Fund, LLC* | $ 13,000,000 | 8/27/2010 | $ - |
| | | | | |
| | | | | |
| | | | | |
*See Note 4 in the Notes to the Financial Statements for additional information. |
*See accompanying notes which are an integral part to these financial statements.
RIVERNORTH CORE OPPORTUNITY FUND |
| |
STATEMENT OF ASSETS AND LIABILITIES |
SEPTEMBER 30, 2009 | |
| |
| |
Assets | |
Investment in securities: | |
At cost | $ 239,668,633 |
At value | $ 278,953,720 |
| |
Receivable for fund investments sold | 1,253,105 |
Receivable for fund shares purchased | 1,277,007 |
Dividends receivable | 556,806 |
Interest receivable | 20,302 |
Prepaid expenses | 11,945 |
Total assets | 282,072,885 |
| |
Liabilities | |
Accrued 12b-1 fees | 54,981 |
Payable for fund investments purchased | 6,055,644 |
Payable to Adviser (a) | 219,922 |
Payable for fund shares redeemed | 132,631 |
Payable for open swap agreements | 46,560 |
Payable to trustees and officers | 3,204 |
Other accrued expenses | 78,283 |
Total liabilities | 6,591,225 |
| |
Net Assets | $ 275,481,660 |
| |
Net Assets consist of: | |
Paid in capital | $ 243,826,886 |
Accumulated undistributed net investment income (loss) | 3,023,501 |
Accumulated net realized gain (loss) from investment transactions | (10,653,814) |
Net unrealized appreciation (depreciation) on investments | 39,285,087 |
| |
Net Assets | $ 275,481,660 |
| |
Shares outstanding (unlimited number of shares authorized) | 26,057,045 |
| |
| |
Net Asset Value Per Share and Offering Price | $ 10.57 |
| |
Minimum Redemption Price Per Share (b) | $ 10.36 |
| |
| |
| |
(a) See Note 5 in the Notes to the Financial Statements. |
(b) The Fund will impose a 2.00% redemption fee on shares redeemed within 90 days of purchase. |
*See accompanying notes which are an integral part to these financial statements.
RIVERNORTH CORE OPPORTUNITY FUND |
| |
STATEMENT OF OPERATIONS |
FOR THE FISCAL YEAR ENDED SEPTEMBER 30, 2009 |
| |
| |
Investment Income | |
Dividend income | $10,437,414 |
Interest income | 344,435 |
Total Income | 10,781,849 |
| |
Expenses | |
Investment adviser fee (a) | 2,024,017 |
12b-1 fees (a) | 506,009 |
Administration expenses (a) | 123,144 |
Transfer agent expenses (a) | 82,255 |
Legal expenses | 68,451 |
Fund accounting expenses (a) | 65,878 |
Custodian expenses | 62,873 |
Registration expenses | 39,517 |
CCO expenses | 37,028 |
Report printing expenses | 35,451 |
Audit expenses | 15,148 |
24f-2 expenses | 10,689 |
Miscellaneous expenses | 8,717 |
Insurance expense | 7,889 |
Pricing expenses | 7,387 |
Trustee expenses | 3,616 |
Total Expenses | 3,098,069 |
| |
Net Investment Income | 7,683,780 |
| |
| |
Realized & Unrealized Gain (Loss) |
Net realized gain (loss) on: | |
Investment securities | (12,590,569) |
Swaps | 5,214,426 |
Long-term capital gain distributions from other investment companies | 1,363,880 |
Change in unrealized appreciation (depreciation) |
on investment securities | 57,074,718 |
Net realized and unrealized gain (loss) on investment securities | 51,062,455 |
Net increase (decrease) in net assets resulting from operations | $58,746,235 |
| |
| |
(a) See Note 5 in the Notes to the Financial Statements. |
*See accompanying notes which are an integral part to these financial statements.
RIVERNORTH CORE OPPORTUNITY FUND |
| |
STATEMENTS OF CHANGES IN NET ASSETS |
| | | |
| | | |
| | | |
| | | |
| Fiscal Year ended | | Fiscal Year ended |
| September 30, 2009 | | September 30, 2008 |
Increase (Decrease) in Net Assets from: | | |
| | | |
Operations: | | | |
Net investment income (loss) | $ 7,683,780 | | $ 1,675,281 |
Net realized gain (loss) on investment securities and swaps | (7,376,143) | | (4,914,859) |
Long-term capital gain distributions from other investment companies | 1,363,880 | | 311,679 |
Change in unrealized appreciation (depreciation) |
on investment securities | 57,074,718 | | (18,491,830) |
Net increase (decrease) in net assets resulting from operations | 58,746,235 | | (21,419,729) |
| | | |
Distributions to shareholders: | | |
From net investment income | (5,838,783) | | (540,869) |
From net realized gain | (15,501) | | (290,112) |
Total distributions | (5,854,284) | | (830,981) |
| | | |
Capital Share Transactions: | | |
Proceeds from Fund shares sold | 181,134,720 | | 144,555,567 |
Reinvestment of distributions | 5,836,736 | | 830,981 |
Proceeds from redemption fees (a) | 73,541 | | 30,448 |
Amount paid for Fund shares redeemed | (97,784,899) | | (8,584,796) |
Net increase (decrease) in net assets resulting | |
from capital share transactions | 89,260,098 | | 136,832,200 |
| | | |
Net Increase (Decrease) in Net Assets | 142,152,049 | | 114,581,490 |
| | | |
Net Assets | | | |
Beginning of year | 133,329,611 | | 18,748,121 |
| | | |
End of year | $ 275,481,660 | | $ 133,329,611 |
| | | |
Accumulated undistributed net investment income |
included in net assets at end of period | $ 3,023,501 | | $ 402,066 |
| | | |
Capital Share Transactions | | |
Shares sold | 23,061,304 | | 14,318,853 |
Shares issued in reinvestment of distributions | 817,470 | | 78,841 |
Shares redeemed | (13,117,957) | | (847,096) |
| | | |
Net increase (decrease) from capital share transactions | 10,760,817 | | 13,550,598 |
(a) See Note 2 in the Notes to the Financial Statements. |
*See accompanying notes which are an integral part to these financial statements.
RIVERNORTH CORE OPPORTUNITY FUND | |
| | | | | | |
FINANCIAL HIGHLIGHTS | | | | | |
Selected data for a share outstanding throughout each period. | | | |
| | | | | | |
| | | | | | |
| | | | | | |
| | | | | | |
| Fiscal Year ended | | Fiscal Year ended | | Period ended | |
| September 30, 2009 | | September 30, 2008 | | September 30, 2007 | (a) |
| | | | | | |
Selected Per Share Data: | | | | | |
Net asset value, beginning of period | $ 8.72 | | $ 10.74 | | $ 10.00 | |
| | | | | | |
Income (loss) from investment operations: | | | | |
Net investment income (b) | 0.32 | | 0.42 | | 0.11 | |
Net realized and unrealized gains (losses) | 1.76 | | (2.10) | | 0.63 | |
Total income from investment operations | 2.08 | | (1.68) | | 0.74 | |
| | | | | | |
Less distributions: | | | | | |
From net investment income | (0.23) | | (0.23) | | - | |
From net realized gain | - | (c) | (0.12) | | - | |
Total distributions | (0.23) | | (0.35) | | - | |
| | | | | | |
Paid in capital from redemption fees | - | (d) | 0.01 | | - | (d) |
| | | | | | |
Net asset value, end of period | $ 10.57 | | $8.72 | | $10.74 | |
| | | | | | |
Total Return (e) | 25.06% | | -16.08% | | 7.40% | (f) |
| | | | | | |
Ratios and Supplemental Data: | | | | | |
Net assets, end of period (000) | $275,482 | | $133,330 | | $18,748 | |
| | | | | | |
Ratio of expenses to average net assets (g) | 1.53% | | 1.65% | | 1.95% | (h) |
Ratio of expenses to average net assets | | | | |
before reimbursement (g) | 1.53% | | 1.59% | | 2.21% | (h) |
Ratio of net investment income to | | | | | |
average net assets (g) | 3.80% | | 4.15% | | 1.45% | (h) |
Ratio of net investment income to | | | | | |
average net assets before reimbursement (g) | 3.80% | | 4.21% | | 1.19% | (h) |
Portfolio turnover rate | 215.42% | | 304.39% | | 74.84% | |
| | | | | | |
(a) For the period December 27, 2006 (Commencement of Operations) to September 30, 2007. | |
(b) Net investment income per share is based on average shares outstanding during the period. | |
(c) Net realized gain distribution resulted in less than $0.005 per share for the period. | |
(d) Redemption fees resulted in less than $0.005 per share for the period. | | |
(e) Total return in the above table represents the rate that the investor would have earned or | |
lost on an investment in the Fund, assuming reinvestment of dividends. | | |
(f) Not annualized. | | | | | | |
(g) The ratios exclude the impact of expenses of the underlying funds in which the Fund invests | |
as represented in the Schedule of Investments. | | | | |
(h) Annualized. | | | | | | |
*See accompanying notes which are an integral part to these financial statements.
RIVERNORTH CORE OPPORTUNITY FUND |
NOTES TO THE FINANCIAL STATEMENTSSEPTEMBER 30, 2009
1. ORGANIZATION
The RiverNorth Core Opportunity Fund (the “Fund”) was organized as a diversified series of RiverNorth Funds (the “Trust”) on July 18, 2006 and commenced investment operations on December 27, 2006. The Trust is an open-end investment company established under the laws of Ohio by an Agreement and Declaration of Trust dated July 18, 2006 (the “Trust Agreement”). The Trust Agreement permits the Board of Trustees (the “Trustees”) to authorize and issue an unlimited number of shares of beneficial interest of separate series. The Fund is the only series currently authorized by the Trustees. The investment adviser to the Fund is RiverNorth Capital Management, Inc. (the “Adviser”).
The investment objective of the Fund is to seek long-term capital appreciation and income, consistent with prudent investment risk over the long-term.
2. SIGNIFICANT ACCOUNTING POLICIES
SECURITY VALUATION: All investments in securities are recorded at their estimated fair value as described in Note 3.
SECURITY TRANSACTIONS AND RELATED INCOME: The Fund follows industry practice and records security transactions on the trade date. The specific identification method is used for determining gains or losses for financial statements and income tax purposes. Dividend income is recorded on the ex-dividend date and interest income is recorded on an accrual basis. Discounts and premiums on securities purchased are amortized or accreted using the effective interest method. Withholding taxes on foreign dividends have been provided for in accordance with the Fund’s understanding of the applicable country’s tax rules and rates.
OTHER: The Fund records security transactions based on trade date. Dividend income is recognized on the ex-dividend date. Interest income is recognized on an accrual basis. Discounts and premiums on fixed income securities purchased are amortized over the lives of the respective securities. The Fund has held certain investments which pay dividends to their shareholders based upon available funds from operations. It is possible for these dividends to exceed the underlying investments taxable earnings and profits resulting in the excess portion of such dividends being designated as a return of capital. Distributions received from investments in securities that represent a return of capital or capital gain are recorded as a reduction of the cost of investments or as a realized gain, respectively.
SHARE VALUATION: The net asset value (the “NAV”) is generally calculated as of the close of trading on the New York Stock Exchange (“the Exchange”) (normally 4:00 p.m. Eastern time) every day the Exchange is open. The NAV is calculated by taking the total value of the Fund’s assets, subtracting its liabilities, and then dividing by the total number of shares outstanding, rounded to the nearest cent. The offering price and redemption price per share is equal to the net asset value per share, except that shares of the Fund are subject to a redemption fee of 2% if redeemed within 90 days of purchase. For the fiscal year ended September 30, 2009, there were redemption fees of $73,541.
FEDERAL INCOME TAXES: The Fund makes no provision for federal income tax. The Fund intends to qualify each year as a “regulated investment company” under subchapter M of the Internal Revenue Code of 1986, as amended, by distributing substantially all of its taxable income. If the required amount of net investment income is not distributed, the Fund could incur a tax expense.
As of and during the fiscal year ended September 30, 2009, the Fund did not have a liability for any unrecognized tax benefits. The Fund recognizes interest and penalties, if any, related to unrecognized tax benefits as income tax expense in the statement of operations. During the period, the Fund did not incur any interest or penalties. The Fund is not subject to examination by U.S. federal tax authorities for tax years prior to 2007.
RIVERNORTH CORE OPPORTUNITY FUND |
NOTES TO THE FINANCIAL STATEMENTS (CONTINUED)SEPTEMBER 30, 2009
2. SIGNIFICANT ACCOUNTING POLICIES - continued
USE OF ESTIMATES: The preparation of financial statements in conformity with accounting principles generally accepted in the United States of America (“GAAP”) requires management to make estimates and assumptions that affect the reported amounts of assets and liabilities and disclosure of contingent assets and liabilities at the date of the financial statements and the reported amounts of increases and decreases in net assets from operations during the reporting period. Actual results could differ from those estimates.
DISTRIBUTIONS TO SHAREHOLDERS: Distributions to shareholders, which are determined in accordance with income tax regulations, are recorded on the ex-dividend date. The treatment for financial reporting purposes of distributions made to shareholders during the year from net investment income or net realized capital gains may differ from their ultimate treatment for federal income tax purposes. These differences are caused primarily by differences in the timing of recognition of certain components of income, expense or realized capital gain for federal income tax purposes. Where such differences are permanent in nature, they are reclassified in the components of the net assets based on their ultimate characterization for federal income tax purposes. Any such reclassification will have no effect on net assets, results of operations or net asset values per share of the Fund. Due to permanent book to tax differences, $61,315 of accumulated undistributed net investment income has been reclassified by management to accumulated net realized gains, and $38,105 of accumulated undistributed net investment income has been reclassified by management to net unrealized appreciation on investments.
SUBSEQUENT EVENTS: In accordance with GAAP, management has evaluated subsequent events through November 30, 2009, the date the financial statements were issued and determined there were no material subsequent events.
3. SECURITIES VALUATION AND FAIR VALUE MANAGEMENT
Fair value is defined as the price that a Fund would receive upon selling an investment in a timely transaction to an independent buyer in the principal or most advantageous market of the investment. GAAP establishes a three-tier hierarchy to maximize the use of observable market data and minimize the use of unobservable inputs and to establish classification of fair value measurements for disclosure purposes.
Inputs refer broadly to the assumptions that market participants would use in pricing the asset or liability, including assumptions about risk, for example, the risk inherent in a particular valuation technique used to measure fair value including such a pricing model and/or the risk inherent in the inputs to the valuation technique. Inputs may be observable or unobservable. Observable inputs are inputs that reflect the assumptions market participants would use in pricing the asset or liability developed based on market data obtained from sources independent of the reporting entity. Unobservable inputs are inputs that reflect the reporting entity’s own assumptions about the assumptions market participants would use in pricing the asset or liability developed based on the best information available in the circumstances.
Various inputs are used in determining the value of the Fund’s investments. These inputs are summarized in the three broad levels listed below.
| • | Level 1 – quoted prices in active markets for identical securities |
| • | Level 2 – other significant observable inputs (including, but not limited to, quoted prices for an identical security in an inactive market, quoted prices for similar securities, interest rates, prepayment speeds, credit risk, etc.) |
| • | Level 3 – significant unobservable inputs (including the Fund’s own assumptions in determining fair value of investments based on the best information available) |
RIVERNORTH CORE OPPORTUNITY FUND |
NOTES TO THE FINANCIAL STATEMENTS (CONTINUED)
SEPTEMBER 30, 2009
3. SECURITIES VALUATION AND FAIR VALUE MEASUREMENTS – continued
The inputs used to measure fair value may fall into different levels of the fair value hierarchy. In such cases, for disclosure purposes, the level in the fair value hierarchy within which the fair value measurement falls in its entirety, is determined based on the lowest level input that is significant to the fair value measurement in its entirety.
Equity securities, including closed-end funds, exchange-traded funds, exchange-traded notes, holding and investment management companies and preferred stocks, are generally valued by using market quotations, but may be valued on the basis of prices furnished by a pricing service when the Adviser believes such prices more accurately reflect the fair value of such securities. Securities that are traded on any stock exchange are generally valued by the pricing service at the last quoted sale price. Lacking a last sale price, an exchange traded security is generally valued by the pricing service at its last bid price. Securities traded in the NASDAQ over-the-counter market are generally valued by the pricing service at the NASDAQ Official Closing Price. When using the market quotations or close prices provided by the pricing service and when the market is considered active, the security will be classified as a Level 1 security. Sometimes, an equity security owned by the Fund will be valued by the pricing service with factors other than market quotations or when the market is considered inactive. When this happens, the security will be classified as a Level 2 security. When market quotations are not readily available, when the Adviser determines that the market quotation or the price provided by the pricing service does not accurately reflect the current fair value, or when restricted or illiquid securities are being valued, such securities are valued as determined in good faith by the Adviser, in conformity with guidelines adopted by and subject to review by the Board. These securities will be categorized as Level 3 securities.
Investments in mutual funds, including money market mutual funds, are generally priced at the ending net asset value (NAV) provided by the service agent of the funds. These securities will be categorized as Level 1 securities.
Fixed income securities are generally valued using market quotations in an active market, will be categorized as Level 1 securities. However, they may be valued on the basis of prices furnished by a pricing service when the Adviser believes such prices more accurately reflect the fair value of such securities. A pricing service utilizes electronic data processing techniques based on yield spreads relating to securities with similar characteristics to determine prices for normal institutional-size trading units of debt securities without regard to sale or bid prices. These securities will generally be categorized as Level 2 securities. If the Adviser decides that a price provided by the pricing service does not accurately reflect the fair value of the securities, when prices are not readily available from a pricing service, or when restricted or illiquid securities are being valued, securities are valued at fair value as determined in good faith by the Adviser, in conformity with guidelines adopted by and subject to review of the Board. These securities will be categorized as Level 3 securities. The ability of issuers of debt securities held by the Fund to meet their obligations may be affected by economic and political developments in a specific country or region.
Short-term investments in fixed income securities, with maturities of less than 60 days when acquired, or which subsequently are within 60 days of maturity, are valued by using the amortized cost method of valuation, which the Board has determined will represent fair value. These securities will be classified as Level 2 securities.
In accordance with the Trust’s good faith pricing guidelines, the Adviser is required to consider all appropriate factors relevant to the value of securities for which it has determined other pricing sources are not available or reliable as described above. No single standard exists for determining fair value, because fair value depends upon the circumstances of each individual case. As a general principle, the current fair value of an issue of securities being valued by the Adviser would appear to be the amount which the owner might reasonably expect to receive for them upon their current sale. Methods which are in accordance with this principle may, for example, be based on (i) a multiple of earnings; (ii) a discount from market of a similar freely traded security (including a derivative security or a basket of securities traded on other markets, exchanges or among dealers); or (iii) yield to maturity with respect to debt issues, or a combination of these and other methods. Good faith pricing is permitted if, in the Adviser’s opinion, the validity of market quotations appears to be questionable based on factors such as evidence of a thin market in the security based on a small number of quotations, a significant event occurs after the close of a market but before the Fund’s NAV calculation that may affect a security’s value, or the Adviser is aware of any other data that calls into question the reliability of market quotations.
RIVERNORTH CORE OPPORTUNITY FUND |
NOTES TO THE FINANCIAL STATEMENTS (CONTINUED)SEPTEMBER 30, 2009
3. SECURITIES VALUATION AND FAIR VALUE MEASUREMENTS – continued
Good faith pricing may also be used in instances when the bonds the Fund invests in may default or otherwise cease to have market quotations readily available. Investments in foreign securities, junk bonds or other thinly traded securities are more likely to trigger fair valuation than other securities.
The following is a summary of the inputs used at September 30, 2009, in valuing the Fund’s assets carried at fair value:
| | Valuation Inputs | | |
Assets | Level 1 - Quoted Prices in Active Markets | Level 2 - Other Significant Observable Inputs | Level 3 - Significant Unobservable Inputs | Total |
| | | | |
Closed-End Funds | $ 164,242,306 | $ - | $ - | $ 164,242,306 |
| | | | |
Mutual Funds | 20,015,117 | - | - | 20,015,117 |
| | | | |
Exchange-Traded Funds | 35,868,401 | - | - | 35,868,401 |
| | | | |
Exchange-Traded Notes | 4,382,623 | - | - | 4,382,623 |
| | | | |
Holding & Investment Management Companies | 1,150,789 | - | - | 1,150,789 |
| | | | |
Preferred Stocks | 1,459,490 | 2,112,400 | - | 3,571,890 |
| | | | |
Short-Term Investments | 49,722,594 | - | - | 49,722,594 |
| | | | |
Total | $ 276,841,320 | $ 2,112,400 | $ - | $ 278,953,720 |
The Fund did not hold any investments at any time during the reporting period in which significant unobservable inputs were used in determining fair value; therefore, no reconciliation of Level 3 securities is included for this reporting period.
4. DERIVATIVE TRANSACTIONS
The Fund may enter into total return swaps. Total return swaps are agreements that provide the Fund with a return based on the performance of an underlying asset, in exchange for fee payments to a counterparty based on a specific rate. The difference in the value of these income streams is recorded daily by the Fund, and is settled in cash at the end of each month. The fee paid by the Fund will typically be determined by multiplying the face value of the swap agreement by an agreed upon interest rate. In addition, if the underlying asset declines in value over the term of the swap, the Fund would also be required to pay the dollar value of that decline to the counterparty. Total return swaps could result in losses if the underlying asset does not perform as anticipated by the Adviser. The Fund may use its own net asset value as the underlying asset in a total return swap. This strategy serves to reduce cash drag (the impact of cash on the Fund’s overall return) by replacing it with the impact of market exposure based upon the Fund’s own investment holdings. The Fund records fluctuations in the value of open swap contracts on a daily basis as unrealized gains or losses. Net amounts received or paid on the swap contracts are recorded as realized gains or losses. Realized gains and losses from terminated swaps are included in net realized gains/losses on swap contracts. Risks may exceed amounts recognized on the statement of assets and liabilities. The Fund values the total return swaps in which it enters based on a formula of the underlying asset’s nightly value, USD-LIBOR-BBA and an annual fee or various agreed upon inputs.
RIVERNORTH CORE OPPORTUNITY FUND |
NOTES TO THE FINANCIAL STATEMENTS (CONTINUED)
SEPTEMBER 30, 2009
4. DERIVATIVE TRANSACTIONS - continued
These securities will be categorized as Level 2 securities.
During the fiscal year, the Fund adopted ASC (FASB Accounting Standards Codification) 815-10-50 which required quantitative disclosures about objectives and strategies for using derivatives and their effect on the Fund’s financial position and performance as well as disclosure about credit-risk-related contingent features in derivative agreements. During the fiscal year ended September 30, 2009, the Fund invested in total return swaps. The total return swaps can be found on the balance sheet under receivable/payable for open swap agreements. At September 30, 2009, the payable for open swap agreements was $46,560. For the fiscal year ended September 30, 2009, the net realized gain (loss) on swaps was $5,214,426.
At September 30, 2009, the Fund had the following open total return swap contract.
| Termination | Notional | Unrealized |
Agreement with ReFlow Fund, LLC | 08/27/2010 | $13,000,000 | $ - |
dated August 27, 2008 to receive total
return of the Fund, based on its daily
change in NAV less USD-LIBOR plus
an annualized spread of 1.95%.
The swap is settled and reset monthly. In accordance with the swap contract, the Fund has the ability to adjust the notional amount on a daily basis. The activity of the swap is summarized below:
Beginning of year | $16,000,000 |
5. | INVESTMENT ADVISORY FEE AND OTHER TRANSACTIONS WITH AFFILIATES |
The Adviser serves as the investment adviser to the Fund. Under the terms of the management agreement (the “Agreement”), the Adviser, subject to the supervision of the Board, provides or arranges to be provided to the Fund such investment advice as it deems advisable and will furnish or arrange to be furnished a continuous investment program for the Fund consistent with the Fund’s investment objectives and policies. As compensation for its management services, the Fund is obligated to pay the Adviser a fee computed and accrued daily and paid monthly in arrears at an annual rate of 1.00% of the average daily net assets of the Fund. For the fiscal year ended September 30, 2009, the Adviser earned investment advisory fees of $2,024,017.
The Adviser has contractually agreed to defer the collection of fees and/or reimburse expenses, but only to the extent necessary to limit net annual operating expenses (excluding brokerage fees and commissions; borrowing costs, such as (a) interest and (b) dividends on securities sold short; taxes; indirect expenses incurred by the underlying funds in which the Fund invests; and extraordinary expenses) to 1.60% of the average daily net assets of the Fund through January 31, 2010. Each deferral of fees or reimbursement of an expense by the Adviser is subject to repayment by the Fund within the three fiscal years following the fiscal year in which the expenses was incurred, provided that the Fund is able to make the repayment without exceeding the above expense limitations. For the fiscal year ended September 30, 2009, there were no fee deferrals or reimbursements by the Adviser and there were no carryovers from prior years of amounts recoupable to the Adviser. At September 30, 2009, the Fund owed the Adviser $219,922 for advisory services.
RIVERNORTH CORE OPPORTUNITY FUND |
NOTES TO THE FINANCIAL STATEMENTS (CONTINUED)SEPTEMBER 30, 2009
5. | INVESTMENT ADVISORY FEE AND OTHER TRANSACTIONS WITH AFFILIATES - continued |
The Trust retains Unified Fund Services, Inc. (“Unified”) to manage the Fund’s business affairs and to provide the Fund with administrative services, including all regulatory reporting and necessary office equipment and personnel. For the fiscal year ended September 30, 2009, Unified earned fees of $123,144 for administrative services provided to the Fund. At September 30, 2009, Unified was owed $12,900 from the Fund for administrative services. Certain officers of the Trust are members of management and/or employees of Unified. Unified operates as a wholly-owned subsidiary of Huntington Bancshares, Inc., the parent company of the Distributor and Huntington National Bank, the custodian of the Funds’ investments (the “Custodian”). For the fiscal year ended September 30, 2009, the Custodian earned fees of $62,873 from the Fund for custody services. At September 30, 2009, the Custodian was owed $5,060 by the Fund for custody services.
The Trust retains Unified to act as the Fund’s transfer agent and to provide fund accounting services. For the fiscal year ended September 30, 2009, Unified earned fees of $22,296 for transfer agent services and $59,959 in reimbursement for out-of-pocket expenses incurred in providing transfer agent services for the Fund. At September 30, 2009, the Fund owed Unified $1,724 for transfer agent services and $10,239 for reimbursement of out-of-pocket expenses. For the fiscal year ended September 30, 2009, Unified earned fees of $65,878 from the Fund for fund accounting services. At September 30, 2009, Unified was owed $5,969 from the Fund for fund accounting services.
The Fund has adopted a plan pursuant to Rule 12b-1 under the Investment Company Act of 1940, as amended (the “Plan”). The Plan permits the Fund to pay the Adviser for distribution and promotion expenses related to marketing shares of the Fund. The amount payable annually by the fund is 0.25% of the average daily net assets. Under the Plan the Trust may engage in any activities related to the distribution of Fund shares. During the fiscal year ended September 30, 2009, the Fund accrued 12b-1 expenses of $506,009, of which $54,981 was unpaid at September 30, 2009.
Unified Financial Securities, Inc. (the “Distributor”) acts as the sole distributor of the Fund. There were no payments to the Distributor by the Fund during the fiscal year ended September 30, 2009. The Distributor, Unified and the Custodian are controlled by Huntington Bancshares, Inc. A Trustee of the Trust is a member of management of Huntington National Bank, a subsidiary of Huntington Bancshares, Inc. (the parent of the Distributor) and an officer of the Trust is an officer of the Distributor and such persons may be deemed to be affiliates of the Distributor.
6. | INVESTMENTS TRANSACTIONS |
For the fiscal year ended September 30, 2009, purchases and sales of investment securities, other than short-term investments and short-term U.S. government obligations were as follows:

RIVERNORTH CORE OPPORTUNITY FUND |
NOTES TO THE FINANCIAL STATEMENTS (CONTINUED)
SEPTEMBER 30, 2009
6. | INVESTMENTS TRANSACTIONS - continued |
At September 30, 2009, the net unrealized appreciation (depreciation) of investments for tax purposes was as follows:

At September 30, 2009, the aggregate cost of securities for federal income tax purposes was $246,895,913.
7. BENEFICIAL OWNERSHIP
The beneficial ownership, either directly or indirectly, of more than 25% of the voting securities of a fund creates a presumption of control of the fund, under Section 2(a)(9) of the Investment Company Act of 1940. As of September 30, 2009, National Financial Services, for the benefit of its customers, owned 70.47% of the RiverNorth Core Opportunity Fund.
8. | DISTRIBUTIONS TO SHAREHOLDERS |
On December 29, 2008, the Fund paid an income distribution of $0.2260 per share or $5,838,783 and a short-term capital gain distribution of $0.0006 per share or $15,501 to shareholders of record on December 26, 2008.
The tax character of distributions paid during the fiscal years ended September 30, 2009, and September 30, 2008, was as follows:

At September 30, 2009, the components of distributable earnings on a tax basis were as follows:

At September 30, 2009, the difference between book and tax basis unrealized appreciation (depreciation) is attributable primarily to the tax deferral of post-October losses in the amount of $2,000,934, losses on wash sales, mark-to-market of swap agreements and mark-to-market of certain investments.
RIVERNORTH CORE OPPORTUNITY FUND |
NOTES TO THE FINANCIAL STATEMENTS (CONTINUED)
SEPTEMBER 30, 2009
9. CAPITAL LOSS CARRYFORWARD
At September 30, 2009, the Fund had available for federal tax purposes unused capital loss carryforwards of $10,298,275, which are available to offset future realized gains. To the extent that these carryforwards are used to offset future gains, it is probable that the amount offset will not be distributed to shareholders. The carryforward expires as follows:
| Amount | Expires September 30, |
REPORT OF INDEPENDENT REGISTERED PUBLIC ACCOUNTING FIRM
To The Shareholders and Board of Trustees
RiverNorth Funds
We have audited the accompanying statement of assets and liabilities, including the schedule of investments, of RiverNorth Funds, comprising RiverNorth Core Opportunity Fund (the “Fund”) as of September 30, 2009, and the related statement of operations for the year then ended, the statements of changes in net assets for each of the two years in the period then ended, and the financial highlights for each of the three periods then ended. These financial statements and financial highlights are the responsibility of Fund management. Our responsibility is to express an opinion on these financial statements and financial highlights based on our audits.
We conducted our audits in accordance with the standards of the Public Company Accounting Oversight Board (United States). Those standards require that we plan and perform the audit to obtain reasonable assurance about whether the financial statements and financial highlights are free of material misstatement. An audit includes examining, on a test basis, evidence supporting the amounts and disclosures in the financial statements. Our procedures included confirmation of securities owned as of September 30, 2009 by correspondence with the Fund’s custodian and brokers or by other appropriate auditing procedures where replies from brokers were not received. An audit also includes assessing the accounting principles used and significant estimates made by management, as well as evaluating the overall financial statement presentation. We believe that our audits provide a reasonable basis for our opinion.
In our opinion, the financial statements and financial highlights referred to above present fairly, in all material respects, the financial position of RiverNorth Funds, comprising RiverNorth Core Opportunity Fund as of September 30, 2009, the results of its operations for the year then ended, the changes in its net assets for each of the two years in the period then ended, and the financial highlights for each of the three periods then ended, in conformity with accounting principles generally accepted in the United States of America.
COHEN FUND AUDIT SERVICES, LTD.
Westlake, Ohio
November 30, 2009
RIVERNORTH CORE OPPORTUNITY FUND |
ADDITIONAL INFORMATION
SEPTEMBER 30, 2009 | (UNAUDITED) |
PROXY VOTING GUIDELINES
A description of the policies and procedures that the Fund uses to determine how to vote proxies relating to portfolio securities and information regarding how the Fund voted proxies during the most recent 12-month period ended June 30, are available without charge upon request by (1) calling the Fund at (888) 848-7569 and (2) from Form N-PX filed by the Fund with the Securities and Exchange Commission (“SEC”) on the SEC’s website at www.sec.gov.
PORTFOLIO HOLDINGS DISCLOSURE POLICY
The Fund files a complete schedule of investments with the SEC for the first and third quarter of each fiscal year on Form N-Q. The Fund’s first and third fiscal quarters end on December 31 and June 30. The Form N-Q filing must be made within 60 days of the end of the quarter, and the Fund’s first Form N-Q was filed with the SEC on February 26, 2007. The Fund’s Forms N-Q are available on the SEC’s website at www.sec.gov, or they may be reviewed and copied at the SEC’s Public Reference Room in Washington, DC (call 1-800-732-0330 for information on the operations of the Public Reference Room). You may also obtain copies by calling the Fund at 1-888-848-7569.
APPROVAL OF INVESTMENT ADVISORY AGREEMENT
The continuation of the Management Agreement ("Agreement") between RiverNorth Funds (the "Trust") and RiverNorth Capital Management (the "Adviser") was considered by the Board of Trustees (the "Board" or the "Trustees") at an in-person meeting (the "Meeting") held on August 25, 2009. The Board acknowledged having received materials compiled by the Fund's administrator including a copy of the Agreement, the Adviser's response to a questionnaire regarding the Adviser's profitability, management and operations, a copy of the Adviser's Form ADV, certifications regarding the Adviser's compliance programs and information regarding the Fund performance versus the performance of its benchmarks and peer funds. The Board also acknowledged having received a memorandum from its legal counsel regarding the Trustees' responsibilities in considering the renewal of the Agreement and detailing the specific factors it must consider including: (i) the investment performance of the Fund and the investment performance of the Advisor, (ii) the nature, extent and quality of the services provided by the Adviser to the Fund, (iii) the costs of the services provided and the profits to be realized by the Advisor and any of its affiliates from the relationship with the Fund, (iv) the extent to which economies of scale will be realized by the Fund as it grows, and (v) whether the Fund's fee levels reflected the economies of scale to the benefit of the Fund's shareholders.
The Board reviewed the performance of the Fund for the fiscal years 2007 and 2008 and for the year-to-date 2009. The Board noted that as of June 30, 2009 the Fund returned 0.54% from its inception date. This return compares favorably to the 60/40 blended index which returned -6.10% and the S&P 500 Index which returned -13.92% for the same period. As of July 31, 2009, the Board noted that the Fund's year-to-date performance was 32.62% which compares favorably to the Morningstar Moderate Allocation Peer Group which returned 12.69%, the 60/40 blended index which returned 8.40% and the S&P 500 Index which returned 10.96% for the same period.
RIVERNORTH CORE OPPORTUNITY FUND |
ADDITIONAL INFORMATION (CONTINUED)
SEPTEMBER 30, 2009 | (UNAUDITED) |
APPROVAL OF INVESTMENT ADVISORY AGREEMENT - continued
The Trustees also reviewed the Trust performance relative to the appropriate peer group and indexes and concluded that the returns for the 2009 fiscal year to date, the since inception returns and the returns for fiscal year 2008 compared favorably to the peer group averages and to the returns of the relative benchmark index.
As to the comparative fees and expenses, the Trustees considered the management fee paid by the Fund and compared that fee to the management fees paid by funds in a relative peer group, as well as its total expense ratios. the Board noted that the annual net expense ratio of 1.66% was slightly above the 0.94% average expense ratio for the peer funds included in the moderate allocation Morningstar category. The Trustees also noted that the lowest reported net expense ratio was 0.02% within the peer group and the highest was 2.27%. The Board recognized that the average of the peer group was skewed downward because of the very low minimum likely resulting from a significant waiver of expenses. The Board also noted that the annual management fee of 1.00% for the Fund was slightly above the 0.47% average paid by the other peer funds. The Board noted that 1.00% is the maximum fee charged by the peers and the minimum fee for the same peer group is 0.04%. The Board heard from management of the Adviser that that the peer group includes fund of funds, which typically have low expenses. Nevertheless, after further discussion, it was a consensus of the Trustees that the fees were reasonable given the exceptional performance of the Fund over the same periods.
As to the nature, extent and quality of the services provided by the Adviser to the Fund, the Trustees considered that under the terms of the Agreement, the Adviser would, subject to the supervision of the Board, provide or arrange to be provided to the Fund such investment advice as the Adviser, in its discretion, deems advisable and will furnish or arrange to be furnished a continuous investment program for the Fund consistent with the Fund's investment objective and policies. The Adviser indicated that there were no changes in its operations with the exception of the hiring of a new Chief Compliance Officer for both the Fund and the Adviser. The Board indicated that the hiring of a dedicated Chief Compliance Officer was indicative of the Adviser's commitment to running its business in an efficient manner as well as its dedication to compliance. The Board was then referred to the Adviser's Form ADV which was previously provided to the Board and which provided details regarding the experience of each of the Adviser's personnel. The Adviser also provided additional information regarding its experience managing other investment accounts. Based on the foregoing information, the Trustees concluded that the Adviser had provided quality services and would continue to do so for the Fund.
As to the cost of the services to be provided and to the profits to be realized by the Adviser, the Trustees reviewed the Adviser's estimates of its profitability and its financial condition. The Board noted the Adviser's financial condition is stable as additional accounts and income from the Fund have contributed to higher revenues for the Adviser. The Board also noted that for a period of time, the Adviser had subsidized the operations of the Fund. After additional discussion, the Trustees agreed that the Agreement was not overly profitable to the Adviser and the financial condition of the Adviser was adequate. The Trustees noted that the Adviser has no affiliations with the Fund's transfer agent fund account, custodian, distributor or any other broker-dealers and therefore does not derive any benefits from the relationships these parties may have with the Trust.
RIVERNORTH CORE OPPORTUNITY FUND |
ADDITIONAL INFORMATION (CONTINUED)
SEPTEMBER 30, 2009 | (UNAUDITED) |
APPROVAL OF INVESTMENT ADVISORY AGREEMENT – continued
With regard to future growth and achieving economies of scale, the Adviser outlined the marketing plans that include emphasis on marketing to fee-based financial planners to grow the assets of the Fund. The Adviser further indicated that as the Fund's assets grow it is anticipated that the Adviser would reduce further the annual expense ratio of the Fund. Additionally, the Board noted that because of the growth in the Fund, additional economies of scale would be realized and as such economies are realized, the Adviser would consider further reductions in the management fees.
After additional consideration, the Board commenced an executive session to further consider and discuss the renewal of the Agreement. Upon the reconvening, a majority of the Board of Trustees of RiverNorth Funds, including a majority of the Trustees who are not interested persons of the Trust or interested parties to the Agreement voted to approve the continuation of the Management Agreement for an additional year.
| | | | | | | | |
| | | | | | | | |
RiverNorth Funds |
RiverNorth Core Opportunity Fund |
| | | | | | | | |
| | | | | | | | |
Board of Trustees |
Patrick W. Galley, CFA, Chairman |
Kevin M. Hinton |
James G. Kelley |
Dennis F. Magulick |
| | | | | | | | |
| | | | | | | | |
Investment Adviser |
RiverNorth Capital Management, Inc. |
| | | | | | | | |
| | | | | | | | |
Transfer Agent, Administrator and Dividend Disbursing Agent |
Unified Fund Services, Inc. |
| | | | | | | | |
| | | | | | | | |
Custodian |
Huntington National Bank |
| | | | | | | | |
| | | | | | | | |
Legal Counsel |
Thompson Hine LLP |
| | | | | | | | |
| | | | | | | | |
Independent Registered Public Accounting Firm |
Cohen Fund Audit Servies, Ltd. |
| | | | | | | | |
| | | | | | | | |
| | | | | | | | |
This report is provided for the general information of the shareholders of the RiverNorth Funds. |
This report is not intended for distribution to prospective investors in the Funds, unless preceded or |
accompanied by an effective prospectus. |
| | | | | | | | |
(a) As of the end of the period covered by this report, the registrant has adopted a code of ethics that applies to the registrant's principal executive officer, principal financial officer, principal accounting officer or controller, or persons performing similar functions, regardless of whether these individuals are employed by the registrant or a third party.
(b) For purposes of this item, “code of ethics” means written standards that are reasonably designed to deter wrongdoing and to promote:
| (1) | Honest and ethical conduct, including the ethical handling of actual or apparent conflicts of interest between personal and professional relationships; |
| (2) | Full, fair, accurate, timely, and understandable disclosure in reports and documents that a registrant files with, or submits to, the Commission and in other public communications made by the registrant; |
| (3) | Compliance with applicable governmental laws, rules, and regulations; |
| (4) | The prompt internal reporting of violations of the code to an appropriate person or persons identified in the code; and |
| (5) | Accountability for adherence to the code. |
(c) Amendments: During the period covered by the report, there have not been any amendments to the provisions of the code of ethics.
(d) Waivers: During the period covered by the report, the registrant has not granted any express or implicit waivers from the provisions of the code of ethics.
(e) | Posting: We do not intend to post the Code of Ethics for the Officers or any amendments or waivers on a website. |
(f) Availability: The Code of Ethics for the Officers can be obtained, free of charge by calling the toll free number for the appropriate Fund.
Item 3. Audit Committee Financial Expert.
(a) The registrant’s board of trustees has determined that the registrant does not have an audit committee financial expert. The committee members and the full Board considered a possibility of adding a member that would qualify as an expert. The audit committee determined that, although none of its members meet the technical definition of an audit committee expert, the committee has sufficient financial expertise to adequately perform its duties under the Audit Committee Charter without the addition of a qualified expert.
Item 4. Principal Accountant Fees and Services.
| Nature of the fees: | prepare tax returns |
Nature of the fees: Semi-Annual review and distribution calculation review
(e) | (1) | Audit Committee’s Pre-Approval Policies |
The Audit Committee Charter requires the Audit Committee to be responsible for the selection, retention or termination of auditors and, in connection therewith, to (i) evaluate the proposed fees and other compensation, if any, to be paid to the auditors, (ii) evaluate the independence of the auditors, (iii) pre-approve all audit services and, when appropriate, any non-audit services provided by the independent auditors to the Trust, (iv) pre-approve, when appropriate, any non-audit services provided by the independent auditors to the Trust's investment adviser, or any entity controlling, controlled by, or under common control with the investment adviser and that provides ongoing services to the Trust if the engagement relates directly to the operations and financial reporting of the Trust, and (v) receive the auditors’ specific representations as to their independence;
| (2) | Percentages of Services Approved by the Audit Committee |
(f) During audit of registrant's financial statements for the most recent fiscal year, less than 50 percent of the hours expended on the principal accountant's engagement were attributed to work performed by persons other than the principal accountant's full-time, permanent employees.
(g) The aggregate non-audit fees billed by the registrant's accountant for services rendered to the registrant, and rendered to the registrant's investment adviser (not including any sub-adviser whose role is primarily portfolio management and is subcontracted with or overseen by another investment adviser), and any entity controlling, controlled by, or under common control with the adviser that provides ongoing services to the registrant:
(h) Not applicable. The auditor performed no services for the registrant’s investment adviser or any entity controlling, controlled by, or under common control with the investment adviser that provides ongoing services to the registrant.
Item 5. Audit Committee of Listed Companies. NOT APPLICABLE – applies to listed companies only
Item 6. Schedule of Investments. schedule included with Item 1.
Item 7. Disclosure of Proxy Voting Policies and Procedures for Closed-End Management Investment Companies. NOT APPLICABLE – applies to closed-end funds only
Item 8. Portfolio Managers of Closed-End Investment Companies. NOT APPLICABLE – applies to closed-end funds only
Item 9. Purchases of Equity Securities by Closed-End Management Investment Company and Affiliated Purchasers. NOT APPLICABLE – applies to closed-end funds only
Item 10. Submission of Matters to a Vote of Security Holders.
The registrant has not adopted procedures by which shareholders may recommend nominees to the registrant’s board of trustees.
Item 11. Controls and Procedures.
(a) Based on an evaluation of the registrant's disclosure controls and procedures (as defined in Rule 30a-3(c) under the Investment Company Act of 1940) as of a date within 90 days of the filing date of this Form N-CSR, the disclosure controls and procedures are reasonably designed to ensure that the information required in filings on Forms N-CSR is recorded, processed, summarized, and reported on a timely basis.
(b) There were no significant changes in the registrant’s internal control over financial reporting that occurred during the registrant’s second fiscal quarter of the period covered by this report that have materially affected, or are reasonably likely to materially affect, the registrant’s internal control over financial reporting.
Item 12. Exhibits.
(a) (1) | Code is filed herewith |
| (2) | Certifications by the registrant's principal executive officer and principal financial officer, pursuant to Section 302 of the Sarbanes- Oxley Act of 2002 and required by Rule 30a-2under the |
| Investment Company Act of 1940 are filed herewith. |
(b) | Certification pursuant to 18 U.S.C. Section 1350, as adopted pursuant to Section 906 of the Sarbanes-Oxley Act of 2002 is filed herewith. |
SIGNATURES
Pursuant to the requirements of the Securities Exchange Act of 1934 and the Investment Company Act of 1940, the registrant has duly caused this report to be signed on its behalf by the undersigned, thereunto duly authorized.
(Registrant) RiverNorth Funds
By
*___/s/ Patrick W. Galley________ _____________________
Patrick W. Galley, President
Date 12/09/09____________
Pursuant to the requirements of the Securities Exchange Act of 1934 and the Investment Company Act of 1940, this report has been signed below by the following persons on behalf of the registrant and in the capacities and on the dates indicated.
By
*___ /s/ Patrick W. Galley__ ___________________________
Patrick W. Galley, President
Date 12/09/09____________
By
*___/s/ Jonathan M. Mohrhardt____ _____________________
Jonathan M. Mohrhardt, Treasurer
Date _12/09/09____ __