UNITED STATES
SECURITIES AND EXCHANGE COMMISSION
Washington, D.C. 20549
FORM N-CSR
CERTIFIED SHAREHOLDER REPORT OF REGISTERED
MANAGEMENT INVESTMENT COMPANIES
Investment Company Act file number: 811-21934
RiverNorth Funds
(Exact name of registrant as specified in charter)
325 North LaSalle Street, Suite 645, Chicago, IL 60654
(Address of principal executive offices) (Zip code)
Patrick W. Galley
325 North LaSalle Street, Suite 645
Chicago, IL 60654
(Name and address of agent for service)
Registrant’s telephone number, including area code: 312-832-1440
Date of fiscal year end: 09/30
Date of reporting period: 09/30/2012
| Item 1. | Reports to Stockholders. |
| | |
RiverNorth Funds | | Table of Contents |
| | September 30, 2012 |
| | |
Annual Report | September 30, 2012 | | 1 |
| | |
RiverNorth Funds | | Shareholder Letter |
| | September 30, 2012 (Unaudited) |
Dear Fellow Shareholders,
We are pleased to provide you with the 2012 Annual Report for the RiverNorth Funds. This report covers the RiverNorth Core Opportunity Fund (ticker: RNCOX), the RiverNorth/DoubleLine Strategic Income Fund (tickers: RNSIX and RNDLX) and the recently launched RiverNorth/Manning & Napier Dividend Income Fund (tickers: RNDIX and RNMNX). All Funds have a fiscal year-end of September 30, 2012.
Launched in July 2012, the RiverNorth/Manning & Napier Dividend Income Fund helps round out RiverNorth’s product offering of opportunistic investment strategies focused on closed-end funds. The RiverNorth/Manning & Napier Dividend Income Fund is an equity income based strategy. The Fund combines RiverNorth’s expertise in capitalizing on the inefficiencies within the closed-end fund space, specifically equity focused closed-end funds, with Manning & Napier’s disciplined stock screening process with a focus on companies with high free cash flow yields. We believe that opportunistic, discount-based investments in closed-end fund shares can earn excess returns over the closed-end fund’s benchmark index. Therefore, tactical management of an equity closed-end fund portfolio combined with a disciplined equity manager, we believe can produce best in class risk adjusted returns. Investor sentiment continues to be negative toward equities and many equity based closed-end funds are trading at attractive discounts to net asset value. As irrefutable contrarians investing against the herd, we find the current investment opportunity in equity closed-end funds compelling.
After just fifteen months of launching, we closed our alternative fixed income fund, the RiverNorth/DoubleLine Strategic Income Fund, to new investors on March 30, 2012. Our flagship fund, the RiverNorth Core Opportunity Fund, remains closed to new investors as well. Shareholders may still purchase shares of the fund(s) in which they are currently invested. Our history of closing funds to new investors reflects our commitment to shareholders in preserving current and future trading opportunities within the closed-end fund space.
Last, we are pleased to announce the launch of the RiverNorth Dynamic Buy-Write Fund (ticker: RNBWX) in October 2012, after the date of this Annual Report. The RiverNorth Dynamic Buy-Write Fund is designed to capitalize on the inefficiencies and opportunities embedded in the options market. RiverNorth hired significant talent and expertise within the volatility and options markets to manage this new product. We at RiverNorth are very excited about the prospects of this new fund and look forward to sharing detailed information about the new fund. Please visit www.rivernorthfunds.com for information about the RiverNorth Dynamic Buy-Write Fund.
Our family of funds offers investors an alternative and prudent way to allocate to more traditional asset classes. We believe these characteristics are necessary for an investment strategy in today’s volatile and uncertain market environment.
We thank you for your investment and trust in managing your assets.
Respectfully,
Patrick W. Galley, CFA
| | |
2 | | (888) 848-7569 | www.rivernorthfunds.com |
| | |
RiverNorth Funds | | Shareholder Letter |
| | September 30, 2012 (Unaudited) |
RiverNorth Core Opportunity Fund
Portfolio Management Commentary – Patrick Galley, CFA and Stephen O’Neill, CFA
What is the Fund’s investment strategy?
The RiverNorth Core Opportunity Fund (RNCOX; the “Fund”) invests in a broad range of equity, fixed income and short-term securities. To implement the Fund’s tactical asset allocation, the Adviser generally invests in closed-end funds and exchange-traded funds.
How did the RiverNorth Core Opportunity Fund perform relative to its benchmark during the reporting period?
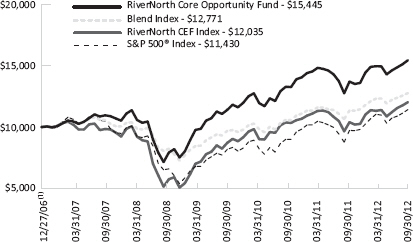
For the twelve months ended September 30, 2012, the RiverNorth Core Opportunity Fund returned 21.05%. The unmanaged Blend Index returned 19.87%, during the same period. The Blend Index consists of 60% S&P 500 Index and 40% Barclays Capital U.S. Aggregate Bond Index.
In order to compare the Fund’s performance to the overall taxable closed-end fund market, we maintain the RiverNorth Closed-end Fund Index (“RiverNorth CEF Index”). We believe the RiverNorth CEF Index provides the best representation of the taxable closed-end fund market because it is constructed without discount biases and is designed to capture the broader group’s asset class diversity. The RiverNorth CEF Index returned 24.54% during the reporting period. Please note that RNCOX owns closed-end funds opportunistically and is not benchmarked against the RiverNorth CEF Index. We recommend that shareholders view the RiverNorth CEF Index as a reference point only.
Comparison of a $10,000 Investment in the RiverNorth Core Opportunity Fund, the Blend Index, the RiverNorth CEF Index, and the S&P 500® Index.
| | |
Annual Report | September 30, 2012 | | 3 |
| | |
RiverNorth Funds | | Shareholder Letter |
| | September 30, 2012 (Unaudited) |
Average Annual Total Returns for Periods Ending September 30, 2012
| | | | | | | | |
| | | 1-Year | | 3-Year | | 5-Year | | Since
Inception(1) |
RiverNorth Core Opportunity Fund (RNCOX) | | 21.05% | | 11.07% | | 7.54% | | 7.84% |
Blend Index(2) | | 19.87% | | 10.71% | | 3.67% | | 4.34% |
S&P 500® Index(2) | | 30.20% | | 13.20% | | 1.05% | | 2.48% |
RiverNorth CEF Index(3) | | 24.54% | | 12.20% | | 3.30% | | 3.27% |
| (1) | Inception date is December 27, 2006. |
| (2) | Blend Index consists of 60% S&P 500® Index and 40% Barclays Capital U.S. Aggregate Bond Index. S&P 500® Index is a capitalization-weighted index of 500 stocks. The S&P 500® Index is designed to measure performance of the broad domestic economy based on the changing aggregate market value of these 500 stocks. The Barclays Capital US Aggregate Bond Index (formerly Lehman Brothers US Aggregate Bond Index) is a benchmark index composed of US securities in Treasury, Government-Related, Corporate, and Securitized sectors. It includes securities that are of investment-grade quality or better, have at least one year to maturity, and have an outstanding par value of at least $250 million. This unmanaged index does not reflect fees and expenses. The index cannot be invested in directly. The S&P 500 and Blend Indices are indices only and cannot be invested in directly. |
| (3) | The RiverNorth CEF Index measures the performance of the taxable closed-end fund market through a representative 75 Funds. The index rebalances every 12 months and is calculated using the total return of the underlying investments. Please see www.rivernorth.com for more information. |
The RiverNorth CEF Index is an index only and cannot be invested in directly.
Performance data quoted represents past performance, which is not a guarantee of future results. Current performance may be lower or higher than the performance quoted. The principal value and investment return of an investment will fluctuate so that your shares, when redeemed, may be worth more or less than their original cost. You can obtain performance data current to the most recent month end by calling (888) 848-7569 or www.rivernorthfunds.com. Total return measures net investment income and capital gain or loss from portfolio investments. All performance shown assumes reinvestment of dividends and capital gains distributions.
The RiverNorth Core Opportunity Fund’s Total Annual Fund Operating Expenses as disclosed in the prospectus is 2.32%. The Fund’s adviser has contractually agreed to waive management fees and/or reimburse expenses (excluding brokerage fees and commissions; borrowing costs such as (a) interest and (b) dividends on securities sold short; taxes; indirect expenses incurred by the underlying funds in which the Fund invests and extraordinary expenses) of the Fund until at least January 31, 2013 in order to maintain the Total Annual Fund Operating Expenses After Fee Waiver and/or Reimbursement at or below 1.60%. As reported in the Financial Highlights section of this Report, for the fiscal year ended September 30, 2012 the ratio of expenses to average net assets excluding fee waivers and reimbursements was 1.36%.
What contributing factors were responsible for the RiverNorth Core Opportunity Fund’s relative performance during the period?
With respect to the equity portion of the portfolio, the Fund’s allocation to international equities (in both developed and emerging markets) detracted from the Fund’s relative performance. The MSCI All Country World Index* was up 20.98% over the past twelve months; whereas the S&P 500 Index was up 30.20%. We remain committed to our international equity allocation based on the attractive discounts of global equity funds and the favorable valuation ratios on developed and emerging market indices. Overall the equity portfolio did benefit from discount narrowing in 2012.
| | |
4 | | (888) 848-7569 | www.rivernorthfunds.com |
| | |
RiverNorth Funds | | Shareholder Letter |
| | September 30, 2012 (Unaudited |
Our preference for the credit-related sectors of the bond market contributed to the outperformance of the Fund’s fixed income portfolio relative to the Barclays Capital U.S. Aggregate Bond Index*, which returned 5.12% over the last 12 months. Yields on high quality bonds (i.e. U.S. Treasury bonds and agency mortgage-backed securities) are no longer keeping pace with inflation. We believe bank loans and high yield bonds offer more attractive yields and are fundamentally compelling.
Our closed-end bond funds performed exceptionally well during the latest fiscal year. Two of the best performing funds were those formerly known as the Nuveen Multi-Strategy Income & Growth Funds I and II. In November 2011, these multi-strategy funds received shareholder approval to reposition the portfolios as single-strategy funds. Closed-end fund investors generally prefer funds that fit neatly into one investment category or style box and therefore single-strategy funds often trade narrower. Fund I converted into a preferred stock fund and Fund II converted into a bank loan fund. We owned both funds and had allocated about 5% of the portfolio to this idea. Over the past twelve months the discounts on both funds have narrowed roughly 1,000 basis points. We had similar success with the BlackRock Credit Allocation Funds II, III and IV. These funds were formerly preferred stock funds that had incurred steep losses during the credit crisis. BlackRock repositioned the portfolios in 2010 and the funds now focus on corporate bonds (investment grade and high yield). Over the past twelve months the discounts on these three funds narrowed roughly 800 basis points.
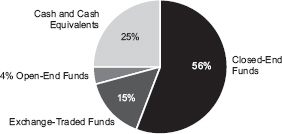
We also generated excess returns (“alpha”) for our shareholders by tactically managing the Fund’s closed-end fund exposure. From September 30, 2011 to December 31, 2011 we increased the Fund’s closed-end fund exposure from 59% to 70% of assets. We became more aggressive in response to discount volatility in October/November 2011. The trading opportunity was short-lived but the volatility enabled us to increase our exposure at very attractive discount levels. Closed-end funds went on to rally in 2012 and we sold down our positions into strength. The Fund’s current closed-end fund exposure is 56%.
What was the closed-end fund environment like for the past twelve months and current outlook?
The trailing twelve-month average discount on the RiverNorth CEF Index was 2.30% on September 30, 2012. To put this figure into perspective, the comparable averages for fiscal years 2011 and 2010 were 2.81% and 2.65%, respectively.
The range of the average discount over the past twelve months was 0.58% to 6.01%. While the discount range was fairly wide the mean-reversion trading opportunities for the Fund were limited. There were only seven trading days in the past twelve months when the average discount on the RiverNorth CEF Index closed wider than its five-year average of 4.28%. Despite multiple periods of capital markets volatility in the recent past, the closed-end fund market has simply not experienced long-lasting and broad-based discount volatility since 2009. We believe discount volatility is restrained because – 1) investors have become acclimated to the tumultuous macro-environment and 2) investors are hungry for yield and closed-end funds can offer compelling distribution rates. In other words, the absence of fear and the prevalence of greed have kept discounts relatively stable and narrow.
Though we would have preferred more discount volatility over the past twelve months, the environment was certainly favorable to long-term closed-end fund investors. Taxable bond funds were investor favorites. The average premium on the roughly 180 taxable bond funds was 3.04% on September 30, 2012; an increase of over 500 basis points in the past year. As previously mentioned, our taxable bond funds were significant contributors to the Fund’s recent outperformance. Equity funds (including general equity, covered call and hybrid funds) also
| | |
Annual Report | September 30, 2012 | | 5 |
| | |
RiverNorth Funds | | Shareholder Letter |
| | September 30, 2012 (Unaudited) |
narrowed during the reporting period. However these discounts remain wide by historical standards. The Fund’s largest equity fund positions are still trading at double-digit discounts.
Looking forward, we anticipate a slow and steady rotation out of taxable bond funds and into equity funds with attractive distribution policies. With bond yields near historic lows and bond fund premiums near historic highs, the risk of buying over-priced bonds through an over-priced investment vehicle should begin to dissuade knowledgeable investors from pushing premiums much higher. The diminished total return prospects for the bond market and the recent gains in the stock market may cause investors to warm up to equity closed-end funds. The wide discounts on these equity funds can offer investors an attractive opportunity as they wade into the equity market.
Future discount volatility should be highly correlated with U.S. interest rates. Discount volatility may intensify if/when the economy gains momentum and interest rates begin to rise. Closed-end fund investors typically over-react when the Federal Reserve’s monetary policy is in a tightening mode. Although the Federal Reserve has announced its intention to keep short-term interest rates low through at least mid-2015, we believe discount volatility on bond funds will increase when long-term interest rates begin to rise.
How was the RiverNorth Core Opportunity Fund positioned at the end of September 2012?
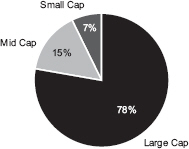
We have allocated 60% of the portfolio to equities, 15% to fixed income, 7% to hybrid securities (primarily preferred stocks and convertible bonds) and 29% to cash. The allocations exceed 100% because some of the closed-end funds we own utilize leverage.
Our equity allocation is neutral; though the equity beta is less than 1.0 (relative to the S&P 500). Beta reflects the sensitivity of a fund’s return to fluctuations in the market index. We are 60% invested in equities with roughly 73% domestic and 27% international exposure. The equity portfolio includes a large allocation to covered-call funds with exposure to domestic and foreign large cap stocks. These funds sell call options against their underlying positions to generate additional income. Therefore covered-call funds are often expected to outperform a purely passive stock index strategy in bear markets and underperform a purely passive stock index in bull markets.
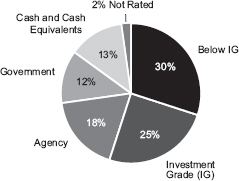
Our fixed income portfolio is quite different from the Barclays Capital U.S. Aggregate Bond Index. The Fund has minimal exposure to U.S. Treasury bonds and agency mortgage-backed securities (MBS). We favor cash and corporate credit to high quality bonds with paltry yields. Our fixed income allocation of 15% (excluding cash) contains mostly leveraged loans, high yield bonds, investment grade bonds and non-agency MBS. The Fund continues to maintain a large cash position for three reasons – 1) cash as a substitute for high quality bonds, 2) cash to counterbalance the leverage from some of our closed-end fund positions and 3) cash as dry-powder for closed-end fund trading opportunities.
The Fund’s current allocation to closed-end funds is 56% of assets. Most of our closed-end fund exposure comes from traditional equity and covered-call funds. We believe these funds should generate alpha for our shareholders if/when Main Street investors return to the equity market.
*The MSCI All Country World Index is a market capitalization weighted index designed to provide a broad measure of equity-market performance throughout the world. It is maintained by Morgan Stanley Capital International, and is comprised of stocks from both developed and emerging markets. The Barclays Capital U.S. Aggregate Bond Index is a benchmark index composed of U.S. securities in Treasury, Government-Related, Corporate, and Securitized sectors. It includes securities that are of investment-grade quality or better, have at least one year to maturity, and have an outstanding par value of at least $250 million. You cannot invest directly in an index.
| | |
| | |
6 | | (888) 848-7569 | www.rivernorthfunds.com |
| | |
RiverNorth Funds | | Shareholder Letter |
| | September 30, 2012 (Unaudited) |
The charts below further highlight our positioning:
Investment Vehicle Allocation(1) (percentages are based on net assets)
Asset Class Allocation(1) (percentages are based on net assets)
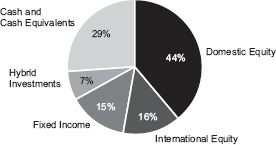
The allocation does not add up to 100% as it reflects the leverage utilized by the underlying funds.
Equity Capitalization Allocation(1) (percentages are based on net assets)
| | |
| | |
Annual Report | September 30, 2012 | | 7 |
| | |
RiverNorth Funds | | Shareholder Letter |
| | September 30, 2012 (Unaudited) |
Fixed Income Allocation(1) (percentages are based on net assets)
| (1) | Convertible Security Risk – the market value of convertible securities adjust with interest rates and the value of the underlying stock. Exchange Traded Note Risk – exchange traded notes represent unsecured debt of the issuer and may be influenced by interest rates, credit ratings of the issuer or changes in value of the reference index. Fixed Income Risk – the market value of fixed income securities adjust with interest rates and are subject to issuer default. Foreign/Emerging Market Risk – foreign securities may be subject to inefficient or volatile markets, different regulatory regimes or different tax policies. These risks may be enhanced in emerging markets. Management Risk – there is no guarantee that the adviser’s or subadviser’s investment decisions will produce the desired results. Market Risk – economic conditions, interest rates and political events may affect the securities markets. Portfolio Turnover Risk – increased portfolio turnover results in higher brokerage expenses and may impact the tax status of distributions. REIT Risk – the value of REITs change with the value of the underlying properties and changes in interest rates and are subject to additional fees. Short Sale Risk – short positions are speculative, are subject to transaction costs and are riskier than long positions in securities. Small-Cap Risk – small-cap companies are more susceptible to failure, are often thinly traded and have more volatile stock prices. Structured Notes Risk – because of the imbedded derivative feature, structured notes are subject to more risk than investing in a simple note or bond. Swap Risk – swap agreements are subject to counterparty default risk and may not perform as intended. Underlying Fund Risk – underlying funds have additional fees, may utilize leverage, may not correlate to an intended index and may trade at a discount to their net asset values. |
Portfolio detail statistics are estimates made by the Adviser and are subject to change.
Information regarding closed-end fund premiums and discounts provided by Morningstar.
| | |
8 | | (888) 848-7569 | www.rivernorthfunds.com |
| | |
RiverNorth Funds | | Shareholder Letter |
| | September 30, 2012 (Unaudited) |
RiverNorth/Doubleline Strategic Income Fund
Portfolio Management Commentary – Patrick Galley, CFA, Stephen O’Neill, CFA and Jeffrey Gundlach
What is the Fund’s investment strategy?
The RiverNorth/DoubleLine Strategic Income Fund (RNSIX and RNDLX; the “Fund”) invests in a broad range of fixed income securities of U.S. and foreign issuers including closed-end funds.
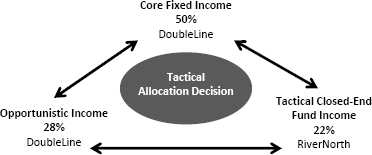
Assets of the Fund are tactically managed across three distinct fixed income strategies (or sleeves). RiverNorth Capital Management oversees the sleeve allocation and manages the Tactical Closed-end Fund Income Strategy. This strategy is designed to provide diversified exposure to the fixed income market through opportunistic investments in closed-end funds. Jeffrey Gundlach, Chief Investment Officer at DoubleLine Capital, oversees the Opportunistic Income and Core Fixed Income Strategies. The Opportunistic Income Strategy has a flexible mandate and is managed without duration constraints. The Core Fixed-Income Strategy, the most traditional of the three fixed income sleeves, incorporates an active asset allocation approach within the diverse fixed income universe in an effort to mitigate risk and achieve superior risk-adjusted returns.
How did the RiverNorth/DoubleLine Strategic Income Fund perform relative to its benchmark during the reporting period?
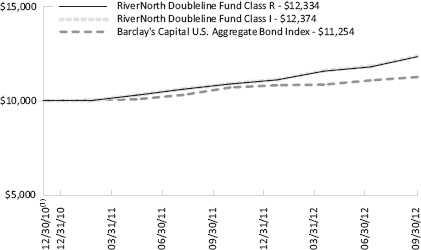
For the twelve months ended September 30, 2012, the Class I shares of the RiverNorth/DoubleLine Strategic Income Fund returned 13.56%. The Fund’s Class R shares returned 13.28% for the period. The Barclays Capital U.S. Aggregate Bond Index returned 5.16%, during the same period.
Comparison of a $10,000 Investment in the RiverNorth/Doubleline Strategic Income Fund and the Barclay’s Capital U.S. Aggregate Bond Index
| | |
Annual Report | September 30, 2012 | | 9 |
| | |
RiverNorth Funds | | Shareholder Letter |
| | September 30, 2012 (Unaudited) |
Average Annual Total Returns for Periods Ending September 30, 2012
| | | | |
| | | 1 - Year | | Since Inception(1) |
RiverNorth/Doubleline Strategic Income Fund – Class I (RNSIX) | | 13.56% | | 12.94% |
RiverNorth/Doubleline Strategic Income Fund – Class R (RNDLX) | | 13.28% | | 12.73% |
Barclays Capital U.S. Aggregate Bond Index(2) | | 5.16% | | 6.98% |
| (1) | Inception date is December 30, 2010. |
| (2) | The Barclay’s Capital U.S. Aggregate Bond Index is a benchmark index composed of U.S. securities in Treasury, Government-Related, Corporate, and Securitized sectors. It includes securities that are of investment-grade quality or better, have at least one year to maturity, and have an outstanding par value of at least $250 million. This unmanaged index does not reflect fees and expenses. The index cannot be invested in directly. |
Performance data quoted represents past performance, which is not a guarantee of future results. Current performance may be lower or higher than the performance quoted. The principal value and investment return of an investment will fluctuate so that your shares, when redeemed, may be worth more or less than their original cost. You can obtain performance data current to the most recent month end by calling (888) 848-7569 or www.rivernorthfunds.com. Total return measures net investment income and capital gain or loss from portfolio investments. All performance shown assumes reinvestment of dividends and capital gains distributions.
The RiverNorth/DoubleLine Strategic Income Fund’s Total Annual Operating Expense as disclosed in the prospectus is 1.23% for Class I Shares and 1.48% for Class R Shares. The Fund’s adviser has contractually agreed to waive management fees and/or reimburse expenses (excluding brokerage fees and commissions; borrowing costs such as (a) interest and (b) dividends on securities sold short; taxes; indirect expenses incurred by the underlying funds in (b) which the Fund invests and extraordinary expenses) of the Fund until at least January 31, 2013 in order to (c) maintain the Total Annual Fund Operating Expenses After Fee Waiver and/or Reimbursement at or below 0.95% and 1.20% for the Class I shares and Class R shares, respectively. As reported in the Financial Highlights section of this Report, for the fiscal year ended September 30, 2012 the ratio of expenses to average net assets excluding fee waivers and reimbursements for the Class I shares and Class R shares was 0.90% and 1.15%, respectively, including fee waivers and reimbursements it was 0.90% and 1.15%, respectively.
What contributing factors were responsible for the RiverNorth/DoubleLine Strategic Income Fund’s relative performance during the period?
RiverNorth Tactical Closed-End Fund Income Sleeve:
The RiverNorth sleeve benefited from the general discount narrowing on taxable bond funds. The focus on credit-related sectors of the bond market also contributed to the sleeve’s outperformance relative to the Barclays Capital U.S. Aggregate Bond Index.
DoubleLine Opportunistic Income Sleeve:
The non-agency mortgage-backed securities (MBS) sector saw a significant rally over the latter half of the fiscal year across the credit spectrum. Specifically, higher credit quality bonds, such as Prime and Alt-A securities, were the best performing benefiting from relatively high price appreciation and strong interest returns. Alt-A is a classification of mortgages where the risk profile falls between prime and subprime. Longer duration agency collateralized mortgage obligations (CMOs),
| | |
10 | | (888) 848-7569 | www.rivernorthfunds.com |
| | |
RiverNorth Funds | | Shareholder Letter |
| | September 30, 2012 (Unaudited) |
such as inverse floating-rate bonds, continue to experience strong interest income and price gains which more than offset prepayments over the period.
DoubleLine Core Fixed Income Sleeve:
Risk assets have seen a significant rally over the latter half of the year with both emerging market debt and non-agency MBS, boosting most of the performance over the period. Investment grade corporate bonds performed well versus the index while U.S. government debt was relatively flat.
What was the closed-end fund environment like for the past twelve months and current outlook?
Near zero percent policy rates and a series of quantitative easing programs have forced savers to reach for yield in the taxable bond market. Many investors have discovered closed-end bond funds in their search for attractive yield. Closed-end bond funds generally use leverage (about 30%) and therefore their distribution yields are often higher than those on open-end mutual funds and exchange-traded funds with similar investment strategies. The average closed-end fund distribution rate is currently 7.08%. The yield advantage has enticed investors into paying premiums for these bond funds. The average premium on the roughly 180 taxable bond funds was 3.04% on September 30, 2012; an increase of over 500 basis points in the past year.
We have responded by reducing the Fund’s allocation to closed-end funds. We have been selling our best performing funds into strength. The closed-end fund portfolio has become more concentrated in our best ideas. The top ten closed-end fund positions now account for over 50% of the closed-end fund portfolio. We remain bullish on our core positions and are comfortable with the weighted average discount on the portfolio, which is approximately 5%.
In our opinion, bond fund discounts will remain narrow by historical standards so long as interest rates remain low. We believe the current environment is ideal for leveraged bond funds. These funds borrow at rock-bottom short-term rates and investors pocket the spread between the interest income from the bonds and the interest expense on the debt. Although a fundamental case could be made for owning many bond funds at premium valuations, we adhere to Warren Buffett’s advice of being fearful when others are greedy and greedy when others are fearful.
What was the fixed income environment like for the past twelve months and current outlook?
For the past twelve months, U.S. Treasury rates fell with the curve flattening even further; 2-year rates were down 1 basis point on the year with the 10-year down 28 basis points to end the period at 1.63%. The riskier assets in the fixed income market outperformed over the period with emerging markets fixed income leading the way. Corporate securities and non-agency MBS also had significant outperformance over the time period. Treasuries and agency MBS returns trailed over the period given these sectors have little credit risk.
Looking forward, the key headwinds facing global markets will continue to be the European banking/debt crisis, U.S. elections/fiscal cliff and slowing Chinese growth. Despite the fact that liquidity provided by the European Central Bank (ECB), U.S. and other central banks around the world have been market supportive over the past 4 months, these issues have not been resolved and will likely weigh on global growth through the end of 2012 and into 2013. The ECB’s European Support Mechanism (ESM) and SMP 2.0 program now known as outright monetary transactions or OMTs have yet to be tested as ECB President Draghi has been successful in talking down yields in the European periphery without putting “any skin in the game”. Greek and Spanish governments still face uphill battles to find ever deeper austerity adjustments to cover increasing fiscal shortfalls as growth targets continue to be missed, and to convince coalition partners and citizens to continue forward with increasingly burdensome austerity measures. Not to be underestimated,
| | |
Annual Report | September 30, 2012 | | 11 |
| | |
RiverNorth Funds | | Shareholder Letter |
| | September 30, 2012 (Unaudited) |
“bail-out fatigue’ from Germany, Finland, Netherlands and other core European countries could escalate as the bailout costs for periphery Europe rises. Over the longer term, the eurozone’s creation of a banking union and advance toward full fiscal union should continue to proceed, albeit at a start-and stop pace.
A U.S. policy response to the fiscal crisis is not expected until after the November presidential election, or around the time the expiration of numerous tax cuts and the implementation of automatic spending cuts begin at year-end. Lastly, Chinese officials are likely to continue to provide just enough stimuli to maintain growth and avoid a hard landing, without showing any real new growth programs ahead of its leadership changes starting in October/November 2012 and ending in March 2013 with the change in Presidency and Premiership at the National People’s Congress. Another risk that remains on DoubleLine’s radar screen is the growing geopolitical tensions between Israel and Iran.
How was the RiverNorth/DoubleLine Strategic Income Fund positioned at the end of September 2012?
Strategy (“Sleeve”) Allocation
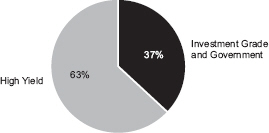
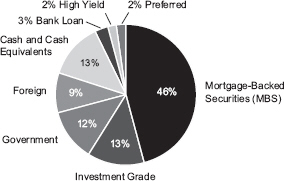
Credit Quality Distribution(1) (percentages are based on net assets)
| | |
| | |
12 | | (888) 848-7569 | www.rivernorthfunds.com |
| | |
RiverNorth Funds | | Shareholder Letter |
| | September 30, 2012 (Unaudited) |
Sector Breakdown(1) (percentages are based on net assets)
| (1) | Asset-Backed Security Risk – the risk that the value of the underlying assets will impair the value of the security. Borrowing Risk – borrowings increase fund expenses and are subject to repayment, possibly at inopportune times. Convertible Security Risk – the market value of convertible securities adjust with interest rates and the value of the underlying stock. Defaulted Securities Risk – defaulted securities carry the risk of uncertainty of repayment. Derivatives Risk – derivatives are subject to counterparty risk. Exchange Traded Note Risk –exchange traded notes represent unsecured debt of the issuer and may be influenced by interest rates, credit ratings of the issuer or changes in value of the reference index. Fixed Income Risk – the market value of fixed income securities adjust with interest rates and are subject to issuer default. Foreign/Emerging Market Risk – foreign securities may be subject to inefficient or volatile markets, different regulatory regimes or different tax policies. These risks may be enhanced in emerging markets. Liquidity Risk – illiquid investments may be difficult or impossible to sell. Management Risk – there is no guarantee that the adviser’s subadviser’s investment decisions will produce the desired results. Market Risk – economic conditions, interest rates and political events may affect the securities markets. Mortgage-Backed Security Risk – mortgage backed securities are subject to credit risk, pre-payment risk and devaluation of the underlying collateral. Portfolio Turnover Risk – increased portfolio turnover results in higher brokerage expenses and may impact the tax status of distributions. Rating Agency Risk – rating agencies may change their ratings or ratings may not accurately reflect a debt issuer’s creditworthiness. REIT Risk – the value of REITs change with the value of the underlying properties and changes in interest rates and are subject to additional fees. Structured Notes Risk – because of the imbedded derivative feature, structured notes are subject to more risk than investing in a simple note or bond. Swap Risk – swap agreements are subject to counterparty default risk and may not perform as intended. Underlying Fund Risk – underlying funds have additional fees, may utilize leverage, may not correlate to an intended index and may trade at a discount to their net asset values. |
Portfolio detail statistics are estimates made by the Adviser and are subject to change.
Information regarding closed-end fund premiums and discounts provided by Morningstar.
| | |
Annual Report | September 30, 2012 | | 13 |
| | |
RiverNorth Funds | | Shareholder Letter |
| | September 30, 2012 (Unaudited) |
RiverNorth/Manning & Napier Dividend Income Fund
Portfolio Management Commentary –Patrick Galley, CFA, Stephen O’Neill, CFA and Manning & Napier (team-based)
What is the Fund’s investment strategy?
The RiverNorth/Manning & Napier Dividend Income Fund (RNDIX and RNDLX; the “Fund”) invests in a broad range of dividend paying equity securities including closed-end funds. Please refer to the preceding Letter from the President for additional information about the Fund’s investment strategy.
How did the RiverNorth/Manning & Napier Dividend Income Fund perform relative to its benchmark during the reporting period?
Since inception (July 18, 2012) through September 30, 2012, the Fund returned 4.44% (RNDIX) and 4.46% (RNMNX). The Russell 1000 Value Index returned 5.73%, during the same period.
Cumulative Total Returns for the Period Ending September 30, 2012
| | |
| | | Since Inception(1) |
RiverNorth/Manning & Napier Dividend Income Fund – Class I (RNDIX) | | 4.44% |
RiverNorth/Manning & Napier Dividend Income Fund – Class R (RNMNX) | | 4.46% |
Russell 1000 Value Index(2) | | 5.73% |
| (1) | Inception date is July 18, 2012. Since Inception return is cumulative, not annualized. |
| (2) | The Russell 1000 Value Index measures the performance of the large-cap value segment of the U.S. equity universe. It includes those Russell 1000 Index companies with lower price-to-book ratios and lower expected growth values. The index cannot be invested in directly and does not reflect fees and expenses. |
Performance data quoted represents past performance, which is not a guarantee of future results. Current performance may be lower or higher than the performance quoted. The principal value and investment return of an investment will fluctuate so that your shares, when redeemed, may be worth more or less than their original cost. You can obtain performance data current to the most recent month end by calling (888) 848-7569 or www.rivernorthfunds.com. Total return measures net investment income and capital gain or loss from portfolio investments. All performance shown assumes reinvestment of dividends and capital gains distributions.
The RiverNorth/Manning & Napier Dividend Income Fund’s Total Annual Operating Expense as disclosed in the prospectus is 1.66% for Class I Shares and 1.91% for Class R Shares. The Fund’s adviser has contractually agreed to waive management fees and/or reimburse expenses (excluding brokerage fees and commissions; borrowing costs such as (a) interest and (b) dividends on securities sold short; taxes; indirect expenses incurred by the underlying funds in which the Fund invests and extraordinary expenses) of the Fund until at least January 31, 2014 in order to maintain the Total Annual Fund Operating Expenses After Fee Waiver and/or Reimbursement at or below 1.35% and 1.60% for the Class I shares and Class R shares, respectively. As reported in the Financial Highlights section of this Report, for the period July 18, 2012 (inception) to September 30, 2012 the ratio of expenses to average net assets excluding fee waivers and reimbursements for the Class I shares and Class R shares was 6.16% and 6.21%, respectively, including fee waivers and reimbursements it was 1.35% and 1.60%, respectively.
| | |
| | |
14 | | (888) 848-7569 | www.rivernorthfunds.com |
| | |
RiverNorth Funds | | Shareholder Letter |
| | September 30, 2012 (Unaudited) |
How was the RiverNorth/Manning & Napier Dividend Income Fund positioned at the end of September 2012?
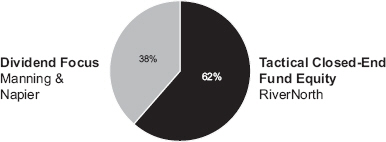
The Fund is young and we are in the process of ramping up the portfolio. The current allocation between strategies is 62% Tactical Closed-end Fund Equity and 38% Dividend Focus. For now the RiverNorth allocation includes a large exchange-traded funds (ETF) position that gives the Fund exposure to the Russell 1000 Value Index. As the Fund grows, this exposure should be reduced.
We are excited about the opportunity to own equity closed-end funds at historically wide discounts. Roughly 23% of the Fund is invested in covered-call funds managed by Eaton Vance; six funds in total with an average discount of 13%. Each fund was trading at a premium as recently as 2010. The discounts came about following a series of distribution cuts, the latest of which occurred in the first half of 2012. Investors have been fearful of additional distribution cuts and consequently the Eaton Vance covered-call funds have been amongst the widest of all closed-end funds. On October 5th, 2012, Eaton Vance announced a share-repurchase program for their covered-call funds and made clear that the firm has no current plans to alter future distributions. We believe the discounts on these covered-call funds should narrow with time. Additionally, we are finding value in general equity funds that may be susceptible to shareholder activism. Funds that trade at chronic discounts attract institutional investors that push for shareholder-friendly corporate actions (i.e. dividend increases and tender-offers).
In our opinion, equity funds present the best trading opportunities in the closed-end fund market. We look forward to fully deploying the Fund’s capital in today’s target rich environment.
The Charts below further highlight our positioning:
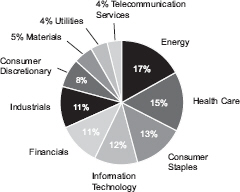
Sector Breakdown(1) (percentages are based on net assets)
| | |
Annual Report | September 30, 2012 | | 15 |
| | |
| RiverNorth Funds | | Shareholder Letter |
| | September 30, 2012 (Unaudited) |
Sleeve Weights(1) (percentages are based on net assets)
| (1) | Convertible Security Risk – the market value of convertible securities adjust with interest rates and the value of the underlying stock. Currency Risk – foreign currencies will rise or decline relative to the U.S. dollar. Equity Risk – the value of equity securities change frequently. Fixed Income Risk – the market value of fixed income securities adjust with interest rates and are subject to issuer default. Foreign/Emerging Market Risk – foreign securities may be subject to inefficient or volatile markets, different regulatory regimes or different tax policies. These risks may be enhanced in emerging markets. Investment Style Risk – investment strategies may come in and out of favor with investors and may underperform or outperform at times. Mid-Cap Risk – mid-cap companies may be more susceptible to adverse business or economic events than large-cap companies. Management Risk – there is no guarantee that the adviser’s subadviser’s investment decisions will produce the desired results. Market Risk – economic conditions, interest rates and political events may affect the securities markets. Portfolio Turnover Risk – increased portfolio turnover results in higher brokerage expenses and may impact the tax status of distributions. Preferred Stock Risk – preferred stocks generally pay dividends, but may be less liquid than common stocks, have less priority than debt instruments and may be subject to redemption by the issuer. Small-Cap Risk – small-cap companies are more susceptible to failure, are often thinly traded and have more volatile stock prices. Swap Risk – swap agreements are subject to counterparty default risk and may not perform as intended. Underlying Fund Risk – underlying funds have additional fees, may utilize leverage, may not correlate to an intended index and may trade at a discount to their net asset values. |
Portfolio detail statistics are estimates made by the Adviser and are subject to change.
| | |
16 | | (888) 848-7569 | www.rivernorthfunds.com |
| | |
RiverNorth Funds | | Disclosure of Fund Expenses |
| | September 30, 2012 (Unaudited) |
Expense Example
As a shareholder of the RiverNorth Funds, you incur two types of costs: (1) transaction costs (such as the 2% fee on redemption of Fund shares made within 90 days of purchase); and (2) ongoing costs, including management fees, distribution and service (12b-1) fees and other Fund expenses. This example is intended to help you understand your ongoing costs (in dollars) of investing in the Funds and to compare these costs with the ongoing costs of investing in other mutual funds. The Example is based on an investment of $1,000 invested at the beginning of the period, April 1, 2012 and held for the six months ended September 30, 2012.
Actual Expenses
The first line of the table below provides information about actual account values and actual expenses. You may use the information in this line, together with the amount you invested, to estimate the expenses that you paid over the period. Simply divide your account value by $1,000 (for example, an $8,600 account value divided by $1,000 = 8.6), then multiply the result by the number in the first line under the heading entitled “Expenses Paid During Period” to estimate the expenses you paid on your account during this period.
Hypothetical Example for Comparison Purposes
The second line of the table below provides information about hypothetical account values and hypothetical expenses based on each Fund’s actual expense ratio and an assumed rate of return of 5% per year before expenses, which is not each Fund’s actual return. The hypothetical account values and expenses may not be used to estimate the actual ending account balance or expenses you paid for the period. You may use this information to compare the ongoing costs of investing in each Fund and other funds. To do so, compare these 5% hypothetical examples with the 5% hypothetical examples that appear in the shareholder reports of other funds.
Please note that the expenses shown in the table below are meant to highlight your ongoing costs only and do not reflect any transactional costs, such as redemption fees. Therefore, the second line for each share class of each Fund within the table is useful in comparing ongoing costs only, and will not help you determine the relative total costs of owning different funds. If these transactional costs were included, your costs would have been higher.
| | |
Annual Report | September 30, 2012 | | 17 |
| | |
RiverNorth Funds | | Disclosure of Fund Expenses |
| | September 30, 2012 (Unaudited) |
| | | | | | | | |
| | | Beginning
Account Value
04/01/2012 | | Ending
Account Value
09/30/2012 | | Expense
Ratio(a) | | Expenses Paid During Period(b) |
RiverNorth Core Opportunity Fund | | | | | | | | |
Actual | | $1,000.00 | | $1,032.60 | | 1.30% | | $6.61 |
Hypothetical (5% return before expenses) | | $1,000.00 | | $1,018.50 | | 1.30% | | $6.56 |
| | | | |
RiverNorth/DoubleLine Strategic Income Fund | | | | | | | | |
Class R Shares | | | | | | | | |
Actual | | $1,000.00 | | $1,066.50 | | 1.14% | | $5.89 |
Hypothetical (5% return before expenses) | | $1,000.00 | | $1,019.30 | | 1.14% | | $5.76 |
| | | | |
Class I Shares | | | | | | | | |
Actual | | $1,000.00 | | $1,067.90 | | 0.89% | | $4.60 |
Hypothetical (5% return before expenses) | | $1,000.00 | | $1,020.55 | | 0.89% | | $4.50 |
| | | | |
RiverNorth/Manning & Napier Dividend Income Fund(c) | | | | | | | | |
Class R Shares | | | | | | | | |
Actual | | $1,000.00 | | $1,044.60 | | 1.60% | | $3.31 |
Hypothetical (5% return before expenses) | | $1,000.00 | | $1,017.00 | | 1.60% | | $8.07 |
| | | | |
Class I Shares | | | | | | | | |
Actual | | $1,000.00 | | $1,044.40 | | 1.35% | | $2.79 |
Hypothetical (5% return before expenses) | | $1,000.00 | | $1,018.25 | | 1.35% | | $6.81 |
| (a) | Annualized, based on the Fund’s most recent fiscal half-year expenses. |
| (b) | Expenses are equal to the Fund’s annualized ratio multiplied by the average account value over the period, multiplied by the number of days in the most recent fiscal half year (183), then divided by 366. Note this expense example is typically based on a six-month period. |
| (c) | Note the Actual Expense Paid During the Period is based on since inception of the Share Class on July 18, 2012. |
| | |
18 | | (888) 848-7569 | www.rivernorthfunds.com |
| | |
| RiverNorth Core Opportunity Fund | | Schedule of Investments |
| | September 30, 2012 |
| | | | | | |
| Shares/Description | | Fair Value | |
CLOSED-END FUNDS - 55.75% | | | | |
1,476,089 | | Adams Express Co. | | $ | 16,738,849 | |
136,224 | | ASA Gold and Precious Metals Ltd. | | | 3,432,845 | |
681,996 | | BlackRock Credit Allocation Income Trust II, Inc. | | | 7,870,234 | |
964,545 | | BlackRock Credit Allocation Income Trust IV, Inc. | | | 13,677,248 | |
653,052 | | Boulder Growth & Income Fund, Inc. | | | 4,277,491 | |
272,671 | | Boulder Total Return Fund, Inc.(a) | | | 4,908,078 | |
68,687 | | Calamos Convertible and High Income Fund | | | 869,577 | |
91,400 | | Calamos Global Dynamic Income Fund | | | 780,556 | |
90,000 | | Central Europe and Russia Fund, Inc. | | | 3,005,100 | |
535,437 | | Clough Global Equity Fund | | | 6,907,137 | |
1,524,908 | | Clough Global Opportunities Fund | | | 17,841,424 | |
250 | | DNP Select Income Fund, Inc. | | | 2,465 | |
515,913 | | Eaton Vance Enhanced Equity Income Fund | | | 5,716,316 | |
1,153,841 | | Eaton Vance Risk-Managed Diversified Equity Income Fund | | | 12,149,946 | |
129,076 | | Eaton Vance Tax-Advantaged Global Dividend Opportunities Fund | | | 2,553,123 | |
680,231 | | Eaton Vance Tax-Managed Buy-Write Opportunities Fund | | | 8,849,805 | |
1,542,710 | | Eaton Vance Tax-Managed Diversified Equity Income Fund | | | 14,671,172 | |
1,794,249 | | Eaton Vance Tax-Managed Global Buy-Write Opportunities Fund | | | 19,916,164 | |
3,458,853 | | Eaton Vance Tax-Managed Global Diversified Equity Income Fund | | | 30,472,495 | |
462,315 | | Gabelli Dividend & Income Trust | | | 7,836,239 | |
408,250 | | General American Investors Co., Inc. | | | 11,863,745 | |
4,711,791 | | Liberty All Star® Equity Fund | | | 22,757,951 | |
473,714 | | Macquarie Global Infrastructure Total Return Fund, Inc. | | | 9,071,623 | |
1,782,824 | | Nuveen Credit Strategies Income Fund | | | 17,329,049 | |
44,739 | | Nuveen Energy MLP Total Return Fund | | | 843,330 | |
4,413 | | Nuveen Preferred Income Opportunities Fund | | | 43,512 | |
266,792 | | PIMCO Income Strategy Fund II | | | 3,046,765 | |
494,019 | | Royce Focus Trust, Inc. | | | 3,319,808 | |
1,717,633 | | Royce Value Trust, Inc. | | | 22,449,463 | |
718,998 | | TCW Strategic Income Fund, Inc. | | | 4,105,479 | |
120,142 | | Templeton Emerging Markets Fund | | | 2,213,016 | |
151,568 | | The Greater China Fund, Inc. | | | 1,727,875 | |
65,900 | | The New Germany Fund, Inc. | | | 958,792 | |
386,402 | | The Thai Fund, Inc. | | | 6,789,083 | |
1,022,496 | | Tri-Continental Corp. | | | 16,584,885 | |
933,097 | | Zweig Total Return Fund, Inc. | | | 11,813,008 | |
| | | | | | |
| |
TOTAL CLOSED-END FUNDS | | | | |
(Cost $268,396,402) | | | 317,393,648 | |
| | | | | | |
| |
MUTUAL FUNDS - 3.84% | | | | |
533,820 | | Calamos Convertible Fund - Class A | | | 9,571,400 | |
| | |
See Notes to Financial Statements. | | |
Annual Report | September 30, 2012 | | 19 |
| | |
| RiverNorth Core Opportunity Fund | | Schedule of Investments |
| | September 30, 2012 |
| | | | | | |
| Shares/Description | | Fair Value | |
1,111,161 | | Eaton Vance Floating-Rate Advantaged Fund | | $ | 12,267,214 | |
| | | | | | |
| |
TOTAL MUTUAL FUNDS (Cost $15,430,785) | | | 21,838,614 | |
| | | | | | |
| |
EXCHANGE-TRADED FUNDS - 14.81% | | | | |
88,563 | | Guggenheim Russell Top 50 Mega Cap ETF | | | 9,493,953 | |
176,839 | | iShares® MSCI Emerging Markets Index Fund | | | 7,307,872 | |
447,980 | | iShares® S&P 100® Index Fund | | | 29,772,751 | |
334,568 | | Powershares FTSE RAFI US 1000 Portfolio | | | 20,589,315 | |
111,000 | | SPDR® Barclays Capital Convertible Securities ETF | | | 4,393,380 | |
100,000 | | Vanguard® MSCI EAFE ETF | | | 3,288,000 | |
153,000 | | Vanguard® MSCI Emerging Markets ETF | | | 6,383,160 | |
58,957 | | WisdomTree Emerging Markets Local Debt Fund | | | 3,084,041 | |
| | | | | | |
| |
TOTAL EXCHANGE-TRADED FUNDS (Cost $71,367,614) | | | 84,312,472 | |
| | | | | | |
| |
HOLDING & INVESTMENT MANAGEMENT COMPANIES - 0.26% | | | | |
12,100 | | Affiliated Managers Group, Inc.(a) | | | 1,488,300 | |
| | | | | | |
| |
TOTAL HOLDING & INVESTMENT MANAGEMENT COMPANIES (Cost $634,253) | | | 1,488,300 | |
| | | | | | |
| |
PREFERRED STOCKS - 0.70% | | | | |
64,103 | | General American Investors Co., Inc., Series B, 5.950% | | | 1,667,319 | |
92,500 | | Kayne Anderson MLP Investment Co., Series D, 4.950% | | | 2,344,875 | |
| | | | | | |
| |
TOTAL PREFERRED STOCKS (Cost $3,825,799) | | | 4,012,194 | |
| | | | | | |
| | | | | | |
TOTAL INVESTMENTS - 75.36% (Cost $359,654,853) | | | 429,045,228 | |
CASH - 24.00% | | | 136,665,713 | |
OTHER ASSETS IN EXCESS OF LIABILITIES - 0.63% | | | 3,612,861 | |
| | | | | | |
NET ASSETS - 100.00% | | $ | 569,323,802 | |
| | | | | | |
| (a) | Non-income producing security. |
| | |
See Notes to Financial Statements. | | |
20 | | (888) 848-7569 | www.rivernorthfunds.com |
| | |
RiverNorth Core Opportunity Fund | | Schedule of Investments |
| | September 30, 2012 |
Common Abbreviations:
EAFE - Europe, Australia, and Far East.
FTSE - Financial Times Stock Exchange.
ETF - Exchange Traded Fund.
Ltd. - Limited.
MLP – Master Limited Partnership.
MSCI – Morgan Stanley Capital International.
RAFI - Research Affiliates Fundamental Index.
S&P – Standard & Poor’s.
SPDR – Standard & Poor’s Depository Receipts.
| | |
See Notes to Financial Statements. | | |
Annual Report | September 30, 2012 | | 21 |
| | |
RiverNorth/DoubleLine Strategic Income Fund | | Schedule of Investments |
| | September 30, 2012 |
| | | | | | |
| Shares/Description | | Fair Value | |
CLOSED-END FUNDS - 15.28% | | | | |
255,141 | | Advent Claymore Convertible Securities and Income Fund | | $ | 4,202,172 | |
543,636 | | Advent Claymore Convertible Securities and Income Fund II | | | 3,658,670 | |
398,296 | | Advent Claymore Enhanced Growth & Income Fund | | | 3,839,574 | |
3,035,157 | | AllianceBernstein Income Fund, Inc. | | | 26,223,757 | |
273,671 | | BlackRock Credit Allocation Income Trust I, Inc. | | | 2,909,123 | |
526,495 | | BlackRock Credit Allocation Income Trust II, Inc. | | | 6,075,752 | |
544,912 | | BlackRock Credit Allocation Income Trust III, Inc. | | | 6,598,884 | |
572,279 | | BlackRock Credit Allocation Income Trust IV, Inc. | | | 8,114,916 | |
222,822 | | BlackRock Diversified Income Strategies Fund, Inc. | | | 2,404,249 | |
161,042 | | BlackRock Income Trust, Inc. | | | 1,236,803 | |
418,191 | | Calamos Convertible and High Income Fund | | | 5,294,298 | |
210,828 | | DWS Global High Income Fund, Inc. | | | 1,856,678 | |
35,325 | | Eaton Vance Short Duration Diversified Income Fund | | | 622,427 | |
281,765 | | Federated Enhanced Treasury Income Fund | | | 4,023,604 | |
59,883 | | Global Income & Currency Fund, Inc. | | | 816,205 | |
174,771 | | Helios Strategic Income Fund, Inc. | | | 1,113,361 | |
698,784 | | ING Prime Rate Trust | | | 4,325,473 | |
699,762 | | Invesco Van Kampen Dynamic Credit Opportunities Fund | | | 8,872,982 | |
1,411,009 | | Invesco Van Kampen Senior Income Trust | | | 7,069,155 | |
198,622 | | Legg Mason BW Global Income Opportunities Fund, Inc. | | | 3,944,633 | |
296,684 | | Montgomery Street Income Securities, Inc. | | | 5,037,694 | |
302,231 | | Morgan Stanley Emerging Markets Debt Fund, Inc. | | | 3,641,884 | |
463,451 | | Morgan Stanley Emerging Markets Domestic Debt Fund, Inc. | | | 7,633,038 | |
977,673 | | NexPoint Credit Strategies Fund | | | 6,755,720 | |
182,063 | | Nuveen Build America Bond Opportunity Fund | | | 4,014,489 | |
1,480,229 | | Nuveen Credit Strategies Income Fund | | | 14,387,826 | |
901,356 | | Nuveen Multi-Currency Short-Term Government Income Fund | | | 11,897,899 | |
533,436 | | Nuveen Preferred Income Opportunities Fund | | | 5,259,679 | |
416,772 | | PIMCO Dynamic Income Fund | | | 11,765,487 | |
52,201 | | PIMCO Income Strategy Fund | | | 690,619 | |
195,482 | | PIMCO Income Strategy Fund II | | | 2,232,404 | |
254,406 | | Putnam Master Intermediate Income Trust | | | 1,317,823 | |
350,781 | | The GDL Fund | | | 4,142,724 | |
12,063 | | Virtus Global Multi-Sector Income Fund | | | 230,162 | |
641,431 | | Wells Fargo Advantage Multi-Sector Income Fund | | | 10,461,740 | |
152,398 | | Western Asset Inflation Management Fund, Inc. | | | 2,898,183 | |
510,757 | | Western Asset/Claymore Inflation-Linked Opportunities & Income Fund | | | 6,869,682 | |
86,822 | | Western Asset/Claymore Inflation-Linked Securities & Income Fund | | | 1,152,128 | |
| | | | | | |
| |
TOTAL CLOSED-END FUNDS (Cost $185,601,781) | | | 203,591,897 | |
| | | | | | |
| | |
See Notes to Financial Statements. | | |
22 | | (888) 848-7569 | www.rivernorthfunds.com |
| | |
RiverNorth/DoubleLine Strategic Income Fund | | Schedule of Investments |
| | September 30, 2012 |
| | | | | | | | | | | | |
| Shares /Description | | | | | | | Fair Value | |
PREFERRED STOCKS - 1.44% | | | | | | | | | | |
80,225 | | Apollo Commercial Real Estate Finance, Inc., 8.625% | | | | | | | | $ | 2,053,760 | |
3,909 | | General American Investors Co., Inc., Series B, 5.950% | | | | | | | | | 101,673 | |
383,767 | | Kayne Anderson MLP Investment Co., 4.250% | | | | | | | | | 9,690,117 | |
76,371 | | The GDL Fund, Series B, 7.000%(a) | | | | | | | | | 3,852,917 | |
334,415 | | Tortoise Energy Capital Corp., 3.950% | | | | | | | | | 3,411,033 | |
| | | | | | | | | | | | |
| | | |
TOTAL PREFERRED STOCKS (Cost $19,064,085) | | | | | | | | | 19,109,500 | |
| | | | | | | | | | | | |
| | | |
| Principal Amount/Description | | Rate | | | Maturity | | Fair Value | |
FOREIGN CORPORATE BONDS - 5.88% | | | | | | | | | | |
Australia - 0.25% | | | | | | | | | | |
$2,400,000 | | Australia & New Zealand Banking Group Ltd.(b) | | | 4.88 | % | | 01/12/2021 | | | 2,764,344 | |
555,000 | | PTTEP Australia International Finance Pty. Ltd.(c) | | | 4.15 | % | | 07/19/2015 | | | 587,597 | |
| | | | | | | | | | | | |
| | | | | | | | | | | 3,351,941 | |
| | | | | | | | | | | | |
| | | |
Bermuda - 0.16% | | | | | | | | | | |
600,000 | | Inkia Energy Ltd.(c) | | | 8.38 | % | | 04/04/2021 | | | 660,000 | |
1,400,000 | | Qtel International Finance Ltd.(c) | | | 3.38 | % | | 10/14/2016 | | | 1,468,600 | |
| | | | | | | | | | | | |
| | | | | | | | | | | 2,128,600 | |
| | | | | | | | | | | | |
| | | |
Brazil - 0.47% | | | | | | | | | | |
1,000,000 | | Banco Bradesco SA(b) | | | 5.75 | % | | 03/01/2022 | | | 1,067,500 | |
1,200,000 | | Banco do Brasil SA(a)(c)(d) | | | 8.50 | % | | Perpetual Maturity | | | 1,432,560 | |
400,000 | | Globo Comunicacao e Participacoes SA(b)(e) | | | 5.31 | % | | 05/11/2022 | | | 439,000 | |
1,400,000 | | Globo Comunicacao e Participacoes SA(c)(e) | | | 6.25 | % | | 07/20/2049 | | | 1,526,000 | |
1,400,000 | | Itau Unibanco Holding SA(c) | | | 5.65 | % | | 03/19/2022 | | | 1,470,000 | |
300,000 | | NET Servicos de Comunicacao SA | | | 7.50 | % | | 01/27/2020 | | | 349,875 | |
| | | | | | | | | | | | |
| | | | | | | | | | | 6,284,935 | |
| | | | | | | | | | | | |
| | | |
British Virgin Islands - 0.11% | | | | | | | | | | |
100,000 | | C10 Capital SPV Ltd.(a)(c)(d) | | | 6.72 | % | | Perpetual Maturity | | | 71,500 | |
700,000 | | CNPC General Capital Ltd.(c) | | | 2.75 | % | | 04/19/2017 | | | 725,722 | |
600,000 | | Hongkong Electric Finance Ltd. | | | 4.25 | % | | 12/14/2020 | | | 659,320 | |
| | | | | | | | | | | | |
| | | | | | | | | | | 1,456,542 | |
| | | | | | | | | | | | |
| | | |
Canada - 0.44% | | | | | | | | | | |
2,875,000 | | Bank of Montreal | | | 1.40 | % | | 09/11/2017 | | | 2,893,932 | |
840,000 | | Pacific Rubiales Energy Corp.(b) | | | 7.25 | % | | 12/12/2021 | | | 991,200 | |
600,000 | | Pacific Rubiales Energy Corp.(c) | | | 7.25 | % | | 12/12/2021 | | | 708,000 | |
| | |
See Notes to Financial Statements. | | |
Annual Report | September 30, 2012 | | 23 |
| | |
RiverNorth/DoubleLine Strategic Income Fund | | Schedule of Investments |
| | September 30, 2012 |
| | | | | | | | | | |
| Principal Amount/Description | | Rate | | Maturity | | Fair Value | |
$1,350,000 | | Teck Resources Ltd. | | 5.40% | | 02/01/2043 | | $ | 1,323,661 | |
| | | | | | | | | | |
| | | | | | | | | 5,916,793 | |
| | | | | | | | | | |
| | | |
Cayman Islands - 0.55% | | | | | | | | |
200,000 | | AES Andres Dominicana Ltd.(c) | | 9.50% | | 11/12/2020 | | | 218,000 | |
500,000 | | AES Andres Dominicana Ltd. / Itabo Dominicana Ltd(b) | | 9.50% | | 11/12/2020 | | | 545,000 | |
900,000 | | EGE Haina Finance Co.(c) | | 9.50% | | 04/26/2017 | | | 949,500 | |
500,000 | | Embraer Overseas Ltd. | | 6.38% | | 01/24/2017 | | | 570,000 | |
500,000 | | Embraer Overseas Ltd. | | 6.38% | | 01/15/2020 | | | 577,500 | |
200,000 | | Grupo Aval Ltd.(b) | | 5.25% | | 02/01/2017 | | | 213,500 | |
300,000 | | Grupo Aval Ltd.(b) | | 4.75% | | 09/26/2022 | | | 296,250 | |
410,087 | | IIRSA Norte Finance Ltd.(c) | | 8.75% | | 05/30/2024 | | | 508,508 | |
250,000 | | Intercorp Retail Trust(b) | | 8.88% | | 11/14/2018 | | | 278,750 | |
1,100,000 | | Raizen Fuels Finance Ltd.(c) | | 9.50% | | 08/15/2014 | | | 1,241,625 | |
1,150,000 | | Transocean, Inc. | | 6.00% | | 03/15/2018 | | | 1,344,799 | |
600,000 | | Virgolino de Oliveira Finance Ltd.(b) | | 11.75% | | 02/09/2022 | | | 600,000 | |
| | | | | | | | | | |
| | | | | | | | | 7,343,432 | |
| | | | | | | | | | |
| | | |
Chile - 0.48% | | | | | | | | |
400,000 | | AES Gener SA | | 7.50% | | 03/25/2014 | | | 432,961 | |
200,000 | | Banco de Chile(c) | | 6.25% | | 06/15/2016 | | | 223,911 | |
1,600,000 | | Banco de Credito e Inversiones(b) | | 3.00% | | 09/13/2017 | | | 1,602,013 | |
1,110,000 | | Celulosa Arauco y Constitucion SA(c) | | 4.75% | | 01/11/2022 | | | 1,164,886 | |
200,000 | | Corp. Nacional del Cobre de Chile(c) | | 4.75% | | 10/15/2014 | | | 214,134 | |
1,200,000 | | Corp. Nacional del Cobre de Chile(c) | | 3.88% | | 11/03/2021 | | | 1,310,113 | |
200,000 | | Inversiones CMPC SA(b) | | 4.75% | | 01/19/2018 | | | 215,204 | |
500,000 | | Inversiones CMPC SA(b) | | 4.50% | | 04/25/2022 | | | 521,907 | |
100,000 | | Inversiones CMPC SA(c) | | 4.75% | | 01/19/2018 | | | 107,577 | |
500,000 | | Inversiones CMPC SA(c) | | 6.13% | | 11/05/2019 | | | 576,237 | |
| | | | | | | | | | |
| | | | | | | | | 6,368,943 | |
| | | | | | | | | | |
| | | |
China - 0.04% | | | | | | | | |
500,000 | | CNPC General Capital Ltd.(b) | | 3.95% | | 04/19/2022 | | | 534,491 | |
| | | | | | | | | | |
| | | | | | | | | 534,491 | |
| | | | | | | | | | |
| | | |
Colombia - 0.05% | | | | | | | | |
200,000 | | Banco de Bogota SA(b) | | 5.00% | | 01/15/2017 | | | 212,000 | |
400,000 | | Transportadora de Gas Internacional SA ESP(c) | | 5.70% | | 03/20/2022 | | | 432,000 | |
| | | | | | | | | | |
| | | | | | | | | 644,000 | |
| | | | | | | | | | |
| | | |
Costa Rica - 0.12% | | | | | | | | |
800,000 | | Instit Costa de Electric(b) | | 6.95% | | 11/10/2021 | | | 892,000 | |
600,000 | | Instit Costa de Electric(c) | | 6.95% | | 11/10/2021 | | | 669,000 | |
| | | | | | | | | | |
| | | | | | | | | 1,561,000 | |
| | | | | | | | | | |
| | |
See Notes to Financial Statements. | | |
24 | | (888) 848-7569 | www.rivernorthfunds.com |
| | |
RiverNorth/DoubleLine Strategic Income Fund | | Schedule of Investments |
| | September 30, 2012 |
| | | | | | | | | | |
| Principal Amount/Description | | Rate | | Maturity | | Fair Value | |
Cyprus - 0.08% | | | | | | | | |
$1,000,000 | | Alfa MTN Invest Ltd.(c) | | 9.25% | | 06/24/2013 | | $ | 1,047,500 | |
| | | | | | | | | | |
| | | | | | | | | 1,047,500 | |
| | | | | | | | | | |
| | | |
France - 0.12% | | | | | | | | |
1,450,000 | | France Telecom SA | | 2.75% | | 09/14/2016 | | | 1,523,083 | |
| | | | | | | | | | |
| | | | | | | | | 1,523,083 | |
| | | | | | | | | | |
| | | |
Great Britain - 0.38% | | | | | | | | |
1,303,000 | | BP Capital Markets PLC | | 4.75% | | 03/10/2019 | | | 1,513,565 | |
2,263,000 | | British Telecommunications PLC | | 5.95% | | 01/15/2018 | | | 2,713,755 | |
850,000 | | Diageo Capital PLC | | 1.50% | | 05/11/2017 | | | 865,918 | |
| | | | | | | | | | |
| | | | | | | | | 5,093,238 | |
| | | | | | | | | | |
| | | |
India - 0.04% | | | | | | | | |
500,000 | | Reliance Holdings USA, Inc.(b) | | 5.40% | | 02/14/2022 | | | 533,694 | |
| | | | | | | | | | |
| | | | | | | | | 533,694 | |
| | | | | | | | | | |
| | | |
Ireland - 0.06% | | | | | | | | |
700,000 | | AK Transneft OJSC Via TransCapitalInvest Ltd.(c) | | 5.67% | | 03/05/2014 | | | 744,100 | |
| | | | | | | | | | |
| | | | | | | | | 744,100 | |
| | | | | | | | | | |
| | | |
Isle Of Man - 0.05% | | | | | | | | |
700,000 | | AngloGold Ashanti Holdings PLC | | 5.13% | | 08/01/2022 | | | 714,364 | |
| | | | | | | | | | |
| | | | | | | | | 714,364 | |
| | | | | | | | | | |
| | | |
Kazakhstan - 0.00%(f) | | | | | | | | |
60,000 | | BTA Bank JSC(c)(e)(g) | | 10.75% | | 07/01/2018 | | | 11,700 | |
| | | | | | | | | | |
| | | | | | | | | 11,700 | |
| | | | | | | | | | |
| | | |
Luxembourg - 0.23% | | | | | | | | |
100,000 | | Bank of Moscow OJSC Via Kuznetski Capital(a) | | 5.97% | | 11/25/2015 | | | 103,600 | |
960,000 | | Covidien International Finance SA | | 2.80% | | 06/15/2015 | | | 1,010,833 | |
850,000 | | Covidien International Finance SA | | 6.00% | | 10/15/2017 | | | 1,046,268 | |
500,000 | | Minerva Luxembourg SA(b) | | 12.25% | | 02/10/2022 | | | 579,350 | |
286,182 | | Tengizchevoil Finance Co. SARL(c) | | 6.12% | | 11/15/2014 | | | 301,206 | |
| | | | | | | | | | |
| | | | | | | | | 3,041,257 | |
| | | | | | | | | | |
| | | |
Marshall Islands - 0.04% | | | | | | | | |
479,844 | | Nakilat, Inc.(c) | | 6.27% | | 12/31/2033 | | | 570,175 | |
| | | | | | | | | | |
| | | | | | | | | 570,175 | |
| | | | | | | | | | |
| | | |
Mexico - 0.41% | | | | | | | | |
700,000 | | Banco Mercantil del Norte SA(c) | | 4.38% | | 07/19/2015 | | | 745,500 | |
700,000 | | Banco Mercantil del Norte SA(a)(c) | | 6.86% | | 10/13/2021 | | | 761,250 | |
150,000 | | Empresas ICA SAB de CV(b) | | 8.38% | | 07/24/2017 | | | 156,750 | |
600,000 | | Empresas ICA SAB de CV(c) | | 8.90% | | 02/04/2021 | | | 633,000 | |
500,000 | | Gruma SAB de CV(c)(d) | | 7.75% | | Perpetual
Maturity | | | 513,750 | |
940,000 | | Grupo KUO SAB De CV(c) | | 9.75% | | 10/17/2017 | | | 1,005,800 | |
| | |
See Notes to Financial Statements. | | |
Annual Report | September 30, 2012 | | 25 |
| | |
RiverNorth/DoubleLine Strategic Income Fund | | Schedule of Investments |
| | September 30, 2012 |
| | | | | | | | | | |
| Principal Amount/Description | | Rate | | Maturity | | Fair Value | |
$100,000 | | Ixe Banco SA(c) | | 9.25% | | 10/14/2020 | | $ | 119,000 | |
1,000,000 | | Mexichem SAB de CV(b) | | 4.88% | | 09/19/2022 | | | 1,017,500 | |
500,000 | | Telefonos de Mexico SAB de CV | | 5.50% | | 01/27/2015 | | | 554,234 | |
| | | | | | | | | | |
| | | | | | | | | 5,506,784 | |
| | | | | | | | | | |
| | | |
Myanmar - 0.11% | | | | | | | | |
650,000 | | Axiata SPV1 Labuan Ltd. | | 5.38% | | 04/28/2020 | | | 731,892 | |
200,000 | | IOI Ventures L Bhd | | 5.25% | | 03/16/2015 | | | 213,247 | |
500,000 | | Penerbangan Malaysia Bhd(c) | | 5.63% | | 03/15/2016 | | | 566,519 | |
| | | | | | | | | | |
| | | | | | | | | 1,511,658 | |
| | | | | | | | | | |
| | | |
Netherlands - 0.14% | | | | | | | | |
266,000 | | Deutsche Telekom International Finance BV | | 8.75% | | 06/15/2030 | | | 401,498 | |
647,000 | | Koninklijke KPN NV | | 8.38% | | 10/01/2030 | | | 868,344 | |
700,000 | | WPE International Cooperatief UA(c) | | 10.38% | | 09/30/2020 | | | 602,000 | |
| | | | | | | | | | |
| | | | | | | | | 1,871,842 | |
| | | | | | | | | | |
| | | |
Norway - 0.04% | | | | | | | | |
500,000 | | Corp. Pesquera Inca SAC(c) | | 9.00% | | 02/10/2017 | | | 542,500 | |
| | | | | | | | | | |
| | | | | | | | | 542,500 | |
| | | | | | | | | | |
| | | |
Panama - 0.06% | | | | | | | | |
800,000 | | Banco Latinoamericano de Comercio Exterior SA(b) | | 3.75% | | 04/04/2017 | | | 832,000 | |
| | | | | | | | | | |
| | | | | | | | | 832,000 | |
| | | | | | | | | | |
| | | |
Peru - 0.05% | | | | | | | | |
190,000 | | Banco de Credito del Peru(c) | | 4.75% | | 03/16/2016 | | | 201,400 | |
100,000 | | Banco de Credito del Peru(a)(c) | | 9.75% | | 11/06/2069 | | | 121,000 | |
100,000 | | Banco Internacional del Peru SAA(a)(c) | | 8.50% | | 04/23/2070 | | | 106,000 | |
200,000 | | Corp. Lindley SA(b) | | 6.75% | | 11/23/2021 | | | 225,500 | |
| | | | | | | | | | |
| | | | | | | | | 653,900 | |
| | | | | | | | | | |
| | | |
Qatar - 0.12% | | | | | | | | |
839,800 | | Ras Laffan Liquefied Natural Gas Co. Ltd. II(c) | | 5.30% | | 09/30/2020 | | | 948,974 | |
500,000 | | Ras Laffan Liquefied Natural Gas Co. Ltd. III(c) | | 5.84% | | 09/30/2027 | | | 582,500 | |
| | | | | | | | | | |
| | | | | | | | | 1,531,474 | |
| | | | | | | | | | |
| | | |
Russia - 0.40% | | | | | | | | |
1,100,000 | | Gazprom OAO Via Gaz Capital SA(c) | | 8.13% | | 07/31/2014 | | | 1,216,061 | |
1,250,000 | | Gazprombank OJSC Via GPB Eurobond Finance PLC | | 7.93% | | 06/28/2013 | | | 1,309,375 | |
400,000 | | Industry & Construction Bank St. Petersburg OJSC Via Or-ICB for Industry(a) | | 5.01% | | 09/29/2015 | | | 400,000 | |
500,000 | | Russian Agricultural Bank OJSC Via RSHB Capital SA(c) | | 7.13% | | 01/14/2014 | | | 530,300 | |
| | |
See Notes to Financial Statements. | | |
26 | | (888) 848-7569 | www.rivernorthfunds.com |
| | |
RiverNorth/DoubleLine Strategic Income Fund | | Schedule of Investments |
| | September 30, 2012 |
| | | | | | | | | | |
| Principal Amount/Description | | Rate | | Maturity | | Fair Value | |
$750,000 | | Vimpel Communications Via VIP Finance Ireland Ltd. OJSC(c) | | 8.38% | | 04/30/2013 | | $ | 778,493 | |
1,000,000 | | VTB Bank OJSC Via VTB Capital SA(c) | | 6.88% | | 05/29/2018 | | | 1,078,800 | |
| | | | | | | | | | |
| | | | | | | | | 5,313,029 | |
| | | | | | | | | | |
| | | |
Singapore - 0.30% | | | | | | | | |
1,400,000 | | DBS Bank Ltd.(a)(c) | | 5.00% | | 11/15/2019 | | | 1,485,897 | |
1,600,000 | | Oversea-Chinese Banking Corp. Ltd.(a) | | 4.25% | | 11/18/2019 | | | 1,667,525 | |
800,000 | | United Overseas Bank Ltd.(a)(c) | | 5.38% | | 09/03/2019 | | | 849,556 | |
| | | | | | | | | | |
| | | | | | | | | 4,002,978 | |
| | | | | | | | | | |
| | | |
South Africa - 0.05% | | | | | | | | |
200,000 | | Transnet SOC Ltd.(b) | | 4.00% | | 07/26/2022 | | | 203,800 | |
400,000 | | Transnet SOC Ltd.(c) | | 4.50% | | 02/10/2016 | | | 425,206 | |
| | | | | | | | | | |
| | | | | | | | | 629,006 | |
| | | | | | | | | | |
| | | |
South Korea - 0.32% | | | | | | | | |
800,000 | | POSCO(b) | | 4.25% | | 10/28/2020 | | | 852,915 | |
650,000 | | POSCO(b) | | 5.25% | | 04/14/2021 | | | 743,097 | |
2,500,000 | | The Korea Development Bank | | 4.38% | | 08/10/2015 | | | 2,714,518 | |
| | | | | | | | | | |
| | | | | | | | | 4,310,530 | |
| | | | | | | | | | |
| | | |
United Arab Emirates - 0.21% | | | | | | | | |
200,000 | | Abu Dhabi National Energy Co.(b) | | 5.88% | | 12/13/2021 | | | 232,250 | |
200,000 | | Abu Dhabi National Energy Co.(c) | | 4.75% | | 09/15/2014 | | | 211,750 | |
1,000,000 | | Abu Dhabi National Energy Co.(c) | | 5.88% | | 12/13/2021 | | | 1,161,250 | |
400,000 | | Dolphin Energy Ltd.(b) | | 5.50% | | 12/15/2021 | | | 463,600 | |
640,320 | | Dolphin Energy Ltd.(c) | | 5.89% | | 06/15/2019 | | | 728,364 | |
| | | | | | | | | | |
| | | | | | | | | 2,797,214 | |
| | | | | | | | | | |
| | | |
TOTAL FOREIGN CORPORATE BONDS (Cost $75,591,272) | | | | | | | 78,372,703 | |
| | | | | | | | | | |
| | | |
| U.S. CORPORATE BONDS - 8.27% | | | | | | | | |
1,325,000 | | Alcoa, Inc. | | 6.15% | | 08/15/2020 | | | 1,464,806 | |
2,700,000 | | Altria Group, Inc. | | 2.85% | | 08/09/2022 | | | 2,700,173 | |
2,750,000 | | American Express Credit Corp. | | 2.75% | | 09/15/2015 | | | 2,899,174 | |
1,450,000 | | Arrow Electronics, Inc. | | 3.38% | | 11/01/2015 | | | 1,515,269 | |
1,050,000 | | AT&T, Inc. | | 5.35% | | 09/01/2040 | | | 1,270,336 | |
2,100,000 | | BB&T Corp. | | 1.60% | | 08/15/2017 | | | 2,140,679 | |
1,645,000 | | Becton Dickinson and Co. | | 3.13% | | 11/08/2021 | | | 1,765,736 | |
1,667,000 | | Biogen Idec, Inc. | | 6.88% | | 03/01/2018 | | | 2,053,669 | |
300,000 | | Boston Properties LP | | 5.63% | | 11/15/2020 | | | 357,802 | |
875,000 | | Boston Properties LP | | 4.13% | | 05/15/2021 | | | 950,341 | |
400,000 | | Boston Properties LP | | 3.85% | | 02/01/2023 | | | 422,279 | |
1,350,000 | | Celgene Corp. | | 3.25% | | 08/15/2022 | | | 1,366,026 | |
250,000 | | Cemex Finance LLC(c) | | 9.50% | | 12/14/2016 | | | 260,000 | |
| | |
See Notes to Financial Statements. | | |
Annual Report | September 30, 2012 | | 27 |
| | |
RiverNorth/DoubleLine Strategic Income Fund | | Schedule of Investments |
| | September 30, 2012 |
| | | | | | | | | | |
| Principal Amount/Description | | Rate | | Maturity | | Fair Value | |
$1,150,000 | | Citigroup, Inc. | | 6.00% | | 12/13/2013 | | $ | 1,220,061 | |
950,000 | | ConocoPhillips | | 6.50% | | 02/01/2039 | | | 1,373,776 | |
100,000 | | Daimler Finance North America LLC | | 6.50% | | 11/15/2013 | | | 106,485 | |
2,000,000 | | Daimler Finance North America LLC(b) | | 1.88% | | 09/15/2014 | | | 2,032,112 | |
965,000 | | Devon Energy Corp. | | 6.30% | | 01/15/2019 | | | 1,199,867 | |
1,603,000 | | Devon Energy Corp. | | 4.00% | | 07/15/2021 | | | 1,766,139 | |
1,350,000 | | DIRECTV Holdings LLC / DIRECTV Financing Co., Inc. | | 5.00% | | 03/01/2021 | | | 1,515,324 | |
1,550,000 | | Duke Energy Corp. | | 3.55% | | 09/15/2021 | | | 1,652,970 | |
1,400,000 | | Eastman Chemical Co. | | 2.40% | | 06/01/2017 | | | 1,464,110 | |
1,305,000 | | Ecolab, Inc. | | 2.38% | | 12/08/2014 | | | 1,354,205 | |
1,350,000 | | Express Scripts Holding Co.(b) | | 2.10% | | 02/12/2015 | | | 1,385,699 | |
2,175,000 | | Ford Motor Co. | | 7.45% | | 07/16/2031 | | | 2,716,031 | |
800,000 | | Freeport-McMoRan Copper & Gold, Inc. | | 2.15% | | 03/01/2017 | | | 810,048 | |
2,750,000 | | General Electric Capital Corp. | | 2.90% | | 01/09/2017 | | | 2,912,957 | |
1,436,000 | | General Mills, Inc. | | 3.15% | | 12/15/2021 | | | 1,497,647 | |
675,000 | | Halliburton Co. | | 6.15% | | 09/15/2019 | | | 842,846 | |
900,000 | | Illinois Tool Works, Inc. | | 3.38% | | 09/15/2021 | | | 969,611 | |
1,250,000 | | Intel Corp. | | 3.30% | | 10/01/2021 | | | 1,360,691 | |
1,400,000 | | International Business Machines Corp. | | 1.95% | | 07/22/2016 | | | 1,463,830 | |
1,850,000 | | JP Morgan Chase & Co. | | 4.95% | | 03/25/2020 | | | 2,116,801 | |
700,000 | | JP Morgan Chase & Co. | | 4.50% | | 01/24/2022 | | | 778,148 | |
900,000 | | Kellogg Co. | | 7.45% | | 04/01/2031 | | | 1,261,566 | |
1,600,000 | | Kinder Morgan Energy Partners LP | | 6.95% | | 01/15/2038 | | | 2,054,946 | |
1,089,000 | | Kraft Foods, Inc. | | 5.38% | | 02/10/2020 | | | 1,316,024 | |
1,500,000 | | Liberty Mutual Group, Inc.(b) | | 6.50% | | 05/01/2042 | | | 1,631,146 | |
1,243,000 | | Marathon Petroleum Corp. | | 5.13% | | 03/01/2021 | | | 1,437,137 | |
1,250,000 | | Mattel, Inc. | | 2.50% | | 11/01/2016 | | | 1,307,754 | |
825,000 | | MetLife, Inc. | | 6.38% | | 06/15/2034 | | | 1,081,197 | |
250,000 | | MetLife, Inc. | | 5.70% | | 06/15/2035 | | | 308,587 | |
350,000 | | MidAmerican Energy Holdings Co. | | 5.95% | | 05/15/2037 | | | 440,698 | |
1,499,000 | | MidAmerican Energy Holdings Co. | | 6.50% | | 09/15/2037 | | | 2,016,612 | |
1,615,000 | | Motorola Solutions, Inc. | | 6.00% | | 11/15/2017 | | | 1,930,091 | |
2,514,000 | | National Rural Utilities Cooperative Finance Corp. | | 10.38% | | 11/01/2018 | | | 3,725,600 | |
525,000 | | News America, Inc. | | 6.65% | | 11/15/2037 | | | 669,191 | |
1,250,000 | | Novartis Capital Corp. | | 4.40% | | 04/24/2020 | | | 1,476,906 | |
1,275,000 | | Omnicom Group, Inc. | | 4.45% | | 08/15/2020 | | | 1,421,718 | |
1,200,000 | | ONEOK Partners LP | | 6.13% | | 02/01/2041 | | | 1,448,342 | |
1,475,000 | | Phillips 66(b) | | 5.88% | | 05/01/2042 | | | 1,760,205 | |
150,000 | | Plains All American Pipeline LP | | 5.15% | | 06/01/2042 | | | 171,521 | |
625,000 | | PNC Funding Corp. | | 6.70% | | 06/10/2019 | | | 796,324 | |
1,300,000 | | PNC Funding Corp. | | 4.38% | | 08/11/2020 | | | 1,485,891 | |
795,000 | | Simon Property Group LP | | 5.65% | | 02/01/2020 | | | 958,213 | |
| | |
See Notes to Financial Statements. | | |
28 | | (888) 848-7569 | www.rivernorthfunds.com |
| | |
| RiverNorth/DoubleLine Strategic Income Fund | | Schedule of Investments |
| | September 30, 2012 |
| | | | | | | | | | |
| Principal Amount/Description | | Rate | | Maturity | | Fair Value | |
| |
$400,000 | | Simon Property Group LP | | 4.38% | | 03/01/2021 | | $ | 453,032 | |
1,950,000 | | Southern Power Co. | | 4.88% | | 07/15/2015 | | | 2,148,210 | |
200,000 | | Southwest Airlines Co. | | 5.25% | | 10/01/2014 | | | 214,842 | |
365,000 | | Southwest Airlines Co. | | 5.75% | | 12/15/2016 | | | 417,772 | |
992,000 | | Southwest Airlines Co. | | 5.13% | | 03/01/2017 | | | 1,111,904 | |
900,000 | | Target Corp. | | 3.88% | | 07/15/2020 | | | 1,028,092 | |
500,000 | | Target Corp. | | 2.90% | | 01/15/2022 | | | 531,006 | |
1,295,000 | | The ADT Corp.(b) | | 3.50% | | 07/15/2022 | | | 1,348,489 | |
721,000 | | The Boeing Co. | | 6.88% | | 03/15/2039 | | | 1,122,800 | |
100,000 | | The Boeing Co. | | 5.88% | | 02/15/2040 | | | 139,759 | |
1,550,000 | | The Coca-Cola Co. | | 1.80% | | 09/01/2016 | | | 1,616,765 | |
1,925,000 | | The Kroger Co. | | 3.40% | | 04/15/2022 | | | 2,009,417 | |
1,150,000 | | Time Warner Cable, Inc. | | 5.00% | | 02/01/2020 | | | 1,335,609 | |
850,000 | | Time Warner Cable, Inc. | | 4.50% | | 09/15/2042 | | | 852,276 | |
1,300,000 | | Tyson Foods, Inc. | | 4.50% | | 06/15/2022 | | | 1,368,250 | |
750,000 | | United Technologies Corp. | | 3.10% | | 06/01/2022 | | | 801,094 | |
1,250,000 | | Valero Energy Corp. | | 6.13% | | 02/01/2020 | | | 1,520,885 | |
2,400,000 | | Wal-Mart Stores, Inc. | | 3.25% | | 10/25/2020 | | | 2,645,047 | |
1,615,000 | | Waste Management, Inc. | | 6.13% | | 11/30/2039 | | | 2,043,920 | |
1,405,000 | | WellPoint, Inc. | | 5.25% | | 01/15/2016 | | | 1,576,902 | |
925,000 | | WellPoint, Inc. | | 5.88% | | 06/15/2017 | | | 1,101,847 | |
2,600,000 | | Wells Fargo & Co. | | 4.60% | | 04/01/2021 | | | 3,009,282 | |
1,225,000 | | Wynn Las Vegas LLC | | 7.75% | | 08/15/2020 | | | 1,368,937 | |
1,800,000 | | Xerox Corp. | | 4.25% | | 02/15/2015 | | | 1,912,783 | |
| | | | | | | | | | |
| | | |
TOTAL U.S. CORPORATE BONDS (Cost $105,037,514) | | | | | | | 110,084,237 | |
| | | | | | | | | | |
|
FOREIGN GOVERNMENT BONDS AND NOTES, SUPRANATIONALS AND FOREIGN AGENCIES - 1.25% | |
2,450,000 | | Corp. Andina de Fomento | | 3.75% | | 01/15/2016 | | | 2,581,286 | |
1,350,000 | | Costa Rica Government International Bond(c) | | 6.55% | | 03/20/2014 | | | 1,424,250 | |
1,940,000 | | Mexico Government International Bond | | 5.63% | | 01/15/2017 | | | 2,277,560 | |
1,000,000 | | Panama Government International Bond | | 7.25% | | 03/15/2015 | | | 1,147,500 | |
2,500,000 | | Pemex Project Funding Master Trust | | 6.63% | | 06/15/2035 | | | 3,150,000 | |
500,000 | | Qatar Government International Bond(b) | | 4.50% | | 01/20/2022 | | | 567,500 | |
850,000 | | Qatar Government International Bond(c) | | 4.00% | | 01/20/2015 | | | 904,400 | |
1,500,000 | | Qatar Government International Bond(c) | | 4.50% | | 01/20/2022 | | | 1,702,500 | |
|
See Notes to Financial Statements. |
| | |
Annual Report | September 30, 2012 | | 29 |
| | |
RiverNorth/DoubleLine Strategic Income Fund | | Schedule of Investments |
| | September 30, 2012 |
| | | | | | | | | | |
| Principal Amount/Description | | Rate | | Maturity | | Fair Value | |
$250,000 | | Wakala Global Sukuk Bhd(c) | | 2.99% | | 07/06/2016 | | $ | 262,177 | |
2,250,000 | | Wakala Global Sukuk Bhd(c) | | 4.65% | | 07/06/2021 | | | 2,608,139 | |
| | | | | | | | | | |
| |
TOTAL FOREIGN GOVERNMENT BONDS AND NOTES, SUPRANATIONALS AND FOREIGN AGENCIES (Cost $15,781,572) | | | 16,625,312 | |
| | | | | | | | | | |
| | | |
| NON-AGENCY COLLATERALIZED MORTGAGE OBLIGATIONS - 26.64% | | | | | | | | |
| | Adjustable Rate Mortgage Trust | | | | | | | | |
3,975,846 | | Series 2005-1(a) | | 2.89% | | 05/25/2035 | | | 3,867,062 | |
2,666,294 | | Series 2005-7(a) | | 3.38% | | 10/25/2035 | | | 2,296,394 | |
| | American Home Mortgage Investment Trust | | | | | | | | |
289,141 | | Series 2007-A(b)(e) | | 6.10% | | 01/25/2037 | | | 174,046 | |
| | Banc of America Alternative Loan Trust | | | | | | | | |
173,632 | | Series 2005-6 | | 6.00% | | 07/25/2035 | | | 161,998 | |
626,757 | | Series 2005-6 | | 5.50% | | 07/25/2035 | | | 604,995 | |
| | Banc of America Commercial Mortgage Trust | | | | | | | | |
100,000 | | Series 2007-1 | | 5.45% | | 01/15/2017 | | | 116,120 | |
600,000 | | Series 2007-2(a) | | 5.81% | | 04/10/2049 | | | 645,276 | |
305,000 | | Series 2007-4(a) | | 5.92% | | 02/10/2051 | | | 363,042 | |
| | Banc of America Funding Corp. | | | | | | | | |
1,284,057 | | Series 2006-2 | | 5.50% | | 03/25/2036 | | | 1,316,113 | |
3,538,397 | | Series 2006-A(a) | | 5.32% | | 02/20/2036 | | | 2,898,446 | |
2,232,015 | | Series 2008-R2(b) | | 6.00% | | 09/25/2037 | | | 2,274,673 | |
| | Banc of America Merrill Lynch Commercial Mortgage, Inc. | | | | | | | | |
43,040,085 | | Series 2005-5(a) | | 0.18% | | 10/10/2045 | | | 129 | |
| | Banc of America Mortgage Trust | | | | | | | | |
405,961 | | Series 2004-8 | | 5.50% | | 09/25/2024 | | | 415,277 | |
3,544,187 | | Series 2005-E(a) | | 5.39% | | 06/25/2035 | | | 3,518,648 | |
| | Banc of America Re-Remic Trust | | | | | | | | |
200,000 | | Series 2012-CLRN(a)(b) | | 1.84% | | 08/15/2014 | | | 201,240 | |
300,000 | | Series 2012-CLRN(a)(b) | | 2.94% | | 08/15/2014 | | | 301,860 | |
| | Bank of America-First Union NB Commercial Mortgage | | | | | | | | |
45,000 | | Series 2001-3(b) | | 6.56% | | 04/11/2037 | | | 45,178 | |
| | BCAP LLC Trust | | | | | | | | |
383,122 | | Series 2007-AA2(a) | | 7.50% | | 04/25/2037 | | | 311,184 | |
248,577 | | Series 2007-AA2 | | 6.00% | | 04/25/2037 | | | 203,454 | |
500,000 | | Series 2010-RR6(a)(b) | | 8.02% | | 08/26/2022 | | | 490,801 | |
| | |
See Notes to Financial Statements. | | |
30 | | (888) 848-7569 | www.rivernorthfunds.com |
| | |
RiverNorth/DoubleLine Strategic Income Fund | | Schedule of Investments |
| | September 30, 2012 |
| | | | | | | | | | |
| Principal Amount/Description | | Rate | | Maturity | | Fair Value | |
| | Bear Stearns ALT-A Trust | | | | | | | | |
$3,273,684 | | Series 2004-11(a) | | 3.09% | | 11/25/2034 | | $ | 2,715,583 | |
2,897,933 | | Series 2005-3(a) | | 2.74% | | 04/25/2035 | | | 2,153,434 | |
3,125,743 | | Series 2006-6(a) | | 4.85% | | 11/25/2036 | | | 2,306,957 | |
| | Bear Stearns Asset-Backed Securities Trust | | | | | | | | |
1,164,485 | | Series 2005-HE3(a) | | 0.90% | | 03/25/2035 | | | 1,082,917 | |
4,353,327 | | Series 2006-AC1(e) | | 5.75% | | 02/25/2036 | | | 3,474,186 | |
| | Bear Stearns Commercial Mortgage Securities | | | | | | | | |
246,719 | | Series 2001-TOP2(a) | | 6.83% | | 02/15/2035 | | | 248,983 | |
100,000 | | Series 2006-PW13(a) | | 5.58% | | 08/11/2016 | | | 111,535 | |
750,000 | | Series 2007-PW16(a) | | 5.91% | | 05/11/2017 | | | 823,234 | |
650,000 | | Series 2007-PW17(a) | | 5.92% | | 06/11/2050 | | | 716,465 | |
| | Chase Mortgage Finance Corp. | | | | | | | | |
1,358,862 | | Series 2007-S3 | | 5.50% | | 05/25/2037 | | | 1,397,810 | |
| | Citicorp Mortgage Securities, Inc. | | | | | | | | |
1,991,056 | | Series 2007-1 | | 6.00% | | 01/25/2037 | | | 2,040,504 | |
2,017,136 | | Series 2007-2 | | 5.50% | | 02/25/2037 | | | 1,869,762 | |
| | Citigroup Commercial Mortgage Trust | | | | | | | | |
63,000 | | Series 2004-C1(a) | | 5.53% | | 04/15/2040 | | | 65,017 | |
250,000 | | Series 2005-C3(a) | | 4.83% | | 05/15/2043 | | | 266,657 | |
265,000 | | Series 2006-C4(a) | | 5.92% | | 03/15/2049 | | | 295,689 | |
500,000 | | Series 2006-C5 | | 5.43% | | 10/15/2049 | | | 581,196 | |
500,000 | | Series 2007-C6(a) | | 5.89% | | 06/10/2017 | | | 546,580 | |
900,000 | | Series 2008-C7(a) | | 6.26% | | 12/10/2049 | | | 988,831 | |
4,000,000 | | Series 2012-GC8(a)(b) | | 2.27% | | 09/10/2045 | | | 541,249 | |
| | Citigroup Mortgage Loan Trust, Inc. | | | | | | | | |
4,890,244 | | Series 2004-HYB1(a) | | 2.87% | | 02/25/2034 | | | 4,883,941 | |
1,730,522 | | Series 2006-WF1(e) | | 6.02% | | 03/25/2036 | | | 1,230,493 | |
2,358,758 | | Series 2007-OPX1(e) | | 6.33% | | 01/25/2037 | | | 1,607,765 | |
2,000,000 | | Series 2008-AR4(a)(b) | | 3.04% | | 11/25/2038 | | | 1,132,098 | |
1,400,000 | | Series 2008-AR4(a)(b) | | 2.89% | | 11/25/2038 | | | 758,815 | |
1,485,358 | | Series 2010-8(a)(b) | | 10.60% | | 11/25/2036 | | | 1,054,604 | |
4,604,681 | | Series 2010-8(a)(b) | | 9.09% | | 12/25/2036 | | | 3,359,980 | |
| | Citigroup/Deutsche Bank Commercial Mortgage Trust | | | | | | | | |
48,141 | | Series 2005-CD1(a) | | 0.34% | | 07/15/2044 | | | 48,125 | |
35,000 | | Series 2006-CD3 | | 5.65% | | 10/15/2048 | | | 37,328 | |
250,000 | | Series 2007-CD4 | | 5.32% | | 03/11/2012 | | | 286,271 | |
136,270 | | Series 2007-CD4 | | 5.28% | | 12/11/2049 | | | 143,721 | |
28,961,502 | | Series 2007-CD5(a)(b) | | 0.31% | | 11/15/2044 | | | 120,248 | |
| | Citimortgage Alternative Loan Trust | | | | | | | | |
1,904,767 | | Series 2007-A1 | | 6.00% | | 01/25/2037 | | | 1,496,189 | |
375,189 | | Series 2007-A1(a) | | 5.18% | | 01/25/2037 | | | 61,696 | |
| | |
See Notes to Financial Statements. | | |
Annual Report | September 30, 2012 | | 31 |
| | |
| RiverNorth/DoubleLine Strategic Income Fund | | Schedule of Investments |
| | September 30, 2012 |
| | | | | | | | | | |
| Principal Amount/Description | | Rate | | Maturity | | Fair Value | |
$665,172 | | Series 2007-A3(a) | | 5.18% | | 03/25/2037 | | $ | 129,257 | |
289,039 | | Series 2007-A3(a) | | 6.00% | | 03/25/2037 | | | 215,512 | |
10,067,461 | | Series 2007-A4 | | 5.75% | | 04/25/2037 | | | 7,813,175 | |
2,249,391 | | Series 2007-A4 | | 5.75% | | 04/25/2037 | | | 1,720,447 | |
2,026,410 | | Series 2007-A6 | | 5.50% | | 06/25/2037 | | | 1,594,239 | |
| | COBALT CMBS Commercial Mortgage Trust | | | | | | | | |
600,000 | | Series 2007-C2(a) | | 5.53% | | 04/15/2047 | | | 632,609 | |
| | Commercial Mortgage Acceptance Corp. | | | | | | | | |
157,450 | | Series 1998-C2(b) | | 5.44% | | 09/15/2030 | | | 162,005 | |
| | Commercial Mortgage Asset Trust | | | | | | | | |
250,000 | | Series 1999-C1(a) | | 7.23% | | 01/17/2032 | | | 260,080 | |
| | Commercial Mortgage Pass-Through Certificates | | | | | | | | |
175,000 | | Series 2006-C7(a) | | 5.96% | | 06/10/2046 | | | 187,788 | |
600,000 | | Series 2006-C8 | | 5.35% | | 12/10/2016 | | | 643,601 | |
1,132,602 | | Series 2010-C1(a)(b) | | 2.55% | | 07/10/2046 | | | 71,066 | |
100,000 | | Series 2011-THL(b) | | 5.95% | | 08/09/2016 | | | 104,438 | |
993,656 | | Series 2012-LC4(a)(b) | | 2.71% | | 12/10/2044 | | | 153,668 | |
| | Countrywide Alternative Loan Trust | | | | | | | | |
1,012,932 | | Series 2005-20CB | | 5.50% | | 07/25/2035 | | | 873,059 | |
406,189 | | Series 2005-54CB | | 5.50% | | 11/25/2035 | | | 348,092 | |
1,000,000 | | Series 2005-6CB | | 5.50% | | 04/25/2035 | | | 924,468 | |
826,502 | | Series 2005-85CB(a) | | 20.84% | | 02/25/2036 | | | 1,043,730 | |
3,913,654 | | Series 2005-85CB(a) | | 1.32% | | 02/25/2036 | | | 2,452,149 | |
1,009,478 | | Series 2005-86CB | | 5.50% | | 02/25/2036 | | | 761,907 | |
2,068,585 | | Series 2005-9CB(a) | | 4.83% | | 05/25/2035 | | | 315,908 | |
1,164,744 | | Series 2005-9CB(a) | | 0.72% | | 05/25/2035 | | | 901,761 | |
762,622 | | Series 2006-12CB(a) | | 5.75% | | 05/25/2036 | | | 518,375 | |
3,442,244 | | Series 2006-15CB | | 6.50% | | 06/25/2036 | | | 2,304,417 | |
520,119 | | Series 2006-30T1 | | 6.25% | | 11/25/2036 | | | 424,738 | |
387,670 | | Series 2006-32CB | | 5.50% | | 11/25/2036 | | | 306,575 | |
728,084 | | Series 2006-36T2(a) | | 27.06% | | 12/25/2036 | | | 930,864 | |
3,068,170 | | Series 2007-19 | | 6.00% | | 08/25/2037 | | | 2,403,141 | |
3,120,384 | | Series 2007-23CB(a) | | 6.28% | | 09/25/2037 | | | 731,565 | |
3,267,988 | | Series 2007-23CB(a) | | 0.72% | | 09/25/2037 | | | 1,857,247 | |
| | Countrywide Asset-Backed Certificates | | | | | | |
2,500,000 | | Series 2005-12(e) | | 5.56% | | 02/25/2036 | | | 2,446,087 | |
| | Countrywide Home Loan Mortgage Pass-Through Trust | | | | | | | | |
300,000 | | Series 2005-J4 | | 5.50% | | 11/25/2035 | | | 290,829 | |
1,290,536 | | Series 2007-17 | | 6.00% | | 10/25/2037 | | | 1,253,830 | |
1,360,835 | | Series 2007-3 | | 6.00% | | 04/25/2037 | | | 1,240,453 | |
1,882,520 | | Series 2007-7 | | 5.75% | | 06/25/2037 | | | 1,750,427 | |
| | |
See Notes to Financial Statements. | | |
32 | | (888) 848-7569 | www.rivernorthfunds.com |
| | |
RiverNorth/DoubleLine Strategic Income Fund | | Schedule of Investments |
| | September 30, 2012 |
| | | | | | | | | | |
| Principal Amount/Description | | Rate | | Maturity | | Fair Value | |
| | Credit Suisse First Boston Mortgage Securities Corp. | | | | | | | | |
$250,000 | | Series 1998-C2(a)(b) | | 6.75% | | 11/15/2030 | | $ | 269,014 | |
201,254 | | Series 2005-10 | | 5.50% | | 11/25/2035 | | | 171,682 | |
204,113 | | Series 2005-8 | | 5.50% | | 08/25/2025 | | | 194,585 | |
| | Credit Suisse Mortgage Capital Certificates | | | | | | | | |
1,753,123 | | Series 2006-5 | | 6.25% | | 06/25/2036 | | | 962,295 | |
1,080,000 | | Series 2006-C3(a) | | 6.01% | | 06/15/2038 | | | 1,181,660 | |
110,009,498 | | Series 2006-C4(a)(b) | | 0.76% | | 09/15/2039 | | | 648,506 | |
550,000 | | Series 2006-C5 | | 5.34% | | 12/15/2039 | | | 572,123 | |
| | Crest Dartmouth Street | | | | | | | | |
1,000,000 | | Series 2003-1A(a)(b) | | 1.86% | | 06/28/2038 | | | 917,500 | |
| | CSAB Mortgage-Backed Trust | | | | | | | | |
8,781,274 | | Series 2006-2(e) | | 5.70% | | 09/25/2036 | | | 2,803,790 | |
236,291 | | Series 2007-1(a) | | 5.90% | | 05/25/2037 | | | 153,216 | |
| | CSMC Mortgage-Backed Trust | | | | | | | | |
476,505 | | Series 2006-1 | | 6.00% | | 02/25/2036 | | | 356,974 | |
418,398 | | Series 2006-4 | | 5.50% | | 05/25/2021 | | | 432,304 | |
2,389,231 | | Series 2006-7 | | 5.00% | | 08/25/2036 | | | 1,980,252 | |
194,675 | | Series 2006-9 | | 6.00% | | 11/25/2036 | | | 181,575 | |
7,620,845 | | Series 2007-1 | | 6.00% | | 02/25/2037 | | | 6,654,995 | |
395,542 | | Series 2007-2 | | 5.00% | | 03/25/2037 | | | 390,612 | |
814,398 | | Series 2007-3(a) | | 5.84% | | 04/25/2037 | | | 485,531 | |
174,198 | | Series 2007-4 | | 6.00% | | 06/25/2037 | | | 152,036 | |
2,864,811 | | Series 2010-7R(a)(b) | | 7.95% | | 04/26/2037 | | | 1,913,839 | |
150,000 | | Series 2010-RR1(a)(b) | | 5.69% | | 04/16/2017 | | | 163,105 | |
300,000 | | Series 2010-RR2(a)(b) | | 5.34% | | 01/15/2017 | | | 320,365 | |
| | DBRR Trust | | | | | | | | |
650,000 | | Series 2012-EZ1 B | | 1.39% | | 09/25/2045 | | | 649,494 | |
| | Deutsche ALT-A Securities, Inc. Alternate Loan Trust | | | | | | | | |
870,908 | | Series 2005-6(a) | | 4.86% | | 12/25/2035 | | | 176,701 | |
419,597 | | Series 2005-6(a) | | 1.62% | | 12/25/2035 | | | 249,302 | |
| | Deutsche Mortgage Securities, Inc. | | | | | | | | |
301,079 | | Series 2006-PR1(a)(b) | | 11.79% | | 04/15/2036 | | | 330,610 | |
| | Extended Stay America Trust | | | | | | | | |
212,463 | | Series 2010-ESHA(b) | | 2.95% | | 11/05/2015 | | | 213,695 | |
| | First Horizon Alternative Mortgage Securities | | | | | | | | |
238,499 | | Series 2005-FA6 | | 5.50% | | 09/25/2035 | | | 213,146 | |
249,734 | | Series 2006-FA7 | | 6.25% | | 12/25/2036 | | | 195,773 | |
425,681 | | Series 2007-FA2 | | 6.00% | | 04/25/2037 | | | 302,422 | |
| | Fontainebleau Miami Beach Trust | | | | | | | | |
800,000 | | Series 2012-FBLU(b) | | 4.27% | | 05/05/2017 | | | 836,905 | |
| | |
See Notes to Financial Statements. | | |
Annual Report | September 30, 2012 | | 33 |
| | |
RiverNorth/DoubleLine Strategic Income Fund | | Schedule of Investments |
| | September 30, 2012 |
| | | | | | | | | | |
| Principal Amount/Description | | Rate | | Maturity | | Fair Value | |
$300,000 | | Series 2012-FBLU(b) | | 5.25% | | 05/05/2017 | | $ | 312,893 | |
| | GMAC Commercial Mortgage Securities, Inc. | | | | | | | | |
200,000 | | Series 2006-C1(a) | | 5.29% | | 11/10/2045 | | | 210,759 | |
| | Greenwich Capital Commercial Funding Corp. | | | | | | | | |
10,000 | | Series 2004-FL2A(a)(b) | | 0.64% | | 11/05/2019 | | | 9,453 | |
250,000 | | Series 2007-GG9 | | 5.44% | | 03/10/2039 | | | 287,030 | |
| | GS Mortgage Securities Corp. II | | | | | | | | |
250,000 | | Series 2004-GG2(a) | | 5.40% | | 08/10/2038 | | | 267,985 | |
18,324,343 | | Series 2006-GG6(a)(b) | | 0.14% | | 04/10/2038 | | | 33,369 | |
250,000 | | Series 2006-GG6(a) | | 5.62% | | 04/10/2038 | | | 269,068 | |
600,000 | | Series 2007-EOP(a)(b) | | 1.26% | | 03/06/2020 | | | 599,823 | |
20,000 | | Series 2007-GG10(a) | | 5.98% | | 08/10/2045 | | | 23,006 | |
589,882 | | Series 2011-GC3(a)(b) | | 1.31% | | 03/10/2044 | | | 30,329 | |
3,952,300 | | Series 2011-GC5(a)(b) | | 1.93% | | 08/10/2044 | | | 346,008 | |
| | GSAA Trust | | | | | | | | |
751,537 | | Series 2005-7(a) | | 4.48% | | 05/25/2035 | | | 741,518 | |
850,131 | | Series 2006-18(e) | | 5.68% | | 11/25/2036 | | | 498,729 | |
283,525 | | Series 2006-6(a) | | 5.00% | | 03/25/2036 | | | 164,024 | |
1,489,536 | | Series 2007-2(e) | | 6.10% | | 03/25/2037 | | | 909,350 | |
5,132,444 | | Series 2007-8(a) | | 0.57% | | 08/25/2037 | | | 3,706,431 | |
| | GSR Mortgage Loan Trust | | | | | | | | |
2,581,525 | | Series 2005-AR4(a) | | 5.25% | | 07/25/2035 | | | 2,550,872 | |
4,089,079 | | Series 2007-AR2(a) | | 3.10% | | 05/25/2037 | | | 2,942,616 | |
| | HSI Asset Loan Obligation Trust | | | | | | | | |
829,894 | | Series 2007-2 | | 5.50% | | 09/25/2037 | | | 834,347 | |
4,359,373 | | Series 2007-2 | | 6.00% | | 09/25/2037 | | | 4,082,684 | |
| | IndyMac IMJA Mortgage Loan Trust | | | | | | | | |
5,140,552 | | Series 2007-A1 | | 6.00% | | 08/25/2037 | | | 4,544,927 | |
| | IndyMac IMSC Mortgage Loan Trust | | | | | | | | |
6,917,266 | | Series 2007-F2 | | 6.50% | | 07/25/2037 | | | 4,282,348 | |
| | IndyMac Index Mortgage Loan Trust | | | | | | | | |
8,517,076 | | Series 2005-AR31(a) | | 2.60% | | 01/25/2036 | | | 6,632,247 | |
3,503,049 | | Series 2005-AR35(a) | | 5.12% | | 02/25/2036 | | | 2,817,222 | |
2,000,000 | | Series 2007-FLX1(a) | | 0.40% | | 02/25/2037 | | | 1,855,832 | |
| | Jefferies & Co. | | | | | | | | |
2,960,137 | | Series 2010-R7(a)(b) | | 1.25% | | 09/26/2035 | | | 2,771,165 | |
| | JP Morgan Alternative Loan Trust | | | | | | | | |
879,114 | | Series 2005-S1 | | 6.00% | | 12/25/2035 | | | 753,674 | |
281,496 | | Series 2006-S1 | | 5.00% | | 02/25/2021 | | | 259,484 | |
2,432,860 | | Series 2006-S3(e) | | 6.12% | | 08/25/2036 | | | 2,307,643 | |
| | JP Morgan Chase Commercial Mortgage Securities Corp. | | | | | | | | |
315,000 | | Series 2006-CB16 | | 5.55% | | 05/12/2045 | | | 363,371 | |
| | |
See Notes to Financial Statements. | | |
34 | | (888) 848-7569 | www.rivernorthfunds.com |
| | |
RiverNorth/DoubleLine Strategic Income Fund | | Schedule of Investments |
| | September 30, 2012 |
| | | | | | | | | | |
| Principal Amount/Description | | Rate | | Maturity | | Fair Value | |
$250,000 | | Series 2006-CB17 | | 5.43% | | 12/12/2043 | | $ | 287,377 | |
8,919,203 | | Series 2006-LDP8(a) | | 0.73% | | 05/15/2045 | | | 152,322 | |
200,000 | | Series 2007-C1 | | 5.72% | | 11/15/2017 | | | 237,070 | |
600,000 | | Series 2007-CB18(a) | | 5.47% | | 02/12/2017 | | | 649,757 | |
200,000 | | Series 2007-CB19(a) | | 5.92% | | 05/12/2017 | | | 208,605 | |
90,000 | | Series 2007-CB19(a) | | 5.92% | | 02/12/2049 | | | 106,448 | |
200,000 | | Series 2007-CB20(a) | | 5.79% | | 08/12/2017 | | | 238,918 | |
300,000 | | Series 2007-CB20(a) | | 5.93% | | 09/12/2017 | | | 329,671 | |
500,000 | | Series 2007-CB20(a) | | 6.09% | | 09/12/2017 | | | 558,318 | |
500,000 | | Series 2009-RR2(b) | | 5.54% | | 02/17/2017 | | | 540,957 | |
125,000 | | Series 2011-PLSD(b) | | 3.36% | | 11/13/2016 | | | 135,732 | |
9,000,000 | | Series 2012-C8(a) | | 2.38% | | 09/15/2022 | | | 1,228,599 | |
| | JP Morgan Mortgage Acquisition Corp. | | | | | | |
500,000 | | Series 2006-CH2(e) | | 5.46% | | 10/25/2036 | | | 299,375 | |
4,000,000 | | Series 2007-CH1(e) | | 5.58% | | 05/25/2015 | | | 3,248,096 | |
| | JP Morgan Mortgage Trust | | | | | | | | |
3,383,772 | | Series 2007-S3 | | 6.00% | | 07/25/2037 | | | 3,047,838 | |
608,298 | | Series 2007-S3 | | 6.00% | | 08/25/2037 | | | 523,932 | |
| | JP Morgan Resecuritization Trust | | | | | | | | |
3,859,657 | | Series 2011-1(a)(b) | | 7.15% | | 06/26/2037 | | | 2,484,075 | |
| | LB-UBS Commercial Mortgage Trust | | | | | | | | |
650,000 | | Series 2001-C2 | | 7.29% | | 09/15/2034 | | | 653,835 | |
250,000 | | Series 2004-C2 | | 4.37% | | 03/15/2036 | | | 261,499 | |
5,129,189 | | Series 2006-C7(a)(b) | | 0.33% | | 11/15/2038 | | | 72,281 | |
3,846,892 | | Series 2006-C7(a)(b) | | 0.84% | | 11/15/2038 | | | 84,712 | |
500,000 | | Series 2007-C1 | | 5.46% | | 01/15/2017 | | | 539,273 | |
| | Lehman Mortgage Trust | | | | | | | | |
1,721,090 | | Series 2006-6 | | 5.50% | | 10/25/2036 | | | 1,216,286 | |
4,926,158 | | Series 2006-7(a) | | 0.47% | | 11/25/2036 | | | 824,461 | |
4,926,158 | | Series 2006-7(a) | | 7.53% | | 11/25/2036 | | | 1,372,699 | |
3,036,952 | | Series 2006-8(a) | | 0.64% | | 12/25/2036 | | | 1,184,758 | |
3,036,952 | | Series 2006-8(a) | | 6.36% | | 12/25/2036 | | | 753,544 | |
4,259,661 | | Series 2007-10 | | 6.00% | | 01/25/2038 | | | 4,121,358 | |
945,200 | | Series 2007-10 | | 6.50% | | 01/25/2038 | | | 899,980 | |
| | Lehman XS Trust | | | | | | | | |
1,588,460 | | Series 2006-5(e) | | 5.89% | | 04/25/2036 | | | 1,474,665 | |
| | MASTR Asset Securitization Trust | | | | | | | | |
298,504 | | Series 2003-1 | | 5.75% | | 02/25/2033 | | | 298,140 | |
313,721 | | Series 2003-2 | | 5.75% | | 04/25/2033 | | | 313,784 | |
222,605 | | Series 2005-1 | | 5.00% | | 05/25/2035 | | | 223,392 | |
| | Merrill Lynch Mortgage Trust | | | | | | | | |
450,000 | | Series 2005-CIP1(a) | | 5.11% | | 07/12/2015 | | | 496,098 | |
245,000 | | Series 2006-C1(a) | | 5.85% | | 05/12/2039 | | | 271,595 | |
| | |
See Notes to Financial Statements. | | |
Annual Report | September 30, 2012 | | 35 |
| | |
RiverNorth/DoubleLine Strategic Income Fund | | Schedule of Investments |
| | September 30, 2012 |
| | | | | | | | | | |
| Principal Amount/Description | | Rate | | Maturity | | Fair Value | |
| | Merrill Lynch/Countrywide Commercial Mortgage Trust | | | | | | | | |
$52,887 | | Series 2007-8(a) | | 6.10% | | 08/12/2049 | | $ | 56,864 | |
| | Morgan Stanley Bank of America Merrill Lynch Trust | | | | | | | | |
4,990,774 | | Series 2012-C5(a)(b) | | 2.10% | | 07/15/2022 | | | 570,381 | |
| | Morgan Stanley Capital I Trust | | | | | | | | |
95,000 | | Series 2005-HQ7(a) | | 5.38% | | 11/14/2042 | | | 104,726 | |
87,348 | | Series 2006-HQ9 | | 5.69% | | 07/12/2044 | | | 89,621 | |
150,000 | | Series 2006-HQ9(a) | | 5.77% | | 07/12/2044 | | | 167,778 | |
45,000 | | Series 2007-HQ11(a) | | 5.45% | | 02/12/2044 | | | 52,269 | |
83,253 | | Series 2007-HQ12(a) | | 5.60% | | 04/12/2049 | | | 86,277 | |
41,627 | | Series 2007-HQ12(a) | | 0.49% | | 04/12/2049 | | | 40,511 | |
750,000 | | Series 2007-IQ16(a) | | 6.30% | | 11/12/2017 | | | 838,124 | |
9,795,783 | | Series 2011-C1(a)(b) | | 1.14% | | 09/15/2047 | | | 339,806 | |
| | Morgan Stanley Mortgage Loan Trust | | | | | | | | |
7,246,328 | | Series 2005-3AR(a) | | 2.90% | | 07/25/2035 | | | 5,538,644 | |
449,454 | | Series 2006-11 | | 6.00% | | 08/25/2036 | | | 327,912 | |
2,928,912 | | Series 2006-7(a) | | 5.59% | | 06/25/2036 | | | 2,182,558 | |
2,523,621 | | Series 2006-7 | | 6.00% | | 06/25/2036 | | | 2,056,731 | |
762,379 | | Series 2007-3XS(e) | | 5.70% | | 01/25/2047 | | | 557,353 | |
| | Morgan Stanley Re-REMIC Trust | | | | | | | | |
750,000 | | Series 2010-HQ4(b) | | 4.97% | | 04/15/2040 | | | 787,649 | |
916,549 | | Series 2011-R1(a)(b) | | 5.94% | | 02/26/2037 | | | 948,628 | |
| | Nomura Asset Acceptance Corp. | | | | | | | | |
2,000,000 | | Series 2005-AP3(a) | | 5.32% | | 08/25/2035 | | | 1,419,652 | |
| | N-Star Real Estate CDO II Ltd. | | | | | | | | |
121,609 | | Series 2004-2A(a)(b) | | 0.59% | | 06/28/2039 | | | 120,393 | |
| | PHH Alternative Mortgage Trust | | | | | | | | |
4,313,359 | | Series 2007-2 | | 6.00% | | 05/25/2037 | | | 3,592,636 | |
| | Prime Mortgage Trust | | | | | | | | |
418,113 | | Series 2006-1 | | 5.50% | | 06/25/2036 | | | 389,885 | |
172,830 | | Series 2006-DR1(b) | | 5.50% | | 05/25/2035 | | | 163,936 | |
| | RBSGC Structured Trust | | | | | | | | |
609,537 | | Series 2008-B(b) | | 6.00% | | 06/25/2037 | | | 491,054 | |
| | Residential Accredit Loans, Inc. | | | | | | | | |
799,470 | | Series 2004-QS15 | | 5.25% | | 11/25/2034 | | | 754,624 | |
5,336,580 | | Series 2005-QS17 | | 6.00% | | 12/25/2035 | | | 4,553,987 | |
8,841,779 | | Series 2006-QA5(a) | | 0.47% | | 07/25/2036 | | | 5,278,648 | |
894,190 | | Series 2006-QS4 | | 6.00% | | 04/25/2036 | | | 646,586 | |
2,832,853 | | Series 2006-QS6 | | 6.00% | | 06/25/2036 | | | 2,089,070 | |
2,018,433 | | Series 2006-QS6 | | 6.00% | | 06/25/2036 | | | 1,488,481 | |
272,029 | | Series 2006-QS7(a) | | 0.62% | | 06/25/2036 | | | 149,493 | |
816,088 | | Series 2006-QS7(a) | | 5.38% | | 06/25/2036 | | | 151,273 | |
5,174,421 | | Series 2006-QS7 | | 6.00% | | 06/25/2036 | | | 3,836,228 | |
| | |
See Notes to Financial Statements. | | |
36 | | (888) 848-7569 | www.rivernorthfunds.com |
| | |
RiverNorth/DoubleLine Strategic Income Fund | | Schedule of Investments |
| | September 30, 2012 |
| | | | | | | | | | |
| Principal Amount/Description | | Rate | | Maturity | | Fair Value | |
$1,047,095 | | Series 2006-QS8(a) | | 5.33% | | 08/25/2036 | | $ | 192,726 | |
349,032 | | Series 2006-QS8(a) | | 0.67% | | 08/25/2036 | | | 198,920 | |
6,633,409 | | Series 2007-QS3 | | 6.50% | | 02/25/2037 | | | 4,965,239 | |
217,199 | | Series 2007-QS6 | | 6.25% | | 04/25/2037 | | | 159,549 | |
30,602 | | Series 2007-QS6(a) | | 53.20% | | 04/25/2037 | | | 69,531 | |
492,306 | | Series 2008-QR1 | | 6.00% | | 08/25/2036 | | | 226,837 | |
| | Residential Asset Mortgage Products, Inc. | | | | | | | | |
165,944 | | Series 2004-RS4(a) | | 5.07% | | 04/25/2034 | | | 171,260 | |
2,415,474 | | Series 2006-RS5(a) | | 0.39% | | 09/25/2036 | | | 1,927,918 | |
| | Residential Asset Securities Corp. | | | | | | | | |
2,500,000 | | Series 2004-KS6(a) | | 5.85% | | 07/25/2034 | | | 2,125,142 | |
1,640,006 | | Series 2005-KS4(a) | | 0.63% | | 05/25/2035 | | | 1,576,930 | |
8,080,199 | | Series 2006-EMX6(a) | | 0.37% | | 07/25/2036 | | | 6,362,042 | |
5,364,787 | | Series 2007-KS4(a) | | 0.40% | | 05/25/2037 | | | 4,924,488 | |
| | Residential Asset Securitization Trust | | | | | | | | |
1,064,764 | | Series 2006-A1 | | 6.00% | | 04/25/2036 | | | 884,203 | |
2,254,521 | | Series 2006-A2 | | 6.00% | | 05/25/2036 | | | 1,728,043 | |
1,494,714 | | Series 2006-A6 | | 6.50% | | 07/25/2036 | | | 984,422 | |
10,521,292 | | Series 2006-A7CB | | 6.25% | | 07/25/2036 | | | 8,893,596 | |
521,782 | | Series 2006-A8(a) | | 5.68% | | 08/25/2036 | | | 103,393 | |
1,114,344 | | Series 2006-A8 | | 6.00% | | 08/25/2036 | | | 870,130 | |
246,418 | | Series 2006-A8 | | 6.50% | | 08/25/2036 | | | 164,590 | |
3,152,999 | | Series 2007-A1 | | 6.00% | | 03/25/2037 | | | 2,366,515 | |
6,311,175 | | Series 2007-A2 | | 6.00% | | 04/25/2037 | | | 5,485,024 | |
224,787 | | Series 2007-A6 | | 6.00% | | 06/25/2037 | | | 196,586 | |
5,288,558 | | Series 2007-A7 | | 6.00% | | 07/25/2037 | | | 4,228,196 | |
| | Residential Funding Mortgage Securities I, Inc. | | | | | | | | |
3,704,800 | | Series 2006-S3 | | 5.50% | | 03/25/2036 | | | 3,279,982 | |
917,709 | | Series 2006-S6 | | 6.00% | | 07/25/2036 | | | 849,454 | |
1,502,498 | | Series 2007-S3 | | 6.00% | | 03/25/2037 | | | 1,310,433 | |
1,281,725 | | Series 2007-S6 | | 6.00% | | 06/25/2037 | | | 1,117,060 | |
| | RREF 2012 LT1 LLC | | | | | | | | |
30,613 | | Series 2012-LT1A(b) | | 4.75% | | 12/15/2013 | | | 30,647 | |
| | Structured Adjustable Rate Mortgage Loan Trust | | | | | | | | |
2,419,785 | | Series 2005-15(a) | | 2.75% | | 07/25/2035 | | | 1,743,136 | |
| | Structured Asset Securities Corp. | | | | | | | | |
2,055,765 | | Series 2003-35(a) | | 5.17% | | 12/25/2033 | | | 2,074,510 | |
1,776,290 | | Series 2004-15 | | 4.75% | | 09/25/2019 | | | 1,807,713 | |
518,684 | | Series 2005-RF1(a)(b) | | 0.57% | | 03/25/2035 | | | 423,832 | |
525,852 | | Series 2005-RF1(a)(b) | | 5.50% | | 03/25/2035 | | | 100,716 | |
| | TBW Mortgage-Backed Trust | | | | | | | | |
2,233,812 | | Series 2006-2 | | 7.00% | | 07/25/2036 | | | 920,585 | |
| | |
See Notes to Financial Statements. | | |
Annual Report | September 30, 2012 | | 37 |
| | |
RiverNorth/DoubleLine Strategic Income Fund | | Schedule of Investments |
| | September 30, 2012 |
| | | | | | | | | | |
| Principal Amount/Description | | Rate | | Maturity | | Fair Value | |
| | TIAA Seasoned Commercial Mortgage Trust | | | | | | | | |
$250,000 | | Series 2007-C4(a) | | 5.58% | | 08/15/2039 | | $ | 270,975 | |
| | UBS-Barclays Commercial Mortgage Trust | | | | | | | | |
5,000,000 | | Series 2012-C3(a)(b) | | 2.21% | | 06/10/2022 | | | 711,805 | |
| | Wachovia Bank Commercial Mortgage Trust | | | | | | | | |
125,000 | | Series 2005-C22(a) | | 5.52% | | 12/15/2044 | | | 135,510 | |
500,000 | | Series 2006-C23(a) | | 5.47% | | 01/15/2016 | | | 551,179 | |
220,000 | | Series 2006-C25(a) | | 5.92% | | 04/15/2016 | | | 256,105 | |
19,241,139 | | Series 2006-C27(a)(b) | | 0.10% | | 07/15/2045 | | | 191,065 | |
1,747,268 | | Series 2006-C29(a) | | 0.55% | | 11/15/2048 | | | 26,211 | |
| | Washington Mutual Alternative Mortgage Pass-Through Certificates | | | | | | | | |
5,268,393 | | Series 2005-1 | | 6.00% | | 03/25/2035 | | | 5,154,775 | |
192,267 | | Series 2005-9 | | 5.50% | | 11/25/2035 | | | 155,083 | |
1,349,696 | | Series 2006-5 | | 6.00% | | 07/25/2036 | | | 955,652 | |
| | Wells Fargo Alternative Loan Trust | | | | | | | | |
3,679,165 | | Series 2007-PA2 | | 6.00% | | 06/25/2037 | | | 3,304,916 | |
2,416,961 | | Series 2007-PA2(a) | | 0.65% | | 06/25/2037 | | | 1,355,729 | |
2,416,961 | | Series 2007-PA2(a) | | 5.85% | | 06/25/2037 | | | 567,159 | |
1,036,010 | | Series 2007-PA3 | | 5.75% | | 07/25/2037 | | | 861,626 | |
4,100,766 | | Series 2007-PA5 | | 6.25% | | 11/25/2037 | | | 3,883,213 | |
| | Wells Fargo Mortgage Loan Trust | | | | | | | | |
4,154,592 | | Series 2012-RR1(a)(b) | | 2.85% | | 08/27/2037 | | | 4,214,085 | |
| | Wells Fargo Mortgage-Backed | | | | | | | | |
| | Securities Trust | | | | | | | | |
7,307,686 | | Series 2005-12 | | 5.50% | | 11/25/2035 | | | 7,418,163 | |
2,923,254 | | Series 2006-11 | | 6.00% | | 09/25/2036 | | | 2,893,276 | |
665,864 | | Series 2006-2 | | 5.50% | | 03/25/2036 | | | 630,921 | |
366,276 | | Series 2006-2 | | 5.75% | | 03/25/2036 | | | 368,585 | |
1,111,663 | | Series 2007-10 | | 6.00% | | 07/25/2037 | | | 1,069,029 | |
2,933,801 | | Series 2007-13 | | 6.00% | | 09/25/2037 | | | 2,923,618 | |
3,511,338 | | Series 2007-14 | | 6.00% | | 10/25/2037 | | | 3,521,925 | |
2,938,966 | | Series 2007-2 | | 6.00% | | 03/25/2037 | | | 2,860,858 | |
5,462,210 | | Series 2007-3 | | 5.50% | | 04/25/2037 | | | 5,252,166 | |
1,773,362 | | Series 2007-5 | | 5.50% | | 05/25/2037 | | | 1,842,587 | |
3,856,359 | | Series 2007-8 | | 6.00% | | 07/25/2037 | | | 3,715,791 | |
2,221,390 | | Series 2007-8 | | 6.00% | | 07/25/2037 | | | 2,208,573 | |
| | | | | | | | | | |
| |
TOTAL NON-AGENCY COLLATERALIZED MORTGAGE OBLIGATIONS (Cost $324,926,754) | | | 354,878,676 | |
| | | | | | | | | | |
| | |
See Notes to Financial Statements. | | |
38 | | (888) 848-7569 | www.rivernorthfunds.com |
| | |
RiverNorth/DoubleLine Strategic Income Fund | | Schedule of Investments |
| | September 30, 2012 |
| | | | | | | | | | |
| Principal Amount/Description | | Rate | | Maturity | | Fair Value | |
U.S. GOVERNMENT BONDS AND NOTES - 8.53% | | | | |
$20,600,000 | | U.S. Treasury Bonds | | 3.75% | | 08/15/2041 | | $ | 24,665,286 | |
10,700,000 | | U.S. Treasury Notes | | 1.88% | | 09/30/2017 | | | 11,357,890 | |
13,950,000 | | U.S. Treasury Notes | | 2.38% | | 05/31/2018 | | | 15,197,869 | |
21,400,000 | | U.S. Treasury Notes | | 1.25% | | 04/30/2019 | | | 21,816,294 | |
3,500,000 | | U.S. Treasury Notes | | 1.00% | | 08/31/2019 | | | 3,493,984 | |
11,300,000 | | U.S. Treasury Notes | | 2.63% | | 11/15/2020 | | | 12,484,737 | |
24,300,000 | | U.S. Treasury Notes | | 1.75% | | 05/15/2022 | | | 24,655,023 | |
| | | | | | | | | | |
| |
TOTAL U.S. GOVERNMENT BONDS AND NOTES (Cost $113,710,213) | | | 113,671,083 | |
| | | | | | | | | | |
| |
U.S. GOVERNMENT /AGENCY MORTGAGE BACKED SECURITIES - 18.26% | | | | |
| | Federal Home Loan Mortgage Corp. Pool | | | | | | | | |
1,918,647 | | Series Pool #G01840 | | 5.00% | | 07/01/2035 | | | 2,084,773 | |
814,660 | | Series Pool #G04587 | | 5.50% | | 08/01/2038 | | | 887,925 | |
1,041,754 | | Series Pool #G04817 | | 5.00% | | 09/01/2038 | | | 1,129,350 | |
1,738,422 | | Series Pool #G06871 | | 6.00% | | 06/01/2038 | | | 1,914,863 | |
7,932,671 | | Series Pool #G06954 | | 6.00% | | 05/01/2040 | | | 8,725,407 | |
| | Federal Home Loan Mortgage Corp. REMICS | | | | | | | | |
5,506,813 | | Series 2003-2663 | | 5.00% | | 08/15/2033 | | | 6,321,100 | |
3,813,947 | | Series 2003-2722(a) | | 9.64% | | 12/15/2033 | | | 4,780,878 | |
950,055 | | Series 2005-R003 | | 5.50% | | 10/15/2035 | | | 1,102,785 | |
6,105,596 | | Series 2006-3244(a) | | 6.44% | | 11/15/2036 | | | 1,278,671 | |
369,831 | | Series 2007-3261(a) | | 6.21% | | 01/15/2037 | | | 65,155 | |
4,594,902 | | Series 2007-3262(a) | | 6.18% | | 01/15/2037 | | | 655,715 | |
6,484,974 | | Series 2007-3301(a) | | 5.88% | | 04/15/2037 | | | 875,841 | |
4,758,452 | | Series 2007-3303(a) | | 5.88% | | 04/15/2037 | | | 692,250 | |
8,973,080 | | Series 2007-3303(a) | | 5.86% | | 04/15/2037 | | | 1,297,597 | |
6,393,167 | | Series 2007-3382(a) | | 5.78% | | 11/15/2037 | | | 628,365 | |
5,277,242 | | Series 2007-3384(a) | | 6.09% | | 08/15/2036 | | | 656,842 | |
3,950,044 | | Series 2007-3384(a) | | 6.17% | | 11/15/2037 | | | 511,365 | |
3,993,450 | | Series 2008-3417(a) | | 5.96% | | 02/15/2038 | | | 393,087 | |
120,124,118 | | Series 2008-3423(a) | | 0.35% | | 03/15/2038 | | | 1,012,166 | |
5,470,320 | | Series 2008-3423(a) | | 5.43% | | 03/15/2038 | | | 500,704 | |
7,258,673 | | Series 2009-3510(a) | | 6.53% | | 02/15/2037 | | | 1,393,171 | |
3,175,281 | | Series 2009-3523(a) | | 5.78% | | 04/15/2039 | | | 443,025 | |
536,452 | | Series 2009-3524 | | 5.63% | | 06/15/2038 | | | 566,286 | |
436,601 | | Series 2009-3549(a) | | 5.58% | | 07/15/2039 | | | 40,372 | |
5,127,459 | | Series 2009-3560(a) | | 6.18% | | 11/15/2036 | | | 974,832 | |
3,149,454 | | Series 2010-3630(a) | | 1.93% | | 03/15/2017 | | | 98,487 | |
1,500,000 | | Series 2010-3641 | | 4.50% | | 03/15/2040 | | | 1,620,358 | |
| | |
See Notes to Financial Statements. | | |
Annual Report | September 30, 2012 | | 39 |
| | |
RiverNorth/DoubleLine Strategic Income Fund | | Schedule of Investments |
| | September 30, 2012 |
| | | | | | | | | | |
| Principal Amount/Description | | Rate | | Maturity | | Fair Value | |
$923,110 | | Series 2010-3688 | | 4.00% | | 07/15/2029 | | $ | 942,674 | |
4,087,935 | | Series 2010-3726(a) | | 5.83% | | 09/15/2040 | | | 548,082 | |
51,787 | | Series 2010-3738(a) | | 11.34% | | 10/15/2040 | | | 51,997 | |
78,955 | | Series 2010-3739(a) | | 9.56% | | 11/15/2039 | | | 81,769 | |
1,097,768 | | Series 2010-3745(a) | | 9.56% | | 10/15/2040 | | | 1,151,021 | |
214,583 | | Series 2010-3747(a) | | 14.34% | | 10/15/2040 | | | 218,707 | |
299,959 | | Series 2010-3758(a) | | 5.38% | | 05/15/2039 | | | 300,476 | |
51,165 | | Series 2010-3764(a) | | 9.46% | | 11/15/2040 | | | 51,875 | |
350,874 | | Series 2010-3766(a) | | 9.56% | | 11/15/2040 | | | 374,168 | |
250,000 | | Series 2010-3779 | | 4.00% | | 12/15/2030 | | | 275,778 | |
750,000 | | Series 2010-3779 | | 3.50% | | 12/15/2030 | | | 810,867 | |
491,680 | | Series 2010-3779 | | 4.50% | | 12/15/2040 | | | 517,491 | |
49,088 | | Series 2010-3780(a) | | 9.46% | | 12/15/2040 | | | 49,462 | |
206,241 | | Series 2011-3786(a) | | 9.06% | | 01/15/2041 | | | 221,880 | |
1,223,024 | | Series 2011-3793(a) | | 9.36% | | 01/15/2041 | | | 1,279,003 | |
1,068,821 | | Series 2011-3795 | | 4.00% | | 01/15/2041 | | | 1,160,126 | |
382,598 | | Series 2011-3796(a) | | 9.46% | | 01/15/2041 | | | 388,212 | |
336,772 | | Series 2011-3798(a) | | 9.06% | | 11/15/2040 | | | 363,606 | |
219,960 | | Series 2011-3805(a) | | 9.06% | | 02/15/2041 | | | 228,947 | |
1,636,156 | | Series 2011-3806 | | 5.50% | | 07/15/2034 | | | 1,955,977 | |
600,000 | | Series 2011-3808 | | 3.50% | | 02/15/2031 | | | 648,017 | |
157,881 | | Series 2011-3809(a) | | 9.01% | | 02/15/2041 | | | 166,882 | |
6,980,569 | | Series 2011-3815(a) | | 5.63% | | 02/15/2041 | | | 886,567 | |
3,276,933 | | Series 2011-3818 | | 4.50% | | 01/15/2040 | | | 3,399,680 | |
500,000 | | Series 2011-3824 | | 3.50% | | 03/15/2031 | | | 539,821 | |
2,000,000 | | Series 2011-3824(a) | | 6.88% | | 08/15/2036 | | | 458,842 | |
788,712 | | Series 2011-3838(a) | | 8.38% | | 04/15/2041 | | | 804,054 | |
619,768 | | Series 2011-3857(a) | | 8.82% | | 05/15/2041 | | | 673,595 | |
1,560,078 | | Series 2011-3863 | | 5.50% | | 08/15/2034 | | | 1,855,204 | |
1,695,325 | | Series 2011-3864(a) | | 8.71% | | 05/15/2041 | | | 1,811,245 | |
1,071,000 | | Series 2011-3871 | | 5.50% | | 06/15/2041 | | | 1,299,867 | |
7,740,575 | | Series 2011-3872(a) | | 5.73% | | 06/15/2041 | | | 928,877 | |
2,595,212 | | Series 2011-3877 | | 4.50% | | 06/15/2041 | | | 2,911,776 | |
1,885,844 | | Series 2011-3888 | | 4.00% | | 07/15/2041 | | | 2,044,812 | |
2,950,637 | | Series 2011-3894 | | 4.50% | | 07/15/2041 | | | 3,250,629 | |
69,568 | | Series 2011-3899(a) | | 12.77% | | 07/15/2041 | | | 70,002 | |
2,111,083 | | Series 2011-3910 | | 5.00% | | 08/15/2041 | | | 2,495,930 | |
6,703,485 | | Series 2011-3924(a) | | 5.78% | | 09/15/2041 | | | 1,005,710 | |
1,053,586 | | Series 2011-3924(a) | | 9.10% | | 09/15/2041 | | | 1,105,511 | |
7,222,609 | | Series 2011-3925 | | 3.00% | | 09/15/2021 | | | 356,927 | |
2,007,039 | | Series 2012-4003(a) | | 6.50% | | 11/15/2041 | | | 2,028,695 | |
3,030,100 | | Series 2012-4057 | | 4.00% | | 06/15/2042 | | | 3,463,641 | |
| | |
See Notes to Financial Statements. | | |
40 | | (888) 848-7569 | www.rivernorthfunds.com |
| | |
RiverNorth/DoubleLine Strategic Income Fund | | Schedule of Investments |
| | September 30, 2012 |
| | | | | | | | | | |
| Principal Amount/Description | | Rate | | Maturity | | Fair Value | |
| | Federal Home Loan Mortgage Corp. Strips | | | | | | | | |
$7,978,382 | | Series 2012-269 | | 3.00% | | 08/15/2042 | | $ | 8,368,666 | |
| | Federal National Mortgage Association Pool | | | | | | | | |
538,675 | | Series Pool #555743 | | 5.00% | | 09/01/2033 | | | 591,833 | |
645,930 | | Series Pool #735382 | | 5.00% | | 04/01/2035 | | | 705,736 | |
1,645,701 | | Series Pool #735383 | | 5.00% | | 04/01/2035 | | | 1,798,075 | |
1,230,559 | | Series Pool #735484 | | 5.00% | | 05/01/2035 | | | 1,348,040 | |
2,375,826 | | Series Pool #889509 | | 6.00% | | 05/01/2038 | | | 2,631,068 | |
3,188,662 | | Series Pool #965025 | | 6.50% | | 09/01/2038 | | | 3,601,980 | |
2,538,351 | | Series Pool #995581 | | 6.00% | | 01/01/2039 | | | 2,808,639 | |
277,521 | | Series Pool #AH1140 | | 4.50% | | 12/01/2040 | | | 294,361 | |
397,532 | | Series Pool #AH4437 | | 4.00% | | 01/01/2041 | | | 420,150 | |
2,500,050 | | Series Pool #AH7309 | | 4.00% | | 02/01/2031 | | | 2,714,172 | |
3,101,598 | | Series Pool #AI6658 | | 4.00% | | 08/01/2041 | | | 3,278,069 | |
4,526,576 | | Series Pool #AK4039 | | 4.00% | | 02/01/2042 | | | 4,784,124 | |
4,727,894 | | Series Pool #AL1690 | | 6.00% | | 05/01/2041 | | | 5,235,826 | |
4,125,771 | | Series Pool #AL1744 | | 6.00% | | 10/01/2040 | | | 4,569,015 | |
1,834,707 | | Series Pool #MA0264 | | 4.50% | | 12/01/2029 | | | 1,990,185 | |
3,653,602 | | Series Pool #MA0353 | | 4.50% | | 03/01/2030 | | | 3,973,084 | |
1,314,148 | | Series Pool #MA0871 | | 4.00% | | 10/01/2041 | | | 1,388,919 | |
3,657,281 | | Series Pool #MA1050 | | 4.50% | | 03/01/2042 | | | 3,879,208 | |
2,177,172 | | Series Pool #MA1068 | | 3.50% | | 05/01/2042 | | | 2,284,087 | |
3,707,878 | | Series Pool #MA1117 | | 3.50% | | 07/01/2042 | | | 3,889,961 | |
3,762,114 | | Series Pool #MA3894 | | 4.00% | | 09/01/2031 | | | 4,084,328 | |
| | Federal National Mortgage Association REMICS | | | | | | | | |
4,720,126 | | Series 2003-92 | | 5.00% | | 09/25/2033 | | | 5,464,678 | |
536,489 | | Series 2004-46(a) | | 5.78% | | 03/25/2034 | | | 80,814 | |
4,112,466 | | Series 2005-104(a) | | 6.48% | | 12/25/2033 | | | 445,257 | |
1,387,966 | | Series 2006-101(a) | | 6.36% | | 10/25/2036 | | | 245,397 | |
3,857,107 | | Series 2006-123(a) | | 6.10% | | 01/25/2037 | | | 689,562 | |
956,278 | | Series 2007-102(a) | | 6.18% | | 11/25/2037 | | | 158,434 | |
2,095,590 | | Series 2007-108(a) | | 6.14% | | 12/25/2037 | | | 298,064 | |
296,744 | | Series 2007-30(a) | | 5.89% | | 04/25/2037 | | | 35,172 | |
5,039,993 | | Series 2007-38(a) | | 5.86% | | 05/25/2037 | | | 561,894 | |
333,354 | | Series 2007-51(a) | | 5.88% | | 06/25/2037 | | | 44,407 | |
735,927 | | Series 2007-53(a) | | 5.88% | | 06/25/2037 | | | 105,797 | |
4,127,451 | | Series 2007-57(a) | | 6.40% | | 10/25/2036 | | | 647,395 | |
5,399,404 | | Series 2007-68(a) | | 6.43% | | 07/25/2037 | | | 747,823 | |
1,478,857 | | Series 2008-14 | | 5.50% | | 03/25/2038 | | | 1,689,570 | |
4,455,258 | | Series 2008-3(a) | | 6.24% | | 02/25/2038 | | | 685,268 | |
5,205,439 | | Series 2008-56(a) | | 5.84% | | 07/25/2038 | | | 728,418 | |
1,610,700 | | Series 2008-81 | | 5.50% | | 09/25/2038 | | | 1,763,652 | |
| | |
See Notes to Financial Statements. | | |
Annual Report | September 30, 2012 | | 41 |
| | |
RiverNorth/DoubleLine Strategic Income Fund | | Schedule of Investments |
| | September 30, 2012 |
| | | | | | | | | | |
| Principal Amount/Description | | Rate | | Maturity | | Fair Value | |
$2,867,685 | | Series 2009-111 | | 5.00% | | 01/25/2040 | | $ | 3,212,897 | |
5,261,578 | | Series 2009-111(a) | | 6.03% | | 01/25/2040 | | | 579,952 | |
3,639,868 | | Series 2009-12(a) | | 6.38% | | 03/25/2036 | | | 751,502 | |
665,727 | | Series 2009-28(a) | | 5.78% | | 04/25/2037 | | | 76,405 | |
1,742,263 | | Series 2009-41 | | 4.50% | | 06/25/2039 | | | 1,880,286 | |
2,658,462 | | Series 2009-42(a) | | 5.78% | | 06/25/2039 | | | 288,509 | |
5,662,760 | | Series 2009-47(a) | | 5.88% | | 07/25/2039 | | | 651,268 | |
3,709,517 | | Series 2009-62(a) | | 5.88% | | 08/25/2039 | | | 400,364 | |
1,231,451 | | Series 2009-66(a) | | 5.58% | | 02/25/2038 | | | 129,506 | |
1,625,302 | | Series 2009-68(a) | | 5.03% | | 09/25/2039 | | | 176,097 | |
3,762,000 | | Series 2009-80 | | 4.50% | | 10/25/2039 | | | 4,261,037 | |
244,825 | | Series 2010-109(a) | | 52.30% | | 10/25/2040 | | | 344,042 | |
8,014,518 | | Series 2010-11(a) | | 4.58% | | 02/25/2040 | | | 632,778 | |
1,295,741 | | Series 2010-111(a) | | 5.78% | | 10/25/2040 | | | 163,489 | |
541,571 | | Series 2010-112 | | 4.00% | | 10/25/2040 | | | 585,180 | |
3,425,032 | | Series 2010-115(a) | | 6.38% | | 11/25/2039 | | | 391,217 | |
7,007,627 | | Series 2010-15(a) | | 4.73% | | 03/25/2040 | | | 670,777 | |
1,403,132 | | Series 2010-34(a) | | 4.71% | | 04/25/2040 | | | 82,783 | |
360,288 | | Series 2010-4(a) | | 6.01% | | 02/25/2040 | | | 69,956 | |
1,000,000 | | Series 2010-58(a) | | 11.91% | | 06/25/2040 | | | 1,219,132 | |
2,498,124 | | Series 2010-75 | | 4.50% | | 07/25/2040 | | | 2,754,621 | |
1,238,509 | | Series 2010-9(a) | | 5.08% | | 02/25/2040 | | | 138,766 | |
7,481,749 | | Series 2010-9(a) | | 4.53% | | 02/25/2040 | | | 599,408 | |
302,413 | | Series 2010-90(a) | | 5.78% | | 08/25/2040 | | | 28,483 | |
3,701,645 | | Series 2011-127 | | 4.00% | | 12/25/2041 | | | 3,664,314 | |
4,636,814 | | Series 2011-141 | | 4.00% | | 01/25/2042 | | | 4,984,506 | |
500,000 | | Series 2011-16 | | 3.50% | | 03/25/2031 | | | 536,538 | |
95,468 | | Series 2011-18(a) | | 9.05% | | 03/25/2041 | | | 97,768 | |
38,666 | | Series 2011-2(a) | | 9.14% | | 02/25/2041 | | | 38,820 | |
2,672,052 | | Series 2011-2 | | 4.00% | | 02/25/2041 | | | 2,886,107 | |
1,000,000 | | Series 2011-25 | | 3.00% | | 04/25/2026 | | | 1,058,033 | |
500,000 | | Series 2011-29 | | 3.50% | | 04/25/2031 | | | 536,480 | |
1,200,000 | | Series 2011-48(a) | | 8.77% | | 06/25/2041 | | | 1,380,090 | |
8,325,075 | | Series 2011-5(a) | | 6.18% | | 11/25/2040 | | | 772,671 | |
5,448,614 | | Series 2011-58(a) | | 6.33% | | 07/25/2041 | | | 1,143,620 | |
1,226,520 | | Series 2011-72 | | 5.50% | | 04/25/2037 | | | 1,478,449 | |
1,778,689 | | Series 2011-77 | | 4.00% | | 08/25/2041 | | | 1,797,896 | |
11,433 | | Series 2011-8(a) | | 9.17% | | 02/25/2041 | | | 11,534 | |
8,164,769 | | Series 2012-20 | | 3.50% | | 03/25/2042 | | | 8,378,352 | |
8,253,997 | | Series 2012-29(a) | | 5.78% | | 04/25/2042 | | | 766,705 | |
4,869,009 | | Series 2012-32 | | 5.00% | | 04/25/2042 | | | 709,833 | |
2,658,502 | | Series 2012-55(a) | | 6.63% | | 05/25/2042 | | | 2,695,267 | |
4,404,292 | | Series 2012-92 | | 3.50% | | 08/25/2042 | | | 4,474,589 | |
| | |
See Notes to Financial Statements. | | |
42 | | (888) 848-7569 | www.rivernorthfunds.com |
| | |
RiverNorth/DoubleLine Strategic Income Fund | | Schedule of Investments |
| | September 30, 2012 |
| | | | | | | | | | | | | | |
| Principal Amount/Description | | Rate | | | Maturity | | | Fair Value | |
| | Government National Mortgage Association | | | | | | | | | | | | |
$298,281 | | Series 2004-83(a) | | | 5.84 | % | | | 10/20/2034 | | | $ | 45,518 | |
338,117 | | Series 2008-6(a) | | | 6.22 | % | | | 02/20/2038 | | | | 54,658 | |
317,517 | | Series 2008-67(a) | | | 5.76 | % | | | 08/20/2038 | | | | 46,616 | |
4,767,771 | | Series 2008-69(a) | | | 7.39 | % | | | 08/20/2038 | | | | 799,555 | |
242,558 | | Series 2009-10(a) | | | 6.41 | % | | | 02/16/2039 | | | | 56,880 | |
2,323,017 | | Series 2009-35 | | | 4.50 | % | | | 05/20/2039 | | | | 2,644,260 | |
360,465 | | Series 2009-6(a) | | | 5.71 | % | | | 02/20/2038 | | | | 53,510 | |
4,065,153 | | Series 2009-75 | | | 5.00 | % | | | 09/20/2039 | | | | 4,799,287 | |
644,366 | | Series 2010-61(a) | | | 6.31 | % | | | 09/20/2039 | | | | 97,881 | |
4,580,851 | | Series 2010-98 | | | 5.95 | % | | | 03/20/2039 | | | | 470,000 | |
206,502 | | Series 2011-12(h) | | | 0.00 | % | | | 12/20/2040 | | | | 191,930 | |
2,674,238 | | Series 2011-45 | | | 4.50 | % | | | 03/20/2041 | | | | 3,055,100 | |
4,349,764 | | Series 2011-69(h) | | | 0.00 | % | | | 05/20/2041 | | | | 4,017,455 | |
2,123,435 | | Series 2011-71 | | | 4.50 | % | | | 02/20/2041 | | | | 2,420,380 | |
8,164,477 | | Series 2011-71(a) | | | 5.18 | % | | | 05/20/2041 | | | | 1,088,431 | |
2,544,544 | | Series 2011-72(a) | | | 5.91 | % | | | 05/20/2041 | | | | 377,262 | |
13,010,124 | | Series 2011-89(a) | | | 5.23 | % | | | 06/20/2041 | | | | 1,742,433 | |
5,977,780 | | Series 2012-105(a) | | | 5.98 | % | | | 01/20/2041 | | | | 968,245 | |
| | | | | | | | | | | | | | |
| |
TOTAL U.S. GOVERNMENT / AGENCY MORTGAGE BACKED SECURITIES (Cost $238,328,867) | | | | 243,290,328 | |
| | | | | | | | | | | | | | |
| | | |
| Shares/Description | | | | | | | | Fair Value | |
RIGHTS - 0.00%(f) | | | | | | | | | | | | |
3,500 | | Helios Total Return Fund, Inc., Expires 10/19/2012(i) | | | | | | | | | | | 2,660 | |
| | | | | | | | | | | | | | |
| | | |
TOTAL RIGHTS (Cost $0) | | | | | | | | | | | 2,660 | �� |
| | | | | | | | | | | | | | |
| | | |
SHORT-TERM SECURITY - 0.88% | | | | | | | | | | | | |
11,750,000 | | U.S. Treasury Bills, Discount Notes, 1.25%, Due 12/06/2012(j) | | | | | | | | | | | 11,748,390 | |
| | | | | | | | | | | | | | |
| | | |
TOTAL SHORT-TERM SECURITY (Cost $11,747,328) | | | | | | | | | | | 11,748,390 | |
| | | | | | | | | | | | | | |
| | | |
TOTAL INVESTMENTS - 86.43% (Cost $1,089,789,386) | | | | | | | | | | | 1,151,374,786 | |
CASH - 13.74% | | | | | | | | | | | 183,070,748 | |
LIABILITIES IN EXCESS OF OTHER ASSETS - (0.17)% | | | | | | | | | | | (2,295,087) | |
| | | | | | | | | | | | | | |
NET ASSETS - 100.00% | | | | | | | | | | $ | 1,332,150,447 | |
| | | | | | | | | | | | | | |
| | |
See Notes to Financial Statements. | | |
Annual Report | September 30, 2012 | | 43 |
| | |
RiverNorth/DoubleLine Strategic Income Fund | | Schedule of Investments |
| | September 30, 2012 |
| (a) | Floating or variable rate security. Interest rate disclosed is that which is in effect at September 30, 2012. |
| (b) | Security exempt from registration under Rule 144A of the Securities Act of 1933. These securities have been deemed liquid under procedures approved by the Fund’s Board of Trustees and may normally be sold to qualified institutional buyers in transactions exempt from registration. Total fair value of Rule 144A securities amounts to $58,813,070, which represents approximately 4.41% of net assets as of September 30, 2012. |
| (c) | Securities were purchased pursuant to Regulation S under the Securities Act of 1933, which exempts securities offered and sold outside of the United States from registration. Such securities cannot be sold in the United States without either an effective registration statement filed pursuant to the Securities Act of 1933, or pursuant to an exemption from registration. These securities have been deemed liquid under procedures approved by the Fund’s Board of Trustees. As of September 30, 2012, the aggregate fair value of those securities was $42,016,487, representing 3.15% of net assets. |
| (d) | This security has no contractual maturity date, is not redeemable and contractually pays an indefinite stream of interest. |
| (e) | Step bond. Coupon increases periodically based upon a predetermined schedule. Interest rate disclosed is that which is in effect at September 30, 2012. |
| (f) | Less than 0.005% of net assets. |
| (g) | Security is currently in default/non-income producing. |
| (h) | Zero coupon bond. Interest rate reflects effective yield on the date of purchase. |
| (i) | Non-income producing security. |
| (j) | Rate shown represents the bond equivalent yield to maturity at date of purchase. |
Common Abbreviations:
Bhd - Berhad, a Malaysian public limited company.
BV - Besloten Vennootschap a Dutch private limited liability company.
CDO - Collateralized Debt Obligation.
JSC - Joint Stock Company.
LLC - Limited Liability Corp.
LP - Limited Partnership.
Ltd. - Limited.
MLP – Master Limited Partnership.
MTN - Medium-Term Note.
NV - Naamloze Vennootschap is the Dutch term for a public limited liability corporation.
OJSC - Open Joint Stock Company.
PLC - Public Limited Co.
Pty. - Proprietary.
REMICS - Real Estate Mortgage Investment Conduits.
Re-REMICS - Re-securitized Real Estate Mortgage Investment Conduits.
SA - Generally designates corporations in various countries, mostly those employing the civil law.
SAA - Sociedad Anónima Abierta - A publicly traded corporation.
SAB de CV - A variable capital company.
SAC - Sociedad Anónima Cerrada - A privately held corporation.
SARL - Société à responsabilité limitée, is a private limited liability corporate entity.
SPV - Special Purpose Vehicle.
| | |
See Notes to Financial Statements. | | |
44 | | (888) 848-7569 | www.rivernorthfunds.com |
| | |
RiverNorth/Manning & Napier Dividend Income Fund | | Schedule of Investments |
| | September 30, 2012 |
| | | | | | |
| Shares/Description | | Fair Value | |
CLOSED-END FUNDS - 44.39% | | | | |
28,819 | | Adams Express Co. | | $ | 326,808 | |
4,626 | | Clough Global Allocation Fund | | | 62,636 | |
32,580 | | Eaton Vance Enhanced Equity Income Fund | | | 360,986 | |
14,800 | | Eaton Vance Enhanced Equity Income Fund II | | | 163,984 | |
54,670 | | Eaton Vance Risk-Managed Diversified Equity Income Fund | | | 575,675 | |
47,300 | | Eaton Vance Tax-Managed Diversified Equity Income Fund | | | 449,823 | |
7,200 | | Eaton Vance Tax-Managed Global Buy-Write Opportunities Fund | | | 79,920 | |
4,000 | | Eaton Vance Tax-Managed Global Diversified Equity Income Fund | | | 35,240 | |
6,000 | | Kayne Anderson MLP Investment Co. | | | 187,440 | |
57,566 | | Liberty All Star® Equity Fund | | | 278,044 | |
4,118 | | Nuveen Energy MLP Total Return Fund | | | 77,624 | |
9,669 | | Reaves Utility Income Fund | | | 244,432 | |
33,018 | | Royce Focus Trust, Inc. | | | 221,881 | |
5,900 | | Royce Value Trust, Inc. | | | 77,113 | |
7,502 | | Tri-Continental Corp. | | | 121,683 | |
| | | | | | |
| |
TOTAL CLOSED-END FUNDS (Cost $3,168,396) | | | 3,263,289 | |
| | | | | | |
| |
COMMON STOCK - 33.49% | | | | |
Basic Materials - 2.18% | | | | |
74 | | Air Products & Chemicals, Inc. | | | 6,120 | |
404 | | ArcelorMittal | | | 5,834 | |
1,053 | | BHP Billiton PLC, ADR | | | 65,770 | |
469 | | EI du Pont de Nemours & Co. | | | 23,577 | |
226 | | Freeport-McMoRan Copper & Gold, Inc. | | | 8,945 | |
146 | | International Paper Co. | | | 5,303 | |
76 | | PPG Industries, Inc. | | | 8,728 | |
294 | | Sasol, Ltd., ADR | | | 13,106 | |
310 | | Southern Copper Corp. | | | 10,652 | |
141 | | Teck Resources, Ltd. | | | 4,152 | |
286 | | The Dow Chemical Co. | | | 8,281 | |
| | | | | | |
| | | | | 160,468 | |
| | | | | | |
| |
Communications - 1.23% | | | | |
384 | | Corning, Inc. | | | 5,050 | |
258 | | Mobile Telesystems OJSC, ADR | | | 4,520 | |
1,000 | | NTT DOCOMO, Inc., ADR | | | 16,160 | |
124 | | Omnicom Group, Inc. | | | 6,394 | |
360 | | Pearson PLC, ADR | | | 7,034 | |
| | |
See Notes to Financial Statements. | | |
Annual Report | September 30, 2012 | | 45 |
| | |
RiverNorth/Manning & Napier Dividend Income Fund | | Schedule of Investments |
| | September 30, 2012 |
| | | | | | |
| Shares/Description | | Fair Value | |
228 | | Rogers Communications, Inc. | | $ | 9,211 | |
1,700 | | Telefonaktiebolaget LM Ericsson, ADR | | | 15,521 | |
142 | | The McGraw-Hill Cos., Inc. | | | 7,752 | |
437 | | Thomson Reuters Corp. | | | 12,612 | |
121 | | Viacom, Inc., Class B | | | 6,484 | |
| | | | | | |
| | | | | 90,738 | |
| | | | | | |
| |
Consumer, Cyclical - 3.24% | | | | |
79 | | Genuine Parts Co. | | | 4,821 | |
89 | | Kohl’s Corp. | | | 4,559 | |
150 | | Ltd. Brands, Inc. | | | 7,389 | |
82 | | Magna International, Inc. | | | 3,547 | |
166 | | Mattel, Inc. | | | 5,888 | |
510 | | McDonald’s Corp. | | | 46,792 | |
276 | | Staples, Inc. | | | 3,180 | |
238 | | Target Corp. | | | 15,106 | |
747 | | The Home Depot, Inc. | | | 45,096 | |
206 | | Walgreen Co. | | | 7,507 | |
1,276 | | Wal-Mart Stores, Inc. | | | 94,169 | |
| | | | | | |
| | | | | 238,054 | |
| | | | | | |
| |
Consumer, Non-cyclical - 13.84% | | | | |
735 | | Abbott Laboratories | | | 50,392 | |
168 | | Amgen, Inc. | | | 14,161 | |
238 | | Archer-Daniels-Midland Co. | | | 6,469 | |
648 | | AstraZeneca PLC, ADR | | | 31,013 | |
244 | | Automatic Data Processing, Inc. | | | 14,313 | |
168 | | Avon Products, Inc. | | | 2,680 | |
241 | | Baxter International, Inc. | | | 14,525 | |
85 | | Becton Dickinson and Co. | | | 6,678 | |
805 | | Bristol-Myers Squibb Co. | | | 27,169 | |
161 | | Campbell Soup Co. | | | 5,606 | |
121 | | Cardinal Health, Inc. | | | 4,715 | |
191 | | Colgate-Palmolive Co. | | | 20,479 | |
140 | | ConAgra Foods, Inc. | | | 3,863 | |
566 | | Eli Lilly & Co. | | | 26,834 | |
318 | | General Mills, Inc. | | | 12,672 | |
1,518 | | GlaxoSmithKline PLC, ADR | | | 70,192 | |
152 | | HJ Heinz Co. | | | 8,504 | |
1,317 | | Johnson & Johnson | | | 90,754 | |
174 | | Kellogg Co. | | | 8,989 | |
193 | | Kimberly-Clark Corp. | | | 16,556 | |
70 | | Lorillard, Inc. | | | 8,151 | |
339 | | Medtronic, Inc. | | | 14,618 | |
1,395 | | Merck & Co., Inc | | | 62,908 | |
941 | | Novartis AG, ADR | | | 57,646 | |
642 | | PepsiCo, Inc. | | | 45,434 | |
| | |
See Notes to Financial Statements. | | |
46 | | (888) 848-7569 | www.rivernorthfunds.com |
| | |
RiverNorth/Manning & Napier Dividend Income Fund | | Schedule of Investments |
| | September 30, 2012 |
| | | | | | |
| Shares/Description | | Fair Value | |
3,641 | | Pfizer, Inc. | | $ | 90,479 | |
913 | | Philip Morris International, Inc. | | | 82,115 | |
969 | | Sanofi, ADR | | | 41,725 | |
297 | | Sysco Corp. | | | 9,287 | |
2,192 | | The Coca-Cola Co. | | | 83,143 | |
107 | | The Hershey Co. | | | 7,585 | |
56 | | The JM Smucker Co. | | | 4,834 | |
1,045 | | The Procter & Gamble Co. | | | 72,481 | |
| | | | | | |
| | | | | 1,016,970 | |
| | | | | | |
| |
Energy - 5.46% | | | | |
1,150 | | BP PLC, ADR | | | 48,714 | |
844 | | Chevron Corp. | | | 98,377 | |
647 | | ConocoPhillips | | | 36,995 | |
1,100 | | Exxon Mobil Corp. | | | 100,595 | |
182 | | Marathon Oil Corp. | | | 5,382 | |
197 | | Occidental Petroleum Corp. | | | 16,954 | |
316 | | Phillips 66 | | | 14,653 | |
766 | | Royal Dutch Shell PLC, ADR | | | 53,168 | |
1,027 | | Statoil ASA, ADR | | | 26,486 | |
| | | | | | |
| | | | | 401,324 | |
| | | | | | |
| |
Financial - 0.13% | | | | |
278 | | Marsh & McLennan Cos., Inc. | | | 9,433 | |
| | | | | | |
| | | | | 9,433 | |
| | | | | | |
| |
Industrial - 4.31% | | | | |
372 | | 3M Co. | | | 34,380 | |
1,033 | | ABB, Ltd., ADR | | | 19,317 | |
236 | | CSX Corp. | | | 4,897 | |
89 | | Deere & Co. | | | 7,340 | |
101 | | Dover Corp. | | | 6,008 | |
122 | | Eaton Corp. | | | 5,767 | |
415 | | Emerson Electric Co. | | | 20,032 | |
141 | | General Dynamics Corp. | | | 9,323 | |
346 | | Honeywell International, Inc. | | | 20,673 | |
247 | | Illinois Tool Works, Inc. | | | 14,689 | |
548 | | Koninklijke Philips Electronics NV | | | 12,851 | |
120 | | Norfolk Southern Corp. | | | 7,636 | |
128 | | Northrop Grumman Corp. | | | 8,503 | |
142 | | Raytheon Co. | | | 8,117 | |
337 | | Siemens AG, ADR | | | 33,751 | |
59 | | Stanley Black & Decker, Inc. | | | 4,499 | |
165 | | TE Connectivity, Ltd. | | | 5,612 | |
253 | | The Boeing Co. | | | 17,607 | |
104 | | Union Pacific Corp. | | | 12,345 | |
335 | | United Parcel Service, Inc., Class B | | | 23,976 | |
408 | | United Technologies Corp. | | | 31,942 | |
| | |
See Notes to Financial Statements. | | |
Annual Report | September 30, 2012 | | 47 |
| | |
RiverNorth/Manning & Napier Dividend Income Fund | | Schedule of Investments |
| | September 30, 2012 |
| | | | | | |
| Shares/Description | | Fair Value | |
244 | | Waste Management, Inc. | | $ | 7,827 | |
| | | | | | |
| | | | | 317,092 | |
| | | | | | |
| |
Technology - 2.82% | | | | |
170 | | Accenture PLC, Class A | | | 11,905 | |
112 | | Analog Devices, Inc. | | | 4,388 | |
505 | | Applied Materials, Inc. | | | 5,638 | |
535 | | Canon, Inc., ADR | | | 17,125 | |
476 | | Hewlett-Packard Co. | | | 8,120 | |
2,765 | | Intel Corp. | | | 62,641 | |
129 | | Linear Technology Corp. | | | 4,105 | |
2,863 | | Microsoft Corp. | | | 85,203 | |
297 | | Texas Instruments, Inc. | | | 8,184 | |
| | | | | | |
| | | | | 207,309 | |
| | | | | | |
| |
Utilities - 0.28% | | | | |
48 | | Cia de Saneamento Basico do Estado de Sao Paulo, ADR | | | 3,898 | |
313 | | Cia Energetica de Minas Gerais, ADR | | | 3,794 | |
277 | | Enersis SA, ADR | | | 4,540 | |
251 | | Public Service Enterprise Group, Inc. | | | 8,077 | |
| | | | | | |
| | | | | 20,309 | |
| | | | | | |
| |
TOTAL COMMON STOCK (Cost $2,452,246) | | | 2,461,697 | |
| | | | | | |
| |
EXCHANGE-TRADED FUNDS - 20.28% | | | | |
20,650 | | iShares Russell 1000 Value Index Fund | | | 1,490,517 | |
| | | | | | |
| |
TOTAL EXCHANGE-TRADED FUNDS (Cost $1,444,086) | | | 1,490,517 | |
| | | | | | |
| |
TOTAL INVESTMENTS - 98.16% (Cost $7,064,728) | | | 7,215,503 | |
CASH - 8.18% | | | 601,645 | |
LIABILITIES IN EXCESS OF OTHER ASSETS - (6.34)% | | | (466,151) | |
| | | | | | |
NET ASSETS - 100.00% | | $ | 7,350,997 | |
| | | | | | |
Common Abbreviations:
ADR – American Depositary Receipt.
MLP – Master Limited Partnership.
PLC - Public Limited Company.
| | |
See Notes to Financial Statements. | | |
48 | | (888) 848-7569 | www.rivernorthfunds.com |
| | |
RiverNorth Core Opportunity Fund | | |
Statement of Assets and Liabilities | | September 30, 2012 |
| | | | |
ASSETS: | | | | |
Investment in securities: | | | | |
At cost | | $ | 359,654,853 | |
| | | | |
At fair value | | $ | 429,045,228 | |
| |
Cash | | | 136,665,713 | |
Receivable for fund investments sold | | | 3,811,923 | |
Receivable for fund shares sold | | | 1,372,335 | |
Dividends receivable | | | 445,492 | |
Prepaid expenses and other assets | | | 18,054 | |
Total Assets | | | 571,358,745 | |
| |
LIABILITIES: | | | | |
Facility loan fee payable | | | 5,736 | |
Payable for fund investments purchased | | | 680,974 | |
Payable for fund shares redeemed | | | 620,150 | |
Payable to Adviser | | | 464,958 | |
Payable for Fund Accounting and Administration fees | | | 13,657 | |
Accrued 12b-1 fees | | | 116,239 | |
Payable to Trustees and Officers | | | 3,224 | |
Payable for Excise Tax | | | 85,290 | |
Other accrued expenses | | | 44,715 | |
Total Liabilities | | | 2,034,943 | |
Net Assets | | $ | 569,323,802 | |
| | | | | |
| |
NET ASSETS CONSIST OF: | | | | |
Paid-in capital | | $ | 479,472,742 | |
Accumulated net investment loss | | | (349,296) | |
Accumulated net realized gain on investments | | | 20,809,981 | |
Net unrealized appreciation on investments | | | 69,390,375 | |
Net Assets | | $ | 569,323,802 | |
| | | | | |
| |
PRICING OF SHARES: | | | | |
Net Assets | | $ | 569,323,802 | |
Shares of beneficial interest outstanding
(unlimited number of shares, no par value) | | | 46,017,816 | |
Net Asset Value Per Share, Offering and Redemption Price Per Share | | $ | 12.37 | |
| | | | | |
Minimum Redemption Price Per Share(a) | | $ | 12.12 | |
| | | | | |
| (a) | The Fund will impose a 2.00% redemption fee on shares redeemed within 90 days of purchase. |
| | |
See Notes to Financial Statements. | | |
Annual Report | September 30, 2012 | | 49 |
| | |
RiverNorth/DoubleLine Strategic Income Fund | | |
Statement of Assets and Liabilities | | September 30, 2012 |
| | | | |
ASSETS: | | | | |
Investment in securities: | | | | |
At cost | | $ | 1,089,789,386 | |
| | | | |
At fair value | | $ | 1,151,374,786 | |
| |
Cash | | | 183,070,748 | |
Interest receivable | | | 6,291,075 | |
Receivable for fund investments sold | | | 2,557,362 | |
Receivable for fund shares sold | | | 1,371,564 | |
Dividends receivable | | | 820,077 | |
Prepaid expenses and other assets | | | 72,166 | |
Total Assets | | | 1,345,557,778 | |
| |
LIABILITIES: | | | | |
Facility loan fee payable | | | 14,138 | |
Payable for fund investments purchased | | | 11,803,319 | |
Payable for fund shares redeemed | | | 542,363 | |
Payable to Adviser | | | 801,018 | |
Payable for Fund Accounting and Administration fees | | | 54,666 | |
Accrued 12b-1 fees - Class R Shares | | | 90,781 | |
Payable to Trustees and Officers | | | 7,482 | |
Other accrued expenses | | | 93,564 | |
Total Liabilities | | | 13,407,331 | |
Net Assets | | $ | 1,332,150,447 | |
| | | | | |
| |
NET ASSETS CONSIST OF: | | | | |
Paid-in capital | | $ | 1,261,964,384 | |
Accumulated net investment income | | | 261,199 | |
Accumulated net realized gain on investments | | | 8,339,464 | |
Net unrealized appreciation on investments | | | 61,585,400 | |
Net Assets | | $ | 1,332,150,447 | |
| | | | | |
| |
PRICING OF SHARES: | | | | |
Class I Shares | | | | |
Net Assets | | $ | 878,630,584 | |
Shares of beneficial interest outstanding
(unlimited number of shares, no par value) | | | 77,536,932 | |
Net Asset Value Per Share, Offering and Redemption Price Per Share | | $ | 11.33 | |
| | | | | |
Minimum Redemption Price Per Share(a) | | $ | 11.11 | |
| | | | | |
Class R Shares | | | | |
Net Assets | | $ | 453,519,863 | |
Shares of beneficial interest outstanding
(unlimited number of shares, no par value) | | | 39,977,746 | |
Net Asset Value Per Share, Offering and Redemption Price Per Share | | $ | 11.34 | |
| | | | | |
Minimum Redemption Price Per Share(a) | | $ | 11.12 | |
| | | | | |
| (a) | The Fund will impose a 2.00% redemption fee on shares redeemed within 90 days of purchase. |
| | |
See Notes to Financial Statements. | | |
50 | | (888) 848-7569 | www.rivernorthfunds.com |
| | |
RiverNorth/Manning & Napier Dividend Income Fund | | |
Statement of Assets and Liabilities | | September 30, 2012 |
| | | | |
ASSETS: | | | | |
Investment in securities: | | | | |
At cost | | $ | 7,064,728 | |
| | | | |
At fair value | | $ | 7,215,503 | |
| |
Cash | | | 601,645 | |
Receivable for fund investments sold | | | 558,117 | |
Receivable for fund shares sold | | | 62,780 | |
Dividends receivable | | | 2,115 | |
Prepaid offering costs | | | 2,078 | |
Prepaid expenses and other assets | | | 6,480 | |
Total Assets | | | 8,448,718 | |
| |
LIABILITIES: | | | | |
Facility loan fee payable | | | 65 | |
Payable for fund investments purchased | | | 1,044,369 | |
Payable for fund shares redeemed | | | 24,777 | |
Payable for distributions | | | 31 | |
Payable to Adviser | | | 463 | |
Payable for Fund Accounting and Administration fees | | | 692 | |
Accrued 12b-1 fees - Class R Shares | | | 1,197 | |
Payable to Trustees and Officers | | | 50 | |
Other accrued expenses | | | 26,077 | |
Total Liabilities | | | 1,097,721 | |
Net Assets | | $ | 7,350,997 | |
| | | | | |
| |
NET ASSETS CONSIST OF: | | | | |
Paid-in capital | | $ | 7,168,135 | |
Accumulated net realized gain on investments | | | 32,087 | |
Net unrealized appreciation on investments | | | 150,775 | |
Net Assets | | $ | 7,350,997 | |
| | | | | |
| |
PRICING OF SHARES: | | | | |
Class I Shares | | | | |
Net Assets | | $ | 1,069,237 | |
Shares of beneficial interest outstanding
(unlimited number of shares, no par value) | | | 102,623 | |
Net Asset Value Per Share, Offering and Redemption Price Per Share | | $ | 10.42 | |
| | | | | |
Minimum Redemption Price Per Share(a) | | $ | 10.21 | |
| | | | | |
Class R Shares | | | | |
Net Assets | | $ | 6,281,760 | |
Shares of beneficial interest outstanding
(unlimited number of shares, no par value) | | | 603,036 | |
Net Asset Value Per Share, Offering and Redemption Price Per Share | | $ | 10.42 | |
| | | | | |
Minimum Redemption Price Per Share(a) | | $ | 10.21 | |
| | | | | |
| (a) | The Fund will impose a 2.00% redemption fee on shares redeemed within 90 days of purchase. |
| | |
See Notes to Financial Statements. | | |
Annual Report | September 30, 2012 | | 51 |
| | |
RiverNorth Core Opportunity Fund | | |
Statement of Operations | | For the Year Ended September 30, 2012 |
| | | | | |
INVESTMENT INCOME: | | | | | |
Dividend income | | | $ | 16,558,688 | |
Other income | | | | 6,013 | |
Total Investment Income | | | | 16,564,701 | |
| |
EXPENSES: | | | | | |
Investment Adviser fee | | | | 5,337,272 | |
12b-1 fees | | | | 1,334,318 | |
Accounting and Administration fee | | | | 176,656 | |
Excise tax expenses | | | | 79,248 | |
Compliance expenses | | | | 59,672 | |
Custodian expenses | | | | 52,612 | |
Transfer agent expenses | | | | 46,984 | |
Registration expenses | | | | 46,427 | |
Report printing expenses | | | | 42,601 | |
Facility loan fee | | | | 32,361 | |
Insurance expenses | | | | 19,994 | |
Audit expenses | | | | 17,165 | |
Legal expenses | | | | 6,428 | |
Trustee expenses | | | | 5,383 | |
24f-2 expenses | | | | 2,720 | |
Miscellaneous expenses | | | | 23,076 | |
Total Expenses | | | | 7,282,917 | |
Net Investment Income | | | | 9,281,784 | |
| |
REALIZED AND UNREALIZED GAIN ON INVESTMENTS: | | | | | |
Net realized gain on: | | | | | |
Investments | | | | 22,373,489 | |
Long-term capital gain distributions from other investment companies | | | | 2,212,488 | |
Net change in unrealized appreciation on: | | | | | |
Investments | | | | 64,106,622 | |
Net Realized and Unrealized Gain on Investments | | | | 88,692,599 | |
Net Increase in Net Assets Resulting from Operations | | | $ | 97,974,383 | |
| | |
See Notes to Financial Statements. | | |
52 | | (888) 848-7569 | www.rivernorthfunds.com |
| | |
RiverNorth/DoubleLine Strategic Income Fund | | |
Statement of Operations | | For the Year Ended September 30, 2012 |
| | | | |
INVESTMENT INCOME: | | | | |
Dividend income | | $ | 12,525,236 | |
Interest income | | | 45,658,961 | |
Other income | | | 16,133 | |
Total Investment Income | | | 58,200,330 | |
| |
EXPENSES: | | | | |
Investment Adviser fee | | | 7,150,519 | |
12b-1 fees - Class R Shares | | | 793,663 | |
Accounting and Administration fee | | | 443,196 | |
Transfer agent expenses | | | 189,349 | |
Repayment of previously waived fees (Note 4) | | | 138,963 | |
Custodian expenses | | | 112,402 | |
24f-2 expenses | | | 103,038 | |
Registration expenses | | | 97,545 | |
Compliance expenses | | | 96,469 | |
Report printing expenses | | | 90,154 | |
Facility loan fee | | | 60,637 | |
Legal expenses | | | 29,907 | |
Audit expenses | | | 22,065 | |
Offering costs | | | 13,659 | |
Trustee expenses | | | 7,709 | |
Insurance expenses | | | 1,643 | |
Miscellaneous expenses | | | 34,569 | |
Total Net Expenses | | | 9,385,487 | |
Net Investment Income | | | 48,814,843 | |
| |
REALIZED AND UNREALIZED GAIN ON INVESTMENTS: | | | | |
Net realized gain on: | | | | |
Investments | | | 14,773,662 | |
Long-term capital gain distributions from other investment companies | | | 25,567 | |
Net change in unrealized appreciation on: | | | | |
Investments | | | 60,017,254 | |
Net Realized and Unrealized Gain on Investments | | | 74,816,483 | |
Net Increase in Net Assets Resulting from Operations | | $ | 123,631,326 | |
| | |
See Notes to Financial Statements. | | |
Annual Report | September 30, 2012 | | 53 |
| | |
RiverNorth/Manning & Napier Dividend Income Fund | | |
Statement of Operations | | For the Period July 18, 2012 (inception) to September 30, 2012 |
| | | | |
INVESTMENT INCOME: | | | | |
Dividend income | | $ | 18,937 | |
Foreign taxes withheld | | | (14 | ) |
Total Investment Income | | | 18,923 | |
| |
EXPENSES: | | | | |
Audit expenses | | | 15,500 | |
Offering costs | | | 11,682 | |
Custodian expenses | | | 9,000 | |
Investment Adviser fee | | | 8,978 | |
Transfer agent expenses | | | 5,160 | |
12b-1 fees - Class R Shares | | | 1,956 | |
Registration expenses | | | 1,047 | |
Accounting and Administration fee | | | 788 | |
24f-2 expenses | | | 719 | |
Report printing expenses | | | 102 | |
Compliance expenses | | | 75 | |
Facility loan fee | | | 65 | |
Legal expenses | | | 45 | |
Miscellaneous expenses | | | 550 | |
Total expenses before waiver/reimbursement | | | 55,667 | |
Less fees waived/reimbursed by Investment Adviser: | | | | |
Class I Shares | | | (5,553 | ) |
Class R Shares | | | (36,038 | ) |
Total Net Expenses | | | 14,076 | |
Net Investment Income | | | 4,847 | |
| |
REALIZED AND UNREALIZED GAIN ON INVESTMENTS: | | | | |
Net realized gain on: | | | | |
Investments | | | 40,990 | |
Net change in unrealized appreciation on: | | | | |
Investments | | | 150,775 | |
Net Realized and Unrealized Gain on Investments | | | 191,765 | |
Net Increase in Net Assets Resulting from Operations | | $ | 196,612 | |
| | |
See Notes to Financial Statements. | | |
54 | | (888) 848-7569 | www.rivernorthfunds.com |
| | |
RiverNorth Core Opportunity Fund | | |
Statements of Changes in Net Assets | | |
| | | | | | | | |
| | | For the Year Ended September 30, 2012 | | | For the Year Ended September 30, 2011 | |
NET INCREASE/(DECREASE) IN NET ASSETS FROM OPERATIONS: | | | | | | | | |
Net investment income | | $ | 9,281,784 | | | $ | 12,191,243 | |
Net realized gain on investments | | | 22,373,489 | | | | 26,373,281 | |
Long-term capital gain distributions from other investment companies | | | 2,212,488 | | | | 594,886 | |
Net change in unrealized appreciation/(depreciation) on investments | | | 64,106,622 | | | | (58,239,398 | ) |
Net increase/(decrease) in net assets resulting from operations | | | 97,974,383 | | | | (19,079,988 | ) |
DISTRIBUTIONS TO SHAREHOLDERS: | | | | | | | | |
From net investment income | | | (20,499,992 | ) | | | (10,698,525 | ) |
From net realized gains on investments | | | (21,513,345 | ) | | | – | |
Net decrease in net assets from distributions to shareholders | | | (42,013,337 | ) | | | (10,698,525 | ) |
CAPITAL SHARE TRANSACTIONS: | | | | | | | | |
Proceeds from shares sold | | | 142,129,866 | | | | 269,665,868 | |
Reinvestment of distributions | | | 41,181,736 | | | | 10,615,314 | |
Cost of shares redeemed | | | (158,178,289 | ) | | | (154,776,438 | ) |
Redemption fees(a) | | | 34,290 | | | | 47,707 | |
Net increase in net assets from capital share transactions | | | 25,167,603 | | | | 125,552,451 | |
Net Increase in Net Assets | | | 81,128,649 | | | | 95,773,938 | |
NET ASSETS: | | | | | | | | |
Beginning of period | | | 488,195,153 | | | | 392,421,215 | |
End of period (including accumulated net investment income/(loss) of $(349,296) and $9,549,201, respectively) | | $ | 569,323,802 | | | $ | 488,195,153 | |
| | | | | | | | | |
OTHER INFORMATION: | | | | | | | | |
Share Transactions: | | | | | | | | |
Shares sold | | | 12,059,869 | | | | 21,737,508 | |
Shares issued in reinvestment of distributions | | | 3,792,057 | | | | 874,408 | |
Shares redeemed | | | (13,491,501 | ) | | | (12,704,972 | ) |
Net increase from share transactions | | | 2,360,425 | | | | 9,906,944 | |
| | | | | | | | | |
| (a) | The Fund will impose a 2.00% redemption fee on shares redeemed within 90 days of purchase. |
| | |
See Notes to Financial Statements. | | |
Annual Report | September 30, 2012 | | 55 |
| | |
RiverNorth/DoubleLine Strategic Income Fund | | |
Statement of Changes in Net Assets | | |
| | | | | | | | |
| | | For the Year Ended September 30, 2012 | | | For the Period December 30, 2010 (Inception) to September 30, 2011 | |
NET INCREASE IN NET ASSETS FROM OPERATIONS: | | | | | | | | |
Net investment income | | $ | 48,814,843 | | | $ | 5,615,997 | |
Net realized gain on investments | | | 14,773,662 | | | | 1,435,993 | |
Long-term capital gain distributions from other investment companies | | | 25,567 | | | | – | |
Net change in unrealized appreciation on investments | | | 60,017,254 | | | | 1,568,146 | |
Net increase in net assets resulting from operations | | | 123,631,326 | | | | 8,620,136 | |
| | |
DISTRIBUTIONS TO SHAREHOLDERS: | | | | | | | | |
From net investment income: | | | | | | | | |
Class I Shares | | | (37,582,010) | | | | (3,907,229) | |
Class R Shares | | | (18,098,346) | | | | (1,480,090) | |
From net realized gains on investments: | | | | | | | | |
Class I Shares | | | (704,354) | | | | – | |
Class R Shares | | | (352,655) | | | | – | |
Net decrease in net assets from distributions to shareholders | | | (56,737,365) | | | | (5,387,319) | |
| | |
CAPITAL SHARE TRANSACTIONS: | | | | | | | | |
Class I Shares | | | | | | | | |
Proceeds from shares sold | | | 557,176,722 | | | | 336,502,966 | |
Reinvestment of distributions | | | 34,078,733 | | | | 3,614,658 | |
Cost of shares redeemed | | | (89,957,893) | | | | (9,964,884) | |
Redemption fees(a) | | | 61,046 | | | | 63,388 | |
Net increase in net assets from capital share transactions | | | 501,358,608 | | | | 330,216,128 | |
| | |
Class R Shares | | | | | | | | |
Proceeds from shares sold | | | 353,259,674 | | | | 148,631,281 | |
Reinvestment of distributions | | | 17,679,372 | | | | 1,458,797 | |
Cost of shares redeemed | | | (81,644,400) | | | | (9,172,641) | |
Redemption fees(a) | | | 160,048 | | | | 76,802 | |
Net increase in net assets from capital share transactions | | | 289,454,694 | | | | 140,994,239 | |
| | |
Net Increase in Net Assets | | | 857,707,263 | | | | 474,443,184 | |
| | |
NET ASSETS: | | | | | | | | |
Beginning of period | | | 474,443,184 | | | | – | |
End of period (including accumulated net investment income of $261,199 and $746,673, respectively) | | $ | 1,332,150,447 | | | $ | 474,443,184 | |
| | | | | | | | | |
| | |
| | |
56 | | (888) 848-7569 | www.rivernorthfunds.com |
| | |
RiverNorth/DoubleLine Strategic Income Fund | | |
Statement of Changes in Net Assets (continued) | | |
| | | | | | | | |
| | | For the Year Ended
September 30, 2012 | | | For the Period
December 30, 2010
(Inception) to
September 30, 2011 | |
OTHER INFORMATION: | | | | | | | | |
Share Transactions: | | | | | | | | |
Class I Shares | | | | | | | | |
Shares sold | | | 51,228,287 | | | | 32,006,388 | |
Shares issued in reinvestment of distributions | | | 3,109,665 | | | | 344,024 | |
Shares redeemed | | | (8,205,498) | | | | (945,934) | |
Net increase from share transactions | | | 46,132,454 | | | | 31,404,478 | |
| | |
| | |
Class R Shares | | | | | | | | |
Shares sold | | | 32,428,937 | | | | 14,101,059 | |
Shares issued in reinvestment of distributions | | | 1,611,147 | | | | 138,616 | |
Shares redeemed | | | (7,437,705) | | | | (864,308) | |
Net increase from share transactions | | | 26,602,379 | | | | 13,375,367 | |
| | |
| (a) | The Fund will impose a 2.00% redemption fee on shares redeemed within 90 days of purchase. |
| | |
See Notes to Financial Statements. | | |
Annual Report | September 30, 2012 | | 57 |
| | |
RiverNorth/Manning & Napier Dividend Income Fund | | |
Statement of Changes in Net Assets | | |
| | | | |
| | | For the Period July 18, 2012 (Inception) to
September 30, 2012 | |
NET INCREASE IN NET ASSETS FROM OPERATIONS: | | | | |
Net investment income | | $ | 4,847 | |
Net realized gain on investments | | | 40,990 | |
Net change in unrealized appreciation on investments | | | 150,775 | |
Net increase in net assets resulting from operations | | | 196,612 | |
| |
DISTRIBUTIONS TO SHAREHOLDERS: | | | | |
From net investment income: | | | | |
Class I Shares | | | (2,429) | |
Class R Shares | | | (15,328) | |
Net decrease in net assets from distributions to shareholders | | | (17,757) | |
| |
CAPITAL SHARE TRANSACTIONS: | | | | |
Class I Shares | | | | |
Proceeds from shares sold | | | 1,046,429 | |
Reinvestment of distributions | | | 2,429 | |
Cost of shares redeemed | | | (99) | |
Net increase in net assets from capital share transactions | | | 1,048,759 | |
| |
Class R Shares | | | | |
Proceeds from shares sold | | | 6,214,805 | |
Reinvestment of distributions | | | 15,297 | |
Cost of shares redeemed | | | (107,796) | |
Redemption fees(a) | | | 1,077 | |
Net increase in net assets from capital share transactions | | | 6,123,383 | |
| |
Net Increase in Net Assets | | | 7,350,997 | |
| |
NET ASSETS: | | | | |
Beginning of period | | | – | |
End of period (including accumulated net investment income of $0) | | $ | 7,350,997 | |
| | |
| | |
| | |
58 | | (888) 848-7569 | www.rivernorthfunds.com |
| | |
RiverNorth/Manning & Napier Dividend Income Fund | | |
Statement of Changes in Net Assets (continued) | | |
| | | | |
| | | For the Period July 18, 2012 (Inception) to
September 30, 2012 | |
OTHER INFORMATION: | | | | |
Share Transactions: | | | | |
Class I Shares | | | | |
Shares sold | | | 102,400 | |
Shares issued in reinvestment of distributions | | | 232 | |
Shares redeemed | | | (9) | |
Net increase from share transactions | | | 102,623 | |
| | |
| |
Class R Shares | | | | |
Shares sold | | | 612,037 | |
Shares issued in reinvestment of distributions | | | 1,461 | |
Shares redeemed | | | (10,462) | |
Net increase from share transactions | | | 603,036 | |
| | |
| (a) | The Fund will impose a 2.00% redemption fee on shares redeemed within 90 days of purchase. |
| | |
See Notes to Financial Statements. | | |
Annual Report | September 30, 2012 | | 59 |
| | |
RiverNorth Core Opportunity Fund | | |
Financial Highlights | | |
|
|
|
Net asset value - beginning of period |
Income/(Loss) from investment operations: |
Net investment income(a) |
Net realized and unrealized gain/(loss) on investments(a) |
Total income/(loss) from investment operations |
|
Less distributions: |
From net investment income |
From net realized gain on investments |
Total distributions |
Paid-in capital from redemption fees(a) |
Net increase/(decrease) in net asset value |
Net asset value - end of period |
| |
|
Total Return(c) |
|
Ratios/Supplemental Data: |
Net assets, end of period (in thousands) |
|
Ratio of expenses to average net assets excluding fee waivers and reimbursements(d) |
|
Ratio of expenses to average net assets including fee waivers and reimbursements(d) |
Ratio of net investment income to average net assets excluding fee waivers and reimbursements(d) |
Ratio of net investment income to average net assets including fee waivers and reimbursements(d) |
Portfolio turnover rate |
| (a) | Based on average shares outstanding during the period. |
| (b) | Less than $0.005 per share. |
| (c) | Total return in the above table represents the rate that the investor would have earned or lost on an investment in the Fund, assuming reinvestment of dividends. |
| (d) | The ratios exclude the impact of expenses of the underlying funds in which the Fund invests as represented in the Schedule of Investments. |
| | |
See Notes to Financial Statements. | | |
60 | | (888) 848-7569 | www.rivernorthfunds.com |
| | |
| | |
| | For a share outstanding throughout the periods presented. |
| | | | | | | | | | | | | | | | | | |
For the Year Ended September 30, 2012 | | | For the Year Ended September 30,
2011 | | | For the Year Ended September 30,
2010 | | | For the Year Ended September 30,
2009 | | | For the Year Ended September 30,
2008 | |
| | | | |
| $ | 11.18 | | | $ | 11.63 | | | $ | 10.57 | | | $ | 8.72 | | | $ | 10.74 | |
| | | | | | | | | | | | | | | | | | |
| | 0.20 | | | | 0.32 | | | | 0.21 | | | | 0.32 | | | | 0.42 | |
| | 2.01 | | | | (0.45) | | | | 1.30 | | | | 1.76 | | | | (2.10) | |
| | 2.21 | | | | (0.13) | | | | 1.51 | | | | 2.08 | | | | (1.68) | |
| | | | |
| | | | | | | | | | | | | | | | | | |
| | (0.50) | | | | (0.32) | | | | (0.45) | | | | (0.23) | | | | (0.23) | |
| | (0.52) | | | | – | | | | – | | | | 0.00 | (b) | | | (0.12) | |
| | (1.02) | | | | (0.32) | | | | (0.45) | | | | (0.23) | | | | (0.35) | |
| | 0.00 | (b) | | | 0.00 | (b) | | | 0.00 | (b) | | | 0.00 | (b) | | | 0.01 | |
| | 1.19 | | | | (0.45) | | | | 1.06 | | | | 1.85 | | | | (2.02) | |
| $ | 12.37 | | | $ | 11.18 | | | $ | 11.63 | | | $ | 10.57 | | | $ | 8.72 | |
| | | |
| | | | |
| | 21.05% | | | | (1.33%) | | | | 14.72% | | | | 25.06% | | | | (16.08%) | |
| | | | |
| | | | | | | | | | | | | | | | | | | |
| $ | 569,324 | | | $ | 488,195 | | | $ | 392,421 | | | $ | 275,482 | | | $ | 133,330 | |
| | | | |
| | 1.36% | | | | 1.45% | | | | 1.45% | | | | 1.53% | | | | 1.59% | |
| | | | |
| | 1.36% | | | | 1.45% | | | | 1.45% | | | | 1.53% | | | | 1.65% | |
| | 1.74% | | | | 2.57% | | | | 1.95% | | | | 3.80% | | | | 4.21% | |
| | 1.74% | | | | 2.57% | | | | 1.95% | | | | 3.80% | | | | 4.15% | |
| | 30% | | | | 38% | | | | 38% | | | | 215% | | | | 304% | |
| | |
| | |
Annual Report | September 30, 2012 | | 61 |
| | |
RiverNorth/DoubleLine Strategic Income Fund | | Class I |
Financial Highlights | | For a share outstanding throughout the periods presented. |
| | | | | | | | |
| | | For the Year Ended
September 30, 2012 | | | For the Period December 30, 2010
(Inception) to September 30, 2011 | |
| | |
Net asset value - beginning of period | | $ | 10.59 | | | $ | 10.00 | |
Income from investment operations: | | | | | | | | |
Net investment income(a) | | | 0.57 | | | | 0.42 | |
Net realized and unrealized gain on investments(a) | | | 0.82 | | | | 0.46 | |
Total income from investment operations | | | 1.39 | | | | 0.88 | |
| | |
Less distributions: | | | | | | | | |
From net investment income | | | (0.63) | | | | (0.30) | |
From net realized gain on investments | | | (0.02) | | | | – | |
Total distributions | | | (0.65) | | | | (0.30) | |
Paid-in capital from redemption fees(a) | | | 0.00(b) | | | | 0.01 | |
Net increase in net asset value | | | 0.74 | | | | 0.59 | |
Net asset value - end of period | | $ | 11.33 | | | $ | 10.59 | |
| | | | | | | | | |
| | |
Total Return(c) | | | 13.56% | | | | 8.97% (d) | |
| | |
Ratios/Supplemental Data: | | | | | | | | |
Net assets, end of period (in thousands) | | $ | 878,631 | | | $ | 332,664 | |
Ratio of expenses to average net assets excluding fee waivers and reimbursements(e) | | | 0.90% | | | | 1.08% (f) | |
Ratio of expenses to average net assets including fee waivers and reimbursements(e) | | | 0.90% | | | | 0.95% (f) | |
Ratio of net investment income to average net assets excluding fee waivers and reimbursements(e) | | | 5.20% | | | | 5.18% (f) | |
Ratio of net investment income to average net assets including fee waivers and reimbursements(e) | | | 5.20% | | | | 5.31% (f) | |
Portfolio turnover rate | | | 74% | | | | 64% (d) | |
| (a) | Based on average shares outstanding during the period. |
| (b) | Less than $0.005 per share. |
| (c) | Total return in the above table represents the rate that the investor would have earned or lost on an investment in the Fund, assuming reinvestment of dividends. |
| (e) | The ratios exclude the impact of expenses of the underlying funds in which the Fund invests as represented in the Schedule of Investments. |
| | |
See Notes to Financial Statements. | | |
62 | | (888) 848-7569 | www.rivernorthfunds.com |
| | |
RiverNorth/DoubleLine Strategic Income Fund | | Class R |
Financial Highlights | | For a share outstanding throughout the periods presented. |
| | | | | | | | |
| | | For the Year Ended September 30, 2012 | | | For the Period December 30, 2010 (Inception) to September 30, 2011 | |
| | |
Net asset value - beginning of period | | $ | 10.60 | | | $ | 10.00 | |
Income from investment operations: | | | | | | | | |
Net investment income(a) | | | 0.54 | | | | 0.40 | |
Net realized and unrealized gain on investments(a) | | | 0.82 | | | | 0.46 | |
Total income from investment operations | | | 1.36 | | | | 0.86 | |
| | |
Less distributions: | | | | | | | | |
From net investment income | | | (0.61) | | | | (0.28) | |
From net realized gain on investments | | | (0.02) | | | | – | |
Total distributions | | | (0.63) | | | | (0.28) | |
Paid-in capital from redemption fees(a) | | | 0.01 | | | | 0.02 | |
Net increase in net asset value | | | 0.74 | | | | 0.60 | |
Net asset value - end of period | | $ | 11.34 | | | $ | 10.60 | |
| | | | | | | | | |
| | |
Total Return(b) | | | 13.28% | | | | 8.88% (c) | |
| | |
Ratios/Supplemental Data: | | | | | | | | |
Net assets, end of period (in thousands) | | $ | 453,520 | | | $ | 141,779 | |
Ratio of expenses to average net assets excluding fee waivers and reimbursements(d) | | | 1.15% | | | | 1.33% (e) | |
Ratio of expenses to average net assets including fee waivers and reimbursements(d) | | | 1.15% | | | | 1.20% (e) | |
Ratio of net investment income to average net assets excluding fee waivers and reimbursements(d) | | | 4.96% | | | | 4.99% (e) | |
Ratio of net investment income to average net assets including fee waivers and reimbursements(d) | | | 4.96% | | | | 5.11% (e) | |
Portfolio turnover rate | | | 74% | | | | 64% (c) | |
| (a) | Based on average shares outstanding during the period. |
| (b) | Total return in the above table represents the rate that the investor would have earned or lost on an investment in the Fund, assuming reinvestment of dividends. |
| (d) | The ratios exclude the impact of expenses of the underlying funds in which the Fund invests as represented in the Schedule of Investments. |
| | |
See Notes to Financial Statements. | | |
Annual Report | September 30, 2012 | | 63 |
| | |
RiverNorth/Manning & Napier Dividend Income Fund | | Class I |
Financial Highlights | | For a share outstanding throughout the period presented. |
| | | | |
| | | For the Period July 18, 2012 (Inception) to September 30, 2012 | |
| |
Net asset value - beginning of period | | $ | 10.00 | |
Income from investment operations: | | | | |
Net investment income(a) | | | 0.02 | |
Net realized and unrealized gain on investments(a) | | | 0.42 | |
Total income from investment operations | | | 0.44 | |
| |
Less distributions: | | | | |
From net investment income | | | (0.02) | |
Total distributions | | | (0.02) | |
Paid-in capital from redemption fees(a) | | | – | |
Net increase in net asset value | | | 0.42 | |
Net asset value - end of period | | $ | 10.42 | |
| | |
| |
Total Return(b) | | | 4.44% (c) | |
| |
Ratios/Supplemental Data: | | | | |
Net assets, end of period (in thousands) | | $ | 1,069 | |
Ratio of expenses to average net assets excluding fee waivers and reimbursements(d) | | | 6.16% (e) | |
Ratio of expenses to average net assets including fee waivers and reimbursements(d) | | | 1.35% (e) | |
Ratio of net investment loss to average net assets excluding fee waivers and reimbursements(d) | | | (3.92%) (e) | |
Ratio of net investment income to average net assets including fee waivers and reimbursements(d) | | | 0.89% (e) | |
Portfolio turnover rate | | | 13% (c) | |
| (a) | Based on average shares outstanding during the period. |
| (b) | Total return in the above table represents the rate that the investor would have earned or lost on an investment in the Fund, assuming reinvestment of dividends. |
| (d) | The ratios exclude the impact of expenses of the underlying funds in which the Fund invests as represented in the Schedule of Investments. |
| | |
See Notes to Financial Statements. | | |
64 | | (888) 848-7569 | www.rivernorthfunds.com |
| | |
RiverNorth/Manning & Napier Dividend Income Fund | | Class R |
Financial Highlights | | For a share outstanding throughout the period presented. |
| | | | |
| | | For the Period July 18, 2012 (Inception) to September 30, 2012 | |
| |
| |
| |
| | |
Net asset value - beginning of period | | $ | 10.00 | |
Income from investment operations: | | | | |
Net investment income(a) | | | 0.01 | |
Net realized and unrealized gain on investments(a) | | | 0.44 | |
Total income from investment operations | | | 0.45 | |
| |
Less distributions: | | | | |
From net investment income | | | (0.03) | |
Total distributions | | | (0.03) | |
Paid-in capital from redemption fees(a) | | | 0.00 | (b) |
Net increase in net asset value | | | 0.42 | |
Net asset value - end of period | | $ | 10.42 | |
| | |
| |
Total Return(c) | | | 4.46% | (d) |
| |
Ratios/Supplemental Data: | | | | |
Net assets,end of period (in thousands) | | $ | 6,282 | |
Ratio of expenses to average net assets excluding fee waivers and reimbursements(e) | | | 6.21% | (f) |
Ratio of expenses to average net assets including fee waivers and reimbursements(e) | | | 1.60% | (f) |
Ratio of net investment loss to average net assets excluding fee waivers and reimbursements(e) | | | (4.12%) | (f) |
Ratio of net investment income to average net assets including fee waivers and reimbursements(e) | | | 0.49% | (f) |
Portfolio turnover rate | | | 13% | (d) |
| (a) | Based on average shares outstanding during the period. |
| (b) | Less than $0.005 per share. |
| (c) | Total return in the above table represents the rate that the investor would have earned or lost on an investment in the Fund, assuming reinvestment of dividends. |
| (e) | The ratios exclude the impact of expenses of the underlying funds in which the Fund invests as represented in the Schedule of Investments. |
| | |
See Notes to Financial Statements. | | |
Annual Report | September 30, 2012 | | 65 |
| | |
| RiverNorth Funds | | Notes to Financial Statements |
| | September 30, 2012 |
1. ORGANIZATION
The RiverNorth Core Opportunity Fund (the “Core Opportunity Fund”) was organized as a diversified series of RiverNorth Funds (the “Trust” or “Funds”) on
July 18, 2006 and commenced investment operations on December 27, 2006. The Trust is an open-end investment company established under the laws of Ohio by an Agreement and Declaration of Trust dated July 18, 2006 (the “Trust Agreement”). The Trust Agreement permits the Board of Trustees (the “Trustees”) to authorize and issue an unlimited number of shares of beneficial interest of a separate series without par value. The investment adviser to the Core Opportunity Fund is RiverNorth Capital Management, LLC (the “Adviser”). The investment objective of the Core Opportunity Fund is to seek long-term capital appreciation and income.
The RiverNorth/DoubleLine Strategic Income Fund (the “Strategic Income Fund”) is a diversified series of the Trust and commenced investment operations on December 30, 2010. The Strategic Income Fund offers two series of shares, Class I Shares and Class R Shares. All classes of shares have identical rights to earnings, assets and voting privileges, except for class-specific expenses and exclusive rights to vote on matters affecting only individual classes. The Trust Agreement permits the Board of Trustees to authorize and issue an unlimited number of shares of beneficial interest of a separate series without par value. The investment adviser to the Strategic Income Fund is RiverNorth Capital Management, LLC. The Strategic Income Fund’s sub-adviser is DoubleLine Capital, LP (“DoubleLine”). The investment objective of the Strategic Income Fund is current income and overall total return.
The RiverNorth/Manning & Napier Dividend Income Fund (the “Dividend Income Fund”) is a diversified series of the Trust and commenced investment operations on July 18, 2012. The Dividend Income Fund offers two series of shares, Class I Shares and Class R Shares. All classes of shares have identical rights to earnings, assets and voting privileges, except for class-specific expenses and exclusive rights to vote on matters affecting only individual classes. The Trust Agreement permits the Board of Trustees to authorize and issue an unlimited number of shares of beneficial interest of a separate series without par value. The investment adviser to the Dividend Income Fund is RiverNorth Capital Management, LLC. The Dividend Income Fund’s sub-adviser is Manning & Napier Advisors, LLC (“Manning & Napier,” and with DoubleLine, the “Sub-Adviser”). The investment objective of the Dividend Income Fund is overall total return consisting of long-term capital appreciation and income.
The following is a summary of significant accounting policies followed by the Funds. These policies are in conformity with U.S. generally accepted accounting principles (“GAAP”). The preparation of financial statements in accordance with GAAP requires management to make estimates and assumptions that affect the reported amounts and disclosures in the financial statements during the reporting period. Management believes the estimates and security valuations are appropriate; however, actual results may differ from those estimates, and the security valuations reflected in the financial statements may differ from the value the Funds ultimately realize upon sale of the securities. The financial statements have been prepared as of the close of the New York Stock Exchange (“NYSE”) on September 28, 2012.
| | |
| | |
66 | | (888) 848-7569 | www.rivernorthfunds.com |
| | |
| RiverNorth Funds | | Notes to Financial Statements |
| | September 30, 2012 |
2. SIGNIFICANT ACCOUNTING POLICIES
SECURITY VALUATION: All investments in securities are recorded at their estimated fair value as described in Note 3.
SECURITY TRANSACTIONS AND RELATED INCOME: The Funds follow industry practice and record security transactions on the trade date basis. The specific identification method is used for determining gains or losses for financial statements and income tax purposes. Dividend income is recorded on the
ex-dividend date or for certain foreign securities, when the information becomes available to the Fund and interest income is recorded on an accrual basis. Discounts and premiums on securities purchased are amortized or accreted using the effective interest method. Withholding taxes on foreign dividends have been provided for in accordance with the Trust’s understanding of the applicable country’s tax rules and rates. The ability of issuers of debt securities held by the Trust to meet their obligations may be affected by economic and political developments in a specific country or region.
OTHER: The Funds have held certain investments which pay dividends to their shareholders based upon available funds from operations. It is possible for these dividends to exceed the underlying investments’ taxable earnings and profits resulting in the excess portion of such dividends being designated as a return of capital. Distributions received from investments in securities that represent a return of capital or capital gain are recorded as a reduction of the cost of investments or as a realized gain, respectively.
SHARE VALUATION: The net asset value (the “NAV”) is generally calculated as of the close of trading on the New York Stock Exchange (“the Exchange”) (normally 4:00 p.m. Eastern time) every day the Exchange is open. The NAV is calculated by taking the total value of each Fund’s assets, subtracting their liabilities, and then dividing by the total number of shares outstanding, rounded to the nearest cent. The offering price and redemption price per share is equal to the net asset value per share, except that shares of each Fund are subject to a redemption fee of 2% if redeemed within 90 days of purchase. For the year ended September 30, 2012, the Core Opportunity Fund, Strategic Income Fund, and Dividend Income Fund received redemption fees of $34,290, $221,094, and $1,077, respectively.
OFFERING COSTS: Offering costs, including costs of printing initial prospectuses, legal and registration fees, are being amortized over twelve months for the Dividend Income Fund. As of September 30, 2012, $2,078 of offering costs remain to be amortized by the Fund.
EXPENSES: Some expenses of the Trust can be directly attributed to the Fund or the Fund specific share class. Expenses which cannot be directly attributed are apportioned among all Funds and Fund series classes in the Trust based on average net assets.
FEDERAL INCOME TAXES: The Funds make no provision for federal income tax. Each Fund intends to qualify each year as a “regulated investment company” under subchapter M of the Internal Revenue Code of 1986, as amended, by distributing substantially all of its taxable income. If the required amount of net investment income is not distributed, the Funds could incur a tax expense.
| | |
| | |
Annual Report | September 30, 2012 | | 67 |
| | |
RiverNorth Funds | | Notes to Financial Statements |
| | September 30, 2012 |
As of and during the year ended September 30, 2012, the Funds did not have a liability for any unrecognized tax benefits. The Funds recognize interest and penalties, if any, related to unrecognized tax benefits as income tax expense in the statement of operations. The Funds are not subject to examination by U.S. federal tax authorities for tax years prior to 2008, as applicable.
DISTRIBUTIONS TO SHAREHOLDERS: Distributions to shareholders, which are determined in accordance with income tax regulations, are recorded on the ex-dividend date. The treatment for financial reporting purposes of distributions made to shareholders during the year from net investment income or net realized capital gains may differ from their ultimate treatment for federal income tax purposes. These differences are caused primarily by differences in the timing of recognition of certain components of income, expense or realized capital gain for federal income tax purposes. Where such differences are permanent in nature, they are reclassified in the components of the net assets based on their ultimate characterization for federal income tax purposes. Any such reclassification will have no effect on net assets, results of operations or net asset values per share of the Funds.
3. SECURITIES VALUATION AND FAIR VALUE MANAGEMENT
Fair value is defined as the price that a Fund would receive upon selling an investment in a timely transaction to an independent buyer in the principal or most advantageous market of the investment. GAAP establishes a three-tier hierarchy to maximize the use of observable market data and minimize the use of unobservable inputs and to establish classification of fair value measurements for disclosure purposes.
Inputs refer broadly to the assumptions that market participants would use in pricing the asset or liability, including assumptions about risk, for example, the risk inherent in a particular valuation technique used to measure fair value including such a pricing model and/or the risk inherent in the inputs to the valuation technique. Inputs may be observable or unobservable. Observable inputs are inputs that reflect the assumptions market participants would use in pricing the asset or liability developed based on market data obtained from sources independent of the reporting entity. Unobservable inputs are inputs that reflect the reporting entity’s own assumptions about the assumptions market participants would use in pricing the asset or liability developed based on the best information available in the circumstances.
Various inputs are used in determining the value of the Funds’ investments. These inputs are summarized in the three broad levels listed below.
| | • | | Level 1 – Unadjusted quoted prices in active markets for identical, unrestricted assets or liabilities that a Fund has the ability to access at the measurement date; |
| | • | | Level 2 – Quoted prices which are not active, quoted prices for similar assets or liabilities in active markets or inputs other than quoted prices that are observable (either directly or indirectly) for substantially the full term of the asset or liability; and |
| | • | | Level 3 – Significant unobservable prices or inputs (including the Fund’s own assumptions in determining the fair value of investments) where there is little or no market activity for the asset or liability at the measurement date. |
| | |
. | | |
68 | | (888) 848-7569 | www.rivernorthfunds.com |
| | |
RiverNorth Funds | | Notes to Financial Statements |
| | September 30, 2012 |
The inputs used to measure fair value may fall into different levels of the fair value hierarchy. In such cases, for disclosure purposes, the level in the fair value hierarchy within which the fair value measurement falls in its entirety, is determined based on the lowest level input that is significant to the fair value measurement in its entirety.
Equity securities, including common stocks, closed-end funds, exchange-traded funds, holding and investment management companies, preferred stocks, and real estate investment trusts are generally valued by using market quotations, but may be valued on the basis of prices furnished by a pricing service when the Adviser believes such prices more accurately reflect the fair value of such securities. Securities that are traded on any stock exchange are generally valued by the pricing service at the last quoted sale price. Lacking a last sale price, an exchange traded security is generally valued by the pricing service at its last bid price. Securities traded in the NASDAQ over-the-counter market are generally valued by the pricing service at the NASDAQ Official Closing Price. When using the market quotations or close prices provided by the pricing service and when the market is considered active, the security will be classified as a Level 1 security. Sometimes, an equity security owned by the Funds will be valued by the pricing service with factors other than market quotations or when the market is considered inactive. When this happens, the security will be classified as a Level 2 security. When market quotations are not readily available, when the Adviser or a Sub-Adviser determines that the market quotation or the price provided by the pricing service does not accurately reflect the current fair value, or when restricted or illiquid securities are being valued, such securities are valued as determined in good faith by the Adviser or a Sub-Adviser, in conformity with guidelines adopted by and subject to review by the Board. These securities will be categorized as Level 3 securities.
Investments in mutual funds, including money market mutual funds, are generally priced at the ending net asset value (NAV) provided by the service agent of the funds. These securities will be categorized as Level 1 securities.
Domestic and foreign fixed income securities, including corporate bonds, government bonds and notes, supranationals and foreign agencies, non-agency collateralized mortgage obligations, and U.S. Government/Agency mortgage backed securities, as well as non-exchange traded derivatives are normally valued on the basis of quotes obtained from brokers and dealers or independent pricing services. Prices obtained from independent pricing services typically use information provided by market makers or estimates of market values obtained from yield data relating to investments or securities with similar characteristics. Data used to establish quotes includes analysis of cash flows, pre-payment speeds, default rates, delinquency assumptions and assumptions regarding collateral and loss assumptions. These securities will be classified as Level 2 securities.
Rights are generally valued by using the last sale price, which would result in a classification as a Level 1 security. In the absence of a last sale price, the rights will be fair-valued by the Adviser or a Sub-Adviser, which would result in a classification as a Level 3 security.
Short-term investments in fixed income securities, with maturities of less than 60 days when acquired, or which subsequently are within 60 days of maturity, are valued by using the amortized cost method of valuation, which the Board has determined will represent fair value. These securities will be classified as Level 2 securities.
| | |
| | |
Annual Report | September 30, 2012 | | 69 |
| | |
RiverNorth Funds | | Notes to Financial Statements |
| | September 30, 2012 |
In accordance with the Funds’ good faith pricing guidelines, the Adviser or a Sub-Adviser is required to consider all appropriate factors relevant to the value of securities for which it has determined other pricing sources are not available or reliable as described above. No single standard exists for determining fair value, because fair value depends upon the circumstances of each individual case. As a general principle, the current fair value of an issue of securities being valued by the Adviser or a Sub-Adviser would appear to be the amount which the owner might reasonably expect to receive for them upon their current sale. Methods which are in accordance with this principle may, for example, be based on (i) a multiple of earnings; (ii) a discount from market of a similar freely traded security (including a derivative security or a basket of securities traded on other markets, exchanges or among dealers); or (iii) yield to maturity with respect to debt issues, or a combination of these and other methods. Good faith pricing is permitted if, in the Adviser’s or a Sub-Adviser’s opinion, the validity of market quotations appears to be questionable based on factors such as evidence of a thin market in the security based on a small number of quotations, a significant event occurs after the close of a market but before a Fund’s NAV calculation that may affect a security’s value, or the Adviser or a Sub-Adviser is aware of any other data that calls into question the reliability of market quotations.
Good faith pricing may also be used in instances when the bonds the Funds invest in may default or otherwise cease to have market quotations readily available. Investments in foreign securities, junk bonds or other thinly traded securities are more likely to trigger good faith pricing than other securities.
The following is a summary of the inputs used at September 30, 2012 in valuing the Funds’ assets:
Core Opportunity Fund
| | | | | | | | | | | | | | | | |
| | | Valuation Inputs | | | | |
Investments in Securities at Value | | Level 1 | | | Level 2 | | | Level 3 | | | Total | |
Closed-End Funds | | $ | 317,393,648 | | | $ | – | | | $ | – | | | $ | 317,393,648 | |
Mutual Funds | | | 21,838,614 | | | | – | | | | – | | | | 21,838,614 | |
Exchange-Traded Funds | | | 84,312,472 | | | | – | | | | – | | | | 84,312,472 | |
Holding & Investment Management Companies | | | 1,488,300 | | | | – | | | | – | | | | 1,488,300 | |
Preferred Stocks | | | 4,012,194 | | | | – | | | | – | | | | 4,012,194 | |
Total | | $ | 429,045,228 | | | $ | – | | | $ | – | | | $ | 429,045,228 | |
| | | | | | | | | | | | | | | | | |
| | |
| | |
70 | | (888) 848-7569 | www.rivernorthfunds.com |
| | |
RiverNorth Funds | | Notes to Financial Statements |
| | September 30, 2012 |
Strategic Income Fund
| | | | | | | | | | | | | | | | |
| | | Valuation Inputs | | | | |
| Investments in Securities at Value | | Level 1 | | | Level 2 | | | Level 3 | | | Total | |
Closed-End Funds | | $ | 203,591,897 | | | $ | – | | | $ | – | | | $ | 203,591,897 | |
Preferred Stocks | | | 19,109,500 | | | | – | | | | – | | | | 19,109,500 | |
Foreign Corporate Bonds | | | – | | | | 78,372,703 | | | | – | | | | 78,372,703 | |
U.S. Corporate Bonds | | | – | | | | 110,084,237 | | | | – | | | | 110,084,237 | |
Foreign Government Bonds and Notes, Supranationals and Foreign Agencies | | | – | | | | 16,625,312 | | | | – | | | | 16,625,312 | |
Non-Agency Collateralized Mortgage Obligations | | | – | | | | 354,878,676 | | | | – | | | | 354,878,676 | |
U.S. Government Bonds and Notes | | | – | | | | 113,671,083 | | | | – | | | | 113,671,083 | |
U.S. Government / Agency Mortgage Backed Securities | | | – | | | | 243,290,328 | | | | – | | | | 243,290,328 | |
Rights | | | 2,660 | | | | – | | | | – | | | | 2,660 | |
Short-Term Securities | | | – | | | | 11,748,390 | | | | – | | | | 11,748,390 | |
Total | | $ | 222,704,057 | | | $ | 928,670,729 | | | $ | – | | | $ | 1,151,374,786 | |
| | | | | | | | | | | | | | | | | |
Dividend Income Fund
| | | | | | | | | | | | | | | | |
| | | Valuation Inputs | | | | |
| Investments in Securities at Value | | Level 1 | | | Level 2 | | | Level 3 | | | Total | |
Closed-End Funds | | $ | 3,263,289 | | | $ | – | | | $ | – | | | $ | 3,263,289 | |
Common Stock | | | 2,461,697 | | | | – | | | | – | | | | 2,461,697 | |
Exchange-Traded Funds | | | 1,490,517 | | | | – | | | | – | | | | 1,490,517 | |
Total | | $ | 7,215,503 | | | $ | – | | | $ | – | | | $ | 7,215,503 | |
| | | | | | | | | | | | | | | | | |
The Funds did not hold any investments at the beginning or end of the period in which significant unobservable inputs were used in determining fair value; therefore, no reconciliation of Level 3 securities is included for this reporting period.
There were no transfers into and out of Levels 1 and 2 during the current period presented. It is the Funds’ policy to recognize transfers into and out of the Levels 1 and 2 at the end of the reporting period.
| | |
| | |
Annual Report | September 30, 2012 | | 71 |
| | |
RiverNorth Funds | | Notes to Financial Statements |
| | September 30, 2012 |
4. INVESTMENT ADVISORY FEE AND OTHER TRANSACTIONS WITH AFFILIATES
The Adviser serves as the investment adviser to the Funds. Under the terms of the management agreement (the “Agreement”), the Adviser, subject to the supervision of the Board, provides or arranges to be provided to the Funds such investment advice as it deems advisable and will furnish or arrange to be furnished a continuous investment program for the Funds consistent with the Funds’ investment objectives and policies. As compensation for its management services, the Core Opportunity Fund, the Strategic Income Fund and the Dividend Income Fund are obligated to pay the Adviser a fee computed and accrued daily and paid monthly in arrears at an annual rate of 1.00%, 0.75% and 1.00%, respectively, of the average daily net assets of the Funds.
DoubleLine is the investment sub-adviser to the Strategic Income Fund. Manning & Napier is the sub-adviser to the Dividend Income Fund. Under the terms of the sub-advisory agreements, the Sub-Advisers, subject to the supervision of the Adviser and the Board of Trustees of the Trust, provide or arrange to be provided to the Strategic Income Fund and the Dividend Income Fund such investment advice as deemed advisable and will furnish or arrange to be furnished a continuous investment program for the portion of assets managed in the respective Fund consistent with the respective Fund’s investment objective and policies. As compensation for its sub-advisory services, the Adviser is obligated to pay the Sub-Advisers a fee computed and accrued daily and paid monthly in arrears based on an annual rate of the average daily net assets of the Strategic Income Fund and Dividend Income Fund.
The Adviser has contractually agreed to defer the collection of the Core Opportunity Fund management fees and/or reimburse expenses, but only to the extent necessary to limit net annual operating expenses (excluding brokerage fees and commissions; borrowing costs, such as (a) interest and (b) dividends on securities sold short; taxes; indirect expenses incurred by the underlying funds in which the Core Opportunity Fund invests; and extraordinary expenses) to 1.60% of the average daily net assets of the Fund through January 31, 2013. Each deferral of fees or reimbursement of an expense by the Adviser is subject to repayment by the Fund within the three fiscal years following the fiscal year in which the expenses were incurred, provided that the Fund is able to make the repayment without exceeding the above expense limitations. For the year ended September 30, 2012, there were no fee deferrals or reimbursements by the Adviser and there were no carryovers from prior years of amounts recoupable to the Adviser.
The Adviser has contractually agreed to defer the collection of the Strategic Income Fund management fees and/or reimburse expenses, but only to the extent necessary to limit total annual operating expenses (excluding brokerage fees and commissions; borrowing costs such as (a) interest and (b) dividends on securities sold short; taxes; indirect expenses incurred by the underlying funds in which the Strategic Income Fund invests; and extraordinary expenses), including amortized offering costs, at 0.95% of the average daily net assets for the Class I shares and 1.20% for the Class R shares of the Fund through January 31, 2013. Each deferral of fees or reimbursement of an expense by the Adviser is subject to repayment by the Fund within the three fiscal years following the fiscal year in which the expenses were incurred, provided that the Fund is able to make the repayment without exceeding the above expense limitations. During the year ended September 30, 2012 the Adviser received $138,963 in repayment of previously waived management fees, as disclosed on the Statement of Operations. No additional amounts are recoupable to the Adviser.
| | |
| | |
72 | | (888) 848-7569 | www.rivernorthfunds.com |
| | |
RiverNorth Funds | | Notes to Financial Statements |
| | September 30, 2012 |
The Adviser has contractually agreed to defer the collection of the Dividend Income Fund management fees and/or reimburse expenses, but only to the extent necessary to limit total annual operating expenses (excluding brokerage fees and commissions; borrowing costs such as (a) interest and (b) dividends on securities sold short; taxes; indirect expenses incurred by the underlying funds in which the Strategic Income Fund invests; and extraordinary expenses), including amortized offering costs, at 1.35% of the average daily net assets for the Class I shares and 1.60% for the Class R shares of the Fund through January 31, 2014. Each deferral of fees or reimbursement of an expense by the Adviser is subject to repayment by the Fund within the three fiscal years following the fiscal year in which the expenses were incurred, provided that the Fund is able to make the repayment without exceeding the above expense limitations. For the period ended September 30, 2012, $41,591 of fees were waived or reimbursed by the Adviser. The Fund will have until September 30, 2015 to recoup these fees.
ALPS Fund Services, Inc. (“ALPS”) provides the Funds with fund administration and fund accounting services. ALPS also serves as transfer, dividend paying and shareholder servicing agent for the Funds (“Transfer Agent”).
The Northern Trust Company (the “Custodian”) serves as the Fund’s custodian.
The Funds have adopted a plan pursuant to Rule 12b-1 under the Investment Company Act of 1940, as amended (the “Plan”). The Plan permits the Funds to pay the Adviser for distribution and promotion expenses related to marketing shares of the Funds. The amount payable annually by the Core Opportunity Fund and the Class R Shares for the Strategic Income Fund and Dividend Income Fund is 0.25% of the average daily net assets. Under the Plan the Trust may engage in any activities related to the distribution of Fund shares.
The Funds have entered into a Distribution Agreement with ALPS Distributors, Inc (“the Distributor”) to provide distribution services to the Funds. The Distributor serves as underwriter/distributor of shares of the Funds.
For the year ended September 30, 2012, the Core Opportunity Fund, Strategic Income Fund, and Dividend Income Fund paid $123,281, $200,283, and $3,120, respectively, in brokerage commissions to RiverNorth Securities LLC, an affiliated broker-dealer of the Funds.
Officers of the Trust and Trustees who are “interested persons” of the Trust or the Adviser will receive no salary or fees from the Trust. Each Trustee who is not an “interested person” receives a fee of $3,000 per year. The audit committee chairman receives an additional $1,000 per year. The Trust reimburses each Trustee and Officer for his or her travel and other expenses relating to attendance at such meetings.
Certain Trustees and Officers of the Trust are also officers of the Adviser, the Distributor or the Administrator.
| | |
| | |
Annual Report | September 30, 2012 | | 73 |
| | |
RiverNorth Funds | | Notes to Financial Statements |
| | September 30, 2012 |
5. TAX BASIS INFORMATION
Tax Basis of Distributions to Shareholders
The tax character of distributions paid by the Funds during the fiscal year ended September 30, 2012, was as follows:
| | | | | | | | | | | | | | | |
| Fund | | Ordinary
Income | | Distributions
paid from Long-
Term Capital
Gain | | Total |
Core Opportunity Fund* | | | $ | 19,491,846 | | | | $ | 22,521,491 | | | | $ | 42,013,337 | |
Strategic Income Fund* | | | | 56,708,539 | | | | | 28,826 | | | | | 56,737,365 | |
Dividend Income Fund | | | | 17,757 | | | | | – | | | | | 17,757 | |
| * | Classifications of Distributions: Net investment income and net realized gain may differ for financial statement and tax purposes. The character of distributions made during the year from net investment income or net realized gains may differ from its ultimate characterization for federal income tax purposes. |
The tax character of distributions paid by the Funds for the fiscal year ended September 30, 2011 was as follows:
| | | | | | | | | | |
| Fund | | Ordinary Income | | Total |
Core Opportunity Fund | | | $ | 10,698,525 | | | | $ | 10,698,525 | |
Strategic Income Fund | | | | 5,387,319 | | | | | 5,387,319 | |
Components of Distributable Earnings on a Tax Basis: The tax components of distributable earnings are determined in accordance with income tax regulations which may differ from the composition of net assets reported under GAAP. Accordingly, for the year ended September 30, 2012, certain differences were reclassified. These differences were primarily due to the differing tax treatment of wash sales and the treatment of certain expenses; the amounts reclassified did not affect net assets. The reclassifications were as follows:
| | | | | | | | | | | | | | | |
| Fund | | (Decrease)
Paid-in Capital | | Increase
Accumulated Net
Investment Income | | Increase
Accumulated Net
Realized (Loss) |
Core Opportunity Fund | | | $ | – | | | | $ | 1,319,711 | | | | $ | (1,319,711) | |
Strategic Income Fund | | | | (40,622 | ) | | | | 6,380,039 | | | | | (6,339,417) | |
Dividend Income Fund | | | | (4,007 | ) | | | | 12,910 | | | | | (8,903) | |
At September 30, 2012, the components of distributable earnings on a tax basis for the Funds were as follows:
| | | | | | | | | | | | | | | | | | | | | | | | | |
| Fund | | Undistributed
Ordinary
Income | | Accumulated
Capital Gains | | Net Unrealized
Appreciation | | Other Cumulative
Effect of Timing
Differences | | Total |
Core Opportunity | | | $ | 2,309,810 | | | | $ | 20,230,631 | | | | $ | 67,389,867 | | | | $ | (79,248 | ) | | | $ | 89,851,060 | |
Strategic Income | | | | 8,317,228 | | | | | 392,740 | | | | | 61,476,095 | | | | | – | | | | | 70,186,063 | |
Dividend Income | | | | 30,182 | | | | | 1,905 | | | | | 150,775 | | | | | – | | | | | 182,862 | |
| | |
| | |
74 | | (888) 848-7569 | www.rivernorthfunds.com |
| | |
RiverNorth Funds | | Notes to Financial Statements |
| | September 30, 2012 |
Capital Losses: As of September 30, 2012 the Funds do not have unused capital loss carryforwards which may reduce the Funds’ taxable income arising from future net realized gains on investments.
Unrealized Appreciation and Depreciation on Investments: The amount of net unrealized appreciation (depreciation) and the cost of investment securities for tax purposes, including short-term securities at September 30, 2012, were as follows:
| | | | | | | | | | | | | | | | | | | | |
| Fund | | Gross
Appreciation
(excess of value
over tax cost) | | Gross
Depreciation
(excess of tax
cost over value) | | Net Unrealized
Appreciation | | Cost of
Investments for Income Tax Purposes |
Core Opportunity Fund* | | | $ | 75,459,253 | | | | $ | (8,069,386 | ) | | | $ | 67,389,867 | | | | $ | 361,655,361 | |
Strategic Income Fund* | | | | 71,689,914 | | | | | (10,213,819 | ) | | | | 61,476,095 | | | | | 1,089,898,691 | |
Dividend Income Fund | | | | 158,811 | | | | | (8,036 | ) | | | | 150,775 | | | | | 7,064,728 | |
| * | The difference between book and tax basis unrealized appreciation (depreciation) for the Funds is attributable primarily to the tax deferral of losses on wash sales. |
6. INVESTMENTS TRANSACTIONS
Investment transactions for the year ended September 30, 2012, excluding U.S. Government Obligations and short-term investments, were as follows:
| | | | | | | | | | |
| | | Cost of investments
purchased | | Proceeds from
investments sold |
Core Opportunity Fund | | | $ | 129,101,976 | | | | $ | 182,880,633 | |
Strategic Income Fund | | | | 845,537,036 | | | | | 276,408,709 | |
Dividend Income Fund* | | | | 7,684,483 | | | | | 635,142 | |
| * | Fund commenced operations on July 18, 2012. |
Investment transactions in U.S. Government Obligations for the year ended September 30, 2012 were as follows:
| | | | | | | | | | |
| | | Cost of investments
purchased | | Proceeds from
investments sold |
Strategic Income Fund | | | $ | 413,087,415 | | | | $ | 350,062,113 | |
7. REVOLVING LINE OF CREDIT
The Funds have a $75,000,000 Revolving Credit Agreement with The Northern Trust Company. Borrowings under this arrangement are secured by investments held in each Fund’s portfolio and bear interest at the Federal Funds Rate in effect on the day the loan is made plus 1.15% or a minimum of 1.75%, whichever is greater. For unloaned balances the Funds pay a facility fee equal to the product of $75,000,000 less the principal amount of loans outstanding and 0.15%, this fee is reported on the Statements of Operations as Facility Loan Fee. This contract is up for renewal in July, 2013. As of September 30, 2012, there was no outstanding balance and there were no borrowings made during the year.
| | |
| | |
Annual Report | September 30, 2012 | | 75 |
| | |
RiverNorth Funds | | Notes to Financial Statements |
| | September 30, 2012 |
8. BENEFICIAL OWNERSHIP
On September 30, 2012, there were an unlimited number of no par value shares of beneficial interest authorized for each Fund. Transactions in shares of beneficial interest are shown in the Statement of Changes in Net Assets.
The beneficial ownership, either directly or indirectly, of more than 25% of the voting securities of a fund creates a presumption of control of the fund, under Section 2(a)(9) of the Investment Company Act of 1940. Beneficial owners owning more than 25% of the voting securities for the benefit of their customers of each class of each fund, as of September 30, 2012, are listed below:
| | | | | | | |
| Fund | | Shareholder Name | | Percentage Interest |
Core Opportunity Fund | | National Financial Services LLC | | | | 58.83 | % |
Strategic Income Fund - Class I | | Charles Schwab | | | | 27.42 | % |
Strategic Income Fund - Class R | | Charles Schwab | | | | 26.01 | % |
Dividend Income Fund - Class I | | National Financial Services LLC | | | | 40.50 | % |
Dividend Income Fund - Class R | | Charles Schwab | | | | 44.38 | % |
Dividend Income Fund - Class R | | National Financial Services LLC | | | | 35.47 | % |
9. INDEMNIFICATIONS
Under the Trust’s organizational documents, its officers and Trustees are indemnified against certain liability arising out of the performance of their duties to the Trust. Additionally, in the normal course of business, the Trust enters into contracts with service providers that may contain general indemnification clauses. The Trust’s maximum exposure under these arrangements is unknown, as this would involve future claims that may be made against the Trust that have not yet occurred.
10. SUBSEQUENT EVENTS
On October 31, 2012 the Strategic Income Fund Class R Shares and Class I Shares paid an income distribution of $0.037998 and $0.040403 per share, respectively, to shareholders of record on October 26, 2012. On November 30, 2012 the Strategic Income Fund Class R Shares and Class I Shares will pay an income distribution of $0.042259 and $0.044587 per share, respectively, to shareholders of record on November 28, 2012.
On November 14, 2012, the Board of Trustees of RiverNorth approved the nomination of two individuals to the Board of Trustees, subject to shareholder approval. The Board also approved the calling of a special shareholder meeting to elect or re-elect the Trustees of the Trust. The nominations and shareholder meeting are both in response to the decision by an independent Trustee to resign from the Board effective upon the election of the nominees to the Board. Additional details will be forthcoming in a proxy statement. The shareholder meeting will take place in mid-January 2013.
In addition, following the end of the fiscal period, the Trust registered two new series; the RiverNorth Dynamic Buy-Write Fund and the RiverNorth/Oaktree High Income Fund. Going forward references to the “Fund Complex” should include these two new series.
| | |
| | |
76 | | (888) 848-7569 | www.rivernorthfunds.com |
| | |
RiverNorth Funds | | Report of Independent Registered Public Accounting Firm |
| | |
To the Shareholders and Board of Trustees of RiverNorth Funds
We have audited the accompanying statements of assets and liabilities, of RiverNorth Funds, comprising RiverNorth Core Opportunity Fund, RiverNorth/DoubleLine Strategic Income Fund, and RiverNorth/Manning & Napier Dividend Income Fund (the “Funds”), including the schedules of investments, as of September 30, 2012, and the related statement of operations for the year then ended, the statement of changes in net assets for each of the two years in the period then ended, and the financial highlights for each of the five years in the period then ended for the RiverNorth Core Opportunity Fund, the statement of operations for the year then ended, the statement of changes in net assets and the financial highlights for each of the two periods in the period then ended for the RiverNorth/DoubleLine Strategic Income Fund, and the statements of operations and changes in net assets and the financial highlights for the period July 18, 2012 (commencement of operations) through September 30, 2012, for RiverNorth/Manning & Napier Dividend Income Fund. These financial statements and financial highlights are the responsibility of the Funds’ management. Our responsibility is to express an opinion on these financial statements and financial highlights based on our audits.
We conducted our audits in accordance with the standards of the Public Company Accounting Oversight Board (United States). Those standards require that we plan and perform the audit to obtain reasonable assurance about whether the financial statements and financial highlights are free of material misstatement. An audit includes examining, on a test basis, evidence supporting the amounts and disclosures in the financial statements. Our procedures included confirmation of securities owned as of September 30, 2012, by correspondence with the custodian and brokers or by other appropriate auditing procedures where replies from brokers were not received. An audit also includes assessing the accounting principles used and significant estimates made by management, as well as evaluating the overall financial statement presentation. We believe that our audits provide a reasonable basis for our opinion.
In our opinion, the financial statements and financial highlights referred to above present fairly, in all material respects, the financial position of each of the Funds constituting RiverNorth Funds as of September 30, 2012, the results of their operations, the changes in their net assets and their financial highlights for the periods indicated herein, in conformity with accounting principles generally accepted in the United States of America.
COHEN FUND AUDIT SERVICES, LTD.
Cleveland, Ohio
November 29, 2012
| | |
| | |
Annual Report | September 30, 2012 | | 77 |
| | |
RiverNorth Funds | | Additional Information |
| | September 30, 2012 (Unaudited) |
PROXY VOTING GUIDELINES
A description of the policies and procedures that the Funds used to determine how to vote proxies relating to portfolio securities and information regarding how the Funds voted proxies during the most recent 12-month period ended June 30, are available without charge upon request by (1) calling the Funds at (888) 848-7569 and (2) from Form N-PX filed by the Funds with the Securities and Exchange Commission (“SEC”) on the SEC’s website at www.sec.gov.
PORTFOLIO HOLDINGS DISCLOSURE POLICY
The Funds file a complete schedule of investments with the SEC for the first and third quarter of each fiscal year on Form N-Q. The Funds’ first and third fiscal quarters end on December 31 and June 30. The Form N-Q filing must be made within 60 days of the end of the quarter, and the Funds’ first Form N-Q was filed with the SEC on February 26, 2007. The Funds’ Forms N-Q are available on the SEC’s website at www.sec.gov, or they may be reviewed and copied at the SEC’s Public Reference Room in Washington, DC (call 1-800-732-0330 for information on the operations of the Public Reference Room). You may also obtain copies by calling the Funds at 1-888-848-7569.
UNAUDITED TAX INFORMATION
The Funds designate the following as a percentage of taxable ordinary income distributions, or up to the maximum amount allowable, for the calendar year ended December 31, 2011:
| | | | |
| | | Qualified Dividend Income | | Dividend Received Deduction |
Core Opportunity Fund | | 0.01% | | 0.01% |
Strategic Income Fund | | 0.40% | | 0.40% |
Pursuant to Section 852(b)(3) of the Internal Revenue Code, the RiverNorth Core Opportunity Fund and the RiverNorth/DoubleLine Strategic Income Fund designated $22,521,491 and $28,826 respectively as long-term capital gain dividends.
APPROVAL OF AMENDMENTS TO MANAGEMENT AGREEMENT
RiverNorth/Manning & Napier Dividend Income Fund
An amendment of the Management Agreement (“Agreement”) between RiverNorth Funds (the “Trust”) and RiverNorth Capital Management (the “Adviser”) required for the addition of the RiverNorth/Manning & Napier Dividend Income Fund to the Trust was considered by the Board of Trustees (the “Board” or the “Trustees”) at an in-person meeting (the “Meeting”) held on May 16, 2012. The Board acknowledged having received materials compiled by the Adviser, Manning & Napier (the “Sub-Adviser”), and the Fund’s administrator including a copy of the Agreement, the Adviser’s response to a questionnaire regarding the Adviser’s profitability, management and operations, a copy of the Adviser’s Form ADV, certifications regarding the Adviser’s compliance programs and information regarding the performance of its benchmarks and peer funds. The Board also acknowledged having received a memorandum from its legal counsel regarding the Trustees’ responsibilities in considering the renewal or approval of the Agreement and detailing the specific factors it must consider including: (i) the investment performance of the Fund and the
| | |
| | |
78 | | (888) 848-7569 | www.rivernorthfunds.com |
| | |
RiverNorth Funds | | Additional Information |
| | September 30, 2012 (Unaudited) |
investment performance of the Adviser, (ii) the nature, extent and quality of the services provided by the Adviser to the Fund, (iii) the costs of the services provided and the profits to be realized by the Adviser and any of its affiliates from the relationship with the Fund, (iv) the extent to which economies of scale will be realized by the Fund as it grows, and (v) whether the Fund’s fee levels reflected the economies of scale to the benefit of the Fund’s shareholders.
The Board did not review the performance of the Fund as it had not yet commenced investment operations. The Board reviewed performance for similar funds managed by both the Adviser and the Sub-Adviser. It was noted that the Adviser and Sub-Adviser had successfully managed similar strategies that were to be utilized in the Fund.
As to the comparative fees and expenses, the Trustees considered the management fee paid by the Fund and compared that fee to the management fees paid by funds in a relative peer group, as well as its total expense ratios. the Board noted that the Class I share estimated annual net expense ratio of 1.35% was the same as the average expense ratio for the peer funds included in the peer group. The Trustees also noted that the lowest reported net expense ratio was 1.06% within the peer group and the highest was 1.75%. The Board also noted that the annual management fee of 1.00% for the Fund was slightly above the 0.82% average paid by the other peer funds. The Board noted that 1.25% is the maximum fee charged by the peers and the minimum fee for the same peer group is 0.50%. After discussion, it was a consensus of the Trustees that the fees were reasonable given the exceptional performance of the Fund over the same periods.
As to the nature, extent and quality of the services to be provided by the Adviser to the Fund, the Trustees considered that under the terms of the Agreement, the Adviser would, subject to the supervision of the Board, provide or arrange to be provided to the Fund such investment advice as the Adviser, in its discretion, deems advisable and will furnish or arrange to be furnished a continuous investment program for the Fund consistent with the Fund’s investment objective and policies. The Board was then referred to the Adviser’s Form ADV which was previously provided to the Board and which provided details regarding the experience of each of the Adviser’s personnel. The Adviser also provided additional information regarding its experience managing other investment accounts. Based on the foregoing information, the Trustees concluded that the Adviser had provided quality services and would continue to do so for the Fund.
As to the cost of the services to be provided and to the profits to be realized by the Adviser, the Trustees reviewed the Adviser’s estimates of its profitability and its financial condition. The Board noted the Adviser’s financial condition is stable as additional accounts and income from its mutual funds have contributed to higher revenues for the Adviser. The Trustees determined and agreed that the Agreement, with respect to the RiverNorth/Manning & Napier Dividend Income Fund was not overly profitable to the Adviser and the financial condition of the Adviser was adequate. The Trustees noted that the Adviser has no affiliations with the Fund’s transfer agent fund account, custodian, or distributor and therefore does not derive any benefits from the relationships these parties may have with the Trust. The Board determined that although an affiliate of the Adviser did receive some benefits from the Fund in the form of brokerage commissions, those commissions were comparable to those negotiated in arm’s length negotiations and therefore did not disadvantage the Fund in commission costs, and may have benefited the Fund as a result of better execution services.
| | |
| | |
Annual Report | September 30, 2012 | | 79 |
| | |
| RiverNorth Funds | | Additional Information |
| | September 30, 2012 (Unaudited) |
BOARD CONSIDERATIONS REGARDING APPROVAL OF INVESTMENT
SUB-ADVISORY AGREEMENT
RiverNorth/Manning and Napier Dividend Income Fund
The approval of the Sub-Advisory Agreement (“Agreement”) between RiverNorth Capital Management LLC (the “Adviser”) and Manning & Napier Advisors, LLC (the “Sub-Adviser) with respect to the RiverNorth/Manning and Napier Dividend Income Fund (the “Fund”) was considered by the Board of Trustees (the “Board” or the “Trustees”) at an in-person meeting (the “Meeting”) held on May 16, 2012. The Board acknowledged having received materials compiled by the Fund’s administrator including a copy of the Agreement, the Sub-Adviser’s responses to a questionnaire regarding the Sub-Adviser’s profitability, management and operations, a copy of the Sub-Adviser’s Form ADV, and certifications regarding the Sub-Adviser’s compliance programs. The Board acknowledged having received a memorandum from its legal counsel regarding the Trustees’ responsibilities in considering the approval of the Agreement and detailing the specific factors it must consider including: (i) the performance of the Sub-Adviser in managing its retail funds and separate accounts, (ii) the nature, extent and quality of the services provided by the Sub-Adviser to the Fund, (iii) the costs of the services provided and the profits to be realized by the Adviser, Sub-Adviser, and any of their affiliates from their relationship with the Fund, (iv) the extent to which economies of scale will be realized by the Fund as it grows, and (v) whether the Fund’s fee levels were expected to result in economies of scale to the benefit of the Fund’s shareholders.
As to the comparative fees and expenses, the Trustees considered the management fee to be paid by the Fund to the Adviser and compared that fee to the management fees paid by funds in a relative peer group, as well as its total expense ratios. The Adviser indicated that the annual operating expenses were estimated for the first year, and from its management fee it would be paying the Sub-Adviser its fee. The Board also noted that the Fund does not have a true peer group as the strategy is unique to the Fund, but the Board determined that the proposed fees are reasonable given the strategy.
As to the nature, extent and quality of the services to be provided by the Adviser and Sub-Adviser to the Fund, the Board considered that under the terms of the Management Agreement, the Adviser would, subject to the supervision of the Board, provide or arrange to be provided to the Fund such investment advice as the Adviser, in its discretion, deems advisable and will furnish or arrange to be furnished a continuous investment program for the Fund consistent with the Fund’s investment objective and policies. As part of the program, the Board noted that the Adviser had retained an established equity income manager to manage certain assets of the Fund consistent with the strategy. Based on the foregoing information, the Board concluded that the Adviser and Sub-Adviser will provide quality services for the Fund.
The Board noted that the Adviser and Sub-Adviser have no affiliations with the Fund’s transfer agent fund account, custodian, distributor or any other broker-dealers and therefore would not derive any benefits from the relationships these parties may have with the Fund.
With regard to future growth and achieving economies of scale, the Adviser outlined the marketing plans that include emphasis on marketing to fee-based financial advisers to grow the assets of the Fund. In response to the Board’s comment regarding expenses and management fees, the Adviser indicated that as the Fund’s assets grow it would anticipate reducing further the annual expense ratio of the Fund. Additionally, the Adviser indicated that as economies are
| | |
| | |
80 | | (888) 848-7569 | www.rivernorthfunds.com |
| | |
RiverNorth Funds | | Additional Information |
| | September 30, 2012 (Unaudited) |
realized, the Adviser would consider further reductions in the management fees, but also noted the limited capacity of the strategy.
After additional consideration, the Board commenced an executive session to further consider and discuss the approval of the proposed Sub-Advisory Agreement. After discussion, a majority of the Board of Trustees of RiverNorth Funds, including a majority of the Trustees who are not interested persons of the Trust or interested parties to the Agreement approved the Sub- Advisory Agreement.
| | |
| | |
Annual Report | September 30, 2012 | | 81 |
| | |
RiverNorth Funds | | Trustees and Officers |
| | September 30, 2012 (Unaudited) |
The Board of Trustees supervises the business activities of the Trust and appoints the officers. Each Trustee serves as a trustee until the termination of the Trust unless the Trustee dies, resigns, retires or is removed. The Board generally meets four times a year to review the progress and status of the Funds.
The following table provides information regarding each Trustee who is not an “interested person” of the Trust, as defined in the Investment Company Act of 1940, as amended.
| | | | | | | | | | |
Name, Address and Year of Birth(1) | | Positions Held with
the Funds | | Term of
Office/Length of
Time Served | | Principal Occupation(s)
During past 5 Years | | Number of
Portfolios in Fund
Complex(2)
Overseen by
Trustee | | Other Directorships Held by Trustee During the Past 5 Years |
Kevin M. Hinton Y.O.B. 1971 | | Trustee | | Indefinite/ September 2006 to present | | Executive Vice President Associated Destinations Worldwide (2010 to present) Chief Executive Officer, Hinton and Grusich (a hotel sales representation firm) (2009 to 2010), Chief Operating Officer (1999 to 2009). | | 3 | | N/A |
James G. Kelley Y.O.B. 1948 | | Trustee | | Indefinite/ September 2006 to present | | Certified Business & Life Coach, JGK & Associates (2002 to present); Vice President Finance & Operation, Paymaster Technologies, Inc. (2009 to 2010); Executive Vice President /Chief Operating Officer, The Hedman Company (a manufacturing company) (1984 to 2010). | | 3 | | N/A |
John S. Oakes Y.O.B. 1943 | | Trustee | | Indefinite/ December 2010 to present | | Regional Vice President, Securities America (a broker-dealer) (2007 to present); Business Development Director, First Allied Securities (a broker-dealer) (2005 to 2007). | | 3 | | Independent Director, Chairman of the Board of Directors, Utopia Funds; 2005 to 2009. |
| (1) | The mailing address of each Trustee is 325 N. LaSalle Street, Suite 645, Chicago, IL 60654. |
| (2) | The Fund Complex is comprised of the RiverNorth Core Opportunity Fund, the RiverNorth/DoubleLine Strategic Income Fund and the RiverNorth/Manning & Napier Dividend Income Fund. |
| | |
| | |
82 | | (888) 848-7569 | www.rivernorthfunds.com |
| | |
| RiverNorth Funds | | Trustees and Officers |
| | September 30, 2012 (Unaudited) |
The following table provides information regarding each Trustee who is an “interested person” of the Trust, as defined in the Investment Company Act of 1940, as amended, and each officer of the Trust.
| | | | | | | | | | |
Name, Address and Year of Birth(1) | | Positions Held with the Funds | | Term of Office/Length of Time Served | | Principal Occupation(s) During past 5 Years | | Number of Portfolios in Fund Complex(2) Overseen by Trustee | | Other
Directorships
Held by Trustee
During the Past
5 Years |
Patrick W. Galley3 Y.O.B. 1975 | | President, Principal Executive Officer and Trustee | | Indefinite/ July 2006 to present | | Chief Investment Officer, RiverNorth Capital Management, LLC. (2004 to present). | | 3 | | Board of
Managers
RiverNorth
Capital
Management,
LLC (2010 to
present),
Board of
Directors
RiverNorth
Holdings, Co.
(2010 to
present). |
Jonathan M. Mohrhardt Y.O.B. 1974 | | Treasurer, Chief Financial Officer | | Indefinite/ February 2009 to present | | Chief Compliance Officer, RiverNorth Capital Management, LLC. (2009 to 2012); Chief Operating Officer, RiverNorth Capital Management, LLC (2011 to present) and President, Chief Executive Officer, and Chief Compliance Officer, RiverNorth Securities, LLC (2010 to present); Utopia Funds, Chief Compliance Officer (2007 to 2009), Treasurer and Chief Financial Officer (2005 to 2009); FIM Group, Director of Mutual Funds (2004 to 2009). | | N/A | | Board of
Managers
RiverNorth
Capital
Management,
LLC (2010 to
present),
Board of
Directors
RiverNorth
Holdings, Co.
(2010 to
present). |
Marcus L. Collins Y.O.B. 1968 | | Chief Compliance Officer | | Indefinite/ May 2012 to Present | | General Counsel, RiverNorth Capital Management, LLC (2012 to Present), Chief Compliance Officer, RiverNorth Capital Management, LLC (2012 to Present) Counsel, Thompson Hine, LLP (2007 to 2012). | | N/A | | N/A |
| (1) | The mailing address of each Trustee and listed Officer is 325 N. LaSalle Street, Suite 645, Chicago, IL 60654. |
| (2) | The “Fund Complex” consists of the RiverNorth Core Opportunity Fund, the RiverNorth/DoubleLine Strategic Income Fund and the RiverNorth/Manning & Napier Dividend Income Fund. |
| (3) | Patrick W. Galley is considered an “Interested” Trustee as defined in the Investment Company Act of 1940, as amended, because he is an officer of the Trust and Chief Investment Officer of the Funds’ investment adviser. |
| | |
| | |
Annual Report | September 30, 2012 | | 83 |
| | |
RiverNorth Funds | | Trustees and Officers |
| | September 30, 2012 |
| | | | | | | | | | |
Name, Address and Year of Birth(1) | | Positions
Held with the Funds | | Term of Office/Length of Time Served | | Principal Occupation(s) During past 5 Years | | Number of Portfolios in Fund Complex(2) Overseen by Trustee | | Other Directorships Held by Trustee During the Past 5 Years |
Paul F. Leone Y.O.B. 1963 c/o ALPS Fund Services, Inc. 1290 Broadway, Suite 1100 Denver, CO 80203 | | Secretary | | Indefinite/ December 2010 to present | | Assistant General Counsel, ALPS Fund Services, Inc. (2010 to present); Deputy Chief Compliance Officer, Old Mutual Capital (2005 to 2009). Mr. Leone is also Secretary of the Westcore Trust. | | N/A | | N/A |
J. Tison Cory Y.O.B. 1969 c/o ALPS Fund Services, Inc. 1290 Broadway, Suite 1100 Denver, CO 80203 | | Assistant Secretary | | Indefinite/ December 2010 to present | | Senior Paralegal, ALPS Fund Services, Inc. (2005 to present); Adjunct Professor, Metropolitan State College of Denver (2000 to present). Mr. Cory is also Secretary of the Reaves Utility Income Fund. | | N/A | | N/A |
Dawn Cotten Y.O.B. 1977 c/o ALPS Fund Services, Inc. 1290 Broadway, Suite 1100 Denver, CO 80203 | | Assistant Treasurer | | Indefinite/ May 2011 to present | | Fund Controller, ALPS Fund Services (2009 to present); Assistant Vice President of Fund Accounting, Madison Capital Management (2009); Financial Reporting Manager, Janus Capital Group (2000 to 2009). Ms. Cotten is also Assistant Treasurer of the Stone Harbor Investment Funds, Stone Harbor Emerging Markets Income Fund, Clough Global Allocation Fund, Clough Global Opportunities Fund, Clough Global Equity Fund, Stonebridge Funds Trust, and Secretary of Stonebridge Funds. | | N/A | | N/A |
| (1) | The mailing address of each Trustee and listed Officer is 325 N. LaSalle Street, Suite 645, Chicago, IL 60654. |
| (2) | The “Fund Complex” consists of the RiverNorth Core Opportunity Fund, the RiverNorth/DoubleLine Strategic Income Fund and the RiverNorth/Manning & Napier Dividend Income Fund. |
| | |
| | |
84 | | (888) 848-7569 | www.rivernorthfunds.com |

| (a) | The registrant, as of the end of the period covered by this report, has adopted a code of ethics that applies to the registrant’s principal executive officer, principal financial officer, principal accounting officer or controller or any persons performing similar functions on behalf of the registrant. |
| (b) | For purposes of this item, “code of ethics” means written standards that are reasonably designed to deter wrongdoing and to promote: |
| | (1) | Honest and ethical conduct, including the ethical handling of actual or apparent conflicts of interest between personal and professional relationships; |
| | (2) | Full, fair, accurate, timely, and understandable disclosure in reports and documents that a registrant files with, or submits to, the Commission and in other public communications made by the registrant; |
| | (3) | Compliance with applicable governmental laws, rules, and regulations; |
| | (4) | The prompt internal reporting of violations of the code of ethics to an appropriate person or persons identified in the code of ethics; and |
| | (5) | Accountability for adherence to the code of ethics. |
| (c) | Amendments: During the period covered by this report, no amendments were made to the provisions of the code of ethics adopted in 2(a) above. |
| (d) | Waivers: During the period covered by this report, no implicit or explicit waivers to the provisions of the code of ethics adopted in 2(a) above were granted. |
| (e) | Posting: We do not intend to post the code of ethics for the Officers or any amendments or waivers on a website. |
| (f) | Availability: The code of ethics for the Officers can be obtained, free of charge by calling the toll free number for the appropriate Fund. |
| Item 3. | Audit Committee Financial Expert. |
The registrant’s board of trustees has determined that the registrant does not have an audit committee financial expert. The committee members and the full Board considered a possibility of adding a member that would qualify as an expert. The audit committee determined that, although none of its members meet the technical definition of an audit committee expert, the committee has sufficient financial expertise to adequately perform its duties under the Audit Committee Charter without the addition of a qualified expert.
| Item 4. | Principal Accountant Fees and Services. |
| | | | | | |
(a) | | Audit Fees | | | | |
| | Fiscal Year | | Audit Fees | |
| | FY 2012 | | $40,500 | |
| | FY 2011 | | $24,000 | |
(b) | | Audit-Related Fees | |
| | Fiscal Year | | Registrant | |
| | FY 2012 | | $0 | |
| | FY 2011 | | $0 | |
(c) | | Tax Fees | | | |
| | Fiscal Year | | Registrant | |
| | FY 2012 | | $12,000 | |
| | FY 2011 | | $5,000 | |
| | Nature of the Tax Fees: prepare tax returns | |
(d) | | All Other Fees | | | |
| | Fiscal Year | | Registrant | |
| | FY 2012 | | $3,030 | |
| | FY 2011 | | $4,750 | |
| | Nature of the fees: cursory review of Semi-Annual Shareholder report, post-effective amendment consents and distribution calculation review |
(e)
(1) Audit Committee’s Pre-Approval Policies
The Audit Committee Charter requires the Audit Committee to be responsible for the selection, retention or termination of auditors and, in connection therewith, to (i) evaluate the proposed fees and other compensation, if any, to be paid to the auditors, (ii) evaluate the independence of the auditors, (iii) pre-approve all audit services and, when appropriate, any non-audit services provided by the independent auditors to the Trust, (iv) pre-approve, when appropriate, any non-audit services provided by the independent auditors to the Trust’s investment adviser, or any entity controlling, controlled by, or under common control with the investment adviser and that provides ongoing services to the Trust if the engagement relates directly to the operations and financial reporting of the Trust, and (v) receive the auditors’ specific representations as to their independence.
(2) Percentages of Services Approved by the Audit Committee
| | | | | | |
| | Registrant | | | | |
| | Audit-Related Fees: | | 0% | |
| | Tax Fees: | | 0% | |
| | All Other Fees: | | 0% | |
| (f) | During audit of registrant’s financial statements for the most recent fiscal year, less than 50 percent of the hours expended on the principal accountant’s engagement were attributed to work performed by persons other than the principal accountant’s full-time, permanent employees. |
| (g) | The aggregate non-audit fees billed by the registrant’s accountant for services rendered to the registrant, and rendered to the registrant’s investment adviser (not including any sub-adviser whose role is primarily portfolio management and is subcontracted with or overseen by another investment adviser), and any entity controlling, controlled by, or under common control with the adviser that provides ongoing services to the registrant: |
| | | | | | | | |
| | Fiscal Year | | Registrant | | Adviser | | |
| | FY 2012 | | $15,030 | | $0 | |
| | FY 2011 | | $9,750 | | $0 | |
| (h) | Not applicable. The auditor performed no services for the registrant’s investment adviser or any entity controlling, controlled by, or under common control with the investment adviser that provides ongoing services to the registrant. |
| Item 5. | Audit Committee of Listed Registrants. |
NOT APPLICABLE – applies to listed companies only
| Item 6. | Schedule of Investments. |
Schedule included with Item 1.
| Item 7. | Disclosure of Proxy Voting Policies and Procedures for Closed-End Management Investment Companies. |
NOT APPLICABLE – applies to closed-end funds only
| Item 8. | Portfolio Managers of Closed-End Management Investment Companies. |
NOT APPLICABLE – applies to closed-end funds only
| Item 9. | Purchases of Equity Securities by Closed-End Management Investment Company and Affiliated Purchasers. |
NOT APPLICABLE – applies to closed-end funds only
| Item 10. | Submission of Matters to Vote of Security Holders. |
The registrant has not adopted procedures by which shareholders may recommend nominees to the registrant’s board of trustees.
| Item 11. | Controls and Procedures. |
| | (a) | Based on an evaluation of the registrant’s disclosure controls and procedures (as defined in
Rule 30a-3(c) under the Investment Company Act of 1940) as of a date within 90 days of the filing date of this Form N-CSR, the disclosure controls and procedures are reasonably designed to ensure that the information required in filings on Forms N-CSR is recorded, processed, summarized, and reported on a timely basis. |
| | (b) | There were no significant changes in the registrant’s internal control over financial reporting that occurred during the registrant’s second fiscal quarter of the period covered by this report that have materially affected, or are reasonably likely to materially affect, the registrant’s internal control over financial reporting. |
| | | | |
| | (a)(1) | | Code is filed herewith |
| | |
| | (a)(2) | | Certifications by the registrant’s principal executive officer and principal financial officer, pursuant to Section 302 of the Sarbanes-Oxley Act of 2002 and required by Rule 30a-2under the Investment Company Act of 1940 are filed herewith. |
| | |
| | (a)(3) | | Not Applicable. |
| | |
| | (b) | | Certification pursuant to 18 U.S.C. Section 1350, as adopted pursuant to Section 906 of the Sarbanes-Oxley Act of 2002 is filed herewith. |
SIGNATURES
Pursuant to the requirements of the Securities Exchange Act of 1934 and the Investment Company Act of 1940, the registrant has duly caused this report to be signed on its behalf by the undersigned, thereunto duly authorized.
Registrant: RiverNorth Funds
| | |
By: | | /s/ Patrick W. Galley |
Name: | | Patrick W. Galley |
Title: | | President |
| |
Date: | | December 5, 2012 |
Pursuant to the requirements of the Securities Exchange Act of 1934 and the Investment Company Act of 1940, this report has been signed below by the following persons on behalf of the registrant and in the capacities and on the dates indicated.
| | |
By: | | /s/ Patrick W. Galley |
Name: | | Patrick W. Galley |
Title: | | President & Chief Executive Officer |
| |
Date: | | December 5, 2012 |
| | |
By: | | /s/ Jonathan M. Mohrhardt |
Name: | | Jonathan M. Mohrhardt |
Title: | | Treasurer & Chief Financial Officer |
| |
Date: | | December 5, 2012 |