UNITED STATES
SECURITIES AND EXCHANGE COMMISSION
Washington, D.C. 20549
FORM N-CSR
CERTIFIED SHAREHOLDER REPORT OF REGISTERED
MANAGEMENT INVESTMENT COMPANIES
Investment Company Act file number: 811-21934
RiverNorth Funds
(Exact name of registrant as specified in charter)
325 North LaSalle Street, Suite 645
Chicago, IL 60654
(Address of principal executive offices) (Zip code)
Marc L. Collins
325 North LaSalle Street, Suite 645
Chicago, IL 60654
(Name and address of agent for service)
Registrant’s telephone number, including area code: 312-832-1440
| | |
| Date of fiscal year end: | | 09/30 |
| |
| Date of reporting period: | | 09/30/2013 |
| Item 1. | Reports to Stockholders. |
| | |
| RiverNorth Funds | | Table of Contents |
| | |
| | |
| Annual Report | September 30, 2013 | | 1 |
| | |
| RiverNorth Funds | | Table of Contents |
| | |
| | |
| 2 | | (888) 848-7569 | www.rivernorthfunds.com |
| | | | |
| | “Be Fearful When Others Are Greedy and Greedy When Others Are Fearful” | | |
| | |
| | – Warren Buffett | | |
| | |
| RiverNorth Funds | | Shareholder Letter |
| | September 30, 2013 (Unaudited) |
Dear Fellow Shareholders,
We are pleased to provide you with the 2013 Annual Report for the RiverNorth Funds. This report covers the RiverNorth Core Opportunity Fund (ticker: RNCOX), the RiverNorth/DoubleLine Strategic Income Fund (tickers: RNSIX and RNDLX), the RiverNorth/Manning & Napier Dividend Income Fund (tickers: RNDIX and RNMNX), the RiverNorth Dynamic Buy-Write Fund (ticker: RNBWX) and our newest fund family member, the RiverNorth/Oaktree High Income Fund (tickers: RNHIX and RNOTX). All Funds have a fiscal year-end of September 30, 2013. In the Management Discussion of Fund Performance section of this report, we discuss each Fund’s total return investment performance and main drivers of performance during the reporting period. We have separated the Funds into two categories, Opportunistic Closed-End Fund Strategies and Managed Volatility Strategy.
In fiscal year 2013, we are pleased to have launched two new funds, adding to the breadth of the RiverNorth fund lineup, in addition to re-opening the RiverNorth/DoubleLine Strategic Income Fund.
| | • | | The RiverNorth/Oaktree High Income Fund combines the credit expertise of one of the most highly respected institutional managers, Oaktree Capital Management, with RiverNorth’s opportunistic closed-end Fund strategy. The result is a unique alternative to traditional credit-focused funds. |
| | • | | The RiverNorth Dynamic Buy-Write Fund is focused on exploiting the inefficiencies within the options market. Managed by a separate team within RiverNorth, specializing in managing volatility, we believe this Fund provides investors with an alternative to traditional fixed income and equity markets. |
| | • | | The RiverNorth/DoubleLine Strategic Income Fund re-opened in August 2013 after being closed to new investors for the past 16 months. Attractive investment opportunities within the fixed income closed-end fund market not seen since the Fund’s inception was the main catalyst for the Fund’s reopening. We will continue to monitor the Fund’s size in relationship to the investment opportunity going forward. |
A consistent theme within RiverNorth’s fund line up is the emphasis on taking an opportunistic approach in a risk-minded manner. In a period of uncertainty caused by either capital market fears, interest rate fears, or political fears, each Fund within the RiverNorth Funds family is positioned to be opportunistic and reactive to market dislocations. Partnered with some of the best sub-advisers in the world, which share a similar philosophy and objective, the RiverNorth Funds family takes a unique approach to core beta products combined with unique alpha opportunities packaged into single funds with an array of investment objectives. We believe these alternative strategies provide investors with a solutions-based approach for today’s uncertain markets.
Please visit www.rivernorthfunds.com for additional information.
We thank you for your investment and trust in managing your assets.
Respectfully,
Patrick W. Galley, CFA
Chairman, President and Chief Investment Officer
RiverNorth Funds
| | |
| 4 | | (888) 848-7569 | www.rivernorthfunds.com |

| | |
| RiverNorth Funds | | Portfolio Update |
| | September 30, 2013 (Unaudited) |
Closed-End Fund Market Overview and Outlook
Bond Funds
Since we co-manage our High Income Fund with Oaktree Capital, we decided to borrow an observation made by Howard Marks about investor psychology. Howard Marks, Chairman and co-founder of Oaktree Capital, is well known within the investment community as a thought leader on behavioral finance. The following observation applies to investors in general, but we thought it also summarized the attitude and behavior of closed-end bond fund investors over the past twelve months.
“When things are going well and prices are high, investors rush to buy, forgetting all prudence. Then, when there’s chaos all around and assets are on the bargain counter, they lose all willingness to bear risk and rush to sell. And it will ever be so.”
In the case of closed-end bond funds, the pendulum of investor sentiment has swung from greed to fear. The average discount on closed-end bond funds (i.e., 394 funds with an aggregate market capitalization of $134 billion) was 6.0% on September 30, 2013. This compares to an average premium of 3.3% on September 30, 2012. The collapse of closed-end bond fund premiums is the main reason why the market price total return for this category was negative 10.7% over the past twelve months. The net asset value (“NAV”) total return was negative 1.6% during the same period. In other words, the mood swing of the closed-end fund market caused the market price total return of the bond fund category to trail the net asset value total return by approximately 900 basis points.
The bond fund sell-off began May 2013. Federal Reserve Chairman Ben Bernanke told Congress the Fed may reduce the pace of bond purchases (i.e. quantitative easing) sometime this year if there were indications of sustained economic growth. The simple suggestion of tighter monetary policy sparked a global panic in the bond market. Interest rates and volatility spiked higher as investors liquidated their fixed income holdings. Although the momentum of the sell-off was unexpected, we were prepared for the contraction in bond fund premiums. In our Letter to Shareholders in 2012, we wrote:
“With bond yields near historic lows and bond fund premiums at historic highs, the risk of buying over-priced bonds through an over-priced investment vehicle should dissuade knowledgeable investors from pushing premiums much higher.”
Across our closed-end fund (“CEF”) trading strategies, we had become underweight bond Funds and concentrated in our best ideas. We sold bond funds into strength during the first four months of the year. As of April 30, 2013 (pre-panic), closed-end bond fund exposure levels were 5.2% for RiverNorth Core Opportunity, 13.9% for RiverNorth/DoubleLine Strategic Income and 12.6% for RiverNorth/Oaktree High Income.
Now that prices are lower and discounts wider, our bond fund exposure is higher across the board. As of September 30, 2013, closed-end bond fund exposure levels were 19.3% for RiverNorth Core Opportunity, 27.1% for RiverNorth/DoubleLine Strategic Income and 18.3% for RiverNorth/Oaktree High Income. The areas we find most attractive are high yield, multi-sector and municipal bond funds. Having waited patiently for interest rate volatility to drive discounts wider, we are now excited about today’s opportunity set. We share this enthusiasm with fixed income luminary, Jeffrey Gundlach, CEO/CIO of DoubleLine Capital, LP and co-Portfolio Manager of
| | |
| 6 | | (888) 848-7569 | www.rivernorthfunds.com |
| | |
| RiverNorth Funds | | Portfolio Update |
| | September 30, 2013 (Unaudited) |
our Strategic Income Fund. While there is no guarantee that discounts will narrow, we have confidence that market participants like a good deal. We believe well-managed bond funds trading at historically wide discounts do not sit on the bargain counter for long; especially when bond funds are priced to yield 7.0%, on average.
Nevertheless, we may experience some headwind caused by tax-loss selling in the fourth quarter of 2013. Financial advisors will likely encourage their clients to sell bond funds and use the losses to offset capital gains on their tax returns. The seasonal selling pressure may lead to further discount widening. RiverNorth will be prepared to buy on technical weakness in the fourth quarter.
Equity Funds (including Hybrid Funds)
As of September 30, 2013, there were 201 U.S. domiciled equity closed-end funds with an aggregate market capitalization of $90 billion. Over the past twelve months, the market price total return for this category was positive 6.6% and the net asset value total return was positive 9.8%. The average discount on equity funds was 8.1% on September 30, 2013.
Although equity funds delivered solid performance, they were outdone by the S&P 500 (a proxy for the US equity market). The S&P 500 jumped 19.3% over the past twelve months. On average, we expect the net asset value total return of the equity fund category to underperform the S&P 500 when the domestic equity market is soaring. Most closed-end equity funds are not benchmarked against the S&P 500. Instead, the majority of managers are running non-traditional investment strategies – including, but not limited to, covered call, dividend income, global allocation and sector-specific. Collectively, equity funds have a market beta of less than 1.0 (relative to the S&P 500). Beta reflects the sensitivity of a fund’s return to fluctuation in the market index.
Currently, we believe there are plenty of attractive investment opportunities among equity funds. About half of these funds are trading at discounts wider than 10%. Approximately 40% of both the RiverNorth Core Opportunity Fund and the RiverNorth/Manning & Napier Dividend Income Fund was allocated to equity funds as of September 30, 2013. The areas we find most attractive are traditional equity funds with high distribution rates and hybrid funds (i.e., stock and bond portfolios) with discounts wider than 10%.
We believe that bond funds will continue to grab the headlines, but equity funds should not be overlooked. After three years of net outflows, US focused equity mutual funds have reported modest year-to-date net inflows. Although we cannot predict when investors will allocate a more meaningful amount of capital to US equities, we believe that positive momentum in the open-end mutual fund category will spill over into the closed-end fund space. Equity funds trading at double-digit discounts may outperform the market if their discounts narrow to the historical average.
| | |
| Annual Report | September 30, 2013 | | 7 |
| | |
| RiverNorth Funds | | Portfolio Update |
| | September 30, 2013 (Unaudited) |
RiverNorth Core Opportunity Fund
Portfolio Management Commentary – Patrick Galley, CFA and Stephen O’Neill, CFA
What is the Fund’s investment strategy?
The RiverNorth Core Opportunity Fund (“RNCOX”; “the Fund”) invests in a broad range of equity, fixed income and short-term securities. To implement the Fund’s tactical asset allocation, the adviser generally invests in closed-end funds and exchange-traded funds (“ETFs”).
How did the RiverNorth Core Opportunity Fund perform relative to its benchmark during the reporting period?
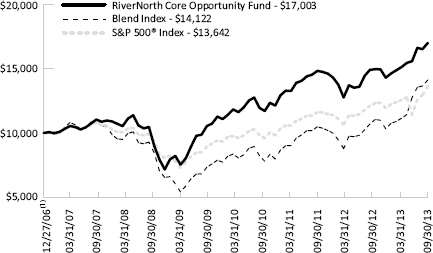
For the twelve month period ending September 30, 2013, the RiverNorth Core Opportunity Fund returned 10.08%. The unmanaged Blend Index returned 10.58% during the same period. The Blend Index consists of 60% S&P 500 Index and 40% Barclays Capital U.S. Aggregate Bond Index.
Comparison of a $10,000 Investment in the RiverNorth Core Opportunity Fund, the Blend Index, and the S&P 500® Index.
Average Annual Total Returns for Periods Ending September 30, 2013
| | | | | | | | | | |
| | | 1-Year | | 3-Year | | 5-Year | | Since Inception(1) | | |
|
RiverNorth Core Opportunity Fund (RNCOX) | | 10.08% | | 9.55% | | 13.59% | | 8.17% | | |
|
Blend Index(2) | | 10.58% | | 10.95% | | 8.59% | | 5.24% | | |
|
S&P 500® Index(2) | | 19.34% | | 16.27% | | 10.02% | | 4.70% | | |
|
| | |
| 8 | | (888) 848-7569 | www.rivernorthfunds.com |
| | |
| RiverNorth Funds | | Portfolio Update |
| | September 30, 2013 (Unaudited) |
| (1) | Inception date is December 27, 2006. |
| (2) | Blend Index consists of 60% S&P 500® Index and 40% Barclays Capital U.S. Aggregate Bond Index. S&P 500® Index is a capitalization-weighted index of 500 stocks. The S&P 500® Index is designed to measure performance of the broad domestic economy based on the changing aggregate market value of these 500 stocks. The Barclays Capital US Aggregate Bond Index (formerly Lehman Brothers US Aggregate Bond Index) is a benchmark index composed of US securities in Treasury, Government-Related, Corporate, and Securitized sectors. It includes securities that are of investment-grade quality or better, have at least one year to maturity, and have an outstanding par value of at least $250 million. This unmanaged index does not reflect fees and expenses. The index cannot be invested in directly. The S&P 500 and Blend Indices are indices only and cannot be invested in directly. |
Performance data quoted represents past performance, which is not a guarantee of future results. Current performance may be lower or higher than the performance quoted. The principal value and investment return of an investment will fluctuate so that your shares, when redeemed, may be worth more or less than their original cost. You can obtain performance data current to the most recent month end by calling (888) 848-7569 or www.rivernorthfunds.com. Total return measures net investment income and capital gain or loss from portfolio investments. All performance shown assumes reinvestment of dividends and capital gains distributions.
The RiverNorth Core Opportunity Fund’s Total Annual Fund Operating Expenses as disclosed in the prospectus is 2.27%. The Fund’s adviser has contractually agreed to waive management fees and/or reimburse expenses (excluding brokerage fees and commissions; borrowing costs such as (a) interest and (b) dividends on securities sold short; taxes; indirect expenses incurred by the underlying funds in which the Fund invests and extraordinary expenses) of the Fund until at least January 31, 2014 in order to maintain the Total Annual Fund Operating Expenses After Fee Waiver and/or Reimbursement at or below 1.60%. As reported in the Financial Highlights section of this Report, for the fiscal year ended September 30, 2013 the ratio of expenses to average net assets excluding fee waivers and reimbursements was 1.35%.
What contributing factors were responsible for the RiverNorth Core Opportunity Fund’s relative performance during the period?
With respect to the equity portion of the portfolio, the Fund’s allocation to covered call funds detracted from the Fund’s relative performance. Covered call funds sell call options against their underlying positions, which generate income, but limit their upside in a rising market. Our largest holding as of the beginning of the reporting period (9/30/2012), the Eaton Vance Tax-Managed Global Diversified Equity Income Fund (EXG), provides good example of what we experienced over the year. EXG traded at a 13.8% discount at the beginning of the period, and narrowed to a discount of under 8% at times during the Spring and Summer. However, EXG’s NAV return over the reporting period was 13.08%, which trailed the S&P 500 by 6.26%. While we did see excess return (“alpha”) from EXG’s narrowing discount, it did not completely make up for the Fund’s lagging NAV performance relative to the S&P 500.
The Fund’s allocation to emerging markets equities also hurt performance relative to the S&P 500 as emerging markets have continued to be out of favor with investors. Over the reporting period the MSCI Emerging Markets Index underperformed the S&P 500 with a return of 0.98% versus the S&P 500’s return of 19.34%.
With respect to the fixed income portion of the portfolio, our allocation to high yield bond funds and cash contributed to our performance versus the Barclays Capital U.S. Aggregate Bond Index. While we did have a relatively low allocation to fixed income closed-end funds, discount widening due to interest rate fears detracted from performance.
| | |
| Annual Report | September 30, 2013 | | 9 |
| | |
| RiverNorth Funds | | Portfolio Update |
| | September 30, 2013 (Unaudited) |
How was the RiverNorth Core Opportunity Fund positioned at the end of September 2013?
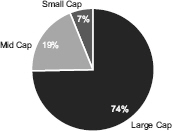
At the aggregate Fund level, we allocated 58% of the portfolio to equities, 25% to fixed income, 7% to hybrid securities (primarily preferred stocks and convertible bonds) and 19% to cash. Allocations exceed 100% due to leverage utilized by some of the underlying closed-end funds.
Our equity allocation is neutral. We are 58% invested in equities with roughly 76% domestic and 24% international exposure. The portfolio includes a 10% allocation to covered-call funds with exposure to domestic and foreign large cap stocks.
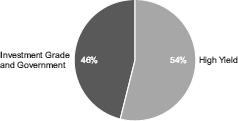
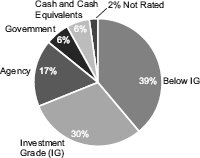
Our fixed income portfolio is quite different from the Barclays Capital U.S. Aggregate Bond Index. The Fund has minimal exposure to U.S. Treasury bonds and Agency mortgage-backed securities (MBS). Our fixed income allocation of 25% (excluding cash) contains mostly high yield bonds, foreign bonds and investment grade corporate bonds. The Fund has decreased its cash position relative to last year in order to take advantage of widening discounts among fixed income closed-end funds.
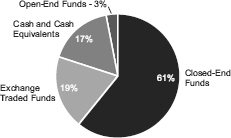
The Fund’s current allocation to closed-end funds is 61% of assets. Over the past year we have increased the Fund’s closed-end fixed income fund exposure from 8% to 19%, with much of the increase coming through multi-sector bond funds. We have been selling our covered call closed-end fund holdings as their discounts have narrowed and replacing them with general equity closed-end funds and ETFs.
Investment Vehicle Allocation(1) (percentages are based on net assets)
| | |
| 10 | | (888) 848-7569 | www.rivernorthfunds.com |
| | |
| RiverNorth Funds | | Portfolio Update |
| | September 30, 2013 (Unaudited) |
Asset Class Allocation(1) (percentages are based on net assets)
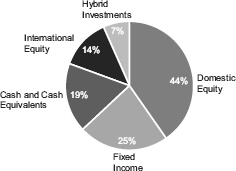
The allocation does not add up to 100% as it reflects the leverage utilized by the underlying funds.
Equity Capitalization Allocation(1) (percentages are based on net assets)
Fixed Income Allocation(1) (percentages are based on net assets)
| | |
| Annual Report | September 30, 2013 | | 11 |
| | |
| RiverNorth Funds | | Portfolio Update |
| | September 30, 2013 (Unaudited) |
| (1) | Convertible Security Risk – the market value of convertible securities adjust with interest rates and the value of the underlying stock. Exchange Traded Note Risk – exchange traded notes represent unsecured debt of the issuer and may be influenced by interest rates, credit ratings of the issuer or changes in value of the reference index. Fixed Income Risk – the market value of fixed income securities adjust with interest rates and are subject to issuer default. Foreign/Emerging Market Risk – foreign securities may be subject to inefficient or volatile markets, different regulatory regimes or different tax policies. These risks may be enhanced in emerging markets. Management Risk – there is no guarantee that the adviser’s or subadviser’s investment decisions will produce the desired results. Market Risk – economic conditions, interest rates and political events may affect the securities markets. Portfolio Turnover Risk – increased portfolio turnover results in higher brokerage expenses and may impact the tax status of distributions. REIT Risk – the value of REITs change with the value of the underlying properties and changes in interest rates and are subject to additional fees. Short Sale Risk – short positions are speculative, are subject to transaction costs and are riskier than long positions in securities. Small-Cap Risk – small-cap companies are more susceptible to failure, are often thinly traded and have more volatile stock prices. Structured Notes Risk – because of the imbedded derivative feature, structured notes are subject to more risk than investing in a simple note or bond. Swap Risk – swap agreements are subject to counterparty default risk and may not perform as intended. Underlying Fund Risk – underlying funds have additional fees, may utilize leverage, may not correlate to an intended index and may trade at a discount to their net asset values. |
Portfolio detail statistics are estimates made by the Adviser and are subject to change.
Information regarding closed-end fund premiums and discounts provided by Morningstar.
| | |
| 12 | | (888) 848-7569 | www.rivernorthfunds.com |
| | |
| RiverNorth Funds | | Portfolio Update |
| | September 30, 2013 (Unaudited) |
RiverNorth/DoubleLine Strategic Income Fund
Portfolio Management Commentary – Patrick Galley, CFA, Stephen O’Neill, CFA and Jeffrey Gundlach
What is the Fund’s investment strategy?
The RiverNorth/DoubleLine Strategic Income Fund (“RNSIX and RNDLX”; the “Fund”) invests in a broad range of fixed income securities of U.S. and foreign issuers, including closed-end funds.
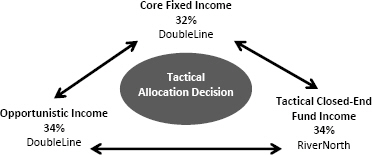
Assets of the Fund are tactically managed across three distinct fixed income strategies (sleeves). RiverNorth oversees the sleeve allocation and manages the Tactical Closed-end Fund Income Strategy. This strategy is designed to provide diversified exposure to the fixed income market through opportunistic investments in closed-end funds. Jeffrey Gundlach, Chief Executive Officer and Chief Investment Officer of DoubleLine Capital, oversees the Opportunistic Income and Core Fixed Income Strategies. The Opportunistic Income Strategy has a flexible mandate and is managed without duration constraints. The Core Fixed-Income Strategy--the most traditional of the three fixed income sleeves--incorporates an active asset allocation approach within the diverse fixed income universe in an effort to mitigate risk and achieve highest possible risk-adjusted returns.
How did the RiverNorth/DoubleLine Strategic Income Fund perform relative to its benchmark during the reporting period?
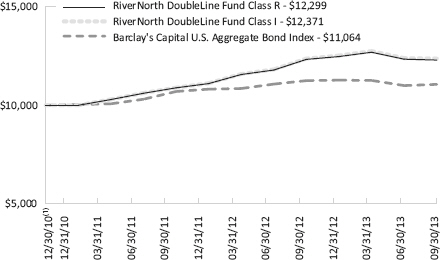
For the twelve month period ending September 30, 2013, RNSIX, the Class I share of the RiverNorth/DoubleLine Strategic Income Fund, returned -0.03%. The Fund’s Class R share, RNDLX returned -0.29% for the period. The Barclays Capital U.S. Aggregate Bond Index returned -1.68%, during the same period. As a reference point, given that the Fund invests in closed-end funds, the Morningstar All Fixed Income Unweighted Price Index, which measures the average market price return of all fixed income closed-end funds in Morningstar’s database, returned -10.68% over the reporting period.
| | |
| Annual Report | September 30, 2013 | | 13 |
| | |
| RiverNorth Funds | | Portfolio Update |
| | September 30, 2013 (Unaudited) |
Comparison of a $10,000 Investment in the RiverNorth/DoubleLine Strategic Income Fund and the Barclay’s Capital U.S. Aggregate Bond Index
Average Annual Total Returns for Periods Ending September 30, 2013
| | | | |
| | | 1-Year | | Since Inception(1) |
|
RiverNorth/DoubleLine Strategic Income Fund – Class I (RNSIX) | | -0.03% | | 8.04% |
|
RiverNorth/DoubleLine Strategic Income Fund – Class R (RNDLX) | | -0.29% | | 7.81% |
|
Barclays Capital U.S. Aggregate Bond Index(2) | | -1.68% | | 3.75% |
|
| (1) | Inception date is December 30, 2010. |
| (2) | The Barclay’s Capital U.S. Aggregate Bond Index is a benchmark index composed of U.S. securities in Treasury, Government-Related, Corporate, and Securitized sectors. It includes securities that are of investment-grade quality or better, have at least one year to maturity, and have an outstanding par value of at least $250 million. This unmanaged index does not reflect fees and expenses. The index cannot be invested in directly. |
Performance data quoted represents past performance, which is not a guarantee of future results. Current performance may be lower or higher than the performance quoted. The principal value and investment return of an investment will fluctuate so that your shares, when redeemed, may be worth more or less than their original cost. You can obtain performance data current to the most recent month end by calling (888) 848-7569 or www.rivernorthfunds.com. Total return measures net investment income and capital gain or loss from portfolio investments. All performance shown assumes reinvestment of dividends and capital gains distributions.
The RiverNorth/DoubleLine Strategic Income Fund’s Total Annual Operating Expense as disclosed in the prospectus is 1.23% for Class I Shares and 1.48% for Class R Shares. The Fund’s adviser has contractually agreed to waive management fees and/or reimburse expenses (excluding brokerage fees and commissions; borrowing costs such as (a) interest and (b) dividends on
| | |
| 14 | | (888) 848-7569 | www.rivernorthfunds.com |
| | |
| RiverNorth Funds | | Portfolio Update |
| | September 30, 2013 (Unaudited) |
securities sold short; taxes; indirect expenses incurred by the underlying funds in (b) which the Fund invests and extraordinary expenses) of the Fund until at least January 31, 2014 in order to (c) maintain the Total Annual Fund Operating Expenses After Fee Waiver and/or Reimbursement at or below 0.95% and 1.20% for the Class I shares and Class R shares, respectively. As reported in the Financial Highlights section of this Report, for the fiscal year ended September 30, 2013 the ratio of expenses to average net assets excluding fee waivers and reimbursements for the Class I shares and Class R shares was 0.89% and 1.14%, respectively, including fee waivers and reimbursements it was 0.89% and 1.14%, respectively.
What contributing factors were responsible for the RiverNorth/DoubleLine Strategic Income Fund’s relative performance during the period?
RiverNorth Tactical Closed-End Fund Income Sleeve
The RiverNorth sleeve outperformed the benchmark index. The primary contributing factors were –1) tactical management of the closed-end fund portfolio, 2) an overweight allocation to credit risk, and 3) an overweight allocation to cash. Although closed-end bond funds tumbled in price over the past twelve months, the market price total return for the category was positive from September 30, 2012 to April 30, 2013 (pre-panic). When prices were higher and discounts were narrower, RiverNorth reduced bond fund exposure and allowed our cash balance to increase.
Although relative performance was positive, the absolute performance of the RiverNorth sleeve was negative during the period. The main contributing factors were – 1) bond funds’ discount widening, 2) duration risk and 3) foreign exchange risk.
DoubleLine Core Fixed Income Sleeve
The broader fixed income market experienced heightened volatility over the fiscal year, particularly over the latter half. Some pockets of the structured products market performed well, with Commercial MBS (“CMBS”) gaining the most. Collateralized Loan Obligations (“CLOs”) and Non-Agency Residential MBS (“RMBS”) also helped to boost returns. CLOs remained sheltered from most of the volatility over the period while Non-Agency RMBS benefited from the improving U.S. Housing market. Not surprisingly, the government bond allocation put a drag on performance along with investment grade corporate bonds, as interest rates rose for most of the period. Heightened tension overseas, particularly in Syria, led to some weakening in the emerging market allocation of the portfolio.
DoubleLine Opportunistic Income Sleeve
With U.S. Treasury interest rates rising throughout the fiscal year, combined with a steepening of the yield curve, it is not a surprise that the Agency mortgage portion of the portfolio experienced negative price returns over the twelve-month period. However, much of this sector, such as inverse floating-rate securities and inverse interest-only bonds, continues to benefit from low LIBOR rates and contributes high interest income. Non-Agency mortgages performed well over the period as the U.S. Housing market has steadily rebounded. Non-Agency collateral performance across the entire credit spectrum benefited from strong price appreciation and high interest income, with Alt-A bonds gaining the most.
| | |
| Annual Report | September 30, 2013 | | 15 |
| | |
| RiverNorth Funds | | Portfolio Update |
| | September 30, 2013 (Unaudited) |
How was the RiverNorth/DoubleLine Strategic Income Fund positioned at the end of September 2013?
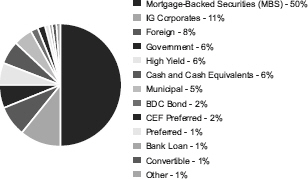
The Fund allocation was 34% RiverNorth Tactical Closed-End Fund Sleeve, 34% DoubleLine Opportunistic Income Sleeve and 32% DoubleLine Core Fixed Income Sleeve. The most significant change to the portfolio has been the higher allocation to closed-end funds. As of September 30, 2013, the Fund’s exposure to closed-end bond funds was 27% compared to 15% at the beginning of the reporting period (9/30/2013). The closed-end bond fund portfolio is diversified across investment strategies, with a focus on multi-sector credit, global and municipal bond funds.
Strategy (“Sleeve”) Allocation
Credit Quality Distribution(1) (percentages are based on net assets)
| (1) | Holdings subject to change. |
| | |
| 16 | | (888) 848-7569 | www.rivernorthfunds.com |
| | |
| RiverNorth Funds | | Portfolio Update |
| | September 30, 2013 (Unaudited) |
Sector Breakdown(1) (percentages are based on net assets)
| (1) | Asset-Backed Security Risk – the risk that the value of the underlying assets will impair the value of the security. Borrowing Risk – borrowings increase fund expenses and are subject to repayment, possibly at inopportune times. Convertible Security Risk – the market value of convertible securities adjust with interest rates and the value of the underlying stock. Defaulted Securities Risk – defaulted securities carry the risk of uncertainty of repayment. Derivatives Risk – derivatives are subject to counterparty risk. Exchange Traded Note Risk – exchange traded notes represent unsecured debt of the issuer and may be influenced by interest rates, credit ratings of the issuer or changes in value of the reference index. Fixed Income Risk – the market value of fixed income securities adjust with interest rates and are subject to issuer default. Foreign/Emerging Market Risk – foreign securities may be subject to inefficient or volatile markets, different regulatory regimes or different tax policies. These risks may be enhanced in emerging markets. Liquidity Risk – illiquid investments may be difficult or impossible to sell. Management Risk – there is no guarantee that the adviser’s subadviser’s investment decisions will produce the desired results. Market Risk – economic conditions, interest rates and political events may affect the securities markets. Mortgage-Backed Security Risk – mortgage backed securities are subject to credit risk, pre-payment risk and devaluation of the underlying collateral. Portfolio Turnover Risk – increased portfolio turnover results in higher brokerage expenses and may impact the tax status of distributions. Rating Agency Risk – rating agencies may change their ratings or ratings may not accurately reflect a debt issuer’s creditworthiness. REIT Risk – the value of REITs change with the value of the underlying properties and changes in interest rates and are subject to additional fees. Structured Notes Risk – because of the imbedded derivative feature, structured notes are subject to more risk than investing in a simple note or bond. Swap Risk – swap agreements are subject to counterparty default risk and may not perform as intended. Underlying Fund Risk – underlying funds have additional fees, may utilize leverage, may not correlate to an intended index and may trade at a discount to their net asset values. |
Portfolio detail statistics are estimates made by the Adviser and are subject to change.
Information regarding closed-end fund premiums and discounts provided by Morningstar.
| | |
| Annual Report | September 30, 2013 | | 17 |
| | |
| RiverNorth Funds | | Portfolio Update |
| | September 30, 2013 (Unaudited) |
RiverNorth/Manning & Napier Dividend Income Fund
Portfolio Manager Commentary – Patrick Galley, CFA, Stephen O’Neill, CFA and Manning & Napier (team-based)
What is the Fund’s investment strategy?
The RiverNorth/Manning & Napier Dividend Income Fund (“RNDIX and RNDLX”; “the Fund”) invests in a broad range of dividend paying equity securities including equity focused closed-end funds. The Fund has two strategies, a closed-end fund strategy managed by RiverNorth and a dividend income strategy managed by Manning & Napier.
RiverNorth determines the Fund’s allocation to each strategy based on market conditions, although there is no set minimum for either strategy. Therefore, the amount allocated to any individual strategy may vary between 0% and 100%. However, RiverNorth anticipates it will, under normal circumstances, allocate some portion of the Fund’s assets to each of the two strategies at any given time.
How did the RiverNorth/Manning & Napier Dividend Income Fund perform relative to its benchmark during the reporting period?
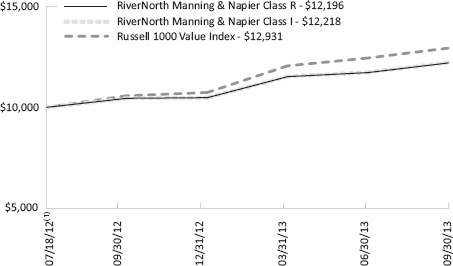
For the twelve month period ending September 30, 2013, RNDIX, the Class I share of the RiverNorth/Manning & Napier Dividend Income Fund returned 16.99%. The Fund’s Class R share, RNMNX, returned 16.75%. The Russell 1000 Value Index returned 22.30% during the same period.
Comparison of a $10,000 Investment in the RiverNorth/Manning & Napier Dividend Income Fund and the Russell 1000 Value Index
| | |
| 18 | | (888) 848-7569 | www.rivernorthfunds.com |
| | |
| RiverNorth Funds | | Portfolio Update |
| | September 30, 2013 (Unaudited) |
Average Annual Total Returns for Periods Ending September 30, 2013
| | | | | | |
| | | 1-Year | | Since
Inception(1) | | |
RiverNorth/Manning & Napier Dividend Income Fund – Class I (RNDIX) | | 16.99% | | 18.12% | | |
RiverNorth/Manning & Napier Dividend Income Fund – Class R (RNMNX) | | 16.75% | | 17.94% | | |
Russell 1000 Value Index(2) | | 22.30% | | 23.82% | | |
| (1) | Inception date is July 18, 2012. |
| (2) | The Russell 1000 Value Index measures the performance of the large-cap value segment of the U.S. equity universe. It includes those Russell 1000 Index companies with lower price-to-book ratios and lower expected growth values. The index cannot be invested in directly and does not reflect fees and expenses. |
Performance data quoted represents past performance, which is not a guarantee of future results. Current performance may be lower or higher than the performance quoted. The principal value and investment return of an investment will fluctuate so that your shares, when redeemed, may be worth more or less than their original cost. You can obtain performance data current to the most recent month end by calling (888) 848-7569 or www.rivernorthfunds.com. Total return measures net investment income and capital gain or loss from portfolio investments. All performance shown assumes reinvestment of dividends and capital gains distributions.
The RiverNorth/Manning & Napier Dividend Income Fund’s Total Annual Operating Expense as disclosed in the prospectus is 1.66% for Class I Shares and 1.91% for Class R Shares. The Fund’s adviser has contractually agreed to waive management fees and/or reimburse expenses (excluding brokerage fees and commissions; borrowing costs such as (a) interest and (b) dividends on securities sold short; taxes; indirect expenses incurred by the underlying funds in which the Fund invests and extraordinary expenses) of the Fund until at least January 31, 2014 in order to maintain the Total Annual Fund Operating Expenses After Fee Waiver and/or Reimbursement at or below 1.35% and 1.60% for the Class I shares and Class R shares, respectively. As reported in the Financial Highlights section of this Report, for the fiscal year ended September 30, 2013 the ratio of expenses to average net assets excluding fee waivers and reimbursements for the Class I shares and Class R shares was 1.98% and 2.21%, respectively, including fee waivers and reimbursements it was 1.35% and 1.60%, respectively.
What contributing factors were responsible for the RiverNorth/Manning & Napier Dividend Income Fund’s relative performance during the period?
RiverNorth Tactical Closed-end Fund Sleeve
The NAV returns of many of the closed-end funds held in the portfolio underperformed the Russell 1000 Value Index over the reporting period, which detracted from the Fund’s relative performance. Most equity closed-end funds tend to have betas less than 1 relative to the S&P 500 Index, which means their NAV movements up or down will tend to be less than the market index. Because of this, the NAV returns of closed-end equity funds will have difficulty keeping up with the index during strong rising markets, as we experienced over the reporting period. An example of this from the Fund’s portfolio was our allocation to covered call closed-end funds. We were attracted to covered call funds a year ago because of their wide discounts, which we believed had the potential to narrow. We were correct about this and many of the funds saw their discounts narrow by several percent. However, the NAV performance of these closed-end funds was unable to keep up with the index over the reporting period and they were a net detractor from relative performance.
| | |
| Annual Report | September 30, 2013 | | 19 |
| | |
| RiverNorth Funds | | Portfolio Update |
| | September 30, 2013 (Unaudited) |
Manning & Napier Dividend Focus Sleeve
The Manning & Napier stock selection process attempts to identify stocks meeting each of the following criteria: (1) an above-average dividend, (2) attractive free cash flow yield (cash generated that is available to equity holders), (3) conservative dividend payout relative to free cash flow, and (4) low estimated risk of financial distress. This process results in a portfolio of generally high quality, financially sound companies that can perform well on a long-term basis. This focus on high quality, however, lagged the broad equity markets during the above average returns produced over the last twelve months. Other detractors to the Strategy’s relative performance included an underweight to the Financials sector and an overweight to the Consumer Staples Sector. The Strategy allocates more than 20% of its portfolio to non-U.S. stocks, which also likely detracted from returns as non-U.S. stocks generally underperformed domestic stocks.
How was the RiverNorth/Manning & Napier Dividend Income Fund positioned at the end of September 2013?
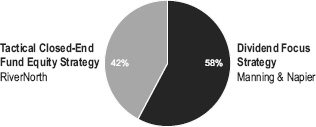
The current allocation between strategies is 42% Tactical Closed-End Fund Equity Sleeve and 58% Dividend Focus Sleeve.
As discounts on covered call closed-end funds narrowed, we have been decreasing our exposure to this area. The Fund has approximately 5% invested in covered call closed-end funds, down from 23% at the beginning of the reporting period. We have redeployed the cash into traditional equity closed-end funds trading at wide discounts. We believe these funds offer the opportunity for discount narrowing while providing equity exposure for the portfolio.
Manning & Napier Dividend Focus Sleeve
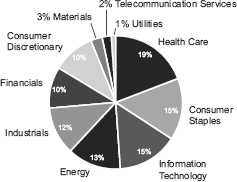
We believe the Strategy remains attractively positioned to meet its objective going forward. Our view is that equity income investors need be discerning in today’s environment. Some high dividend paying companies, including those found in the utilities and telecom sectors, remain overvalued by our metrics - or they may simply not provide the kind of dividend growth and sustainability that is crucial in today’s low growth environment. As a result, the Strategy’s largest sector weightings are in Healthcare and Consumer Staples - areas where our process has identified value.
| | |
| 20 | | (888) 848-7569 | www.rivernorthfunds.com |
| | |
| RiverNorth Funds | | Portfolio Update |
| | September 30, 2013 (Unaudited) |
Sector Breakdown(1) (percentages are based on net assets)
Sleeve Weights(1) (percentages are based on net assets)
| (1) | Convertible Security Risk – the market value of convertible securities adjust with interest rates and the value of the underlying stock. Currency Risk – foreign currencies will rise or decline relative to the U.S. dollar. Equity Risk – the value of equity securities change frequently. Fixed Income Risk – the market value of fixed income securities adjust with interest rates and are subject to issuer default. Foreign/Emerging Market Risk – foreign securities may be subject to inefficient or volatile markets, different regulatory regimes or different tax policies. These risks may be enhanced in emerging markets. Investment Style Risk – investment strategies may come in and out of favor with investors and may underperform or outperform at times. Mid-Cap Risk – mid-cap companies may be more susceptible to adverse business or economic events than large-cap companies. Management Risk – there is no guarantee that the adviser’s subadviser’s investment decisions will produce the desired results. Market Risk – economic conditions, interest rates and political events may affect the securities markets. Portfolio Turnover Risk – increased portfolio turnover results in higher brokerage expenses and may impact the tax status of distributions. Preferred Stock Risk – preferred stocks generally pay dividends, but may be less liquid than common stocks, have less priority than debt instruments and may be subject to redemption by the issuer. Small-Cap Risk – small-cap companies are more susceptible to failure, are often thinly traded and have more volatile stock prices. Swap Risk – swap agreements are subject to counterparty default risk and may not perform as intended. Underlying Fund Risk – underlying funds have additional fees, may utilize leverage, may not correlate to an intended index and may trade at a discount to their net asset values. |
Portfolio detail statistics are estimates made by the Adviser and are subject to change.
| | |
| Annual Report | September 30, 2013 | | 21 |
| | |
| RiverNorth Funds | | Portfolio Update |
| | September 30, 2013 (Unaudited) |
RiverNorth/Oaktree High Income Fund
Portfolio Manager Commentary – Patrick Galley, CFA, Stephen O’Neill, CFA, Sheldon Stone, Desmund Shirazi and Shannon Ward
What is the Fund’s investment strategy?
The RiverNorth/Oaktree High Income Fund (“RNHIX and RNOTX”; “the Fund”) invests in a broad range of income producing securities including both fixed income and equity securities.
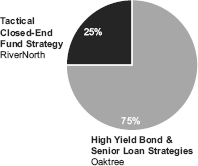
Assets of the Fund are tactically managed across three distinct income strategies (or sleeves). RiverNorth Capital Management, LLC (“RiverNorth”) manages the Tactical Closed-End Fund Strategy. This strategy is designed to provide diversified fixed income and equity income exposure through opportunistic investments in closed-end funds. Oaktree Capital Management, L.P. (“Oaktree”) manages the High Yield Bond and Senior Loan Strategies on a global basis. Oaktree will tactically manage the allocation between the High Yield Bond and Senior Loan Strategies based both on market opportunities and the risk and reward trade-offs between the two asset classes.
How did the RiverNorth/Oaktree High Income Fund perform relative to its benchmark during the reporting period?
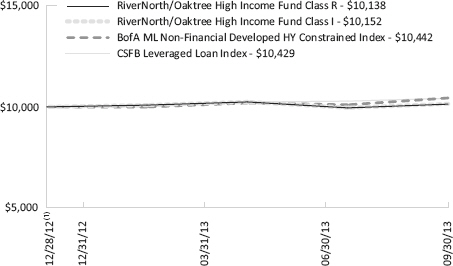
Since inception (December 28, 2012) through September 30, 2013, the Class I shares of the RiverNorth/Oaktree High Income Fund returned 1.52%. The Fund’s Class R shares returned 1.38% for the period. The BofA ML Non-Financial Developed HY Constrained Index and CSFB Leveraged Loan Index returned 4.42% and 4.29% respectively, during the same period.
Comparison of a $10,000 Investment in the RiverNorth/Oaktree High Income Fund, BofA ML Non-Financial Developed HY Constrained Index, and the CSFB Leveraged Loan Index
| | |
| 22 | | (888) 848-7569 | www.rivernorthfunds.com |
| | |
| RiverNorth Funds | | Portfolio Update |
| | September 30, 2013 (Unaudited) |
Cumulative Total Returns for the Period Ending September 30, 2013
| | | | |
| | | Since Inception(1) | | |
RiverNorth/Oaktree High Income Fund – Class I (RNHIX) | | 1.52% | | |
RiverNorth/Oaktree High Income Fund – Class R (RNOTX) | | 1.38% | | |
BofA ML Non-Financial Developed HY Constrained Index(2) | | 4.42% | | |
CSFB Leveraged Loan Index(2) | | 4.29% | | |
| (1) | Inception date is December 28, 2012. Since Inception return is cumulative, not annualized. |
| (2) | The BofA Merrill Lynch Developed Markets High Yield Constrained Index contains all securities in the BofA Merrill Lynch Global High Yield index from developed markets countries but cap issuer exposure at 2%. Developed markets is defined as an FX-G10 member, a Western European nation, or a territory of the U.S. or a Western European nation. The index tracks the performance of USD, CAD, GBP and EUR denominated below investment grade corporate debt publicly issued in the major domestic or Eurobond markets. Qualifying securities must have a below investment grade rating (based on an average of Moody’s, S&P and Fitch). CSFB Leveraged Loan Index tracks the investable market of the U.S. dollar denominated leveraged loan market. It consists of issues rated “5B” or lower, meaning that the highest rated issues included in this index are Moody’s/S&P ratings of Baa1/BB+ or Ba1/BBB+. All loans are funded term loans with a tenure of at least one year and are made by issuers domiciled in developed countries. The Bofa Merrill Lynch Developed Markets High Yield Constrained and the CSFB Leveraged Loan Indices are indices only and cannot be invested in directly. |
Performance data quoted represents past performance, which is not a guarantee of future results. Current performance may be lower or higher than the performance quoted. The principal value and investment return of an investment will fluctuate so that your shares, when redeemed, may be worth more or less than their original cost. You can obtain performance data current to the most recent month end by calling (888) 848-7569 or www.rivernorthfunds.com. Total return measures net investment income and capital gain or loss from portfolio investments. All performance shown assumes reinvestment of dividends and capital gains distributions.
The RiverNorth/Oaktree High Income Fund Total Annual Fund Operating Expenses as disclosed in the prospectus is 1.52% for Class I Shares and 1.77% for Class R Shares. The Fund’s adviser has contractually agreed to waive management fees and/or reimburse expenses (excluding brokerage fees and commissions; borrowing costs such as (a) interest and (b) dividends on securities sold short; taxes; indirect expenses incurred by the underlying funds in which the Fund invests and extraordinary expenses) of the Fund until at least January 31, 2014 in order to maintain the Total Annual Fund Operating Expenses After Fee Waiver and/or Reimbursement at or below 1.35% and 1.60% for the Class I shares and Class R shares, respectively. As reported in the Financial Highlights section of this Report, for the period December 28, 2012 (inception) to September 30, 2013 the ratio of expenses to average net assets excluding fee waivers and reimbursements for Class I shares and Class R shares was 1.58% and 1.80%, respectively, including fee waivers and reimbursements it was 1.35% and 1.60%, respectively.
What contributing factors were responsible for the RiverNorth/Oaktree High Income Fund’s relative performance since inception?
During the ramp up period the Fund held a higher percentage of assets in cash than it would have under normal conditions, which detracted from performance. During the second quarter of 2013, the Fund became optimally invested with regard to the cash position and allocation among the Fund’s sleeves, and we believe that relative performance going forward will be more reflective of the Fund’s investment strategy.
| | |
| Annual Report | September 30, 2013 | | 23 |
| | |
| RiverNorth Funds | | Portfolio Update |
| | September 30, 2013 (Unaudited) |
Oaktree High Yield Bond and Senior Loan Sleeve
Global high yield bonds were quite volatile during the reporting period and, as such, were a slight detractor from performance. In June, concern over the Federal Reserve’s intention to reduce, or taper, its quantitative easing program caused a rout across all fixed income markets. While high yield bonds weren’t singled out, prices declined sharply during the month. Following a treacherous June, high yield bonds rebounded in the period July through September.
How was the RiverNorth/Oaktree High Income Fund positioned at the end of September 2013?
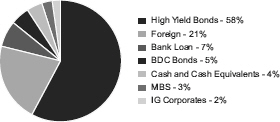
The current Fund allocation among strategies is 25% Tactical Closed-End Fund and 75% High Yield Bond.
The closed-end portion is diversified across closed-end fund common shares, closed-end fund preferred shares and business development company baby bonds. Over the past several months we have shifted the allocation of the Tactical Closed-end Fund Strategy towards more common shares of fixed income closed-end funds. As closed-end fund discounts have widened out, we believe they offer the most attractive risk-return tradeoff since the Fund’s inception.
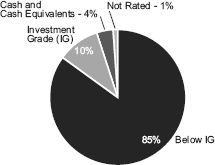
The global high yield bond portfolio is defensively positioned and constructed to preserve capital in the event of a market downturn. Over the years, it has been demonstrated that the key to long-term success is managing credit risk, avoiding dangerous concentrations and minimizing defaults in the portfolio.
Strategy Allocation
| | |
| 24 | | (888) 848-7569 | www.rivernorthfunds.com |
| | |
| RiverNorth Funds | | Portfolio Update |
| | September 30, 2013 (Unaudited) |
Credit Quality Distribution(1) (percentages are based on net assets)
| (1) | Holdings subject to change. |
Sector Breakdown(1) (percentages are based on net assets)
| (1) | Borrowing Risk – borrowings increase fund expenses and are subject to repayment, possibly at inopportune times. Closed-End Fund Risk – closed-end funds are exchange traded, may trade at a discount to their net asset values and may deploy leverage. Convertible Security Risk – the market value of convertible securities adjusts with interest rates and the value of the underlying stock. Credit Derivatives Risk – the use of credit derivatives is high specialized, involves default, counterparty and liquidity risks and may not perfectly correlate to the underlying asset or liability being hedged. Currency Risk – foreign currencies will rise or decline relative to the U.S. dollar. Distressed and Defaulted Securities Risk – defaulted securities carry the risk of uncertainty of repayment. Equity Risk – equity securities may experience volatility and the value of equity securities may move in opposite directions from each other and from other equity markets generally. Fixed Income Risk – the market value of fixed income securities adjusts with interest rates and the securities are subject to issuer default. Foreign/Emerging Market Risk – foreign securities may be subject to inefficient or volatile markets, different regulatory regimes or different tax policies. These risks may be enhanced in emerging markets. Floating Interest Rate Risk – loans pay interest based on the London Interbank Offered Rate (LIBOR) and a decline in LIBOR could negatively impact the Fund’s return. Investment Style Risk – investment strategies may come in and out of favor with investors and may underperform or outperform at times. Loans Risk – loans may be unrated or rated below investment grade and the pledged collateral may lose value. Secondary trading in loans is not fully-developed and may result in illiquidity. Management Risk – there is no guarantee that the adviser’s or sub-adviser’s investment decisions will produce the desired results. Market Risk – economic conditions, interest rates and political events may affect the securities markets. New Fund Risk – the Fund is a new mutual fund with limited operating |
| | |
| Annual Report | September 30, 2013 | | 25 |
| | |
| RiverNorth Funds | | Portfolio Update |
| | September 30, 2013 (Unaudited) |
| | history. Portfolio Turnover Risk – increased portfolio turnover results in higher brokerage expenses and may impact the tax status of distributions. Preferred Stock Risk – preferred stocks generally pay dividends, but may be less liquid than common stocks, have less priority than debt instruments and may be subject to redemption by the issuer. Security Risk – the value of the Fund may increase or decrease in response to the prospects of the issuers of securities and loans held in the Fund. Swap Risk – swap agreements are subject to counterparty default risk and may not perform as intended. Underlying Fund Risk – underlying funds have additional fees, may utilize leverage, may not correlate to an intended index and may trade at a discount to their net asset values. Valuation Risk – Loans and fixed-income securities are traded “over the counter” and because there is no centralized information regarding trading, the valuation of loans and fixed-income securities may vary. |
Portfolio detail statistics are estimates made by the Adviser and are subject to change.
Information regarding closed-end fund premiums and discounts provided by Morningstar.
| | |
| 26 | | (888) 848-7569 | www.rivernorthfunds.com |

| | |
| RiverNorth Funds | | Portfolio Update |
| | September 30, 2013 (Unaudited) |
Equity and Volatility Markets Overview and Outlook
The previous fiscal year bore witness to a number of unusual, simultaneous events: a very strong domestic equity rally, equity volatility levels at five-year lows, and diminished sector and security correlations. All of this occurred within the backdrop of significant gold and treasury market declines. In addition, Apple Inc. (AAPL), which is the S&P 500 Index’s largest company by market capitalization, was down almost 30% at one point during the year.
Looking forward, the macro climate continues to be driven by global quantitative easing while the risks today are mostly the same as they have been for the last two years – potential P/E multiple contraction, potential for a Chinese slowdown, global austerity measures and disruptive U.S. politics. Despite these risks, equity markets continue to make new price highs, while volatility levels continue to contract across most asset classes, sectors and individual securities. This environment requires the Fund to be quite defensive, causing returns to potentially lag in bull markets. Given the long-term asymmetry of large market movements, (markets tend to fall faster than they rise), however, the Fund should help dampen the blow to any adverse market movements that arise.
Looking at equity volatility, specifically the VIX Index (the broadest and most common measure of equity volatility), traded in a range of 22.7 to 11.3 during the fiscal year. Closing at about 16.5 on September 30, 2013, the VIX is still below its long run average of 20. Going forward, absent an unforeseen macro shock, volatility levels for the coming months will likely be driven by quality of earnings and subsequent guidance contained in fourth quarter earnings reports. Volatility sentiment can always change faster than any portfolio manager or computer can react, however, so we remain ready for any unforeseen increases in volatility levels.
RiverNorth Dynamic Buy-Write Fund
Portfolio Manager Commentary – Eric Metz, CFA
What is the Fund’s investment strategy?
The RiverNorth Dynamic Buy-Write Fund (“RNBWX”; “the Fund”) seeks to achieve greater risk-adjusted returns than The CBOE Buy-Write Index (“BXM”). In addition, the Fund seeks to provide investors with total return and lower volatility than the S&P 500 Index by constructing a portfolio of single security, ETF and index buy-writes with the greatest potential alpha coming from volatility, as opposed to stock selection. The volatility management aspect of the Fund is typically only available in a hedge fund structure. The portfolio is typically comprised of 100-150 securities which are chosen based upon the opportunity in the security’s options and then expressed as a buy-write, or equivalently, as a cash secured put option. The Fund’s strategy can be viewed as alternative in nature in that it seeks to provide low beta exposure to the broad equity markets with a standard deviation (measure of the volatility of a fund’s return) similar to traditional fixed income investments.
| | |
| 28 | | (888) 848-7569 | www.rivernorthfunds.com |
| | |
| RiverNorth Funds | | Portfolio Update |
| | September 30, 2013 (Unaudited) |
How did the RiverNorth Dynamic Buy-Write Fund perform relative to its benchmark during the reporting period?
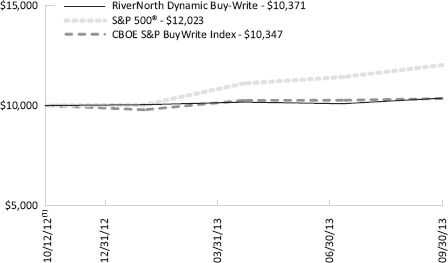
For the period from Fund inception (October 12, 2012) through September 30, 2013, the RiverNorth Dynamic Buy-Write Fund returned 3.71%. The CBOE Buy-Write Index returned 3.47%, during the same period.
In addition, the Fund’s standard deviation (daily annualized) was 4.15% for the period, while the standard deviation (daily annualized) of the CBOE Buy-Write Index was 5.62% during the same period.
Comparison of a $10,000 Investment in the RiverNorth Dynamic Buy-Write Fund, the S&P 500 Index, and the CBOE S&P Buy-Write Index
Cumulative Total Returns for the Period Ending September 30, 2013
| | | | | | | | |
| | | Since
Inception(1) | | Standard
Deviation | | Sharpe | | Beta |
|
RiverNorth Dynamic Buy-Write (RNBWX) | | 3.71% | | 4.15% | | 0.88 | | 0.34 |
|
CBOE S&P 500® BuyWrite Index (BXM)(2) | | 3.47% | | 5.62% | | 0.61 | | 0.53 |
|
S&P 500® Index(2) | | 20.23% | | 8.82% | | 2.29 | | 1.00 |
|
| (1) | Inception date is October 12, 2012. Since Inception return is cumulative, not annualized. |
| (2) | The CBOE S&P 500 BuyWrite Index (BXM) is a benchmark index designed to track the performance of a hypothetical buy-write strategy on the S&P 500 Index. Standard and Poor’s 500 Index is a capitalization-weighted index of 500 stocks. The index is designed to measure performance of the broad domestic economy through changes in the aggregate market value of 500 stocks representing all major industries. The S&P 500 and CBOE S&P 500 BuyWrite Indices are indices only and cannot be invested in directly. |
| | |
| Annual Report | September 30, 2013 | | 29 |
| | |
| RiverNorth Funds | | Portfolio Update |
| | September 30, 2013 (Unaudited) |
Performance data quoted represents past performance, which is not a guarantee of future results. Current performance may be lower or higher than the performance quoted. The principal value and investment return of an investment will fluctuate so that your shares, when redeemed, may be worth more or less than their original cost. You can obtain performance data current to the most recent month end by calling (888) 848-7569 or www.rivernorthfunds.com. Total return measures net investment income and capital gain or loss from portfolio investments. All performance shown assumes reinvestment of dividends and capital gains distributions.
The RiverNorth Dynamic Buy-Write Fund Total Annual Fund Operating Expenses as disclosed in the prospectus is 2.02%. The Fund’s adviser has contractually agreed to waive management fees and/or reimburse expenses (excluding brokerage fees and commissions; borrowing costs such as (a) interest and (b) dividends on securities sold short; taxes; indirect expenses incurred by the underlying funds in which the Fund invests and extraordinary expenses) of the Fund until at least January 31, 2014 in order to maintain the Total Annual Fund Operating Expenses After Fee Waiver and/or Reimbursement at or below 1.80%. As reported in the Financial Highlights section of this Report, for the period October 12, 2012 (inception) to September 30, 2013 the ratio of expenses to average net assets excluding fee waivers and reimbursements was 2.19%, including fee waivers and reimbursements it was 1.80%.
What contributing factors were responsible for the RiverNorth Dynamic Buy-Write Fund’s relative performance during the period?
Detracting from relative performance was the Fund’s beta, or market risk, positioning. While the Fund actively manages its beta, the BXM Index does not. Due to the mechanical nature of the BXM Index strategy, the market beta fluctuates between 0 and 1 as the S&P 500 Index ebbs and flows. This passive beta strategy worked well over the last fiscal year as the BXM Index found itself with an elevated beta just before market rallies on more than one occasion. Over the course of market cycles, we think it is more prudent to actively manage beta risk with respect to volatility exposure with the goal of having minimal market exposure as markets fall and more meaningful exposure as markets seem poised to rise.
Also detracting from relative performance was security selection, as some individual companies exhibited far more volatility than expected at the time the buy-write position was introduced to the portfolio. As part of this, the Fund was not particularly aggressive in taking short option positions over the balance of the period, as overall equity market volatility has been subdued for quite some time. We believe it to be a far more prudent strategy to save some dry powder for better opportunities in the future.
Contributing to Fund relative performance was sector selection as overweighting the Materials, Information Technology and Telecommunications sectors proved to be successful.
How was the RiverNorth Dynamic Buy-Write Fund positioned at the end of September 2013?
Given the current levels of volatility for both the broad equity market and for individual stocks, we remain cautious with the Fund’s short volatility positioning. Regardless, the Fund’s beta is near the long-run target of 0.3 simply because there have not been enough attractive opportunities in the short volatility arena. If opportunities arise, the Fund has ample cash to attempt to capitalize and position accordingly.
From a sector perspective, the Fund looked quite similar to the index as of September 30, 2013. Sector ETFs are being used as placeholders until more attractive opportunities present themselves. The Fund’s largest relative sector exposures are Information Technology, Materials
| | |
| 30 | | (888) 848-7569 | www.rivernorthfunds.com |
| | |
| RiverNorth Funds | | Portfolio Update |
| | September 30, 2013 (Unaudited) |
(specifically individual Gold Miners) and Consumer Staples. The largest sector underweight is Consumer Discretionary.
The largest single security positions in the Fund are Apple, Goodyear Tire Preferred shares, Newmont Mining, Hewlett Packard, Wal-Mart and Intel. Like the sector overweights, these are all positions where we believe that implied volatility was too high at the time of the option writing and that implied volatility will compress or realize a volatility less than its implied over the life of that option, ideally creating excess return for the Fund.
| | |
| Annual Report | September 30, 2013 | | 31 |

| | |
| RiverNorth Funds | | Disclosure of Fund Expenses |
| | September 30, 2013 (Unaudited) |
Expense Example
As a shareholder of the RiverNorth Funds, you incur two types of costs: (1) transaction costs (such as the 2% fee on redemption of Fund shares made within 90 days of purchase); and (2) ongoing costs, including management fees, distribution and service (12b-1) fees and other Fund expenses. This example is intended to help you understand your ongoing costs (in dollars) of investing in the Funds and to compare these costs with the ongoing costs of investing in other mutual funds. The Example is based on an investment of $1,000 invested at the beginning of the period, April 1, 2013 and held for the six months ended September 30, 2013.
Actual Expenses
The first line of the table below provides information about actual account values and actual expenses. You may use the information in this line, together with the amount you invested, to estimate the expenses that you paid over the period. Simply divide your account value by $1,000 (for example, an $8,600 account value divided by $1,000 = 8.6), then multiply the result by the number in the first line under the heading entitled “Expenses Paid During Period” to estimate the expenses you paid on your account during this period.
Hypothetical Example for Comparison Purposes
The second line of the table below provides information about hypothetical account values and hypothetical expenses based on each Fund’s actual expense ratio and an assumed rate of return of 5% per year before expenses, which is not each Fund’s actual return. The hypothetical account values and expenses may not be used to estimate the actual ending account balance or expenses you paid for the period. You may use this information to compare the ongoing costs of investing in each Fund and other funds. To do so, compare these 5% hypothetical examples with the 5% hypothetical examples that appear in the shareholder reports of other funds.
Please note that the expenses shown in the table below are meant to highlight your ongoing costs only and do not reflect any transactional costs, such as redemption fees. Therefore, the second line for each share class of each Fund within the table is useful in comparing ongoing costs only, and will not help you determine the relative total costs of owning different funds. If these transactional costs were included, your costs would have been higher.
| | |
| Annual Report | September 30, 2013 | | 33 |
| | |
| RiverNorth Funds | | Disclosure of Fund Expenses |
| | September 30, 2013 (Unaudited) |
| | | | | | | | |
| | | Beginning
Account Value
04/01/2013 | | Ending
Account Value
09/30/2013 | | Expense
Ratio(a) | | Expenses
Paid During
Period(b) |
RiverNorth Core Opportunity Fund | | | | | | | | |
Actual | | $1,000.00 | | $1,023.50 | | 1.33% | | $6.75 |
Hypothetical (5% return before expenses) | | $1,000.00 | | $1,018.40 | | 1.33% | | $6.73 |
| | | | |
RiverNorth/DoubleLine Strategic Income Fund | | | | | | | | |
Class I Shares | | | | | | | | |
Actual | | $1,000.00 | | $970.00 | | 0.88% | | $4.35 |
Hypothetical (5% return before expenses) | | $1,000.00 | | $1,020.66 | | 0.88% | | $4.46 |
| | | | |
Class R Shares | | | | | | | | |
Actual | | $1,000.00 | | $968.70 | | 1.13% | | $5.58 |
Hypothetical (5% return before expenses) | | $1,000.00 | | $1,019.40 | | 1.13% | | $5.72 |
| | | | |
RiverNorth/Manning & Napier Dividend Income Fund | | | | | | | | |
Class I Shares | | | | | | | | |
Actual | | $1,000.00 | | $1,060.20 | | 1.35% | | $6.97 |
Hypothetical (5% return before expenses) | | $1,000.00 | | $1,018.30 | | 1.35% | | $6.83 |
| | | | |
Class R Shares | | | | | | | | |
Actual | | $1,000.00 | | $1,058.90 | | 1.60% | | $8.26 |
Hypothetical (5% return before expenses) | | $1,000.00 | | $1,017.05 | | 1.60% | | $8.09 |
| | | | |
RiverNorth/Oaktree High Income Fund | | | | | | | | |
Class I Shares | | | | | | | | |
Actual | | $1,000.00 | | $989.70 | | 1.35% | | $6.73 |
Hypothetical (5% return before expenses) | | $1,000.00 | | $1,018.30 | | 1.35% | | $6.83 |
| | | | |
Class R Shares | | | | | | | | |
Actual | | $1,000.00 | | $989.40 | | 1.60% | | $7.98 |
Hypothetical (5% return before expenses) | | $1,000.00 | | $1,017.05 | | 1.60% | | $8.09 |
| | | | |
RiverNorth Dynamic Buy-Write Fund | | | | | | | | |
Actual | | $1,000.00 | | $1,019.70 | | 1.80% | | $9.11 |
Hypothetical (5% return before expenses) | | $1,000.00 | | $1,016.04 | | 1.80% | | $9.10 |
| (a) | Annualized, based on the Fund’s most recent fiscal half-year expenses. |
| | |
| 34 | | (888) 848-7569 | www.rivernorthfunds.com |
| | |
| RiverNorth Funds | | Disclosure of Fund Expenses |
| | September 30, 2013 (Unaudited) |
| (b) | Expenses are equal to the Fund’s annualized ratio multiplied by the average account value over the period, multiplied by the number of days in the most recent fiscal half year (183), then divided by 365. Note this expense example is typically based on a six-month period. |
| | |
| Annual Report | September 30, 2013 | | 35 |
| | |
| RiverNorth Core Opportunity Fund | | Schedule of Investments |
| | September 30, 2013 |
| | | | | | |
Shares/Description | | | Value | |
CLOSED-END FUNDS - 61.52% | | | | |
1,097,575 | | Aberdeen Asia-Pacific Income Fund, Inc. | | $ | 6,651,304 | |
76,239 | | Aberdeen Emerging Markets Smaller Company Opportunities Fund, Inc. | | | 1,484,373 | |
43,401 | | Aberdeen Global Income Fund, Inc. | | | 470,033 | |
1,755,452 | | Adams Express Co. | | | 21,750,050 | |
716,461 | | AllianceBernstein Income Fund, Inc. | | | 5,043,885 | |
400,317 | | AllianzGI Equity & Convertible Income Fund | | | 7,433,887 | |
2,972,358 | | Alpine Total Dynamic Dividend Fund | | | 11,948,879 | |
177,868 | | Apollo Tactical Income Fund, Inc. | | | 2,970,396 | |
48,630 | | Babson Capital Global Short Duration High Yield Fund | | | 1,110,223 | |
28,650 | | BlackRock Build America Bond Trust | | | 538,906 | |
1,511,249 | | BlackRock Credit Allocation Income Trust IV, Inc. | | | 19,706,687 | |
227,427 | | BlackRock Debt Strategies Fund, Inc. | | | 914,257 | |
442,824 | | BlackRock Enhanced Equity Dividend Trust | | | 3,330,036 | |
1,076,257 | | BlackRock Global Opportunities Equity Trust | | | 15,056,835 | |
109,655 | | BlackRock High Yield Trust | | | 758,593 | |
469,405 | | BlackRock International Growth and Income Trust | | | 3,614,418 | |
223,375 | | BlackRock Multi-Sector Income Trust | | | 3,723,661 | |
653,052 | | Boulder Growth & Income Fund, Inc. | | | 4,982,787 | |
272,671 | | Boulder Total Return Fund, Inc.(a) | | | 5,944,228 | |
71,162 | | Brookfield Total Return Fund, Inc. | | | 1,632,456 | |
131,973 | | Calamos Convertible and High Income Fund | | | 1,653,622 | |
182,081 | | Calamos Global Dynamic Income Fund | | | 1,549,509 | |
171,648 | | Central Europe and Russia Fund, Inc. | | | 5,564,828 | |
571,703 | | Central Fund of Canada Ltd. - Class A | | | 8,404,034 | |
535,437 | | Clough Global Equity Fund | | | 8,044,941 | |
1,457,345 | | Clough Global Opportunities Fund | | | 18,756,030 | |
109,526 | | Cohen & Steers REIT and Preferred Income Fund, Inc. | | | 1,698,748 | |
35,528 | | DWS High Income Trust | | | 322,239 | |
645,987 | | Eaton Vance Enhanced Equity Income Fund | | | 7,790,603 | |
1,153,841 | | Eaton Vance Risk-Managed Diversified Equity Income Fund | | | 12,473,021 | |
1,566,136 | | Eaton Vance Tax-Managed Diversified Equity Income Fund | | | 15,786,651 | |
634,890 | | Eaton Vance Tax-Managed Global Buy-Write Opportunities Fund | | | 7,199,653 | |
133,509 | | First Trust High Income Long/Short Fund | | | 2,341,748 | |
49,400 | | First Trust Strategic High Income Fund II | | | 785,954 | |
130,025 | | Franklin Templeton Limited Duration Income Trust | | | 1,690,325 | |
331,670 | | Gabelli Dividend & Income Trust | | | 6,593,600 | |
325,604 | | General American Investors Co., Inc. | | | 11,116,121 | |
60,929 | | Global High Income Fund, Inc. | | | 626,959 | |
17,400 | | Invesco Municipal Trust | | | 203,580 | |
78,670 | | Ivy High Income Opportunities Fund | | | 1,400,326 | |
48,304 | | John Hancock Hedged Equity & Income Fund | | | 803,296 | |
3,653,751 | | Liberty All Star® Equity Fund | | | 19,766,793 | |
141,885 | | Macquarie Global Infrastructure Total Return Fund, Inc. | | | 3,070,391 | |
| | |
| See Notes to Financial Statements. | | |
| 36 | | (888) 848-7569 | www.rivernorthfunds.com |
| | |
| RiverNorth Core Opportunity Fund | | Schedule of Investments |
| | September 30, 2013 |
| | | | | | |
Shares/Description | | | Value | |
91,107 | | MFS Charter Income Trust | | $ | 815,408 | |
90,394 | | MFS Multimarket Income Trust | | | 597,504 | |
62,863 | | Morgan Stanley Emerging Markets Debt Fund, Inc. | | | 628,630 | |
358,491 | | Morgan Stanley Emerging Markets Domestic Debt Fund, Inc. | | | 5,054,687 | |
40,167 | | Neuberger Berman High Yield Strategies Fund, Inc. | | | 524,581 | |
382,067 | | Neuberger Berman Real Estate Securities Income Fund, Inc. | | | 1,726,943 | |
428,677 | | NexPoint Credit Strategies Fund | | | 3,279,379 | |
311,980 | | Nuveen Build American Bond Term Fund | | | 5,637,479 | |
4,800 | | Nuveen Credit Strategies Income Fund | | | 44,880 | |
42,041 | | Nuveen Dividend Advantage Municipal Fund | | | 547,794 | |
383,420 | | Nuveen Intermediate Duration Municipal Term Fund | | | 4,401,662 | |
109,815 | | Nuveen Mortgage Opportunity Term Fund | | | 2,609,204 | |
69,682 | | Nuveen Mortgage Opportunity Term Fund 2 | | | 1,673,065 | |
51,206 | | Nuveen Municipal Opportunity Fund, Inc. | | | 665,678 | |
23,520 | | Nuveen Performance Plus Municipal Fund, Inc. | | | 317,755 | |
315,992 | | Nuveen Preferred Income Opportunities Fund | | | 2,742,811 | |
117,725 | | Nuveen Premium Income Municipal Fund 2 | | | 1,536,311 | |
31,700 | | Nuveen Premium Income Municipal Fund 4, Inc. | | | 377,230 | |
100,069 | | Nuveen Quality Preferred Income Fund | | | 756,522 | |
342,585 | | Nuveen Quality Preferred Income Fund II | | | 2,795,494 | |
127,568 | | Nuveen Quality Preferred Income Fund III | | | 1,006,512 | |
41,507 | | PIMCO Corporate & Income Strategy Fund | | | 692,752 | |
439,610 | | PIMCO Dynamic Credit Income Fund | | | 9,781,323 | |
56,989 | | PIMCO Dynamic Income Fund | | | 1,635,014 | |
65,170 | | PIMCO Income Opportunity Fund | | | 1,791,523 | |
132,644 | | PIMCO Income Strategy Fund | | | 1,534,691 | |
427,532 | | PIMCO Income Strategy Fund II | | | 4,360,826 | |
42,484 | | Putnam Master Intermediate Income Trust | | | 207,322 | |
144,192 | | Putnam Premier Income Trust | | | 758,450 | |
543,419 | | Royce Focus Trust, Inc. | | | 3,925,659 | |
1,679,687 | | Royce Value Trust, Inc. | | | 27,059,758 | |
174,144 | | TCW Strategic Income Fund, Inc. | | | 938,636 | |
23,125 | | Templeton Emerging Markets Income Fund | | | 330,225 | |
228,770 | | The Thai Fund, Inc. | | | 4,545,660 | |
1,044,196 | | Tri-Continental Corp. | | | 19,129,671 | |
53,019 | | Virtus Global Multi-Sector Income Fund | | | 901,323 | |
151,053 | | Wells Fargo Advantage Multi-Sector Income Fund | | | 2,135,889 | |
83,024 | | Western Asset Emerging Markets Debt Fund, Inc. | | | 1,489,451 | |
37,553 | | Western Asset Emerging Markets Income Fund, Inc. | | | 470,915 | |
213,057 | | Western Asset Global Corporate Defined Opportunity Fund, Inc. | | | 3,790,284 | |
81,575 | | Western Asset Global High Income Fund, Inc. | | | 1,007,451 | |
187,441 | | Western Asset High Income Opportunity Fund, Inc. | | | 1,119,023 | |
102,854 | | Western Asset Managed High Income Fund, Inc. | | | 585,239 | |
47,050 | | Western Asset Mortgage Defined Opportunity Fund, Inc. | | | 1,058,625 | |
179,791 | | Western Asset Worldwide Income Fund, Inc. | | | 2,259,973 | |
| | |
| See Notes to Financial Statements. | | |
| Annual Report | September 30, 2013 | | 37 |
| | |
| RiverNorth Core Opportunity Fund | | Schedule of Investments |
| | September 30, 2013 |
| | | | | | |
Shares/Description | | | Value | |
938,241 | | Zweig Total Return Fund, Inc. | | $ | 12,290,957 | |
| | | | | | |
| |
TOTAL CLOSED-END FUNDS (Cost $345,156,745) | | | 398,249,035 | |
| | | | | | |
| |
MUTUAL FUNDS - 3.46% | | | | |
533,820 | | Calamos Convertible Fund | | | 9,998,457 | |
1,111,161 | | Eaton Vance Floating-Rate Advantaged Fund | | | 12,367,218 | |
| | | | | | |
| |
TOTAL MUTUAL FUNDS (Cost $15,452,768) | | | 22,365,675 | |
| | | | | | |
| |
EXCHANGE-TRADED FUNDS - 18.43% | | | | |
89,963 | | Guggenheim Russell Top 50® Mega Cap ETF | | | 10,542,764 | |
374,942 | | iShares® S&P 100® Index Fund | | | 28,060,659 | |
209,517 | | Market Vectors® Gold Miners ETF | | | 5,242,116 | |
247,540 | | PowerShares® FTSE RAFI Emerging Markets Portfolio | | | 5,025,062 | |
336,568 | | PowerShares® FTSE RAFI US 1000 Portfolio | | | 25,407,518 | |
111,000 | | SPDR® Barclays Capital Convertible Securities ETF | | | 5,017,200 | |
136,978 | | Vanguard® MSCI EAFE ETF | | | 5,421,589 | |
376,375 | | Vanguard® MSCI Emerging Markets ETF | | | 15,105,811 | |
252,763 | | Vanguard® S&P 500® ETF | | | 19,462,751 | |
| | | | | | |
| |
TOTAL EXCHANGE-TRADED FUNDS (Cost $102,959,334) | | | 119,285,470 | |
| | | | | | |
| |
HOLDING & INVESTMENT MANAGEMENT COMPANIES - 0.34% | | | | |
12,100 | | Affiliated Managers Group, Inc.(a) | | | 2,209,944 | |
| | | | | | |
| |
TOTAL HOLDING & INVESTMENT MANAGEMENT COMPANIES (Cost $634,253) | | | 2,209,944 | |
| | | | | | |
| |
PREFERRED STOCKS - 0.24% | | | | |
61,158 | | General American Investors Co., Inc., Series B, 5.950% | | | 1,546,074 | |
| | | | | | |
| |
TOTAL PREFERRED STOCKS (Cost $1,444,152) | | | 1,546,074 | |
| | | | | | |
| | |
| See Notes to Financial Statements. | | |
| 38 | | (888) 848-7569 | www.rivernorthfunds.com |
| | |
| RiverNorth Core Opportunity Fund | | Schedule of Investments |
| | September 30, 2013 |
| | | | | | | | | | | | | | |
| Shares/Description | | Rate | | | Maturity | | | Value | |
BUSINESS DEVELOPMENT COMPANY SENIOR NOTES - 0.01% | | | | | | | | | | | | |
3,600 | | Apollo Investment Corp. | | | 6.63 | % | | | 10/15/2042 | | | $ | 78,156 | |
| | | | | | | | | | | | | | |
| | | |
TOTAL BUSINESS DEVELOPMENT COMPANY SENIOR NOTES (Cost $84,441) | | | | | | | | | | | 78,156 | |
| | | | | | | | | | | | | | |
| | | |
| Shares/Description | | | | | | | | Value | |
SHORT-TERM INVESTMENTS - 16.53% | | | | | | | | | | | | |
107,032,737 | | Northern Institutional Government Select Portfolio, (7 Day Yield 0.01%) | | | | | | | | | | | 107,032,737 | |
| | | | | | | | | | | | | | |
| | | |
TOTAL SHORT-TERM INVESTMENTS (Cost $107,032,737) | | | | | | | | | | | 107,032,737 | |
| | | | | | | | | | | | | | |
| | | |
TOTAL INVESTMENTS - 100.53% (Cost $572,764,430) | | | | | | | | | | | 650,767,091 | |
LIABILITIES IN EXCESS OF OTHER ASSETS — 0.53% | | | | | | | | | | | (3,401,895 | ) |
| | | | | | | | | | | | | | |
NET ASSETS - 100.00% | | | | | | | | | | $ | 647,365,196 | |
| | | | | | | | | | | | | | |
| (a) | Non-income producing security. |
Common Abbreviations:
EAFE - Europe, Australia, and Far East.
FTSE - Financial Times Stock Exchange.
ETF - Exchange Traded Fund.
Ltd. - Limited.
MSCI – Morgan Stanley Capital International.
RAFI - Research Affiliates Fundamental Index.
S&P – Standard & Poor’s.
SPDR - Standard and Poor’s Depositary Receipt.
| | |
| See Notes to Financial Statements. | | |
| Annual Report | September 30, 2013 | | 39 |
| | |
| RiverNorth/DoubleLine Strategic Income Fund | | Schedule of Investments |
| | September 30, 2013 |
| | | | | | |
| Shares/Description | | Value | |
| CLOSED-END FUNDS - 26.94% | | | | |
675,628 | | Aberdeen Asia-Pacific Income Fund, Inc. | | $ | 4,094,306 | |
62,427 | | Aberdeen Global Income Fund, Inc. | | | 676,084 | |
98,882 | | Advent Claymore Convertible Securities and Income Fund | | | 1,739,334 | |
866,470 | | Advent Claymore Convertible Securities and Income Fund II | | | 6,021,966 | |
398,296 | | Advent Claymore Enhanced Growth & Income Fund | | | 3,895,335 | |
2,695,360 | | AllianceBernstein Income Fund, Inc. | | | 18,975,334 | |
63,690 | | Babson Capital Global Short Duration High Yield Fund | | | 1,454,043 | |
185,172 | | BlackRock Build America Bond Trust | | | 3,483,085 | |
1,678,446 | | BlackRock Credit Allocation Income Trust IV, Inc. | | | 21,886,936 | |
292,928 | | BlackRock Debt Strategies Fund, Inc. | | | 1,177,571 | |
135,034 | | BlackRock Income Opportunity Trust, Inc. | | | 1,336,837 | |
377,356 | | BlackRock Multi-Sector Income Trust | | | 6,290,525 | |
56,688 | | BlackRock MuniHoldings Quality Fund, Inc. | | | 702,931 | |
39,651 | | BlackRock MuniYield Quality Fund II, Inc. | | | 490,879 | |
112,520 | | BlackRock Senior High Income Fund, Inc. | | | 443,329 | |
50,380 | | Brookfield Total Return Fund, Inc. | | | 1,155,717 | |
356,079 | | Calamos Convertible and High Income Fund | | | 4,461,670 | |
205,534 | | DWS Global High Income Fund, Inc. | | | 1,646,327 | |
455,060 | | DWS High Income Opportunities Fund, Inc. | | | 6,439,099 | |
159,679 | | Eaton Vance Municipal Bond Fund | | | 1,845,889 | |
213,125 | | Federated Enhanced Treasury Income Fund | | | 2,740,788 | |
36,900 | | First Trust Strategic High Income Fund II | | | 587,079 | |
174,771 | | Helios Strategic Income Fund, Inc. | | | 1,109,796 | |
37,050 | | Invesco Advantage Municipal Income Trust II | | | 396,806 | |
24,823 | | Invesco Municipal Opportunity Trust | | | 292,415 | |
252,128 | | Invesco Municipal Trust | | | 2,949,898 | |
428,848 | | Legg Mason BW Global Income Opportunities Fund, Inc. | | | 7,174,627 | |
341,936 | | Managed High Yield Plus Fund, Inc. | | | 683,872 | |
140,439 | | MFS Charter Income Trust | | | 1,256,929 | |
94,112 | | MFS Multimarket Income Trust | | | 622,080 | |
296,684 | | Montgomery Street Income Securities, Inc. | | | 4,660,906 | |
70,496 | | Morgan Stanley Emerging Markets Debt Fund, Inc. | | | 704,960 | |
768,977 | | Morgan Stanley Emerging Markets Domestic Debt Fund, Inc. | | | 10,842,499 | |
33,713 | | Morgan Stanley Income Securities, Inc. | | | 560,647 | |
95,510 | | Neuberger Berman High Yield Strategies Fund, Inc. | | | 1,247,361 | |
1,219,241 | | NexPoint Credit Strategies Fund | | | 9,327,194 | |
212,626 | | Nuveen Build America Bond Opportunity Fund | | | 3,942,086 | |
1,366,318 | | Nuveen Diversified Currency Opportunities Fund | | | 14,319,013 | |
403,979 | | Nuveen Dividend Advantage Municipal Fund | | | 5,263,846 | |
224,288 | | Nuveen Global Income Opportunities Fund | | | 2,630,898 | |
193,878 | | Nuveen Intermediate Duration Municipal Term Fund | | | 2,225,719 | |
36,357 | | Nuveen Municipal High Income Opportunity Fund | | | 424,286 | |
93,096 | | Nuveen Municipal Opportunity Fund, Inc. | | | 1,210,248 | |
466,071 | | Nuveen Performance Plus Municipal Fund, Inc. | | | 6,296,619 | |
243,371 | | Nuveen Preferred Income Opportunities Fund | | | 2,112,460 | |
| | |
| See Notes to Financial Statements. | | |
| 40 | | (888) 848-7569 | www.rivernorthfunds.com |
| | |
| RiverNorth/DoubleLine Strategic Income Fund | | Schedule of Investments |
| | September 30, 2013 |
| | | | | | |
| Shares/Description | | Value | |
73,140 | | Nuveen Premier Municipal Income Fund, Inc. | | $ | 943,506 | |
538,376 | | Nuveen Premium Income Municipal Fund 2 | | | 7,025,807 | |
329,712 | | Nuveen Premium Income Municipal Fund, Inc. | | | 4,213,719 | |
146,500 | | Nuveen Quality Preferred Income Fund | | | 1,107,540 | |
364,267 | | Nuveen Quality Preferred Income Fund II | | | 2,972,419 | |
172,298 | | Nuveen Quality Preferred Income Fund III | | | 1,359,431 | |
296,588 | | PIMCO Corporate & Income Opportunity Fund | | | 5,353,413 | |
43,435 | | PIMCO Corporate & Income Strategy Fund | | | 724,930 | |
602,629 | | PIMCO Dynamic Credit Income Fund | | | 13,408,495 | |
825,584 | | PIMCO Dynamic Income Fund | | | 23,686,005 | |
96,394 | | PIMCO Income Opportunity Fund | | | 2,649,871 | |
307,990 | | PIMCO Income Strategy Fund | | | 3,563,444 | |
608,523 | | PIMCO Income Strategy Fund II | | | 6,206,935 | |
115,653 | | PIMCO Municipal Income Fund II | | | 1,275,653 | |
33,907 | | Prudential Global Short Duration High Yield Fund, Inc. | | | 591,338 | |
132,648 | | Putnam High Income Securities Fund | | | 1,043,940 | |
46,584 | | Putnam Managed Municipal Income Trust | | | 318,635 | |
338,325 | | Putnam Master Intermediate Income Trust | | | 1,651,026 | |
1,949,064 | | Putnam Premier Income Trust | | | 10,252,077 | |
137,633 | | Strategic Global Income Fund, Inc. | | | 1,278,611 | |
77,973 | | The GDL Fund | | | 879,535 | |
93,512 | | The New America High Income Fund, Inc. | | | 889,299 | |
201,333 | | Virtus Global Multi-Sector Income Fund | | | 3,422,661 | |
218,560 | | Wells Fargo Advantage Multi-Sector Income Fund | | | 3,090,438 | |
114,205 | | Western Asset Emerging Markets Debt Fund, Inc. | | | 2,048,838 | |
35,049 | | Western Asset Emerging Markets Income Fund, Inc. | | | 439,514 | |
126,709 | | Western Asset Global Corporate Defined Opportunity Fund, Inc. | | | 2,254,153 | |
120,077 | | Western Asset High Income Opportunity Fund, Inc. | | | 716,860 | |
155,798 | | Western Asset Inflation Management Fund, Inc. | | | 2,558,203 | |
64,000 | | Western Asset Managed High Income Fund, Inc. | | | 364,160 | |
33,722 | | Western Asset Worldwide Income Fund, Inc. | | | 423,886 | |
525,157 | | Western Asset/Claymore Inflation-Linked Opportunities & Income Fund | | | 6,091,821 | |
| | | | | | |
| |
TOTAL CLOSED-END FUNDS (Cost $295,375,308) | | | 284,606,392 | |
| | | | | | |
| |
| PREFERRED STOCKS - 2.23% | | | | |
80,225 | | Apollo Commercial Real Estate Finance, Inc., 8.625% | | | 2,013,648 | |
199,000 | | Kayne Anderson MLP Investment Co., Series F, 3.500% | | | 4,706,350 | |
383,767 | | Kayne Anderson MLP Investment Co., Series E, 4.250% | | | 9,598,013 | |
76,371 | | The GDL Fund, Series B, 7.000%(a) | | | 3,839,170 | |
| | |
| See Notes to Financial Statements. | | |
| Annual Report | September 30, 2013 | | 41 |
| | |
| RiverNorth/DoubleLine Strategic Income Fund | | Schedule of Investments |
| | September 30, 2013 |
| | | | | | | | | | |
| Shares/Description | | | | | | Value | |
334,415 | | Tortoise Energy Capital Corp., 3.950% | | | | | | $ | 3,394,312 | |
| | | | | | | | | | |
| | | |
TOTAL PREFERRED STOCKS (Cost $23,941,345) | | | | | | | 23,551,493 | |
| | | | | | | | | | |
| | | |
| Shares/Description | | Rate | | Maturity | | Value | |
| BUSINESS DEVELOPMENT COMPANY SENIOR NOTES - 2.62% | | | | | | |
$4,939 | | Apollo Investment Corp. | | 6.63% | | 10/15/2042 | | | 107,226 | |
328,850 | | Fifth Street Finance Corp. | | 6.13% | | 04/30/2028 | | | 7,445,164 | |
380,004 | | Main Street Capital Corp. | | 6.13% | | 04/01/2023 | | | 8,892,093 | |
201,266 | | Medley Capital Corp. | | 6.13% | | 03/30/2023 | | | 4,689,498 | |
66,065 | | MVC Capital, Inc. | | 7.25% | | 01/15/2023 | | | 1,658,892 | |
203,293 | | PennantPark Investment Corp. | | 6.25% | | 02/01/2025 | | | 4,879,032 | |
| | | | | | | | | | |
| | | |
TOTAL BUSINESS DEVELOPMENT COMPANY SENIOR NOTES (Cost $29,560,006) | | | | | | | 27,671,905 | |
| | | | | | | | | | |
| | | |
| FOREIGN CORPORATE BONDS - 5.58% | | | | | | | | |
Australia - 0.12% | | | | | | | | |
1,125,000 | | Australia & New Zealand Banking Group Ltd.(b) | | 4.88% | | 01/12/2021 | | | 1,235,093 | |
| | | | | | | | | | |
| | | | | | | | | 1,235,093 | |
| | | |
Austria - 0.12% | | | | | | | | |
800,000 | | ESAL GmbH(b) | | 6.25% | | 02/05/2023 | | | 710,000 | |
600,000 | | ESAL GmbH(c) | | 6.25% | | 02/05/2023 | | | 532,500 | |
| | | | | | | | | | |
| | | | | | | | | 1,242,500 | |
| | | |
Bermuda - 0.14% | | | | | | | | |
600,000 | | Inkia Energy Ltd.(c) | | 8.38% | | 04/04/2021 | | | 631,500 | |
800,000 | | Noble Group Ltd.(c) | | 6.75% | | 01/29/2020 | | | 832,000 | |
| | | | | | | | | | |
| | | | | | | | | 1,463,500 | |
| | | |
Brazil - 0.49% | | | | | | | | |
600,000 | | Banco do Brasil SA(c) | | 5.88% | | 01/19/2023 | | | 565,500 | |
1,200,000 | | Banco do Brasil SA(a)(c)(d) | | 8.50% | | Perpetual
Maturity | | | 1,344,000 | |
300,000 | | Caixa Economica Federal(c) | | 3.50% | | 11/07/2022 | | | 249,000 | |
400,000 | | Globo Comunicacao e Participacoes SA(b)(e) | | 5.31% | | 05/11/2022 | | | 404,000 | |
200,000 | | Globo Comunicacao e Participacoes SA(c)(e) | | 5.31% | | 05/11/2022 | | | 202,000 | |
600,000 | | Itau Unibanco Holding SA(c) | | 5.50% | | 08/06/2022 | | | 564,000 | |
1,500,000 | | OAS Financial Ltd.(a)(b) | | 8.88% | | 12/29/2049 | | | 1,368,750 | |
400,000 | | Samarco Mineracao SA(b) | | 4.13% | | 11/01/2022 | | | 349,000 | |
| | |
| See Notes to Financial Statements. | | |
| 42 | | (888) 848-7569 | www.rivernorthfunds.com |
| | |
| RiverNorth/DoubleLine Strategic Income Fund | | Schedule of Investments |
| | September 30, 2013 |
| | | | | | | | | | |
| Principal Amount/Description | | Rate | | Maturity | | Value | |
$200,000 | | Samarco Mineracao SA(c) | | 4.13% | | 11/01/2022 | | $ | 174,500 | |
| | | | | | | | | | |
| | | | | | | | | 5,220,750 | |
| | | |
Canada - 0.29% | | | | | | | | |
1,275,000 | | Bank of Montreal | | 1.40% | | 09/11/2017 | | | 1,257,615 | |
840,000 | | Pacific Rubiales Energy Corp.(b) | | 7.25% | | 12/12/2021 | | | 886,200 | |
600,000 | | Pacific Rubiales Energy Corp.(b) | | 5.13% | | 03/28/2023 | | | 540,750 | |
360,000 | | Pacific Rubiales Energy Corp.(c) | | 7.25% | | 12/12/2021 | | | 379,800 | |
| | | | | | | | | | |
| | | | | | | | | 3,064,365 | |
| | | |
Cayman Islands - 0.63% | | | | | | | | |
500,000 | | AES Andres Dominicana Ltd.(b) | | 9.50% | | 11/12/2020 | | | 530,000 | |
1,000,000 | | AES Andres Dominicana Ltd.(c) | | 9.50% | | 11/12/2020 | | | 1,060,000 | |
900,000 | | EGE Haina Finance Co.(c) | | 9.50% | | 04/26/2017 | | | 928,503 | |
700,000 | | Grupo Aval Ltd.(b) | | 4.75% | | 09/26/2022 | | | 630,000 | |
800,000 | | Grupo Aval Ltd.(c) | | 4.75% | | 09/26/2022 | | | 720,000 | |
387,557 | | IIRSA Norte Finance Ltd.(c) | | 8.75% | | 05/30/2024 | | | 453,442 | |
1,000,000 | | Industrial Senior Trust(b) | | 5.50% | | 11/01/2022 | | | 917,500 | |
500,000 | | Industrial Senior Trust(c) | | 5.50% | | 11/01/2022 | | | 458,750 | |
300,000 | | Odebrecht Finance Ltd.(c) | | 7.50% | | 09/29/2049 | | | 292,500 | |
575,000 | | Transocean, Inc. | | 6.00% | | 03/15/2018 | | | 648,654 | |
| | | | | | | | | | |
| | | | | | | | | 6,639,349 | |
| | | |
Chile - 0.63% | | | | | | | | |
1,000,000 | | Cencosud SA(b) | | 4.88% | | 01/20/2023 | | | 952,109 | |
400,000 | | CFR International SpA(b) | | 5.13% | | 12/06/2022 | | | 369,280 | |
1,100,000 | | CFR International SpA(c) | | 5.13% | | 12/06/2022 | | | 1,015,129 | |
800,000 | | CorpGroup Banking SA(b) | | 6.75% | | 03/15/2023 | | | 684,000 | |
500,000 | | Inversiones CMPC SA(b) | | 4.50% | | 04/25/2022 | | | 468,324 | |
300,000 | | Inversiones CMPC SA(b) | | 4.38% | | 05/15/2023 | | | 280,534 | |
800,000 | | SACI Falabella(b) | | 3.75% | | 04/30/2023 | | | 716,000 | |
400,000 | | SMU SA(b) | | 7.75% | | 02/08/2020 | | | 270,000 | |
2,000,000 | | Tanner Servicios Financieros SA(b) | | 4.38% | | 03/13/2018 | | | 1,900,818 | |
| | | | | | | | | | |
| | | | | | | | | 6,656,194 | |
| | | |
Colombia - 0.33% | | | | | | | | |
800,000 | | Banco de Bogota SA(b) | | 5.38% | | 02/19/2023 | | | 750,000 | |
700,000 | | Banco de Bogota SA(c) | | 5.38% | | 02/19/2023 | | | 656,250 | |
1,100,000 | | Bancolombia SA | | 5.95% | | 06/03/2021 | | | 1,122,000 | |
1,000,000 | | Transportadora de Gas Internacional SA ESP(c) | | 5.70% | | 03/20/2022 | | | 1,007,500 | |
| | | | | | | | | | |
| | | | | | | | | 3,535,750 | |
| | | |
Costa Rica - 0.14% | | | | | | | | |
800,000 | | Instit Costa de Electric(b) | | 6.95% | | 11/10/2021 | | | 826,000 | |
600,000 | | Instit Costa de Electric(c) | | 6.95% | | 11/10/2021 | | | 619,500 | |
| | | | | | | | | | |
| | | | | | | | | 1,445,500 | |
| | |
| See Notes to Financial Statements. | | |
| Annual Report | September 30, 2013 | | 43 |
| | |
| RiverNorth/DoubleLine Strategic Income Fund | | Schedule of Investments |
| | September 30, 2013 |
| | | | | | | | | | |
| Principal Amount/Description | | Rate | | Maturity | | Value | |
Curacao - 0.06% | | | | | | | | |
$665,000 | | Teva Pharmaceutical Finance Co. BV | | 2.95% | | 12/18/2022 | | $ | 617,631 | |
| | | | | | | | | | |
| | | | | | | | | 617,631 | |
| | | |
France - 0.06% | | | | | | | | |
625,000 | | Orange SA | | 2.75% | | 09/14/2016 | | | 645,409 | |
| | | | | | | | | | |
| | | | | | | | | 645,409 | |
| | | |
Great Britain - 0.36% | | | | | | | | |
473,000 | | BP Capital Markets PLC | | 4.75% | | 03/10/2019 | | | 524,912 | |
125,000 | | BP Capital Markets PLC | | 2.50% | | 11/06/2022 | | | 113,354 | |
1,163,000 | | British Telecommunications PLC | | 5.95% | | 01/15/2018 | | | 1,334,442 | |
600,000 | | Diageo Capital PLC | | 1.50% | | 05/11/2017 | | | 600,843 | |
1,000,000 | | Vedanta Resources PLC(b) | | 7.13% | | 05/31/2023 | | | 932,500 | |
300,000 | | Vedanta Resources PLC(c) | | 8.25% | | 06/07/2021 | | | 304,313 | |
| | | | | | | | | | |
| | | | | | | | | 3,810,364 | |
| | | |
Ireland - 0.02% | | | | | | | | |
200,000 | | Ardagh Packaging Finance PLC /Ardagh MP Holdings USA, Inc.(b) | | 7.00% | | 11/15/2020 | | | 193,000 | |
| | | | | | | | | | |
| | | | | | | | | 193,000 | |
| | | |
Jersey - 0.14% | | | | | | | | |
1,500,000 | | Polyus Gold International Ltd.(b) | | 5.63% | | 04/29/2020 | | | 1,477,500 | |
| | | | | | | | | | |
| | | | | | | | | 1,477,500 | |
| | | |
Luxembourg - 0.21% | | | | | | | | |
500,000 | | Cosan Luxembourg SA(b) | | 5.00% | | 03/14/2023 | | | 451,250 | |
835,000 | | Covidien International Finance SA | | 2.95% | | 06/15/2023 | | | 789,750 | |
195,000 | | Intelsat Luxembourg SA(b) | | 7.75% | | 06/01/2021 | | | 202,556 | |
650,000 | | Minerva Luxembourg SA(b) | | 7.75% | | 01/31/2023 | | | 614,250 | |
200,000 | | Minerva Luxembourg SA(c) | | 7.75% | | 01/31/2023 | | | 189,000 | |
| | | | | | | | | | |
| | | | | | | | | 2,246,806 | |
| | | |
Malaysia - 0.09% | | | | | | | | |
1,000,000 | | IOI Investment L Bhd | | 4.38% | | 06/27/2022 | | | 943,109 | |
| | | | | | | | | | |
| | | | | | | | | 943,109 | |
| | | |
Mexico - 0.19% | | | | | | | | |
1,000,000 | | Grupo KUO SAB De CV(b) | | 6.25% | | 12/04/2022 | | | 962,500 | |
1,000,000 | | Grupo KUO SAB De CV(c) | | 6.25% | | 12/04/2022 | | | 962,500 | |
100,000 | | Ixe Banco SA(c) | | 9.25% | | 10/14/2020 | | | 118,313 | |
| | | | | | | | | | |
| | | | | | | | | 2,043,313 | |
| | | |
Netherlands - 0.23% | | | | | | | | |
547,000 | | Koninklijke KPN NV | | 8.38% | | 10/01/2030 | | | 701,571 | |
500,000 | | Lukoil International Finance BV(c) | | 4.56% | | 04/24/2023 | | | 466,375 | |
400,000 | | Petrobras Global Finance BV | | 4.38% | | 05/20/2023 | | | 370,067 | |
900,000 | | VimpelCom Holdings BV(b) | | 5.95% | | 02/13/2023 | | | 855,594 | |
| | | | | | | | | | |
| | | | | | | | | 2,393,607 | |
| | |
| See Notes to Financial Statements. | | |
| 44 | | (888) 848-7569 | www.rivernorthfunds.com |
| | |
| RiverNorth/DoubleLine Strategic Income Fund | | Schedule of Investments |
| | September 30, 2013 |
| | | | | | | | | | |
| Principal Amount/Description | | Rate | | Maturity | | Value | |
Norway - 0.06% | | | | | | | | |
$600,000 | | Corp. Pesquera Inca SAC(c) | | 9.00% | | 02/10/2017 | | $ | 606,000 | |
| | | | | | | | | | |
| | | | | | | | | 606,000 | |
| | | |
Peru - 0.58% | | | | | | | | |
1,500,000 | | Banco de Credito del Peru(b) | | 4.25% | | 04/01/2023 | | | 1,339,500 | |
900,000 | | Banco de Credito del Peru(a)(b) | | 6.13% | | 04/24/2027 | | | 884,250 | |
100,000 | | Banco de Credito del Peru(a)(c) | | 9.75% | | 11/06/2069 | | | 114,250 | |
300,000 | | Banco Internacional del Peru SAA(a)(c) | | 8.50% | | 04/23/2070 | | | 317,250 | |
1,500,000 | | Cia Minera Milpo SAA(b) | | 4.63% | | 03/28/2023 | | | 1,353,750 | |
100,000 | | Corp. Pesquera Inca SAC(b) | | 9.00% | | 02/10/2017 | | | 101,000 | |
500,000 | | Pesquera Exalmar SAA(b) | | 7.38% | | 01/31/2020 | | | 462,500 | |
500,000 | | Pesquera Exalmar SAA(c) | | 7.38% | | 01/31/2020 | | | 462,500 | |
500,000 | | Scotiabank Peru SA(a)(b) | | 4.50% | | 12/13/2027 | | | 437,500 | |
800,000 | | Scotiabank Peru SA(a)(c) | | 4.50% | | 12/13/2027 | | | 700,000 | |
| | | | | | | | | | |
| | | | | | | | | 6,172,500 | |
| | | |
Russia - 0.32% | | | | | | | | |
1,000,000 | | Alfa Bank OJSC Via Alfa Bond Issuance PLC(c) | | 7.50% | | 09/26/2019 | | | 1,037,500 | |
1,600,000 | | Gazprom OAO Via Gaz Capital SA(c) | | 4.95% | | 02/06/2028 | | | 1,424,000 | |
500,000 | | Rosneft Oil Co. via Rosneft International Finance Ltd.(c) | | 4.20% | | 03/06/2022 | | | 462,500 | |
300,000 | | Sberbank of Russia Via SB Capital SA(c) | | 5.13% | | 10/29/2022 | | | 281,310 | |
200,000 | | VTB Bank OJSC Via VTB Capital SA(c) | | 6.95% | | 10/17/2022 | | | 199,500 | |
| | | | | | | | | | |
| | | | | | | | | 3,404,810 | |
| | | |
South Korea - 0.13% | | | | | | | | |
1,000,000 | | The Korea Development Bank | | 4.38% | | 08/10/2015 | | | 1,060,478 | |
250,000 | | The Korea Development Bank | | 3.25% | | 03/09/2016 | | | 260,989 | |
| | | | | | | | | | |
| | | | | | | | | 1,321,467 | |
| | | |
Spain - 0.04% | | | | | | | | |
400,000 | | Cemex Espana Luxembourg(c) | | 9.25% | | 05/12/2020 | | | 432,000 | |
| | | | | | | | | | |
| | | | | | | | | 432,000 | |
| | | |
Turkey - 0.20% | | | | | | | | |
600,000 | | Anadolu Efes Biracilik Ve Malt Sanayii AS(b) | | 3.38% | | 11/01/2022 | | | 493,500 | |
700,000 | | Tupras Turkiye Petrol Rafinerileri AS(b) | | 4.13% | | 05/02/2018 | | | 657,125 | |
1,000,000 | | Tupras Turkiye Petrol Rafinerileri AS(c) | | 4.13% | | 05/02/2018 | | | 938,750 | |
| | | | | | | | | | |
| | | | | | | | | 2,089,375 | |
| | | | | | | | | | |
| | | |
TOTAL FOREIGN CORPORATE BONDS (Cost $62,133,847) | | | | | | | 58,899,892 | |
| | | | | | | | | | |
| | |
| See Notes to Financial Statements. | | |
| Annual Report | September 30, 2013 | | 45 |
| | |
| RiverNorth/DoubleLine Strategic Income Fund | | Schedule of Investments |
| | September 30, 2013 |
| | | | | | | | | | |
| Principal Amount/Description | | Rate | | Maturity | | Value | |
| U.S. CORPORATE BONDS - 5.82% | | | | | | | | |
$215,000 | | Activision Blizzard, Inc.(b) | | 5.63% | | 09/15/2021 | | $ | 215,806 | |
235,000 | | Alere, Inc. | | 6.50% | | 06/15/2020 | | | 234,119 | |
1,400,000 | | Altria Group, Inc. | | 2.85% | | 08/09/2022 | | | 1,285,210 | |
200,000 | | American Axle & Manufacturing, Inc. | | 6.63% | | 10/15/2022 | | | 206,000 | |
1,250,000 | | American Express Credit Corp. | | 2.13% | | 07/27/2018 | | | 1,256,569 | |
635,000 | | Arrow Electronics, Inc. | | 3.38% | | 11/01/2015 | | | 657,335 | |
245,000 | | Ashland, Inc. | | 4.75% | | 08/15/2022 | | | 230,912 | |
720,000 | | AT&T, Inc. | | 5.35% | | 09/01/2040 | | | 701,150 | |
225,000 | | Atlas Pipeline Partners LP / Atlas Pipeline Finance Corp.(b) | | 4.75% | | 11/15/2021 | | | 204,469 | |
220,000 | | Avis Budget Car Rental LLC /Avis Budget Finance, Inc. | | 5.50% | | 04/01/2023 | | | 204,600 | |
325,000 | | Baxter International, Inc. | | 3.20% | | 06/15/2023 | | | 317,898 | |
625,000 | | BB&T Corp. | | 1.60% | | 08/15/2017 | | | 621,279 | |
1,000,000 | | BBVA Bancomer SA(c) | | 6.50% | | 03/10/2021 | | | 1,045,000 | |
845,000 | | Becton Dickinson and Co. | | 3.13% | | 11/08/2021 | | | 839,493 | |
872,000 | | Biogen Idec, Inc. | | 6.88% | | 03/01/2018 | | | 1,036,406 | |
100,000 | | BMC Software Finance, Inc.(b) | | 8.13% | | 07/15/2021 | | | 104,250 | |
600,000 | | Boston Properties LP | | 4.13% | | 05/15/2021 | | | 619,518 | |
700,000 | | Burlington Northern Santa Fe LLC | | 3.00% | | 03/15/2023 | | | 660,315 | |
230,000 | | CCO Holdings LLC /CCO Holdings Capital Corp. | | 5.25% | | 09/30/2022 | | | 213,900 | |
225,000 | | Celanese US Holdings LLC | | 4.63% | | 11/15/2022 | | | 216,562 | |
675,000 | | Celgene Corp. | | 3.25% | | 08/15/2022 | | | 641,538 | |
140,000 | | Cinemark USA, Inc. | | 7.38% | | 06/15/2021 | | | 151,900 | |
220,000 | | CIT Group, Inc. | | 5.00% | | 08/15/2022 | | | 215,990 | |
215,000 | | Claire’s Stores, Inc.(b) | | 7.75% | | 06/01/2020 | | | 211,237 | |
855,000 | | ConAgra Foods, Inc. | | 3.20% | | 01/25/2023 | | | 801,798 | |
500,000 | | ConocoPhillips | | 6.50% | | 02/01/2039 | | | 630,851 | |
185,000 | | DaVita HealthCare Partners, Inc. | | 5.75% | | 08/15/2022 | | | 183,844 | |
965,000 | | Devon Energy Corp. | | 6.30% | | 01/15/2019 | | | 1,128,217 | |
203,000 | | Devon Energy Corp. | | 4.00% | | 07/15/2021 | | | 207,819 | |
625,000 | | DIRECTV Holdings LLC / DIRECTV Financing Co., Inc. | | 5.00% | | 03/01/2021 | | | 641,046 | |
675,000 | | Duke Energy Corp. | | 3.55% | | 09/15/2021 | | | 677,932 | |
200,000 | | Ecolab, Inc. | | 2.38% | | 12/08/2014 | | | 203,893 | |
450,000 | | Ecolab, Inc. | | 1.00% | | 08/09/2015 | | | 450,446 | |
195,000 | | Equinix, Inc. | | 7.00% | | 07/15/2021 | | | 208,406 | |
1,005,000 | | Ford Motor Co. | | 7.45% | | 07/16/2031 | | | 1,229,623 | |
210,000 | | Gannett Co., Inc.(b) | | 5.13% | | 07/15/2020 | | | 206,850 | |
1,175,000 | | General Electric Capital Corp. | | 2.90% | | 01/09/2017 | | | 1,231,082 | |
375,000 | | Glencore Funding LLC(b) | | 2.50% | | 01/15/2019 | | | 352,028 | |
542,000 | | Halliburton Co. | | 6.15% | | 09/15/2019 | | | 650,411 | |
| | |
| See Notes to Financial Statements. | | |
| 46 | | (888) 848-7569 | www.rivernorthfunds.com |
| | |
| RiverNorth/DoubleLine Strategic Income Fund | | Schedule of Investments |
| | September 30, 2013 |
| | | | | | | | | | |
| Principal Amount/Description | | Rate | | Maturity | | Value | |
$195,000 | | Hawk Acquisition Sub, Inc.(b) | | 4.25% | | 10/15/2020 | | $ | 186,469 | |
185,000 | | HD Supply, Inc.(b) | | 7.50% | | 07/15/2020 | | | 192,169 | |
180,000 | | IASIS Healthcare LLC /IASIS Capital Corp. | | 8.38% | | 05/15/2019 | | | 187,650 | |
675,000 | | Illinois Tool Works, Inc. | | 3.38% | | 09/15/2021 | | | 687,788 | |
550,000 | | JP Morgan Chase & Co. | | 4.50% | | 01/24/2022 | | | 574,917 | |
750,000 | | JPMorgan Chase & Co. | | 3.25% | | 09/23/2022 | | | 709,198 | |
490,000 | | Kellogg Co. | | 7.45% | | 04/01/2031 | | | 627,698 | |
600,000 | | Kinder Morgan Energy Partners LP | | 2.65% | | 02/01/2019 | | | 596,747 | |
400,000 | | Kinder Morgan Energy Partners LP | | 6.95% | | 01/15/2038 | | | 452,225 | |
225,000 | | Kinder Morgan Energy Partners LP | | 6.50% | | 09/01/2039 | | | 245,076 | |
905,000 | | Liberty Mutual Group, Inc.(b) | | 6.50% | | 05/01/2042 | | | 979,786 | |
745,000 | | Macy’s Retail Holdings, Inc. | | 2.88% | | 02/15/2023 | | | 671,513 | |
603,000 | | Marathon Petroleum Corp. | | 5.13% | | 03/01/2021 | | | 652,272 | |
625,000 | | Mattel, Inc. | | 2.50% | | 11/01/2016 | | | 645,811 | |
250,000 | | MetLife, Inc. | | 6.38% | | 06/15/2034 | | | 301,728 | |
475,000 | | MetLife, Inc. | | 5.70% | | 06/15/2035 | | | 527,563 | |
375,000 | | MetLife, Inc. | | 5.88% | | 02/06/2041 | | | 427,385 | |
205,000 | | MGM Resorts International | | 6.63% | | 12/15/2021 | | | 212,431 | |
725,000 | | Microsoft Corp. | | 2.13% | | 11/15/2022 | | | 661,254 | |
822,000 | | MidAmerican Energy Holdings Co. | | 6.50% | | 09/15/2037 | | | 973,959 | |
514,000 | | Mondelez International, Inc. | | 5.38% | | 02/10/2020 | | | 581,357 | |
650,000 | | Morgan Stanley | | 3.75% | | 02/25/2023 | | | 628,114 | |
800,000 | | Motorola Solutions, Inc. | | 6.00% | | 11/15/2017 | | | 913,585 | |
55,000 | | MPT Operating Partnership LP / MPT Finance Corp. | | 6.38% | | 02/15/2022 | | | 55,962 | |
1,189,000 | | National Rural Utilities Cooperative Finance Corp. | | 10.38% | | 11/01/2018 | | | 1,635,619 | |
50,000 | | NCL Corp. Ltd.(b) | | 5.00% | | 02/15/2018 | | | 50,125 | |
210,000 | | Newfield Exploration Co. | | 5.75% | | 01/30/2022 | | | 210,525 | |
625,000 | | Novartis Capital Corp. | | 4.40% | | 04/24/2020 | | | 687,404 | |
205,000 | | Nuveen Investments, Inc.(b) | | 9.50% | | 10/15/2020 | | | 201,412 | |
210,000 | | Oasis Petroleum, Inc.(b) | | 6.88% | | 03/15/2022 | | | 222,075 | |
640,000 | | ONEOK Partners LP | | 6.13% | | 02/01/2041 | | | 649,072 | |
850,000 | | Oracle Corp. | | 1.20% | | 10/15/2017 | | | 835,795 | |
475,000 | | Oracle Corp. | | 2.38% | | 01/15/2019 | | | 477,941 | |
210,000 | | Penn Virginia Resource Partners LP / Penn Virginia Resource Finance Corp. | | 8.25% | | 04/15/2018 | | | 218,925 | |
590,000 | | Phillips 66 | | 5.88% | | 05/01/2042 | | | 621,848 | |
1,175,000 | | PNC Funding Corp. | | 4.38% | | 08/11/2020 | | | 1,264,081 | |
195,000 | | Post Holdings, Inc.(b) | | 7.38% | | 02/15/2022 | | | 205,969 | |
215,000 | | QEP Resources, Inc. | | 5.38% | | 10/01/2022 | | | 206,400 | |
210,000 | | Regency Energy Partners LP /Regency Energy Finance Corp. | | 5.50% | | 04/15/2023 | | | 202,650 | |
220,000 | | Revlon Consumer Products Corp.(b) | | 5.75% | | 02/15/2021 | | | 212,575 | |
| | |
| See Notes to Financial Statements. | | |
| Annual Report | September 30, 2013 | | 47 |
| | |
| RiverNorth/DoubleLine Strategic Income Fund | | Schedule of Investments |
| | September 30, 2013 |
| | | | | | | | | | |
| Principal Amount/Description | | Rate | | Maturity | | Value | |
$100,000 | | Reynolds Group Issuer, Inc. / Reynolds Group Issuer LLC | | 9.88% | | 08/15/2019 | | $ | 109,000 | |
195,000 | | RR Donnelley & Sons Co. | | 7.88% | | 03/15/2021 | | | 210,112 | |
200,000 | | Safway Group Holding LLC / Safway Finance Corp.(b) | | 7.00% | | 05/15/2018 | | | 204,000 | |
205,000 | | Sally Holdings LLC / Sally Capital, Inc. | | 5.75% | | 06/01/2022 | | | 206,537 | |
205,000 | | SBA Communications Corp. | | 5.63% | | 10/01/2019 | | | 202,437 | |
195,000 | | Sealed Air Corp.(b) | | 6.50% | | 12/01/2020 | | | 205,238 | |
215,000 | | Select Medical Corp.(b) | | 6.38% | | 06/01/2021 | | | 204,788 | |
215,000 | | Service Corp. International(b) | | 5.38% | | 01/15/2022 | | | 205,594 | |
420,000 | | Simon Property Group LP | | 5.65% | | 02/01/2020 | | | 479,993 | |
150,000 | | Simon Property Group LP | | 4.38% | | 03/01/2021 | | | 159,849 | |
225,000 | | Sirius XM Radio, Inc.(b) | | 4.25% | | 05/15/2020 | | | 210,938 | |
165,000 | | SM Energy Co.(b) | | 5.00% | | 01/15/2024 | | | 152,625 | |
900,000 | | Southern Copper Corp. | | 5.25% | | 11/08/2042 | | | 730,246 | |
875,000 | | Southern Power Co. | | 4.88% | | 07/15/2015 | | | 936,452 | |
940,000 | | Southwest Airlines Co. | | 5.13% | | 03/01/2017 | | | 1,038,350 | |
200,000 | | Spectrum Brands Escrow Corp.(b) | | 6.63% | | 11/15/2022 | | | 208,000 | |
185,000 | | Sun Merger Sub, Inc.(b) | | 5.88% | | 08/01/2021 | | | 188,006 | |
235,000 | | Targa Resources Partners LP / Targa Resources Partners Finance Corp.(b) | | 4.25% | | 11/15/2023 | | | 213,850 | |
205,000 | | Terex Corp. | | 6.00% | | 05/15/2021 | | | 208,331 | |
795,000 | | The ADT Corp. | | 3.50% | | 07/15/2022 | | | 673,592 | |
461,000 | | The Boeing Co. | | 6.88% | | 03/15/2039 | | | 621,768 | |
625,000 | | The Coca-Cola Co. | | 1.80% | | 09/01/2016 | | | 643,114 | |
655,000 | | The Dow Chemical Co. | | 3.00% | | 11/15/2022 | | | 604,560 | |
550,000 | | The Goldman Sachs Group, Inc. | | 5.75% | | 01/24/2022 | | | 610,994 | |
175,000 | | The Goodyear Tire & Rubber Co. | | 7.00% | | 05/15/2022 | | | 182,875 | |
1,000,000 | | The Kroger Co. | | 3.40% | | 04/15/2022 | | | 975,576 | |
185,000 | | The Manitowoc Co., Inc. | | 8.50% | | 11/01/2020 | | | 206,737 | |
195,000 | | Toll Brothers Finance Corp. | | 5.88% | | 02/15/2022 | | | 200,363 | |
600,000 | | Tyson Foods, Inc. | | 4.50% | | 06/15/2022 | | | 624,084 | |
190,000 | | United Rentals North America, Inc. | | 7.63% | | 04/15/2022 | | | 207,575 | |
475,000 | | United Technologies Corp. | | 3.10% | | 06/01/2022 | | | 468,347 | |
100,000 | | US Foods, Inc. | | 8.50% | | 06/30/2019 | | | 105,875 | |
195,000 | | Valeant Pharmaceuticals International(b) | | 7.50% | | 07/15/2021 | | | 211,088 | |
575,000 | | Valero Energy Corp. | | 6.13% | | 02/01/2020 | | | 662,203 | |
680,000 | | Verizon Communications, Inc. | | 2.50% | | 09/15/2016 | | | 701,524 | |
1,175,000 | | Wal-Mart Stores, Inc. | | 3.25% | | 10/25/2020 | | | 1,213,467 | |
830,000 | | Waste Management, Inc. | | 6.13% | | 11/30/2039 | | | 952,342 | |
215,000 | | WCI Communities, Inc.(b) | | 6.88% | | 08/15/2021 | | | 206,938 | |
740,000 | | WellPoint, Inc. | | 5.25% | | 01/15/2016 | | | 808,504 | |
450,000 | | WellPoint, Inc. | | 2.30% | | 07/15/2018 | | | 450,814 | |
1,150,000 | | Wells Fargo & Co. | | 4.60% | | 04/01/2021 | | | 1,251,191 | |
| | |
| See Notes to Financial Statements. | | |
| 48 | | (888) 848-7569 | www.rivernorthfunds.com |
| | |
| RiverNorth/DoubleLine Strategic Income Fund | | Schedule of Investments |
| | September 30, 2013 |
| | | | | | | | | | |
| Principal Amount/Description | | Rate | | Maturity | | Value | |
$595,000 | | Wynn Las Vegas LLC | | 7.75% | | 08/15/2020 | | $ | 670,863 | |
645,000 | | Xerox Corp. | | 4.25% | | 02/15/2015 | | | 672,786 | |
| | | | | | | | | | |
| | | |
TOTAL U.S. CORPORATE BONDS (Cost $63,184,235) | | | | | | | 61,492,301 | |
| | | | | | | | | | |
|
| FOREIGN GOVERNMENT BONDS AND NOTES, SUPRANATIONALS AND FOREIGN AGENCIES - 0.35% | |
1,275,000 | | Corp. Andina de Fomento | | 3.75% | | 01/15/2016 | | | 1,338,455 | |
1,000,000 | | Mexico Government International Bond | | 4.00% | | 10/02/2023 | | | 995,000 | |
1,300,000 | | Pemex Project Funding Master Trust | | 6.63% | | 06/15/2035 | | | 1,379,313 | |
| | | | | | | | | | |
| |
TOTAL FOREIGN GOVERNMENT BONDS AND NOTES, SUPRANATIONALS AND FOREIGN AGENCIES (Cost $3,879,381) | | | 3,712,768 | |
| | | | | | | | | | |
| | | |
| COLLATERALIZED LOAN OBLIGATIONS - 1.38% | | | | | | | | |
184,380 | | Adirondack Park CLO Ltd. 2013-1A Series 2013-1A(a)(b) | | 1.27% | | 04/15/2016 | | | 184,369 | |
500,000 | | ALM IV Ltd. Series 2011-4A(a)(b) | | 3.02% | | 07/18/2022 | | | 484,072 | |
500,000 | | ARES CLO Ltd. Series 2012-2A(a)(b) | | 4.98% | | 10/12/2023 | | | 498,554 | |
500,000 | | ARES XXVI CLO Ltd. Series 2013-1A(a)(b) | | 4.04% | | 04/15/2025 | | | 475,249 | |
500,000 | | BlueMountain CLO Ltd. Series 2012-1A(a)(b) | | 5.77% | | 07/20/2023 | | | 476,715 | |
250,000 | | Brookside Mill CLO Ltd. Series 2013-1A(a)(b) | | 2.98% | | 04/17/2025 | | | 242,526 | |
500,000 | | Series 2013-1A(a)(b) | | 3.33% | | 04/17/2025 | | | 457,840 | |
500,000 | | Series 2013-1A(a)(b) | | 4.68% | | 04/17/2025 | | | 445,160 | |
500,000 | | Cent CLO 18 Ltd. Series 2013-18A(a)(b) | | 3.72% | | 07/23/2025 | | | 469,702 | |
250,000 | | Series 2013-18A(a)(b) | | 4.87% | | 07/23/2025 | | | 220,320 | |
500,000 | | Centurion CDO 8 Ltd. Series 2005-8X C(a) | | 2.27% | | 03/08/2017 | | | 480,407 | |
500,000 | | Chatham Light CLO Ltd. Series 2005-2A(a)(b) | | 1.97% | | 08/03/2019 | | | 475,696 | |
500,000 | | Dryden XXIV Senior Loan Fund Series 2012-24A(a)(b) | | 5.01% | | 11/15/2023 | | | 499,989 | |
500,000 | | Four Corners CLO III Ltd. Series 2006-3A(a)(b) | | 1.77% | | 07/22/2020 | | | 475,544 | |
| | |
| See Notes to Financial Statements. | | |
| Annual Report | September 30, 2013 | | 49 |
| | |
| RiverNorth/DoubleLine Strategic Income Fund | | Schedule of Investments |
| | September 30, 2013 |
| | | | | | | | | | |
| Principal Amount/Description | | Rate | | Maturity | | Value | |
$500,000 | | Galaxy XV CLO Ltd. Series 2013-15A(a)(b) | | 2.89% | | 04/15/2025 | | $ | 478,680 | |
500,000 | | Series 2013-15A(a)(b) | | 3.69% | | 04/15/2025 | | | 473,394 | |
250,000 | | GoldenTree Loan Opportunities IV Ltd. Series 2007-4A(a)(b) | | 4.51% | | 08/18/2022 | | | 235,314 | |
750,000 | | GoldenTree Loan Opportunities VI Ltd. Series 2012-6A(a)(b) | | 4.47% | | 04/17/2022 | | | 744,096 | |
500,000 | | LCM X LP Series 2012-10A(a)(b) | | 4.87% | | 04/15/2022 | | | 497,325 | |
500,000 | | LCM XI LP Series 2012-11A(a)(b) | | 4.22% | | 04/19/2022 | | | 487,313 | |
500,000 | | Magnetite IV CLO Ltd. Series 2012-7A(a)(b) | | 5.52% | | 01/15/2025 | | | 468,611 | |
250,000 | | Nomad CLO Ltd. Series 2013-1A(a)(b) | | 3.22% | | 01/15/2025 | | | 245,683 | |
250,000 | | Series 2013-1A(a)(b) | | 3.77% | | 01/15/2025 | | | 237,104 | |
500,000 | | OCP CLO 2013-3 Ltd. Series 2013-3A(a)(b) | | 3.03% | | 01/17/2025 | | | 485,464 | |
500,000 | | Octagon Investment Partners XVI Ltd. Series 2013-1A(a)(b) | | 3.62% | | 07/17/2025 | | | 471,177 | |
500,000 | | Series 2013-1A(a)(b) | | 4.77% | | 07/17/2025 | | | 444,901 | |
500,000 | | OHA Intrepid Leveraged Loan Fund Ltd. Series 2013-1AR(a)(b) | | 3.32% | | 04/20/2021 | | | 489,879 | |
250,000 | | Race Point VIII CLO Ltd. Series 2013-8A(a)(b) | | 2.17% | | 02/20/2025 | | | 250,003 | |
100,000 | | Saturn CLO Ltd. Series 2007-1A(a)(b) | | 4.26% | | 05/13/2022 | | | 90,827 | |
1,000,000 | | Venture V CDO Ltd. Series 2005-1A(a)(b) | | 0.71% | | 11/22/2018 | | | 957,498 | |
500,000 | | Venture X CLO Ltd. Series 2012-10A(a)(b) | | 4.47% | | 07/20/2022 | | | 491,552 | |
500,000 | | WhiteHorse III Ltd. Corp. Series 2006-1A(a)(b) | | 2.12% | | 05/01/2018 | | | 482,855 | |
750,000 | | Wind River CLO Ltd. Series 2013-1A C(a)(b) | | 3.68% | | 04/20/2025 | | | 710,010 | |
| | | | | | | | | | |
| | | |
TOTAL COLLATERALIZED LOAN OBLIGATIONS (Cost $14,823,020) | | | | | | | 14,627,829 | |
| | | | | | | | | | |
| | | |
| NON-AGENCY COLLATERALIZED MORTGAGE OBLIGATIONS - 30.35% | | | | | | | | |
3,136,038 | | Adjustable Rate Mortgage Trust Series 2005-1(a) | | 2.87% | | 05/25/2035 | | | 3,023,919 | |
2,357,367 | | Series 2005-7(a) | | 3.11% | | 10/25/2035 | | | 2,094,714 | |
| | |
| See Notes to Financial Statements. | | |
| 50 | | (888) 848-7569 | www.rivernorthfunds.com |
| | |
| RiverNorth/DoubleLine Strategic Income Fund | | Schedule of Investments |
| | September 30, 2013 |
| | | | | | | | | | |
| Principal Amount/Description | | Rate | | Maturity | | Value | |
$851,503 | | Alternative Loan Trust Series 2005-20CB | | 5.50% | | 07/25/2035 | | $ | 740,342 | |
345,681 | | Series 2005-54CB | | 5.50% | | 11/25/2035 | | | 295,372 | |
1,000,000 | | Series 2005-6CB | | 5.50% | | 04/25/2035 | | | 979,039 | |
686,514 | | Series 2005-85CB(a) | | 20.98% | | 02/25/2036 | | | 858,881 | |
3,250,782 | | Series 2005-85CB(a) | | 1.28% | | 02/25/2036 | | | 2,587,304 | |
831,544 | | Series 2005-86CB | | 5.50% | | 02/25/2036 | | | 695,419 | |
1,734,987 | | Series 2005-9CB(a) | | 4.87% | | 05/25/2035 | | | 217,531 | |
976,907 | | Series 2005-9CB(a) | | 0.68% | | 05/25/2035 | | | 766,859 | |
635,456 | | Series 2006-12CB(a) | | 5.75% | | 05/25/2036 | | | 502,238 | |
2,863,691 | | Series 2006-15CB | | 6.50% | | 06/25/2036 | | | 2,205,340 | |
419,500 | | Series 2006-30T1 | | 6.25% | | 11/25/2036 | | | 359,226 | |
323,540 | | Series 2006-32CB | | 5.50% | | 11/25/2036 | | | 277,426 | |
628,905 | | Series 2006-36T2(a) | | 27.24% | | 12/25/2036 | | | 834,697 | |
2,435,886 | | Series 2007-19 | | 6.00% | | 08/25/2037 | | | 1,921,310 | |
7,782,173 | | Series 2007-20 | | 6.25% | | 08/25/2047 | | | 6,554,924 | |
2,627,177 | | Series 2007-23CB(a) | | 6.32% | | 09/25/2037 | | | 570,090 | |
2,751,451 | | Series 2007-23CB(a) | | 0.68% | | 09/25/2037 | | | 1,620,244 | |
246,499 | | American Home Mortgage Investment Trust Series 2007-A(b)(e) | | 6.10% | | 01/25/2037 | | | 163,874 | |
200,000 | | BAMLL Commercial Mortgage Securities Trust Series 2012-CLRN(a)(b) | | 1.78% | | 08/15/2014 | | | 200,419 | |
300,000 | | Series 2012-CLRN(a)(b) | | 2.88% | | 08/15/2014 | | | 301,165 | |
148,252 | | Banc of America Alternative Loan Trust Series 2005-6 | | 6.00% | | 07/25/2035 | | | 137,459 | |
294,323 | | Series 2005-6 | | 5.50% | | 07/25/2035 | | | 286,167 | |
500,000 | | Banc of America Commercial Mortgage Trust Series 2007-5(a) | | 5.77% | | 10/10/2017 | | | 536,798 | |
1,108,831 | | Banc of America Funding Corp. Series 2006-2 | | 5.50% | | 03/25/2036 | | | 1,111,521 | |
2,713,994 | | Series 2006-A(a) | | 2.99% | | 02/20/2036 | | | 2,198,302 | |
1,672,336 | | Series 2008-R2(b) | | 6.00% | | 09/25/2037 | | | 1,785,953 | |
232,074 | | Banc of America Mortgage Trust Series 2004-8 | | 5.50% | | 09/25/2024 | | | 237,562 | |
328,293 | | BCAP LLC Trust Series 2007-AA2(a) | | 7.50% | | 04/25/2037 | | | 276,881 | |
213,003 | | Series 2007-AA2 | | 6.00% | | 04/25/2037 | | | 181,521 | |
500,000 | | Series 2010-RR6(a)(b) | | 6.72% | | 11/26/2014 | | | 503,487 | |
2,777,696 | | Bear Stearns ALT-A Trust Series 2004-11(a) | | 2.82% | | 11/25/2034 | | | 2,426,736 | |
2,706,389 | | Series 2005-3(a) | | 2.52% | | 04/25/2035 | | | 2,138,142 | |
| | |
| See Notes to Financial Statements. | | |
| Annual Report | September 30, 2013 | | 51 |
| | |
| RiverNorth/DoubleLine Strategic Income Fund | | Schedule of Investments |
| | September 30, 2013 |
| | | | | | | | | | |
| Principal Amount/Description | | Rate | | Maturity | | Value | |
$2,736,353 | | Series 2006-6(a) | | 4.67% | | 11/25/2036 | | $ | 1,916,651 | |
944,544 | | Bear Stearns Asset-Backed Securities Trust Series 2005-HE3(a) | | 1.20% | | 03/25/2035 | | | 910,503 | |
4,027,328 | | Series 2006-AC1(e) | | 5.75% | | 02/25/2036 | | | 3,220,835 | |
1,089,860 | | Chase Mortgage Finance Trust Series 2007-S3 | | 5.50% | | 05/25/2037 | | | 1,056,470 | |
7,246,289 | | CHL Mortgage Pass-Through Trust 2006-18 Series 2006-18 | | 6.00% | | 12/25/2036 | | | 6,296,112 | |
1,815,521 | | Citicorp Mortgage Securities Trust Series 2007-1 | | 6.00% | | 01/25/2037 | | | 1,818,834 | |
1,081,297 | | Series 2007-2 | | 5.50% | | 02/25/2037 | | | 1,056,769 | |
63,000 | | Citigroup Commercial Mortgage Trust Series 2004-C1(a) | | 5.61% | | 04/15/2040 | | | 64,225 | |
250,000 | | Series 2005-C3(a) | | 4.83% | | 05/15/2043 | | | 262,560 | |
850,000 | | Series 2013-SMP C | | 2.74% | | 01/12/2018 | | | 843,009 | |
850,000 | | Series 2013-SMP D(a) | | 3.01% | | 01/12/2018 | | | 832,573 | |
1,551,521 | | Citigroup Mortgage Loan Trust, Inc. Series 2006-WF1(e) | | 5.80% | | 03/25/2036 | | | 1,058,977 | |
2,175,987 | | Series 2007-OPX1(e) | | 6.33% | | 01/25/2037 | | | 1,360,162 | |
2,000,000 | | Series 2008-AR4(a)(b) | | 2.91% | | 11/25/2038 | | | 1,680,024 | |
1,400,000 | | Series 2008-AR4(a)(b) | | 2.76% | | 11/25/2038 | | | 1,052,543 | |
1,485,358 | | Series 2010-8(a)(b) | | 9.24% | | 11/25/2036 | | | 1,271,047 | |
4,262,667 | | Series 2010-8(a)(b) | | 8.30% | | 12/25/2036 | | | 3,464,895 | |
1,100,000 | | Citigroup/Deutsche Bank Commercial Mortgage Trust Series 2007-CD4(a) | | 5.37% | | 12/11/2049 | | | 1,111,188 | |
27,011,465 | | Series 2007-CD5(a)(b) | | 0.31% | | 11/15/2044 | | | 61,667 | |
1,618,302 | | CitiMortgage Alternative Loan Trust Series 2007-A1 | | 6.00% | | 01/25/2037 | | | 1,368,865 | |
318,763 | | Series 2007-A1(a) | | 5.22% | | 01/25/2037 | | | 44,667 | |
573,772 | | Series 2007-A3(a) | | 5.22% | | 03/25/2037 | | | 85,350 | |
249,323 | | Series 2007-A3(a) | | 6.00% | | 03/25/2037 | | | 212,700 | |
8,855,495 | | Series 2007-A4 | | 5.75% | | 04/25/2037 | | | 7,317,420 | |
1,978,600 | | Series 2007-A4 | | 5.75% | | 04/25/2037 | | | 1,634,944 | |
1,733,910 | | Series 2007-A6 | | 5.50% | | 06/25/2037 | | | 1,348,817 | |
1,060,498 | | Commercial Mortgage Pass-Through Certificates Series 2010-C1(a)(b) | | 2.52% | | 07/10/2046 | | | 46,459 | |
10,000 | | Commercial Mortgage Trust Series 2004-FL2A(a)(b) | | 0.59% | | 11/05/2019 | | | 9,700 | |
900,000 | | Series 2007-GG11(a) | | 5.87% | | 08/10/2017 | | | 982,747 | |
600,000 | | Series 2007-GG9 | | 5.48% | | 02/10/2017 | | | 634,291 | |
| | |
| See Notes to Financial Statements. | | |
| 52 | | (888) 848-7569 | www.rivernorthfunds.com |
| | |
| RiverNorth/DoubleLine Strategic Income Fund | | Schedule of Investments |
| | September 30, 2013 |
| | | | | | | | | | |
| Principal Amount/Description | | Rate | | Maturity | | Value | |
$400,000 | | Series 2007-GG9 | | 5.48% | | 03/10/2039 | | $ | 419,773 | |
2,500,000 | | Countrywide Asset-Backed Certificates Series 2005-12(e) | | 5.56% | | 02/25/2036 | | | 2,576,307 | |
300,000 | | Countrywide Home Loan Mortgage Pass-Through Trust Series 2005-J4 | | 5.50% | | 11/25/2035 | | | 292,544 | |
1,014,366 | | Series 2007-17 | | 6.00% | | 10/25/2037 | | | 977,892 | |
1,061,191 | | Series 2007-3 | | 6.00% | | 04/25/2037 | | | 963,375 | |
1,467,724 | | Series 2007-7 | | 5.75% | | 06/25/2037 | | | 1,327,266 | |
172,200 | | Credit Suisse First Boston Mortgage Securities Corp. Series 2005-10 | | 5.50% | | 11/25/2035 | | | 148,155 | |
155,359 | | Series 2005-8 | | 5.50% | | 08/25/2025 | | | 146,550 | |
750,000 | | Series 2005-C6(a) | | 4.94% | | 11/15/2015 | | | 797,840 | |
229,140 | | Credit Suisse First Boston Mortgage Securities Corp. Series 1998-C2 Series 1998-C2(a)(b) | | 6.75% | | 11/15/2030 | | | 238,229 | |
950,000 | | Credit Suisse Mortgage Capital Certificates Series 2006-C4 | | 5.51% | | 09/15/2016 | | | 1,017,398 | |
550,000 | | Series 2006-C5 | | 5.34% | | 12/15/2039 | | | 584,689 | |
457,329 | | Series 2006-TF2A(a)(b) | | 0.35% | | 10/15/2021 | | | 455,529 | |
700,000 | | Series 2007-TFLA(a)(b) | | 0.33% | | 02/15/2022 | | | 687,063 | |
8,781,274 | | CSAB Mortgage-Backed Trust Series 2006-2(e) | | 5.70% | | 09/25/2036 | | | 3,183,264 | |
211,233 | | Series 2007-1(a) | | 5.90% | | 05/25/2037 | | | 127,792 | |
442,349 | | CSMC Mortgage-Backed Trust Series 2006-1 | | 6.00% | | 02/25/2036 | | | 329,133 | |
255,119 | | Series 2006-4 | | 5.50% | | 05/25/2021 | | | 242,689 | |
1,531,906 | | Series 2006-5 | | 6.25% | | 06/25/2036 | | | 869,165 | |
1,390,389 | | Series 2006-7 | | 5.00% | | 08/25/2036 | | | 1,131,604 | |
171,846 | | Series 2006-9 | | 6.00% | | 11/25/2036 | | | 172,661 | |
5,905,434 | | Series 2007-1 | | 6.00% | | 02/25/2037 | | | 5,310,107 | |
55,257 | | Series 2007-2 | | 5.00% | | 03/25/2037 | | | 53,686 | |
773,495 | | Series 2007-3(a) | | 5.84% | | 04/25/2037 | | | 421,698 | |
136,714 | | Series 2007-4 | | 6.00% | | 06/25/2037 | | | 122,170 | |
2,698,732 | | Series 2010-7R(a)(b) | | 7.12% | | 04/26/2037 | | | 2,395,649 | |
650,000 | | DBRR Trust Series 2012-EZ1 B(b) | | 1.39% | | 09/25/2045 | | | 651,755 | |
500,000 | | Del Coronado Trust Series 2013-HDC D(a)(b) | | 2.14% | | 03/15/2026 | | | 495,818 | |
500,000 | | Series 2013-HDC E(a)(b) | | 2.84% | | 03/15/2018 | | | 491,524 | |
| | |
| See Notes to Financial Statements. | | |
| Annual Report | September 30, 2013 | | 53 |
| | |
| RiverNorth/DoubleLine Strategic Income Fund | | Schedule of Investments |
| | September 30, 2013 |
| | | | | | | | | | |
| Principal Amount/Description | | Rate | | Maturity | | Value | |
$788,145 | | Deutsche Alt-A Securities, Inc. Mortgage Loan Trust Series 2005-6(a) | | 4.90% | | 12/25/2035 | | $ | 108,599 | |
361,356 | | Series 2005-6(a) | | 1.58% | | 12/25/2035 | | | 250,549 | |
4,743,135 | | Series 2007-1(a) | | 0.32% | | 08/25/2037 | | | 3,636,486 | |
273,158 | | Deutsche Mortgage Securities, Inc. Mortgage Loan Trust Series 2006-PR1(a)(b) | | 11.87% | | 04/15/2036 | | | 324,877 | |
209,436 | | First Horizon Alternative Mortgage Securities Trust Series 2005-FA6 | | 5.50% | | 09/25/2035 | | | 185,717 | |
213,034 | | Series 2006-FA7 | | 6.25% | | 12/25/2036 | | | 185,436 | |
360,346 | | Series 2007-FA2 | | 6.00% | | 04/25/2037 | | | 275,327 | |
5,302,762 | | First Horizon Mortgage Pass-Through Trust Series 2007-AR3(a) | | 2.44% | | 11/25/2037 | | | 4,555,582 | |
800,000 | | Fontainebleau Miami Beach Trust Series 2012-FBLU(b) | | 4.27% | | 05/05/2017 | | | 826,697 | |
300,000 | | Series 2012-FBLU(b) | | 5.25% | | 05/05/2017 | | | 312,061 | |
200,000 | | GMAC Commercial Mortgage Securities, Inc. Series 2006-C1(a) | | 5.29% | | 11/10/2045 | | | 212,909 | |
16,944,065 | | GS Mortgage Securities Trust Series 2006-GG6(a)(b) | | 0.22% | | 04/10/2038 | | | 21,672 | |
578,478 | | Series 2011-GC3(a)(b) | | 1.27% | | 03/10/2021 | | | 25,028 | |
3,895,962 | | Series 2011-GC5(a)(b) | | 1.90% | | 08/10/2044 | | | 292,840 | |
531,768 | | GSAA Home Equity Trust Series 2005-7(a) | | 4.48% | | 05/25/2035 | | | 524,384 | |
795,187 | | Series 2006-18(e) | | 5.68% | | 11/25/2036 | | | 443,375 | |
265,324 | | Series 2006-6(a) | | 4.96% | | 03/25/2036 | | | 159,037 | |
1,376,215 | | Series 2007-2(e) | | 6.10% | | 03/25/2037 | | | 816,352 | |
4,091,833 | | Series 2007-8(a) | | 0.53% | | 08/25/2037 | | | 3,362,603 | |
1,876,786 | | GSR Mortgage Loan Trust Series 2005-AR4(a) | | 5.25% | | 07/25/2035 | | | 1,866,368 | |
4,948,154 | | Series 2006-2F | | 5.25% | | 02/25/2036 | | | 4,318,754 | |
3,518,940 | | Series 2007-AR2(a) | | 2.87% | | 05/25/2037 | | | 2,930,914 | |
518,751 | | HSI Asset Loan Obligation Trust Series 2007-2 | | 5.50% | | 09/25/2037 | | | 521,319 | |
3,933,850 | | IndyMac IMJA Mortgage Loan Trust Series 2007-A1 | | 6.00% | | 08/25/2037 | | | 3,409,307 | |
6,144,778 | | IndyMac IMSC Mortgage Loan Trust Series 2007-F2 | | 6.50% | | 07/25/2037 | | | 3,656,284 | |
7,632,670 | | IndyMac Index Mortgage Loan Trust Series 2005-AR31(a) | | 2.54% | | 01/25/2036 | | | 6,400,558 | |
| | |
| See Notes to Financial Statements. | | |
| 54 | | (888) 848-7569 | www.rivernorthfunds.com |
| | |
| RiverNorth/DoubleLine Strategic Income Fund | | Schedule of Investments |
| | September 30, 2013 |
| | | | | | | | | | |
| Principal Amount/Description | | Rate | | Maturity | | Value | |
$3,015,164 | | Series 2005-AR35(a) | | 4.98% | | 02/25/2036 | | $ | 2,492,344 | |
7,996,810 | | Series 2006-AR25(a) | | 2.73% | | 09/25/2036 | | | 5,773,521 | |
1,810,936 | | Series 2007-FLX1(a) | | 0.36% | | 02/25/2037 | | | 1,710,690 | |
759,813 | | JP Morgan Alternative Loan Trust Series 2005-S1 | | 6.00% | | 12/25/2035 | | | 667,791 | |
232,374 | | Series 2006-S1 | | 5.00% | | 02/25/2021 | | | 224,116 | |
2,095,242 | | Series 2006-S3(e) | | 6.12% | | 08/25/2036 | | | 1,946,105 | |
7,488,519 | | JP Morgan Chase Commercial Mortgage Securities Corp. Series 2006-LDP8(a) | | 0.73% | | 05/15/2045 | | | 109,617 | |
1,100,000 | | Series 2007-CB19(a) | | 5.90% | | 05/12/2017 | | | 1,181,358 | |
4,000,000 | | Series 2007-CH1(e) | | 5.31% | | 05/25/2015 | | | 3,584,316 | |
900,000 | | Series 2007-LD12(a) | | 6.20% | | 08/15/2017 | | | 985,646 | |
8,698,685 | | Series 2012-C8(a) | | 2.21% | | 09/15/2022 | | | 1,038,084 | |
1,000,000 | | Series 2012-PHH(a)(b) | | 1.85% | | 10/15/2014 | | | 1,005,937 | |
500,000 | | JP Morgan Mortgage Acquisition Corp. Series 2006-CH2(e) | | 5.46% | | 10/25/2036 | | | 382,371 | |
473,524 | | JP Morgan Mortgage Trust Series 2007-S3 | | 6.00% | | 07/25/2037 | | | 415,098 | |
2,634,440 | | Series 2007-S3 | | 6.00% | | 08/25/2037 | | | 2,309,390 | |
3,634,424 | | JP Morgan Resecuritization Trust Series 2011-1(a)(b) | | 6.52% | | 06/26/2037 | | | 3,064,824 | |
4,622,294 | | LB-UBS Commercial Mortgage Trust Series 2006-C7(a)(b) | | 0.33% | | 11/15/2038 | | | 81,745 | |
3,466,721 | | Series 2006-C7(a)(b) | | 0.85% | | 11/15/2038 | | | 64,093 | |
1,000,000 | | Series 2007-C1 | | 5.48% | | 02/15/2040 | | | 1,004,839 | |
1,438,253 | | Lehman Mortgage Trust Series 2006-6 | | 5.50% | | 10/25/2036 | | | 1,169,350 | |
4,337,803 | | Series 2006-7(a) | | 0.43% | | 11/25/2036 | | | 477,840 | |
4,337,803 | | Series 2006-7(a) | | 7.57% | | 11/25/2036 | | | 1,055,984 | |
2,663,201 | | Series 2006-8(a) | | 0.60% | | 12/25/2036 | | | 1,229,371 | |
2,663,201 | | Series 2006-8(a) | | 6.40% | | 12/25/2036 | | | 692,432 | |
3,210,569 | | Series 2007-10 | | 6.00% | | 01/25/2038 | | | 3,017,078 | |
804,101 | | Series 2007-10 | | 6.50% | | 01/25/2038 | | | 723,243 | |
1,303,234 | | Lehman XS Trust Series 2006-5(e) | | 5.89% | | 04/25/2036 | | | 1,184,781 | |
183,265 | | MASTR Asset Securitization Trust Series 2003-1 | | 5.75% | | 02/25/2033 | | | 183,334 | |
244,188 | | Series 2003-2 | | 5.75% | | 04/25/2033 | | | 244,176 | |
41,956 | | ML-CFC Commercial Mortgage Trust Series 2007-8(a) | | 6.03% | | 08/12/2049 | | | 43,355 | |
4,928,789 | | Morgan Stanley Bank of America Merrill Lynch Trust Series 2012-C5(a)(b) | | 2.05% | | 07/15/2022 | | | 487,891 | |
| | |
| See Notes to Financial Statements. | | |
| Annual Report | September 30, 2013 | | 55 |
| | |
| RiverNorth/DoubleLine Strategic Income Fund | | Schedule of Investments |
| | September 30, 2013 |
| | | | | | | | | | |
| Principal Amount/Description | | Rate | | Maturity | | Value | |
$95,000 | | Morgan Stanley Capital I Trust Series 2005-HQ7(a) | | 5.38% | | 11/14/2042 | | $ | 101,082 | |
1,000,000 | | Series 2006-HQ8(a) | | 5.68% | | 03/12/2044 | | | 1,011,400 | |
1,000,000 | | Series 2007-HQ11(a) | | 5.51% | | 02/12/2044 | | | 1,059,816 | |
33,466 | | Series 2007-HQ12(a) | | 0.49% | | 04/12/2049 | | | 32,919 | |
900,000 | | Series 2007-IQ13 | | 5.41% | | 03/15/2017 | | | 966,441 | |
9,653,345 | | Series 2011-C1(a)(b) | | 1.11% | | 09/15/2047 | | | 255,312 | |
6,714,740 | | Morgan Stanley Mortgage Loan Trust Series 2005-3AR(a) | | 2.71% | | 07/25/2035 | | | 5,432,010 | |
390,728 | | Series 2006-11 | | 6.00% | | 08/25/2036 | | | 310,804 | |
2,445,118 | | Series 2006-7(a) | | 5.49% | | 06/25/2036 | | | 2,064,428 | |
2,120,855 | | Series 2006-7 | | 6.00% | | 06/25/2036 | | | 1,773,196 | |
706,620 | | Series 2007-3XS(e) | | 5.70% | | 01/25/2047 | | | 486,781 | |
750,000 | | Morgan Stanley Re-REMIC Trust Series 2010-HQ4(b) | | 4.97% | | 04/15/2040 | | | 771,980 | |
787,269 | | Series 2011-R1(a)(b) | | 5.94% | | 02/26/2037 | | | 845,987 | |
2,000,000 | | Nomura Asset Acceptance Corp. Alternative Loan Trust Series 2005-AP3(a) | | 5.32% | | 08/25/2035 | | | 1,534,732 | |
3,491,864 | | PHH Alternative Mortgage Trust Series 2007-2 | | 6.00% | | 05/25/2037 | | | 2,858,007 | |
267,993 | | Prime Mortgage Trust Series 2006-1 | | 5.50% | | 06/25/2036 | | | 241,880 | |
154,526 | | Series 2006-DR1(b) | | 5.50% | | 05/25/2035 | | | 148,334 | |
538,593 | | RBSGC Structured Trust Series 2008-B(b) | | 6.00% | | 06/25/2037 | | | 491,814 | |
604,626 | | Residential Accredit Loans, Inc. Series 2004-QS15 | | 5.25% | | 11/25/2034 | | | 622,954 | |
4,505,467 | | Series 2005-QS17 | | 6.00% | | 12/25/2035 | | | 3,729,553 | |
8,012,007 | | Series 2006-QA5(a) | | 0.40% | | 07/25/2036 | | | 5,093,409 | |
769,320 | | Series 2006-QS4 | | 6.00% | | 04/25/2036 | | | 614,494 | |
2,438,619 | | Series 2006-QS6 | | 6.00% | | 06/25/2036 | | | 1,918,886 | |
1,737,538 | | Series 2006-QS6 | | 6.00% | | 06/25/2036 | | | 1,367,223 | |
235,205 | | Series 2006-QS7(a) | | 0.58% | | 06/25/2036 | | | 149,574 | |
705,616 | | Series 2006-QS7(a) | | 5.42% | | 06/25/2036 | | | 99,240 | |
4,473,975 | | Series 2006-QS7 | | 6.00% | | 06/25/2036 | | | 3,508,795 | |
888,269 | | Series 2006-QS8(a) | | 5.37% | | 08/25/2036 | | | 122,175 | |
296,090 | | Series 2006-QS8(a) | | 0.63% | | 08/25/2036 | | | 183,871 | |
5,734,745 | | Series 2007-QS3 | | 6.50% | | 02/25/2037 | | | 4,602,637 | |
181,302 | | Series 2007-QS6 | | 6.25% | | 04/25/2037 | | | 149,269 | |
25,545 | | Series 2007-QS6(a) | | 53.51% | | 04/25/2037 | | | 53,821 | |
467,391 | | Series 2008-QR1 | | 6.00% | | 08/25/2036 | | | 306,032 | |
| | |
| See Notes to Financial Statements. | | |
| 56 | | (888) 848-7569 | www.rivernorthfunds.com |
| | |
| RiverNorth/DoubleLine Strategic Income Fund | | Schedule of Investments |
| | September 30, 2013 |
| | | | | | | | | | |
| Principal Amount/Description | | Rate | | Maturity | | Value | |
$98,137 | | Residential Asset Mortgage Products, Inc. Series 2004-RS4(a) | | 5.07% | | 04/25/2034 | | $ | 101,405 | |
1,652,007 | | Series 2006-RS5(a) | | 0.35% | | 09/25/2036 | | | 1,558,187 | |
2,500,000 | | Residential Asset Securities Corp. Series 2004-KS6(a) | | 5.67% | | 07/25/2034 | | | 2,674,137 | |
980,260 | | Series 2005-KS4(a) | | 0.59% | | 05/25/2035 | | | 967,001 | |
6,912,659 | | Series 2006-EMX6(a) | | 0.33% | | 05/25/2036 | | | 5,868,785 | |
3,752,245 | | Series 2007-KS4(a) | | 0.36% | | 05/25/2037 | | | 3,608,069 | |
967,924 | | Residential Asset Securitization Trust Series 2006-A1 | | 6.00% | | 04/25/2036 | | | 800,978 | |
1,958,115 | | Series 2006-A2 | | 6.00% | | 05/25/2036 | | | 1,497,858 | |
1,329,390 | | Series 2006-A6 | | 6.50% | | 07/25/2036 | | | 870,299 | |
9,209,537 | | Series 2006-A7CB | | 6.25% | | 07/25/2036 | | | 8,202,897 | |
474,185 | | Series 2006-A8(a) | | 5.72% | | 08/25/2036 | | | 99,984 | |
926,035 | | Series 2006-A8 | | 6.00% | | 08/25/2036 | | | 823,365 | |
223,957 | | Series 2006-A8 | | 6.50% | | 08/25/2036 | | | 147,870 | |
2,884,250 | | Series 2007-A1 | | 6.00% | | 03/25/2037 | | | 2,250,240 | |
5,221,525 | | Series 2007-A2 | | 6.00% | | 04/25/2037 | | | 4,626,595 | |
188,566 | | Series 2007-A6 | | 6.00% | | 06/25/2037 | | | 164,412 | |
4,695,781 | | Series 2007-A7 | | 6.00% | | 07/25/2037 | | | 3,712,255 | |
2,872,826 | | Residential Funding Mortgage Securities I, Inc. Series 2006-S3 | | 5.50% | | 03/25/2036 | | | 2,551,586 | |
720,374 | | Series 2006-S6 | | 6.00% | | 07/25/2036 | | | 651,398 | |
5,104,700 | | Series 2006-S6 | | 6.00% | | 07/25/2036 | | | 4,615,920 | |
1,203,861 | | Series 2007-S3 | | 6.00% | | 03/25/2037 | | | 1,144,234 | |
1,003,789 | | Series 2007-S6 | | 6.00% | | 06/25/2037 | | | 897,890 | |
837,758 | | RREF 2013 LT2 LLC Series 2013-LT2 A(b) | | 2.83% | | 12/20/2015 | | | 837,564 | |
5,729,428 | | Sequoia Mortgage Trust Series 2007-3(a) | | 2.46% | | 07/20/2037 | | | 4,530,620 | |
232,662 | | SMA Issuer I LLC Series 2012-LV1(b) | | 3.50% | | 09/20/2014 | | | 233,105 | |
2,203,434 | | Structured Adjustable Rate Mortgage Loan Trust Series 2005-15(a) | | 2.53% | | 07/25/2035 | | | 1,802,059 | |
462,128 | | Structured Asset Securities Corp. Series 2005-RF1(a)(b) | | 0.53% | | 03/25/2035 | | | 377,942 | |
462,128 | | Series 2005-RF1(a)(b) | | 5.32% | | 03/25/2035 | | | 70,756 | |
1,972,924 | | TBW Mortgage-Backed Trust Series 2006-2 | | 7.00% | | 07/25/2036 | | | 874,408 | |
| | |
| See Notes to Financial Statements. | | |
| Annual Report | September 30, 2013 | | 57 |
| | |
| RiverNorth/DoubleLine Strategic Income Fund | | Schedule of Investments |
| | September 30, 2013 |
| | | | | | | | | | |
| Principal Amount/Description | | Rate | | Maturity | | Value | |
$250,000 | | TIAA Seasoned Commercial Mortgage Trust Series 2007-C4(a) | | 5.55% | | 08/15/2039 | | $ | 271,364 | |
17,001,003 | | Wachovia Bank Commercial Mortgage Trust Series 2006-C27(a)(b) | | 0.46% | | 07/15/2045 | | | 146,464 | |
1,592,491 | | Series 2006-C29(a) | | 0.53% | | 11/15/2048 | | | 19,921 | |
900,000 | | Series 2007-C33(a) | | 6.12% | | 07/15/2017 | | | 989,978 | |
4,656,702 | | Washington Mutual Alternative Mortgage Pass-Through Certificates Series 2005-1 | | 6.00% | | 03/25/2035 | | | 4,587,271 | |
171,352 | | Series 2005-9 | | 5.50% | | 11/25/2035 | | | 137,074 | |
1,170,182 | | Series 2006-5 | | 6.00% | | 07/25/2036 | | | 858,395 | |
2,903,575 | | Wells Fargo Alternative Loan Trust Series 2007-PA2 | | 6.00% | | 06/25/2037 | | | 2,635,161 | |
1,959,870 | | Series 2007-PA2(a) | | 0.61% | | 06/25/2037 | | | 1,303,764 | |
1,959,870 | | Series 2007-PA2(a) | | 5.89% | | 06/25/2037 | | | 334,203 | |
828,625 | | Series 2007-PA3 | | 5.75% | | 07/25/2037 | | | 746,842 | |
7,719,629 | | Wells Fargo Mortgage-Backed Securities Trust Series 2005-12 | | 5.50% | | 11/25/2035 | | | 7,769,096 | |
2,180,221 | | Series 2006-11 | | 6.00% | | 09/25/2036 | | | 2,113,809 | |
593,521 | | Series 2006-2 | | 5.50% | | 03/25/2036 | | | 554,380 | |
259,506 | | Series 2006-2 | | 5.75% | | 03/25/2036 | | | 257,363 | |
827,121 | | Series 2007-10 | | 6.00% | | 07/25/2037 | | | 785,488 | |
2,254,060 | | Series 2007-13 | | 6.00% | | 09/25/2037 | | | 2,259,521 | |
2,564,189 | | Series 2007-14 | | 6.00% | | 10/25/2037 | | | 2,573,105 | |
2,238,044 | | Series 2007-2 | | 6.00% | | 03/25/2037 | | | 2,101,636 | |
1,099,103 | | Series 2007-5 | | 5.50% | | 05/25/2037 | | | 1,133,981 | |
1,635,945 | | Series 2007-8 | | 6.00% | | 07/25/2037 | | | 1,562,260 | |
4,922,228 | | WF-RBS Commercial Mortgage Trust Series 2012-C9(a)(b) | | 2.43% | | 11/15/2045 | | | 634,131 | |
| | | | | | | | | | |
| | | |
TOTAL NON-AGENCY COLLATERALIZED MORTGAGE OBLIGATIONS (Cost $289,316,038) | | | | | | | 320,666,828 | |
| | | | | | | | | | |
| | | |
| U.S. GOVERNMENT BONDS AND NOTES - 3.84% | | | | | | | | |
9,300,000 | | U.S. Treasury Bonds | | 1.63% | | 08/15/2022 | | | 8,668,613 | |
2,000,000 | | U.S. Treasury Bonds | | 4.25% | | 05/15/2039 | | | 2,220,468 | |
4,600,000 | | U.S. Treasury Bonds | | 3.75% | | 08/15/2041 | | | 4,675,109 | |
7,850,000 | | U.S. Treasury Notes | | 0.25% | | 05/31/2014 | | | 7,858,737 | |
6,900,000 | | U.S. Treasury Notes | | 1.50% | | 08/31/2018 | | | 6,948,245 | |
2,950,000 | | U.S. Treasury Notes | | 1.00% | | 08/31/2019 | | | 2,831,540 | |
| | |
| See Notes to Financial Statements. | | |
| 58 | | (888) 848-7569 | www.rivernorthfunds.com |
| | |
| RiverNorth/DoubleLine Strategic Income Fund | | Schedule of Investments |
| | September 30, 2013 |
| | | | | | | | | | |
| Principal Amount/Description | | Rate | | Maturity | | Value | |
$7,450,000 | | U.S. Treasury Notes | | 1.88% | | 06/30/2020 | | $ | 7,417,987 | |
| | | | | | | | | | |
| | | |
TOTAL U.S. GOVERNMENT BONDS AND NOTES (Cost $41,771,403) | | | | | | | 40,620,699 | |
| | | | | | | | | | |
| | | |
| MUNICIPAL BONDS - 0.28% | | | | | | | | |
1,200,000 | | City of New York NY | | 5.00% | | 04/01/2027 | | | 1,324,788 | |
1,350,000 | | New York State Dormitory Authority | | 5.50% | | 03/15/2027 | | | 1,642,518 | |
| | | | | | | | | | |
| | | |
TOTAL MUNICIPAL BONDS (Cost $2,829,577) | | | | | | | 2,967,306 | |
| | | | | | | | | | |
| | | |
| U.S. GOVERNMENT / AGENCY MORTGAGE BACKED SECURITIES - 15.96% | | | | | | | | |
1,131,005 | | Federal Home Loan Mortgage Corp. Pool Series Pool #G01840 | | 5.00% | | 07/01/2035 | | | 1,227,646 | |
396,308 | | Series Pool #G04587 | | 5.50% | | 08/01/2038 | | | 429,368 | |
521,300 | | Series Pool #G04817 | | 5.00% | | 09/01/2038 | | | 561,926 | |
3,813,947 | | Federal Home Loan Mortgage Corp. REMICS Series 2003-2722(a) | | 9.69% | | 12/15/2033 | | | 4,594,536 | |
1,003,646 | | Series 2005-R003 | | 5.50% | | 10/15/2035 | | | 1,097,939 | |
4,923,502 | | Series 2006-3244(a) | | 6.48% | | 11/15/2036 | | | 849,959 | |
270,242 | | Series 2007-3261(a) | | 6.25% | | 01/15/2037 | | | 43,706 | |
2,442,871 | | Series 2007-3262(a) | | 6.22% | | 01/15/2037 | | | 307,780 | |
3,723,976 | | Series 2007-3301(a) | | 5.92% | | 04/15/2037 | | | 433,966 | |
5,507,787 | | Series 2007-3303(a) | | 5.90% | | 04/15/2037 | | | 601,037 | |
2,920,796 | | Series 2007-3303(a) | | 5.92% | | 04/15/2037 | | | 385,650 | |
3,094,108 | | Series 2007-3382(a) | | 5.82% | | 11/15/2037 | | | 340,646 | |
2,915,309 | | Series 2007-3384(a) | | 6.13% | | 08/15/2036 | | | 338,811 | |
2,146,642 | | Series 2007-3384(a) | | 6.21% | | 11/15/2037 | | | 258,127 | |
2,139,323 | | Series 2008-3417(a) | | 6.00% | | 02/15/2038 | | | 234,438 | |
13,258,852 | | Series 2008-3419(a) | | 6.25% | | 02/15/2038 | | | 1,995,762 | |
61,235,639 | | Series 2008-3423(a) | | 0.35% | | 03/15/2038 | | | 472,678 | |
2,801,884 | | Series 2008-3423(a) | | 5.47% | | 03/15/2038 | | | 307,540 | |
5,449,921 | | Series 2009-3510(a) | | 6.57% | | 02/15/2037 | | | 950,085 | |
1,958,070 | | Series 2009-3523(a) | | 5.82% | | 04/15/2039 | | | 236,496 | |
343,283 | | Series 2009-3524(a) | | 5.37% | | 06/15/2038 | | | 351,684 | |
228,307 | | Series 2009-3549(a) | | 5.62% | | 07/15/2039 | | | 25,451 | |
3,733,193 | | Series 2009-3560(a) | | 6.22% | | 11/15/2036 | | | 537,781 | |
1,710,064 | | Series 2010-3630(a) | | 1.93% | | 03/15/2017 | | | 65,750 | |
1,465,893 | | Series 2010-3641 | | 4.50% | | 03/15/2040 | | | 1,556,148 | |
449,946 | | Series 2010-3688 | | 4.00% | | 07/15/2029 | | | 463,361 | |
| | |
| See Notes to Financial Statements. | | |
| Annual Report | September 30, 2013 | | 59 |
| | |
| RiverNorth/DoubleLine Strategic Income Fund | | Schedule of Investments |
| | September 30, 2013 |
| | | | | | | | | | |
| Principal Amount/Description | | Rate | | Maturity | | Value | |
$2,371,022 | | Series 2010-3726(a) | | 5.87% | | 09/15/2040 | | $ | 316,045 | |
12,588,918 | | Series 2010-3728(a) | | 4.27% | | 09/15/2040 | | | 1,437,906 | |
32,446 | | Series 2010-3745(a) | | 9.64% | | 10/15/2040 | | | 32,736 | |
146,023 | | Series 2010-3766(a) | | 9.64% | | 11/15/2040 | | | 148,793 | |
250,000 | | Series 2010-3779 | | 4.00% | | 12/15/2030 | | | 259,114 | |
750,000 | | Series 2010-3779 | | 3.50% | | 12/15/2030 | | | 732,491 | |
453,893 | | Series 2010-3779 | | 4.50% | | 12/15/2040 | | | 453,880 | |
140,797 | | Series 2011-3786(a) | | 9.14% | | 01/15/2041 | | | 139,971 | |
1,112,366 | | Series 2011-3795 | | 4.00% | | 01/15/2041 | | | 1,112,909 | |
194,113 | | Series 2011-3798(a) | | 9.14% | | 11/15/2040 | | | 192,811 | |
42,271 | | Series 2011-3805(a) | | 9.14% | | 02/15/2041 | | | 42,636 | |
600,000 | | Series 2011-3808 | | 3.50% | | 02/15/2031 | | | 595,456 | |
61,547 | | Series 2011-3809(a) | | 9.13% | | 02/15/2041 | | | 60,507 | |
4,176,921 | | Series 2011-3815(a) | | 5.67% | | 02/15/2041 | | | 465,735 | |
500,000 | | Series 2011-3824 | | 3.50% | | 03/15/2031 | | | 495,782 | |
2,000,000 | | Series 2011-3824(a) | | 6.92% | | 08/15/2036 | | | 369,304 | |
676,934 | | Series 2011-3857(a) | | 8.90% | | 05/15/2041 | | | 714,098 | |
1,451,982 | | Series 2011-3863 | | 5.50% | | 08/15/2034 | | | 1,633,200 | |
913,427 | | Series 2011-3864(a) | | 8.83% | | 05/15/2041 | | | 880,568 | |
1,131,413 | | Series 2011-3871 | | 5.50% | | 06/15/2041 | | | 1,284,535 | |
4,142,875 | | Series 2011-3872(a) | | 5.77% | | 06/15/2041 | | | 459,722 | |
1,962,677 | | Series 2011-3888 | | 4.00% | | 07/15/2041 | | | 2,008,315 | |
3,086,189 | | Series 2011-3894 | | 4.50% | | 07/15/2041 | | | 3,315,774 | |
2,219,091 | | Series 2011-3910 | | 5.00% | | 08/15/2041 | | | 2,411,763 | |
46,615 | | Series 2011-3924(a) | | 9.19% | | 09/15/2041 | | | 46,811 | |
4,564,918 | | Series 2011-3924(a) | | 5.82% | | 09/15/2041 | | | 542,919 | |
4,942,861 | | Series 2011-3925 | | 3.00% | | 09/15/2021 | | | 391,776 | |
3,153,551 | | Series 2012-4057 | | 4.00% | | 06/15/2042 | | | 2,961,153 | |
9,748,103 | | Series 2013-4196(a) | | 5.18% | | 03/15/2043 | | | 7,405,292 | |
7,573,387 | | Federal Home Loan Mortgage Corp. Strips Series 2012-269 | | 3.00% | | 08/15/2049 | | | 7,567,526 | |
311,677 | | Federal National Mortgage Association Pool Series Pool #555743 | | 5.00% | | 09/01/2033 | | | 339,639 | |
378,430 | | Series Pool #735382 | | 5.00% | | 04/01/2035 | | | 411,520 | |
982,567 | | Series Pool #735383 | | 5.00% | | 04/01/2035 | | | 1,068,392 | |
708,361 | | Series Pool #735484 | | 5.00% | | 05/01/2035 | | | 770,221 | |
220,274 | | Series Pool #AH4437 | | 4.00% | | 01/01/2041 | | | 228,598 | |
2,637,109 | | Series Pool #AK4039 | | 4.00% | | 02/01/2042 | | | 2,737,040 | |
1,150,530 | | Series Pool #MA0264 | | 4.50% | | 12/01/2029 | | | 1,246,903 | |
660,959 | | Series Pool #MA0871 | | 4.00% | | 10/01/2041 | | | 686,174 | |
1,303,645 | | Series Pool #MA1068 | | 3.50% | | 05/01/2042 | | | 1,314,897 | |
2,219,722 | | Series Pool #MA1117 | | 3.50% | | 07/01/2042 | | | 2,238,923 | |
| | |
| See Notes to Financial Statements. | | |
| 60 | | (888) 848-7569 | www.rivernorthfunds.com |
| | |
| RiverNorth/DoubleLine Strategic Income Fund | | Schedule of Investments |
| | September 30, 2013 |
| | | | | | | | | | |
| Principal Amount/Description | | Rate | | Maturity | | Value | |
$2,719,772 | | Series Pool #MA1275 | | 3.00% | | 12/01/2032 | | $ | 2,723,835 | |
2,608,326 | | Series Pool #MA3894 | | 4.00% | | 09/01/2031 | | | 2,792,709 | |
4,961,616 | | Federal National Mortgage Association REMICS Series 2003-92 | | 5.00% | | 09/25/2033 | | | 5,386,152 | |
389,830 | | Series 2004-46(a) | | 5.82% | | 03/25/2034 | | | 47,454 | |
2,470,483 | | Series 2005-104(a) | | 6.52% | | 12/25/2033 | | | 241,337 | |
1,020,648 | | Series 2006-101(a) | | 6.40% | | 10/25/2036 | | | 169,415 | |
2,890,092 | | Series 2006-123(a) | | 6.14% | | 01/25/2037 | | | 478,206 | |
594,432 | | Series 2007-102(a) | | 6.22% | | 11/25/2037 | | | 84,381 | |
1,306,320 | | Series 2007-108(a) | | 6.18% | | 12/25/2037 | | | 164,165 | |
173,703 | | Series 2007-30(a) | | 5.93% | | 04/25/2037 | | | 18,767 | |
2,318,785 | | Series 2007-38(a) | | 5.90% | | 05/25/2037 | | | 244,205 | |
187,874 | | Series 2007-51(a) | | 5.92% | | 06/25/2037 | | | 20,141 | |
359,602 | | Series 2007-53(a) | | 5.92% | | 06/25/2037 | | | 37,000 | |
2,462,732 | | Series 2007-57(a) | | 6.44% | | 10/25/2036 | | | 405,031 | |
2,510,137 | | Series 2007-68(a) | | 6.47% | | 07/25/2037 | | | 278,068 | |
1,562,276 | | Series 2008-14 | | 5.50% | | 03/25/2038 | | | 1,711,914 | |
3,153,788 | | Series 2008-3(a) | | 6.28% | | 02/25/2038 | | | 419,892 | |
2,359,843 | | Series 2008-56(a) | | 5.88% | | 07/25/2038 | | | 266,988 | |
1,009,565 | | Series 2008-81 | | 5.50% | | 09/25/2038 | | | 1,108,255 | |
2,755,782 | | Series 2009-111 | | 5.00% | | 01/25/2040 | | | 2,980,185 | |
2,466,546 | | Series 2009-111(a) | | 6.07% | | 01/25/2040 | | | 286,312 | |
3,140,869 | | Series 2009-12(a) | | 6.42% | | 03/25/2036 | | | 705,097 | |
308,448 | | Series 2009-28(a) | | 5.82% | | 04/25/2037 | | | 31,517 | |
1,560,134 | | Series 2009-41 | | 4.50% | | 06/25/2039 | | | 1,630,685 | |
1,244,901 | | Series 2009-42(a) | | 5.82% | | 06/25/2039 | | | 124,897 | |
2,951,569 | | Series 2009-47(a) | | 5.92% | | 07/25/2039 | | | 286,878 | |
1,785,171 | | Series 2009-62(a) | | 5.92% | | 08/25/2039 | | | 226,560 | |
640,073 | | Series 2009-66(a) | | 5.62% | | 02/25/2038 | | | 69,738 | |
788,362 | | Series 2009-68(a) | | 5.07% | | 09/25/2039 | | | 69,302 | |
18,497 | | Series 2010-109(a) | | 52.99% | | 10/25/2040 | | | 68,383 | |
4,005,022 | | Series 2010-11(a) | | 4.62% | | 02/25/2040 | | | 337,816 | |
624,103 | | Series 2010-111(a) | | 5.82% | | 10/25/2040 | | | 63,594 | |
563,636 | | Series 2010-112 | | 4.00% | | 10/25/2040 | | | 594,909 | |
1,800,494 | | Series 2010-115(a) | | 6.42% | | 11/25/2039 | | | 200,642 | |
5,946,014 | | Series 2010-115(a) | | 5.82% | | 10/25/2040 | | | 1,125,325 | |
3,868,909 | | Series 2010-15(a) | | 4.77% | | 03/25/2040 | | | 354,009 | |
649,469 | | Series 2010-34(a) | | 4.75% | | 04/25/2040 | | | 59,172 | |
266,217 | | Series 2010-4(a) | | 6.05% | | 02/25/2040 | | | 43,742 | |
672,024 | | Series 2010-58(a) | | 12.01% | | 06/25/2040 | | | 732,858 | |
2,612,887 | | Series 2010-75 | | 4.50% | | 07/25/2040 | | | 2,750,119 | |
4,015,797 | | Series 2010-9(a) | | 4.57% | | 02/25/2040 | | | 331,207 | |
599,079 | | Series 2010-9(a) | | 5.12% | | 02/25/2040 | | | 51,565 | |
| | |
| See Notes to Financial Statements. | | |
| Annual Report | September 30, 2013 | | 61 |
| | |
| RiverNorth/DoubleLine Strategic Income Fund | | Schedule of Investments |
| | September 30, 2013 |
| | | | | | | | | | |
| Principal Amount/Description | | Rate | | Maturity | | Value | |
$169,212 | | Series 2010-90(a) | | 5.82% | | 08/25/2040 | | $ | 17,823 | |
500,000 | | Series 2011-16 | | 3.50% | | 03/25/2031 | | | 504,760 | |
2,780,915 | | Series 2011-2 | | 4.00% | | 02/25/2041 | | | 2,815,054 | |
1,000,000 | | Series 2011-25 | | 3.00% | | 04/25/2026 | | | 1,010,147 | |
500,000 | | Series 2011-29 | | 3.50% | | 04/25/2031 | | | 504,852 | |
1,200,000 | | Series 2011-48(a) | | 8.84% | | 06/25/2041 | | | 1,210,382 | |
3,511,448 | | Series 2011-5(a) | | 6.22% | | 11/25/2040 | | | 407,655 | |
4,026,419 | | Series 2011-58(a) | | 6.37% | | 07/25/2041 | | | 712,205 | |
1,295,706 | | Series 2011-72 | | 5.50% | | 04/25/2037 | | | 1,442,731 | |
14,535,481 | | Series 2012-106(a) | | 5.98% | | 10/25/2042 | | | 2,102,165 | |
2,357,952 | | Series 2012-124(a) | | 7.47% | | 11/25/2042 | | | 2,085,646 | |
776,204 | | Series 2012-140(a) | | 7.56% | | 12/25/2042 | | | 698,535 | |
6,168,336 | | Series 2012-144(a) | | 4.44% | | 11/25/2049 | | | 6,706,190 | |
8,455,165 | | Series 2012-20 | | 3.50% | | 03/25/2042 | | | 7,869,924 | |
4,504,248 | | Series 2012-29(a) | | 5.82% | | 04/25/2042 | | | 531,064 | |
3,379,403 | | Series 2012-32 | | 5.00% | | 04/25/2042 | | | 605,741 | |
755,522 | | Series 2012-55(a) | | 6.64% | | 05/25/2042 | | | 714,409 | |
12,920,191 | | Series 2012-65(a) | | 5.80% | | 06/25/2042 | | | 1,864,422 | |
4,560,939 | | Series 2012-92 | | 3.50% | | 08/25/2042 | | | 3,864,324 | |
7,501,561 | | Series 2013-19(a) | | 5.19% | | 03/25/2043 | | | 5,826,650 | |
9,646,208 | | Series 2013-51(a) | | 5.19% | | 04/25/2043 | | | 7,460,011 | |
212,159 | | Government National Mortgage Association Series 2004-83(a) | | 5.90% | | 10/20/2034 | | | 25,914 | |
235,743 | | Series 2008-6(a) | | 6.28% | | 02/20/2038 | | | 32,594 | |
224,511 | | Series 2008-67(a) | | 5.82% | | 08/20/2038 | | | 26,667 | |
3,394,986 | | Series 2008-69(a) | | 7.45% | | 08/20/2038 | | | 613,732 | |
191,624 | | Series 2009-10(a) | | 6.47% | | 02/16/2039 | | | 35,993 | |
2,429,736 | | Series 2009-35 | | 4.50% | | 05/20/2039 | | | 2,641,133 | |
251,325 | | Series 2009-6(a) | | 5.77% | | 02/20/2038 | | | 30,535 | |
4,273,134 | | Series 2009-75 | | 5.00% | | 09/20/2039 | | | 4,711,310 | |
12,460,818 | | Series 2010-26(a) | | 6.07% | | 02/20/2040 | | | 2,367,568 | |
413,398 | | Series 2010-61(a) | | 6.37% | | 09/20/2039 | | | 55,963 | |
2,557,808 | | Series 2010-98(a) | | 5.93% | | 03/20/2039 | | | 286,096 | |
42,600 | | Series 2011-12(f) | | 0.00% | | 12/20/2040 | | | 40,110 | |
2,797,092 | | Series 2011-45 | | 4.50% | | 03/20/2041 | | | 2,947,248 | |
3,238,942 | | Series 2011-69(f) | | 0.00% | | 05/20/2041 | | | 2,809,565 | |
2,220,985 | | Series 2011-71 | | 4.50% | | 02/20/2041 | | | 2,338,429 | |
5,815,843 | | Series 2011-71(a) | | 5.22% | | 05/20/2041 | | | 705,642 | |
1,774,989 | | Series 2011-72(a) | | 5.97% | | 05/20/2041 | | | 227,561 | |
8,983,975 | | Series 2011-89(a) | | 5.27% | | 06/20/2041 | | | 1,127,219 | |
| | |
| See Notes to Financial Statements. | | |
| 62 | | (888) 848-7569 | www.rivernorthfunds.com |
| | |
| RiverNorth/DoubleLine Strategic Income Fund | | Schedule of Investments |
| | September 30, 2013 |
| | | | | | | | | | |
| Principal Amount/Description | | Rate | | Maturity | | Value | |
$4,125,725 | | Series 2012-105(a) | | 6.02% | | 01/20/2041 | | $ | 742,560 | |
| | | | | | | | | | |
| | |
TOTAL U.S. GOVERNMENT / AGENCY MORTGAGE BACKED SECURITIES (Cost $190,880,800) | | | | | 168,633,062 | |
| | | | | | | | | | |
| | | |
| Shares/Description | | | | | | Value | |
SHORT-TERM INVESTMENTS - 3.98% | | | | | | | | |
42,042,618 | | Northern Institutional Government Select Portfolio, (7 Day Yield 0.01%) | | | | | | | 42,042,618 | |
| | | | | | | | | | |
| | | |
TOTAL SHORT-TERM INVESTMENTS (Cost $42,042,618) | | | | | | | 42,042,618 | |
| | | | | | | | | | |
| | | |
TOTAL INVESTMENTS - 99.33% (Cost $1,059,737,578) | | | | | | | 1,049,493,093 | |
OTHER ASSETS IN EXCESS OF LIABILITIES - 0.67% | | | | | | | 7,040,445 | |
| | | | | | | | | | |
NET ASSETS - 100.00% | | | | | | $ | 1,056,533,538 | |
| | | | | | | | | | |
| (a) | Floating or variable rate security. Interest rate disclosed is that which is in effect at September 30, 2013. |
| (b) | Security exempt from registration under Rule 144A of the Securities Act of 1933. These securities have been deemed liquid under procedures approved by the Fund’s Board of Trustees and may normally be sold to qualified institutional buyers in transactions exempt from registration. Total market value of Rule 144A securities amounts to $73,388,194, which represents approximately 6.95% of net assets as of September 30, 2013. |
| (c) | Securities were purchased pursuant to Regulation S under the Securities Act of 1933, which exempts securities offered and sold outside of the United States from registration. Such securities cannot be sold in the United States without either an effective registration statement filed pursuant to the Securities Act of 1933, or pursuant to an exemption from registration. These securities have been deemed liquid under procedures approved by the Fund’s Board of Trustees. As of September 30, 2013, the aggregate market value of those securities was $22,747,435, representing 2.15% of net assets. |
| (d) | This security has no contractual maturity date, is not redeemable and contractually pays an indefinite stream of interest. |
| (e) | Step bond. Coupon increases periodically based upon a predetermined schedule. Interest rate disclosed is that which is in effect at September 30, 2013. |
| (f) | Zero coupon bond reflects effective yield on the date of purchase. |
| | |
| See Notes to Financial Statements. | | |
| Annual Report | September 30, 2013 | | 63 |
| | |
| RiverNorth/DoubleLine Strategic Income Fund | | Schedule of Investments |
| | September 30, 2013 |
Common Abbreviations:
AS - Anonim Sirket is the Turkish term for Incorporation.
Bhd - Berhad, a Malaysian public limited company.
BV - Besloten Vennootschap a Dutch private limited liability company.
CDO - Collateralized Debt Obligation.
CLO - Collateralized Loan Obligation.
ESP - Empresa de Servicios Publicos is the Colombian term for Public Service Company.
GmbH - Gesellschaft mit beschrankter Haftung is the German term for a company with limited liability.
LLC - Limited Liability Corp.
LP - Limited Partnership.
Ltd. - Limited.
MLP – Master Limited Partnership.
NV - Naamloze Vennootschap is the Dutch term for a public limited liability corporation.
OAO - Otkrytoe Aktsionernoe Obschestvo is the Russian term for Open Joint Stock Company.
OJSC - Open Joint Stock Company.
PLC - Public Limited Co.
REMICS - Real Estate Mortgage Investment Conduits.
Re-REMICS - Re-securitized Real Estate Mortgage Investment Conduits.
SA - Generally designates corporations in various countries, mostly those employing the civil law.
SAA - Sociedad Anónima Abierta - A publicly traded corporation.
SAB de CV - A variable capital company.
SAC - Sociedad Anónima Cerrada - A privately held corporation.
SpA - Societa per Azioni.
| | |
| See Notes to Financial Statements. | | |
| 64 | | (888) 848-7569 | www.rivernorthfunds.com |
| | |
RiverNorth/Manning & Napier Dividend Income Fund | | Schedule of Investments |
| | September 30, 2013 |
| | | | | | |
Shares/Description | | | Value | |
CLOSED-END FUNDS - 40.48% | | | | |
| 51,119 | | Adams Express Co. | | $ | 633,364 | |
| 17,500 | | AllianzGI Equity & Convertible Income Fund | | | 324,975 | |
| 101,995 | | Alpine Total Dynamic Dividend Fund | | | 410,020 | |
| 43,998 | | BlackRock Global Opportunities Equity Trust | | | 615,532 | |
| 29,163 | | Boulder Growth & Income Fund, Inc. | | | 222,514 | |
| 7,400 | | Boulder Total Return Fund, Inc.(a) | | | 161,320 | |
| 5,350 | | Central Securities Corp. | | | 125,350 | |
| 60,150 | | Clough Global Allocation Fund | | | 917,287 | |
| 28,700 | | Clough Global Opportunities Fund | | | 369,369 | |
| 10,945 | | Eaton Vance Tax-Managed Diversified Equity Income Fund | | | 110,326 | |
| 9,200 | | Gabelli Utility Trust | | | 58,420 | |
| 3,000 | | General American Investors Co., Inc. | | | 102,420 | |
| 79,040 | | Liberty All Star® Equity Fund | | | 427,606 | |
| 5,700 | | NexPoint Credit Strategies Fund | | | 43,605 | |
| 70,619 | | Royce Focus Trust, Inc. | | | 510,152 | |
| 9,200 | | Royce Value Trust, Inc. | | | 148,212 | |
| 26,286 | | Tri-Continental Corp. | | | 481,560 | |
| | | | | | |
| |
TOTAL CLOSED-END FUNDS (Cost $5,319,868) | | | 5,662,032 | |
| | | | | | |
| |
COMMON STOCKS - 56.41% | | | | |
Aerospace/Defense - 2.52% | | | | |
| 419 | | General Dynamics Corp. | | | 36,671 | |
| 254 | | Lockheed Martin Corp. | | | 32,398 | |
| 339 | | Northrop Grumman Corp. | | | 32,293 | |
| 418 | | Raytheon Co. | | | 32,215 | |
| 833 | | The Boeing Co. | | | 97,878 | |
| 1,116 | | United Technologies Corp. | | | 120,327 | |
| | | | | | |
| | | | | 351,782 | |
| | | | | | |
Agriculture - 2.08% | | | | |
| 760 | | Archer-Daniels-Midland Co. | | | 27,998 | |
| 565 | | Lorillard, Inc. | | | 25,301 | |
| 2,494 | | Philip Morris International, Inc. | | | 215,956 | |
| 431 | | Reynolds American, Inc. | | | 21,024 | |
| | | | | | |
| | | | | 290,279 | |
| | | | | | |
Auto Parts & Equipment - 0.16% | | | | |
| 269 | | Magna International, Inc. | | | 22,209 | |
Beverages - 3.48% | | | | |
| 517 | | Diageo PLC, ADR | | | 65,700 | |
| 2,290 | | PepsiCo, Inc. | | | 182,055 | |
| | |
See Notes to Financial Statements. | | |
| Annual Report | September 30, 2013 | | 65 |
| | |
RiverNorth/Manning & Napier Dividend Income Fund | | Schedule of Investments |
| | September 30, 2013 |
| | | | | | |
Shares/Description | | | Value | |
| 6,321 | | The Coca-Cola Co. | | $ | 239,440 | |
| | | | | | |
| | | | | 487,195 | |
| | | | | | |
Chemicals - 0.58% | | | | |
| 1,376 | | EI du Pont de Nemours & Co. | | | 80,578 | |
Commercial Services - 0.55% | | | | |
| 683 | | Automatic Data Processing, Inc. | | | 49,436 | |
| 424 | | McGraw Hill Financial, Inc. | | | 27,810 | |
| | | | | | |
| | | | | 77,246 | |
| | | | | | |
Computers - 2.29% | | | | |
| 704 | | Accenture PLC - Class A | | | 51,843 | |
| 471 | | Apple, Inc. | | | 224,549 | |
| 2,113 | | Hewlett-Packard Co. | | | 44,352 | |
| | | | | | |
| | | | | 320,744 | |
| | | | | | |
Cosmetics/Personal Care - 2.19% | | | | |
| 1,116 | | Colgate-Palmolive Co. | | | 66,179 | |
| 3,177 | | The Procter & Gamble Co. | | | 240,149 | |
| | | | | | |
| | | | | 306,328 | |
| | | | | | |
Distribution/Wholesale - 0.12% | | | | |
| 211 | | Genuine Parts Co. | | | 17,068 | |
Electronics - 1.57% | | | | |
| 1,061 | | Emerson Electric Co. | | | 68,647 | |
| 962 | | Honeywell International, Inc. | | | 79,884 | |
| 1,430 | | Koninklijke Philips NV | | | 46,118 | |
| 489 | | TE Connectivity Ltd. | | | 25,320 | |
| | | | | | |
| | | | | 219,969 | |
| | | | | | |
Engineering & Construction - 0.52% | | | | |
| 3,066 | | ABB Ltd., ADR | | | 72,327 | |
Environmental Control - 0.20% | | | | |
| 679 | | Waste Management, Inc. | | | 28,002 | |
Food - 1.59% | | | | |
| 476 | | ConAgra Foods, Inc. | | | 14,442 | |
| 899 | | General Mills, Inc. | | | 43,080 | |
| 500 | | Kellogg Co. | | | 29,365 | |
| 860 | | Sysco Corp. | | | 27,374 | |
| 159 | | The JM Smucker Co. | | | 16,701 | |
| 2,368 | | Unilever PLC, ADR | | | 91,357 | |
| | | | | | |
| | | | | 222,319 | |
| | | | | | |
Forest Products & Paper - 0.15% | | | | |
| 478 | | International Paper Co. | | | 21,414 | |
Hand/Machine Tools - 0.12% | | | | |
| 189 | | Stanley Black & Decker, Inc. | | | 17,118 | |
Healthcare Products - 0.92% | | | | |
| 660 | | Baxter International, Inc. | | | 43,355 | |
| 237 | | Becton Dickinson and Co. | | | 23,705 | |
| | |
See Notes to Financial Statements. | | |
| 66 | | (888) 848-7569 | www.rivernorthfunds.com |
| | |
RiverNorth/Manning & Napier Dividend Income Fund | | Schedule of Investments |
| | September 30, 2013 |
| | | | | | |
Shares/Description | | | Value | |
| 1,148 | | Medtronic, Inc. | | $ | 61,131 | |
| | | | | | |
| | | | | 128,191 | |
| | | | | | |
Household Products/Wares - 0.36% | | | | |
| 541 | | Kimberly-Clark Corp. | | | 50,973 | |
Insurance - 0.24% | | | | |
| 776 | | Marsh & McLennan Cos., Inc. | | | 33,795 | |
Machinery - 0.52% | | | | |
| 499 | | Caterpillar, Inc. | | | 41,617 | |
| 388 | | Deere & Co. | | | 31,579 | |
| | | | | | |
| | | | | 73,196 | |
| | | | | | |
Media - 0.47% | | | | |
| 1,107 | | Pearson PLC, ADR | | | 22,517 | |
| 1,227 | | Thomson Reuters Corp. | | | 42,957 | |
| | | | | | |
| | | | | 65,474 | |
| | | | | | |
Mining - 0.19% | | | | |
| 403 | | Newmont Mining Corp. | | | 11,324 | |
| 574 | | Teck Resources Ltd. - Class B | | | 15,406 | |
| | | | | | |
| | | | | 26,730 | |
| | | | | | |
Miscellaneous Manufacturing - 2.20% | | | | |
| 1,030 | | 3M Co. | | | 122,992 | |
| 666 | | Illinois Tool Works, Inc. | | | 50,796 | |
| 1,106 | | Siemens AG, ADR | | | 133,284 | |
| | | | | | |
| | | | | 307,072 | |
| | | | | | |
Office/Business Equipment - 0.37% | | | | |
| 1,605 | | Canon, Inc., ADR | | | 51,360 | |
Oil & Gas - 8.93% | | | | |
| 2,485 | | Chevron Corp. | | | 301,928 | |
| 1,840 | | ConocoPhillips | | | 127,898 | |
| 3,433 | | Exxon Mobil Corp. | | | 295,375 | |
| 743 | | Marathon Oil Corp. | | | 25,916 | |
| 841 | | Occidental Petroleum Corp. | | | 78,667 | |
| 3,367 | | Royal Dutch Shell PLC, ADR | | | 221,145 | |
| 3,965 | | Statoil ASA, ADR | | | 89,926 | |
| 1,869 | | Total SA, ADR | | | 108,252 | |
| | | | | | |
| | | | | 1,249,107 | |
| | | | | | |
Pharmaceuticals - 12.77% | | | | |
| 1,947 | | AbbVie, Inc. | | | 87,089 | |
| 1,866 | | AstraZeneca PLC, ADR | | | 96,901 | |
| 2,329 | | Bristol-Myers Squibb Co. | | | 107,786 | |
| 384 | | Cardinal Health, Inc. | | | 20,026 | |
| 1,626 | | Eli Lilly & Co. | | | 81,837 | |
| 3,657 | | GlaxoSmithKline PLC, ADR | | | 183,472 | |
| 3,673 | | Johnson & Johnson | | | 318,412 | |
| 3,846 | | Merck & Co., Inc. | | | 183,104 | |
| | |
See Notes to Financial Statements. | | |
| Annual Report | September 30, 2013 | | 67 |
| | |
RiverNorth/Manning & Napier Dividend Income Fund | | Schedule of Investments |
| | September 30, 2013 |
| | | | | | |
Shares/Description | | | Value | |
| 3,022 | | Novartis AG, ADR | | $ | 231,818 | |
| 10,317 | | Pfizer, Inc. | | | 296,356 | |
| 3,027 | | Sanofi, ADR | | | 153,257 | |
| 685 | | Teva Pharmaceutical Industries Ltd., ADR | | | 25,879 | |
| | | | | | |
| | | | | 1,785,937 | |
| | | | | | |
Retail - 5.03% | | | | |
| 392 | | L Brands, Inc. | | | 23,951 | |
| 1,465 | | McDonald’s Corp. | | | 140,948 | |
| 743 | | Target Corp. | | | 47,537 | |
| 2,096 | | The Home Depot, Inc. | | | 158,982 | |
| 948 | | Walgreen Co. | | | 51,002 | |
| 3,803 | | Wal-Mart Stores, Inc. | | | 281,270 | |
| | | | | | |
| | | | | 703,690 | |
| | | | | | |
Semiconductors - 1.63% | | | | |
| 349 | | Analog Devices, Inc. | | | 16,420 | |
| 7,207 | | Intel Corp. | | | 165,192 | |
| 1,144 | | Texas Instruments, Inc. | | | 46,092 | |
| | | | | | |
| | | | | 227,704 | |
| | | | | | |
Software - 2.10% | | | | |
| 8,833 | | Microsoft Corp. | | | 293,962 | |
Telecommunications - 1.97% | | | | |
| 4,214 | | Cisco Systems, Inc. | | | 98,738 | |
| 1,078 | | Mobile Telesystems OJSC, ADR | | | 23,996 | |
| 4,535 | | NTT DOCOMO, Inc., ADR | | | 73,558 | |
| 4,862 | | Telefonaktiebolaget LM Ericsson, ADR | | | 64,908 | |
| 410 | | Telekomunikasi Indonesia Persero Tbk PT, ADR | | | 14,887 | |
| | | | | | |
| | | | | 276,087 | |
| | | | | | |
Toys/Games/Hobbies - 0.14% | | | | |
| 483 | | Mattel, Inc. | | | 20,228 | |
Transportation - 0.39% | | | | |
| 1,040 | | CSX Corp. | | | 26,770 | |
| 363 | | Norfolk Southern Corp. | | | 28,078 | |
| | | | | | |
| | | | | 54,848 | |
| | | | | | |
Water - 0.06% | | | | |
| 894 | | Cia de Saneamento Basico do Estado de Sao Paulo, ADR | | | 8,904 | |
| | | | | | |
| |
TOTAL COMMON STOCKS (Cost $7,026,044) | | | 7,891,836 | |
| | | | | | |
| | |
See Notes to Financial Statements. | | |
| 68 | | (888) 848-7569 | www.rivernorthfunds.com |
| | |
RiverNorth/Manning & Napier Dividend Income Fund | | Schedule of Investments |
| | September 30, 2013 |
| | | | | | |
Shares/Description | | | Value | |
| SHORT-TERM INVESTMENTS - 1.94% | | | | |
| 271,889 | | Northern Institutional Government Select Portfolio, | | | | |
| | (7 Day Yield 0.01%) | | $ | 271,889 | |
| | | | | | |
| |
TOTAL SHORT-TERM INVESTMENTS (Cost $271,889) | | | 271,889 | |
| | | | | | |
| |
TOTAL INVESTMENTS - 98.83% (Cost $12,617,801) | | | 13,825,757 | |
| OTHER ASSETS IN EXCESS OF LIABILITIES - 1.17% | | | 163,635 | |
| | | | | | |
| NET ASSETS - 100.00% | | $ | 13,989,392 | |
| | | | | | |
| (a) | Non-income producing security. |
Common Abbreviations:
ADR - American Depositary Receipt.
AG - Aktiengesellschaft is a German term that refers to a corporation that is limited by shares, i.e., owned by shareholders.
ASA - Allmennaksjeselskap is the Norwegian term for a public limited company.
Ltd. - Limited.
NV - Naamloze Vennootschap is the Dutch term for a public limited liability corporation.
OJSC - Open Joint Stock Company.
PLC - Public Limited Company.
RAFI - Research Affiliates Fundamental Index.
SA - Generally designates corporations in various countries, mostly those employing the civil law.
Tbk PT - Terbuka is the Indonesian term for limited liability company.
| | |
See Notes to Financial Statements. | | |
| Annual Report | September 30, 2013 | | 69 |
| | |
| RiverNorth/Oaktree High Income Fund | | Schedule of Investments |
| | September 30, 2013 |
| | | | | | |
| Shares/Description | | Value | |
| CLOSED-END FUNDS - 18.15% | | | | |
| 5,000 | | Aberdeen Global Income Fund, Inc. | | $ | 54,150 | |
| 9,055 | | Advent Claymore Convertible Securities and Income Fund II | | | 62,932 | |
| 8,700 | | Advent Claymore Enhanced Growth & Income Fund | | | 85,086 | |
| 4,900 | | American Strategic Income Portfolio, Inc. | | | 47,873 | |
| 58,391 | | Apollo Tactical Income Fund, Inc. | | | 975,130 | |
| 7,900 | | BlackRock Corporate High Yield Fund III, Inc. | | | 57,670 | |
| 19,700 | | BlackRock Corporate High Yield Fund V, Inc. | | | 238,764 | |
| 1,500 | | BlackRock Corporate High Yield Fund VI, Inc. | | | 17,640 | |
| 14,618 | | BlackRock Credit Allocation Income Trust IV, Inc. | | | 190,619 | |
| 49,045 | | BlackRock Debt Strategies Fund, Inc. | | | 197,161 | |
| 25,086 | | BlackRock Defined Opportunity Credit Trust | | | 350,702 | |
| 25,000 | | BlackRock High Income Shares | | | 52,000 | |
| 30,290 | | BlackRock Multi-Sector Income Trust | | | 504,934 | |
| 131,186 | | BlackRock Senior High Income Fund, Inc. | | | 516,873 | |
| 20,233 | | BlackRock Strategic Bond Trust | | | 262,017 | |
| 32,917 | | Blackstone/GSO Strategic Credit Fund | | | 582,302 | |
| 9,800 | | DWS High Income Opportunities Fund, Inc. | | | 138,670 | |
| 285 | | Eaton Vance Floating-Rate Income Plus Fund | | | 5,087 | |
| 17,516 | | Eaton Vance Short Duration Diversified Income Fund | | | 271,323 | |
| 17,363 | | First Trust High Income Long/Short Fund | | | 304,547 | |
| 1,300 | | Franklin Templeton Limited Duration Income Trust | | | 16,900 | |
| 24,611 | | Helios Advantage Income Fund, Inc. | | | 209,686 | |
| 25,675 | | Helios Multi-Sector High Income Fund, Inc. | | | 149,172 | |
| 2,500 | | Helios Strategic Income Fund, Inc. | | | 15,875 | |
| 27,263 | | Ivy High Income Opportunities Fund | | | 485,281 | |
| 3,500 | | John Hancock Income Securities Trust | | | 49,420 | |
| 31,276 | | Legg Mason BW Global Income Opportunities Fund, Inc. | | | 523,248 | |
| 20,000 | | MFS Intermediate Income Trust | | �� | 106,200 | |
| 12,594 | | Nuveen Diversified Currency Opportunities Fund | | | 131,985 | |
| 13,600 | | Nuveen Mortgage Opportunity Term Fund | | | 323,136 | |
| 6,687 | | PIMCO Corporate & Income Strategy Fund | | | 111,606 | |
| 9,276 | | PIMCO Dynamic Credit Income Fund | | | 206,391 | |
| 23,170 | | PIMCO Dynamic Income Fund | | | 664,747 | |
| 2,316 | | PIMCO Income Opportunity Fund | | | 63,667 | |
| 8,114 | | PIMCO Income Strategy Fund II | | | 82,763 | |
| 23,098 | | Wells Fargo Advantage Income Opportunities Fund | | | 207,882 | |
| 32,171 | | Western Asset High Income Opportunity Fund, Inc. | | | 192,061 | |
| 15,800 | | Western Asset Managed High Income Fund, Inc. | | | 89,902 | |
| 5,500 | | Western Asset Variable Rate Strategic Fund, Inc. | | | 93,500 | |
| | | | | | |
| |
TOTAL CLOSED-END FUNDS (Cost $8,658,766) | | | 8,638,902 | |
| | | | | | |
| | |
See Notes to Financial Statements. | | |
| 70 | | (888) 848-7569 | www.rivernorthfunds.com |
| | |
| RiverNorth/Oaktree High Income Fund | | Schedule of Investments |
| | September 30, 2013 |
| | | | | | | | | | |
| Shares/Description | | | | | | Value | |
| PREFERRED STOCKS - 0.29% | | | | | | | | |
2,690 | | Gabelli Global Utility & Income Trust, 6.000%, Perpetual Maturity | | | | | | $ | 136,625 | |
| | | | | | | | | | |
| | | |
TOTAL PREFERRED STOCKS (Cost $138,106) | | | | | | | 136,625 | |
| | | | | | | | | | |
| | | |
| Principal Amount/Description | | Rate | | Maturity | | Value | |
| BANK LOANS - 2.07% | | | | | | | | |
$205,000 | | BMC Software Finance, Inc., Initial Term Loan | | 5.00% | | 09/10/2020 | | | 205,359 | |
320,000 | | Fieldwood Energy LLC, Term Loan(a) | | L+7.125% | | 09/30/2020 | | | 319,501 | |
324,837 | | Getty Images, Inc., Initial Term Loan(a) | | L+3.5% | | 10/18/2019 | | | 291,784 | |
170,000 | | Toys “R” US, Initial Term Loan | | 6.00% | | 08/21/2019 | | | 167,663 | |
| | | | | | | | | | |
| | | | | | | | | 984,307 | |
| | | | | | | | | | |
TOTAL BANK LOANS (Cost $993,020) | | | | | | | 984,307 | |
| | | | | | | | | | |
| | | |
| Shares/Description | | Rate | | Maturity | | Value | |
| BUSINESS DEVELOPMENT COMPANY SENIOR NOTES - 5.29% | | | | | | | | |
28,300 | | Fifth Street Finance Corp. | | 5.88% | | 10/30/2024 | | | 689,954 | |
39,655 | | Main Street Capital Corp. | | 6.13% | | 04/01/2023 | | | 927,927 | |
37,700 | | Medley Capital Corp. | | 6.13% | | 03/30/2023 | | | 878,410 | |
800 | | PennantPark Investment Corp. | | 6.25% | | 02/01/2025 | | | 19,200 | |
| | | | | | | | | | |
| | | | | | | | | 2,515,491 | |
| | | | | | | | | | |
| | | |
TOTAL BUSINESS DEVELOPMENT COMPANY SENIOR NOTES (Cost $2,653,007) | | | | | | | 2,515,491 | |
| | | | | | | | | | |
| | | |
| Principal Amount/Description | | Rate | | Maturity | | Value | |
| HIGH YIELD DEBT - 69.76% | | | | | | | | |
Australia - 0.56% | | | | | | | | |
$255,000 | | FMG Resources August 2006 Pty Ltd.(b) | | 6.88% | | 02/01/2018 | | | 267,431 | |
| | | | | | | | | | |
| | | |
Belgium - 0.82% | | | | | | | | |
270,000 | | Ontex IV SA(c) | | 9.00% | | 04/15/2019 | | | 388,099 | |
| | | | | | | | | | |
| | | |
Bermuda - 0.43% | | | | | | | | |
200,000 | | Seadrill Ltd.(b) | | 5.63% | | 09/15/2017 | | | 203,000 | |
| | | | | | | | | | |
| | |
See Notes to Financial Statements. | | |
| Annual Report | September 30, 2013 | | 71 |
| | |
| RiverNorth/Oaktree High Income Fund | | Schedule of Investments |
| | September 30, 2013 |
| | | | | | | | | | |
| Principal Amount/Description | | Rate | | Maturity | | Value | |
Canada - 2.29% | | | | | | | | |
$235,000 | | Harvest Operations Corp. | | 6.88% | | 10/01/2017 | | $ | 252,625 | |
175,000 | | HudBay Minerals, Inc. | | 9.50% | | 10/01/2020 | | | 176,312 | |
130,000 | | Kodiak Oil & Gas Corp.(b) | | 5.50% | | 02/01/2022 | | | 127,400 | |
329,000 | | Novelis, Inc. | | 8.75% | | 12/15/2020 | | | 362,723 | |
160,000 | | Precision Drilling Corp. | | 6.63% | | 11/15/2020 | | | 170,000 | |
| | | | | | | | | | |
| | | | | | | | | 1,089,060 | |
| | | |
France - 1.60% | | | | | | | | |
200,000 | | CGG | | 6.50% | | 06/01/2021 | | | 205,000 | |
100,000 | | Elior Finance & Co. SCA(c) | | 6.50% | | 05/01/2020 | | | 141,860 | |
100,000 | | Holding Medi-Partenaires SAS(c) | | 7.00% | | 05/15/2020 | | | 134,947 | |
200,000 | | Loxam SAS(c) | | 7.38% | | 01/24/2020 | | | 280,085 | |
| | | | | | | | | | |
| | | | | | | | | 761,892 | |
| | | |
Germany - 1.79% | | | | | | | | |
100,000 | | Faenza GmbH(b) | | 8.25% | | 08/15/2021 | | | 139,344 | |
200,000 | | Techem Energy Metering Service GmbH & Co. KG(c) | | 7.88% | | 10/01/2020 | | | 299,218 | |
100,000 | | Trionista TopCo GmbH(b) | | 6.88% | | 04/30/2021 | | | 139,682 | |
100,000 | | Unitymedia Hessen GmbH & Co. KG / Unitymedia NRW GmbH(c) | | 5.63% | | 04/15/2023 | | | 133,256 | |
100,000 | | WEPA Hygieneprodukte GmbH(b) | | 6.50% | | 05/15/2020 | | | 141,980 | |
| | | | | | | | | | |
| | | | | | | | | 853,480 | |
| | | |
Great Britain - 3.90% | | | | | | | | |
200,000 | | Arqiva Broadcast Finance PLC(c) | | 9.50% | | 03/31/2020 | | | 348,065 | |
60,000 | | Kerling PLC(c) | | 10.63% | | 02/01/2017 | | | 86,569 | |
215,000 | | Pendragon PLC | | 6.88% | | 05/01/2020 | | | 360,248 | |
100,000 | | Phosphorus Holdco(b) | | 10.00% | | 04/01/2019 | | | 161,284 | |
100,000 | | R&R Pik PLC(b)(d) | | 9.25% | | 05/15/2018 | | | 140,020 | |
100,000 | | Thames Water Kemble Finance PLC | | 7.75% | | 04/01/2019 | | | 176,016 | |
150,000 | | Virgin Media Finance PLC(c) | | 7.00% | | 04/15/2023 | | | 247,212 | |
100,000 | | Vougeot Bidco PLC(b) | | 7.88% | | 07/15/2020 | | | 169,192 | |
100,000 | | Vougeot Bidco PLC(c) | | 7.88% | | 07/15/2020 | | | 169,192 | |
| | | | | | | | | | |
| | | | | | | | | 1,857,798 | |
| | | |
Ireland - 1.41% | | | | | | | | |
270,000 | | Ardagh Glass Finance PLC(c) | | 8.75% | | 02/01/2020 | | | 372,641 | |
100,000 | | Nara Cable Funding II Ltd.(c) | | 8.50% | | 03/01/2020 | | | 154,225 | |
100,000 | | Nara Cable Funding Ltd.(c) | | 8.88% | | 12/01/2018 | | | 144,755 | |
| | | | | | | | | | |
| | | | | | | | | 671,621 | |
| | | |
Jersey - 0.73% | | | | | | | | |
200,000 | | AA Bond Co. Ltd.(c) | | 9.50% | | 07/31/2019 | | | 349,684 | |
| | | | | | | | | | |
| | |
See Notes to Financial Statements. | | |
| 72 | | (888) 848-7569 | www.rivernorthfunds.com |
| | |
| RiverNorth/Oaktree High Income Fund | | Schedule of Investments |
| | September 30, 2013 |
| | | | | | | | | | |
| Principal Amount/Description | | Rate | | Maturity | | Value | |
Luxembourg - 6.89% | | | | | | | | |
$150,000 | | Aguila 3 SA(c) | | 7.88% | | 01/31/2018 | | $ | 174,158 | |
405,000 | | ArcelorMittal | | 5.50% | | 03/01/2021 | | | 418,163 | |
120,000 | | Befesa Zinc SAU Via Zinc Capital SA(c) | | 8.88% | | 05/15/2018 | | | 172,691 | |
400,000 | | ConvaTec Finance International SA(b)(d) | | 8.25% | | 01/15/2019 | | | 401,000 | |
120,000 | | Expro Finance Luxembourg SCA(b) | | 8.50% | | 12/15/2016 | | | 126,450 | |
120,000 | | Fiat Finance & Trade SA | | 6.75% | | 10/14/2019 | | | 167,399 | |
100,000 | | Gestamp Funding Luxembourg SA(b) | | 5.88% | | 05/31/2020 | | | 137,483 | |
200,000 | | INEOS Group Holdings SA(b) | | 6.50% | | 08/15/2018 | | | 266,173 | |
100,000 | | KION Finance SA(c) | | 6.75% | | 02/15/2020 | | | 146,277 | |
200,000 | | Matterhorn Midco & Cy SCA(c) | | 7.75% | | 02/15/2020 | | | 275,982 | |
200,000 | | Numericable Finance & Co. SCA(c) | | 8.75% | | 02/15/2019 | | | 307,774 | |
100,000 | | Spie BondCo 3 SCA(c) | | 11.00% | | 08/15/2019 | | | 153,210 | |
100,000 | | Sunrise Communications Holdings SA(c) | | 8.50% | | 12/31/2018 | | | 146,435 | |
100,000 | | Telenet Finance Luxembourg SCA(c) | | 6.38% | | 11/15/2020 | | | 142,726 | |
170,000 | | Wind Acquisition Finance SA(c) | | 7.38% | | 02/15/2018 | | | 240,660 | |
| | | | | | | | | | |
| | | | | | | | | 3,276,581 | |
| | | |
Netherlands - 1.61% | | | | | | | | |
100,000 | | Nokia Siemens Networks Finance BV(c) | | 7.13% | | 04/15/2020 | | | 150,606 | |
100,000 | | Refresco Group BV(c) | | 7.38% | | 05/15/2018 | | | 144,474 | |
100,000 | | Schaeffler Holding Finance BV(b)(d) | | 6.88% | | 08/15/2018 | | | 142,218 | |
100,000 | | Schaeffler Holding Finance BV(c)(d) | | 6.88% | | 08/15/2018 | | | 142,219 | |
140,000 | | UPC Holding BV(c) | | 6.38% | | 09/15/2022 | | | 187,505 | |
| | | | | | | | | | |
| | | | | | | | | 767,022 | |
| | | |
Spain - 0.54% | | | | | | | | |
180,000 | | Obrascon Huarte Lain SA(c) | | 7.63% | | 03/15/2020 | | | 256,906 | |
| | | | | | | | | | |
| | | |
Sweden - 0.19% | | | | | | | | |
60,000 | | Stena AB(c) | | 7.88% | | 03/15/2020 | | | 90,709 | |
| | | | | | | | | | |
| | | |
United States - 47.00% | | | | | | | | |
195,000 | | Access Midstream Partners LP / ACMP Finance Corp. | | 5.88% | | 04/15/2021 | | | 201,337 | |
340,000 | | ACCO Brands Corp. | | 6.75% | | 04/30/2020 | | | 342,125 | |
220,000 | | Accudyne Industries Borrower / Accudyne Industries LLC(b) | | 7.75% | | 12/15/2020 | | | 227,150 | |
225,000 | | ACI Worldwide, Inc.(b) | | 6.38% | | 08/15/2020 | | | 229,500 | |
220,000 | | Allegion US Holding Co., Inc.(b) | | 5.75% | | 10/01/2021 | | | 222,200 | |
95,000 | | Alphabet Holding Co., Inc.(d) | | 7.75% | | 11/01/2017 | | | 98,087 | |
190,000 | | American Builders & Contractors Supply Co., Inc.(b) | | 5.63% | | 04/15/2021 | | | 187,387 | |
220,000 | | AmeriGas Finance LLC /AmeriGas Finance Corp. | | 7.00% | | 05/20/2022 | | | 229,900 | |
| | |
See Notes to Financial Statements. | | |
| Annual Report | September 30, 2013 | | 73 |
| | |
| RiverNorth/Oaktree High Income Fund | | Schedule of Investments |
| | September 30, 2013 |
| | | | | | | | | | |
| Principal Amount/Description | | Rate | | Maturity | | Value | |
$235,000 | | Atkore International, Inc. | | 9.88% | | 01/01/2018 | | $ | 254,975 | |
175,000 | | BC Mountain LLC / BC Mountain Finance, Inc.(b) | | 7.00% | | 02/01/2021 | | | 174,562 | |
175,000 | | Berry Petroleum Co. | | 6.38% | | 09/15/2022 | | | 176,750 | |
155,000 | | BI-LO LLC / BI-LO Finance Corp.(b)(d) | | 8.63% | | 09/15/2018 | | | 158,100 | |
110,000 | | Biomet, Inc. | | 6.50% | | 08/01/2020 | | | 114,125 | |
195,000 | | Biomet, Inc. | | 6.50% | | 10/01/2020 | | | 198,656 | |
320,000 | | Building Materials Corp. of America(b) | | 6.75% | | 05/01/2021 | | | 344,800 | |
190,000 | | Cablevision Systems Corp. | | 5.88% | | 09/15/2022 | | | 187,150 | |
195,000 | | Caesars Entertainment Operating Co., Inc. | | 9.00% | | 02/15/2020 | | | 184,275 | |
100,000 | | CCO Holdings LLC / CCO Holdings Capital Corp. | | 8.13% | | 04/30/2020 | | | 109,250 | |
230,000 | | CCO Holdings LLC / CCO Holdings Capital Corp. | | 6.50% | | 04/30/2021 | | | 235,750 | |
185,000 | | CDR DB Sub, Inc.(b) | | 7.75% | | 10/15/2020 | | | 185,925 | |
155,000 | | Chemtura Corp. | | 5.75% | | 07/15/2021 | | | 155,387 | |
175,000 | | Chesapeake Energy Corp. | | 6.63% | | 08/15/2020 | | | 189,000 | |
220,000 | | CHS/Community Health Systems, Inc. | | 7.13% | | 07/15/2020 | | | 222,475 | |
175,000 | | Cloud Peak Energy Resources LLC / Cloud Peak Energy Finance Corp. | | 8.50% | | 12/15/2019 | | | 189,875 | |
260,000 | | CommScope, Inc.(b) | | 8.25% | | 01/15/2019 | | | 285,350 | |
235,000 | | Crown Castle International Corp. | | 5.25% | | 01/15/2023 | | | 217,375 | |
140,000 | | Cumulus Media Holdings, Inc. | | 7.75% | | 05/01/2019 | | | 145,950 | |
140,000 | | Dana Holding Corp. | | 5.38% | | 09/15/2021 | | | 138,250 | |
180,000 | | DaVita HealthCare Partners, Inc. | | 5.75% | | 08/15/2022 | | | 178,875 | |
275,000 | | Denali Borrower LLC / Denali Finance Corp.(b) | | 5.63% | | 10/15/2020 | | | 268,469 | |
245,000 | | DISH DBS Corp. | | 5.00% | | 03/15/2023 | | | 228,462 | |
150,000 | | Dynegy, Inc.(b) | | 5.88% | | 06/01/2023 | | | 137,250 | |
230,000 | | First Data Corp.(b) | | 8.25% | | 01/15/2021 | | | 238,625 | |
225,000 | | Flexi-Van Leasing, Inc.(b) | | 7.88% | | 08/15/2018 | | | 234,000 | |
295,000 | | Forum Energy Technologies, Inc.(b) | | 6.25% | | 10/01/2021 | | | 297,581 | |
175,000 | | Frontier Communications Corp. | | 7.63% | | 04/15/2024 | | | 175,875 | |
105,000 | | GCI, Inc. | | 6.75% | | 06/01/2021 | | | 99,750 | |
190,000 | | Global Brass & Copper, Inc.(b) | | 9.50% | | 06/01/2019 | | | 209,950 | |
165,000 | | GrafTech International Ltd. | | 6.38% | | 11/15/2020 | | | 167,475 | |
160,000 | | Halcon Resources Corp. | | 9.75% | | 07/15/2020 | | | 170,000 | |
225,000 | | HCA Holdings, Inc. | | 6.25% | | 02/15/2021 | | | 229,219 | |
110,000 | | HD Supply, Inc.(b) | | 7.50% | | 07/15/2020 | | | 114,262 | |
205,000 | | Healthcare Technology Intermediate, Inc.(b)(d) | | 7.38% | | 09/01/2018 | | | 210,381 | |
215,000 | | Hockey Merger Sub 2, Inc.(b) | | 7.88% | | 10/01/2021 | | | 216,344 | |
145,000 | | IMS Health, Inc.(b) | | 6.00% | | 11/01/2020 | | | 148,444 | |
70,000 | | Ingles Markets, Inc.(b) | | 5.75% | | 06/15/2023 | | | 67,725 | |
| | |
See Notes to Financial Statements. | | |
| 74 | | (888) 848-7569 | www.rivernorthfunds.com |
| | |
| RiverNorth/Oaktree High Income Fund | | Schedule of Investments |
| | September 30, 2013 |
| | | | | | | | | | |
| Principal Amount/Description | | Rate | | Maturity | | Value | |
$165,000 | | Iron Mountain, Inc. | | 5.75% | | 08/15/2024 | | $ | 149,325 | |
170,000 | | Isle of Capri Casinos, Inc. | | 8.88% | | 06/15/2020 | | | 177,225 | |
235,000 | | Jarden Corp. | | 7.50% | | 01/15/2020 | | | 255,856 | |
145,000 | | JBS USA LLC / JBS USA Finance, Inc.(b) | | 8.25% | | 02/01/2020 | | | 153,337 | |
180,000 | | JBS USA LLC / JBS USA Finance, Inc.(b) | | 7.25% | | 06/01/2021 | | | 181,800 | |
210,000 | | Kinetic Concepts, Inc. / KCI USA, Inc. | | 10.50% | | 11/01/2018 | | | 232,837 | |
110,000 | | Kraton Polymers LLC / Kraton Polymers Capital Corp. | | 6.75% | | 03/01/2019 | | | 113,850 | |
220,000 | | Level 3 Financing, Inc. | | 7.00% | | 06/01/2020 | | | 223,300 | |
170,000 | | Levi Strauss & Co. | | 6.88% | | 05/01/2022 | | | 181,050 | |
180,000 | | LIN Television Corp. | | 6.38% | | 01/15/2021 | | | 180,900 | |
215,000 | | Linn Energy LLC / Linn Energy Finance Corp.(b) | | 6.25% | | 11/01/2019 | | | 203,713 | |
190,000 | | MetroPCS Wireless, Inc.(b) | | 6.25% | | 04/01/2021 | | | 191,663 | |
150,000 | | MGM Resorts International | | 6.63% | | 12/15/2021 | | | 155,438 | |
165,000 | | Michaels FinCo Holdings LLC / Michaels FinCo, Inc.(b)(d) | | 7.50% | | 08/01/2018 | | | 167,888 | |
225,000 | | Milacron LLC / Mcron Finance Corp.(b) | | 7.75% | | 02/15/2021 | | | 233,438 | |
140,000 | | Murray Energy Corp.(b) | | 8.63% | | 06/15/2021 | | | 141,050 | |
150,000 | | Natural Resource Partners LP(b) | | 9.13% | | 10/01/2018 | | | 151,500 | |
165,000 | | Neuberger Berman Group LLC / Neuberger Berman Finance Corp.(b) | | 5.88% | | 03/15/2022 | | | 166,650 | |
75,000 | | NRG Energy, Inc. | | 7.88% | | 05/15/2021 | | | 80,625 | |
225,000 | | NRG Energy, Inc. | | 6.63% | | 03/15/2023 | | | 221,625 | |
110,000 | | Oasis Petroleum, Inc. | | 6.50% | | 11/01/2021 | | | 116,600 | |
115,000 | | Oasis Petroleum, Inc.(b) | | 6.88% | | 03/15/2022 | | | 121,613 | |
120,000 | | Oasis Petroleum, Inc. | | 6.88% | | 01/15/2023 | | | 127,800 | |
140,000 | | Omega Healthcare Investors, Inc. | | 7.50% | | 02/15/2020 | | | 152,950 | |
210,000 | | Party City Holdings, Inc.(b) | | 8.88% | | 08/01/2020 | | | 226,800 | |
160,000 | | Penn Virginia Corp. | | 8.50% | | 05/01/2020 | | | 163,200 | |
155,000 | | Pinnacle Foods Finance LLC / Pinnacle Foods Finance Corp.(b) | | 4.88% | | 05/01/2021 | | | 144,925 | |
245,000 | | Plastipak Holdings, Inc.(b) | | 6.50% | | 10/01/2021 | | | 248,675 | |
330,000 | | PNK Finance Corp.(b) | | 6.38% | | 08/01/2021 | | | 338,250 | |
315,000 | | Polymer Group, Inc. | | 7.75% | | 02/01/2019 | | | 338,231 | |
180,000 | | Rent-A-Center, Inc.(b) | | 4.75% | | 05/01/2021 | | | 168,300 | |
235,000 | | Reynolds Group Issuer, Inc. / Reynolds Group Issuer LLC | | 9.88% | | 08/15/2019 | | | 256,150 | |
230,000 | | Reynolds Group Issuer, Inc. / Reynolds Group Issuer LLC | | 5.75% | | 10/15/2020 | | | 232,013 | |
250,000 | | RR Donnelley & Sons Co. | | 7.00% | | 02/15/2022 | | | 252,500 | |
140,000 | | Sabine Pass Liquefaction LLC(b) | | 5.63% | | 04/15/2023 | | | 134,925 | |
230,000 | | Scientific Games International, Inc. | | 6.25% | | 09/01/2020 | | | 232,875 | |
280,000 | | Sealed Air Corp.(b) | | 8.13% | | 09/15/2019 | | | 313,600 | |
| | |
See Notes to Financial Statements. | | |
| Annual Report | September 30, 2013 | | 75 |
| | |
| RiverNorth/Oaktree High Income Fund | | Schedule of Investments |
| | September 30, 2013 |
| | | | | | | | | | |
| Principal Amount/Description | | Rate | | Maturity | | Value | |
$250,000 | | Sequa Corp.(b) | | 7.00% | | 12/15/2017 | | $ | 251,250 | |
85,000 | | Serta Simmons Holdings LLC(b) | | 8.13% | | 10/01/2020 | | | 89,888 | |
140,000 | | Sinclair Television Group, Inc. | | 5.38% | | 04/01/2021 | | | 133,700 | |
20,000 | | Sinclair Television Group, Inc.(b) | | 6.38% | | 11/01/2021 | | | 20,200 | |
320,000 | | Six Flags Entertainment Corp.(b) | | 5.25% | | 01/15/2021 | | | 305,600 | |
195,000 | | Spectrum Brands Escrow Corp.(b) | | 6.38% | | 11/15/2020 | | | 203,775 | |
250,000 | | Sprint Communications, Inc. | | 6.00% | | 11/15/2022 | | | 231,250 | |
300,000 | | Sprint Corp.(b) | | 7.25% | | 09/15/2021 | | | 303,750 | |
135,000 | | Stone Energy Corp. | | 7.50% | | 11/15/2022 | | | 142,425 | |
339,000 | | Suburban Propane Partners LP / Suburban Energy Finance Corp. | | 7.38% | | 08/01/2021 | | | 364,425 | |
170,000 | | Summit Materials LLC / Summit Materials Finance Corp. | | 10.50% | | 01/31/2020 | | | 180,200 | |
155,000 | | Sun Merger Sub, Inc.(b) | | 5.25% | | 08/01/2018 | | | 159,263 | |
250,000 | | SunCoke Energy, Inc. | | 7.63% | | 08/01/2019 | | | 269,375 | |
200,000 | | SunGard Data Systems, Inc. | | 7.63% | | 11/15/2020 | | | 215,000 | |
140,000 | | Tempur Sealy International, Inc. | | 6.88% | | 12/15/2020 | | | 147,000 | |
105,000 | | Tenet Healthcare Corp.(b) | | 6.00% | | 10/01/2020 | | | 107,559 | |
190,000 | | Tesoro Logistics LP / Tesoro Logistics Finance Corp. | | 6.13% | | 10/15/2021 | | | 191,900 | |
145,000 | | The ADT Corp.(b) | | 6.25% | | 10/15/2021 | | | 147,356 | |
225,000 | | The Goodyear Tire & Rubber Co. | | 6.50% | | 03/01/2021 | | | 230,062 | |
100,000 | | The Hertz Corp. | | 6.25% | | 10/15/2022 | | | 103,750 | |
190,000 | | The William Carter Co.(b) | | 5.25% | | 08/15/2021 | | | 190,950 | |
75,000 | | T-Mobile USA, Inc.(b) | | 5.25% | | 09/01/2018 | | | 76,594 | |
120,000 | | Tops Holding Corp. / Tops Markets LLC(b) | | 8.88% | | 12/15/2017 | | | 132,000 | |
145,000 | | TransDigm, Inc. | | 5.50% | | 10/15/2020 | | | 142,825 | |
125,000 | | TransDigm, Inc. | | 7.50% | | 07/15/2021 | | | 135,000 | |
195,000 | | Trinseo Materials Operating SCA /Trinseo Materials Finance, Inc.(b) | | 8.75% | | 02/01/2019 | | | 194,513 | |
125,000 | | Tronox Finance LLC | | 6.38% | | 08/15/2020 | | | 124,375 | |
20,000 | | tw telecom holdings, Inc. | | 5.38% | | 10/01/2022 | | | 19,150 | |
155,000 | | United Rentals North America, Inc. | | 6.13% | | 06/15/2023 | | | 156,550 | |
330,000 | | Univision Communications, Inc.(b) | | 6.88% | | 05/15/2019 | | | 354,750 | |
100,000 | | US Coatings Acquisition, Inc. / Axalta Coating Systems Dutch Holding B BV(c) | | 5.75% | | 02/01/2021 | | | 136,300 | |
255,000 | | Valeant Pharmaceuticals International(b) | | 7.50% | | 07/15/2021 | | | 276,038 | |
180,000 | | Watco Cos. LLC / Watco Finance Corp.(b) | | 6.38% | | 04/01/2023 | | | 179,100 | |
85,000 | | Windstream Corp.(b) | | 7.75% | | 10/01/2021 | | | 88,188 | |
105,000 | | Windstream Corp. | | 7.50% | | 04/01/2023 | | | 104,212 | |
| | |
See Notes to Financial Statements. | | |
| 76 | | (888) 848-7569 | www.rivernorthfunds.com |
| | |
| RiverNorth/Oaktree High Income Fund | | Schedule of Investments |
| | September 30, 2013 |
| | | | | | | | | | |
| Principal Amount/Description | | Rate | | Maturity | | Value | |
$90,000 | | WMG Acquisition Corp.(c) | | 6.25% | | 01/15/2021 | | $ | 126,018 | |
| | | | | | | | | | |
| | | | | | | | | 22,365,121 | |
| | | | | | | | | | |
| | | |
TOTAL HIGH YIELD (Cost $33,377,068) | | | | | | | 33,198,404 | |
| | | | | | | | | | |
| | | |
| Shares/Description | | | | | | Value | |
| SHORT-TERM INVESTMENTS - 8.35% | | | | | | | | |
3,973,556 | | Northern Institutional Government Select Portfolio, (7 Day Yield 0.01%) | | | | | | | 3,973,556 | |
| | | | | | | | | | |
| | | |
TOTAL SHORT-TERM INVESTMENTS (Cost $3,973,556) | | | | | | | 3,973,556 | |
| | | | | | | | | | |
| | | |
TOTAL INVESTMENTS - 103.91% (Cost $49,793,523) | | | | | | | 49,447,285 | |
| LIABILITIES IN EXCESS OF OTHER ASSETS - -3.91% | | | | | | | (1,860,674) | |
| | | | | | | | | | |
| NET ASSETS - 100.00% | | | | | | $ | 47,586,611 | |
| | | | | | | | | | |
| (a) | All or a portion of this position has not settled as of September 30, 2013. The interest rate shown represents the stated spread over the London Interbank Offered Rate (“LIBOR” or “L”) or the applicable LIBOR floor; the Fund will not accrue interest until the settlement date, at which point LIBOR will be established. |
| (b) | Security exempt from registration under Rule 144A of the Securities Act of 1933. These securities have been deemed liquid under procedures approved by the Fund’s Board of Trustees and may normally be sold to qualified institutional buyers in transactions exempt from registration. Total market value of Rule 144A securities amounts to $13,089,562, which represents approximately 27.51% of net assets as of September 30, 2013. |
| (c) | Securities were purchased pursuant to Regulation S under the Securities Act of 1933, which exempts securities offered and sold outside of the United States from registration. Such securities cannot be sold in the United States without either an effective registration statement filed pursuant to the Securities Act of 1933, or pursuant to an exemption from registration. These securities have been deemed liquid under procedures approved by the Fund’s Board of Trustees. As of September 30, 2013, the aggregate market value of those securities was $6,244,459, representing 13.12% of net assets. |
| (d) | Pay-in-kind securities. |
Common Abbreviations:
BV - Besloten Vennootschap a Dutch private limited liability company.
GmbH - Gesellschaft mit beschrankter Haftung is the German term for a company with limited liability.
KG - Kommanditgesellschaft is the German term for a private limited company.
LLC - Limited Liability Corp.
LP - Limited Partnership.
| | |
See Notes to Financial Statements. | | |
| Annual Report | September 30, 2013 | | 77 |
| | |
| RiverNorth/Oaktree High Income Fund | | Schedule of Investments |
| | September 30, 2013 |
Ltd. - Limited.
PLC - Public Limited Co.
Pty. - Proprietary.
SA - Generally designates corporations in various countries, mostly those employing the civil law.
SAS - Societe per actions simplifiee is the French term for a joint stock company.
SCA - Societe en commandite pe actiuni is the Romanian term for limited liability partnership.
OUTSTANDING FORWARD FOREIGN CURRENCY CONTRACTS
| | | | | | | | | | | | | | | | | | |
| Counterparty | | Foreign
Currency | | Contracted
Amount* | | | Contract
Type | | Settlement
Date | | Current
Value | | | Unrealized
Depreciation | |
Northern Trust - London | | CHF | | | 160,228 | | | Sale | | 10/04/2013 | | $ | 177,179 | | | $ | (6,234) | |
Northern Trust - London | | EUR | | | 4,760,413 | | | Sale | | 10/04/2013 | | | 6,440,177 | | | | (157,936) | |
Northern Trust - London | | GBP | | | 1,256,086 | | | Sale | | 10/04/2013 | | | 2,033,413 | | | | (71,218) | |
| | | | | | | | | | | | | | | | | | |
| | | | | | | | | | | | | | | | $ | (235,388) | |
| | | | | | | | | | | | | | | | | | |
* The contracted amount is stated in the currency in which the security is denominated.
| | |
| See Notes to Financial Statements. | | |
| 78 | | (888) 848-7569 | www.rivernorthfunds.com |
| | |
| RiverNorth Dynamic Buy-Write Fund | | Schedule of Investments |
| | September 30, 2013 |
| | | | | | |
Shares/Description | | | Value | |
COMMON STOCKS - 16.61% | |
Agriculture - 0.79% | | | | |
| 2,000 | | Lorillard, Inc.(a) | | $ | 89,560 | |
| 500 | | Philip Morris International, Inc. | | | 43,295 | |
| | | | | | |
| | | | | 132,855 | |
| | | | | | |
Biotechnology - 0.57% | | | | |
| 400 | | Biogen Idec, Inc.(a)(b) | | | 96,304 | |
Coal - 0.43% | | | | |
| 17,600 | | Arch Coal, Inc.(a) | | | 72,336 | |
Commercial Services - 0.40% | | | | |
| 2,500 | | Iron Mountain, Inc.(a) | | | 67,550 | |
Computers - 2.79% | | | | |
| 400 | | Apple, Inc.(a) | | | 190,700 | |
| 4,570 | | Blackberry Ltd.(a)(b) | | | 36,309 | |
| 11,500 | | Hewlett-Packard Co.(a) | | | 241,385 | |
| | | | | | |
| | | | | 468,394 | |
| | | | | | |
Electric -0.43% | | | | |
| 1,500 | | Exelon Corp.(a) | | | 44,460 | |
| 1,000 | | NRG Energy, Inc.(a) | | | 27,330 | |
| | | | | | |
| | | | | 71,790 | |
| | | | | | |
Food - 0.88% | | | | |
| 2,000 | | General Mills, Inc.(a) | | | 95,840 | |
| 1,000 | | Kraft Foods Group, Inc.(a) | | | 52,480 | |
| | | | | | |
| | | | | 148,320 | |
| | | | | | |
Internet - 1.19% | | | | |
| 500 | | Facebook, Inc. - Class A(a)(b) | | | 25,115 | |
| 200 | | Google, Inc. - Class A(a)(b) | | | 175,182 | |
| | | | | | |
| | | | | 200,297 | |
| | | | | | |
Machinery - 0.46% | | | | |
| 1,500 | | Joy Global, Inc. | | | 76,560 | |
Media - 0.38% | | | | |
| 1,000 | | The Walt Disney Co.(a) | | | 64,490 | |
Mining - 0.67% | | | | |
| 3,000 | | Newmont Mining Corp.(a) | | | 84,300 | |
| 2,600 | | Pan American Silver Corp.(a) | | | 27,430 | |
| | | | | | |
| | | | | 111,730 | |
| | | | | | |
Oil & Gas - 1.47% | | | | |
| 3,000 | | Encana Corp.(a) | | | 51,990 | |
| 1,000 | | Exxon Mobil Corp. | | | 86,040 | |
| 800 | | Occidental Petroleum Corp.(a) | | | 74,832 | |
| 1,500 | | Statoil ASA, ADR(a) | | | 34,020 | |
| | | | | | |
| | | | | 246,882 | |
| | | | | | |
See Notes to Financial Statements.
| | |
| Annual Report | September 30, 2013 | | 79 |
| | |
| RiverNorth Dynamic Buy-Write Fund | | Schedule of Investments |
| | September 30, 2013 |
| | | | | | |
Shares/Description | | | Value | |
Pharmaceuticals - 1.57% | | | | |
| 1,800 | | Abbott Laboratories(a) | | $ | 59,742 | |
| 1,000 | | Eli Lilly & Co. | | | 50,330 | |
| 1,000 | | Merck & Co., Inc.(a) | | | 47,609 | |
| 3,500 | | Pfizer, Inc. | | | 100,537 | |
| 200 | | Zoetis, Inc.(a) | | | 6,224 | |
| | | | | | |
| | | | | 264,442 | |
| | | | | | |
REITS - 0.43% | | | | |
| 3,500 | | Annaly Capital Management, Inc.(a) | | | 40,530 | |
| 500 | | Ventas, Inc.(a) | | | 30,750 | |
| | | | | | |
| | | | | 71,280 | |
| | | | | | |
Retail - 1.19% | | | | |
| 1,000 | | Abercrombie & Fitch Co. - Class A(a) | | | 35,370 | |
| 1,000 | | Darden Restaurants, Inc. | | | 46,290 | |
| 1,600 | | Wal-Mart Stores, Inc. | | | 118,336 | |
| | | | | | |
| | | | | 199,996 | |
| | | | | | |
Semiconductors - 1.15% | | | | |
| 1,600 | | Broadcom Corp. - Class A(a) | | | 41,632 | |
| 1,000 | | First Solar, Inc.(a)(b) | | | 40,210 | |
| 4,000 | | Intel Corp. | | | 91,684 | |
| 1,700 | | Marvell Technology Group Ltd.(a) | | | 19,550 | |
| | | | | | |
| | | | | 193,076 | |
| | | | | | |
Software - 0.42% | | | | |
| 2,100 | | Microsoft Corp.(a) | | | 69,888 | |
Telecommunications - 1.39% | | | | |
| 2,000 | | CenturyLink, Inc.(a) | | | 62,760 | |
| 2,500 | | Cisco Systems, Inc. | | | 58,578 | |
| 1,300 | | JDS Uniphase Corp.(a)(b) | | | 19,123 | |
| 2,000 | | Verizon Communications, Inc.(a) | | | 93,350 | |
| | | | | | |
| | | | | 233,811 | |
| | | | | | |
| |
TOTAL COMMON STOCKS (Cost $2,920,392) | | | 2,790,001 | |
| | | | | | |
|
EXCHANGE-TRADED FUNDS - 26.41% | |
| 8,100 | | Consumer Staples Select Sector SPDR® Fund | | | 322,380 | |
| 27,100 | | Financial Select Sector SPDR® Fund | | | 539,425 | |
| 2,000 | | Health Care Select Sector SPDR® Fund | | | 101,180 | |
| 2,200 | | Industrial Select Sector SPDR® Fund | | | 102,091 | |
| 29,600 | | Market Vectors® Gold Miners ETF(a) | | | 740,592 | |
| 2,500 | | Market Vectors® Semiconductor ETF(a) | | | 99,700 | |
| 7,500 | | SPDR® S&P 500® ETF Trust(a) | | | 1,260,075 | |
| 1,700 | | SPDR® S&P® Retail ETF | | | 139,431 | |
| 32,500 | | Technology Select Sector SPDR® Fund | | | 1,041,300 | |
See Notes to Financial Statements.
| | |
| 80 | | (888) 848-7569 | www.rivernorthfunds.com |
| | |
| RiverNorth Dynamic Buy-Write Fund | | Schedule of Investments |
| | September 30, 2013 |
| | | | | | |
Shares/Description | | | Value | |
| 2,400 | | Utilities Select Sector SPDR® Fund(a) | | $ | 89,686 | |
| | | | | | |
| |
TOTAL EXCHANGE-TRADED FUNDS (Cost $4,510,687) | | | 4,435,860 | |
| | | | | | |
|
PREFERRED STOCKS - 7.13% | |
| 18,800 | | The Goodyear Tire & Rubber Co., 5.875% | | | 1,197,184 | |
| | | | | | |
| |
TOTAL PREFERRED STOCKS (Cost $934,198) | | | 1,197,184 | |
| | | | | | |
| | | | | | | | | | | | |
Number of
Contracts | | Description | | Exercise
Price | | | Maturity
Date | | Value | |
PURCHASED OPTIONS - 0.52% | |
Purchased Call Options - 0.11% | |
32 | | EMC Corp. | | | $27.00 | | | 01/18/2014 | | | 2,128 | |
150 | | Financial Select Sector SPDR® Fund | | | 21.00 | | | 01/18/2014 | | | 4,575 | |
20 | | Freeport-McMoRan Copper & Gold, Inc. | | | 34.00 | | | 11/16/2013 | | | 1,680 | |
8 | | Occidental Petroleum Corp. | | | 95.00 | | | 11/16/2013 | | | 1,972 | |
20 | | Oracle Corp. | | | 33.00 | | | 12/21/2013 | | | 2,760 | |
15 | | QUALCOMM, Inc. | | | 67.50 | | | 01/18/2014 | | | 4,800 | |
| | | | | | | | | | | | |
| |
TOTAL PURCHASED CALL OPTIONS (Cost $22,056) | | | 17,915 | |
| | | | | | | | | | | | |
|
Purchased Put Options - 0.41% | |
2 | | Google, Inc. | | | 900.00 | | | 10/19/2013 | | | 7,140 | |
65 | | Hewlett-Packard Co. | | | 26.00 | | | 01/18/2014 | | | 35,262 | |
6 | | ICICI Bank Ltd. | | | 26.00 | | | 10/19/2013 | | | 153 | |
15 | | Joy Global, Inc. | | | 46.00 | | | 01/18/2014 | | | 2,587 | |
200 | | Powershares QQQ Trust Series 1 | | | 79.00 | | | 10/19/2013 | | | 20,900 | |
75 | | SPDR® S&P 500® ETF Trust | | | 160.00 | | | 10/19/2013 | | | 3,938 | |
| | | | | | | | | | | | |
| |
TOTAL PURCHASED PUT OPTIONS (Cost $64,430) | | | 69,980 | |
| | | | | | | | | | | | |
| |
TOTAL PURCHASED OPTIONS (Cost $86,486) | | | 87,895 | |
| | | | | | | | | | | | |
See Notes to Financial Statements.
| | |
| Annual Report | September 30, 2013 | | 81 |
| | |
| RiverNorth Dynamic Buy-Write Fund | | Schedule of Investments |
| | September 30, 2013 |
| | | | | | |
Shares/Description | | | Value | |
SHORT-TERM INVESTMENTS - 10.62% | |
| 1,784,283 | | Northern Institutional Government Select Portfolio, (7 Day Yield 0.01%) | | | $ 1,784,283 | |
| | | | | | |
| |
TOTAL SHORT-TERM INVESTMENTS (Cost $1,784,283) | | | 1,784,283 | |
| | | | | | |
| |
TOTAL INVESTMENTS - 61.29% (Cost $10,236,046) | | | 10,295,223 | |
SEGREGATED CASH - 18.05%(c) | | | 3,032,258 | |
OTHER ASSETS IN EXCESS OF LIABILITIES - 20.66% | | | 3,470,397 | |
| | | | | | |
NET ASSETS - 100.00% | | $ | 16,797,878 | |
| | | | | | |
| | | | | | |
| (a) | All or a portion of this security may be subject to call/put written options. |
| (b) | Non-income producing security. |
| (c) | Cash is being held as collateral for written options. |
Common Abbreviations:
ADR – American Depositary Receipt.
ASA - Allmennaksjeselskap is the Norwegian term for a public limited company.
ETF - Exchange-Traded Fund.
Ltd. - Limited.
S&P - Standard and Poor’s.
SPDR - Standard and Poor’s Depositary Receipt.
See Notes to Financial Statements.
| | |
| 82 | | (888) 848-7569 | www.rivernorthfunds.com |
| | |
| RiverNorth Dynamic Buy-Write Fund | | Schedule of Written Options |
| | September 30, 2013 |
| | | | | | | | | | | | |
Number of Contracts | | | | Exercise
Price | | | Maturity Date | | Value | |
Written Call Options | | | | | | | | | | | | |
(18) | | Abbott Laboratories | | $ | 34.00 | | | 10/19/2013 | | $ | (486 | ) |
(10) | | Abercrombie & Fitch Co. - Class A | | | 41.00 | | | 11/16/2013 | | | (345 | ) |
(35) | | Annaly Capital Management, Inc. | | | 12.00 | | | 01/18/2014 | | | (1,383 | ) |
(4) | | Apple, Inc. | | | 500.00 | | | 10/19/2013 | | | (1,850 | ) |
(38) | | Arch Coal, Inc. | | | 5.50 | | | 10/19/2013 | | | (57 | ) |
(38) | | Arch Coal, Inc. | | | 5.00 | | | 10/19/2013 | | | (133 | ) |
(100) | | Arch Coal, Inc. | �� | | 5.50 | | | 01/18/2014 | | | (1,600 | ) |
(4) | | Biogen Idec, Inc. | | | 225.00 | | | 10/19/2013 | | | (7,020 | ) |
(16) | | Blackberry Ltd. | | | 10.00 | | | 10/04/2013 | | | (8 | ) |
(1) | | Blackberry Ltd. | | | 12.00 | | | 11/16/2013 | | | (2 | ) |
(16) | | Broadcom Corp. | | | 27.00 | | | 10/19/2013 | | | (416 | ) |
(20) | | CenturyLink, Inc. | | | 38.00 | | | 10/19/2013 | | | (50 | ) |
(30) | | Encana Corp. | | | 18.00 | | | 10/19/2013 | | | (675 | ) |
(15) | | Exelon Corp. | | | 32.00 | | | 01/18/2014 | | | (525 | ) |
(5) | | Facebook, Inc. - Class A | | | 46.00 | | | 11/16/2013 | | | (3,250 | ) |
(10) | | First Solar, Inc. | | | 45.00 | | | 10/19/2013 | | | (650 | ) |
(20) | | General Mills, Inc. | | | 46.00 | | | 10/19/2013 | | | (3,930 | ) |
(2) | | Google, Inc. - Class A | | | 925.00 | | | 10/19/2013 | | | (1,140 | ) |
(50) | | Hewlett-Packard Co. | | | 24.00 | | | 10/19/2013 | | | (250 | ) |
(25) | | Iron Mountain, Inc. | | | 30.00 | | | 01/18/2014 | | | (4,250 | ) |
(13) | | JDS Uniphase Corp. | | | 15.00 | | | 10/19/2013 | | | (429 | ) |
(10) | | Kraft Foods Group, Inc. | | | 57.50 | | | 12/21/2013 | | | (300 | ) |
(20) | | Lorillard, Inc. | | | 45.00 | | | 12/21/2013 | | | (3,270 | ) |
(31) | | Market Vectors® Gold Miners ETF | | | 26.00 | | | 10/19/2013 | | | (1,798 | ) |
(195) | | Market Vectors® Gold Miners ETF | | | 32.00 | | | 01/18/2014 | | | (9,750 | ) |
(70) | | Market Vectors® Gold Miners ETF | | | 26.00 | | | 01/18/2014 | | | (13,090 | ) |
(23) | | Market Vectors® Semiconductor ETF | | | 38.00 | | | 11/16/2013 | | | (5,462 | ) |
(17) | | Marvell Technology Group Ltd. | | | 13.00 | | | 10/19/2013 | | | (136 | ) |
(10) | | Merck & Co., Inc. | | | 50.00 | | | 11/16/2013 | | | (490 | ) |
(21) | | Microsoft Corp. | | | 35.00 | | | 12/21/2013 | | | (1,428 | ) |
(30) | | Newmont Mining Corp. | | | 37.00 | | | 12/21/2013 | | | (555 | ) |
(10) | | NRG Energy, Inc. | | | 30.00 | | | 12/21/2013 | | | (525 | ) |
(8) | | Occidental Petroleum Corp. | | | 90.00 | | | 10/19/2013 | | | (3,380 | ) |
(26) | | Pan American Silver Corp. | | | 12.00 | | | 10/19/2013 | | | (195 | ) |
(75) | | SPDR® S&P 500® ETF Trust | | | 169.00 | | | 10/19/2013 | | | (13,688 | ) |
(15) | | Statoil ASA, ADR | | | 20.00 | | | 10/19/2013 | | | (4,050 | ) |
(50) | | The Goodyear Tire & Rubber Co. | | | 18.00 | | | 01/18/2014 | | | (24,000 | ) |
(510) | | The Goodyear Tire & Rubber Co. | | | 19.00 | | | 01/18/2014 | | | (204,000 | ) |
(10) | | The Walt Disney Co. | | | 65.00 | | | 10/19/2013 | | | (905 | ) |
(24) | | Utilities Select Sector SPDR® Fund | | | 40.00 | | | 12/21/2013 | | | (384 | ) |
(5) | | Ventas, Inc. | | | 60.00 | | | 10/19/2013 | | | (1,100 | ) |
(10) | | Verizon Communications, Inc. | | | 50.00 | | | 12/21/2013 | | | (375 | ) |
See Notes to Financial Statements.
| | |
| Annual Report | September 30, 2013 | | 83 |
| | |
| RiverNorth Dynamic Buy-Write Fund | | Schedule of Written Options |
| | September 30, 2013 |
| | | | | | | | | | | | |
Number of
Contracts | | | | Exercise
Price | | | Maturity Date | | Value | |
(2) | | Zoetis, Inc. | | $ | 31.00 | | | 10/19/2013 | | $ | (140 | ) |
| | | �� | | | | | | | | | |
| | | |
Total Written Call Options (Proceeds $ 175,617) | | | | | | | | $ | (317,470 | ) |
| | | | | | | | | | | | |
| | | | |
Written Put Options | | | | | | | | | | | | |
(10) | | AbbVie, Inc. | | | 37.50 | | | 11/16/2013 | | | (150 | ) |
(5) | | Agrium, Inc. | | | 80.00 | | | 01/18/2014 | | | (1,675 | ) |
(4) | | Alexion Pharmaceuticals, Inc. | | | 100.00 | | | 10/19/2013 | | | (90 | ) |
(16) | | Allegheny Technologies, Inc. | | | 25.00 | | | 10/19/2013 | | | (40 | ) |
(20) | | Amgen, Inc. | | | 97.50 | | | 10/19/2013 | | | (230 | ) |
(16) | | AngloGold Ashanti Ltd. | | | 13.00 | | | 10/19/2013 | | | (840 | ) |
(35) | | Annaly Capital Management, Inc. | | | 10.00 | | | 01/18/2014 | | | (858 | ) |
(8) | | Apple, Inc. | | | 475.00 | | | 10/19/2013 | | | (9,120 | ) |
(15) | | Archer-Daniels-Midland Co. | | | 35.00 | | | 11/16/2013 | | | (1,170 | ) |
(20) | | Ascena Retail Group, Inc. | | | 16.00 | | | 10/19/2013 | | | (50 | ) |
(1) | | AutoZone, Inc. | | | 390.00 | | | 12/21/2013 | | | (600 | ) |
(6) | | Bed Bath & Beyond, Inc. | | | 70.00 | | | 10/19/2013 | | | (69 | ) |
(5) | | Biogen Idec, Inc. | | | 205.00 | | | 10/19/2013 | | | (212 | ) |
(1) | | Blackberry Ltd. | | | 8.00 | | | 11/16/2013 | | | (69 | ) |
(20) | | Boston Scientific Corp. | | | 11.00 | | | 10/19/2013 | | | (240 | ) |
(20) | | Bristol-Myers Squibb Co. | | | 41.00 | | | 12/21/2013 | | | (1,010 | ) |
(15) | | Cablevision Systems Corp. | | | 16.00 | | | 12/21/2013 | | | (1,650 | ) |
(25) | | Citigroup, Inc. | | | 45.00 | | | 12/21/2013 | | | (2,550 | ) |
(10) | | ConAgra Foods, Inc. | | | 31.00 | | | 10/19/2013 | | | (950 | ) |
(15) | | Delta Air Lines, Inc. | | | 17.00 | | | 10/19/2013 | | | (38 | ) |
(10) | | Dollar General Corp. | | | 47.00 | | | 11/16/2013 | | | (125 | ) |
(15) | | DR Horton, Inc. | | | 17.00 | | | 10/19/2013 | | | (113 | ) |
(21) | | eBay, Inc. | | | 52.50 | | | 11/16/2013 | | | (2,394 | ) |
(50) | | Energy Select Sector SPDR® Fund | | | 82.00 | | | 10/19/2013 | | | (4,550 | ) |
(20) | | Exelon Corp. | | | 29.00 | | | 10/19/2013 | | | (500 | ) |
(10) | | Facebook, Inc. - Class A | | | 38.00 | | | 12/21/2013 | | | (685 | ) |
(10) | | Facebook, Inc. - Class A | | | 35.00 | | | 01/18/2014 | | | (515 | ) |
(10) | | FedEx Corp. | | | 105.00 | | | 10/19/2013 | | | (290 | ) |
(2) | | Google, Inc. - Class A | | | 865.00 | | | 10/19/2013 | | | (3,420 | ) |
(10) | | H&R Block, Inc. | | | 26.00 | | | 10/19/2013 | | | (300 | ) |
(10) | | HCA Holdings, Inc. | | | 41.00 | | | 10/19/2013 | | | (400 | ) |
(10) | | HCP, Inc. | | | 40.00 | | | 10/19/2013 | | | (475 | ) |
(6) | | ICICI Bank, Ltd. | | | 24.00 | | | 10/19/2013 | | | (72 | ) |
(16) | | ICICI Bank, Ltd. | | | 26.00 | | | 12/21/2013 | | | (1,608 | ) |
(20) | | International Game Technology | | | 20.00 | | | 10/19/2013 | | | (2,600 | ) |
(17) | | Intrepid Potash, Inc. | | | 9.00 | | | 12/21/2013 | | | (212 | ) |
(50) | | JC Penney Co., Inc. | | | 12.00 | | | 01/18/2014 | | | (18,625 | ) |
(10) | | Kinder Morgan, Inc. | | | 35.00 | | | 12/21/2013 | | | (1,435 | ) |
(10) | | Kraft Foods Group, Inc. | | | 50.00 | | | 12/21/2013 | | | (1,175 | ) |
(20) | | Lennar Corp. | | | 32.00 | | | 10/19/2013 | | | (460 | ) |
See Notes to Financial Statements.
| | |
| 84 | | (888) 848-7569 | www.rivernorthfunds.com |
| | |
| RiverNorth Dynamic Buy-Write Fund | | Schedule of Written Options |
| | September 30, 2013 |
| | | | | | | | | | | | |
Number of Contracts | | | | Exercise
Price | | | Maturity
Date | | Value | |
(10) | | Marathon Oil Corp. | | $ | 33.00 | | | 10/19/2013 | | $ | (225 | ) |
(10) | | Marathon Petroleum Corp. | | | 65.00 | | | 10/19/2013 | | | (2,225 | ) |
(10) | | Marathon Petroleum Corp. | | | 55.00 | | | 01/18/2014 | | | (1,400 | ) |
(23) | | Market Vectors® Semiconductor ETF | | | 37.00 | | | 11/16/2013 | | | (690 | ) |
(160) | | Market Vectors® Semiconductor ETF | | | 35.00 | | | 11/16/2013 | | | (2,000 | ) |
(10) | | Merck & Co., Inc. | | | 46.00 | | | 11/16/2013 | | | (740 | ) |
(75) | | Microsoft Corp. | | | 31.00 | | | 10/19/2013 | | | (638 | ) |
(21) | | Microsoft Corp. | | | 31.00 | | | 12/21/2013 | | | (1,344 | ) |
(40) | | Mondelez International, Inc. | | | 29.00 | | | 12/21/2013 | | | (1,820 | ) |
(15) | | Navistar International Corp. | | | 36.00 | | | 10/25/2013 | | | (1,987 | ) |
(15) | | Newmont Mining Corp. | | | 23.00 | | | 12/21/2013 | | | (832 | ) |
(10) | | Noble Corp. | | | 33.00 | | | 12/21/2013 | | | (600 | ) |
(9) | | ONEOK, Inc. | | | 37.50 | | | 10/19/2013 | | | (45 | ) |
(24) | | Pan American Silver Corp. | | | 12.00 | | | 10/19/2013 | | | (3,720 | ) |
(30) | | Peabody Energy Corp. | | | 16.00 | | | 10/19/2013 | | | (630 | ) |
(10) | | PepsiCo, Inc. | | | 72.50 | | | 01/18/2014 | | | (920 | ) |
(100) | | Powershares QQQ Trust Series 1 | | | 76.00 | | | 10/19/2013 | | | (3,050 | ) |
(8) | | QUALCOMM, Inc. | | | 65.00 | | | 10/19/2013 | | | (360 | ) |
(6) | | Simon Property Group, Inc. | | | 145.00 | | | 11/16/2013 | | | (2,145 | ) |
(75) | | SPDR® S&P 500® ETF Trust | | | 153.00 | | | 10/19/2013 | | | (1,538 | ) |
(75) | | SPDR® S&P 500® ETF Trust | | | 150.00 | | | 12/21/2013 | | | (7,500 | ) |
(10) | | The ADT Corp. | | | 35.00 | | | 10/19/2013 | | | (50 | ) |
(25) | | The ADT Corp. | | | 36.00 | | | 10/19/2013 | | | (187 | ) |
(20) | | The Charles Schwab Corp. | | | 20.00 | | | 12/21/2013 | | | (1,550 | ) |
(20) | | The Goodyear Tire & Rubber Co. | | | 20.00 | | | 11/16/2013 | | | (900 | ) |
(10) | | The Mosaic Co. | | | 35.00 | | | 12/21/2013 | | | (430 | ) |
(10) | | The Mosaic Co. | | | 37.50 | | | 12/21/2013 | | | (895 | ) |
(15) | | The Procter & Gamble Co. | | | 72.50 | | | 11/16/2013 | | | (1,673 | ) |
(10) | | The Walt Disney Co. | | | 57.50 | | | 10/19/2013 | | | (60 | ) |
(6) | | Time Warner Cable, Inc. | | | 100.00 | | | 01/18/2014 | | | (2,130 | ) |
(12) | | United Continental Holdings, Inc. | | | 24.00 | | | 12/21/2013 | | | (582 | ) |
(25) | | United States Steel Corp. | | | 19.00 | | | 11/16/2013 | | | (1,675 | ) |
(24) | | Utilities Select Sector SPDR® Fund | | | 35.00 | | | 12/21/2013 | | | (1,068 | ) |
(10) | | Walgreen Co. | | | 44.00 | | | 10/19/2013 | | | (20 | ) |
(15) | | Walgreen Co. | | | 42.00 | | | 01/18/2014 | | | (480 | ) |
(10) | | WellPoint, Inc. | | | 77.50 | | | 12/21/2013 | | | (1,715 | ) |
(12) | | Yahoo!, Inc. | | | 26.00 | | | 10/19/2013 | | | (24 | ) |
| | | | | | | | | | | | |
| | | |
Total Written Put Options (Proceeds $170,308) | | | | | | | | $ | (109,413 | ) |
| | | | | | | | | | | | |
| | | |
Total Written Options (Proceeds $345,925) | | | | | | | | $ | (426,883 | ) |
| | | | | | | | | | | | |
| | | | | | | | | | | | |
See Notes to Financial Statements.
| | |
| Annual Report | September 30, 2013 | | 85 |
| | |
| RiverNorth Core Opportunity Fund | | |
| Statement of Assets and Liabilities | | September 30, 2013 |
| | | | |
ASSETS: | | | | |
Investment in securities: | | | | |
At cost | | $ | 572,764,430 | |
| | | | |
At value | | $ | 650,767,091 | |
| |
Receivable for fund investments sold | | | 1,894,397 | |
Dividends receivable | | | 760,826 | |
Receivable for fund shares sold | | | 544,099 | |
Interest receivable | | | 903 | |
Prepaid expenses and other assets | | | 33,390 | |
| |
Total Assets | | | 654,000,706 | |
| |
| |
LIABILITIES: | | | | |
Facility loan fee payable | | | 10,275 | |
Payable for fund investments purchased | | | 2,520,644 | |
Payable for fund shares redeemed | | | 3,354,767 | |
Payable to Adviser | | | 529,805 | |
Payable for Fund Accounting and Administration fees | | | 22,042 | |
Accrued 12b-1 fees | | | 132,451 | |
Payable for Custodian fees | | | 11,183 | |
Payable for Audit fees | | | 17,325 | |
Payable to Trustees and Officers | | | 3,673 | |
Other accrued expenses | | | 33,345 | |
| |
Total Liabilities | | | 6,635,510 | |
| |
Net Assets | | $ | 647,365,196 | |
| |
| |
| |
NET ASSETS CONSIST OF: | | | | |
Paid-in capital | | $ | 540,652,700 | |
Accumulated net investment income | | | 1,159 | |
Accumulated net realized gain on investments | | | 28,708,676 | |
Net unrealized appreciation on investments | | | 78,002,661 | |
| |
Net Assets | | $ | 647,365,196 | |
| |
| |
| |
PRICING OF SHARES: | | | | |
Net Assets | | $ | 647,365,196 | |
Shares of beneficial interest outstanding (unlimited number of shares, no par value) | | | 51,176,212 | |
| |
Net Asset Value Per Share, Offering and Redemption Price Per Share | | $ | 12.65 | |
| |
| |
Minimum Redemption Price Per Share(a) | | $ | 12.40 | |
| |
| |
| (a) | The Fund will impose a 2.00% redemption fee on shares redeemed within 90 days of purchase. |
See Notes to Financial Statements.
| | |
| 86 | | (888) 848-7569 | www.rivernorthfunds.com |
| | |
| RiverNorth/DoubleLine Strategic Income Fund | | |
Statement of Assets and Liabilities | | September 30, 2013 |
| | | | |
ASSETS: | | | | |
Investment in securities: | | | | |
At cost | | $ | 1,059,737,578 | |
| | | | |
At value | | $ | 1,049,493,093 | |
| |
Interest receivable | | | 4,455,953 | |
Receivable for fund investments sold | | | 2,950,523 | |
Receivable for fund shares sold | | | 2,141,074 | |
Dividends receivable | | | 1,660,424 | |
Prepaid offering costs | | | 17,956 | |
Prepaid expenses and other assets | | | 60,281 | |
| |
Total Assets | | | 1,060,779,304 | |
| |
| |
LIABILITIES: | | | | |
Facility loan fee payable | | | 17,910 | |
Payable for fund investments purchased | | | 1,505,955 | |
Payable for fund shares redeemed | | | 1,817,564 | |
Payable to Adviser | | | 652,303 | |
Payable for Fund Accounting and Administration fees | | | 68,978 | |
Accrued 12b-1 fees - Class R Shares | | | 56,051 | |
Payable for Custodian fees | | | 28,588 | |
Payable for Audit fees | | | 20,325 | |
Payable to Trustees and Officers | | | 3,151 | |
Other accrued expenses | | | 74,941 | |
| |
Total Liabilities | | | 4,245,766 | |
| |
Net Assets | | $ | 1,056,533,538 | |
| |
| |
| |
NET ASSETS CONSIST OF: | | | | |
Paid-in capital | | $ | 1,071,737,474 | |
Accumulated net investment loss | | | (109,120 | ) |
Accumulated net realized loss on investments | | | (4,850,331 | ) |
Net unrealized depreciation on investments | | | (10,244,485 | ) |
| |
Net Assets | | $ | 1,056,533,538 | |
| |
| |
See Notes to Financial Statements.
| | |
| Annual Report | September 30, 2013 | | 87 |
| | |
| RiverNorth/DoubleLine Strategic Income Fund | | |
Statement of Assets and Liabilities | | September 30, 2013 |
| | | | |
PRICING OF SHARES: | | | | |
Class I Shares | | | | |
Net Assets | | $ | 785,973,802 | |
Shares of beneficial interest outstanding (unlimited number of shares, no par value) | | | 74,018,239 | |
| |
Net Asset Value Per Share, Offering and Redemption Price Per Share | | $ | 10.62 | |
| |
| |
Minimum Redemption Price Per Share(a) | | $ | 10.41 | |
| |
| |
Class R Shares | | | | |
Net Assets | | $ | 270,559,736 | |
Shares of beneficial interest outstanding (unlimited number of shares, no par value) | | | 25,449,386 | |
| |
Net Asset Value Per Share, Offering and Redemption Price Per Share | | $ | 10.63 | |
| |
| |
Minimum Redemption Price Per Share(a) | | $ | 10.42 | |
| |
| |
| (a) | The Fund will impose a 2.00% redemption fee on shares redeemed within 90 days of purchase. |
See Notes to Financial Statements.
| | |
| 88 | | (888) 848-7569 | www.rivernorthfunds.com |
| | |
| RiverNorth/Manning & Napier Dividend Income Fund | | |
Statement of Assets and Liabilities | | September 30, 2013 |
| | | | |
ASSETS | | | | |
Investment in securities: | | | | |
At cost | | $ | 12,617,801 | |
| | | | |
At value | | $ | 13,825,757 | |
| |
Receivable for fund investments sold | | | 1,148,744 | |
Dividends receivable | | | 16,176 | |
Receivable for fund shares sold | | | 6,160 | |
Prepaid expenses and other assets | | | 23,725 | |
| |
Total Assets | | | 15,020,562 | |
| |
| |
LIABILITIES: | | | | |
Payable to custodian due to overdraft | | | 765,090 | |
Facility loan fee payable | | | 253 | |
Payable for fund shares redeemed | | | 221,217 | |
Payable to Adviser | | | 16,090 | |
Payable for Fund Accounting and Administration fees | | | 2,132 | |
Accrued 12b-1 fees - Class R Shares | | | 2,541 | |
Payable for Custodian fees | | | 1,538 | |
Payable for Audit fees | | | 17,325 | |
Payable to Trustees and Officers | | | 202 | |
Other accrued expenses | | | 4,782 | |
| |
Total Liabilities | | | 1,031,170 | |
| |
Net Assets | | $ | 13,989,392 | |
| |
| |
NET ASSETS CONSIST OF: | | | | |
Paid-in capital | | $ | 12,114,530 | |
Accumulated net realized gain on investments | | | 666,906 | |
Net unrealized appreciation on investments | | | 1,207,956 | |
| |
Net Assets | | $ | 13,989,392 | |
| |
| |
PRICING OF SHARES: | | | | |
Class I Shares | | | | |
Net Assets | | $ | 3,066,651 | |
Shares of beneficial interest outstanding (unlimited number of shares, no par value) | | | 262,531 | |
| |
Net Asset Value Per Share, Offering and Redemption Price Per Share | | $ | 11.68 | |
| |
Minimum Redemption Price Per Share(a) | | $ | 11.45 | |
| |
Class R Shares | | | | |
Net Assets | | $ | 10,922,741 | |
Shares of beneficial interest outstanding (unlimited number of shares, no par value) | | | 935,315 | |
| |
Net Asset Value Per Share, Offering and Redemption Price Per Share | | $ | 11.68 | |
| |
Minimum Redemption Price Per Share(a) | | $ | 11.45 | |
| |
| (a) | The Fund will impose a 2.00% redemption fee on shares redeemed within 90 days of purchase. |
| | |
| See Notes to Financial Statements. | | |
| Annual Report | September 30, 2013 | | 89 |
| | |
| RiverNorth/Oaktree High Income Fund | | |
Statement of Assets and Liabilities | | September 30, 2013 |
| | | | |
ASSETS: | | | | |
Investment in securities: | | | | |
At cost | | $ | 49,793,523 | |
| | | | |
At value | | $ | 49,447,285 | |
| |
Foreign currency, at value (Cost $167,686) | | | 169,033 | |
Receivable for fund investments sold | | | 1,653,373 | |
Interest receivable | | | 572,839 | |
Receivable for fund shares sold | | | 262,029 | |
Dividends receivable | | | 30,491 | |
Prepaid offering costs | | | 13,679 | |
Prepaid expenses and other assets | | | 7,737 | |
| |
Total Assets | | | 52,156,466 | |
| |
| |
LIABILITIES: | | | | |
Payable to custodian due to overdraft | | | 433,988 | |
Payable for fund investments purchased | | | 3,160,811 | |
Payable for fund shares redeemed | | | 662,543 | |
Unrealized depreciation on forward foreign currency contracts | | | 235,388 | |
Payable for distributions | | | 82 | |
Payable to Adviser | | | 35,833 | |
Payable for Fund Accounting and Administration fees | | | 5,053 | |
Accrued 12b-1 fees | | | 4,455 | |
Payable for Custodian fees | | | 4,192 | |
Payable for Audit fees | | | 20,325 | |
Payable to Trustees and Officers | | | 930 | |
Other accrued expenses | | | 6,255 | |
| |
Total Liabilities | | | 4,569,855 | |
| |
Net Assets | | $ | 47,586,611 | |
| |
| |
NET ASSETS CONSIST OF: | | | | |
Paid-in capital | | $ | 47,975,614 | |
Accumulated net investment income | | | 231,462 | |
Accumulated net realized loss on investments | | | (44,289) | |
Net unrealized depreciation on investments | | | (576,176) | |
| |
Net Assets | | $ | 47,586,611 | |
| |
| | |
See Notes to Financial Statements. | | |
| 90 | | (888) 848-7569 | www.rivernorthfunds.com |
| | |
| RiverNorth/Oaktree High Income Fund | | |
Statement of Assets and Liabilities | | September 30, 2013 |
| | | | |
PRICING OF SHARES: | | | | |
Class I Shares | | | | |
Net Assets | | $ | 25,472,010 | |
Shares of beneficial interest outstanding (unlimited number of shares, no par value) | | | 2,559,092 | |
| |
Net Asset Value Per Share, Offering and Redemption Price Per Share | | $ | 9.95 | |
| |
Minimum Redemption Price Per Share(a) | | $ | 9.75 | |
| |
Class R Shares | | | | |
Net Assets | | $ | 22,114,601 | |
Shares of beneficial interest outstanding (unlimited number of shares, no par value) | | | 2,222,839 | |
| |
Net Asset Value Per Share, Offering and Redemption Price Per Share | | $ | 9.95 | |
| |
Minimum Redemption Price Per Share(a) | | $ | 9.75 | |
| |
| (a) | The Fund will impose a 2.00% redemption fee on shares redeemed within 90 days of purchase. |
| | |
| See Notes to Financial Statements. | | |
| Annual Report | September 30, 2013 | | 91 |
| | |
| RiverNorth Dynamic Buy-Write Fund | | |
Statement of Assets and Liabilities | | September 30, 2013 |
| | | | |
ASSETS: | | | | |
Investment in securities: | | | | |
At cost | | $ | 10,236,046 | |
| | | | |
At value | | $ | 10,295,223 | |
| |
Cash | | | 3,032,258 | |
Cash held as collateral | | | 3,032,258 | |
Deposit with broker for written options | | | 937,054 | |
Receivable for fund investments sold | | | 263,918 | |
Receivable for fund shares sold | | | 26,082 | |
Dividends receivable | | | 25,762 | |
Prepaid offering costs | | | 772 | |
Interest receivable | | | 27 | |
Prepaid expenses and other assets | | | 14,391 | |
| |
Total Assets | | | 17,627,745 | |
| |
| |
LIABILITIES: | | | | |
Written options, at value (Premiums received $345,925) | | | 426,883 | |
Payable for fund investments purchased | | | 167,824 | |
Payable for fund shares redeemed | | | 194,154 | |
Payable to Adviser | | | 7,058 | |
Payable for Fund Accounting and Administration fees | | | 3,302 | |
Accrued 12b-1 fees | | | 3,858 | |
Payable for Custodian fees | | | 4,599 | |
Payable for Audit fees | | | 17,325 | |
Payable to Trustees and Officers | | | 284 | |
Other accrued expenses | | | 4,580 | |
| |
Total Liabilities | | | 829,867 | |
| |
Net Assets | | $ | 16,797,878 | |
| |
| |
NET ASSETS CONSIST OF: | | | | |
Paid-in capital | | $ | 16,031,043 | |
Accumulated net realized gain on investments and written options | | | 788,616 | |
Net unrealized depreciation on investments and written options | | | (21,781) | |
| |
Net Assets | | $ | 16,797,878 | |
| |
| |
PRICING OF SHARES: | | | | |
Net Assets | | $ | 16,797,878 | |
Shares of beneficial interest outstanding (unlimited number of shares, no par value) | | | 1,619,431 | |
| |
Net Asset Value Per Share, Offering and Redemption Price Per Share | | $ | 10.37 | |
| |
Minimum Redemption Price Per Share(a) | | $ | 10.16 | |
| |
| (a) | The Fund will impose a 2.00% redemption fee on shares redeemed within 90 days of purchase. |
| | |
| See Notes to Financial Statements. | | |
| 92 | | (888) 848-7569 | www.rivernorthfunds.com |
| | |
| RiverNorth Core Opportunity Fund | | |
Statement of Operations | | For the Year Ended September 30, 2013 |
| | | | |
INVESTMENT INCOME: | | | | |
Dividend income | | $ | 17,829,834 | |
| |
Total Investment Income | | | 17,829,834 | |
| |
| |
EXPENSES: | | | | |
Investment Adviser fee | | | 5,927,628 | |
12b-1 fees | | | 1,481,907 | |
Accounting and administration fee | | | 237,960 | |
Printing expenses | | | 56,423 | |
Transfer agent expenses | | | 46,587 | |
Custodian expenses | | | 46,219 | |
Compliance expenses | | | 33,201 | |
Registration expenses | | | 27,698 | |
Facility loan fee | | | 23,325 | |
Audit expenses | | | 18,423 | |
Insurance expenses | | | 15,989 | |
Trustee expenses | | | 15,848 | |
Legal expenses | | | 8,434 | |
Miscellaneous expenses | | | 67,733 | |
| |
Total Expenses | | | 8,007,375 | |
| |
Net Investment Income | | | 9,822,459 | |
| |
| |
REALIZED AND UNREALIZED GAIN ON INVESTMENTS: | | | | |
Net realized gain on: | | | | |
Investments | | | 32,697,013 | |
Long-term capital gain distributions from other investment companies | | | 3,933,171 | |
| |
Net change in unrealized appreciation on: | | | | |
Investments | | | 8,612,286 | |
| |
Net Realized and Unrealized Gain on Investments | | | 45,242,470 | |
| |
Net Increase in Net Assets Resulting from Operations | | $ | 55,064,929 | |
| |
| | |
See Notes to Financial Statements. | | |
| Annual Report | September 30, 2013 | | 93 |
| | |
| RiverNorth/DoubleLine Strategic Income Fund | | |
Statement of Operations | | For the Year Ended September 30, 2013 |
| | | | |
INVESTMENT INCOME: | | | | |
Dividend income | | $ | 17,701,981 | |
Interest income | | | 57,595,729 | |
Other income | | | 18,750 | |
| |
Total Investment Income | | | 75,316,460 | |
| |
| |
EXPENSES: | | | | |
Investment Adviser fee | | | 10,167,360 | |
12b-1 fees - Class R Shares | | | 1,001,344 | |
Accounting and administration fee | | | 720,821 | |
Transfer agent expenses | | | 272,761 | |
Custodian expenses | | | 162,755 | |
Printing expenses | | | 114,185 | |
Compliance expenses | | | 109,910 | |
Registration expenses | | | 99,329 | |
Facility loan fee | | | 81,900 | |
Trustee expenses | | | 62,378 | |
Insurance expenses | | | 53,254 | |
Audit expenses | | | 20,423 | |
Legal expenses | | | 13,433 | |
24f-2 expenses | | | 4,372 | |
Miscellaneous expenses | | | 141,841 | |
| |
Total Expenses | | | 13,026,066 | |
| |
Net Investment Income | | | 62,290,394 | |
| |
| |
REALIZED AND UNREALIZED GAIN/(LOSS) ON INVESTMENTS: | | | | |
Net realized gain on: | | | | |
Investments | | | 7,045,020 | |
Long-term capital gain distributions from other investment companies | | | 1,595,279 | |
| |
Net change in unrealized depreciation on: | | | | |
Investments | | | (71,829,885) | |
| |
Net Realized and Unrealized Loss on Investments | | | (63,189,586) | |
| |
Net Decrease in Net Assets Resulting from Operations | | $ | (899,192) | |
| |
| | |
| See Notes to Financial Statements. | | |
| 94 | | (888) 848-7569 | www.rivernorthfunds.com |
| | |
| RiverNorth/Manning & Napier Dividend Income Fund | | |
Statement of Operations | | For the Year Ended September 30, 2013 |
| | | | |
INVESTMENT INCOME: | | | | |
Dividend income | | $ | 462,699 | |
Foreign taxes withheld | | | (5,215) | |
| |
Total Investment Income | | | 457,484 | |
| |
| |
EXPENSES: | | | | |
Investment Adviser fee | | | 138,366 | |
Offering costs | | | 41,683 | |
Transfer agent expenses | | | 26,993 | |
12b-1 fees - Class R Shares | | | 26,808 | |
Audit expenses | | | 18,748 | |
Accounting and administration fee | | | 13,087 | |
Custodian expenses | | | 9,042 | |
Registration expenses | | | 7,143 | |
Printing expenses | | | 5,616 | |
Legal expenses | | | 3,219 | |
Compliance expenses | | | 1,202 | |
Facility loan fee | | | 982 | |
Trustee expenses | | | 627 | |
Insurance expenses | | | 209 | |
24f-2 expenses | | | 104 | |
Miscellaneous expenses | | | 5,293 | |
| |
Total expenses before waiver/reimbursement | | | 299,122 | |
Less fees waived/reimbursed by Investment Adviser: | | | | |
Class I Shares | | | (19,714) | |
Class R Shares | | | (65,892) | |
| |
Net Expenses | | | 213,516 | |
| |
Net Investment Income | | | 243,968 | |
| |
| |
REALIZED AND UNREALIZED GAIN ON INVESTMENTS: | | | | |
Net realized gain on: | | | | |
Investments | | | 872,669 | |
Long-term capital gain distributions from other investment companies | | | 42,003 | |
| |
Net change in unrealized appreciation on: | | | | |
Investments | | | 1,057,181 | |
| |
Net Realized and Unrealized Gain on Investments | | | 1,971,853 | |
| |
Net Increase in Net Assets Resulting from Operations | | $ | 2,215,821 | |
| |
| | |
| See Notes to Financial Statements. | | |
| Annual Report | September 30, 2013 | | 95 |
| | |
| RiverNorth/Oaktree High Income Fund | | |
Statement of Operations | | For the Period December 28, 2012 (inception) to |
| | September 30, 2013 |
| | | | |
INVESTMENT INCOME: | | | | |
Dividend income | | $ | 375,272 | |
Interest income | | | 548,991 | |
| |
Total Investment Income | | | 924,263 | |
| |
| |
EXPENSES: | | | | |
Investment Adviser fee | | | 214,293 | |
Offering costs | | | 38,704 | |
12b-1 fees - Class R Shares | | | 24,943 | |
Audit expenses | | | 21,415 | |
Transfer agent expenses | | | 21,302 | |
Accounting and administration fee | | | 16,534 | |
Custodian expenses | | | 13,589 | |
Compliance expenses | | | 2,078 | |
Printing expenses | | | 1,614 | |
Legal expenses | | | 1,512 | |
Trustee expenses | | | 871 | |
Insurance expenses | | | 817 | |
Miscellaneous expenses | | | 3,116 | |
| |
Total expenses before waiver/reimbursement | | | 360,788 | |
Less fees waived/reimbursed by Investment Adviser: | | | | |
Class I Shares | | | (26,539) | |
Class R Shares | | | (20,011) | |
| |
Net Expenses | | | 314,238 | |
| |
Net Investment Income | | | 610,025 | |
| |
| |
REALIZED AND UNREALIZED GAIN/(LOSS) ON INVESTMENTS: | | | | |
Net realized loss on: | | | | |
Investments | | | (17,464) | |
Foreign currency transactions | | | (42,197) | |
Long-term capital gain distributions from other investment companies | | | 11,511 | |
| |
Net change in unrealized appreciation/(depreciation) on: | | | | |
Investments | | | (607,030) | |
Translation of assets and liabilities denominated in foreign currencies | | | 30,854 | |
| |
Net Realized and Unrealized Loss on Investments | | | (624,326) | |
| |
Net Decrease in Net Assets Resulting from Operations | | $ | (14,301) | |
| |
| | |
See Notes to Financial Statements. | | |
| 96 | | (888) 848-7569 | www.rivernorthfunds.com |
| | |
| RiverNorth Dynamic Buy-Write Fund | | |
Statement of Operations | | For the Period October 12, 2012 (inception) to |
| | September 30, 2013 |
| | | | |
INVESTMENT INCOME: | | | | |
Dividend income | | $ | 189,667 | |
Foreign taxes withheld | | | (894) | |
| |
Total Investment Income | | | 188,773 | |
| |
| |
EXPENSES: | | | | |
Investment Adviser fee | | | 155,699 | |
Custodian expenses | | | 42,736 | |
12b-1 fees | | | 38,925 | |
Offering costs | | | 33,778 | |
Transfer agent expenses | | | 26,422 | |
Audit expenses | | | 18,415 | |
Accounting and administration fee | | | 14,850 | |
Legal expenses | | | 2,003 | |
Compliance expenses | | | 1,391 | |
Printing expenses | | | 1,232 | |
Registration expenses | | | 834 | |
Trustee expenses | | | 752 | |
Insurance expenses | | | 229 | |
Miscellaneous expenses | | | 4,284 | |
| |
Total expenses before waiver/reimbursement | | | 341,550 | |
Less fees waived/reimbursed by Investment Adviser: | | | (61,295) | |
| |
Net Expenses | | | 280,255 | |
| |
Net Investment Loss | | | (91,482) | |
| |
| |
REALIZED AND UNREALIZED GAIN/(LOSS) ON INVESTMENTS: | | | | |
Net realized gain/(loss) on: | | | | |
Investments | | | (147,102) | |
Written Options | | | 989,848 | |
Long-term capital gain distributions from other investment companies | | | 157 | |
| |
Net change in unrealized appreciation/(depreciation) on: | | | | |
Investments | | | 59,177 | |
Written Options | | | (80,958) | |
| |
Net Realized and Unrealized Gain on Investments | | | 821,122 | |
| |
Net Increase in Net Assets Resulting from Operations | | $ | 729,640 | |
| |
| | |
| See Notes to Financial Statements. | | |
| Annual Report | September 30, 2013 | | 97 |
| | |
| RiverNorth Core Opportunity Fund | | |
| Statements of Changes in Net Assets | | |
| | | | | | | | |
| | | For the Year Ended
September 30, 2013 | | | For the Year Ended
September 30, 2012 | |
| |
NET INCREASE IN NET ASSETS FROM OPERATIONS: | | | | | | | | |
Net investment income | | $ | 9,822,459 | | | $ | 9,281,784 | |
Net realized gain on investments | | | 32,697,013 | | | | 22,373,489 | |
Long-term capital gain distributions from other investment companies | | | 3,933,171 | | | | 2,212,488 | |
Net change in unrealized appreciation on investments | | | 8,612,286 | | | | 64,106,622 | |
| |
Net increase in net assets resulting from operations | | | 55,064,929 | | | | 97,974,383 | |
| |
| | |
DISTRIBUTIONS TO SHAREHOLDERS: | | | | | | | | |
From net investment income | | | (15,103,234) | | | | (20,499,992) | |
From net realized gains on investments | | | (23,100,259) | | | | (21,513,345) | |
| |
Net decrease in net assets from distributions to shareholders | | | (38,203,493) | | | | (42,013,337) | |
| |
| | |
CAPITAL SHARE TRANSACTIONS: | | | | | | | | |
Proceeds from shares sold | | | 178,658,565 | | | | 142,129,866 | |
Reinvestment of distributions | | | 37,586,237 | | | | 41,181,736 | |
Cost of shares redeemed | | | (155,089,762) | | | | (158,178,289) | |
Redemption fees(a) | | | 24,918 | | | | 34,290 | |
| |
Net increase in net assets from capital share transactions | | | 61,179,958 | | | | 25,167,603 | |
| |
| | |
Net Increase in Net Assets | | | 78,041,394 | | | | 81,128,649 | |
| | |
NET ASSETS: | | | | | | | | |
Beginning of period | | | 569,323,802 | | | | 488,195,153 | |
| |
End of period (including accumulated net investment income/(loss) of $1,159 and $(349,296), respectively) | | $ | 647,365,196 | | | $ | 569,323,802 | |
| |
| | |
OTHER INFORMATION: | | | | | | | | |
Share Transactions: | | | | | | | | |
Shares sold | | | 14,487,987 | | | | 12,059,869 | |
Shares issued in reinvestment of distributions | | | 3,271,213 | | | | 3,792,057 | |
Shares redeemed | | | (12,600,804) | | | | (13,491,501) | |
| |
Net increase from share transactions | | | 5,158,396 | | | | 2,360,425 | |
| |
| (a) | The Fund will impose a 2.00% redemption fee on shares redeemed within 90 days of purchase. |
| | |
See Notes to Financial Statements. | | |
| 98 | | (888) 848-7569 | www.rivernorthfunds.com |
| | |
| RiverNorth/DoubleLine Strategic Income Fund | | |
| Statements of Changes in Net Assets | | |
| | | | | | | | |
| | | For the Year Ended
September 30, 2013 | | | For the Year Ended
September 30, 2012 | |
| |
NET INCREASE/(DECREASE) IN NET ASSETS FROM OPERATIONS: | |
Net investment income | | $ | 62,290,394 | | | $ | 48,814,843 | |
Net realized gain on investments | | | 7,045,020 | | | | 14,773,662 | |
Long-term capital gain distributions from other investment companies | | | 1,595,279 | | | | 25,567 | |
Net change in unrealized appreciation/(depreciation) on investments | | | (71,829,885) | | | | 60,017,254 | |
| |
Net increase/(decrease) in net assets resulting from operations | | | (899,192) | | | | 123,631,326 | |
| |
| | |
DISTRIBUTIONS TO SHAREHOLDERS: | | | | | | | | |
From net investment income: | | | | | | | | |
Class I Shares | | | (53,073,880) | | | | (37,582,010) | |
Class R Shares | | | (20,673,415) | | | | (18,098,346) | |
From net realized gains on investments: | | | | | | | | |
Class I Shares | | | (7,261,076) | | | | (704,354) | |
Class R Shares | | | (3,482,436) | | | | (352,655) | |
| |
Net decrease in net assets from distributions to shareholders | | | (84,490,807) | | | | (56,737,365) | |
| |
| | |
CAPITAL SHARE TRANSACTIONS: | | | | | | | | |
Class I Shares | | | | | | | | |
Proceeds from shares sold | | | 391,117,558 | | | | 557,176,722 | |
Reinvestment of distributions | | | 44,278,773 | | | | 34,078,733 | |
Cost of shares redeemed | | | (466,135,625) | | | | (89,957,893) | |
Redemption fees(a) | | | 147,578 | | | | 61,046 | |
| |
Net increase/(decrease) in net assets from capital share transactions | | | (30,591,716) | | | | 501,358,608 | |
| |
| | |
Class R Shares | | | | | | | | |
Proceeds from shares sold | | | 125,949,097 | | | | 353,259,674 | |
Reinvestment of distributions | | | 23,633,983 | | | | 17,679,372 | |
Cost of shares redeemed | | | (309,260,010) | | | | (81,644,400) | |
Redemption fees(a) | | | 41,736 | | | | 160,048 | |
| |
Net increase/(decrease) in net assets from capital share transactions | | | (159,635,194) | | | | 289,454,694 | |
| |
| | |
Net Increase/(Decrease) in Net Assets | | | (275,616,909) | | | | 857,707,263 | |
| | |
NET ASSETS: | | | | | | | | |
Beginning of period | | $ | 1,332,150,447 | | | $ | 474,443,184 | |
| |
End of period (including accumulated net investment income/(loss) of $(109,120) and $261,199) | | $ | 1,056,533,538 | | | $ | 1,332,150,447 | |
| |
| | |
| See Notes to Financial Statements. | | |
| Annual Report | September 30, 2013 | | 99 |
| | |
| RiverNorth/DoubleLine Strategic Income Fund | | |
| Statements of Changes in Net Assets | | |
| | | | | | | | |
| | | For the Year Ended
September 30, 2013 | | | For the Year Ended
September 30, 2012 | |
| |
OTHER INFORMATION: | | | | | | | | |
Share Transactions: | | | | | | | | |
Class I Shares | | | | | | | | |
Shares sold | | | 34,901,898 | | | | 51,228,287 | |
Shares issued in reinvestment of distributions | | | 3,992,459 | | | | 3,109,665 | |
Shares redeemed | | | (42,413,050) | | | | (8,205,498) | |
| |
Net increase/(decrease) from share transactions | | | (3,518,693) | | | | 46,132,454 | |
| |
| | |
Class R Shares | | | | | | | | |
Shares sold | | | 11,239,657 | | | | 32,428,937 | |
Shares issued in reinvestment of distributions | | | 2,125,093 | | | | 1,611,147 | |
Shares redeemed | | | (27,893,110) | | | | (7,437,705) | |
| |
Net increase/(decrease) from share transactions | | | (14,528,360) | | | | 26,602,379 | |
| |
| (a) | The Fund will impose a 2.00% redemption fee on shares redeemed within 90 days of purchase. |
| | |
| See Notes to Financial Statements. | | |
| 100 | | (888) 848-7569 | www.rivernorthfunds.com |
| | |
| RiverNorth/Manning & Napier Dividend Income Fund | | |
| Statements of Changes in Net Assets | | |
| | | | | | | | |
| | | For the Year Ended
September 30, 2013 | | | For the Period
July 18, 2012
(Inception) to
September 30, 2012 | |
| |
NET INCREASE IN NET ASSETS FROM OPERATIONS: | | | | | | | | |
Net investment income | | $ | 243,968 | | | $ | 4,847 | |
Net realized gain on investments | | | 872,669 | | | | 40,990 | |
Long-term capital gain distributions from other investment companies | | | 42,003 | | | | – | |
Net change in unrealized appreciation on investments | | | 1,057,181 | | | | 150,775 | |
| |
Net increase in net assets resulting from operations | | | 2,215,821 | | | | 196,612 | |
| |
| | |
DISTRIBUTIONS TO SHAREHOLDERS: | | | | | | | | |
From net investment income: | | | | | | | | |
Class I Shares | | | (116,174) | | | | (2,429) | |
Class R Shares | | | (362,781) | | | | (15,328) | |
From net realized gains on investments: | | | | | | | | |
Class I Shares | | | (19,020) | | | | – | |
Class R Shares | | | (67,585) | | | | – | |
| |
Net decrease in net assets from distributions to shareholders | | | (565,560) | | | | (17,757) | |
| |
| | |
CAPITAL SHARE TRANSACTIONS: | | | | | | | | |
Class I Shares | | | | | | | | |
Proceeds from shares sold | | | 3,742,082 | | | | 1,046,429 | |
Reinvestment of distributions | | | 133,382 | | | | 2,429 | |
Cost of shares redeemed | | | (2,268,152) | | | | (99) | |
Redemption fees(a) | | | 2,026 | | | | – | |
| |
Net increase in net assets from capital share transactions | | | 1,609,338 | | | | 1,048,759 | |
| |
| | |
Class R Shares | | | | | | | | |
Proceeds from shares sold | | | 7,200,285 | | | | 6,214,805 | |
Reinvestment of distributions | | | 421,675 | | | | 15,297 | |
Cost of shares redeemed | | | (4,255,463) | | | | (107,796) | |
Redemption fees(a) | | | 12,299 | | | | 1,077 | |
| |
Net increase in net assets from capital share transactions | | | 3,378,796 | | | | 6,123,383 | |
| |
| | |
Net Increase in Net Assets | | | 6,638,395 | | | | 7,350,997 | |
| | |
NET ASSETS: | | | | | | | | |
Beginning of period | | | 7,350,997 | | | | – | |
| |
End of period (including accumulated net investment income of $– and $–) | | $ | 13,989,392 | | | $ | 7,350,997 | |
| |
| | |
See Notes to Financial Statements. | | |
| Annual Report | September 30, 2013 | | 101 |
| | |
| RiverNorth/Manning & Napier Dividend Income Fund | | |
| Statements of Changes in Net Assets | | |
| | | | | | | | |
| | | For the Year Ended
September 30, 2013 | | | For the Period
July 18, 2012
(Inception) to
September 30, 2012 | |
| |
OTHER INFORMATION: | | | | | | | | |
Share Transactions: | | | | | | | | |
Class I Shares | | | | | | | | |
Shares sold | | | 349,602 | | | | 102,400 | |
Shares issued in reinvestment of distributions | | | 12,225 | | | | 232 | |
Shares redeemed | | | (201,919) | | | | (9) | |
| |
Net increase from share transactions | | | 159,908 | | | | 102,623 | |
| |
| | |
Class R Shares | | | | | | | | |
Shares sold | | | 665,867 | | | | 612,037 | |
Shares issued in reinvestment of distributions | | | 38,761 | | | | 1,461 | |
Shares redeemed | | | (372,349) | | | | (10,462) | |
| |
Net increase from share transactions | | | 332,279 | | | | 603,036 | |
| |
| (a) | The Fund will impose a 2.00% redemption fee on shares redeemed within 90 days of purchase. |
| | |
See Notes to Financial Statements. | | |
| 102 | | (888) 848-7569 | www.rivernorthfunds.com |
| | |
| RiverNorth/Oaktree High Income Fund | | |
| Statement of Changes in Net Assets | | |
| | | | |
| | | For the Period
December 28, 2012
(Inception) to
September 30, 2013 | |
| |
NET DECREASE IN NET ASSETS FROM OPERATIONS: | | | | |
Net investment income | | $ | 610,025 | |
Net realized loss on investments | | | (59,661) | |
Long-term capital gain distributions from other investment companies | | | 11,511 | |
Net change in unrealized depreciation on investments | | | (576,176) | |
| |
Net decrease in net assets resulting from operations | | | (14,301) | |
| |
| |
DISTRIBUTIONS TO SHAREHOLDERS: | | | | |
From net investment income: | | | | |
Class I Shares | | | (381,295) | |
Class R Shares | | | (324,649) | |
| |
Net decrease in net assets from distributions to shareholders | | | (705,944) | |
| |
| |
CAPITAL SHARE TRANSACTIONS: | | | | |
Class I Shares | | | | |
Proceeds from shares sold | | | 32,486,635 | |
Reinvestment of distributions | | | 346,851 | |
Cost of shares redeemed | | | (7,072,680) | |
Redemption fees(a) | | | 4,428 | |
| |
Net increase in net assets from capital share transactions | | | 25,765,234 | |
| |
| |
Class R Shares | | | | |
Proceeds from shares sold | | | 27,496,607 | |
Reinvestment of distributions | | | 322,553 | |
Cost of shares redeemed | | | (5,282,259) | |
Redemption fees(a) | | | 4,721 | |
| |
Net increase in net assets from capital share transactions | | | 22,541,622 | |
| |
| |
Net Increase in Net Assets | | | 47,586,611 | |
| |
NET ASSETS: | | | | |
Beginning of period | | | – | |
| |
End of period (including accumulated net investment income of $231,462) | | $ | 47,586,611 | |
| |
| | |
| See Notes to Financial Statements. | | |
| Annual Report | September 30, 2013 | | 103 |
| | |
| RiverNorth/Oaktree High Income Fund | | |
Statement of Changes in Net Assets | | |
| | | | |
| | | For the Period December 28, 2012 (Inception) to September 30, 2013 | |
OTHER INFORMATION: | | | | |
Share Transactions: | | | | |
Class I Shares | | | | |
Shares sold | | | 3,226,812 | |
Shares issued in reinvestment of distributions | | | 34,763 | |
Shares redeemed | | | (702,483) | |
Net increase from share transactions | | | 2,559,092 | |
| | | | | |
| |
Class R Shares | | | | |
Shares sold | | | 2,715,460 | |
Shares issued in reinvestment of distributions | | | 32,395 | |
Shares redeemed | | | (525,016) | |
Net increase from share transactions | | | 2,222,839 | |
| | | | | |
| (a) | The Fund will impose a 2.00% redemption fee on shares redeemed within 90 days of purchase. |
| | |
| See Notes to Financial Statements. | | |
| 104 | | (888) 848-7569 | www.rivernorthfunds.com |
| | |
| RiverNorth Dynamic Buy-Write Fund | | |
| Statement of Changes in Net Assets | | |
| | | | |
| | | For the Period October 12, 2012 (Inception) to September 30, 2013 | |
NET INCREASE IN NET ASSETS FROM OPERATIONS: | | | | |
Net investment loss | | $ | (91,482) | |
Net realized gain on investments and written options | | | 842,746 | |
Long-term capital gain distributions from other investment companies | | | 157 | |
Net change in unrealized depreciation on investments and written options | | | (21,781) | |
Net increase in net assets resulting from operations | | | 729,640 | |
| |
DISTRIBUTIONS TO SHAREHOLDERS: | | | | |
From net investment income | | | (779) | |
Net decrease in net assets from distributions to shareholders | | | (779) | |
| |
CAPITAL SHARE TRANSACTIONS: | | | | |
Proceeds from shares sold | | | 22,291,221 | |
Reinvestment of distributions | | | 776 | |
Cost of shares redeemed | | | (6,227,539) | |
Redemption fees(a) | | | 4,559 | |
Net increase in net assets from capital share transactions | | | 16,069,017 | |
| |
Net Increase in Net Assets | | | 16,797,878 | |
| |
NET ASSETS: | | | | |
Beginning of period | | | – | |
End of period (including accumulated net investment income of $–) | | $ | 16,797,878 | |
| | | | | |
| |
OTHER INFORMATION: | | | | |
Share Transactions: | | | | |
Shares sold | | | 2,225,791 | |
Shares issued in reinvestment of distributions | | | 78 | |
Shares redeemed | | | (606,438) | |
Net increase from share transactions | | | 1,619,431 | |
| | | | | |
| (a) | The Fund will impose a 2.00% redemption fee on shares redeemed within 90 days of purchase. |
| | |
| Annual Report | September 30, 2013 | | 105 |
| | |
| RiverNorth Core Opportunity Fund | | |
Financial Highlights | | |
|
|
|
Net asset value - beginning of period |
Income/(loss) from investment operations: |
Net investment income(a) |
Net realized and unrealized gain/(loss) on investments(a) |
Total income/(loss) from investment operations |
|
Less distributions: |
From net investment income |
From net realized gain on investments |
Total distributions |
Paid-in capital from redemption fees(a) |
Net increase/(decrease) in net asset value |
Net asset value - end of period |
| |
|
Total Return(c) |
|
Ratios/Supplemental Data: |
Net assets, end of period (in thousands) |
|
Ratio of expenses to average net assets excluding fee waivers and reimbursements(d) |
|
Ratio of expenses to average net assets including fee waivers and reimbursements(d) |
Ratio of net investment income to average net assets excluding fee waivers and reimbursements(d) |
Ratio of net investment income to average net assets including fee waivers and reimbursements(d) |
Portfolio turnover rate |
| (a) | Based on average shares outstanding during the period. |
| (b) | Less than $0.005 per share. |
| (c) | Total return in the above table represents the rate that the investor would have earned or lost on an investment in the Fund, assuming reinvestment of dividends. |
| (d) | The ratios exclude the impact of expenses of the underlying funds in which the Fund invests as represented in the Schedule of Investments. |
| | |
| See Notes to Financial Statements. | | |
| 106 | | (888) 848-7569 | www.rivernorthfunds.com |
| | |
| | | |
| | For a share outstanding throughout the periods presented. |
| | | | | | | | | | | | | | | | | | |
For the Year Ended September 30, 2013 | | | For the Year Ended September 30, 2012 | | | For the Year Ended September 30, 2011 | | | For the Year Ended September 30, 2010 | | | For the Year Ended September 30, 2009 | |
| | | | |
| $ | 12.37 | | | $ | 11.18 | | | $ | 11.63 | | | $ | 10.57 | | | $ | 8.72 | |
| | | | | | | | | | | | | | | | | | | |
| | 0.20 | | | | 0.20 | | | | 0.32 | | | | 0.21 | | | | 0.32 | |
| | 0.96 | | | | 2.01 | | | | (0.45) | | | | 1.30 | | | | 1.76 | |
| | 1.16 | | | | 2.21 | | | | (0.13) | | | | 1.51 | | | | 2.08 | |
| | | | |
| | | | | | | | | | | | | | | | | | | |
| | (0.35) | | | | (0.50) | | | | (0.32) | | | | (0.45) | | | | (0.23) | |
| | (0.53) | | | | (0.52) | | | | – | | | | – | | | | 0.00 | (b) |
| | (0.88) | | | | (1.02) | | | | (0.32) | | | | (0.45) | | | | (0.23) | |
| | 0.00 | (b) | | | 0.00 | (b) | | | 0.00 | (b) | | | 0.00 | (b) | | | 0.00 | (b) |
| | 0.28 | | | | 1.19 | | | | (0.45) | | | | 1.06 | | | | 1.85 | |
| $ | 12.65 | | | $ | 12.37 | | | $ | 11.18 | | | $ | 11.63 | | | $ | 10.57 | |
| | | | | | | | | | | | | | | | | | | |
| | | | |
| | 10.08% | | | | 21.05% | | | | (1.33%) | | | | 14.72% | | | | 25.06% | |
| | | | |
| | | | | | | | | | | | | | | | | | | |
| $ | 647,365 | | | $ | 569,324 | | | $ | 488,195 | | | $ | 392,421 | | | $ | 275,482 | |
| | | | |
| | 1.35% | | | | 1.36% | | | | 1.45% | | | | 1.45% | | | | 1.53% | |
| | | | |
| | 1.35% | | | | 1.36% | | | | 1.45% | | | | 1.45% | | | | 1.53% | |
| | 1.66% | | | | 1.74% | | | | 2.57% | | | | 1.95% | | | | 3.80% | |
| | 1.66% | | | | 1.74% | | | | 2.57% | | | | 1.95% | | | | 3.80% | |
| | 46% | | | | 30% | | | | 38% | | | | 38% | | | | 215% | |
| | |
| Annual Report | September 30, 2013 | | 107 |
| | |
| RiverNorth/DoubleLine Strategic Income Fund | | Class I |
Financial Highlights | | For a share outstanding throughout the periods presented. |
| | | | | | | | | | | | |
| | | For the Year Ended September 30, 2013 | | | For the Year Ended September 30, 2012 | | | For the Period December 30, 2010 (Inception) to
September 30, 2011 | |
| | | |
Net asset value - beginning of period | | $ | 11.33 | | | $ | 10.59 | | | $ | 10.00 | |
Income from investment operations: | | | | | | | | | | | | |
Net investment income(a) | | | 0.52 | | | | 0.57 | | | | 0.42 | |
Net realized and unrealized gain/(loss) on investments(a) | | | (0.51) | | | | 0.82 | | | | 0.46 | |
Total income from investment operations | | | 0.01 | | | | 1.39 | | | | 0.88 | |
| | | |
Less distributions: | | | | | | | | | | | | |
From net investment income | | | (0.63) | | | | (0.63) | | | | (0.30) | |
From net realized gain on investments | | | (0.09) | | | | (0.02) | | | | – | |
Total distributions | | | (0.72) | | | | (0.65) | | | | (0.30) | |
Paid-in capital from redemption fees(a) | | | 0.00 | (b) | | | 0.00 | (b) | | | 0.01 | |
Net increase/(decrease) in net asset value | | | (0.71) | | | | 0.74 | | | | 0.59 | |
Net asset value - end of period | | $ | 10.62 | | | $ | 11.33 | | | $ | 10.59 | |
| | | | | | | | | | | | | |
| | | |
Total Return(c) | | | (0.03%) | | | | 13.56% | | | | 8.97% | (d) |
| | | |
Ratios/Supplemental Data: | | | | | | | | | | | | |
Net assets, end of period (in thousands) | | $ | 785,974 | | | $ | 878,631 | | | $ | 332,664 | |
Ratio of expenses to average net assets excluding fee waivers and reimbursements(e) | | | 0.89% | | | | 0.90% | | | | 1.08% | (f) |
Ratio of expenses to average net assets including fee waivers and reimbursements(e) | | | 0.89% | | | | 0.90% | | | | 0.95% | (f) |
Ratio of net investment income to average net assets excluding fee waivers and reimbursements(e) | | | 4.68% | | | | 5.20% | | | | 5.18% | (f) |
Ratio of net investment income to average net assets including fee waivers and reimbursements(e) | | | 4.68% | | | | 5.20% | | | | 5.31% | (f) |
Portfolio turnover rate | | | 80% | | | | 74% | | | | 64% | (d) |
| (a) | Based on average shares outstanding during the period. |
| (b) | Less than $0.005 per share. |
| (c) | Total return in the above table represents the rate that the investor would have earned or lost on an investment in the Fund, assuming reinvestment of dividends. |
| (e) | The ratios exclude the impact of expenses of the underlying funds in which the Fund invests as represented in the Schedule of Investments. |
| | |
| See Notes to Financial Statements. | | |
| 108 | | (888) 848-7569 | www.rivernorthfunds.com |
| | |
| RiverNorth/DoubleLine Strategic Income Fund | | Class R |
Financial Highlights | | For a share outstanding throughout the periods presented. |
| | | | | | | | | | | | |
| | | For the Year Ended September 30, 2013 | | | For the Year Ended September 30, 2012 | | | For the Period December 30, 2010
(Inception) to
September 30, 2011 | |
| | | |
Net asset value - beginning of period | | $ | 11.34 | | | $ | 10.60 | | | $ | 10.00 | |
Income/(loss) from investment operations: | | | | | | | | | | | | |
Net investment income(a) | | | 0.49 | | | | 0.54 | | | | 0.40 | |
Net realized and unrealized gain/(loss) on investments(a) | | | (0.51) | | | | 0.82 | | | | 0.46 | |
Total income/(loss) from investment operations | | | (0.02) | | | | 1.36 | | | | 0.86 | |
| | | |
Less distributions: | | | | | | | | | | | | |
From net investment income | | | (0.60) | | | | (0.61) | | | | (0.28) | |
From net realized gain on investments | | | (0.09) | | | | (0.02) | | | | – | |
Total distributions | | | (0.69) | | | | (0.63) | | | | (0.28) | |
Paid-in capital from redemption fees(a) | | | 0.00 | (b) | | | 0.01 | | | | 0.02 | |
Net increase/(decrease) in net asset value | | | (0.71) | | | | 0.74 | | | | 0.60 | |
Net asset value - end of period | | $ | 10.63 | | | $ | 11.34 | | | $ | 10.60 | |
| | | | | | | | | | | | | |
| | | |
Total Return(c) | | | (0.29%) | | | | 13.28% | | | | 8.88% | (d) |
| | | |
Ratios/Supplemental Data: | | | | | | | | | | | | |
Net assets, end of period (in thousands) | | $ | 270,560 | | | $ | 453,520 | | | $ | 141,779 | |
Ratio of expenses to average net assets excluding fee waivers and reimbursements(e) | | | 1.14% | | | | 1.15% | | | | 1.33% | (f) |
Ratio of expenses to average net assets including fee waivers and reimbursements(e) | | | 1.14% | | | | 1.15% | | | | 1.20% | (f) |
Ratio of net investment income to average net assets excluding fee waivers and reimbursements(e) | | | 4.40% | | | | 4.96% | | | | 4.99% | (f) |
Ratio of net investment income to average net assets including fee waivers and reimbursements(e) | | | 4.40% | | | | 4.96% | | | | 5.11% | (f) |
Portfolio turnover rate | | | 80% | | | | 74% | | | | 64% | (d) |
| (a) | Based on average shares outstanding during the period. |
| (b) | Less than $0.005 per share. |
| (c) | Total return in the above table represents the rate that the investor would have earned or lost on an investment in the Fund, assuming reinvestment of dividends. |
| (e) | The ratios exclude the impact of expenses of the underlying funds in which the Fund invests as represented in the Schedule of Investments. |
| | |
| See Notes to Financial Statements. | | |
| Annual Report | September 30, 2013 | | 109 |
| | |
| RiverNorth/Manning & Napier Dividend Income Fund | | Class I |
Financial Highlights | | For a share outstanding throughout the periods presented. |
| | | | | | | | |
| | | For the Year Ended September 30, 2013 | | | For the Period July 18, 2012 (Inception) to September 30, 2012 | |
| | |
Net asset value - beginning of period | | $ | 10.42 | | | $ | 10.00 | |
Income from investment operations: | | | | | | | | |
Net investment income(a) | | | 0.22 | | | | 0.02 | |
Net realized and unrealized gain on investments(a) | | | 1.50 | | | | 0.42 | |
Total income from investment operations | | | 1.72 | | | | 0.44 | |
| | |
Less distributions: | | | | | | | | |
From net investment income | | | (0.39) | | | | (0.02) | |
From net realized gain on investments | | | (0.08) | | | | – | |
Total distributions | | | (0.47) | | | | (0.02) | |
Paid-in capital from redemption fees(a) | | | 0.01 | | | | – | |
Net increase in net asset value | | | 1.26 | | | | 0.42 | |
Net asset value - end of period | | $ | 11.68 | | | $ | 10.42 | |
| | | | | | | | | |
| | |
Total Return(b) | | | 16.99% | | | | 4.44% | (c) |
| | |
Ratios/Supplemental Data: | | | | | | | | |
Net assets, end of period (in thousands) | | $ | 3,067 | | | $ | 1,069 | |
Ratio of expenses to average net assets excluding fee waivers and reimbursements(d) | | | 1.98% | | | | 6.16% | (e) |
Ratio of expenses to average net assets including fee waivers and reimbursements(d) | | | 1.35% | | | | 1.35% | (e) |
Ratio of net investment income/(loss) to average net assets excluding fee waivers and reimbursements(d) | | | 1.33% | | | | (3.92%) | (e) |
Ratio of net investment income to average net assets including fee waivers and reimbursements(d) | | | 1.96% | | | | 0.89% | (e) |
Portfolio turnover rate | | | 100% | | | | 13% | (c) |
| (a) | Based on average shares outstanding during the period. |
| (b) | Total return in the above table represents the rate that the investor would have earned or lost on an investment in the Fund, assuming reinvestment of dividends. |
| (d) | The ratios exclude the impact of expenses of the underlying funds in which the Fund invests as represented in the Schedule of Investments. |
| | |
See Notes to Financial Statements. | | |
| 110 | | (888) 848-7569 | www.rivernorthfunds.com |
| | |
| RiverNorth/Manning & Napier Dividend Income Fund | | Class R |
Financial Highlights | | For a share outstanding throughout the periods presented. |
| | | | | | | | |
| | | For the Year Ended September 30, 2013 | | | For the Period July 18, 2012 (Inception) to September 30, 2012 | |
| | |
Net asset value - beginning of period | | $ | 10.42 | | | $ | 10.00 | |
Income from investment operations: | | | | | | | | |
Net investment income(a) | | | 0.19 | | | | 0.01 | |
Net realized and unrealized gain on investments(a) | | | 1.51 | | | | 0.44 | |
Total income from investment operations | | | 1.70 | | | | 0.45 | |
| | |
Less distributions: | | | | | | | | |
From net investment income | | | (0.37) | | | | (0.03) | |
From net realized gain on investments | | | (0.08) | | | | – | |
Total distributions | | | (0.45) | | | | (0.03) | |
Paid-in capital from redemption fees(a) | | | 0.01 | | | | 0.00 | (b) |
Net increase in net asset value | | | 1.26 | | | | 0.42 | |
Net asset value - end of period | | $ | 11.68 | | | $ | 10.42 | |
| | | | | | | | | |
| | |
Total Return(c) | | | 16.75% | | | | 4.46% | (d) |
| | |
Ratios/Supplemental Data: | | | | | | | | |
Net assets, end of period (in thousands) | | $ | 10,923 | | | $ | 6,282 | |
Ratio of expenses to average net assets excluding fee waivers and reimbursements(e) | | | 2.21% | | | | 6.21% | (f) |
Ratio of expenses to average net assets including fee waivers and reimbursements(e) | | | 1.60% | | | | 1.60% | (f) |
Ratio of net investment income/(loss) to average net assets excluding fee waivers and reimbursements(e) | | | 1.09% | | | | (4.12%) | (f) |
Ratio of net investment income to average net assets including fee waivers and reimbursements(e) | | | 1.71% | | | | 0.49% | (f) |
Portfolio turnover rate | | | 100% | | | | 13% | (d) |
| (a) | Based on average shares outstanding during the period. |
| (b) | Less than $0.005 per share. |
| (c) | Total return in the above table represents the rate that the investor would have earned or lost on an investment in the Fund, assuming reinvestment of dividends. |
| (e) | The ratios exclude the impact of expenses of the underlying funds in which the Fund invests as represented in the Schedule of Investments. |
| | |
| See Notes to Financial Statements. | | |
| Annual Report | September 30, 2013 | | 111 |
| | |
| RiverNorth/Oaktree High Income Fund | | Class I |
Financial Highlights | | For a share outstanding throughout the period presented. |
| | | | |
| | | For the Period December 28, 2012 (Inception) to September 30, 2013 | |
| |
Net asset value - beginning of period | | $ | 10.00 | |
Income from investment operations: | | | | |
Net investment income(a) | | | 0.22 | |
Net realized and unrealized loss on investments(a) | | | (0.07) | |
Total income from investment operations | | | 0.15 | |
| |
Less distributions: | | | | |
From net investment income | | | (0.20) | |
Total distributions | | | (0.20) | |
Paid-in capital from redemption fees(a) | | | 0.00 | (b) |
Net decrease in net asset value | | | (0.05) | |
Net asset value - end of period | | $ | 9.95 | |
| | | | | |
| |
Total Return(c) | | | 1.52% | (d) |
| |
Ratios/Supplemental Data: | | | | |
Net assets, end of period (in thousands) | | $ | 25,472 | |
Ratio of expenses to average net assets excluding fee waivers and reimbursements(e) | | | 1.58% | (f) |
Ratio of expenses to average net assets including fee waivers and reimbursements(e) | | | 1.35% | (f) |
Ratio of net investment income to average net assets excluding fee waivers and reimbursements(e) | | | 2.65% | (f) |
Ratio of net investment income to average net assets including fee waivers and reimbursements(e) | | | 2.88% | (f) |
Portfolio turnover rate | | | 117% | (d) |
| (a) | Based on average shares outstanding during the period. |
| (b) | Less than $0.005 per share. |
| (c) | Total return in the above table represents the rate that the investor would have earned or lost on an investment in the Fund, assuming reinvestment of dividends. |
| (e) | The ratios exclude the impact of expenses of the underlying funds in which the Fund invests as represented in the Schedule of Investments. |
| | |
See Notes to Financial Statements. | | |
| 112 | | (888) 848-7569 | www.rivernorthfunds.com |
| | |
| RiverNorth/Oaktree High Income Fund | | Class R |
Financial Highlights | | For a share outstanding throughout the period presented. |
| | | | |
| | | For the Period December 28, 2012 (Inception) to September 30, 2013 | |
| |
Net asset value - beginning of period | | $ | 10.00 | |
Income from investment operations: | | | | |
Net investment income(a) | | | 0.21 | |
Net realized and unrealized loss on investments(a) | | | (0.07) | |
Total income from investment operations | | | 0.14 | |
| |
Less distributions: | | | | |
From net investment income | | | (0.19) | |
Total distributions | | | (0.19) | |
Paid-in capital from redemption fees(a) | | | 0.00 | (b) |
Net decrease in net asset value | | | (0.05) | |
Net asset value - end of period | | $ | 9.95 | |
| | | | | |
| |
Total Return(c) | | | 1.38% | (d) |
| |
Ratios/Supplemental Data: | | | | |
Net assets, end of period (in thousands) | | $ | 22,115 | |
Ratio of expenses to average net assets excluding fee waivers and reimbursements(e) | | | 1.80% | (f) |
Ratio of expenses to average net assets including fee waivers and reimbursements(e) | | | 1.60% | (f) |
Ratio of net investment income to average net assets excluding fee waivers and reimbursements(e) | | | 2.60% | (f) |
Ratio of net investment income to average net assets including fee waivers and reimbursements(e) | | | 2.80% | (f) |
Portfolio turnover rate | | | 117% | (d) |
| (a) | Based on average shares outstanding during the period. |
| (b) | Less than $0.005 per share. |
| (c) | Total return in the above table represents the rate that the investor would have earned or lost on an investment in the Fund, assuming reinvestment of dividends. |
| (e) | The ratios exclude the impact of expenses of the underlying funds in which the Fund invests as represented in the Schedule of Investments. |
| | |
| See Notes to Financial Statements. | | |
| Annual Report | September 30, 2013 | | 113 |
| | |
| RiverNorth Dynamic Buy-Write Fund | | |
| Financial Highlights | | For a share outstanding throughout the period presented. |
| | | | |
| | | For the Period October 12, 2012 (Inception) to September 30, 2013 | |
| |
Net asset value - beginning of period | | $ | 10.00 | |
Income from investment operations: | | | | |
Net investment loss(a) | | | (0.06) | |
Net realized and unrealized gain on investments(a) | | | 0.43 | |
Total income from investment operations | | | 0.37 | |
| |
Less distributions: | | | | |
From net investment income | | | (0.00) | (b) |
Total distributions | | | (0.00) | (b) |
Paid-in capital from redemption fees(a) | | | 0.00 | (b) |
Net increase in net asset value | | | 0.37 | |
Net asset value - end of period | | $ | 10.37 | |
| | | | | |
| |
Total Return(c) | | | 3.71% | (d) |
| |
Ratios/Supplemental Data: | | | | |
Net assets, end of period (in thousands) | | $ | 16,798 | |
Ratio of expenses to average net assets excluding fee waivers and reimbursements(e) | | | 2.19% | (f) |
Ratio of expenses to average net assets including fee waivers and reimbursements(e) | | | 1.80% | (f) |
Ratio of net investment loss to average net assets excluding fee waivers and reimbursements(e) | | | (0.98%) | (f) |
Ratio of net investment loss to average net assets including fee waivers and reimbursements(e) | | | (0.59%) | (f) |
Portfolio turnover rate | | | 603% | (d) |
| (a) | Based on average shares outstanding during the period. |
| (b) | Less than $(0.005) and $0.005 per share. |
| (c) | Total return in the above table represents the rate that the investor would have earned or lost on an investment in the Fund, assuming reinvestment of dividends. |
| (e) | The ratios exclude the impact of expenses of the underlying funds in which the Fund invests as represented in the Schedule of Investments. |
| | |
| See Notes to Financial Statements. | | |
| 114 | | (888) 848-7569 | www.rivernorthfunds.com |
| | |
| RiverNorth Funds | | Notes to Financial Statements |
| | September 30, 2013 |
1. ORGANIZATION
The RiverNorth Funds (the “Trust” or “Funds”) was established under the laws of Ohio by an Agreement and Declaration of Trust dated July 18, 2006 (the “Trust Agreement”). The Trust is an open-end management investment company registered under the Investment Company Act of 1940, as amended (the “1940 Act”). The Trust Agreement permits the Board of Trustees (the “Board’ or “Trustees”) to authorize and issue an unlimited number of shares of beneficial interest of a separate series without par value. All classes of shares for each of the Funds have identical rights to earnings, assets and voting privileges, except for class-specific expenses and exclusive rights to vote on matters affecting only individual classes.
The RiverNorth Core Opportunity Fund (the “Core Opportunity Fund”) was organized as a diversified series of the Trust on July 18, 2006 and commenced investment operations on December 27, 2006. The investment adviser to the Core Opportunity Fund is RiverNorth Capital Management, LLC (the “Adviser”). The investment objective of the Core Opportunity Fund is to seek long-term capital appreciation and income.
The RiverNorth/DoubleLine Strategic Income Fund (the “Strategic Income Fund”) is a diversified series of the Trust and commenced investment operations on December 30, 2010. The Strategic Income Fund offers two series of shares, Class I Shares and Class R Shares. The investment adviser to the Strategic Income Fund is RiverNorth Capital Management, LLC. The Strategic Income Fund’s sub-adviser is DoubleLine Capital, LP (“DoubleLine”). The investment objective of the Strategic Income Fund is current income and overall total return.
The RiverNorth/Manning & Napier Dividend Income Fund (the “Dividend Income Fund”) is a diversified series of the Trust and commenced investment operations on July 18, 2012. The Dividend Income Fund offers two series of shares, Class I Shares and Class R Shares. The investment adviser to the Dividend Income Fund is RiverNorth Capital Management, LLC. The Dividend Income Fund’s sub-adviser is Manning & Napier Advisors, LLC (“Manning & Napier”). The investment objective of the Dividend Income Fund is overall total return consisting of long-term capital appreciation and income.
The RiverNorth/Oaktree High Income Fund (the “High Income Fund”) is a diversified series of the Trust and commenced investment operations on December 28, 2012. The High Income Fund offers two series of shares, Class I Shares and Class R Shares. The investment adviser to the High Income Fund is RiverNorth Capital Management, LLC. The High Income Fund’s sub-adviser is Oaktree Capital Management, L.P. (“Oaktree Capital,” and with DoubleLine and Manning & Napier, each a “Sub-Adviser” or collectively, the “Sub-Advisers”). The investment objective of the High Income Fund is overall total return consisting of long-term capital appreciation and income.
The RiverNorth Dynamic Buy-Write Fund (the “Dynamic Buy-Write Fund”) is a non-diversified series of the Trust and commenced investment operations on October 12, 2012. The investment adviser to the Dynamic Buy-Write Fund is RiverNorth Capital Management, LLC. The investment objective of the Dynamic Buy-Write Fund is total return with lower volatility than the Standard and Poor’s 500 Index.
The following is a summary of significant accounting policies followed by the Funds. These policies are in conformity with U.S. generally accepted accounting principles (“GAAP”). The preparation of financial statements in accordance with GAAP requires management to make estimates and assumptions that affect the reported amounts and disclosures in the financial statements during the reporting period. Management believes the estimates and security valuations are appropriate; however, actual results may differ from those estimates, and the security valuations reflected in
| | |
| Annual Report | September 30, 2013 | | 115 |
| | |
| RiverNorth Funds | | Notes to Financial Statements |
| | September 30, 2013 |
the financial statements may differ from the value the Funds ultimately realize upon sale of the securities. The financial statements have been prepared as of the close of the New York Stock Exchange (“NYSE”) on September 30, 2013.
2. SIGNIFICANT ACCOUNTING POLICIES
Security Valuation: All investments in securities are recorded at their estimated fair value as described in Note 3.
Security Transactions and Related Income: The Funds follow industry practice and record security transactions on the trade date basis. The specific identification method is used for determining gains or losses for financial statements and income tax purposes. Dividend income is recorded on the ex-dividend date or for certain foreign securities, when the information becomes available to the Fund and interest income is recorded on an accrual basis. Discounts and premiums on securities purchased are amortized or accreted using the effective interest method. Withholding taxes on foreign dividends have been provided for in accordance with the Trust’s understanding of the applicable country’s tax rules and rates. The ability of issuers of debt securities held by the Funds to meet their obligations may be affected by economic and political developments in a specific country or region.
Foreign Currency Translation: The books and records of the Funds are maintained in U.S. dollars. Investment valuations and other assets and liabilities initially expressed in foreign currencies are converted each business day into U.S. dollars based upon current exchange rates. Prevailing foreign exchange rates may generally be obtained at the close of the NYSE (normally, 4:00 p.m. Eastern time). The portion of realized and unrealized gains or losses on investments due to fluctuations in foreign currency exchange rates is not separately disclosed and is included in realized and unrealized gains or losses on investments, when applicable.
Foreign Securities: The Funds may directly purchase securities of foreign issuers. Investing in securities of foreign issuers involves special risks not typically associated with investing in securities of U.S. issuers. The risks include possible revaluation of currencies, the ability to repatriate funds, less complete financial information about companies and possible future adverse political and economic developments. Moreover, securities of many foreign issuers and their markets may be less liquid and their prices more volatile than those of securities of comparable U.S. issuers.
Other: The Funds have held certain investments which pay dividends to their shareholders based upon available funds from operations. It is possible for these dividends to exceed the underlying investments’ taxable earnings and profits resulting in the excess portion of such dividends being designated as a return of capital. Distributions received from investments in securities that represent a return of capital or capital gain are recorded as a reduction of the cost of investments or as a realized gain, respectively.
Share Valuation: The net asset value (the “NAV”) is generally calculated as of the close of trading on the New York Stock Exchange (“the Exchange”) (normally 4:00 p.m. Eastern time) every day the Exchange is open. The NAV is calculated by taking the total value of each Fund’s assets, subtracting their liabilities, and then dividing by the total number of shares outstanding, rounded to the nearest cent. The offering price and redemption price per share is equal to the net asset value per share, except that shares of each Fund are subject to a redemption fee of 2% if redeemed within 90 days of purchase. For the year ended September 30, 2013, the Core Opportunity Fund, Strategic Income Fund, Dividend Income Fund, High Income Fund, and Dynamic
| | |
| 116 | | (888) 848-7569 | www.rivernorthfunds.com |
| | |
| RiverNorth Funds | | Notes to Financial Statements |
| | September 30, 2013 |
Buy-Write Fund received redemption fees of $24,918, $189,314, $14,325, $9,149, and $4,559, respectively.
Offering Costs: Offering costs, including costs of printing initial prospectuses, legal and registration fees, are being amortized over twelve months for the High Income Fund and Dynamic Buy-Write Fund. As of September 30, 2013, $13,679 and $772 of offering costs remain to be amortized by the Funds above, respectively.
Expenses: Some expenses of the Trust can be directly attributed to the Fund or the Fund specific share class. Expenses which cannot be directly attributed are apportioned among all Funds and Fund series classes in the Trust based on average net assets.
Federal Income Taxes: The Funds make no provision for federal income tax. Each Fund intends to qualify each year as a “regulated investment company” under subchapter M of the Internal Revenue Code of 1986, as amended, by distributing substantially all of its taxable income. If the required amount of net investment income is not distributed, the Funds could incur a tax expense.
As of and during the year ended September 30, 2013, the Funds did not have a liability for any unrecognized tax benefits. The Funds file U.S. federal, state, and local tax returns as required. The Funds’ tax returns are subject to examination by the relevant tax authorities until expiration of the applicable statute of limitations which is generally three years after the filing of the tax return for federal purposes and four years for most state returns. Tax returns for open years have incorporated no uncertain tax positions that require a provision for income taxes.
Distributions to Shareholders: Distributions to shareholders, which are determined in accordance with income tax regulations, are recorded on the ex-dividend date. The treatment for financial reporting purposes of distributions made to shareholders during the year from net investment income or net realized capital gains may differ from their ultimate treatment for federal income tax purposes. These differences are caused primarily by differences in the timing of recognition of certain components of income, expense or realized capital gain for federal income tax purposes. Where such differences are permanent in nature, they are reclassified in the components of the net assets based on their ultimate characterization for federal income tax purposes. Any such reclassification will have no effect on net assets, results of operations or net asset values per share of the Funds.
3. SECURITIES VALUATION AND FAIR VALUE MEASUREMENTS
Fair value is defined as the price that a Fund might reasonably expect to receive upon selling an investment in a timely transaction to an independent buyer in the principal or most advantageous market of the investment. GAAP establishes a three-tier hierarchy to maximize the use of observable market data and minimize the use of unobservable inputs and to establish classification of fair value measurements for disclosure purposes.
Inputs refer broadly to the assumptions that market participants would use in pricing the asset or liability, including assumptions about risk, for example, the risk inherent in a particular valuation technique used to measure fair value including such a pricing model and/or the risk inherent in the inputs to the valuation technique. Inputs may be observable or unobservable. Observable inputs are inputs that reflect the assumptions market participants would use in pricing the asset or liability developed based on market data obtained from sources independent of the reporting entity. Unobservable inputs are inputs that reflect the reporting entity’s own assumptions about
| | |
| Annual Report | September 30, 2013 | | 117 |
| | |
| RiverNorth Funds | | Notes to Financial Statements |
| | September 30, 2013 |
the assumptions market participants would use in pricing the asset or liability developed based on the best information available in the circumstances.
Various inputs are used in determining the value of the Funds’ investments. These inputs are summarized in the three broad levels listed below.
| | • | | Level 1 – Unadjusted quoted prices in active markets for identical, unrestricted assets or liabilities that a Fund has the ability to access at the measurement date; |
| | • | | Level 2 – Quoted prices which are not active, quoted prices for similar assets or liabilities in active markets or inputs other than quoted prices that are observable (either directly or indirectly) for substantially the full term of the asset or liability; and |
| | • | | Level 3 – Significant unobservable prices or inputs (including the Fund’s own assumptions in determining the fair value of investments) where there is little or no market activity for the asset or liability at the measurement date. |
The inputs used to measure fair value may fall into different levels of the fair value hierarchy. In such cases, for disclosure purposes, the level in the fair value hierarchy within which the fair value measurement falls in its entirety, is determined based on the lowest level input that is significant to the fair value measurement in its entirety.
Equity securities, including common stocks, closed-end funds, exchange-traded funds, holding and investment management companies, preferred stocks, and business development company senior notes are generally valued by using market quotations, but may be valued on the basis of prices furnished by a pricing service when the Adviser or a Sub-Adviser believes such prices more accurately reflect the fair market value of such securities. Securities that are traded on any stock exchange are generally valued by the pricing service at the last quoted sale price. Lacking a last sale price, an exchange traded security is generally valued by the pricing service at its last bid price. Securities traded in the NASDAQ over-the-counter market are generally valued by the pricing service at the NASDAQ Official Closing Price. When using the market quotations or close prices provided by the pricing service and when the market is considered active, the security will be classified as a Level 1 security. Sometimes, an equity security owned by the Funds will be valued by the pricing service with factors other than market quotations or when the market is considered inactive. When this happens, the security will be classified as a Level 2 security. When market quotations are not readily available, when the Adviser or a Sub-Adviser determines that the market quotation or the price provided by the pricing service does not accurately reflect the current fair value, or when restricted or illiquid securities are being valued, such securities are valued as determined in good faith by the Adviser, Sub-Adviser, or valuation committee in conformity with guidelines adopted by and subject to review by the Board. These securities will be categorized as Level 3 securities.
Investments in mutual funds, including money market mutual funds, are generally priced at the ending net asset value (NAV) provided by the service agent of the Funds. These securities will be categorized as Level 1 securities.
Domestic and foreign fixed income securities, including foreign and U.S. corporate bonds, foreign and U.S. government bonds and notes, supranationals and foreign agencies, non-agency collateralized mortgage obligations, U.S. Government/Agency mortgage backed securities bank loans, collateralized loan obligations, and municipal bonds, as well as non-exchange traded derivatives are normally valued on the basis of quotes obtained from brokers and dealers or independent pricing services. Prices obtained from independent pricing services typically use information provided by market makers or estimates of market values obtained from yield data relating to investments or securities with similar characteristics. Data used to establish quotes includes analysis of cash flows, pre-
| | |
| 118 | | (888) 848-7569 | www.rivernorthfunds.com |
| | |
| RiverNorth Funds | | Notes to Financial Statements |
| | September 30, 2013 |
payment speeds, default rates, delinquency assumptions and assumptions regarding collateral and loss assumptions. These securities will be classified as Level 2 securities.
Closing bid and ask option contract quotations are considered to be reflective of the option contract values as of the close of the regular session of trading on the New York Stock Exchange (the “stock market close”), and will be used to determine fair value of the option contracts. On days when the closing market quotations for option contracts are not considered to be reflective of their value as of the stock market close, each of the option contracts held by a Fund will be priced at the average of the bid and asked quotations as of the stock market close by reference to time-stamped quotes obtained from an independent third-party pricing source. If an acceptable quotation is unavailable for a particular contract, that contract will be priced at the mean of the valuations of the two most widely accepted and well documented methods for deriving prices for option contracts, the Black-Scholes model and the binomial model, as of the stock market close.
Rights are generally valued by using the last sale price, which would result in a classification as a Level 1 security. In the absence of a last sale price, the rights will be fair-valued by the Adviser or a Sub-Adviser, which would result in a classification as a Level 3 security.
Short-term investments in fixed income securities, with maturities of less than 60 days when acquired, or which subsequently are within 60 days of maturity, are valued by using the amortized cost method of valuation, which the Board has determined will represent fair value. These securities will be classified as Level 2 securities.
In accordance with the Funds’ good faith pricing guidelines, the Adviser, Sub-Adviser, or valuation committee is required to consider all appropriate factors relevant to the value of securities for which it has determined other pricing sources are not available or reliable as described above. No single standard exists for determining fair value, because fair value depends upon the circumstances of each individual case. As a general principle, the current fair value of an issue of securities being valued by the Adviser, Sub-Adviser, or valuation committee would appear to be the amount which the owner might reasonably expect to receive for them upon their current sale. Methods which are in accordance with this principle may, for example, be based on (i) a multiple of earnings; (ii) a discount from market of a similar freely traded security (including a derivative security or a basket of securities traded on other markets, exchanges or among dealers); or (iii) yield to maturity with respect to debt issues, or a combination of these and other methods. Good faith pricing is permitted if, in the Adviser’s, a Sub-Adviser’s, or the valuation committee’s opinion, the validity of market quotations appears to be questionable based on factors such as evidence of a thin market in the security based on a small number of quotations, a significant event occurs after the close of a market but before a Fund’s NAV calculation that may affect a security’s value, or the Adviser or a Sub-Adviser is aware of any other data that calls into question the reliability of market quotations.
Good faith pricing may also be used in instances when the bonds the Funds invest in may default or otherwise cease to have market quotations readily available. Investments in foreign securities, junk bonds or other thinly traded securities are more likely to trigger good faith pricing than other securities.
| | |
| Annual Report | September 30, 2013 | | 119 |
| | |
| RiverNorth Funds | | Notes to Financial Statements |
| | September 30, 2013 |
The following is a summary of the inputs used at September 30, 2013 in valuing the Funds’ assets and liabilities:
| | | | | | | | | | | | | | | | |
Core Opportunity Fund | | | | | | | | | | | | | | | | |
| | | Valuation Inputs | | | | |
| | | | | | | | |
Investments in Securities at Value* | | Level 1 | | | Level 2 | | | Level 3 | | | Total | |
| |
Closed-End Funds | | $ | 398,249,035 | | | $ | – | | | $ | – | | | $ | 398,249,035 | |
Mutual Funds | | | 22,365,675 | | | | – | | | | – | | | | 22,365,675 | |
Exchange-Traded Funds | | | 119,285,470 | | | | – | | | | – | | | | 119,285,470 | |
Holding & Investment Management Companies | | | 2,209,944 | | | | – | | | | – | | | | 2,209,944 | |
Preferred Stocks | | | 1,546,074 | | | | – | | | | – | | | | 1,546,074 | |
Business Development Company Senior Notes | | | 78,156 | | | | – | | | | – | | | | 78,156 | |
Short-Term Investments | | | 107,032,737 | | | | – | | | | – | | | | 107,032,737 | |
| |
Total | | $ | 650,767,091 | | | $ | – | | | $ | – | | | $ | 650,767,091 | |
| |
| |
Strategic Income Fund | | | | | | | | | | | | | | | | |
| | | Valuation Inputs | | | | |
| | | | | | | | |
Investments in Securities at Value* | | Level 1 | | | Level 2 | | | Level 3 | | | Total | |
| |
Closed-End Funds | | $ | 284,606,392 | | | $ | – | | | $ | – | | | $ | 284,606,392 | |
Preferred Stocks | | | 23,551,493 | | | | – | | | | – | | | | 23,551,493 | |
Business Development Company Senior Notes | | | 27,671,905 | | | | – | | | | – | | | | 27,671,905 | |
Foreign Corporate Bonds | | | – | | | | 58,899,892 | | | | – | | | | 58,899,892 | |
U.S. Corporate Bonds | | | – | | | | 61,492,301 | | | | – | | | | 61,492,301 | |
Foreign Government Bonds and Notes, Supranationals and Foreign Agencies | | | – | | | | 3,712,768 | | | | – | | | | 3,712,768 | |
Collateralized Loan Obligations | | | – | | | | 14,627,829 | | | | – | | | | 14,627,829 | |
Non-Agency Collateralized Mortgage Obligations | | | – | | | | 320,666,828 | | | | – | | | | 320,666,828 | |
U.S. Government Bonds and Notes | | | – | | | | 40,620,699 | | | | – | | | | 40,620,699 | |
Municipal Bonds | | | – | | | | 2,967,306 | | | | – | | | | 2,967,306 | |
U.S. Government / Agency Mortgage Backed Securities | | | – | | | | 168,633,062 | | | | – | | | | 168,633,062 | |
Short-Term Investments | | | 42,042,618 | | | | – | | | | – | | | | 42,042,618 | |
| |
Total | | $ | 377,872,408 | | | $ | 671,620,685 | | | $ | – | | | $ | 1,049,493,093 | |
| |
| |
| | |
| 120 | | (888) 848-7569 | www.rivernorthfunds.com |
| | |
| RiverNorth Funds | | Notes to Financial Statements |
| | September 30, 2013 |
| | | | | | | | | | | | | | | | |
Dividend Income Fund | | | | | | | | | | | | | | | | |
| | | Valuation Inputs | | | | |
| | | | | | | | |
| Investments in Securities at Value* | | Level 1 | | | Level 2 | | | Level 3 | | | Total | |
| |
Closed-End Funds | | $ | 5,662,032 | | | $ | – | | | $ | – | | | $ | 5,662,032 | |
Common Stocks | | | 7,891,836 | | | | – | | | | – | | | | 7,891,836 | |
Short-Term Investments | | | 271,889 | | | | – | | | | – | | | | 271,889 | |
| |
Total | | $ | 13,825,757 | | | $ | – | | | $ | – | | | $ | 13,825,757 | |
| |
| |
| | | | |
High Income Fund | | | | | | | | | | | | | | | | |
| | | Valuation Inputs | | | | |
| | | | | | | | |
| Investments in Securities at Value* | | Level 1 | | | Level 2 | | | Level 3 | | | Total | |
| |
Closed-End Funds | | $ | 8,638,902 | | | $ | – | | | $ | – | | | $ | 8,638,902 | |
Preferred Stocks | | | 136,625 | | | | – | | | | – | | | | 136,625 | |
Bank Loans | | | – | | | | 984,307 | | | | – | | | | 984,307 | |
Business Development Company Senior Notes | | | 2,515,491 | | | | – | | | | – | | | | 2,515,491 | |
High Yield Debt | | | – | | | | 33,198,404 | | | | – | | | | 33,198,404 | |
Short-Term Investments | | | 3,973,556 | | | | – | | | | – | | | | 3,973,556 | |
| |
Total | | $ | 15,264,574 | | | $ | 34,182,711 | | | $ | – | | | $ | 49,447,285 | |
| |
| |
| | |
| | | Valuation Inputs | | | | |
| | | | | | | | |
| Other Financial Instruments** | | Level 1 | | | Level 2 | | | Level 3 | | | Total | |
| |
Liabilities | | | | | | | | | | | | | | | | |
Forward Contracts | | $ | – | | | $ | (235,388 | ) | | $ | – | | | $ | (235,388 | ) |
| |
Total | | $ | – | | | $ | (235,388 | ) | | $ | – | | | $ | (235,388 | ) |
| |
| |
| | | | |
Dynamic Buy-Write Fund | | | | | | | | | | | | | | | | |
| | | Valuation Inputs | | | | |
| | | | | | | | |
| Investments in Securities at Value* | | Level 1 | | | Level 2 | | | Level 3 | | | Total | |
| |
Common Stocks | | $ | 2,790,001 | | | $ | – | | | $ | – | | | $ | 2,790,001 | |
Exchange-Traded Funds | | | 4,435,860 | | | | – | | | | – | | | | 4,435,860 | |
Preferred Stocks | | | 1,197,184 | | | | – | | | | – | | | | 1,197,184 | |
Purchased Options | | | 87,895 | | | | – | | | | – | | | | 87,895 | |
Short-Term Investments | | | 1,784,283 | | | | – | | | | – | | | | 1,784,283 | |
| |
Total | | $ | 10,295,223 | | | $ | – | | | $ | – | | | $ | 10,295,223 | |
| |
| |
| | |
| | | Valuation Inputs | | | | |
| | | | | | | | |
| Other Financial Instruments** | | Level 1 | | | Level 2 | | | Level 3 | | | Total | |
| |
Liabilities | | | | | | | | | | | | | | | | |
Written Options | | $ | (426,883 | ) | | $ | – | | | $ | – | | | $ | (426,883 | ) |
| |
Total | | $ | (426,883 | ) | | $ | – | | | $ | – | | | $ | (426,883 | ) |
| |
| |
| * | Refer to each Fund’s Schedule of Investments for a listing of securities by type. |
| ** | Other financial instruments are derivative instruments not reflected in the Schedule of Investments. |
| | |
| Annual Report | September 30, 2013 | | 121 |
| | |
| RiverNorth Funds | | Notes to Financial Statements |
| | September 30, 2013 |
The Funds did not hold any investments at the beginning or end of the year in which significant unobservable inputs were used in determining fair value; therefore, no reconciliation of Level 3 securities is included for this reporting period.
It is the Funds’ policy to recognize transfers into and out of the Levels 1 and 2 at the end of the reporting period.
There were no transfers into and out of Levels 1 and 2 during the current year presented.
4. DERIVATIVE FINANCIAL INSTRUMENTS
The following discloses the Funds’ use of derivative instruments. The Funds’ investment objectives not only permit the Funds to purchase investment securities, they also allow the Funds to enter into various types of derivative contracts such as purchased and written options and forward foreign currency contracts. In doing so, the Funds will employ strategies in differing combinations to permit them to increase, decrease, or change the level or types of exposure to market factors. Central to those strategies are features inherent to derivatives that make them more attractive for this purpose than equity or debt securities; they require little or no initial cash investment, they can focus exposure on only certain selected risk factors, and they may not require the ultimate receipt or delivery of the underlying security (or securities) to the contract. This may allow the Funds to pursue their objectives more quickly and efficiently than if they were to make direct purchases or sales of securities capable of effecting a similar response to market factors.
Market Risk Factors: In pursuit of their investment objectives, the Funds may seek to use derivatives to increase or decrease their exposure to the following market risk factors:
Equity Risk: Equity risk relates to the change in value of equity securities as they relate to increases or decreases in the general market.
Foreign Exchange Rate Risk: Foreign exchange rate risk relates to the change in the U.S. dollar value of a security held that is denominated in a foreign currency. The value of a foreign currency denominated security will decrease as the dollar appreciates against the currency, while the value of the foreign currency denominated security will increase as the dollar depreciates against the currency.
Risk of Investing in Derivatives
The Funds’ use of derivatives can result in losses due to unanticipated changes in the market risk factors and the overall market. Derivatives may have little or no initial cash investment relative to their market value exposure and therefore can produce significant gains or losses in excess of their cost. This use of embedded leverage allows the Funds to increase their market value exposure relative to their net assets and can substantially increase the volatility of the Funds’ performance.
Additional associated risks from investing in derivatives also exist and potentially could have significant effects on the valuation of the derivative and the Funds. Typically, the associated risks are not the risks that the Funds are attempting to increase or decrease exposure to, per their investment objectives, but are the additional risks from investing in derivatives.
Examples of these associated risks are liquidity risk, which is the risk that the Funds will not be able to sell the derivative in the open market in a timely manner, and counterparty credit risk, which is the risk that the counterparty will not fulfill its obligation to the Funds.
| | |
| 122 | | (888) 848-7569 | www.rivernorthfunds.com |
| | |
| RiverNorth Funds | | Notes to Financial Statements |
| | September 30, 2013 |
Option Writing/Purchasing
The Funds may write or purchase option contracts to adjust risk and return of their overall investment positions. When a fund writes or purchases an option, an amount equal to the premium received or paid by the funds is recorded as a liability or an asset and is subsequently adjusted to the current market value of the option written or purchased. Premiums received or paid from writing or purchasing options that expire unexercised are treated by the Funds on the expiration date as realized gains or losses. The difference between the premium and the amount paid or received on effecting a closing purchase or sale transaction, including brokerage commissions, is also treated as a realized gain or loss. If an option is exercised, the premium paid or received is added to the cost of the purchase or proceeds from the sale in determining whether the Funds have realized a gain or loss on investment transactions. Risks from entering into option transactions arise from the potential inability of counterparties to meet the terms of the contracts, the potential inability to enter into closing transactions because of an illiquid secondary market and from unexpected movements in security values. Cash segregated as collateral for written option contracts is shown on the Dynamic Buy-Write Fund’s Statement of Assets and Liabilities.
Forward Foreign Currency Contracts
The Funds may engage in currency transactions with counterparties to hedge the value of portfolio securities denominated in particular currencies against fluctuations in relative value, to gain or reduce exposure to certain currencies, or to generate income or gains. A forward foreign currency contract is an agreement between two parties to buy and sell a currency at a set price on a future date. The contract is marked-to-market daily and the change in value is recorded by the Funds as an unrealized gain or loss. When a forward foreign currency contract is extinguished, through either delivery or offset by entering into another forward foreign currency contract, the Funds record a realized gain or loss equal to the difference between the value of the contract at the time it was opened and the value of the contract at the time it was extinguished.
Forward foreign currency contracts involve elements of market risk in excess of the amounts reflected in the Statements of Assets and Liabilities. The Funds bear the risk of an unfavorable change in the foreign exchange rate underlying the forward foreign currency contract. Risks may also arise upon entering into these contracts from the potential inability of the counterparties to meet the terms of their contracts.
The Dynamic Buy-Write Fund had the following transactions in written options during the year ended September 30, 2013.
| | | | | | | | |
| | | Number of Contracts | | | Premiums | |
Balance as of October 12, 2012 | | | – | | | $ | – | |
Options Written | | | 31,838 | | | | 2,780,440 | |
Options Expired | | | (13,593 | ) | | | (818,575 | ) |
Options Closed | | | (8,548 | ) | | | (900,785 | ) |
Options Exercised | | | (6,597 | ) | | | (715,155 | ) |
Options Split | | | 106 | | | | – | |
Balance as of September 30, 2013 | | | 3,206 | | | $ | 345,925 | |
| | | | | | | | | |
| | |
| Annual Report | September 30, 2013 | | 123 |
| | |
| RiverNorth Funds | | Notes to Financial Statements |
| | September 30, 2013 |
The effect of derivatives instruments on each Fund’s Statement of Assets and Liabilities as of September 30, 2013:
| | | | | | | | |
| | | | | Asset Derivatives | |
| Fund | | Risk Exposure | | Statement of Assets and Liabilities Location | | Fair Value | |
| |
| Dynamic Buy-Write Fund | | Equity Contracts (Purchased Options) | | Investments in securities, at value | | $ | 87,895 | |
| |
| | |
| | | | | Liabilities Derivatives | |
| Fund | | Risk Exposure | | Statement of Assets and Liabilities Location | | Fair Value | |
| |
| Oaktree High Income Fund | | Forward foreign currency contracts | | Unrealized depreciation on forward foreign currency contracts | | $ | (235,388) | |
| |
| Dynamic Buy-Write Fund | | Equity Contracts (Written Options) | | Written options, at value | | $ | (426,883) | |
| |
The effect of derivatives instruments on each Fund’s Statement of Operations for the year ended September 30, 2013:
| | | | | | | | | | | | |
| Fund | | Risk Exposure | | Statement of Operations Location | | Realized Gain/(Loss) on Derivatives Recognized in Income | | | Change in Unrealized Gain/(Loss) on Derivatives
Recognized in
Income | |
| |
Oaktree High Income Fund | | Forward foreign currency contracts | | Net realized loss on Foreign currency transactions/ Net change in unrealized appreciation/(depreciation) on Translation of assets and liabilities denominated in foreign currencies | | $ | 22,147 | | | $ | (235,388) | |
| |
| | Equity Contracts (Purchased Options) | | Net realized gain/(loss) on Investments/Net change in unrealized appreciation/(depreciation) on Investments | | $ | (803,560) | | | $ | 1,409 | |
| Dynamic Buy-Write Fund | | Equity Contracts (Written Options) | | Net realized gain/(loss) on Written options/Net change in unrealized appreciation/(depreciation) on Written Options | | $ | 989,848 | | | $ | (80,958) | |
| |
| | | | | | $ | 186,288 | | | $ | (79,549) | |
| | | | | | | | |
| | |
| 124 | | (888) 848-7569 | www.rivernorthfunds.com |
| | |
| RiverNorth Funds | | Notes to Financial Statements |
| | September 30, 2013 |
The average purchased and written option contracts volume during the year ended September 30, 2013 is noted below.
| | | | |
| Fund | | Average Purchased Option Contract Volume | | Average Written Option Contract Volume |
|
Dynamic Buy-Write Fund | | 1,151 | | (2,772) |
|
| |
| Fund | | Average Value of Forward Currency Contracts |
|
High Income Fund | | $ 6,146,318 |
|
5. LOAN PARTICIPATIONS AND ASSIGNMENTS
The High Income Fund may invest in direct debt instruments which are interests in amounts owed to lenders or lending syndicates by corporate, governmental, or other borrowers. The High Income Fund investments in loans may be in the form of participations in loans or assignments of all or a portion of loans from third parties. A loan is often administered by a bank or other financial institution (the “lender”) that acts as agent for all holders. The agent administers the terms of the loan, as specified in the loan agreement. The High Income Fund may invest in multiple series or tranches of a loan, which may have varying terms and carry different associated risks. The High Income Fund generally has no right to enforce compliance with the terms of the loan agreement with the borrower. As a result, the High Income Fund may be subject to the credit risk of both the borrower and the lender that is selling the loan agreement. When the High Income Fund purchases assignments from lenders it acquires direct rights against the borrower of the loan. The High Income Fund may enter into unfunded loan commitments, which are contractual obligations for future funding. Unfunded loan commitments represent a future obligation in full, even though a percentage of the notional loan amounts may not be utilized by the borrower. When investing in a loan participation, the High Income Fund has the right to receive payments of principal, interest and any fees to which it is entitled only from the lender selling the loan agreement and only upon receipt of payments by the lender from the borrower. The High Income Fund may receive a commitment fee based on the undrawn portion of the underlying line of credit portion of a floating rate loan. In certain circumstances, the High Income Fund may receive a penalty fee upon the prepayment of a floating rate loan by a borrower. Fees earned or paid are recorded as a component of interest income or interest expense, respectively, on the Statement of Operations. At September 30, 2013, the High Income Fund had $559,000 in outstanding loan commitments.
6. INVESTMENT ADVISORY FEE AND OTHER TRANSACTIONS WITH AFFILIATES
The Adviser serves as the investment adviser to the Funds. Under the terms of the management agreement (the “Agreement”), the Adviser, subject to the supervision of the Board, provides or arranges to be provided to the Funds such investment advice as it deems advisable and will furnish or arrange to be furnished a continuous investment program for the Funds consistent with the Funds’ investment objectives and policies. As compensation for its management services, the Funds are obligated to pay the Adviser a fee computed and accrued daily and paid monthly in arrears at an annual rate of the average daily net assets of the Funds. The following table reflects the Funds’ contractual management fee rates (expressed as an annual rate).
| | |
| Annual Report | September 30, 2013 | | 125 |
| | |
| RiverNorth Funds | | Notes to Financial Statements |
| | September 30, 2013 |
| | |
| Fund | | Contractual Management Fee |
|
Core Opportunity Fund | | 1.00% |
Strategic Income Fund | | 0.75% |
Dividend Income Fund | | 1.00% |
High Income Fund | | 1.00% |
Dynamic Buy-Write Fund | | 1.00% |
The Adviser has contractually agreed to defer the collection of the Funds’ management fees and/or reimburse expenses, but only to the extent necessary to limit net annual operating expenses (excluding brokerage fees and commissions; borrowing costs, such as (a) interest and (b) dividends on securities sold short; taxes; indirect expenses incurred by the underlying funds in which the Funds’ invest; and extraordinary expenses) as a percentage of the average daily net assets of the Funds through January 31, 2014. Each deferral of fees or reimbursements of expenses by the Adviser are subject to repayment by the Fund within the three fiscal years following the fiscal year in which the expenses were incurred, provided that the Fund is able to make the repayment without exceeding the below expense limitations.
| | | | | | |
| Fund | | Class I | | Class R | | Expiration of Expense Limitation Agreement |
|
Core Opportunity Fund | | N/A | | 1.60% | | January 31, 2014 |
Strategic Income Fund | | 0.95% | | 1.20% | | January 31, 2014 |
Dividend Income Fund | | 1.35% | | 1.60% | | January 31, 2014 |
High Income Fund | | 1.35% | | 1.60% | | January 31, 2014 |
Dynamic Buy-Write Fund | | N/A | | 1.80% | | January 31, 2014 |
As of the year ended September 30, 2013, the following fees were waived or reimbursed by the Adviser:
| | | | | | |
| Fund | | Expires 2014 | | Expires 2015 | | Expires 2016 |
|
Core Opportunity Fund | | $ N/A | | $ N/A | | $ N/A |
Strategic Income Fund | | N/A | | N/A | | N/A |
Dividend Income Fund | | N/A | | 41,591 | | 85,606 |
High Income Fund | | N/A | | N/A | | 46,550 |
Dynamic Buy-Write Fund | | N/A | | N/A | | 61,295 |
DoubleLine is the investment sub-adviser to the Strategic Income Fund. Manning & Napier is the investment sub-adviser to the Dividend Income Fund. Oaktree Capital is the investment sub-adviser to the High Income Fund. Under the terms of the sub-advisory agreements, the Sub-Advisers, subject to the supervision of the Adviser and the Board of the Trust, provide or arrange to be provided to the Strategic Income Fund, the Dividend Income Fund, and the High Income Fund such investment advice as deemed advisable and will furnish or arrange to be furnished a continuous investment program for the portion of assets managed in the respective Fund consistent with the respective Fund’s investment objective and policies. As compensation for its sub-advisory services, the Adviser is obligated to pay each Sub-Adviser a fee computed and accrued daily and paid monthly in arrears based on an annual rate of the average daily net assets of the Strategic Income Fund, Dividend Income Fund, and the High Income Fund.
ALPS Fund Services, Inc. (“ALPS”) provides the Funds with fund administration and fund accounting services. ALPS also serves as transfer, dividend paying and shareholder servicing agent for the Funds (“Transfer Agent”).
The Northern Trust Company (the “Custodian”) serves as the Funds’ custodian.
| | |
| 126 | | (888) 848-7569 | www.rivernorthfunds.com |
| | |
| RiverNorth Funds | | Notes to Financial Statements |
| | September 30, 2013 |
The Funds have adopted a plan pursuant to Rule 12b-1 under the Investment Company Act of 1940, as amended (the “Plan”). The Plan permits the Funds to pay the Adviser for distribution and promotion expenses related to marketing shares of the Funds. The amount payable annually by the Core Opportunity Fund, the Class R Shares of the Strategic Income Fund, the Class R Shares of the Dividend Income Fund, the Dynamic Buy-Write Fund, and the Class R Shares of the High Income Fund is 0.25% of the average daily net assets. Under the Plan the Trust may engage in any activities related to the distribution of Fund shares. The expenses of the Funds’ Plan are reflected as 12b-1 fees in the statement of operations.
The Funds have entered into a Distribution Agreement with ALPS Distributors, Inc (“the Distributor”) to provide distribution services to the Funds. The Distributor serves as underwriter/distributor of shares of the Funds.
Officers of the Trust and Trustees who are “interested persons” of the Trust or the Adviser will receive no salary or fees from the Trust. Each Trustee who is not an “interested person” receives a fee of $25,000 per year. The audit committee chairman receives an additional $1,000 per year. The Trust reimburses each Trustee and Officer for his or her travel and other expenses relating to attendance at such meetings.
Certain Trustees and Officers of the Trust are also officers of the Adviser, the Distributor or the Administrator.
7. TAX BASIS INFORMATION
Tax Basis of Distributions to Shareholders
Tax Basis of Distributions to Shareholders: The character of distributions made during the year from net investment income or net realized gains may differ from its ultimate characterization for federal income tax purposes. Also, due to the timing of dividend distributions, the fiscal year in which amounts are distributed may differ from the fiscal year in which the income or realized gain were recorded by a Fund.
The tax character of distributions paid by the Funds during the fiscal year ended September 30, 2013, was as follows:
| | | | | | | | | | | | | | | | |
| | | Ordinary Income | | | Distributions paid from Long-Term Capital Gain | | | Return of Capital | | | Total | |
Core Opportunity Fund* | | $ | 15,176,518 | | | $ | 23,026,975 | | | $ | – | | | $ | 38,203,493 | |
Strategic Income Fund* | | | 81,042,978 | | | | 3,447,829 | | | | – | | | | 84,490,807 | |
Dividend Income Fund* | | | 563,141 | | | | 2,419 | | | | – | | | | 565,560 | |
High Income Fund* | | | 405,890 | | | | 11,511 | | | | 288,543 | | | | 705,944 | |
Dynamic Buy-Write Fund* | | | 622 | | | | 157 | | | | – | | | | 779 | |
| | |
| Annual Report | September 30, 2013 | | 127 |
| | |
| RiverNorth Funds | | Notes to Financial Statements |
| | September 30, 2013 |
The tax character of distributions paid by the Funds during the fiscal year ended September 30, 2012, was as follows:
| | | | | | | | | | | | | | | | |
| | | Ordinary Income | | | Distributions paid from Long-Term Capital Gain | | | Return of Capital | | | Total | |
Core Opportunity Fund | | $ | 19,491,846 | | | $ | 22,521,491 | | | | – | | | $ | 42,013,337 | |
Strategic Income Fund | | | 56,708,539 | | | | 28,826 | | | | – | | | | 56,737,365 | |
Dividend Income Fund | | | 17,757 | | | | – | | | | – | | | | 17,757 | |
High Income Fund | | | N/A | | | | N/A | | | | N/A | | | | N/A | |
Dynamic Buy-Write Fund | | | N/A | | | | N/A | | | | N/A | | | | N/A | |
| * | Classifications of Distributions: Net investment income and net realized gain may differ for financial statement and tax purposes. The character of distributions made during the year from net investment income or net realized gains may differ from its ultimate characterization for federal income tax purposes. |
Components of Distributable Earnings on a Tax Basis: The tax components of distributable earnings are determined in accordance with income tax regulations which may differ from the composition of net assets reported under GAAP. Accordingly, for the year ended September 30, 2013, certain differences were reclassified. These differences were primarily due to book/tax distribution differences, to the different tax treatment of organizational costs and certain other investments; the amounts reclassified did not affect net assets. The reclassifications were as follows:
| | | | | | | | | | | | |
| | | (Decrease) Paid-in Capital | | | Increase Accumulated Net Investment Income | | | Increase/(Decrease) Accumulated Net Realized Gain/(Loss) | |
Core Opportunity Fund | | $ | – | | | $ | 5,631,230 | | | $ | (5,631,230) | |
Strategic Income Fund | | | – | | | | 11,086,582 | | | | (11,086,582) | |
Dividend Income Fund | | | (41,739) | | | | 234,987 | | | | (193,248) | |
High Income Fund | | | (331,242) | | | | 327,381 | | | | 3,861 | |
Dynamic Buy-Write Fund | | | (37,974) | | | | 92,261 | | | | (54,287) | |
At September 30, 2013, the components of distributable earnings on a tax basis for the Funds were as follows:
| | | | | | | | | | | | | | | | | | | | |
| | | Undistributed Ordinary Income | | | Accumulated Capital Gains | | | Net Unrealized Appreciation/ (Depreciation) | | | Other Cumulative Effect of Timing Differences | | | Total | |
Core Opportunity Fund | | $ | – | | | $ | 30,699,300 | | | $ | 76,012,037 | | | $ | 1,159 | | | $ | 106,712,496 | |
Strategic Income Fund | | | – | | | | 3,604,302 | | | | (10,904,444) | | | | (7,903,794) | | | | (15,203,936) | |
Dividend Income Fund | | | 544,259 | | | | 122,647 | | | | 1,207,956 | | | | – | | | | 1,874,862 | |
High Income Fund | | | – | | | | – | | | | (589,980) | | | | 200,977 | | | | (389,003) | |
Dynamic Buy-Write Fund | | | 1,063,023 | | | | – | | | | (169,706) | | | | (126,482) | | | | 766,835 | |
| | |
| 128 | | (888) 848-7569 | www.rivernorthfunds.com |
| | |
| RiverNorth Funds | | Notes to Financial Statements |
| | September 30, 2013 |
Capital Losses: As of September 30, 2013 the Funds do not have unused capital loss carryforwards which may reduce the Funds’ taxable income arising from future net realized gains on investments.
Strategic Income Fund and High Income Fund have elected to defer to the period ending September 30, 2014 capital losses recognized during the period November 1, 2012 to September 30, 2013 in the amount of $7,794,674 and $30,485, respectively.
Unrealized Appreciation and Depreciation on Investments: The amount of net unrealized appreciation (depreciation) and the cost of investment securities for tax purposes, including short-term securities at September 30, 2013, were as follows:
| | | | | | | | | | | | | | | | | | | | | | | | | |
| Fund | | Gross Appreciation (excess of
value over
tax cost) | | Gross Depreciation (excess of tax cost over value) | | Net Depreciation of Foreign Currency and Derivatives | | Net Unrealized Appreciation/ (Depreciation) | | Cost of Investments for Income Tax Purposes |
Core Opportunity Fund | | | $ | 86,474,011 | | | | $ | (10,461,974 | ) | | | $ | – | | | | $ | 76,012,037 | | | | $ | 574,755,054 | |
Strategic Income Fund | | | | 46,332,148 | | | | | (57,236,592 | ) | | | | – | | | | | (10,904,444 | ) | | | | 1,060,397,537 | |
Dividend Income Fund | | | | 1,306,827 | | | | | (98,871 | ) | | | | – | | | | | 1,207,956 | | | | | 12,617,801 | |
High Income Fund | | | | 616,655 | | | | | (976,697 | ) | | | | (229,938 | ) | | | | (589,980 | ) | | | | 49,807,327 | |
Dynamic Buy-Write Fund | | | | 370,268 | | | | | (459,016 | ) | | | | (80,958 | ) | | | | (169,706 | ) | | | | 10,383,971 | |
| * | The difference between book and tax basis unrealized appreciation (depreciation) for the Funds is attributable primarily to the tax deferral of losses on wash sales. |
8. INVESTMENTS TRANSACTIONS
Investment transactions for the year ended September 30, 2013, excluding U.S. Government Obligations and short-term investments, were as follows:
| | | | | | | | | | |
| Fund | | Purchases of Securities | | Proceeds from Sales of Securities |
Core Opportunity Fund | | | $ | 298,604,302 | | | | $ | 217,464,145 | |
Strategic Income Fund | | | | 594,611,680 | | | | | 581,763,431 | |
Dividend Income Fund | | | | 17,477,317 | | | | | 12,911,723 | |
High Income Fund(a) | | | | 73,404,351 | | | | | 27,474,443 | |
Dynamic Buy-Write Fund(b) | | | | 52,424,004 | | | | | 44,715,204 | |
| | |
| Annual Report | September 30, 2013 | | 129 |
| | |
| RiverNorth Funds | | Notes to Financial Statements |
| | September 30, 2013 |
Investment Transactions in U.S. Government Obligations for the year ended September 30, 2013 were as follows:
| | | | | | | | |
| Fund | | Purchases of Securities | | | Proceeds from Sales of Securities | |
Strategic Income Fund | | $ | 376,520,101 | | | $ | 452,461,577 | |
| (a) | Fund commenced operations on December 28, 2012. |
| (b) | Fund commenced operations on October 12, 2012. |
9. REVOLVING LINE OF CREDIT
The Funds have a $100,000,000 Revolving Credit Agreement with The Northern Trust Company. Borrowings under this arrangement are secured by investments held in each Fund’s portfolio and bear interest at the Federal Funds Rate in effect on the day the loan is made plus 1.15% or a minimum of 1.75%, whichever is greater. For unloaned balances the Funds pay a facility fee equal to the product of $100,000,000 less the principal amount of loans outstanding and 0.15%, this fee is reported on the Statements of Operations as Facility Loan Fee. This contract is up for renewal in July 11, 2014. As of September 30, 2013, there was no outstanding balance and there were no borrowings made during the year.
10. BENEFICIAL OWNERSHIP
On September 30, 2013, there were an unlimited number of no par value shares of beneficial interest authorized for each Fund. Transactions in shares of beneficial interest are shown in the Statement of Changes in Net Assets.
The beneficial ownership, either directly or indirectly, of more than 25% of the voting securities of a fund creates a presumption of control of the fund, under Section 2(a)(9) of the Investment Company Act of 1940. Beneficial owners owning more than 25% of the voting securities for the benefit of their customers of each class of each Fund, as of September 30, 2013, are listed below:
| | | | |
| Fund | | Shareholder Name | | Percentage Interest |
Core Opportunity Fund | | National Financial Services LLC | | 56.56% |
Core Opportunity Fund | | Charles Schwab & Company, Inc. | | 25.45% |
Strategic Income Fund - Class I | | Charles Schwab & Company, Inc. | | 29.09% |
Strategic Income Fund - Class R | | UBS Wealth Management USA | | 40.66% |
Dividend Income Fund - Class R | | National Financial Services LLC | | 43.64% |
Dividend Income Fund - Class R | | Charles Schwab & Company, Inc. | | 30.64% |
High Income Fund - Class R | | UBS Wealth Management USA | | 47.73% |
High Income Fund - Class I | | Charles Schwab & Company, Inc. | | 48.93% |
Dynamic Buy-Write Fund | | Charles Schwab & Company, Inc. | | 47.51% |
11. INDEMNIFICATIONS
Under the Trust’s organizational documents, its officers and Trustees are indemnified against certain liability arising out of the performance of their duties to the Trust. Additionally, in the normal course of business, the Trust enters into contracts with service providers that may contain general
| | |
| 130 | | (888) 848-7569 | www.rivernorthfunds.com |
| | |
| RiverNorth Funds | | Notes to Financial Statements |
| | September 30, 2013 |
indemnification clauses. The Trust’s maximum exposure under these arrangements is unknown, as this would involve future claims that may be made against the Trust that have not yet occurred.
12. RECENT ACCOUNTING PRONOUNCEMENTS
In December 2011, the Financial Accounting Standards Board (“FASB”) issued Accounting Standards Update (“ASU”) No. 2013-01 “Clarifying the Scope of Disclosures about Offsetting Assets and Liabilities (Balance Sheet Topic 210” to expand current disclosure requirements on the offsetting of certain assets and liabilities. The new disclosures will be required for investments and derivative financial instruments subject to master netting or similar agreements which are eligible for offset in the Statements of Assets and Liabilities and will require an entity to disclose both gross and net information about such investments and transactions in the financial statements. The guidance is effective for financial statements with fiscal years beginning on or after January 1, 2013, and interim periods within those fiscal years. Management is evaluating the impact of this guidance on each Fund’s financial statement disclosure.
In June 2013, the FASB issued ASU No. 2013-08, Financial Services-Investment Companies (Topic 946): Amendments to the Scope, Measurement, and Disclosure Requirements. The FASB standard identifies characteristics a company must assess to determine whether it is considered an investment company for financial reporting purposes. This ASU is effective for fiscal years beginning after December 15, 2013. The Fund believes the adoption of this ASU will not have a material impact on its financial statements.
13. SUBSEQUENT EVENTS
On November 20, 2013, the Board of Trustees of RiverNorth Funds voted to approve the termination of the Subadvisory Agreement between RiverNorth Capital Management, LLC and Manning & Napier Advisors, LLC related to the Dividend Income Fund. Effective December 31, 2013 RiverNorth Capital Management will take over full management of the Dividend Income Fund and the name of the Dividend Income Fund will be changed to the RiverNorth Equity Opportunity Fund. Although the RiverNorth Equity Opportunity Fund’s objective will remain the same, the strategy will change to permit the RiverNorth Equity Opportunity Fund to gain exposure to the equity markets through exchange-traded funds rather than individual dividend-paying stocks. The effective date of the strategy change will be January 28, 2014. In the interim, the Dividend Income Fund will provide shareholders with 60-days advance notice of the strategy change in accordance with Rule 35d-1 of the Investment Company Act of 1940. Additional details regarding the new strategy and associated risks will be included in the RiverNorth Equity Opportunity Fund’s prospectus to be updated January 28, 2014.
Also on November 20, 2013, the Board of Trustees of RiverNorth Funds voted to approve a change of name and strategy of the Dynamic Buy-Write Fund. Effective January 1, 2014, the name of the Dynamic Buy-Write Fund will change to the RiverNorth Managed Volatility Fund. The RiverNorth Managed Volatility Fund’s objective will remain the same; however, the strategy will change to permit the RiverNorth Managed Volatility Fund to invest less than 80% of its nets assets, plus any borrowings for investment purposes, in common stocks, preferred stocks and options on those securities. The effective date of the strategy change will be January 28, 2014. In the interim, the Dynamic Buy-Write Fund will provide shareholders with 60-days advance notice of the strategy change in accordance with Rule 35d-1 of the Investment Company Act of 1940. Additional details regarding the new strategy and associated risks will be included in the RiverNorth Managed Volatility Fund’s prospectus to be updated January 28, 2014.
| | |
| Annual Report | September 30, 2013 | | 131 |
| | |
| RiverNorth Funds | | Report of Independent Registered Public Accounting Firm |
| | |
To the Shareholders and Board of Trustees of RiverNorth Funds
We have audited the accompanying statements of assets and liabilities, including the schedules of investments and schedule of written options, of RiverNorth Funds, comprising RiverNorth Core Opportunity Fund, RiverNorth/DoubleLine Strategic Income Fund, RiverNorth/Manning & Napier Dividend Income Fund, RiverNorth/Oaktree High Income Fund, and RiverNorth Dynamic Buy-Write Fund (the “Funds”), as of September 30, 2013, and the related statement of operations for the year then ended, the statements of changes in net assets for each of the two years in the period then ended, and the financial highlights for each of the five years in the period then ended for RiverNorth Core Opportunity Fund, and the related statement of operations for the year then ended, the statements of changes in net assets for each of the two years in the period then ended, and the financial highlights for each of the three periods in the period then ended for RiverNorth/DoubleLine Strategic Income Fund, and the related statement of operations for the year then ended, the statements of changes in net assets and the financial highlights for each of the two periods in the period then ended for RiverNorth/Manning & Napier Dividend Income Fund, and the related statements of operations and changes in net assets and the financial highlights for the period December 28, 2012 (commencement of operations) to September 30, 2013 for RiverNorth/Oaktree High Income Fund, and the related statements of operations and changes in net assets and the financial highlights for the period October 12, 2012 (commencement of operations) to September 30, 2013 for RiverNorth Dynamic Buy-Write Fund. These financial statements and financial highlights are the responsibility of the Funds’ management. Our responsibility is to express an opinion on these financial statements and financial highlights based on our audits.
We conducted our audits in accordance with the standards of the Public Company Accounting Oversight Board (United States). Those standards require that we plan and perform the audit to obtain reasonable assurance about whether the financial statements and financial highlights are free of material misstatement. An audit includes examining, on a test basis, evidence supporting the amounts and disclosures in the financial statements. Our procedures included confirmation of securities owned as of September 30, 2013, by correspondence with the custodian and brokers or by other appropriate auditing procedures where replies from brokers were not received. An audit also includes assessing the accounting principles used and significant estimates made by management, as well as evaluating the overall financial statement presentation. We believe that our audits provide a reasonable basis for our opinion.
In our opinion, the financial statements and financial highlights referred to above present fairly, in all material respects, the financial position of each of the Funds constituting RiverNorth Funds as of September 30, 2013, the results of each of their operations, the changes in each of their net assets and the financial highlights for each of the periods presented, in conformity with accounting principles generally accepted in the United States of America.
COHEN FUND AUDIT SERVICES, LTD.
Cleveland, Ohio
November 26, 2013
| | |
| 132 | | (888) 848-7569 | www.rivernorthfunds.com |
| | |
| RiverNorth Funds | | Additional Information |
| | September 30, 2013 (Unaudited) |
PROXY VOTING GUIDELINES
A description of the policies and procedures that the Funds used to determine how to vote proxies relating to portfolio securities and information regarding how the Funds voted proxies during the most recent 12-month period ended June 30, are available without charge upon request by (1) calling the Funds at (888) 848-7569 and (2) from Form N-PX filed by the Funds with the Securities and Exchange Commission (“SEC”) on the SEC’s website at www.sec.gov.
PORTFOLIO HOLDINGS DISCLOSURE POLICY
The Funds file a complete schedule of investments with the SEC for the first and third quarter of each fiscal year on Form N-Q. The Funds’ first and third fiscal quarters end on December 31 and June 30. The Form N-Q filing must be made within 60 days of the end of the quarter, and the Funds’ first Form N-Q was filed with the SEC on February 26, 2007. The Funds’ Forms N-Q are available on the SEC’s website at www.sec.gov, or they may be reviewed and copied at the SEC’s Public Reference Room in Washington, DC (call 1-800-732-0330 for information on the operations of the Public Reference Room). You may also obtain copies by calling the Funds at 1-888-848-7569.
UNAUDITED TAX INFORMATION
The Funds designate the following as a percentage of taxable ordinary income distributions, or up to the maximum amount allowable, for the calendar year ended December 31, 2012:
| | | | |
| | | Qualified Dividend Income | | Dividend Received Deduction |
| | |
Core Opportunity Fund | | 0.00% | | 0.00% |
Strategic Income Fund | | 0.00% | | 0.00% |
Dividend Income Fund | | 18.03% | | 16.00% |
High Income Fund | | N/A | | N/A |
Dynamic Buy-Write Fund | | 0.00% | | 0.00% |
Pursuant to Section 852(b)(3) of the Internal Revenue Code, the Core Opportunity Fund, Strategic Income Fund, Dividend Income Fund, High Income Fund and the Dynamic Buy-Write Fund designated $23,026,975, $3,447,829, $2,419, $11,511 and $157 respectively as long-term capital gain dividends.
| | |
| Annual Report | September 30, 2013 | | 133 |
| | |
| RiverNorth Funds | | Trustees and Officers |
| | September 30, 2013 (Unaudited) |
The Board of Trustees supervises the business activities of the Trust and appoints the officers. Each Trustee serves as a trustee until the termination of the Trust unless the Trustee dies, resigns, retires or is removed. The Board generally meets four times a year to review the progress and status of the Funds.
The following table provides information regarding each Trustee who is not an “interested person” of the Trust, as defined in the Investment Company Act of 1940, as amended.
| | | | | | | | | | |
Name, Address and Year of Birth(1) | | Position(s) Held with the Fund | | Term of Office/Length of Time Served | | Principal Occupation(s) During Past 5 Years | | Number of Portfolios in Fund Complex Overseen by Trustee(2) | | Other Directorships Held by Trustee During the Past 5 Years |
John K. Carter Y.O.B. 1961 | | Trustee | | Indefinite/January 2013 to present | | Managing Partner, Global Recruiters of St. Petersburg (a financial services consulting and recruiting firm) (2012 to present); Business Unit Head, Transamerica Asset Management (2006 to 2012); Senior Vice President, General Counsel and Chief Compliance Officer, Transamerica Asset Management (2004 to 2006) | | 5 | | Director, Chairman of the Board of Directors, Transamerica Funds (120 funds) (2006 to 2012). Board Member, United Way of Tampa Bay (2011 to 2012) |
| James G. Kelley Y.O.B. 1948 | | Trustee | | Indefinite/December 2006 to present | | Certified Business Coach, JGK & Associates (2000 to present); Vice President Finance & Operation, Paymaster Technologies, Inc. (2009 to 2010); Executive Vice President /Chief Operating Officer, The Hedman Company (a manufacturing and distribution company) (1984 to 2010). | | 5 | | NA |
John S. Oakes Y.O.B. 1943 | | Trustee | | Indefinite/December 2010 to present | | Principal, Financial Search and Consulting (a recruiting and consulting firm) (2013 to present); Regional Vice President, Securities America (a broker-dealer) (2007 to 2013); Business Development Director, First Allied Securities (a broker-dealer) (2005 to 2007). | | 5 | | Independent Director, Chairman of the Board of Directors, Utopia Funds (4 funds) (2005 to 2009). |
| | |
| 134 | | (888) 848-7569 | www.rivernorthfunds.com |
| | |
| RiverNorth Funds | | Trustees and Officers |
| | September 30, 2013 (Unaudited) |
| | | | | | | | | | |
Name, Address and Year of Birth(1) | | Position(s) Held with the Fund | | Term of Office/Length of Time Served | | Principal Occupation(s) During Past 5 Years | | Number of Portfolios in Fund Complex Overseen by Trustee(2) | | Other Directorships Held by Trustee During the Past 5 Years |
| Fred G. Steingraber Y.O.B. 1938 | | Trustee | | Indefinite/January 2013 to present | | Chairman, Board Advisors LLC (a consulting firm) (2001 to present). Retired, Chairman Emeritus, A.T. Kearney (a business consulting firm) (2001 to present) | | 5 | | Director, Diamond Hill Financial Trends Fund (a closed-end fund) (1989 to present). Director, Elkay Manufacturing (2004 to present). Director, Talent Intelligence (leadership development) (2004 to present). Director, 3iPLC (a private equity firm) (2001 to 2008). Director, Continental (automotive electronics and tires) (1999 to 2009). Chairman Emeritus, A.T. Kearney (management consulting) (2001 to present). Chairman, Board Advisors (Board consulting) (2001 to present) |
| (1) | The mailing address of each Trustee is 325 N. LaSalle Street, Suite 645, Chicago, IL 60654. |
| (2) | The Fund Complex is comprised of the RiverNorth Core Opportunity Fund, the RiverNorth/DoubleLine Strategic Income Fund, the RiverNorth/Manning & Napier Dividend Income Fund, the RiverNorth/Oaktree High Income Fund, and the RiverNorth Dynamic Buy-Write Fund. |
| | |
| Annual Report | September 30, 2013 | | 135 |
| | |
| RiverNorth Funds | | Trustees and Officers |
| | September 30, 2013 (Unaudited) |
The following table provides information regarding each Trustee who is an “interested person” of the Trust, as defined in the Investment Company Act of 1940, as amended, and each officer of the Trust.
| | | | | | | | | | |
Name, Address and Year of Birth(1) | | Position(s) Held with the Fund | | Term of Office/Length of Time Served | | Principal Occupation(s) During Past 5 Years | | Number of Portfolios in Fund Complex Overseen by Trustee(2) | | Other Directorships Held by Trustee During the Past 5 Years |
| Patrick W. Galley(3) Y.O.B. 1975 | | President, Principal Executive Officer and Trustee | | Indefinite/July 2006 to present | | Chief Investment Officer, RiverNorth Capital Management, LLC. (2004 to present). | | 5 | | Board of Managers of RiverNorth Capital Management, LLC (2010 to present), Board of Managers of RiverNorth Securities, LLC (2010 to 2012) and Board of Directors RiverNorth Holdings, Co. (2010 to present). |
Jonathan M. Mohrhardt Y.O.B. 1974 | | Treasurer, and Chief Financial Officer | | Indefinite/February 2009 to present | | Chief Compliance Officer, RiverNorth Capital Management, LLC. (2009 to 2012); Chief Operating Officer, RiverNorth Capital Management, LLC (2011 to present) and President, Chief Executive Officer and Chief Compliance Officer, RiverNorth Securities, LLC (2010 to 2012); Utopia Funds Chief Compliance Officer 2007 to 2009, Treasurer and Chief Financial Officer 2005 to 2009; FIM Group, Director of Mutual Funds (2004 to 2009). | | NA | | Board of Managers of RiverNorth Capital Management, LLC (2010 to present), Board of Managers of RiverNorth Securities, LLC (2010 to 2012) and Board of Directors RiverNorth Holdings, Co. (2010 to present). |
| Marcus L. Collins Y.O.B. 1968 | | Chief Compliance Officer | | Indefinite/May 2012 to Present | | General Counsel, RiverNorth Capital Management, LLC (2012 to present), Chief Compliance Officer, RiverNorth Capital Management, LLC (2012 to present) Counsel, Thompson Hine, LLP (2007 to 2012) | | NA | | NA |
| | |
| 136 | | (888) 848-7569 | www.rivernorthfunds.com |
| | |
| RiverNorth Funds | | Trustees and Officers |
| | September 30, 2013 (Unaudited) |
| | | | | | | | | | |
Name, Address and
Year of Birth(1) | | Position(s) Held with the Fund | | Term of Office/Length of Time Served | | Principal Occupation(s) During Past 5 Years | | Number of
Portfolios
in Fund Complex
Overseen by
Trustee(2) | | Other
Directorships Held by Trustee During the Past 5 Years |
Paul F. Leone Y.O.B. 1963 c/o ALPS Fund Services, Inc. 1290 Broadway, Suite 1100 Denver, CO 80203 | | Secretary | | Indefinite/December 2010 to present | | Associate Counsel, ALPS Fund Services, Inc. (2010 to present); Deputy Chief Compliance Officer, Old Mutual Capital (2005 to 2009). | | NA | | NA |
J. Tison Cory Y.O.B. 1969 c/o ALPS Fund Services, Inc. 1290 Broadway, Suite 1100 Denver, CO 80203 | | Assistant Secretary | | Indefinite/December 2010 to present | | Senior Paralegal, ALPS Fund Services, Inc. (2005 to present); Adjunct Professor, Metropolitan State College of Denver (2000 to present). | | NA | | NA |
Gina Meyer Y.O.B. 1980 c/o ALPS Fund Services, Inc. 1290 Broadway, Suite 1100 Denver, CO 80203 | | Assistant Treasurer | | Indefinite/August 2013 to present | | Fund Controller, ALPS Fund Services (2012 to present); Fund Accounting Manager, Jackson National Asset Management (2008 to 2012). | | NA | | NA |
| (1) | The mailing address of each Trustee and listed Officer is 325 N. LaSalle Street, Suite 645, Chicago, IL 60654. |
| (2) | The Fund Complex consists of the RiverNorth Core Opportunity Fund, the RiverNorth/DoubleLine Strategic Income Fund, the RiverNorth/Manning & Napier Dividend Income Fund, the RiverNorth/Oaktree High Income Fund, and the RiverNorth Dynamic Buy-Write Fund. |
| (3) | Patrick W. Galley is considered an “Interested” Trustee as defined in the Investment Company Act of 1940, as amended, because he is an officer of the Trust and Chief Investment Officer of the Funds’ investment adviser. |
| | |
| Annual Report | September 30, 2013 | | 137 |
| | |
| | |
| 138 | | (888) 848-7569 | www.rivernorthfunds.com |
| | |
| | |
| Annual Report | September 30, 2013 | | 139 |
| | | | |
RiverNorth Funds RiverNorth Core Opportunity Fund RiverNorth/DoubleLine Strategic Income Fund RiverNorth/Manning & Napier Dividend Income Fund RiverNorth/Oaktree High Income Fund RiverNorth Dynamic Buy-Write Fund Board of Trustees Patrick W. Galley, CFA, Chairman James G. Kelley John S. Oakes Fred G. Steingraber John K. Carter Investment Adviser RiverNorth Capital Management, LLC Sub Advisers DoubleLine Capital, LP Manning & Napier Advisors, LLC Oaktree Capital Management, L.P. Transfer Agent, Administrator and Dividend Disbursing Agent ALPS Fund Services, Inc. Distributor ALPS Distributors, Inc. Custodian The Northern Trust Company Independent Registered Public Accounting Firm Cohen Fund Audit Services, Ltd. This report is provided for the general information of the shareholders of the RiverNorth Funds. This report is not intended for distribution to prospective investors in the Funds, unless preceded or accompanied by an effective prospectus. | |
| 
|
|
| |
| |
| |
| |
| |
| |
| |
| |
| |
| |
| |
| |
| |
| |
| |
| |
| |
| |
| |
| |
| |
| |
| |
| |
| |
| |
| |
| (a) | The registrant, as of the end of the period covered by this report, has adopted a code of ethics that applies to the registrant’s principal executive officer, principal financial officer, principal accounting officer or controller or any persons performing similar functions on behalf of the registrant. |
| (b) | For purposes of this item, “code of ethics” means written standards that are reasonably designed to deter wrongdoing and to promote: |
| | (1) | Honest and ethical conduct, including the ethical handling of actual or apparent conflicts of interest between personal and professional relationships; |
| | (2) | Full, fair, accurate, timely, and understandable disclosure in reports and documents that a registrant files with, or submits to, the Commission and in other public communications made by the registrant; |
| | (3) | Compliance with applicable governmental laws, rules, and regulations; |
| | (4) | The prompt internal reporting of violations of the code of ethics to an appropriate person or persons identified in the code of ethics; and |
| | (5) | Accountability for adherence to the code of ethics. |
| (c) | Amendments: During the period covered by this report, no amendments were made to the provisions of the code of ethics adopted in 2(a) above. |
| (d) | Waivers: During the period covered by this report, no implicit or explicit waivers to the provisions of the code of ethics adopted in 2(a) above were granted. |
| (e) | Posting: We do not intend to post the code of ethics for the Officers or any amendments or waivers on a website. |
| (f) | Availability: The code of ethics for the Officers can be obtained, free of charge by calling the toll free number for the appropriate Fund. |
| Item 3. | Audit Committee Financial Expert. |
The registrant’s board of trustees has determined that the registrant does not have an audit committee financial expert. The committee members and the full Board considered a possibility of adding a member that would qualify as an expert. The audit committee determined that, although none of its members meet the technical definition of an audit committee expert, the committee has sufficient financial expertise to adequately perform its duties under the Audit Committee Charter without the addition of a qualified expert.
| Item 4. | Principal Accountant Fees and Services. |
| | | | | | | | |
| (a) | | Audit Fees | | | | | | |
| | Fiscal Year | | | Audit Fees | | | |
| | FY 2013 | | | $71,000 | | | |
| | FY 2012 | | | $40,500 | | | |
| | | |
| (b) | | Audit-Related Fees | | | | | | |
| | Fiscal Year | | | Registrant | | | |
| | FY 2013 | | | $0 | | | |
| | FY 2012 | | | $0 | | | |
| | | |
| (c) | | Tax Fees | | | | | | |
| | Fiscal Year | | | Registrant | | | |
| | FY 2013 | | | $20,000 | | | |
| | FY 2012 | | | $12,000 | | | |
| | Nature of the Tax Fees: prepare tax returns |
| | | |
| (d) | | All Other Fees | | | | | | |
| | Fiscal Year | | | Registrant | | | |
| | FY 2013 | | | $5,450 | | | |
| | FY 2012 | | | $3,030 | | | |
| | Nature of the fees: cursory review of Semi-Annual Shareholder report, post-effective amendment consents and distribution calculation review |
| |
| (e) | | |
| | (1) Audit Committee’s Pre-Approval Policies |
| | The Audit Committee Charter requires the Audit Committee to be responsible for the selection, retention or termination of auditors and, in connection therewith, to (i) evaluate the proposed fees and other compensation, if any, to be paid to the auditors, (ii) evaluate the independence of the auditors, (iii) pre-approve all audit services and, when appropriate, any non-audit services provided by the independent auditors to the Trust, (iv) pre-approve, when appropriate, any non-audit services provided by the independent auditors to the Trust’s investment adviser, or any entity controlling, controlled by, or under common control with the investment adviser and that provides ongoing services to the Trust if the engagement relates directly to the operations and financial reporting of the Trust, and (v) receive the auditors’ specific representations as to their independence. |
| |
| | (2) Percentages of Services Approved by the Audit Committee |
| | | |
| | Registrant | | | | | | |
| | Audit-Related Fees: | | | 0 | % | | |
| | Tax Fees: | | | 0 | % | | |
| | All Other Fees: | | | 0 | % | | |
| (f) | During audit of registrant’s financial statements for the most recent fiscal year, less than 50 percent of the hours expended on the principal accountant’s engagement were attributed to work performed by persons other than the principal accountant’s full-time, permanent employees. |
| (g) | The aggregate non-audit fees billed by the registrant’s accountant for services rendered to the registrant, and rendered to the registrant’s investment adviser (not including any sub-adviser whose role is primarily portfolio management and is subcontracted with or overseen by another investment adviser), and any entity controlling, controlled by, or under common control with the adviser that provides ongoing services to the registrant: |
| | | | | | |
| | | Fiscal Year | | Registrant | | Adviser |
| | FY 2013 | | $25,450 | | $0 |
| | FY 2012 | | $15,030 | | $0 |
| (h) | Not applicable. The auditor performed no services for the registrant’s investment adviser or any entity controlling, controlled by, or under common control with the investment adviser that provides ongoing services to the registrant. |
| Item 5. | Audit Committee of Listed Registrants. |
| | NOT APPLICABLE – applies to listed companies only |
| Item 6. | Schedule of Investments. |
| | Schedule included with Item 1. |
| Item 7. | Disclosure of Proxy Voting Policies and Procedures for Closed-End Management Investment Companies. |
| | NOT APPLICABLE – applies to closed-end funds only |
| Item 8. | Portfolio Managers of Closed-End Management Investment Companies. |
| | NOT APPLICABLE – applies to closed-end funds only |
| Item 9. | Purchases of Equity Securities by Closed-End Management Investment Company and Affiliated Purchasers. |
| | NOT APPLICABLE – applies to closed-end funds only |
| Item 10. | Submission of Matters to Vote of Security Holders. |
| | The registrant has not adopted procedures by which shareholders may recommend nominees to the registrant’s board of trustees. |
| Item 11. | Controls and Procedures. |
| | (a) | Based on an evaluation of the registrant’s disclosure controls and procedures (as defined in Rule 30a-3(c) under the Investment Company Act of 1940) as of a date within 90 days of the filing date of this Form N-CSR, the disclosure controls and procedures are reasonably designed to ensure that the information required in filings on Forms N-CSR is recorded, processed, summarized, and reported on a timely basis. |
| | (b) | There were no significant changes in the registrant’s internal control over financial reporting that occurred during the registrant’s second fiscal quarter of the period covered by this report that have materially affected, or are reasonably likely to materially affect, the registrant’s internal control over financial reporting. |
| | (a)(1) | Code of Ethics is filed herewith. |
| | (a)(2) | Certifications by the registrant’s principal executive officer and principal financial officer, pursuant to Section 302 of the Sarbanes-Oxley Act of 2002 and required by Rule 30a-2under the Investment Company Act of 1940 are filed herewith. |
| | (b) | Certification pursuant to 18 U.S.C. Section 1350, as adopted pursuant to Section 906 of the Sarbanes-Oxley Act of 2002 is filed herewith. |
SIGNATURES
Pursuant to the requirements of the Securities Exchange Act of 1934 and the Investment Company Act of 1940, the registrant has duly caused this report to be signed on its behalf by the undersigned, thereunto duly authorized.
| | |
| Registrant: | | RiverNorth Funds |
| | |
| |
| By: | | /s/ Patrick W. Galley |
| Name: | | Patrick W. Galley |
| Title: | | President |
| |
| Date: | | December 5, 2013 |
Pursuant to the requirements of the Securities Exchange Act of 1934 and the Investment Company Act of 1940, this report has been signed below by the following persons on behalf of the registrant and in the capacities and on the dates indicated.
| | |
| By: | | /s/ Patrick W. Galley |
| Name: | | Patrick W. Galley |
| Title: | | President & Chief Executive Officer |
| |
| Date: | | December 5, 2013 |
| |
| By: | | /s/ Jonathan M. Mohrhardt |
| Name: | | Jonathan M. Mohrhardt |
| Title: | | Treasurer & Chief Financial Officer |
| |
| Date: | | December 5, 2013 |