Use these links to rapidly review the document
TABLE OF CONTENTS
Index to Financial Statements of Ellora Energy Inc
As filed with the Securities and Exchange Commission on August 13, 2007
Registration No. 333-138583
UNITED STATES
SECURITIES AND EXCHANGE COMMISSION
Washington, D.C. 20549
Amendment No. 3 to
Form S-1
REGISTRATION STATEMENT
UNDER
THE SECURITIES ACT OF 1933
Ellora Energy Inc.
(Exact name of registrant as specified in its charter)
| Delaware (State or other jurisdiction of incorporation or organization) | 1311 (Primary Standard Industrial Classification Code Number) | 01-0717160 (I.R.S. Employer Identification Number) | ||
5665 Flatiron Parkway Boulder, CO 80301 (303) 444-8881 (Address, including zip code, and telephone number, including area code, of registrant's principal executive offices) | ||||
T. Scott Martin Chairman, President and Chief Executive Officer 5665 Flatiron Parkway Boulder, CO 80301 (303) 444-8881 (Name, address, including zip code, and telephone number, including area code, of agent for service) | ||||
Copies to: | ||
| Dallas Parker Kirk Tucker Thompson & Knight LLP 333 Clay Street, Suite 3300 Houston, TX 77002 (713) 654-8111 |
Approximate date of commencement of proposed sale to the public:
As soon as practicable after this Registration Statement is declared effective.
If any securities being registered on this form are to be offered on a delayed or continuous basis pursuant to Rule 415 under the Securities Act of 1933, as amended (the "Securities Act"), check the following box. ý
If this form is filed to register additional securities for an offering pursuant to Rule 462(b) under the Securities Act, check the following box and list the Securities Act registration statement number of the earlier effective registration statement for the same offering. o
If this form is a post-effective amendment filed pursuant to Rule 462(c) under the Securities Act, check the following box and list the Securities Act registration statement number of the earlier effective registration statement for the same offering. o
If this form is a post-effective amendment filed pursuant to Rule 462(d) under the Securities Act, check the following box and list the Securities Act registration statement number of the earlier effective registration statement for the same offering. o
The registrant hereby amends this registration statement on such date or dates as may be necessary to delay its effective date until the registrant shall file a further amendment which specifically states that this registration statement shall thereafter become effective in accordance with Section 8(a) of the Securities Act or until this registration statement shall become effective on such date as the Commission, acting pursuant to said Section 8(a), may determine.
The information in the prospectus is not complete and may be changed. The securities may not be sold until the registration statement filed with the Securities and Exchange Commission is effective. This prospectus is not an offer to sell these securities, and it is not soliciting an offer to buy these securities in any state where the offer or sale is not permitted.
SUBJECT TO COMPLETION, DATED AUGUST 13, 2007
PRELIMINARY PROSPECTUS
11,623,261 Shares
![]()
Common Stock
This prospectus relates to up to 11,623,261 shares of the common stock of Ellora Energy Inc., which may be offered and sold, from time to time, by the selling stockholders named in this prospectus. The selling stockholders acquired the shares of common stock offered by this prospectus in a private equity placement. We are registering the offer and sale of the shares of common stock to satisfy registration rights we have granted to the selling stockholders. We are not selling any shares of common stock under this prospectus and will not receive any proceeds from the sale of common stock by the selling stockholders.
The shares of common stock to which this prospectus relates may be offered and sold from time to time directly by the selling stockholders or alternatively through underwriters or broker-dealers or agents. The shares of common stock may be sold in one or more transactions, at fixed prices, at prevailing market prices at the time of sale, or at negotiated prices. Prior to this offering, there has been no public market for the common stock. We estimate that the selling stockholders initially will sell their shares at prices between $ per share and $ per share, if any shares are sold. Future prices will likely vary from this range and initial sales may not be indicative of prices at which our common stock will trade in the future. Please read "Plan of Distribution."
We have applied to list our common stock on the Nasdaq Global Market under the symbol "LORA."
Investing in our common stock involves a high degree of risk. You should read the section entitled "Risk Factors" beginning on page 11 for a discussion of certain risks that you should consider before buying shares of our common stock.
You should rely only on the information contained in this prospectus or any prospectus supplement or amendment. We have not authorized anyone to provide you with different information. We are not making an offer of these securities in any state where the offer is not permitted.
Neither the Securities and Exchange Commission nor any state securities commission has approved or disapproved these securities or determined if this prospectus is truthful or complete. Any representation to the contrary is a criminal offense.
The date of this prospectus is , 2007.
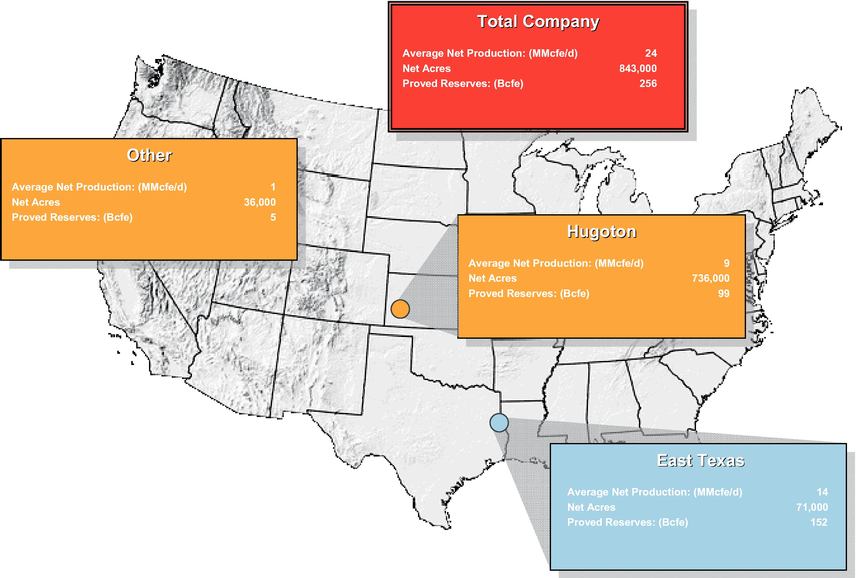
Ellora Energy Inc. Areas of Operation
As of and for the six months ended June 30, 2007
This summary highlights selected information from this prospectus but does not contain all information that you should consider before investing in our common stock. You should read this entire prospectus carefully, including "Risk Factors" beginning on page 12, and the financial statements included elsewhere in this prospectus. In this prospectus, we refer to Ellora Energy Inc., its subsidiaries and predecessors as "Ellora Energy," "we," "us," "our," or "our company." References to the number of shares of our common stock outstanding have been revised to reflect a 8.09216-for-1 stock split effected in July 2006. We engage MHA Petroleum Consultants, Inc., independent petroleum engineers ("MHA"), to evaluate our properties annually. The estimates of our proved reserves included in this prospectus as of June 30, 2007 are based on a reserve report prepared by MHA. A summary of MHA's report with respect to these estimated proved reserves as of June 30, 2007 is attached to this prospectus as Appendix A. We discuss sales volumes, per Mcf revenue, per Mcf cost and other data in this prospectus net of any royalty owner's interest. We have provided definitions for some of the industry terms used in this prospectus in the "Glossary of Selected Oil and Gas Terms."
Ellora Energy Inc.
Overview
We are an independent oil and gas company engaged in the acquisition, exploration, development and production of onshore domestic U.S. oil and gas properties and have been operating since our inception in June 2002. We primarily operate in two areas: east Texas and adjacent lands in western Louisiana, which we collectively refer to as East Texas, and the Hugoton field in southwest Kansas. We have assembled combined acreage of approximately 913,000 gross (843,000 net) acres providing us with 754 identified drilling locations. At June 30, 2007 we owned interests in 293 gross (161 net) producing wells, and for the three months ended June 30, 2007, our average net production was approximately 28.0 MMcfe/d. At June 30, 2007, our estimated total proved oil and gas reserves were approximately 256 Bcfe. Our proved reserves are approximately 73% gas and 36% proved developed. Our total proved reserves have a reserve life index of approximately 29 years and our proved producing reserves have a reserve life index of 10 years. Using prices as of June 30, 2007, our proved reserves had an estimated pre-tax net present value, discounted at 10%, or PV-10, of approximately $576 million, of which 40% was proved developed. See "Selected Combined Historical Financial Data—Reconciliation of Non-GAAP Financial Measures" for additional information regarding PV-10. As operator of over 90% of our proved reserves, we have a high degree of control over our capital expenditure budget and other operating matters.
The following table sets forth by operating area a summary of our estimated net proved reserves and estimated average daily net production information as of and for the six months ended June 30, 2007.
| | Estimated Proved Reserves at June 30, 2007 | | Production for the Six Months Ended June 30, 2007 | ||||||||||||||||
|---|---|---|---|---|---|---|---|---|---|---|---|---|---|---|---|---|---|---|---|
| | Developed (Bcfe) | Undeveloped (Bcfe) | Total (Bcfe) | Percent of Total Reserves | PV-10(1) ($Millions) | Identified Drilling Locations(2) | Net Average MMcfe/d | Percent of Total | |||||||||||
| East Texas | 60 | 92 | 152 | 59 | % | $ | 268 | 270 | 14 | 58 | % | ||||||||
| Hugoton (Kansas) | 28 | 71 | 99 | 39 | 295 | 469 | 9 | 38 | |||||||||||
| Other | 3 | 2 | 5 | 2 | 13 | 15 | 1 | 4 | |||||||||||
| Total | 91 | 165 | 256 | 100 | % | $ | 576 | 754 | 24 | 100 | % | ||||||||
- (1)
- Based on June 30, 2007 posted field prices of $6.795 per MMBtu of gas and $67.25 per Bbl of oil, respectively, adjusted for basis and held flat for the life of the reserves and adjusted for quality differentials.
- (2)
- Represents total gross drilling locations identified by management as of June 30, 2007, of which 197 locations are classified as proved. Based on fluctuations in commodity prices, the number of drilling locations will change.
1
Areas of Operation
East Texas
We acquired our initial position in East Texas in June 2002, and as of June 30, 2007, we held 74,000 gross acres (71,000 net acres) in East Texas, primarily in the James Lime play. From June 2002 until June 30, 2007, we have invested $95 million to drill and complete 29 of 30 James Lime wells, a 97% completion rate, and during the first six months of 2007, we produced an average of 14 MMcfe/d from this region. The wells drilled to date have all been completed naturally with open-hole horizontal well bores. We have recently applied a frac stimulation technology to certain wells previously drilled in the area. We are continuing to drill, complete and produce wells utilizing conventional drilling and production techniques, but once a significant reduction in the production level of a well occurs, we will assess the suitability for utilizing stimulation frac technology to increase the production of a well. An average well costs approximately $2.1 million to drill and complete for unstimulated wells and $3.6 million for stimulated wells. We may also drill multilateral wells in the future at an expected cost of $2.6 million to $3.6 million per well subject to the number of laterals drilled. As of June 30, 2007, our producing wells in the James Lime had produced an average of 0.9 gross Bcfe per well and had estimated proved reserves remaining of 1.5 gross Bcfe for a total of 2.4 gross Bcfe per well. At June 30, 2007, we had 74 productive wells in East Texas, of which 66 are in the James Lime play and total proved reserves of approximately 152 Bcfe in East Texas. In the James Lime we have identified 144 future drilling locations and drilled 5 wells during the six months ended June 30, 2007.
In addition to the James Lime play we have started developing the lower Cretaceous Fredericksburg (or Edwards) formation using horizontal drilling. We believe there are additional productive formations under our properties in East Texas.
We plan to drill or stimulate an additional 11 to 13 wells in the James Lime play during the remainder of 2007, depending on our drilling success. All of our drilling in East Texas will be developmental drilling. See "Summary of Capital Expenditures" for our estimated capital expenditures in East Texas.
In East Texas, we own and operate approximately 100 miles of four-to-eight-inch gas gathering lines and gas pipelines and operate nine compressor stations with 10,395 total compression horsepower, which gather, process and transport our gas and third party gas in our East Texas operations area, which we refer to as English Bay Pipeline. Our ownership of this pipeline system provides us with the benefit of controlling compression location and timing of connection to newly completed wells. Our system interconnects to the Texas Eastern, Centerpoint and Gulf South pipelines. In February 2007, we acquired a 100% interest in the Shelby Pipeline in Shelby County, Texas for $6.5 million. The Shelby Pipeline transports gas from the southern portion of the Huxley Field for us and other independent producers. The addition of this approximate 20-mile pipeline increased the English Bay Pipeline to approximately 100 miles. During the six months ended June 30, 2007 we transported an average of approximately 29 MMcf/d of gas. Our pipeline activities from transporting third-party production provided us with revenues of approximately $4.5 million for the full year 2006 and $4.5 million for the six months ended June 30, 2007.
Hugoton Field (Kansas)
We initially acquired our acreage position in the Hugoton field through our 2005 acquisition of Presco Western LLC, which is a party to a farmout agreement that covers approximately 651,000 gross (631,000 net) acres in the Hugoton field. The farmout grants us mineral rights in reservoirs below the Heebner Shale (located at a depth of approximately 4,000 feet), which we refer to as the Hugoton Deep. We acquired, in a series of transactions that were completed by July 2007, the mineral rights to that farmout acreage and acquired additional acreage and producing wells in the Hugoton Deep for $27.5 million. As a result of this acquisition and additional leasing activities, we increased our acreage
2
in the Hugoton Deep from an approximate 651,000 acres (631,000 net) to 793,000 acres (736,000 net) and increased the net revenue interest in virtually all of the Hugoton Deep acreage from 80% to 87.5%.
Since our entry to the Hugoton Deep, we have invested $42.4 million to complete 54 of 63 wells, an 86% completion rate. At June 30, 2007 we had 180 productive wells and total proved reserves of approximately 98 Bcfe, of which 28 Bcfe were proved developed producing and approximately 64% oil. During the first six months of 2007, we produced an average of 8.5 MMcfe/d, up from the 2.0 MMcfe/d at the time of acquisition. For the six months ended June 30, 2007, we completed 17 of 19 wells drilled. We have identified three waterfloods, 469 drilling locations and anticipate drilling 37 wells during the remainder of 2007, including 20 injection and production wells in the Southwest Lemon Victory waterflood project, a secondary recovery project in the field. We expect water injection to commence in August 2007.
Summary of Capital Expenditures
The following table summarizes information regarding our historical 2006 and our estimated 2007 and 2008 capital expenditures. The estimated 2007 and 2008 capital expenditures shown are preliminary full year estimates, including approximately $34.0 million spent from January 1, 2007 through June 30, 2007. The estimated capital expenditures are subject to change depending upon a number of factors, including availability of capital, drilling results, oil and gas prices, costs of drilling and completion and availability of drilling rigs, equipment and labor.
| | | Estimated | ||||||||
|---|---|---|---|---|---|---|---|---|---|---|
| | Historical | Year Ending December 31, | ||||||||
| | Year Ended December 31, 2006 | |||||||||
| | 2007 | 2008 | ||||||||
| | (In thousands) | |||||||||
| Capital expenditures: | ||||||||||
| East Texas | $ | 22,400 | $ | 45,000 | $ | 48,000 | ||||
| Hugoton | 31,200 | 46,000 | 48,000 | |||||||
| Other | 1,400 | 5,000 | 9,000 | |||||||
| Geological and geophysical | 2,400 | 4,000 | 4,000 | |||||||
| Growth capital expenditures(1) | — | — | 30,000 | |||||||
| Total capital expenditures | $ | 57,400 | $ | 100,000 | $ | 139,000 | ||||
- (1)
- Growth capital expenditures are for the acceleration of drilling and secondary recovery in addition to capital expenditures contemplated in the reserve report. We do not budget for possible acquisitions.
Strategy
Our strategy is to increase stockholder value by profitably increasing our reserves, production, cash flow and earnings using a balanced program of (1) developing existing properties, (2) exploiting and exploring undeveloped properties, (3) completing strategic acquisitions and (4) maintaining financial flexibility. The following are key elements of our strategy:
- •
- Maintain Technological Expertise. We intend to utilize and expand the technological expertise that has enabled us to achieve a drilling completion rate of 90% since our inception and helped us improve and maximize field recoveries.
- •
- Accelerate the Development of our Existing Properties. We intend to further develop the significant remaining upside potential of our properties.
3
- •
- As discussed, we will sometimes use multi-stage frac technology or multilateral drilling to enhance production from the James Lime wells in East Texas.
- •
- In the Hugoton field we are completing studies of two secondary recovery projects that will use traditional waterflood techniques. The Southwest Lemon Victory waterflood project has shown increased production in response to waterflood projects operated by others on contiguous properties. We expect to commence initial operations on the Southwest Lemon Victory waterflood project during the third quarter of 2007.
- •
- In the Hugoton field, we drill to the lowest known hydrocarbon producing formation in our area, then attempt completion in zones that have shown the presence of hydrocarbons during drilling. Geological evaluation through traditional logging methods and this pragmatic test has led to regular finding hydrocarbons. We have found at least two economic production zones in each completed well using this method.
- •
- Acquisition Growth. We continually review opportunities to acquire producing properties, undeveloped acreage and drilling prospects, particularly on opportunities where we believe our reservoir management and operational expertise will enhance the value and performance of acquired properties. Initial acquisition targets are expected to be in and around our major producing and activity areas.
- •
- Endeavor to be a Low Cost Producer. We will strive to minimize our operating costs by concentrating our assets within geographic areas where we can consolidate operating control and capture operating efficiencies.
- •
- Maintain Financial Flexibility. Upon the completion of our initial public offering, we expect to have approximately $39 million in cash, no bank debt and at least $110 million available for borrowings under our revolving line of credit, providing us with significant financial flexibility to pursue our business strategy.
Competitive Strengths
We believe our historical success is, and future performance will be, directly related to the following combination of strengths which enable us to implement our strategy:
- •
- Experienced Management Team. The members of our executive management team have an average of over 23 years of experience in the oil and gas industry and significant experience in managing public and private oil and gas companies.
- •
- High Quality, Operated Asset Base. We own a high quality asset base comprised of long-lived reserves along with shorter-lived, higher return reserves. We operate over 90% of our estimated proved reserves.
- •
- Large Acreage Positions. We are a significant acreage holder in each of our two primary operating areas. In East Texas we control over 74,000 gross (71,000 net) acres and in the Hugoton field our BP Amoco farmout covers 793,000 gross (736,000 net) acres.
- •
- Significant Hugoton Reserve Potential. We believe the deeper zones of the Hugoton field have not been fully explored or developed. Accordingly, we believe that significant amounts of gas and oil remain to be recovered in the current higher price environment using modern exploration and production technologies.
- •
- Drilling Inventory. We have identified 754 drillable, low to moderate risk locations providing us with multiple years of drilling inventory. Of these locations, 197 are classified as proved undeveloped.
4
- •
- Proven Technical Team. Our technical staff includes 16 geologists, geophysicists, reservoir engineers and technicians with an average of over 16 years of relevant technical experience. Our staff has a proven record of analyzing complex structural and stratigraphic plays using 3-D seismic, geological and geophysical expertise, producing and optimizing oil and gas reservoirs, and drilling, completing and fracing tight gas reservoirs.
- •
- Developmental Drilling Success. The competencies of our proven technical team focused in our large and productive acreage holdings have helped us to achieve a developmental drilling success rate of 90% since our inception in 2002. Our technical expertise has also allowed us to improve the production rates and ultimate hydrocarbon recoveries on our wells as compared to those wells drilled by others in similar reservoirs in our primary operating areas. We do not expect to drill any exploratory wells during the next 18 months.
- •
- Low Finding and Development Costs. Since our inception, we have invested approximately $149.3 million to drill and complete 90 wells in our East Texas and Hugoton operating areas. Our average acquisition, finding and development costs from inception to June 30, 2007 was $1.58 per Mcfe. For a discussion of how we calculate our finding and development costs, see "Business—Historical Finding and Development Costs."
- •
- Control of Low-Pressure Gas Gathering Infrastructure. We own and operate approximately 100 miles of gas gathering lines and gas pipelines that collect and transport our production and third-party production in our East Texas operations area. We intend to
acquire or construct additional gas gathering assets as necessary to fully develop our East Texas opportunities.
- •
- Gas Marketing Flexibility. Production from both East Texas and the Hugoton field has access to multiple delivery points to several regional and interstate pipelines that provide more than sufficient take away capacity to sell our production.
Our Challenges in Capitalizing on Our Strengths and Implementing Our Strategies
Our ability to successfully leverage our competitive strengths and execute our strategy depends upon many factors and is subject to a variety of risks. For example, our ability to accelerate drilling on our properties and fund the remainder of our 2007 capital budget and, in particular, our estimated growth capital expenditures depend, to a large extent, upon our ability to generate cash flow from operations at or above current levels, maintain borrowing capacity at or near current levels under our revolving credit facility, and the availability of future debt and equity financing at attractive prices. Our ability to fund property acquisitions and compete for and retain the qualified personnel necessary to conduct our business is also dependent upon our financial resources. Changes in oil and gas prices, which may affect both our cash flows and the value of our reserves, our ability to replace production through drilling activities, a material adverse change in our oil and gas reserves due to factors other than oil and gas pricing changes, drilling costs and other factors, may adversely affect our ability to fund our anticipated capital expenditures, pursue property acquisitions, and compete for qualified personnel, among other things. You are urged to the read the section entitled "Risk Factors" for more information regarding these and other risks that may affect our business and our common stock.
Corporate Information
Ellora Energy Inc. was formed in June 2002 and secured an equity investment from Yorktown Energy Partners V, L.P. to fund our first East Texas acquisition that same year.
In July 2006, we completed a private equity offering of 12,400,000 shares of our common stock, consisting of 2,500,000 shares issued by us and 9,900,000 shares sold by certain of our existing stockholders. We received aggregate consideration (before offering expenses of approximately $1,400,000 but after the initial purchaser's discount) of approximately $27.9 million, or $11.16 per
5
share. We did not receive any proceeds from the shares sold by the selling stockholders. However, we did receive approximately $6.4 million from certain of the selling stockholders who are employees of our company for the repayment of loans that were made to them in connection with previous purchases of our common stock. We used the net proceeds from the offering, together with the proceeds from the repayment of the selling stockholders' loans, principally to pay down the entire outstanding balance on our credit facility.
Prior to the private equity offering in July 2006 we operated as two separate entities, Ellora Energy Inc. and Ellora Oil & Gas Inc., with one management team and substantially similar ownership. Ellora Oil and Gas Inc. was formed in April 2005 to acquire Presco Western, LLC and Ellora Energy Inc.'s assets in Colorado and interests in a joint venture with Centurion Exploration Company. These entities were merged prior to the closing of the private equity offering, with Ellora Energy Inc. as the surviving entity. The exchange factor was determined by the management and approved by the Board of Directors of Ellora Oil and Gas Inc. and Ellora Energy Inc. based upon an analysis of management's estimates of the relative equity value of each of Ellora Oil and Gas Inc. and Ellora Energy Inc. These estimates of equity value were based on an analysis of estimated cash flow and net asset value for both Ellora Energy Inc. and Ellora Oil and Gas Inc. relative to comparable public companies' cash flow, net asset valuations and equity valuations. Ellora Oil & Gas Inc. stockholders received 2.49 shares of Ellora Energy Inc. for each share of Ellora Oil & Gas Inc. Following the merger, we effected an 8.09216-to-1 stock split of our common stock.
Presentations in this prospectus that reflect shares, shares outstanding, or weighted average shares of our common stock or options exercisable for shares of our common stock are reflected on a post-merger and post-split basis.
Ellora Energy Inc., a Delaware corporation, was incorporated in June 2002. Our principal executive offices are located at 5665 Flatiron Parkway, Boulder, Colorado 80301. Our telephone number is (303) 444-8881. Our corporate website address iswww.elloraenergy.com. Information on our website or any other website is not incorporated by reference into this prospectus and does not constitute a part of this prospectus.
6
THE OFFERING
| Common stock offered by the selling stockholders | 11,623,261 shares. | |
Common stock to be outstanding after this offering(1) | 52,855,999 shares. | |
Use of proceeds | We will not receive any proceeds from the sale of the shares of common stock offered in this prospectus. | |
Dividend policy | We do not anticipate that we will pay cash dividends in the foreseeable future. Our existing credit facility restricts our ability to pay cash dividends. | |
Risk factors | For a discussion of factors you should consider in making an investment, see "Risk Factors." | |
Proposed Nasdaq Global Market symbol | "LORA" |
- (1)
- Assumes the issuance of 8,000,000 shares of our common stock in our initial public offering. Excludes options to purchase 2,556,376 shares of our common stock outstanding as of June 30, 2007, of which 2,008,602 were exercisable within 60 days.
7
SUMMARY COMBINED HISTORICAL FINANCIAL DATA
The following table shows the combined historical financial data as of and for each of the three years ended December 31, 2004, 2005 and 2006, and the unaudited combined historical financial data as of and for each of the six-month periods ended June 30, 2006 and 2007 for Ellora Energy Inc. and Ellora Oil & Gas Inc. as if they had been one entity throughout the periods presented. These entities were merged in July 2006. You should read the following summary combined historical financial information together with the combined financial statements and related notes included elsewhere in this prospectus. The historical combined financial data as of December 31, 2005 and 2006 and for the three fiscal years ended December 31, 2004, 2005 and 2006 were derived from the combined audited financial statements included in this prospectus. The data for the six-month periods ended June 30, 2006 and 2007 were derived from the unaudited combined interim financial statements also included in this prospectus. The summary combined historical results are not necessarily indicative of results to be expected in future periods.
| | Year Ended December 31, | Six Months Ended June 30, | |||||||||||||||
|---|---|---|---|---|---|---|---|---|---|---|---|---|---|---|---|---|---|
| | 2004 | 2005 | 2006 | 2006 | 2007 | ||||||||||||
| | | | | (Unaudited) | |||||||||||||
| | (In thousands, except per share data) | ||||||||||||||||
| Operating Results Data | |||||||||||||||||
| Revenue | |||||||||||||||||
| Oil and gas sales | $ | 22,780 | $ | 47,595 | $ | 52,050 | $ | 26,824 | $ | 31,339 | |||||||
| Gas aggregation, pipeline sales and other | 1,491 | 5,487 | 10,638 | 4,874 | 4,551 | ||||||||||||
| Total revenue | 24,271 | 53,082 | 62,688 | 31,698 | 35,890 | ||||||||||||
| Costs and expenses | |||||||||||||||||
| Lease operating expense | 4,539 | 6,141 | 10,091 | 5,770 | 5,685 | ||||||||||||
| Production taxes | 1,291 | 1,813 | 1,973 | 602 | 1,148 | ||||||||||||
| Gas aggregation and pipeline cost of sales | 1,316 | 4,020 | 5,247 | 2,111 | 4,483 | ||||||||||||
| Depreciation, depletion and amortization | 3,479 | 8,189 | 11,770 | 4,543 | 8,604 | ||||||||||||
| Exploration | — | 422 | 3,441 | 284 | 2,019 | ||||||||||||
| General and administrative | 3,407 | 11,766 | 11,889 | 4,284 | 7,349 | ||||||||||||
| Interest | 355 | 716 | 1,642 | 1,032 | 1,776 | ||||||||||||
| Total costs and expenses | 14,387 | 33,067 | 46,053 | 18,626 | 31,064 | ||||||||||||
| Income before provision for income taxes | 9,884 | 20,015 | 16,635 | 13,072 | 4,826 | ||||||||||||
| Provision for deferred income taxes | 3,850 | 9,234 | 6,424 | 5,241 | 1,858 | ||||||||||||
| Net income | $ | 6,034 | $ | 10,781 | $ | 10,211 | $ | 7,831 | $ | 2,968 | |||||||
| Net income per common share: | |||||||||||||||||
| Basic | $ | 0.22 | $ | 0.28 | $ | 0.23 | $ | 0.19 | $ | 0.07 | |||||||
| Diluted | $ | 0.22 | $ | 0.27 | $ | 0.23 | $ | 0.18 | $ | 0.06 | |||||||
| Weighted average number of shares of common stock – basic | 27,541,033 | 38,753,063 | 43,485,783 | 42,310,871 | 44,837,712 | ||||||||||||
| Weighted average number of shares of common stock – diluted | 27,945,641 | 40,209,654 | 45,339,821 | 44,055,137 | 46,660,930 | ||||||||||||
8
| | As of December 31, | | ||||||||||
|---|---|---|---|---|---|---|---|---|---|---|---|---|
| | As of June 30, 2007 | |||||||||||
| | 2004 | 2005 | 2006 | |||||||||
| | | | | (Unaudited) | ||||||||
| | (In thousands) | |||||||||||
| Balance Sheet Data | ||||||||||||
| Property and equipment, net, successful efforts method | $ | 70,811 | $ | 170,094 | $ | 216,239 | $ | 275,536 | ||||
| Total assets | 80,206 | 192,300 | 231,913 | 295,098 | ||||||||
| Long-term debt | 10,683 | 25,750 | 16,000 | 71,000 | ||||||||
| Stockholders' equity | 51,757 | 131,669 | 176,166 | 179,662 | ||||||||
| Working capital (deficiency) | (1,581 | ) | 3,648 | (920 | ) | 1,215 | ||||||
Year Ended December 31, | Six Months Ended June 30, | ||||||||||||||||
|---|---|---|---|---|---|---|---|---|---|---|---|---|---|---|---|---|---|
| | 2004 | 2005 | 2006 | 2006 | 2007 | ||||||||||||
| | | | | (Unaudited) | |||||||||||||
| | (In thousands) | ||||||||||||||||
| Other Financial Data | |||||||||||||||||
| Net cash provided (used) by: | |||||||||||||||||
| Operating activities | $ | 16,313 | $ | 30,166 | $ | 29,158 | $ | 20,238 | $ | 10,141 | |||||||
| Investing activities | (27,491 | ) | (106,355 | ) | (50,209 | ) | (23,394 | ) | (63,482 | ) | |||||||
| Financing activities | 12,350 | 76,602 | 22,219 | 4,206 | 54,619 | ||||||||||||
| EBITDA(1) | $ | 13,718 | $ | 33,777 | $ | 31,427 | $ | 19,348 | $ | 15,850 | |||||||
- (1)
- See "Selected Combined Historical Financial Data—Reconciliation of Non-GAAP Financial Measures" for a reconciliation of our net income to EBITDA.
9
Operating Data
The following table presents certain information with respect to our historical operating data for the years ended December 31, 2004, 2005 and 2006 and for the six months ended June 30, 2007:
| | Year Ended December 31, | | |||||||||||
|---|---|---|---|---|---|---|---|---|---|---|---|---|---|
| | Six Months Ended June 30, 2007 | ||||||||||||
| | 2004 | 2005 | 2006 | ||||||||||
| Gross wells | |||||||||||||
| Drilled | 14 | 23 | 39 | 24 | |||||||||
| Completed | 14 | 20 | 34 | 22 | |||||||||
| Net wells | |||||||||||||
| Drilled | 9.7 | 21.6 | 32.1 | 20.2 | |||||||||
| Completed | 9.7 | 18.6 | 28.0 | 18.4 | |||||||||
| Net production data | |||||||||||||
| Net volume (MMcfe) | 3,849 | 6,098 | 7,703 | 4,372 | |||||||||
| Average daily volume (MMcfe/d) | 10.5 | 16.7 | 21.1 | 24.1 | |||||||||
| Average sales price (per Mcfe) | |||||||||||||
| Average sales price (without hedge) | $ | 5.91 | $ | 7.81 | $ | 6.76 | $ | 7.17 | |||||
| Average sales price (with hedge) | 5.91 | 7.79 | 7.54 | 7.18 | |||||||||
| Expenses (per Mcfe) | |||||||||||||
| Lease operating | $ | 1.18 | $ | 1.01 | $ | 1.31 | $ | 1.30 | |||||
| Production and ad valorem taxes | 0.34 | 0.30 | 0.26 | 0.26 | |||||||||
| General and administrative | 0.89 | 1.93 | 1.54 | 1.67 | |||||||||
| Depreciation, depletion and amortization | 0.90 | 1.34 | 1.53 | 1.97 | |||||||||
Estimated Reserve Data
The estimates in the table below of our net proved reserves as of June 30, 2007 are based on a reserve report prepared by MHA.
| | As of June 30, 2007 | ||||
|---|---|---|---|---|---|
| Estimated Proved Reserves | |||||
| Gas (Bcf) | 187 | ||||
| Oil (MMBbls) | 11 | ||||
| Total proved reserves (Bcfe)(1) | 256 | ||||
| Total proved developed reserves (Bcfe) | 91 | ||||
PV-10 value (millions)(2) | |||||
| Proved developed reserves | $ | 228 | |||
| Proved undeveloped reserves | 348 | ||||
| Total PV-10 value | $ | 576 | |||
- (1)
- Based on a conversion rate of 6 Mcfe of gas per Bbl of oil/condensate.
- (2)
- Based on June 30, 2007 posted field prices of $6.795 per MMBtu of gas and $67.25 per Bbl of oil, each adjusted for basis and held flat for the life of the reserves and adjusted for quality differentials. See "Selected Combined Historical Financial Data—Reconciliation of Non-GAAP Financial Measures" for a reconciliation of PV-10 to the standardized measure of discounted future net cash flows.
10
You should consider carefully each of the risks described below, together with all of the other information contained in this prospectus, before deciding to invest in our common stock.
Risks Related to Our Business
Oil and gas prices are volatile, and a decline in oil and gas prices would adversely affect our financial results and impede our ability to make capital expenditures necessary to grow.
Our revenues, profitability and cash flow depend substantially upon the prices and demand for oil and gas. The markets for these commodities are volatile, and even relatively modest drops in prices can affect significantly our financial results and impede our growth. Prices for oil and gas fluctuate widely in response to relatively minor changes in the supply and demand for oil and gas, market uncertainty and a variety of additional factors beyond our control, such as:
- •
- domestic and foreign supply of oil and gas;
- •
- price and quantity of foreign imports;
- •
- domestic and foreign governmental regulations;
- •
- political conditions in or affecting other oil producing and gas producing countries, including the current conflicts in the Middle East and conditions in South America and Russia;
- •
- weather conditions, including unseasonably warm winter weather;
- •
- technological advances affecting oil and gas consumption;
- •
- overall U.S. and global economic conditions; and
- •
- price and availability of alternative fuels.
Further, oil prices and gas prices do not necessarily fluctuate in direct relationship to each other. Because approximately 73% of our estimated proved reserves as of June 30, 2007 were gas reserves, our financial results are more sensitive to movements in gas prices. In the past, the price of gas has been extremely volatile, and we expect this volatility to continue. For example, during the year ended December 31, 2006, the NYMEX natural gas spot price ranged from a high of $9.90 per MMBtu to a low of $3.66 per MMBtu. The NYMEX natural gas spot price at December 31, 2006 was $5.50 per MMBtu and on June 29, 2007 it was $6.41 per MMBtu. At August 6, 2007, the NYMEX spot gas price was $6.11 per MMBtu. Our revenues for the six months ended June 30, 2007 were $35.9 million. If, on average, gas prices during that period were $1.00 lower than the actual gas prices, our revenues would have been approximately $3.4 million lower than our actual revenues. The results of higher investment in the exploration for and production of gas and other factors may cause the price of gas to drop. Lower oil and gas prices may not only decrease our revenues but also may reduce the amount of oil and gas that we can produce economically. Lower prices may result in our having to make substantial downward adjustments to our estimated proved reserves. If this occurs or if our estimates of development costs increase, production data factors change or our exploration results deteriorate, accounting rules may require us to write down, as a non-cash charge to earnings, the carrying value of our properties for impairments. We are required to perform impairment tests on our assets whenever events or changes in circumstances lead to a reduction of the estimated useful life or estimated future cash flows that would indicate that the carry amount may not be recoverable or whenever management's plans change with respect to those assets. We may incur impairment charges in the future, which could have a material adverse effect on our results of operations in the period taken.
11
Our future revenues are dependent on the ability to successfully complete drilling activity.
In general, production from oil and gas properties declines as reserves are depleted, with the rate of decline depending on reservoir characteristics. Our total proved reserves will decline as reserves are produced and, therefore, our level of production and cash flows will be affected adversely unless we conduct successful exploration and development activities or acquire properties containing proved reserves. Exploration and development activities involve numerous risks, including the risk that no commercially productive oil or gas reservoirs will be discovered. In addition, the future cost and timing of drilling, completing and producing wells is often uncertain. Furthermore, drilling operations may be curtailed, delayed or canceled as a result of a variety of factors, including:
- •
- lack of acceptable prospective acreage;
- •
- inadequate capital resources;
- •
- unexpected drilling conditions; pressure or irregularities in formations; equipment failures or accidents;
- •
- adverse weather conditions, including hurricanes;
- •
- unavailability or high cost of drilling rigs, equipment or labor;
- •
- reductions in oil and gas prices;
- •
- limitations in the market for oil and gas;
- •
- title problems;
- •
- compliance with governmental regulations; and
- •
- mechanical difficulties.
The use of a frac technology may not be effective in increasing our levels of production or our levels of ultimate recovery.
We are utilizing a frac technology to stimulate the production of our wells and have not achieved additional production over an extensive period of time to determine whether or not the enhanced production achieved by using the frac technology will be sustained or enhance our ultimate recovery of hydrocarbons. In addition, production results will vary from well to well and there is no assurance that we will obtain or maintain increased levels of production that we have experienced to date using this frac technology.
Drilling multilateral wells may not increase levels of production or our levels of ultimate recovery.
We intend to drill multilateral wells in the James Lime formation in Shelby County. We have not previously drilled multilateral wells in this formation. Production results may not be enhanced from using this multilateral technique while costs to drill these wells will increase from single lateral drilling.
The interpretation and analysis of 3-D seismic data does not allow the interpreter to know if hydrocarbons are present or economically producible.
Our decisions to purchase, explore, develop and exploit prospects or properties depend in part on data obtained through geophysical and geological analyses, production data and engineering studies, the results of which are uncertain. Even when used and properly interpreted, 3-D seismic data and visualization techniques only assist geoscientists and geologists in identifying subsurface structures and hydrocarbon indicators. They do not allow the interpreter to know if hydrocarbons are present or producible economically. In addition, the use of 3-D seismic and other advanced technologies require greater predrilling expenditures than traditional drilling strategies.
12
The credit default of one of our customers could have a temporary adverse effect on us.
Our revenues are generated under contracts with a limited number of customers. Results of operations would be adversely affected as a result of non-performance by two of our large customers, which represent 10% or more of our sales, of their contractual obligations. A non-payment default by one of these large customers could have an adverse effect on us, temporarily reducing our cash flow.
Our identified drilling location inventories are scheduled out over several years, making them susceptible to uncertainties that could materially alter the occurrence or timing of their drilling.
Our management team has specifically identified and scheduled drilling locations as an estimation of our future multi-year drilling activities on our acreage. Our drilling locations represent a significant part of our growth strategy. Our ability to drill and develop these locations depends on a number of factors, including the availability of capital, seasonal conditions, regulatory approvals, oil and gas prices, costs and drilling results. Our final determination on whether to drill any of these drilling locations will be dependent upon the factors described elsewhere in this prospectus as well as, to some degree, the results of our drilling activities with respect to our proved drilling locations. Because of these uncertainties, we do not know if the drilling locations we have identified will be drilled within our timeframe or will ever be drilled or if we will be able to produce oil or gas from these or any other potential drilling locations. As such, our actual drilling activities may be materially different from those presently identified, which could adversely affect our business, results of operations or financial condition.
Unless we replace our oil and gas reserves, our reserves and production will decline.
Our future oil and gas production depends on our success in finding or acquiring additional reserves. The decline rate for our proved developed producing wells has averaged over 20% for the first year of production. Our estimated average decline rates for the life of our reserves are 8.5% for our reserves that are proved developed producing and 9.0% for our total proved reserves. If we fail to replace reserves through drilling or acquisitions, our level of production and cash flows will be affected adversely. In general, production from oil and gas properties declines as reserves are depleted, with the rate of decline depending on reservoir characteristics. Our total proved reserves will decline as reserves are produced unless we conduct other successful exploration and development activities or acquire properties containing proved reserves, or both. Our ability to make the necessary capital investment to maintain or expand our asset base of oil and gas reserves would be impaired to the extent cash flow from operations is reduced and external sources of capital become limited or unavailable. We may not be successful in exploring for, developing or acquiring additional reserves.
We face uncertainties in estimating proved oil and gas reserves and inaccuracies in our estimates could result in lower than expected reserve quantities and a lower present value of our proved reserves.
Petroleum engineering is a subjective process of estimating underground accumulations of oil and gas that cannot be measured in an exact manner. Estimates of economically recoverable oil and gas reserves and of future net cash flows necessarily depend upon a number of variable factors and assumptions, including:
- •
- historical production from the area compared with production from other similar producing areas;
- •
- the assumed effects of regulations by governmental agencies;
- •
- assumptions concerning future oil and gas prices; and
- •
- assumptions concerning future operating costs, severance and excise taxes, development costs and workover and remedial costs.
13
Because all reserve estimates are to some degree subjective, each of the following items may differ materially from those assumed in estimating proved reserves:
- •
- the quantities of oil and gas that are ultimately recovered;
- •
- the production and operating costs incurred;
- •
- the amount and timing of future development expenditures; and
- •
- future oil and gas sales prices.
As of June 30, 2007, approximately 64% of our proved reserves were either proved undeveloped or proved non-producing. Estimates of proved undeveloped or proved non-producing reserves are even less reliable than estimates of proved developed producing reserves.
Furthermore, different reserve engineers may make different estimates of reserves and cash flows based on the same available data. Our actual production, revenues and expenditures with respect to reserves will likely be different from estimates and the differences may be material. The discounted future net cash flows included in this prospectus should not be considered as the current market value of the estimated oil and gas reserves attributable to our properties. As required by the SEC, the estimated discounted future net cash flows from proved reserves are generally based on prices and costs as of the date of the estimate, while actual future prices and costs may be materially higher or lower. Actual future net cash flows also will be affected by factors such as:
- •
- the amount and timing of actual production;
- •
- supply and demand for oil and gas;
- •
- increases or decreases in consumption; and
- •
- changes in governmental regulations or taxation.
In addition, the 10% discount factor, which is required by the SEC to be used to calculate discounted future net cash flows for reporting purposes, is not necessarily the most appropriate discount factor based on interest rates in effect from time to time and risks associated with us or the oil and gas industry in general.
You should not assume that the present value of future net revenues from our proved reserves referred to in this prospectus is the current market value of our estimated oil and natural gas reserves. In accordance with SEC requirements, we generally base the estimated discounted future net cash flows from our proved reserves on prices and costs on the date of the estimate. Actual future prices and costs may differ materially from those used in the present value estimate. If gas prices decline by $1.00 per Mcf, then our PV-10 as of June 30, 2007 would decrease from $576 million to $497 million.
Our bank lenders can limit our borrowing capabilities, which may materially impact our operations.
At August 6, 2007 our debt outstanding under our credit facility was approximately $84.0 million and we intend to use a portion of the proceeds from this offering to repay the outstanding balance under our credit facility. Our credit facility subjects us to a number of covenants that impose restrictions on us. Our credit facility also provides for periodic redeterminations of our borrowing base, which may affect our borrowing capacity. Redeterminations are based upon a number of factors, including commodity prices and reserve levels. In addition, our bank lenders have substantial flexibility to reduce our borrowing base due to subjective factors. Upon a redetermination, we could be required to repay a portion of our bank debt to the extent our outstanding borrowings at such time exceeds the redetermined borrowing base. We may not have sufficient funds to make such repayments, which could result in a default under the terms of the loan agreement and an acceleration of the loan.
14
We intend to finance our development, acquisition and exploration activities with cash flow from operations, bank borrowings and other financing activities. In addition, we may significantly alter our capitalization to make future acquisitions or develop our properties. These changes in capitalization may significantly increase our level of debt. If we incur additional debt for these or other purposes, the related risks that we now face could intensify. A higher level of debt also increases the risk that we may default on our debt obligations. Our ability to meet our debt obligations and to reduce our level of debt depends on our future performance which is affected by general economic conditions and financial, business and other factors. Our level of debt affects our operations in several important ways, including the following:
- •
- a portion of our cash flow from operations is used to pay interest on borrowings;
- •
- the covenants contained in the agreements governing our debt limit our ability to borrow additional funds, pay dividends, dispose of assets or issue shares of preferred stock and otherwise may affect our flexibility in planning for, and reacting to, changes in business conditions;
- •
- a high level of debt may impair our ability to obtain additional financing in the future for working capital, capital expenditures, acquisitions, general corporate or other purposes;
- •
- a leveraged financial position would make us more vulnerable to economic downturns and could limit our ability to withstand competitive pressures; and
- •
- any debt that we incur under our revolving credit facility will be at variable rates which makes us vulnerable to increases in interest rates.
We depend on our senior management team and other key personnel. Accordingly, the loss of any of these individuals could adversely affect our business, financial condition and the results of operations and future growth.
Our success is largely dependent on the skills, experience and efforts of our people. The loss of the services of one or more members of our senior management team or of our other employees with critical skills needed to operate our business could have a negative effect on our business, financial conditions and results of operations and future growth. We have not entered into, and do not expect to enter into, employment agreements or non-competition agreements with any of our key employees, other than T. Scott Martin, our President and Chief Executive Officer. See "Management—Employment Agreements and Other Arrangements." Our ability to manage our growth, if any, will require us to continue to train, motivate and manage our employees and to attract, motivate and retain additional qualified personnel. Competition for these types of personnel is intense and we may not be successful in attracting, assimilating and retaining the personnel required to grow and operate our business profitably.
Market conditions or transportation impediments may hinder our access to oil and gas markets or delay our production.
Market conditions, the unavailability of satisfactory oil and gas processing and transportation may hinder our access to oil and gas markets or delay our production. For example, in areas where we do not own the gathering system, such as in the Hugoton, production may be delayed from time to time while we await connection to the gathering system. The availability of a ready market for our oil and gas production depends on a number of factors, including the demand for and supply of oil and gas and the proximity of reserves to pipelines or trucking and terminal facilities. In addition, the amount of oil and gas that can be produced and sold is subject to curtailment in certain circumstances, such as pipeline interruptions due to scheduled and unscheduled maintenance, excessive pressure, physical damage to the gathering or transportation system or lack of contracted capacity on such systems. The
15
curtailments arising from these and similar circumstances may last from a few days to several months, and we are often provided with limited, if any, notice as to when these circumstances will arise and their duration. As a result, we may not be able to sell our oil and gas production, we may have to transport our production by more expensive means, or we may be required to shut in gas wells or delay initial production until the necessary gathering and transportation systems are available. Any significant curtailment in gathering system or pipeline capacity, or significant delay in construction of necessary gathering and transportation facilities, could adversely affect our business, financial condition and results of operations.
We will require additional capital to fund our future activities. If we fail to obtain additional capital, we may not be able to implement fully our business plan, which could lead to a decline in reserves.
We depend on our ability to obtain financing beyond our cash flow from operations. Historically, we have financed our business plan and operations primarily with internally generated cash flow, bank borrowings, and issuances of common stock. Our future contractual commitments from June 30, 2007 through June 30, 2012 total $95.2 million and include debt obligations, operating lease obligations, and a firm drilling rig lease commitment and other obligations, collectively aggregating approximately $9.0 million through June 30, 2008, an additional $14.4 million through June 30, 2010, and an additional $71.9 million through June 30, 2012. We also require capital to fund our capital budget, including acquisitions, which is expected to be approximately $134 million for 2007. In addition, approximately 64% of our total estimated proved reserves were undeveloped as of June 30, 2007. Recovery of such reserves will require significant capital expenditures and successful drilling operations. We will be required to meet our needs from our internally generated cash flow, debt financings, and equity financings.
If our revenues decrease as a result of lower commodity prices, operating difficulties, declines in reserves or for any other reason, we may have limited ability to obtain the capital necessary to sustain our operations at current levels. We may, from time to time, need to seek additional financing. Our revolving credit facility contains covenants restricting our ability to incur additional indebtedness without the consent of the lender. If we incur additional debt, the related risks that we now face could intensify.
Even if additional capital is needed, we may not be able to obtain debt or equity financing on terms favorable to us, or at all. If cash generated by operations or available under our revolving credit facility is not sufficient to meet our capital requirements, the failure to obtain additional financing could result in a curtailment of our operations relating to exploration and development of our projects, which in turn could lead to a possible loss of properties and a decline in our natural gas reserves.
The unavailability or high cost of drilling rigs, equipment, supplies, personnel, and oilfield services could adversely affect our ability to execute our exploration and development plans on a timely basis and within our budget.
Our industry is cyclical, and from time to time there is a shortage of drilling rigs, equipment, supplies or qualified personnel. During these periods, the costs and delivery times of rigs, equipment, and supplies are substantially greater. As a result of historically strong prices of oil and gas, the demand for oilfield and drilling services has risen, and the costs of these services are increasing. For example, average day rates for land-based rigs have increased substantially during the last two years. We are particularly sensitive to higher rig costs and drilling rig availability, as we presently have two rigs under contract, with one rig under contract on a month-to-month basis. If the unavailability or high cost of drilling rigs, equipment, supplies, or qualified personnel were particularly severe in the areas where we operate, we could be materially and adversely affected.
16
We may incur losses as a result of title deficiencies.
We purchase working and revenue interests in the natural gas and oil leasehold interests upon which we will perform our exploration activities from third parties or directly from the mineral fee owners. The existence of a material title deficiency can render a lease worthless and can adversely affect our results of operations and financial condition. Title insurance covering mineral leaseholds is not generally available and, in all instances, we forego the expense of retaining lawyers to examine the title to the mineral interest to be placed under lease or already placed under lease until the drilling block is assembled and ready to be drilled. As is customary in our industry, we rely upon the judgment of natural gas and oil lease brokers, in-house landmen or independent landmen who perform the field work in examining records in the appropriate governmental offices and abstract facilities before attempting to acquire or place under lease a specific mineral interest. We, in some cases, perform curative work to correct deficiencies in the marketability of the title to us. The work might include obtaining affidavits of heirship or causing an estate to be administered. We obtain title opinions for specific drilling locations prior to the commencement of drilling. In cases involving more serious title problems, the amount paid for affected natural gas and oil leases can be generally lost, and the target area can become undrillable.
Competition in the oil and gas industry is intense, and many of our competitors have resources that are greater than ours.
We operate in a highly competitive environment for acquiring prospects and productive properties, marketing oil and gas and securing equipment and trained personnel. As a relatively small oil and gas company, many of our competitors, major and large independent oil and gas companies, possess and employ financial, technical and personnel resources substantially greater than ours. Those companies may be able to develop and acquire more prospects and productive properties than our financial or personnel resources permit. Our ability to acquire additional prospects and discover reserves in the future will depend on our ability to evaluate and select suitable properties and consummate transactions in a highly competitive environment. Also, there is substantial competition for capital available for investment in the oil and gas industry. Larger competitors may be better able to withstand sustained periods of unsuccessful drilling and absorb the burden of changes in laws and regulations more easily than we can, which would adversely affect our competitive position. We may not be able to compete successfully in the future in acquiring prospective reserves, developing reserves, marketing hydrocarbons, attracting and retaining quality personnel and raising additional capital.
Operating hazards, natural disasters or other interruptions of our operations including, with respect to our Texas and Louisiana operations, those from hurricanes, could result in potential liabilities, which may not be fully covered by our insurance.
The oil and gas business involves certain operating hazards such as:
- •
- well blowouts;
- •
- cratering;
- •
- explosions;
- •
- uncontrollable flows of oil, gas or well fluids;
- •
- fires;
- •
- pollution; and
- •
- releases of toxic gas.
17
In addition, our operations in Texas and Louisiana are especially susceptible to damage from natural disasters such as hurricanes and involve increased risks of personal injury, property damage and marketing interruptions. The occurrence of one of these operating hazards may result in injury, loss of life, suspension of operations, environmental damage and remediation and/or governmental investigations and penalties. The payment of any of these liabilities could reduce, or even eliminate, the funds available for exploration, development, and acquisition, or could result in a loss of our properties.
Our insurance policies provide limited coverage for losses or liabilities relating to pollution, with broader coverage for sudden and accidental occurrences. Our insurance might be inadequate to cover our liabilities. Insurance costs are expected to continue to increase over the next few years, and we may decrease coverage and retain more risk to mitigate future cost increases. If we incur substantial liability, and the damages are not covered by insurance or are in excess of policy limits, then our business, results of operations and financial condition may be materially adversely affected.
Environmental liabilities may expose us to significant costs and liabilities.
We could incur significant environmental costs and liabilities in our oil and natural gas operations due to the handling of petroleum hydrocarbons and generated wastes, the occurrence of air emissions and water discharges from work-related activities, and the legacy of pollution from historical industry operations and waste disposal practices. Environmental liabilities may arise in both the exploration and production of oil and gas as well as in connection with our gas gathering operations. Failure to comply with applicable environmental laws and regulations may result in the assessment of administrative, civil and criminal penalties, imposition of remedial obligations, and the issuance of injunctions limiting or preventing some or all of our operations. Moreover, joint and several, strict liability may be incurred under these environmental laws and regulations in connection with spills, leaks or releases of petroleum hydrocarbons and wastes on, under or from our properties and facilities, many of which have been used for exploration, production or development activities for many years, oftentimes by third parties not under our control. Private parties, including the owners of properties upon which we conduct drilling and production activities as well as facilities where our petroleum hydrocarbons or wastes are taken for reclamation or disposal, may also have the right to pursue legal actions to enforce compliance as well as to seek damages for non-compliance with environmental laws and regulations or for personal injury or property damage. In addition, changes in environmental laws and regulations occur frequently, and any such changes that result in more stringent and costly waste handling, storage, transport, disposal, or remediation requirements could have a material adverse effect on our operations or financial position. We may not be able to recover some or any of these costs from insurance. See "Business—Environmental Regulation."
Our growth strategy could fail or present unanticipated problems for our business in the future, which could adversely affect our ability to make acquisitions or realize anticipated benefits of those acquisitions.
Our growth strategy may include acquiring oil and gas businesses and properties. We may not be able to identify suitable acquisition opportunities or finance and complete any particular acquisition successfully.
Furthermore, acquisitions involve a number of risks and challenges, including:
- •
- diversion of management's attention;
- •
- the need to integrate acquired operations;
- •
- potential loss of key employees of the acquired companies;
- •
- potential lack of operating experience in a geographic market of the acquired business; and
- •
- an increase in our expenses and working capital requirements.
18
Any of these factors could adversely affect our ability to achieve anticipated levels of cash flows from the acquired businesses or realize other anticipated benefits of those acquisitions.
Risks Related to this Offering and Our Common Stock
We are controlled by principal stockholders whose interests may differ from your interests and who will be able to exert significant influence over corporate decisions.
Yorktown Energy Partners V, L.P. and Yorktown Energy Partners VI, L.P., or collectively, Yorktown, own approximately 61.2% of our outstanding common stock. After giving effect to our initial public offering, Yorktown will continue to beneficially own approximately 52.0% of our outstanding common stock ( % if the over-allotment option is exercised in full). In addition, two Yorktown representatives serve on our board of directors, and our directors, officers and their affiliates will beneficially own or control approximately 61.0% of our common stock outstanding ( % if the over-allotment option is exercised in full). See "Security Ownership of Certain Beneficial Owners and Management." As a result of this ownership, Yorktown will have the ability to nominate all our directors and will have the ability to control the vote in any election of directors. Yorktown will also have control over our decisions to enter into significant corporate transactions and, in its capacity as our majority stockholder, will have the ability to prevent any transactions that it does not believe are in Yorktown's best interest. As a result, Yorktown will be able to control, directly or indirectly and subject to applicable law, all matters affecting us, including the following:
- •
- any determination with respect to our business direction and policies, including the appointment and removal of officers;
- •
- any determinations with respect to mergers, business combinations or dispositions of assets;
- •
- our capital structure;
- •
- compensation, option programs and other human resources policy decisions;
- •
- changes to other agreements that may adversely affect us; and
- •
- the payment of dividends on our common stock.
Yorktown may also have an interest in pursuing transactions that, in their judgment, enhance the value of their respective equity investments in our company, even though those transactions may involve risks to you as a minority stockholder. In addition, circumstances could arise under which their interests could be in conflict with the interests of our other stockholders or you, a minority stockholder. Also, Yorktown and its affiliates have and may in the future make significant investments in other companies, some of which may be competitors. Yorktown and its affiliates are not obligated to advise us of any investment or business opportunities of which they are aware, and they are not restricted or prohibited from competing with us.
There has been no public market for our common stock, and our stock price may fluctuate significantly.
There is currently no public market for our common stock, and an active trading market may not develop or be sustained after the sale of all of the shares covered by this prospectus. The market price of our common stock could fluctuate significantly as a result of:
- •
- our operating and financial performance and prospects;
- •
- quarterly variations in the rate of growth of our financial indicators, such as net income per share, net income and revenues;
- •
- changes in revenue or earnings estimates or publication of research reports by analysts about us or the exploration and production industry;
19
- •
- liquidity and registering our common stock for public resale;
- •
- actual or unanticipated variations in our reserve estimates and quarterly operating results;
- •
- changes in oil and gas prices;
- •
- speculation in the press or investment community;
- •
- sales of our common stock by our stockholders;
- •
- increases in our cost of capital;
- •
- changes in applicable laws or regulations, court rulings and enforcement and legal actions;
- •
- changes in market valuations of similar companies;
- •
- adverse market reaction to any increased indebtedness we incur in the future;
- •
- additions or departures of key management personnel;
- •
- actions by our stockholders;
- •
- general market and economic conditions, including the occurrence of events or trends affecting the price of natural gas; and
- •
- domestic and international economic, legal, and regulatory factors unrelated to our performance.
If a trading market develops for our common stock, stock markets in general experience volatility that often is unrelated to the operating performance of particular companies. These broad market fluctuations may adversely affect the trading price of our common stock.
The market price of our common stock could be adversely affected by sales of substantial amounts of our common stock in the public markets.
We have recently filed a registration statement to register 8,000,000 shares of our common stock in an underwritten initial public offering. The sale of the shares of common stock in this public offering or the issuance of a large number of shares of our common stock in connection with future acquisitions, equity financings or otherwise, could cause the market price of our common stock to decline significantly. After the completion of our initial public offering, we will have approximately 52.9 million shares of common stock issued and outstanding, including approximately 31.5 million shares of our common stock held or controlled by our executive officers and directors which are or will be eligible for sale under Rule 144 after the expiration of the 180-day lock-up period that is applicable to our executive officers, directors, and certain of our stockholders following the completion of our initial public offering. All of the 8,000,000 shares of the common stock sold in our initial public offering will be freely tradable without restriction or further registration under the Securities Act by persons other than our "affiliates"(within the meaning of Rule 144 under the Securities Act) immediately upon completion of our initial public offering. Additionally, we may file one or more registration statements with the Securities and Exchange Commission providing for the registration of up to approximately 3.6 million additional shares of our common stock issued or reserved for issuance under our employee plans, all of which will be eligible for sale without further registration under the Securities Act.
We do not anticipate paying any dividends on our common stock in the foreseeable future.
We do not expect to declare or pay any cash or other dividends in the foreseeable future on our common stock, as we intend to use cash flow generated by operations to expand our business. Our credit facility will restrict our ability to pay cash dividends on our common stock, and we may also enter into credit agreements or other borrowing arrangements in the future that restrict our ability to declare or pay cash dividends on our common stock.
20
You may experience dilution of your ownership interests due to the future issuance of additional shares of our common stock.
We may in the future issue our previously authorized and unissued securities, resulting in the dilution of the ownership interests of our present stockholders and purchasers of common stock offered hereby. We are currently authorized to issue 125,000,000 shares of common stock and 10,000,000 shares of preferred stock with preferences and rights as determined by our board of directors. The potential issuance of such additional shares of common stock may create downward pressure on the trading price of our common stock. We may also issue additional shares of our common stock or other securities that are convertible into or exercisable for common stock in connection with the hiring of personnel, future acquisitions, future public offerings or private placements of our securities for capital raising purposes, or for other business purposes.
Provisions under Delaware law, our certificate of incorporation and bylaws could delay or prevent a change in control of our company, which could adversely affect the price of our common stock.
The existence of some provisions under Delaware law, our certificate of incorporation and bylaws could delay or prevent a change in control of our company, which could adversely affect the price of our common stock. For example, our certificate of incorporation and bylaws provide that no stockholder shall have the right to call a special meeting of the stockholders. In addition, Delaware law imposes restrictions on mergers and other business combinations between us and any holder of 15% or more of our outstanding common stock.
We will incur increased costs as a result of being a public company.
As a public company, we will incur significant legal, accounting and other expenses that we did not incur as a private company. The U.S. Sarbanes-Oxley Act of 2002 and related rules of the U.S. Securities and Exchange Commission, or SEC, and the Nasdaq Global Market regulate corporate governance practices of public companies. We expect that compliance with these public company requirements will increase our costs and make some activities more time consuming. For example, we have created new board committees, and we will adopt new internal controls and disclosure controls and procedures. In addition, we will incur additional expenses associated with our SEC reporting requirements. A number of those requirements will require us to carry out activities we have not conducted previously. For example, under Section 404 of the Sarbanes-Oxley Act, for our annual report on Form 10-K for 2008, we will need to document and test our internal control procedures, our management will need to assess and report on our internal control over financial reporting and our independent accountants will need to issue an opinion on that assessment and the effectiveness of those controls. Furthermore, if we identify any issues in complying with those requirements (for example, if we or our independent auditors identified a material weakness or significant deficiency in our internal control over financial reporting), we could incur additional costs rectifying those issues, and the existence of those issues could adversely affect us, our reputation or investor perceptions of us. We also expect that it could be difficult and will be significantly more expensive to obtain directors' and officers' liability insurance, and we may be required to accept reduced policy limits and coverage or incur substantially higher costs to obtain the same or similar coverage. As a result, it may be more difficult for us to attract and retain qualified persons to serve on our board of directors or as executive officers. Advocacy efforts by stockholders and third parties may also prompt even more changes in governance and reporting requirements. We cannot predict or estimate the amount of additional costs we may incur or the timing of such costs.
21
CAUTIONARY STATEMENT REGARDING FORWARD-LOOKING STATEMENTS
Various statements in this prospectus, including those that express a belief, expectation, or intention, as well as those that are not statements of historical fact, are forward-looking statements. The forward-looking statements may include projections and estimates concerning the timing and success of specific projects and our future reserves, production, revenues, income, and capital spending. When we use the words "believe," "intend," "expect," "may," "should," "anticipate," "could," "estimate," "plan," "predict," "project," or their negatives, other similar expressions, or the statements that include those words are usually forward-looking statements.
The forward-looking statements contained in this prospectus are largely based on our expectations, which reflect estimates and assumptions made by our management. These estimates and assumptions reflect our best judgment based on currently known market conditions and other factors. Although we believe such estimates and assumptions to be reasonable, they are inherently uncertain and involve a number of risks and uncertainties that are beyond our control. In addition, management's assumptions about future events may prove to be inaccurate. Management cautions all readers that the forward-looking statements contained in this prospectus are not guarantees of future performance, and we cannot assure any reader that such statements will be realized or the forward-looking events and circumstances will occur. Actual results may differ materially from those anticipated or implied in the forward-looking statements due to the factors listed in the "Risk Factors" section and elsewhere in this prospectus. All forward-looking statements speak only as of the date of this prospectus. We do not intend to publicly update or revise any forward-looking statements as a result of new information, future events or otherwise. These cautionary statements qualify all forward-looking statements attributable to us, or persons acting on our behalf. The risks, contingencies and uncertainties relate to, among other matters, the following:
- •
- our business strategy;
- •
- our financial position;
- •
- our cash flow and liquidity;
- •
- declines in the prices we receive for our oil and gas affecting our operating results and cash flows;
- •
- economic slowdowns that can adversely affect consumption of oil and gas by businesses and consumers;
- •
- uncertainties in estimating our oil and gas reserves;
- •
- replacing our oil and gas reserves;
- •
- uncertainties in exploring for and producing oil and gas;
- •
- our inability to obtain additional financing necessary in order to fund our operations, capital expenditures, and to meet our other obligations;
- •
- availability of drilling and production equipment and field service providers;
- •
- disruptions capacity constraints in, or other limitations on the pipeline systems which deliver our gas and other processing and transportation considerations;
- •
- competition in the oil and gas industry;
- •
- our inability to retain and attract key personnel;
- •
- the effects of government regulation and permitting and other legal requirements;
- •
- costs associated with perfecting title for mineral rights in some of our properties; and
- •
- other factors discussed under "Risk Factors."
22
We will not receive any of the proceeds from the sale of the shares of common stock offered by the selling stockholders under this prospectus. Any proceeds from the sale of the shares pursuant to this prospectus will be received by the selling stockholders.
We do not expect to declare or pay any cash or other dividends in the foreseeable future on our common stock, as we intend to reinvest cash flow generated by operations in our business. Our credit facility currently limits our ability to pay cash dividends on our common stock, and we may also enter into credit agreements or other borrowing arrangements in the future that prohibit or restrict our ability to declare or pay cash dividends on our common stock.
23
The following table sets forth our cash and capitalization as of June 30, 2007 on an actual historical basis and on an as adjusted basis after giving effect to, on an as adjusted basis, the issuance and sale by us of 8,000,000 shares of common stock in our initial public offering and the application of the net proceeds therefrom.
You should refer to "Summary Combined Historical Financial Data," "Management's Discussion and Analysis of Financial Condition and Results of Operations" and the annual and unaudited interim combined financial statements included elsewhere in this prospectus in evaluating the material presented below.
| | As of June 30, 2007 | ||||||||
|---|---|---|---|---|---|---|---|---|---|
| | Actual | As Adjusted | |||||||
| | (In thousands) | ||||||||
| Cash | $ | 5,607 | $ | 51,647 | |||||
| Long-term debt(1) | $ | 71,000 | $ | — | |||||
| Stockholders' equity: | |||||||||
| Common stock | $ | 45 | $ | 53 | |||||
| Additional paid-in capital | 145,672 | 262,704 | |||||||
| Retained earnings | 33,997 | 33,997 | |||||||
| Accumulated other comprehensive income | (52 | ) | (52 | ) | |||||
| Total stockholders' equity | $ | 179,662 | $ | 296,702 | |||||
| Total capitalization | $ | 250,662 | $ | 296,702 | |||||
- (1)
- As of August 6, 2007, we had an outstanding balance under our credit facility of approximately $84.0 million.
24
SELECTED COMBINED HISTORICAL FINANCIAL DATA
The following table shows the selected combined historical financial data as of and for each of the five years ended December 31, 2002, 2003, 2004, 2005 and 2006 and the unaudited selected combined historical financial data as of and for each of the six-month periods ended June 30, 2006 and 2007 for Ellora Energy Inc. You should read the following summary combined historical financial information together with the combined financial statements and related notes included elsewhere in this prospectus. The selected historical consolidated financial and operating data for the three years ended December 31, 2004, 2005 and 2006 are derived from our audited financial statements included herein. The selected historical consolidated financial and operating data for the year ended December 31, 2002 was derived from our financial statements not included herein. The data for the six-month periods ended June 30, 2006 and 2007 were derived from the unaudited combined interim financial statements also included in this prospectus. The summary combined historical results are not necessarily indicative of results to be expected in future periods.
| | Period from Inception April 1, 2002 to December 31, 2002 | | | | | Six Months Ended June 30, | |||||||||||||||||
|---|---|---|---|---|---|---|---|---|---|---|---|---|---|---|---|---|---|---|---|---|---|---|---|
| | Year Ended December 31, | ||||||||||||||||||||||
| | 2003 | 2004 | 2005 | 2006 | 2006 | 2007 | |||||||||||||||||
| | | | | | | (Unaudited) | |||||||||||||||||
| | (In thousands, except per share data) | ||||||||||||||||||||||
| Operating Results Data | |||||||||||||||||||||||
| Revenue: | |||||||||||||||||||||||
| Oil and gas sales | $ | 5,167 | $ | 11,810 | $ | 22,780 | $ | 47,595 | $ | 52,050 | $ | 26,824 | $ | 31,339 | |||||||||
| Gas aggregation, pipeline sales and other | 431 | 365 | 1,491 | 5,487 | 10,638 | 4,874 | 4,551 | ||||||||||||||||
| Total revenue | 5,598 | 12,175 | 24,271 | 53,082 | 62,688 | 31,698 | 35,890 | ||||||||||||||||
| Costs and expenses: | |||||||||||||||||||||||
| Lease operating expense | 1,260 | 2,580 | 4,539 | 6,141 | 10,091 | 5,770 | 5,685 | ||||||||||||||||
| Production taxes | 358 | 473 | 1,291 | 1,813 | 1,973 | 602 | 1,148 | ||||||||||||||||
| Gas aggregation and pipeline cost of sales | — | — | 1,316 | 4,020 | 5,247 | 2,111 | 4,483 | ||||||||||||||||
| Depreciation, depletion and amortization | 1,557 | 1,432 | 3,479 | 8,189 | 11,770 | 4,543 | 8,604 | ||||||||||||||||
| Exploration | — | — | — | 422 | 3,441 | 284 | 2,019 | ||||||||||||||||
| General and administrative | 929 | 2,497 | 3,407 | 11,766 | 11,899 | 4,284 | 7,349 | ||||||||||||||||
| Interest | 155 | 219 | 355 | 716 | 1,642 | 1,032 | 1,776 | ||||||||||||||||
| Total costs and expenses | 4,259 | 7,201 | 14,387 | 33,067 | 46,053 | 18,626 | 31,064 | ||||||||||||||||
| Income before provision for income taxes | 1,339 | 4,974 | 9,884 | 20,015 | 16,635 | 13,072 | 4,826 | ||||||||||||||||
| Current income tax expense (benefit) | 298 | (254 | ) | — | — | — | — | — | |||||||||||||||
| Provision for deferred income taxes | 243 | 2,053 | 3,850 | 9,234 | 6,424 | 5,241 | 1,858 | ||||||||||||||||
| Cumulative effect of accounting change | — | 30 | — | — | — | — | — | ||||||||||||||||
| Net income | $ | 798 | $ | 3,205 | $ | 6,034 | $ | 10,781 | $ | 10,211 | $ | 7,831 | $ | 2,968 | |||||||||
| Net income per common share: | |||||||||||||||||||||||
| Basic | $ | 0.04 | $ | 0.15 | $ | 0.22 | $ | 0.28 | $ | 0.23 | $ | 0.19 | $ | 0.07 | |||||||||
| Diluted | $ | 0.04 | $ | 0.15 | $ | 0.22 | $ | 0.27 | $ | 0.23 | $ | 0.18 | $ | 0.06 | |||||||||
Balance Sheet Data | |||||||||||||||||||||||
| Property and equipment, net, successful efforts method | $ | 26,354 | $ | 44,566 | $ | 70,811 | $ | 170,094 | $ | 216,239 | $ | 193,807 | $ | 275,536 | |||||||||
| Total assets | 33,805 | 51,681 | 80,206 | 192,300 | 231,913 | 211,187 | 295,098 | ||||||||||||||||
| Long-term debt | 5,783 | 6,333 | 10,683 | 25,750 | 16,000 | 30,940 | 71,000 | ||||||||||||||||
| Stockholders' equity | 24,320 | 37,423 | 51,757 | 131,669 | 176,166 | 142,001 | 179,662 | ||||||||||||||||
| Working capital (deficiency) | 2,463 | 96 | (1,581 | ) | 3,648 | (920 | ) | 519 | 1,215 | ||||||||||||||
25
| | Period from Inception April 1, 2002 to December 31, 2002 | | | | | Six Months Ended June 30, | |||||||||||||||||
|---|---|---|---|---|---|---|---|---|---|---|---|---|---|---|---|---|---|---|---|---|---|---|---|
| | Year Ended December 31, | ||||||||||||||||||||||
| | 2003 | 2004 | 2005 | 2006 | 2006 | 2007 | |||||||||||||||||
| | | | | | | (Unaudited) | |||||||||||||||||
| | (In thousands) | ||||||||||||||||||||||
| Other Financial Data | |||||||||||||||||||||||
| Net cash provided (used) by: | |||||||||||||||||||||||
| Operating activities | $ | 3,769 | $ | 6,746 | $ | 16,313 | $ | 30,166 | $ | 29,158 | $ | 20,238 | $ | 10,141 | |||||||||
| Investing activities | (18,511 | ) | (19,165 | ) | (27,491 | ) | (106,355 | ) | (50,209 | ) | (23,394 | ) | (63,482 | ) | |||||||||
| Financing activities | 18,289 | 10,448 | 12,350 | 76,602 | 22,219 | 4,206 | 54,619 | ||||||||||||||||
EBITDA(1) | $ | 3,051 | $ | 6,655 | $ | 13,718 | $ | 33,777 | $ | 31,427 | $ | 19,348 | $ | 15,850 | |||||||||
- (1)
- See "—Reconciliation of Non-GAAP Financial Measures" below for additional information.
Reconciliation of Non-GAAP Financial Measures
The following table shows our reconciliation of our PV-10 to our standardized measure of discounted future net cash flows (the most directly comparable measure calculated and presented in accordance with GAAP). PV-10 is our estimate of the present value of future net revenues from estimated proved natural gas reserves after deducting estimated production and ad valorem taxes, future capital costs and operating expenses, but before deducting any estimates of future income taxes. The estimated future net revenues are discounted at an annual rate of 10% to determine their "present value." We believe PV-10 to be an important measure for evaluating the relative significance of our oil and natural gas properties and that the presentation of the non-GAAP financial measure of PV-10 provides useful information to investors because it is widely used by professional analysts and sophisticated investors in evaluating oil and gas companies. Because there are many unique factors that can impact an individual company when estimating the amount of future income taxes to be paid, we believe the use of a pre-tax measure is valuable for evaluating our company. We believe that most other companies in the oil and gas industry calculate PV-10 on the same basis. PV-10 should not be considered as an alternative to the standardized measure of discounted future net cash flows as computed under GAAP.
| | As of June 30, 2007 | ||||
|---|---|---|---|---|---|
| | (in thousands) | ||||
| PV-10 | $ | 576,484 | |||
Less: Undiscounted income taxes | (418,925 | ) | |||
| Plus: 10% discount factor | 228,142 | ||||
| Discounted income taxes | (190,783 | ) | |||
| Standardized measure of discounted future net cash flows | $ | 385,701 | |||
The following table reconciles our net income to EBITDA. EBITDA is defined as net income or loss before interest, income taxes, non-cash compensation, depreciation, depletion and amortization. We have reported EBITDA because we believe EBITDA is useful to investors as an indicator of a company's operating performance and ability to incur and service debt. Management also believes that EBITDA facilitates investors in comparing a company's performance on a consistent basis without regard to capital structures or financing methods. One of the loan covenants in our credit agreement is a measurement of EBITDA plus exploration costs, which is referred to as EBITDAX, compared to total debt outstanding. Our exploration costs are disclosed in our financial statements as a separate line item and include exploratory dry holes, geologic and geophysical costs, and delay rentals.
26
While we have disclosed our EBITDA to permit a more complete comparative analysis of our operating performance and debt servicing ability relative to other companies, investors should be cautioned that EBITDA as reported by us may not be comparable in all instances to EBITDA as reported by other companies. In addition, EBITDA amounts may not be fully available for management's discretionary use, due to the requirements to conserve funds for capital expenditures, debt service or other commitments. EBITDA should not be considered in isolation or as a substitute for net income, operating income, net cash provided by operating activities or any other measure of financial performance presented in accordance with generally accepted accounting principles.
| | Period from Inception April 1, 2002 to December 31, 2002 | | | | | Six Months Ended June 30, | ||||||||||||||||
|---|---|---|---|---|---|---|---|---|---|---|---|---|---|---|---|---|---|---|---|---|---|---|
| | Year Ended December 31, | |||||||||||||||||||||
| | 2003 | 2004 | 2005 | 2006 | 2006 | 2007 | ||||||||||||||||
| | | | | | | (Unaudited) | ||||||||||||||||
| | (In thousands) | |||||||||||||||||||||
| Net income | $ | 798 | $ | 3,205 | $ | 6,034 | $ | 10,781 | $ | 10,211 | $ | 7,831 | $ | 2,968 | ||||||||
| Income taxes | 541 | 1,799 | 3,850 | 9,234 | 6,424 | 5,241 | 1,858 | |||||||||||||||
| Non-cash compensation | — | — | — | 4,857 | 1,380 | 701 | 644 | |||||||||||||||
| Depreciation, depletion and amortization | 1,557 | 1,432 | 3,479 | 8,189 | 11,770 | 4,543 | 8,604 | |||||||||||||||
| Interest | 155 | 219 | 355 | 716 | 1,642 | 1,032 | 1,776 | |||||||||||||||
| EBITDA | $ | 3,051 | $ | 6,655 | $ | 13,718 | $ | 33,777 | $ | 31,427 | $ | 19,348 | $ | 15,850 | ||||||||
27
MANAGEMENT'S DISCUSSION AND ANALYSIS OF FINANCIAL CONDITION
AND RESULTS OF OPERATIONS
The following discussion is intended to assist in understanding our results of operations and our present financial condition. Our combined financial statements and the accompanying notes included elsewhere in this prospectus contain additional information that should be referred to when reviewing this material. Statements in this discussion may be forward-looking. These forward-looking statements involve risks and uncertainties, which could cause actual results to differ from those expressed.
Overview
We are an independent oil and gas company engaged in the acquisition, development, production and exploration of onshore U.S. oil and gas properties. We own and operate an approximate 100-mile pipeline in East Texas that gathers and transports gas in the area for delivery to other pipelines. Our properties are concentrated in East Texas and in the Hugoton field in southwest Kansas. We have increased our proved reserves and production primarily through acquisitions in conjunction with an active drilling program. From inception (April 2002) we have acquired approximately 133 Bcfe of proved reserves for approximately $119 million.
We continually evaluate opportunities to expand our position in our core areas. Since inception, we have closed four East Texas acquisitions: two consisting of reserve acquisitions, one to increase our pipeline ownership position and one to acquire the Shelby Pipeline. The total cost of these acquisitions was approximately $48.2 million. In addition, we have spent approximately $73 million for our current position in the Hugoton field from our initial acquisition in 2005 and our most recent acquisition in 2007.
Our financial results depend upon many factors, particularly the price of oil and gas. Commodity prices are affected by changes in market demand, which is impacted by overall economic activity, weather, pipeline capacity constraints, inventory storage levels, basis differentials and other factors. As a result, we cannot accurately predict future oil and gas prices, and therefore, we cannot determine what effect increases or decreases will have on our capital program, production volumes and future revenues. In addition to production volumes and commodity prices, finding and developing sufficient amounts of oil and gas reserves at economical costs are critical to our long-term success.
We have identified the impact of generally higher commodity prices in the last several years as compared to prior periods as an important trend that we expect to affect our business in the future. If commodity prices continue at present relatively high levels or increase, we would expect this trend to result not only in increased revenue from the increased commodity prices, but also in an increasingly competitive environment for good drilling prospects, qualified geological and technical personnel and oil field services, including rigs. Increasing competition in these areas, which we expect to increase so long as commodity prices remain relatively high, will likely result in higher costs in these areas, and could result in unavailability of drilling rigs, and thus could affect the profitability of our future operations. We may not be able to compete successfully in the future with larger competitors in acquiring prospective reserves, developing reserves, marketing hydrocarbons, attracting and retaining quality personnel and raising additional capital.
Critical Accounting Policies and Estimates
The discussion and analysis of our financial condition and results of operations are based upon our combined financial statements, which have been prepared in accordance with accounting policies generally accepted in the United States of America. The preparation of our combined financial statements requires us to make estimates and assumptions that affect our reported results of operations and the amount of reported assets, liabilities and proved oil and gas reserves. Some accounting policies involve judgments and uncertainties to such an extent that there is reasonable likelihood that materially
28
different amounts could have been reported under different conditions, or if different assumptions had been used. Actual results may differ from the estimates and assumptions used in the preparation of our combined financial statements. Described below are the most significant policies we apply in preparing our combined financial statements some of which are subject to alternative treatments under accounting policies generally accepted in the United States of America. We also describe the most significant estimates and assumptions we make in applying these policies. See notes to the financial statements under the heading "Summary of Significant Accounting Policies" for additional accounting policies and estimates by management.
Oil and Gas Activities
Accounting for oil and gas activities is subject to special, unique rules. We utilize the successful efforts method for accounting for our oil and gas activities. The significant principles for this method are:
- •
- Geological and geophysical evaluation costs are expensed as incurred.
- •
- Dry holes for exploratory wells are expensed. Dry holes for developmental wells are capitalized.
- •
- Impairments of properties, if any, are based on the evaluation of the carrying value of properties against their fair value based upon pools of properties grouped by geographical and geological conformity.
Our engineering estimates of proved oil and gas reserves directly impact financial accounting estimates including depletion, depreciation, and amortization expense; evaluation of impairment of properties and the calculation of plugging and abandonment liabilities. Proved oil and gas reserves are the estimated quantities of oil and gas that geological and engineering data demonstrate with reasonable certainty to be recoverable in future years from known reservoirs under period-end economic and operating conditions. The process of estimating quantities of proved reserves is very complex, requiring significant subjective decisions in the evaluation of all geological, engineering and economic data for each reservoir. The data for any reservoir may change substantially over time as a result of changing results from operational activity and results. Changes in commodity prices, operation costs and techniques will also change and change the overall evaluation of reservoirs.
Our estimated proved reserves as of June 30, 2007 were prepared by MHA Petroleum Consultants, Inc.
Derivative Instruments and Hedging Activities
We enter into derivative contracts to hedge future gas and crude oil production to mitigate a portion of the risk of market price fluctuations.
To designate a derivative as a cash flow hedge, we document at the hedge's inception our assessment as to whether the derivative will be highly effective in offsetting expected changes in cash flows from the item hedged. This assessment, which is updated at least quarterly, is generally based on the most recent relevant historical correlation between the derivative and the item hedged. The ineffective portion of the hedge, if any, is calculated as the difference between the change in fair value of the derivative and the estimated change in cash flows from the item hedged.
If, during the derivative's term, we determine the hedge is no longer highly effective, hedge accounting is prospectively discontinued and any remaining unrealized gains or losses on the effective portion of the derivative are reclassified to earnings when the underlying transaction occurs. If it is determined that the designated hedge transaction is not likely to occur, any unrealized gains or losses are recognized immediately in the consolidated statements of income as a derivative fair value gain or loss.
29
Recent Accounting Pronouncements
In September 2006, the FASB issued FAS No. 157, "Fair Value Measurements" ("FAS 157"). FAS 157 defines fair value to measure assets and liabilities, establishes a framework for measuring fair value, and requires additional disclosures about the use of fair value. FAS 157 is applicable whenever another accounting pronouncement requires or permits assets and liabilities to be measured at fair value. FAS 157 does not expand or require any new fair value measures. FAS 157 is effective for our fiscal year beginning January 1, 2008. We are currently evaluating the impact that the adoption of FAS 157 will have on our financial position or results of operations.
In February 2007, the FASB issued FAS No. 159, "The Fair Value Option for Financial Assets and Financial Liabilities" ("FAS 159"). FAS 159 permits entities to choose to measure many financial instruments and certain other items at fair value that are not currently required to be measured at fair value. FAS 159 is effective as of the beginning of an entity's first fiscal year that begins after November 15, 2007, which for us will be January 1, 2008. We are currently evaluating the impact of adopting FAS 159 on our financial position and results of operations.
Effects of Inflation
Inflation in the United States has been relatively low in recent years and did not have a material impact on our results of operations for the years ended December 31, 2004, 2005 or 2006 and the six months ended June 30, 2007. Although the impact of inflation has been insignificant in recent years, it is still a factor in the United States economy and may increase the cost to acquire or replace property, plant and equipment. It may also increase the costs of labor and supplies. To the extent permitted by competition, regulation and our existing agreements, we have and will continue to pass along increased costs to our customers in the form of higher prices.
Stock Based and Other Compensation
Our Amended and Restated 2006 Stock Incentive Plan allows grants of stock and or options to management and key employees. Granting of awards may increase our general and administrative expenses subject to the size and timing of the grants.
Public Company Expenses
We believe that our general and administrative expenses will increase in connection with the completion of our initial public offering. This increase will consist of legal and accounting fees and additional expenses associated with compliance with the Sarbanes-Oxley Act of 2002 and other regulations. We anticipate that our ongoing general and administrative expenses will also increase as a result of being a publicly traded company. This increase will be due primarily to the cost of accounting support services, filing annual and quarterly reports with the SEC, investor relations, directors' fees, directors' and officers' insurance, and registrar and transfer agent fees. As a result, we believe that our general and administrative expenses for future periods will increase significantly. Our consolidated financial statements following the completion of this offering will reflect the impact of these increased expenses and affect the comparability of our financial statements with periods prior to the completion of our initial public offering.
Results of Operations
In April 2005 we acquired Presco Western, LLC and in August 2005 we acquired additional acreage in Shelby County, Texas. These acquisitions substantially changed the magnitude of our operations and resulted in substantially increased production volumes for which the acquired properties
30
were included in the 2005 results from the date of acquisition, together with corollary increases in related income and expenses.
In April 2004, we acquired the 75% of the English Bay pipeline in East Texas that we did not own which increased our revenue and expenses related to our gas gathering assets in subsequent periods.
Six Months Ended June 30, 2006 and 2007
| | Six Months Ended June 30, | ||||||
|---|---|---|---|---|---|---|---|
| | 2006 | 2007 | |||||
| Net Production (MMcfe) | 3,762 | 4,372 | |||||
Average Sales Prices (per Mcfe) (before hedging) | $ | 7.13 | $ | 7.17 | |||
Oil and gas sales (in thousands) | $ | 26,824 | $ | 31,339 | |||
Costs and expenses (in thousands): | |||||||
| Lease operating expenses | $ | 5,770 | $ | 5,685 | |||
| Production taxes | 602 | 1,148 | |||||
| Depreciation, depletion and amortization | 4,543 | 8,604 | |||||
| Exploration | 284 | 2,019 | |||||
| General and administrative | 4,284 | 7,349 | |||||
| Interest | 1,032 | 1,776 | |||||
Oil and Gas Sales. Our oil and gas sales increased from $26.8 million for the six-month period ended June 30, 2006 to $31.3 million for the comparable period in 2007, primarily as a result of a 16% increase in our net production. Our oil volumes increased significantly from our drilling results in Kansas. Gas prices increased and oil prices decreased by 1% and 3%, respectively.
Gas Aggregation and Pipeline Sales. Gas aggregation and pipeline sales increased from $2.4 million for the six-month period ended June 30, 2006 to $4.5 million for the comparable period in 2007, primarily as a result of increased volumes of third party gas being transported and, to a lesser extent, from the additional revenues derived from buying and selling pipeline gas. These revenues are derived strictly from transmission and sales of third party gas and gas transactions.
Gain on Oil and Gas Hedging Activities. Gains on oil and gas hedging activities decreased from $2.4 million for the six months ended June 30, 2006 to $28,000 for the comparable period in 2007. Our gains for the six months ended June 30, 2006 were the result of puts having a weighted average price of $10.40 covering 40% of our production during the period. Our gains for the six months ended June 30, 2007 were the result of puts having a weighted average price of $7.00 for 16% of our production for the period.
Lease Operating Expenses. Our lease operating expenses decreased from $5.8 million for the six-month period ended June 30, 2006 to $5.7 million for the comparable period in 2007. Our 2006 lease operating expenses included approximately $1 million associated with the reentry and workover of a horizontal well in East Texas. Excluding the costs for this well, lease operating expenses per Mcfe were comparable for both periods.
Production Taxes. Our production taxes increased from $0.6 million for the six-month period ended June 30, 2006 to $1.2 million for the comparable period in 2007. In addition to our increased volume in 2007, we received a significant amount of tax credit refunds in 2006 that lowered costs during that period. Our production taxes are generally calculated as a percentage of oil and gas sales
31
revenue before the effects of hedging. We take full advantage of all credits and exemptions from various taxing authorities.
Gas Aggregation and Pipeline Cost of Sales. Our gas aggregation and pipeline cost of sales increased from $2.1 million for the six-month period ended June 30, 2006 to $4.5 million for the comparable period in 2007. The increase is consistent with the change in gas aggregation and pipeline sales over the two periods.
Depreciation, Depletion and Amortization (DD&A). Depreciation, depletion and amortization expenses increased from $4.5 million for the six-month period ended June 30, 2006 to $8.6 million for comparable period in 2007. This is a result of increased production and increased per unit rate for depletion associated with higher finding and development costs. Our DD&A rate used for the six months ended June 30, 2007 was $1.93 per Mcfe as compared to a rate of $1.53 per Mcfe for the comparable period in 2006.
Exploration. Exploration costs increased from $0.3 million for the six-month period ended June 30, 2006 to $2.0 million for the comparable period in 2007. All costs incurred for exploration were for seismic acquisition and interpretation. Costs increased as we started our acquisition of seismic data in Kansas that will approximate $4 million per year for the next three years.
General and Administrative. General and administrative costs increased from $4.3 million for the six-month period ended June 30, 2006 to $7.4 million in the comparable period in 2007. As we have grown, we have added additional staff to assist in our operations and the exploitation and evaluation of our properties.
Interest Expense. Interest expense increased from $1.0 million for the six-month period ended June 30, 2006 to $1.8 million for the comparable period in 2007. Interest costs are a function of amounts borrowed and the effective rate for borrowing. Thus, the increased interest expense was a function of higher rates and a larger average balance outstanding.
Income Taxes. Income tax expense decreased from $5.2 million for the period ended June 30, 2006 to $1.9 million for the comparable period in 2007, as our net income before taxes declined $8.2 million. Income taxes are recorded at the combined federal and state effective rate of 38.5%. We are allowed to deduct various items for tax that are capitalized for purposes of presenting on our financial statements and no taxes are due and payable for any tax reporting or interim period.
Year Ended December 31, 2005 and 2006
| | Year Ended December 31, | ||||||
|---|---|---|---|---|---|---|---|
| | 2005 | 2006 | |||||
| Net Production (MMcfe) | 6,098 | 7,703 | |||||
Average Sales Prices (per Mcfe) (before hedging) | $ | 7.81 | $ | 6.76 | |||
Oil and gas sales (in thousands) | $ | 47,595 | $ | 52,050 | |||
Costs and expenses (in thousands): | |||||||
| Lease operating expenses | $ | 6,141 | $ | 10,091 | |||
| Production taxes | 1,813 | 1,973 | |||||
| Depreciation, depletion and amortization | 8,189 | 11,770 | |||||
| Exploration | 422 | 3,441 | |||||
| General and administrative | 11,766 | 11,889 | |||||
| Interest | 716 | 1,642 | |||||
Oil and Gas Sales. Oil and gas sales increased from $47.6 million in 2005 to $52.0 million in 2006 as a result of a 26% increase in net production. Offsetting our increase in net production was a 13%
32
decrease in the blended average sales price of oil and gas. We had no acquisitions of producing properties in 2006. During 2006, we drilled 39 wells (32.1 net) and completed 34 wells (28 net).
Gas Aggregation and Pipeline Sales. Our gas aggregation and pipeline sales decreased from $5.6 million in 2005 to $4.5 million in 2006. These revenues represent only those amounts from third-party interests and do not include amounts for the transportation of our gas. Our revenues decreased by 19% as we sold less gas on behalf of third parties. Volumes transported on behalf of others was comparable for each year.
Gain on Oil and Gas Hedging Activities. Gains on oil and gas hedging activities were approximately $6.1 million for the year ended December 31, 2006. These gains were the result of puts having a weighted average price of $10.21, covering 38% of our production. In 2005, we had nominal hedging activity.
Lease Operating Expense. Our lease operating expenses increased from $6.1 million in 2005 to $10.1 million in 2006. Costs increased 64% from 2005 to 2006 while production increased 26%. The significant increase was caused by an increase for all supplies and services in the field as well as approximately $1 million incurred to reenter a horizontal well in East Texas to install hardware for stimulation to the well.
Production Taxes. Our production taxes increased from $1.8 million in 2005 to $2.0 million in 2006. During both years, we applied for and received significant refunds of production taxes for wells drilled in previous years. Thus, the tax amounts reflected in the accompanying financial statements are significantly below the anticipated rates due to the refunds received.
Gas Aggregation and Pipeline Cost of Sales. Our gas aggregation and pipeline cost of sales increased from $4.0 million in 2005 to $5.3 million in 2006, primarily as a result of increased volumes of third party gas being transported and, to a lesser extent, from the additional revenues derived from buying and selling pipeline gas. These revenues are derived strictly from transmission and sales of third party gas and gas transactions.
Depreciation, Depletion and Amortization (DD&A). Our depreciation, depletion and amortization increased from $8.2 million in 2005 to $11.8 million in 2006, an increase of 44%. Our production increased 36%. The remainder of this increase can be attributed to an increase in finding costs in 2006 that were associated with a significant increase in the cost of drilling rigs and all other costs associated with drilling oil and gas wells.
Exploration. Our exploration costs increased from $0.4 million in 2005 to $3.4 million in 2006. All of the exploration costs in 2005 were associated with the acquisition and interpretation of seismic data. In 2006, we were associated with a non-operated deep exploration well in Louisiana. Our share of this dry hole was approximately $1.0 million. The remainder of the exploration costs in 2006 were for the acquisition and interpretation of seismic data.
General and Administrative. Our general and administrative costs increased from approximately $11.8 million in 2005 to $11.9 million in 2006. However, our 2005 expenses included $4.8 million of non-cash compensation charges associated with the sale of stock to officers and our 2006 expenses included $1.4 million of non-cash charges for the cost associated with stock options in 2006. Excluding these non-cash charges, the cost increase in 2006 was $3.5 million, a direct result of adding additional personnel for our operations.
Interest Expense. Interest expense increased from $716,000 in 2005 to $1.6 million in 2006, as we had higher levels of debt outstanding in support of our drilling program.
33
Income Taxes. Our income tax expense decreased from $9.2 million in 2005 to $6.4 million in 2006 as our net income before provision for income taxes was less in 2006 than in 2005. In addition, $4.8 million non-cash compensation charge in 2005 was non-deductible for tax purposes.
Year Ended December 31, 2004 and 2005
| | Year Ended December 31, | ||||||
|---|---|---|---|---|---|---|---|
| | 2004 | 2005 | |||||
| Net Production (MMcfe) | 3,849 | 6,098 | |||||
Average Sales Prices (per Mcfe) (before hedging) | $ | 5.91 | $ | 7.81 | |||
Oil and gas sales (in thousands) | $ | 22,780 | $ | 47,595 | |||
Costs and expenses (in thousands): | |||||||
| Lease operating expenses | $ | 4,539 | $ | 6,141 | |||
| Production taxes | 1,291 | 1,813 | |||||
| Depreciation, depletion and amortization | 3,479 | 8,189 | |||||
| Exploration | — | 422 | |||||
| General and administrative | 3,407 | 11,766 | |||||
| Interest | 355 | 716 | |||||
Oil and Gas Sales. Oil and gas sales increased from $22.8 million to $47.6 million as a result of increased production from acquisitions made in 2005 and the success of our 2005 drilling program with 20.0 (18.6 net) successful wells out of a total of 23 wells drilled (21.6 net). In addition to a 58% increase in production, the average price for natural gas received by us increased 32% from $5.91 per Mcfe to $7.81 per Mcfe. The increase in the price of gas was the most significant factor in the increased oil and gas revenue. Natural gas sales represented 90% of total oil and gas sales in 2005 compared to 97% in 2004 as our Kansas operations acquired in 2005 have oil sales whereby our East Texas operations are almost all natural gas. Thus, 47% of the oil and gas sales increase was due to pricing and 53% was due to increased production.
Gas Aggregation and Pipeline Sales. These revenues increased from $1.1 million in 2005 to $5.6 million in 2005 as a result of our acquisition of the remaining 75% ownership of the English Bay Pipeline in 2004. Total throughput of the pipeline increased from 8,403 MMcf in 2004 to 11,640 MMcf in 2005, with 60% of this throughput being from third parties.
Hedging Activities. We had nominal hedging activity in 2005, and the loss of $115,000 reflects the premiums paid for floors offset by nominal payments from the third party trading company providing the hedging contracts. We had no hedging activity in 2004.
Lease Operating Expense. Lease operating expense increased as production increased. Our production increased 48% and the lease operating expenses increased from $4.5 million in 2004 to $6.1 million in 2005, an increase of 35%.
Production Taxes. The increase from $1.3 million in 2004 to $1.8 million in 2005 is a function of increased production and increased pricing offset by credits received applicable to prior years. These credits amounted to $0.6 million in 2005.
Gas Aggregation and Pipeline Cost of Sales. Costs in 2005 increased with revenues as we owned and operated the pipeline for a complete year in 2005. Costs in 2004 exceeded revenues, as we incurred significant costs to upgrade our pipeline operations and incurred significant costs to reengineer and
34
move a significant portion of our leased compressor capacity. As a result of these improvements and increased revenues, revenues exceeded expenses in 2005.
Depreciation, Depletion and Amortization (DD&A). We had increased production in 2005 from 2004 which was reflected in an increased DD&A charge from $3.5 million in 2004 to $8.2 million in 2005. In addition, the charge per unit of production increased from $0.90 per Mcfe in 2004 to $1.34 in 2005.
Exploration. We hold almost all of our leasehold interest by production and thus incur nominal delay rentals. We had nominal charges in 2005 for geological evaluation costs and incurred no dry hole costs associated with exploratory drilling during the year. There were no exploration or geological evaluation charges in 2004.
General and Administrative. Costs increased significantly from 2004 to 2005 increasing from $3.4 million to $11.8 million in 2005. However, $4.9 million of this increase was applicable to a non-cash stock compensation charge. The increase in general and administrative expense, excluding the non-cash stock compensation charge, was principally due to the significant consulting and professional fees associated with our growth, and increased personnel and costs associated with supporting and housing employees and consultants.
Interest Expense. Interest expense increased $0.4 million to $0.7 million in 2005. The significant increase was a function of increased borrowings.
Income Taxes. We did not pay income taxes in 2004 or in 2005. The provision for income taxes in 2005 increased due to increased net income and because the non-cash stock expense was not a deductible item. Thus our effective income tax rate in 2005 was 46% compared to the expected 38% rate in 2004.
Capital Resources and Liquidity
For the six months ended June 30, 2007, we borrowed $55 million from our line of credit and generated $10.1 million from operations, the proceeds of which we used to fund our drilling operations and for two acquisitions we made in 2007. In February 2007, we acquired a 100% interest in a 20-mile pipeline in East Texas to connect to and supplement our pipeline operations in the Huxley Field for $6.5 million. In March 2007, we acquired the mineral interests underlying our farmout in the Hugoton Deep, as well as additional acreage and producing properties for $19 million. Subsequent to June 30, 2007, we have spent an additional $8.2 million for closing on properties that were subject to preferential rights in the Hugoton Deep.
During 2006, we generated $29.2 million in cash from operations, $26.5 million in cash from our July 2006 equity offering, and borrowed $47.9 million under our line of credit. We used the proceeds from the sale of our common stock to pay back the outstanding amount under our credit facility, but subsequently borrowed additional funds under the line of credit to support our drilling operations, including $53.9 million for drilling in East Texas and Kansas.
For the year ended December 31, 2005, our primary sources of cash were from financing and operating activities. Approximately $121.2 million in proceeds from the sale of stock, borrowings from our line of credit and cash produced from operations were used to acquire the deep mineral interests in the Hugoton field in southwest Kansas via the acquisition of Presco Western, LLC and additional working interests in producing properties in East Texas.
For the year ended December 31, 2004, cash flow from operations of $16.3 million and proceeds from sale of stock of $8.0 million provided the funds to drill and acquire the remaining 75% of the English Bay Pipeline.
35
Our cash flow from operations is driven by commodity prices and production volumes. Prices for oil and gas are driven by seasonal influences of weather, national and international economic and political environments and, increasingly, from heightened demand for hydrocarbons from emerging nations, particularly China and India. Our working capital is significantly influenced by changes in commodity prices and significant declines in prices could decrease our exploration and development expenditures. Cash flows from operations were primarily used to fund exploration and development of our mineral interests. Our cash flows from operations have increased each year since inception as has our investment in the development of our interests.
The following table summarizes our sources and uses of funds for the periods noted:
| | Year Ended December 31, | Six Months Ended June 30, | ||||||||||||||
|---|---|---|---|---|---|---|---|---|---|---|---|---|---|---|---|---|
| | 2004 | 2005 | 2006 | 2006 | 2007 | |||||||||||
| | (in thousands) | |||||||||||||||
| Cash flows provided by operations | $ | 16,313 | $ | 30,166 | $ | 29,158 | $ | 20,238 | $ | 10,141 | ||||||
| Cash flows used in investing activities | (27,491 | ) | (106,355 | ) | (50,209 | ) | (23,394 | ) | (63,482 | ) | ||||||
| Cash flows provided by financing activities | 12,350 | 76,602 | 22,219 | 4,206 | 54,619 | |||||||||||
| Net increase (decrease) in cash and cash equivalents | $ | 1,172 | $ | 413 | $ | 1,168 | $ | 1,050 | $ | 1,278 | ||||||
Operating Activities
For the six months ended June 30, 2007 and 2006, we used our cash flow for drilling, utilizing $34.1 million and $22.7 million in 2007 and 2006, respectively. Our cash flow from operations declined in 2007 due to weather-related and pipeline problems in the first quarter of 2007 that kept our production flat but increased our costs.
Net cash provided by operating activities increased from $30.2 million in 2005 to $29.2 million in 2006. In 2006, increased production offset the decrease in prices compared to 2005. Cash flow from operating activities in 2004 and 2005 were $16.3 million and $30.2 million, respectively. The majority of these increases were generated by drilling and acquisitions in 2004 in East Texas and the acquisition of Presco Western LLC in 2005. Production volumes have increased each year.
Investing Activities
During the six months ended June 30, 2007, we spent $6.5 million to acquire the 20-mile Shelby Pipeline that was connected to our current pipeline facilities to enhance our operational capabilities in East Texas. In addition we acquired the underlying mineral rights to our farmout agreement in Southwest Kansas. This $19.3 million acquisition added additional acreage, increased our net revenue interest in the properties and included some producing wells. We spent an additional $8.2 million subsequent to June 30, 2007 for those properties with preferential rights associated with this transaction.
In 2006 we continued to invest in our drilling program. We spent $51.7 million for drilling and completion in East Texas and Kansas. Our drilling and exploration capital expenditures have increased each year from inception and totaled $19 million in 2003, $21 million in 2004, and $33 million in 2005. Additionally, we made acquisitions totaling $71 million in 2005 and $7 million in 2004.
36
We acquired deep mineral rights to approximately 651,000 gross (631,000 net) acres in the Hugoton field in southwest Kansas in April 2005 as a result of our $45 million acquisition of Presco Western, LLC, which is a party to a farmout agreement.
In August 2005, we acquired additional working interests for $26 million in existing properties in East Texas from a stockholder and former member of the board of directors. This acquisition enhanced our position in the area and assured our operational control of the properties. This acquisition was funded by working capital and borrowings under of our line of credit.
We have established a development budget of $100 million in 2007 and $139 million in 2008 to be funded from cash flow from operations, borrowings under our credit facility and proceeds from our initial public offering. We establish these budgets based upon expected volumes produced and commodity prices.
Financing Activities
For the six months ended June 30, 2007 we borrowed $55.0 million to fund two acquisitions and our drilling activities.
In 2006, we received net proceeds of $26.5 million from the sale of our common stock in our July private equity offering and borrowed $47.9 million under our line of credit.
During 2005, we sold approximately $64.3 million of common stock. These proceeds were primarily used to fund the Presco Western, LLC acquisition and to assist in the development of our interests in the Hugoton field.
In 2004, we received net proceeds of $8.0 million from the sale of our common stock and borrowed $4.4 million under our line of credit.
In February 2006, we established a new $400 million credit facility with a syndication of six banks. Borrowings under this facility were used to repay and replace a previous facility and to increase our borrowing capabilities thereby enhancing our financial flexibility. As of December 15, 2006, we had an outstanding balance under this credit facility of approximately $16 million, with a borrowing base of $110 million. The borrowing base is subject to adjustment twice each year, based on an assessment by bank petroleum engineers of our future cash flows from proved oil and gas reserves using the bank's pricing parameters.
Our goal is to limit borrowing to no more than 50% of book capital to assure that we have flexibility to expand and invest, and to avoid the problems associated with highly leveraged companies of large interest costs and possible debt reductions restricting ongoing operations.
We believe that cash flow from operations, borrowings under our credit facility and proceeds from our initial public offering will finance all of our anticipated drilling, exploration and capital needs and we will use our credit facility for possible acquisitions, temporary working capital needs and any expansion of our drilling program through 2008.
Future Capital Expenditures for 2007 and 2008
The following table summarizes information regarding our estimated 2007 and 2008 capital expenditures. We will be required to meet our needs from our internally generated cash flow, debt financings, and equity financings. The estimated 2007 and 2008 capital expenditures shown (excluding acquisitions) are preliminary full year estimates, including approximately $34 million spent from January 1, 2007 through June 30, 2007. The estimated capital expenditures are subject to change
37
depending upon a number of factors, including availability of capital, drilling results, oil and gas prices, costs of drilling and completion and availability of drilling rigs, equipment and labor.
| | | Estimated | ||||||||
|---|---|---|---|---|---|---|---|---|---|---|
| | Historical | Year Ending December 31, | ||||||||
| | Year Ended December 31, 2006 | |||||||||
| | 2007 | 2008 | ||||||||
| | | (In thousands) | ||||||||
| Capital expenditures: | ||||||||||
| East Texas | $ | 22,400 | $ | 45,000 | $ | 48,000 | ||||
| Hugoton | 31,200 | 46,000 | 48,000 | |||||||
| Other | 1,400 | 5,000 | 9,000 | |||||||
| Geological and geophysical | 2,400 | 4,000 | 4,000 | |||||||
| Growth capital expenditures(1) | — | — | 30,000 | |||||||
| Total capital expenditures | $ | 57,400 | $ | 100,000 | $ | 139,000 | ||||
- (1)
- Growth capital expenditures are for the acceleration of drilling and secondary recovery in addition to capital expenditures contemplated in the reserve report. We do not budget for possible acquisitions.
Credit Facility
In February 2006, we entered into a new $400 million revolving credit facility with JPMorgan Chase Bank, N.A., as administrative agent, and certain lenders. The availability of funds under the credit facility is subject to a borrowing base which was initially set at, and currently is, $110 million. The borrowing base will be redetermined every six months or, upon our election, one additional time each calendar year.
The credit facility provides for interest on amounts outstanding under the credit facility to accrue at a rate calculated, at our option, at either: (i) the adjusted base rate (which is the greater of the agent's base rate or the federal funds rate plus one half of one percent) plus a margin which ranges from 0% to 0.75%; or (ii) the London Interbank Offered Rate plus a margin which ranges from 1.25% to 2.0% per annum, as applicable, as amounts outstanding under the credit facility increase as a percentage of the borrowing base. In addition, we pay an annual commitment fee which ranges from 0.3% to 0.5% of non-utilized borrowings available under the credit facility, as amounts outstanding under the credit facility increase as a percentage of the borrowing base.
We are subject to financial covenants requiring maintenance of a minimum current ratio and a minimum debt to income ratio. In addition, we are subject to covenants restricting or prohibiting cash dividends and other restricted payments, transactions with affiliates, incurrence of other debt, consolidations and mergers, the level of operating leases, assets sales, investments in other entities, and liens on properties.
Loans under the credit facility are secured by first priority liens on substantially all of our assets including equity interests in our subsidiaries. All outstanding amounts under the credit facility are due and payable in February 2010.
We anticipate that the proceeds to us from this offering will be used to pay off outstanding indebtedness. As of August 6, 2007, the outstanding balance under the credit facility was approximately $84 million.
38
Contractual Commitments
We have entered into a contract to use a drilling rig in East Texas for three years at approximately $8 million per year. In the event that gas prices have a six-month average below $4.50 per Mcf or above $10 per Mcf the pricing is modified.
In October 2006 and November 2006, respectively, we executed a five-year lease and an amendment thereto for approximately 43,000 square feet of office space for approximately $73,000 per month. We are also under a lease that expires in 2010 for office space we previously occupied at $220,000 per year. We are currently looking to sublet this space for the remainder of the lease term.
The following table summarizes these commitments as of June 30, 2007:
| Contractual Obligations | Total | Less than 1 Year | 1-3 Years | 3-5 Years | More than 5 Years | ||||||||||
|---|---|---|---|---|---|---|---|---|---|---|---|---|---|---|---|
| Long-Term Debt Obligations—Bank Borrowing Facility | $ | 71,000,000 | $ | — | $ | — | $ | 71,000,000 | $ | — | |||||
| Operating Lease Obligations—Office Leases | 4,211,000 | 962,000 | 2,371,000 | 878,000 | — | ||||||||||
| Drill Rig Lease | 20,000,000 | 8,000,000 | 12,000,000 | — | — | ||||||||||
| Total | $ | 95,211,000 | $ | 8,962,000 | $ | 14,371,000 | $ | 71,878,000 | $ | — | |||||
Off Balance-Sheet Arrangements
We do not have any off-balance sheet arrangements.
Quantitative and Qualitative Disclosure about Market Risk
Some of the information below contains forward-looking statements. The primary objective of the following information is to provide forward-looking quantitative and qualitative information about our potential exposure to market risks. The term "market risk" refers to the risk of loss arising from adverse changes in oil and natural gas prices, and other related factors. The disclosure is not meant to be a precise indicator of expected future losses, but rather an indicator of reasonably possible losses. This forward-looking information provides an indicator of how we view and manage our ongoing market risk exposures. Our market risk sensitive instruments were entered into for hedging and investment purposes, not for trading purposes.
Commodity Price Risk
We enter into derivative contracts to hedge future gas and crude oil production to mitigate portion of the risk of market price fluctuations.
To designate a derivative as a cash flow hedge, we document at the hedge's inception our assessment as to whether the derivative will be highly effective in offsetting expected changes in cash flows from the item hedged. This assessment, which is updated at least quarterly, is generally based on the most recent relevant historical correlation between the derivative and the item hedged. The ineffective portion of the hedge, if any, is calculated as the difference between the change in fair value of the derivative and the estimated change in cash flows from the item hedged.
If, during the derivative's term, we determine the hedge is no longer highly effective, hedge accounting is prospectively discontinued and any remaining unrealized gains or losses on the effective portion of the derivative are reclassified to earnings when the underlying transaction occurs. If it is determined that the designated hedge transaction is not likely to occur, any unrealized gains or losses
39
are recognized immediately in the consolidated statements of income as a derivative fair value gain or loss.
As of August 6, 2007, we had the following outstanding financial natural gas positions:
| Contract Type | Weighted Average Strike Price | Quantity | Contract Period | ||||
|---|---|---|---|---|---|---|---|
| | | (MMBtu) | | ||||
| Futures Put | $ | 6.50 | 200,000 | August 2007 | |||
| Futures Put | $ | 6.50 | 200,000 | September 2007 | |||
We have reviewed the financial strength of our hedge counterparties and believe our credit risk to be minimal. Our hedge counterparties are participants in our credit agreement and the collateral for the outstanding borrowings under our credit agreement is used as collateral for our hedges.
40
Overview
We are an independent oil and gas company engaged in the acquisition, exploration, development and production of onshore domestic U.S. oil and gas properties and have been operating since our inception in June 2002. We primarily operate in two areas: east Texas and adjacent lands in western Louisiana, which we collectively refer to as East Texas, and the Hugoton field in southwest Kansas (the "Hugoton field"). We have assembled combined acreage of approximately 913,000 gross (843,000 net) acres providing us with 754 identified drilling locations. At June 30, 2007 we owned interests in 293 gross (161 net) producing wells, and for the three months ended June 30, 2007 our average net production was approximately 28 MMcfe/d. At June 30, 2007, our estimated total proved oil and gas reserves were approximately 256 Bcfe. Our proved reserves are approximately 73% gas and 36% proved developed. Our total proved reserves have a reserve life index of approximately 29 years, and our proved producing reserves have a reserve life index of 10 years. Using prices as of June 30, 2007, the PV-10 value of our proved reserves had an estimated pre-tax net present value, discounted at 10%, or PV-10, of approximately $576 million, of which 40% was proved developed. See "Selected Combined Historical Financial Data—Reconciliation of Non-GAAP Financial Measures" for additional information regarding PV-10. As operator of over 90% of our proved reserves, we have a high degree of control over our capital expenditure budget and other operating matters.
Competitive Strengths
We believe our historical success is, and future performance will be, directly related to the following combination of strengths which enable us to implement our strategy:
- •
- Experienced Management Team and Directors. The members of our executive management team have an average of over 23 years of experience in the oil and gas industry and
significant experience in managing public and private oil and gas companies. Several of our directors also have significant experience in managing both public and private oil and gas firms.
- •
- High Quality, Operated Asset Base. We own a high quality asset base comprised of long-lived reserves along with shorter-lived, higher return reserves. We operate over 90% of our estimated proved reserves. Approximately 73% of our reserves are gas, and almost all of our assets are located in East Texas and the Hugoton field. We believe this property profile will produce stable cash flows while providing us with a large number of development, exploitation and exploration opportunities.
- •
- Large Acreage Positions. We are a significant acreage holder in each of our two primary operating areas. In East Texas we control over 74,000 gross (71,000 net) acres and in the Hugoton field our interests in the Hugoton Deep amount to 793,000 gross (736,000 net) acres. We believe we have assembled a high quality asset portfolio in prolific oil and gas fields that would be difficult to replicate.
- •
- Significant Hugoton Reserve Potential. With production commencing in the late 1920's, a substantial majority of gas sold from the Hugoton field has been sold at prices under $2.00 per Mcf. As a result of these historically lower prices, we believe the deeper zones of the Hugoton field have not been fully explored or developed. Accordingly, we believe that significant amounts of gas and oil remain to be recovered in the current higher price environment using modern exploration and production technologies.
- •
- Drilling Inventory. We have identified 754 drillable, low to moderate risk locations providing us with multiple years of drilling inventory. Of these locations, 197 are classified as proved undeveloped. We have traditionally drilled locations that management deems to have the greatest economic potential as opposed to drilling wells designed to impact our reported proved
41
- •
- Proven Technical Team. Our technical staff includes 16 geologists, geophysicists, reservoir engineers and technicians with an average of over 16 years of relevant technical experience. Our staff has a proven record of analyzing complex structural and stratigraphic plays using 3-D seismic, geological and geophysical expertise, producing and optimizing oil and gas reservoirs, and
drilling, completing and fracing tight gas reservoirs. Our professionals have developed new horizontal drilling and completion techniques that enhance initial production rates and ultimate reserve recoveries.
- •
- Developmental Drilling Success. The competencies of our proven technical team focused in our large and productive acreage holdings have helped us to achieve a developmental drilling success rate of 90% since our inception in 2002. Our technical expertise has also allowed us to improve the production rates and ultimate hydrocarbon recoveries on our wells as compared to those wells drilled by others in similar reservoirs in our primary operating areas. We do not expect to drill any exploratory wells during the next 18 months.
- •
- Low Finding and Development Costs. Our significant reserve potential in our operating areas, our technical expertise and high drilling success have allowed us to achieve relatively lower finding and development costs. Since our inception, we have invested approximately $149.3 million to drill and complete 90 wells in our East Texas and Hugoton operating areas. Our average acquisition, finding and development cost from inception to June 30, 2007, 2006 was $1.58 per Mcfe. We calculate our cost per Mcfe by adding our historical costs to date with our expected costs to develop proved undeveloped reserves and dividing the sum by our total proved reserves. Other companies may calculate finding and development costs differently than us and, therefore, their finding and development costs may not be comparable to ours.
- •
- Control of Low-Pressure Gas Gathering Infrastructure. We own and operate approximately 100 miles of gas gathering lines and gas pipelines that collect and transport our production and third-party production in our East Texas operations area. We intend to acquire or construct additional gas gathering assets as necessary to fully develop our East Texas opportunities.
- •
- Gas Marketing Flexibility. Production from both East Texas and the Hugoton field has access to multiple delivery points to several regional and interstate pipelines that provide more than sufficient take away capacity to sell our production.
reserve value by converting probable or possible reserves to proved reserves. See "Prospectus Summary—Summary of Capital Expenditures" for more information regarding our anticipated drilling in East Texas.
Strategy
Our strategy is to increase stockholder value by profitably increasing our reserves, production, cash flow and earnings using a balanced program of (1) developing existing properties, (2) exploiting and exploring undeveloped properties, (3) completing strategic acquisitions and (4) maintaining financial flexibility. The following are key elements of our strategy:
- •
- Maintain Technological Expertise. We intend to utilize and expand the technological expertise that has enabled us to achieve a drilling completion rate of 90% since our inception and helped us improve and maximize field recoveries. We will use modern geological and geophysical technologies, detailed petrophysical analyses and sophisticated completion and stimulation techniques, including multi-stage stimulation frac technology, to profitably grow our reserves and production.
- •
- Accelerate the Development of our Existing Properties. We intend to further develop the significant remaining upside potential of our properties.
42
- •
- As discussed, we will sometimes use multi-stage frac technology or multilateral drilling to enhance production from the James Lime wells in East Texas.
- •
- In the Hugoton field we are completing studies of two secondary recovery projects that will use traditional waterflood techniques. The Southwest Lemon Victory Waterflood project has shown increased production in response to waterflood projects operated by others on contiguous properties. We expect to commence initial operations on the Southwest Lemon Victory Waterflood project during the third quarter of 2007.
- •
- In the Hugoton field, we drill to the lowest known hydrocarbon producing formation in our area, then attempt completion in zones that have shown the presence of hydrocarbons during drilling. Geological evaluation through traditional logging methods and this pragmatic test has led us to regularly finding hydrocarbons. We have found at least two economic production zones in each completed well using this method.
- •
- We intend to acquire an additional 350 square miles of proprietary 3-D seismic data with respect to our Hugoton properties over the next five years. This data will add to our current inventory of 350 square miles of proprietary 3-D seismic and 275 square miles of licensed 3-D seismic, providing seismic coverage of approximately two-thirds of our Hugoton interest by 2011.
- •
- Acquisition Growth. We continually review opportunities to acquire producing properties, undeveloped acreage and drilling prospects, particularly on opportunities where we believe our reservoir management and operational expertise will enhance the value and performance of acquired properties. Initial acquisition targets are expected to be in and around our major producing and activity areas. We may enter into hedging agreements in connection with future acquisitions to protect our return on investment. Our management team members have gained significant acquisition experience during their careers with Ellora and previous employers.
- •
- Endeavor to be a Low Cost Producer. We will strive to minimize our operating costs by concentrating our assets within geographic areas where we can consolidate operating control and capture operating efficiencies.
- •
- Maintain Financial Flexibility. Upon the completion of our initial public offering, we expect to have approximately $39 million in cash, no bank debt and at least $110 million available for borrowings under our revolving line of credit, providing us with significant financial flexibility to pursue our business strategy. Our goal is to limit borrowing to no more than 50% of book capital to assure that we have flexibility to expand and invest, and to avoid the problems associated with highly leveraged companies, including large interest costs and possible debt reductions that can restrict ongoing operations. We have historically used puts (or floors) to protect a portion of our exposure to commodity price fluctuations while capturing all of the upside potential of prices. We may enter into additional commodity hedge agreements, including fixed price, forward price, physical purchase and sales contracts, futures, financial swaps, option contracts and put options.
Areas of Operations
We own oil and gas properties, producing and non-producing, principally in East Texas and in the Hugoton field in southwestern Kansas. The following is a brief summary of our major producing and exploration activity areas.
East Texas
We acquired our initial position in East Texas in June 2002. Our acreage is in the Huxley and East Bridges fields, which we believe are the most productive areas of the James Lime. We drill our
43
horizontal wells using fresh water and without drilling mud, which is known as underbalanced drilling. The James Lime has a vertical depth of approximately 6,100 feet and horizontal lengths of up to 8,000 feet. Our acreage across the James Lime is a porous packstone with up to 125 feet of net pay with net porosity greater than 8% in nine different intervals in the limestone. The wells drilled to date have all been completed naturally with open-hole horizontal well bores. An average well costs approximately $2.1 million to drill and complete for unstimulated wells and $3.6 million for stimulated wells. We may also drill multilateral wells in the future at an expected cost of $2.6 million to $3.6 million per well subject to the number of laterals drilled. As of June 30, 2007, our producing wells in the James Lime had produced an average of 0.9 gross Bcfe per well and had estimated proved reserves remaining of 1.5 gross Bcfe, for a total of 2.4 gross Bcfe per well. As previously discussed, we have recently begun implementing a new stimulation technology plan in this area. Our average working interest and net revenue interest in East Texas are 78% and 62%, respectively.
In addition to the James Lime play we started developing the lower Cretaceous Fredericksburg (or Edwards) formation using horizontal drilling. We have identified 120 future locations in the Fredricksburg formation and have drilled two wells in the Fredricksburg formation in 2007. Fredericksburg wells are also drilled underbalanced with water and completed with no stimulation.
All of our drilling in East Texas will be developmental drilling. See "Prospectus Summary—Summary of Capital Expenditures" for our estimated capital expenditures in East Texas.
Hugoton Field
The Hugoton field located in southwestern Kansas was discovered in 1927 and is the largest gas field in North America with cumulative production over 31 Tcf. We believe that substantial recoverable reserves remain in the Hugoton field. Companies active in the Hugoton field include EOG Resources, Inc., Occidental Petroleum Corporation, Cimarex Energy Co., XTO Energy Inc. and BP Amoco. The majority of gas produced to date has been from the shallower Permian formations, which produce primarily gas from 2,400 to 3,200 feet.
We believe the deeper, yet still comparatively shallow, potential of the Hugoton field has been historically underexploited due to the prolific shallow production and historically low gas prices received from 1927 to the 1980s. A majority of the 31 Tcf of gas produced from the field was sold at prices under $2.00 per Mcf, which we believe led to the early abandonment of wells and the bypassing of deeper gas reserves that were not economic to recover in a lower price environment and without the benefit of modern drilling and completion technologies. The deeper Hugoton has produced 3.3 Tcf of gas and 323 MMBbls of oil and condensate in the nine-county area where our acreage is located.
We acquired our rights to develop the Hugoton's deeper potential through our acquisition of Presco Western, LLC in April 2005. We estimate that 8,000 wells have been drilled above the Heebner Shale in the nine counties where our acreage position is located. There are 13 productive horizons below the Heebner Shale (generally 4,000 feet), which we refer to as the Hugoton Deep, and we drill all of our Hugoton wells to the base of the deepest known producing formation in the area.
We intend to acquire an additional 350 square miles of proprietary 3-D seismic data with respect to our Hugoton properties over the next five years. This data will add to our current inventory of 350 square miles of proprietary 3-D seismic and 275 square miles of licensed 3-D seismic, providing seismic coverage of approximately two-thirds of our Hugoton interest by 2011.
During the period we have held our Hugoton acreage, we have already identified three waterfloods and we currently have 469 potential drilling locations. We have increased production from 2 MMcfe/d to over 14 MMcfe/d through the drilling of 66 wells and participating in three farmouts with only nine dry holes. Our average working interest and net revenue interest in the Hugoton field are 100% and 87.5%, respectively. We intend to exploit waterflood potential in the field as well as the stacked pay
44
potential. The primary targets are Morrow and Chester Valley sands which can be detected seismically. We drilled 19 wells in the Hugoton field during the first half of 2007. We anticipate drilling 37 wells in the Hugoton field during the remainder of 2007, including 20 injection and production wells in the Southwest Lemon Victory waterflood project.
Other
We own interests in 45 wells in southeastern Colorado and an approximate 40-mile pipeline that transports the gas produced from such wells to an interstate pipeline. We operate the pipeline and each of the wells in which we own an interest. We transport gas on behalf of our company as well as for others. We also own small interests in approximately 300 wells in Kansas, Oklahoma and Texas.
�� On an aggregate basis, these interests produce 1 MMcf of gas per day. We do not expect significant development or exploration in these areas in the foreseeable future.
Estimated Proved Reserves
The following table sets forth by operating area a summary of our estimated net proved reserves and estimated average daily net production information as of and for the six months ended June 30, 2007.
| | Estimated Proved Reserves at June 30, 2007 | | Production for the Six Months Ended June 30, 2007 | ||||||||||||||||
|---|---|---|---|---|---|---|---|---|---|---|---|---|---|---|---|---|---|---|---|
| | Developed (Bcfe) | Undeveloped (Bcfe) | Total (Bcfe) | Percent of Total Reserves | PV-10(1) ($Millions) | Identified Drilling Locations(2) | Net Average MMcfe/d | Percent of Total | |||||||||||
| East Texas | 60 | 92 | 152 | 59 | % | $ | 268 | 270 | 14 | 58 | % | ||||||||
| Hugoton (Kansas) | 28 | 71 | 99 | 39 | 295 | 469 | 9 | 38 | |||||||||||
| Other | 3 | 2 | 5 | 2 | 13 | 15 | 1 | 4 | |||||||||||
| Total | 91 | 165 | 256 | 100 | % | $ | 576 | 754 | 24 | 100 | % | ||||||||
- (1)
- Based on June 30, 2007 posted field prices of $6.795 per MMBtu of gas and $67.25 per Bbl of oil, respectively, each adjusted for basis and held flat for the life of the reserves and adjusted for quality differentials.
- (2)
- Represents total gross drilling locations identified by management as of June 30, 2007, of which 197 locations are classified as proved. Based on fluctuations in commodity prices, the number of drilling locations will change.
45
Operating Data
The following table presents certain information with respect to our historical operating data for the years ended December 31, 2004, 2005 and 2006 and for the six months ended June 30, 2007:
| | Year Ended December 31, | Six Months Ended June 30, 2007 | |||||||||||
|---|---|---|---|---|---|---|---|---|---|---|---|---|---|
| | 2004 | 2005 | 2006 | ||||||||||
| Gross wells | |||||||||||||
| Drilled | 14 | 23 | 39 | 24 | |||||||||
| Completed | 14 | 20 | 34 | 22 | |||||||||
| Net wells | |||||||||||||
| Drilled | 9.7 | 21.6 | 32.1 | 20.2 | |||||||||
| Completed | 9.7 | 18.6 | 28.0 | 18.4 | |||||||||
| Net production data | |||||||||||||
| Net volume (MMcfe) | 3,849 | 6,098 | 7,703 | 4,372 | |||||||||
| Average daily volume (MMcfe/d) | 10.5 | 16.7 | 21.1 | 24.1 | |||||||||
| Average sales price (per Mcfe) | |||||||||||||
| Average sales price (without hedge) | $ | 5.91 | $ | 7.81 | $ | 6.76 | $ | 7.17 | |||||
| Average sales price (with hedge) | 5.91 | 7.79 | 7.54 | 7.18 | |||||||||
| Expenses (per Mcfe) | |||||||||||||
| Lease operating | $ | 1.18 | $ | 1.01 | $ | 1.31 | 1.30 | ||||||
| Production and ad valorem taxes | 0.34 | 0.30 | 0.26 | 0.26 | |||||||||
| General and administrative | 0.89 | 1.93 | 1.54 | 1.67 | |||||||||
| Depreciation, depletion and amortization | 0.90 | 1.34 | 1.53 | 1.97 | |||||||||
Estimated Proved Reserves
The estimates in the table below of net proved reserves as of June 30, 2007 are based on a reserve report prepared by MHA.
| | As of June 30, 2007 | ||||
|---|---|---|---|---|---|
| Estimated Proved Reserves | |||||
| Gas (Bcf) | 187 | ||||
| Oil (MMBls) | 11 | ||||
| Total proved reserves (Bcfe)(1) | 256 | ||||
| Total proved developed reserves (Bcfe) | 91 | ||||
| PV-10 value (millions)(2) | |||||
| Proved developed reserves | $ | 228 | |||
| Proved undeveloped reserves | 348 | ||||
| Total PV-10 value | $ | 576 | |||
- (1)
- Based on a conversion of 6 Mcfe of gas per Bbl of oil/condensate.
- (2)
- Based on June 30, 2007 posted field prices of $6.795 per MMBtu of gas and $67.25 per Bbl of oil, respectively, each adjusted for basis and held flat for the life of the reserves and adjusted for quality differentials. See "Selected Combined Historical Financial Data—Reconciliation of Non-GAAP Financial Measures" for a reconciliation of PV-10 to the standardized measure of discounted future net cash flows.
46
Development and Exploration Projects
The following table summarizes information regarding our historical 2006 and our estimated 2007 and 2008 capital expenditures. The estimated 2007 and 2008 capital expenditures shown are preliminary full year estimates, including approximately $35 million spent from January 1, 2007 through June 30, 2007. The estimated capital expenditures are subject to change depending upon a number of factors, including availability of capital, drilling results, oil and gas prices, costs of drilling and completion and availability of drilling rigs, equipment and labor.
| | Historical | Estimated | ||||||||
|---|---|---|---|---|---|---|---|---|---|---|
| | Year Ended December 31, | Year Ending December 31, | ||||||||
| | 2006 | 2007 | 2008 | |||||||
| | (In thousands) | |||||||||
| Capital expenditures: | ||||||||||
| East Texas | $ | 22,400 | $ | 45,000 | $ | 48,000 | ||||
| Hugoton | 31,200 | 46,000 | 45,000 | |||||||
| Other | 1,400 | 5,000 | 9,000 | |||||||
| Geological and geophysical | 2,400 | 4,000 | 4,000 | |||||||
| Growth capital expenditures(1) | — | — | 30,000 | |||||||
| Total capital expenditures | $ | 57,400 | $ | 100,000 | $ | 139,000 | ||||
- (1)
- Growth capital expenditures are for the acceleration of drilling and secondary recovery in addition to capital expenditures contemplated in the reserve report. We do not budget for possible acquisitions.
Historical Finding and Development Costs
From our inception in April 2002 to June 30, 2007, our acquisition, finding and development costs have averaged $1.58 per Mcfe. The cost of finding and developing reserves is expressed in dollars per Mcfe and is calculated for this time period by taking the sum of the cost incurred for exploration, development and acquisition, including future development costs attributable to proved undeveloped reserves, adjusted for the balance of unevaluated gas properties not subject to amortization, and dividing such amount by the total proved reserve additions. Of our approximately $282 million of costs incurred to date, $127 million, or 45%, have been for acquisitions. Estimated future development costs at June 30, 2007 totaled $163 million. Management believes that this information is useful to an investor in evaluating us because it measures the efficiency of a company in adding proved reserves as compared to others in the industry; however, other companies may calculate finding and development costs differently than us and, therefore, their finding and development costs may not be comparable to ours.
Principal Customers and Marketing Agreements
We generally sell our production on a month-to-month basis based on current market prices.
The production we sold to Louis Dreyfus Corporation represented 63% and 51% of our oil and gas sales for the year ended December 31, 2006 and the six months ended June 30, 2007, respectively. The production we sold to Plains Marketing, L.P. represented 21% of our oil and gas sales for the six-month period ended June 30, 2007. No other customer represented more than 10% of our oil and gas sales in these periods.
47
Productive Wells
The following table sets forth the number of productive oil and gas wells in which we owned a working interest at December 31, 2006 and June 30, 2007.
| | Total Productive Wells at | ||||||||
|---|---|---|---|---|---|---|---|---|---|
| | December 31, 2006 | June 30, 2007 | |||||||
| | Gross | Net | Gross | Net | |||||
| Oil | 63 | 36 | 124 | 74 | |||||
| Gas | 158 | 77 | 169 | 87 | |||||
| Total | 221 | 113 | 293 | 161 | |||||
Acreage
The following table sets forth certain information with respect to the developed and undeveloped acreage as of June 30, 2007.
| | Developed | Undeveloped | Total | ||||||||||
|---|---|---|---|---|---|---|---|---|---|---|---|---|---|
| | Gross | Net | Gross | Net | Gross | Net | |||||||
| Hugoton Field | 63,310 | 38,394 | 729,957 | 698,100 | 793,267 | 736,494 | |||||||
| East Texas | 30,103 | 29,476 | 44,286 | 41,633 | 74,388 | 71,108 | |||||||
| Other | 17,110 | 14,070 | 27,822 | 21,554 | 44,933 | 35,625 | |||||||
| Total | 110,523 | 81,940 | 802,065 | 761,287 | 912,588 | 843,227 | |||||||
Drilling Activity
Development wells
The following table describes the development wells we drilled during the years ended December 31,
2004, 2005, and 2006 and the six months ended June 30, 2007.
| | Year Ended December 31, | Six Months Ended June 30, | ||||||||||||||||
|---|---|---|---|---|---|---|---|---|---|---|---|---|---|---|---|---|---|---|
| | 2004 | 2005 | 2006 | 2007 | ||||||||||||||
| | Gross | Net | Gross | Net | Gross | Net | Gross | Net | ||||||||||
| Producing | 14 | 9.7 | 20 | 18.6 | 34 | 28.0 | 22 | 18.4 | ||||||||||
| Dry | — | — | 3 | 3.0 | 5 | 4.1 | 2 | 1.8 | ||||||||||
| Total | 14 | 9.7 | 23 | 21.6 | 39 | 32.1 | 24 | 20.2 | ||||||||||
We were in the process of drilling six gross (5.1 net) development wells as of June 30, 2007.
Exploratory wells
We did not participate in the drilling of any exploratory wells in 2004 and 2005. We participated as a non-operator in four gross (one net) exploratory wells in 2006. Three of these wells were economically successful.
48
Hedging Activity
Derivative Instruments and Hedging Activities
We enter into derivative contracts to hedge future gas and crude oil production to mitigate a portion of the risk of market price fluctuations.
To designate a derivative as a cash flow hedge, we document at the hedge's inception our assessment as to whether the derivative will be highly effective in offsetting expected changes in cash flows from the item hedged. This assessment, which is updated at least quarterly, is generally based on the most recent relevant historical correlation between the derivative and the item hedged. The ineffective portion of the hedge, if any, is calculated as the difference between the change in fair value of the derivative and the estimated change in cash flows from the item hedged.
If, during the derivative's term, we determine the hedge is no longer highly effective, hedge accounting is prospectively discontinued and any remaining unrealized gains or losses on the effective portion of the derivative are reclassified to earnings when the underlying transaction occurs. If it is determined that the designated hedge transaction is not likely to occur, any unrealized gains or losses are recognized immediately in the consolidated statements of income as a derivative fair value gain or loss.
It is our intent to use counterparties that participate in our credit facility to allow us maximum flexibility in contract selection and size.
Title to Properties
Our properties are subject to customary royalty interests, liens incident to operating agreements, liens for current taxes and other burdens, including other mineral encumbrances and restrictions. We do not believe that any of these burdens materially interfere with our use of the properties in the operation of our business.
We believe that we have generally satisfactory title to or rights in all of our producing properties. As is customary in the oil and gas industry, we make minimal investigation of title at the time we acquire undeveloped properties. We make title investigations and receive title opinions of local counsel only before we commence drilling operations. We believe that we have satisfactory title to all of our other assets. Although title to our properties is subject to encumbrances in certain cases, we believe that none of these burdens will materially detract from the value of our properties or from our interest therein or will materially interfere with our use in the operation of our business.
Competition
The oil and gas industry is highly competitive and we compete with a substantial number of other companies that have greater resources. Many of these companies explore for, produce and market oil and gas, carry on refining operations and market the resultant products on a worldwide basis. The primary areas in which we encounter substantial competition are in locating and acquiring desirable leasehold acreage for our drilling and development operations, locating and acquiring attractive producing oil and gas properties, and obtaining purchasers and transporters of the oil and gas we produce. There is also competition between producers of oil and gas and other industries producing alternative energy and fuel. Furthermore, competitive conditions may be substantially affected by various forms of energy legislation and/or regulation considered from time to time by the government of the United States; however, it is not possible to predict the nature of any such legislation or regulation that may ultimately be adopted or its effects upon our future operations. Such laws and regulations may, however, substantially increase the costs of exploring for, developing or producing gas and oil and may prevent or delay the commencement or continuation of a given operation. The effect of these risks cannot be accurately predicted.
49
Regulation
The oil and gas industry in the United States is subject to extensive regulation by federal, state and local authorities. We hold onshore federal leases involving the United States Department of Interior (the Bureau of Land Management and the Bureau of Indian Affairs). At the federal level, various federal rules, regulations and procedures apply, including those issued by the United States Department of Interior as noted above, and the United States Department of Transportation (Office of Pipeline Safety). At the state and local level, various agencies and commissions regulate drilling, production and midstream activities. These federal, state and local authorities have various permitting, licensing and bonding requirements. Varied remedies are available for enforcement of these federal, state and local rules, regulations and procedures, including fines, penalties, revocation of permits and licenses, actions affecting the value of leases, wells or other assets, and suspension of production. As a result, there can be no assurance that we will not incur liability for fines and penalties or otherwise subject us to the various remedies as are available to these federal, state and local authorities. However, we believe that we are currently in material compliance with these federal, state and local rules, regulations and procedures.
Transportation and Sale of Gas
The Federal Energy Regulation Commission ("FERC") regulates interstate gas pipeline transportation rates and service conditions. Although the FERC does not regulate gas producers such as us, the agency's actions are intended to foster increased competition within all phases of the gas industry. To date, the FERC's pro-competition policies have not materially affected our business or operations. It is unclear what impact, if any, future rules or increased competition within the gas industry will have on our gas sales efforts.
The FERC, the United States Congress or state regulatory agencies may consider additional proposals or proceedings that might affect the gas industry. We cannot predict when or if these proposals will become effective or any effect they may have on our operations. We do not believe, however, that any of these proposals will affect us any differently than other gas producers with which we compete.
Regulation of Production
Oil and gas production is regulated under a wide range of federal and state statutes, rules, orders and regulations. State and federal statutes and regulations require permits for drilling operations, drilling bonds and reports concerning operations. The states in which we own and operate properties have regulations governing conservation matters, including provisions for the unitization or pooling of oil and gas properties, the establishment of maximum rates of production from oil and gas wells and the regulation of the spacing, and plugging and abandonment of wells. Also, each state generally imposes an ad valorem, production or severance tax with respect to production and sale of oil, gas and gas liquids within its jurisdiction.
Environmental Regulations
The exploration for and development of oil and natural gas and the drilling and operation of wells, fields and gathering systems are subject to extensive federal, state and local laws and regulations governing environmental protection as well as discharge of materials into the environment. These laws and regulations may, among other things:
- •
- require the acquisition of various permits before drilling commences;
- •
- require the installation of expensive pollution control equipment;
50
- •
- restrict the types, quantities and concentration of various substances that can be released into the environment in connection with oil and natural gas drilling production, transportation and processing activities;
- •
- suspend, limit or prohibit construction, drilling and other activities in certain lands lying within wilderness, wetlands and other protected areas; and
- •
- require remedial measures to mitigate pollution from historical and ongoing operations, such as the closure of pits and plugging of abandoned wells.
These laws, rules and regulations may also restrict the rate of oil and natural gas production below the rate that would otherwise be possible. The regulatory burden on the oil and natural gas industry increases the cost of doing business in the industry and consequently affects profitability.
Governmental authorities have the power to enforce compliance with environmental laws, regulations and permits, and violations are subject to injunction, as well as administrative, civil and criminal penalties. The effects of these laws and regulations, as well as other laws or regulations that may be adopted or re-interpreted in the future, could have a material adverse impact on our business, financial condition and results of operations. While we believe that we are in substantial compliance with existing environmental laws and regulations and that continued compliance with current requirements would not have a material adverse effect on us, there is no assurance that this trend or compliance will continue in the future.
The following is a summary of some of the existing laws, rules, and regulations to which our business operations are subject. To date we have not incurred any material costs or penalties as a result of violating any environmental laws or regulations.
Hazardous Substances and Waste Handling
The Comprehensive Environmental Response, Compensation and Liability Act, or CERCLA, also known as the Superfund law, imposes joint and several liability, without regard to fault or legality of conduct, on classes of persons who are considered to be responsible for the release of a hazardous substance into the environment. These persons include the owner or operator of the site where the release occurred, and anyone who disposed or arranged for the disposal of a hazardous substance released at the site. Under CERCLA, such persons may be subject to strict, joint and several liabilities for the costs of cleaning up the hazardous substances that have been released into the environment, for damages to natural resources and for the costs of certain health studies. In addition, it is not uncommon for neighboring landowners and other third-parties to file claims for personal injury and property damage allegedly caused by the hazardous substances released into the environment. While we generate materials in the course of our operations that may be regulated as hazardous substances, we have not received notification that we may be potentially responsible for cleanup costs under CERCLA.
The Resource Conservation and Recovery Act, or RCRA, and comparable state statutes, regulate the generation, transportation, treatment, storage, disposal and cleanup of hazardous and non-hazardous wastes. With the approval of the EPA, the individual states administer some or all of the provisions of RCRA, sometimes in conjunction with their own, more stringent requirements. Drilling fluids, produced waters, and most of the other wastes associated with the exploration, development, and production of crude oil or natural gas are currently regulated under RCRA's non-hazardous waste provisions. However, it is possible that certain oil and natural gas exploration and production wastes now classified as non-hazardous could be classified as hazardous wastes in the future. Any such change could result in an increase in our operating expenses, which could have a material adverse effect on our results of operations and financial position.
We currently own or lease, and have in the past owned or leased, properties that for many years have been used for oil and natural gas exploration, production and development activities. Although we
51
used operating and disposal practices that were standard in the industry at the time, petroleum hydrocarbons or wastes may have been disposed of or released on or under the properties owned or leased by us or on or under other locations where such wastes have been taken for disposal. In addition, some of these properties have been operated by third parties whose treatment and disposal or release of petroleum hydrocarbons and wastes was not under our control. These properties and the materials disposed or released on them may be subject to CERCLA, RCRA and analogous state laws. Under such laws, we could be required to remove or remediate previously disposed wastes or property contamination, or to perform remedial activities to prevent future contamination.
Air Emissions
The federal Clean Air Act and comparable state laws regulate emissions of various air pollutants through air emissions permitting programs and the imposition of other requirements. In addition, EPA has developed, and continues to develop, stringent regulations governing emissions of toxic air pollutants at specified sources. These regulatory programs may require us to obtain permits before commencing construction on a new source of air emissions, and may require us to reduce emissions at existing facilities. As a result, we may be required to incur increased capital and operating costs. Additionally, federal and state regulatory agencies can impose administrative, civil and criminal penalties for non-compliance with air permits or other requirements of the federal Clean Air Act and associated state laws and regulations.
Water Discharges
The Federal Water Pollution Control Act, also known as the Clean Water Act, and analogous state laws, impose restrictions and strict controls with respect to the discharge of pollutants, including spills and leaks of oil and other substances into state waters or waters of the United States, including wetlands. The discharge of pollutants into regulated waters is prohibited, except in accordance with the terms of a permit issued by EPA or an analogous state agency. Federal and state regulatory agencies can impose administrative, civil and criminal penalties for non-compliance with discharge permits or other requirements of the Clean Water Act and analogous state laws and regulations.
Global Warming and Climate Control
Recent scientific studies have suggested that emissions of certain gases, commonly referred to as "greenhouse gases" and including carbon dioxide and methane, may be contributing to warming of the Earth's atmosphere. In response to such studies, the U.S. Congress is actively considering legislation to reduce emissions of greenhouse gases. In addition, at least 14 states have declined to wait on Congress to develop and implement climate control legislation and have already taken legal measures to reduce emissions of greenhouse gases. Also, as a result of the U.S. Supreme Court's decision on April 2, 2007 inMassachusetts, et al. v. EPA, the EPA may be required to regulate greenhouse gas emissions from mobile sources (e.g., cars and trucks) even if Congress does not adopt new legislation specifically addressing emissions of greenhouse gases. The Court's holding inMassachusettsthat greenhouse gases fall under the federal Clean Air Act's definition of "air pollutant" may also result in future regulation of greenhouse gas emissions from stationary sources under certain Clean Air Act programs. New legislation or regulatory programs that restrict emissions of greenhouse gases in areas where we conduct business could adversely affect our operations and demand for our products
Employees
At June 30, 2007, we had 60 full-time employees. None of our employees is represented by a labor union or covered by any collective bargaining agreement. We believe that our relations with our employees are satisfactory.
52
Legal Proceedings
From time to time, we are subject to legal proceedings and claims that arise in the ordinary course of business. Like other gas and oil producers and marketers, our operations are subject to extensive and rapidly changing federal and state environmental, health and safety and other laws and regulations governing air emissions, wastewater discharges, and solid and hazardous waste management activities.
As of the date of this prospectus, we are not aware of any pending or overtly threatened legal actions that we believe, based on our experience to date, would have a material adverse impact on our business, financial position or results of operations.
Insurance Matters
As is common in the oil and gas industry, we will not insure fully against all risks associated with our business either because such insurance is not available or because premium costs are considered prohibitive. A loss not fully covered by insurance could have a materially adverse effect on our financial position, results of operations or cash flows.
53
Executive Officers and Directors
The following discussion sets forth, as of the date of this prospectus, the names and ages of our executive officers and directors and the principal offices and positions they hold as of August 1, 2007. Our executive officers are appointed by our board of directors and shall serve until the expiration of their contracts, their death, resignation, or removal by our board of directors. Our directors serve one year terms or until their successors are elected and qualified or until their death, resignation or removal in the manner provided in our bylaws. The present term of each director will expire at the next annual meeting of our stockholders.
| Name | Age | Position(s) Held | Since | |||
|---|---|---|---|---|---|---|
| T. Scott Martin | 57 | Chairman of the Board, President and Chief Executive Officer | 2002 | |||
Richard F. McClure Jr. | 46 | Vice President of Operations and Chief Operating Officer | 2002 | |||
James R. Casperson | 59 | Vice President of Finance and Chief Financial Officer | 2005 | |||
Valerie K. Walker | 48 | Vice President of Exploration | 2002 | |||
Jeffery S. Williams | 48 | Vice President of Land and Acquisition | 2005 | |||
Cortlandt S. Dietler(a) | 85 | Director | 2006 | |||
Bryan H. Lawrence | 65 | Director | 2002 | |||
Peter A. Leidel | 51 | Director | 2002 | |||
Sheldon B. Lubar(b)(c) | 78 | Director | 2003 | |||
Neil L. Stenbuck(a)(c) | 54 | Director | 2006 | |||
James B. Wallace(b) | 78 | Director | 2006 | |||
George A. Wiegers(a) | 70 | Director | 2006 |
- (a)
- Member of Audit Committee
- (b)
- Member of Compensation and Governance Committee
- (c)
- Committee Chairman
T. Scott Martin has been our chief executive officer since our inception in 2002. Mr. Martin was previously the President of TPEX Exploration in 1991 and 1992 and Chief Operating Officer of Alta Energy from 1992 to 1994. Mr. Martin founded Ellora Energy LLC in 1994 and served as its president until the company ceased operations in 2002. Ellora Energy LLC had non-operated oil and gas interests in Kansas and southeastern Colorado and royalty interests primarily in west Texas. Before operating those companies, Mr. Martin was an engineer with BWAB Inc. and Amoco Production Company. Mr. Martin holds a BA from the Colorado College and a degree in Chemical Engineering from the University of Colorado. In addition to membership in the Society of Petroleum Engineers and the Independent Petroleum Association of America, Mr. Martin was a founding trustee of the Boulder Country Day School and the Martin Seamster Endowment Fund of the Sioux City Art Museum. Mr. Martin was awarded the Boulder Chamber of Commerce Entrepreneur of Distinction Award in 2005.
Richard F. McClure Jr. joined us in 2002 as Chief Operating Officer after 15 years with Questa Engineering in Golden, Colorado. As Vice President of Questa, Mr. McClure spent significant time as a consultant to the oil and gas industry in Southeast Asia, Russia and North America. Previous to his
54
relationship with Questa, Mr. McClure was a drilling and reservoir engineer with ARCO. Mr. McClure earned a BS and ME degree from the Colorado School of Mines in Petroleum Engineering. In addition to being a registered professional engineer in Colorado and New Mexico, Mr. McClure is a member of the Society of Petroleum Engineers and the Society of Petroleum Evaluation Engineers.
James R. Casperson joined us as Chief Financial Officer in March 2005. Mr. Casperson spent the previous five years as the Chief Financial Officer of Whiting Petroleum Corporation of Denver, Colorado. Mr. Casperson has 27 years of experience in the oil and gas industry in public accounting, private industry and as a consultant. Before his employment with Whiting, Mr. Casperson spent 15 years as President of Casperson Incorporated, private consulting firm specializing in the oil and gas industry. Mr. Casperson has a BBA in accounting from Texas Tech University and practiced as a CPA but does not currently have an active license.
Valerie K. Walker has been our Vice President of Exploration since our inception in June 2002. Before her employment with us, Mrs. Walker was a senior geologist with Questar Exploration and Production in Denver, Colorado from 1991 to 1999. From 1999 to 2002, Mrs. Walker was a self-employed independent geology consultant. Mrs. Walker also served as a geologist for Amoco Production Company and Shell Exploration and Production. Mrs. Walker graduated Phi Beta Kappa from Middlebury College with a degree in Geology and earned a Masters Degree in Geology from the University of Colorado. An active member of the American Association of Petroleum Geologists, Mrs. Walker belongs also to the Rocky Mountain Association of Geologists, and Society of Economic Paleontologists and Mineralogists and is a certified geologist in the state of Wyoming.
Jeffery S. Williams joined us as Vice President of Land and Acquisitions in October of 2005. Before joining Ellora, Mr. Williams spent 25 years with POGO Producing Company in Houston, Texas and Oklahoma City, Oklahoma in POGO's land department ultimately serving as a Regional Land Manager. Mr. Williams has a Bachelor's Degree in Business Administration with an emphasis in Petroleum Land Management from the University of Oklahoma.
Cortlandt S. Dietler joined our Board of Directors in September 2006. Mr. Dietler was Chairman of TransMontaigne Inc., a refined petroleum products marketing, distribution and supply chain management company, from April 1995 until September 2006, and served as Chief Executive Officer from April 1995 to September 1999. He was the founder, Chairman and Chief Executive Officer of Associated Natural Gas Corporation, a natural gas gathering, processing and marketing company, prior to its 1994 merger with PanEnergy Corporation. From 1994 to 1997, Mr. Dietler served as an Advisory Director to PanEnergy Corporation prior to its merger with Duke Energy Corporation in March 1997. Mr. Dietler currently serves as a Director of Hallador Petroleum Company, Cimarex Energy Co., and Nytis Exploration Company. Industry affiliations include: Member, National Petroleum Council; Director, American Petroleum Institute; and past Director, Independent Petroleum Association of America.
Bryan H. Lawrence joined us as a director in June 2002. Since 1994, Mr. Lawrence has been a founder and senior manager of Yorktown Partners LLC, the manager of the Yorktown group of investment partnerships, which make investments in companies engaged in the energy industry. The Yorktown partnerships were formerly affiliated with the investment firm of Dillon, Read & Co. Inc., where Mr. Lawrence had been employed since 1966, serving as a Managing Director until the merger of Dillon Read with SBC Warburg in September 1997. Mr. Lawrence also serves as a director of Crosstex Energy, Inc. and Crosstex Energy GP, LLC; Hallador Petroleum Company; Star Gas Partners, L.P.; and Winstar Resources (a Canadian publicly traded company) and certain non-public companies in the energy industry in which Yorktown partnerships hold equity interests. Mr. Lawrence is a graduate of Hamilton College and also has an M.B.A. from Columbia University.
Peter A. Leidel joined us as a director in June 2002. Since September 1997, Mr. Leidel has been a founder and partner in Yorktown Partners LLC, and the manager of the Yorktown group of investment
55
partnerships, which make investments in companies engaged in the energy industry. From 1983 to September 1997, he was employed by Dillon, Read & Co., Inc., an investment banking firm, serving most recently as a Senior Vice President. Mr. Leidel is also a director of certain non-public companies in the energy industry in which Yorktown partnerships hold equity interests. Mr. Leidel holds a BBA from the University of Wisconsin and an MBA from the University of Pennsylvania.
Sheldon B. Lubar joined us as a director in September 2003. Mr. Lubar has been Chairman of the Board of Lubar & Co. Incorporated, a private investment and venture capital firm he founded, since 1977. He was Chairman of the Board of Christiana Companies, Inc., a logistics and manufacturing company, from 1987 until its merger with Weatherford International in 1995. Mr. Lubar has also been a director of Crosstex Energy Inc. since May 2001 and Crosstex Energy GP, LLC since December 2003, Star Gas Partners, L.P. since 2006, and Weatherford International, Inc., an energy services company, since 1995. Mr. Lubar holds a bachelor's degree in Business Administration and a Law degree from the University of Wisconsin—Madison. He was awarded an honorary Doctor of Commercial Science degree from the University of Wisconsin—Milwaukee.
Neil L. Stenbuck joined our Board of Directors in September 2006. Mr. Stenbuck is the Executive Vice President and Chief Financial Officer of Cirque Resources, LP, a private oil and gas firm in Denver, Colorado. Mr. Stenbuck was a Director and Executive Vice President and Chief Financial Officer of Prima Energy Corporation and Gas from May 2001 until October of 2004. He was previously with Basin Exploration, Inc., where he served as Vice President—Finance, Chief Financial Officer, Treasurer and a director from 1995 to 2001. Prior to joining Basin, Mr. Stenbuck was with United Meridian Corporation where he served as Vice President—Capital via the 1994 merger between UMC and General Atlantic Resources, Inc., where he held the same position beginning in 1989. He joined General Atlantic in 1987 as Vice President—Finance and Accounting. Mr. Stenbuck is a Certified Public Accountant not currently licensed. He received a B.S.B.A. degree in Accounting and Finance from the University of Arizona.
James B. Wallace joined us as a director in September 2006. Mr. Wallace is the past Chairman of the Board of Tom Brown Inc., a public oil and gas company until its merger with Encana in May of 2005, and currently serves on the board of directors of Delta Petroleum Corporation. Mr. Wallace was the President and Chairman of the Board of BWAB Inc., a private oil and gas company located in Denver, Colorado from 1988 to 1996. Mr. Wallace has been involved in the oil and gas business for over 40 years and has been a partner of Brownlie, Wallace, Armstrong and Bander Exploration in Denver, Colorado since 1992. Mr. Wallace joined our Board of Directors in September 2006. From 1980 to 1992 he was Chairman of the Board and Chief Executive Officer of BWAB Incorporated. He received a B.S. Degree in Business Administration from the University of Southern California in 1951.
George A. Wiegers joined our Board of Directors in September 2006. Mr. Wiegers has worked at senior levels in the investment banking business for over 30 years. Mr. Wiegers joined Dillon, Read & Co. Inc. as a Managing Director in October 1983. Prior to that, he was a General Partner of Lehman Brothers. Mr. Wiegers has been active in the development and financing of industrial, natural resource and media/communications companies. Mr. Wiegers is a trustee of the University of Colorado Foundation, Inc., retired chairman of Trout Unlimited, and a director of several public and private industrial and media companies. Mr. Wiegers holds a B.A. from Niagara University and an M.B.A. from the Columbia University Graduate School of Business.
Board of Directors; Committees of the Board
Our board of directors is comprised of eight members, consisting of T. Scott Martin, Cortlandt S. Dietler, Brian H. Lawrence, Peter A. Leidel, Sheldon B. Lubar, Neil Stenbuck, James Wallace and George Wiegers. We expect that Messrs. Dietler, Lubar, Stenbuck, Wallace and Wiegers, being a majority of our board, will qualify as independent directors as such term is defined by the SEC and the
56
Nasdaq Global Market. We have an audit committee and a compensation and corporate governance committee, which are each composed of independent directors.
Indemnification
Our certificate of incorporation and bylaws provide indemnification rights to the members of our board of directors. Additionally, we will enter into separate indemnification agreements with the members of our board of directors to provide additional indemnification benefits, including the right to receive in advance reimbursements for expenses incurred in connection with a defense for which the director is entitled to indemnification.
57
Compensation Discussion and Analysis
This compensation discussion describes the material elements of compensation awarded to, earned by or paid to our Chief Executive Officer, Chief Financial Officer and our three other most highly compensated executive officers, each as named in the tables below. We refer to all of these officers as "named executive officers." While this compensation discussion focuses primarily on the information contained in the following tables and related footnotes, as well as the narrative relating to the last completed fiscal year, we also describe compensation actions taken before or after the last completed fiscal year to the extent that such discussion enhances the understanding of our executive compensation disclosure.
We believe our success depends on the continued contributions of our named executive officers. Our executive compensation programs are designed with the philosophy of attracting, motivating and retaining experienced and qualified executive officers and directors with compensation that is consistent with comparable public companies and that recognizes individual merit and overall business results. Our policies are also intended to support the attainment of our strategic objectives by tying the interests of our executive officers with those of our stockholders through operational and financial performance goals and equity-based compensation.
The principal elements of our executive compensation programs are base salary, annual cash incentives, long-term equity incentives in the form of stock options, stock awards, as well as other benefits and perquisites. The other benefits and perquisites provided to our executive officers consist of life, disability and health insurance benefits, a qualified 401(k) savings plan and paid vacation and holidays. Our salary and benefits are intended to be competitive with similarly situated companies and our objective is to position the aggregate of these elements at a level that is commensurate with our size and sustained performance.
Our Compensation and Governance Committee
The Compensation and Governance Committee of our board of directors is responsible for the approval, evaluation and oversight of all of our compensation plans, policies and programs. The primary purpose of the Compensation and Governance Committee is to assist our board of directors in establishing and implementing our compensation policies and monitoring our compliance with such policies. The members of our Compensation and Governance Committee are Sheldon B. Lubar (chairman) and James B. Wallace, each of whom is an independent director in accordance with the NASDAQ Global Market rules. From time to time, the Compensation and Governance Committee may, whenever it deems appropriate, form and delegate authority to various subcommittees.
Each of Messrs. Lubar and Wallace has served as the president of a corporation, each of them serves on the board of directors of at least one other publicly traded oil and gas company and each of them is currently serving or has served on compensation and governance committees of those firms. Both board members are experienced managers and board members.
Mr. Lubar, as chairman of the committee, is responsible for selecting the time and place of meetings and the agendas therefor.
The function of the Compensation and Governance Committee is more fully described in its charter, which our board of directors adopted, effective as of September 11, 2006. The Compensation and Governance Committee reviews and assesses, on an annual basis, the adequacy of the charter and recommends any proposed changes to our board of directors for approval.
The Compensation and Governance Committee held one meeting during 2006.
58
Responsibilities of the Compensation and Governance Committee
Acting on behalf of the board of directors, the responsibilities of the Compensation and Governance Committee include the following:
- •
- reviewing and making recommendations to our board of directors with respect to our general compensation policies;
- •
- reviewing and approving our goals and objectives relating to the compensation of our executive officers, evaluating such officers' performance in light of these goals and recommending compensation levels to our board of directors based on these evaluations;
- •
- reviewing market data to assess our position with respect to the compensation of our executive officers in order to ensure we are competitive with comparable public companies;
- •
- administering our stock option and restricted stock plans or other similar plans including selecting to whom grants under any such plans are made and determining the terms and type of any such grant;
- •
- recommending to our board of directors the adoption of amendments to any of our plans and modifying or canceling any exiting grants under such plans;
- •
- reviewing the sufficiency of the shares available for grant under any of our Plans based on our goals for hiring, bonus and retention grants and assessing our competitive position with respect to the level of our equity compensation, vesting schedules and other terms with comparable public companies; and
- •
- preparing the "Report of the Compensation and Governance Committee" to be included in our proxy statement.
Compensation Program Objectives
The objectives of our executive compensation programs are as follows:
- •
- attract and retain talented and experienced executives;
- •
- motivate and reward executives whose knowledge, skills and performance are critical to our success;
- •
- align the interests of our executive officers and stockholders by motivating executive officers to increase shareholder value and rewarding executive officers when shareholder value increases;
- •
- provide a competitive compensation package that is weighted heavily towards pay for performance, and in which total compensation is primarily determined by company and individual results and the creation of shareholder value;
- •
- insure fairness among the executive management team by recognizing the contributions each executive makes to our success;
- •
- foster a shared commitment among executives by coordinating their company and individual goals; and
- •
- compensate our executives accordingly to meet our long-term objectives.
The Compensation and Governance Committee will evaluate the objectives of our executive compensation programs on a regular basis. In determining the objectives of our executive compensation programs, the Compensation and Governance Committee will examine the appropriate matching of compensation to performance as an individual and as an executive group. The Committee is
59
responsible for comparative analysis of our executive compensation plan against others in the industry to insure that the executive compensation plans are competitive.
The Compensation and Governance Committee is responsible for reviewing and making recommendations to our board of directors regarding our executive compensation programs. These programs were implemented to achieve the objectives established by the Compensation and Governance Committee for compensating our executive officers. The Compensation and Governance Committee will review our executive compensation programs on an annual basis to determine if such programs are effective in achieving the objectives established by the Compensation and Governance Committee. Compensation objectives are established based upon various measurements of profitability, share value enhancement and specific transaction conclusion, both as individuals and as a management group.
To assist management and the Compensation and Governance Committee in assessing and determining compensation packages, the Compensation and Governance Committee will engage compensation consultants based upon the specific needs of the Compensation and Governance Committee. The Compensation and Governance Committee will contract with the consultants directly and will control and direct the work to be performed.
The Compensation and Governance Committee will meet outside the presence of all of our executive officers to consider the appropriate compensation for our Chief Executive Officer. For all other named executive officers, the Compensation and Governance Committee will meet outside the presence of all executive officers, except our Chief Executive Officer. Our Chief Executive Officer will annually review the performance of each named executive officer with the Compensation and Governance Committee and will make recommendations to the Compensation and Governance Committee with respect to the appropriate base salary, payments to be made under our annual cash incentive plan and the grant of long-term equity incentive awards. Based in part on these recommendations from our Chief Executive Officer and the other considerations discussed below, the Compensation and Governance Committee will approve the annual compensation package of each of our executive officers, other than our Chief Executive Officer. The Compensation and Governance Committee will analyze the performance of our Chief Executive Officer and determine the base salary, payments to be made under our annual cash incentive plan and the grant of long-term equity incentive awards. Input or suggestions applicable to group or individual compensation from other executive officers will be solicited by the Compensation and Governance Committee.
Compensation for each executive officer will be determined by the Compensation and Governance Committee by evaluating such officer's performance, our performance, and the officer's impact on our performance. Based upon these evaluations, the Compensation and Governance Committee will determine the compensation for each of our executive officers, consistent with the objectives established by the Compensation and Governance Committee. The Compensation and Governance Committee will also compare the compensation (including salary, bonuses, long-term incentives, etc.) paid by us to our executive officers to similarly-positioned executive officers in our industry, specifically other publicly held oil and gas companies with headquarters in the Rocky Mountain region such as: Cimarex Energy Co., Delta Petroleum Corporation, Forest Oil Corporation, St. Mary Land & Exploration Company and Whiting Petroleum Corporation. These are our five primary Rocky Mountain publicly-traded competitors, thus providing a relevant benchmark for comparing our executive officers' compensation. The competitors have operations in similar areas, require executives with similar experience and we compete against them for employees in all areas and at all levels of expertise, experience and abilities.
The Compensation and Governance Committee will establish specific performance targets that our executive officers must achieve in order to receive certain types of compensation, including annual bonuses, base pay increases and performance awards under our Amended and Restated 2006
60
Long-Term Incentive Plan. These performance targets are accurate indicators of the executive officers' impact on our operational success and provide specific standards that motivate the officers to perform in our best interest and in our stockholders best interests. These targets include performance measures that increase the value of the company including: net income, EBITDAX, reserve growth and specific major tasks that need to be accomplished to insure the financial health of the company. Each officer's individual goals will be set based upon those activities that they can control.
Specifically, compensation will be based upon a competitive plan but paid based upon a combination of group and individual goals that include meeting or exceeding profitability, oil and gas reserve enhancement, cash flow from operations or other goals established by the board that would enhance the value of our stock. In addition, there are certain transactional achievements that must be achieved each year to insure our financial health. For example, the Chief Financial Officer may need to renegotiate the company's lending agreement, the exploration manager needs to hire two geologists, the Chief Operating Officer needs to reduce lease operating expenses to a directed level and the Vice President of Land may need to complete the acquisition of significant leases in a targeted drilling area. Each one of the financial, operational or transactional goals will be weighted for each executive to match its/their importance.
Certain Policies of Our Executive Compensation Programs
We have adopted the following material policies relating to our executive compensation programs:
- •
- Allocation between long-term and currently paid out compensation: The compensation we currently pay consists of base pay and annual incentive compensation. The long-term compensation consists entirely of awards under our Amended and Restated 2006 Long-Term Incentive Plan. The allocation between long-term and currently paid out compensation is based on an analysis of how our peer companies use long-term and currently paid compensation to pay their executive officers.
- •
- Allocation between cash and non-cash compensation: It is our policy to allocate all currently paid compensation in the form of cash and all long-term compensation in the form of awards of options to purchase our common stock. We consider competitive market analyses when determining the allocation between cash and non-cash consideration.
- •
- Return of incentive pay: We intend to implement a policy for the adjustment or recovery of awards or payments if performance measures upon which they are based are materially restated or otherwise adjusted in a manner that will reduce the size of an award or payment. This policy will include the return by any executive officer of any compensation based upon performance measures that require material restatement because of such executive's intentional misconduct or misrepresentation.
61
Our Executive Compensation Programs
Overall, our executive compensation programs are designed to be consistent with the objectives and principals set forth above. The basic elements of our executive compensation programs are summarized in the table below, followed by a more detailed discussion of each compensation program.
| Element | Characteristics | Purpose | ||
|---|---|---|---|---|
| Base Salary | Competitive to industry | Attract and retain | ||
Incentive Bonus | Based upon performance individually and as an executive group | To motivate enhanced share value, short and long term financial growth and stability of the company | ||
Long-Term Equity Incentive Plan Awards | Based upon performance individually and as an executive group | To retain and motivate our executives over a longer term | ||
Retirement Savings Opportunity | Competitive to the industry | Enhance overall compensation package | ||
Health & Welfare Benefits | Competitive to industry | Attract and retain | ||
Other Perquisites | Competitive to the industry | Attract, retain and motivate |
All pay elements are cash-based except for the long-term equity incentive program, which is an equity-based award. We consider market pay practices and practices of peer companies in determining the amounts to be paid, what components should be paid in cash versus equity and how much of a named executive officer's compensation should be short-term versus long-term. Compensation opportunities for our executive officers, including our named executive officers, are designed to be competitive with peer companies. We believe that a substantial portion of each named executive officer's compensation should be in performance based pay.
In determining whether to increase or decrease compensation to our executive officers, including our named executive officers, we take into account annually the changes (if any) in the market pay levels based on our peer group, the contributions made by the executive officer, the performance of the executive officer, the increases or decreases in responsibilities and roles of the executive officer, the business needs of the executive officer, the transferability of managerial skills to another employer, the relevance of the executive officer's experience to other potential employers and the readiness of the executive officer to assume a more significant role with another organization.
In general, compensation or amounts realized by executives from prior compensation from us, such as gains from previously awarded stock options or options awards, are not taken into account in setting other elements of compensation, such as base pay, incentive bonuses or awards of stock options under our long-term equity incentive program. With respect to new executive officers, we take into account their prior base salary and annual cash incentives, as well as the contributions expected to be made by the new executive officer, the business needs and the role of the executive officer with us. We believe that our executive officers should be fairly compensated each year relative to market pay levels of our peer group and the internal pay levels of our executive officers.
Annual Cash Compensation
To attract and retain executives with the ability and the experience necessary to lead us and deliver strong performance to our stockholders, we provide a competitive total compensation package. Base salaries are intended to be competitive with our peer group, while total compensation is intended to
62
exceed that of our peer group, considering individual performance and experience, to ensure that each executive is appropriately compensated.
Base Salary
Annually we review salary ranges and individual salaries for our executive officers. We establish the base salary for each executive officer based in consideration of pay levels of our peer group and internal factors, such as the individual's performance and experience, and the pay of others on the executive team.
We consider market pay levels among individuals in comparable positions with transferable skills within the oil and gas industry and comparable companies in general industry. When establishing the base salary of any executive officer, we also consider business requirements for certain skills, individual experience and contributions, the roles and responsibilities of the executive and other factors. We believe competitive base salary is necessary to attract and retain an executive management team with the appropriate abilities and experience required to lead us. Approximately 25% to 45% of an executive officer's total compensation is comprised of base salary, depending on the executive's role with us.
The base salaries paid to our named executive officers are set forth below in the Summary Compensation Table. See "—Summary of Compensation."
Annual Incentive Bonuses
We provide the opportunity for our named executive officers and other executives to earn an annual cash incentive award. We provide this opportunity to attract and retain an appropriate caliber of talent for the position and to motivate executives to achieve our annual business goals. We plan to review annual cash incentive awards for our named executive officers and other executives annually in January or February to determine award payments for the last completed fiscal year, as well as to establish award opportunities for the current fiscal year.
There were no specific individual performance goals for the 2006 incentive awards, but the Compensation and Governance Committee or the board of directors may exercise discretion and take into account individual performance in determining the awards. For 2006, the incentive awards were subject to the Compensation and Governance Committee's discretion. Beginning in 2007, we may make adjustments to our overall corporate performance goals and our actual performance results that may cause differences between the numbers used for the effect of external events that are outside the control of our executives, such as natural disasters, litigation, or regulatory changes in accounting or taxation standards. These adjustments may also exclude all or a portion of both the positive or negative effect of unusual or significant strategic events that are within the control of our executives but that are undertaken with an expectation of improving our long-term financial performance, such as restructurings, acquisitions or divestitures.
Long-term Equity Incentive Compensation
We award long-term equity incentive grants to executive officers, including the named executive officers, as part of our total compensation package, under our Amended and Restated 2006 Stock Incentive Plan (the "2006 Plan").
The 2006 Plan allows for the grant of stock options, stock appreciation rights, restricted stock, stock units, unrestricted stock, dividend equivalent rights and cash awards. The primary purpose of the 2006 Plan is to enhance our ability to attract and retain highly qualified officers, directors, key employees, and other persons, and to motivate such persons to continue in our service and to expend
63
maximum effort to improve our business results and earnings, by providing to such persons an opportunity to acquire or increase a direct proprietary interest in our operations and future success.
The Compensation and Governance Committee administers the 2006 Plan and in doing so, the Compensation and Governance Committee selects participants to receive awards, determines the types of awards, the terms and conditions of the awards, and interprets the provisions of the 2006 Plan.
Other Benefits
Retirement Savings Opportunity
All employees may participate in our 401(k) Retirement Savings Plan, or 401(k) Plan, established in 2006. Each employee may make before tax contributions of up to 60% of their base salary, subject to the current Internal Revenue Service limits. We provide this 401(k) Plan to help our employees save a portion of their cash compensation for retirement in a tax efficient manner. We do not match any contributions made by our employees to the 401(k) Plan. However, we did make a discretionary contribution of $110,000 for the 2006 plan year. We also do not provide an option for our employees to invest in our stock in the 401(k) plan.
Health and Welfare Benefits
All fulltime employees, including our named executive officers, may participate in our health and welfare benefit programs; including medical, dental and vision care coverage, disability insurance and life insurance.
Other Items of Compensation
Our Chief Executive Officer participates in a plan that reimburses him for out of pocket medical costs. In addition, we pay for a life insurance policy that our Chief Executive Officer owns and directs the beneficiary. Until August 2007, our employees used credit cards issued from the personal account of our Chief Executive Officer and the award benefits of those cards inured to our Chief Executive Officer.
Our named executive officers and key employees are provided an allowance for the use of mobile phones.
Employment Agreements and Other Arrangements
We have entered into an employment agreement with T. Scott Martin, our President and Chief Executive Officer. The agreement provides for an employment term of two years ending on June 12, 2008, although it may be terminated earlier under certain circumstances. Under the terms of the agreement, Mr. Martin will receive an annual base salary of $341,000 and is eligible to receive an annual bonus, to be determined by the Compensation and Governance Committee. The employment agreement also provides that if Mr. Martin's employment is terminated by us without cause or by him for good reason, which includes our failure to perform under the agreement, he will be entitled to receive severance compensation consisting of the unpaid portion of his total base salary for the current year, an additional year's base salary and reimbursement for all unpaid travel and other business expenses.
Under the employment agreement, if benefits to which the executive becomes entitled are considered "excess parachute payments" under Section 280G of the Tax Code, then he will be entitled to an additional "gross-up" payment from us in an amount such that, after payment by the executive of all taxes, including any excise tax imposed upon the gross-up payment, he retains an amount equal to the excise tax imposed upon the payment.
64
Mr. Martin is entitled to all of the employee benefits, fringe benefits and perquisites we provide to other employees. We have not entered into an employment agreement with any other executive officer.
Prior to the close of this offering, all of our officers will sign "non-solicitation" agreements in the event of their termination of employment with us, prohibiting them from hiring any of our employees for a period of twelve months after the officer's termination.
Stock Ownership Guidelines
Stock ownership guidelines have not been implemented by the Compensation and Governance Committee for our executive officers. Until recently, our common stock was subject to a stockholders agreement that limited a stockholder's ability to transfer stock. We will continue to periodically review best practices and reevaluate our position with respect to stock ownership guidelines.
Securities Trading Policy
Our securities trading policy states that executive officers, including the named executive officers and directors, may not purchase or sell puts or calls to sell or buy our stock, engage in short sales with respect to our stock or buy our securities on margin. The purchase or sale of stock by our officers may only be made during a window of time established by the Compensation and Governance Committee with the aid of legal counsel.
Tax Deductibility of Executive Compensation
Limitations on deductibility of compensation may occur under Section 162(m) of the Internal Revenue Code which generally limits the tax deductibility of compensation paid by a public company to its Chief Executive Officer and certain other highly compensated executive officers to $1 million in the year the compensation becomes taxable to the executive officer. There is an exception to the limit on deductibility for performance based compensation that meets certain requirements.
Although deductibility of compensation is preferred, tax deductibility is not a primary objective of our compensation programs. We believe that achieving our compensation objectives set forth above is more important than the benefit of tax deductibility and we reserve the right to maintain flexibility in how we compensate our executive officers that may result in limiting the deductibility of amounts of compensation from time to time.
Conclusion
We believe the compensation we have provided to each of our executive officers is reasonable and appropriate to facilitate the achievement of our operational objectives. The compensation programs and policies that we and our Compensation and Governance Committee have designed effectively incentivize our executive officers on both a short-term and long-term basis to perform at a level necessary to achieve these objectives. The various elements of compensation combine to align the best interests of our executive officers with the best interests of our stockholders and our best interests in order to maximize shareholder value.
65
The following table shows information concerning the annual compensation for services provided to us by our Chief Executive Officer, our Chief Financial Officer and our three other most highly compensated executive officers during 2006.
| Name and Principal Position | Year | Salary | Bonus(1) | Stock Awards | Option Awards(2) | Non-Equity Incentive Plan Compensation Earnings | Change in Pension Value and Nonqualified Deferred Compensation Earnings | All Other Compensation(3) | Total | |||||||||||||||||
|---|---|---|---|---|---|---|---|---|---|---|---|---|---|---|---|---|---|---|---|---|---|---|---|---|---|---|
| T. Scott Martin Chairman, President and Chief Executive Officer | 2006 | $ | 341,000 | $ | — | $ | — | $ | 359,083 | $ | — | $ | — | $ | 16,870 | $ | 716,953 | |||||||||
Richard F. McClure Jr. Vice President of Operations and Chief Operating Officer | 2006 | $ | 185,000 | $ | 160,000 | $ | — | $ | 206,606 | $ | — | $ | — | $ | 10,057 | $ | 561,663 | |||||||||
James R. Casperson Vice President of Finance and Chief Financial Officer | 2006 | $ | 200,000 | $ | — | $ | — | $ | 165,848 | $ | — | $ | — | $ | 900 | $ | 366,748 | |||||||||
Valerie K. Walker Vice President of Exploration | 2006 | $ | 185,000 | $ | 160,000 | $ | — | $ | 206,606 | $ | — | $ | — | $ | 9,517 | $ | 561,123 | |||||||||
Jeffery S. Williams Vice President of Land and Acquisitions | 2006 | $ | 185,000 | $ | 260,000 | $ | — | $ | 165,848 | $ | — | $ | — | $ | 7,657 | $ | 618,505 | |||||||||
- (1)
- In connection with our private placement sale of 12,400,000 shares of common stock on July 12, 2006, Mr. Martin's and Mr. Casperson forfeited bonuses of $300,000 and $155,000, respectively, as the resale shelf registration was not effective within established deadlines.
- (2)
- Please see the discussion of the assumptions made in the valuation of these awards in the footnotes to the financial statements. We adopted the fair value recognition provisions of SFAS No. 123(R) effective January 1, 2006. In accordance with APB 25, we did not record any amounts in our Audited Combined Financial Statements for the year ended December 31, 2005 with respect to the awards included in this table. In accordance with the modified prospective transition method of SFAS No. 123(R), the above amounts were included as non-cash compensation expense in the September 30, 2006 Consolidated Financial Statements for Messrs. Martin, Casperson, McClure and Williams and Ms. Walker, respectively. See Note 1 "Summary of Significant Accounting Policies" contained elsewhere in this prospectus for further discussion of the accounting treatment for these options.
- (3)
- Includes all other compensation including medical reimbursements, insurance reimbursements, cell phone expenses, membership dues, and company contributions to retirement and 401(k) plans.
Grants of Plan-based Awards
During the fiscal year ended December 31, 2006, we did not make any rewards under any plan to our named executive officers.
Discussion of Summary Compensation and Plan-Based Awards Tables
Our executive compensation policies and practices, pursuant to which the compensation set forth in the Summary Compensation Table and the grants of Plan Based Awards table was paid or awarded, are described above under "Compensation Discussion and Analysis." A summary of certain material terms of our compensation plans and arrangements is set forth below.
66
Description of the Amended and Restated 2006 Long-Term Incentive Plan
Our Amended and Restated 2006 Stock Incentive Plan (the "2006 Plan") is the successor equity incentive program to our 2002 Stock Option Plan. We do not intend to make any additional grants under our 2002 Stock Option Plan. All outstanding awards under our 2002 Stock Option Plan have been transferred to our 2006 Plan; however, such awards will continue to be subject to their existing terms. The following is a summary of the 2006 Plan.
The 2006 Plan allows for the grant of stock options, stock appreciation rights, restricted stock, stock units, unrestricted stock, dividend equivalent rights and cash awards. The primary purpose of the 2006 Plan is to enhance our ability to attract and retain highly qualified officers, directors, key employees, and other persons, and to motivate such persons to continue in our service and to expend maximum effort to improve our business results and earnings, by providing to such persons an opportunity to acquire or increase a direct proprietary interest in our operations and future success. We have reserved 3,584,616 shares of common stock for issuance under the 2006 Plan, including the 2.7 million shares of common stock subject to options outstanding prior to the adoption of the 2006 Plan.
Administration. The 2006 Plan provides for administration by our board of directors or otherwise by a compensation committee or other committee of our board of directors. Subject to the terms of the 2006 Plan, our board of directors or the committee administering the 2006 Plan may select participants to receive awards, determine the types of awards and terms and conditions of awards and interpret provisions of the 2006 Plan. Currently, the 2006 Plan is administered by the Compensation and Governance Committee.
Common Stock Reserved for Issuance under the 2006 Plan. Our common stock issued or to be issued under the 2006 Plan consists of authorized but unissued shares and issued shares that we have reacquired. If any shares covered by an award are not purchased or are forfeited, or if an award otherwise terminates without delivery of any common stock, then the number of shares of common stock counted against the aggregate number of shares available under the 2006 Plan with respect to the award will, to the extent of any such forfeiture or termination, again be available for making awards under the 2006 Plan.
Eligibility. Awards may be made under the 2006 Plan to our employees and consultants, including any such employee who is an officer or director, and to any other individual whose participation in the 2006 Plan is determined by our board of directors to be in our best interest.
Amendment or Termination of the 2006 Plan. Our board of directors may amend, suspend or terminate the 2006 Plan at any time and for any reason. The 2006 Plan shall terminate in any event ten years after the date of its adoption by the board. Amendments to the 2006 Plan will be submitted for stockholder approval to the extent stated by the board of directors, required by the Internal Revenue Code of 1986 or other applicable law or required by applicable stock exchange listing requirements. In addition, an amendment to the 2006 Plan will be contingent on stockholder approval if the amendment would materially increase the benefits accruing to participants under the 2006 Plan, materially increase the aggregate number of shares of common stock that may be issued under the 2006 Plan or materially modify the requirements as to eligibility for participation in the 2006 Plan.
Options. The 2006 Plan permits the granting of options to purchase shares of common stock intended to qualify as incentive stock options under the Internal Revenue Code and stock options that do not qualify as incentive stock options. The exercise price of each stock option may not be less than 100% of the fair market value of the common stock on the date of grant. In the case of certain 10% stockholders who receive incentive stock options, the exercise price may not be less than 110% of the fair market value of the common stock on the date of grant. An exception to these requirements is made for options that we grant in substitution for options held by employees of companies that we
67
acquire. In such a case the exercise price is adjusted to preserve the economic value of the employee's stock option from his or her former employer.
The term of each stock option is fixed at the time of grant and may not exceed 10 years from the date of grant. The board of directors or committee administering the 2006 Plan determines at what time or times each option may be exercised and the period of time, if any, after retirement, death, disability or termination of employment during which options may be exercised. Options may be made exercisable in installments. The exercisability of options may be accelerated by our board of directors or committee administering the 2006 Plan.
In general, an optionee may pay the exercise price of an option in cash or in cash equivalents, by tendering shares of common stock to the extent provided in an award agreement, by means of a broker-assisted cashless exercise to the extent provided in an award agreement and permitted by applicable law or as otherwise provided in an award agreement and permitted by applicable law.
Stock options granted under the 2006 Plan may not be sold, transferred, pledged or assigned other than by will or under applicable laws of descent and distribution. However, we may permit in an award agreement the limited transfers of non-qualified options for the benefit of family members of grantees.
Other Awards. The 2006 Plan permits the granting of the following additional types of awards:
- •
- shares of unrestricted stock, which are shares of common stock at no cost or for a purchase price and are free from any restrictions under the 2006 Plan. Unrestricted shares of common stock may be issued to participants in recognition of past services or other valid consideration, and may be issued in lieu of cash compensation to be paid to participants;
- •
- shares of restricted stock, which are shares of common stock subject to restrictions;
- •
- stock units, which are common stock units subject to restrictions;
- •
- dividend equivalent rights, which are rights entitling the recipient to receive credits for dividends that would be paid if the recipient had held a specified number of shares of common stock;
- •
- stock appreciation rights, which are rights to receive a number of shares or, in the discretion of the administrator, an amount in cash or a combination of shares and cash, based on the increase in the fair market value of the shares underlying the rights during a specified period of time;
- •
- performance and annual incentive awards, ultimately payable in common stock or cash, as determined by the board or committee administering the 2006 Plan. Multi-year and annual incentive awards may be subject to achievement of specified goals tied to business criteria, as described below. The board or committee administering the 2006 Plan may specify the amount of the incentive award as a percentage of these business criteria, a percentage in excess of a threshold amount or as another amount which need not bear a strictly mathematical relationship to these business criteria. The board or committee administering the 2006 Plan may modify, amend or adjust the terms of each award and performance goal. Awards to individuals who are covered under Section 162(m) of the Internal Revenue Code, or who are likely to be covered in the future, will comply with the requirement that payments to such employees qualify as performance-based compensation under Section 162(m) of the Internal Revenue Code to the extent that the board or committee administering the 2006 Plan so designates. Such employees include the Chief Executive Officer and the four highest compensated executive officers (other than the Chief Executive Officer) determined at the end of each year.
Minimum Vesting for restricted stock and stock unit. The 2006 Plan provides that restricted stock and stock units that vest solely by the passage of time may vest in no less than three years from the grant date and restricted stock and stock units for which vesting may be accelerated by achieving performance targets may vest in no less than one year from the date of grant.
68
Section 162(m) of the Internal Revenue Code. Section 162(m) of the Internal Revenue Code limits publicly-held companies to an annual deduction for federal income tax purposes of $1 million for compensation paid to their covered employees. However, performance-based compensation is excluded from this limitation. The 2006 Plan is designed to permit us to grant awards that qualify as performance-based for purposes of satisfying the conditions of Section 162(m).
To qualify as performance-based:
- (i)
- the compensation must be paid solely on account of the attainment of one or more pre-established, objective performance goals;
- (ii)
- the performance goal under which compensation is paid must be established by a compensation committee comprised solely of two or more directors who qualify as "outside directors" for purposes of the exception;
- (iii)
- the material terms under which the compensation is to be paid must be disclosed to and subsequently approved by stockholders of the corporation before payment is made in a separate vote; and
- (iv)
- the compensation committee must certify in writing before payment of the compensation that the performance goals and any other material terms were in fact satisfied.
In the case of compensation attributable to stock options, the performance goal requirement (summarized in (i) above) is deemed satisfied, and the certification requirement (summarized in (iv) above) is inapplicable, if the grant or award is made by the compensation committee of the board of directors; the plan under which the option is granted states the maximum number of shares with respect to which options may be granted during a specified period to an employee; and under the terms of the option, the amount of compensation is based solely on an increase in the value of the common stock after the date of grant.
Under the 2006 Plan, one or more of the following business criteria, on a consolidated basis, and/or with respect to specified subsidiaries or business units, except with respect to the total stockholder return and earnings per share criteria, will be used exclusively by the compensation committee in establishing performance goals:
- •
- total stockholder return;
- •
- such total stockholder return as compared to total return (on a comparable basis) of a publicly available index such as the Standard & Poor's 500 Stock Index;
- •
- net income;
- •
- pretax earnings;
- •
- earnings before interest expense, taxes, depreciation and amortization;
- •
- pretax operating earnings after interest expense and before bonuses, service fees and extraordinary or special items;
- •
- value of oil and gas reserves;
- •
- earnings per share;
- •
- return on equity;
- •
- return on capital;
- •
- return on investment;
- •
- operating earnings;
69
- •
- working capital;
- •
- ratio of debt to stockholders' equity; and
- •
- revenue.
Business criteria may be measured on a GAAP or non-GAAP basis.
Under the Internal Revenue Code, a director is an "outside director" of a company if he or she is not a current employee of that company; is not a former employee who receives compensation for prior services (other than under a qualified retirement plan); has not been an officer of the company; and does not receive, directly or indirectly (including amounts paid to an entity that employs the director or in which the director has at least a five percent ownership interest), remuneration from the company in any capacity other than as a director.
The maximum number of shares of common stock subject to options or stock appreciation rights that can be awarded under the 2006 Plan to any person is 333,333 per year. The maximum number of shares of common stock that can be awarded under the 2006 Plan to any person, other than pursuant to an option or a stock appreciation rights, is 333,333 per year. The maximum amount that may be earned as an annual incentive award or other cash award in any calendar year by any one person is $2 million, and the maximum amount that may be earned as a performance award or other cash award in respect of a performance period by any one person is $5 million.
Adjustments for Stock Dividends and Similar Events. We may make appropriate adjustments in outstanding awards and the number of shares available for issuance under the 2006 Plan, including the individual limitations on awards, to reflect recapitalizations, reclassifications, stock spits, reverse splits, stock dividends and other similar events.
Effect of Certain Corporate Transactions. Certain change of control transactions involving us, such as the sale of our company, may cause awards granted under the 2006 Plan to vest, unless the awards are continued or substituted for in connection with the change of control transaction.
70
Outstanding Equity Awards at Fiscal Year-end
The following table summarizes the number of securities underlying outstanding plan awards for each named executive officer as of December 31, 2006.
| | Option Awards | Stock Awards | |||||||||||||||||||
|---|---|---|---|---|---|---|---|---|---|---|---|---|---|---|---|---|---|---|---|---|---|
| | | | | | | | | | Equity Incentive Plan Awards: Market or Payout Value of Unearned Shares, Units or Other Rights That Have Not Vested | ||||||||||||
| | | | | | | | | Equity Incentive Plan Awards: Number of Unearned Shares, Units or Other Rights That Have Not Vested | |||||||||||||
| | | | Equity Incentive Plan Awards: Number of Securities Underlying Unexercised Unearned Options | | | | | ||||||||||||||
| | Number of Securities Underlying Unexercised Options | Number of Securities Underlying Unexercised Options | | | | Market Value of Shares or Units of Stock That Have Not Vested | |||||||||||||||
| | | | Number of Shares of Units of Stock That Have Not Vested | ||||||||||||||||||
| Name | Option Exercise Price | Option Expiration Date | |||||||||||||||||||
| Exercisable | Unexercisable | ||||||||||||||||||||
| T. Scott Martin Chairman, President and Chief Executive Officer | 269,736 109,244 80,112 191,019 | — — 7,283 213,491 | — | $ $ $ $ | 1.24 2.47 2.47 4.94 | June 2009 September 2010 April 2011 July 2012 | — | $ | — | — | $ | — | |||||||||
Richard F. McClure Jr. Vice President of Operations and Chief Operating Officer | 202,304 30,265 22,194 114,611 | — — 2,018 128,095 | — | $ $ $ $ | 1.24 2.47 2.47 4.94 | June 2009 September 2010 April 2011 July 2012 | — | $ | — | — | $ | — | |||||||||
James R. Casperson Vice President of Finance and Chief Financial Officer | 95,509 | 106,746 | — | $ | 4.94 | July 2012 | — | $ | — | — | $ | — | |||||||||
Valerie K. Walker Vice President of Exploration | 89,912 142,657 22,194 114,611 | — — 2,018 128,095 | — | $ $ $ $ | 1.24 2.47 2.47 4.94 | June 2009 September 2010 April 2011 July 2012 | — | $ | — | — | $ | — | |||||||||
Jeffery S. Williams Vice President of Land and Acquisitions | 95,509 | 106,746 | — | $ | $4.94 | July 2012 | — | $ | — | — | $ | — | |||||||||
Option Exercises
Our named executive officers did not exercise any stock options in 2006.
Pension Benefits
We do not have any plan that provides for payments or other benefits at, following, or in connection with, retirement.
Non-Qualified Deferred Compensation
We do not have any plan that provides for the deferral of compensation on a basis that is not tax qualified.
71
Director Compensation
The following table summarizes compensation that our directors earned during 2006 for services as members of our Board.
| Name | Fees Earned or Paid in Cash(1) | Stock Awards | Option Awards | Non-Equity Incentive Plan Compensation | Change in Pension Value and Nonqualified Deferred Compensation Earnings | All Other Compensation | Total | ||||||||||||||
|---|---|---|---|---|---|---|---|---|---|---|---|---|---|---|---|---|---|---|---|---|---|
| T. Scott Martin | $ | — | $ | — | $ | — | $ | — | $ | — | $ | — | $ | — | |||||||
| Cortlandt S. Dietler | $ | 23,000 | $ | — | $ | — | $ | — | $ | — | $ | — | $ | 23,000 | |||||||
| Bryan H. Lawrence | $ | — | $ | — | $ | — | $ | — | $ | — | $ | — | $ | — | |||||||
| Peter A. Leidel | $ | — | $ | — | $ | — | $ | — | $ | — | $ | — | $ | — | |||||||
| Sheldon B. Lubar | $ | 23,625 | $ | — | $ | — | $ | — | $ | — | $ | — | $ | 23,625 | |||||||
| Neil L. Stenbuck | $ | 24,250 | $ | — | $ | — | $ | — | $ | — | $ | — | $ | 24,250 | |||||||
| James B. Wallace | $ | 23,000 | $ | — | $ | — | $ | — | $ | — | $ | — | $ | 23,000 | |||||||
| George A. Wiegers | $ | 23,000 | $ | — | $ | — | $ | — | $ | — | $ | — | $ | 23,000 | |||||||
- (1)
- No fees were paid to any members of the Board of Directors during 2006. However, earned fees will be included in amounts paid during 2007.
Discussion of Director Compensation Table
Historically, our directors have not received any compensation for serving on our board, although we did reimburse directors for expenses incurred in connection with attendance at meetings of the board of directors. After June 30, 2006, we began accruing for each non-employee member of our board of directors compensation for service on our board of directors and committees thereof. Non-employee and non-Yorktown Energy Partners directors receive $80,000 per year in shares of our common stock or cash, at the election of each director, plus meeting expenses of $2,000 per board and $1,000 per committee meeting. The chairman of the audit committee and the compensation and governance committee receive $5,000 and $2,500, respectively.
Employee directors do not receive compensation for service on our board of directors. All directors are reimbursed for reasonable out-of-pocket expenses incurred in attending meetings of the board or committees and for other reasonable expenses incurred in connection with service on the board and any committee.
Potential Payments Upon Termination or Change in Control
We have entered into an employment agreement with T. Scott Martin, our President and Chief Executive Officer. Under the terms of the agreement, Mr. Martin receives an annual base salary of $341,000 and is eligible to receive an annual bonus, to be determined by our outside directors or otherwise by a board committee. The employment agreement also provides that if Mr. Martin's employment is terminated by us without cause or by the executive for good reason, which includes our failure to perform under the agreement, he will be entitled to receive severance compensation consisting of the unpaid portion of his total base salary for the current year, an additional year's base salary and reimbursement for all unpaid travel and other business expenses. A change of control does not affect the amount or timing of these cash severance payments.
We are not obligated to make any cash payments to any other named executive officer if their employment is terminated by us or by the executive. No severance benefits are provided for any of the named executive officers in the event of death or disability. A change of control does not affect the amount of timing of these cash severance payments.
72
SECURITY OWNERSHIP OF CERTAIN BENEFICIAL OWNERS AND MANAGEMENT
The following table sets forth certain information regarding the beneficial ownership of our common stock as of June 30, 2007, by (i) each person who, to our knowledge, beneficially owns more than 5% of our common stock; (ii) each of our directors and executive officers; and (iii) all of our executive officers and directors as a group, before our initial public offering and after the completion of our initial public offering. The table showing the percentage of shares beneficially owned after the offering assumes the sale of 8,000,000 shares of our common stock by us in our initial public offering.
| | | Percentage of Shares Beneficially Owned(2) | |||||
|---|---|---|---|---|---|---|---|
| | Shares of Ellora Common Stock Beneficially Owned(1) | ||||||
| Name and Address of Beneficial Owner | Before Offering | After Offering | |||||
| Bryan H. Lawrence(3)(4) | 27,462,159 | 61.2 | % | 52.0 | % | ||
| Peter A. Leidel(3)(4) | 27,462,159 | 61.2 | % | 52.0 | % | ||
| Yorktown Energy Partners V, L.P.(3) | 21,039,278 | 46.9 | % | 39.8 | % | ||
| Yorktown Energy Partners VI, L.P.(3) | 6,422,881 | 14.3 | % | 12.2 | % | ||
| T. Scott Martin(5)(6) | 2,036,239 | 4.5 | % | 3.8 | % | ||
| Sheldon B. Lubar(7) | 1,815,080 | 4.0 | % | 3.4 | % | ||
| Valerie K. Walker(5)(8) | 687,206 | 1.5 | % | 1.3 | % | ||
| Richard F. McClure Jr.(5)(9) | 687,206 | 1.5 | % | 1.3 | % | ||
| James R. Casperson(5)(10) | 384,602 | * | % | * | % | ||
| George A. Wiegers(5) | 166,667 | * | % | * | % | ||
| Jeffery S. Williams(5)(11) | 140,454 | * | % | * | % | ||
| James B. Wallace(5)(12) | 16,667 | * | % | * | % | ||
| Cortlandt S. Dietler(5) | 8,333 | * | % | * | % | ||
| Neil L. Stenbuck(5) | — | * | % | * | % | ||
| All officers and directors as a group (12 persons) | 33,404,613 | 71.5 | % | 61.0 | % | ||
- *
- Less than one percent.
- (1)
- Unless otherwise indicated, all shares of stock are held directly with sole voting and investment power.
- (2)
- For purposes of calculating the percent of the class outstanding held by each owner shown above with a right to acquire additional shares, the total number of shares excludes the shares which all other persons have the right to acquire within 60 days after the date of this prospectus, pursuant to the exercise of outstanding stock options and warrants.
- (3)
- Has a principal business address of 410 Park Avenue, Suite 1900, New York, New York 10022.
- (4)
- Includes attribution of shares held by Yorktown Energy Partners V, L.P. and Yorktown Energy Partners VI, L.P.
- (5)
- Has a principal business address of c/o Ellora Energy Inc., 5665 Flatiron Parkway, Boulder, Colorado 80301.
- (6)
- Includes options to purchase up to 747,287 shares of common stock, which are exercisable within 60 days from the date of this prospectus.
- (7)
- Has a principal business address of 700 N. Water Street, Suite 1200, Milwaukee, Wisconsin 53202.
- (8)
- Includes options to purchase up to 425,327 shares of common stock, which are exercisable within 60 days from the date of this prospectus.
- (9)
- Includes options to purchase up to 425,327 shares of common stock, which are exercisable within 60 days from the date of this prospectus.
- (10)
- Includes options to purchase up to 140,454 shares of common stock, which are exercisable within 60 days from the date of this prospectus.
- (11)
- Includes options to purchase up to 140,454 shares of common stock, which are exercisable within 60 days from the date of this prospectus.
- (12)
- Includes 12,500 shares of common stock held by a limited liability company under the control of Mr. Wallace and for which he holds voting and dispositive power.
73
CERTAIN RELATIONSHIPS AND RELATED PARTY TRANSACTIONS
We have entered into an employment agreement with T. Scott Martin, our Chairman, President and Chief Executive Officer. See "Executive Compensation—Employment Agreements and Other Arrangements" for a detailed description of this agreement. Additionally, we will enter into indemnification agreements with the members of our board of directors.
Ellora was formed in June 2002 through the issuance of approximately 16.2 million shares of common stock for cash consideration of $20 million to Yorktown Energy Partners V, L.P., our controlling stockholder, which was organized to make direct investments in the energy industry on behalf of certain institutional investors, and the issuance of approximately 4.1 million shares of common stock to certain of our executive officers for $1,167 in cash, notes receivable in the amount of $1,667,000, and certain other contributed property pursuant to the terms of a contribution agreement among us, Yorktown, certain of our executive officers, and other investors. The notes issued to us by certain of our executive officers were full recourse, earned interest at an annual rate of 6%, and matured on the earlier of June 7, 2009 or three months after the holder ceased to be employed by us. Their notes receivable are shown in our financial statements as a reduction in stockholders' equity. The note holders repaid these notes with interest upon the closing of the private equity offering in the third quarter of 2006. Ellora Oil & Gas Inc. was formed in 2005 and issued shares of its common stock for cash consideration of $40 million to Yorktown Energy Partners VI, L.P., which received approximately 8,000,000 post-split shares of our common stock upon completion of the Merger.
On April 15, 2004, we purchased the interests held by Durango Connection Pipeline in English Bay for approximately $6.7 million in cash. English Bay Pipeline, L.P. is now our wholly owned subsidiary. The valuation of Durango Connection Pipeline's partnership interest in English Bay was determined by arm's length negotiations between us and Mr. Allen Born, the owner of 100% of Durango Connection Pipeline, and we believe the terms of the acquisition were commensurate with the terms of a third-party oil and gas industry arrangement. At the time of the acquisition, Mr. Born was a stockholder and member of our board of directors. The terms of the transaction were approved by all of the independent members of our board of directors.
On August 29, 2005 we acquired interests in oil and gas properties in Shelby County, Texas from Durango Connection LLLP for $26 million in cash. Durango Connection LLLP was owned 99% by Mr. Allen Born at the time of the acquisition. The valuation of the purchased Shelby County oil and gas interests held by Durango Connection LLLP was determined by arms-length negotiations between us and Mr. Born, and the terms of the acquisition were commensurate with the terms of a third-party oil and gas industry arrangement. At the time of the acquisition, Mr. Born was a stockholder and member of our board of directors. The terms of the transaction were approved by all of the independent members of our board of directors.
On June 1, 2004, we entered into a joint venture agreement with Centurion Exploration Company, pursuant to which we paid Centurion $1.25 million for the right to participate in all prospects that Centurion generates through September 2007. As of August 6, 2007, we had participated in five wells with Centurion. The joint venture agreement was negotiated at arm's length between us and Centurion. At the time we entered into the joint venture agreement and at the time the abovementioned wells were drilled, T. Scott Martin was a member of the board of directors of Centurion, in which an affiliate of Yorktown owns a controlling interest. The terms of the transaction were approved by all of the independent members of our board of directors. Mr. Martin has resigned from the board of directors of Centurion. In December 2006, we sold our interest in the Centurion Joint Venture and our interest in certain minor wells drilled by Centurion in East Texas for approximately $2,600,000.
74
Procedures for Approval of Related Person Transactions
In the event that a related party transaction is identified, such transaction must be reviewed and approved by our Chief Executive Officer or other members of management, our board of directors or the independent members of our board of directors, depending on the parties involved and the terms of the proposed transaction. Additionally, related party transactions cannot be approved by our Chief Executive Officer or other members of management or a member of our board of directors if they are a party to the transaction. In such instance, an unrelated party must approve that particular related party transaction.
75
This prospectus covers shares sold in our recent private equity offering to "accredited investors" as defined by Rule 501(a) under the Securities Act pursuant to an exemption from registration provided in Regulation D, Rule 506 under Section 4(2) of the Securities Act, "qualified institutional buyers," as defined by Rule 144A under the Securities Act, and to non-U.S. persons pursuant to Regulation S under the Securities Act. The selling stockholders who purchased shares from us and the initial purchaser in the private equity offering (and their transferees) may from time to time offer and sell under this prospectus any or all of the shares listed opposite each of their names below. We are required to register for resale the shares of our common stock described in the table below.
The following table sets forth information about the number of shares owned by each selling stockholder that may be offered from time to time under this prospectus. Certain selling stockholders may be deemed to be "underwriters" as defined in the Securities Act. Any profits realized by the selling stockholder may be deemed to be underwriting commissions.
The table below has been prepared based upon the information furnished to us by the selling stockholders as of August 1, 2007. The selling stockholders identified below may have sold, transferred, or otherwise disposed of some or all of their shares since the date on which the information in the following table is presented in transactions exempt from or not subject to the registration requirements of the Securities Act. Information concerning the selling stockholders may change from time to time and, if necessary, we will amend or supplement this prospectus accordingly. We cannot give an estimate as to the amount of shares of common stock that will be held by the selling stockholders upon termination of this offering because the selling stockholders may offer some or all of their common stock under the offering contemplated by this prospectus. The total number of shares that may be sold hereunder will not exceed the number of shares offered hereby. Please read "Plan of Distribution."
The following table sets forth the name of each selling stockholder, the nature of any position, office, or other material relationship, if any, which the selling stockholder has had with us or any of our predecessors or affiliates within the past three years, and the number of shares of our common stock owned by such stockholder prior to the offering. We have assumed all shares reflected on the table will be sold from time to time.
| Selling Stockholder(1): | Number of Shares of Common Stock Owned Prior to the Offering(2) | Number of Shares of Common Stock Being Offered Hereby | Number of Shares of Common Stock Owned After Completion of the Offering | Percentage of Common Stock Owned After Completion of the Offering | |||||
|---|---|---|---|---|---|---|---|---|---|
| A. Albinsson & M. Wahlstrom(3) | 14,000 | 14,000 | — | * | |||||
| A. Laurence & Helayne B. Jones(3) | 4,000 | 4,000 | — | * | |||||
| A&C Tank Sales Company, Inc(4) | 4,000 | 4,000 | — | * | |||||
| Adair Group, Inc.(3) | 2,500 | 2,500 | — | * | |||||
| AGS Investments, LLC(3) | 4,000 | 4,000 | — | * | |||||
| Allison B. Weiss Irrevocable Trust dated 5/12/1998(5) | 66,667 | 66,667 | — | * | |||||
| Andrea Singer Pollack 1975 Revocable Trust(3) | 9,400 | 9,400 | — | * | |||||
| Andrea Singer Pollack Revocable Trust(3) | 18,400 | 18,400 | — | * | |||||
| Anima SGR SA(6) | 175,000 | 175,000 | — | * | |||||
| Anthony G. Perry IRA(3) | 9,500 | 9,500 | — | * | |||||
| BBT Fund, L.P.(7) | 118,000 | 118,000 | — | * | |||||
| Bear Stearns SEC Corp FBO J. Steven Emerson, IRA R/O II(8) | 300,000 | 300,000 | — | * | |||||
76
| Bennett Family LLC(9) | 4,166 | 4,166 | — | * | |||||
| Blue Ridge Investments, Inc.(10) | 1,600 | 1,600 | — | * | |||||
| Brian & Kelly Wilmovsky | 2,000 | 2,000 | — | * | |||||
| Brownlie Family Partnership(3) | 5,000 | 5,000 | — | * | |||||
| Bruce E. Dines IRA(3) | 12,000 | 12,000 | — | * | |||||
| CAP Fund, L.P.(11) | 58,000 | 58,000 | — | * | |||||
| Celeste C. Grynberg(3) | 13,000 | 13,000 | — | * | |||||
| Champagne Capital SAS(12) | 8,000 | 8,000 | — | * | |||||
| Cintra Pollack 1993 Trust(3) | 4,500 | 4,500 | — | * | |||||
| Clinton Multistrategy Master Fund, Ltd.(13) | 1,250,000 | 1,250,000 | — | * | |||||
| CNF Investments II, LLC(14) | 25,000 | 25,000 | — | * | |||||
| Coleman Family Revocable Trust(15) | 4,000 | 4,000 | — | * | |||||
| Cortlandt S. Dietler | 8,333 | 8,333 | — | * | |||||
| Credit Suisse Client Nominees (UK) Ltd.(16) | 30,000 | 30,000 | — | * | |||||
| Cumber International S.A.(17) | 112,850 | 112,850 | — | * | |||||
| Cumberland Benchmarked Partners, L.P.(17) | 270,740 | 270,740 | — | * | |||||
| Cumberland Long Partners, L.P.(17) | 1,050 | 1,050 | — | * | |||||
| Cumberland Partners(17) | 458,570 | 458,570 | — | * | |||||
| David & Sharon Neenan(3) | 4,000 | 4,000 | — | * | |||||
| David G. Neenan Keogh(3) | 2,000 | 2,000 | — | * | |||||
| Davis Brothers Limited Partnership II(18) | 4,000 | 4,000 | — | * | |||||
| Douglass H. & Gail D. Manuel | 6,250 | 6,250 | — | * | |||||
| Douglass H. McCorkindale | 8,333 | 8,333 | — | * | |||||
| Doyle Family Trust(19) | 3,000 | 3,000 | — | * | |||||
| Drake Associates, L.P.(20) | 75,000 | 75,000 | — | * | |||||
| Edward Im & Jill Im | 2,000 | 2,000 | — | * | |||||
| Edward A. Fox IRA | 8,333 | 8,333 | — | * | |||||
| Edward M. Giles | 18,000 | 18,000 | — | * | |||||
| Epstein Combined Holdings, LLC(21) | 8,300 | 8,300 | — | * | |||||
| Eric W. Reimers & Marcia Reimers | 8,000 | 8,000 | — | * | |||||
| Estate of Joseph Bander(3) | 1,500 | 1,500 | — | * | |||||
| Fidelity Advisor Series 1: Fidelity Advisor Balanced(22) | 106,700 | 106,700 | — | * | |||||
| Fidelity Puritan Trust: Fidelity Balanced Fund(22) | 1,529,700 | 1,529,700 | — | * | |||||
| Flanagan Family Limited Partnership(23) | 8,333 | 8,333 | — | * | |||||
| Francis E. Belmont | 2,000 | 2,000 | — | * | |||||
| Frank B. Day(3) | 23,500 | 23,500 | — | * | |||||
| Frank B. Day CRT(3) | 1,400 | 1,400 | — | * | |||||
| Frank Day Lead Annuity Trust(3) | 1,400 | 1,400 | — | * | |||||
| G. Hall & Kathleen Martin | 10,000 | 10,000 | — | * | |||||
77
| George Weiss Associates Profit Sharing Plan(24) | 200,000 | 200,000 | — | * | |||||
| Georgetown Preparatory School, Inc.(25) | 8,333 | 8,333 | — | * | |||||
| Gina R. Day(3) | 10,000 | 10,000 | — | * | |||||
| Gina R. Day CRT(3) | 14,000 | 14,000 | — | * | |||||
| GJ Vogel, Inc. Profit Sharing Plan(26) | 1,600 | 1,600 | — | * | |||||
| GLG North American Opportunity Fund(27) | 1,041,666 | 1,041,666 | — | * | |||||
| Global Energy Opportunity Fund Ltd(28) | 1,000 | 1,000 | — | * | |||||
| Global Energy Opportunity Partners LP(28) | 5,333 | 5,333 | — | * | |||||
| Grandview, LLC(29) | 500,000 | 500,000 | — | * | |||||
| Grey K Fund LP(30) | 24,000 | 24,000 | — | * | |||||
| Grey K Offshore Fund LTD(31) | 42,667 | 42,667 | — | * | |||||
| Harbor Advisors, LLC FBO A/C Butterfield Bermuda General Account(32) | 30,000 | 30,000 | — | * | |||||
| Hard Assets 2X Master Fund Ltd(28) | 380,000 | 380,000 | — | * | |||||
| Hard Assets Partners LP(28) | 39,000 | 39,000 | — | * | |||||
| Hard Assets Portfolio Ltd(28) | 411,000 | 411,000 | — | * | |||||
| Harley G. Higbie, III(3) | 3,000 | 3,000 | — | * | |||||
| Harley G. Higbie, Jr.(3) | 7,000 | 7,000 | — | * | |||||
| HedgEnergy Master Fund LP(33) | 300,000 | 300,000 | — | * | |||||
| HFR HE Platinum Master Trust(17) | 23,060 | 23,060 | — | * | |||||
| Hildreth D. Wold(3) | 2,700 | 2,700 | — | * | |||||
| IOU Limited Partnership(34) | 150,000 | 150,000 | — | * | |||||
| J. Anthony & Phyllis K. Syme | 4,166 | 4,166 | — | * | |||||
| Jack Wold Family Partnership(3) | 2,900 | 2,900 | — | * | |||||
| Jeffrey T. Neal | 4,100 | 4,100 | — | * | |||||
| James B. Wallace | 4,167 | 4,167 | — | * | |||||
| James Locke & Susan Locke Tenants in the Entirety | 20,000 | 20,000 | — | * | |||||
| Jay S. Weiss | 8,300 | 8,300 | — | * | |||||
| Jennifer B. Lynn | 2,000 | 2,000 | — | * | |||||
| Jerry Armstrong(3) | 7,000 | 7,000 | — | * | |||||
| John & Mary Ann Duffey(3) | 5,200 | 5,200 | — | * | |||||
| John D. Reilly | 8,300 | 8,300 | — | * | |||||
| John Duffey IRA(3) | 3,000 | 3,000 | — | * | |||||
| John E. Freyer(3) | 6,000 | 6,000 | — | * | |||||
| John M. & Marcella F. Fox(3) | 7,000 | 7,000 | — | * | |||||
| John P. Wold(3) | 7,700 | 7,700 | — | * | |||||
| Johnson Revocable Living Trust dated 5/18/98(35) | 7,916 | 7,916 | — | * | |||||
| Joseph Werner | 12,500 | 12,500 | — | * | |||||
| John Whalen & Linda D. Rabbitt | 4,166 | 4,166 | — | * | |||||
78
| Joyce Buchman & Joel Buchman JTWROS | 8,000 | 8,000 | — | * | |||||
| Juan Piedra(3) | 1,000 | 1,000 | — | * | |||||
| Karen Ray Shay IRA(3) | 6,200 | 6,200 | — | * | |||||
| Keegan Family Trust(36) | 10,000 | 10,000 | — | * | |||||
| Kenmont Special Opportunities Master, L.P.(37) | 78,000 | 78,000 | — | * | |||||
| KO-OP XXVI Wood, LLC(3) | 10,000 | 10,000 | — | * | |||||
| Lansing Family Trust(38) | 8,000 | 8,000 | — | * | |||||
| Lee A. Alexander | 4,100 | 4,100 | — | * | |||||
| LeRoy Eakin III & Lindsay Eakin, JTBE | 6,250 | 6,250 | — | * | |||||
| Linda Stone | 30,000 | 30,000 | — | * | |||||
| Lolita Higbie Living Trust(3) | 3,300 | 3,300 | — | * | |||||
| Long View Partners B, L.P.(17) | 93,900 | 93,900 | — | * | |||||
| Lubar Nominees General Partnership(39) | 1,815,080 | 35,000 | 1,780,080 | 3.97 | % | ||||
| Man Mac Miesque 10B Ltd.(37) | 52,000 | 52,000 | — | * | |||||
| Mary Ann Duffey IRA(3) | 1,800 | 1,800 | — | * | |||||
| Michael E. Heijer | 2,000 | 2,000 | — | * | |||||
| Michael J. & Susan Darby | 4,100 | 4,100 | — | * | |||||
| Mutual of America Institutional Funds, Inc. All America Fund(40) | 3,000 | 3,000 | — | * | |||||
| Mutual of America Institutional Funds, Inc. Aggressive Equity Fund(40) | 5,400 | 5,400 | �� | — | * | ||||
| Mutual of America Investment Corp. All America Fund(41) | 21,800 | 21,800 | — | * | |||||
| Mutual of America Investment Corp. Small Cap Value Fund(41) | 119,800 | 119,800 | — | * | |||||
| Nadine Grelsamer | 3,000 | 3,000 | — | * | |||||
| Noah S. Pollack Revocable Trust(3) | 1,500 | 1,500 | — | * | |||||
| Noah Singer Pollack 1993 Trust(3) | 4,300 | 4,300 | — | * | |||||
| Park West Investors LLC(42) | 150,738 | 150,738 | — | * | |||||
| Park West Partners International, Ltd.(42) | 32,562 | 32,562 | — | * | |||||
| Perennial Partners, LP(43) | 100,000 | 100,000 | — | * | |||||
| Peter B. Cannell | 25,000 | 25,000 | — | * | |||||
| Peterson Investment Trust UAD 4/2/01(44) | 333,333 | 333,333 | — | * | |||||
| Potato Patch I LP(3) | 10,000 | 10,000 | — | * | |||||
| R. Patrick & Shelly L. McGinley | 2,400 | 2,400 | — | * | |||||
| Rachel S. Grynberg Trust(3) | 1,000 | 1,000 | — | * | |||||
| Rachel S. Grynberg Trust U/A dated 4/21/82(3) | 3,500 | 3,500 | — | * | |||||
| Ray O. Brownlie(3) | 10,000 | 10,000 | — | * | |||||
| Richard S. Bodman Revocable Trust, dated 9/1/1998(45) | 6,250 | 6,250 | — | * | |||||
79
| Robert H. Smith | 9,000 | 9,000 | — | * | |||||
| Sara F. Hayes | 10,000 | 10,000 | — | * | |||||
| Shay Enterprises, LLLP(3) | 4,400 | 4,400 | — | * | |||||
| SRI Fund, L.P.(46) | 24,000 | 24,000 | — | * | |||||
| Steuart Investment Company(47) | 33,333 | 33,333 | — | * | |||||
| Summer Street Cumberland Investors, LLC(18) | 39,830 | 39,830 | — | * | |||||
| Teressa Giguere Perry(3) | 7,000 | 7,000 | — | * | |||||
| The Neenan Family LLLP(3) | 3,000 | 3,000 | — | * | |||||
| The Northwestern Mutual Life Insurance Company(48) | 833,333 | 833,333 | — | * | |||||
| Timothy B. Marz & Jane F. Matz JTWROS(49) | 1,000 | 1,000 | — | * | |||||
| Tivoli Partners L.P.(50) | 20,000 | 20,000 | — | * | |||||
| Trousil & Associates, Inc.(3) | 24,500 | 24,500 | — | * | |||||
| Twin Bridges, LLC(51) | 12,500 | 12,500 | — | * | |||||
| United Capital Management, Inc.(52) | 20,833 | 20,833 | — | * | |||||
| UWM Foundation, Inc.(53) | 20,000 | 20,000 | — | * | |||||
| Van Eck Global Hard Assets(54) | 369,000 | 369,000 | — | * | |||||
| Variable Insurance Products Fund III: Balanced Portfolio(22) | 30,267 | 30,267 | — | * | |||||
| Wallace F. Holladay, Jr. | 4,166 | 4,166 | — | * | |||||
| Wallace Family Partnership(3) | 8,700 | 8,700 | — | * | |||||
| White River Partners, L.P.(55) | 115,000 | 115,000 | — | * | |||||
| Wiegers & Co.(56) | 166,667 | 166,667 | — | * | |||||
| William Achenbach IRA(3) | 5,400 | 5,400 | — | * | |||||
| William Garrison | 10,000 | 10,000 | — | * | |||||
| William T. Hankinson(3) | 1,300 | 1,300 | — | * | |||||
| Worldwide Hard Assets(54) | 528,000 | 528,000 | — | * |
- *
- Less than one percent.
- (1)
- Unless otherwise indicated, each of the Selling Stockholders listed hereunder is neither a broker-dealer nor an affiliate of a broker-dealer.
- (2)
- Ownership is determined in accordance with Rule 13d-3 under the Securities Exchange Act of 1934.
- (3)
- George F. Wood is the President of Wood & Co., the Investment Advisor for this selling stockholder. By virtue of his position with Wood & Co., Mr. Wood is deemed to hold investment power and voting control over the shares held by this stockholder.
- (4)
- Joseph C. Cattares is the President of A&C Tank Sales Company, Inc. and is deemed to hold investment power and voting control over the shares held by this selling stockholder.
- (5)
- Steven C. Kleinman and David M. Call are Trustees of this selling stockholder and are deemed to hold investment power and voting control over the shares held by this selling stockholder.
- (6)
- Giordano Martinelli is the Executive Director of Fondi Anima, the Investment Advisor of this selling stockholder. By virtue of his position at Fondi Anima, Mr. Martinelli is deemed to hold investment power and voting control over this shares held by this selling stockholder.
80
- (7)
- Sid R. Bass is the President and controlling stockholder of BBT-FW, Inc., the General Partner of BBT Genpar, L.P., the Managing General Partner of BBT Fund, L.P. By virtue of his position at BBT-FW, Inc., Mr. Bass is deemed to hold investment power and voting control over the shares held by this selling stockholder.
- (8)
- J. Steven Emerson is the sole beneficiary of the Bear Stearns SEC Corp FBO J. Steven Emerson, IRA R/O II and is deemed to hold investment power and voting control over the shares held by this selling stockholder.
- (9)
- LuAnn L. Bennett is the Managing Member of Bennett Family LLC and is deemed to hold investment power and voting control over the shares held by this selling stockholder.
- (10)
- David H. Stevenson is the President of Blue Ridge Investments, Inc. and is deemed to hold investment power and voting control over the shares held by this selling stockholder.
- (11)
- Sid R. Bass is the President and controlling stockholder of CAP-FW, Inc., the General Partner of CAP Genpar, L.P., the Managing General Partner of CAP Fund, L.P. By virtue of his position at CAP-FW, Inc., Mr. Bass is deemed to hold investment power and voting control over the shares held by this selling stockholder.
- (12)
- Gaetan Japy is the President of Champagne Capital SAS and is deemed to hold investment power and voting control over the shares held by this selling stockholder.
- (13)
- Vincent Darpino is a Portfolio Manager at Clinton Group, Inc., the Investment Manager of this selling stockholder. By virtue of his position at Clinton Group, Inc., Mr. Darpino is deemed to hold investment power and voting control over the shares held by this selling stockholder.
- (14)
- Robert J. Flanagan is the Manager of CNF Investments II, LLC and is deemed to hold investment power and voting control over the shares held by this selling stockholder.
- (15)
- Ron Coleman and Michelle Coleman are Trustees of this selling stockholder and are deemed to hold investment power and voting control over the shares held by this selling stockholder.
- (16)
- Arild Eide is a Portfolio Manager at RAB Capital PLC, the Investment Manager of RAB American Opportunities Fund Limited, the beneficial owner of this selling stockholder. By virtue of his position at RAB Capital PLC, Mr. Eide is deemed to hold investment power and voting control over the shares held by this selling stockholder
- (17)
- Bruce Wilcox, Andrew Wallach and Gary Tynes are Managing Members of Cumberland Associates LLC, the Investment Manager of this selling stockholder. By virtue of their positions with Cumberland Associates LLC, Messrs. Wilcox, Wallach and Tynes are deemed to hold investment power and voting control over the shares held by this selling stockholder.
- (18)
- Floyd E. Davis III is the President of Davis Brothers II, Inc., the General Partner of this selling stockholder. By virtue of his position at Davis Brothers II, Inc., Mr. Davis is deemed to hold investment power and voting control over the shares held by this selling stockholder.
- (19)
- James G. Doyle and Virginia K. Doyle are Trustees of this selling stockholder and are deemed to hold investment power and voting control over the shares held by this selling stockholder.
- (20)
- Alexander W. Rutherford is the Portfolio Manager of Drake Asset Management LLC, the General Partner of this selling stockholder. By virtue of his position with Drake Asset Management LLC, Mr. Rutherford is deemed to hold investment power and voting control over the shares held by this selling stockholder.
- (21)
- James R. Epstein is the President of EFO Capital Management, the Investment Manager of this selling stockholder. By virtue of his position with EFO Capital Management, Mr. Epstein is
81
deemed to hold investment power and voting control over the shares held by this selling stockholder.
- (22)
- This selling stockholder is a registered investment fund advised by Fidelity Management & Research Company, a wholly-owned subsidiary of FMR Corp. and is the beneficial owner of the shares held by this selling stockholder. Edward C. Johnson III, Chairman of FMR Corp., through it's control of Fidelity Management & Research Company, has the sole power to dispose of the shares held by this selling stockholder. Neither FMR Corp. nor Edward C. Johnson III has the sole power to vote or direct the voting of the shares owned directly by this selling stockholder, which power resides with this selling stockholder's Board of Trustees. This selling stockholder is not a broker-dealer; however, it is an affiliate of a broker-dealer. The shares held by this selling stockholder were purchased in the ordinary course of business and, at the time of purchase, this selling stockholder had no agreements or understandings, directly or indirectly, with any party to distribute the shares.
- (23)
- Robert J. Flanagan is the Manager of E.O. Flanagan, LLC, the General Partner of this selling stockholder. By virtue of his position at E.O. Flanagan, LLC, Mr. Flanagan is deemed to hold investment power and voting control over the shares held by this selling stockholder.
- (24)
- George A. Weiss is the Trustee of the George Weiss Associates Profit Sharing Plan and is deemed to hold investment power and voting control over the shares held by this selling stockholder. This selling stockholder is not a broker-dealer; however, it is an affiliate of a broker-dealer. The shares held by this selling stockholder were purchased in the ordinary course of business and, at the time of purchase, this selling stockholder had no agreements or understandings, directly or indirectly, with any party to distribute the shares.
- (25)
- Robert W. Posniewski is the Chief Financial Officer of Georgetown Preparatory School, Inc. and is deemed to hold investment power and voting control over the shares held by this selling stockholder.
- (26)
- Greg Vogel is the President of the GJ Vogel Inc. Profit Sharing Plan and is deemed to hold investment power and voting control over the shares held by this selling stockholder.
- (27)
- Noam Gottesman, Pierre Lagrange and Emmanuel Roman are Managing Directors of GLG Partners LP, the Investment Manager of this selling stockholder. By virtue of their positions with GLG Partners LP, the above listed individuals are deemed to hold investment power and voting control over the shares held by this selling stockholder.
- (28)
- Shawn Reynolds is a Portfolio Manager at Van Eck Absolute Return Advisors Corporation, the Investment Manager of this selling stockholder. By virtue of his position at Van Eck Absolute Return Advisors Corporation, Mr. Reynolds is deemed to hold investment power and voting control over the shares held by this selling stockholder.
- (29)
- Israel A. Englander is the Managing Member of Millennium Management, L.L.C., the Managing Partner of Millennium Partners, L.P., the Managing Member of Grandview, LLC. By virtue of his position at Millennium Management, L.L.C., Mr. Englander is deemed to hold investment power and voting control over the shares held by this selling stockholder.
- (30)
- Robert Koltun is the Managing Member of Grey K GP, LLC, the General Partner of this selling stockholder. By virtue of his position with Grey K GP, LLC, Mr. Koltun is deemed to hold investment power and voting control over the shares held by this selling stockholder.
- (31)
- Robert Koltun is the Managing Member of RNK Capital LLC, the Investment Manager of this selling stockholder. By virtue of his position with RNK Capital LLC, Mr. Koltun is deemed to hold investment power and voting control over the shares held by this selling stockholder.
82
- (32)
- Diana Light-Rhodes is the Vice President and Robert Janecek is a Member of Harbor Advisors, LLC. By virtue of their positions with Harbor Advisors, LLC, Ms. Light-Rhodes and Mr. Janecek are deemed to hold investment power and voting control over the shares held by this selling stockholder.
- (33)
- B.J. Willingham is the Chief Investment Officer and Lee P. Moncrief is the Chief Executive Officer of Moncrief Willingham Energy Advisers, the Investment Adviser of this selling stockholder. By virtue of their positions with Moncrief Willingham Energy Advisers, Mr. Willingham and Mr. Moncrief are deemed to hold investment power and voting control over the shares held by this selling stockholder.
- (34)
- George A. Weiss is the General Partner of this selling stockholder and is deemed to hold investment power and voting control over the shares held by this selling stockholder. This selling stockholder is not a broker-dealer; however, it is an affiliate of a broker-dealer. The shares held by this selling stockholder were purchased in the ordinary course of business and, at the time of purchase, this selling stockholder had no agreements or understandings, directly or indirectly, with any party to distribute the shares.
- (35)
- Richard Johnson and Clasina Johnson are Trustees of this selling stockholder and are deemed to hold investment power and voting control over the shares held by this selling stockholder.
- (36)
- Eamon Keegan is the Trustee of the Keegan Family Trust and is deemed to hold investment power and voting control over the shares held by this selling stockholder.
- (37)
- Donald R. Kendall is the Managing Director of Kenmont Investments Management, L.P., the Investment Manager of this selling stockholder. By virtue of his position with Kenmont Investments Management, L.P., Mr. Kendall is deemed to hold investment power and voting control over the shares held by this selling stockholder.
- (38)
- Thomas H. Lansing and Susan Lansing are Trustees of this selling stockholder and are deemed to hold investment power and voting control over the shares held by this selling stockholder.
- (39)
- Sheldon B. Lubar is a General Partner of this selling stockholder and is deemed to hold investment power and voting control over the shares held by this selling stockholder.
- (40)
- Mutual of America Capital Management Corporation is the investment adviser to Mutual of America Institutional Funds, Inc., a registered investment company comprised of a series of funds under the Investment Company Act of 1940. The funds that hold the Company's stock hold such stock for investment purposes, with no intent to control the business or affairs of the Company. As the investment adviser, Mutual of America Capital Management Corporation has voting and investment power over the shares.
- (41)
- Mutual of America Capital Management Corporation is the investment adviser to Mutual of America Investment Corporation, a registered investment company comprised of a series of funds under the Investment Company Act of 1940 that are available as investment vehicles for account balances under variable accumulation annuity contracts and variable life insurance policies issued by Mutual of America Life Insurance Company. Shares of the funds are purchased by the separate accounts of Mutual of America Life Insurance Company. The funds that hold the Company's stock hold such stock for investment purposes, with no intent to control the business or affairs of the Company. As the investment adviser, Mutual of America Capital Management Corporation has voting and investment power over the shares.
- (42)
- Peter S. Park is the Principal of Park West Asset Management LLC, the Investment Manager of this selling stockholder. By virtue of his positions with Park West Asset Management LLC, Mr. Park is deemed to hold investment power and voting control over the shares held by this selling stockholder
83
- (43)
- Paul A. Fino III is the Chief Executive Officer and Chief Operating Officer of Perennial Investors, LLC, the General Partner of this selling stockholder. By virtue of his position with Perennial Investors, LLC, Mr. Fino is deemed to hold investment power and voting control over the shares held by this selling stockholder.
- (44)
- Claudia M. Sensi and Nancy M. McGrath are Trustees of this selling stockholder and are deemed to hold investment power and voting control over the shares held by this selling stockholder.
- (45)
- Richard S. Bodman is Trustee of this selling stockholder and is deemed to hold investment power and voting control over the shares held by this selling stockholder.
- (46)
- Sid R. Bass is the President and controlling stockholder of BBT-FW, Inc., the General Partner of SRI Genpar, L.P., the Managing General Partner of SRI Fund, L.P. By virtue of his position at CAP-FW, Inc., Mr. Bass is deemed to hold investment power and voting control over the shares held by this selling stockholder.
- (47)
- John R. Clark III is the President of this selling stockholder and is deemed to hold investment power and voting control over the shares held by this selling stockholder.
- (48)
- Jerome R. Baier is a portfolio manager of Northwestern Investment Management Company, LLC, the Investment Manager of this selling stockholder. By virtue of his position with Northwestern Investment Management Company, LLC, Mr. Baier is deemed to hold shared investment power and voting control over the shares held by this selling stockholder.
- (49)
- This selling stockholder is not a broker-dealer; however, it is an affiliate of a broker-dealer. The shares held by this selling stockholder were purchased in the ordinary course of business and, at the time of purchase, this selling stockholder had no agreements or understandings, directly or indirectly, with any party to distribute the shares.
- (50)
- Peter Kenner is the General Partner of this selling stockholder and is deemed to hold investment power and voting control over the shares held by this selling stockholder.
- (51)
- Tom Wallace, Mark Wallace and Jim Wallace are Managers of Twin Bridges, LLC. By virtue of their positions with Twin Bridges, LLC, Messrs. T. Wallace, M. Wallace and J. Wallace are deemed to hold investment power and voting control over the shares held by this selling stockholder.
- (52)
- James A. Lustig is the President of United Capital Management, Inc. and is deemed to hold investment power and voting control over the shares held by this selling stockholder.
- (53)
- Curtis A. Stang is the Chief Operating Officer of this selling stockholder and is deemed to hold investment power and voting control over the shares held by this selling stockholder.
- (54)
- Shawn Reynolds is a Portfolio Manager at Van Eck Associates Corporation, the Investment Manager of this selling stockholder. By virtue of his position at Van Eck Associates Corporation, Mr. Reynolds is deemed to hold investment power and voting control over the shares held by this selling stockholder.
- (55)
- Allen C. Benello is the Managing Member of White River Investment Partners, LLC, the General Partner of this selling stockholder. By virtue of his position with White River Investment Partners, LLC, Mr. Benello is deemed to hold investment power and voting control over the shares held by this selling stockholder.
- (56)
- B. Deane Kreitler is the Portfolio Manager and George A. Wiegers and E. Alex Wiegers are Members of Wiegers & Co. By virtue of their positions with Wiegers & Co., Messrs. Kreitler, G. Wiegers and E. Wiegers are deemed to hold investment power and voting control over the shares held by this selling stockholder.
84
We are registering the common stock covered by this prospectus to permit the selling stockholders (which as used herein includes donees, pledgees, transferees or other successors-in-interest) to conduct public secondary trading of these shares from time to time after the date of this prospectus. Under the registration rights agreement we entered into for the benefit of the selling stockholders, we agreed to, among other things, bear all expenses, other than brokers' or underwriters' discounts and commissions, in connection with the registration and sale of the common stock covered by this prospectus. We will not receive any of the proceeds of the sale of the common stock offered by this prospectus. The aggregate proceeds to the selling stockholders from the sale of the common stock will be the purchase price of the common stock less any discounts and commissions. A selling stockholder reserves the right to accept and, together with their agents, to reject, any proposed purchases of common stock to be made directly or through agents.
The common stock offered by this prospectus may be sold from time to time to purchasers:
- •
- directly by the selling stockholders and their successors, which includes their donees, pledgees or transferees or their successors-in-interest; or
- •
- through underwriters, broker-dealers or agents, who may receive compensation in the form of discounts, concessions or agents' commissions from the selling stockholders or the purchasers of the common stock. These discounts, concessions, or commissions may be in excess of those customary in the types of transactions involved.
The selling stockholders and any underwriters, broker-dealers or agents who participate in the sale or distribution of the common stock may be deemed to be "underwriters" within the meaning of the Securities Act. The selling stockholders identified as registered broker-dealers in the selling stockholders table above under the heading "Selling Stockholders" are deemed to be underwriters. As a result, any profits on the sale of the common stock by such selling stockholders and any discounts, commissions or agent's commissions or concessions received by any such broker-dealer or agents may be deemed to be underwriting discounts and commissions under the Securities Act. Selling stockholders who are deemed to be "underwriters" with the meaning of Section 2(11) of the Securities Act will be subject to prospectus delivery requirements of the Securities Act. In addition, underwriters are subject to certain statutory liabilities, including, but not limited to, Sections 11, 12, and 17 of the Securities Act.
The common stock may be sold in one or more transactions at:
- •
- fixed prices;
- •
- prevailing market prices at the time of sale;
- •
- prices related to such prevailing market prices;
- •
- varying prices determined at the time of sale; or
- •
- negotiated prices.
These sales may be effected in one or more transactions:
- •
- on any national securities exchange or quotation on which the common stock may be listed or quoted at the time of the sale;
- •
- in the over-the-counter market;
- •
- in transactions on such exchanges or services or in the over-the-counter market;
85
- •
- through the writing of options (including the issuance by the selling stockholders of derivative securities), whether the options or such other derivative securities are listed on an options exchange or otherwise;
- •
- through the settlement of short sales (only after the initial effectiveness of the registration statement to which this prospectus is a part); or
- •
- through any combination of the foregoing.
These transactions may include block transactions or crosses. Crosses are transactions in which the same broker acts as an agent on both sides of the trade.
In connection with the sales of the common stock, the selling stockholders may enter into hedging transactions with broker-dealers or other financial institutions that in turn may:
- •
- engage in short sales of the common stock (only after the initial effectiveness of the registration statement to which this prospectus is a part) in the course of hedging their positions;
- •
- sell the common stock short and deliver the common stock to close out short positions;
- •
- loan or pledge the common stock to broker-dealers or other financial institutions that in turn may sell the common stock;
- •
- enter into option or other transactions with broker-dealers or other financial institutions that require the delivery to the broker-dealer or other financial institution of the common stock, which the broker-dealer or other financial institution may resell under the prospectus; or
- •
- enter into transactions in which a broker-dealer makes purchases as a principal for resale for its own account or through other types of transactions.
To our knowledge, there are currently no plans, arrangements or understandings between any selling stockholders and any underwriter, broker-dealer or agent regarding the sale of the common stock by the selling stockholders. In compliance with the guidelines of the National Association of Securities Dealers, or NASD, the maximum consideration or discount to be received by any NASD member or independent broker-dealer may not exceed 8% of the aggregate amount of securities offered pursuant to this prospectus or any applicable prospectus supplement.
We have applied for listing of our common stock on The Nasdaq Global Market once we meet its eligibility requirements. However, we can give no assurances as to the development of liquidity or any trading market for the common stock or that we will meet the listing requirements of The Nasdaq Global Market.
There can be no assurance that any selling stockholder will sell any or all of the common stock under this prospectus. Further, we cannot assure you that any such selling stockholder will not transfer, devise or gift the common stock by other means not described in this prospectus. In addition, any common stock covered by this prospectus that qualifies for sale under Rule 144 or Rule 144A of the Securities Act may be sold under Rule 144 or Rule 144A rather than under this prospectus. The common stock covered by this prospectus may also be sold to non-U.S. persons outside the U.S. in accordance with Regulation S under the Securities Act rather than under this prospectus. The common stock may be sold in some states only through registered or licensed brokers or dealers. In addition, in some states the common stock may not be sold unless it has been registered or qualified for sale or an exemption from registration or qualification is available and complied with.
The selling stockholders and any other person participating in the sale of the common stock will be subject to the applicable provisions of the Exchange Act and the rules and regulations promulgated thereunder. The Exchange Act rules include, without limitation, Regulation M, which may limit the timing of purchases and sales of any of the common stock by the selling stockholders and any other
86
participating person. In addition, Regulation M may restrict the ability of any person engaged in the distribution of the common stock to engage in market-making activities with respect to the particular common stock being distributed. This may affect the marketability of the common stock and the ability of any person or entity to engage in market-making activities with respect to the common stock.
We have agreed to indemnify the selling stockholders against certain liabilities, including liabilities under the Securities Act.
We have agreed to pay substantially all of the expenses incidental to the registration, offering, and sale of the common stock to the public, including the payment of federal securities law and state blue sky registration fees, except that we will not bear any brokerage or underwriting discounts or commissions or transfer taxes relating to the sale of shares of our common stock.
If required, at the time of a particular offering of shares of common stock by a selling stockholder, a supplement to this prospectus will be circulated setting forth the name or names of any underwriters, broker-dealers or agents, any discounts, commissions or other terms constituting compensation for underwriters and any discounts, commissions or concessions allowed or reallowed or paid to agents or broker-dealers.
We have agreed with the selling stockholders to keep the registration statement of which this prospectus forms a part effective for specified periods of time or until the occurrence of certain events. We may, under certain circumstances, suspend the use of this prospectus upon notice to the selling stockholders, to update the registration statement of which this prospectus forms a part with periodic information or material non-public information as required by the Securities Act. We have agreed with the selling stockholders to limit these suspended periods to those required by the Securities Act or limit them to contractually specified limits. See "Registration Rights."
The holders of shares of our common stock that are beneficiaries of the registration rights agreement and have elected to participate in our initial public offering will not be able to sell any remaining shares owned by them and not included in our initial public offering for a period of 180 days following the effective date of such registration statement. The holders of shares of our common stock that are beneficiaries of the registration rights agreement and have elected not to participate in our initial public offering also will not be able to sell any such shares for a period of 60 days following the effective date of such registration statement.
Once sold under the registration statement of which this prospectus forms a part, the shares of common stock covered hereby will be freely tradeable in the hands of persons other than our affiliates.
87
Pursuant to our amended certificate of incorporation, we have the authority to issue an aggregate of 135,000,000 shares of capital stock, consisting of 125,000,000 shares of common stock, par value $0.001 per share, and 10,000,000 shares of preferred stock, par value $0.001 per share.
Selected provisions of our organizational documents are summarized below. Forms of our organizational documents are attached as exhibits to the registration statement of which this prospectus is a part. In addition, the summary below does not give full effect to the terms of the provisions of statutory or common law which may affect the rights of a stockholder.
Common Stock
As of August 6, 2007, we had a total of 44,855,999 shares of common stock and no shares of preferred stock outstanding. Following the completion of our initial public offering and assuming that the underwriters exercise their option to purchase additional shares in full, we will have shares of common stock outstanding based on the number of shares outstanding as of August 6, 2007. We have reserved 3,584,616 shares for issuance to employees under our 2006 Plan. As of August 6, 2007, we have options to purchase 2,556,376 shares of our common stock outstanding and 1,028,240 shares remain available for future grants.
Voting rights. Each share of common stock is entitled to one vote in the election of directors and on all other matters submitted to a vote of our stockholders. Our stockholders may not cumulate their votes in the election of directors. Each of our directors is elected on an annual basis by our stockholders voting as a single class.
Dividends, distributions and stock splits. Holders of our common stock are entitled to receive dividends if, as and when such dividends are declared by our board out of assets legally available therefor after payment of dividends required to be paid on shares of preferred stock, if any.
Liquidation. In the event of any dissolution, liquidation, or winding up of our affairs, whether voluntary or involuntary, after payment of our debts and other liabilities and making provision for any holders of our preferred stock who have a liquidation preference, our remaining assets will be distributed ratably among the holders of common stock.
Fully paid. All the shares of common stock to be outstanding upon completion of this offering will be fully paid and nonassessable.
Other rights. Holders of our common stock have no redemption or conversion rights or other subscription rights. There are no redemption or sinking fund provisions applicable to the common stock.
The rights preferences and privileges of holders of common stock are subject to, and may be adversely affected by, the rights of holders of shares of any series of preferred stock that we may designate and issue in the future.
Preferred Stock
Our restated certificate of incorporation authorizes our board of directors, subject to any limitations prescribed by law, without further stockholder approval, to establish and to issue from time to time one or more classes or series of preferred stock, par value $0.001 per share, covering up to an aggregate of 10,000,000 shares of preferred stock. Each class or series of preferred stock will cover the number of shares and will have preferences, voting powers, qualifications and special or relative rights or privileges as is determined by the board of directors, which may include, among others, dividend rights, liquidation preferences, voting rights, conversion rights, preemptive rights and redemption rights.
88
The rights of the holders of common stock will be subject to the rights of holders of any preferred stock issued in the future. The issuance of preferred stock could adversely affect the voting power of holders of common stock and reduce the likelihood that common stockholders will receive dividend payments and payments upon liquidation. The issuance of preferred stock could also have the effect of decreasing the market price of the common stock and could delay, deter or prevent a change in control of our company. We have no present intention to issue any shares of preferred stock.
Certain Effects of Authorized But Unissued Stock
The authorized but unissued shares of common stock and preferred stock are available for future issuance without stockholder approval. These additional shares may be utilized for a variety of corporate purposes, including future public offerings to raise additional capital, corporate acquisitions and employee benefit plans.
The ability of our board of directors to issue authorized but unissued and unreserved common stock and preferred stock could render more difficult or discourage an attempt to obtain control of the company by means of a proxy contest, tender offer, merger, or otherwise, and thereby protect the continuity of our management.
Anti-Takeover Effects of Delaware Law and Our Charter and Bylaw Provisions
A number of provisions in our restated certificate of incorporation, our restated bylaws and Delaware law may make it more difficult to acquire control of us. These provisions could deprive the stockholders of opportunities to realize a premium on the shares of common stock owned by them. In addition, these provisions may adversely affect the prevailing market price of our common stock. These provisions are intended to:
- •
- enhance the likelihood of continuity and stability in the composition of the board and in the policies formulated by the board;
- •
- discourage transactions which may involve an actual or threatened change in control of us;
- •
- discourage tactics that may be involved in proxy fights; and
- •
- encourage persons seeking to acquire control of our company to consult first with the board of directors to negotiate the terms of any proposed business combination or offer.
Advance Notice Procedures for Stockholder Proposals and Director Nominations
Our restated bylaws provide that stockholders seeking to bring business before an annual meeting of stockholders, or to nominate candidates for election as directors at an annual meeting of stockholders, must provide timely notice thereof in writing. To be timely, a stockholder's notice generally must be delivered to or mailed and received at our principal executive offices not less than 60 and no more than 90 calendar days prior to the first anniversary of the date on which we first mailed our proxy materials for the preceding year's annual meeting of stockholders. In addition, our bylaws specify requirements as to the form and content of a stockholder's notice. These provisions may preclude stockholders from bringing matters before an annual meeting of stockholders or from making nominations for directors at an annual meeting of stockholders.
Stockholder Meetings
Our restated certificate of incorporation provides that stockholders are not permitted to call special meetings of stockholders. Only our board of directors, Chairperson or Chief Executive Officer are permitted to call a meeting of stockholders.
89
Supermajority Vote to Amend Bylaws
Our restated certificate of incorporation requires the affirmative vote of at least two-thirds of the directors then in office or of the holders of at least two-thirds of the combined voting power of all shares of our stock then outstanding to adopt, amend or repeal any bylaws of the company.
Limitation of Liability
Our restated certificate of incorporation provides that to the fullest extent permitted by Delaware law, as that law may be amended and supplemented from time to time, our directors shall not be personally liable to us or our stockholders for monetary damages for breach of fiduciary duty as a director, except for liability (i) for any breach of the director's duty of loyalty to the company or our stockholders, (ii) for acts or omissions not in good faith or which involve intentional misconduct or a knowing violation of law, (iii) under Section 174 of the Delaware General Corporation Law (the "DGCL"), or (iv) for any transaction from which the director derived any improper personal benefit. The effect of the provision of the certificate of incorporation is to eliminate the rights of the company and our stockholders (through stockholders' derivative suits on our behalf) to recover monetary damages against a director for breach of the fiduciary duty of care as a director (including breaches resulting from negligent behavior) except in the situations described in clauses (i) through (iv) above. Our bylaws also set forth certain indemnification provisions and provide for the advancement of expenses incurred by a director in defending a claim by reason of the fact that he was one of our directors (or was serving as a director or officer of another entity at our request), provided that the director agrees to repay the amounts advanced if the director is not entitled to be indemnified by us under the provisions of the DGCL. The indemnification provisions of our certificate of incorporation may reduce the likelihood of derivative litigation against directors and may discourage or deter stockholders or management from bringing a lawsuit against directors for breaches of their fiduciary duties, even though an action, if successful, otherwise might have benefited us and our stockholders.
The right to indemnification and advancement of expenses are not exclusive of any other rights to indemnification our directors or officers may be entitled to under any agreement, vote of stockholders or disinterested directors or otherwise. We intend to enter into indemnification agreements with each of our directors and some of our officers pursuant to which we agree to indemnify the director or officer against expenses, judgments, fines or amounts paid in settlement incurred by the director or officer and arising out of his capacity as a director, officer, employee and/or agent of the company or other enterprise of which he is a director, officer, employee or agent acting at our request to the maximum extent permitted by applicable law, subject to certain limitations. Additionally, under Delaware law, we may purchase and maintain insurance for the benefit and on behalf of our directors and officers insuring against all liabilities that may be incurred by the director or officer in or arising out of his capacity as our director, officer, employee and/or agent.
Delaware Business Combination Statute
We have elected in our restated certificate of incorporation to be subject to Section 203 of the Delaware General Corporation Law regulating corporate takeovers. This section prevents a Delaware corporation from engaging in a business combination which includes a merger or sale of more than 10% of the corporation's assets with a stockholder who owns 15% or more of the corporation's outstanding voting stock, as well as affiliates and associates of any of those persons. That prohibition extends for three years following the date that stockholder acquired that amount of stock unless:
- •
- the transaction in which that stockholder acquired the stock is approved by the board of directors prior to that date;
- •
- upon completion of the transaction that resulted in the acquisition of the stock, the stockholder owned at least 85% of the voting stock of the corporation outstanding at the time the
90
- •
- on or after the date the stockholder acquired the stock, the business combination is approved by the board of directors and authorized at an annual or special meeting of stockholders by the affirmative vote of at least two-thirds of the outstanding voting stock that is not owned by the stockholder.
transaction commenced, excluding those shares owned by various employee benefit plans or persons who are directors and also officers; or
A corporation may, at its option, exclude itself from Section 203 of the Delaware General Corporation Law by amending its certificate of incorporation or bylaws by action of its stockholders. The charter or bylaw amendment shall not become effective until 12 months after the date it is adopted or applies to a stockholder. Section 203 will not apply to a business combination between us and Yorktown because Yorktown held more than 15% of our stock prior to the effective date of our restated certificate of incorporation.
91
SHARES ELIGIBLE FOR FUTURE SALE
Prior to the date of this prospectus, there has been no public market for our common stock. The sale of a substantial amount of our common stock in the public market after we complete our initial public offering and this offering, or the perception that such sales may occur, could adversely affect the prevailing market price of our common stock. Furthermore, because some of our shares will not be available for sale shortly after our initial public offering and this offering due to the contractual and legal restrictions on resale described below and the fact that a substantial majority of our shares of common stock are subject to registration rights held by certain of our selling stockholders, the sale of a substantial amount of common stock in the public market after these restrictions lapse or in the future by these selling stockholders could adversely affect the prevailing market price of our common stock and our ability to raise equity capital in the future.
As of August 6, 2007, we had 44,855,999 shares of common stock outstanding. All of the shares of our common stock sold in this offering will be freely tradable without restrictions or further registration under the Securities Act, unless the shares are purchased by "affiliates" as that term is defined in Rule 144 under the Securities Act and except certain shares that will be subject to a lock-up period of up to 180 days following the completion of our initial public offering. The holders of shares of our common stock that are beneficiaries of the registration rights agreement and have elected to participate in our initial public offering will not be able to sell any remaining shares owned by them and not included in our initial public offering for a period of 180 days following the effective date of such registration statement. The holders of shares of our common stock that are beneficiaries of the registration rights agreement and have elected not to participate in our initial public offering also will not be able to sell any such shares for a period of 60 days following the effective date of such registration statement.
Any shares purchased by an affiliate may not be resold except in compliance with Rule 144 volume limitations, manner of sale and notice requirements, pursuant to another applicable exemption from registration or pursuant to an effective registration statement. The shares of common stock currently held by our employees are "restricted securities" as that term is defined in Rule 144 under the Securities Act. These restricted securities may be sold in the public market by our employees only if they are registered or if they qualify for an exemption from registration under Rule 144 or Rule 144(k) under the Securities Act. These rules are summarized below.
Rule 144
In general, under Rule 144 as currently in effect, beginning 90 days after the date of this prospectus, a person or persons whose shares are aggregated, who have beneficially owned restricted shares for at least one year, including persons who may be deemed to be our "affiliates," would be entitled to sell within any three-month period a number of shares that does not exceed the greater of (i) 1% of the number of shares of common stock then outstanding or (ii) the average weekly trading volume of our common stock during the four calendar weeks before a notice of the sale on SEC Form 144 is filed.
Sales under Rule 144 are also subject to certain manner of sale provisions and notice requirements and to the availability of certain public information about us.
Rule 144(k)
Under Rule 144(k), a person who is not deemed to have been one of our "affiliates" at any time during the 90 days preceding a sale, and who has beneficially owned the shares proposed to be sold for at least two years, including the holding period of any prior owner other than an "affiliate," is entitled to sell these shares without complying with the manner of sale, public information, volume limitation or notice provisions of Rule 144.
92
Stock Issued Under Employee Plans
We intend to file a registration statement on Form S-8 under the Securities Act to register approximately 3,600,000 shares of common stock issuable, with respect to options and restricted stock units that have been exercised or will be granted under our employee plans or otherwise. This registration statement is expected to be filed following the effective date of the registration statement of which this prospectus is a part and will be effective upon filing. Shares issued under our 2006 Plan will be eligible for resale in the public market without restriction after the effective date of the Form S-8 registration statements, subject to Rule 144 limitations applicable to affiliates. Under Rule 701 under the Securities Act, as currently in effect, each of our employees, officers, directors, and consultants who purchased or received shares pursuant to a written compensatory plan or contract is eligible to resell these shares 90 days after the effective date of this offering in reliance upon Rule 144, but without compliance with specific restrictions. Rule 701 provides that affiliates may sell their Rule 701 shares under Rule 144 without complying with the holding period requirement and that non-affiliates may sell their shares in reliance on Rule 144 without complying with the holding period, public information, volume limitation, or notice provisions of Rule 144.
93
We entered into a registration rights agreement in connection with our private placement of common stock in the July 2006. In the registration rights agreement we agreed, for the benefit of the purchasers of our common stock in the private offering, that we will, at our expense:
- •
- file two registration statements (the "shelf registration statements") with the SEC (which occurs in part pursuant to the filing of the shelf registration statement of which this prospectus is a part) by November 9, 2006;
- •
- use our commercially reasonable efforts to cause the shelf registration statements to become effective under the Securities Act not later than February 7, 2007, which we were unable to comply with; as a result T. Scott Martin, our chief executive officer, and James R. Casperson, our chief financial officer, forfeited bonuses of $300,000 and $155,000, respctively;
- •
- continuously maintain the effectiveness of the shelf registration statements under the Securities Act until the earliest of:
- •
- the sale of all of the shares of common stock covered by the shelf registration statements pursuant to the registration statements or Rule 144 under the Securities Act or any similar provision then in effect;
- •
- such time as all of the shares of our common stock sold in the private offering and covered by the shelf registration statements and not held by affiliates of us are, in the opinion of our counsel, eligible for sale pursuant to Rule 144(k) (or any successor or analogous rule) under the Securities Act; or
- •
- the shares have been sold to us or any of our subsidiaries.
We filed the registration statement of which this prospectus is a part to satisfy in part our filing obligation under the registration rights agreement. A purchaser of our common stock in connection with this prospectus will not receive the benefits of the registration rights agreement.
Notwithstanding the foregoing, we will be permitted, under limited circumstances, to suspend the use, from time to time, of the shelf registration statement of which this prospectus is a part (and therefore suspend sales under the registration statement) for certain periods, referred to as "blackout periods," if, among other things, any of the following occurs:
- •
- The representative of the underwriters of an underwritten offering of primary shares by us has advised us that the sale of shares of our common stock under the shelf registration statement would have a material adverse effect on such public offering (in which case the black out period cannot be more than 45 days or, in the case of an initial public offering, 60 days);
- •
- a majority of our board of directors, in good faith, determines that (1) the offer or sale of any shares of our common stock would materially impede, delay or interfere with any proposed financing, offer or sale of securities, acquisition, merger, tender offer, business combination, corporate reorganization, consolidation or other significant transaction involving us; (2) after the advice of counsel, the sale of the shares covered by the shelf registration statement would require disclosure of non-public material information not otherwise required to be disclosed under applicable law; and (3) either (x) we have a bona fide business purpose for preserving the confidentiality of the proposed transaction, (y) disclosure would have a material adverse effect on us or our ability to consummate the proposed transaction, or (z) the proposed transaction renders us unable to comply with SEC requirements, in each case under circumstances that would make it impractical or inadvisable to cause the registrations statement (or such filings) to become effective or to promptly amend or supplement the registration statement on a post-effective basis; or
94
- •
- a majority of our board of directors, in good faith, determines, that we are required by law, rule or regulation to supplement the shelf registration statement or file a post-effective amendment to the shelf registration statement in order to incorporate information into the shelf registration statement for the purpose of (1) including in the shelf registration statement a prospectus required under Section 10(a)(3) of the Securities Act; (2) including in the prospectus included in the shelf registration statement any facts or events arising after the effective date of the shelf registration statement (or the most-recent post-effective amendment) that, individually or in the aggregate, represents a fundamental change in the information set forth in the prospectus; or (3) including in the prospectus included in the shelf registration statement any material information with respect to the plan of distribution not disclosed in the shelf registration statement or any material change to such information.
The cumulative blackout periods in any 12-month period commencing on the closing of the private equity placement may not exceed an aggregate of 90 days and furthermore may not exceed 60 days in any 90-day period, except as a result of a review of any post-effective amendment by the SEC prior to declaring it effective; provided we have used all commercially reasonable efforts to cause such post-effective amendment to be declared effective.
In addition to this limited ability to suspend use of the shelf registration statement, until we are eligible to incorporate by reference into the registration statement our periodic and current reports, which will not occur until at least one year following the end of the month in which the registration statement of which this prospectus is a part is declared effective, we will be required to amend or supplement the shelf registration statement to include our quarterly and annual financial information and other developments material to us. Therefore, sales under the shelf registration statement will be suspended until the amendment or supplement, as the case may be, is filed and effective.
Each holder will be deemed to have agreed that, upon receipt of notice of the occurrence of any event which makes a statement in the prospectus which is a part of the shelf registration statement untrue in any material respect or which requires the making of any changes in such prospectus in order to make the statements therein not misleading, or of certain other events specified in the registration rights agreement, such holder will suspend the sale of our common stock pursuant to such prospectus until we have amended or supplemented such prospectus to correct such misstatement or omission and have furnished copies of such amended or supplemented prospectus to such holder or we have given notice that the sale of the common stock may be resumed.
95
MATERIAL UNITED STATES FEDERAL INCOME TAX CONSIDERATIONS
FOR NON-UNITED STATES HOLDERS
The following is a summary of material U.S. federal income and, to a limited extent, estate tax considerations relating to the purchase, ownership and disposition of our common stock by persons that are non-United States holders (as defined below), but does not purport to be a complete analysis of all the potential tax considerations relating thereto. This summary is based upon the Internal Revenue Code of 1986 as amended (the "Code") and regulations, administrative rulings and court decisions thereunder now in effect, all of which are subject to change, possibly on a retroactive basis or to different interpretations. This summary deals only with non-United States holders that will hold our common stock as a "capital asset" (generally, property held for investment) and does not address tax considerations applicable to investors that may be subject to special rules under United States federal income tax law, such as (without limitation):
- •
- certain United States expatriates;
- •
- stockholders that hold our common stock as part of a straddle, appreciated financial position, synthetic security, hedge, conversion transaction or other integrated investment or risk reduction transaction;
- •
- stockholders who hold our common stock as a result of a constructive sale;
- •
- stockholders whose functional currency is not the United States dollar;
- •
- stockholders who acquired our common stock through the exercise of employee stock options or otherwise as compensation or through a tax-qualified retirement plan;
- •
- stockholders that are S corporations, entities treated as partnerships for United States federal income tax purposes or other pass-through entities or owners thereof;
- •
- financial institutions;
- •
- insurance companies;
- •
- tax-exempt entities;
- •
- dealers in securities or foreign currencies; and
- •
- traders in securities that mark-to-market.
Furthermore, this summary does not address any aspect of state, local or foreign tax laws or the alternative minimum tax provisions of the Code.
If a partnership (including an entity treated as a partnership for U.S. federal income tax purposes) holds the common stock, the tax treatment of a partner will generally depend upon the status of the partner and the activities of the partnership. If you are a partner of a partnership (including an entity treated as a partnership for U.S. federal income tax purposes) holding our common stock, you should consult your tax advisor. Moreover, this summary does not discuss alternative minimum tax consequences, if any, or any state, local or foreign tax consequences to holders of our common stock.
We have not sought any ruling from the Internal Revenue Service (the "IRS") with respect to the statements made and the conclusions reached in the following summary, and there can be no assurance that the IRS will agree with such statements and conclusions. INVESTORS CONSIDERING THE PURCHASE OF COMMON STOCK SHOULD CONSULT THEIR OWN TAX ADVISORS WITH RESPECT TO THE APPLICATION OF THE UNITED STATES FEDERAL INCOME AND ESTATE TAX LAWS TO THEIR PARTICULAR SITUATIONS AS WELL AS ANY TAX CONSEQUENCES ARISING UNDER THE LAWS OF ANY STATE, LOCAL OR FOREIGN TAXING JURISDICTION OR UNDER ANY APPLICABLE TAX TREATY.
96
As used in this discussion, a "non-United States holder" is a beneficial owner of common stock (other than a partnership or entity treated as a partnership for U.S. federal income tax purposes) that for U.S. federal income tax purposes is not:
- •
- an individual who is a citizen or resident of the United States, including an alien individual who is a lawful permanent resident of the United States or who meets the "substantial presence" test under Section 7701(b) of the Code;
- •
- a corporation, or other entity taxable as a corporation for U.S. federal income tax purposes, that was created or organized in or under the laws of the United States, any state thereof or the District of Columbia;
- •
- an estate whose income is subject to U.S. federal income taxation regardless of its source; or
- •
- a trust (i) if it is subject to the supervision of a court within the United States and one or more United States persons have the authority to control all substantial decisions of the trust or (ii) that has a valid election in effect under applicable United States Treasury Regulations to be treated as a United States person.
Dividends
We do not presently expect to declare or pay any dividends on our common stock in the foreseeable future. However, if we do make distributions on our common stock, such distributions will constitute dividends for U.S. federal income tax purposes to the extent paid from our current or accumulated earnings and profits, as determined under U.S. federal income tax principles. Distributions in excess of earnings and profits will constitute a return of capital that is applied against and reduces the non-United States holder's adjusted tax basis in our common stock. Any remaining excess will be treated as gain realized on the sale or other disposition of the common stock and will be treated as described under "Gain on Disposition of Common Stock" below. Any dividend paid to a non-United States holder of common stock ordinarily will be subject to withholding of U.S. federal income tax at a rate of 30%, or such lower rate as may be specified under an applicable income tax treaty. In order to receive a reduced treaty rate, a non-United States holder must provide us with IRS Form W-8BEN (or other applicable form) properly certifying eligibility for the reduced rate.
Dividends paid to a non-United States holder that are effectively connected with a trade or business conducted by the non-United States holder in the United States (and, where a tax treaty applies, are attributable to a permanent establishment maintained by the non-United States holder in the United States) generally will be exempt from the withholding tax described above and instead will be subject to U.S. federal income tax on a net income basis at the regular graduated U.S. federal income tax rates in much the same manner as if the non-United States holder were a resident of the United States. In such cases, we will not have to withhold U.S. federal income tax if the non-United States holder complies with applicable certification and disclosure requirements. In order to obtain this exemption from withholding tax, a non-United States holder must provide us with an IRS Form W-8ECI (or other applicable form) properly certifying eligibility for such exemption. Dividends received by a corporate non-United States holder that are effectively connected with a trade or business conducted by such corporate non-United States holder in the United States also may be subject to an additional branch profits tax at a rate of 30% or such lower rate as may be specified by an applicable tax treaty.
97
Gain on Disposition of Common Stock
Any gain realized on the disposition of our common stock generally will not be subject to United States federal income tax unless:
- •
- the gain is effectively connected with a trade or business of the non-United States holder in the United States, and, if required by an applicable income tax treaty, is attributable to a United States permanent establishment of the non-United States holder;
- •
- the non-United States holder is an individual who is present in the United States for 183 days or more in the taxable year of that disposition, and certain other conditions are met; or
- •
- we are or have been a "United States real property holding corporation" for United States federal income tax purposes.
An individual non-United States holder described in the first bullet point immediately above will be subject to tax on the net gain derived from the sale under regular graduated United States federal income tax rates. If a non-United States holder that is a foreign corporation falls under the first bullet point immediately above, it generally will be subject to tax on its net gain in the same manner as if it were a United States person as defined under the Code and, in addition, may be subject to the branch profits tax equal to 30% of its effectively connected earnings and profits or at such lower rate as may be specified by an applicable income tax treaty.
An individual non-United States holder described in the second bullet point immediately above will be subject to a flat 30% tax on the gain derived from the sale, which may be offset by United States source capital losses, even though the individual is not considered a resident of the United States.
As to the third bullet point, we believe that we are currently a "United States real property holding corporation" for United States federal income tax purposes. So long as our common stock is "regularly traded on an established securities market," only a non-United States holder who holds or held (at any time during the shorter of the five year period preceding the date of disposition or the holder's holding period) more than 5% of our common stock will be subject to United States federal income tax on the disposition of our common stock. If our common stock were not considered to be "regularly traded on an established securities market," all non-United States holders would be subject to U.S. federal income tax on a disposition of our common stock.
Non-United States holders should consult their own tax advisors with respect to the application of the foregoing rules to their ownership and disposition of our common stock.
Federal Estate Taxes
If you are an individual, common stock owned or treated as being owned by you at the time of your death will be included in your gross estate for U.S. federal estate tax purposes and may be subject to U.S. federal estate tax, unless an applicable estate tax treaty provides otherwise.
Information Reporting and Backup Withholding
We must report annually to the IRS and to each non-United States holder the amount of dividends paid to such holder and the tax withheld with respect to such dividends, regardless of whether withholding was required. Copies of the information returns reporting such dividends and withholding may also be made available to the tax authorities in the country in which the non-United States holder resides under the provisions of an applicable income tax treaty.
A non-United States holder will be subject to backup withholding for dividends paid to such holder unless such holder certifies under penalty of perjury that it is a non-United States holder, and the payor does not have actual knowledge or reason to know that such holder is a United States person as defined under the Code, or such holder otherwise establishes an exemption.
98
Information reporting and, depending on the circumstances, backup withholding will apply to the proceeds of a sale of our common stock within the United States or conducted through certain United States-related financial intermediaries, unless the beneficial owner certifies under penalty of perjury that it is a non-United States holder (and the payor does not have actual knowledge or reason to know that the beneficial owner is a United States person as defined under the Code) or such owner otherwise establishes an exemption.
Any amounts withheld under the backup withholding rules may be allowed as a refund or a credit against a non-United States holder's United States federal income tax liability provided the required information is furnished to the IRS.
The validity of the shares offered hereby and certain other legal matters in connection with this offering will be passed upon for us by Thompson & Knight LLP, Houston, Texas.
The financial statements of Ellora Energy Inc. as of December 31, 2005 and 2006, and for each of the three years in the period ended December 31, 2006 included in this prospectus have been audited by Hein & Associates LLP, independent registered public accountants, as stated in their report appearing in this registration statement, and have been so included in reliance upon the report of such firm given upon their authority as experts in accounting and auditing.
The financial statements of Presco Western, LLC for the two years ended December 31, 2003 and 2004 included in this prospectus have been audited by Hein & Associates LLP, independent registered public accountants, as stated in their report appearing in this prospectus, and have been so included in reliance upon the report of such firm given upon their authority as experts in accounting and auditing.
The information included in this prospectus regarding estimated quantities of proved reserves, the future net revenues from those reserves and their present value is based, in part, on our estimates of the proved reserves and present values of proved reserves as of June 30, 2007 prepared by MHA Petroleum Consultants, Inc., independent petroleum engineers. The summary pages of their report in respect of our reserves as of June 30, 2007 are included in this prospectus as Appendix "A." These estimates are included in this prospectus in reliance upon the authority of MHA as experts in these matters.
WHERE YOU CAN FIND MORE INFORMATION
We have filed with the SEC, under the Securities Act, a registration statement on Form S-1 with respect to the common stock offered by this prospectus. This prospectus, which constitutes part of the registration statement, does not contain all of the information set forth in the registration statement or the exhibits and schedules which are part of the registration statement, portions of which are omitted as permitted by the rules and regulations of the SEC. Statements made in this prospectus regarding the contents of any contract or other documents are summaries of the material terms of the contract or document. With respect to each contract or document filed as an exhibit to the registration statement, reference is made to the corresponding exhibit. For further information pertaining to us and to the common stock offered by this prospectus, reference is made to the registration statement, including the exhibits and schedules thereto, copies of which may be inspected without charge at the public reference facilities of the SEC at 100 F Street, N.E., Room 1580, Washington, D.C. 20549. Copies of all or any portion of the registration statement may also be obtained by calling the SEC at 1-800-SEC-0330. In addition, the SEC maintains a web site that contains reports, proxy and information statements, and other information that is filed electronically with the SEC. The web site can be accessed at www.sec.gov.
After effectiveness of the registration statement, which includes this prospectus, we will be required to comply with the requirements of the Exchange Act, and, accordingly, will file current reports on Form 8-K, quarterly reports on Form 10-Q, annual reports on Form 10-K, and other information with the SEC. Those reports and other information will be available for inspection and copying at the public reference facilities and internet site of the SEC referred to above.
99
GLOSSARY OF SELECTED OIL AND GAS TERMS
The following is a description of the meanings of some of the oil and gas industry terms used in this prospectus.
3-D seismic. (Three-Dimensional Seismic Data) Geophysical data that depicts the subsurface strata in three dimensions. 3-D seismic data typically provides a more detailed and accurate interpretation of the subsurface strata than two dimensional seismic data.
Bcfe. Billion cubic feet equivalent, determined using the ratio of six Mcf of gas to one Bbl of crude oil, condensate or gas liquids.
Btu or British Thermal Unit. The quantity of heat required to raise the temperature of one pound of water by one degree Fahrenheit.
Completion. The installation of permanent equipment for the production of oil or gas.
Development well. A well drilled within the proved boundaries of an oil or gas reservoir with the intention of completing the stratigraphic horizon known to be productive.
Dry hole. A well found to be incapable of producing hydrocarbons in sufficient quantities such that proceeds from the sale of such production exceed production expenses and taxes.
Dry hole costs. Costs incurred in drilling a well, assuming a well is not successful, including plugging and abandonment costs.
Exploitation. Ordinarily considered to be a form of development within a known reservoir.
Exploratory well. A well drilled to find and produce oil or gas reserves not classified as proved, to find a new reservoir in a field previously found to be productive of oil or gas in another reservoir or to extend a known reservoir.
Farmout. An agreement whereby the owner of a leasehold or working interest agrees to assign an interest in certain specific acreage to the assignees, retaining an interest such as an overriding royalty interest, an oil and gas payment, offset acreage or other type of interest, subject to the drilling of one or more specific wells or other performance as a condition of the assignment.
Field. An area consisting of either a single reservoir or multiple reservoirs, all grouped on or related to the same individual geological structural feature and/or stratigraphic condition.
Finding and development costs. Capital costs incurred in the acquisition, exploration, development and revisions of proved oil and gas reserves divided by proved reserve additions.
Fracing or Fracture stimulation technology. The technique of improving a well's production or injection rates by pumping a mixture of fluids into the formation and rupturing the rock, creating an artificial channel. As part of this technique, sand or other material may also be injected into the formation to keep the channel open, so that fluids or gases may more easily flow through the formation.
Gross acres or gross wells. The total acres or wells, as the case may be, in which a working interest is owned.
Horizontal drilling. A drilling operation in which a portion of the well is drilled horizontally within a productive or potentially productive formation. This operation usually yields a well which has the ability to produce higher volumes than a vertical well drilled in the same formation.
100
Injection well or Injection. A well which is used to place liquids or gases into the producing zone during secondary/tertiary recovery operations to assist in maintaining reservoir pressure and enhancing recoveries from the field.
Lease operating expenses. The expenses of lifting oil or gas from a producing formation to the surface, and the transportation and marketing thereof, constituting part of the current operating expenses of a working interest, and also including labor, superintendence, supplies, repairs, short-lived assets, maintenance, allocated overhead costs, ad valorem taxes and other expenses incidental to production, but excluding lease acquisition or drilling or completion expenses.
MBbls. Thousand barrels of crude oil or other liquid hydrocarbons.
Mcf. Thousand cubic feet of natural gas. The energy value of natural gas is approximately 1.031 MMBtu at standard temperature and pressure for dry natural gas and approximately 1.103 MMBtu per Mcf at standard temperature and pressure for rich natural gas.
Mcfe. Thousand cubic feet equivalent, determined using the ratio of six Mcf of gas to one Bbl of oil, condensate or gas liquids.
MMBbls. Million barrels of oil or other liquid hydrocarbons.
MMBtu. Million British thermal units. The energy value of natural gas is approximately 1.031 MMBtu at standard temperature and pressure for dry natural gas and approximately 1.103 MMBtu per Mcf at standard temperature and pressure for rich natural gas.
MMcf. Million cubic feet of gas.
MMcfe. Million cubic feet equivalent, determined using the ratio of six Mcf of gas to one Bbl of oil, condensate or gas liquids.
Multilateral drilling. A method of drilling whereby a well has more than one branch radiating from the main wellbore.
Net acres or net wells. The sum of the fractional working interests owned in gross acres or wells, as the case may be.
NYMEX. New York Mercantile Exchange.
Open hole. Uncased portion of a well.
Open-hole completion. A method of preparing a well for production in which no production casing or liner is set opposite the producing formation. Reservoir fluids flow unrestricted into the open wellbore. An open-hole completion has limited use in rather special situations.
PV-10 or present value of estimated future net revenues. An estimate of the present value of the estimated future net revenues from proved oil and gas reserves at a date indicated after deducting estimated production and ad valorem taxes, future capital costs and operating expenses, but before deducting any estimates of federal income taxes. The estimated future net revenues are discounted at an annual rate of 10%, in accordance with the Securities and Exchange Commission's practice, to determine their "present value." The present value is shown to indicate the effect of time on the value of the revenue stream and should not be construed as being the fair market value of the properties. Estimates of future net revenues are made using oil and gas prices and operating costs at the date indicated and held constant for the life of the reserves.
Productive well. A well that is found to be capable of producing hydrocarbons in sufficient quantities such that proceeds from the sale of such production exceed production expenses and taxes.
101
Prospect. A specific geographic area which, based on supporting geological, geophysical or other data and also preliminary economic analysis using reasonably anticipated prices and costs, is deemed to have potential for the discovery of commercial hydrocarbons.
Proved developed non-producing reserves. Proved reserves that are shut-in reserves or behind-pipe reserves. Shut-in reserves are reserves expected to be recovered from completion intervals which are open at the time of the estimate, but which have not started producing, wells which were shut-in for market conditions or pipeline connections, or wells not capable of production for mechanical reasons. Behind-pipe reserves are reserves expected to be recovered from zones in existing wells, which will require additional completion work or future re-completion prior to the start of production.
Proved developed producing reserves. Proved developed reserves that are expected to be recovered from completion intervals currently open in existing wells and capable of production to market.
Proved developed reserves. Proved reserves that can be expected to be recovered from existing wells with existing equipment and operating methods.
Proved reserves. The estimated quantities of oil, gas and gas liquids that geological and engineering data demonstrate with reasonable certainty to be recoverable in future years from known reservoirs under existing economic and operating conditions.
Proved undeveloped reserves. Proved reserves that are expected to be recovered from new wells on undrilled acreage or from existing wells where a relatively major expenditure is required for recompletion.
Reserve Audit. The process of examining Reserve Information estimated by others and contained in a reserve report. Reserve Information consists of various estimates pertaining to the extent and value of oil and gas properties and may, but will not necessarily, include estimates of (i) reserves, (ii) the future production rates from such reserves, (iii) the future net revenue from such reserves and (iv) the present value of such future net revenue.
Reserve life index. This index is calculated by dividing year-end reserves by the average production during the past year to estimate the number of years of remaining production.
Reservoir. A porous and permeable underground formation containing a natural accumulation of producible oil and/or gas that is confined by impermeable rock or water barriers and is individual and separate from other reservoirs.
Secondary recovery. An artificial method or process used to restore or increase production from a reservoir after the primary production by the natural producing mechanism and reservoir pressure has experienced partial depletion. Gas injection and waterflooding are examples of this technique.
Tcf. Trillion cubic feet of gas.
Tcfe. Trillion cubic feet equivalent, determined using the ratio of six Mcf of gas to one Bbl of oil, condensate or gas liquids.
Underbalanced drilling. Drilling under conditions where the pressure being exerted inside the wellbore (from the drilling fluids) is less than the pressure of the oil or gas in the formation.
Undeveloped acreage. Lease acreage on which wells have not been drilled or completed to a point that would permit the production of commercial quantities of oil or gas regardless of whether or not such acreage contains proved reserves.
Waterflooding. A secondary recovery operation in which water is injected into the producing formation in order to maintain reservoir pressure and force oil toward and into the producing wells.
Working interest. The operating interest that gives the owner the right to drill, produce and conduct operating activities on the property and receive a share of production.
/d. "Per day" when used with volumetric units or dollars.
102
ELLORA ENERGY INC.
Index To Financial Statements
F-1
REPORT OF INDEPENDENT REGISTERED PUBLIC ACCOUNTING FIRM
Board of Directors
Ellora Energy Inc.
Boulder, Colorado
We have audited the accompanying balance sheets of Ellora Energy Inc. and subsidiaries as of December 31, 2006 and 2005, and the related statements of income, comprehensive income, stockholders' equity, and cash flows for each of the three years in the period ended December 31, 2006. These financial statements are the responsibility of the Company's management. Our responsibility is to express an opinion on these financial statements based on our audits.
We conducted our audits in accordance with the standards of the Public Company Accounting Oversight Board (United States). Those standards require that we plan and perform the audit to obtain reasonable assurance about whether the financial statements are free of material misstatement. An audit includes examining, on a test basis, evidence supporting the amounts and disclosures in the financial statements. An audit also includes assessing the accounting principles used and significant estimates made by management, as well as evaluating the overall financial statement presentation. We believe that our audits provide a reasonable basis for our opinion.
In our opinion, the financial statements referred to above present fairly, in all material respects, the financial position of Ellora Energy Inc. and affiliated entities as of December 31, 2006 and 2005, and the results of their operations and their cash flows for each of the three years in the period ended December 31, 2006 in conformity with U.S. generally accepted accounting principles.
As discussed in Note 1 to the accompanying financial statements, effective January 1, 2006, the Company adopted Statement of Financial Accounting Standards No. 123(R),Share-Based Payment.
HEIN & ASSOCIATES LLP
Denver, Colorado
April 11, 2007
F-2
ELLORA ENERGY INC. AND SUBSIDIARIES
BALANCE SHEETS
| | December 31, | |||||||||
|---|---|---|---|---|---|---|---|---|---|---|
| | 2005 Combined | 2006 Consolidated | ||||||||
| ASSETS | ||||||||||
| CURRENT ASSETS: | ||||||||||
| Cash | $ | 3,161,000 | $ | 4,329,000 | ||||||
| Accounts receivable: | ||||||||||
| Oil and gas sales | 10,522,000 | 6,057,000 | ||||||||
| Joint interest billings | 1,242,000 | 615,000 | ||||||||
| Income taxes receivable | 500,000 | 500,000 | ||||||||
| Derivative asset | 2,625,000 | 388,000 | ||||||||
| Oil and gas equipment inventory | 1,409,000 | 1,046,000 | ||||||||
| Prepaids and other current assets | 1,431,000 | 1,223,000 | ||||||||
| Total current assets | 20,890,000 | 14,158,000 | ||||||||
| PROPERTY AND EQUIPMENT: | ||||||||||
| Oil and gas properties, successful efforts method: | ||||||||||
| Proved properties | 135,828,000 | 194,899,000 | ||||||||
| Unproved properties | 35,768,000 | 33,456,000 | ||||||||
| Pipeline properties | 11,878,000 | 12,266,000 | ||||||||
| Furniture and equipment | 1,152,000 | 1,829,000 | ||||||||
| Total property and equipment | 184,626,000 | 242,450,000 | ||||||||
| Less accumulated depletion and depreciation | (14,532,000 | ) | (26,211,000 | ) | ||||||
| Net property and equipment | 170,094,000 | 216,239,000 | ||||||||
| OTHER LONG-TERM ASSETS | 1,316,000 | 1,516,000 | ||||||||
| TOTAL ASSETS | $ | 192,300,000 | $ | 231,913,000 | ||||||
| LIABILITIES AND STOCKHOLDERS' EQUITY | ||||||||||
| CURRENT LIABILITIES: | ||||||||||
| Accounts payable | $ | 5,128,000 | $ | 9,407,000 | ||||||
| Accrued expenses | 1,264,000 | 291,000 | ||||||||
| Production taxes payable | 1,373,000 | 396,000 | ||||||||
| Oil and gas revenues payable | 9,477,000 | 4,984,000 | ||||||||
| Total current liabilities | 17,242,000 | 15,078,000 | ||||||||
| LONG-TERM DEBT | 25,750,000 | 16,000,000 | ||||||||
| DEFERRED INCOME TAXES, NET | 16,923,000 | 23,347,000 | ||||||||
| ASSET RETIREMENT OBLIGATIONS | 716,000 | 1,322,000 | ||||||||
| COMMITMENTS (Note 10) | ||||||||||
| STOCKHOLDERS' EQUITY: | ||||||||||
| Ellora Energy Inc. preferred stock, $.001 par value, 10,000,000 shares authorized, -0- outstanding | — | — | ||||||||
| Ellora Energy Inc. common stock, $.001 par value, 125,000,000 shares authorized, 42,307,705 and 44,807,697 issued and outstanding, respectively | 42,000 | 45,000 | ||||||||
| Additional paid-in capital | 116,811,000 | 144,923,000 | ||||||||
| Subscription receivable and accrued interest | (6,224,000 | ) | — | |||||||
| Retained earnings | 20,818,000 | 31,029,000 | ||||||||
| Accumulated other comprehensive income | 222,000 | 169,000 | ||||||||
| Total stockholders' equity | 131,669,000 | 176,166,000 | ||||||||
| TOTAL LIABILITIES AND STOCKHOLDERS' EQUITY | $ | 192,300,000 | $ | 231,913,000 | ||||||
See accompanying notes to these financial statements.
F-3
ELLORA ENERGY INC. AND SUBSIDIARIES
STATEMENTS OF INCOME
| | For the Years Ended December 31, | ||||||||||
|---|---|---|---|---|---|---|---|---|---|---|---|
| | 2004 Consolidated | 2005 Combined | 2006 Consolidated | ||||||||
| REVENUE: | |||||||||||
| Oil and gas sales | $ | 22,780,000 | $ | 47,595,000 | $ | 52,050,000 | |||||
| Gas aggregation and pipeline sales | 1,103,000 | 5,586,000 | 4,506,000 | ||||||||
| (Loss) gain on oil and gas hedging activities | — | (115,000 | ) | 6,077,000 | |||||||
| Interest income and other | 272,000 | 16,000 | 55,000 | ||||||||
| Equity investment income | 116,000 | — | — | ||||||||
| Total revenue | 24,271,000 | 53,082,000 | 62,688,000 | ||||||||
| COSTS AND EXPENSES: | |||||||||||
| Lease operating expense | 4,539,000 | 6,141,000 | 10,091,000 | ||||||||
| Production taxes | 1,291,000 | 1,813,000 | 1,973,000 | ||||||||
| Gas aggregation and pipeline cost of sales | 1,316,000 | 4,020,000 | 5,247,000 | ||||||||
| Depreciation, depletion and amortization | 3,479,000 | 8,189,000 | 11,770,000 | ||||||||
| Exploration | — | 422,000 | 3,441,000 | ||||||||
| General and administrative (including $4,857,000 and $1,380,000 of stock compensation for the years ended December 31, 2005 and 2006) | 3,407,000 | 11,766,000 | 11,889,000 | ||||||||
| Interest expense | 355,000 | 716,000 | 1,642,000 | ||||||||
| Total costs and expenses | 14,387,000 | 33,067,000 | 46,053,000 | ||||||||
| INCOME BEFORE TAXES | 9,884,000 | 20,015,000 | 16,635,000 | ||||||||
INCOME TAXES: | |||||||||||
| Deferred income tax expense | 3,850,000 | 9,234,000 | 6,424,000 | ||||||||
| NET INCOME | $ | 6,034,000 | $ | 10,781,000 | $ | 10,211,000 | |||||
| BASIC INCOME PER SHARE | $ | .22 | $ | .28 | $ | .23 | |||||
| DILUTED INCOME PER SHARE | $ | .22 | $ | .27 | $ | .23 | |||||
| WEIGHTED AVERAGE NUMBER OF SHARES OF COMMON STOCK—BASIC | 27,541,033 | 38,753,063 | 43,485,783 | ||||||||
| WEIGHTED AVERAGE NUMBER OF SHARES OF COMMON STOCK—DILUTED | 27,945,641 | 40,209,654 | 45,339,821 | ||||||||
See accompanying notes to these financial statements.
F-4
ELLORA ENERGY INC. AND SUBSIDIARIES
STATEMENTS OF COMPREHENSIVE INCOME
| | For the Years Ended December 31, | ||||||||||
|---|---|---|---|---|---|---|---|---|---|---|---|
| | 2004 Consolidated | 2005 Combined | 2006 Consolidated | ||||||||
| NET INCOME | $ | 6,034,000 | $ | 10,781,000 | $ | 10,211,000 | |||||
| OTHER COMPREHENSIVE INCOME (LOSS): | |||||||||||
| Change in derivative instrument fair value, net of tax | 300,000 | 24,000 | (53,000 | ) | |||||||
| COMPREHENSIVE INCOME | $ | 6,334,000 | $ | 10,805,000 | $ | 10,158,000 | |||||
See accompanying notes to these financial statements.
F-5
ELLORA ENERGY INC. AND SUBSIDIARIES
STATEMENTS OF STOCKHOLDERS' EQUITY AND COMPREHENSIVE INCOME
FOR THE YEARS ENDED DECEMBER 31, 2004 (CONSOLIDATED), 2005 (COMBINED), AND 2006 (CONSOLIDATED)
| | Ellora Energy Inc. | | | | ||||||||||||||||||
|---|---|---|---|---|---|---|---|---|---|---|---|---|---|---|---|---|---|---|---|---|---|---|
| | Common Stock | | | | Accumulated Other Comprehensive Loss | | ||||||||||||||||
| | Additional Paid-In Capital | Subscription Receivable | Retained Earnings | | ||||||||||||||||||
| | Shares | Amount | Total | |||||||||||||||||||
| BALANCES, January 1, 2004 | 24,964,338 | $ | 25,000 | $ | 36,677,000 | $ | (3,180,000 | ) | $ | 4,003,000 | $ | (102,000 | ) | $ | 37,423,000 | |||||||
| Sale of stock | 3,236,867 | 4,000 | 7,996,000 | — | — | — | 8,000,000 | |||||||||||||||
| Stock issued for notes | 498,761 | — | 1,232,000 | (1,232,000 | ) | — | — | — | ||||||||||||||
| Accrued interest on notes | — | — | 237,000 | (237,000 | ) | — | — | — | ||||||||||||||
| Net income | — | — | — | — | 6,034,000 | — | 6,034,000 | |||||||||||||||
| Change in derivative instrument fair value | — | — | — | — | — | 300,000 | 300,000 | |||||||||||||||
| BALANCES, December 31, 2004 | 28,699,966 | 29,000 | 46,142,000 | (4,649,000 | ) | 10,037,000 | 198,000 | 51,757,000 | ||||||||||||||
| Sale of stock | 12,994,879 | 13,000 | 64,237,000 | — | — | — | 64,250,000 | |||||||||||||||
| Stock issued for notes | 612,860 | — | 1,265,000 | (1,265,000 | ) | — | — | — | ||||||||||||||
| Accrued interest on notes | — | — | 310,000 | (310,000 | ) | — | — | — | ||||||||||||||
| Non-cash compensation | — | — | 4,857,000 | — | — | — | 4,857,000 | |||||||||||||||
| Net income | — | — | — | — | 10,781,000 | — | 10,781,000 | |||||||||||||||
| Change in derivative instrument fair value | — | — | — | — | — | 24,000 | 24,000 | |||||||||||||||
| BALANCES, December 31, 2005 | 42,307,705 | 42,000 | 116,811,000 | (6,224,000 | ) | 20,818,000 | 222,000 | 131,669,000 | ||||||||||||||
| Sale of stock | 2,499,992 | 3,000 | 26,531,000 | — | — | 26,534,000 | ||||||||||||||||
| Accrued interest on notes | — | — | 201,000 | (201,000 | ) | — | — | — | ||||||||||||||
| Repayment of subscription receivable | — | — | — | 6,425,000 | — | — | 6,425,000 | |||||||||||||||
| Non-cash compensation | — | — | 1,380,000 | — | — | 1,380,000 | ||||||||||||||||
| Net income | — | — | — | — | 10,211,000 | — | 10,211,000 | |||||||||||||||
| Change in derivative instrument fair value | — | — | — | — | — | (53,000 | ) | (53,000 | ) | |||||||||||||
| BALANCES, December 31, 2006 | 44,807,697 | $ | 45,000 | $ | 144,923,000 | $ | — | $ | 31,029,000 | $ | 169,000 | $ | 176,166,000 | |||||||||
See accompany notes to these financial statements.
F-6
ELLORA ENERGY INC. AND SUBSIDIARIES
STATEMENTS OF CASH FLOWS
| | For the Years Ended December 31, | ||||||||||||
|---|---|---|---|---|---|---|---|---|---|---|---|---|---|
| | 2004 Consolidated | 2005 Combined | 2006 Consolidated | ||||||||||
| CASH FLOWS FROM OPERATING ACTIVITIES: | |||||||||||||
| Net income | $ | 6,034,000 | $ | 10,781,000 | $ | 10,211,000 | |||||||
| Adjustments to reconcile net income to net cash provided by operating activities: | |||||||||||||
| Depreciation, depletion and amortization | 3,479,000 | 8,189,000 | 11,770,000 | ||||||||||
| Amortization of debt asset | — | 128,000 | 2,470,000 | ||||||||||
| Amortization of debit issue costs | — | — | 187,000 | ||||||||||
| Deferred income taxes | 3,850,000 | 9,234,000 | 6,424,000 | ||||||||||
| Income from equity investment | (116,000 | ) | — | — | |||||||||
| Exploration | — | 387,000 | 1,629,000 | ||||||||||
| Non-cash compensation expense | — | 4,857,000 | 1,380,000 | ||||||||||
| Changes in operating assets and liabilities: | |||||||||||||
| Accounts receivable | (3,165,000 | ) | (7,289,000 | ) | 5,092,000 | ||||||||
| Prepaid and other current assets | 322,000 | (2,428,000 | ) | (1,595,000 | ) | ||||||||
| Other long-term assets | — | (56,000 | ) | (837,000 | ) | ||||||||
| Accounts payable and accrued expenses | 4,910,000 | (1,065,000 | ) | (3,080,000 | ) | ||||||||
| Oil and gas revenues payable | 999,000 | 7,428,000 | (4,493,000 | ) | |||||||||
| Net cash provided by operating activities | 16,313,000 | 30,166,000 | 29,158,000 | ||||||||||
| CASH FLOWS FROM INVESTING ACTIVITIES: | |||||||||||||
| Proceeds from sale of oil and gas properties | — | — | 2,602,000 | ||||||||||
| Acquisition of Shelby County Properties | — | (25,795,000 | ) | — | |||||||||
| Drilling capital expenditures | (20,616,000 | ) | (32,779,000 | ) | (51,746,000 | ) | |||||||
| Acquisition of Presco Western, net of working capital of $285,000 | — | (45,424,000 | ) | — | |||||||||
| Pipeline capital expenditures | (6,711,000 | ) | (1,717,000 | ) | (388,000 | ) | |||||||
| Purchase of other property and equipment | (164,000 | ) | (640,000 | ) | (677,000 | ) | |||||||
| Net cash used in investing activities | (27,491,000 | ) | (106,355,000 | ) | (50,209,000 | ) | |||||||
| CASH FLOWS FROM FINANCING ACTIVITIES: | |||||||||||||
| Proceeds from sale of Ellora Energy Inc. common stock | 8,000,000 | 64,250,000 | 26,534,000 | ||||||||||
| Proceeds from repayment of subscription receivable | — | — | 6,425,000 | ||||||||||
| Proceeds from long-term debt under credit agreement | 4,350,000 | 26,750,000 | 47,940,000 | ||||||||||
| Payments of long-term debt under credit agreement | — | (11,683,000 | ) | (57,690,000 | ) | ||||||||
| Loan origination fees | — | — | (800,000 | ) | |||||||||
| Loan termination fees | — | — | (190,000 | ) | |||||||||
| Cash paid for derivative asset | — | (2,715,000 | ) | — | |||||||||
| Net cash provided by financing activities | 12,350,000 | 76,602,000 | 22,219,000 | ||||||||||
| INCREASE IN CASH | 1,172,000 | 413,000 | 1,168,000 | ||||||||||
| CASH, beginning of year | 1,576,000 | 2,748,000 | 3,161,000 | ||||||||||
| CASH, end of year | $ | 2,748,000 | $ | 3,161,000 | $ | 4,329,000 | |||||||
| SUPPLEMENTAL CASH FLOW INFORMATION: | |||||||||||||
| Cash paid for interest | $ | 276,000 | $ | 702,000 | $ | 1,250,000 | |||||||
| Cash paid for taxes | $ | — | $ | — | $ | — | |||||||
| NON CASH INVESTING ACTIVITIES: | |||||||||||||
| Changes in working capital related to drilling expenditures | $ | — | $ | 1,156,000 | $ | 4,150,000 | |||||||
| Transfers from inventory to oil and gas properties | $ | — | $ | — | $ | 2,166,000 | |||||||
| NON CASH FINANCING ACTIVITIES: | |||||||||||||
| Stock issued for subscription agreement | $ | 1,232,000 | $ | 1,265,000 | $ | — | |||||||
| Accrued interest on subscription notes | $ | 237,000 | $ | 310,000 | $ | 201,000 | |||||||
See accompanying notes to these financial statements.
F-7
ELLORA ENERGY INC. AND SUBSIDIARIES
NOTES TO FINANCIAL STATEMENTS
1. SUMMARY OF SIGNIFICANT ACCOUNTING POLICIES:
Organization—Ellora Energy Inc. was incorporated on June 1, 2002 in the State of Delaware to engage in the acquisition, exploration, development and production of oil and gas properties. During April 2005, Ellora's management established Ellora Oil and Gas Inc. to acquire Presco Western, LLC, which is a party to a farmout agreement in the Hugoton field in Kansas. Ellora Oil and Gas Inc. also acquired Ellora Energy Inc.'s assets in Colorado and its interests in a joint venture with Centurion Exploration Company. Ellora Energy Inc. and Ellora Oil and Gas Inc. operate oil and gas properties in Texas, Louisiana, Colorado and Kansas and, when combined, have five wholly owned subsidiaries. Ellora Energy Inc., Ellora Oil and Gas Inc. and their respective subsidiaries are collectively referred to herein as "Ellora". In July, 2006, Ellora Energy Inc. and Ellora Oil and Gas Inc. merged with Ellora Energy Inc. as the surviving entity.
Basis of Presentation of Consolidated Financial Statements—The accompanying consolidated financial statements as of and for the year ended December 31, 2006 include the accounts of Ellora Energy Inc. and it subsidiaries, all of which are wholly owned. All significant intercompany transactions have been eliminated in consolidation. The accompanying combined financial statements as of and for the year ended December 31, 2005 include all accounts of Ellora Energy Inc. and Ellora Oil and Gas Inc. These entities are related due to their common ownership. On July 12, 2006, Ellora completed the private placement of 2,499,992 shares of its common stock pursuant to Rule 144A and Section 4(2) under the Securities Act of 1933, as amended. Immediately prior to the private placement, the shares of Ellora Oil and Gas Inc. were exchanged for shares of Ellora Energy Inc. Each share of Ellora Oil and Gas Inc. was exchanged for 2.499391 shares of Ellora Energy Inc. The exchange factor was determined by the management and approved by the Board of Directors of Ellora Oil and Gas Inc. and Ellora Energy Inc. based upon an analysis of management's estimates of the relative equity value of each of Ellora Oil and Gas Inc. and Ellora Energy Inc. These estimates of equity value were based on an analysis of estimated cash flow and net asset value for both Ellora Energy Inc. and Ellora Oil and Gas Inc. relative to comparable public companies' cash flow, net asset valuations and equity valuations. The shares were then allocated based on each company's respective value. Immediately after the exchange of the shares, all shares of Ellora Energy Inc. common stock were split 8.09216-for-1. All shares and earnings per share calculations for all periods in this document have been restated to reflect the effect of the stock split.
Cash and Cash Equivalents—Cash equivalents consist of money market accounts and investments which have an original maturity of three months or less. At December 31, 2005 and 2006, the Company maintained cash balances with a commercial bank in excess of FDIC insurance limits.
Fair Value of Financial Instruments—Ellora's financial instruments, including cash and cash equivalents, accounts receivable and payable are carried at cost, which approximates their fair value because of the short-term maturity of these instruments. The credit agreement has a recorded value that approximates its fair value since its variable interest rate is tied to current market rates. Ellora's derivative instruments are marked-to-market with changes in value being recorded in accumulated other comprehensive income.
Concentration of Credit Risk—Substantially all of Ellora's receivables are within the oil and gas industry, primarily from the sale of oil and gas products and billings to working interest owners.
F-8
Collectibility is affected by the general economic conditions of the industry. Most of the receivables are not collateralized and to date, Ellora has had minimal bad debts.
Oil and Gas Producing Operations—Ellora follows the successful efforts method of accounting for its oil and gas properties. Under this method of accounting, all property acquisition costs and costs of exploratory and development wells are capitalized when incurred, pending determination of whether the well has found proved reserves. If an exploratory well has not found proved reserves, the costs of drilling the well and other associated costs are charged to expense. During 2005 and 2006, the Company recorded charges to exploration expense in the amounts of $422,000 and $1,352,000, respectively, for exploratory wells that did not find proved reserves. The costs of development wells are capitalized whether productive or nonproductive. Costs incurred to maintain wells and related equipment and lease and well operating costs are charged to expense as incurred. Gains and losses arising from sales of properties are included in income. Geological and geophysical costs of exploratory prospects and the costs of carrying and retaining unproved properties are expensed as incurred. An impairment is recorded for unproved properties if the capitalized costs are not considered to be realizable.
Depletion, depreciation and amortization ("DD&A") of capitalized costs of proved oil and gas properties is provided for on a field-by-field basis using the units of production method based upon proved reserves. The computation of DD&A takes into consideration the anticipated proceeds from equipment salvage and Ellora's expected cost to abandon its well interests. Depletion expense for oil and gas producing property and related equipment was $3,107,000, $7,562,000, and $10,884,000 for the years ended December 31, 2004, 2005 and 2006, respectively.
In accordance with Statement of Financial Accounting Standards (SFAS) No. 144, "Accounting for the Impairment of Long-Lived Assets and for Long-Lived Assets to Be Disposed Of," Ellora assesses its proved oil and gas properties for impairment whenever events or circumstances indicate that the carrying value of the assets may not be recoverable. The impairment test compares undiscounted future net cash flows to the assets' net book value. If the net capitalized costs exceed future net cash flows, then the cost of the property is written down to "fair value". Fair value for oil and natural gas properties is generally determined based on discounted future net cash flows.
Abandonment Liability—Effective January 1, 2003, Ellora adopted the provisions of SFAS No. 143, "Accounting for Asset Retirement Obligations." This Statement generally applies to legal obligations associated with the retirement of long-lived assets that result from the acquisition, construction, development and/or the normal operation of a long-lived asset. SFAS No. 143 requires Ellora to recognize the fair value of asset retirement obligations in the financial statements by capitalizing that cost as a part of the cost of the related asset. In regard to Ellora, this Statement applies directly to the plug and abandonment liabilities associated with Ellora's net working interest in well bores. The additional carrying amount is depleted over the estimated lives of the properties. The discounted liability is based on historical abandonment costs in specific areas and is accreted at the end of each accounting period through charges to depreciation, depletion and amortization expense. If the obligation is settled for other than the carrying amount, then a gain or loss is recognized on settlement.
F-9
Revenue Recognition—Ellora recognizes oil and gas revenues for only its ownership percentage of total production under the entitlement method. Purchase, sale and transportation of natural gas are recognized upon completion of the sale and when transported volumes are delivered according to the terms of the contract.
Derivative Instruments—Ellora enters into derivative contracts to hedge future natural gas and crude oil production in order to mitigate the risk of market price fluctuations. Ellora does not enter into derivative instruments for speculative trading purposes.
All derivatives are recognized on the balance sheet and measured at fair value. Realized gains and losses as well as the ineffective portion of hedge derivatives, if any, are recorded as a derivative fair value gain or loss in the consolidated statements of income. Unrealized gains and losses on effective cash flow hedge derivatives are recorded as a component of accumulated other comprehensive income (loss). When the hedged transaction occurs, the realized gain or loss on the hedge derivative is transferred from accumulated other comprehensive income (loss) to earnings. Realized gains and losses on commodity hedge derivatives are recognized as "gain (loss) on oil and gas hedging activities."
Ellora has formally documented all relationships between hedging instruments and hedged items, as well the risk management objectives and strategy for undertaking the hedge. This process includes specific identification of the hedging instrument and the hedged item, the nature of the risk being hedged and the manner in which the hedging instrument's effectiveness will be assessed.
To designate a derivative as a cash flow hedge, Ellora documents at the hedge's inception its assessment as to whether the derivative will be highly effective in offsetting expected changes in cash flows from the item hedged. This assessment, which is updated at least quarterly, is generally based on the most recent relevant historical correlation between the derivative and the item hedged. The ineffective portion of the hedge, if any, is calculated as the difference between the change in fair value of the derivative and the estimated change in cash flows from the item hedged. If, during the derivative's term, Ellora determines the hedge is no longer highly effective, hedge accounting is prospectively discontinued and any remaining unrealized gains or losses on the effective portion of the derivative are reclassified to earnings when the underlying transaction occurs. If it is determined that the designated hedge transaction is not likely to occur, any unrealized gains or losses are recognized immediately in the consolidated statements of income as a derivative fair value gain or loss.
At December 31, 2006, accumulated other comprehensive income consisted of $272,000 ($169,000 after tax) of unrealized gains, representing the mark-to-market value of Ellora's open commodity contracts, designated as cash flow hedges, as of the balance sheet date. At December 31, 2005, accumulated other comprehensive income consisted of $358,000 ($222,000 after tax) of unrealized gains on Ellora's open commodity hedge derivatives. Included as a portion of accumulated other comprehensive loss as of December 31, 2004 was $319,000 ($198,000 after tax) of unrealized gains on Ellora's open commodity hedges.
Prior Year Reclassifications—Certain prior period balances reclassified to conform to the current year presentation, and such reclassifications had no impact on net income or stockholders' equity previously reported.
F-10
Oil and Gas Sales Receivable—Oil and gas sales, and aggregation and pipeline revenues are recognized as income when the oil or gas is produced and sold. Monthly, Ellora makes estimates of the amount of production delivered to the purchaser and the price to be received.
Joint Interest Billings Receivable—Joint interest billings receivable represent amounts receivable for lease operating expenses and other costs due from third party working interest owners in the wells that Ellora operates. The receivable is recognized when the cost is incurred and the related payable and Ellora's share of the cost is recorded. Most receivables are due within 30 days of receipt. The receivables are reviewed periodically and appropriate actions are taken on past due amounts, if any.
Oil and Gas Equipment Inventory—Oil and gas equipment inventory consists primarily of tubular goods and production equipment, stated at the lower of weighted-average cost or market.
Per Share Amounts—Basic income per share is computed using the weighted average number of shares outstanding. Diluted income per share reflects the potential dilution that would occur if stock options were exercised using the average market price for Ellora's stock for the period. Total potential dilutive shares based on options outstanding at December 31, 2006 were 1,854,038.
Ellora's calculation of earning per share of common stock is as follows:
| | 2004 | 2005 | 2006 | |||||||||||||||||||||
|---|---|---|---|---|---|---|---|---|---|---|---|---|---|---|---|---|---|---|---|---|---|---|---|---|
| | Net Income | Shares | Net Income Per Share | Net Income | Shares | Net Income Per Share | Net Income | Shares | Net Income Per Share | |||||||||||||||
| Basic earnings per share | $ | 6,034,000 | 27,541,033 | $ | .22 | $ | 10,781,000 | 38,753,063 | $ | .28 | $ | 10,211,000 | 43,485,783 | $ | .23 | |||||||||
| Effect of dilutive shares of common stock from stock options | 404,608 | — | 1,456,591 | (.01 | ) | 1,854,038 | — | |||||||||||||||||
| Diluted earnings per share | $ | 6,034,000 | 27,945,641 | $ | .22 | $ | 10,781,000 | 40,209,654 | $ | .27 | $ | 10,211,000 | 45,339,821 | $ | .23 | |||||||||
Oil and Gas Revenue Payable—Oil and gas revenue payable represents amounts due to third party revenue interest owners for their share of oil and gas revenue collected on their behalf by Ellora. The payable is recorded when Ellora recognizes oil and gas sales and records the related oil and gas sales receivable.
Income Taxes—Ellora accounts for income taxes under the liability method, which requires recognition of deferred tax assets and liabilities for the expected future tax consequences of events that have been included in the financial statements or tax returns. Under this method, deferred tax assets and liabilities are determined based on the difference between the financial statements and tax bases of assets and liabilities using enacted tax rates in effect for the year in which the differences are expected to reverse.
Use of Estimates and Certain Significant Estimates—The preparation of Ellora's financial statements in conformity with accounting principles generally accepted in the United States of America requires Ellora's management to make estimates and assumptions that affect the amounts reported in these financial statements and accompanying notes. Actual results could differ from those estimates. These estimates include realizability of receivables, selection of the useful lives for
F-11
property and equipment and timing and costs associated with its retirement obligations. Significant assumptions are also required in the valuation of proved oil and gas reserves, which will affect the depletion calculation and possibly any impairment of oil and gas properties. It is at least reasonably possible those estimates could be revised in the near term and those revisions could be material.
English Bay Pipeline, L.P.—During 2002, Ellora Energy Inc. acquired a 25% interest in English Bay Pipeline, L.P. (English Bay) in Texas. The pipeline aggregates natural gas through the purchase of production from properties in Shelby County, Texas in which Ellora Energy Inc. has an interest and the purchase of gas from other producers and shippers that is delivered through English Bay. This investment was accounted for under the equity method until April 2004. In April 2004, Ellora Energy Inc. purchased the remaining 75% interest in English Bay for $6,711,000. The financial information of English Bay is included in Ellora's consolidated financial statements as of and for the year ended December 31, 2006 and in the combined financial statements as of and for the year ended December 31, 2005, and in the consolidated financial statements as of December 31, 2004, and for the period from April 15, 2004 to December 31, 2004.
The English Bay Pipeline provides gathering services to wells operated by Ellora. For the years ended December 31, 2005, and 2006, English Bay recorded $1,137,000 and $1,113,000, respectively, of gathering income that is eliminated in the consolidation.
Change in Accounting Principle—On December 16, 2004, the Financial Accounting Standards Board ("FASB") published Statement of Financial Accounting Standards No. 123 (Revised 2004), "Share Based Payment" ("SFAS No. 123(R)"). Share based payment transactions within the scope of SFAS No. 123(R) include stock options, restricted stock plans, performance based awards, stock appreciation rights, and employee share purchase plans. This statement supersedes Accounting Principles Board Opinion No. 25, "Accounting for Stock Issued to Employees" (APB No. 25). SFAS No. 123(R) requires a company to measure the grant date fair value of equity awards given to employees in exchange for services and recognize that cost, less estimated forfeitures, over the period that such services are performed. The fair value of stock options is determined using the Black-Scholes valuation model. Ellora adopted SFAS No. 123(R) on January 1, 2006 using the modified prospective transition method.
Prior to adopting SFAS No. 123(R), Ellora followed the provisions of SFAS No. 123, "Accounting for Stock Based Compensation," for all issuances of stock options to non-employees of Ellora. Ellora followed the provisions of APB Opinion No. 25 (Opinion 25), "Accounting for Stock Issued to Employees" for all issuances of stock options to their employees. In accordance with APB 25, prior to January 1, 2006, no compensation cost has been recognized for stock options granted to employees under the 2002 Plan. Under the modified prospective method of adopting SFAS No. 123(R), compensation cost recognized for the year ended December 31, 2006 includes compensation cost for all stock option awards granted prior to, but not yet vested as of January 1, 2006, based on the grant date fair value, less estimated forfeitures. In accordance with the modified prospective method, prior period results have not been restated. Refer to further disclosure related to Ellora's adoption of SFAS No. 123(R) in Note 6, "Stockholders' Equity."
New Accounting Pronouncements—In September 2006, the FASB issued SFAS No. 157, "Fair Value Measurements." SFAS No. 157 defines fair value, establishes a framework for measuring fair value
F-12
in generally accepted accounting principles and expands disclosures about fair value measurements. SFAS No. 157 is effective for fiscal years beginning after November 15, 2007. While the Company is currently evaluating the impact of SFAS No. 157, the Company does not believe the impact will be material to its results of operations.
In February 2007, the SFAS issued SFAS No. 159, The Fair Value Option for Financial Assets and Financial Liabilities (SFAS 159). SFAS 159 permits an entity to irrevocably elect fair value on a contract-by-contract basis as the initial and subsequent measurement attribute for many financial assets and liabilities and certain other items including insurance contracts. Entities electing the fair value option would be required to recognize changes in fair value in earnings and to expense upfront cost and fees associated with the item for which the fair value option is elected. SFAS 159 is effective for fiscal years beginning after November 15, 2007. Early adoption is permitted as of the beginning of a fiscal year that begins on or before November 15, 2007, provided the entity also elects to apply the provisions of SFAS No. 157, Fair Value Measurements. The Company is currently evaluating the impact, if any, of adopting SFAS 159 on its financial condition or results of operations.
2. ACQUISITIONS AND DIVESTURES:
- •
- On April 29, 2005, Ellora acquired Presco Western, LLC for approximately $45,000,000 in cash. The acquisition was accounted for using the purchase method of accounting and the purchase price was allocated primarily to oil and gas properties and net working capital acquired.
- •
- On August 31, 2005, Ellora acquired additional interests in existing properties located in Shelby County, Texas from a minority stockholder of Ellora Energy Inc. for approximately $26,000,000 in cash. The acquisition was accounted for using the purchase method of accounting and the purchase price was allocated entirely to oil and gas properties.
In December of 2006, the Company sold its interest in non-core producing wells and non-producing acreage in East Texas and Louisiana to a related party at its fair market value of $3,000,000, less closing adjustments. No gain or loss was recognized on the transaction.
Ellora completed two acquisitions during 2005:
The results of operations from the acquisitions are included with our results from the respective acquisition dates noted above. The table below summarizes the preliminary allocation of the
F-13
purchase price for each transaction based on the acquisition date fair values of the assets acquired and liabilities assumed.
| | Presco Western, LLC | Shelby County | ||||
|---|---|---|---|---|---|---|
| Purchase Price: | ||||||
| Cash paid, net of cash received | $ | 45,424,000 | $ | 25,795,000 | ||
| Total | $ | 45,424,000 | $ | 25,795,000 | ||
| Allocation of Purchase Price: | ||||||
| Working capital (including cash acquired of $285,000) | $ | 709,000 | — | |||
| Proved properties | 20,260,000 | 25,795,000 | ||||
| Unproved properties | 24,455,000 | — | ||||
| Total | $ | 45,424,000 | $ | 25,795,000 | ||
The following table reflects the unaudited pro forma oil and gas sales and net income and net income per share calculations for the twelve months ended December 31, 2004 and 2005 as though the Presco Western, LLC and Shelby County acquisitions had occurred on January 1, 2004.
| | Pro Forma Ellora (unaudited) | ||
|---|---|---|---|
| Year ended December 31, 2004: | |||
| Total revenues | $ | 32,794,000 | |
| Net income | 7,390,000 | ||
| Net income per share, basic | $ | .27 | |
| Net income per share, diluted | $ | .26 | |
| Year ended December 31, 2005: | |||
| Total revenues | $ | 51,789,000 | |
| Net income | 11,174,000 | ||
| Net income per share, basic | $ | .29 | |
| Net income per share, diluted | $ | .28 | |
The pro forma amounts above are presented for informational purposes only and not necessarily indicative of the results that would have occurred had the Presco Western, LLC and Shelby County acquisitions been consummated on January 1, 2004, nor are the pro forma amounts necessarily indicative of the future results of operations of Ellora.
F-14
3. FURNITURE AND EQUIPMENT:
At December 31, 2005 and 2006, furniture and equipment consists of the following:
| | 2005 Combined | 2006 Consolidated | ||||||
|---|---|---|---|---|---|---|---|---|
| Office furniture and equipment | $ | 232,000 | $ | 206,000 | ||||
| Computers | 722,000 | 923,000 | ||||||
| Leasehold | 57,000 | 64,000 | ||||||
| Other | 141,000 | 636,000 | ||||||
| Total | 1,152,000 | 1,829,000 | ||||||
| Less accumulated depreciation | (442,000 | ) | (851,000 | ) | ||||
| Furniture and equipment, net | $ | 710,000 | $ | 978,000 | ||||
Total depreciation expense related to furniture and equipment amounted to $120,000, $224,000, and $429,000 for the years ended December 31, 2004, 2005, and 2006, respectively.
4. ASSET RETIREMENT OBLIGATION:
In June 2001, the Financial Accounting Standards Board issued Statement of Financial Accounting Standards No. 143 (SFAS No. 143), "Accounting for Asset Retirement Obligations." Ellora adopted SFAS No. 143 beginning January 1, 2003. The most significant impact of this standard on Ellora was a change in the method of accruing for costs to plug and abandon oil and gas properties. Under SFAS No. 143, the fair value of asset retirement obligations is recorded as a liability when incurred, which is typically at the time the assets are placed in service. Amounts recorded for the related assets are increased by a corresponding amount of these obligations. Prospectively, the liabilities are accreted for the change in their present value and the initial capitalized costs are depleted, depreciated and amortized over the productive lives of the related assets.
At December 31, 2006, there were no assets legally restricted for purposes of settling asset retirement obligations. The following is a reconciliation of Ellora's asset retirement obligations as of December 31:
| | 2005 Combined | 2006 Consolidated | ||||
|---|---|---|---|---|---|---|
| Beginning of year | $ | 368,000 | $ | 716,000 | ||
| Additional liabilities incurred | 167,000 | 134,000 | ||||
| Accretion expense | 29,000 | 57,000 | ||||
| Revisions to estimate | 152,000 | 415,000 | ||||
| End of year | $ | 716,000 | $ | 1,322,000 | ||
F-15
5. LONG-TERM DEBT:
Long-term debt consisted of the following at December 31, 2005 and 2006:
| | December 31, 2005 Combined | December 31, 2006 Consolidated | ||||
|---|---|---|---|---|---|---|
| Credit Agreement. | $ | 25,750,000 | $ | 16,000,000 | ||
On February 3, 2006, Ellora entered into a $400,000,000 credit agreement with an initial borrowing base of $110,000,000 with a syndicate of banks led by JP Morgan Chase Bank, N.A. Commitment fees of 0.30% to 0.50% accrue on the unused portion of the borrowing base, depending on the utilization percentage and are included as a component of interest expense. For the year ended December 31, 2006, the weighted average interest rate on the entire outstanding principal balance was 6.48% and the effective interest rate as of December 31, 2006 was 6.63%. Interest accrues at either (1) the base rate plus a margin where the base rate is defined as the higher of the prime rate or the federal funds rate plus a margin varying from 0% to 0.75% depending on the utilization percentage of the borrowing base, or (2) at the LIBOR rate plus a margin where the margin varies from 1.25% to 2.00% depending on the utilization percentage of the borrowing base. Ellora has consistently chosen the LIBOR rate option since it delivers the lowest effective interest rate. The loan is collateralized by Ellora's oil and gas properties and includes certain financial covenants, for which Ellora was in compliance for the year ended December 31, 2006.
As of December 31, 2005, Ellora had a $40,000,000 line of credit agreement with a borrowing base of $35,000,000 with US Bank bearing interest at prime, which was 7.5% as of December 31, 2005. On February 3, 2006 the line of credit with US Bank was paid in full and terminated with the proceeds received from the JP Morgan Chase Bank line of credit agreement. The borrowing base for the JP Morgan Chase Bank credit agreement was determined at the discretion of the lenders based on the collateral value of the proved reserves that have been mortgaged to the lenders and is subject to regular redetermination on May 1 and November 1 of each year.
The credit agreement provides for interest only payments until February 3, 2010, when the entire amount borrowed is due. Ellora may, throughout the term of the credit agreement, borrow, repay and reborrow up to the borrowing base in effect from time to time.
6. STOCKHOLDERS' EQUITY:
Ellora Energy Inc.—At inception, Ellora Energy Inc. issued 16,184,336 shares of common stock for $20,000,000. Ellora Energy Inc. issued 4,046,084 shares in 2003 for $10,000,000 and 3,236,867 shares in 2004 for $8,000,000. In addition, Ellora Energy Inc. has 10,000,000 shares of $.001 par value of preferred stock authorized, none issued. The preferred stock may be issued in such series and preferences as determined by Ellora Energy Inc.'s board of directors.
Ellora Oil and Gas Inc.—During April 2005, Ellora Oil and Gas Inc. issued 12,994,879 shares of common stock for $64,250,000.
Subscription Agreements—For shares of common stock sold and issued to employees, Ellora Energy Inc. has financed the sale of those shares and entered into full recourse promissory notes that are collateralized by Ellora Energy Inc.'s stock. The promissory notes have been reflected as a
F-16
reduction of stockholders' equity and are due June 2009, with an interest rate of 6%. Interest of $928,000 on these subscriptions has been recorded as a reduction to stockholders' equity and an addition to additional paid-in capital through July 11, 2006. On July 12, 2006 Ellora completed the private placement of 2,499,992 shares of common stock pursuant to Rule 144A and Section 4(2) under the Securities Act of 1933, as amended. In connection with this offering, Ellora received approximately $6,425,000, including $928,000 of accrued interest, from certain of the selling stockholders for repayment of the subscription agreements.
Ellora Oil and Gas Inc. Stock Option Plan (Converted to the 2006 Ellora Energy Inc. Stock Plan) —Ellora Oil and Gas Inc. adopted the 2005 Stock Option Plan for employees and non-employee directors to receive stock option rewards. Under the 2005 Plan, 82,000 options were outstanding as of December 31, 2005. On July 12, 2006 the options of Ellora Oil and Gas Inc. were exchanged for options of Ellora Energy Inc. Each option of Ellora Oil and Gas Inc. was exchanged for 2.499391 options of Ellora Energy Inc. The exchanged factor was based on valuations of each company as prepared by an independent investment Banking firm. Immediately after the exchange of the options, the options were split 8.092168039-for-1. Upon completion of the split the 2005 Stock Option Plan was converted to the Ellora Energy Inc. 2006 Stock Option Plan.
Ellora Energy Inc. granted the following non-qualified options as of December 31, 2006:
| | Number of Options | Weighted Average Exercise Price | Weighted Average Fair Value Price | ||||||
|---|---|---|---|---|---|---|---|---|---|
| Outstanding, January 1, 2005 | — | — | — | ||||||
| Granted | 1,658,490 | $ | 4.94 | $ | 2.46 | ||||
| Exercised | — | — | — | ||||||
| Expired | — | — | — | ||||||
| Cancelled | — | — | — | ||||||
| Outstanding as of, December 31, 2005 | 1,658,490 | 4.94 | 2.46 | ||||||
| Granted | — | — | — | ||||||
| Exercised | — | — | — | ||||||
| Expired | — | — | — | ||||||
| Cancelled | (72,474 | ) | 4.94 | 2.46 | |||||
| Transferred in July 2006 | (1,586,016 | ) | 4.94 | 2.46 | |||||
| Outstanding as of, December 31, 2006 | — | $ | — | $ | — | ||||
Ellora Energy Inc. Stock Option Plan—Ellora Energy Inc. adopted the 2002 Stock Option Plan (the "2002 Plan") for employees and non-employee directors to receive stock option rewards. Under the 2002 Plan, 130,253 shares were outstanding as of December 31, 2005. On July 12, 2006 the 130,253 options outstanding were split 8.092168039-for-1.
F-17
Ellora Energy Inc. granted the following non-qualified options as of December 31, 2006:
| | Number of Options | Weighted Average Exercise Price | Weighted Average Fair Value | ||||||
|---|---|---|---|---|---|---|---|---|---|
| Outstanding, January 1, 2004 | 1,137,832 | 1.60 | .53 | ||||||
| Granted | 172,978 | 2.47 | .94 | ||||||
| Exercised | — | — | — | ||||||
| Expired | — | — | — | ||||||
| Outstanding, December 31, 2004 | 1,310,810 | 1.71 | .58 | ||||||
| Granted | — | — | — | ||||||
| Exercised | — | — | — | ||||||
| Expired | — | — | — | ||||||
| Cancelled | (256,781 | ) | 2.47 | .94 | |||||
| Outstanding, December 31, 2005 | 1,054,029 | 1.76 | .61 | ||||||
| Granted | — | — | — | ||||||
| Exercised | — | — | — | ||||||
| Expired | — | — | — | ||||||
| Cancelled | (2,188 | ) | 2.47 | .94 | |||||
| Transferred | 1,586,016 | 4.94 | 2.46 | ||||||
| Outstanding, December 31, 2006 | 2,637,857 | $ | 3.54 | $ | 1.67 | ||||
The above options vest as follows:
| | Number of Options | Weighted Average Exercise Price | Weighted Average Fair Value Price | |||||
|---|---|---|---|---|---|---|---|---|
| Vested as of December 31, 2006 | 1,804,058 | $ | 2.94 | $ | 1.33 | |||
| Vest in 2007 | 530,978 | 4.89 | 2.43 | |||||
| Vest in 2008 | 302,821 | 4.94 | 2.46 | |||||
| 2,637,857 | $ | 3.54 | $ | 1.67 | ||||
All options issued and outstanding under the 2002 and 2005 Plans were converted into options issued and outstanding under Ellora's 2006 Plan. If not previously exercised, the Ellora Energy Inc. options outstanding at December 31, 2006, which were issued under the 2002 Plan will expire in 2010. If not previously exercised, the Ellora Energy Inc. options outstanding at December 31, 2006, which were issued under the 2005 Plan will expire in 2012. Total estimated unrecognized compensation cost for the unvested stock options as of December 31, 2006 was approximately $2,037,000, which is expected to be recognized over a period of 1.58 years. The intrinsic value of the outstanding and vested shares, based on an estimated intrinsic value of $12.00 per share less the weighted average exercise price was $10.52 for options originally issued under the 2002 Plan and $7.06 for options originally issued under the 2005 Plan as of December 31, 2006.
F-18
For the years ended December 31, 2004 and 2005 (no options or warrants were issued in 2006), the value of each option granted under the plans was estimated on the date of grant, using the minimum value method described in SFAS No. 123, with the following assumptions:
| | 2004 | 2005 | ||||
|---|---|---|---|---|---|---|
| Risk-free interest rate | 5% | 7% | ||||
| Expected life | 7 years | 7-10 years | ||||
| Expected volatility | 0% | 0% | ||||
| Expected dividend | $ | 0 | $ | 0 | ||
Prior to adopting SFAS No. 123(R), Ellora followed the provisions of SFAS No. 123, "Accounting for Stock Based Compensation," for all issuances of stock options to non-employees of Ellora. Ellora followed the provisions of APB Opinion No. 25 (Opinion 25), "Accounting for Stock Issued to Employees" for all issuances of stock options to their employees. In accordance with APB 25, prior to January 1, 2006, no compensation cost had been recognized for stock options granted to employees under the plans. Had compensation cost for the Plans been determined based upon the provisions of SFAS No. 123, Ellora's net income for 2004 and 2005 would have been decreased to the pro forma amounts indicated below, respectively:
| | 2004 | 2005 | |||||
|---|---|---|---|---|---|---|---|
| Net income—as reported | $ | 6,034,000 | $ | 10,781,000 | |||
| Pro forma expense | (240,000 | ) | (1,344,000 | ) | |||
| Net income—pro forma | $ | 5,794,000 | $ | 9,437,000 | |||
| Basic earnings per share—pro forma | $ | .21 | $ | .24 | |||
| Diluted earnings per share—pro forma | $ | .21 | $ | .23 | |||
Ellora Energy Inc. Non-Cash Compensation Expense—In July of 2005, Ellora Energy Inc. sold shares of stock for less than fair value to an officer. Also during July of 2005, Ellora Energy Inc. sold shares of stock for less than fair value to an officer who retired during 2005. In connection with these transactions, Ellora recorded non-cash compensation expense of $4,857,000 in the statements of income with a corresponding credit to additional paid-in capital.
7. INCOME TAXES:
Deferred tax assets and liabilities are measured by applying the provisions of enacted tax laws to determine the amount of taxes payable or refundable currently or in future years related to cumulative temporary differences between the tax bases of assets and liabilities and amounts reported in Ellora's balance sheet. The tax effect of the net change in the cumulative temporary differences during each period in the deferred tax assets and liability determines the periodic provision for deferred taxes. The Company is in the process of completing their 2005 Federal tax return. When filed, there may be adjustments to the components of temporary differences as
F-19
reflected below, but such adjustments are not expected to be significant. The provision for income taxes consists of the following:
| | 2004 Consolidated | 2005 Combined | 2006 Consolidated | |||||||
|---|---|---|---|---|---|---|---|---|---|---|
| Current taxes | $ | — | $ | — | $ | — | ||||
| Deferred taxes | 3,850,000 | 9,234,000 | 6,424,000 | |||||||
| Total income tax expense | $ | 3,850,000 | $ | 9,234,000 | $ | 6,424,000 | ||||
Temporary differences between the financial statement carrying amounts and tax bases of assets and liabilities that give rise to the net deferred tax liability result from the following components:
| | 2005 Combined | 2006 Consolidated | ||||||
|---|---|---|---|---|---|---|---|---|
| Oil and gas properties | $ | 19,615,000 | $ | 37,284,000 | ||||
| Net operating loss carryforward | (1,955,000 | ) | (12,170,000 | ) | ||||
| Accrued property tax | (447,000 | ) | (152,000 | ) | ||||
| Abandonment obligations | (276,000 | ) | (509,000 | ) | ||||
| Deferred deductions and other | (14,000 | ) | (1,106,000 | ) | ||||
| Total | $ | 16,923,000 | $ | 23,347,000 | ||||
At December 31, 2006, Ellora Energy Inc. had net operating loss carryforwards for Federal tax purposes of approximately $31,610,000. Reconciliation of Ellora's effective tax rate to the expected federal tax rate of 35% is as follows:
| | 2004 Consolidated | 2005 Combined | 2006 Consolidated | |||
|---|---|---|---|---|---|---|
| Expected Federal tax rate | 35% | 35% | 35% | |||
| Permanent difference—stock based compensation | — | 9% | 0% | |||
| State income taxes and other | 4% | 2% | 3% | |||
| Effective tax rate | 39% | 46% | 38% | |||
F-20
8. COMBINING FINANCIAL INFORMATION:
Presented below is the condensed combining information of Ellora Energy Inc. and Affiliated Entities as of and for the year ended December 31, 2005 (see Note 1):
| | Condensed Combining Balance Sheet December 31, 2005 | |||||||||||
|---|---|---|---|---|---|---|---|---|---|---|---|---|
| | Ellora Energy Inc. | Ellora Oil and Gas Inc. | Elimination | Total | ||||||||
| Current assets | $ | 16,958,000 | $ | 5,303,000 | $ | (1,371,000 | ) | $ | 20,890,000 | |||
| Property and equipment, net | 110,036,000 | 68,356,000 | (8,298,000 | ) | 170,094,000 | |||||||
| Other long term assets | 10,199,000 | 56,849,000 | (65,732,000 | ) | 1,316,000 | |||||||
| $ | 137,193,000 | $ | 130,508,000 | $ | (75,401,000 | ) | $ | 192,300,000 | ||||
| | Liabilities and Stockholders' Equity | |||||||||||
| Current liabilities | $ | 14,618,000 | $ | 3,995,000 | $ | (1,371,000 | ) | $ | 17,242,000 | |||
| Long-term liabilities | 42,098,000 | 1,291,000 | — | 43,389,000 | ||||||||
| Stockholders' equity | 80,477,000 | 125,222,000 | (74,030,000 | ) | 131,669,000 | |||||||
| $ | 137,193,000 | $ | 130,508,000 | $ | (75,401,000 | ) | $ | 192,300,000 | ||||
Ellora Energy Inc. provided administrative services to Ellora Oil and Gas Inc. for which Ellora Energy Inc. received overhead reimbursements in the amount of $1,050,000 for the year ended December 31, 2005. The amount earned by Ellora Energy Inc. is included below as a reduction to general and administrative expense with a corresponding charge to Ellora Oil and Gas Inc.'s general and administrative expense.
| | Condensed Combining Statement of Operations for the Fiscal Year Ended December 31, 2005 | |||||||||||
|---|---|---|---|---|---|---|---|---|---|---|---|---|
| | Ellora Energy Inc. | Ellora Oil and Gas Inc. | Elimination | Total | ||||||||
| Revenues | $ | 41,663,000 | $ | 11,419,000 | $ | — | $ | 53,082,000 | ||||
| Gain on sale of property | 8,400,000 | — | (8,400,000 | ) | — | |||||||
| Operating expenses | 8,816,000 | 3,158,000 | — | 11,974,000 | ||||||||
| Depreciation, depletion and amortization | 5,846,000 | 2,343,000 | — | 8,189,000 | ||||||||
| Exploration and impairment | 35,000 | 387,000 | — | 422,000 | ||||||||
| General and administrative and other expenses | 11,217,000 | 1,265,000 | — | 12,482,000 | ||||||||
| Income tax expense | 8,233,000 | 1,001,000 | — | 9,234,000 | ||||||||
| Net income | $ | 15,916,000 | $ | 3,265,000 | $ | (8,400,000 | ) | $ | 10,781,000 | |||
F-21
9. MAJOR CUSTOMERS:
During 2004 and 2005, Louis Dreyfus Energy Services was the only customer of ours who accounted for greater than 10% of our oil and gas sales, accounting for approximately 63% of such oil and gas sales each year. During 2006 Louis Dreyfus Energy Services and Plains Marketing, L.P. accounted for 50% and 21%, respectively, of oil and gas sales. Management believes that the loss of any individual purchaser would not have a long-term material adverse impact on the financial position or results of operations of the Company.
10. COMMITMENTS:
Office Lease—Ellora leases office space with a term through January 31, 2010. Total rental expense was $84,000, $196,000, and $204,000 for the years ended December 31, 2004, 2005, and 2006, respectively. Ellora's obligation for future minimum lease payments under this agreement is as follows:
| 2007 | $ | 684,000 | |
| 2008 | 717,000 | ||
| 2009 | 751,000 | ||
| 2010 | 557,000 | ||
| 2011 | 559,000 | ||
| $ | 3,268,000 | ||
Environmental Issues—Ellora is engaged in oil and gas exploration and production and may incur liability for environmental clean up of well sites or other environmental restoration procedures as they relate to the drilling of oil and gas wells and the operation thereof. In Ellora's acquisition of existing or previously drilled well bores, Ellora may not be aware of what environmental safeguards were taken at the time such wells were drilled or during such time the wells were operated. Petroleum hydrocarbons or wastes may have been disposed of or released on or under properties owned or leased by Ellora or on or under other locations where such wastes have been taken for disposal. Should it be determined that a liability exists with respect to any environmental clean up or restoration, the liability to cure such a violation could fall upon Ellora. Management believes its properties are operated in conformity with local state and Federal regulations. No claim has been made, nor is Ellora aware of any uninsured liability that Ellora may have, as it relates to any environmental clean up, restoration or the violation of any rules or regulations relating thereto.
11. DERIVATIVE FINANCIAL INSTRUMENTS:
Ellora entered into various futures commitments to minimize the effect of natural gas price fluctuations summarized in the table below. Management does not anticipate that the execution of
F-22
such transactions will result in any significant losses based on current market conditions. As of December 31, 2006, Ellora had the following outstanding financial natural gas positions:
| Contract Type | Weighted Average Floor Price | Quantity | Contract Period | ||||
|---|---|---|---|---|---|---|---|
| | | (Mmbtu) | | ||||
| Futures Put | $ | 10.00 | 100,000 | January 2007 | |||
| Futures Put | $ | 6.50 | 200,000 | April 2007 | |||
| Futures Put | $ | 6.50 | 200,000 | May 2007 | |||
| Futures Put | $ | 6.50 | 200,000 | June 2007 | |||
| Futures Put | $ | 6.50 | 200,000 | July 2007 | |||
| Futures Put | $ | 6.50 | 200,000 | August 2007 | |||
| Futures Put | $ | 6.50 | 200,000 | September 2007 | |||
As of December 31, 2006, the above contracts had an unrealized gain, net of deferred tax effect, of $169,000, which is recorded in other comprehensive income.
12. OIL AND GAS ACTIVITIES:
Ellora's oil and natural gas activities are entirely within the United States. Costs incurred in oil and natural gas producing activities are as follows:
| | 2004 Consolidated | 2005 Combined | 2006 Consolidated | |||||||
|---|---|---|---|---|---|---|---|---|---|---|
| Unproved property acquisition | $ | — | $ | 25,036,000 | 5,675,000 | |||||
| Proved property acquisition | 2,594,000 | 46,764,000 | — | |||||||
| Development | 5,163,000 | 17,325,000 | 17,290,000 | |||||||
| Exploration | 12,859,000 | 16,451,000 | 43,320,000 | |||||||
| Total | $ | 20,616,000 | $ | 105,576,000 | $ | 66,285,000 | ||||
During 2004, 2005 and 2006, additions to oil and gas properties of approximately $30,000, $167,000, and $134,000 were recorded for the estimated costs of future abandonment related to new wells drilled or acquired.
F-23
Net capitalized costs related to Ellora's oil and natural gas producing activities are summarized as follows:
| | 2004 Consolidated | 2005 Combined | 2006 Consolidated | ||||||||
|---|---|---|---|---|---|---|---|---|---|---|---|
| Proved oil and gas properties | $ | 55,779,000 | $ | 135,828,000 | $ | 194,899,000 | |||||
| Unproved oil and gas properties | 10,732,000 | 35,768,000 | 33,456,000 | ||||||||
| Accumulated depreciation, depletion and amortization | (5,913,000 | ) | (13,587,000 | ) | (24,398,000 | ) | |||||
| Oil and gas properties—net | $ | 60,598,000 | $ | 158,009,000 | $ | 203,957,000 | |||||
In April 2005, the Financial Account Standards Board ("FASB") issued Staff Position No. FAS 19-1, Accounting for Suspended Well Costs ("FSP 19-1"), which amends FAS 19, Financial Accounting and Reporting by Oil and Gas Producing Companies. During the third quarter of 2005, Ellora adopted the requirements of FSP 19-1. Upon adoption, Ellora evaluated all existing capitalized well costs under the provisions of FSP 19-1 and determined there was no impact to Ellora's consolidated financial statements.
13. DISCLOSURES ABOUT OIL AND GAS PRODUCING ACTIVITIES (UNAUDITED):
The estimate of proved reserves and related valuations for the years ended December 31, 2005 and 2006 was based upon the report prepared by Ellora's engineering staff and audited by MHA Petroleum Consultants, Inc., independent petroleum engineers. For the year ended December 31, 2004, the estimate of proved reserves and related valuations was based upon the reports of Ellora's engineering staff. The estimates of proved reserves were made in accordance with Rule 4-10(a) of Regulation S-X. The estimates of proved reserves are inherently imprecise and are continually subject to revision based on production history, results of additional exploration and development, price changes and other factors.
F-24
All of Ellora's oil and natural gas reserves are attributable to properties within the United States. A summary of Ellora's changes in quantities of proved oil and natural gas reserves for the years ended December 31, 2004, 2005 and 2006, are as follows:
| | Natural Gas | Oil | ||||
|---|---|---|---|---|---|---|
| | (MMcf) | (MBbl) | ||||
| Balance—January 1, 2004 | 112,166 | 928 | ||||
| Extensions and discoveries | 11,251 | 15 | ||||
| Sales of minerals in place | — | — | ||||
| Purchases of minerals in place | 884 | — | ||||
| Production | (3,471 | ) | (63 | ) | ||
| Revisions to previous estimates | (21,397 | ) | (576 | ) | ||
| Balance—December 31, 2004 | 99,433 | 304 | ||||
| Extensions and discoveries | 40,165 | 469 | ||||
| Sales of minerals in place | — | — | ||||
| Purchases of minerals in place | 22,953 | 8,033 | ||||
| Production | (5,348 | ) | (125 | ) | ||
| Revisions to previous estimates | (10,359 | ) | 207 | |||
| Balance—December 31, 2005 | 146,844 | 8,888 | ||||
| Extensions and discoveries | 71,586 | 3,047 | ||||
| Sales of minerals in place | (1,201 | ) | (16 | ) | ||
| Purchases of minerals in place | — | — | ||||
| Production | (6,348 | ) | (218 | ) | ||
| Revisions to previous estimates | (20,659 | ) | (5,126 | ) | ||
| Balance—December 31, 2006 | 190,222 | 6,575 | ||||
| Proved developed reserves: | ||||||
| December 31, 2004 | 41,947 | 50 | ||||
| December 31, 2005 | 60,078 | 776 | ||||
| December 31, 2006 | 76,151 | 1,332 | ||||
The standardized measure of discounted future net cash flows relating to proved oil and natural gas reserves and the changes in standardized measure of discounted future net cash flows relating to proved oil and natural gas reserves were prepared in accordance with the provisions of SFAS No. 69. Future cash inflows were computed by applying prices at year end to estimated future production. Future production and development costs are computed by estimating the expenditures to be incurred in developing and producing the proved oil and natural gas reserves at year end, based on year-end costs and assuming continuation of existing economic conditions.
Future income tax expenses are calculated by applying appropriate year-end tax rates to future pretax net cash flows relating to proved oil and natural gas reserves, less the tax basis of properties involved. Future income tax expenses give effect to permanent differences, tax credits and loss carryforwards relating to the proved oil and natural gas reserves. Future net cash flows are
F-25
discounted at a rate of 10% annually to derive the standardized measure of discounted future net cash flows. This calculation procedure does not necessarily result in an estimate of the fair market value or the present value of Ellora's oil and natural gas properties.
The standardized measure of discounted future net cash flows relating to proved oil and natural gas reserves are as follows (in thousands):
| | 2004 Consolidated | 2005 Combined | 2006 Consolidated | ||||||||
|---|---|---|---|---|---|---|---|---|---|---|---|
| Future cash flows | $ | 631,533 | $ | 1,609,961 | $ | 1,404,143 | |||||
| Future production costs | (157,586 | ) | (415,075 | ) | (403,856 | ) | |||||
| Future development costs | (50,006 | ) | (113,183 | ) | (128,213 | ) | |||||
| Future income tax expense | (144,994 | ) | (365,772 | ) | (282,904 | ) | |||||
| Future net cash flows | 278,947 | 715,931 | 589,170 | ||||||||
| 10% annual discount for estimated timing of cash flows | (161,820 | ) | (389,749 | ) | (329,466 | ) | |||||
| Standardized measure of discounted future net cash flows | $ | 117,127 | $ | 326,182 | $ | 259,704 | |||||
Future cash flows as shown above were reported without consideration for the effects of hedging transactions outstanding at each period end. The effect of hedging transactions on the future cash flows for the years ended December 31, 2004, 2005, and 2006 was immaterial.
The changes in the standardized measure of discounted future net cash flows relating to proved oil and natural gas reserves are as follows (in thousands):
| | 2004 Consolidated | 2005 Combined | 2006 Consolidated | |||||||
|---|---|---|---|---|---|---|---|---|---|---|
| Beginning of year | $ | 89,250 | $ | 117,127 | $ | 326,182 | ||||
| Sale of oil and gas produced, net of production costs | (16,950 | ) | (39,641 | ) | (39,986 | ) | ||||
| Net changes in prices and production costs | 57,986 | 62,012 | (151,473 | ) | ||||||
| Extensions, discoveries and improved recoveries | 24,937 | 129,715 | 172,529 | �� | ||||||
| Development costs incurred | 5,163 | 17,325 | 17,290 | |||||||
| Changes in estimated development cost | (21,431 | ) | (80,502 | ) | (32,320 | ) | ||||
| Purchases of mineral in place | 1,738 | 214,753 | — | |||||||
| Sales of mineral in place | — | — | (2,490 | ) | ||||||
| Revisions of previous quantity estimates | (43,024 | ) | (24,821 | ) | (109,905 | ) | ||||
| Net change in income taxes | (12,487 | ) | (105,766 | ) | 41,944 | |||||
| Accretion of discount | 13,764 | 17,801 | 49,283 | |||||||
| Changes in production rates and other | 18,181 | 18,179 | (11,350 | ) | ||||||
| End of year | $ | 117,127 | $ | 326,182 | $ | 259,704 | ||||
F-26
Average wellhead prices in effect at December 31, 2004, 2005 and 2006 inclusive of adjustments for quality and location used in determining future net revenues related to the standardized measure calculation are as follows:
| | 2004 Consolidated | 2005 Combined | 2006 Consolidated | ||||||
|---|---|---|---|---|---|---|---|---|---|
| Oil (per Bbl) | $ | 39.55 | $ | 56.50 | $ | 58.36 | |||
| Gas (per Mcf) | $ | 5.60 | $ | 8.12 | $ | 6.21 | |||
14. SUBSEQUENT EVENTS:
In February of 2007, Presco Western LLC (a wholly owned subsidiary of Ellora) entered into a purchase and sale agreement for $27,788,000 covering developed and undeveloped leasehold mineral interests in the Hugoton Field of Southwestern Kansas. Included were producing properties and leasehold mineral interests in depths below the top of the Heebner Shale equaling approximately 618,000 net leasehold acres, producing wells with combined production of approximately 2,000 Mcfe per day, and an additional 75,000 undeveloped net acres and an increased net revenue interest from 80% to 87.5%. The purchase and sale agreement is subject to standard conditions to closing, including Ellora's completion of title and environmental due diligence. The acquisition will be funded under Ellora's credit agreement.
On February 22, 2007, English Bay Pipeline, L.P. (a wholly owned subsidiary of Ellora) acquired a 100% interest in the 20 mile long Shelby Pipeline in Shelby County, Texas for approximately $6,500,000. The pipeline transports gas from the southern portion of the Huxley Field for Ellora and other independent producers to an interstate pipeline. In addition, this line was connected to Ellora's English Bay Pipeline during March of 2007.
F-27
[THIS PAGE INTENTIONALLY LEFT BLANK]
F-28
ELLORA ENERGY INC. AND SUBSIDIARIES
BALANCE SHEETS
| | December 31, 2006 Consolidated | June 30, 2007 Consolidated | ||||||||
|---|---|---|---|---|---|---|---|---|---|---|
| | | (unaudited) | ||||||||
| ASSETS | ||||||||||
| CURRENT ASSETS: | ||||||||||
| Cash | $ | 4,329,000 | $ | 5,607,000 | ||||||
| Accounts receivable: | ||||||||||
| Oil and gas sales | 6,057,000 | 7,850,000 | ||||||||
| Joint interest billings | 615,000 | 1,209,000 | ||||||||
| Income taxes receivable | 500,000 | 500,000 | ||||||||
| Derivative asset | 388,000 | 158,000 | ||||||||
| Oil and gas equipment inventory | 1,046,000 | 1,470,000 | ||||||||
| Prepaids and other current assets | 1,223,000 | 1,704,000 | ||||||||
| Total current assets | 14,158,000 | 18,498,000 | ||||||||
| PROPERTY AND EQUIPMENT: | ||||||||||
| Oil and gas properties (successful efforts method): | ||||||||||
| Proved properties | 194,899,000 | 249,976,000 | ||||||||
| Unproved properties | 33,456,000 | 35,780,000 | ||||||||
| Pipeline properties | 12,266,000 | 19,397,000 | ||||||||
| Furniture and equipment | 1,829,000 | 5,131,000 | ||||||||
| Total property and equipment | 242,450,000 | 310,284,000 | ||||||||
| Less accumulated depletion and depreciation | (26,211,000 | ) | (34,748,000 | ) | ||||||
| Net property and equipment | 216,239,000 | 275,536,000 | ||||||||
| OTHER LONG-TERM ASSETS | 1,516,000 | 1,064,000 | ||||||||
| TOTAL ASSETS | $ | 231,913,000 | $ | 295,098,000 | ||||||
LIABILITIES AND STOCKHOLDERS' EQUITY | ||||||||||
| CURRENT LIABILITIES: | ||||||||||
| Accounts payable | $ | 9,407,000 | $ | 9,114,000 | ||||||
| Accrued expenses | 291,000 | 416,000 | ||||||||
| Production taxes payable | 396,000 | 826,000 | ||||||||
| Oil and gas revenues payable | 4,984,000 | 6,927,000 | ||||||||
| Total current liabilities | 15,078,000 | 17,283,000 | ||||||||
| LONG-TERM DEBT | 16,000,000 | 71,000,000 | ||||||||
| DEFERRED INCOME TAXES | 23,347,000 | 25,205,000 | ||||||||
| ASSET RETIREMENT OBLIGATIONS | 1,322,000 | 1,948,000 | ||||||||
COMMITMENTS (NOTE 8) | ||||||||||
STOCKHOLDERS' EQUITY: | ||||||||||
| Ellora Energy Inc. preferred stock, $.001 par value, 10,000,000 shares authorized, -0- outstanding | — | — | ||||||||
| Ellora Energy Inc. common stock, $.001 par value, 125,000,000 shares authorized, 44,807,697 and 44,855,999 issued and outstanding, respectively | 45,000 | 45,000 | ||||||||
| Additional paid-in capital | 144,923,000 | 145,672,000 | ||||||||
| Retained earnings | 31,029,000 | 33,997,000 | ||||||||
| Accumulated other comprehensive income (loss) | 169,000 | (52,000 | ) | |||||||
| Total stockholders' equity | 176,166,000 | 179,662,000 | ||||||||
| TOTAL LIABILITIES AND STOCKHOLDERS' EQUITY | $ | 231,913,000 | $ | 295,098,000 | ||||||
See accompanying notes to these financial statements.
F-29
ELLORA ENERGY INC. AND SUBSIDIARIES
UNAUDITED STATEMENTS OF INCOME
| | For the six months ended June 30, | ||||||||
|---|---|---|---|---|---|---|---|---|---|
| | 2006 Combined | 2007 Consolidated | |||||||
| REVENUE: | |||||||||
| Oil and gas sales | $ | 26,824,000 | $ | 31,339,000 | |||||
| Gas aggregation and pipeline sales | 2,429,000 | 4,510,000 | |||||||
| Gain on oil and gas hedging activities | 2,421,000 | 28,000 | |||||||
| Loss on sale of unproved oil and gas properties | — | (20,000 | ) | ||||||
| Interest income and other | 24,000 | 33,000 | |||||||
| Total revenue | 31,698,000 | 35,890,000 | |||||||
COSTS AND EXPENSES: | |||||||||
| Lease operating expense | 5,770,000 | 5,685,000 | |||||||
| Production taxes | 602,000 | 1,148,000 | |||||||
| Gas aggregation and pipeline cost of sales | 2,111,000 | 4,483,000 | |||||||
| Depreciation, depletion and amortization | 4,543,000 | 8,604,000 | |||||||
| Exploration | 284,000 | 2,019,000 | |||||||
| General and administrative (including $701,000 and $644,000, respectively, of stock option compensation) | 4,284,000 | 7,349,000 | |||||||
| Interest expense | 1,032,000 | 1,776,000 | |||||||
| Total costs and expenses | 18,626,000 | 31,064,000 | |||||||
| INCOME BEFORE INCOME TAXES | 13,072,000 | 4,826,000 | |||||||
INCOME TAXES: | |||||||||
| Deferred income tax expense | 5,241,000 | 1,858,000 | |||||||
| NET INCOME | $ | 7,831,000 | $ | 2,968,000 | |||||
| BASIC INCOME PER SHARE | $ | .19 | $ | .07 | |||||
| DILUTED INCOME PER SHARE | $ | .18 | $ | .06 | |||||
| WEIGHTED AVERAGE NUMBER OF SHARES OF COMMON STOCK—BASIC | 42,310,871 | 44,837,712 | |||||||
| WEIGHTED AVERAGE NUMBER OF SHARES OF COMMON STOCK—DILUTED | 44,055,137 | 46,660,930 | |||||||
See accompanying notes to these financial statements.
F-30
ELLORA ENERGY INC. AND SUBSIDIARIES
UNAUDITED STATEMENTS OF COMPREHENSIVE INCOME
| | For the six months ended June 30, | |||||||
|---|---|---|---|---|---|---|---|---|
| | 2006 Combined | 2007 Consolidated | ||||||
| NET INCOME | $ | 7,831,000 | $ | 2,968,000 | ||||
OTHER COMPREHENSIVE INCOME: | ||||||||
| Change in derivative instrument fair value, net of tax | 1,800,000 | (221,000 | ) | |||||
| COMPREHENSIVE INCOME | $ | 9,631,000 | $ | 2,747,000 | ||||
See accompanying notes to these financial statements.
F-31
ELLORA ENERGY INC. AND SUBSIDIARIES
CONSOLIDATED STATEMENTS OF STOCKHOLDERS' EQUITY AND COMPREHENSIVE INCOME
FOR THE YEAR ENDED DECEMBER 31, 2006 AND THE SIX MONTHS ENDED JUNE 30, 2007
(unaudited)
| | Common Stock | | | | | | ||||||||||||||||
|---|---|---|---|---|---|---|---|---|---|---|---|---|---|---|---|---|---|---|---|---|---|---|
| | Additional Paid-In Capital | Subscription Receivable | Retained Earnings | Accumulated Other Comprehensive income | | |||||||||||||||||
| | Shares | Amount | Total | |||||||||||||||||||
| BALANCES, January 1, 2006 | 42,307,705 | $ | 42,000 | $ | 116,811,000 | $ | (6,224,000 | ) | $ | 20,818,000 | $ | 222,000 | $ | 131,669,000 | ||||||||
Sale of stock | 2,499,992 | 3,000 | 26,531,000 | — | — | — | 26,534,000 | |||||||||||||||
| Accrued interest on notes | — | — | 201,000 | (201,000 | ) | — | — | — | ||||||||||||||
| Repayment of subscription receivable | — | — | — | 6,425,000 | — | — | 6,425,000 | |||||||||||||||
| Non-cash compensation | — | — | 1,380,000 | — | — | — | 1,380,000 | |||||||||||||||
| Net income | — | — | — | — | 10,211,000 | — | 10,211,000 | |||||||||||||||
| Change in derivative instrument fair value | — | — | — | — | — | (53,000 | ) | (53,000 | ) | |||||||||||||
| BALANCES, December 31, 2006 | 44,807,697 | 45,000 | 144,923,000 | — | 31,029,000 | 169,000 | 176,166,000 | |||||||||||||||
Non-cash compensation | — | — | 644,000 | — | — | — | 644,000 | |||||||||||||||
| Exercise of stock options | 48,302 | — | 105,000 | — | — | — | 105,000 | |||||||||||||||
| Net income | — | — | — | — | 2,968,000 | — | 2,968,000 | |||||||||||||||
| Change in derivative instrument fair value | — | — | — | — | — | (221,000 | ) | (221,000 | ) | |||||||||||||
| BALANCES, June 30, 2007 | 44,855,999 | $ | 45,000 | $ | 145,672,000 | $ | — | $ | 33,997,000 | $ | (52,000 | ) | $ | 179,662,000 | ||||||||
See accompanying notes to these financial statements.
F-32
ELLORA ENERGY INC. AND SUBSIDIARIES
UNAUDITED STATEMENTS OF CASH FLOWS
| | For the six months ended June 30, | |||||||||
|---|---|---|---|---|---|---|---|---|---|---|
| | 2006 Combined | 2007 Consolidated | ||||||||
| CASH FLOWS FROM OPERATING ACTIVITIES: | ||||||||||
| Net income | $ | 7,831,000 | $ | 2,968,000 | ||||||
| Adjustments to reconcile net income to net cash provided by operating activities: | ||||||||||
| Depreciation, depletion and amortization | 4,543,000 | 8,604,000 | ||||||||
| Amortization of derivative asset | 873,000 | 361,000 | ||||||||
| Amortization of debt issue costs | — | 103,000 | ||||||||
| Deferred income taxes | 5,241,000 | 1,858,000 | ||||||||
| Exploration | 284,000 | 63,000 | ||||||||
| Non-cash compensation expense | 701,000 | 644,000 | ||||||||
| Loss on sale of unproved oil and gas properties | — | 20,000 | ||||||||
| Changes in operating assets and liabilities: | ||||||||||
| Accounts receivable | 6,251,000 | (2,387,000 | ) | |||||||
| Prepaid and other current assets | 881,000 | (3,001,000 | ) | |||||||
| Other long-term assets | 101,000 | 349,000 | ||||||||
| Accounts payable and accrued expenses | (2,916,000 | ) | (1,384,000 | ) | ||||||
| Oil and gas revenues payable | (3,552,000 | ) | 1,943,000 | |||||||
| Net cash provided by operating activities | 20,238,000 | 10,141,000 | ||||||||
CASH FLOWS FROM INVESTING ACTIVITIES: | ||||||||||
| Cash acquisition capital expenditures | — | (19,331,000 | ) | |||||||
| Proceeds from sale of unproved oil and gas properties | — | 331,000 | ||||||||
| Drilling capital expenditures | (22,678,000 | ) | (34,049,000 | ) | ||||||
| Acquisition of Shelby Pipeline, Ltd. | — | (6,655,000 | ) | |||||||
| Pipeline capital expenditures | (349,000 | ) | (476,000 | ) | ||||||
| Purchase of other property and equipment | (367,000 | ) | (3,302,000 | ) | ||||||
| Net cash used in investing activities | (23,394,000 | ) | (63,482,000 | ) | ||||||
CASH FLOWS FROM FINANCING ACTIVITIES: | ||||||||||
| Proceeds from long-term debt under credit agreement | 31,940,000 | 55,000,000 | ||||||||
| Principal payments of long-term debt under credit agreement | (26,750,000 | ) | — | |||||||
| Loan origination fees | (794,000 | ) | — | |||||||
| Loan termination fees | (190,000 | ) | — | |||||||
| Cash received for exercise of stock options | — | 105,000 | ||||||||
| Cash paid for derivative asset | — | (486,000 | ) | |||||||
| Net cash provided by financing activities | 4,206,000 | 54,619,000 | ||||||||
| INCREASE IN CASH | 1,050,000 | 1,278,000 | ||||||||
CASH, beginning of period | 3,161,000 | 4,329,000 | ||||||||
| CASH, end of period | $ | 4,211,000 | $ | 5,607,000 | ||||||
SUPPLEMENTAL CASH FLOW INFORMATION: | ||||||||||
| Cash paid for interest | $ | 742,000 | $ | 1,233,000 | ||||||
| Cash paid for taxes | $ | — | $ | — | ||||||
NON CASH INVESTING ACTIVITIES: | ||||||||||
| Changes in working capital related to drilling capital expenditures | $ | 3,368,000 | $ | 1,780,000 | ||||||
| Transfers from inventory to oil and gas properties | $ | 777,000 | $ | 2,007,000 | ||||||
NON CASH FINANCING ACTIVITIES: | ||||||||||
| Accrued interest on subscription notes | $ | 201,000 | $ | — | ||||||
F-33
ELLORA ENERGY INC. AND SUBSIDIARIES
NOTES TO CONDENSED UNAUDITED FINANCIAL STATEMENTS
1. SUMMARY OF SIGNIFICANT ACCOUNTING POLICIES:
Organization—Ellora Energy Inc. was incorporated on June 1, 2002 in the State of Delaware to engage in the acquisition, exploration, development and production of oil and gas properties. During April 2005, Ellora's management established Ellora Oil and Gas Inc. to acquire Presco Western, LLC, which is a party to a farmout agreement in the Hugoton field in Kansas. Subsequently, Presco Western LLC acquired such farmout position. Ellora Oil and Gas Inc. also acquired Ellora Energy Inc.'s assets in Colorado and its interests in a joint venture with Centurion Exploration Company. Ellora Energy Inc. and Ellora Oil and Gas Inc. operate oil and gas properties in Texas, Louisiana, Colorado and Kansas and, when combined, have five wholly owned subsidiaries. Ellora Energy Inc., Ellora Oil and Gas Inc. and their respective subsidiaries are collectively referred to herein as "Ellora". In July, 2006, Ellora Energy Inc. and Ellora Oil and Gas Inc. merged with Ellora Energy Inc. as the surviving entity.
Basis of Presentation of Consolidated Financial Statements—The accompanying consolidated financial statements as of and for the period ended June 30, 2007 include the accounts of Ellora Energy Inc. and it subsidiaries, all of which are wholly owned. All significant intercompany transactions have been eliminated in consolidation. The accompanying consolidated financial statements as of December 31, 2006 and the combined financial statements for the six month period ended June 30, 2006 include all accounts of Ellora Energy Inc. and Ellora oil and Gas Inc. These entities are related due to their common ownership. On July 12, 2006, Ellora completed the private placement of 2,499,992 shares of its common stock pursuant to Rule 144A and Section 4(2) under the Securities Act of 1933, as amended. Immediately prior to the private placement, the shares of Ellora Oil and Gas Inc. were exchanged for shares of Ellora Energy Inc. Each share of Ellora Oil and Gas Inc. was exchanged for 2.499391 shares of Ellora Energy Inc. The exchange factor was determined by the management and approved by the Board of Directors of Ellora Oil and Gas Inc. and Ellora Energy Inc. based upon an analysis of management's estimates of the relative equity value of each of Ellora Oil and Gas Inc. and Ellora Energy Inc. These estimates of equity value were based on an analysis of estimated cash flow and net asset value for both Ellora Energy Inc. and Ellora Oil and Gas Inc. relative to comparable public companies' cash flow, net asset valuations and equity valuations. The shares were then allocated based on each company's respective value. Immediately after the exchange of the shares, all shares of Ellora Energy Inc. common stock were split 8.09216-for-1. All shares and earnings per share calculations for all periods in this document have been restated to reflect the effect of the stock split.
Cash and Cash Equivalents—Cash equivalents consist of money market accounts and investments which have an original maturity of three months or less. At December 31, 2006 and June 30, 2007, the Company maintained cash balances with a commercial bank in excess of FDIC insurance limits.
Fair Value of Financial Instruments—Ellora's financial instruments, including cash and cash equivalents, accounts receivable and payable are carried at cost, which approximates their fair value because of the short-term maturity of these instruments. The credit agreement has a recorded value that approximates its fair value since its variable interest rate is tied to current market rates. Ellora's derivative instruments are marked-to-market with changes in value being recorded in accumulated other comprehensive income.
F-34
Concentration of Credit Risk—Substantially all of Ellora's receivables are within the oil and gas industry, primarily from the sale of oil and gas products and billings to working interest owners. Collectibility is affected by the general economic conditions of the industry. Most of the receivables are not collateralized and to date, Ellora has had minimal bad debts.
Oil and Gas Producing Operations—Ellora follows the successful efforts method of accounting for its oil and gas properties. Under this method of accounting, all property acquisition costs and costs of exploratory and development wells are capitalized when incurred, pending determination of whether the well has found proved reserves. If an exploratory well has not found proved reserves, the costs of drilling the well and other associated costs are charged to expense. The costs of development wells are capitalized whether productive or nonproductive. Costs incurred to maintain wells and related equipment and lease and well operating costs are charged to expense as incurred. Gains and losses arising from sales of properties are included in income. Geological and geophysical costs of exploratory prospects and the costs of carrying and retaining unproved properties are expensed as incurred. In the six months ended June 30, 2006 and 2007, the company incurred geological and geophysical costs of $284,000 and $2,019,000, respectively. An impairment is recorded for unproved properties if the capitalized costs are not considered to be realizable.
Depletion, depreciation and amortization ("DD&A") of capitalized costs of proved oil and gas properties is provided for on a field-by-field basis using the units of production method based upon proved reserves. The computation of DD&A takes into consideration the anticipated proceeds from equipment salvage and Ellora's expected cost to abandon its well interests. Depletion expense for oil and gas producing property and related equipment was $4,236,000 and $7,918,000 for the six month periods ended June 30, 2006 and 2007.
Derivative Instruments—Ellora enters into derivative contracts to hedge future natural gas and crude oil production in order to mitigate the risk of market price fluctuations. Ellora does not enter into derivative instruments for speculative trading purposes.
All derivatives are recognized on the balance sheet and measured at fair value. Realized gains and losses as well as the ineffective portion of hedge derivatives, if any, are recorded as a derivative fair value gain or loss in the consolidated statements of income. Unrealized gains and losses on effective cash flow hedge derivatives are recorded as a component of accumulated other comprehensive income (loss). When the hedged transaction occurs, the realized gain or loss on the hedge derivative is transferred from accumulated other comprehensive income (loss) to earnings. Realized gains and losses on commodity hedge derivatives are recognized as "gain (loss) on oil and gas hedging activities."
Ellora has formally documented all relationships between hedging instruments and hedged items, as well as the risk management objectives and the strategy for undertaking the hedge. This process includes specific identification of the hedging instrument and the hedged item, the nature of the risk being hedged and the manner in which the hedging instrument's effectiveness will be assessed.
To designate a derivative as a cash flow hedge, Ellora documents at the hedge's inception its assessment as to whether the derivative will be highly effective in offsetting expected changes in cash flows from the item hedged. This assessment, which is updated at least quarterly, is generally based on the most recent relevant historical correlation between the derivative and the item
F-35
hedged. The ineffective portion of the hedge, if any, is calculated as the difference between the change in fair value of the derivative and the estimated change in cash flows from the item hedged. If, during the derivative's term, Ellora determines the hedge is no longer highly effective, hedge accounting is prospectively discontinued and any remaining unrealized gains or losses on the effective portion of the derivative are reclassified to earnings when the underlying transaction occurs. If it is determined that the designated hedge transaction is not likely to occur, any unrealized gains or losses are recognized immediately in the consolidated statements of income as a derivative fair value gain or loss.
At December 31, 2006, accumulated other comprehensive income consisted of $272,000 ($169,000 after tax) of unrealized gains, representing the mark-to-market value of Ellora's open commodity contracts, designated as cash flow hedges, as of the balance sheet date. At June 30, 2007, accumulated other comprehensive loss consisted of ($84,000) (($52,000) after tax) of unrealized losses on Ellora's open commodity hedge derivatives
Prior Year Reclassifications—Certain prior period balances reclassified to conform to the current year presentation, and such reclassifications had no impact on net income or stockholders' equity previously reported.
Per Share Amounts—Basic income per share is computed using the weighted average number of shares outstanding. Diluted income per share reflects the potential dilution that would occur if stock options were exercised using the average market price for Ellora's stock for the period. Total potential dilutive shares based on options outstanding at June 30, 2007 were 1,823,218.
Ellora's calculation of earnings per share for common stock for the six month periods ended June 30, 2006 and 2007 is as follows:
| | 2006 | 2007 | |||||||||||||||
|---|---|---|---|---|---|---|---|---|---|---|---|---|---|---|---|---|---|
| | Net Income | Shares | Net Income Per Share | Net Income | Shares | Net Income Per Share | |||||||||||
| Basic earnings per share | $ | 7,831,000 | 42,310,871 | $ | .19 | $ | 2,968,000 | 44,837,712 | $ | .07 | |||||||
| Effect of dilutive shares of common stock from stock options | 1,744,266 | (.01 | ) | 1,823,218 | (.01 | ) | |||||||||||
| Diluted earnings per share | $ | 7,831,000 | 44,055,137 | $ | .18 | $ | 2,968,000 | 46,660,930 | $ | .06 | |||||||
Use of Estimates and Certain Significant Estimates—The preparation of Ellora's financial statements in conformity with accounting principles generally accepted in the United States of America requires Ellora's management to make estimates and assumptions that affect the amounts reported in these financial statements and accompanying notes. Actual results could differ from those estimates. These estimates include collection of receivables, selection of the useful lives for property and equipment and timing and costs associated with its retirement obligations. Significant assumptions are also required in the valuation of proved oil and gas reserves, which will affect the depletion calculation and possibly any impairment of oil and gas properties. It is at least reasonably possible those estimates could be revised in the near term and those revisions could be material.
F-36
New Accounting Pronouncements—In July 2006, the Financial Accounting Standards Board ("FASB") issued Interpretation No. 48, Accounting for Uncertainty in Income Taxes—an interpretation of FASB Statement No. 109 ("FIN 48"). The interpretation creates a single model to address accounting for uncertainty in tax positions. Specifically, the pronouncement prescribes a recognition threshold and a measurement attribute for the financial statement recognition and measurement of a tax position taken or expected to be taken in a tax return. The interpretation also provides guidance on derecognition, classification, interest and penalties, accounting in interim periods, disclosure and transition on uncertain tax positions.
The Company adopted the provisions of FIN 48 on January 1, 2007. The adoption of FIN 48 did not have a material impact on the Company's consolidated financial position or results of operations.
The Company files income tax returns in the U.S. Federal jurisdiction and various State jurisdictions. The Company is in the process of completing our 2005 and 2006 Federal tax returns. The following is a listing of tax years that remain subject to examination by major jurisdiction:
| U.S. Federal | December 31, 2003—December 31, 2004 | |
| U.S. States | December 31, 2003—December 31, 2005 |
The Company's policy is to recognize potential interest and penalties accrued related to unrecognized tax benefits within income tax expense. For the six month period ended June 30, 2007, the Company did not recognize any interest or penalties in the condensed consolidated statements of income, nor did the Company have any interest or penalties accrued in its condensed consolidated balance sheet at June 30, 2007 relating to unrecognized tax benefits.
In September 2006, the FASB issued SFAS No. 157, "Fair Value Measurements." SFAS No. 157 defines fair value, establishes a framework for measuring fair value in generally accepted accounting principles and expands disclosures about fair value measurements. SFAS No. 157 is effective for fiscal years beginning after November 15, 2007. While the Company is currently evaluating the impact of SFAS No. 157, the Company does not believe the impact will be material to its results of operations.
In February 2007, the SFAS issued SFAS No. 159, The Fair Value Option for Financial Assets and Financial Liabilities (SFAS 159). SFAS 159 permits an entity to irrevocably elect fair value on a contract-by-contract basis as the initial and subsequent measurement attribute for many financial assets and liabilities and certain other items including insurance contracts. Entities electing the fair value option would be required to recognize changes in fair value in earnings and to expense upfront cost and fees associated with the item for which the fair value option is elected. SFAS 159 is effective for fiscal years beginning after November 15, 2007. Early adoption is permitted as of the beginning of a fiscal year that begins on or before November 15, 2007, provided the entity also elects to apply the provisions of SFAS No. 157, Fair Value Measurements. The Company is currently evaluating the impact, if any, of adopting SFAS 159 on its financial condition or results of operations.
Unaudited Informations—The accompanying interim financial information as of June 30, 2007 and for the six month periods ended June 30, 2006 and 2007 was taken from Ellora's books and records without audit. However, in the opinion of management, such information includes all
F-37
adjustments (consisting only of normal recurring accruals), which are necessary to properly reflect the financial position of Ellora as of June 30, 2007 and the results of operations for the six month periods ended June 30, 2006 and 2007. It is recommended that these unaudited financial statements be read in conjunction with the audited financial statements and notes included in the Company's Form S-1 registration statement. The results of operations for the six months ended June 30, 2007 are not necessarily indicative of those to be expected for the year ended December 31, 2007.
2. ACQUISITIONS:
In February of 2007, Presco Western LLC (a wholly owned subsidiary of Ellora) entered into a purchase and sale agreement for $27,788,000 covering developed and undeveloped leasehold mineral interests in the Hugoton Field of Southwestern Kansas. Included were producing properties and leasehold mineral interests underlying the Presco Western farmout agreement. Upon closing, Presco will own the leasehold mineral interests in depths below the top of the Heebner Shale equaling approximately 618,000 net leasehold acres, producing wells with combined production of approximately 2,000 Mcfe per day, and an additional 75,000 undeveloped net acres and an increased net revenue interest from 80% to 87.5%. The purchase and sale agreement is subject to standard conditions to closing, including Ellora's completion of title and environmental due diligence. The acquisition will be funded under Ellora's credit agreement. Presco had closed on approximately $19,331,000 of the purchase as of June 30, 2007 and the final closing, in the amount of $8,207,000 occurred in July of 2007.
On February 22, 2007, English Bay Pipeline, L.P. (a wholly owned subsidiary of Ellora) acquired a 100% interest in the 20 mile long Shelby Pipeline in Shelby County, Texas for approximately $6,500,000. The pipeline transports gas from the southern portion of the Huxley Field for Ellora and other independent producers to an interstate pipeline. In addition, this line was connected to Ellora's English Bay Pipeline during March of 2007.
3. ASSET RETIREMENT OBLIGATION:
In June 2001, the Financial Accounting Standards Board issued Statement of Financial Accounting Standards No. 143 (SFAS No. 143), "Accounting for Asset Retirement Obligations." Ellora adopted SFAS No. 143 beginning January 1, 2003. The most significant impact of this standard on Ellora was a change in the method of accruing for costs to plug and abandon oil and gas properties. Under SFAS No. 143, the fair value of asset retirement obligations is recorded as a liability when incurred, which is typically at the time the assets are placed in service. Amounts recorded for the related assets are increased by a corresponding amount of these obligations. Prospectively, the liabilities are accreted for the change in their present value and the initial capitalized costs are depleted, depreciated and amortized over the productive lives of the related assets.
F-38
At December 31, 2006 and June 30, 2007, there were no assets legally restricted for purposes of settling asset retirement obligations. The following is a reconciliation of Ellora's asset retirement obligations as of December 31, 2006 and June 30, 2007:
| | Six Months Ended June 30, 2007 Consolidated | ||
|---|---|---|---|
| Beginning of Period | $ | 1,322,000 | |
| Additional liabilities incurred | 573,000 | ||
| Accretion expense | 53,000 | ||
| Revisions to estimate | — | ||
| End of Period | $ | 1,948,000 | |
4. LONG-TERM DEBT:
Long-term debt consisted of the following at December 31, 2006 and June 30, 2007:
| | December 31, 2006 Consolidated | June 30, 2007 Consolidated | ||||
|---|---|---|---|---|---|---|
| Credit Agreement. | $ | 16,000,000 | $ | 71,000,000 | ||
On February 3, 2006, Ellora entered into a $400,000,000 credit agreement with an initial borrowing base of $110,000,000 with a syndicate of banks led by JP Morgan Chase Bank, N.A. Commitment fees of 0.30% to 0.50% accrue on the unused portion of the borrowing base, depending on the utilization percentage and are included as a component of interest expense. For the six months ended June 30, 2007 the weighted average interest rate on the entire outstanding principal balance was 7.39% and the effective interest rate as of June 30, 2007 was 7.10%. Interest accrues at either (1) the base rate plus a margin where the base rate is defined as the higher of the prime rate or the federal funds rate plus a margin varying from 0% to 0.75% depending on the utilization percentage of the borrowing base, or (2) at the LIBOR rate plus a margin where the margin varies from 1.25% to 2.00% depending on the utilization percentage of the borrowing base. Ellora has consistently chosen the LIBOR rate option since it delivers the lowest effective interest rate. The loan is collateralized by Ellora's oil and gas properties and includes certain financial covenants, for which Ellora was in compliance for six months ended June 30, 2007.
The credit agreement provides for interest only payments until February 3, 2010, when the entire amount borrowed is due. Ellora may, throughout the term of the credit agreement, borrow and repay up to the borrowing base in effect from time to time.
5. STOCKHOLDERS' EQUITY:
Ellora Energy Inc.—At inception, Ellora Energy Inc. issued 16,184,336 shares of common stock for $20,000,000. Ellora Energy Inc. issued 4,046,084 shares in 2003 for $10,000,000 and 3,236,867 shares in 2004 for $8,000,000. In addition, Ellora Energy Inc. has 10,000,000 shares of
F-39
$.001 par value preferred stock authorized with none issued. The preferred stock may be issued in such series and preferences as determined by Ellora Energy Inc.'s board of directors.
Ellora Oil and Gas Inc.—During April 2005, Ellora Oil and Gas Inc. issued 12,994,879 shares of common stock for $64,250,000.
Subscription Agreements—For shares of common stock sold and issued to employees, Ellora Energy Inc. has financed the sale of those shares and entered into full recourse promissory notes that are collateralized by Ellora Energy Inc.'s stock. The promissory notes have been reflected as a reduction of stockholders' equity and are due June 2009, with an interest rate of 6%. Interest of $928,000 on these subscriptions has been recorded as a reduction to stockholders' equity and an addition to additional paid-in capital through July 11, 2006. On July 12, 2006 Ellora completed the private placement of 2,499,992 shares of common stock pursuant to Rule 144A and Section 4(2) under the Securities Act of 1933, as amended. In connection with this offering, Ellora received approximately $6,425,000, including $928,000 of accrued interest, from certain of the selling stockholders for repayment of the subscription agreements.
Ellora Energy Inc. 2006 Stock Option Plan—Ellora Energy Inc. adopted the 2002 Stock Option Plan (the "2002 Plan") for employees and non-employee directors to receive stock option rewards. Under the 2002 Plan, 130,253 shares were outstanding as of December 31, 2005. On July 12, 2006 the 130,253 options outstanding were split 8.092168039-for-1. Upon completion of the split the 2002 Stock Option Plan was converted to the Ellora Energy Inc. 2006 Stock Option Plan.
Ellora Oil and Gas Inc. adopted the 2005 Stock Option Plan for employees and non-employee directors to receive stock option rewards. Under the 2005 Plan, 82,000 options were outstanding as of December 31, 2005. On July 12, 2006 the options of Ellora Oil and Gas Inc. were exchanged for options of Ellora Energy Inc. Each option of Ellora Oil and Gas Inc. was exchanged for 2.499391 options of Ellora Energy Inc. Immediately after the exchange of the options, the options were split 8.092168039-for-1. Upon completion of the split the 2005 Stock Option Plan was converted to the Ellora Energy Inc. 2006 Stock Option Plan.
The following table shows a summary of the non-qualified options as of June 30, 2007:
| | Number of Options | Weighted Average Exercise Price | Weighted Average Fair Value | ||||||
|---|---|---|---|---|---|---|---|---|---|
| Outstanding, December 31, 2006 | 2,637,857 | $ | 3.54 | $ | 1.67 | ||||
| Granted | — | — | — | ||||||
| Exercised | (48,302 | ) | 4.94 | 2.46 | |||||
| Expired | — | — | — | ||||||
| Cancelled | (33,179 | ) | 4.94 | 2.46 | |||||
| Outstanding, June 30, 2007 | 2,556,376 | $ | 3.54 | $ | 1.67 | ||||
F-40
The above options vest as follows:
| | Number of Options | Weighted Average Exercise Price | Weighted Average Fair Value Price | |||||
|---|---|---|---|---|---|---|---|---|
| Vested as of June 30, 2007 | 2,008,602 | $ | 3.31 | $ | 1.51 | |||
| Vest during the remainder of 2007 | 252,818 | 4.94 | 2.46 | |||||
| Vest in 2008 | 294,956 | 4.94 | 2.46 | |||||
| 2,556,376 | $ | 3.65 | $ | 1.71 | ||||
All options issued and outstanding under the 2002 and 2005 Plans were converted into options issued and outstanding under Ellora's 2006 Plan. If not previously exercised, the Ellora Energy Inc. options outstanding at June 30, 2007, which were issued under the 2002 Plan will expire in 2010. If not previously exercised, the Ellora Energy Inc. options outstanding at June 30, 2007, which were issued under the 2005 Plan will expire in 2012. Total estimated unrecognized compensation cost for the unvested stock options as of June 30, 2007 was approximately $1,372,670, which is expected to be recognized over a period of 1.08 years. The intrinsic value of the outstanding and vested shares, based on an estimated intrinsic value of $12.00 per share less the weighted average exercise price was $10.24 for options originally issued under the 2002 Plan and $7.06 for options originally issued under the 2005 Plan as of December 31, 2006.
6. INCOME TAXES:
The provision for income taxes consists of the following:
| | June 30, 2006 Consolidated | June 30, 2007 Consolidated | |||||
|---|---|---|---|---|---|---|---|
| Current taxes | $ | — | $ | — | |||
| Deferred taxes | 5,241,000 | 1,858,000 | |||||
| Total income tax expense | $ | 5,241,000 | $ | 1,858,000 | |||
The deferred income tax liability of $25,205,000 for the six months ended June 30, 2007 is composed of future taxable temporary differences related to Ellora's oil and gas properties, including amounts previously recorded in connection with the acquisition of properties and subsequent differences between financial and tax reporting for oil and gas properties and is partially offset by Ellora's net operating loss carryforwards. At June 30, 2007, Ellora Energy Inc. had net operating loss carryforwards for Federal tax purposes of approximately $46,765,000.
7. MAJOR CUSTOMERS:
For the six months ended June 30, 2006 and 2007, Louis Dreyfus Energy Services accounted for 54% and 31%, and Plains Marketing, L.P. accounted for 19% and 18%, respectively, of our oil and gas sales. Management believes that the loss of any individual purchaser would not have a long-term material adverse impact on the financial position or results of operations of the Company.
F-41
8. COMMITMENTS:
Office Lease—Ellora leases office space with a term through January 31, 2010. Total rental expense was $107,000 and $470,000 for the periods ended June 30, 2006 and 2007, respectively. Ellora's obligation for future minimum lease payments under this agreement is as follows:
| 2007 | $ | 611,000 | |
| 2008 | 1,069,000 | ||
| 2009 | 1,124,000 | ||
| 2010 | 950,000 | ||
| 2011 | 973,000 | ||
| $ | 4,727,000 | ||
Environmental Issues—Ellora is engaged in oil and gas exploration and production and may incur liability for environmental clean up of well sites or other environmental restoration procedures as they relate to the drilling of oil and gas wells and the operation thereof. In Ellora's acquisition of existing or previously drilled well bores, Ellora may not be aware of what environmental safeguards were taken at the time such wells were drilled or during such time the wells were operated. Petroleum hydrocarbons or wastes may have been disposed of or released on or under properties owned or leased by Ellora or on or under other locations where such wastes have been taken for disposal. Should it be determined that a liability exists with respect to any environmental clean up or restoration, the liability to cure such a violation could fall upon Ellora. Management believes its properties are operated in conformity with local state and Federal regulations. No claim has been made, nor is Ellora aware of any uninsured liability that Ellora may have, as it relates to any environmental clean up, restoration or the violation of any rules or regulations relating thereto.
9. DERIVATIVE FINANCIAL INSTRUMENTS:
Ellora entered into various futures commitments to minimize the effect of natural gas price fluctuations summarized in the table below. Management does not anticipate that the execution of such transactions will result in any significant losses based on current market conditions. As of June 30, 2007, Ellora had the following outstanding financial natural gas positions:
| Contract Type | Weighted Average Floor Price | Quantity | Contract Period | ||||
|---|---|---|---|---|---|---|---|
| | | (Mmbtu) | | ||||
| Futures Put | $ | 6.50 | 200,000 | July 2007 | |||
| Futures Put | $ | 6.50 | 200,000 | August 2007 | |||
| Futures Put | $ | 6.50 | 200,000 | September 2007 | |||
As of June 30, 2007, the above contracts had an unrealized loss, net of deferred tax effect, of ($52,000), which is recorded in other comprehensive income.
F-42
REPORT OF INDEPENDENT REGISTERED PUBLIC ACCOUNTING FIRM
To the Board of Directors
Ellora Energy Inc.
Boulder, Colorado
We have audited the accompanying statements of income, members' equity and cash flows of Presco Western, LLC for the year ended December 31, 2004. These financial statements are the responsibility of the Company's management. Our responsibility is to express an opinion on these financial statements based on our audits.
We conducted our audits in accordance with the standards of the Public Company Accounting Oversight Board (United States). Those standards require that we plan and perform the audit to obtain reasonable assurance about whether the financial statements are free of material misstatement. An audit includes examining, on a test basis, evidence supporting the amounts and disclosures in the financial statements. An audit also includes assessing the accounting principles used and significant estimates made by management, as well as evaluating the overall financial statement presentation. We believe that our audits provide a reasonable basis for our opinion.
In our opinion, the financial statements referred to above present fairly, in all material respects, the operating results of Presco Western, LLC as of December 31, 2004, and its cash flows for the year then ended in conformity with accounting principles generally accepted in the United States of America.
HEIN & ASSOCIATES LLP
Denver, Colorado
October 2, 2006
See accompanying notes to the financial statements.
F-43
PRESCO WESTERN, LLC
STATEMENTS OF INCOME
| | For the Year Ended December 31, 2004 | Three Months Ended March 31, 2005 | ||||||
|---|---|---|---|---|---|---|---|---|
| | | (unaudited) | ||||||
| REVENUE: | ||||||||
| Oil and gas sales | $ | 5,792,000 | $ | 1,635,000 | ||||
| Interest income and other | 66,000 | 12,000 | ||||||
| Total revenue | 5,858,000 | 1,647,000 | ||||||
COSTS AND EXPENSES: | ||||||||
| Lease operating expense | 1,075,000 | 241,000 | ||||||
| Abandonment expense | 405,000 | — | ||||||
| Production taxes | 213,000 | 60,000 | ||||||
| Depreciation, depletion and amortization | 324,000 | 81,000 | ||||||
| Exploration | 755,000 | — | ||||||
| General and administrative | 894,000 | 223,000 | ||||||
| Interest expense | 5,000 | — | ||||||
| Total costs and expenses | 3,671,000 | 605,000 | ||||||
NET INCOME | 2,187,000 | 1,042,000 | ||||||
PRO FORMA INCOME TAXES | 831,000 | 396,000 | ||||||
PRO FORMA NET INCOME | $ | 1,356,000 | $ | 646,000 | ||||
See accompanying notes to the financial statements.
F-44
PRESCO WESTERN, LLC
STATEMENTS OF MEMBERS' EQUITY
FOR THE YEAR ENDED DECEMBER 31, 2004
AND THE THREE MONTHS ENDED MARCH 31, 2005
| | Members' Equity | ||||
|---|---|---|---|---|---|
BALANCE, January 1, 2004 | 2,019,000 | ||||
Net income | 2,187,000 | ||||
| Distribution to stockholders | (133,000 | ) | |||
BALANCE, December 31, 2004 | 4,073,000 | ||||
Net income (unaudited) | 1,042,000 | ||||
BALANCE, March 31, 2005 (unaudited) | $ | 5,115,000 | |||
See accompanying notes to the financial statements.
F-45
PRESCO WESTERN, LLC
STATEMENTS OF CASH FLOWS
| | For the Year Ended December 31, 2004 | Three Months Ended March 31, 2005 | ||||||||
|---|---|---|---|---|---|---|---|---|---|---|
| | | (unaudited) | ||||||||
| CASH FLOWS FROM OPERATING ACTIVITIES: | ||||||||||
| Net income | $ | 2,187,000 | $ | 1,042,000 | ||||||
| Adjustments to reconcile net income to net cash provided by operating activities: | ||||||||||
| Depreciation, depletion and amortization | 324,000 | 81,000 | ||||||||
| Exploration | 755,000 | — | ||||||||
| Changes in operating assets and liabilities: | ||||||||||
| Accounts receivable | (280,000 | ) | (274,000 | ) | ||||||
| Accounts payable and accrued expenses | 419,000 | (214,000 | ) | |||||||
| Oil and gas revenues payable | 33,000 | 33,000 | ||||||||
| Net cash provided by operating activities | 3,438,000 | 668,000 | ||||||||
CASH FLOWS FROM INVESTING ACTIVITIES: | ||||||||||
| Drilling capital expenditures | (3,247,000 | ) | (731,000 | ) | ||||||
| Purchase of other property and equipment | — | — | ||||||||
| Net cash used in investing activities | (3,247,000 | ) | (731,000 | ) | ||||||
CASH FLOWS FROM FINANCING ACTIVITIES: | ||||||||||
| Capital distribution | (133,000 | ) | — | |||||||
| Net cash used in financing activities | (133,000 | ) | — | |||||||
INCREASE (DECREASE) IN CASH | 58,000 | (63,000 | ) | |||||||
| CASH, beginning of period | 290,000 | 348,000 | ||||||||
| CASH, end of period | $ | 348,000 | $ | 285,000 | ||||||
SUPPLEMENTAL CASH FLOW INFORMATION: | ||||||||||
| Cash paid for interest | $ | 5,000 | $ | — | ||||||
| Cash paid for taxes | $ | — | $ | — | ||||||
See accompanying notes to the financial statements.
F-46
PRESCO WESTERN, LLC
NOTES TO FINANCIAL STATEMENTS
1. BASIS OF PRESENTATION:
On April 12, 2005, Ellora acquired Presco Western, LLC ("Presco") for approximately $45,000,000 in cash. These historical financial statements, which include the results of operations, cash flows and members' equity, were required under Rule 3-05 of the Securities and Exchange Commission Regulation S-X.
Fair Value of Financial Instruments—Presco's financial instruments approximate their fair value because of the short-term maturity of these instruments.
Concentration of Credit Risk—Substantially all of Presco's receivables are within the oil and gas industry, primarily from the sale of oil and gas products and billings to working interest owners. Collectibility is dependent upon the general economic conditions of the industry. Most of the receivables are not collateralized and to date, Presco has had minimal bad debts.
Oil and Gas Producing Operations—Presco follows the successful efforts method of accounting for its oil and gas properties. Under this method of accounting, all property acquisition costs and costs of exploratory and development wells are capitalized when incurred, pending determination of whether the well has found proved reserves. If an exploratory well has not found proved reserves, the costs of drilling the well and other associated costs are charged to expense. The costs of development wells are capitalized whether productive or nonproductive. Costs incurred to maintain wells and related equipment and lease and well operating costs are charged to expense as incurred. Gains and losses arising from sales of properties are included in income. Geological and geophysical costs of exploratory prospects and the costs of carrying and retaining unproved properties are expensed as incurred. An impairment is recorded for unproved properties if the capitalized costs are not considered to be realizable.
Depletion, depreciation and amortization ("DD&A") of capitalized costs of proved oil and gas properties is provided for on a field-by-field basis using the units of production method based upon proved reserves. The computation of DD&A takes into consideration the anticipated proceeds from equipment salvage and Presco's expected cost to abandon its well interests. Depletion expense for oil and gas producing property and related equipment was $311,000 for the year ended December 31, 2004.
In accordance with Statement of Financial Accounting Standards (SFAS) No. 144, "Accounting for the Impairment of Long-Lived Assets and for Long-Lived Assets to Be Disposed Of," Presco assesses its proved oil and gas properties for impairment whenever events or circumstances indicate that the carrying value of the assets may not be recoverable. The impairment test compares future net undiscounted cash flows to the assets' net book value. If the net capitalized cost exceeds future net cash flows, then the cost of the property is written down to "fair value." Fair value for oil and natural gas properties is generally determined based on discounted future net cash flows.
Abandonment Liability—Effective January 1, 2003, Presco adopted the provisions of SFAS No. 143, "Accounting for Asset Retirement Obligations." This Statement generally applies to legal obligations associated with the retirement of long-lived assets that result from the acquisition, construction, development and/or the normal operation of a long-lived asset. SFAS No. 143 requires Presco to recognize the fair value of asset retirement obligations in the financial statements by capitalizing that cost as a part of the cost of the related asset. In regard to Presco,
F-47
this Statement applies directly to the plug and abandonment liabilities associated with Presco's net working interest in well bores. The additional carrying amount is depleted over the estimated lives of the properties. The discounted liability is based on historical abandonment costs in specific areas and is accreted at the end of each accounting period through charges to depreciation, depletion and amortization expense. If the obligation is settled for other than the carrying amount, then a gain or loss is recognized on settlement.
Revenue Recognition—Presco recognizes oil and gas revenues for only its ownership percentage of total production under the entitlement method. Purchase, sale and transportation of natural gas are recognized upon completion of the sale and when transported volumes are delivered according to the terms of the contract.
Income Taxes—Presco is a limited liability company under the Internal Revenue Code. As such, it is not subject to income taxes as a separate entity, and its income or loss is required to be included in the income tax returns of its equity holders. For financial presentation purposes, pro forma income tax expense has been calculated on the statements of income using and effective tax rate of 38%
Use of Estimates and Certain Significant Estimates—The preparation of Presco's financial statements in conformity with accounting principles generally accepted in the United States of America requires management to make estimates and assumptions that affect the amounts reported in these financial statements and accompanying notes. Actual results could differ from those estimates. These estimates include realizability of receivables, selection of the useful lives for property and equipment and timing and costs associated with its retirement obligations. Significant assumptions are also required in the valuation of proved oil and gas reserves, which will affect the depletion calculation and possibly any impairment of oil and gas properties. It is at least reasonably possible those estimates could be revised in the near term and those revisions could be material.
Unaudited Information—The accompanying interim financial information for the three months ended March 31, 2005 was taken from Presco's books and records without audit. However, in the opinion of management, such information includes all adjustments (consisting only of normal recurring accruals), which are necessary to properly reflect the results of operations for the three months ended March 31, 2005.
2. COMMITMENTS:
Environmental Issues—Presco is engaged in oil and gas exploration and production and may become subject to certain liabilities as they relate to environmental clean up of well sites or other environmental restoration procedures as they relate to the drilling of oil and gas wells and the operation thereof. Acquisition of existing or previously drilled well bores, Presco may not be aware of what environmental safeguards were taken at the time such wells were drilled or during such time the wells were operated. Should it be determined that a liability exists with respect to any environmental clean up or restoration, the liability to cure such a violation could fall upon Presco. Management believes its properties are operated in conformity with local state and Federal regulations. No claim has been made, nor is Presco aware of any uninsured liability that it may have, as it relates to any environmental clean up, restoration or the violation of any rules or regulations relating thereto.
F-48
3. OIL AND GAS ACTIVITIES:
Presco's oil and natural gas activities are entirely within the United States. Costs incurred in oil and natural gas producing activities are as follows:
| | 2004 | ||
|---|---|---|---|
| Unproved property acquisition | $ | — | |
| Proved property acquisition | — | ||
| Development | 2,672,000 | ||
| Exploration | 755,000 | ||
| Total | $ | 3,427,000 | |
During 2004, additions to oil and gas properties of approximately $23,000 were recorded for the estimated costs of future abandonment related to new wells drilled or acquired.
4. DISCLOSURES ABOUT OIL AND GAS PRODUCING ACTIVITIES (UNAUDITED):
Reserve Quantities—The following table summarizes the estimated quantities of proved oil and gas reserves of Presco. These amounts were derived from reserve estimates prepared by Management. Estimates of proved reserves are inherently imprecise and are continually subject to revision based on production history, results of additional exploration and development, price changes and other factors. The oil and gas reserves stated below are attributable solely to properties within the United States.
| | Gas | Oil | |||||
|---|---|---|---|---|---|---|---|
| | (MMcf) | (MBbl) | |||||
| Balance—January 1, 2004 | 2,028 | 829 | |||||
Production | (266 | ) | (153 | ) | |||
| Extensions and discoveries | 2,893 | 63 | |||||
| Revisions to previous quantity estimate | (346 | ) | (103 | ) | |||
Balance—December 31, 2004 | 4,309 | 636 | |||||
Proved undeveloped reserves: | |||||||
| December 31, 2002 | No undeveloped | ||||||
| December 31, 2003 | No undeveloped | ||||||
| December 31, 2004 | No undeveloped | ||||||
F-49
Standardized Measure of Discounted Future Net Cash Flows—The standardized measure of discounted future net cash flows relating to proved oil and gas reserves and the changes in standardized measure of discounted future net cash flows relating to proved oil and gas reserves were prepared in accordance with the provisions of SFAS No. 69. Future cash inflows were computed by applying prices at year end to estimated future production, less estimated future expenditures (based on year end costs) to be incurred in developing and producing the proved reserves, less estimated future income tax expense. Future income tax expenses are calculated by applying appropriate year-end tax rates to future pretax net cash flows, less the tax basis of properties involved. Future net cash flows are discounted at a rate of 10% annually to derive the standardized measure of discounted future net cash flows. This calculation procedure does not necessarily result in an estimate of the fair market value or the present value of Presco (in thousands).
| | 2004 | ||||
|---|---|---|---|---|---|
| Future cash flows | $ | 50,972 | |||
| Future production costs | (10,434 | ) | |||
| Future development costs | (5,576 | ) | |||
| Future income tax expense | (12,233 | ) | |||
| Future net cash flows | 22,729 | ||||
| 10% annual discount for estimated timing of cash flows | (11,278 | ) | |||
| Standardized measure of discounted future net cash flows | $ | 11,451 | |||
The changes in the standardized measure of discounted future net cash flows relating to proved oil and gas reserves are as follows (in thousands):
| | 2004 | |||||
|---|---|---|---|---|---|---|
| Beginning of year | $ | 10,986 | ||||
| Sale of oil and gas produced, net of production costs | (4,504 | ) | ||||
| Net changes in prices and production costs | 1,455 | |||||
| Extensions, discoveries and improved recoveries | 9,039 | |||||
| Development costs — net | (4,700 | ) | ||||
| Revisions of previous quantity estimates | (3,637 | ) | ||||
| Net change in income taxes | 213 | |||||
| Accretion of discount | 1,736 | |||||
| Changes in production rates and other | 863 | |||||
| End of year | $ | 11,451 | ||||
F-50
Average wellhead prices in effect at December 31, 2004 inclusive of adjustments for quality and location used in determining future net revenues related to the standardized measure calculation are as follows:
| | 2004 | ||
|---|---|---|---|
| Oil (per Bbl) | $ | 39.55 | |
| Gas (per Mcf) | $ | 5.60 | |
F-51
REPORT OF INDEPENDENT REGISTERED PUBLIC ACCOUNTING FIRM
Board of Directors
Ellora Energy Inc.
Boulder, Colorado
We have audited the accompanying statement of revenues and direct operating expenses of the Shelby County acquisition properties for the year ended December 31, 2004. The statement of revenues and direct operating expenses is the responsibility of the Company's management. Our responsibility is to express an opinion on the statement of revenues and direct operating expenses based on our audit.
We conducted our audit in accordance with the standards of the Public Company Accounting Oversight Board (United States). Those standards require that we plan and perform the audit to obtain reasonable assurance about whether the historical summaries are free of material misstatement. An audit includes examining, on a test basis, evidence supporting the amounts and disclosures in the historical summaries. An audit also includes assessing the accounting principles used and significant estimates made by management, as well as evaluating the overall historical summaries presentation. We believe that our audit provides a reasonable basis for our opinion.
The accompanying statement of revenues and direct operating expenses was prepared for the purpose of complying with the rules and regulations of the Securities and Exchange Commission (for inclusion in the Form S-1 of Ellora Energy Inc.) as described in Note 1 and are not intended to be a complete presentation of the properties' revenues and expenses.
In our opinion, the statement of revenues and direct operating expenses referred to above present fairly, in all material respects, the revenue and direct operating expenses of the Shelby County acquisition properties for the year ended December 31, 2004 in conformity with accounting standards generally accepted in the United States of America.
HEIN & ASSOCIATES LLP
Denver, Colorado
October 6, 2006
See accompanying notes to the Statements of Revenues and Direct Operating Expenses
F-52
SHELBY COUNTY ACQUISTION PROPERTIES
STATEMENTS OF REVENUES AND DIRECT OPERATING EXPENSES
FOR THE YEAR ENDED DECEMBER 31, 2004
AND THE SIX MONTHS ENDED JUNE 30, 2005 (UNAUDITED)
| | Year Ended December 31, 2004 | Six Months Ended June 30, 2005 | ||||||
|---|---|---|---|---|---|---|---|---|
| | | (unaudited) | ||||||
| REVENUES—Oil and gas production | $ | 4,222,000 | $ | 2,559,000 | ||||
| DIRECT OPERATING EXPENSES: | ||||||||
| Lease operating expense | 731,000 | 279,000 | ||||||
| Production taxes | 128,000 | 71,000 | ||||||
| Total direct operating expenses | 859,000 | 350,000 | ||||||
REVENUE IN EXCESS OF DIRECT OPERATING EXPENSES | $ | 3,363,000 | $ | 2,209,000 | ||||
See accompanying notes to the Statements of Revenues and Direct Operating Expenses
F-53
SHELBY COUNTY ACQUISTION PROPERTIES
NOTES TO STATEMENTS OF REVENUE AND DIRECT OPERATING EXPENSES
1. BASIS OF PRESENTATION:
On August 31, 2005, Ellora completed its acquisition of additional interests in natural gas fields located in Shelby County, Texas from a minority stockholder and former director of Ellora Energy Inc. for approximately $26,000,000. The properties are referred to herein as the "Shelby County Acquisition Properties," or "Shelby." The purchase price was entirely allocated to oil and gas properties.
Ellora was the operator of these wells prior to the acquisition of the additional interest. The accompanying statements of revenues and direct operating expenses were derived from the historical accounting records of Ellora and reflect the acquired interest in the revenues and direct operating expenses of the Shelby County Acquisition Properties. Such amounts may not be representative of future operations. The statements do not include depreciation, depletion and amortization, general and administrative expenses, income taxes or interest expense as these costs may not be comparable to the expenses expected to be incurred by Ellora on a prospective basis.
Shelby used the sales method to record gas revenue, where revenue is recognized based on the amount of gas sold to purchasers. Direct operating expenses include payroll, leases and well repairs, production taxes, maintenance, utilities and other direct operating expenses.
The process of preparing financial statements in conformity with generally accepted principles requires the use of estimates and assumptions regarding certain types of revenues and expenses. Such estimates primarily relate to unsettled transactions and events as of the date of the financial statements. Accordingly, upon settlement, actual results may differ from estimated amounts.
Historical financial statements reflecting financial position, results of operations and cash flows required by generally accepted accounting principles are not presented as such information is not readily available on an individual property basis and not meaningful to the Shelby County Acquisition Properties. Accordingly, the historical statements of revenue and direct operating expenses are presented in lieu of the financial statements required under Rule 3-05 of the Securities and Exchange Commission Regulation S-X.
Unaudited Information—The accompanying interim financial information for the six months ended June 30, 2005 was taken from Ellora's books and records without audit. However, in the opinion of management, such information includes all adjustments (consisting only of normal recurring accruals), which are necessary to properly reflect the financial results of operations for the six months ended June 30, 2005.
2. SUPPLEMENTAL DISCLOSURES OF OIL AND GAS PRODUCING ACTIVITIES (UNAUDITED):
Reserve Quantities—The following table summarizes the estimated quantities of proved oil and gas reserves of the Shelby County Acquisition Properties. These amounts were derived from reserve estimates prepared by Management. Estimates of proved reserves are inherently imprecise and are continually subject to revision based on production history, results of additional exploration and
F-54
development, price changes and other factors. The oil and gas reserves stated below are attributable solely to properties within the United States.
| | Gas | |||
|---|---|---|---|---|
| | (MMcf) | |||
| Balance—January 1, 2004 | 6,631 | |||
| Production | (758 | ) | ||
| Extensions and discoveries | 2,472 | |||
| Revisions to previous quantity estimate | 1,600 | |||
| Balance—December 31, 2004 | 9,945 | |||
| Proved developed reserves: | ||||
| December 31, 2003 | 6,631 | |||
| December 31, 2004 | 9,945 | |||
Standardized Measure of Discounted Future Net Cash Flows—The standardized measure of discounted future net cash flows relating to proved oil and gas reserves and the changes in standardized measure of discounted future net cash flows relating to proved oil and gas reserves were prepared in accordance with the provisions of SFAS No. 69. Future cash inflows were computed by applying prices at year end to estimated future production, less estimated future expenditures (based on year end costs) to be incurred in developing and producing the proved reserves, less estimated future income tax expense. Future income tax expenses are calculated by applying appropriate year-end tax rates to future pretax net cash flows, less the tax basis of properties involved. Future net cash flows are discounted at a rate of 10% annually to derive the standardized measure of discounted future net cash flows. This calculation procedure does not necessarily result in an estimate of the fair market value or the present value of the Shelby County Acquisition Properties (in thousands).
| | 2004 | ||||
|---|---|---|---|---|---|
| Future cash flows | $ | 62,777 | |||
| Future production costs | (14,586 | ) | |||
| Future development costs | — | ||||
| Future income tax expense | (17,054 | ) | |||
| Future net cash flows | 31,137 | ||||
| 10% annual discount for estimated timing of cash flows | (17,289 | ) | |||
| Standardized measure of discounted future net cash flows | $ | 13,848 | |||
F-55
The changes in the standardized measure of discounted future net cash flows relating to proved oil and gas reserves are as follows (in thousands):
| | 2004 | |||||
|---|---|---|---|---|---|---|
| Beginning of year | $ | 8,587 | ||||
| Sale of oil and gas produced, net of production costs | (3,363 | ) | ||||
| Net changes in prices and production costs | 150 | |||||
| Extensions, discoveries and improved recoveries | 5,327 | |||||
| Revisions of previous quantity estimates | 3,448 | |||||
| Net change in income taxes | (2,693 | ) | ||||
| Accretion of discount | 1,348 | |||||
| Changes in production rates and other | 1,044 | |||||
| End of year | $ | 13,848 | ||||
Average wellhead prices in effect at December 31, 2004, inclusive of adjustments for quality and location used in determining future net revenues, related to the standardized measure calculation are as follows:
| | 2004 | ||
|---|---|---|---|
| Oil (per Bbl) | $ | 39.55 | |
| Gas (per Mcf) | $ | 5.60 | |
F-56
August 6, 2007
| Mr. T. Scott Martin CEO Ellora Energy, Inc. 5480 Valmont, 3rd Floor Boulder, CO 80301 |  |
Dear Mr. Martin:
Pursuant to your request, MHA Petroleum Consultants, Inc. (MHA) has prepared an estimate of the reserves and income attributable to certain oil and gas properties of Ellora Energy, Inc. (Ellora), effective June 30, 2007. These properties are located in Colorado, Kansas, Louisiana, and Texas.
The reserve and income data have been estimated using parameters provided by Ellora. Midyear pricing was provided by Ellora and price differentials were applied. Operating costs and capital costs were held constant.
Reserve estimates and cash flow estimates are dependent on the pricing and cost parameters used in the report. Future variations in the pricing and cost parameters will cause variations in the reserve and cash flow estimates reported in the evaluation. The results are summarized below.
Ellora Energy, Inc. Proved Reserves and Economics As of June 30, 2007
| | Gross Oil MBBLS | Gross Gas MMCF | Net Oil MBBLS | Net Gas MMCF | BFIT Net Income M$, US | Disc Net Income M$, US @10% | ||||||
|---|---|---|---|---|---|---|---|---|---|---|---|---|
| Proved Developed Producing | 4,413.6 | 130,734.6 | 3,028.9 | 71,907.2 | 475,773.3 | 224,200.8 | ||||||
| Royalties (PDP) | 2,221.6 | 6,427.3 | 103.4 | 308.8 | 7,703.1 | 4,177.5 | ||||||
| Proved Undeveloped | 10,486.6 | 147,147.7 | 8,281.1 | 114,887.0 | 782,381.8 | 348,105.6 | ||||||
| Total Proved | 17,121.8 | 284,309.5 | 11,413.4 | 187,103.0 | 1,265,858.2 | 576,483.8 |
Numbers in the above table may not exactly match economic output due to rounding.
The future net revenue in this report was based on net hydrocarbon volume sold multiplied by the appropriate price. Expenses include severance and ad valorem taxes, and the normal cost of operating the wells. Future net cash flow is future net revenue minus expenses and any development costs. The future net cash flow has not been adjusted for outstanding loans, which may exist, nor does it include any adjustments for cash on hand or undistributed income. No attempt has been made to quantify or otherwise account for any accumulated gas production imbalances that may exist.
![]()
A-1
Reserve Estimates
Reserve estimates included in this study were assigned on the basis of the U. S. Securities and Exchange Commissions most current definitions included with this letter. These definitions are generally accepted as standard in the U.S. oil and gas industry and this report follows these guidelines.
The reserve estimates included in this study were estimated by performance methods, volumetric methods, simulation studies, and comparisons with analogous wells, where applicable. The reserves estimated by the performance method utilized extrapolations of historical production data. Reserves were estimated by analogy in cases where the historical production data was insufficient to establish a definitive trend.
Prices and Costs
Ellora provided the mid-year oil and gas prices using Henry Hub of $6.795/Mcf and West Texas Intermediate of $67.25/Bbl. Differentials were then applied for each state as follows:
| State | Oil Basis Differential $/Bbl | Platts P-Plus $/Bbl | Net* Oil Price $/Bbl | Gas Basis Differential $/Mcf | Premium $/Mcf | Net* Gas Price $/Mcf | ||||||
|---|---|---|---|---|---|---|---|---|---|---|---|---|
| Colorado | -3.25 | 0.00 | 64.00 | -1.18 | 5.615 | |||||||
| Kansas | -7.60 | 3.80 | 63.45 | -0.51 | 6.285 | |||||||
| Louisiana | 0.00 | 1.80 | 69.05 | -0.225 | -0.01 | 6.560 | ||||||
| Texas | -0.50 | 0.00 | 66.75 | -0.32 | -0.01 | 6.465 | ||||||
| Texas-Shelby | -0.50 | 0.00 | 66.75 | -0.14 | -0.29 | 6.365 |
- *
- Before transportation cost
The oil and gas price differentials were applied to each well to reflect differences in oil and gas quality, contractual agreements, and regional price variations.
Operating costs used in the report were provided by Ellora and are specific to each well. Operating costs were held constant for the life of the properties. MHA reviewed the operating costs and made changes where applicable.
Product transportation costs were also used for each state as follows:
| State | Oil Transportation $/Bbl | Gas Transportation $/Mcf | ||
|---|---|---|---|---|
| Colorado | 0.00 | 0.35 | ||
| Kansas | 0.00 | 0.55 | ||
| Louisiana | 2.25 | 0.38 | ||
| Texas | 1.20 | 0.29 | ||
| Texas-Shelby | 1.20 | 0.40 |
Development costs used in the report were provided by the current operator. MHA reviewed these development costs and recent AFEs to insure that they appeared reasonable. No deductions were made for estimated abandonment costs for the properties using the assumption that equipment salvage values would, at a minimum, be equal to abandonment costs. MHA has not performed a detailed study of the abandonment costs and salvage values of the leases. No deductions were made for indirect costs such as loan repayments, interest expenses, and exploration and development prepayments.
![]()
A-2
Report Format
This report contains a one line summary of all properties and a yearly summary output for each reserve category, by state.
All pertinent work notes, maps, logs, and other information are available in our office for review.
Statement of Risk
The accuracy of reserve and economic evaluations is always subject to uncertainty. The magnitude of this uncertainty is generally proportional to the quantity and quality of data available for analysis. As a well matures and new information becomes available, revisions may be required which may either increase or decrease the previous reserve assignments. Sometimes these revisions may result not only in a significant change to the reserves and value assigned to a property, but also may impact the total company reserve and economic status. The reserves and forecasts contained in this report were based upon a technical analysis of the available data using accepted engineering principles. However, they must be accepted with the understanding that further information and future reservoir performance subsequent to the date of the estimate may justify their revision. It is MHA's opinion that the estimated proven reserves and other reserve information as specified in this report are reasonable, and have been prepared in accordance with generally accepted petroleum engineering and evaluation principles. Notwithstanding the aforementioned opinion, MHA makes no warranties concerning the data and interpretations of such data. In no event shall MHA be liable for any special or consequential damages arising from Ellora's use of MHA's interpretation, reports, or services produced as a result of its work for Ellora.
Neither MHA, nor any of our employees have any interest in the subject properties and neither the employment to do this work, nor the compensation, is contingent on our estimates of reserves for the properties in this report.
This report was prepared for the exclusive use of Ellora and will not be released by MHA to any other parties without Ellora's written permission. The data and work papers used in the preparation of this report are available for examination by authorized parties in our offices.
It was a pleasure performing this work for Ellora. If you have any questions regarding this evaluation or if additional information is needed, please contact me at this office.
Sincerely, | ||
Leslie S. O'Connor Vice President |
![]()
A-3
You may rely on the information contained in this prospectus. We have not authorized anyone to provide information different from that contained in this prospectus. Neither the delivery of this prospectus nor sale of shares of common stock means that information contained in this prospectus is correct after the date of this prospectus. This prospectus is not an offer to sell or solicitation of an offer to buy shares of common stock in any circumstances under which the offer or solicitation is unlawful.
TABLE OF CONTENTS
| | PAGE | |
|---|---|---|
| Prospectus Summary | 1 | |
| Risk Factors | 11 | |
| Cautionary Statement Regarding Forward-Looking Statements | 22 | |
| Use of Proceeds | 23 | |
| Dividend Policy | 23 | |
| Capitalization | 24 | |
| Selected Combined Historical Financial Data | 25 | |
| Management's Discussion and Analysis of Financial Condition and Results of Operations | 28 | |
| Business | 41 | |
| Management | 54 | |
| Executive Compensation | 58 | |
| Security Ownership of Certain Beneficial Owners and Management | 73 | |
| Certain Relationships and Related Party Transactions | 74 | |
| Selling Stockholders | 76 | |
| Plan of Distribution | 85 | |
| Description of Capital Stock | 88 | |
| Shares Eligible For Future Sale | 92 | |
| Registration Rights | 94 | |
| Material United States Federal Income Tax Considerations for Non-United States Holders | 96 | |
| Legal Matters | 99 | |
| Experts | 99 | |
| Where You Can Find More Information | 99 | |
| Glossary of Selected Oil and Gas Terms | 100 | |
| Index to Financial Statements of Ellora Energy Inc. | F-1 | |
| Executive Summary Report of MHA Petroleum Consultants, Inc. | A-1 |
11,623,261 SHARES
![]()
COMMON STOCK
PROSPECTUS
, 2007
PART II
INFORMATION NOT REQUIRED IN THE PROSPECTUS
Item 13. Other Expenses of Issuance and Distribution
Set forth below are the expenses (other than underwriting discounts and commissions) expected to be incurred in connection with the issuance and distribution of the securities registered hereby. With the exception of the Securities and Exchange Commission registration fee and the NASD filing fee, the amounts set forth below are estimates.
| SEC registration fee | $ | 14,925 | ||
| Legal fees and expenses | 50,000 | |||
| Nasdaq Global Market listing fee | $ | 105,000 | ||
| Printing and engraving expenses | 50,000 | |||
| Engineering fees and expenses | 50,000 | |||
| Transfer agent's and registrar's fees | 50,000 | |||
| Accounting fees and expenses | 50,000 | |||
| Miscellaneous | 100,000 | |||
| Total | $ | 469,925 | ||
Item 14. Indemnification of Officers and Directors
Our certificate of incorporation provides that a director will not be liable to the corporation or its stockholders for monetary damages for breach of fiduciary duty as a director, except for liability (1) for any breach of the director's duty of loyalty to the corporation or its stockholders, (2) for acts or omissions not in good faith or which involved intentional misconduct or a knowing violation of the law, (3) under section 174 of the Delaware General Corporate Law ("DGCL") for unlawful payment of dividends or improper redemption of stock or (4) for any transaction from which the director derived an improper personal benefit. In addition, if the DGCL is amended to authorize the further elimination or limitation of the liability of directors, then the liability of a director of the corporation, in addition to the limitation on personal liability provided for in our charter, will be limited to the fullest extent permitted by the amended DGCL. Our bylaws provide that the corporation will indemnify, and advance expenses to, any officer or director to the fullest extent authorized by the DGCL.
Section 145 of the DGCL provides that a corporation may indemnify directors and officers as well as other employees and individuals against expenses, including attorneys' fees, judgments, fines and amounts paid in settlement in connection with specified actions, suits and proceedings whether civil, criminal, administrative, or investigative, other than a derivative action by or in the right of the corporation, if they acted in good faith and in a manner they reasonably believed to be in or not opposed to the best interests of the corporation and, with respect to any criminal action or proceeding, had no reasonable cause to believe their conduct was unlawful. A similar standard is applicable in the case of derivative actions, except that indemnification extends only to expenses, including attorneys' fees, incurred in connection with the defense or settlement of such action and the statute requires court approval before there can be any indemnification where the person seeking indemnification has been found liable to the corporation. The statute provides that it is not exclusive of other indemnification that may be granted by a corporation's charter, bylaws, disinterested director vote, stockholder vote, agreement, or otherwise.
Our charter also contains indemnification rights for our directors and our officers. Specifically, the charter provides that we shall indemnify our officers and directors to the fullest extent authorized by the DGCL. Further, we may maintain insurance on behalf of our officers and directors against expense, liability or loss asserted incurred by them in their capacities as officers and directors.
II-1
We have obtained directors' and officers' insurance to cover our directors, officers and some of our employees for certain liabilities.
We will enter into written indemnification agreements with our directors and executive officers. Under these proposed agreements, if an officer or director makes a claim of indemnification to us, either a majority of the independent directors or independent legal counsel selected by the independent directors must review the relevant facts and make a determination whether the officer or director has met the standards of conduct under Delaware law that would permit (under Delaware law) and require (under the indemnification agreement) us to indemnify the officer or director.
The registration rights agreement and purchase agreement we entered into in connection with our earlier financings provide for the indemnification by the investors in those financings of our officers and directors for certain liabilities.
Item 15. Recent Sales of Unregistered Securities
During the last three years, we have sold the following unregistered shares of common stock:
1. On April 12, 2004, we sold 3,075,219 shares of common stock to Yorktown Energy Partners V, L.P. and 161,853 shares of common stock to Sheldon Lubar for aggregate purchase price of $8 million. Also on April 12, 2004, we sold 341,576 shares of our common stock to T. Scott Martin, Richard F. McClure, Valerie K. Walker, John W. Minnett, Gregory Faith (former V.P.) and an employee for an aggregate purchase price consisting of (i) a full recourse promissory notes issued by the purchasers in the total principal amount of $844,118 and (ii) $42.00 in cash. No underwriters were used in the foregoing issuances of securities. We relied upon the exemption under Section 4(2) of the Securities Act in connection with the offer and sale of those shares, as all of the purchasers were affiliates or employees of Ellora and the shares were not sold in a public offering.
2. On July 8, 2005, we sold 364,171 shares of common stock to James R. Casperson, Vice President of Finance and Chief Financial Officer, for a purchase price consisting of (i) a full recourse promissory note issued by the purchaser in the principal amount of $899,955 and (ii) $45.00 in cash. No underwriters were used in the foregoing issuances of securities. We relied upon the exemption under Section 4(2) of the Securities Act in connection with the offer and sale of those shares, as Mr. Casperson was an executive officer at the time of purchase and this transaction was not a public offering.
3. On July 12, 2006 we completed a private placement of 12,400,000 shares of common stock, 2,500,000 shares of which were issued and sold by us and 9,900,000 shares of which were sold by certain of our stockholders. All of the shares sold by the selling stockholders were offered and sold to qualified institutional buyers pursuant to Rule 144A under the Securities Act and non-U.S. persons under Regulation S of the Securities Act. The shares issued by us were offered and sold to qualified institutional buyers pursuant to Rule 144A under the Securities Act and non-U.S. persons under Regulation S of the Securities Act and to accredited investors pursuant to Section 4(2) of the Securities Act. Friedman, Billings & Ramsey Co, Inc. ("FBR") acted as the initial purchaser of all of the shares issued pursuant to Rule 144A and Regulation S and as placement agent for all of the shares issued pursuant to Section 4(2) of the Securities Act. We sold the shares issued pursuant to Rule 144A and Regulation S to FBR at a price of $11.16 per share, which was an $0.84 per share discount to the gross offering price to the investors of $12.00 per share. Aggregate net proceeds to us for the total offering, after deducting discounts of $2,100,000, was $27,900,000. We did not receive any proceeds from the shares sold by the selling stockholders. All net proceeds of the above offering that we received were used for paying down our existing debt and for general corporate purposes.
4. Additionally from April 1, 2002 (inception) through October 31, 2006, we have granted to our employees, including executive officers, and others providing services to us options to purchase
II-2
2,996,074 shares of our common stock at exercise prices ranging from $1.24 per share to $4.95 per share. During that same period an executive officer, exercised options to purchase an aggregate of 248,713 shares of our common stock. All such issuances were made in reliance on Rule 701 as promulgated under the Securities Act relating to issuances of securities under compensatory plans.
Item 16. Exhibits and Financial Statement Schedules
- (a)
- Exhibits.
The following exhibits are filed herewith pursuant to the requirements of Item 601 of Regulation S-K:
| Exhibit No. | Description | |
|---|---|---|
| 3.1** | Amended and Restated Certificate of Incorporation of Ellora Energy Inc. (incorporated by reference to Exhibit 3.1 to the Company's Registration Statement on Form S-1 (No. 333-138442) filed on November 3, 2006). | |
| 3.2** | Bylaws of Ellora Energy Inc. dated as of May 17, 2002 (incorporated by reference to Exhibit 3.2 to the Company's Registration Statement on Form S-1 (No. 333-138442) filed on November 3, 2006). | |
| 3.3** | Amendment to the Bylaws of Ellora Energy Inc. dated as of August 27, 2002 (incorporated by reference to Exhibit 3.3 to the Company's Registration Statement on Form S-1 (No. 333-138442) filed on November 3, 2006). | |
| 3.4** | Amendment No. 2 to the Bylaws of Ellora Energy Inc. dated as of September 11, 2006 (incorporated by reference to Exhibit 3.4 to the Company's Registration Statement on Form S-1 (No. 333-138442) filed on November 3, 2006). | |
| 4.1** | Registration Rights Agreement between Ellora Energy Inc. and Friedman, Billings, Ramsey & Co., Inc., dated as of July 12, 2006 (incorporated by reference to Exhibit 4.1 to the Company's Registration Statement on Form S-1 (No. 333-138442) filed on November 3, 2006). | |
| 4.2** | Registration Rights Agreement among Ellora Energy Inc., Yorktown Energy Partners V, L.P., Yorktown Energy Partners VI, L.P., and the participating stockholders who have executed the signature pages thereto or are listed on Schedule I thereto, dated as of July 12, 2006 (incorporated by reference to Exhibit 3.1 to the Company's Registration Statement on Form S-1 (No. 333-138442) filed on November 3, 2006). | |
| 4.3** | Specimen of Ellora Energy Inc. Common Stock Certificate. | |
| 5.1* | Opinion of Thompson & Knight LLP. | |
| 10.1** | Ellora Energy Inc. Amended and Restated 2006 Stock Incentive Plan dated July 11, 2006 (incorporated by reference to Exhibit 10.1 to the Company's Registration Statement on Form S-1 (No. 333-138442) filed on November 3, 2006). | |
| 10.2** | Employment Agreement dated as of July 12, 2006 between Ellora Energy Inc. and T. Scott Martin (incorporated by reference to Exhibit 10.2 to the Company's Registration Statement on Form S-1 (No. 333-138442) filed on November 3, 2006). | |
| 10.3** | Farmout Contract dated as of November 14, 1997 between Amoco Production Company and Ellora Energy Inc. (as successor in interest to Presco, Inc.) (incorporated by reference to Exhibit 10.3 to the Company's Registration Statement on Form S-1 (No. 333-138442) filed on November 3, 2006). | |
| 10.4** | Credit Agreement dated as of February 3, 2006 among Ellora Energy Inc., Ellora Oil & Gas Inc., JPMorgan Chase Bank, N.A. and the Lenders party thereto (incorporated by reference to Exhibit 10.4 to the Company's Registration Statement on Form S-1 (No. 333-138442) filed on November 3, 2006). | |
| 10.5** | Joint Venture Agreement dated June 1, 2004 by and between Centurion Exploration Company, Centurion Exploration Company, LLC, and Ellora Energy Inc. (incorporated by reference to Exhibit 10.5 to the Company's Amendment No. 1 to Registration Statement on Form S-1 (No. 333-138442) filed on December 26, 2006). | |
II-3
| 10.6** | Confirmation Letter for Contract for Sale and Purchase of Natural Gas dated November 29, 2006 between Louis Dreyfus Energy Services LP and Ellora Operating, LP (incorporated by reference to Exhibit 10.6 to the Company's Amendment No. 1 to Registration Statement on Form S-1 (No. 333-138442) filed on December 26, 2006). | |
| 10.7** | Confirmation Letter for Contract for Sale and Purchase of Natural Gas dated November 30, 2006 between Louis Dreyfus Energy Services LP and Ellora Operating, LP (incorporated by reference to Exhibit 10.7 to the Company's Amendment No. 1 to Registration Statement on Form S-1 (No. 333-138442) filed on December 26, 2006). | |
| 10.8** | Crude Oil Purchase Contract dated June 1, 2002 between Presco Western, LLC and Plains Marketing, L.P. (incorporated by reference to Exhibit 10.8 to the Company's Amendment No. 1 to Registration Statement on Form S-1 (No. 333-138442) filed on December 26, 2006). | |
| 10.9** | Crude Oil Purchase Contract dated May 5, 2005 between Ellora Operating, L.P. and Plains Marketing, L.P. (incorporated by reference to Exhibit 10.9 to the Company's Amendment No. 1 to Registration Statement on Form S-1 (No. 333-138442) filed on December 26, 2006). | |
| 10.10** | Amendment to Crude Oil Purchase Contract (June 1, 2002) dated October 4, 2006 between Presco Western, LLC. and Plains Marketing, L.P. (incorporated by reference to Exhibit 10.10 to the Company's Amendment No. 1 to Registration Statement on Form S-1 (No. 333-138442) filed on December 26, 2006). | |
| 21.1** | List of Subsidiaries of Ellora Energy Inc. | |
| 23.1* | Consent of Hein & Associates LLP. | |
| 23.2* | Consent of MHA Petroleum Consultants, Inc. | |
| 23.3* | Consent of Thompson & Knight LLP (included in Exhibit 5.1). | |
| 24** | Power of Attorney |
- *
- Filed herewith
- **
- Previously filed
- (b)
- Financial Statements Schedules
All schedules have been omitted because they are not required, are not applicable, or the information is included in the Financial Statements or Notes thereto.
Item 17. Undertakings
The undersigned registrant hereby undertakes:
- (a)
- To file, during any period in which offers or sales are being made, a post-effective amendment to this registration statement:
- (i)
- To include any prospectus required by Section 10(a)(3) of the Securities Act of 1933, as amended;
- (ii)
- To reflect in the prospectus any facts or events arising after the effective date of the registration statement (or the most recent post-effective amendment thereof) which, individually or in the aggregate, represent a fundamental change in the information set forth in the registration statement; and
- (iii)
- To include any material information with respect to the plan of distribution not previously disclosed in the registration statement or any material change to such information in the registration statement;
- provided, however, that paragraphs (a)(i), (ii) and (iii) above do not apply if the information required to be included in a post-effective amendment by those paragraphs is contained in
II-4
- (b)
- That, for the purpose of determining any liability under the Securities Act of 1933, as amended, each such post-effective amendment that contains a form of prospectus shall be deemed to be a new registration statement relating to the securities offered therein, and the offering of such securities at that time shall be deemed to be the initial bona fide offering thereof.
- (c)
- To remove from registration by means of a post-effective amendment any of the securities being registered which remain unsold at the termination of the offering.
- (d)
- That, for the purpose of determining liability under the Securities Act of 1933 to any purchaser:
- (i)
- If the registrant is relying on Rule 430B:
- (A)
- Each prospectus filed by the registrant pursuant to Rule 424(b)(3) shall be deemed to be part of the registration statement as of the date the filed prospectus was deemed part of and included in the registration statement; and
- (B)
- Each prospectus required to be filed pursuant to Rule 424(b)(2), (b)(5), or (b)(7) as part of a registration statement in reliance on Rule 430B relating to an offering made pursuant to Rule 415(a)(1)(i), (vii), or (x) for the purpose of providing the information required by section 10(a) of the Securities Act of 1933 shall be deemed to be part of and included in the registration statement as of the earlier of the date such form of prospectus is first used after effectiveness or the date of the first contract of sale of securities in the offering described in the prospectus. As provided in Rule 430B, for liability purposes of the issuer and any person that is at that date an underwriter, such date shall be deemed to be a new effective date of the registration statement relating to the securities in the registration statement to which that prospectus relates, and the offering of such securities at that time shall be deemed to be the initial bona fide offering thereof. Provided, however, that no statement made in a registration statement or prospectus that is part of the registration statement or made in a document incorporated or deemed incorporated by reference into the registration statement or prospectus that is part of the registration statement will, as to a purchaser with a time of contract of sale prior to such effective date, supersede or modify any statement that was made in the registration statement or prospectus that was part of the registration statement or made in any such document immediately prior to such effective date; or
- (ii)
- If the registrant is subject to Rule 430C, each prospectus filed pursuant to Rule 424(b) as part of a registration statement relating to an offering, other than registration statements relying on Rule 430B or other than prospectuses filed in reliance on Rule 430A, shall be deemed to be part of and included in the registration statement as of the date it is first used after effectiveness. Provided, however, that no statement made in a registration statement or prospectus that is part of the registration statement or made in a document incorporated or deemed incorporated by reference into the registration statement or prospectus that is part of the registration statement will, as to a purchaser with a time of contract of sale prior to such first use, supersede or modify any statement that was made in the registration statement or prospectus that was part of the registration statement or made in any such document immediately prior to such date of first use.
reports filed with or furnished to the Commission by the registrant pursuant to Section 13 or Section 15(d) of the Securities Exchange Act of 1934 that are incorporated by reference in the Registration Statement, or is contained in a form of prospectus filed pursuant to Rule 424(b) that is part of this registration statement.
II-5
- (e)
- That, for the purpose of determining liability of the registrant under the Securities Act of 1933 to any purchaser in the initial distribution of the securities: The undersigned registrant undertakes that in a primary offering of securities of the undersigned registrant pursuant to this registration statement, regardless of the underwriting method used to sell the securities to the purchaser, if the securities are offered or sold to such purchaser by means of any of the following communications, the undersigned registrant will be a seller to the purchaser and will be considered to offer or sell such securities to such purchaser:
- (i)
- Any preliminary prospectus or prospectus of the undersigned registrant relating to the offering required to be filed pursuant to Rule 424;
- (ii)
- Any free writing prospectus relating to the offering prepared by or on behalf of the undersigned registrant or used or referred to by the undersigned registrant;
- (iii)
- The portion of any other free writing prospectus relating to the offering containing material information about the undersigned registrant or its securities provided by or on behalf of the undersigned registrant; and
- (iv)
- Any other communication that is an offer in the offering made by the undersigned registrant to the purchaser.
- (f)
- Insofar as indemnification for liabilities arising under the Securities Act of 1933 may be permitted to directors, officers, and controlling persons of the registrant pursuant to the provisions, or otherwise, the registrant has been advised that in the opinion of the Securities and Exchange Commission such indemnification is against public policy as expressed in the Act and is, therefore, unenforceable. In the event that a claim for indemnification against such liabilities (other than the payment by the registrant of expenses incurred or paid by a director, officer, or controlling person of the registrant in the successful defense of any action, suit or proceeding) is asserted by such director, officer, or controlling person in connection with the securities being registered, the registrant will, unless in the opinion of its counsel the matter has been settled by controlling precedent, submit to a court of appropriate jurisdiction the question whether such indemnification by it is against public policy as expressed in the Act and will be governed by the final adjudication of such issue.
II-6
Pursuant to the requirements of the Securities Act of 1933, the Registrant has duly caused this Amendment No. 3 to the Registration Statement to be signed on its behalf by the undersigned, thereunto duly authorized, in the City of Boulder, State of Colorado, on August 13, 2007.
| ELLORA ENERGY INC. | |||
By: | /s/ T. SCOTT MARTIN | ||
| Name: | T. Scott Martin | ||
| Title: | President and Chief Executive Officer | ||
Pursuant to the requirements of the Securities Act of 1933, this Amendment No. 3 to the Registration Statement has been signed by the following persons in the capacities indicated below on August 13, 2007.
| Signature | Capacity | |
|---|---|---|
| /s/ T. SCOTT MARTIN T. Scott Martin | Chairman of the Board President and Chief Executive Officer (Principal Executive Officer) | |
/s/ JAMES R. CASPERSON James R. Casperson | Vice President of Finance and Chief Financial Officer (Principal Financial and Accounting Officer) | |
* Cortlandt S. Dietler | Director | |
* Bryan H. Lawrence | Director | |
* Peter A. Leidel | Director | |
* Sheldon B. Lubar | Director | |
* Neil L. Stenbuck | Director | |
* James B. Wallace | Director | |
* George A. Wiegers | Director | |
* /s/ JAMES R. CASPERSON | ||
| Attorney-In-Fact |
II-7
| Exhibit No. | Description | |
|---|---|---|
| 3.1** | Amended and Restated Certificate of Incorporation of Ellora Energy Inc. (incorporated by reference to Exhibit 3.1 to the Company's Registration Statement on Form S-1 (No. 333-138442) filed on November 3, 2006). | |
| 3.2** | Bylaws of Ellora Energy Inc. dated as of May 17, 2002 (incorporated by reference to Exhibit 3.2 to the Company's Registration Statement on Form S-1 (No. 333-138442) filed on November 3, 2006). | |
| 3.3** | Amendment to the Bylaws of Ellora Energy Inc. dated as of August 27, 2002 (incorporated by reference to Exhibit 3.3 to the Company's Registration Statement on Form S-1 (No. 333-138442) filed on November 3, 2006). | |
| 3.4** | Amendment No. 2 to the Bylaws of Ellora Energy Inc. dated as of September 11, 2006 (incorporated by reference to Exhibit 3.4 to the Company's Registration Statement on Form S-1 (No. 333-138442) filed on November 3, 2006). | |
| 4.1** | Registration Rights Agreement between Ellora Energy Inc. and Friedman, Billings, Ramsey & Co., Inc., dated as of July 12, 2006 (incorporated by reference to Exhibit 4.1 to the Company's Registration Statement on Form S-1 (No. 333-138442) filed on November 3, 2006). | |
| 4.2** | Registration Rights Agreement among Ellora Energy Inc., Yorktown Energy Partners V, L.P., Yorktown Energy Partners VI, L.P., and the participating stockholders who have executed the signature pages thereto or are listed on Schedule I thereto, dated as of July 12, 2006 (incorporated by reference to Exhibit 3.1 to the Company's Registration Statement on Form S-1 (No. 333-138442) filed on November 3, 2006). | |
| 4.3** | Specimen of Ellora Energy Inc. Common Stock Certificate. | |
| 5.1* | Opinion of Thompson & Knight LLP. | |
| 10.1** | Ellora Energy Inc. Amended and Restated 2006 Stock Incentive Plan dated July 11, 2006 (incorporated by reference to Exhibit 10.1 to the Company's Registration Statement on Form S-1 (No. 333-138442) filed on November 3, 2006). | |
| 10.2** | Employment Agreement dated as of July 12, 2006 between Ellora Energy Inc. and T. Scott Martin (incorporated by reference to Exhibit 10.2 to the Company's Registration Statement on Form S-1 (No. 333-138442) filed on November 3, 2006). | |
| 10.3** | Farmout Contract dated as of November 14, 1997 between Amoco Production Company and Ellora Energy Inc. (as successor in interest to Presco, Inc.) (incorporated by reference to Exhibit 10.3 to the Company's Registration Statement on Form S-1 (No. 333-138442) filed on November 3, 2006). | |
| 10.4** | Credit Agreement dated as of February 3, 2006 among Ellora Energy Inc., Ellora Oil & Gas Inc., JPMorgan Chase Bank, N.A. and the Lenders party thereto (incorporated by reference to Exhibit 10.4 to the Company's Registration Statement on Form S-1 (No. 333-138442) filed on November 3, 2006). | |
| 10.5** | Joint Venture Agreement dated June 1, 2004 by and between Centurion Exploration Company, Centurion Exploration Company, LLC, and Ellora Energy Inc. (incorporated by reference to Exhibit 10.5 to the Company's Amendment No. 1 to Registration Statement on Form S-1 (No. 333-138442) filed on December 26, 2006). | |
| 10.6** | Confirmation Letter for Contract for Sale and Purchase of Natural Gas dated November 29, 2006 between Louis Dreyfus Energy Services LP and Ellora Operating, LP (incorporated by reference to Exhibit 10.6 to the Company's Amendment No. 1 to Registration Statement on Form S-1 (No. 333-138442) filed on December 26, 2006). | |
| 10.7** | Confirmation Letter for Contract for Sale and Purchase of Natural Gas dated November 30, 2006 between Louis Dreyfus Energy Services LP and Ellora Operating, LP (incorporated by reference to Exhibit 10.7 to the Company's Amendment No. 1 to Registration Statement on Form S-1 (No. 333-138442) filed on December 26, 2006). | |
II-8
| 10.8** | Crude Oil Purchase Contract dated June 1, 2002 between Presco Western, LLC and Plains Marketing, L.P. (incorporated by reference to Exhibit 10.8 to the Company's Amendment No. 1 to Registration Statement on Form S-1 (No. 333-138442) filed on December 26, 2006). | |
| 10.9** | Crude Oil Purchase Contract dated May 5, 2005 between Ellora Operating, L.P. and Plains Marketing, L.P. (incorporated by reference to Exhibit 10.9 to the Company's Amendment No. 1 to Registration Statement on Form S-1 (No. 333-138442) filed on December 26, 2006). | |
| 10.10** | Amendment to Crude Oil Purchase Contract (June 1, 2002) dated October 4, 2006 between Presco Western, LLC. and Plains Marketing, L.P. (incorporated by reference to Exhibit 10.10 to the Company's Amendment No. 1 to Registration Statement on Form S-1 (No. 333-138442) filed on December 26, 2006). | |
| 21.1** | List of Subsidiaries of Ellora Energy Inc. | |
| 23.1* | Consent of Hein & Associates LLP. | |
| 23.2* | Consent of MHA Petroleum Consultants, Inc. | |
| 23.3* | Consent of Thompson & Knight LLP (included in Exhibit 5.1). | |
| 24** | Power of Attorney |
- *
- Filed herewith
- **
- Previously filed
II-9