Filed Pursuant to Rule 424(b)(3)
Registration Nos. 333-163552
333-163552-01
333-163552-02
333-163552-03
333-163552-04
333-163552-05
POWERSHARES DB US DOLLAR INDEX TRUST
POWERSHARES DB US DOLLAR INDEX BULLISH FUND
POWERSHARES DB US DOLLAR INDEX BEARISH FUND
DB US DOLLAR INDEX MASTER TRUST
DB US DOLLAR INDEX BULLISH MASTER FUND
DB US DOLLAR INDEX BEARISH MASTER FUND
SUPPLEMENT DATED OCTOBER 1, 2010 TO
PROSPECTUS DATED JANUARY 4, 2010
This Supplement updates certain information contained in the Prospectus dated January 4, 2010, as supplemented from time-to-time (the “Prospectus”), of PowerShares DB US Dollar Index Trust (the “Trust”), PowerShares DB US Dollar Index Bullish Fund and PowerShares DB US Dollar Index Bearish Fund (collectively, the “Funds”), DB US Dollar Index Master Trust, DB US Dollar Index Bullish Master Fund and DB US Dollar Index Bearish Master Fund. All capitalized terms used in this Supplement have the same meaning as in the Prospectus.
Prospective investors in the Fund should review carefully the contents of both this Supplement and the Prospectus.
* * * * * * * * * * * * * * * * * * *
All information in the Prospectus is restated pursuant to this Supplement, except as updated hereby.
Neither the Securities and Exchange Commission nor any state securities commission
has approved or disapproved of these securities or determined if this Prospectus is
truthful or complete. Any representation to the contrary is a criminal offense.
THE COMMODITY FUTURES TRADING COMMISSION HAS NOT PASSED UPON THE MERITS OF PARTICIPATING IN THIS POOL NOR HAS THE COMMISSION PASSED UPON THE ADEQUACY OR ACCURACY OF THIS DISCLOSURE DOCUMENT.
DB COMMODITY SERVICES LLC
Managing Owner
-1-
| I. | Risk Factor (14) on page 23 of the Prospectus is hereby deleted and replaced, in its entirety, with the following: |
“(14) Price Volatility May Possibly Cause the Total Loss of Your Investment.
Futures contracts have a high degree of price variability and are subject to occasional rapid and substantial changes. Consequently, you could lose all or substantially all of your investment in a Fund.
The following table* reflects various measures of volatility** of the Long Index and the Short Index, each as calculated on an excess return basis:
Volatility Type | Volatility | |||||
| Long Index | Short Index | |||||
Daily volatility over full history | 8.95 | % | 8.88 | % | ||
Average rolling 3 month daily volatility | 8.64 | % | 8.54 | % | ||
Monthly return volatility | 8.88 | % | 8.78 | % | ||
Average annual volatility | 8.80 | % | 8.70 | % | ||
The following table reflects the daily volatility on an annual basis of the Long Index and the Short Index:
Year | Daily Volatility | |||||
| Long Index | Short Index | |||||
1986*** | 0.00 | % | 0.00 | % | ||
1987 | 9.44 | % | 9.07 | % | ||
1988 | 9.62 | % | 9.69 | % | ||
1989 | 10.22 | % | 10.20 | % | ||
1990 | 8.77 | % | 8.35 | % | ||
1991 | 11.53 | % | 11.89 | % | ||
1992 | 11.70 | % | 12.06 | % | ||
1993 | 9.44 | % | 9.54 | % | ||
1994 | 7.83 | % | 7.52 | % | ||
1995 | 9.78 | % | 9.55 | % | ||
1996 | 4.99 | % | 5.01 | % | ||
1997 | 7.59 | % | 7.91 | % | ||
1998 | 8.06 | % | 7.94 | % | ||
1999 | 7.59 | % | 7.71 | % | ||
2000 | 8.77 | % | 9.17 | % | ||
2001 | 8.70 | % | 8.56 | % | ||
2002 | 7.49 | % | 7.19 | % | ||
2003 | 8.44 | % | 8.25 | % | ||
2004 | 9.52 | % | 9.23 | % | ||
2005 | 8.10 | % | 8.46 | % | ||
2006 | 6.95 | % | 6.75 | % | ||
2007 | 5.21 | % | 5.08 | % | ||
2008 | 11.94 | % | 12.46 | % | ||
2009 | 11.09 | % | 9.55 | % | ||
2010* | 8.32 | % | 7.54 | % | ||
| * | As of June 30, 2010. Past Index levels are not necessarily indicative of future changes, positive or negative, in the Index levels. |
| ** | Volatility, for these purposes means the following: |
| Daily Volatility: The relative rate at which the price of the Index moves up and down, found by calculating the annualized standard deviation of the daily change in price. |
| Monthly Return Volatility: The relative rate at which the price of the Index moves up and down, found by calculating the annualized standard deviation of the monthly change in price. |
| Average Annual Volatility: The average of yearly volatilities for a given sample period. The yearly volatility is the relative rate at which the price of the Index moves up and down, found by calculating the annualized standard deviation of the daily change in price for each business day in the given year. |
| *** | As of December 31, 1986.” |
-2-
| II. | Pages 33 through 62 of the Prospectus are hereby deleted and replaced, in their entirety, with the following: |
“PERFORMANCE OF POWERSHARES DB US DOLLAR INDEX BULLISH FUND (TICKER: UUP), A SERIES OF POWERSHARES DB US DOLLAR INDEX TRUST
Name of Pool:PowerShares DB US Dollar Index Bullish Fund
Type of Pool:Public, Exchange-Listed Commodity Pool
Inception of Trading:February 2007
Aggregate Gross Capital Subscriptions as of June 30, 2010:$5,214,212,285
Net Asset Value as of June 30, 2010:$1,181,548,543
Net Asset Value per Share as of June 30, 2010:$25.03
Worst Monthly Drawdown:(6.89)% December 2008
Worst Peak-to-Valley Drawdown:(16.38)% November 2008 – November 2009*
| Monthly Rate of Return | 2010(%) | 2009(%) | 2008(%) | 2007(%) | ||||
January | 1.69 | 5.02 | (1.47) | — | ||||
February | 0.90 | 1.89 | (1.84) | (0.32) | ||||
March | 0.65 | (3.06) | (2.48) | (0.32) | ||||
April | 0.78 | (1.29) | 0.80 | (1.29) | ||||
May | 5.38 | (6.16) | 0.31 | 1.55 | ||||
June | (0.91) | 0.63 | (0.62) | 0.00 | ||||
July | (2.43) | 0.93 | (0.92) | |||||
August | (0.30) | 5.42 | 0.57 | |||||
September | (2.06) | 1.88 | (3.31) | |||||
October | (0.53) | 8.49 | (1.17) | |||||
November | (1.99) | 0.38 | 0.04 | |||||
December | 3.74 | (6.89)** | 0.04*** | |||||
Compound Rate of Return | 8.68% (6 months) | (6.84)% | 4.17% | (5.08)% (10 1/4 months) |
| * | The Worst Peak-to-Valley Drawdown from November 2008 – November 2009 includes the effect of the $0.17 per Share distribution made to Shareholders of record as of December 17, 2008. Please see Footnote **. |
| ** | The December 2008 return of (6.89)% includes the $0.17 per Share distribution made to Shareholders of record as of December 17, 2008. Prior to the December 30, 2008 distribution, the pool’s return for December 2008 was (6.25)%. |
| *** | The December 2007 return of 0.04% includes the $0.20 per Share distribution made to Shareholders of record as of December 19, 2007. Prior to the December 28, 2007 distribution, the pool’s return for December 2007 was 0.76%. |
PAST PERFORMANCE IS NOT NECESSARILY INDICATIVE OF FUTURE RESULTS.
PERFORMANCE OF POWERSHARES DB US DOLLAR INDEX BEARISH FUND (TICKER: UDN), A SERIES OF
POWERSHARES DB US DOLLAR INDEX TRUST
Name of Pool:PowerShares DB US Dollar Index Bearish Fund
Type of Pool:Public, Exchange-Listed Commodity Pool
Inception of Trading:February 2007
Aggregate Gross Capital Subscriptions as of June 30, 2010:$770,923,112
Net Asset Value as of June 30, 2010:$159,140,194
Net Asset Value per Share as of June 30, 2010:$24.87
Worst Monthly Drawdown:(8.37)% October 2008
Worst Peak-to-Valley Drawdown:(17.03)% March 2008 – February 2009*
| Monthly Rate of Return | 2010(%) | 2009(%) | 2008(%) | 2007(%) | ||||
January | (1.94) | (4.70) | 2.14 | — | ||||
February | (1.15) | (1.92) | 4.28 | 0.64 | ||||
March | (0.76) | 3.03 | 2.65 | 0.99 | ||||
April | (0.93) | 1.19 | (0.68) | 2.01 | ||||
May | (5.87) | 5.61 | (0.27) | (0.73) | ||||
June | 0.53 | (0.63) | 0.82 | 0.74 | ||||
July | 2.35 | (0.71) | 1.54 | |||||
August | 0.22 | (5.30) | 0.38 | |||||
September | 1.93 | (1.99) | 3.82 | |||||
October | 0.43 | (8.37) | 1.68 | |||||
November | 1.92 | (0.48) | 0.68 | |||||
December | (3.72) | 5.78** | (1.92)*** | |||||
Compound Rate of Return | (9.81)% (6 months) | 5.37% | (2.94)% | 10.16% (10 1/4 months) |
| * | The Worst Peak-to-Valley Drawdown from March 2008 - February 2009 includes the effect of the $0.15 per Share distribution made to Shareholders of record as of December 17, 2008. Please see Footnote **. |
| ** | The December 2008 return of 5.78% includes the $0.15 per Share distribution made to Shareholders of record as of December 17, 2008. Prior to the December 30, 2008 distribution, the pool’s return for December 2008 was 6.39%. |
| *** | The December 2007 return of (1.92)% includes the $0.40 per Share distribution made to Shareholders of record as of December 19, 2007. Prior to the December 28, 2007 distribution, the pool’s return for December 2007 was 0.39%. |
PAST PERFORMANCE IS NOT NECESSARILY INDICATIVE OF FUTURE RESULTS.
See accompanying Footnotes to Performance Information on page 34.
-3-
Footnotes to Performance Information
1. “Aggregate Gross Capital Subscriptions” is the aggregate of all amounts ever contributed to the relevant pool, including investors who subsequently redeemed their investments.
2. “Net Asset Value” is the net asset value of each pool as of June 30, 2010.
3. “Net Asset Value per Share” is the Net Asset Value of the relevant pool divided by the total number of Shares outstanding with respect to such pool as of June 30, 2010.
4. “Worst Monthly Drawdown” is the largest single month loss sustained since inception of trading. “Drawdown” as used in this section of the prospectus means losses experienced by the relevant pool over the specified period and is calculated on a rate of return basis, i.e., dividing net performance by beginning equity. “Drawdown” is measured on the basis of monthly returns only, and does not reflect intra-month figures. “Month” is the month of the Worst Monthly Drawdown.
5. “Worst Peak-to-Valley Drawdown” is the largest percentage decline in the Net Asset Value per Share over the history of the relevant pool. This need not be a continuous decline, but can be a series of positive and negative returns where the negative returns are larger than the positive returns. “Worst Peak-to-Valley Drawdown” represents the greatest percentage decline from any month-end Net Asset Value per Share that occurs without such month-end Net Asset Value per Share being equaled or exceeded as of a subsequent month-end. For example, if the Net Asset Value per Share of a particular pool declined by $1 in each of January and February, increased by $1 in March and declined again by $2 in April, a “peak-to-valley drawdown” analysis conducted as of the end of April would consider that “drawdown” to be still continuing and to be $3 in amount, whereas if the Net Asset Value per Share had increased by $2 in March, the January-February drawdown would have ended as of the end of February at the $2 level.
6. “Compound Rate of Return” is calculated by multiplying on a compound basis each of the monthly rates of return set forth in the respective charts above and not by adding or averaging such monthly rates of return. For periods of less than one year, the results are year-to-date.
[Remainder of page left blank intentionally.]
-4-
DESCRIPTION OF THE DEUTSCHE BANK LONG US DOLLAR INDEX (USDX®) FUTURES INDEX – EXCESS RETURNTM AND DEUTSCHE BANK SHORT US DOLLAR INDEX (USDX®) FUTURES INDEX – EXCESS RETURNTM
The Index Sponsor does not approve, endorse or recommend the Funds, the Master Funds or the Managing Owner. The USDX® mark is a registered service mark owned by ICE Futures U.S., Inc.
General
The Deutsche Bank Long US Dollar Index (USDX®) Futures Index – Excess ReturnTM, or Long Index, and the Deutsche Bank Short US Dollar Index (USDX®) Futures Index – Excess ReturnTM, or Short Index, are designed to reflect the changes in market value over time, whether positive or negative, from investing in long or short positions, respectively, in the first to expire futures contracts, or DX Contracts, whose changes in market value over time, whether positive or negative, in turn, are tied to the USDX®. The first to expire DX Contracts are the futures contracts that expire in March, June, September and December. DX Contracts are traded exclusively through ICE Futures U.S., under the symbol “DX.” As described further in “Index Calculation” below, the Indexes are calculated as either the Long Index or as the Short Index.
The changes in market value over time, whether positive or negative, of DX Contracts are related to the six underlying currencies of the USDX®, or the Index Currencies. (Although each Index tracks the changes in market value over time, whether positive or negative, of long or short positions in the first to expire DX Contracts, the closing levels of each Index is in effect, and in part, a reflection of the changes, whether positive or negative, in the level of the U.S. dollar relative to a basket of the underlying Index Currencies.) The Index Currencies are Euro, Japanese Yen, British Pound, Canadian Dollar, Swedish Krona and Swiss Franc. The Index Currencies represent the currencies of the major trading partners of the U.S. (and represent the currencies of 17 countries, 12 countries of the Euro zone plus five other countries).
The USDX® is composed of notional amounts of each Index Currency. The notional amounts of the Index Currencies included in the USDX® reflect a geometric weighted average of the change in the Index Currencies’ exchange rates against the U.S. dollar relative to March 1973. March 1973 was chosen as a base period of the USDX® because it represents a significant milestone in foreign exchange history when the world’s major trading nations allowed their currencies to float freely against each other.
The fair value of DX Contracts is based on foreign exchange futures prices for the underlying Index Currencies. The fair value of DX Contracts is calculated in the same way as a spot index. DX Contracts, similar to single currency futures contracts, will trade at a forward premium or discount based on the interest rate differential between the U.S. dollar and the Index Currencies.
Volatility of the USDX® has been historically comparable in range and variability to a broad-based, multi-capitalization stock index future. The DX Contract price is sized at $1000 times the USDX® closing level. Thus, if the USDX® closing level is 100.00, the DX Contract will be valued $100,000. If the USDX® closing level is 112.50, each DX Contract will have a $112,500 value.
The sponsor of the Long Index and the Short Index is Deutsche Bank AG London, or the Index Sponsor.
USDX® Composition
Each Index reflects the changes in market value over time, whether positive or negative, of a long or short position in, as applicable, of the first to expire DX Contracts. In turn, the changes in market value over time, whether positive or negative, of DX Contracts are related to the changes, positive and negative, in the level of the USDX®.
The USDX® provides a general indication of the international value of the U.S. dollar and is composed of notional amounts of each of the Index Currencies. The notional amounts of each Index Currency included in the USDX® are weighted to reflect the currencies of the largest trading partners of the U.S. These largest trading partners constitute the bulk of international trade with the United States and have well-developed foreign exchange markets with rates freely determined by market participants. In addition, many currencies not included in the USDX® move in close correlation with those that are included. The USDX® is computed 24 hours a day, seven days a week based on exchange rates supplied to Reuters by some 500 banks worldwide.
-5-
The following table reflects the index base weights, or Index Base Weights, of each Index Currency as of March 1973 with respect to the USDX®:
| Index Currency | Index Base Weight (%) | |
Euro | 57.60 | |
Japanese Yen | 13.60 | |
British Pound | 11.90 | |
Canadian Dollar | 9.10 | |
Swedish Krona | 4.20 | |
Swiss Franc | 3.60 | |
Closing Level at Inception: | 100.00 |
The USDX® has been calculated since inception in March 1973. The closing level at inception was 100.00.
The Euro was included in the USDX® in 1999 and replaced the following currencies that were originally included in the USDX®: Belgian Franc, Dutch Guilder, German Mark, French Franc and Italian Lira.
There are no regularly scheduled adjustments or rebalancings of the USDX®. The USDX® has only been adjusted once, when the Euro, as noted in the above paragraph, was introduced as the common currency for the European Union (EU) bloc of countries. Without any other adjustments, the combination of components and their respective weightings in the USDX® have yielded performance results similar to other commonly used US dollar indexes, whether those index methodologies are based on trade weights or capital flow weights.
Index Calculation
Each Index reflects the changes in market value over time, whether positive or negative, of a long or short position in, as applicable, of the first to expire DX Contract relative to the value of the dollar as of December 31, 1986, or Base Date. On the Base Date, the closing level was 100.00. Although the DX Contract started trading in 1985, the Base Date of December 31, 1986 was selected because reasonably reliable pricing data was not available prior to December 31, 1986. A quote of “105.50” means the U.S. dollar’s value has risen 5.50% since the Base Date relative to the underlying basket of Index Currencies which comprise the USDX®.
The Index Sponsor calculates the closing level of each Index on both an excess return basis and a total return basis. The excess return index reflects the changes in market value over time, whether positive or negative, of the DX Contracts. The total return is the sum of the changes in market value over time, whether positive or negative, of the DX Contracts plus the return of 3-month U.S. Treasury bills. The closing levels of each Index have been calculated using historic exchange closing price data of the DX Contracts since the Base Date.
The Long Index is calculated to reflect the changes in market value over time, whether positive or negative, of long positions in DX Contracts. The Short Index is calculated to reflect the changes in market value over time, whether positive or negative, of short positions in DX Contracts. Both the Long Index and the Short Index reflect the changes in market value over time, whether positive or negative, of the DX Contracts which expire in March, June, September and December. The use of long positions in DX Contracts in the construction of the Long Index causes the Long Index to rise as a result of any upward price movement in the DX Contracts. In turn, this appreciation in the long DX Contracts reflects the rise of the U.S. dollar relative to the underlying basket of Index Currencies which comprise the USDX®. The use of short positions in DX Contracts in the construction of the Short Index causes the Short Index to rise as a result of any downward price movement in the DX Contracts. In turn, this appreciation in the short DX Contracts reflects the fall of the U.S. dollar relative to the underlying basket of Index Currencies which comprise the USDX®.
Since the Base Date, the Long Index closing level has ranged on a daily basis from as high as 100.58 on January 5, 1987 to as low as 54.14 on April 22, 2008. Since the Base Date, the Short Index closing level has ranged on a daily basis from as high as 153.28 on April 22, 2008 to as low as 91.91 on July 5, 2001. Past Index levels are not necessarily indicative of future Index levels.
Index Rolls
The underlying DX Contracts of the Indexes are rolled quarterly on the Index Roll Day, which is the Wednesday prior to the applicable IMM Date. “IMM Date” means the third Wednesday of March, June, September and December, a traditional settlement date in the International Money Market.
-6-
DX Contracts are rolled on the Wednesday prior to each IMM Date as follows:
| • | The DX Contract that expires on the next IMM Date is sold. |
| • | A position in the DX Contract that expires on the IMM Date following the next IMM Date is purchased. |
Change in the Methodology of an Index
The Index Sponsor employs the methodology described above and its application of such methodology shall be conclusive and binding. While the Index Sponsor currently employs the above described methodology to calculate each Index, no assurance can be given that fiscal, market, regulatory, juridical or financial circumstances (including, but not limited to, any changes to or any suspension or termination of or any other events affecting the applicable Index, the USDX®,DX Contracts, any Index Currency or any relevant exchange instrument) will not arise that would, in the view of the Index Sponsor, necessitate a modification of or change to such methodology and in such circumstances the Index Sponsor may make any such modification or change as it determines appropriate. The Index Sponsor may also make modifications to the terms of an Index in any manner that it may deem necessary or desirable, including (without limitation) to correct any manifest or proven error or to cure, correct or supplement any defective provision of an Index. The Index Sponsor will publish notice of any such modification or change.
Publication of Closing Levels and Adjustments
In order to calculate the indicative Index level of each Index, the Index Sponsor polls Reuters every 15 seconds to determine the real time price of each DX Contract. The Index Sponsor then applies a set of rules to these values to create the indicative level of the applicable Index. These rules are consistent with the rules which the Index Sponsor applies at the end of each trading day to calculate the closing level of an Index. A similar polling process is applied to the U.S. Treasury bills to determine the indicative value of the U.S. Treasury bills held by the Funds every 15 seconds throughout the trading day.
The intra-day indicative value per Share of each Fund is calculated by adding the intra-day U.S. Treasury bills level plus the intra-day Index level of the corresponding Index which is then applied to the last published net asset value of the Fund, less accrued fees.
The Index Sponsor publishes the closing level of the Indexes daily. The Managing Owner publishes the net asset value of each Fund and the net asset value per Share of the Fund daily. Additionally, the Index Sponsor publishes the intra-day Index level of each Index, and the Managing Owner publishes the indicative value per Share of each Fund (quoted in U.S. dollars) once every fifteen seconds throughout each trading day. All of the foregoing information is published as follows:
The intra-day level of the Indexes (symbols: Long Index: USDUPX; Short Index: USDDNX) and the intra-day indicative value per Share of each Fund (symbols: Bullish Fund: UUP; Bearish Fund: UDN) (each quoted in U.S. dollars) are published once every fifteen seconds throughout each trading day on the consolidated tape, Reuters and/or Bloomberg and on the Managing Owner’s website at http://www.dbfunds.db.com, or any successor thereto.
The current trading price per Share of each Fund (symbols: Bullish Fund: UUP; Bearish Fund: UDN) (quoted in U.S. dollars) is published continuously as trades occur throughout each trading day on the consolidated tape, Reuters and/or Bloomberg and on the Managing Owner’s website at http://www.dbfunds.db.com, or any successor thereto.
The most recent end-of-day Index closing level (symbols: Long Index: USDUPX; Short Index: USDDNX) is published as of the close of the NYSE Arca each trading day on the consolidated tape, Reuters and/or Bloomberg and on the Managing Owner’s website athttp://www.dbfunds.db.com, or any successor thereto.
The most recent end-of-day net asset value of each Fund (symbols: Bullish Fund: UUP.NV; Bearish Fund: UDN.NV) is published as of the close of business on Reuters and/or Bloomberg and on the Managing Owner’s website at http://www.dbfunds.db.com, or any successor thereto. In addition, the most recent end-of-day net asset value of the Fund is published the following morning on the consolidated tape.
All of the foregoing information with respect to the Index is also published athttps://index.db.com.
-7-
The Index Sponsor publishes any adjustments made to the Indexes on the Managing Owner’s websitehttp://www.dbfunds.db.com, or any successor thereto.
Interruption of Index Calculation
Calculation of the Indexes may not be possible or feasible under certain events or circumstances, including, without limitation, a systems failure, natural or man-made disaster, act of God, armed conflict, act of terrorism, riot or labor disruption or any similar intervening circumstance, that is beyond the reasonable control of the Index Sponsor and that the Index Sponsor determines affects the Indexes, DX Contracts, the USDX®or any Index Currency. Upon the occurrence of such force majeure events, the Index Sponsor may, in its discretion, elect one (or more) of the following options:
| • | make such determinations and/or adjustments to the terms of the Indexes as it considers appropriate to determine any closing level on any such appropriate Index business day; and/or |
| • | defer publication of the information relating to the Indexes until the next Index business day on which it determines that no force majeure event exists; and/or |
| • | permanently cancel publication of the information relating to the Indexes. |
Additionally, calculation of the Indexes may also be disrupted by an event that prevents the Index Sponsor from obtaining the closing prices of the underlying DX Contracts. In turn, the Index Sponsor would, in its discretion, either review the price of an instrument, if available, that is substantially similar to the DX Contract, or, if unavailable, obtain all the closing prices for the unaffected Index Currencies, then, with respect to the disrupted Index Currencies, calculate the closing price in respect of the disrupted Index Currency on an alternative basis were such event to occur or exist on a day that is a trading day for such Index Currency on the relevant exchange. If such an Index disruption event in relation to an Index Currency as described in the prior sentence occurs and continues for a period of five successive trading days for such Index Currency on the relevant exchange, the Index Sponsor will, in its discretion, either
| • | continue to calculate the relevant closing price for a further period of five successive trading days for such Index Currency on the relevant exchange or |
| • | if such period extends beyond the five successive trading days, the Index Sponsor may elect to replace the exchange-traded instrument with respect to a specific Index Currency and shall make all necessary adjustments to the methodology and calculation of the Indexes as it deems appropriate. |
Historical Closing Levels
Set out below are the Closing Levels of both the Long Index and the Short Index based on historical data from December 31, 1986 to June 30, 2010. The data with respect to Various Statistical Measures and Annualized Index Levels are from December 31, 1986 to June 30, 2010. The data with respect to Correlation of Monthly Returns is from December 31, 1988 to June 30, 2010. The start date of December 31, 1988 was selected with respect to Correlation of Monthly Returns because underlying data with respect to DBLCI TR was not available prior to December 31, 1988.
The following Closing Levels Tables of both the Long Index and the Short Index reflect both the high and low Closing Levels, the annual Index changes and Index changes since December 31, 1986, the Base Date, of each Index.
Since the Base Date of December 31, 1986 with respect to each of the Long Index and the Short Index, close prices of DX Contracts traded on the ICE Futures U.S. were used for each Index calculation. Although the DX Contract started trading in 1985, the Base Date of December 31, 1986 was selected because reasonably reliable pricing data was not available prior to December 31, 1986. The Index Sponsor has not independently verified the DX Contracts close prices obtained from Bloomberg and Reuters.
The first to expire DX Contracts (i.e., March, June, September and December) were used in each Index calculation.
The underlying DX Contracts of the Indexes are rolled quarterly on the Index Roll Day, which is the Wednesday prior to the applicable IMM Date. “IMM Date” means the third Wednesday of March, June, September and December, a traditional settlement date in the International Money Market.
-8-
DX Contracts are rolled on the Wednesday prior to each IMM Date as follows:
| • | The DX Contract that expires on the next IMM Date is sold. |
| • | A position in the DX Contract that expires on the IMM Date following the next IMM Date is purchased. |
Each Index is calculated on both an excess return basis and a total return basis. The excess return index reflects the changes in market value over time, whether positive or negative, of the underlying DX Contracts. The total return is the sum of the changes in market value over time, whether positive or negative, of the underlying DX Contracts plus the return of 3-month U.S. Treasury bills. The following tables reflect both the excess return calculation and the total return calculation of the Long Index and the Short Index.
Cautionary Statement – Statistical Information
Various statistical information is presented on the following pages, relating to the Closing Levels of the Long Index and the Short Index, on an annual and cumulative basis, including certain comparisons of each Index to other currency indices. In reviewing such information, prospective investors should consider that:
| • | Changes in Closing Levels of each Index during any particular period or market cycle may be volatile. |
| Index | Worst Peak-to- Valley Drawdown and Time Period | Worst Monthly Drawdown and Month and Year | ||
Long Index | (45.39)%, 12/86-03/08 | (6.30)%, 5/09 | ||
Short Index | (36.82)%, 6/95-1/02 | (8.77)%, 3/91 |
| For example, the “Worst Peak-to-Valley Drawdown” of each Index, represents the greatest percentage decline from any month-end Closing Level, without such Closing Level being equaled or exceeded as of a subsequent month-end, which occurred during the above-listed time period. |
| The “Worst Monthly Drawdown” of each Index occurred during the above-listed month and year. |
| See “The Risks You Face – (14) Price Volatility May Possibly Cause the Total Loss of Your Investment.” |
| • | Neither the fees charged by either Fund nor the execution costs associated with establishing futures positions in the DX Contracts are incorporated into the Closing Levels of each Index. Accordingly, such Index Levels have not been reduced by the costs associated with an actual investment, such as a Fund, with an investment objective of tracking the corresponding Index. |
| • | The Indexes were established in August 2006, and are independently calculated by Deutsche Bank AG London, the Index Sponsor. The Index calculation methodology and DX Contracts selection is the same before and after August 2006, as described above. Accordingly, the Closing Levels of each Index, terms of each Index methodology and DX Contracts, reflect an element of hindsight at the time each Index was established. See “The Risks You Face – (10) You May Not Rely on Past Performance or Index Results in Deciding Whether to Buy Shares” and “ – (11) Fewer Representative Index Currencies May Result In Greater Index Volatility.” |
WHILE EACH FUND’S OBJECTIVE IS NOT TO GENERATE PROFIT THROUGH ACTIVE PORTFOLIO MANAGEMENT, BUT IS TO TRACK THE CORRESPONDING INDEX, BECAUSE EACH INDEX WAS ESTABLISHED IN AUGUST 2006, CERTAIN INFORMATION RELATING TO INDEX CLOSING LEVELS MAY BE CONSIDERED TO BE “HYPOTHETICAL.” HYPOTHETICAL INFORMATION MAY HAVE CERTAIN INHERENT LIMITATIONS, SOME OF WHICH ARE DESCRIBED BELOW.
NO REPRESENTATION IS BEING MADE THAT EACH INDEX WILL OR IS LIKELY TO ACHIEVE ANNUAL OR CUMULATIVE CLOSING LEVELS CONSISTENT WITH OR SIMILAR TO THOSE SET FORTH HEREIN. SIMILARLY, NO REPRESENTATION IS BEING MADE THAT EACH FUND WILL GENERATE PROFITS OR LOSSES SIMILAR TO THE FUND’S PAST PERFORMANCE, WHEN AVAILABLE, OR THE HISTORICAL ANNUAL OR CUMULATIVE CHANGES IN THE CORRESPONDING INDEX CLOSING LEVELS. IN FACT, THERE ARE FREQUENTLY SHARP DIFFERENCES BETWEEN HYPOTHETICAL RESULTS AND THE ACTUAL RESULTS SUBSEQUENTLY ACHIEVED BY INVESTMENT METHODOLOGIES, WHETHER ACTIVE OR PASSIVE.
-9-
ONE OF THE LIMITATIONS OF HYPOTHETICAL INFORMATION IS THAT IT IS GENERALLY PREPARED WITH THE BENEFIT OF HINDSIGHT. TO THE EXTENT THAT INFORMATION PRESENTED HEREIN RELATES TO THE PERIOD DECEMBER 1986 THROUGH JULY 2006 WITH RESPECT TO EACH INDEX, AS APPLICABLE, EACH INDEX’S CLOSING LEVELS REFLECT THE APPLICATION OF THE INDEX’S METHODOLOGY, AND SELECTION OF DX CONTRACTS, IN HINDSIGHT.
NO HYPOTHETICAL RECORD CAN COMPLETELY ACCOUNT FOR THE IMPACT OF FINANCIAL RISK IN ACTUAL TRADING. FOR EXAMPLE, THERE ARE NUMEROUS FACTORS, INCLUDING THOSE DESCRIBED UNDER “THE RISKS YOU FACE” HEREIN, RELATED TO THE CURRENCIES MARKETS IN GENERAL OR TO THE IMPLEMENTATION OF EACH FUND’S EFFORTS TO TRACK ITS CORRESPONDING INDEX OVER TIME WHICH CANNOT BE, AND HAVE NOT BEEN, ACCOUNTED FOR IN THE PREPARATION OF SUCH INDEX INFORMATION SET FORTH ON THE FOLLOWING PAGES, ALL OF WHICH CAN ADVERSELY AFFECT ACTUAL PERFORMANCE RESULTS FOR EACH FUND. FURTHERMORE, THE INDEX INFORMATION DOES NOT INVOLVE FINANCIAL RISK OR ACCOUNT FOR THE IMPACT OF FEES AND COSTS ASSOCIATED WITH EACH FUND.
THE MANAGING OWNER COMMENCED OPERATIONS IN JANUARY 2006. AS MANAGING OWNER, THE MANAGING OWNER AND ITS TRADING PRINCIPALS HAVE BEEN MANAGING THE DAY-TO-DAY OPERATIONS FOR THE FUNDS AND RELATED PRODUCTS AND MANAGING FUTURES TRADING ACCOUNTS. BECAUSE THERE ARE LIMITED ACTUAL TRADING RESULTS TO COMPARE TO THE INDEX CLOSING LEVELS SET FORTH HEREIN, PROSPECTIVE INVESTORS SHOULD BE PARTICULARLY WARY OF PLACING UNDUE RELIANCE ON THE ANNUAL OR CUMULATIVE INDEX RESULTS.
[Remainder of page left blank intentionally.]
-10-
DATA
RELATING TO THE
LONG INDEX
DEUTSCHE BANK LONG US DOLLAR INDEX (USDX®) FUTURES INDEX – EXCESS RETURNTM
DEUTSCHE BANK LONG US DOLLAR INDEX (USDX®) FUTURES INDEX – TOTAL RETURNTM
The following data relates to the Long Index closing levels and various statistical measures, each of which either analyzes the Long Index closing levels data in terms of volatility, Sharpe Ratios, etc. or compares the Long Index closing levels against various relevant benchmarks. The Long Index is calculated on both an excess return and total return basis.
THE BULLISH FUND TRADES WITH A VIEW TO TRACKING THE DEUTSCHE BANK LONG US DOLLAR INDEX (USDX®) FUTURES INDEX – EXCESS RETURNTM OVER TIME.
THE BULLISH FUND DOES NOT TRADE WITH A VIEW TO TRACKING THE DEUTSCHE BANK LONG US DOLLAR INDEX (USDX®) FUTURES INDEX – TOTAL RETURNTM OVER TIME.
-11-
CLOSING LEVELS TABLE
DEUTSCHE BANK LONG US DOLLAR INDEX (USDX®) FUTURES INDEX – EXCESS RETURNTM
| Closing Level | ||||||||||
| High1 | Low2 | Annual Index Changes3 | Index Changes Since Inception4 | |||||||
19865 | 100.00 | 100.00 | 0.00 | 0.00 | ||||||
1987 | 100.58 | 80.31 | -19.69 | % | -19.69 | % | ||||
1988 | 92.74 | 80.91 | 7.06 | % | -14.02 | % | ||||
1989 | 98.38 | 85.91 | 0.84 | % | -13.30 | % | ||||
1990 | 87.89 | 73.85 | -13.34 | % | -24.86 | % | ||||
1991 | 85.99 | 72.11 | -3.76 | % | -27.69 | % | ||||
1992 | 77.65 | 65.06 | 3.67 | % | -25.04 | % | ||||
1993 | 76.18 | 70.10 | -0.42 | % | -25.35 | % | ||||
1994 | 74.47 | 64.27 | -10.56 | % | -33.23 | % | ||||
1995 | 67.54 | 60.33 | -5.30 | % | -36.77 | % | ||||
1996 | 66.56 | 63.18 | 4.32 | % | -34.04 | % | ||||
1997 | 76.53 | 66.13 | 14.46 | % | -24.50 | % | ||||
1998 | 78.10 | 70.33 | -4.85 | % | -28.16 | % | ||||
1999 | 80.14 | 71.30 | 9.38 | % | -21.42 | % | ||||
2000 | 92.51 | 77.39 | 8.85 | % | -14.47 | % | ||||
2001 | 94.55 | 84.91 | 6.01 | % | -9.33 | % | ||||
2002 | 93.28 | 77.72 | -14.28 | % | -22.28 | % | ||||
2003 | 78.64 | 65.14 | -16.19 | % | -34.86 | % | ||||
2004 | 68.46 | 59.41 | -8.33 | % | -40.29 | % | ||||
2005 | 68.31 | 60.01 | 13.14 | % | -32.44 | % | ||||
2006 | 67.50 | 62.03 | -6.67 | % | -36.95 | % | ||||
2007 | 64.32 | 57.07 | -7.26 | % | -41.53 | % | ||||
2008 | 66.12 | 54.14 | 4.17 | % | -39.09 | % | ||||
2009 | 66.14 | 54.18 | -6.85 | % | -43.26 | % | ||||
20106 | 63.96 | 55.77 | 9.37 | % | -37.94 | % | ||||
THE BULLISH FUND TRADES WITH A VIEW TO TRACKING THE
DEUTSCHE BANK LONG US DOLLAR INDEX (USDX®) FUTURES INDEX – EXCESS RETURNTM OVER TIME.
NEITHER THE PAST PERFORMANCE OF THE FUND NOR THE PRIOR INDEX LEVELS AND CHANGES, POSITIVE AND NEGATIVE, SHOULD BE TAKEN AS AN INDICATION OF THE FUND’S FUTURE PERFORMANCE.
DEUTSCHE BANK LONG US DOLLAR INDEX (USDX®) FUTURES INDEX – TOTAL RETURNTM
| Closing Level | ||||||||||
| High1 | Low2 | Annual Index Changes3 | Index Changes Since Inception4 | |||||||
19865 | 100.00 | 100.00 | 0.00 | 0.00 | ||||||
1987 | 100.66 | 85.33 | -14.67 | % | -14.67 | % | ||||
1988 | 102.65 | 86.02 | 14.80 | % | -2.04 | % | ||||
1989 | 116.74 | 97.97 | 9.54 | % | 7.30 | % | ||||
1990 | 110.08 | 97.96 | -6.41 | % | 0.43 | % | ||||
1991 | 118.38 | 97.40 | 1.66 | % | 2.09 | % | ||||
1992 | 110.58 | 94.16 | 7.37 | % | 9.61 | % | ||||
1993 | 112.53 | 103.48 | 2.67 | % | 12.53 | % | ||||
1994 | 112.42 | 100.14 | -6.62 | % | 5.09 | % | ||||
1995 | 106.73 | 96.63 | 0.14 | % | 5.24 | % | ||||
1996 | 116.61 | 105.21 | 9.82 | % | 15.57 | % | ||||
1997 | 139.28 | 115.91 | 20.51 | % | 39.28 | % | ||||
1998 | 148.94 | 134.97 | -0.11 | % | 39.13 | % | ||||
1999 | 160.01 | 138.16 | 14.67 | % | 59.54 | % | ||||
2000 | 198.12 | 157.20 | 15.48 | % | 84.23 | % | ||||
2001 | 208.23 | 183.08 | 9.78 | % | 102.26 | % | ||||
2002 | 208.39 | 176.25 | -12.86 | % | 76.25 | % | ||||
2003 | 178.34 | 149.23 | -15.33 | % | 49.23 | % | ||||
2004 | 157.39 | 138.01 | -7.05 | % | 38.71 | % | ||||
2005 | 163.02 | 139.43 | 16.79 | % | 62.00 | % | ||||
2006 | 163.23 | 152.48 | -2.09 | % | 58.62 | % | ||||
2007 | 162.61 | 149.70 | -3.02 | % | 53.83 | % | ||||
2008 | 176.36 | 143.29 | 5.62 | % | 62.47 | % | ||||
2009 | 176.48 | 144.72 | -6.71 | % | 51.56 | % | ||||
20106 | 170.96 | 148.98 | 9.44 | % | 65.87 | % | ||||
THE BULLISH FUND DOES NOT TRADE WITH A VIEW TO TRACKING THE
DEUTSCHE BANK LONG US DOLLAR INDEX (USDX®) FUTURES INDEX – TOTAL RETURNTM OVER TIME.
NEITHER THE PAST PERFORMANCE OF THE FUND NOR THE PRIOR INDEX LEVELS AND CHANGES, POSITIVE AND NEGATIVE, SHOULD BE TAKEN AS AN INDICATION OF THE FUND’S FUTURE PERFORMANCE.
Please refer to notes and legends that follow on page 46.
-12-
All Statistics based on data from December 31, 1986 to June 30, 2010
Various Statistical Measures | DB Long Future ER7,8 | DB Long Future TR8,9 | Spot Index10 | |||
Annualized Changes to Index Level11 | -2.0% | 2.2% | -0.8% | |||
Average rolling 3 month volatility12 | 8.6% | 8.6% | 8.3% | |||
Sharpe Ratio13 | -0.76 | -0.28 | -0.64 | |||
% of months with positive change14 | 47% | 52% | 47% | |||
Average monthly positive change15 | 2.0% | 2.1% | 2.0% | |||
Average monthly negative change16 | -2.0% | -1.9% | -1.9% | |||
Annualized Index Levels17 | DB Long Future ER7,8 | DB Long Future TR8,9 | Spot Index10 | |||
1 yr | 5.2% | 5.3% | 7.3% | |||
3 yr | 0.0% | 1.2% | 1.6% | |||
5 yr | -1.1% | 1.4% | -0.7% | |||
7 yr | -2.0% | 0.2% | -1.4% | |||
10 yr | -2.9% | -0.5% | -2.1% | |||
15 yr | 0.1% | 3.5% | 0.4% | |||
Correlation of Monthly Returns (between December 31, 1988 to June 30, 2010)* ,22
| DB Long Future TR7,8 | S&P 500 TR18 | iBoxx US Treasuries19 | DBLCI TR20 | NAR Existing One Family Home Sales Median Price Index21 | ||||||
DB Long Future TR | 1.00 | -0.09 | -0.28 | -0.21 | -0.03 | |||||
S&P 500 TR | -0.09 | 1.00 | -0.25 | 0.08 | 0.09 | |||||
iBoxx US Treasuries | -0.28 | -0.25 | 1.00 | -0.06 | -0.11 | |||||
DBLCI TR | -0.21 | 0.08 | -0.06 | 1.00 | 0.05 | |||||
NAR Existing One Family Home Sales Median Price Index | -0.03 | 0.09 | -0.11 | 0.05 | 1.00 |
NEITHER THE PAST PERFORMANCE OF THE FUND NOR THE PRIOR INDEX LEVELS AND CHANGES, POSITIVE AND NEGATIVE, SHOULD BE TAKEN AS AN INDICATION OF THE FUND’S FUTURE PERFORMANCE.
| * | “Correlation” is a statistical term which describes the degree to which two or more asset classes show a tendency to rise or fall in value together. Diversification of an investment portfolio among asset classes that are not correlated with each other tends to reduce overall volatility and risk in the portfolio as a whole. The hypothetical returns of DB Long Future TR have been compared with the S&P 500 TR, the iBoxx US Treasuries, the DBCLI TR and the NAR Existing One Family Home Sales Median Price Index to permit an investor to compare and contrast the degree of correlation between DB Long Future TR (which is a currency index) and indices which are commonly used to measure the performance of the equity, fixed income, commodity and real estate markets, respectively. |
WHILE THE FUND’S OBJECTIVE IS NOT TO GENERATE PROFIT THROUGH ACTIVE PORTFOLIO MANAGEMENT, BUT IS TO TRACK THE INDEX, BECAUSE THE INDEX WAS ESTABLISHED IN AUGUST 2006, CERTAIN INFORMATION RELATING TO INDEX CLOSING LEVELS MAY BE CONSIDERED TO BE “HYPOTHETICAL.” HYPOTHETICAL INFORMATION MAY HAVE CERTAIN INHERENT LIMITATIONS, SOME OF WHICH ARE DESCRIBED BELOW.
NO REPRESENTATION IS BEING MADE THAT THE INDEX WILL OR IS LIKELY TO ACHIEVE ANNUAL OR CUMULATIVE CLOSING LEVELS CONSISTENT WITH OR SIMILAR TO THOSE SET FORTH HEREIN. SIMILARLY, NO REPRESENTATION IS BEING MADE THAT THE FUND WILL GENERATE PROFITS OR LOSSES SIMILAR TO THE FUND’S PAST PERFORMANCE, WHEN AVAILABLE, OR THE HISTORICAL ANNUAL OR CUMULATIVE CHANGES IN THE INDEX CLOSING LEVELS. IN FACT, THERE ARE FREQUENTLY SHARP DIFFERENCES BETWEEN HYPOTHETICAL RESULTS AND THE ACTUAL RESULTS SUBSEQUENTLY ACHIEVED BY INVESTMENT METHODOLOGIES, WHETHER ACTIVE OR PASSIVE.
ONE OF THE LIMITATIONS OF HYPOTHETICAL INFORMATION IS THAT IT IS GENERALLY PREPARED WITH THE BENEFIT OF HINDSIGHT. TO THE EXTENT THAT INFORMATION PRESENTED HEREIN RELATES TO THE PERIOD DECEMBER 1986 THROUGH JULY 2006, THE INDEX CLOSING LEVELS REFLECT THE APPLICATION OF THE INDEX’S METHODOLOGY, AND SELECTION OF DX CONTRACTS, IN HINDSIGHT.
NO HYPOTHETICAL RECORD CAN COMPLETELY ACCOUNT FOR THE IMPACT OF FINANCIAL RISK IN ACTUAL TRADING. FOR EXAMPLE, THERE ARE NUMEROUS FACTORS, INCLUDING THOSE DESCRIBED UNDER “THE RISKS YOU FACE” HEREIN, RELATED TO THE CURRENCIES MARKETS IN GENERAL OR TO THE IMPLEMENTATION OF THE FUND’S EFFORTS TO TRACK ITS INDEX OVER TIME WHICH CANNOT BE, AND HAVE NOT BEEN, ACCOUNTED FOR IN THE PREPARATION OF SUCH INDEX INFORMATION SET FORTH ON THE FOLLOWING PAGES, ALL OF WHICH CAN ADVERSELY AFFECT ACTUAL PERFORMANCE RESULTS FOR THE FUND. FURTHERMORE, THE INDEX INFORMATION DOES NOT INVOLVE FINANCIAL RISK OR ACCOUNT FOR THE IMPACT OF FEES AND COSTS ASSOCIATED WITH THE FUND.
THE MANAGING OWNER COMMENCED OPERATIONS IN JANUARY 2006. AS MANAGING OWNER, THE MANAGING OWNER AND ITS TRADING PRINCIPALS HAVE BEEN MANAGING THE DAY-TO-DAY OPERATIONS FOR THE FUNDS AND RELATED PRODUCTS AND MANAGING FUTURES TRADING ACCOUNTS. BECAUSE THERE ARE LIMITED ACTUAL TRADING RESULTS TO COMPARE TO THE INDEX CLOSING LEVELS SET FORTH HEREIN, PROSPECTIVE INVESTORS SHOULD BE PARTICULARLY WARY OF PLACING UNDUE RELIANCE ON THE ANNUAL OR CUMULATIVE INDEX RESULTS.
Please refer to notes and legends that follow on page 46.
-13-
COMPARISON OF VARIOUS US DOLLAR INDICES
(DECEMBER 31, 1986 – JUNE 30, 2010)

NEITHER THE PAST PERFORMANCE OF THE FUND NOR THE PRIOR INDEX LEVELS AND CHANGES, POSITIVE AND NEGATIVE, SHOULD BE TAKEN AS AN INDICATION OF THE FUND’S FUTURE PERFORMANCE.
Each of the DB Long Future-ER, DB Long Future-TR and Spot Index are indices and do not reflect actual trading or any fees or expenses.
Spot Index is calculated on an excess return basis.
WHILE THE FUND’S OBJECTIVE IS NOT TO GENERATE PROFIT THROUGH ACTIVE PORTFOLIO MANAGEMENT, BUT IS TO TRACK THE INDEX, BECAUSE THE INDEX WAS ESTABLISHED IN AUGUST 2006, CERTAIN INFORMATION RELATING TO INDEX CLOSING LEVELS MAY BE CONSIDERED TO BE “HYPOTHETICAL.” HYPOTHETICAL INFORMATION MAY HAVE CERTAIN INHERENT LIMITATIONS, SOME OF WHICH ARE DESCRIBED BELOW.
NO REPRESENTATION IS BEING MADE THAT THE INDEX WILL OR IS LIKELY TO ACHIEVE ANNUAL OR CUMULATIVE CLOSING LEVELS CONSISTENT WITH OR SIMILAR TO THOSE SET FORTH HEREIN. SIMILARLY, NO REPRESENTATION IS BEING MADE THAT THE FUND WILL GENERATE PROFITS OR LOSSES SIMILAR TO THE FUND’S PAST PERFORMANCE, WHEN AVAILABLE, OR THE HISTORICAL ANNUAL OR CUMULATIVE CHANGES IN THE INDEX CLOSING LEVELS. IN FACT, THERE ARE FREQUENTLY SHARP DIFFERENCES BETWEEN HYPOTHETICAL RESULTS AND THE ACTUAL RESULTS SUBSEQUENTLY ACHIEVED BY INVESTMENT METHODOLOGIES, WHETHER ACTIVE OR PASSIVE.
ONE OF THE LIMITATIONS OF HYPOTHETICAL INFORMATION IS THAT IT IS GENERALLY PREPARED WITH THE BENEFIT OF HINDSIGHT. TO THE EXTENT THAT INFORMATION PRESENTED HEREIN RELATES TO THE PERIOD DECEMBER 1986 THROUGH JULY 2006, THE INDEX CLOSING LEVELS REFLECT THE APPLICATION OF THE INDEX’S METHODOLOGY, AND SELECTION OF DX CONTRACTS, IN HINDSIGHT.
NO HYPOTHETICAL RECORD CAN COMPLETELY ACCOUNT FOR THE IMPACT OF FINANCIAL RISK IN ACTUAL TRADING. FOR EXAMPLE, THERE ARE NUMEROUS FACTORS, INCLUDING THOSE DESCRIBED UNDER “THE RISKS YOU FACE” HEREIN, RELATED TO THE CURRENCIES MARKETS IN GENERAL OR TO THE IMPLEMENTATION OF THE FUND’S EFFORTS TO TRACK ITS INDEX OVER TIME WHICH CANNOT BE, AND HAVE NOT BEEN, ACCOUNTED FOR IN THE PREPARATION OF SUCH INDEX INFORMATION SET FORTH ON THE FOLLOWING PAGES, ALL OF WHICH CAN ADVERSELY AFFECT ACTUAL PERFORMANCE RESULTS FOR THE FUND. FURTHERMORE, THE INDEX INFORMATION DOES NOT INVOLVE FINANCIAL RISK OR ACCOUNT FOR THE IMPACT OF FEES AND COSTS ASSOCIATED WITH THE FUND.
THE MANAGING OWNER COMMENCED OPERATIONS IN JANUARY 2006. AS MANAGING OWNER, THE MANAGING OWNER AND ITS TRADING PRINCIPALS HAVE BEEN MANAGING THE DAY-TO-DAY OPERATIONS FOR THE FUNDS AND RELATED PRODUCTS AND MANAGING FUTURES TRADING ACCOUNTS. BECAUSE THERE ARE LIMITED ACTUAL TRADING RESULTS TO COMPARE TO THE INDEX CLOSING LEVELS SET FORTH HEREIN, PROSPECTIVE INVESTORS SHOULD BE PARTICULARLY WARY OF PLACING UNDUE RELIANCE ON THE ANNUAL OR CUMULATIVE INDEX RESULTS.
| Please refer to notes and legends that follow on page 46. |
-14-
COMPARISON OF ANNUAL RETURNS OF VARIOUS US DOLLAR INDICES
(DECEMBER 31, 1986 – JUNE 30, 2010)
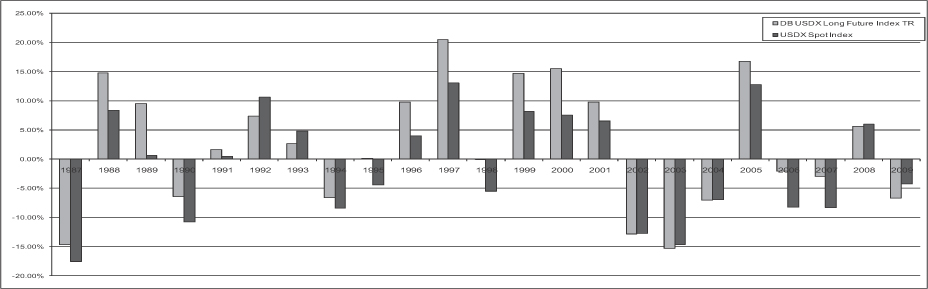
NEITHER THE PAST PERFORMANCE OF THE FUND NOR THE PRIOR INDEX LEVELS AND CHANGES, POSITIVE AND NEGATIVE, SHOULD BE TAKEN AS AN INDICATION OF THE FUND’S FUTURE PERFORMANCE.
Each of the DB Long Future-ER and Spot Index are indices and do not reflect actual trading or any fees or expenses.
Spot Index is calculated on an excess return basis.
WHILE THE FUND’S OBJECTIVE IS NOT TO GENERATE PROFIT THROUGH ACTIVE PORTFOLIO MANAGEMENT, BUT IS TO TRACK THE INDEX, BECAUSE THE INDEX WAS ESTABLISHED IN AUGUST 2006, CERTAIN INFORMATION RELATING TO INDEX CLOSING LEVELS MAY BE CONSIDERED TO BE “HYPOTHETICAL.” HYPOTHETICAL INFORMATION MAY HAVE CERTAIN INHERENT LIMITATIONS, SOME OF WHICH ARE DESCRIBED BELOW.
NO REPRESENTATION IS BEING MADE THAT THE INDEX WILL OR IS LIKELY TO ACHIEVE ANNUAL OR CUMULATIVE CLOSING LEVELS CONSISTENT WITH OR SIMILAR TO THOSE SET FORTH HEREIN. SIMILARLY, NO REPRESENTATION IS BEING MADE THAT THE FUND WILL GENERATE PROFITS OR LOSSES SIMILAR TO THE FUND’S PAST PERFORMANCE, WHEN AVAILABLE, OR THE HISTORICAL ANNUAL OR CUMULATIVE CHANGES IN THE INDEX CLOSING LEVELS. IN FACT, THERE ARE FREQUENTLY SHARP DIFFERENCES BETWEEN HYPOTHETICAL RESULTS AND THE ACTUAL RESULTS SUBSEQUENTLY ACHIEVED BY INVESTMENT METHODOLOGIES, WHETHER ACTIVE OR PASSIVE.
ONE OF THE LIMITATIONS OF HYPOTHETICAL INFORMATION IS THAT IT IS GENERALLY PREPARED WITH THE BENEFIT OF HINDSIGHT. TO THE EXTENT THAT INFORMATION PRESENTED HEREIN RELATES TO THE PERIOD DECEMBER 1986 THROUGH JULY 2006, THE INDEX CLOSING LEVELS REFLECT THE APPLICATION OF THE INDEX’S METHODOLOGY, AND SELECTION OF DX CONTRACTS, IN HINDSIGHT.
NO HYPOTHETICAL RECORD CAN COMPLETELY ACCOUNT FOR THE IMPACT OF FINANCIAL RISK IN ACTUAL TRADING. FOR EXAMPLE, THERE ARE NUMEROUS FACTORS, INCLUDING THOSE DESCRIBED UNDER “THE RISKS YOU FACE” HEREIN, RELATED TO THE CURRENCIES MARKETS IN GENERAL OR TO THE IMPLEMENTATION OF THE FUND’S EFFORTS TO TRACK ITS INDEX OVER TIME WHICH CANNOT BE, AND HAVE NOT BEEN, ACCOUNTED FOR IN THE PREPARATION OF SUCH INDEX INFORMATION SET FORTH ON THE FOLLOWING PAGES, ALL OF WHICH CAN ADVERSELY AFFECT ACTUAL PERFORMANCE RESULTS FOR THE FUND. FURTHERMORE, THE INDEX INFORMATION DOES NOT INVOLVE FINANCIAL RISK OR ACCOUNT FOR THE IMPACT OF FEES AND COSTS ASSOCIATED WITH THE FUND.
THE MANAGING OWNER COMMENCED OPERATIONS IN JANUARY 2006. AS MANAGING OWNER, THE MANAGING OWNER AND ITS TRADING PRINCIPALS HAVE BEEN MANAGING THE DAY-TO-DAY OPERATIONS FOR THE FUNDS AND RELATED PRODUCTS AND MANAGING FUTURES TRADING ACCOUNTS. BECAUSE THERE ARE LIMITED ACTUAL TRADING RESULTS TO COMPARE TO THE INDEX CLOSING LEVELS SET FORTH HEREIN, PROSPECTIVE INVESTORS SHOULD BE PARTICULARLY WARY OF PLACING UNDUE RELIANCE ON THE ANNUAL OR CUMULATIVE INDEX RESULTS.
| Please refer to notes and legends that follow on page 46. |
-15-
NOTES AND LEGENDS:
1. “High” reflects the highest closing level of the Index during the applicable year.
2. “Low” reflects the lowest closing level of the Index during the applicable year.
3. “Annual Index Changes” reflect the change to the Index level on an annual basis as of December 31 of each applicable year.
4. “Index Changes Since Inception” reflects the change of the Index level since inception on a compounded annual basis as of December 31 of each applicable year.
5. Closing levels as of Base Date of December 31, 1986.
6. Closing levels as of June 30, 2010.
7. “DB Long Future ER” is the Deutsche Bank Long US Dollar Index (USDX®) Futures Index – Excess ReturnTM with respect to the Long Index. The Deutsche Bank Long US Dollar Index (USDX®) Futures IndexTM is calculated on both an excess return basis and total return basis. The DB Long Future ER calculation is not funded and reflects the changes in market value over time, whether positive or negative, of the underlying DX Contracts. The sponsor of the Index, or the Index Sponsor, is Deutsche Bank AG London.
8. If a Fund’s interest income from its holdings of fixed income securities were to exceed the Fund’s fees and expenses, the total return on an investment in a Fund is expected to outperform the DB Long Future ER and underperform the DB Long Future TR (as such term is defined in the following footnote). The only difference between the DB Long Future ER and the DB Long Future TR is that the DB Long Future ER does not include interest income from a hypothetical basket of fixed income securities while the DB Long Future TR does include such a component. The difference in the changes in market value over time, whether positive or negative, in the DB Long Future ER and the DB Long Future TR is attributable entirely to the hypothetical interest income from this hypothetical basket of fixed income securities. If a Fund’s interest income from its holdings of fixed-income securities exceeds such Fund’s fees and expenses, then the amount of such excess is expected to be distributed periodically. The market price of the Shares is expected to track closely the DB Long Future ER. The total return on an investment in a Fund over any period is the sum of the capital appreciation or depreciation of the Shares over the period, plus the amount of any distributions during the period. Consequently, a Fund’s total return is expected to outperform the DB Long Future ER by the amount of the excess, if any, of its interest income over its fees and expenses but, as a result of such Fund’s fees and expenses, the total return on a Fund is expected to underperform the DB Long Future TR. If a Fund’s fees and expenses were to exceed such Fund’s interest income from its holdings of fixed income securities, such Fund would underperform the DB Long Future ER.
9. “DB Long Future TR” is the Deutsche Bank Long US Dollar Index (USDX®) Futures Index – Total ReturnTM with respect to the Long Index. The Deutsche Bank Long US Dollar Index (USDX®) Futures IndexTM is calculated on both an excess return basis and total return basis. The DB Long Future TR calculation is funded and reflects the changes in market value over time, whether positive or negative, of both the underlying DX Contracts and the interest income from a hypothetical basket of fixed income securities. The sponsor of the Index, or the Index Sponsor, is Deutsche Bank AG London.
10. “Spot Index” is the U.S. Dollar Index (USDX®), which provides a general indication of the international value of the USD by averaging the exchange rates between the USD and the six major world currencies the Spot Index – Euro, Japanese Yen, British Pound, Canadian Dollar, Swedish Krona and Swiss Franc. The USDX® mark is a registered service mark owned by ICE Futures U.S., Inc.
11. “Annualized Changes to Index Level” reflects the changes of the applicable index on an annual basis as of December 31 of each applicable year.
-16-
12. “Average rolling 3 month daily volatility.” The daily volatility reflects the relative rate at which the price of the applicable index moves up and down, which is found by calculating the annualized standard deviation of the daily change in price. In turn, an average of this value is calculated on a 3 month rolling basis.
13. “Sharpe Ratio” compares the annualized rate of return minus the annualized risk-free rate of return to the annualized variability – often referred to as the “standard deviation” – of the monthly rates of return. A Sharpe Ratio of 1:1 or higher indicates that, according to the measures used in calculating the ratio, the rate of return achieved by a particular strategy has equaled or exceeded the risks assumed by such strategy. The risk-free rate of return that was used in these calculations was assumed to be 4.59%.
14. “% of months with positive change” during the period from inception to June 30, 2010.
15. “Average monthly positive change” during the period from inception to June 30, 2010.
16. “Average monthly negative change” during the period from inception to June 30, 2010.
17. “Annualized Index Levels” reflects the change in the applicable index on an annual basis as of December 31 of each the applicable time period (e.g., 1 year, 3, 5, 7, 10 or 15 years).
18. “S&P 500 TR” is the Standard & Poor’s index calculated on a total return basis. Widely regarded as the benchmark gauge of the U.S. equities market, this index includes a representative sample of 500 leading companies in leading industries of the U.S. economy. Although the S&P 500 focuses on the large-cap segment of the market, with approximately 80% coverage of U.S. equities, it also serves as a proxy for the total market. The total return calculation provides investors with a price-plus-gross cash dividend return. Gross cash dividends are applied on the ex-date of the dividend.
19. “iBoxx US Treasuries” means the Markit iBoxx USD Treasuries index, a sub-index of the Markit iBoxx USD Overall index which covers all USD-denominated investment grade bonds.
20. “DBLCI-TR” is the Deutsche Bank Liquid Commodity IndexTM – Total Return. This Index is intended to reflect the changes in notional value in the following commodities: Light, Sweet Crude Oil, Heating Oil, Aluminum, Gold, Corn and Wheat. The notional amounts of each index commodity included in this index are broadly in proportion to historical levels of the world’s production and stocks of the index commodities. The sponsor of the Index, or the Index Sponsor, is Deutsche Bank AG London. Deutsche Bank Liquid Commodity IndexTM – Total Return is a trade mark of Deutsche Bank AG and is the subject of Community Trade Mark Number 3054996. Trade Mark applications in the United States are pending.
21. “NAR Existing One Family Home Sales Median Price Index” is one component of The National Association Of Realtors® Existing-Home Sales Series, which is the premier measurement of national and regional residential real estate market. On or about the 25th of each month, NAR releases statistics on sales and prices of existing single-family homes for the nation and the four regions. These figures include condos and co-ops, in addition to single-family homes. NAR Existing One Family Home Sales Median Price Index reflects current sales rates, actual totals and median prices by month going back 12 months. Annual totals cover a period of three years, which includes all existing-home sales – single-family, condos and co-ops – rolled into monthly and annual totals.
22. “Correlation of Monthly Returns.” Every investment asset, by definition, has a correlation coefficient of 1.0 with itself; 1.0 indicates 100% positive correlation. Two investments that always move in the opposite direction from each other have a correlation coefficient of -1.0; -1.0 indicates 100% negative correlation. Two investments that perform entirely independently of each other have a correlation coefficient of 0; 0 indicates 100% non-correlation. December 31, 1988 was used as the start date with respect to the underlying data because closing levels with respect to DBLCI-TR was not available prior to December 31, 1988.
WHILE THE FUND’S OBJECTIVE IS NOT TO GENERATE PROFIT THROUGH ACTIVE PORTFOLIO MANAGEMENT, BUT IS TO TRACK THE INDEX, BECAUSE THE INDEX WAS ESTABLISHED IN AUGUST 2006, CERTAIN INFORMATION RELATING TO INDEX CLOSING LEVELS MAY BE CONSIDERED TO BE “HYPOTHETICAL.” HYPOTHETICAL INFORMATION MAY HAVE CERTAIN INHERENT LIMITATIONS, SOME OF WHICH ARE DESCRIBED BELOW.
-17-
NO REPRESENTATION IS BEING MADE THAT THE INDEX WILL OR IS LIKELY TO ACHIEVE ANNUAL OR CUMULATIVE CLOSING LEVELS CONSISTENT WITH OR SIMILAR TO THOSE SET FORTH HEREIN. SIMILARLY, NO REPRESENTATION IS BEING MADE THAT THE FUND WILL GENERATE PROFITS OR LOSSES SIMILAR TO THE FUND’S PAST PERFORMANCE, WHEN AVAILABLE, OR THE HISTORICAL ANNUAL OR CUMULATIVE CHANGES IN THE INDEX CLOSING LEVELS. IN FACT, THERE ARE FREQUENTLY SHARP DIFFERENCES BETWEEN HYPOTHETICAL RESULTS AND THE ACTUAL RESULTS SUBSEQUENTLY ACHIEVED BY INVESTMENT METHODOLOGIES, WHETHER ACTIVE OR PASSIVE.
ONE OF THE LIMITATIONS OF HYPOTHETICAL INFORMATION IS THAT IT IS GENERALLY PREPARED WITH THE BENEFIT OF HINDSIGHT. TO THE EXTENT THAT INFORMATION PRESENTED HEREIN RELATES TO THE PERIOD DECEMBER 1986 THROUGH JULY 2006, THE INDEX CLOSING LEVELS REFLECT THE APPLICATION OF THE INDEX’S METHODOLOGY, AND SELECTION OF DX CONTRACTS, IN HINDSIGHT.
NO HYPOTHETICAL RECORD CAN COMPLETELY ACCOUNT FOR THE IMPACT OF FINANCIAL RISK IN ACTUAL TRADING. FOR EXAMPLE, THERE ARE NUMEROUS FACTORS, INCLUDING THOSE DESCRIBED UNDER “THE RISKS YOU FACE” HEREIN, RELATED TO THE CURRENCIES MARKETS IN GENERAL OR TO THE IMPLEMENTATION OF THE FUND’S EFFORTS TO TRACK ITS INDEX OVER TIME WHICH CANNOT BE, AND HAVE NOT BEEN, ACCOUNTED FOR IN THE PREPARATION OF SUCH INDEX INFORMATION SET FORTH ON THE FOLLOWING PAGES, ALL OF WHICH CAN ADVERSELY AFFECT ACTUAL PERFORMANCE RESULTS FOR THE FUND. FURTHERMORE, THE INDEX INFORMATION DOES NOT INVOLVE FINANCIAL RISK OR ACCOUNT FOR THE IMPACT OF FEES AND COSTS ASSOCIATED WITH THE FUND.
THE MANAGING OWNER COMMENCED OPERATIONS IN JANUARY 2006. AS MANAGING OWNER, THE MANAGING OWNER AND ITS TRADING PRINCIPALS HAVE BEEN MANAGING THE DAY-TO-DAY OPERATIONS FOR THE FUNDS AND RELATED PRODUCTS AND MANAGING FUTURES TRADING ACCOUNTS. BECAUSE THERE ARE LIMITED ACTUAL TRADING RESULTS TO COMPARE TO THE INDEX CLOSING LEVELS SET FORTH HEREIN, PROSPECTIVE INVESTORS SHOULD BE PARTICULARLY WARY OF PLACING UNDUE RELIANCE ON THE ANNUAL OR CUMULATIVE INDEX RESULTS.
ALTHOUGH THE INDEX SPONSOR WILL OBTAIN INFORMATION FOR INCLUSION IN OR FOR USE IN THE CALCULATION OF THE INDEX FROM SOURCE(S) WHICH THE INDEX SPONSOR CONSIDERS RELIABLE, THE INDEX SPONSOR WILL NOT INDEPENDENTLY VERIFY SUCH INFORMATION AND DOES NOT GUARANTEE THE ACCURACY AND/OR THE COMPLETENESS OF THE INDEX OR ANY DATA INCLUDED THEREIN. THE INDEX SPONSOR SHALL NOT BE LIABLE (WHETHER IN NEGLIGENCE OR OTHERWISE) TO ANY PERSON FOR ANY ERROR IN THE INDEX AND THE INDEX SPONSOR IS UNDER NO OBLIGATION TO ADVISE ANY PERSON OF ANY ERROR THEREIN.
UNLESS OTHERWISE SPECIFIED, NO TRANSACTION RELATING TO THE INDEX IS SPONSORED, ENDORSED, SOLD OR PROMOTED BY THE INDEX SPONSOR AND THE INDEX SPONSOR MAKES NO EXPRESS OR IMPLIED REPRESENTATIONS OR WARRANTIES AS TO (A) THE ADVISABILITY OF PURCHASING OR ASSUMING ANY RISK IN CONNECTION WITH ANY SUCH TRANSACTION (B) THE LEVELS AT WHICH THE INDEX STANDS AT ANY PARTICULAR TIME ON ANY PARTICULAR DATE (C) THE RESULTS TO BE OBTAINED BY THE ISSUER OF ANY SECURITY OR ANY COUNTERPARTY OR ANY SUCH ISSUER’S SECURITY HOLDERS OR CUSTOMERS OR ANY SUCH COUNTERPARTY’S CUSTOMERS OR COUNTERPARTIES OR ANY OTHER PERSON OR ENTITY FROM THE USE OF THE INDEX OR ANY DATA INCLUDED THEREIN IN CONNECTION WITH ANY LICENSED RIGHTS OR FOR ANY OTHER USE OR (D) ANY OTHER MATTER. THE INDEX SPONSOR MAKES NO EXPRESS OR IMPLIED REPRESENTATIONS OR WARRANTIES OF MERCHANTABILITY OR FITNESS FOR A PARTICULAR PURPOSE WITH RESPECT TO THE INDEX OR ANY DATA INCLUDED THEREIN.
WITHOUT LIMITING ANY OF THE FOREGOING, IN NO EVENT SHALL THE INDEX SPONSOR HAVE ANY LIABILITY (WHETHER IN NEGLIGENCE OR OTHERWISE) TO ANY PERSON FOR ANY DIRECT, INDIRECT, SPECIAL, PUNITIVE, CONSEQUENTIAL OR ANY OTHER DAMAGES (INCLUDING LOST PROFITS) EVEN IF NOTIFIED OF THE POSSIBILITY OF SUCH DAMAGES.
-18-
DATA
RELATING TO THE
SHORT INDEX
DEUTSCHE BANK SHORT US DOLLAR INDEX (USDX®) FUTURES INDEX – EXCESS RETURNTM
DEUTSCHE BANK SHORT US DOLLAR INDEX (USDX®) FUTURES INDEX – TOTAL RETURNTM
The following data relates to the Short Index closing levels and various statistical measures, each of which either analyzes the Short Index closing levels data in terms of volatility, Sharpe Ratios, etc. or compares the Short Index closing levels against various relevant benchmarks. The Short Index is calculated on both an excess return and total return basis.
THE BEARISH FUND TRADES WITH A VIEW TO TRACKING THE DEUTSCHE BANK SHORT US DOLLAR INDEX (USDX®) FUTURES INDEX – EXCESS RETURNTM OVER TIME.
THE BEARISH FUND DOES NOT TRADE WITH A VIEW TO TRACKING THE DEUTSCHE BANK SHORT US DOLLAR INDEX (USDX®) FUTURES INDEX – TOTAL RETURNTM OVER TIME.
-19-
CLOSING LEVELS TABLE
DEUTSCHE BANK SHORT US DOLLAR INDEX (USDX®) FUTURES INDEX – EXCESS RETURNTM
| Closing Level | ||||||||||
| High1 | Low2 | Annual Index Changes3 | Index Changes Since Inception4 | |||||||
19865 | 100.00 | 100.00 | 0.00 | 0.00 | ||||||
1987 | 123.07 | 99.42 | 23.07 | % | 23.07 | % | ||||
1988 | 122.24 | 105.99 | -7.47 | % | 13.88 | % | ||||
1989 | 113.97 | 98.33 | -2.79 | % | 10.70 | % | ||||
1990 | 128.74 | 109.22 | 14.37 | % | 26.61 | % | ||||
1991 | 131.41 | 109.44 | 1.96 | % | 29.10 | % | ||||
1992 | 141.41 | 120.25 | -5.86 | % | 21.54 | % | ||||
1993 | 129.24 | 119.46 | 0.00 | % | 21.53 | % | ||||
1994 | 140.43 | 121.84 | 11.30 | % | 35.26 | % | ||||
1995 | 148.76 | 133.74 | 4.64 | % | 41.54 | % | ||||
1996 | 141.66 | 134.35 | -4.21 | % | 35.59 | % | ||||
1997 | 135.23 | 115.36 | -13.47 | % | 17.32 | % | ||||
1998 | 125.36 | 113.35 | 4.85 | % | 23.01 | % | ||||
1999 | 123.92 | 109.83 | -8.91 | % | 12.05 | % | ||||
2000 | 113.78 | 94.09 | -9.29 | % | 1.64 | % | ||||
2001 | 102.32 | 91.91 | -5.82 | % | -4.28 | % | ||||
2002 | 110.87 | 92.90 | 15.83 | % | 10.87 | % | ||||
2003 | 130.21 | 109.65 | 17.44 | % | 30.21 | % | ||||
2004 | 141.83 | 123.83 | 8.41 | % | 41.16 | % | ||||
2005 | 140.46 | 122.29 | -12.22 | % | 23.91 | % | ||||
2006 | 134.51 | 124.03 | 6.88 | % | 32.43 | % | ||||
2007 | 145.62 | 129.74 | 7.48 | % | 42.33 | % | ||||
2008 | 153.28 | 123.41 | -5.54 | % | 34.45 | % | ||||
2009 | 149.62 | 123.96 | 6.34 | % | 42.97 | % | ||||
20106 | 145.52 | 125.18 | -9.58 | % | 29.28 | % | ||||
THE BEARISH FUND TRADES WITH A VIEW TO TRACKING THE
DEUTSCHE BANK SHORT US DOLLAR INDEX (USDX®) FUTURES INDEX – EXCESS RETURNTMOVER TIME.
NEITHER THE PAST PERFORMANCE OF THE FUND NOR THE PRIOR INDEX LEVELS AND CHANGES, POSITIVE AND NEGATIVE, SHOULD BE TAKEN AS AN INDICATION OF THE FUND’S FUTURE PERFORMANCE.
DEUTSCHE BANK SHORT US DOLLAR INDEX (USDX®) FUTURES INDEX – TOTAL RETURNTM
| Closing Level | ||||||||||
| High1 | Low2 | Annual Index Changes3 | Index Changes Since Inception4 | |||||||
19865 | 100.00 | 100.00 | 0.00 | 0.00 | ||||||
1987 | 130.76 | 99.50 | 30.76 | % | 30.76 | % | ||||
1988 | 131.84 | 117.08 | -0.78 | % | 29.74 | % | ||||
1989 | 137.94 | 116.55 | 5.60 | % | 37.00 | % | ||||
1990 | 170.77 | 135.31 | 23.51 | % | 69.21 | % | ||||
1991 | 182.61 | 150.65 | 7.70 | % | 82.25 | % | ||||
1992 | 204.64 | 170.95 | -2.50 | % | 77.69 | % | ||||
1993 | 192.01 | 175.28 | 3.10 | % | 83.19 | % | ||||
1994 | 218.80 | 183.73 | 16.20 | % | 112.86 | % | ||||
1995 | 240.62 | 210.69 | 10.66 | % | 135.54 | % | ||||
1996 | 241.78 | 228.68 | 0.85 | % | 137.55 | % | ||||
1997 | 236.99 | 208.43 | -8.89 | % | 116.42 | % | ||||
1998 | 240.56 | 212.61 | 10.07 | % | 138.22 | % | ||||
1999 | 240.09 | 217.83 | -4.51 | % | 127.49 | % | ||||
2000 | 231.10 | 200.46 | -3.77 | % | 118.92 | % | ||||
2001 | 220.85 | 202.43 | -2.46 | % | 113.52 | % | ||||
2002 | 251.42 | 207.52 | 17.75 | % | 151.42 | % | ||||
2003 | 298.30 | 248.66 | 18.65 | % | 198.30 | % | ||||
2004 | 329.45 | 284.67 | 9.92 | % | 227.89 | % | ||||
2005 | 327.76 | 291.86 | -9.38 | % | 197.12 | % | ||||
2006 | 337.28 | 299.84 | 12.13 | % | 233.15 | % | ||||
2007 | 381.95 | 327.04 | 12.39 | % | 274.43 | % | ||||
2008 | 406.25 | 329.16 | -4.22 | % | 258.61 | % | ||||
2009 | 399.63 | 330.77 | 6.49 | % | 281.89 | % | ||||
20106 | 388.73 | 334.55 | -9.52 | % | 245.53 | % | ||||
THE BEARISH FUND DOES NOT TRADE WITH A VIEW TO TRACKING THE
DEUTSCHE BANK SHORT US DOLLAR INDEX (USDX®) FUTURES INDEX – TOTAL RETURNTMOVER TIME.
NEITHER THE PAST PERFORMANCE OF THE FUND NOR THE PRIOR INDEX LEVELS AND CHANGES, POSITIVE AND NEGATIVE, SHOULD BE TAKEN AS AN INDICATION OF THE FUND’S FUTURE PERFORMANCE.
Please refer to notes and legends that follow on page 54.
-20-
All Statistics based on data from December 31, 1986 to June 30, 2010
Various Statistical Measures | DB Short Future ER7,8 | DB Short Future TR8,9 | Spot Index10 | |||
Annualized Changes to Index Level11 | 1.1% | 5.4% | -0.8% | |||
Average rolling 3 month volatility12 | 8.6% | 8.6% | 8.3% | |||
Sharpe Ratio13 | -0.45 | 0.05 | -0.69 | |||
% of months with positive change14 | 54% | 60% | 47% | |||
Average monthly positive change15 | 1.9% | 2.1% | 2.0% | |||
Average monthly negative change16 | -2.0% | -1.9% | -1.9% | |||
Annualized Index Levels17 | DB Short Future ER7,8 | DB Short Future TR8,9 | Spot Index10 | |||
1 yr | -6.3% | -6.2% | 7.3% | |||
3 yr | -1.3% | -0.1% | 1.6% | |||
5 yr | 0.3% | 2.9% | -0.7% | |||
7 yr | 1.1% | 3.5% | -1.4% | |||
10 yr | 2.0% | 4.6% | -2.1% | |||
15 yr | -0.9% | 2.5% | 0.4% | |||
Correlation of Monthly Returns (between December 31, 1988 to June 30, 2010)*, 22
| DB Short Future TR7,8 | S&P 500 TR18 | iBoxx US Treasuries19 | DBLCI TR20 | NAR Existing One Family Home Sales Median Price Index21 | ||||||
DB Short Future TR | 1.00 | 0.10 | 0.29 | 0.22 | 0.02 | |||||
S&P 500 TR | 0.10 | 1.00 | -0.25 | 0.08 | 0.09 | |||||
iBoxx US Treasuries | 0.29 | -0.25 | 1.00 | -0.06 | -0.13 | |||||
DBLCI TR | 0.22 | 0.08 | -0.06 | 1.00 | 0.05 | |||||
NAR Existing One Family Home Sales Median Price Index | 0.02 | 0.09 | -0.13 | 0.05 | 1.00 |
NEITHER THE PAST PERFORMANCE OF THE FUND NOR THE PRIOR INDEX LEVELS AND CHANGES, POSITIVE AND NEGATIVE, SHOULD BE TAKEN AS AN INDICATION OF THE FUND’S FUTURE PERFORMANCE.
| * | “Correlation” is a statistical term which describes the degree to which two or more asset classes show a tendency to rise or fall in value together. Diversification of an investment portfolio among asset classes that are not correlated with each other tends to reduce overall volatility and risk in the portfolio as a whole. The hypothetical returns of DB Short Future TR have been compared with the S&P 500 TR, the iBoxx US Treasuries, the DBCLI TR and the NAR Existing One Family Home Sales Median Price Index to permit an investor to compare and contrast the degree of correlation between DB Short Future TR (which is a currency index) and indices which are commonly used to measure the performance of the equity, fixed income, commodity and real estate markets, respectively. |
WHILE THE FUND’S OBJECTIVE IS NOT TO GENERATE PROFIT THROUGH ACTIVE PORTFOLIO MANAGEMENT, BUT IS TO TRACK THE INDEX, BECAUSE THE INDEX WAS ESTABLISHED IN AUGUST 2006, CERTAIN INFORMATION RELATING TO INDEX CLOSING LEVELS MAY BE CONSIDERED TO BE “HYPOTHETICAL.” HYPOTHETICAL INFORMATION MAY HAVE CERTAIN INHERENT LIMITATIONS, SOME OF WHICH ARE DESCRIBED BELOW.
NO REPRESENTATION IS BEING MADE THAT THE INDEX WILL OR IS LIKELY TO ACHIEVE ANNUAL OR CUMULATIVE CLOSING LEVELS CONSISTENT WITH OR SIMILAR TO THOSE SET FORTH HEREIN. SIMILARLY, NO REPRESENTATION IS BEING MADE THAT THE FUND WILL GENERATE PROFITS OR LOSSES SIMILAR TO THE FUND’S PAST PERFORMANCE, WHEN AVAILABLE, OR THE HISTORICAL ANNUAL OR CUMULATIVE CHANGES IN THE INDEX CLOSING LEVELS. IN FACT, THERE ARE FREQUENTLY SHARP DIFFERENCES BETWEEN HYPOTHETICAL RESULTS AND THE ACTUAL RESULTS SUBSEQUENTLY ACHIEVED BY INVESTMENT METHODOLOGIES, WHETHER ACTIVE OR PASSIVE.
ONE OF THE LIMITATIONS OF HYPOTHETICAL INFORMATION IS THAT IT IS GENERALLY PREPARED WITH THE BENEFIT OF HINDSIGHT. TO THE EXTENT THAT INFORMATION PRESENTED HEREIN RELATES TO THE PERIOD DECEMBER 1986 THROUGH JULY 2006, THE INDEX CLOSING LEVELS REFLECT THE APPLICATION OF THE INDEX’S METHODOLOGY, AND SELECTION OF DX CONTRACTS, IN HINDSIGHT.
NO HYPOTHETICAL RECORD CAN COMPLETELY ACCOUNT FOR THE IMPACT OF FINANCIAL RISK IN ACTUAL TRADING. FOR EXAMPLE, THERE ARE NUMEROUS FACTORS, INCLUDING THOSE DESCRIBED UNDER “THE RISKS YOU FACE” HEREIN, RELATED TO THE CURRENCIES MARKETS IN GENERAL OR TO THE IMPLEMENTATION OF THE FUND’S EFFORTS TO TRACK ITS INDEX OVER TIME WHICH CANNOT BE, AND HAVE NOT BEEN, ACCOUNTED FOR IN THE PREPARATION OF SUCH INDEX INFORMATION SET FORTH ON THE FOLLOWING PAGES, ALL OF WHICH CAN ADVERSELY AFFECT ACTUAL PERFORMANCE RESULTS FOR THE FUND. FURTHERMORE, THE INDEX INFORMATION DOES NOT INVOLVE FINANCIAL RISK OR ACCOUNT FOR THE IMPACT OF FEES AND COSTS ASSOCIATED WITH THE FUND.
THE MANAGING OWNER COMMENCED OPERATIONS IN JANUARY 2006. AS MANAGING OWNER, THE MANAGING OWNER AND ITS TRADING PRINCIPALS HAVE BEEN MANAGING THE DAY-TO-DAY OPERATIONS FOR THE FUNDS AND RELATED PRODUCTS AND MANAGING FUTURES TRADING ACCOUNTS. BECAUSE THERE ARE LIMITED ACTUAL TRADING RESULTS TO COMPARE TO THE INDEX CLOSING LEVELS SET FORTH HEREIN, PROSPECTIVE INVESTORS SHOULD BE PARTICULARLY WARY OF PLACING UNDUE RELIANCE ON THE ANNUAL OR CUMULATIVE INDEX RESULTS.
Please refer to notes and legends that follow on page 54.
-21-
COMPARISON OF VARIOUS US DOLLAR INDICES
(DECEMBER 31, 1986 – JUNE 30, 2010)
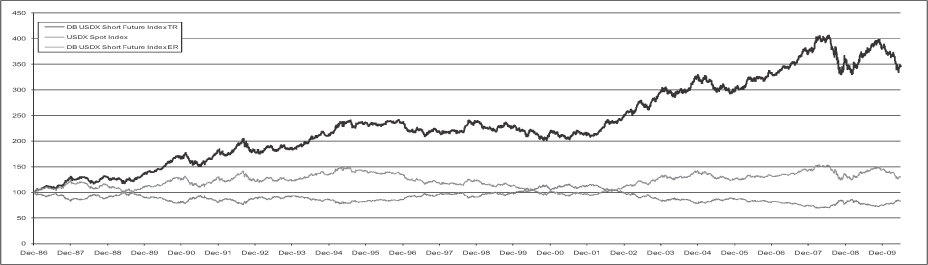
NEITHER THE PAST PERFORMANCE OF THE FUND NOR THE PRIOR INDEX LEVELS AND CHANGES, POSITIVE AND NEGATIVE, SHOULD BE TAKEN AS AN INDICATION OF THE FUND’S FUTURE PERFORMANCE.
Each of the DB Short Future-ER, DB Short Future-TR and Spot Index are indices and do not reflect actual trading or any fees or expenses.
Spot Index is calculated on an excess return basis.
WHILE THE FUND’S OBJECTIVE IS NOT TO GENERATE PROFIT THROUGH ACTIVE PORTFOLIO MANAGEMENT, BUT IS TO TRACK THE INDEX, BECAUSE THE INDEX WAS ESTABLISHED IN AUGUST 2006, CERTAIN INFORMATION RELATING TO INDEX CLOSING LEVELS MAY BE CONSIDERED TO BE “HYPOTHETICAL.” HYPOTHETICAL INFORMATION MAY HAVE CERTAIN INHERENT LIMITATIONS, SOME OF WHICH ARE DESCRIBED BELOW.
NO REPRESENTATION IS BEING MADE THAT THE INDEX WILL OR IS LIKELY TO ACHIEVE ANNUAL OR CUMULATIVE CLOSING LEVELS CONSISTENT WITH OR SIMILAR TO THOSE SET FORTH HEREIN. SIMILARLY, NO REPRESENTATION IS BEING MADE THAT THE FUND WILL GENERATE PROFITS OR LOSSES SIMILAR TO THE FUND’S PAST PERFORMANCE, WHEN AVAILABLE, OR THE HISTORICAL ANNUAL OR CUMULATIVE CHANGES IN THE INDEX CLOSING LEVELS. IN FACT, THERE ARE FREQUENTLY SHARP DIFFERENCES BETWEEN HYPOTHETICAL RESULTS AND THE ACTUAL RESULTS SUBSEQUENTLY ACHIEVED BY INVESTMENT METHODOLOGIES, WHETHER ACTIVE OR PASSIVE.
ONE OF THE LIMITATIONS OF HYPOTHETICAL INFORMATION IS THAT IT IS GENERALLY PREPARED WITH THE BENEFIT OF HINDSIGHT. TO THE EXTENT THAT INFORMATION PRESENTED HEREIN RELATES TO THE PERIOD DECEMBER 1986 THROUGH JULY 2006, THE INDEX CLOSING LEVELS REFLECT THE APPLICATION OF THE INDEX’S METHODOLOGY, AND SELECTION OF DX CONTRACTS, IN HINDSIGHT.
NO HYPOTHETICAL RECORD CAN COMPLETELY ACCOUNT FOR THE IMPACT OF FINANCIAL RISK IN ACTUAL TRADING. FOR EXAMPLE, THERE ARE NUMEROUS FACTORS, INCLUDING THOSE DESCRIBED UNDER “THE RISKS YOU FACE” HEREIN, RELATED TO THE CURRENCIES MARKETS IN GENERAL OR TO THE IMPLEMENTATION OF THE FUND’S EFFORTS TO TRACK ITS INDEX OVER TIME WHICH CANNOT BE, AND HAVE NOT BEEN, ACCOUNTED FOR IN THE PREPARATION OF SUCH INDEX INFORMATION SET FORTH ON THE FOLLOWING PAGES, ALL OF WHICH CAN ADVERSELY AFFECT ACTUAL PERFORMANCE RESULTS FOR THE FUND. FURTHERMORE, THE INDEX INFORMATION DOES NOT INVOLVE FINANCIAL RISK OR ACCOUNT FOR THE IMPACT OF FEES AND COSTS ASSOCIATED WITH THE FUND.
THE MANAGING OWNER COMMENCED OPERATIONS IN JANUARY 2006. AS MANAGING OWNER, THE MANAGING OWNER AND ITS TRADING PRINCIPALS HAVE BEEN MANAGING THE DAY-TO-DAY OPERATIONS FOR THE FUNDS AND RELATED PRODUCTS AND MANAGING FUTURES TRADING ACCOUNTS. BECAUSE THERE ARE LIMITED ACTUAL TRADING RESULTS TO COMPARE TO THE INDEX CLOSING LEVELS SET FORTH HEREIN, PROSPECTIVE INVESTORS SHOULD BE PARTICULARLY WARY OF PLACING UNDUE RELIANCE ON THE ANNUAL OR CUMULATIVE INDEX RESULTS.
| Please refer to notes and legends that follow on page 54. |
-22-
COMPARISON OF ANNUAL RETURNS OF COMPARISON OF VARIOUS US DOLLAR INDICES
(DECEMBER 31, 1986 – JUNE 30, 2010)
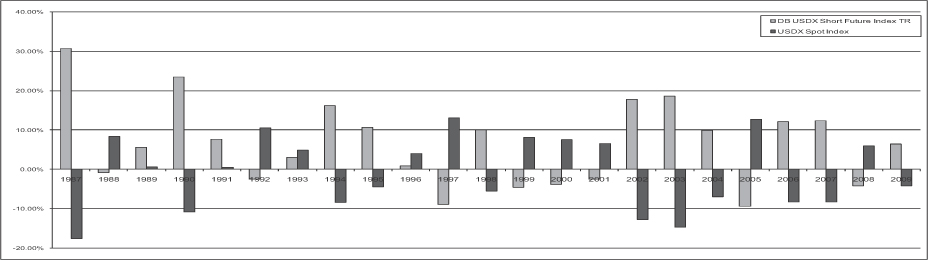
NEITHER THE PAST PERFORMANCE OF THE FUND NOR THE PRIOR INDEX LEVELS AND CHANGES, POSITIVE AND NEGATIVE, SHOULD BE TAKEN AS AN INDICATION OF THE FUND’S FUTURE PERFORMANCE.
Each of the DB Short Future-ER and Spot Index are indices and do not reflect actual trading or any fees or expenses.
Spot Index is calculated on an excess return basis.
WHILE THE FUND’S OBJECTIVE IS NOT TO GENERATE PROFIT THROUGH ACTIVE PORTFOLIO MANAGEMENT, BUT IS TO TRACK THE INDEX, BECAUSE THE INDEX WAS ESTABLISHED IN AUGUST 2006, CERTAIN INFORMATION RELATING TO INDEX CLOSING LEVELS MAY BE CONSIDERED TO BE “HYPOTHETICAL.” HYPOTHETICAL INFORMATION MAY HAVE CERTAIN INHERENT LIMITATIONS, SOME OF WHICH ARE DESCRIBED BELOW.
NO REPRESENTATION IS BEING MADE THAT THE INDEX WILL OR IS LIKELY TO ACHIEVE ANNUAL OR CUMULATIVE CLOSING LEVELS CONSISTENT WITH OR SIMILAR TO THOSE SET FORTH HEREIN. SIMILARLY, NO REPRESENTATION IS BEING MADE THAT THE FUND WILL GENERATE PROFITS OR LOSSES SIMILAR TO THE FUND’S PAST PERFORMANCE, WHEN AVAILABLE, OR THE HISTORICAL ANNUAL OR CUMULATIVE CHANGES IN THE INDEX CLOSING LEVELS. IN FACT, THERE ARE FREQUENTLY SHARP DIFFERENCES BETWEEN HYPOTHETICAL RESULTS AND THE ACTUAL RESULTS SUBSEQUENTLY ACHIEVED BY INVESTMENT METHODOLOGIES, WHETHER ACTIVE OR PASSIVE.
ONE OF THE LIMITATIONS OF HYPOTHETICAL INFORMATION IS THAT IT IS GENERALLY PREPARED WITH THE BENEFIT OF HINDSIGHT. TO THE EXTENT THAT INFORMATION PRESENTED HEREIN RELATES TO THE PERIOD DECEMBER 1986 THROUGH JULY 2006, THE INDEX CLOSING LEVELS REFLECT THE APPLICATION OF THE INDEX’S METHODOLOGY, AND SELECTION OF DX CONTRACTS, IN HINDSIGHT.
NO HYPOTHETICAL RECORD CAN COMPLETELY ACCOUNT FOR THE IMPACT OF FINANCIAL RISK IN ACTUAL TRADING. FOR EXAMPLE, THERE ARE NUMEROUS FACTORS, INCLUDING THOSE DESCRIBED UNDER “THE RISKS YOU FACE” HEREIN, RELATED TO THE CURRENCIES MARKETS IN GENERAL OR TO THE IMPLEMENTATION OF THE FUND’S EFFORTS TO TRACK ITS INDEX OVER TIME WHICH CANNOT BE, AND HAVE NOT BEEN, ACCOUNTED FOR IN THE PREPARATION OF SUCH INDEX INFORMATION SET FORTH ON THE FOLLOWING PAGES, ALL OF WHICH CAN ADVERSELY AFFECT ACTUAL PERFORMANCE RESULTS FOR THE FUND. FURTHERMORE, THE INDEX INFORMATION DOES NOT INVOLVE FINANCIAL RISK OR ACCOUNT FOR THE IMPACT OF FEES AND COSTS ASSOCIATED WITH THE FUND.
THE MANAGING OWNER COMMENCED OPERATIONS IN JANUARY 2006. AS MANAGING OWNER, THE MANAGING OWNER AND ITS TRADING PRINCIPALS HAVE BEEN MANAGING THE DAY-TO-DAY OPERATIONS FOR THE FUNDS AND RELATED PRODUCTS AND MANAGING FUTURES TRADING ACCOUNTS. BECAUSE THERE ARE LIMITED ACTUAL TRADING RESULTS TO COMPARE TO THE INDEX CLOSING LEVELS SET FORTH HEREIN, PROSPECTIVE INVESTORS SHOULD BE PARTICULARLY WARY OF PLACING UNDUE RELIANCE ON THE ANNUAL OR CUMULATIVE INDEX RESULTS.
| Please refer to notes and legends that follow on page 54. |
-23-
NOTES AND LEGENDS:
1. “High” reflects the highest closing level of the Index during the applicable year.
2. “Low” reflects the lowest closing level of the Index during the applicable year.
3. “Annual Index Changes” reflect the change to the Index level on an annual basis as of December 31 of each applicable year.
4. “Index Changes Since Inception” reflects the change of the Index level since inception on a compounded annual basis as of December 31 of each applicable year.
5. Closing levels as of Base Date of December 31, 1986.
6. Closing levels as of June 30, 2010.
7. “DB Short Future ER” is the Deutsche Bank Short US Dollar Index (USDX®) Futures Index – Excess ReturnTM with respect to the Short Index. The Deutsche Bank Short US Dollar Index (USDX®) Futures IndexTM is calculated on both an excess return basis and total return basis. The DB Short Future ER calculation is not funded and reflects the changes in market value over time, whether positive or negative, of the underlying DX Contracts. The sponsor of the Index, or the Index Sponsor, is Deutsche Bank AG London.
8. If a Fund’s interest income from its holdings of fixed income securities were to exceed the Fund’s fees and expenses, the total return on an investment in a Fund is expected to outperform the DB Short Future ER and underperform the DB Short Future TR (as such term is defined in the following footnote). The only difference between the DB Short Future ER and the DB Short Future TR is that the DB Short Future ER does not include interest income from a hypothetical basket of fixed income securities while the DB Short Future TR does include such a component. The difference in the changes in market value over time, whether positive or negative, in the DB Short Future ER and the DB Short Future TR is attributable entirely to the hypothetical interest income from this hypothetical basket of fixed income securities. If a Fund’s interest income from its holdings of fixed-income securities exceeds such Fund’s fees and expenses, then the amount of such excess is expected to be distributed periodically. The market price of the Shares is expected to track closely the DB Short Future ER. The total return on an investment in a Fund over any period is the sum of the capital appreciation or depreciation of the Shares over the period, plus the amount of any distributions during the period. Consequently, a Fund’s total return is expected to outperform the DB Short Future ER by the amount of the excess, if any, of its interest income over its fees and expenses but, as a result of such Fund’s fees and expenses, the total return on a Fund is expected to underperform the DB Short Future TR. If a Fund’s fees and expenses were to exceed such Fund’s interest income from its holdings of fixed income securities, such Fund would underperform the DB Short Future ER.
9. “DB Short Future TR” is the Deutsche Bank Short US Dollar Index (USDX®) Futures Index – Total ReturnTM with respect to the Short Index. The Deutsche Bank Short US Dollar Index (USDX®) Futures IndexTM is calculated on both an excess return basis and total return basis. The DB Short Future TR calculation is funded and reflects the changes in market value over time, whether positive or negative, of both the underlying DX Contracts and the interest income from a hypothetical basket of fixed income securities. The sponsor of the Index, or the Index Sponsor, is Deutsche Bank AG London.
10. “Spot Index” is the U.S. Dollar Index (USDX®), which provides a general indication of the international value of the USD by averaging the exchange rates between the USD and the six major world currencies the Spot Index Euro, Japanese Yen, British Pound, Canadian Dollar, Swedish Krona and Swiss Franc. The USDX® mark is a registered service mark owned by ICE Futures U.S., Inc.
11. “Annualized Changes to Index Level” reflects the changes of the applicable index on an annual basis as of December 31 of each applicable year.
12. “Average rolling 3 month daily volatility.” The daily volatility reflects the relative rate at which the price of the applicable index moves up and down, which is found by calculating the annualized standard deviation of the daily change in price. In turn, an average of this value is calculated on a 3 month rolling basis.
-24-
13. “Sharpe Ratio” compares the annualized rate of return minus the annualized risk-free rate of return to the annualized variability often referred to as the “standard deviation” – of the monthly rates of return. A Sharpe Ratio of 1:1 or higher indicates that, according to the measures used in calculating the ratio, the rate of return achieved by a particular strategy has equaled or exceeded the risks assumed by such strategy. The risk-free rate of return that was used in these calculations was assumed to be 4.98%.
14. “% of months with positive change” during the period from inception to June 30, 2010.
15. “Average monthly positive change” during the period from inception to June 30, 2010.
16. “Average monthly negative change” during the period from inception to June 30, 2010.
17. “Annualized Index Levels” reflects the change in the applicable index on an annual basis as of December 31 of each the applicable time period (e.g., 1 year, 3, 5, 7, 10 or 15 years).
18. “S&P 500 TR” is the Standard & Poor’s index calculated on a total return basis. Widely regarded as the benchmark gauge of the U.S. equities market, this index includes a representative sample of 500 leading companies in leading industries of the U.S. economy. Although the S&P 500 focuses on the large-cap segment of the market, with approximately 80% coverage of U.S. equities, it also serves as a proxy for the total market. The total return calculation provides investors with a price-plus-gross cash dividend return. Gross cash dividends are applied on the ex-date of the dividend.
19. “iBoxx US Treasuries” means the Markit iBoxx USD Treasuries index, a sub-index of the Markit iBoxx USD Overall index which covers all USD-denominated investment grade bonds.
20. “DBLCI-TR” is the Deutsche Bank Liquid Commodity IndexTM – Total Return. This Index is intended to reflect the changes in notional value in the following commodities: Light, Sweet Crude Oil, Heating Oil, Aluminum, Gold, Corn and Wheat. The notional amounts of each index commodity included in this index are broadly in proportion to historical levels of the world’s production and stocks of the index commodities. The sponsor of the Index, or the Index Sponsor, is Deutsche Bank AG London. Deutsche Bank Liquid Commodity IndexTM – Total Return is a trade mark of Deutsche Bank AG and is the subject of Community Trade Mark Number 3054996. Trade Mark applications in the United States are pending.
21. “NAR Existing One Family Home Sales Median Price Index” is one component of The National Association Of Realtors® Existing-Home Sales Series, which is the premier measurement of national and regional residential real estate market. On or about the 25th of each month, NAR releases statistics on sales and prices of existing single-family homes for the nation and the four regions. These figures include condos and co-ops, in addition to single-family homes. NAR Existing One Family Home Sales Median Price Index reflects current sales rates, actual totals and median prices by month going back 12 months. Annual totals cover a period of three years, which includes all existing-home sales – single-family, condos and co-ops – rolled into monthly and annual totals.
22. “Correlation of Monthly Returns.” Every investment asset, by definition, has a correlation coefficient of 1.0 with itself; 1.0 indicates 100% positive correlation. Two investments that always move in the opposite direction from each other have a correlation coefficient of -1.0; -1.0 indicates 100% negative correlation. Two investments that perform entirely independently of each other have a correlation coefficient of 0; 0 indicates 100% non-correlation. December 31, 1988 was used as the start date with respect to the underlying data because closing levels with respect to DBLCI-TR was not available prior to December 31, 1988.
WHILE THE FUND’S OBJECTIVE IS NOT TO GENERATE PROFIT THROUGH ACTIVE PORTFOLIO MANAGEMENT, BUT IS TO TRACK THE INDEX, BECAUSE THE INDEX WAS ESTABLISHED IN AUGUST 2006, CERTAIN INFORMATION RELATING TO INDEX CLOSING LEVELS MAY BE CONSIDERED TO BE “HYPOTHETICAL.” HYPOTHETICAL INFORMATION MAY HAVE CERTAIN INHERENT LIMITATIONS, SOME OF WHICH ARE DESCRIBED BELOW.
-25-
NO REPRESENTATION IS BEING MADE THAT THE INDEX WILL OR IS LIKELY TO ACHIEVE ANNUAL OR CUMULATIVE CLOSING LEVELS CONSISTENT WITH OR SIMILAR TO THOSE SET FORTH HEREIN. SIMILARLY, NO REPRESENTATION IS BEING MADE THAT THE FUND WILL GENERATE PROFITS OR LOSSES SIMILAR TO THE FUND’S PAST PERFORMANCE, WHEN AVAILABLE, OR THE HISTORICAL ANNUAL OR CUMULATIVE CHANGES IN THE INDEX CLOSING LEVELS. IN FACT, THERE ARE FREQUENTLY SHARP DIFFERENCES BETWEEN HYPOTHETICAL RESULTS AND THE ACTUAL RESULTS SUBSEQUENTLY ACHIEVED BY INVESTMENT METHODOLOGIES, WHETHER ACTIVE OR PASSIVE.
ONE OF THE LIMITATIONS OF HYPOTHETICAL INFORMATION IS THAT IT IS GENERALLY PREPARED WITH THE BENEFIT OF HINDSIGHT. TO THE EXTENT THAT INFORMATION PRESENTED HEREIN RELATES TO THE PERIOD DECEMBER 1986 THROUGH JULY 2006, THE INDEX CLOSING LEVELS REFLECT THE APPLICATION OF THE INDEX’S METHODOLOGY, AND SELECTION OF DX CONTRACTS, IN HINDSIGHT.
NO HYPOTHETICAL RECORD CAN COMPLETELY ACCOUNT FOR THE IMPACT OF FINANCIAL RISK IN ACTUAL TRADING. FOR EXAMPLE, THERE ARE NUMEROUS FACTORS, INCLUDING THOSE DESCRIBED UNDER “THE RISKS YOU FACE” HEREIN, RELATED TO THE CURRENCIES MARKETS IN GENERAL OR TO THE IMPLEMENTATION OF THE FUND’S EFFORTS TO TRACK ITS INDEX OVER TIME WHICH CANNOT BE, AND HAVE NOT BEEN, ACCOUNTED FOR IN THE PREPARATION OF SUCH INDEX INFORMATION SET FORTH ON THE FOLLOWING PAGES, ALL OF WHICH CAN ADVERSELY AFFECT ACTUAL PERFORMANCE RESULTS FOR THE FUND. FURTHERMORE, THE INDEX INFORMATION DOES NOT INVOLVE FINANCIAL RISK OR ACCOUNT FOR THE IMPACT OF FEES AND COSTS ASSOCIATED WITH THE FUND.
THE MANAGING OWNER COMMENCED OPERATIONS IN JANUARY 2006. AS MANAGING OWNER, THE MANAGING OWNER AND ITS TRADING PRINCIPALS HAVE BEEN MANAGING THE DAY-TO-DAY OPERATIONS FOR THE FUNDS AND RELATED PRODUCTS AND MANAGING FUTURES TRADING ACCOUNTS. BECAUSE THERE ARE LIMITED ACTUAL TRADING RESULTS TO COMPARE TO THE INDEX CLOSING LEVELS SET FORTH HEREIN, PROSPECTIVE INVESTORS SHOULD BE PARTICULARLY WARY OF PLACING UNDUE RELIANCE ON THE ANNUAL OR CUMULATIVE INDEX RESULTS.
ALTHOUGH THE INDEX SPONSOR WILL OBTAIN INFORMATION FOR INCLUSION IN OR FOR USE IN THE CALCULATION OF THE INDEX FROM SOURCE(S) WHICH THE INDEX SPONSOR CONSIDERS RELIABLE, THE INDEX SPONSOR WILL NOT INDEPENDENTLY VERIFY SUCH INFORMATION AND DOES NOT GUARANTEE THE ACCURACY AND/OR THE COMPLETENESS OF THE INDEX OR ANY DATA INCLUDED THEREIN. THE INDEX SPONSOR SHALL NOT BE LIABLE (WHETHER IN NEGLIGENCE OR OTHERWISE) TO ANY PERSON FOR ANY ERROR IN THE INDEX AND THE INDEX SPONSOR IS UNDER NO OBLIGATION TO ADVISE ANY PERSON OF ANY ERROR THEREIN.
UNLESS OTHERWISE SPECIFIED, NO TRANSACTION RELATING TO THE INDEX IS SPONSORED, ENDORSED, SOLD OR PROMOTED BY THE INDEX SPONSOR AND THE INDEX SPONSOR MAKES NO EXPRESS OR IMPLIED REPRESENTATIONS OR WARRANTIES AS TO (A) THE ADVISABILITY OF PURCHASING OR ASSUMING ANY RISK IN CONNECTION WITH ANY SUCH TRANSACTION (B) THE LEVELS AT WHICH THE INDEX STANDS AT ANY PARTICULAR TIME ON ANY PARTICULAR DATE (C) THE RESULTS TO BE OBTAINED BY THE ISSUER OF ANY SECURITY OR ANY COUNTERPARTY OR ANY SUCH ISSUER’S SECURITY HOLDERS OR CUSTOMERS OR ANY SUCH COUNTERPARTY’S CUSTOMERS OR COUNTERPARTIES OR ANY OTHER PERSON OR ENTITY FROM THE USE OF THE INDEX OR ANY DATA INCLUDED THEREIN IN CONNECTION WITH ANY LICENSED RIGHTS OR FOR ANY OTHER USE OR (D) ANY OTHER MATTER. THE INDEX SPONSOR MAKES NO EXPRESS OR IMPLIED REPRESENTATIONS OR WARRANTIES OF MERCHANTABILITY OR FITNESS FOR A PARTICULAR PURPOSE WITH RESPECT TO THE INDEX OR ANY DATA INCLUDED THEREIN.
WITHOUT LIMITING ANY OF THE FOREGOING, IN NO EVENT SHALL THE INDEX SPONSOR HAVE ANY LIABILITY (WHETHER IN NEGLIGENCE OR OTHERWISE) TO ANY PERSON FOR ANY DIRECT, INDIRECT, SPECIAL, PUNITIVE, CONSEQUENTIAL OR ANY OTHER DAMAGES (INCLUDING LOST PROFITS) EVEN IF NOTIFIED OF THE POSSIBILITY OF SUCH DAMAGES.
-26-
PERFORMANCE OF COMMODITY POOLS OPERATED BY
THE MANAGING OWNER AND ITS AFFILIATES
General
The performance information included herein is presented in accordance with CFTC regulations. Both the Bullish Fund and the Bearish Fund differ materially in certain respects from the following pools’ performance which are included herein. The following sets forth summary performance information for all pools operated by the Managing Owner (other than the Bullish Fund and the Bearish Fund).
The below pools, the performance of which are summarized herein, are materially different in certain respects from both the Bullish Fund and the Bearish Fund and the past performance summary of such pools are generally not representative of how the Bullish Fund and the Bearish Fund might perform in the future. These pools also have material differences from the Bullish Fund and the Bearish Fund, such as different investment objectives and strategies, leverage, employment of short in addition to long positions and fee structures, among other variations. The performance record of these pools may give some general indication of the Managing Owner’s capabilities by indicating the past performance of other pools sponsored by the Managing Owner.
All summary performance information is current as of June 30, 2010. Performance information is set forth, in accordance with CFTC Regulations, since (i) January 31, 2006 (inception with respect to PowerShares DB Commodity Index Tracking Fund (DBC)), (ii) September 18, 2006 (inception with respect to PowerShares DB G10 Currency Harvest Fund (DBV)), and (iii) January 5, 2007 (inception with respect to each of PowerShares DB Energy Fund (DBE), PowerShares DB Oil Fund (DBO), PowerShares DB Precious Metals Fund (DBP), PowerShares DB Gold Fund (DGL), PowerShares DB Silver Fund (DBS), PowerShares DB Base Metals Fund (DBB) and PowerShares DB Agriculture Fund (DBA)). CFTC Regulations require inclusion of only performance information within the five most recent calendar years and year-to-date, or, if inception of the pool has been less than five years and year-to-date, then since inception.
PAST PERFORMANCE IS NOT NECESSARILY INDICATIVE OF FUTURE RESULTS, AND MATERIAL DIFFERENCES EXIST AMONG THE BULLISH FUND, THE BEARISH FUND AND THE POOLS WHOSE PERFORMANCE ARE SUMMARIZED HEREIN.
INVESTORS SHOULD NOTE THAT INTEREST INCOME MAY CONSTITUTE A SIGNIFICANT PORTION OF A COMMODITY POOL’S INCOME AND, IN CERTAIN INSTANCES, MAY GENERATE PROFITS WHERE THERE HAVE BEEN REALIZED AND UNREALIZED LOSSES FROM COMMODITY TRADING.
PERFORMANCE OF POWERSHARES DB COMMODITY INDEX TRACKING FUND(TICKER: DBC)
Name of Pool:PowerShares DB Commodity Index Tracking Fund
Type of Pool: Public, Exchange-Listed Commodity Pool
Inception of Trading: February 2006
Aggregate Gross Capital Subscriptions as of June 30, 2010:$6,259,318,286
Net Asset Value as of June 30, 2010:$4,310,326,827
Net Asset Value per Share as of June 30, 2010:$21.68
Worst Monthly Drawdown: (23.77)% October 2008
Worst Peak-to-Valley Drawdown:(57.34)% June 2008 – February 2009*
| Monthly Rate of Return | 2010(%) | 2009(%) | 2008(%) | 2007(%) | 2006(%) | |||||
January | (7.64) | (5.18) | 3.24 | (2.36) | — | |||||
February | 3.61 | (5.61) | 11.21 | 5.30 | (4.66) | |||||
March | 0.03 | 5.32 | (0.61) | 0.67 | 3.63 | |||||
April | 3.61 | (1.54) | 4.46 | 0.55 | 6.51 | |||||
May | (10.35) | 16.50 | 8.32 | (0.51) | (0.42) | |||||
June | (1.09) | (3.02) | 10.64 | 1.22 | (0.29) | |||||
July | 2.58 | (10.61) | 1.94 | 1.65 | ||||||
August | (3.39) | (5.97) | (2.21) | (2.71) | ||||||
September | (0.31) | (11.01) | 8.58 | (4.54) | ||||||
October | 6.17 | (23.77) | 8.58 | 1.21 | ||||||
November | 4.65 | (10.38) | 0.26 | 6.40 | ||||||
December | (0.03) | (6.71) ** | 3.76*** | (4.70)**** | ||||||
Compound Rate of Return | (12.05)% (6 months) | 15.08% | (31.91)% | 28.15% | 1.23% (11 months) |
| * | The Worst Peak-to-Valley Drawdown from June 2008 – February 2009 includes the effect of the $0.34 per Share distribution made to Shareholders of record as of December 17, 2008. Please see Footnote **. |
| ** | The December 2008 return of (6.71)% includes the $0.34 per Share distribution made to Shareholders of record as of December 17, 2008. Prior to the December 30, 2008 distribution, the pool’s return for December 2008 was (5.23)%. |
| *** | The December 2007 return of 3.76% includes the $0.76 per Share distribution made to Shareholders of record as of December 19, 2007. Prior to the December 28, 2007 distribution, the pool’s return for December 2007 was 6.23%. |
| **** | The December 2006 return of (4.70)% includes the $0.61 per Share distribution made to Shareholders of record as of December 20, 2006. Prior to the December 29, 2006 distribution, the pool’s return for December 2006 was (2.33)%. |
| ***** | As of October 19, 2009, the Fund commenced tracking the Deutsche Bank Liquid Commodity Index–Optimum Yield Diversified Excess Return™. Prior to October 19, 2009, the Fund tracked the Deutsche Bank Liquid Commodity Index–Optimum Yield Excess Return™. |
PAST PERFORMANCE IS NOT NECESSARILY INDICATIVE OF FUTURE RESULTS.
See accompanying Footnotes to Performance Information on page 62.
-27-
PERFORMANCE OF POWERSHARES DB G10 CURRENCY HARVEST FUND (TICKER: DBV)
Name of Pool:PowerShares DB G10 Currency Harvest Fund
Type of Pool:Public, Exchange-Listed Commodity Pool
Inception of Trading:September 2006
Aggregate Gross Capital Subscriptions as of June 30, 2010:$885,368,884
Net Asset Value as of June 30, 2010:$368,601,372
Net Asset Value per Share as of June 30, 2010:$21.94
Worst Monthly Drawdown:(14.37)% October 2008
Worst Peak-to-Valley Drawdown:(36.85)% October 2007 – January 2009*
| Monthly Rate of Return | 2010(%) | 2009(%) | 2008(%) | 2007(%) | 2006(%) | |||||
January | (2.30) | (5.33) | (1.31) | 1.01 | — | |||||
February | 0.35 | 3.09 | (0.96) | 0.65 | — | |||||
March | 2.30 | 7.62 | (4.00) | 2.47 | — | |||||
April | 2.47 | 0.39 | 4.28 | 2.27 | — | |||||
May | (6.72) | 2.72 | 1.34 | 2.14 | — | |||||
June | (2.71) | 1.66 | (0.70) | 3.09 | — | |||||
July | 2.56 | (0.04) | (0.97) | — | ||||||
August | 1.36 | (4.01) | (3.94) | — | ||||||
September | 3.00 | (5.84) | 2.79 | (0.24) | ||||||
October | 0.61 | (14.37) | 3.10 | 1.92 | ||||||
November | (1.30) | (3.21) | (3.76) | (1.30) | ||||||
December | 3.02 | (3.42)** | (2.67)*** | 2.99**** | ||||||
Compound Rate of Return | (6.72)% (6 months) | 20.62% | (28.78)% | 5.96% | 3.36% (3 1/2 months) |
| * | The Worst Peak-to-Valley Drawdown from October 2007 – January 2009 includes the effect of the $0.80 per Share distribution made to Shareholders of record as of December 19, 2007, and the effect of the $0.27 per Share distribution made to Shareholders of record as of December 17, 2008. Please see Footnotes ** and ***. |
| ** | The December 2008 return of (3.42)% includes the $0.27 per Share distribution made to Shareholders of record as of December 17, 2008. Prior to the December 30, 2008 distribution, the pool’s return for December 2008 was (2.08)%. |
| *** | The December 2007 return of (2.67)% includes the $0.80 per Share distribution made to Shareholders of record as of December 19, 2007. Prior to the December 28, 2007 distribution, the pool’s return for December 2007 was 0.14%. |
| **** | The December 2006 return of 2.99% includes the $0.06 per Share distribution made to Shareholders of record as of December 20, 2006. Prior to the December 29, 2006 distribution, the pool’s return for December 2006 was 3.23%. |
PAST PERFORMANCE IS NOT NECESSARILY INDICATIVE OF FUTURE RESULTS.
PERFORMANCE OF POWERSHARES DB ENERGY FUND (TICKER: DBE), A SERIES OF
POWERSHARES DB MULTI-SECTOR COMMODITY TRUST
Name of Pool: PowerShares DB Energy Fund
Type of Pool: Public, Exchange-Listed Commodity Pool
Inception of Trading: January 2007
Aggregate Gross Capital Subscriptions as of June 30, 2010:$587,832,576
Net Asset Value as of June 30, 2010:$334,686,784
Net Asset Value per Share as of June 30, 2010:$23.24
Worst Monthly Drawdown: (28.36)% October 2008
Worst Peak-to-Valley Drawdown: (66.18)% June 2008 – February 2009*
| Monthly Rate of Return | 2010(%) | 2009(%) | 2008(%) | 2007(%) | ||||
January | (8.46) | (6.19) | (1.17) | 0.08 | ||||
February | 5.54 | (5.93) | 10.62 | 5.80 | ||||
March | 2.88 | 5.71 | 1.35 | 5.33 | ||||
April | 5.48 | (1.34) | 10.21 | 0.86 | ||||
May | (14.15) | 22.99 | 14.95 | (0.92) | ||||
June | (0.73) | 3.14 | 10.15 | 3.41 | ||||
July | 2.26 | (12.21) | 2.26 | |||||
August | (3.50) | (6.72) | (4.07) | |||||
September | (0.96) | (11.32) | 7.78 | |||||
October | 7.99 | (28.36) | 12.90 | |||||
November | 1.68 | (14.60) | (2.56) | |||||
December | (0.39) | (13.74)** | 4.95*** | |||||
Compound Rate of Return | (10.65)% (6 months) | 24.81% | (40.74)% | 40.68% |
| * | The Worst Peak-to-Valley Drawdown from June 2008 – February 2009 includes the effect of the $0.44 per Share distribution made to Shareholders of record as of December 17, 2008. Please see Footnote **. |
| ** | The December 2008 return of (13.74)% includes the $0.44 per Share distribution made to Shareholders of record as of December 17, 2008. Prior to the December 30, 2008 distribution, the pool’s return for December 2008 was (11.92)%. |
| *** | The December 2007 return of 4.95% includes the $0.90 per Share distribution made to Shareholders of record as of December 19, 2007. Prior to the December 28, 2007 distribution, the pool’s return for December 2007 was 7.64%. |
PAST PERFORMANCE IS NOT NECESSARILY INDICATIVE OF FUTURE RESULTS.
See accompanying Footnotes to Performance Information on page 62.
-28-
PERFORMANCE OF POWERSHARES DB OIL FUND (TICKER: DBO), A SERIES OF POWERSHARES
DB MULTI-SECTOR COMMODITY TRUST
Name of Pool:PowerShares DB Oil Fund
Type of Pool:Public, Exchange-Listed Commodity Pool
Inception of Trading:January 2007
Aggregate Gross Capital Subscriptions as of June 30, 2010:$803,275,734
Net Asset Value as of June 30, 2010:$497,024,530
Net Asset Value per Share as of June 30, 2010:$23.90
Worst Monthly Drawdown:(29.20)% October 2008
Worst Peak-to-Valley Drawdown:(65.43)% June 2008 – February 2009*
| Monthly Rate of Return | 2010(%) | 2009(%) | 2008(%) | 2007(%) | ||||
January | (8.65) | (5.87) | (3.00) | (2.08) | ||||
February | 7.48 | (4.30) | 10.99 | 6.13 | ||||
March | 4.76 | 7.88 | 0.30 | 4.77 | ||||
April | 4.46 | (1.12) | 12.33 | (2.20) | ||||
May | (16.47) | 26.94 | 12.65 | (2.48) | ||||
June | (3.20) | 1.94 | 11.73 | 4.58 | ||||
July | 3.09 | (11.24) | 2.65 | |||||
August | (3.12) | (5.82) | (4.20) | |||||
September | (1.07) | (12.79) | 9.59 | |||||
October | 8.27 | (29.20) | 15.62 | |||||
November | 2.94 | (15.73) | (2.39) | |||||
December | (0.95) | (11.79)** | 4.85*** | |||||
Compound Rate of Return | (13.12)% (6 months) | 35.65% | (41.42)% | 38.48% |
| * | The Worst Peak-to-Valley Drawdown from June 2008 – February 2009 includes the effect of the $0.12 per Share distribution made to Shareholders of record as of December 17, 2008. Please see Footnote **. |
| ** | The December 2008 return of (11.79)% includes the $0.12 per Share distribution made to Shareholders of record as of December 17, 2008. Prior to the December 30, 2008 distribution, the pool’s return for December 2008 was (11.27)%. |
| *** | The December 2007 return of 4.85% includes the $1.28 per Share distribution made to Shareholders of record as of December 19, 2007. Prior to the December 28, 2007 distribution, the pool’s return for December 2007 was 7.93%. |
PAST PERFORMANCE IS NOT NECESSARILY INDICATIVE OF FUTURE RESULTS.
PERFORMANCE OF POWERSHARES DB PRECIOUS METALS FUND (TICKER: DBP), A SERIES OF
POWERSHARES DB MULTI-SECTOR COMMODITY TRUST
Name of Pool:PowerShares DB Precious Metals Fund
Type of Pool:Public, Exchange-Listed Commodity Pool
Inception of Trading:January 2007
Aggregate Gross Capital Subscriptions as of June 30, 2010:$424,452,498
Net Asset Value as of June 30, 2010:$279,196,361
Net Asset Value per Share as of June 30, 2010:$42.30
Worst Monthly Drawdown:(18.43)% October 2008
Worst Peak-to-Valley Drawdown:(31.88)% February 2008 – October 2008
| Monthly Rate of Return | 2010(%) | 2009(%) | 2008(%) | 2007(%) | ||||
January | (1.83) | 6.02 | 10.18 | 4.04 | ||||
February | 2.92 | 1.97 | 7.34 | 2.77 | ||||
March | 0.68 | (1.84) | (7.24) | (1.87) | ||||
April | 5.93 | (3.99) | (5.36) | 2.10 | ||||
May | 2.01 | 12.91 | 2.30 | (2.43) | ||||
June | 2.27 | (7.08) | 3.99 | (3.14) | ||||
July | 2.61 | (0.88) | 2.96 | |||||
August | 1.17 | (12.05) | (0.77) | |||||
September | 7.00 | 2.59 | 16.86 | |||||
October | 1.73 | (18.43) | (5.36) | |||||
November | 13.44 | 11.56 | 3.95 | |||||
December | (7.62) | 6.94* | 4.04** | |||||
Compound Rate of Return | 12.41% (6 months) | 26.57% | (3.88)% | 23.72% |
| * | The December 2008 return of 6.94% includes the $0.27 per Share distribution made to Shareholders of record as of December 17, 2008. Prior to the December 30, 2008 distribution, the pool’s return for December 2008 was 7.91%. |
| ** | The December 2007 return of 4.04% includes the $0.60 per Share distribution made to Shareholders of record as of December 19, 2007. Prior to the December 28, 2007 distribution, the pool’s return for December 2007 was 5.58%. |
PAST PERFORMANCE IS NOT NECESSARILY INDICATIVE OF FUTURE RESULTS.
See accompanying Footnotes to Performance Information on page 62.
-29-
PERFORMANCE OF POWERSHARES DB GOLD FUND (TICKER: DGL), A SERIES OF
POWERSHARES DB MULTI-SECTOR COMMODITY TRUST
Name of Pool:PowerShares DB Gold Fund
Type of Pool:Public, Exchange-Listed Commodity Pool
Inception of Trading:January 2007
Aggregate Gross Capital Subscriptions as of June 30, 2010:$343,444,552
Net Asset Value as of June 30, 2010:$239,404,174
Net Asset Value per Share as of June 30, 2010:$44.33
Worst Monthly Drawdown:(18.06)% October 2008
Worst Peak-to-Valley Drawdown:(26.80)% February 2008 – October 2008
| Monthly Rate of Return | 2010(%) | 2009(%) | 2008(%) | 2007(%) | ||||
January | (1.30) | 4.85 | 9.67 | 3.44 | ||||
February | 3.15 | 1.48 | 5.14 | 2.44 | ||||
March | (0.56) | (2.07) | (5.77) | (1.02) | ||||
April | 5.89 | (3.64) | (5.92) | 2.86 | ||||
May | 2.79 | 9.53 | 2.54 | (2.93) | ||||
June | 2.45 | (5.40) | 4.17 | (1.99) | ||||
July | 2.69 | (1.48) | 2.61 | |||||
August | (0.26) | (9.22) | 0.68 | |||||
September | 5.75 | 5.49 | 9.81 | |||||
October | 3.01 | (18.06) | 6.01 | |||||
November | 13.39 | 13.29 | (1.26) | |||||
December | (7.27) | 6.66* | 3.54** | |||||
Compound Rate of Return | 12.89% (6 months) | 22.03% | 2.00% | 26.20% |
| * | The December 2008 return of 6.66% includes the $0.26 per Share distribution made to Shareholders of record as of December 17, 2008. Prior to the December 30, 2008 distribution, the pool’s return for December 2008 was 7.52%. |
| ** | The December 2007 return of 3.54% includes the $0.81 per Share distribution made to Shareholders of record as of December 19, 2007. Prior to the December 28, 2007 distribution, the pool’s return for December 2007 was 5.84%. |
PAST PERFORMANCE IS NOT NECESSARILY INDICATIVE OF FUTURE RESULTS.
PERFORMANCE OF POWERSHARES DB SILVER FUND (TICKER: DBS), A SERIES OF
POWERSHARES DB MULTI-SECTOR COMMODITY TRUST
Name of Pool:PowerShares DB Silver Fund
Type of Pool:Public, Exchange-Listed Commodity Pool
Inception of Trading:January 2007
Aggregate Gross Capital Subscriptions as of June 30, 2010:$190,497,818
Net Asset Value as of June 30, 2010:$66,336,184
Net Asset Value per Share as of June 30, 2010:$33.17
Worst Monthly Drawdown:(23.42)% August 2008
Worst Peak-to-Valley Drawdown:(51.35)% February 2008 – October 2008
| Monthly Rate of Return | 2010(%) | 2009(%) | 2008(%) | 2007(%) | ||||
January | (4.06) | 11.40 | 12.83 | 6.48 | ||||
February | 1.91 | 4.16 | 16.53 | 4.13 | ||||
March | 6.15 | (0.89) | (12.95) | (4.91) | ||||
April | 6.20 | (5.23) | (4.05) | 0.49 | ||||
May | (1.11) | 26.80 | 1.67 | (0.26) | ||||
June | 1.38 | (13.00) | 3.41 | (7.80) | ||||
July | 2.46 | 1.68 | 4.60 | |||||
August | 6.73 | (23.42) | (6.71) | |||||
September | 11.63 | (10.23) | 13.76 | |||||
October | (2.45) | (20.75) | 3.92 | |||||
November | 13.71 | 4.72 | (2.92) | |||||
December | (9.03) | 8.74* | 2.02** | |||||
Compound Rate of Return | 10.49% (6 months) | 48.10% | (27.16)% | 11.32% |
| * | The December 2008 return of 8.74% includes the $0.22 per Share distribution made to Shareholders of record as of December 17, 2008. Prior to the December 30, 2008 distribution, the pool’s return for December 2008 was 9.92%. |
| ** | The December 2007 return of 2.02% includes the $0.87 per Share distribution made to Shareholders of record as of December 19, 2007. Prior to the December 28, 2007 distribution, the pool’s return for December 2007 was 5.24%. |
PAST PERFORMANCE IS NOT NECESSARILY INDICATIVE OF FUTURE RESULTS.
See accompanying Footnotes to Performance Information on page 62.
-30-
PERFORMANCE OF POWERSHARES DB BASE METALS FUND (TICKER: DBB), A SERIES OF
POWERSHARES DB MULTI-SECTOR COMMODITY TRUST
Name of Pool:PowerShares DB Base Metals Fund
Type of Pool:Public, Exchange-Listed Commodity Pool
Inception of Trading:January 2007
Aggregate Gross Capital Subscriptions as of June 30, 2010:$776,478,594
Net Asset Value as of June 30, 2010:$319,884,150
Net Asset Value per Share as of June 30, 2010:$18.18
Worst Monthly Drawdown:(27.29)% October 2008
Worst Peak-to-Valley Drawdown:(60.29)% July 2007 – January 2009*
| Monthly Rate of Return | 2010(%) | 2009(%) | 2008(%) | 2007(%) | ||||
January | (11.50) | (7.37) | 8.82 | (5.84) | ||||
February | 4.12 | 3.71 | 12.16 | 3.70 | ||||
March | 8.17 | 12.99 | (5.59) | 1.88 | ||||
April | (4.12) | 6.48 | (0.87) | 10.74 | ||||
May | (10.43) | 6.30 | (4.54) | (2.40) | ||||
June | (5.71) | 3.07 | 3.92 | (1.19) | ||||
July | 13.82 | (4.21) | 4.86 | |||||
August | 7.55 | (6.74) | (7.61) | |||||
September | (0.43) | (11.14) | 2.37 | |||||
October | 5.97 | (27.29) | (2.43) | |||||
November | 6.81 | (6.46) | (5.95) | |||||
December | 7.98 | (11.29)** | (8.98)*** | |||||
Compound Rate of Return | (19.29)% (6 months) | 88.64% | (45.73)% | (12.00)% |
| * | The Worst Peak-to-Valley Drawdown from July 2007 – January 2009 includes the effect of the $0.96 per Share distribution made to Shareholders of record as of December 19, 2007, and the effect of the $0.28 per Share distribution made to Shareholders of record as of December 17, 2008. Please see Footnotes ** and ***. |
| ** | The December 2008 return of (11.29)% includes the $0.28 per Share distribution made to Shareholders of record as of December 17, 2008. Prior to the December 30, 2008 distribution, the pool’s return for December 2008 was (9.21)%. |
| *** | The December 2007 return of (8.98)% includes the $0.96 per Share distribution made to Shareholders of record as of December 19, 2007. Prior to the December 28, 2007 distribution, the pool’s return for December 2007 was (5.01)%. |
PAST PERFORMANCE IS NOT NECESSARILY INDICATIVE OF FUTURE RESULTS.
PERFORMANCE OF POWERSHARES DB AGRICULTURE FUND (TICKER: DBA), A SERIES OF
POWERSHARES DB MULTI-SECTOR COMMODITY TRUST
Name of Pool:PowerShares DB Agriculture Fund
Type of Pool:Public, Exchange-Listed Commodity Pool
Inception of Trading:January 2007
Aggregate Gross Capital Subscriptions as of June 30, 2010:$5,528,262,022
Net Asset Value as of June 30, 2010:$1,846,890,647
Net Asset Value per Share as of June 30, 2010:$23.99
Worst Monthly Drawdown:(14.74)% September 2008
Worst Peak-to-Valley Drawdown:(43.49)% February 2008 – February 2009*
| Monthly Rate of Return | 2010(%) | 2009(%) | 2008(%) | 2007(%) | ||||
January | (3.81) | (3.62) | 12.47 | 3.44 | ||||
February | (0.13) | (5.88) | 12.90 | 3.91 | ||||
March | (4.56) | 3.74 | (12.43) | (5.81) | ||||
April | 2.62 | 2.58 | 0.27 | (1.94) | ||||
May | (5.34) | 11.50 | (1.56) | 5.84 | ||||
June | 1.94 | (9.17) | 13.41 | (0.04) | ||||
July | (0.55) | (10.36) | (0.50) | |||||
August | 3.69 | (3.28) | 2.07 | |||||
September | (2.03) | (14.74) | 10.20 | |||||
October | 0.43 | (14.44) | (0.17) | |||||
November | 3.07 | (4.41) | 4.94 | |||||
December | (0.38) | 5.10** | 6.56*** | |||||
Compound Rate of Return | (9.23)% (6 months) | 1.85% | (20.91)% | 31.24% |
| * | The Worst Peak-to-Valley Drawdown from February 2008 – February 2009 includes the effect of the $0.45 per Share distribution made to Shareholders of record as of December 17, 2008. Please see Footnote **. |
| ** | The December 2008 return of 5.10% includes the $0.45 per Share distribution made to Shareholders of record as of December 17, 2008. Prior to the December 30, 2008 distribution, the pool’s return for December 2008 was 6.93%. |
| *** | The December 2007 return of 6.56% includes the $0.45 per Share distribution made to Shareholders of record as of December 19, 2007. Prior to the December 28, 2007 distribution, the pool’s return for December 2007 was 7.89%. |
| **** | As of October 19, 2009, the Fund commenced tracking the Deutsche Bank Liquid Commodity Index Diversified Agriculture Excess Return™. Prior to October 19, 2009, the Fund tracked the Deutsche Bank Liquid Commodity Index–Optimum Yield Agriculture Excess Return™. |
PAST PERFORMANCE IS NOT NECESSARILY INDICATIVE OF FUTURE RESULTS.
See accompanying Footnotes to Performance Information on page 63.
-31-
Footnotes to Performance Information
1. “Aggregate Gross Capital Subscriptions” is the aggregate of all amounts ever contributed to the relevant pool, including investors who subsequently redeemed their investments.
2. “Net Asset Value” is the net asset value of each pool as of June 30, 2010.
3. “Net Asset Value per Share” is the Net Asset Value of the relevant pool divided by the total number of Shares outstanding with respect to such pool as of June 30, 2010.
4. “Worst Monthly Drawdown” is the largest single month loss sustained since inception of trading. “Drawdown” as used in this section of the prospectus means losses experienced by the relevant pool over the specified period and is calculated on a rate of return basis, i.e., dividing net performance by beginning equity. “Drawdown” is measured on the basis of monthly returns only, and does not reflect intra-month figures. “Month” is the month of the Worst Monthly Drawdown.
5. “Worst Peak-to-Valley Drawdown” is the largest percentage decline in the Net Asset Value per Share over the history of the relevant pool. This need not be a continuous decline, but can be a series of positive and negative returns where the negative returns are larger than the positive returns. “Worst Peak-to-Valley Drawdown” represents the greatest percentage decline from any month-end Net Asset Value per Share that occurs without such month-end Net Asset Value per Share being equaled or exceeded as of a subsequent month-end. For example, if the Net Asset Value per Share of a particular pool declined by $1 in each of January and February, increased by $1 in March and declined again by $2 in April, a “peak-to-valley drawdown” analysis conducted as of the end of April would consider that “drawdown” to be still continuing and to be $3 in amount, whereas if the Net Asset Value per Share had increased by $2 in March, the January-February drawdown would have ended as of the end of February at the $2 level.
6. “Compound Rate of Return” is calculated by multiplying on a compound basis each of the monthly rates of return set forth in the respective charts above and not by adding or averaging such monthly rates of return. For periods of less than one year, the results are year-to-date.
[Remainder of page left blank intentionally.]”
-32-