Filed Pursuant to Rule 424(b)(3)
Registration Nos. 333-163552
333-163552-04
333-163552-05
POWERSHARES DB US DOLLAR INDEX TRUST
POWERSHARES DB US DOLLAR INDEX BULLISH FUND
POWERSHARES DB US DOLLAR INDEX BEARISH FUND
SUPPLEMENT DATED JULY 31, 2011 TO
PROSPECTUS DATED JANUARY 3, 2011
This Supplement updates certain information contained in the Prospectus dated January 3, 2011, as supplemented from time-to-time (the “Prospectus”), of PowerShares DB US Dollar Index Trust (the “Trust”), PowerShares DB US Dollar Index Bullish Fund and PowerShares DB US Dollar Index Bearish Fund (collectively, the “Funds”). All capitalized terms used in this Supplement have the same meaning as in the Prospectus.
Prospective investors in the Fund should review carefully the contents of both this Supplement and the Prospectus.
* * * * * * * * * * * * * * * * * * *
All information in the Prospectus is restated pursuant to this Supplement, except as updated hereby.
Neither the Securities and Exchange Commission nor any state securities commission
has approved or disapproved of these securities or determined if this Prospectus is
truthful or complete. Any representation to the contrary is a criminal offense.
THE COMMODITY FUTURES TRADING COMMISSION HAS NOT PASSED UPON THE
MERITS OF PARTICIPATING IN THIS POOL NOR HAS THE COMMISSION PASSED UPON
THE ADEQUACY OR ACCURACY OF THIS DISCLOSURE DOCUMENT.
DB COMMODITY SERVICES LLC
Managing Owner
-1-
| I. | Risk Factor (13) on page 20 of the Prospectus is hereby deleted and replaced, in its entirety, with the following: |
“(13) Unusually Long Peak-to-Valley Drawdown Periods With Respect To Both the Long Index and the Short Index May Be Reflected in Equally Long Peak-to-Valley Drawdown Periods with Respect to the Performance of the Shares of the Bullish Fund and the Bearish Fund, Respectively.
Although past Index levels are not necessarily indicative of future Index levels, both the Long Index and the Short Index have experienced unusually long peak-to-valley drawdown periods. As of April 30, 2011, the closing level of the Short Index experienced a peak-to-valley drawdown of (36.82)% during the period from June 1995 – January 2002. As of April 30, 2011, the closing level of the Long Index experienced a peak-to-valley drawdown of (48.06)% during the period from December 1986 – April 2011. During the period from June 1995 – January 2002, both the Long Index and Short Index experienced drawdown periods simultaneously.
Because it is expected that each Fund’s performance will track the changes in the closing levels of its underlying Index, a Fund would suffer a continuous drawdown during the period that an Index suffers such a drawdown period, and in turn, the value of your Shares will also suffer.”
-2-
| II. | Risk Factor (14) on page 21 of the Prospectus is hereby deleted and replaced, in its entirety, with the following: |
“(14) Price Volatility May Possibly Cause the Total Loss of Your Investment.
Futures contracts have a high degree of price variability and are subject to occasional rapid and substantial changes. Consequently, you could lose all or substantially all of your investment in a Fund.
The following table* reflects various measures of volatility** of the Long Index and the Short Index, each as calculated on an excess return basis:
Volatility Type | Volatility | |||
Long Index | Short Index | |||
Daily volatility over full history | 8.94% | 8.78% | ||
Average rolling 3 month daily volatility | 8.64% | 8.45% | ||
Monthly return volatility | 8.99% | 8.88% | ||
Average annual volatility | 8.75% | 8.57% | ||
The following table reflects the daily volatility on an annual basis of the Long Index and the Short Index:
Year | Daily Volatility | |||
Long Index | Short Index | |||
1986*** | 0.00% | 0.00% | ||
1987 | 9.44% | 9.07% | ||
1988 | 9.62% | 9.69% | ||
1989 | 10.22% | 10.20% | ||
1990 | 8.77% | 8.35% | ||
1991 | 11.53% | 11.89% | ||
1992 | 11.70% | 12.06% | ||
1993 | 9.44% | 9.54% | ||
1994 | 7.83% | 7.52% | ||
1995 | 9.78% | 9.55% | ||
1996 | 4.99% | 5.01% | ||
1997 | 7.59% | 7.91% | ||
1998 | 8.06% | 7.94% | ||
1999 | 7.59% | 7.71% | ||
2000 | 8.77% | 9.17% | ||
2001 | 8.70% | 8.56% | ||
2002 | 7.49% | 7.19% | ||
2003 | 8.44% | 8.25% | ||
2004 | 9.52% | 9.23% | ||
2005 | 8.10% | 8.46% | ||
2006 | 6.95% | 6.75% | ||
2007 | 5.21% | 5.08% | ||
2008 | 11.94% | 12.46% | ||
2009 | 11.09% | 9.55% | ||
2010 | 8.84% | 7.30% | ||
2011* | 7.21% | 5.81% | ||
| * | As of April 30, 2011. Past Index levels are not necessarily indicative of future changes, positive or negative, in the Index levels. |
| ** | Volatility, for these purposes means the following: |
Daily Volatility: The relative rate at which the price of the Index moves up and down, found by calculating the annualized standard deviation of the daily change in price.
Monthly Return Volatility: The relative rate at which the price of the Index moves up and down, found by calculating the annualized standard deviation of the monthly change in price.
Average Annual Volatility: The average of yearly volatilities for a given sample period. The yearly volatility is the relative rate at which the price of the Index moves up and down, found by calculating the annualized standard deviation of the daily change in price for each business day in the given year.
*** As of December 31, 1986.”
-3-
| III. | Risk Factor (27) on pages 24-25 of the Prospectus is hereby deleted and replaced, in its entirety, with the following, and the numbers of the succeeding risk factor are hereby increased by 1: |
“(27) The Effects Of Market Disruptions and Government Intervention Are Unpredictable And May Have An Adverse Effect On The Value Of Your Shares.
The global financial markets have in the past few years gone through pervasive and fundamental disruptions that have led to extensive and unprecedented governmental intervention. Such intervention has in certain cases been implemented on an “emergency” basis, suddenly and substantially eliminating market participants’ ability to continue to implement certain strategies or manage the risk of their outstanding positions. In addition — as one would expect given the complexities of the financial markets and the limited time frame within which governments have felt compelled to take action — these interventions have typically been unclear in scope and application, resulting in confusion and uncertainty which in itself has been materially detrimental to the efficient functioning of the markets as well as previously successful investment strategies.
The Funds may incur major losses in the event of disrupted markets and other extraordinary events in which historical pricing relationships become materially distorted. The risk of loss from pricing distortions is compounded by the fact that in disrupted markets many positions become illiquid, making it difficult or impossible to close out positions against which the markets are moving. The financing available to market participants from their banks, dealers and other counterparties is typically reduced in disrupted markets. Such a reduction may result in substantial losses to the affected market participants. Market disruptions may from time to time cause dramatic losses, and such events can result in otherwise historically low-risk strategies performing with unprecedented volatility and risk.
(28) Regulatory Changes or Actions, Including the Implementation of the Dodd-Frank Act, May Alter the Operations and Profitability of the Funds.
The regulation of commodity interest transactions in the United States is a rapidly changing area of law and is subject to ongoing modification by governmental and judicial action. Considerable regulatory attention has been focused on non-traditional investment pools that are publicly distributed in the United States. The Dodd-Frank Act seeks to regulate markets, market participants and financial instruments that previously have been unregulated and substantially alters the regulation of many other markets, market participants and financial instruments. Because many provisions of the Dodd-Frank Act require rulemaking by the applicable regulators before becoming fully effective and the Dodd-Frank Act mandates multiple agency reports and studies (which could result in additional legislative or regulatory action), it is difficult to predict the impact of the Dodd-Frank Act on the Funds, the Managing Owner, and the markets in which the Funds may invest, the Net Asset Value of the Funds or the market price of the Shares. The Dodd-Frank Act could result in the Funds’ investment strategies becoming non-viable or non-economic to implement. Therefore, the Dodd-Frank Act and regulations adopted pursuant to the Dodd-Frank Act could have a material adverse impact on the profit potential of the Funds and in turn the value of your Shares.”
-4-
| IV. | Pages 31 through 32 of the Prospectus are hereby deleted and replaced, in their entirety, with the following: |
“PERFORMANCE OF POWERSHARES DB US DOLLAR INDEX BULLISH FUND (TICKER: UUP), A SERIES OF
POWERSHARES DB US DOLLAR INDEX TRUST
Name of Pool: PowerShares DB US Dollar Index Bullish Fund
Type of Pool: Public, Exchange-Listed Commodity Pool
Inception of Trading: February 2007
Aggregate Gross Capital Subscriptions as of April 30, 2011:$6,212,473,779
Net Asset Value as of April 30, 2011:$798,862,626
Net Asset Value per Share as of April 30, 2011:$20.91
Worst Monthly Drawdown:(6.89)% December 2008
Worst Peak-to-Valley Drawdown:(21.24)% November 2008 – April 2011
| Monthly Rate of Return | 2011(%) | 2010(%) | 2009(%) | 2008(%) | 2007(%) | |||||
January | (1.80) | 1.69 | 5.02 | (1.47) | -- | |||||
February | (1.25) | 0.90 | 1.89 | (1.84) | (0.32) | |||||
March | (1.49) | 0.65 | (3.06) | (2.48) | (0.32) | |||||
April | (3.86) | 0.78 | (1.29) | 0.80 | (1.29) | |||||
May | 5.38 | (6.16) | 0.31 | 1.55 | ||||||
June | (0.91) | 0.63 | (0.62) | 0.00 | ||||||
July | (5.27) | (2.43) | 0.93 | (0.92) | ||||||
August | 1.84 | (0.30) | 5.42 | 0.57 | ||||||
September | (5.48) | (2.06) | 1.88 | (3.31) | ||||||
October | (1.90) | (0.53) | 8.49 | (1.17) | ||||||
November | 4.78 | (1.99) | 0.38 | 0.04 | ||||||
December | (2.94) | 3.74 | (6.89)* | 0.04** | ||||||
Compound Rate of Return | (8.17)% (4 months) | (1.13)% | (6.84)% | 4.17% | (5.08)% (10 1/4 months) |
| * | The December 2008 return of (6.89)% includes the $0.17 per Share distribution made to Shareholders of record as of December 17, 2008. Prior to the December 30, 2008 distribution, the pool’s return for December 2008 was (6.25)%. |
| ** | The December 2007 return of 0.04% includes the $0.20 per Share distribution made to Shareholders of record as of December 19, 2007. Prior to the December 28, 2007 distribution, the pool’s return for December 2007 was 0.76%. |
PAST PERFORMANCE IS NOT NECESSARILY INDICATIVE OF FUTURE RESULTS.
PERFORMANCE OF POWERSHARES DB US DOLLAR INDEX BEARISH FUND (TICKER: UDN), A SERIES OF
POWERSHARES DB US DOLLAR INDEX TRUST
Name of Pool: PowerShares DB US Dollar Index Bearish Fund
Type of Pool: Public, Exchange-Listed Commodity Pool
Inception of Trading: February 2007
Aggregate Gross Capital Subscriptions as of April 30, 2011:$830,826,978
Net Asset Value as of April 30, 2011:$175,412,661
Net Asset Value per Share as of April 30, 2011:$29.24
Worst Monthly Drawdown:(8.37)% October 2008
Worst Peak-to-Valley Drawdown:(17.03)% March 2008 – February 2009*
| Monthly Rate of Return | 2011(%) | 2010(%) | 2009(%) | 2008(%) | 2007(%) | |||||
January | 1.66 | (1.94) | (4.70) | 2.14 | -- | |||||
February | 1.09 | (1.15) | (1.92) | 4.28 | 0.64 | |||||
March | 1.40 | (0.76) | 3.03 | 2.65 | 0.99 | |||||
April | 3.72 | (0.93) | 1.19 | (0.68) | 2.01 | |||||
May | (5.87) | 5.61 | (0.27) | (0.73) | ||||||
June | 0.53 | (0.63) | 0.82 | 0.74 | ||||||
July | 5.03 | 2.35 | (0.71) | 1.54 | ||||||
August | (1.73) | 0.22 | (5.30) | 0.38 | ||||||
September | 5.42 | 1.93 | (1.99) | 3.82 | ||||||
October | 1.63 | 0.43 | (8.37) | 1.68 | ||||||
November | (4.33) | 1.92 | (0.48) | 0.68 | ||||||
December | 2.81 | (3.72) | 5.78** | (1.92)*** | ||||||
Compound Rate of Return | 8.10% (4 months) | (1.90)% | 5.37% | (2.94)% | 10.16% (10 1/4 months) |
| * | The Worst Peak-to-Valley Drawdown from March 2008 - February 2009 includes the effect of the $0.15 per Share distribution made to Shareholders of record as of December 17, 2008. Please see Footnote **. |
| ** | The December 2008 return of 5.78% includes the $0.15 per Share distribution made to Shareholders of record as of December 17, 2008. Prior to the December 30, 2008 distribution, the pool’s return for December 2008 was 6.39%. |
| *** | The December 2007 return of (1.92)% includes the $0.40 per Share distribution made to Shareholders of record as of December 19, 2007. Prior to the December 28, 2007 distribution, the pool’s return for December 2007 was 0.39%. |
PAST PERFORMANCE IS NOT NECESSARILY INDICATIVE OF FUTURE RESULTS.
See accompanying Footnotes to Performance Information.
-5-
Footnotes to Performance Information
1. “Aggregate Gross Capital Subscriptions” is the aggregate of all amounts ever contributed to the relevant pool, including investors who subsequently redeemed their investments.
2. “Net Asset Value” is the net asset value of each pool as of April 30, 2011.
3. “Net Asset Value per Share” is the Net Asset Value of the relevant pool divided by the total number of Shares outstanding with respect to such pool as of April 30, 2011.
4. “Worst Monthly Drawdown” is the largest single month loss sustained since inception of trading. “Drawdown” as used in this section of the prospectus means losses experienced by the relevant pool over the specified period and is calculated on a rate of return basis, i.e., dividing net performance by beginning equity. “Drawdown” is measured on the basis of monthly returns only, and does not reflect intra-month figures. “Month” is the month of the Worst Monthly Drawdown.
5. “Worst Peak-to-Valley Drawdown” is the largest percentage decline in the Net Asset Value per Share over the history of the relevant pool. This need not be a continuous decline, but can be a series of positive and negative returns where the negative returns are larger than the positive returns. “Worst Peak-to-Valley Drawdown” represents the greatest percentage decline from any month-end Net Asset Value per Share that occurs without such month-end Net Asset Value per Share being equaled or exceeded as of a subsequent month-end. For example, if the Net Asset Value per Share of a particular pool declined by $1 in each of January and February, increased by $1 in March and declined again by $2 in April, a “peak-to-valley drawdown” analysis conducted as of the end of April would consider that “drawdown” to be still continuing and to be $3 in amount, whereas if the Net Asset Value per Share had increased by $2 in March, the January-February drawdown would have ended as of the end of February at the $2 level.
6. “Compound Rate of Return” is calculated by multiplying on a compound basis each of the monthly rates of return set forth in the respective charts above and not by adding or averaging such monthly rates of return. For periods of less than one year, the results are year-to-date.”
-6-
| V. | Pages 37 through 54 of the Prospectus are hereby deleted and replaced, in their entirety, with the following: |
“Cautionary Statement – Statistical Information
Various statistical information is presented on the following pages, relating to the Closing Levels of the Long Index and the Short Index, on an annual and cumulative basis, including certain comparisons of each Index to other currency indices. In reviewing such information, prospective investors should consider that:
| • | Changes in Closing Levels of each Index during any particular period or market cycle may be volatile. |
| Index | Worst Peak-to- Valley | Worst Monthly Drawdown and Month and Year | ||||||
Long Index |
| (48.06)%, 12/86-04/11 |
|
| (6.30)%, 5/09 |
| ||
Short Index |
| (36.82)%, 6/95-1/02 |
|
| (8.77)%, 3/91 |
| ||
For example, the “Worst Peak-to-Valley Drawdown” of each Index, represents the greatest percentage decline from any month-end Closing Level, without such Closing Level being equaled or exceeded as of a subsequent month-end, which occurred during the above-listed time period.
| • | The “Worst Monthly Drawdown” of each Index occurred during the above-listed month and year. |
| • | See “The Risks You Face - (14) Price Volatility May Possibly Cause the Total Loss of Your Investment.” |
| • | Neither the fees charged by either Fund nor the execution costs associated with establishing futures positions in the DX Contracts are incorporated into the Closing Levels of each Index. Accordingly, such Index Levels have not been reduced by the costs associated with an actual investment, such as a Fund, with an investment objective of tracking the corresponding Index. |
| • | The Indexes were established in November 2006, and are independently calculated by Deutsche Bank AG London, the Index Sponsor. The Index calculation methodology and DX Contracts selection is the same before and after November 2006, as described above. Accordingly, the Closing Levels of each Index, terms of each Index methodology and DX Contracts, reflect an element of hindsight at the time each Index was established. See “The Risks You Face—(10) You May Not Rely on Past Performance or Index Results in Deciding Whether to Buy Shares” and “—(11) Fewer Representative Index Currencies May Result In Greater Index Volatility.” |
WHILE EACH FUND’S OBJECTIVE IS NOT TO GENERATE PROFIT THROUGH ACTIVE PORTFOLIO MANAGEMENT, BUT IS TO TRACK THE CORRESPONDING INDEX, BECAUSE EACH INDEX WAS ESTABLISHED IN NOVEMBER 2006, CERTAIN INFORMATION RELATING TO INDEX CLOSING LEVELS MAY BE CONSIDERED TO BE “HYPOTHETICAL.” HYPOTHETICAL INFORMATION MAY HAVE CERTAIN INHERENT LIMITATIONS, SOME OF WHICH ARE DESCRIBED BELOW.
NO REPRESENTATION IS BEING MADE THAT EACH INDEX WILL OR IS LIKELY TO ACHIEVE ANNUAL OR CUMULATIVE CLOSING LEVELS CONSISTENT WITH OR SIMILAR TO THOSE SET FORTH HEREIN. SIMILARLY, NO REPRESENTATION IS BEING MADE THAT EACH FUND WILL GENERATE PROFITS OR LOSSES SIMILAR TO THE FUND’S PAST PERFORMANCE, WHEN AVAILABLE, OR THE HISTORICAL ANNUAL OR CUMULATIVE CHANGES IN THE CORRESPONDING INDEX CLOSING LEVELS. IN FACT, THERE ARE FREQUENTLY SHARP DIFFERENCES BETWEEN HYPOTHETICAL RESULTS AND THE ACTUAL RESULTS SUBSEQUENTLY ACHIEVED BY INVESTMENT METHODOLOGIES, WHETHER ACTIVE OR PASSIVE.
7
ONE OF THE LIMITATIONS OF HYPOTHETICAL INFORMATION IS THAT IT IS GENERALLY PREPARED WITH THE BENEFIT OF HINDSIGHT. TO THE EXTENT THAT INFORMATION PRESENTED HEREIN RELATES TO THE PERIOD DECEMBER 1986 THROUGH OCTOBER 2006 WITH RESPECT TO EACH INDEX, AS APPLICABLE, EACH INDEX’S CLOSING LEVELS REFLECT THE APPLICATION OF THE INDEX’S METHODOLOGY, AND SELECTION OF DX CONTRACTS, IN HINDSIGHT.
NO HYPOTHETICAL RECORD CAN COMPLETELY ACCOUNT FOR THE IMPACT OF FINANCIAL RISK IN ACTUAL TRADING. FOR EXAMPLE, THERE ARE NUMEROUS FACTORS, INCLUDING THOSE DESCRIBED UNDER “THE RISKS YOU FACE” HEREIN, RELATED TO THE CURRENCIES MARKETS IN GENERAL OR TO THE IMPLEMENTATION OF EACH FUND’S EFFORTS TO TRACK ITS CORRESPONDING INDEX OVER TIME WHICH CANNOT BE, AND HAVE NOT BEEN, ACCOUNTED FOR IN THE PREPARATION OF SUCH INDEX INFORMATION SET FORTH ON THE FOLLOWING PAGES, ALL OF WHICH CAN ADVERSELY AFFECT ACTUAL PERFORMANCE RESULTS FOR EACH FUND. FURTHERMORE, THE INDEX INFORMATION DOES NOT INVOLVE FINANCIAL RISK OR ACCOUNT FOR THE IMPACT OF FEES AND COSTS ASSOCIATED WITH EACH FUND.
THE MANAGING OWNER COMMENCED OPERATIONS IN JANUARY 2006. AS MANAGING OWNER, THE MANAGING OWNER AND ITS TRADING PRINCIPALS HAVE BEEN MANAGING THE DAY-TO-DAY OPERATIONS FOR THE FUNDS AND RELATED PRODUCTS AND MANAGING FUTURES TRADING ACCOUNTS. BECAUSE THERE ARE LIMITED ACTUAL TRADING RESULTS TO COMPARE TO THE INDEX CLOSING LEVELS SET FORTH HEREIN, PROSPECTIVE INVESTORS SHOULD BE PARTICULARLY WARY OF PLACING UNDUE RELIANCE ON THE ANNUAL OR CUMULATIVE INDEX RESULTS.
[Remainder of page left blank intentionally.]
8
DATA
RELATING TO THE
LONG INDEX
DEUTSCHE BANK LONG US DOLLAR INDEX (USDX®) FUTURES INDEX – EXCESS RETURNTM
DEUTSCHE BANK LONG US DOLLAR INDEX (USDX®) FUTURES INDEX – TOTAL RETURNTM
The following data relates to the Long Index closing levels and various statistical measures, each of which either analyzes the Long Index closing levels data in terms of volatility, Sharpe Ratios, etc. or compares the Long Index closing levels against various relevant benchmarks. The Long Index is calculated on both an excess return and total return basis.
THE BULLISH FUND TRADES WITH A VIEW TO TRACKING THE DEUTSCHE BANK LONG US DOLLAR INDEX (USDX®) FUTURES INDEX – EXCESS RETURNTM OVER TIME.
THE BULLISH FUND DOES NOT TRADE WITH A VIEW TO TRACKING THE DEUTSCHE BANK LONG US DOLLAR INDEX (USDX®) FUTURES INDEX – TOTAL RETURNTM OVER TIME.
9
CLOSING LEVELS TABLE
DEUTSCHE BANK LONG US DOLLAR INDEX (USDX®) FUTURES INDEX – EXCESS RETURNTM
| Closing Level | ||||||||
| High1 | Low2 | Annual Index Changes3 | Index Changes Since Inception4 | |||||
19865 | 100.00 | 100.00 | 0.00 | 0.00 | ||||
1987 | 100.58 | 80.31 | -19.69% | -19.69% | ||||
1988 | 92.74 | 80.91 | 7.06% | -14.02% | ||||
1989 | 98.38 | 85.91 | 0.84% | -13.30% | ||||
1990 | 87.89 | 73.85 | -13.34% | -24.86% | ||||
1991 | 85.99 | 72.11 | -3.76% | -27.69% | ||||
1992 | 77.65 | 65.06 | 3.67% | -25.04% | ||||
1993 | 76.18 | 70.10 | -0.42% | -25.35% | ||||
1994 | 74.47 | 64.27 | -10.56% | -33.23% | ||||
1995 | 67.54 | 60.33 | -5.30% | -36.77% | ||||
1996 | 66.56 | 63.18 | 4.32% | -34.04% | ||||
1997 | 76.53 | 66.13 | 14.46% | -24.50% | ||||
1998 | 78.10 | 70.33 | -4.85% | -28.16% | ||||
1999 | 80.14 | 71.30 | 9.38% | -21.42% | ||||
2000 | 92.51 | 77.39 | 8.85% | -14.47% | ||||
2001 | 94.55 | 84.91 | 6.01% | -9.33% | ||||
2002 | 93.28 | 77.72 | -14.28% | -22.28% | ||||
2003 | 78.64 | 65.14 | -16.19% | -34.86% | ||||
2004 | 68.46 | 59.41 | -8.33% | -40.29% | ||||
2005 | 68.31 | 60.01 | 13.14% | -32.44% | ||||
2006 | 67.50 | 62.03 | -6.67% | -36.95% | ||||
2007 | 64.32 | 57.07 | -7.26% | -41.53% | ||||
2008 | 66.12 | 54.14 | 4.17% | -39.09% | ||||
2009 | 66.14 | 54.18 | -6.85% | -43.26% | ||||
2010 | 63.96 | 54.45 | -0.35% | -43.46% | ||||
20116 | 57.99 | 51.94 | -8.13% | -48.06% | ||||
THE BULLISH FUND TRADES WITH A VIEW TO TRACKING THE
DEUTSCHE BANK LONG US DOLLAR INDEX (USDX®) FUTURES INDEX – EXCESS RETURNTM OVER TIME.
NEITHER THE PAST PERFORMANCE OF THE FUND NOR THE PRIOR INDEX LEVELS AND CHANGES, POSITIVE AND NEGATIVE, SHOULD BE TAKEN AS AN INDICATION OF THE FUND’S FUTURE PERFORMANCE.
DEUTSCHE BANK LONG US DOLLAR INDEX (USDX®) FUTURES INDEX – TOTAL RETURNTM
| Closing Level | ||||||||
| High1 | Low2 | Annual Index Changes3 | Index Changes Since Inception4 | |||||
19865 | 100.00 | 100.00 | 0.00 | 0.00 | ||||
1987 | 100.66 | 85.33 | -14.67% | -14.67% | ||||
1988 | 102.65 | 86.02 | 14.80% | -2.04% | ||||
1989 | 116.74 | 97.97 | 9.54% | 7.30% | ||||
1990 | 110.08 | 97.96 | -6.41% | 0.43% | ||||
1991 | 118.38 | 97.40 | 1.66% | 2.09% | ||||
1992 | 110.58 | 94.16 | 7.37% | 9.61% | ||||
1993 | 112.53 | 103.48 | 2.67% | 12.53% | ||||
1994 | 112.42 | 100.14 | -6.62% | 5.09% | ||||
1995 | 106.73 | 96.63 | 0.14% | 5.24% | ||||
1996 | 116.61 | 105.21 | 9.82% | 15.57% | ||||
1997 | 139.28 | 115.91 | 20.51% | 39.28% | ||||
1998 | 148.94 | 134.97 | -0.11% | 39.13% | ||||
1999 | 160.01 | 138.16 | 14.67% | 59.54% | ||||
2000 | 198.12 | 157.20 | 15.48% | 84.23% | ||||
2001 | 208.23 | 183.08 | 9.78% | 102.26% | ||||
2002 | 208.39 | 176.25 | -12.86% | 76.25% | ||||
2003 | 178.34 | 149.23 | -15.33% | 49.23% | ||||
2004 | 157.39 | 138.01 | -7.05% | 38.71% | ||||
2005 | 163.02 | 139.43 | 16.79% | 62.00% | ||||
2006 | 163.23 | 152.48 | -2.09% | 58.62% | ||||
2007 | 162.61 | 149.70 | -3.02% | 53.83% | ||||
2008 | 176.36 | 143.29 | 5.62% | 62.47% | ||||
2009 | 176.48 | 144.72 | -6.71% | 51.56% | ||||
2010 | 170.96 | 145.63 | -0.21% | 51.24% | ||||
20116 | 155.12 | 138.99 | -8.10% | 38.99% | ||||
THE BULLISH FUND DOES NOT TRADE WITH A VIEW TO TRACKING THE
DEUTSCHE BANK LONG US DOLLAR INDEX (USDX®) FUTURES INDEX – TOTAL RETURNTM OVER TIME.
NEITHER THE PAST PERFORMANCE OF THE FUND NOR THE PRIOR INDEX LEVELS AND CHANGES, POSITIVE AND NEGATIVE, SHOULD BE TAKEN AS AN INDICATION OF THE FUND’S FUTURE PERFORMANCE.
See accompanying Notes and Legends.
10
| All Statistics based on data from December 31, 1986 to April 30, 2011 | ||||||||||||||
| Various Statistical Measures | DB Long Future ER7,8 | DB Long Future TR8,9 | Spot Index10 | |||||||||||
Annualized Changes to Index Level11 | -2.7% | 1.4% | -1.4% | |||||||||||
Average rolling 3 month volatility12 | 8.6% | 8.6% | 8.4% | |||||||||||
Sharpe Ratio13 | -0.87 | -0.41 | -0.75 | |||||||||||
% of months with positive change14 | 46% | 51% | 46% | |||||||||||
Average monthly positive change15 | 2.0% | 2.1% | 2.0% | |||||||||||
Average monthly negative change16 | -2.0% | -1.9% | -1.9% | |||||||||||
| Annualized Index Levels17 | DB Long Future ER7,8 | DB Long Future TR8,9 | Spot Index10 | |||||||||||
1 yr | -12.4% | -12.3% | -10.9% | |||||||||||
3 yr | -1.9% | -1.6% | 0.2% | |||||||||||
5 yr | -4.1% | -2.3% | -3.3% | |||||||||||
7 yr | -3.6% | -1.5% | -3.0% | |||||||||||
10 yr | -5.4% | -3.5% | -4.5% | |||||||||||
15 yr | -1.5% | 1.5% | -1.2% | |||||||||||
Correlation of Monthly Returns* ,22 | ||||||||||||||
| DB Long Future TR7,8 | S&P 500 TR18 | iBoxx US Treasuries19 | DBLCI TR20 | NAR Existing One Family Home Sales Median Price Index21 | ||||||||||
DB Long Future TR7,8 | 1.00 | -0.13 | -0.24 | -0.23 | 0.00 | |||||||||
S&P 500 TR18 | -0.13 | 1.00 | -0.27 | 0.11 | 0.06 | |||||||||
iBoxx US Treasuries19 | -0.24 | -0.27 | 1.00 | -0.08 | -0.09 | |||||||||
DBLCI TR20 | -0.23 | 0.11 | -0.08 | 1.00 | 0.04 | |||||||||
NAR Existing One Family Home Sales Median Price Index21 | 0.00 | 0.06 | -0.09 | 0.04 | 1.00 | |||||||||
NEITHER THE PAST PERFORMANCE OF THE FUND NOR THE PRIOR INDEX LEVELS AND CHANGES, POSITIVE AND NEGATIVE, SHOULD BE TAKEN AS AN INDICATION OF THE FUND’S FUTURE PERFORMANCE.
* “Correlation” is a statistical term which describes the degree to which two or more asset classes show a tendency to rise or fall in value together. Diversification of an investment portfolio among asset classes that are not correlated with each other tends to reduce overall volatility and risk in the portfolio as a whole. The hypothetical returns of DB Long Future TR have been compared with the S&P 500 TR, the iBoxx US Treasuries, the DBCLI TR and the NAR Existing One Family Home Sales Median Price Index to permit an investor to compare and contrast the degree of correlation between DB Long Future TR (which is a currency index) and indices which are commonly used to measure the performance of the equity, fixed income, commodity and real estate markets, respectively.
WHILE THE FUND’S OBJECTIVE IS NOT TO GENERATE PROFIT THROUGH ACTIVE PORTFOLIO MANAGEMENT, BUT IS TO TRACK THE INDEX, BECAUSE THE INDEX WAS ESTABLISHED IN NOVEMBER 2006, CERTAIN INFORMATION RELATING TO INDEX CLOSING LEVELS MAY BE CONSIDERED TO BE “HYPOTHETICAL.” HYPOTHETICAL INFORMATION MAY HAVE CERTAIN INHERENT LIMITATIONS, SOME OF WHICH ARE DESCRIBED BELOW.
NO REPRESENTATION IS BEING MADE THAT THE INDEX WILL OR IS LIKELY TO ACHIEVE ANNUAL OR CUMULATIVE CLOSING LEVELS CONSISTENT WITH OR SIMILAR TO THOSE SET FORTH HEREIN. SIMILARLY, NO REPRESENTATION IS BEING MADE THAT THE FUND WILL GENERATE PROFITS OR LOSSES SIMILAR TO THE FUND’S PAST PERFORMANCE, WHEN AVAILABLE, OR THE HISTORICAL ANNUAL OR CUMULATIVE CHANGES IN THE INDEX CLOSING LEVELS. IN FACT, THERE ARE FREQUENTLY SHARP DIFFERENCES BETWEEN HYPOTHETICAL RESULTS AND THE ACTUAL RESULTS SUBSEQUENTLY ACHIEVED BY INVESTMENT METHODOLOGIES, WHETHER ACTIVE OR PASSIVE.
ONE OF THE LIMITATIONS OF HYPOTHETICAL INFORMATION IS THAT IT IS GENERALLY PREPARED WITH THE BENEFIT OF HINDSIGHT. TO THE EXTENT THAT INFORMATION PRESENTED HEREIN RELATES TO THE PERIOD DECEMBER 1986 THROUGH OCTOBER 2006, THE INDEX CLOSING LEVELS REFLECT THE APPLICATION OF THE INDEX’S METHODOLOGY, AND SELECTION OF DX CONTRACTS, IN HINDSIGHT.
NO HYPOTHETICAL RECORD CAN COMPLETELY ACCOUNT FOR THE IMPACT OF FINANCIAL RISK IN ACTUAL TRADING. FOR EXAMPLE, THERE ARE NUMEROUS FACTORS, INCLUDING THOSE DESCRIBED UNDER “THE RISKS YOU FACE” HEREIN, RELATED TO THE CURRENCIES MARKETS IN GENERAL OR TO THE IMPLEMENTATION OF THE FUND’S EFFORTS TO TRACK ITS INDEX OVER TIME WHICH CANNOT BE, AND HAVE NOT BEEN, ACCOUNTED FOR IN THE PREPARATION OF SUCH INDEX INFORMATION SET FORTH ON THE FOLLOWING PAGES, ALL OF WHICH CAN ADVERSELY AFFECT ACTUAL PERFORMANCE RESULTS FOR THE FUND. FURTHERMORE, THE INDEX INFORMATION DOES NOT INVOLVE FINANCIAL RISK OR ACCOUNT FOR THE IMPACT OF FEES AND COSTS ASSOCIATED WITH THE FUND.
THE MANAGING OWNER COMMENCED OPERATIONS IN JANUARY 2006. AS MANAGING OWNER, THE MANAGING OWNER AND ITS TRADING PRINCIPALS HAVE BEEN MANAGING THE DAY-TO-DAY OPERATIONS FOR THE FUNDS AND RELATED PRODUCTS AND MANAGING FUTURES TRADING ACCOUNTS. BECAUSE THERE ARE LIMITED ACTUAL TRADING RESULTS TO COMPARE TO THE INDEX CLOSING LEVELS SET FORTH HEREIN, PROSPECTIVE INVESTORS SHOULD BE PARTICULARLY WARY OF PLACING UNDUE RELIANCE ON THE ANNUAL OR CUMULATIVE INDEX RESULTS.
See accompanying Notes and Legends.
11
COMPARISON OF VARIOUS US DOLLAR INDICES
(DECEMBER 31, 1986 – APRIL 30, 2011)
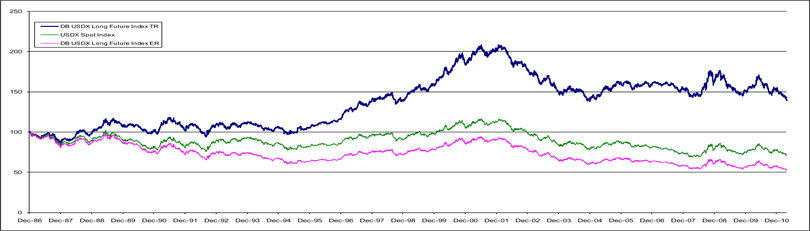
NEITHER THE PAST PERFORMANCE OF THE FUND NOR THE PRIOR INDEX LEVELS AND CHANGES, POSITIVE AND NEGATIVE, SHOULD BE TAKEN AS AN INDICATION OF THE FUND’S FUTURE PERFORMANCE. Each of the DB Long Future-ER, DB Long Future-TR and Spot Index are indices and do not reflect actual trading or any fees or expenses. Spot Index is calculated on an excess return basis.
WHILE THE FUND’S OBJECTIVE IS NOT TO GENERATE PROFIT THROUGH ACTIVE PORTFOLIO MANAGEMENT, BUT IS TO TRACK THE INDEX, BECAUSE THE INDEX WAS ESTABLISHED IN NOVEMBER 2006, CERTAIN INFORMATION RELATING TO INDEX CLOSING LEVELS MAY BE CONSIDERED TO BE “HYPOTHETICAL.” HYPOTHETICAL INFORMATION MAY HAVE CERTAIN INHERENT LIMITATIONS, SOME OF WHICH ARE DESCRIBED BELOW. NO REPRESENTATION IS BEING MADE THAT THE INDEX WILL OR IS LIKELY TO ACHIEVE ANNUAL OR CUMULATIVE CLOSING LEVELS CONSISTENT WITH OR SIMILAR TO THOSE SET FORTH HEREIN. SIMILARLY, NO REPRESENTATION IS BEING MADE THAT THE FUND WILL GENERATE PROFITS OR LOSSES SIMILAR TO THE FUND’S PAST PERFORMANCE, WHEN AVAILABLE, OR THE HISTORICAL ANNUAL OR CUMULATIVE CHANGES IN THE INDEX CLOSING LEVELS. IN FACT, THERE ARE FREQUENTLY SHARP DIFFERENCES BETWEEN HYPOTHETICAL RESULTS AND THE ACTUAL RESULTS SUBSEQUENTLY ACHIEVED BY INVESTMENT METHODOLOGIES, WHETHER ACTIVE OR PASSIVE. ONE OF THE LIMITATIONS OF HYPOTHETICAL INFORMATION IS THAT IT IS GENERALLY PREPARED WITH THE BENEFIT OF HINDSIGHT. TO THE EXTENT THAT INFORMATION PRESENTED HEREIN RELATES TO THE PERIOD DECEMBER 1986 THROUGH OCTOBER 2006, THE INDEX CLOSING LEVELS REFLECT THE APPLICATION OF THE INDEX’S METHODOLOGY, AND SELECTION OF DX CONTRACTS, IN HINDSIGHT. NO HYPOTHETICAL RECORD CAN COMPLETELY ACCOUNT FOR THE IMPACT OF FINANCIAL RISK IN ACTUAL TRADING. FOR EXAMPLE, THERE ARE NUMEROUS FACTORS, INCLUDING THOSE DESCRIBED UNDER “THE RISKS YOU FACE” HEREIN, RELATED TO THE CURRENCIES MARKETS IN GENERAL OR TO THE IMPLEMENTATION OF THE FUND’S EFFORTS TO TRACK ITS INDEX OVER TIME WHICH CANNOT BE, AND HAVE NOT BEEN, ACCOUNTED FOR IN THE PREPARATION OF SUCH INDEX INFORMATION SET FORTH ON THE FOLLOWING PAGES, ALL OF WHICH CAN ADVERSELY AFFECT ACTUAL PERFORMANCE RESULTS FOR THE FUND. FURTHERMORE, THE INDEX INFORMATION DOES NOT INVOLVE FINANCIAL RISK OR ACCOUNT FOR THE IMPACT OF FEES AND COSTS ASSOCIATED WITH THE FUND. THE MANAGING OWNER COMMENCED OPERATIONS IN JANUARY 2006. AS MANAGING OWNER, THE MANAGING OWNER AND ITS TRADING PRINCIPALS HAVE BEEN MANAGING THE DAY-TO-DAY OPERATIONS FOR THE FUNDS AND RELATED PRODUCTS AND MANAGING FUTURES TRADING ACCOUNTS. BECAUSE THERE ARE LIMITED ACTUAL TRADING RESULTS TO COMPARE TO THE INDEX CLOSING LEVELS SET FORTH HEREIN, PROSPECTIVE INVESTORS SHOULD BE PARTICULARLY WARY OF PLACING UNDUE RELIANCE ON THE ANNUAL OR CUMULATIVE INDEX RESULTS. |
See accompanying Notes and Legends.
12
COMPARISON OF ANNUAL RETURNS OF VARIOUS US DOLLAR INDICES
(DECEMBER 31, 1986 – APRIL 30, 2011)
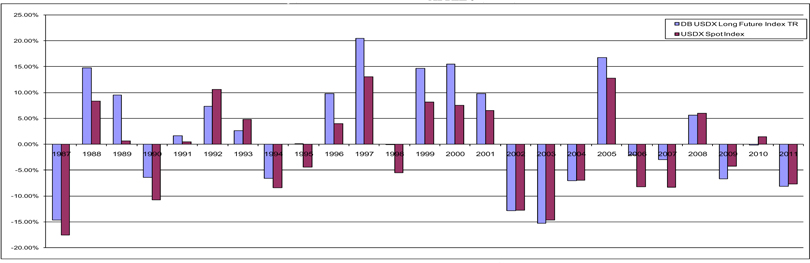
NEITHER THE PAST PERFORMANCE OF THE FUND NOR THE PRIOR INDEX LEVELS AND CHANGES, POSITIVE AND NEGATIVE, SHOULD BE TAKEN AS AN INDICATION OF THE FUND’S FUTURE PERFORMANCE.
Each of the DB Long Future-ER and Spot Index are indices and do not reflect actual trading or any fees or expenses. Spot Index is calculated on an excess return basis.
WHILE THE FUND’S OBJECTIVE IS NOT TO GENERATE PROFIT THROUGH ACTIVE PORTFOLIO MANAGEMENT, BUT IS TO TRACK THE INDEX, BECAUSE THE INDEX WAS ESTABLISHED IN NOVEMBER 2006, CERTAIN INFORMATION RELATING TO INDEX CLOSING LEVELS MAY BE CONSIDERED TO BE “HYPOTHETICAL.” HYPOTHETICAL INFORMATION MAY HAVE CERTAIN INHERENT LIMITATIONS, SOME OF WHICH ARE DESCRIBED BELOW. NO REPRESENTATION IS BEING MADE THAT THE INDEX WILL OR IS LIKELY TO ACHIEVE ANNUAL OR CUMULATIVE CLOSING LEVELS CONSISTENT WITH OR SIMILAR TO THOSE SET FORTH HEREIN. SIMILARLY, NO REPRESENTATION IS BEING MADE THAT THE FUND WILL GENERATE PROFITS OR LOSSES SIMILAR TO THE FUND’S PAST PERFORMANCE, WHEN AVAILABLE, OR THE HISTORICAL ANNUAL OR CUMULATIVE CHANGES IN THE INDEX CLOSING LEVELS. IN FACT, THERE ARE FREQUENTLY SHARP DIFFERENCES BETWEEN HYPOTHETICAL RESULTS AND THE ACTUAL RESULTS SUBSEQUENTLY ACHIEVED BY INVESTMENT METHODOLOGIES, WHETHER ACTIVE OR PASSIVE. ONE OF THE LIMITATIONS OF HYPOTHETICAL INFORMATION IS THAT IT IS GENERALLY PREPARED WITH THE BENEFIT OF HINDSIGHT. TO THE EXTENT THAT INFORMATION PRESENTED HEREIN RELATES TO THE PERIOD DECEMBER 1986 THROUGH OCTOBER 2006, THE INDEX CLOSING LEVELS REFLECT THE APPLICATION OF THE INDEX’S METHODOLOGY, AND SELECTION OF DX CONTRACTS, IN HINDSIGHT. NO HYPOTHETICAL RECORD CAN COMPLETELY ACCOUNT FOR THE IMPACT OF FINANCIAL RISK IN ACTUAL TRADING. FOR EXAMPLE, THERE ARE NUMEROUS FACTORS, INCLUDING THOSE DESCRIBED UNDER “THE RISKS YOU FACE” HEREIN, RELATED TO THE CURRENCIES MARKETS IN GENERAL OR TO THE IMPLEMENTATION OF THE FUND’S EFFORTS TO TRACK ITS INDEX OVER TIME WHICH CANNOT BE, AND HAVE NOT BEEN, ACCOUNTED FOR IN THE PREPARATION OF SUCH INDEX INFORMATION SET FORTH ON THE FOLLOWING PAGES, ALL OF WHICH CAN ADVERSELY AFFECT ACTUAL PERFORMANCE RESULTS FOR THE FUND. FURTHERMORE, THE INDEX INFORMATION DOES NOT INVOLVE FINANCIAL RISK OR ACCOUNT FOR THE IMPACT OF FEES AND COSTS ASSOCIATED WITH THE FUND. THE MANAGING OWNER COMMENCED OPERATIONS IN JANUARY 2006. AS MANAGING OWNER, THE MANAGING OWNER AND ITS TRADING PRINCIPALS HAVE BEEN MANAGING THE DAY-TO-DAY OPERATIONS FOR THE FUNDS AND RELATED PRODUCTS AND MANAGING FUTURES TRADING ACCOUNTS. BECAUSE THERE ARE LIMITED ACTUAL TRADING RESULTS TO COMPARE TO THE INDEX CLOSING LEVELS SET FORTH HEREIN, PROSPECTIVE INVESTORS SHOULD BE PARTICULARLY WARY OF PLACING UNDUE RELIANCE ON THE ANNUAL OR CUMULATIVE INDEX RESULTS. |
See accompanying Notes and Legends.
-13-
| NOTES AND LEGENDS: |
1. “High” reflects the highest closing level of the Index during the applicable year.
2. “Low” reflects the lowest closing level of the Index during the applicable year.
3. “Annual Index Changes” reflect the change to the Index level on an annual basis as of December 31 of each applicable year.
4. “Index Changes Since Inception” reflects the change of the Index level since inception on a compounded annual basis as of December 31 of each applicable year.
5. Closing levels as of Base Date of December 31, 1986.
6. Closing levels as of April 30, 2011.
7. “DB Long Future ER” is the Deutsche Bank Long US Dollar Index (USDX®) Futures Index – Excess ReturnTM with respect to the Long Index. The Deutsche Bank Long US Dollar Index (USDX®) Futures IndexTM is calculated on both an excess return basis and total return basis. The DB Long Future ER calculation is not funded and reflects the changes in market value over time, whether positive or negative, of the underlying DX Contracts. The sponsor of the Index, or the Index Sponsor, is Deutsche Bank AG London.
8. If a Fund’s interest income from its holdings of fixed income securities were to exceed the Fund’s fees and expenses, the total return on an investment in a Fund is expected to outperform the DB Long Future ER and underperform the DB Long Future TR (as such term is defined in the following footnote). The only difference between the DB Long Future ER and the DB Long Future TR is that the DB Long Future ER does not include interest income from a hypothetical basket of fixed income securities while the DB Long Future TR does include such a component. The difference in the changes in market value over time, whether positive or negative, in the DB Long Future ER and the DB Long Future TR is attributable entirely to the hypothetical interest income from this hypothetical basket of fixed income securities. If a Fund’s interest income from its holdings of fixed-income securities exceeds such Fund’s fees and expenses, then the amount of such excess is expected to be distributed periodically. The market price of the Shares is expected to track closely the DB Long Future ER. The total return on an investment in a Fund over any period is the sum of the capital appreciation or depreciation of the Shares over the period, plus the amount of any distributions during the period. Consequently, a Fund’s total return is expected to outperform the DB Long Future ER by the amount of the excess, if any, of its interest income over its fees and expenses but, as a result of such Fund’s fees and expenses, the total return on a Fund is expected to underperform the DB Long Future TR. If a Fund’s fees and expenses were to exceed such Fund’s interest income from its holdings of fixed income securities, such Fund would underperform the DB Long Future ER.
9. “DB Long Future TR” is the Deutsche Bank Long US Dollar Index (USDX®) Futures Index – Total ReturnTM with respect to the Long Index. The Deutsche Bank Long US Dollar Index (USDX®) Futures IndexTM is calculated on both an excess return basis and total return basis. The DB Long Future TR calculation is funded and reflects the changes in market value over time, whether positive or negative, of both the underlying DX Contracts and the interest income from a hypothetical basket of fixed income securities. The sponsor of the Index, or the Index Sponsor, is Deutsche Bank AG London.
10. “Spot Index” is the U.S. Dollar Index (USDX®), which provides a general indication of the international value of the USD by averaging the exchange rates between the USD and the six major world currencies the Spot Index -- Euro, Japanese Yen, British Pound, Canadian Dollar, Swedish Krona and Swiss Franc. The USDX® mark is a registered service mark owned by ICE Futures U.S., Inc.
11. “Annualized Changes to Index Level” reflects the changes of the applicable index on an annual basis as of December 31 of each applicable year.
-14-
12. “Average rolling 3 month daily volatility.” The daily volatility reflects the relative rate at which the price of the applicable index moves up and down, which is found by calculating the annualized standard deviation of the daily change in price. In turn, an average of this value is calculated on a 3 month rolling basis. |
13. “Sharpe Ratio” compares the annualized rate of return minus the annualized risk-free rate of return to the annualized variability — often referred to as the “standard deviation” — of the monthly rates of return. A Sharpe Ratio of 1:1 or higher indicates that, according to the measures used in calculating the ratio, the rate of return achieved by a particular strategy has equaled or exceeded the risks assumed by such strategy. The risk-free rate of return that was used in these calculations was assumed to be 4.87%.
14. “% of months with positive change” during the period from inception to April 30, 2011.
15. “Average monthly positive change” during the period from inception to April 30, 2011.
16. “Average monthly negative change” during the period from inception to April 30, 2011.
17. “Annualized Index Levels” reflects the change in the applicable index on an annual basis as of December 31 of each the applicable time period (e.g., 1 year, 3, 5, 7, 10 or 15 years).
18. “S&P 500 TR” is the Standard & Poor’s index calculated on a total return basis. Widely regarded as the benchmark gauge of the U.S. equities market, this index includes a representative sample of 500 leading companies in leading industries of the U.S. economy. Although the S&P 500 focuses on the large-cap segment of the market, with approximately 80% coverage of U.S. equities, it also serves as a proxy for the total market. The total return calculation provides investors with a price-plus-gross cash dividend return. Gross cash dividends are applied on the ex-date of the dividend.
19. “iBoxx US Treasuries” means the Markit iBoxx USD Treasuries index, a sub-index of the Markit iBoxx USD Overall index which covers all USD-denominated investment grade bonds.
20. “DBLCI-TR” is the Deutsche Bank Liquid Commodity IndexTM -- Total Return. This Index is intended to reflect the changes in notional value in the following commodities: Light, Sweet Crude Oil, Heating Oil, Aluminum, Gold, Corn and Wheat. The notional amounts of each index commodity included in this index are broadly in proportion to historical levels of the world’s production and stocks of the index commodities. The sponsor of the Index, or the Index Sponsor, is Deutsche Bank AG London. Deutsche Bank Liquid Commodity IndexTM – Total Return is a trade mark of Deutsche Bank AG and is the subject of Community Trade Mark Number 3054996. Trade Mark applications in the United States are pending.
21. “NAR Existing One Family Home Sales Median Price Index” is one component of The National Association Of Realtors® Existing-Home Sales Series, which is the premier measurement of national and regional residential real estate market. On or about the 25th of each month, NAR releases statistics on sales and prices of existing single-family homes for the nation and the four regions. These figures include condos and co-ops, in addition to single-family homes. NAR Existing One Family Home Sales Median Price Index reflects current sales rates, actual totals and median prices by month going back 12 months. Annual totals cover a period of three years, which includes all existing-home sales -- single-family, condos and co-ops--rolled into monthly and annual totals.
22. “Correlation of Monthly Returns.” Every investment asset, by definition, has a correlation coefficient of 1.0 with itself; 1.0 indicates 100% positive correlation. Two investments that always move in the opposite direction from each other have a correlation coefficient of -1.0; -1.0 indicates 100% negative correlation. Two investments that perform entirely independently of each other have a correlation coefficient of 0; 0 indicates 100% non-correlation. December 31, 1988 was used as the start date with respect to the underlying data because closing levels with respect to DBLCI-TR was not available prior to December 31, 1988.
WHILE THE FUND’S OBJECTIVE IS NOT TO GENERATE PROFIT THROUGH ACTIVE PORTFOLIO MANAGEMENT, BUT IS TO TRACK THE INDEX, BECAUSE THE INDEX WAS ESTABLISHED IN NOVEMBER 2006, CERTAIN INFORMATION RELATING TO INDEX CLOSING LEVELS MAY BE
-15-
CONSIDERED TO BE “HYPOTHETICAL.” HYPOTHETICAL INFORMATION MAY HAVE CERTAIN INHERENT LIMITATIONS, SOME OF WHICH ARE DESCRIBED BELOW.
NO REPRESENTATION IS BEING MADE THAT THE INDEX WILL OR IS LIKELY TO ACHIEVE ANNUAL OR CUMULATIVE CLOSING LEVELS CONSISTENT WITH OR SIMILAR TO THOSE SET FORTH HEREIN. SIMILARLY, NO REPRESENTATION IS BEING MADE THAT THE FUND WILL GENERATE PROFITS OR LOSSES SIMILAR TO THE FUND’S PAST PERFORMANCE, WHEN AVAILABLE, OR THE HISTORICAL ANNUAL OR CUMULATIVE CHANGES IN THE INDEX CLOSING LEVELS. IN FACT, THERE ARE FREQUENTLY SHARP DIFFERENCES BETWEEN HYPOTHETICAL RESULTS AND THE ACTUAL RESULTS SUBSEQUENTLY ACHIEVED BY INVESTMENT METHODOLOGIES, WHETHER ACTIVE OR PASSIVE.
ONE OF THE LIMITATIONS OF HYPOTHETICAL INFORMATION IS THAT IT IS GENERALLY PREPARED WITH THE BENEFIT OF HINDSIGHT. TO THE EXTENT THAT INFORMATION PRESENTED HEREIN RELATES TO THE PERIOD DECEMBER 1986 THROUGH OCTOBER 2006, THE INDEX CLOSING LEVELS REFLECT THE APPLICATION OF THE INDEX’S METHODOLOGY, AND SELECTION OF DX CONTRACTS, IN HINDSIGHT.
NO HYPOTHETICAL RECORD CAN COMPLETELY ACCOUNT FOR THE IMPACT OF FINANCIAL RISK IN ACTUAL TRADING. FOR EXAMPLE, THERE ARE NUMEROUS FACTORS, INCLUDING THOSE DESCRIBED UNDER “THE RISKS YOU FACE” HEREIN, RELATED TO THE CURRENCIES MARKETS IN GENERAL OR TO THE IMPLEMENTATION OF THE FUND’S EFFORTS TO TRACK ITS INDEX OVER TIME WHICH CANNOT BE, AND HAVE NOT BEEN, ACCOUNTED FOR IN THE PREPARATION OF SUCH INDEX INFORMATION SET FORTH ON THE FOLLOWING PAGES, ALL OF WHICH CAN ADVERSELY AFFECT ACTUAL PERFORMANCE RESULTS FOR THE FUND. FURTHERMORE, THE INDEX INFORMATION DOES NOT INVOLVE FINANCIAL RISK OR ACCOUNT FOR THE IMPACT OF FEES AND COSTS ASSOCIATED WITH THE FUND.
THE MANAGING OWNER COMMENCED OPERATIONS IN JANUARY 2006. AS MANAGING OWNER, THE MANAGING OWNER AND ITS TRADING PRINCIPALS HAVE BEEN MANAGING THE DAY-TO-DAY OPERATIONS FOR THE FUNDS AND RELATED PRODUCTS AND MANAGING FUTURES TRADING ACCOUNTS. BECAUSE THERE ARE LIMITED ACTUAL TRADING RESULTS TO COMPARE TO THE INDEX CLOSING LEVELS SET FORTH HEREIN, PROSPECTIVE INVESTORS SHOULD BE PARTICULARLY WARY OF PLACING UNDUE RELIANCE ON THE ANNUAL OR CUMULATIVE INDEX RESULTS.
ALTHOUGH THE INDEX SPONSOR WILL OBTAIN INFORMATION FOR INCLUSION IN OR FOR USE IN THE CALCULATION OF THE INDEX FROM SOURCE(S) WHICH THE INDEX SPONSOR CONSIDERS RELIABLE, THE INDEX SPONSOR WILL NOT INDEPENDENTLY VERIFY SUCH INFORMATION AND DOES NOT GUARANTEE THE ACCURACY AND/OR THE COMPLETENESS OF THE INDEX OR ANY DATA INCLUDED THEREIN. THE INDEX SPONSOR SHALL NOT BE LIABLE (WHETHER IN NEGLIGENCE OR OTHERWISE) TO ANY PERSON FOR ANY ERROR IN THE INDEX AND THE INDEX SPONSOR IS UNDER NO OBLIGATION TO ADVISE ANY PERSON OF ANY ERROR THEREIN.
UNLESS OTHERWISE SPECIFIED, NO TRANSACTION RELATING TO THE INDEX IS SPONSORED, ENDORSED, SOLD OR PROMOTED BY THE INDEX SPONSOR AND THE INDEX SPONSOR MAKES NO EXPRESS OR IMPLIED REPRESENTATIONS OR WARRANTIES AS TO (A) THE ADVISABILITY OF PURCHASING OR ASSUMING ANY RISK IN CONNECTION WITH ANY SUCH TRANSACTION (B) THE LEVELS AT WHICH THE INDEX STANDS AT ANY PARTICULAR TIME ON ANY PARTICULAR DATE (C) THE RESULTS TO BE OBTAINED BY THE ISSUER OF ANY SECURITY OR ANY COUNTERPARTY OR ANY SUCH ISSUER’S SECURITY HOLDERS OR CUSTOMERS OR ANY SUCH COUNTERPARTY’S CUSTOMERS OR COUNTERPARTIES OR ANY OTHER PERSON OR ENTITY FROM THE USE OF THE INDEX OR ANY DATA INCLUDED THEREIN IN CONNECTION WITH ANY LICENSED RIGHTS OR FOR ANY OTHER USE OR (D) ANY OTHER MATTER. THE INDEX SPONSOR MAKES NO EXPRESS OR IMPLIED REPRESENTATIONS OR WARRANTIES OF MERCHANTABILITY OR FITNESS FOR A PARTICULAR PURPOSE WITH RESPECT TO THE INDEX OR ANY DATA INCLUDED THEREIN.
WITHOUT LIMITING ANY OF THE FOREGOING, IN NO EVENT SHALL THE INDEX SPONSOR HAVE ANY LIABILITY (WHETHER IN NEGLIGENCE OR OTHERWISE) TO ANY PERSON FOR ANY DIRECT, INDIRECT, SPECIAL, PUNITIVE, CONSEQUENTIAL OR ANY OTHER DAMAGES (INCLUDING LOST PROFITS) EVEN IF NOTIFIED OF THE POSSIBILITY OF SUCH DAMAGES. |
-16-
DATA
RELATING TO THE
SHORT INDEX
DEUTSCHE BANK SHORT US DOLLAR INDEX (USDX®) FUTURES INDEX – EXCESS RETURNTM
DEUTSCHE BANK SHORT US DOLLAR INDEX (USDX®) FUTURES INDEX – TOTAL RETURNTM
The following data relates to the Short Index closing levels and various statistical measures, each of which either analyzes the Short Index closing levels data in terms of volatility, Sharpe Ratios, etc. or compares the Short Index closing levels against various relevant benchmarks. The Short Index is calculated on both an excess return and total return basis.
THE BEARISH FUND TRADES WITH A VIEW TO TRACKING THE DEUTSCHE BANK SHORT US DOLLAR INDEX (USDX®) FUTURES INDEX – EXCESS RETURNTM OVER TIME.
THE BEARISH FUND DOES NOT TRADE WITH A VIEW TO TRACKING THE DEUTSCHE BANK SHORT US DOLLAR INDEX (USDX®) FUTURES INDEX – TOTAL RETURNTM OVER TIME.
17
CLOSING LEVELS TABLE
DEUTSCHE BANK SHORT US DOLLAR INDEX (USDX®) FUTURES INDEX – EXCESS RETURNTM
| Closing Level | ||||||||
| High1 | Low2 | Annual Index Changes3 | Index Changes Since Inception4 | |||||
19865 | 100.00 | 100.00 | 0.00 | 0.00 | ||||
1987 | 123.07 | 99.42 | 23.07% | 23.07% | ||||
1988 | 122.24 | 105.99 | -7.47% | 13.88% | ||||
1989 | 113.97 | 98.33 | -2.79% | 10.70% | ||||
1990 | 128.74 | 109.22 | 14.37% | 26.61% | ||||
1991 | 131.41 | 109.44 | 1.96% | 29.10% | ||||
1992 | 141.41 | 120.25 | -5.86% | 21.54% | ||||
1993 | 129.24 | 119.46 | 0.00% | 21.53% | ||||
1994 | 140.43 | 121.84 | 11.30% | 35.26% | ||||
1995 | 148.76 | 133.74 | 4.64% | 41.54% | ||||
1996 | 141.66 | 134.35 | -4.21% | 35.59% | ||||
1997 | 135.23 | 115.36 | -13.47% | 17.32% | ||||
1998 | 125.36 | 113.35 | 4.85% | 23.01% | ||||
1999 | 123.92 | 109.83 | -8.91% | 12.05% | ||||
2000 | 113.78 | 94.09 | -9.29% | 1.64% | ||||
2001 | 102.32 | 91.91 | -5.82% | -4.28% | ||||
2002 | 110.87 | 92.90 | 15.83% | 10.87% | ||||
2003 | 130.21 | 109.65 | 17.44% | 30.21% | ||||
2004 | 141.83 | 123.83 | 8.41% | 41.16% | ||||
2005 | 140.46 | 122.29 | -12.22% | 23.91% | ||||
2006 | 134.51 | 124.03 | 6.88% | 32.43% | ||||
2007 | 145.62 | 129.74 | 7.48% | 42.33% | ||||
2008 | 153.28 | 123.41 | -5.54% | 34.45% | ||||
2009 | 149.62 | 123.96 | 6.34% | 42.97% | ||||
2010 | 145.80 | 125.18 | -1.22% | 41.22% | ||||
20116 | 153.04 | 137.70 | 8.37% | 53.04% | ||||
THE BEARISH FUND TRADES WITH A VIEW TO TRACKING THE
DEUTSCHE BANK SHORT US DOLLAR INDEX (USDX®) FUTURES INDEX – EXCESS RETURNTMOVER TIME.
NEITHER THE PAST PERFORMANCE OF THE FUND NOR THE PRIOR INDEX LEVELS AND CHANGES, POSITIVE AND NEGATIVE, SHOULD BE TAKEN AS AN INDICATION OF THE FUND’S FUTURE PERFORMANCE.
DEUTSCHE BANK SHORT US DOLLAR INDEX (USDX®) FUTURES INDEX – TOTAL RETURNTM
| Closing Level | ||||||||
| High1 | Low2 | Annual Index Changes3 | Index Changes Since Inception4 | |||||
19865 | 100.00 | 100.00 | 0.00 | 0.00 | ||||
1987 | 130.76 | 99.50 | 30.76% | 30.76% | ||||
1988 | 131.84 | 117.08 | -0.78% | 29.74% | ||||
1989 | 137.94 | 116.55 | 5.60% | 37.00% | ||||
1990 | 170.77 | 135.31 | 23.51% | 69.21% | ||||
1991 | 182.61 | 150.65 | 7.70% | 82.25% | ||||
1992 | 204.64 | 170.95 | -2.50% | 77.69% | ||||
1993 | 192.01 | 175.28 | 3.10% | 83.19% | ||||
1994 | 218.80 | 183.73 | 16.20% | 112.86% | ||||
1995 | 240.62 | 210.69 | 10.66% | 135.54% | ||||
1996 | 241.78 | 228.68 | 0.85% | 137.55% | ||||
1997 | 236.99 | 208.43 | -8.89% | 116.42% | ||||
1998 | 240.56 | 212.61 | 10.07% | 138.22% | ||||
1999 | 240.09 | 217.83 | -4.51% | 127.49% | ||||
2000 | 231.10 | 200.46 | -3.77% | 118.92% | ||||
2001 | 220.85 | 202.43 | -2.46% | 113.52% | ||||
2002 | 251.42 | 207.52 | 17.75% | 151.42% | ||||
2003 | 298.30 | 248.66 | 18.65% | 198.30% | ||||
2004 | 329.45 | 284.67 | 9.92% | 227.89% | ||||
2005 | 327.76 | 291.86 | -9.38% | 197.12% | ||||
2006 | 337.28 | 299.84 | 12.13% | 233.15% | ||||
2007 | 381.95 | 327.04 | 12.39% | 274.43% | ||||
2008 | 406.25 | 329.16 | -4.22% | 258.61% | ||||
2009 | 399.63 | 330.77 | 6.49% | 281.89% | ||||
2010 | 389.88 | 334.55 | -1.09% | 277.72% | ||||
20116 | 409.50 | 368.32 | 8.41% | 309.50% | ||||
THE BEARISH FUND DOES NOT TRADE WITH A VIEW TO TRACKING THE
DEUTSCHE BANK SHORT US DOLLAR INDEX (USDX®) FUTURES INDEX – TOTAL RETURNTMOVER TIME.
NEITHER THE PAST PERFORMANCE OF THE FUND NOR THE PRIOR INDEX LEVELS AND CHANGES, POSITIVE AND NEGATIVE, SHOULD BE TAKEN AS AN INDICATION OF THE FUND’S FUTURE PERFORMANCE.
See accompanying Notes and Legends.
18
| All Statistics based on data from December 31, 1986 to April 30, 2011 | ||||||||||||||
| Various Statistical Measures | DB Short Future ER7,8 | DB Short Future TR8,9 | Spot Index10 | |||||||||||
Annualized Changes to Index Level11 | 1.8% | 6.0% | -1.4% | |||||||||||
Average rolling 3 month volatility12 | 8.6% | 8.6% | 8.4% | |||||||||||
Sharpe Ratio13 | -0.40 | 0.08 | -0.80 | |||||||||||
% of months with positive change14 | 55% | 60% | 46% | |||||||||||
Average monthly positive change15 | 2.0% | 2.1% | 2.0% | |||||||||||
Average monthly negative change16 | -2.0% | -1.9% | -1.9% | |||||||||||
| Annualized Index Levels17 | DB Short Future ER7,8 | DB Short Future TR8,9 | Spot Index10 | |||||||||||
1 yr | 12.1% | 12.3% | -10.9% | |||||||||||
3 yr | 0.5% | 0.8% | 0.2% | |||||||||||
5 yr | 3.3% | 5.2% | -3.3% | |||||||||||
7 yr | 2.8% | 5.1% | -3.0% | |||||||||||
10 yr | 4.8% | 6.9% | -4.5% | |||||||||||
15 yr | 0.8% | 3.9% | -1.2% | |||||||||||
Correlation of Monthly Returns*,22 | ||||||||||||||
| DB Short Future TR7,8 | S&P 500 TR18 | iBoxx US Treasuries19 | DBLCI TR20 | NAR Existing One Family Home Sales Median Price Index21 | ||||||||||
DB Short Future TR7,8 | 1.00 | 0.14 | 0.26 | 0.25 | 0.01 | |||||||||
S&P 500 TR18 | 0.14 | 1.00 | -0.27 | 0.11 | 0.07 | |||||||||
iBoxx US Treasuries19 | 0.26 | -0.27 | 1.00 | -0.08 | -0.12 | |||||||||
DBLCI TR20 | 0.25 | 0.11 | -0.08 | 1.00 | 0.03 | |||||||||
NAR Existing One Family Home Sales Median Price Index21 | 0.01 | 0.07 | -0.12 | 0.03 | 1.00 | |||||||||
NEITHER THE PAST PERFORMANCE OF THE FUND NOR THE PRIOR INDEX LEVELS AND CHANGES, POSITIVE AND NEGATIVE, SHOULD BE TAKEN AS AN INDICATION OF THE FUND’S FUTURE PERFORMANCE.
* “Correlation” is a statistical term which describes the degree to which two or more asset classes show a tendency to rise or fall in value together. Diversification of an investment portfolio among asset classes that are not correlated with each other tends to reduce overall volatility and risk in the portfolio as a whole. The hypothetical returns of DB Short Future TR have been compared with the S&P 500 TR, the iBoxx US Treasuries, the DBCLI TR and the NAR Existing One Family Home Sales Median Price Index to permit an investor to compare and contrast the degree of correlation between DB Short Future TR (which is a currency index) and indices which are commonly used to measure the performance of the equity, fixed income, commodity and real estate markets, respectively.
WHILE THE FUND’S OBJECTIVE IS NOT TO GENERATE PROFIT THROUGH ACTIVE PORTFOLIO MANAGEMENT, BUT IS TO TRACK THE INDEX, BECAUSE THE INDEX WAS ESTABLISHED IN NOVEMBER 2006, CERTAIN INFORMATION RELATING TO INDEX CLOSING LEVELS MAY BE CONSIDERED TO BE “HYPOTHETICAL.” HYPOTHETICAL INFORMATION MAY HAVE CERTAIN INHERENT LIMITATIONS, SOME OF WHICH ARE DESCRIBED BELOW.
NO REPRESENTATION IS BEING MADE THAT THE INDEX WILL OR IS LIKELY TO ACHIEVE ANNUAL OR CUMULATIVE CLOSING LEVELS CONSISTENT WITH OR SIMILAR TO THOSE SET FORTH HEREIN. SIMILARLY, NO REPRESENTATION IS BEING MADE THAT THE FUND WILL GENERATE PROFITS OR LOSSES SIMILAR TO THE FUND’S PAST PERFORMANCE, WHEN AVAILABLE, OR THE HISTORICAL ANNUAL OR CUMULATIVE CHANGES IN THE INDEX CLOSING LEVELS. IN FACT, THERE ARE FREQUENTLY SHARP DIFFERENCES BETWEEN HYPOTHETICAL RESULTS AND THE ACTUAL RESULTS SUBSEQUENTLY ACHIEVED BY INVESTMENT METHODOLOGIES, WHETHER ACTIVE OR PASSIVE.
ONE OF THE LIMITATIONS OF HYPOTHETICAL INFORMATION IS THAT IT IS GENERALLY PREPARED WITH THE BENEFIT OF HINDSIGHT. TO THE EXTENT THAT INFORMATION PRESENTED HEREIN RELATES TO THE PERIOD DECEMBER 1986 THROUGH OCTOBER 2006, THE INDEX CLOSING LEVELS REFLECT THE APPLICATION OF THE INDEX’S METHODOLOGY, AND SELECTION OF DX CONTRACTS, IN HINDSIGHT.
NO HYPOTHETICAL RECORD CAN COMPLETELY ACCOUNT FOR THE IMPACT OF FINANCIAL RISK IN ACTUAL TRADING. FOR EXAMPLE, THERE ARE NUMEROUS FACTORS, INCLUDING THOSE DESCRIBED UNDER “THE RISKS YOU FACE” HEREIN, RELATED TO THE CURRENCIES MARKETS IN GENERAL OR TO THE IMPLEMENTATION OF THE FUND’S EFFORTS TO TRACK ITS INDEX OVER TIME WHICH CANNOT BE, AND HAVE NOT BEEN, ACCOUNTED FOR IN THE PREPARATION OF SUCH INDEX INFORMATION SET FORTH ON THE FOLLOWING PAGES, ALL OF WHICH CAN ADVERSELY AFFECT ACTUAL PERFORMANCE RESULTS FOR THE FUND. FURTHERMORE, THE INDEX INFORMATION DOES NOT INVOLVE FINANCIAL RISK OR ACCOUNT FOR THE IMPACT OF FEES AND COSTS ASSOCIATED WITH THE FUND.
THE MANAGING OWNER COMMENCED OPERATIONS IN JANUARY 2006. AS MANAGING OWNER, THE MANAGING OWNER AND ITS TRADING PRINCIPALS HAVE BEEN MANAGING THE DAY-TO-DAY OPERATIONS FOR THE FUNDS AND RELATED PRODUCTS AND MANAGING FUTURES TRADING ACCOUNTS. BECAUSE THERE ARE LIMITED ACTUAL TRADING RESULTS TO COMPARE TO THE INDEX CLOSING LEVELS SET FORTH HEREIN, PROSPECTIVE INVESTORS SHOULD BE PARTICULARLY WARY OF PLACING UNDUE RELIANCE ON THE ANNUAL OR CUMULATIVE INDEX RESULTS.
See accompanying Notes and Legends.
19
COMPARISON OF VARIOUS US DOLLAR INDICES
(DECEMBER 31, 1986 – APRIL 30, 2011)
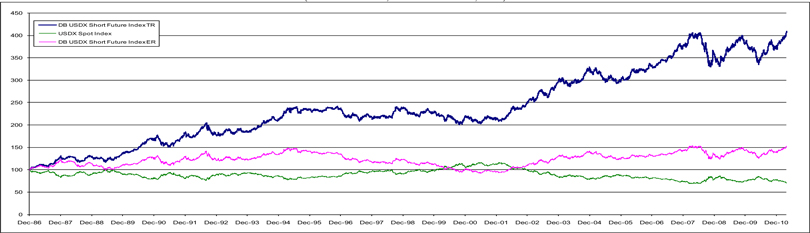
NEITHER THE PAST PERFORMANCE OF THE FUND NOR THE PRIOR INDEX LEVELS AND CHANGES, POSITIVE AND NEGATIVE, SHOULD BE TAKEN AS AN INDICATION OF THE FUND’S FUTURE PERFORMANCE.
Each of the DB Short Future-ER, DB Short Future-TR and Spot Index are indices and do not reflect actual trading or any fees or expenses.
Spot Index is calculated on an excess return basis.
WHILE THE FUND’S OBJECTIVE IS NOT TO GENERATE PROFIT THROUGH ACTIVE PORTFOLIO MANAGEMENT, BUT IS TO TRACK THE INDEX, BECAUSE THE INDEX WAS ESTABLISHED IN NOVEMBER 2006, CERTAIN INFORMATION RELATING TO INDEX CLOSING LEVELS MAY BE CONSIDERED TO BE “HYPOTHETICAL.” HYPOTHETICAL INFORMATION MAY HAVE CERTAIN INHERENT LIMITATIONS, SOME OF WHICH ARE DESCRIBED BELOW.
NO REPRESENTATION IS BEING MADE THAT THE INDEX WILL OR IS LIKELY TO ACHIEVE ANNUAL OR CUMULATIVE CLOSING LEVELS CONSISTENT WITH OR SIMILAR TO THOSE SET FORTH HEREIN. SIMILARLY, NO REPRESENTATION IS BEING MADE THAT THE FUND WILL GENERATE PROFITS OR LOSSES SIMILAR TO THE FUND’S PAST PERFORMANCE, WHEN AVAILABLE, OR THE HISTORICAL ANNUAL OR CUMULATIVE CHANGES IN THE INDEX CLOSING LEVELS. IN FACT, THERE ARE FREQUENTLY SHARP DIFFERENCES BETWEEN HYPOTHETICAL RESULTS AND THE ACTUAL RESULTS SUBSEQUENTLY ACHIEVED BY INVESTMENT METHODOLOGIES, WHETHER ACTIVE OR PASSIVE.
ONE OF THE LIMITATIONS OF HYPOTHETICAL INFORMATION IS THAT IT IS GENERALLY PREPARED WITH THE BENEFIT OF HINDSIGHT. TO THE EXTENT THAT INFORMATION PRESENTED HEREIN RELATES TO THE PERIOD DECEMBER 1986 THROUGH OCTOBER 2006, THE INDEX CLOSING LEVELS REFLECT THE APPLICATION OF THE INDEX’S METHODOLOGY, AND SELECTION OF DX CONTRACTS, IN HINDSIGHT.
NO HYPOTHETICAL RECORD CAN COMPLETELY ACCOUNT FOR THE IMPACT OF FINANCIAL RISK IN ACTUAL TRADING. FOR EXAMPLE, THERE ARE NUMEROUS FACTORS, INCLUDING THOSE DESCRIBED UNDER “THE RISKS YOU FACE” HEREIN, RELATED TO THE CURRENCIES MARKETS IN GENERAL OR TO THE IMPLEMENTATION OF THE FUND’S EFFORTS TO TRACK ITS INDEX OVER TIME WHICH CANNOT BE, AND HAVE NOT BEEN, ACCOUNTED FOR IN THE PREPARATION OF SUCH INDEX INFORMATION SET FORTH ON THE FOLLOWING PAGES, ALL OF WHICH CAN ADVERSELY AFFECT ACTUAL PERFORMANCE RESULTS FOR THE FUND. FURTHERMORE, THE INDEX INFORMATION DOES NOT INVOLVE FINANCIAL RISK OR ACCOUNT FOR THE IMPACT OF FEES AND COSTS ASSOCIATED WITH THE FUND.
THE MANAGING OWNER COMMENCED OPERATIONS IN JANUARY 2006. AS MANAGING OWNER, THE MANAGING OWNER AND ITS TRADING PRINCIPALS HAVE BEEN MANAGING THE DAY-TO-DAY OPERATIONS FOR THE FUNDS AND RELATED PRODUCTS AND MANAGING FUTURES TRADING ACCOUNTS. BECAUSE THERE ARE LIMITED ACTUAL TRADING RESULTS TO COMPARE TO THE INDEX CLOSING LEVELS SET FORTH HEREIN, PROSPECTIVE INVESTORS SHOULD BE PARTICULARLY WARY OF PLACING UNDUE RELIANCE ON THE ANNUAL OR CUMULATIVE INDEX RESULTS.
| See accompanying Notes and Legends. |
20
COMPARISON OF ANNUAL RETURNS OF COMPARISON OF VARIOUS US DOLLAR INDICES
(DECEMBER 31, 1986 – APRIL 30, 2011)
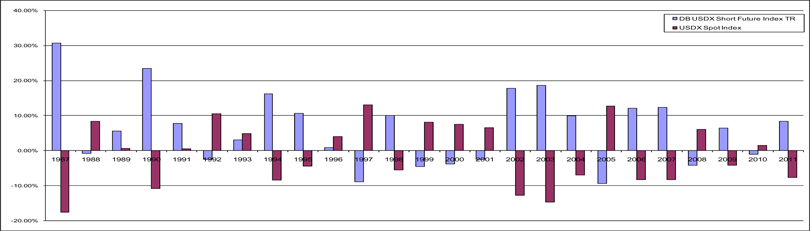
NEITHER THE PAST PERFORMANCE OF THE FUND NOR THE PRIOR INDEX LEVELS AND CHANGES, POSITIVE AND NEGATIVE, SHOULD BE TAKEN AS AN INDICATION OF THE FUND’S FUTURE PERFORMANCE.
Each of the DB Short Future-ER and Spot Index are indices and do not reflect actual trading or any fees or expenses.
Spot Index is calculated on an excess return basis.
WHILE THE FUND’S OBJECTIVE IS NOT TO GENERATE PROFIT THROUGH ACTIVE PORTFOLIO MANAGEMENT, BUT IS TO TRACK THE INDEX, BECAUSE THE INDEX WAS ESTABLISHED IN NOVEMBER 2006, CERTAIN INFORMATION RELATING TO INDEX CLOSING LEVELS MAY BE CONSIDERED TO BE “HYPOTHETICAL.” HYPOTHETICAL INFORMATION MAY HAVE CERTAIN INHERENT LIMITATIONS, SOME OF WHICH ARE DESCRIBED BELOW.
NO REPRESENTATION IS BEING MADE THAT THE INDEX WILL OR IS LIKELY TO ACHIEVE ANNUAL OR CUMULATIVE CLOSING LEVELS CONSISTENT WITH OR SIMILAR TO THOSE SET FORTH HEREIN. SIMILARLY, NO REPRESENTATION IS BEING MADE THAT THE FUND WILL GENERATE PROFITS OR LOSSES SIMILAR TO THE FUND’S PAST PERFORMANCE, WHEN AVAILABLE, OR THE HISTORICAL ANNUAL OR CUMULATIVE CHANGES IN THE INDEX CLOSING LEVELS. IN FACT, THERE ARE FREQUENTLY SHARP DIFFERENCES BETWEEN HYPOTHETICAL RESULTS AND THE ACTUAL RESULTS SUBSEQUENTLY ACHIEVED BY INVESTMENT METHODOLOGIES, WHETHER ACTIVE OR PASSIVE.
ONE OF THE LIMITATIONS OF HYPOTHETICAL INFORMATION IS THAT IT IS GENERALLY PREPARED WITH THE BENEFIT OF HINDSIGHT. TO THE EXTENT THAT INFORMATION PRESENTED HEREIN RELATES TO THE PERIOD DECEMBER 1986 THROUGH OCTOBER 2006, THE INDEX CLOSING LEVELS REFLECT THE APPLICATION OF THE INDEX’S METHODOLOGY, AND SELECTION OF DX CONTRACTS, IN HINDSIGHT.
NO HYPOTHETICAL RECORD CAN COMPLETELY ACCOUNT FOR THE IMPACT OF FINANCIAL RISK IN ACTUAL TRADING. FOR EXAMPLE, THERE ARE NUMEROUS FACTORS, INCLUDING THOSE DESCRIBED UNDER “THE RISKS YOU FACE” HEREIN, RELATED TO THE CURRENCIES MARKETS IN GENERAL OR TO THE IMPLEMENTATION OF THE FUND’S EFFORTS TO TRACK ITS INDEX OVER TIME WHICH CANNOT BE, AND HAVE NOT BEEN, ACCOUNTED FOR IN THE PREPARATION OF SUCH INDEX INFORMATION SET FORTH ON THE FOLLOWING PAGES, ALL OF WHICH CAN ADVERSELY AFFECT ACTUAL PERFORMANCE RESULTS FOR THE FUND. FURTHERMORE, THE INDEX INFORMATION DOES NOT INVOLVE FINANCIAL RISK OR ACCOUNT FOR THE IMPACT OF FEES AND COSTS ASSOCIATED WITH THE FUND.
THE MANAGING OWNER COMMENCED OPERATIONS IN JANUARY 2006. AS MANAGING OWNER, THE MANAGING OWNER AND ITS TRADING PRINCIPALS HAVE BEEN MANAGING THE DAY-TO-DAY OPERATIONS FOR THE FUNDS AND RELATED PRODUCTS AND MANAGING FUTURES TRADING ACCOUNTS. BECAUSE THERE ARE LIMITED ACTUAL TRADING RESULTS TO COMPARE TO THE INDEX CLOSING LEVELS SET FORTH HEREIN, PROSPECTIVE INVESTORS SHOULD BE PARTICULARLY WARY OF PLACING UNDUE RELIANCE ON THE ANNUAL OR CUMULATIVE INDEX RESULTS.
| See accompanying Notes and Legends. |
21
NOTES AND LEGENDS:
1. “High” reflects the highest closing level of the Index during the applicable year.
2. “Low” reflects the lowest closing level of the Index during the applicable year.
3. “Annual Index Changes” reflect the change to the Index level on an annual basis as of December 31 of each applicable year.
4. “Index Changes Since Inception” reflects the change of the Index level since inception on a compounded annual basis as of December 31 of each applicable year.
5. Closing levels as of Base Date of December 31, 1986.
6. Closing levels as of April 30, 2011.
7. “DB Short Future ER” is the Deutsche Bank Short US Dollar Index (USDX®) Futures Index – Excess ReturnTM with respect to the Short Index. The Deutsche Bank Short US Dollar Index (USDX®) Futures IndexTM is calculated on both an excess return basis and total return basis. The DB Short Future ER calculation is not funded and reflects the changes in market value over time, whether positive or negative, of the underlying DX Contracts. The sponsor of the Index, or the Index Sponsor, is Deutsche Bank AG London.
8. If a Fund’s interest income from its holdings of fixed income securities were to exceed the Fund’s fees and expenses, the total return on an investment in a Fund is expected to outperform the DB Short Future ER and underperform the DB Short Future TR (as such term is defined in the following footnote). The only difference between the DB Short Future ER and the DB Short Future TR is that the DB Short Future ER does not include interest income from a hypothetical basket of fixed income securities while the DB Short Future TR does include such a component. The difference in the changes in market value over time, whether positive or negative, in the DB Short Future ER and the DB Short Future TR is attributable entirely to the hypothetical interest income from this hypothetical basket of fixed income securities. If a Fund’s interest income from its holdings of fixed-income securities exceeds such Fund’s fees and expenses, then the amount of such excess is expected to be distributed periodically. The market price of the Shares is expected to track closely the DB Short Future ER. The total return on an investment in a Fund over any period is the sum of the capital appreciation or depreciation of the Shares over the period, plus the amount of any distributions during the period. Consequently, a Fund’s total return is expected to outperform the DB Short Future ER by the amount of the excess, if any, of its interest income over its fees and expenses but, as a result of such Fund’s fees and expenses, the total return on a Fund is expected to underperform the DB Short Future TR. If a Fund’s fees and expenses were to exceed such Fund’s interest income from its holdings of fixed income securities, such Fund would underperform the DB Short Future ER.
9. “DB Short Future TR” is the Deutsche Bank Short US Dollar Index (USDX®) Futures Index – Total ReturnTM with respect to the Short Index. The Deutsche Bank Short US Dollar Index (USDX®) Futures IndexTM is calculated on both an excess return basis and total return basis. The DB Short Future TR calculation is funded and reflects the changes in market value over time, whether positive or negative, of both the underlying DX Contracts and the interest income from a hypothetical basket of fixed income securities. The sponsor of the Index, or the Index Sponsor, is Deutsche Bank AG London.
10. “Spot Index” is the U.S. Dollar Index (USDX®), which provides a general indication of the international value of the USD by averaging the exchange rates between the USD and the six major world currencies the Spot Index Euro, Japanese Yen, British Pound, Canadian Dollar, Swedish Krona and Swiss Franc. The USDX® mark is a registered service mark owned by ICE Futures U.S., Inc.
11. “Annualized Changes to Index Level” reflects the changes of the applicable index on an annual basis as of December 31 of each applicable year. |
-22-
12. “Average rolling 3 month daily volatility.” The daily volatility reflects the relative rate at which the price of the applicable index moves up and down, which is found by calculating the annualized standard deviation of the daily change in price. In turn, an average of this value is calculated on a 3 month rolling basis.
13. “Sharpe Ratio” compares the annualized rate of return minus the annualized risk-free rate of return to the annualized variability — often referred to as the “standard deviation” — of the monthly rates of return. A Sharpe Ratio of 1:1 or higher indicates that, according to the measures used in calculating the ratio, the rate of return achieved by a particular strategy has equaled or exceeded the risks assumed by such strategy. The risk-free rate of return that was used in these calculations was assumed to be 5.25%.
14. “% of months with positive change” during the period from inception to April 30, 2011.
15. “Average monthly positive change” during the period from inception to April 30, 2011.
16. “Average monthly negative change” during the period from inception to April 30, 2011.
17. “Annualized Index Levels” reflects the change in the applicable index on an annual basis as of December 31 of each the applicable time period (e.g., 1 year, 3, 5, 7, 10 or 15 years).
18. “S&P 500 TR” is the Standard & Poor’s index calculated on a total return basis. Widely regarded as the benchmark gauge of the U.S. equities market, this index includes a representative sample of 500 leading companies in leading industries of the U.S. economy. Although the S&P 500 focuses on the large-cap segment of the market, with approximately 80% coverage of U.S. equities, it also serves as a proxy for the total market. The total return calculation provides investors with a price-plus-gross cash dividend return. Gross cash dividends are applied on the ex-date of the dividend.
19. “iBoxx US Treasuries” means the Markit iBoxx USD Treasuries index, a sub-index of the Markit iBoxx USD Overall index which covers all USD-denominated investment grade bonds.
20. “DBLCI-TR” is the Deutsche Bank Liquid Commodity IndexTM -- Total Return. This Index is intended to reflect the changes in notional value in the following commodities: Light, Sweet Crude Oil, Heating Oil, Aluminum, Gold, Corn and Wheat. The notional amounts of each index commodity included in this index are broadly in proportion to historical levels of the world’s production and stocks of the index commodities. The sponsor of the Index, or the Index Sponsor, is Deutsche Bank AG London. Deutsche Bank Liquid Commodity IndexTM – Total Return is a trade mark of Deutsche Bank AG and is the subject of Community Trade Mark Number 3054996. Trade Mark applications in the United States are pending.
21. “NAR Existing One Family Home Sales Median Price Index” is one component of The National Association Of Realtors® Existing-Home Sales Series, which is the premier measurement of national and regional residential real estate market. On or about the 25th of each month, NAR releases statistics on sales and prices of existing single-family homes for the nation and the four regions. These figures include condos and co-ops, in addition to single-family homes. NAR Existing One Family Home Sales Median Price Index reflects current sales rates, actual totals and median prices by month going back 12 months. Annual totals cover a period of three years, which includes all existing-home sales -- single-family, condos and co-ops--rolled into monthly and annual totals.
22. “Correlation of Monthly Returns.” Every investment asset, by definition, has a correlation coefficient of 1.0 with itself; 1.0 indicates 100% positive correlation. Two investments that always move in the opposite direction from each other have a correlation coefficient of -1.0; -1.0 indicates 100% negative correlation. Two investments that perform entirely independently of each other have a correlation coefficient of 0; 0 indicates 100% non-correlation. December 31, 1988 was used as the start date with respect to the underlying data because closing levels with respect to DBLCI-TR was not available prior to December 31, 1988. |
-23-
WHILE THE FUND’S OBJECTIVE IS NOT TO GENERATE PROFIT THROUGH ACTIVE PORTFOLIO MANAGEMENT, BUT IS TO TRACK THE INDEX, BECAUSE THE INDEX WAS ESTABLISHED IN NOVEMBER 2006, CERTAIN INFORMATION RELATING TO INDEX CLOSING LEVELS MAY BE CONSIDERED TO BE “HYPOTHETICAL.” HYPOTHETICAL INFORMATION MAY HAVE CERTAIN INHERENT LIMITATIONS, SOME OF WHICH ARE DESCRIBED BELOW. |
NO REPRESENTATION IS BEING MADE THAT THE INDEX WILL OR IS LIKELY TO ACHIEVE ANNUAL OR CUMULATIVE CLOSING LEVELS CONSISTENT WITH OR SIMILAR TO THOSE SET FORTH HEREIN. SIMILARLY, NO REPRESENTATION IS BEING MADE THAT THE FUND WILL GENERATE PROFITS OR LOSSES SIMILAR TO THE FUND’S PAST PERFORMANCE, WHEN AVAILABLE, OR THE HISTORICAL ANNUAL OR CUMULATIVE CHANGES IN THE INDEX CLOSING LEVELS. IN FACT, THERE ARE FREQUENTLY SHARP DIFFERENCES BETWEEN HYPOTHETICAL RESULTS AND THE ACTUAL RESULTS SUBSEQUENTLY ACHIEVED BY INVESTMENT METHODOLOGIES, WHETHER ACTIVE OR PASSIVE.
ONE OF THE LIMITATIONS OF HYPOTHETICAL INFORMATION IS THAT IT IS GENERALLY PREPARED WITH THE BENEFIT OF HINDSIGHT. TO THE EXTENT THAT INFORMATION PRESENTED HEREIN RELATES TO THE PERIOD DECEMBER 1986 THROUGH OCTOBER 2006, THE INDEX CLOSING LEVELS REFLECT THE APPLICATION OF THE INDEX’S METHODOLOGY, AND SELECTION OF DX CONTRACTS, IN HINDSIGHT.
NO HYPOTHETICAL RECORD CAN COMPLETELY ACCOUNT FOR THE IMPACT OF FINANCIAL RISK IN ACTUAL TRADING. FOR EXAMPLE, THERE ARE NUMEROUS FACTORS, INCLUDING THOSE DESCRIBED UNDER “THE RISKS YOU FACE” HEREIN, RELATED TO THE CURRENCIES MARKETS IN GENERAL OR TO THE IMPLEMENTATION OF THE FUND’S EFFORTS TO TRACK ITS INDEX OVER TIME WHICH CANNOT BE, AND HAVE NOT BEEN, ACCOUNTED FOR IN THE PREPARATION OF SUCH INDEX INFORMATION SET FORTH ON THE FOLLOWING PAGES, ALL OF WHICH CAN ADVERSELY AFFECT ACTUAL PERFORMANCE RESULTS FOR THE FUND. FURTHERMORE, THE INDEX INFORMATION DOES NOT INVOLVE FINANCIAL RISK OR ACCOUNT FOR THE IMPACT OF FEES AND COSTS ASSOCIATED WITH THE FUND.
THE MANAGING OWNER COMMENCED OPERATIONS IN JANUARY 2006. AS MANAGING OWNER, THE MANAGING OWNER AND ITS TRADING PRINCIPALS HAVE BEEN MANAGING THE DAY-TO-DAY OPERATIONS FOR THE FUNDS AND RELATED PRODUCTS AND MANAGING FUTURES TRADING ACCOUNTS. BECAUSE THERE ARE LIMITED ACTUAL TRADING RESULTS TO COMPARE TO THE INDEX CLOSING LEVELS SET FORTH HEREIN, PROSPECTIVE INVESTORS SHOULD BE PARTICULARLY WARY OF PLACING UNDUE RELIANCE ON THE ANNUAL OR CUMULATIVE INDEX RESULTS.
ALTHOUGH THE INDEX SPONSOR WILL OBTAIN INFORMATION FOR INCLUSION IN OR FOR USE IN THE CALCULATION OF THE INDEX FROM SOURCE(S) WHICH THE INDEX SPONSOR CONSIDERS RELIABLE, THE INDEX SPONSOR WILL NOT INDEPENDENTLY VERIFY SUCH INFORMATION AND DOES NOT GUARANTEE THE ACCURACY AND/OR THE COMPLETENESS OF THE INDEX OR ANY DATA INCLUDED THEREIN. THE INDEX SPONSOR SHALL NOT BE LIABLE (WHETHER IN NEGLIGENCE OR OTHERWISE) TO ANY PERSON FOR ANY ERROR IN THE INDEX AND THE INDEX SPONSOR IS UNDER NO OBLIGATION TO ADVISE ANY PERSON OF ANY ERROR THEREIN.
UNLESS OTHERWISE SPECIFIED, NO TRANSACTION RELATING TO THE INDEX IS SPONSORED, ENDORSED, SOLD OR PROMOTED BY THE INDEX SPONSOR AND THE INDEX SPONSOR MAKES NO EXPRESS OR IMPLIED REPRESENTATIONS OR WARRANTIES AS TO (A) THE ADVISABILITY OF PURCHASING OR ASSUMING ANY RISK IN CONNECTION WITH ANY SUCH TRANSACTION (B) THE LEVELS AT WHICH THE INDEX STANDS AT ANY PARTICULAR TIME ON ANY PARTICULAR DATE (C) THE RESULTS TO BE OBTAINED BY THE ISSUER OF ANY SECURITY OR ANY COUNTERPARTY OR ANY SUCH ISSUER’S SECURITY HOLDERS OR CUSTOMERS OR ANY SUCH COUNTERPARTY’S CUSTOMERS OR COUNTERPARTIES OR ANY OTHER PERSON OR ENTITY FROM THE USE OF THE INDEX OR ANY DATA INCLUDED THEREIN IN CONNECTION WITH ANY LICENSED RIGHTS OR FOR ANY OTHER USE OR (D) ANY OTHER MATTER. THE INDEX SPONSOR MAKES NO EXPRESS OR IMPLIED REPRESENTATIONS OR WARRANTIES OF MERCHANTABILITY OR FITNESS FOR A PARTICULAR PURPOSE WITH RESPECT TO THE INDEX OR ANY DATA INCLUDED THEREIN.
-24-
WITHOUT LIMITING ANY OF THE FOREGOING, IN NO EVENT SHALL THE INDEX SPONSOR HAVE ANY LIABILITY (WHETHER IN NEGLIGENCE OR OTHERWISE) TO ANY PERSON FOR ANY DIRECT, INDIRECT, SPECIAL, PUNITIVE, CONSEQUENTIAL OR ANY OTHER DAMAGES (INCLUDING LOST PROFITS) EVEN IF NOTIFIED OF THE POSSIBILITY OF SUCH DAMAGES.” |
-25-
| VI. | The last sentence of the “Daily Limits” paragraph on Page 100 of the Prospectus is hereby deleted and replaced, in its entirety, with the following: |
“See “The Risks You Face – (36) The Net Asset Value Calculation of the Funds May Be Overstated or Understated Due to the Valuation Method Employed When a Settlement Price is Not Available on the Date of Net Asset Value Calculation.””
-26-