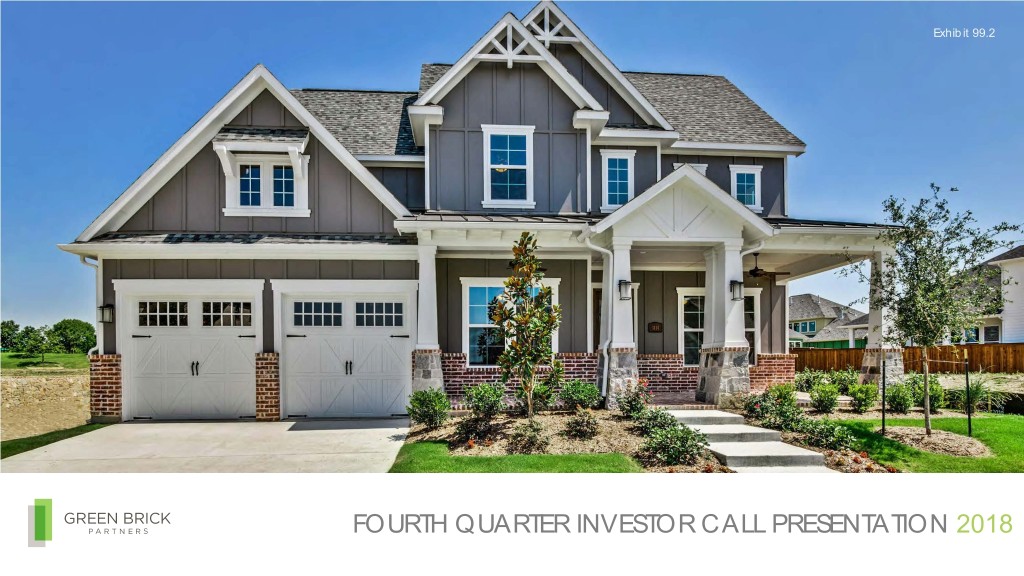
Exhibit 99.2 FOURTH QUARTER INVESTOR CALL PRESENTATION 2018
FORWARD LOOKING STATEMENTS This presentation and the oral statements made by representatives of the Company during the course of this presentation that are not historical facts are forward-looking statements. These statements are often, but not always, made through the use of words or phrases such as “may,” “will,” “should,” “could,” “would,” “predicts,” “potential,” “continue,” “expects,” “anticipates,” “future,” “outlook,” “strategy,” “positioned,” “intends,” “plans,” “believes,” “projects,” “estimates” and similar expressions, as well as statements in the future tense. Although the Company believes that the assumptions underlying these statements are reasonable, individuals considering such statements for any purpose are cautioned that such forward-looking statements are inherently uncertain and necessarily involve risks that may affect the Company’s business prospects and performance, causing actual results to differ from those discussed during the presentation, and any such difference may be material. Factors that could cause actual results to differ from those anticipated are discussed in the Company’s annual and quarterly reports filed with the SEC. Any forward-looking statements made are subject to risks and uncertainties, many of which are beyond management’s control. These risks include the risks described in the Company’s filings with the SEC. Should one or more of these risks or uncertainties occur, or should underlying assumptions prove incorrect, the Company’s actual results and plans could differ materially from those expressed in any forward-looking statements. Given these risks and uncertainties, you are cautioned not to place undue reliance on such forward-looking statements. These forward-looking statements are made only as of the date hereof. The Company undertakes no obligation to publicly update any forward-looking statements, whether as a result of new information or future events. The Company presents Basic Adjusted EPS, Adjusted Pre-tax Income Attributable to Green Brick, Adjusted Pre-tax Income Attributable to Green Brick as a Percentage of Homebuilding Revenues, Adjusted Pre-tax Income as a Percentage of Average Invested Capital, EBITDA, Adjusted Net Income, Adjusted Net Income ROE, Basic weighted-average number of shares outstanding, and Adjusted Homebuilding Gross Margin. The Company believes these and similar measures are useful to management and investors in evaluating its operating performance and financing structure. The Company also believes these measures facilitate the comparison of their operating performance and financing structure with other companies in the industry. Because these measures are not calculated in accordance with Generally Accepted Accounting Principles (“GAAP”), they may not be comparable to other similarly titled measures of other companies and should not be considered in isolation or as a substitute for, or superior to, financial measures prepared in accordance with GAAP. 2
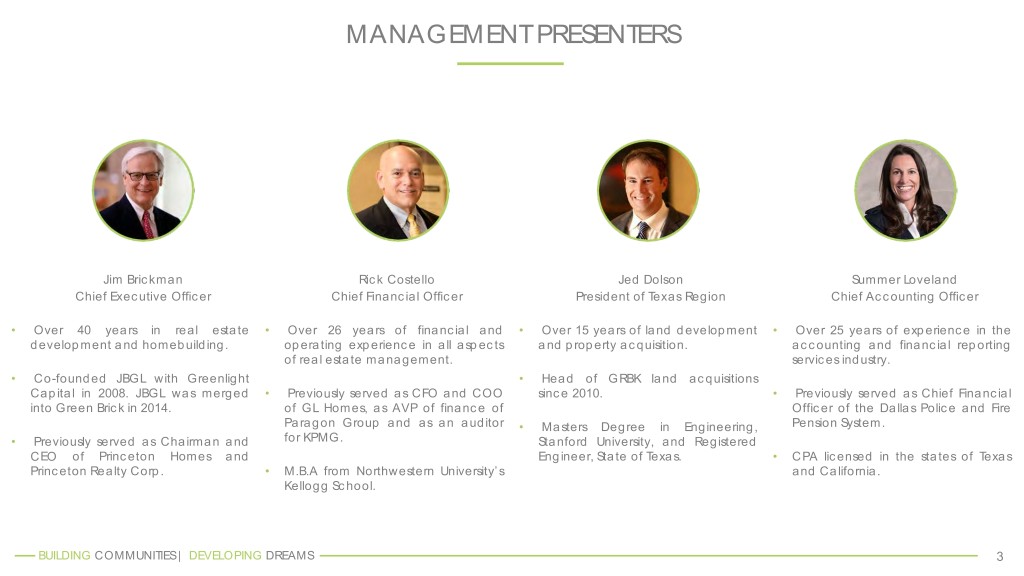
MANAGEMENT PRESENTERS Jim Brickman Rick Costello Jed Dolson Summer Loveland Chief Executive Officer Chief Financial Officer President of Texas Region Chief Accounting Officer • Over 40 years in real estate • Over 26 years of financial and • Over 15 years of land development • Over 25 years of experience in the development and homebuilding. operating experience in all aspects and property acquisition. accounting and financial reporting of real estate management. services industry. • Co-founded JBGL with Greenlight • Head of GRBK land acquisitions Capital in 2008. JBGL was merged • Previously served as CFO and COO since 2010. • Previously served as Chief Financial into Green Brick in 2014. of GL Homes, as AVP of finance of Officer of the Dallas Police and Fire Paragon Group and as an auditor • Masters Degree in Engineering, Pension System. • Previously served as Chairman and for KPMG. Stanford University, and Registered CEO of Princeton Homes and Engineer, State of Texas. • CPA licensed in the states of Texas Princeton Realty Corp. • M.B.A from Northwestern University’s and California. Kellogg School. BUILDING COMMUNITIES | DEVELOPING DREAMS 3
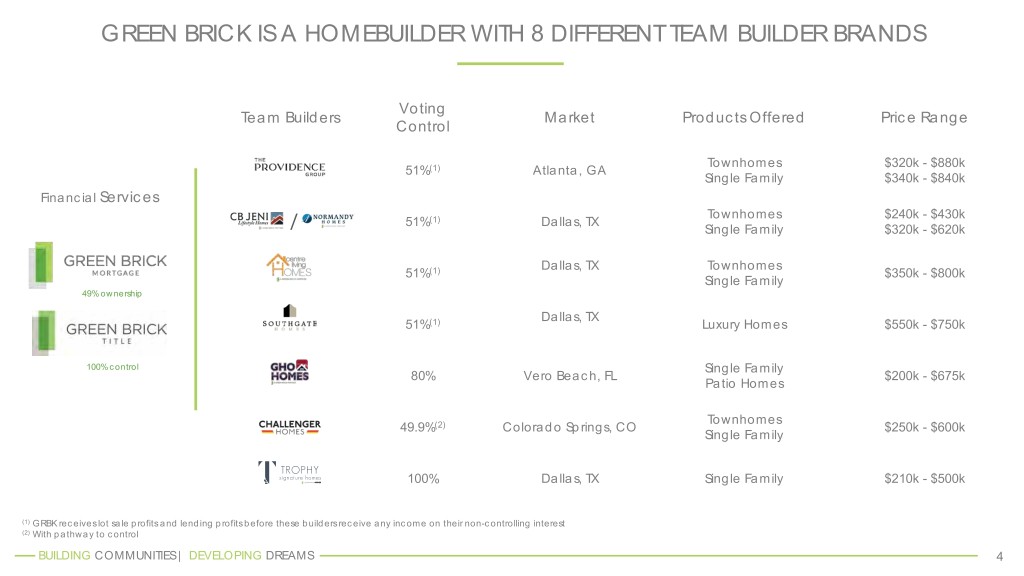
GREEN BRICK IS A HOMEBUILDER WITH 8 DIFFERENT TEAM BUILDER BRANDS Voting Team Builders Market Products Offered Price Range Control Townhomes $320k - $880k 51%(1) Atlanta, GA Single Family $340k - $840k Financial Services Townhomes $240k - $430k 51%(1) Dallas, TX / Single Family $320k - $620k Dallas, TX Townhomes 51%(1) $350k - $800k Single Family 49% ownership Dallas, TX 51%(1) Luxury Homes $550k - $750k 100% control Single Family 80% Vero Beach, FL $200k - $675k Patio Homes Townhomes 49.9%(2) Colorado Springs, CO $250k - $600k Single Family 100% Dallas, TX Single Family $210k - $500k (1) GRBK receives lot sale profits and lending profits before these builders receive any income on their non-controlling interest (2) With pathway to control BUILDING COMMUNITIES | DEVELOPING DREAMS 4
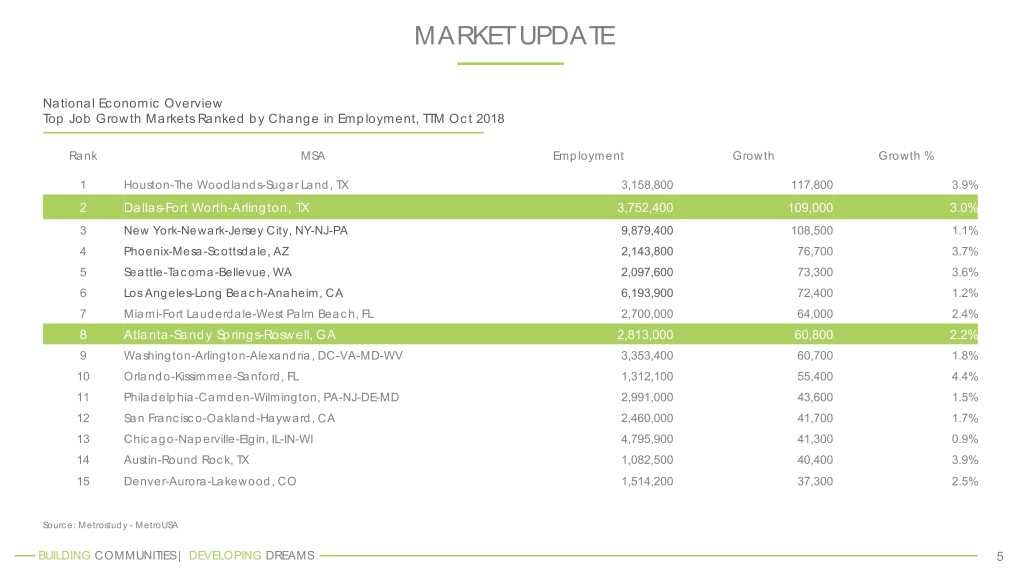
MARKET UPDATE National Economic Overview Top Job Growth Markets Ranked by Change in Employment, TTM Oct 2018 Rank MSA Employment Growth Growth % 1 Houston-The Woodlands-Sugar Land, TX 3,158,800 117,800 3.9% 2 Dallas-Fort Worth-Arlington, TX 3,752,400 109,000 3.0% 3 New York-Newark-Jersey City, NY-NJ-PA 9,879,400 108,500 1.1% 4 Phoenix-Mesa-Scottsdale, AZ 2,143,800 76,700 3.7% 5 Seattle-Tacoma-Bellevue, WA 2,097,600 73,300 3.6% 6 Los Angeles-Long Beach-Anaheim, CA 6,193,900 72,400 1.2% 7 Miami-Fort Lauderdale-West Palm Beach, FL 2,700,000 64,000 2.4% 8 Atlanta-Sandy Springs-Roswell, GA 2,813,000 60,800 2.2% 9 Washington-Arlington-Alexandria, DC-VA-MD-WV 3,353,400 60,700 1.8% 10 Orlando-Kissimmee-Sanford, FL 1,312,100 55,400 4.4% 11 Philadelphia-Camden-Wilmington, PA-NJ-DE-MD 2,991,000 43,600 1.5% 12 San Francisco-Oakland-Hayward, CA 2,460,000 41,700 1.7% 13 Chicago-Naperville-Elgin, IL-IN-WI 4,795,900 41,300 0.9% 14 Austin-Round Rock, TX 1,082,500 40,400 3.9% 15 Denver-Aurora-Lakewood, CO 1,514,200 37,300 2.5% Source: Metrostudy - MetroUSA BUILDING COMMUNITIES | DEVELOPING DREAMS 5
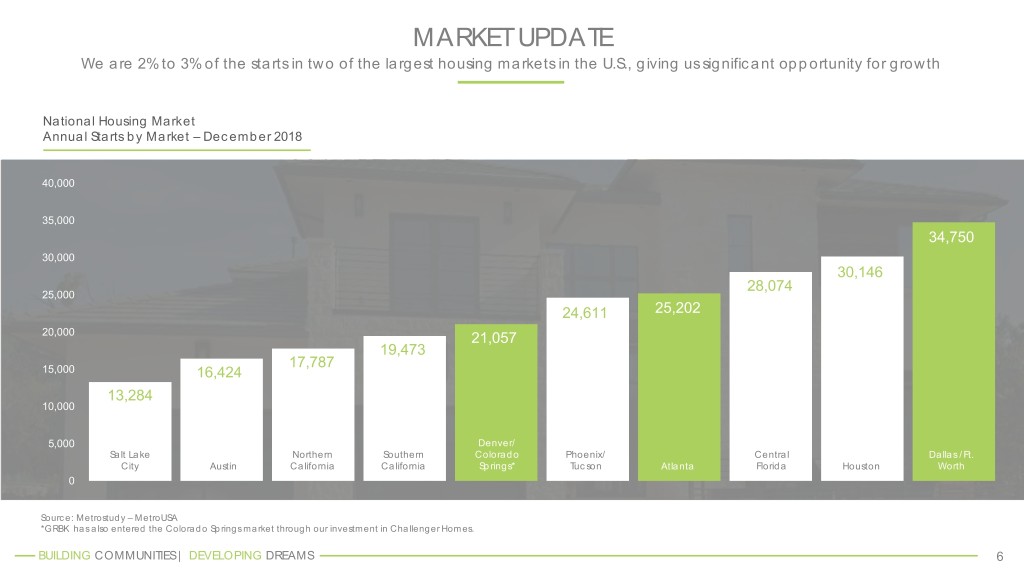
MARKET UPDATE We are 2% to 3% of the starts in two of the largest housing markets in the U.S., giving us significant opportunity for growth National Housing Market Annual Starts by Market – December 2018 40,000 35,000 34,750 30,000 30,146 28,074 25,000 24,611 25,202 20,000 21,057 19,473 17,787 15,000 16,424 13,284 10,000 5,000 Denver/ Salt Lake Northern Southern Colorado Phoenix/ Central Dallas /Ft. City Austin California California Springs* Tucson Atlanta Florida Houston Worth 0 Source: Metrostudy – MetroUSA *GRBK has also entered the Colorado Springs market through our investment in Challenger Homes. BUILDING COMMUNITIES | DEVELOPING DREAMS 6
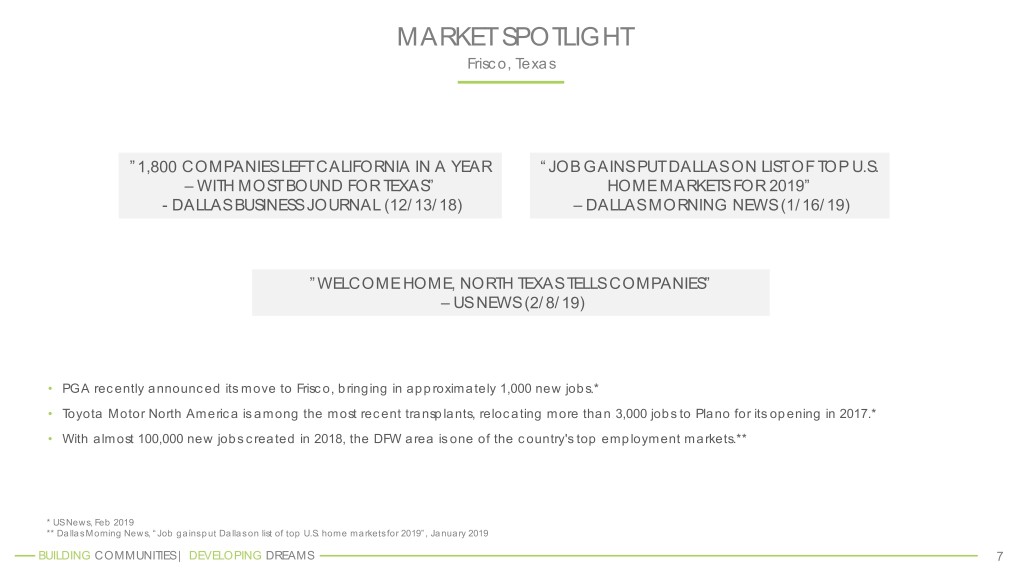
MARKET SPOTLIGHT Frisco, Texas ”1,800 COMPANIES LEFT CALIFORNIA IN A YEAR “JOB GAINS PUT DALLAS ON LIST OF TOP U.S. – WITH MOST BOUND FOR TEXAS” HOME MARKETS FOR 2019” - DALLAS BUSINESS JOURNAL (12/13/18) – DALLAS MORNING NEWS (1/16/19) ”WELCOME HOME, NORTH TEXAS TELLS COMPANIES” – US NEWS (2/8/19) • PGA recently announced its move to Frisco, bringing in approximately 1,000 new jobs.* • Toyota Motor North America is among the most recent transplants, relocating more than 3,000 jobs to Plano for its opening in 2017.* • With almost 100,000 new jobs created in 2018, the DFW area is one of the country's top employment markets.** * US News, Feb 2019 ** Dallas Morning News, “Job gains put Dallas on list of top U.S. home markets for 2019”, January 2019 BUILDING COMMUNITIES | DEVELOPING DREAMS 7
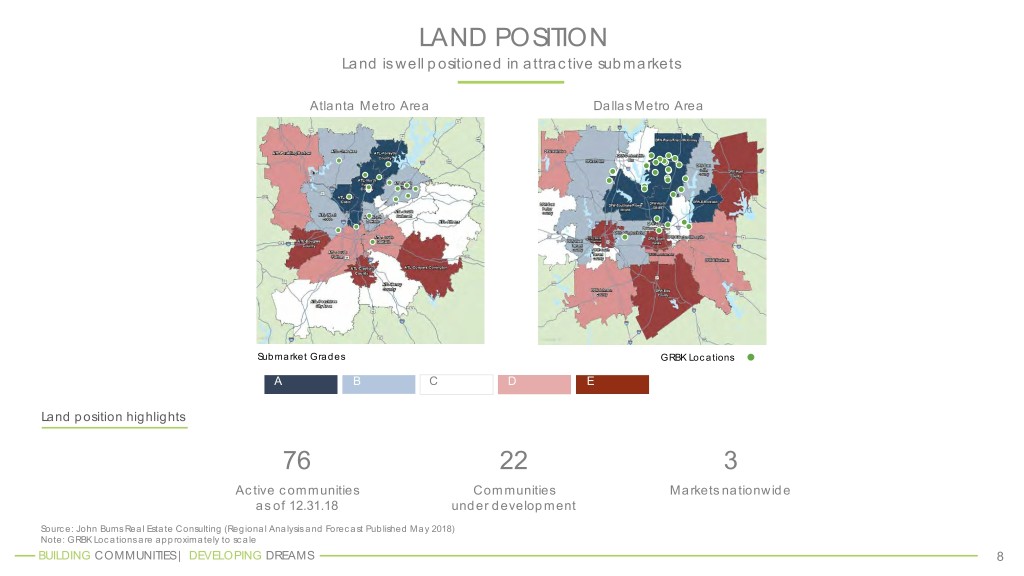
LAND POSITION Land is well positioned in attractive submarkets Atlanta Metro Area Dallas Metro Area Submarket Grades GRBK Locations A B C D E Land position highlights 76 22 3 Active communities Communities Markets nationwide as of 12.31.18 under development Source: John Burns Real Estate Consulting (Regional Analysis and Forecast Published May 2018) Note: GRBK Locations are approximately to scale BUILDING COMMUNITIES | DEVELOPING DREAMS 8
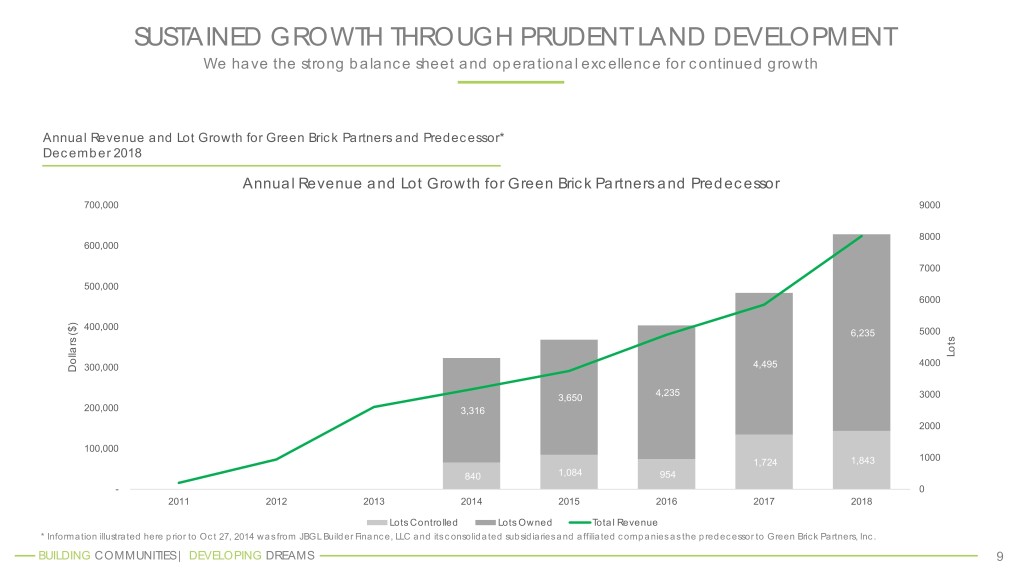
SUSTAINED GROWTH THROUGH PRUDENT LAND DEVELOPMENT We have the strong balance sheet and operational excellence for continued growth Annual Revenue and Lot Growth for Green Brick Partners and Predecessor* December 2018 Annual Revenue and Lot Growth for Green Brick Partners and Predecessor 700,000 9000 8000 600,000 7000 500,000 6000 400,000 6,235 5000 Lots 4,495 4000 Dollars ($) 300,000 4,235 3,650 3000 200,000 3,316 2000 100,000 1000 1,724 1,843 840 1,084 954 - 0 2011 2012 2013 2014 2015 2016 2017 2018 Lots Controlled Lots Owned Total Revenue * Information illustrated here prior to Oct 27, 2014 was from JBGL Builder Finance, LLC and its consolidated subsidiaries and affiliated companies as the predecessor to Green Brick Partners, Inc. BUILDING COMMUNITIES | DEVELOPING DREAMS 9
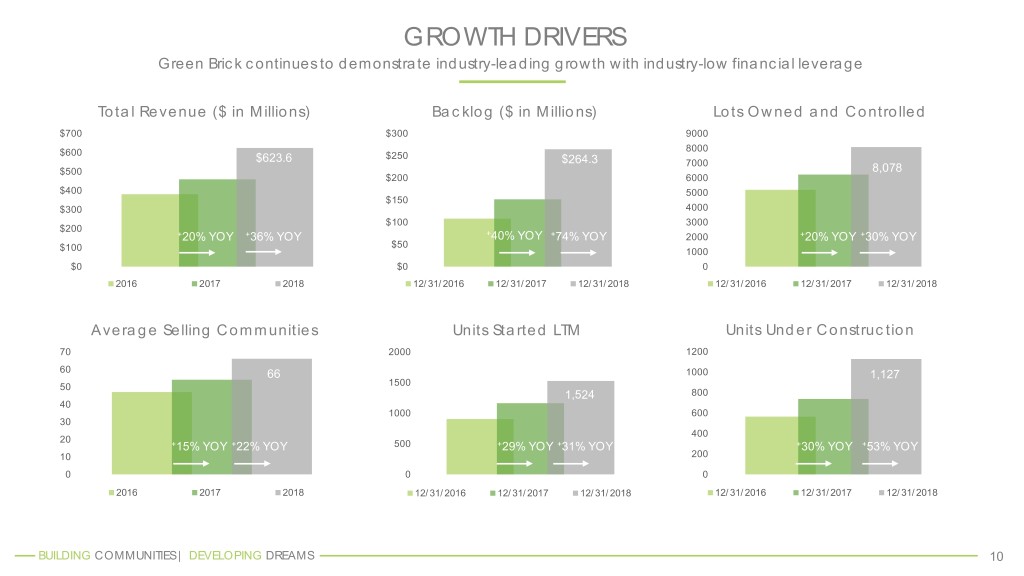
GROWTH DRIVERS Green Brick continues to demonstrate industry-leading growth with industry-low financial leverage Total Revenue ($ in Millions) Backlog ($ in Millions) Lots Owned and Controlled $700 $300 9000 8000 $600 $250 $623.6 $264.3 7000 $500 8,078 $200 6000 $400 5000 $150 $300 4000 $100 3000 $200 +20% YOY +36% YOY +40% YOY +74% YOY 2000 +20% YOY +30% YOY $50 $100 1000 $0 $0 0 2016 2017 2018 12/31/2016 12/31/2017 12/31/2018 12/31/2016 12/31/2017 12/31/2018 Average Selling Communities Units Started LTM Units Under Construction 70 2000 1200 60 66 1,524 1000 1,127 50 1500 1,524 800 40 1000 600 30 400 20 +15% YOY +22% YOY 500 +29% YOY +31% YOY +30% YOY +53% YOY 10 200 0 0 0 2016 2017 2018 12/31/2016 12/31/2017 12/31/2018 12/31/2016 12/31/2017 12/31/2018 BUILDING COMMUNITIES | DEVELOPING DREAMS 10
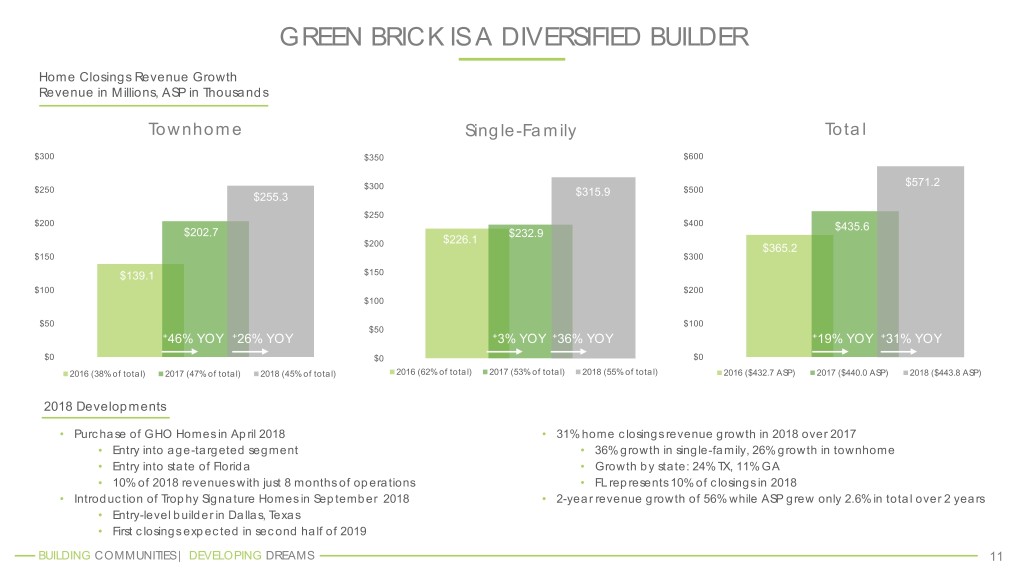
GREEN BRICK IS A DIVERSIFIED BUILDER Home Closings Revenue Growth Revenue in Millions, ASP in Thousands Townhome Single-Family Total $300 $350 $600 $571.2 $250 $300 $500 $255.3 $315.9 $250 $200 $400 $435.6 $202.7 $232.9 $226.1 $200 $365.2 $150 $300 $139.1 $150 $100 $200 $100 $50 $100 $50 +46% YOY +26% YOY +3% YOY +36% YOY +19% YOY +31% YOY $0 $0 $0 2016 (38% of total) 2017 (47% of total) 2018 (45% of total) 2016 (62% of total) 2017 (53% of total) 2018 (55% of total) 2016 ($432.7 ASP) 2017 ($440.0 ASP) 2018 ($443.8 ASP) 2018 Developments • Purchase of GHO Homes in April 2018 • 31% home closings revenue growth in 2018 over 2017 • Entry into age-targeted segment • 36% growth in single-family, 26% growth in townhome • Entry into state of Florida • Growth by state: 24% TX, 11% GA • 10% of 2018 revenues with just 8 months of operations • FL represents 10% of closings in 2018 • Introduction of Trophy Signature Homes in September 2018 • 2-year revenue growth of 56% while ASP grew only 2.6% in total over 2 years • Entry-level builder in Dallas, Texas • First closings expected in second half of 2019 BUILDING COMMUNITIES | DEVELOPING DREAMS 11
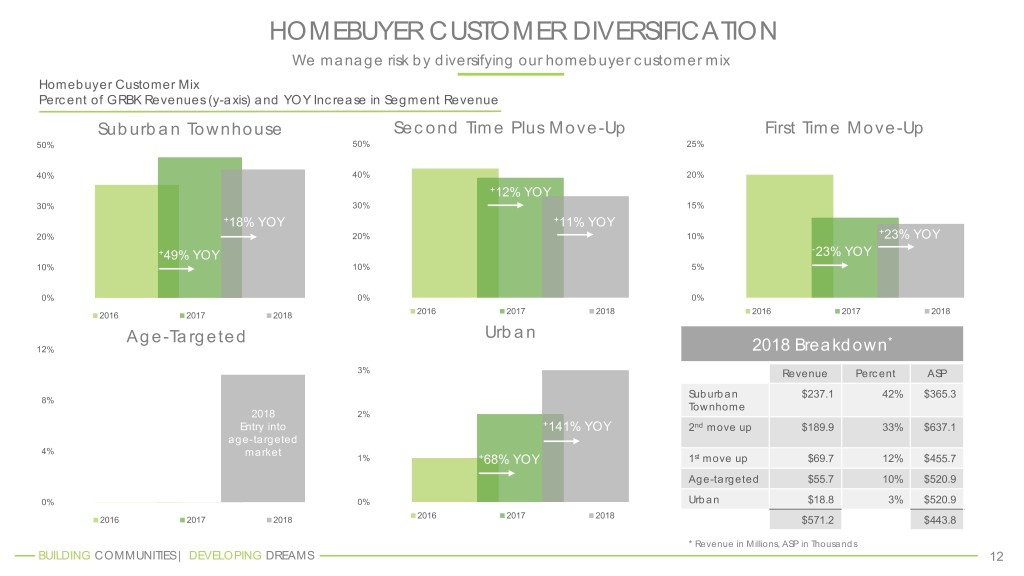
HOMEBUYER CUSTOMER DIVERSIFICATION We manage risk by diversifying our homebuyer customer mix Homebuyer Customer Mix Percent of GRBK Revenues (y-axis) and YOY Increase in Segment Revenue Suburban Townhouse Second Time Plus Move-Up First Time Move-Up 50% 50% 25% 40% 40% 20% +12% YOY 30% 30% 15% +18% YOY +11% YOY + 20% 20% 10% 23% YOY - +49% YOY 23% YOY 10% 10% 5% 0% 0% 0% 2016 2017 2018 2016 2017 2018 2016 2017 2018 Urban Age-Targeted * 12% 2018 Breakdown 3% Revenue Percent ASP Suburban $237.1 42% $365.3 8% Townhome 2018 2% Entry into +141% YOY 2nd move up $189.9 33% $637.1 age-targeted 4% market 1% +68% YOY 1st move up $69.7 12% $455.7 Age-targeted $55.7 10% $520.9 0% 0% Urban $18.8 3% $520.9 2016 2017 2018 2016 2017 2018 $571.2 $443.8 * Revenue in Millions, ASP in Thousands BUILDING COMMUNITIES | DEVELOPING DREAMS 12
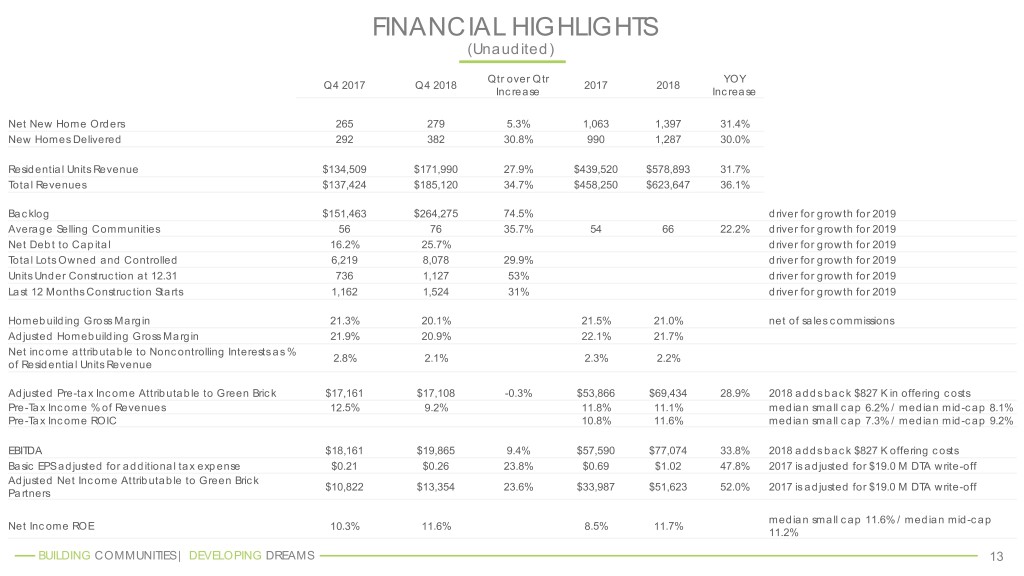
FINANCIAL HIGHLIGHTS (Unaudited) Qtr over Qtr YOY Q4 2017 Q4 2018 2017 2018 Increase Increase Net New Home Orders 265 279 5.3% 1,063 1,397 31.4% New Homes Delivered 292 382 30.8% 990 1,287 30.0% Residential Units Revenue $134,509 $171,990 27.9% $439,520 $578,893 31.7% Total Revenues $137,424 $185,120 34.7% $458,250 $623,647 36.1% Backlog $151,463 $264,275 74.5% driver for growth for 2019 Average Selling Communities 56 76 35.7% 54 66 22.2% driver for growth for 2019 Net Debt to Capital 16.2% 25.7% driver for growth for 2019 Total Lots Owned and Controlled 6,219 8,078 29.9% driver for growth for 2019 Units Under Construction at 12.31 736 1,127 53% driver for growth for 2019 Last 12 Months Construction Starts 1,162 1,524 31% driver for growth for 2019 Homebuilding Gross Margin 21.3% 20.1% 21.5% 21.0% net of sales commissions Adjusted Homebuilding Gross Margin 21.9% 20.9% 22.1% 21.7% Net income attributable to Noncontrolling Interests as % 2.8% 2.1% 2.3% 2.2% of Residential Units Revenue Adjusted Pre-tax Income Attributable to Green Brick $17,161 $17,108 -0.3% $53,866 $69,434 28.9% 2018 adds back $827 K in offering costs Pre-Tax Income % of Revenues 12.5% 9.2% 11.8% 11.1% median small cap 6.2% / median mid-cap 8.1% Pre-Tax Income ROIC 10.8% 11.6% median small cap 7.3% / median mid-cap 9.2% EBITDA $18,161 $19,865 9.4% $57,590 $77,074 33.8% 2018 adds back $827 K offering costs Basic EPS adjusted for additional tax expense $0.21 $0.26 23.8% $0.69 $1.02 47.8% 2017 is adjusted for $19.0 M DTA write-off Adjusted Net Income Attributable to Green Brick $10,822 $13,354 23.6% $33,987 $51,623 52.0% 2017 is adjusted for $19.0 M DTA write-off Partners median small cap 11.6% / median mid-cap Net Income ROE 10.3% 11.6% 8.5% 11.7% 11.2% BUILDING COMMUNITIES | DEVELOPING DREAMS 13
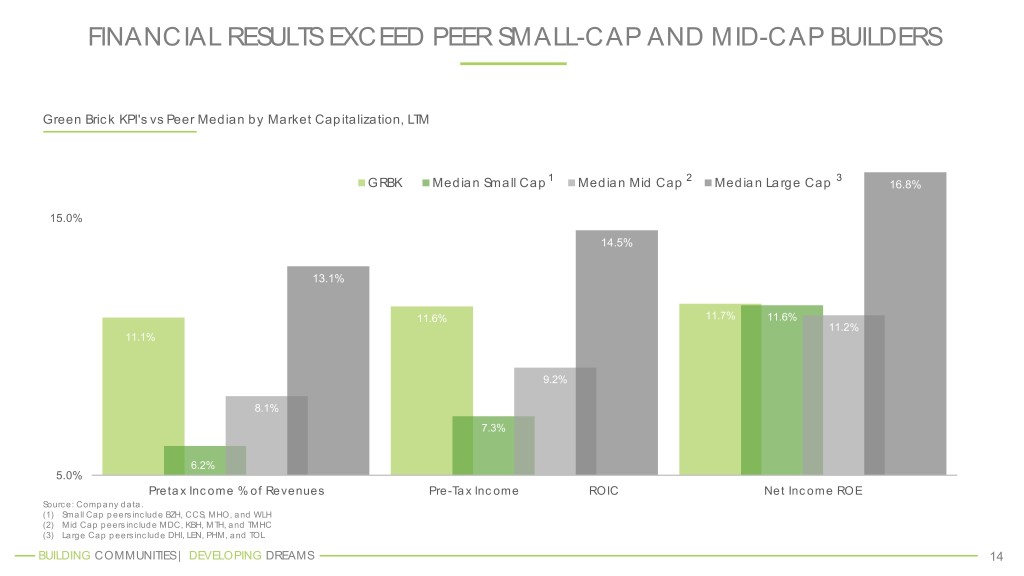
FINANCIAL RESULTS EXCEED PEER SMALL-CAP AND MID-CAP BUILDERS Green Brick KPI's vs Peer Median by Market Capitalization, LTM 1 2 3 GRBK Median Small Cap Median Mid Cap Median Large Cap 16.8% 15.0% 14.5% 13.1% 11.6% 11.7% 11.6% 11.2% 11.1% 9.2% 8.1% 7.3% 6.2% 5.0% Pretax Income % of Revenues Pre-Tax Income ROIC Net Income ROE Source: Company data. (1) Small Cap peers include BZH, CCS, MHO, and WLH (2) Mid Cap peers include MDC, KBH, MTH, and TMHC (3) Large Cap peers include DHI, LEN, PHM, and TOL BUILDING COMMUNITIES | DEVELOPING DREAMS 14
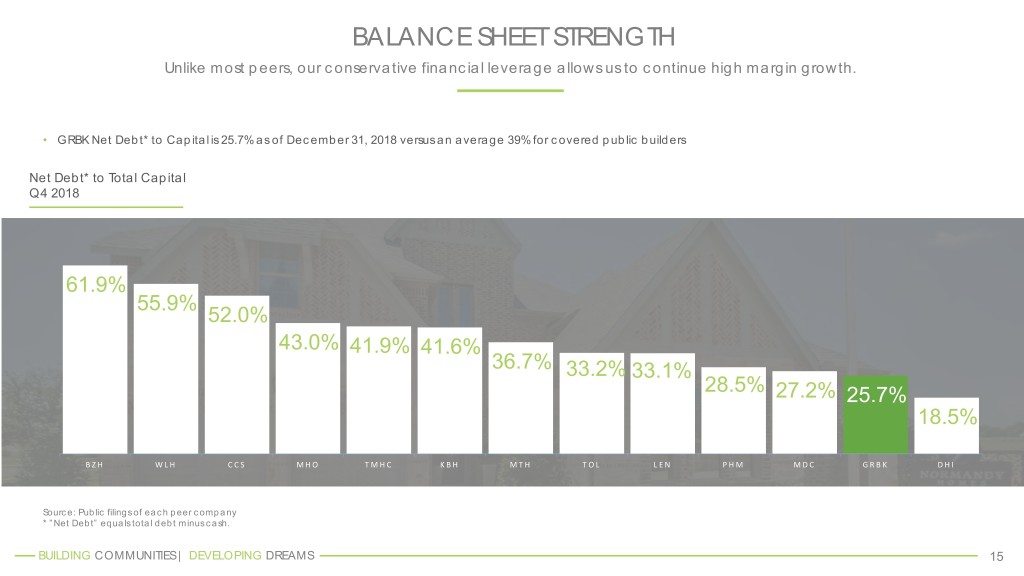
BALANCE SHEET STRENGTH Unlike most peers, our conservative financial leverage allows us to continue high margin growth. • GRBK Net Debt* to Capital is 25.7% as of December 31, 2018 versus an average 39% for covered public builders Net Debt* to Total Capital Q4 2018 61.9% 55.9% 52.0% 43.0% 41.9% 41.6% 36.7% 33.2% 33.1% 28.5% 27.2% 25.7% 18.5% BZH WLH CCS MHO TMHC KBH MTH TOL LEN PHM MDC GRBK DHI Source: Public filings of each peer company * ”Net Debt” equals total debt minus cash. BUILDING COMMUNITIES | DEVELOPING DREAMS 15
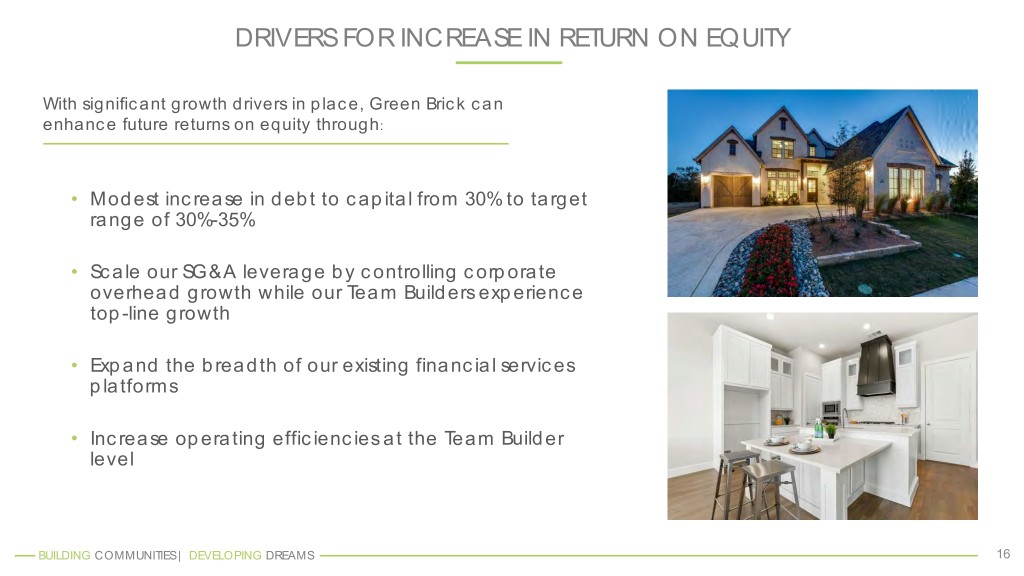
DRIVERS FOR INCREASE IN RETURN ON EQUITY With significant growth drivers in place, Green Brick can enhance future returns on equity through: • Modest increase in debt to capital from 30% to target range of 30%-35% • Scale our SG&A leverage by controlling corporate overhead growth while our Team Builders experience top-line growth • Expand the breadth of our existing financial services platforms • Increase operating efficiencies at the Team Builder level BUILDING COMMUNITIES | DEVELOPING DREAMS 16
APPENDIX BUILDING COMMUNITIES | DEVELOPING DREAMS 17
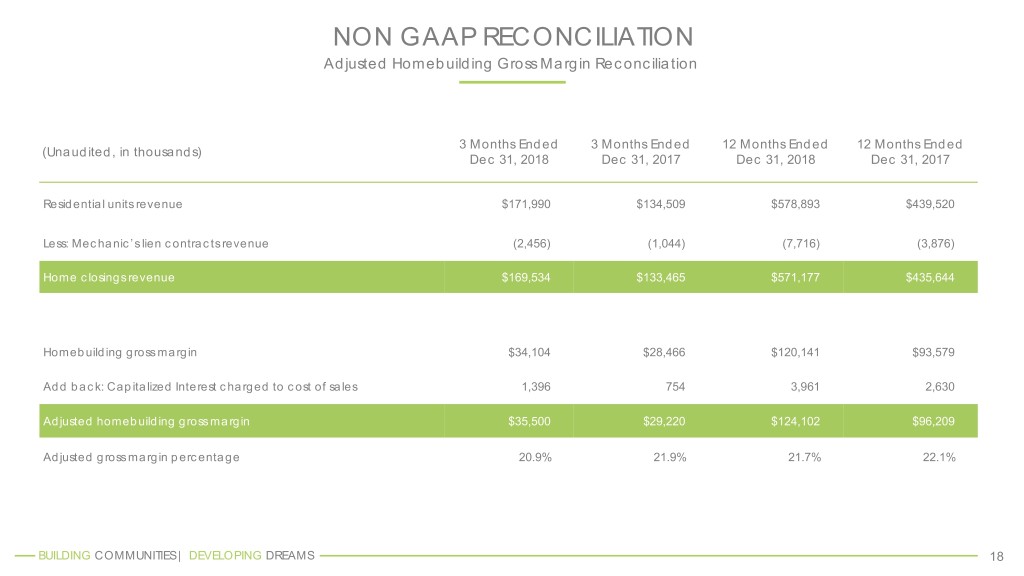
NON GAAP RECONCILIATION Adjusted Homebuilding Gross Margin Reconciliation 3 Months Ended 3 Months Ended 12 Months Ended 12 Months Ended (Unaudited, in thousands) Dec 31, 2018 Dec 31, 2017 Dec 31, 2018 Dec 31, 2017 Residential units revenue $171,990 $134,509 $578,893 $439,520 Less: Mechanic’s lien contracts revenue (2,456) (1,044) (7,716) (3,876) Home closings revenue $169,534 $133,465 $571,177 $435,644 Homebuilding gross margin $34,104 $28,466 $120,141 $93,579 Add back: Capitalized Interest charged to cost of sales 1,396 754 3,961 2,630 Adjusted homebuilding gross margin $35,500 $29,220 $124,102 $96,209 Adjusted gross margin percentage 20.9% 21.9% 21.7% 22.1% BUILDING COMMUNITIES | DEVELOPING DREAMS 18
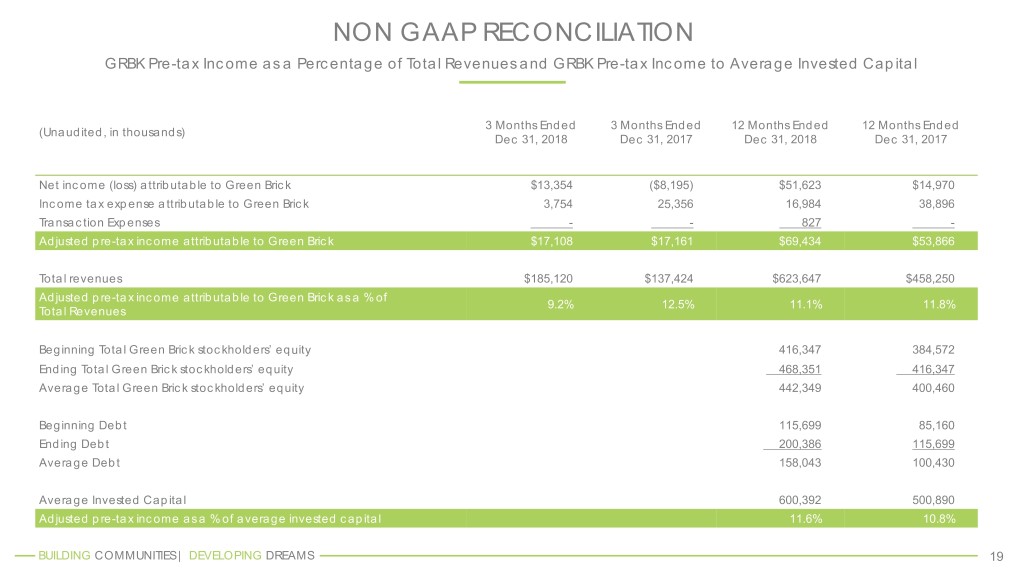
NON GAAP RECONCILIATION GRBK Pre-tax Income as a Percentage of Total Revenues and GRBK Pre-tax Income to Average Invested Capital 3 Months Ended 3 Months Ended 12 Months Ended 12 Months Ended (Unaudited, in thousands) Dec 31, 2018 Dec 31, 2017 Dec 31, 2018 Dec 31, 2017 Net income (loss) attributable to Green Brick $13,354 ($8,195) $51,623 $14,970 Income tax expense attributable to Green Brick 3,754 25,356 16,984 38,896 Transaction Expenses - - 827 - Adjusted pre-tax income attributable to Green Brick $17,108 $17,161 $69,434 $53,866 Total revenues $185,120 $137,424 $623,647 $458,250 Adjusted pre-tax income attributable to Green Brick as a % of 9.2% 12.5% 11.1% 11.8% Total Revenues Beginning Total Green Brick stockholders’ equity 416,347 384,572 Ending Total Green Brick stockholders’ equity 468,351 416,347 Average Total Green Brick stockholders’ equity 442,349 400,460 Beginning Debt 115,699 85,160 Ending Debt 200,386 115,699 Average Debt 158,043 100,430 Average Invested Capital 600,392 500,890 Adjusted pre-tax income as a % of average invested capital 11.6% 10.8% BUILDING COMMUNITIES | DEVELOPING DREAMS 19
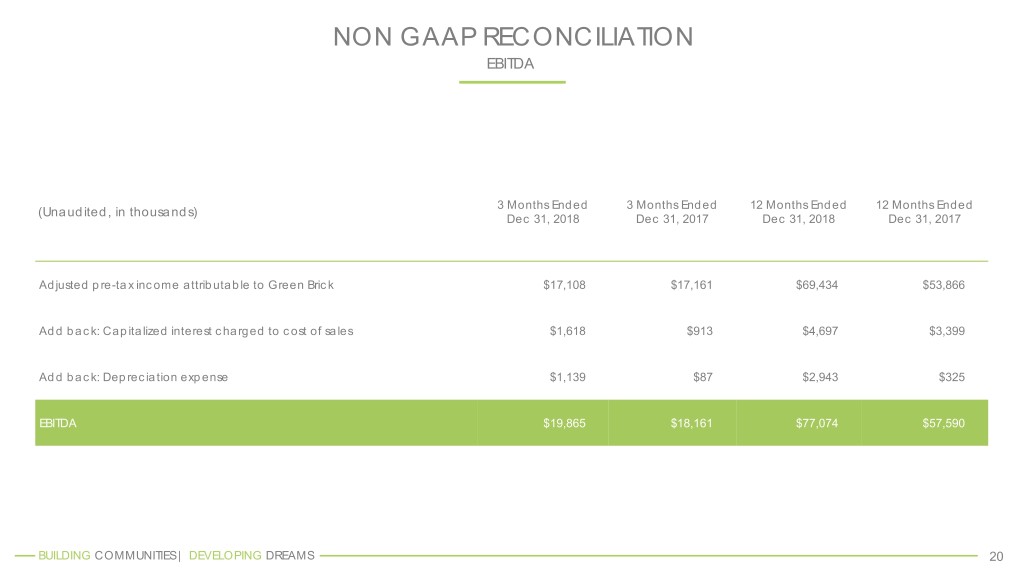
NON GAAP RECONCILIATION EBITDA 3 Months Ended 3 Months Ended 12 Months Ended 12 Months Ended (Unaudited, in thousands) Dec 31, 2018 Dec 31, 2017 Dec 31, 2018 Dec 31, 2017 Adjusted pre-tax income attributable to Green Brick $17,108 $17,161 $69,434 $53,866 Add back: Capitalized interest charged to cost of sales $1,618 $913 $4,697 $3,399 Add back: Depreciation expense $1,139 $87 $2,943 $325 EBITDA $19,865 $18,161 $77,074 $57,590 BUILDING COMMUNITIES | DEVELOPING DREAMS 20
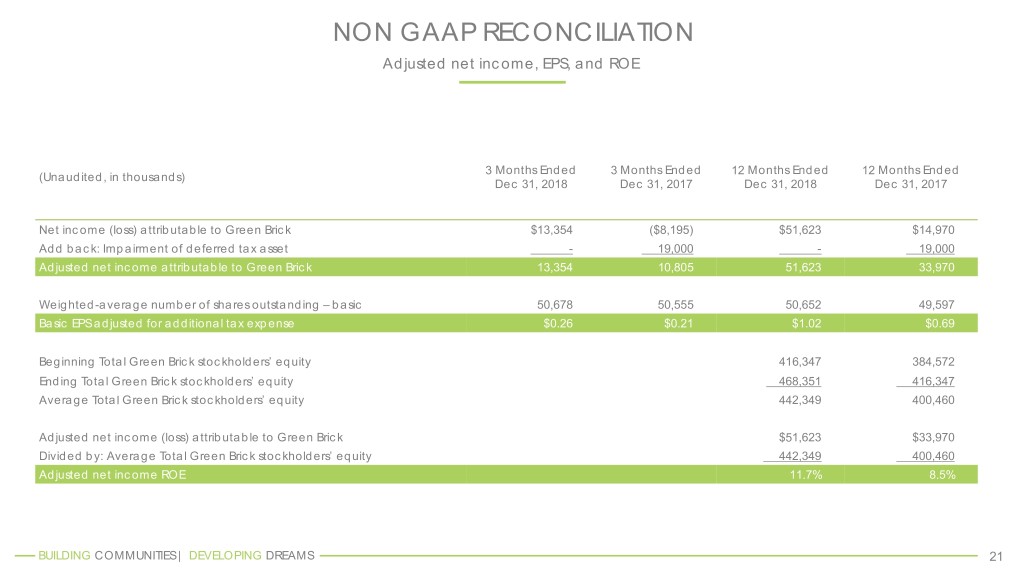
NON GAAP RECONCILIATION Adjusted net income, EPS, and ROE 3 Months Ended 3 Months Ended 12 Months Ended 12 Months Ended (Unaudited, in thousands) Dec 31, 2018 Dec 31, 2017 Dec 31, 2018 Dec 31, 2017 Net income (loss) attributable to Green Brick $13,354 ($8,195) $51,623 $14,970 Add back: Impairment of deferred tax asset - 19,000 - 19,000 Adjusted net income attributable to Green Brick 13,354 10,805 51,623 33,970 Weighted-average number of shares outstanding – basic 50,678 50,555 50,652 49,597 Basic EPS adjusted for additional tax expense $0.26 $0.21 $1.02 $0.69 Beginning Total Green Brick stockholders’ equity 416,347 384,572 Ending Total Green Brick stockholders’ equity 468,351 416,347 Average Total Green Brick stockholders’ equity 442,349 400,460 Adjusted net income (loss) attributable to Green Brick $51,623 $33,970 Divided by: Average Total Green Brick stockholders’ equity 442,349 400,460 Adjusted net income ROE 11.7% 8.5% BUILDING COMMUNITIES | DEVELOPING DREAMS 21
FOURTH QUARTER INVESTOR CALL PRESENTATION 2018 2805 Dallas Parkway, Suite 400 Plano, Texas 75093 | www.greenbrickpartners.com22


