
Brad Skinner
Senior Assistant Chief Accountant
United States Securities and Exchange Commission
Division of Corporate Finance
100 F Street Northeast
Washington, DC 20549-7010
| RE: | Allied Nevada Gold Corp. |
| Form 10-K for Fiscal Year Ended December 31, 2010 | |
| Filed February 28, 2011 | |
| Comment Letter Dated August 23, 2011 | |
| File No. 001-33119 |
Dear Mr. Skinner,
We received your letter dated July 27, 2011 concerning your comments on the above filed reports. We have prepared the following responses to your comments. The Staff’s comments are shown in bold.
Form 10-K for Fiscal Year Ended December 31, 2010
Management’s Discussion and Analysis of Financial Condition and Results of Operations, page 31
Non-GAAP Measures, page 32
| 1. | In your response to our prior comment number one, we note you continue to exclude ‘abnormal stripping costs’ from ‘adjusted cash costs’, a non-GAAP measure. We also note you incurred ‘abnormal stripping costs’ both fiscal years 2009 and 2010. Item 10(e)(ii)(B) of Regulation S-K prohibits excluding items from non-GAAP performance measures as non-recurring, infrequent or unusual when it is reasonably likely to recur within two years or there was a similar charge within the prior two years. Please modify your non-GAAP measure to include ‘abnormal stripping costs’ or tell us why you believe modification is not necessary. |
ALLIED NEVADA GOLD CORP.’S RESPONSE:
We will ensure that our non-GAAP disclosures do not exclude non-recurring, infrequent, or unusual items when it is reasonably likely to recur within two years or there was a similar charge within the prior two years. Accordingly, we will ensure that abnormal stripping costs and similar items such as lower of cost or market adjustments are not excluded from our non-GAAP measures.
We submit the following as an example of the revised “Non-GAAP Measures” note disclosure.
Adjusted Cash Costs
“Adjusted cash costs” is a non-GAAP measure, calculated on a per ounce of gold sold basis, and includes all normal direct and in direct operating cash costs related directly to the physical activities of producing gold, including mining, processing, third party refining expenses, on-site administrative and support costs, royalties, and mining production taxes, net of by-product revenue earned from silver sales. Adjusted cash costs provides management and investors with a measure to assess the company’s
Brad Skinner
September 6, 2011
Page 2
performance against other precious metals companies and performance of the mining operations over multiple periods. Non-GAAP measures do not have any standardized meaning prescribed by GAAP and, therefore, may not be comparable to similar measures presented by other companies. Accordingly, the above measures are intended to provide additional information and should not be considered in isolation or as a substitute for measures of performance prepared in accordance with GAAP. For further information, see our audited financial statements filed with our annual report on form 10-K.
The table below presents a reconciliation between non-GAAP adjusted cash costs to costs of sales (GAAP) for the year ended December 31, 2010 (in thousands, except ounces sold and costs per ounce):
| Total cost of sales | $ | 64,685 | ||
| Less: | ||||
| Depreciation and amortization | (6,972 | ) | ||
| Silver revenues | (4,842 | ) | ||
| Total adjusted cash costs | $ | 52,871 | ||
| Gold ounces sold | 102,483 | |||
| Adjusted cash costs | $ | 515.90 |
We will amend our Form 10-K for the fiscal year ended December 31, 2010 and our Forms 10-Q for the periods ended March 31, 2011 and June 30, 2011 to reflect the changes in the calculation and disclosure of our non-GAAP measures in accordance with the Staff’s comments.
| 2. | We note the disclosure you highlight in your response to our prior comment number three states depreciation, depletion and amortization costs relating to mining and processing operations are included in the accumulated costs of ore on leach pads and inventory. However, we also note you separately present depreciation and amortization costs as an operating expense on the face of your income statement. Please clarify how these costs are both included in inventory and separately presented on your income statement. Please also tell us how depletion of mine development costs are recorded in inventory and reported in your income statement (i.e. within cost of sales or within depreciation and amortization). |
ALLIED NEVADA GOLD CORP.’S RESPONSE:
Depreciation, depletion and amortization (“DD&A”) and direct production costs are included in ore on leach pads, in-process inventories, and finished metals inventories. DD&A balances are maintained on a weighted-average basis separate from the other production costs, and are transferred from ore on leach pads to in-process inventories and then to finished goods inventory from where they are ultimately expensed to depreciation expense when the underlying inventory is sold. Depletion of mine development costs are also included using the methodology described above.
We will amend our financial statements for the year ended December 31, 2010 and our quarterly financial statements for the periods ended March 31, 2011 and June 30, 2011 to provide a subtotal for cost of sales which includes the DD&A expense. We acknowledge that although a portion of this DD&A expense is and could be separately identified outside of cost of sales, we believe that the amount so included would not be material. Accordingly, we do not believe that the separate reporting of DD&A expenses associated with corporate or environmental assets would provide useful information to readers of our financial statements.
Brad Skinner
September 6, 2011
Page 3
| 3. | We note your response to prior comment number three does not appear to address stockpiled ore. Please tell us how you account for the costs of stockpiled ore that has yet to be placed onto leach pads and whether this stockpiled ore is included in your inventory balance. If this stockpiled ore represents lower grade ore for which processing is being deferred, please tell us how you considered inventory valuation and presentation as current or non-current. Please expand your critical accounting policies and estimates disclosure as appropriate. |
ALLIED NEVADA GOLD CORP.’S RESPONSE:
We currently stockpile only small amounts of ore prior to the processing of that ore in our crushing plant. After crushing, the ore is stockpiled prior to being placed on the leach pad. In general, the quantity of ore held in a stockpile prior to crushing is between 10,000 and 60,000 tons which at average mining costs, including a share of waste and associated site services and administration costs, would have a value of between $20,000 and $120,000. The crushed ore stockpile consists of crushed ore awaiting delivery to the leach pad and is generally less than 10,000 tons. The value of the crushed ore stockpile is generally less than $50,000. The carrying value of both stockpiles is currently treated as ore on leach pad inventory.
We currently do not have any low-grade ore stockpiles. All of our ore is either delivered to our leach pads, delivered to the small crusher stockpile, or classified as waste and dumped on waste dumps. We currently do not segregate mineralized and unmineralized waste due to the additional costs, low metal content and storage constraints. Our mineralized waste would typically have a grade that is lower than our in-pit cutoff grade of 0.005 ounces of gold per ton.
Since we do not maintain stockpiled low grade ore for which processing is being deferred and because the crusher stockpiles are not material, we believe that we do not need to expand our critical accounting policies and estimate disclosures to address these issues.
| 4. | We note your response to our prior comment number five and are unable to agree with your conclusion. Please modify your accounting and presentation related to production stage stripping costs and tell us your considerations regarding the guidance of FASB ASC 250-10. |
ALLIED NEVADA GOLD CORP.’S RESPONSE:
We have reviewed our accounting for abnormal stripping costs and will amend our financial statements to include such costs as a variable production cost in inventory.
As required by ASC 350-10-35, we have reviewed the inventory for a potential lower of cost or market adjustment after including the production phase stripping costs as a component of inventory. After reversing the effects of expensing the abnormal stripping costs and recording a lower of cost or market adjustment, the effect of this adjustment would be an increase in net income by $1.6 million for 2009 and $1.8 million for 2010. While quantitatively, these amounts appear
Brad Skinner
September 6, 2011
Page 4
material, we have concluded that qualitatively the amounts are not material and that a restatement of our financial statements for 2009 and 2010 would not be required under ASC 250-10. Accordingly, we will amend our Form 10-K for the fiscal year ended December 31, 2010 and our Forms 10-Q for the periods ended March 31, 2011 and June 30, 2011 to file our amended financial statements for the fiscal years ended December 31, 2009 and 2010 and the quarterly periods ended March 31, 2011 and June 30, 2011.
Our analysis on the materiality of the differences is based, in part, on the FASB's long-held position that materiality cannot be reduced to a numerical formula. In its Concepts Statement 2, the FASB noted that some had urged it to promulgate quantitative materiality guides for use in a variety of situations. The FASB rejected such an approach as representing only a "minority view”, stating:
the predominant view is that materiality judgments can properly be made only by those who have all the facts. The Board's present position is that no general standards of materiality could be formulated to take into account all the considerations that enter into an experienced human judgment.
The FASB goes on to say that materiality concerns the significance of an item to users of a registrant's financial statements. A matter is "material" if there is a substantial likelihood that a reasonable person would consider it important. In its Concepts Statement 2, the FASB stated the essence of the concept of materiality as follows:
The omission or misstatement of an item in a financial report is material if, in the light of surrounding circumstances, the magnitude of the item is such that it is probable that the judgment of a reasonable person relying upon the report would have been changed or influenced by the inclusion or correction of the item.
This formulation in the accounting literature is in substance identical to the formulation used by the courts in interpreting the federal securities laws. The Supreme Court has held that a fact is material if there is a substantial likelihood that the fact would have been viewed by the reasonable investor as having significantly altered the "total mix" of information made available. In the context of a misstatement of a financial statement item, while the "total mix" includes the size in numerical or percentage terms of the misstatement, it also includes the factual context in which the user of financial statements would view the financial statement item. The shorthand in the accounting and auditing literature for this analysis is that financial management and the auditor must consider both "quantitative" and "qualitative" factors in assessing an item's materiality.
Allied Nevada’s Materiality Considerations:
Quantitative Factors:
In assessing materiality, we first considered the impacts of any adjustment on the key balance sheet and income statement items. We understand that the SEC's position is that a percentage or numerical threshold cannot be used as an exclusive basis for determining materiality. We believe, however, that a 5% test is a useful guide in evaluating materiality. The following table illustrates the differences by year as to the effect of capitalizing the stripping costs into inventory and applying the lower of cost or market rule.
| 2009 | 2010 | ||||||||||||||||||||||
| (amounts in thousands) | (amounts in thousands) | ||||||||||||||||||||||
| As reported | As adjusted | % | As reported | As adjusted | % | ||||||||||||||||||
| 6,773 | 6,920 | 2.2 | % | Inventory | 9,978 | 10,350 | 3.7 | % | |||||||||||||||
| 34,179 | 35,659 | 4.3 | % | Ore on Leach Pads | 49,357 | 53,168 | 7.7 | % | |||||||||||||||
| 28,798 | 27,171 | -5.6 | % | Cost of Sales | 64,686 | 62,130 | 4.0 | % | |||||||||||||||
| 14,406 | 16,033 | 11.3 | % | Gross Margin (revenues less cost of sales) | 66,245 | 68,800 | 3.9 | % | |||||||||||||||
| 8,451 | 10,078 | 19.3 | % | Net Income | 34,128 | 35,916 | 5.2 | % | |||||||||||||||
When considering the quantitative materiality in 2009, we concluded that the change in cost of sales, which decreased by 5.6%, was the most relevant measure to consider. Since 2009 was the first year of operations at the Hycroft mine, the net income reported by the Company did not reflect full production levels, sales, or costs. Accordingly, the net income was impacted to a greater degree by the $5.6 million of exploration and land holding costs and the $12.4 million of general and administrative expenses than by the adjustment for production phase stripping costs. The $5.6 million of exploration spending is primarily associated with discretionary spending associated with the discovery at Hycroft.
Brad Skinner
September 6, 2011
Page 5
We also considered the effect of any adjustment for 2009 and 2010 in both dollar amounts and percentage on a quarterly basis. The following table illustrates the dollar and percentage change of any adjustment on significant balance sheet and income statement items for each of the quarterly periods in 2009 and 2010. Please note that for 2009, since the company had a valuation allowance on its deferred tax assets, there is no tax effect related to the 2009 adjustment. The information for 2009 and 2010 on a quarterly basis is as follows:
| 2009 | 2010 | ||||||||||||||||||||||||||||||
| (amounts in thousands) | (amounts in thousands) | ||||||||||||||||||||||||||||||
| Quarter 1 | Quarter 2 | Quarter 3 | Quarter 4 | Quarter 1 | Quarter 2 | Quarter 3 | Quarter 4 | ||||||||||||||||||||||||
| Balance Sheet Items: | |||||||||||||||||||||||||||||||
| (240 | ) | (456 | ) | 70 | 147 | Inventories | 234 | 216 | 291 | 372 | |||||||||||||||||||||
| (1,051 | ) | (391 | ) | 408 | 1,480 | Ore on leach pads | 1,649 | 1,374 | 2,573 | 3,811 | |||||||||||||||||||||
| (8.6 | %) | (6.4 | %) | 1.4 | % | 2.2 | % | Inventories | 2.6 | % | 2.3 | % | 2.9 | % | 3.7 | % | |||||||||||||||
| (12.4 | %) | (2.0 | %) | 1.4 | % | 4.3 | % | Ore on leach pads | 4.1 | % | 3.0 | % | 5.9 | % | 7.7 | % | |||||||||||||||
| Income Statement Items: | |||||||||||||||||||||||||||||||
| 1,291 | (444 | ) | (1,325 | ) | (1,149 | ) | Cost of sales | (256 | ) | 293 | (1,273 | ) | (1,319 | ) | |||||||||||||||||
| (1,291 | ) | 444 | 1,325 | 1,149 | Net income | 179 | (205 | ) | 891 | 923 | |||||||||||||||||||||
| 19.8 | % | (22.3 | %) | (13.0 | %) | (11.4 | %) | Cost of sales | (2.4 | %) | 1.9 | % | (6.0 | %) | (7.5 | %) | |||||||||||||||
| 17.0 | % | (1.0 | %) | 25.8 | % | 19.3 | % | Net income | 4.9 | % | (1.0 | %) | 29.1 | % | 13.9 | % | |||||||||||||||
We completed this same analysis of both dollar amounts and percentage changes for both the first and second quarters of 2011. When analyzing this information for the first quarter of 2011, we determined that even though an adjustment of $165,000 represents a large percentage change to net income, we believe the magnitude of the amount represents an immaterial amount for a company with a market capitalization in excess of $3 billion. The quarterly dollar and percentage changes of the key balance sheet and income statement items is as follows:
| 2011 | ||||||||
| Quarter 1 | Quarter 2 | |||||||
| Balance Sheet Items: | (amounts in thousands) | |||||||
| Inventories | 416 | 515 | ||||||
| Ore on leach pads | 3,531 | 2,582 | ||||||
| Inventories | 3.8 | % | 3.8 | % | ||||
| Ore on leach pads | 6.4 | % | 4.0 | % | ||||
| Income Statement Items: | ||||||||
| Cost of sales | 236 | 850 | ||||||
| Net income | (165 | ) | (595 | ) | ||||
| Cost of sales | 1.6 | % | 6.1 | % | ||||
| Net income | (91.2 | %) | (16.4 | %) | ||||
Brad Skinner
September 6, 2011
Page 6
Qualitative factors:
Following our quantitative analysis, as required by ASC 250-10, we conducted a qualitative analysis of the materiality of the adjustment. For purposes of this analysis, we identified the factors we believe a reasonable investor would consider important in making an investment decision with respect to common shares of Allied Nevada. We believe that during the time periods in question, the more important of these considerations include: | ||
| ● | Future Gold Prices. The price of gold increased significantly during 2009 and 2010. The following data for the affected years indicates that one of the key variables in assessing future profitability of the company was highly variable during the periods in question, resulting in a large amount of variability in any estimates of the future earnings potential of companies in the gold mining industry. |
| 2009 | 2010 | |||||
| Gold price, start of year | 865 | 1,104 | ||||
| Gold price, end of year | 1,104 | 1,410 | ||||
| Gold price, low during year | 810 | 1,058 | ||||
| Gold price, high during year | 1,213 | 1,421 | ||||
| Percent difference between high and low gold price | 49.7 | % | 34.3 | % | ||
| ● | The largest day-over-day increase in the price of gold was $63.25. In 2009, a $50 change in gold price would have had an approximate after tax effect on net income $2.1 million and in 2010 of $3.6 million. |
| ● | Ore reserves and resources. Investors consider the future earnings potential of a mining enterprise by considering its current ore reserves and future potential to increase reserves. During 2009 and 2010, the company was engaged in an extensive exploration program aimed at determining the economic potential of a large discovery at its Hycroft Mine. During the period, both its reserves and other mineralized material increased significantly. Although the future economic values of reserves are easier to assess, significant amount of judgment is required to assess the value beyond proven reserves as evidenced by the quantity of accounting literature and guidance associated with valuing this asset as part of the purchase price accounting on acquisitions. Additionally, although the ore reserves are updated periodically, the company disclosed material exploration results during 2009 and 2010 which would require the reader to consider how those results affected future reserve and resource estimates. During the periods mentioned, our reserves and other mineralized material reported by the company changed as follows: |
Proven & Probable Reserves | Other mineralized material | |||||||||||||||||||
| Ore Reserve Announcement | Tons (000's) | Contained Gold Ounces | Contained Gold Ounces | Total Ounces | Change From Previous | |||||||||||||||
| September 3, 2008 | 73,159 | 1,143,178 | 6,879,016 | 8,022,194 | ||||||||||||||||
| March 31, 2009 | 66,369 | 1,143,178 | 10,763,822 | 11,907,000 | 48 | % | ||||||||||||||
| March 31, 2010 | 177,228 | 2,444,000 | 8,566,704 | 11,010,704 | (8 | %) | ||||||||||||||
| August 10, 2010 | 174,000 | 2,400,000 | 10,155,000 | 12,555,000 | 14 | % | ||||||||||||||
| March 31, 2011 | 196,000 | 2,558,000 | 16,292,000 | 18,850,000 | 50 | % | ||||||||||||||
| August 23, 2011 | 853,979 | 10,191,000 | 10,442,068 | 20,633,068 | 9 | % | ||||||||||||||
| ● | Expansion and Growth plans. When assessing the future earnings capability of a startup organization such as ours, we believe investors consider our ability to expand and grow the operations. During 2009 and 2010, in addition to the startup of a new operation, we announced significant expansion plans to include an accelerated oxide mining plan and scoping studies associated with longer term mill expansion plans. This new information would require the investor to consider how these proposed changes would affect future profitability and expected returns. |
Brad Skinner
September 6, 2011
Page 7
| ● | Nature of Operations in 2009. During 2009, the company was a startup company just reopening the Hycroft Mine. During 2009, the value of the financial information related to operating costs is limited since there are no comparable numbers from the prior year with which to compare the cost of sales. We believe that our 2009 financial results are of limited use for future comparisons of operating performance since the startup results are not indicative of normal operating results. |
| ● | Net Income and Operating Costs. In assessing future cash flows and expected investment returns, we believe a reasonable investor would normally rely on historical earnings trends. Additionally, the investor would consider current operating cost performance in helping to determine expected future profitability. Any consideration of earnings trends or cost performance would need to be adjusted by a reasonable investor’s interpretation of the future gold prices, the ore reserves and resources, and the expansion and growth plans. Since these variables are so dynamic and the interpretation of the results require significant judgment, we believe that for the period affected by the misstatement, an investors judgment or valuation of the company would not be materially changed by the identified misstatements. |
Supporting Graph
The following graph illustrates the relationship between annualized earnings, our total market capitalization, and in situ ore reserves valued at gross realizable value determined at the gold price on the day of the determination. Please note that the vertical line at March 31, 2010 represents the announcement of a significant increase in gold reserves. We believe the graphical presentation clearly shows a strong correlation between the total reserve in-situ value which represents gold price and ore reserves and the market capitalization which represents share price. Given the magnitude of the previous correlation, we believe little or no correlation can be discerned between annualized earnings and market capitalization.
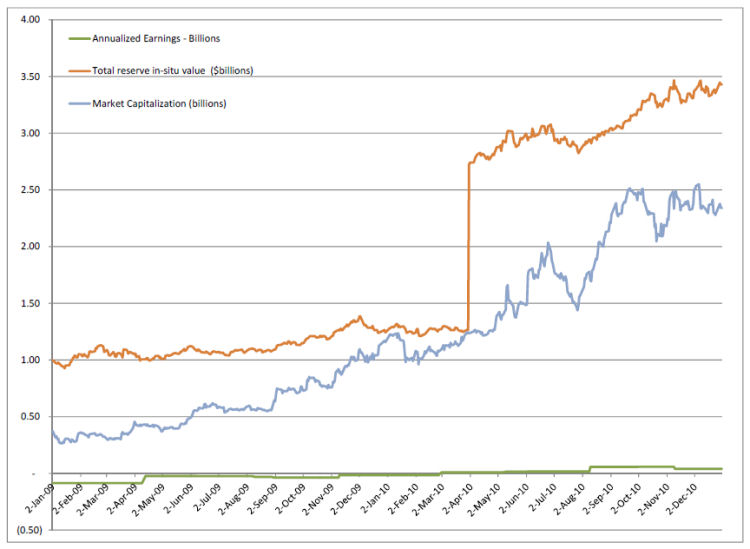
The above graph illustrates the market capitalization and price of our stock is driven by the increase in our reserves and the increase in the price of gold. Our investors, as supported by review of analyst reports, are focused on these factors, not our net income at a particular point of time.
Brad Skinner
September 6, 2011
Page 8
Other Qualitative Factors Considered:
| ● | The misstatement arose from an estimate rather than a precise measurement. The estimating techniques of both normal production costs and lower of cost or market adjustments involve significant judgment and measurement uncertainty. | ||
| ● | The misstatement did not conceal a failure to meet analysts' consensus expectations for the enterprise. The correction of the error resulted in an increase in earnings and as such was not hiding a failure to meet expectations. | ||
| ● | The misstatement does not change a loss into income or vice versa in any of the quarters or annual results. In 2009 and 2010, the correction of the error increased income and did not change a reported income into a loss. | ||
| ● | The misstatement does concern a segment of the business that has been identified as playing a significant role in the registrant's operations or profitability. Since the Hycroft Mine operating segment is the only income generating segment of the company and the other operating segments are cost centers, we believe that the correction of the error does not mask an attempt to mislead investors about the performance of a significant operating segment. | ||
| ● | The misstatement does not affect the registrant's compliance with any regulatory requirements. | ||
| ● | The misstatement does not affect the registrant's compliance with loan covenants or other contractual requirements. | ||
| ● | The misstatement did not have the effect of increasing management's compensation by satisfying requirements for the award of bonuses or other forms of incentive compensation. Management compensation includes Performance Share Units that include a performance metric based on our reported non-GAAP measure related to costs per ounce. The determination of the targeted performance costs were determined in reference to measures calculated on the accounting principles that management, the compensation committee, the auditors, and the board believed appropriate at the time. Since the effects of the lower of cost or market adjustment would actually lower cost of sales on a per ounce basis in both 2009 and 2010, there was not any additional compensation awarded based on this adjustment. | ||
| ● | The misstatement does not involve concealment of an unlawful transaction. | ||
Brad Skinner
September 6, 2011
Page 9
Conclusion:
We determined the impact of the inclusion of all production phase stripping costs in inventory and the application of lower of cost or market principles. We concluded that the net effect on our annual and quarterly financial statements for 2009, 2010 and 2011 was not material based on an extensive consideration of quantitative and qualitative factors and as such a restatement of financial statements is not required.
We will amend our financial statements, notes and related disclosures on Form 10-K for the year ended December 31, 2010 and our quarterly financial statements on Forms 10-Q for the periods ended March 31, 2011 and June 30, 2011 to reclassify our presentation of cost of sales. The income statement presentation of our cost of sales will be reported as a total of two income statement items: “Cost of sales (excluding depreciation expense): and “Depreciation expense”. All production phase stripping costs or lower of cost or market adjustments will be included in “Cost of Sales (excluding depreciation expense)”. At the same time, we will amend the Form 10-K for the fiscal year ended December 31, 2010 and the Forms 10-Q for the periods ended March 31, 2011 and June 30, 2011 to reflect the Staff’s comments from this comment letter, the comment letter dated August 23, 2011 and the comment letter dated June 2, 2011.
In connection with responding to your comments, we acknowledge that:
| ● | the Company is responsible for the adequacy and accuracy of the disclosure in the filing; |
| ● | staff comments or changes to disclosure in response to staff comments do not foreclose the Commission from taking any action with respect to the filing; and |
| ● | the Company may not assert staff comments as a defense in any proceeding initiated by the Commission or any person under the federal securities laws of the United States. |
We believe we have adequately addressed your comments contained in your letter dated July 27, 2011. If you should have any additional questions or comments regarding our responses, please contact us.
Sincerely, /s/ Hal Kirby Hal Kirby Executive Vice President and Chief Financial Officer | |