UNITED STATES
SECURITIES AND EXCHANGE COMMISSION
Washington, D.C. 20549
FORM N-CSR
CERTIFIED SHAREHOLDER REPORT
OF REGISTERED MANAGEMENT INVESTMENT COMPANIES
Investment Company Act file number 811-21960
TENNENBAUM OPPORTUNITIES FUND V, LLC
(Exact Name of Registrant as Specified in Charter)
2951 28TH STREET, SUITE 1000
SANTA MONICA, CALIFORNIA 90405
(Address of Principal Executive Offices) (Zip Code)
ELIZABETH GREENWOOD, SECRETARY
TENNENBAUM OPPORTUNITIES FUND V, LLC
2951 28TH STREET, SUITE 1000
SANTA MONICA, CALIFORNIA 90405
(Name and Address of Agent for Service)
Registrant's telephone number, including area code: (310) 566-1000
Copies to:
RICHARD T. PRINS, ESQ.
SKADDEN, ARPS, SLATE, MEAGHER & FLOM LLP
FOUR TIMES SQUARE
NEW YORK, NEW YORK 10036
Date of fiscal year end: DECEMBER 31, 2009
Date of reporting period: JUNE 30, 2009
| ITEM 1. | REPORTS TO STOCKHOLDERS. |
Semi-Annual Shareholder Report
Tennenbaum Opportunities Fund V, LLC
(A Delaware Limited Liability Company)
June 30, 2009
Tennenbaum Opportunities Fund V, LLC
(A Delaware Limited Liability Company)
Semi-Annual Shareholder Report
June 30, 2009
Contents
| Consolidated Portfolio Asset Allocation | 2 |
| | |
| Unaudited Consolidated Financial Statements | |
| | |
| Consolidated Statement of Assets and Liabilities | 3 |
| Consolidated Statement of Investments | 4 |
| Consolidated Statement of Operations | 11 |
| Consolidated Statements of Changes in Net Assets | 12 |
| Consolidated Statement of Cash Flows | 13 |
| Notes to Consolidated Financial Statements | 14 |
| | |
| Supplemental Information | |
| | |
| Consolidating Statement of Assets and Liabilities | 28 |
| Consolidating Statement of Operations | 29 |
| Approval of Investment Management Agreements | 30 |
Tennenbaum Opportunities Fund V, LLC (the “Company”) files a schedule of its investment in Tennenbaum Opportunities Partners V, LP (the “Partnership”) with the Securities and Exchange Commission (“SEC”) for the first and third quarters of each fiscal year on Form N-Q. Investments listed in the Consolidated Statement of Investments are held by the Partnership, which also files its complete schedule of portfolio holdings with the Securities and Exchange Commission (“SEC”) for the first and third quarters of each fiscal year on Form N-Q. The Forms N-Q of the Company and the Partnership are available on the SEC’s website at http://www.sec.gov. The Forms N-Q of the Company and the Partnership may also be reviewed and copied at the SEC’s Public Reference Room in Washington, D.C. Information on the operation of the Public Reference Room may be obtained by calling 1-800-SEC-0330.
A free copy of the proxy voting guidelines of the Company and the Partnership and information regarding how the Company and the Partnership voted proxies relating to portfolio investments during the most recent twelve-month period may be obtained without charge on the SEC’s website at http://www.sec.gov, or by calling the advisor of the Company and the Partnership, Tennenbaum Capital Partners, LLC, at (310) 566-1000. Collect calls for this purpose are accepted.
Tennenbaum Opportunities Fund V, LLC
(A Delaware Limited Liability Company)
Consolidated Portfolio Asset Allocation (Unaudited)
June 30, 2009
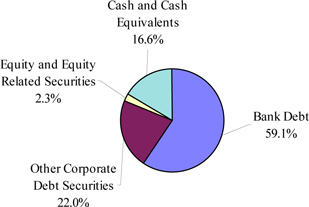
Portfolio Holdings by Investment Type (% of Cash and Investments) |
Portfolio Holdings by Industry (% of Cash and Investments) |
| Wired Telecommunications Carriers | | | 16.5 | % |
| Data Processing, Hosting and Related Services | | | 10.3 | % |
| Satellite Telecommunications | | | 8.0 | % |
| Communications Equipment Manufacturing | | | 7.2 | % |
| Gambling Industries | | | 5.0 | % |
| Cable and Other Subscription Programming | | | 4.5 | % |
| Architectural, Engineering, and Related Services | | | 4.0 | % |
| Other Electrical Equipment and Component Manufacturing | | | 4.0 | % |
| Sporting Goods, Hobby and Musical Instrument Stores | | | 3.0 | % |
| Petroleum and Coal Products Manufacturing | | | 2.8 | % |
| Industrial Machinery Manufacturing | | | 2.7 | % |
| Motor Vehicle Parts Manufacturing | | | 2.6 | % |
| Offices of Real Estate Agents and Brokers | | | 2.1 | % |
| Computer and Peripheral Equipment Manufacturing | | | 1.9 | % |
| Semiconductor and Other Electronic Component Manufacturing | | | 1.9 | % |
| Depository Credit Intermediation | | | 1.2 | % |
| Nondepository Credit Intermediation | | | 1.1 | % |
| Full Service Restaurants | | | 0.9 | % |
| Management, Scientific, and Technical Consulting Services | | | 0.9 | % |
| Radio and Television Broadcasting | | | 0.7 | % |
| Activities Related to Credit Intermediation | | | 0.6 | % |
| Securities and Commodity Contracts Intermediation and Brokerage | | | 0.6 | % |
| Motor Vehicle Manufacturing | | | 0.5 | % |
| Resin, Synthetic Rubber, and Artificial Synthetic Fibers and Filaments Manufacturing | | | 0.2 | % |
| Metalworking Machinery Manufacturing | | | 0.1 | % |
| Other Amusement and Recreation Industries | | | 0.1 | % |
| Plastics Product Manufacturing | | | 0.0 | % |
| Home Furnishings Stores | | | 0.0 | % |
| Cash and Cash Equivalents | | | 16.6 | % |
| | | | | |
| Total | | | 100.0 | % |
Tennenbaum Opportunities Fund V, LLC
(A Delaware Limited Liability Company)
Consolidated Statement of Assets and Liabilities (Unaudited)
June 30, 2009
| Assets | | | |
| Investments, at fair value | | | |
| Unaffiliated issuers (cost $1,252,933,963) | | $ | 995,970,490 | |
| Affiliates (cost $17,246,051) | | | 186,027 | |
| Total investments (cost $1,270,180,014) | | | 996,156,517 | |
| | | | | |
| Cash and cash equivalents | | | 197,699,842 | |
| Receivable for open trades | | | 21,498,929 | |
| Accrued interest income from investments in unaffiliated issuers | | | 19,749,641 | |
| Deferred debt issuance costs | | | 5,902,984 | |
| Prepaid expenses and other assets | | | 383,901 | |
| Total assets | | | 1,241,391,814 | |
| | | | | |
| Liabilities | | | | |
| Credit facility payable | | | 95,424,400 | |
| Payable for investments purchased | | | 31,729,971 | |
| Distributions payable | | | 14,000,000 | |
| Management and advisory fees payable | | | 2,387,500 | |
| Equity placement costs payable | | | 1,506,726 | |
| Interest payable | | | 116,901 | |
| Accrued expenses and other liabilities | | | 759,300 | |
| Total liabilities | | | 145,924,798 | |
| | | | | |
| Preferred stock | | | | |
| Series Z; $500/share liquidation preference; 560 shares authorized, issued and outstanding | | | 280,000 | |
| Accumulated distributions on Series Z preferred stock | | | 12,015 | |
| Total preferred stock | | | 292,015 | |
| | | | | |
| Preferred equity facility | | | | |
| Series A preferred limited partner interests in Tennenbaum Opportunities Partners V, LP; $20,000/interest liquidation preference; 25,000 interests authorized, 18,450 interests issued and outstanding | | | 369,000,000 | |
| Accumulated dividends on Series A preferred equity facility | | | 783,205 | |
| Total preferred limited partner interests | | | 369,783,205 | |
| | | | | |
| Minority interest | | | | |
| General partner interest in Tennenbaum Opportunities Partners V, LP | | | - | |
| | | | | |
| Net assets applicable to common shareholders | | $ | 725,391,796 | |
| | | | | |
| Composition of net assets applicable to common shareholders | | | | |
| Common stock, $0.001 par value; unlimited shares authorized, 78,287.806 shares issued and outstanding | | $ | 78 | |
| Paid-in capital in excess of par | | | 1,079,764,365 | |
| Accumulated net investment income | | | 4,150,842 | |
| Accumulated net realized loss | | | (87,498,445 | ) |
| Accumulated net unrealized depreciation | | | (271,013,029 | ) |
| Accumulated dividends to Series Z preferred shareholders | | | (12,015 | ) |
| Net assets applicable to common shareholders | | $ | 725,391,796 | |
| | | | | |
| Common stock, NAV per share | | $ | 9,265.71 | |
See accompanying notes.
Tennenbaum Opportunities Fund V, LLC
(A Delaware Limited Liability Company)
Consolidated Statement of Investments (Unaudited)
June 30, 2009
Showing Percentage of Total Cash and Investments of the Company
| | | Principal | | | Fair | | | Percent of Cash | |
| Investment | | Amount | | | Value | | | and Investments | |
| | | | | | | | | | |
Debt Investments (81.08%) | | | | | | | | | |
| | | | | | | | | |
| Activities Related to Credit Intermediation (0.03%) | | | | | | | | | |
| OpenSolutions, Inc., Tranche B Term Loan, LIBOR + 2.125%, due 1/23/14 | | | | | | | | | |
| (Acquired 5/12/09, Amortized Cost $310,000) | | $ | 500,000 | | | $ | 335,000 | | | | 0.03 | % |
| | | | | | | | | | | | | |
| Architectural, Engineering, and Related Services (2.19%) | | | | | | | | | | | | |
| Alion Science & Technology Corporation, 1st Lien Term Loan, LIBOR + 6%, due 2/6/13 | | | | | | | | | | | | |
| (Acquired 6/4/09, 6/18/09 and 6/23/09, Amortized Cost $8,562,080) | | $ | 10,936,335 | | | | 9,131,210 | | | | 0.76 | % |
| ESP Holdings, Inc., 2nd Lien Term Loan, LIBOR + 10%, due 9/12/14 | | | | | | | | | | | | |
| (Acquired 2/6/09, Amortized Cost $14,299,412) | | $ | 17,023,109 | | | | 17,023,109 | | | | 1.43 | % |
| Total Architectural, Engineering, and Related Services | | | | | | | 26,154,319 | | | | | |
| | | | | | | | | | | | | |
| Cable and Other Subscription Programming (4.52%) | | | | | | | | | | | | |
| Bresnan Communications, LLC, 2nd Lien Term Loan, LIBOR + 4.5%, due 3/29/14 | | | | | | | | | | | | |
| (Acquired 11/22/06, Amortized Cost $9,926,094) | | $ | 9,750,000 | | | | 8,872,500 | | | | 0.74 | % |
| Primacom AG, Mezzanine Term Loan, EURIBOR + 3.5% Cash + 7% PIK, due 11/21/17 | | | | | | | | | | | | |
(Acquired 12/28/07, Amortized Cost $47,858,918) - (Germany) (3) | | € | 32,549,726 | | | | 45,106,067 | | | | 3.78 | % |
| Total Cable and Other Subscription Programming | | | | | | | 53,978,567 | | | | | |
| | | | | | | | | | | | | |
| Communications Equipment Manufacturing (7.18%) | | | | | | | | | | | | |
| Dialogic Corporation, Senior Secured Notes, 17%, due 9/30/10 | | | | | | | | | | | | |
| (Acquired 12/05/08, Amortized Cost $5,387,879) | | $ | 5,387,879 | | | | 5,315,142 | | | | 0.45 | % |
| Dialogic Corporation, Senior Secured Notes, LIBOR + 12%, due 9/30/10 | | | | | | | | | | | | |
| (Acquired 9/9/08 and 9/10/08, Amortized Cost $39,960,669) | | $ | 40,404,933 | | | | 39,526,126 | | | | 3.31 | % |
| Mitel Networks Corporation, 1st Lien Term Loan, LIBOR + 3.25%, due 8/10/14 | | | | | | | | | | | | |
| (Acquired 12/13/07, Amortized Cost $49,733,325) | | $ | 52,907,792 | | | | 40,871,269 | | | | 3.42 | % |
| Total Communications Equipment Manufacturing | | | | | | | 85,712,537 | | | | | |
| | | | | | | | | | | | | |
| Computer and Peripheral Equipment Manufacturing (1.87%) | | | | | | | | | | | | |
| Palm, Inc., Tranche B Term Loan, LIBOR + 3.5%, due 4/24/14 | | | | | | | | | | | | |
| (Acquired 12/13/07, Amortized Cost $27,030,444) | | $ | 30,033,827 | | | | 22,375,201 | | | | 1.87 | % |
| | | | | | | | | | | | | |
| Data Processing, Hosting and Related Services (7.02%) | | | | | | | | | | | | |
| GXS Worldwide, Inc., 1st Lien Term Loan, Prime + 4.75%, due 3/31/13 | | | | | | | | | | | | |
(Acquired 10/12/07, Amortized Cost $21,955,613) (8) | | $ | 22,449,605 | | | | 20,990,380 | | | | 1.76 | % |
| GXS Worldwide, Inc., 2nd Lien Term Loan, LIBOR + 10.25%, due 9/30/13 | | | | | | | | | | | | |
(Acquired 10/12/07, Amortized Cost $65,940,204) (8) | | $ | 68,264,167 | | | | 62,803,034 | | | | 5.26 | % |
| Total Data Processing, Hosting and Related Services | | | | | | | 83,793,414 | | | | | |
| | | | | | | | | | | | | |
| Gambling Industries (3.06%) | | | | | | | | | | | | |
| Gateway Casinos, Inc., 1st Lien Delayed Draw Term Loan, LIBOR + 2.5%, due 9/30/14 | | | | | | | | | | | | |
| (Acquired 6/8/08, Amortized Cost $108,618) - (Canada) | | $ | 168,400 | | | | 106,653 | | | | 0.01 | % |
| Gateway Casinos, Inc., 1st Lien Term Loan, LIBOR + 2.5%, due 9/30/14 | | | | | | | | | | | | |
| (Acquired 6/8/08, Amortized Cost $536,382) - (Canada) | | $ | 831,600 | | | | 526,680 | | | | 0.04 | % |
| Gateway Casinos, Inc., 2nd Lien Term Loan, LIBOR + 5.5%, due 3/31/15 | | | | | | | | | | | | |
| (Acquired 5/30/08, 6/5/08, 6/12/08 and 6/26/08, Amortized Cost $41,466,250) - (Canada) | | $ | 61,000,000 | | | | 33,129,100 | | | | 2.77 | % |
| Tropicana Entertainment, Term Loan, Prime + 3.25%, due 1/3/12 | | | | | | | | | | | | |
(Acquired 12/7/07 and 12/11/07, Amortized Cost $9,612,500) (4) | | $ | 10,000,000 | | | | 2,831,250 | | | | 0.24 | % |
| Total Gambling Industries | | | | | | | 36,593,683 | | | | | |
Tennenbaum Opportunities Fund V, LLC
(A Delaware Limited Liability Company)
Consolidated Statement of Investments (Unaudited) (Continued)
June 30, 2009
Showing Percentage of Total Cash and Investments of the Company
| | | Principal | | | Fair | | | Percent of Cash | |
| Investment | | Amount | | | Value | | | and Investments | |
| | | | | | | | | | |
Debt Investments (continued) | | | | | | | | | |
Industrial Machinery Manufacturing (1.14%) | | | | | | | | | |
| Edwards Limited 2nd Lien Term Loan, LIBOR + 5.75%, due 11/30/14 | | | | | | | | | |
| (Acquired 7/15/08, 8/14/08, 9/03/08, 5/13/09, 5/26/09, 6/12/09, 6/19/09 | | | | | | | | | |
| and 6/22/09, Amortized Cost $20,376,250) | | $ | 39,000,000 | | | $ | 13,650,000 | | | | 1.14 | % |
| | | | | | | | | | | | | |
| Management, Scientific, and Technical Consulting Services (0.94%) | | | | | | | | | | | | |
| Booz Allen Hamilton Mezzanine Loan, 13%, due 7/31/16 | | | | | | | | | | | | |
| (Acquired 8/1/08, Amortized cost $11,240,578) | | $ | 11,354,118 | | | | 11,202,734 | | | | 0.94 | % |
| | | | | | | | | | | | | |
| Metalworking Machinery Manufacturing (0.13%) | | | | | | | | | | | | |
| Mold-Masters Group, 1st Lien Term Loan, LIBOR + 3.5%, due 10/11/14 | | | | | | | | | | | | |
| (Acquired 6/22/09, Amortized Cost $1,220,939) | | $ | 2,180,248 | | | | 1,580,680 | | | | 0.13 | % |
| | | | | | | | | | | | | |
| Motor Vehicle Manufacturing (0.50%) | | | | | | | | | | | | |
| General Motors Corporation, Revolver, LIBOR + 2.5%, due 7/20/11 | | | | | | | | | | | | |
| (Acquired 9/26/07, 9/27/07, 10/18/07, 11/07/07, 12/04/07, | | | | | | | | | | | | |
| and 12/14/07, Amortized Cost $5,379,541) | | $ | 6,000,000 | | | | 5,939,541 | | | | 0.50 | % |
| | | | | | | | | | | | | |
| Motor Vehicle Parts Manufacturing (2.56%) | | | | | | | | | | | | |
| Visteon Corporation, 1st Lien Term Loan, LIBOR + 3%, due 6/13/13 | | | | | | | | | | | | |
| (Acquired 11/16/07, 11/20/07, 12/14/07, 12/19/07, and 12/20/07, | | | | | | | | | | | | |
Amortized Cost $61,610,533) (4) | | $ | 71,627,582 | | | | 30,531,257 | | | | 2.56 | % |
| | | | | | | | | | | | | |
| Offices of Real Estate Agents and Brokers (1.54%) | | | | | | | | | | | | |
| Realogy Corporation, Revolver, LIBOR + 2.25%, due 4/10/13 | | | | | | | | | | | | |
| (Acquired 6/28/07, 7/9/07, 7/13/07, 8/17/07, 3/25/09 and 4/20/09, | | | | | | | | | | | | |
| Amortized Cost $25,762,083) | | $ | 40,000,000 | | | | 18,333,333 | | | | 1.54 | % |
| | | | | | | | | | | | | |
| Other Electrical Equipment and Component Manufacturing (3.97%) | | | | | | | | | | | | |
| EaglePicher Corporation, 1st Lien Tranche B Term Loan, LIBOR + 4.5%, 12/31/12 | | | | | | | | | | | | |
| (Acquired 12/31/07, Amortized Cost $23,602,970) | | $ | 23,602,970 | | | | 22,599,844 | | | | 1.89 | % |
| EaglePicher Corporation, 2nd Lien Term Loan, LIBOR + 7.5%, 12/31/13 | | | | | | | | | | | | |
| (Acquired 12/31/07 and 2/6/09, Amortized Cost $26,850,250) | | $ | 28,000,000 | | | | 24,850,000 | | | | 2.08 | % |
| Total Other Electrical Equipment and Component Manufacturing | | | | | | | 47,449,844 | | | | | |
| | | | | | | | | | | | | |
| Petroleum and Coal Products Manufacturing (2.85%) | | | | | | | | | | | | |
| Building Materials Corporation of America, 2nd Lien Term Loan, LIBOR + 5.75%, due 9/15/14 | | | | | | | | | | | | |
| (Acquired 6/11/08, 6/12/08, 4/14/09, 4/22/09, 5/20/09, 5/28/09 and 6/2/09, | | | | | | | | | | | | |
| Amortized Cost $32,528,679) | | $ | 42,383,183 | | | | 34,012,504 | | | | 2.85 | % |
| | | | | | | | | | | | | |
| Radio and Television Broadcasting (0.30%) | | | | | | | | | | | | |
| High Plains Broadcasting Operating Company, Term Loan, Prime + 4%, due 9/14/16 | | | | | | | | | |
| (Acquired 9/15/08, Amortized Cost $977,509) | | $ | 1,074,186 | | | | 751,930 | | | | 0.06 | % |
| Newport Television LLC, Term Loan B, Prime + 5%, due 9/14/16 | | | | | | | | | | | | |
| (Acquired 5/1/08 and 5/29/08, Amortized Cost $3,692,389) | | $ | 4,057,570 | | | | 2,840,299 | | | | 0.24 | % |
| Total Radio and Television Broadcasting | | | | | | | 3,592,229 | | | | | |
Tennenbaum Opportunities Fund V, LLC
(A Delaware Limited Liability Company)
Consolidated Statement of Investments (Unaudited) (Continued)
June 30, 2009
Showing Percentage of Total Cash and Investments of the Company
| | | Principal | | | Fair | | | Percent of Cash | |
| Investment | | Amount | | | Value | | | and Investments | |
| | | | | | | | | | |
Debt Investments (continued) | | | | | | | | | |
| Satellite Telecommunications (5.41%) | | | | | | | | | |
| WildBlue Communications, Inc., 1st Lien Delayed Draw Term Loan, | | | | | | | | | |
| LIBOR + 4% Cash + 2.5% PIK, due 12/31/09 | | | | | | | | | |
(Acquired 6/28/07, Amortized Cost $29,470,960) (8) | | $ | 31,008,352 | | | $ | 30,053,294 | | | | 2.52 | % |
| WildBlue Communications, Inc., 2nd Lien Delayed Draw Term Loan, | | | | | | | | | | | | |
| 8.5% Cash + 7.25% PIK, due 8/15/11 | | | | | | | | | | | | |
(Acquired 6/28/07, Amortized Cost $32,488,912) (8) | | $ | 34,169,931 | | | | 34,463,792 | | | | 2.89 | % |
| Total Satellite Telecommunications | | | | | | | 64,517,086 | | | | | |
| | | | | | | | | | | | | |
| Semiconductor and Other Electronic Component Manufacturing (1.88%) | | | | | | | | | | | | |
| Isola USA Corporation, 1st Lien Term Loan, Prime + 9.75%, due 12/18/12 | | | | | | | | | | | | |
| (Acquired 1/24/08 and 6/29/09, Amortized Cost $33,908,912) | | $ | 41,288,733 | | | | 20,644,366 | | | | 1.73 | % |
| Isola USA Corporation, Revolver, LIBOR + 4.75%, due 12/18/12 | | | | | | | | | | | | |
| (Acquired 6/29/09, Amortized Cost $1,864,366) | | $ | 3,691,815 | | | | 1,845,907 | | | | 0.15 | % |
| Total Semiconductor and Other Electronic Component Manufacturing | | | | | | | 22,490,273 | | | | | |
| | | | | | | | | | | | | |
| Sporting Goods, Hobby and Musical Instrument Stores (0.24%) | | | | | | | | | | | | |
| Toys R Us, Real Estate Term Loan, LIBOR + 3%, due 12/8/09 | | | | | | | | | | | | |
| (Acquired 10/18/06, Amortized Cost $2,930,434) | | $ | 2,923,126 | | | | 2,893,895 | | | | 0.24 | % |
| | | | | | | | | | | | | |
| Wired Telecommunications Carriers (11.81%) | | | | | | | | | | | | |
| Cavalier Telephone Corporation, Senior Secured 1st Lien Term Loan, | | | | | | | | | | | | |
| Prime + 6.25%, due 12/31/12 | | | | | | | | | | | | |
| (Acquired 4/18/08 and 4/24/08, Amortized Cost $1,806,262) | | $ | 2,311,420 | | | | 1,298,249 | | | | 0.11 | % |
| Global Crossing Limited, Tranche B Term Loan, LIBOR + 6.25%, due 5/9/12 | | | | | | | | | | | | |
| (Acquired 6/4/07, Amortized Cost $34,406,615) | | $ | 39,177,470 | | | | 33,261,672 | | | | 2.79 | % |
| Hawaiian Telcom Communications Inc., Revolver, Prime + 1.25%, due 4/30/12 | | | | | | | | | | | | |
| (Acquired 5/9/08 and 5/16/08, Cost $3,800,986) | | $ | 4,888,984 | | | | 2,919,842 | | | | 0.24 | % |
| Hawaiian Telcom Communications Inc., Tranche C Term Loan, LIBOR + 2.25%, due 4/30/12 | | | | | | | | | | | | |
| (Acquired 4/22/08, 4/25/08, 4/28/08, 4/30/08, 5/15,08 and 5/19/08, Amortized Cost $2,227,525) | | $ | 2,923,641 | | | | 1,732,257 | | | | 0.15 | % |
| Integra Telecom, Inc., Term Loan, LIBOR + 10% PIK, due 8/31/14 | | | | | | | | | | | | |
| (Acquired 9/05/07, Amortized Cost $43,496,782) | | $ | 43,816,782 | | | | 7,142,136 | | | | 0.60 | % |
| Integra Telecom, Inc., 1st Lien Term Loan, Prime + 3.75%, due 8/31/13 | | | | | | | | | | | | |
| (Acquired 5/20/09 and 6/3/09, Amortized Cost $1,195,641) | | $ | 1,371,770 | | | | 1,248,258 | | | | 0.10 | % |
| Integra Telecom, Inc., 2nd Lien Term Loan, Prime + 6%, due 2/28/14 | | | | | | | | | | | | |
(Acquired 8/1/06, 4/22/09, 6/17/09 and 6/30/09, Amortized Cost $28,367,682) (4) | | $ | 32,729,423 | | | | 23,663,373 | | | | 1.98 | % |
| Interstate Fibernet, Inc., 1st Lien Term Loan, LIBOR + 4%, due 7/31/13 | | | | | | | | | | | | |
(Acquired 8/01/07, Amortized Cost $29,175,093) (8) | | $ | 30,000,095 | | | | 24,813,829 | | | | 2.08 | % |
| Interstate Fibernet, Inc., 2nd Lien Term Loan, LIBOR + 7.5%, due 7/31/14 | | | | | | | | | | | | |
(Acquired 7/31/07, Amortized Cost $44,251,265) (8) | | $ | 44,752,265 | | | | 40,746,937 | | | | 3.41 | % |
| NEF Telecom Company BV, 2nd Lien Tranche D Term Loan, | | | | | | | | | | | | |
| EURIBOR + 5.5%, due 2/16/17 | | | | | | | | | | | | |
(Acquired 8/29/07, Amortized Cost $5,607,877) - (Netherlands) (3) | | € | 4,103,088 | | | | 4,183,088 | | | | 0.35 | % |
| Total Wired Telecommunications Carriers | | | | | | | 141,009,641 | | | | | |
| | | | | | | | | | | | | |
| Total Bank Debt (Cost $850,929,421) | | | | | | | 706,145,738 | | | | | |
Tennenbaum Opportunities Fund V, LLC
(A Delaware Limited Liability Company)
Consolidated Statement of Investments (Unaudited) (Continued)
June 30, 2009
Showing Percentage of Total Cash and Investments of the Company
| | | Principal | | | Fair | | | Percent of Cash | |
| Investment | | Amount | | | Value | | | and Investments | |
| | | | | | | | | | |
Debt Investments (continued) | | | | | | | | | |
| Other Corporate Debt Securities (21.94%) | | | | | | | | | |
| Architectural, Engineering, and Related Services (1.83%) | | | | | | | | | |
| Alion Science & Technology Corporation, Senior Notes, 10.25%, due 2/1/15 | | $ | 54,707,000 | | | $ | 21,882,800 | | | | 1.83 | % |
| | | | | | | | | | | | | |
| Data Processing, Hosting and Related Services (2.78%) | | | | | | | | | | | | |
| Terremark Worldwide, Inc., Senior Secured Notes, 12%, due 6/15/17 | | | | | | | | | | | | |
(Acquired 6/17/09, Amortized Cost $33,236,014) (5) | | $ | 34,936,000 | | | | 33,189,200 | | | | 2.78 | % |
| | | | | | | | | | | | | |
| Depository Credit Intermediation (0.86%) | | | | | | | | | | | | |
| Wells Fargo & Company, FDIC Guaranteed Notes, 3%, due 12/9/11 | | $ | 10,000,000 | | | | 10,297,400 | | | | 0.86 | % |
| | | | | | | | | | | | | |
| Full-Service Restaurants (0.93%) | | | | | | | | | | | | |
| Landry's Restaurant, Inc., Senior Secured Notes, 14%, due 8/15/11 | | | | | | | | | | | | |
(Acquired 6/9/09, Amortized Cost $11,112,000) (5) | | $ | 11,575,000 | | | | 11,112,000 | | | | 0.93 | % |
| | | | | | | | | | | | | |
| Gambling Industries (1.97%) | | | | | | | | | | | | |
| Harrah's Operating Company Inc., Senior Secured Notes, 10%, due 12/15/18 | | | | | | | | | | | | |
(Acquired 6/25/09, Amortized Cost $48,954,024) (5) | | $ | 39,875,000 | | | | 23,526,250 | | | | 1.97 | % |
| | | | | | | | | | | | | |
| Home Furnishings Stores (0.04%) | | | | | | | | | | | | |
Linens 'n Things, Inc., Senior Secured Notes, LIBOR + 5.625%, due 1/15/14 (4) | | $ | 9,189,000 | | | | 512,379 | | | | 0.04 | % |
| | | | | | | | | | | | | |
Industrial Machinery Manufacturing (1.53%) | | | | | | | | | | | | |
| GSI Group Corporation, Senior Notes, 11%, due 8/20/13 | | | | | | | | | | | | |
(Acquired 8/20/08, Amortized Cost $18,090,735) (5) | | $ | 20,743,000 | | | | 18,274,583 | | | | 1.53 | % |
| | | | | | | | | | | | | |
| Nondepository Credit Intermediation (1.08%) | | | | | | | | | | | | |
| General Electric Capital Corp., FDIC Guaranteed Notes, 1.8%, due 3/11/11 | | $ | 2,500,000 | | | | 2,524,700 | | | | 0.21 | % |
| General Electric Capital Corp., FDIC Guaranteed Notes, 3%, due 12/9/11 | | $ | 10,000,000 | | | | 10,331,400 | | | | 0.87 | % |
| Total Nondepository Credit Intermediation | | | | | | | 12,856,100 | | | | | |
| | | | | | | | | | | | | |
| Offices of Real Estate Agents and Brokers (0.54%) | | | | | | | | | | | | |
| Realogy Corporation, Senior Notes, 10.5%, due 4/15/14 | | $ | 6,284,000 | | | | 2,733,540 | | | | 0.23 | % |
| Realogy Corporation, Senior Subordinated Notes, 12.375%, due 4/15/15 | | $ | 13,099,000 | | | | 3,667,720 | | | | 0.31 | % |
| Total Offices of Real Estate Agents and Brokers | | | | | | | 6,401,260 | | | | | |
| | | | | | | | | | | | | |
| Other Amusement and Recreation Industries (0.06%) | | | | | | | | | | | | |
| Bally Total Fitness Holdings, Inc., Senior Subordinated Notes, | | | | | | | | | | | | |
| 14% Cash or 15.625% PIK, due 10/1/13 | | | | | | | | | | | | |
(Acquired 10/01/07, Amortized Cost $13,374,972) (4), (5) | | $ | 13,097,333 | | | | 667,964 | | | | 0.06 | % |
| | | | | | | | | | | | | |
| Plastics Product Manufacturing (0.05%) | | | | | | | | | | | | |
Pliant Corporation, Senior Secured 2nd Lien Notes, 11.125%, due 9/1/09 (4) | | $ | 6,115,000 | | | | 611,500 | | | | 0.05 | % |
| | | | | | | | | | | | | |
| Radio and Television Broadcasting (0.37%) | | | | | | | | | | | | |
| Radio One Inc., Senior Subordinated Notes, 8.875%, due 7/1/11 | | $ | 11,050,000 | | | | 4,420,000 | | | | 0.37 | % |
| | | | | | | | | | | | | |
| Resin, Synthetic Rubber, and Artificial Synthetic Fibers and Filaments Manufacturing (0.19%) | | | | | | | | | | | | |
| AGY Holding Corp., Senior Secured 2nd Lien Notes, 11%, due 11/15/14 | | $ | 2,896,000 | | | | 2,324,040 | | | | 0.19 | % |
Tennenbaum Opportunities Fund V, LLC
(A Delaware Limited Liability Company)
Consolidated Statement of Investments (Unaudited) (Continued)
June 30, 2009
Showing Percentage of Total Cash and Investments of the Company
| | | Principal | | | | | | | |
| | | Amount | | | Fair | | | Percent of Cash | |
| Investment | | or Shares | | | Value | | | and Investments | |
| | | | | | | | | | |
Debt Investments (continued) | | | | | | | | | |
| Satellite Telecommunications (2.37%) | | | | | | | | | |
| Satelites Mexicanos, Senior Secured FRN, LIBOR + 8.75%, due 11/30/11 | | $ | 35,199,380 | | | $ | 28,245,742 | | | | 2.37 | % |
| | | | | | | | | | | | | |
| Securities and Commodity Contracts Intermediation and Brokerage (0.63%) | | | | | | | | | | | | |
| Goldman Sachs Group, Inc., FDIC Guaranteed Notes, 1.7%, due 3/15/11 | | $ | 2,500,000 | | | | 2,515,550 | | | | 0.21 | % |
| JP Morgan Chase & Co., FDIC Guaranteed Notes, 1.65%, due 2/23/11 | | $ | 5,000,000 | | | | 5,029,200 | | | | 0.42 | % |
| Total Securities and Commodity Contracts Intermediation and Brokerage | | | | | | | 7,544,750 | | | | | |
| | | | | | | | | | | | | |
| Sporting Goods, Hobby and Musical Instrument Stores (2.74%) | | | | | | | | | | | | |
| Michaels Stores, Inc., Senior Unsecured Notes, 10%, due 11/1/14 | | $ | 6,265,000 | | | | 5,260,908 | | | | 0.44 | % |
| Michaels Stores, Inc., Senior Subordinated Notes, 11.375%, due 11/1/16 | | $ | 42,000,000 | | | | 27,507,480 | | | | 2.30 | % |
| Total Sporting Goods, Hobby and Musical Instrument Stores | | | | | | | 32,768,388 | | | | | |
| | | | | | | | | | | | | |
| Wired Telecommunications Carriers (3.97%) | | | | | | | | | | | | |
| Hawaiian Telcom Communications, Senior FRN, LIBOR + 5.5%, due 5/1/13 | | | | | | | | | | | | |
(Acquired 6/5/08, 6/10/08, 6/12/08 and 6/13/08 Amortized Cost $5,025,972) (4), (5) | | $ | 12,870,000 | | | | 273,488 | | | | 0.02 | % |
| NEF Telecom Company BV, Mezzanine Term Loan, EURIBOR + 10% PIK, due 8/16/17 | | | | | | | | | | | | |
(Acquired 8/29/07, Amortized Cost $55,675,570) - (Netherlands) (3) | | € | 40,419,884 | | | | 47,163,697 | | | | 3.95 | % |
| Total Wired Telecommunications Carriers | | | | | | | 47,437,185 | | | | | |
| | | | | | | | | | | | | |
| Total Other Corporate Debt Securities (Cost $354,361,805) | | | | | | | 262,071,541 | | | | | |
| | | | | | | | | | | | | |
| Total Debt Investments (Cost $1,205,291,226) | | | | | | | 968,217,279 | | | | | |
| | | | | | | | | | | | | |
Equity Securities (2.34%) | | | | | | | | | | | | |
| Activities Related to Credit Intermediation (0.58%) | | | | | | | | | | | | |
Online Resources Corporation, Common Stock (4) | | | 1,113,900 | | | | 6,950,736 | | | | 0.58 | % |
| | | | | | | | | | | | | |
| Data Processing, Hosting, and Related Services (0.46%) | | | | | | | | | | | | |
| GXS Holdings, Inc., Common Stock | | | | | | | | | | | | |
(Acquired 3/28/08, Cost $2,510,633) (4), (5), (9) | | | 2,611,059 | | | | 5,274,339 | | | | 0.44 | % |
| GXS Holdings, Inc., Series A Preferred Stock | | | | | | | | | | | | |
(Acquired 3/28/08, Cost $100,425) (4), (5), (9) | | | 104,442 | | | | 210,973 | | | | 0.02 | % |
| Total Data Processing, Hosting, and Related Services | | | | | | | 5,485,312 | | | | | |
| | | | | | | | | | | | | |
| Depository Credit Intermediation (0.34%) | | | | | | | | | | | | |
| Doral GP Ltd., GP Interest | | | | | | | | | | | | |
(Acquired 7/12/07, Cost $225) (2), (4), (5), (6) | | | 100 | | | | 225 | | | | 0.00 | % |
| Doral Holdings, LP Interest | | | | | | | | | | | | |
(Acquired 7/12/07, Cost $24,911,825) (4), (5) | | | 24,911,825 | | | | 4,008,060 | | | | 0.34 | % |
| Total Depository Credit Intermediation | | | | | | | 4,008,285 | | | | | |
| | | | | | | | | | | | | |
| Industrial Machinery Manufacturing (0.02%) | | | | | | | | | | | | |
| GSI Group, Inc., Common Stock | | | | | | | | | | | | |
(Acquired 8/20/08, Cost $3,030,191) (4), (5) | | | 578,680 | | | | 286,447 | | | | 0.02 | % |
| | | | | | | | | | | | | |
| Motor Vehicle Manufacturing (0.02%) | | | | | | | | | | | | |
Fleetwood Enterprises, Inc., Common Stock (2), (4), (6) | | | 23,225,225 | | | | 185,802 | | | | 0.02 | % |
Tennenbaum Opportunities Fund V, LLC
(A Delaware Limited Liability Company)
Consolidated Statement of Investments (Unaudited) (Continued)
June 30, 2009
Showing Percentage of Total Cash and Investments of the Company
| | | Principal | | | | | | | |
| | | Amount | | | Fair | | | Percent of Cash | |
| Investment | | or Shares | | | Value | | | and Investments | |
| | | | | | | | | | |
Equity Securities (continued) | | | | | | | | | |
| Satellite Telecommunications (0.18%) | | | | | | | | | |
| WildBlue Communications, Inc., Warrants to Purchase Common Stock | | | | | | | | | |
(Acquired 8/16/08, Cost $219,103) (4), (5), (8) | | | 16,893 | | | $ | 2,177,170 | | | | 0.18 | % |
| | | | | | | | | | | | | |
| Wired Telecommunications Carriers (0.74%) | | | | | | | | | | | | |
| ITC^DeltaCom, Inc., Common Stock | | | | | | | | | | | | |
| (Acquired 11/21/08, 11/25/08, 12/5/08, 12/8/08, 12/9/08, 12/19/08, 12/31/08, 3/25/09, 3/27/09, | | | | | | | | | | | | |
(3/30/09, 3/31/09, 5/27/09, 5/29/09, 6/3/09, 6/5/09, 6/9/09, 6/10/09, Cost $621,900) (4), (5), (10) | | | 1,120,569 | | | | 1,120,569 | | | | 0.09 | % |
| NEF Kamchia Co-Investment Fund, LP Interest | | | | | | | | | | | | |
(Acquired 7/31/07, Amortized Cost $8,982,701) - (Cayman Islands) (3), (4), (5) | | | 6,550,500 | | | | 7,724,917 | | | | 0.65 | % |
| Total Wired Telecommunications Carriers | | | | | | | 8,845,486 | | | | | |
| | | | | | | | | | | | | |
| Total Equity Securities (Cost $64,888,788) | | | | | | | 27,939,238 | | | | | |
| | | | | | | | | | | | | |
Total Investments (Cost $1,270,180,014) (7) | | | | | | | 996,156,517 | | | | | |
| | | | | | | | | | | | | |
Cash and Cash Equivalents (16.58%) | | | | | | | | | | | | |
| Wells Fargo & Company, Overnight Repurchase Agreement, 0.05%, | | | | | | | | | | | | |
| Collateralized by Federal Home Loan Bank Discount Note | | $ | 3,903,072 | | | | 3,903,072 | | | | 0.33 | % |
| Chevron Funding Corporation, Commercial Paper, 0.17%, due 7/1/09 | | $ | 10,000,000 | | | | 10,000,000 | | | | 0.84 | % |
| Chevron Funding Corporation, Commercial Paper, 0.22%, due 7/1/09 | | $ | 25,000,000 | | | | 25,000,000 | | | | 2.09 | % |
| Wells Fargo & Company, Commercial Paper, 0.05%, due 7/1/09 | | $ | 3,000,000 | | | | 3,000,000 | | | | 0.25 | % |
| Citicorp, Commercial Paper, 0.35%, due 7/7/09 | | $ | 20,000,000 | | | | 19,998,833 | | | | 1.68 | % |
| General Electric Capital Corporation, Commercial Paper, 0.18%, due 7/8/09 | | $ | 10,000,000 | | | | 9,999,650 | | | | 0.84 | % |
| Union Bank of California, Commercial Paper, 0.20%, due 7/8/09 | | $ | 10,000,000 | | | | 9,999,611 | | | | 0.84 | % |
| General Electric Capital Corporation, Commercial Paper, 0.15%, due 7/10/09 | | $ | 16,000,000 | | | | 15,999,400 | | | | 1.34 | % |
| Toyota Motor Credit Corporation, Commercial Paper, 0.21%, due 7/15/09 | | $ | 11,000,000 | | | | 10,999,102 | | | | 0.92 | % |
| Toyota Motor Credit Corporation, Commercial Paper, 0.22%, due 7/15/09 | | $ | 13,000,000 | | | | 12,998,888 | | | | 1.09 | % |
| Toyota Motor Credit Corporation, Commercial Paper, 0.23%, due 7/15/09 | | $ | 15,000,000 | | | | 14,998,658 | | | | 1.26 | % |
| Wells Fargo & Company, Commercial Paper, 0.20%, due 7/22/09 | | $ | 25,000,000 | | | | 24,997,083 | | | | 2.09 | % |
| UBS Finance, Commercial Paper, 0.25%, due 7/24/09 | | $ | 5,000,000 | | | | 4,999,201 | | | | 0.42 | % |
| Union Bank of California, Certificate of Deposit, 0.25%, due 7/30/09 | | $ | 25,000,000 | | | | 25,000,000 | | | | 2.09 | % |
| Cash Denominated in Foreign Currency (Cost $1,595,212) | | € | 1,153,440 | | | | 1,618,624 | | | | 0.14 | % |
| Cash Held on Account at Various Institutions | | $ | 4,187,720 | | | | 4,187,720 | | | | 0.36 | % |
| Total Cash and Cash Equivalents | | | | | | | 197,699,842 | | | | | |
| | | | | | | | | | | | | |
| Total Cash and Investments | | | | | | $ | 1,193,856,359 | | | | 100.00 | % |
| | | | | | | | | | | | | |
Notes to Statement of Investments:
| (1) | Investments in bank debt generally are bought and sold among institutional investors in transactions not subject to registration under the Securities Act of 1933. Such transactions are generally subject to contractual restrictions, such as approval of the agent or borrower. |
| (2) | Affiliated issuer - as defined under the Investment Company Act of 1940 (ownership of 5% or more of the outstanding voting securities of this issuer). |
| (3) | Principal amount denominated in euros. Amortized cost and fair value converted from euros to U.S. dollars. |
Tennenbaum Opportunities Fund V, LLC
(A Delaware Limited Liability Company)
Consolidated Statement of Investments (Unaudited) (Continued)
June 30, 2009
Showing Percentage of Total Cash and Investments of the Company
Notes to Statement of Investments (continued):
| (4) | Non-income producing security. |
| (6) | Not a controlling position. |
| (7) | Includes investments with an aggregate fair value of $13,383,540 that have been segregated to collateralize certain unfunded commitments. |
| (8) | Priced by an independent third-party pricing service. |
| (9) | Priced by the Investment Manager. |
| (10) | Priced at the closing price per Pink Sheets. |
Aggregate purchases and aggregate sales of investments, other than Government securities, totaled $135,016,282 and $76,206,583, respectively. Aggregate purchases includes investment assets received as payment in-kind. Aggregate sales includes principal paydowns on debt investments.
The total value of restricted securities and bank debt as of June 30, 2009 was $861,155,620 or 72.13% of total cash and investments of the Company.
See accompanying notes.
Tennenbaum Opportunities Fund V, LLC
(A Delaware Limited Liability Company)
Consolidated Statement of Operations (Unaudited)
Six Months Ended June 30, 2009
| Investment income | | | |
| Interest income from unaffiliated issuers | | $ | 54,506,698 | |
| Dividend income | | | 45,371 | |
| Other income | | | 717,883 | |
| Total investment income | | | 55,269,952 | |
| | | | | |
| Operating expenses | | | | |
| Management and advisory fees | | | 14,325,000 | |
| Interest expense | | | 1,140,230 | |
| Amortization of deferred debt issuance costs | | | 530,634 | |
| Commitment fees | | | 332,075 | |
| Legal fees, professional fees and due diligence expenses | | | 214,514 | |
| Insurance expense | | | 160,294 | |
| Custody fees | | | 88,000 | |
| Director fees | | | 85,500 | |
| Other operating expenses | | | 375,042 | |
| Total expenses | | | 17,251,289 | |
| | | | | |
| Net investment income | | | 38,018,663 | |
| | | | | |
| Net realized and unrealized gain | | | | |
| Net realized loss from: | | | | |
| Investments in unaffiliated issuers | | | (7,104,110 | ) |
| Investments in affiliated issuers | | | (523,714 | ) |
| Foreign currency transactions | | | (242,083 | ) |
| Net realized loss | | | (7,869,907 | ) |
| | | | | |
| Net change in net unrealized depreciation on: | | | | |
| Investments | | | 156,265,340 | |
| Foreign currency | | | 895,568 | |
| Net change in net unrealized depreciation | | | 157,160,908 | |
| | | | | |
| Net realized and unrealized gain | | | 149,291,001 | |
| | | | | |
| Dividends paid on Series A preferred equity facility | | | (2,199,358 | ) |
| Net change in accumulated dividends on Series A preferred equity facility | | | 882,040 | |
| Net change in reserve for dividends to Series Z preferred shareholders | | | (11,262 | ) |
| | | | | |
| Net increase in net assets applicable to common shareholders resulting from operations | | $ | 185,981,084 | |
See accompanying notes.
Tennenbaum Opportunities Fund V, LLC
(A Delaware Limited Liability Company)
Consolidated Statements of Changes in Net Assets
| | | Six Months | | | | |
| | | Ended | | | | |
| | | June 30, 2009 | | | Year Ended | |
| | | (Unaudited) | | | December 31, 2008 | |
| | | | | | | |
| Total common shareholder committed capital | | $ | 1,105,000,000 | | | $ | 1,105,000,000 | |
| | | | | | | | | |
| Net assets applicable to common shareholders, beginning of period | | $ | 463,448,012 | | | $ | 694,367,823 | |
| | | | | | | | | |
| Common shareholders contributions | | | 110,500,000 | | | | 221,000,000 | |
| Equity placement and offering costs charged to paid-in capital | | | (537,300 | ) | | | (1,074,600 | ) |
| Common shareholders contributions, net | | | 109,962,700 | | | | 219,925,400 | |
| | | | | | | | | |
| Net investment income | | | 38,018,663 | | | | 55,985,780 | |
| Net realized loss on investments and foreign currency | | | (7,869,907 | ) | | | (73,199,739 | ) |
| Net change in net unrealized appreciation/depreciation on investments and foreign currency | | | 157,160,908 | | | | (381,468,104 | ) |
| Dividends paid on Series A preferred equity facility from net investment income | | | (2,199,358 | ) | | | (5,224,808 | ) |
| Dividends paid to Series Z preferred shareholders from net investment income | | | - | | | | (49,896 | ) |
| Net change in accumulated dividends on Series A preferred equity facility | | | 882,040 | | | | 84,433 | |
| Net change in reserve for dividends to Series Z preferred shareholders | | | (11,262 | ) | | | 27,123 | |
| Net increase (decrease) in net assets applicable to common shareholders resulting from operations | | | 185,981,084 | | | | (403,845,211 | ) |
| | | | | | | | | |
| Distributions to common shareholders from: Net investment income | | | (34,000,000 | ) | | | (47,000,000 | ) |
| | | | | | | | | |
Net assets applicable to common shareholders, end of period (including accumulated net investment income of $4,150,842 and $1,449,497, respectively) | | $ | 725,391,796 | | | $ | 463,448,012 | |
See accompanying notes.
Tennenbaum Opportunities Fund V, LLC
(A Delaware Limited Liability Company)
Consolidated Statement of Cash Flows (Unaudited)
Six Months Ended June 30, 2009
| Operating activities | | | |
| Net increase in net assets applicable to common shareholders resulting from operations | | $ | 185,981,084 | |
| Adjustments to reconcile net increase in net assets applicable to common shareholders resulting from operations to net cash used in operating activities: | | | | |
| Net realized loss on investments and foreign currency | | | 7,627,824 | |
| Net change in net unrealized depreciation | | | (156,803,502 | ) |
| Distributions paid to Series A preferred limited partners | | | 2,199,358 | |
| Net change in accumulated dividends on Series A preferred equity facility | | | (882,040 | ) |
| Net change in reserve for dividends to Series Z preferred shareholders | | | 11,262 | |
| Income from paid in-kind capitalization | | | (16,972,521 | ) |
| Accretion of original issue discount | | | (228,413 | ) |
| Amortization of deferred debt issuance costs | | | 530,634 | |
| Changes in assets and liabilities: | | | | |
| Purchases of investments | | | (118,043,761 | ) |
| Net proceeds from exchanges, sales, maturities and paydowns of investments | | | 76,206,583 | |
| Increase in receivable for investments sold | | | (19,672,630 | ) |
| Decrease in accrued interest income - unaffiliated issuers | | | 4,631,510 | |
| Decrease in deferred equity placement costs | | | 537,300 | |
| Increase in prepaid expenses and other assets | | | (77,756 | ) |
| Increase in payable for investments purchased | | | 15,183,071 | |
| Decrease in management fees payable | | | (375,000 | ) |
| Decrease in equity placement costs payable | | | (1,445,343 | ) |
| Decrease in interest payable | | | (1,497,878 | ) |
| Decrease in accrued expenses and other liabilities | | | (272,354 | ) |
| Net cash used in operating activities | | | (23,362,572 | ) |
| | | | | |
| Financing activities | | | | |
| Proceeds from issuance of common shares | | | 110,500,000 | |
| Payments for equity placement costs | | | (537,300 | ) |
| Proceeds from draws on credit facility | | | 45,000,000 | |
| Principal repayments on credit facility | | | (157,500,000 | ) |
| Proceeds from draws on Series A preferred equity facility | | | 203,000,000 | |
| Dividends paid on Series A preferred equity facility | | | (2,199,358 | ) |
| Distributions to common limited partner | | | (32,000,000 | ) |
| Net cash provided by financing activities | | | 166,263,342 | |
| | | | | |
| Net increase in cash and cash equivalents | | | 142,900,770 | |
| Cash and cash equivalents at beginning of period | | | 54,799,072 | |
| Cash and cash equivalents at end of period | | $ | 197,699,842 | |
| | | | | |
| Supplemental disclosures | | | | |
| Interest payments | | $ | 2,638,108 | |
See accompanying notes.
Tennenbaum Opportunities Fund V, LLC
(A Delaware Limited Liability Company)
Notes to Consolidated Financial Statements (Unaudited)
June 30, 2009
1. Organization and Nature of Operations
Tennenbaum Opportunities Fund V, LLC (the “Company”), a Delaware Limited Liability Company, is registered as a nondiversified, closed-end management investment company under the Investment Company Act of 1940 (the “1940 Act”). The Company has elected to be treated as a regulated investment company (“RIC”) for U.S. federal income tax purposes. As a RIC, the Company will not be taxed on its income to the extent that it distributes such income each year and satisfies other applicable income tax requirements. The Company was formed to acquire a portfolio of investments consisting primarily of bank loans, distressed debt, stressed high yield debt, mezzanine investments and public equities. The stated objective of the Company is to achieve high total returns while minimizing losses.
The Company’s investment operations commenced on October 10, 2006. On December 15, 2006, the Company contributed substantially all of its assets to Tennenbaum Opportunities Partners V, LP, a Delaware Limited Partnership (the “Partnership”), in exchange for 100% of the Partnership’s common limited partner interests in a non-taxable transaction. The Partnership is also registered as a nondiversified, closed-end management investment company under the 1940 Act, but has elected to be treated as a partnership for U.S. federal income tax purposes. Following the asset transfer, all portfolio activity has been conducted by and in the Partnership.
These consolidated financial statements include the accounts of the Company and the Partnership. All significant intercompany transactions and balances have been eliminated in the consolidation.
The General Partner of the Partnership is SVOF/MM, LLC (“SVOF/MM”). The managing member of SVOF/MM is Tennenbaum Capital Partners, LLC (“TCP”), which serves as the Investment Manager of both the Company and the Partnership. Babson Capital Management LLC serves as Co-Manager of both the Company and the Partnership. Substantially all of the equity interests in the General Partner are owned directly or indirectly by TCP, Babson Capital Management LLC and employees of TCP. The Company, the Partnership, TCP, SVOF/MM and their members and affiliates may be considered related parties.
Company management consists of the Investment Manager and the Board of Directors. Partnership management consists of the General Partner and the Board of Directors. The Investment Manager and the General Partner direct and execute the day-to-day operations of the Company and the Partnership, respectively, subject to oversight from the respective Board of Directors, which sets the broad policies of the Company and performs certain functions required by the 1940 Act in the case of the Partnership. The Board of Directors of the Partnership has delegated investment management of the Partnership’s assets to the Investment Manager and the Co-Manager. Each Board of Directors consists of three persons, two of whom are independent. If the Partnership has preferred limited partner interests outstanding, as it currently does, the holders of the preferred interests voting separately as a class will be entitled to elect two of the Directors. The remaining directors will be subject to election by holders of the common interests and preferred interests voting together as a single class.
Tennenbaum Opportunities Fund V, LLC
(A Delaware Limited Liability Company)
Notes to Consolidated Financial Statements (Unaudited) (Continued)
June 30, 2009
1. Organization and Nature of Operations (continued)
Company Structure
Total maximum capitalization of the consolidated Company is approximately $1.91 billion, consisting of $1.105 billion of common equity commitments, $369 million of preferred limited partner interests in the Partnership (the “Series A Preferred”), $436 million under a senior secured revolving credit facility issued by the Partnership (the “Senior Facility”) and $280,000 in Series Z preferred shares of the Company. The contributed common equity, preferred equity and the amount drawn under the Senior Facility are used to purchase Partnership investments and to pay certain fees and expenses of the Partnership and the Company. Most of these investments are included in the collateral for the Senior Facility.
The Company will liquidate and distribute its assets and will be dissolved on October 10, 2016, subject to up to two one-year extensions if requested by the Investment Manager and approved by the outstanding common shares. The Partnership will liquidate and distribute its assets and will be dissolved on October 10, 2016, subject to up to two one-year extensions if requested by the General Partner and approved by the Company as the holder of the common limited partner interests in the Partnership. However, the Operating Agreement and Partnership Agreement will prohibit liquidation of the Company and the Partnership, respectively, prior to October 10, 2016 if the Series A Preferred are not redeemed in full prior to such liquidation.
Common Equity
Investors committed to purchase $1.105 billion of the Company’s common shares on dates specified by the Company over a period ending on or prior to April 10, 2009. The Company accepted initial commitments of $725 million in October of 2006 (the “First Close”) and received 20% of this initial commitment at its inception of operations on October 10, 2006. The Company accepted additional commitments of $260 million on February 22, 2007 (the “Second Close”), and received an initial 20% of these additional commitments on or about February 26, 2007. The Company accepted a final commitment of $120 million on or about July 2, 2007 (the “Third Close”), and received an initial 20% of this third commitment on or about July 6, 2007. The Company has called and received the remainder of the common shareholder commitments as follows:
Tennenbaum Opportunities Fund V, LLC
(A Delaware Limited Liability Company)
Notes to Consolidated Financial Statements (Unaudited) (Continued)
June 30, 2009
1. Organization and Nature of Operations (continued)
| Call Date | | Share Issuance Date | | Percent of Commitment |
| June 28 / July 2, 2007 | | August 1, 2007 | | 10% |
| July 27, 2007 | | August 31, 2007 | | 20% |
| November 29, 2007 | | January 2, 2008 | | 10% |
| December 28, 2007 | | February 1, 2008 | | 10% |
| July 31, 2008 | | November 3, 2008 | | 10% |
| October 10, 2008 | | December 15, 2008 | | 10% |
| January 2, 2009 | | February 2, 2009 | | 10% |
In order to ensure that the appropriate portion of the organizational, offering and operational expenses (excluding interest and preferred dividends) of the Company and the Partnership through the dates of the Second Close and the Third Close (each, a “Close”) was borne by the subscribers to the respective Close, the price per share of the initial drawdown in respect of the Second Close and the Third Close was net asset value plus a premium of approximately $873.88 and $1,815.34, respectively, and distributions in the aggregate amount of these premia ($308.50 and $148.24 per share, respectively) were declared to the Company’s common shareholders of record prior to the issuance of the new shares in the respective Close. The aggregate effect of the premia received on the net asset value of the Company before the aforementioned distributions is reflected in the Financial Highlights as an increase from capital stock transactions of $456.74 per share, which was entirely offset by the aforementioned distributions.
Preferred Equity Facility
At June 30, 2009, the Partnership had 18,450 Series A preferred limited partner interests (the “Series A Preferred”) issued and outstanding with a liquidation preference of $20,000 per interest. The Series A Preferred are redeemable at the option of the Partnership, subject to certain conditions, and, during the ramp-up period, may be reissued. Additionally, under certain conditions, the Partnership may be required to either redeem certain of the Series A Preferred or repay indebtedness, at the Company’s option. Such conditions would include a failure by the Partnership to maintain adequate collateral as required by its credit facility agreement or by the Statement of Preferences of the Series A Preferred, or a failure by the Partnership to maintain sufficient asset coverage as required by the 1940 Act. At June 30, 2009, the Partnership was in full compliance with such requirements. The Series A Preferred accrue dividends at an annual rate equal to LIBOR plus 0.65%, or in the case of any holders of Series A Preferred that are CP Conduits (as defined in the leveraging documents), the higher of (i) LIBOR plus 0.65% or (ii) the CP Conduit’s cost of funds rate plus 0.65%, subject to certain limitations and adjustments.
Tennenbaum Opportunities Fund V, LLC
(A Delaware Limited Liability Company)
Notes to Consolidated Financial Statements (Unaudited) (Continued)
June 30, 2009
2. Summary of Significant Accounting Policies
Basis of Presentation
The consolidated financial statements of the Company have been prepared in accordance with accounting principles generally accepted in the United States (“GAAP”). In the opinion of the Investment Manager and the General Partner, the consolidated financial results of the Company included herein contain all adjustments necessary to present fairly the consolidated financial position of the Company as of June 30, 2009, the consolidated results of its operations and its consolidated cash flows for the six months then ended, and the consolidated changes in net assets for the six months then ended and for the year ended December 31, 2008. We have evaluated subsequent events through August 20, 2009, the date of issuance of the financial statements. The following is a summary of the significant accounting policies of the Company and the Partnership.
Investment Valuation
All of the Company’s investments are generally held by the Partnership. Management values investments held by the Partnership at fair value based upon the principles and methods of valuation set forth in policies adopted by the Partnership’s Board of Directors and in conformity with procedures set forth in the Senior Facility and Statement of Preferences for the Series A Preferred. Fair value is generally defined as the amount for which an investment could be sold in an orderly transaction between market participants at the measurement date.
Investments listed on a recognized exchange or market quotation system, whether U.S. or foreign, are valued for financial reporting purposes as of the last business day of the reporting period using the closing price on the date of valuation. Liquid investments not listed on a recognized exchange or market quotation system are priced by a nationally recognized pricing service or by using quotations from broker-dealers. Investments not priced by a pricing service or for which market quotations are either not readily available or are determined to be unreliable are valued by one or more independent valuation services or, for investments aggregating less than 5% of the total capitalization of the Partnership, by the Investment Manager.
Fair valuations of investments are determined under guidelines adopted by the Partnership’s Board of Directors, and are subject to their approval. Generally, to increase objectivity in valuing the Partnership’s investments, the Investment Manager will utilize external measures of value, such as public markets or third-party transactions, whenever possible. The Investment Manager’s valuation is not based on long-term work-out value, immediate liquidation value, nor incremental value for potential changes that may take place in the future. The values assigned to investments that are valued by the Investment Manager are based on available information and do not necessarily represent amounts that might ultimately be realized, as these amounts depend on future circumstances and cannot reasonably be determined until the individual investments are actually liquidated.
Tennenbaum Opportunities Fund V, LLC
(A Delaware Limited Liability Company)
Notes to Consolidated Financial Statements (Unaudited) (Continued)
June 30, 2009
2. Summary of Significant Accounting Policies (continued)
On January 1, 2008, the Company and the Partnership adopted Statement of Financial Accounting Standards No. 157, Fair Value Measurements ("FAS 157"), which defines fair value, expands disclosures about fair value measurements, and establishes a hierarchy that prioritizes the inputs used to measure fair value. The adoption of FAS 157 did not have a material impact on the financial statements of the Company or the Partnership. The level category in which an investment falls is based on the lowest level input that is significant to the valuation of the investment in its entirety. At June 30, 2009, the investments of the Partnership were categorized as follows:
| Level | | Basis for Determining Fair Value | | Aggregate Value | |
| 1 | | Quoted prices in active markets for identical assets | | $ | 7,136,538 | |
| 2 | | Other observable market inputs* | | | 448,492,118 | |
| 3 | | Independent third-party pricing sources that employ significant unobservable inputs | | | 500,633,760 | |
| 3 | | Internal valuations with significant unobservable inputs | | | 39,894,101 | |
* E.g. quoted prices in inactive markets or quotes for comparable instruments
Changes in investments categorized as Level 3 during the six months ended June 30, 2009 were as follows:
| | | Independent Third Party Valuation | | | Investment Manager Valuation | |
| Beginning balance | | $ | 487,684,039 | | | $ | 54,116,158 | |
| Net realized and unrealized gains (losses) | | | 39,798,234 | | | | 1,576,867 | |
| Net acquisitions and dispositions | | | 33,673,295 | | | | - | |
| Net transfers into (out of) category | | | (60,521,808 | ) | | | (15,798,924 | ) |
| Ending balance | | $ | 500,633,760 | | | $ | 39,894,101 | |
| | | | | | | | | |
| Net change in unrealized gains (losses) during the period on investments still held at period end (included in net realized and unrealized gains/losses, above) | | $ | 39,798,234 | | | $ | 1,576,867 | |
Tennenbaum Opportunities Fund V, LLC
(A Delaware Limited Liability Company)
Notes to Consolidated Financial Statements (Unaudited) (Continued)
June 30, 2009
2. Summary of Significant Accounting Policies (continued)
Investment Transactions
The Partnership records investment transactions on the trade date, except for private transactions that have conditions to closing, which are recorded on the closing date. The cost of investments purchased is based upon the purchase price plus those professional fees which are specifically identifiable to the investment transaction. Realized gains and losses on investments are recorded based on the specific identification method, which typically allocates the highest cost inventory to the basis of investments sold.
Cash and Cash Equivalents
Cash consists of amounts held in accounts with brokerage firms and the custodian bank. Cash equivalents consist of highly liquid investments with an original maturity of three months or less. For purposes of reporting cash flows, cash consists of the cash held with brokerage firms and the custodian bank, and cash equivalents maturing within 90 days.
Repurchase Agreements
In connection with transactions in repurchase agreements, it is the Partnership’s policy that its custodian take possession of the underlying collateral, the fair value of which is required to exceed the principal amount of the repurchase transaction, including accrued interest, at all times. If the seller defaults, and the fair value of the collateral declines, realization of the collateral by the Partnership may be delayed or limited.
Restricted Investments
The Partnership may invest in instruments that are subject to legal or contractual restrictions on resale. These instruments generally may be resold to institutional investors in transactions exempt from registration or to the public if the securities are registered. Disposal of these investments may involve time-consuming negotiations and additional expense, and prompt sale at an acceptable price may be difficult. Information regarding restricted investments is included at the end of the Statement of Investments. Restricted investments, including any restricted investments in affiliates, are valued in accordance with the investment valuation policies discussed above.
Tennenbaum Opportunities Fund V, LLC
(A Delaware Limited Liability Company)
Notes to Consolidated Financial Statements (Unaudited) (Continued)
June 30, 2009
2. Summary of Significant Accounting Policies (continued)
Foreign Investments
The Partnership may invest in instruments traded in foreign countries and denominated in foreign currencies. At June 30, 2009, the Partnership had foreign currency denominated investments with an aggregate fair value of approximately 8.7% of the Company’s consolidated cash and investments. Such positions were converted at the closing rate in effect at June 30, 2009 and reported in U.S. dollars. Purchases and sales of investments and income and expense items denominated in foreign currencies, when they occur, are translated into U.S. dollars on the respective dates of such transactions. The Company reports that portion of the results of operations resulting from foreign exchange rates on investments separately from the gains or losses arising from changes in market prices of investments held. During the period ended June 30, 2009, such fluctuations from foreign exchange rates were largely offset by fluctuations in the value of foreign currency advances under the Partnership’s credit facility.
Investments in foreign companies and securities of foreign governments may involve special additional risks and considerations not typically associated with investing in U.S. companies and securities of the U.S. government. These risks include, among other things, revaluation of currencies, less reliable information about issuers, different transactions clearance and settlement practices, and potential future adverse political and economic developments. Moreover, investments in some foreign companies and securities of foreign governments and their markets may be less liquid and their prices more volatile than those of comparable U.S. companies and the U.S. government.
Debt Issuance Costs
Costs of approximately $8.5 million were incurred in 2006 in connection with placing the Partnership’s Senior Facility. These costs were deferred and are being amortized on a straight-line basis over eight years, the estimated life of the Senior Facility. The impact of utilizing the straight-line amortization method versus the effective-interest method is not expected to be material to the operations of the Company or the Partnership.
Equity Placement and Offering Costs
Placement and offering costs in 2006 and 2007 for the Company’s common equity were $1,245,000 and $5,796,512, respectively. As of June 30, 2009, $6,853,000 of the costs have been charged to paid-in capital and $188,512 of the costs have been expensed.
Tennenbaum Opportunities Fund V, LLC
(A Delaware Limited Liability Company)
Notes to Consolidated Financial Statements (Unaudited) (Continued)
June 30, 2009
2. Summary of Significant Accounting Policies (continued)
The majority of the Partnership’s high yield and distressed debt investments are purchased at a considerable discount to par as a result of the underlying credit risks and financial results of the issuer, as well as general market factors that influence the financial markets as a whole. GAAP requires that discounts on corporate (investment grade) bonds, municipal bonds and treasury bonds be amortized using the effective-interest or constant-yield method. The process of accreting the purchase discount of a debt investment to par over the holding period results in accounting entries that increase the cost basis of the investment and record a noncash income accrual to the statement of operations. The Partnership considers it prudent to follow GAAP guidance that requires the Investment Manager to consider the collectibility of interest when making accruals. AICPA Statement of Position 93-1 discusses financial accounting and reporting for high yield debt investments for which, because of the credit risks associated with high yield and distressed debt investments, income recognition must be carefully considered and constantly evaluated for collectibility.
Accordingly, when accounting for purchase discounts, management recognizes discount accretion income when it is probable that such amounts will be collected and when such amounts can be estimated. A reclassification entry is recorded at disposition to reflect purchase discounts on all realized investments. For income tax purposes, the economic gain resulting from the sale of debt investments purchased at a discount is allocated between interest income and realized gains.
Income Taxes
The Company intends to comply with the applicable provisions of the Internal Revenue Code of 1986, as amended, pertaining to regulated investment companies and to make distributions of taxable income sufficient to relieve it from substantially all federal income taxes. Accordingly, no provision for income taxes is required in the consolidated financial statements. The Partnership’s income or loss is reported in the partners’ income tax returns. As of June 30, 2009, all tax years of the Company and the Partnership since inception remain subject to examination by federal and state tax authorities. No such examinations are currently pending.
Income and capital gain distributions are determined in accordance with income tax regulations, which may differ from accounting principles generally accepted in the United States. Capital accounts within the financial statements are adjusted at year-end for any permanent book and tax differences. These adjustments have no impact on net assets or the results of operations. Temporary differences are primarily attributable to differing book and tax treatments for the timing of the recognition of gains and losses on certain investment transactions and the timing of the deductibility of certain expenses, and will reverse in subsequent periods.
Tennenbaum Opportunities Fund V, LLC
(A Delaware Limited Liability Company)
Notes to Consolidated Financial Statements (Unaudited) (Continued)
June 30, 2009
2. Summary of Significant Accounting Policies (continued)
Cost and unrealized appreciation (depreciation) for U.S. federal income tax purposes of the investments of the Company at June 30, 2009 were as follows:
| Unrealized appreciation | | $ | 13,960,709 | |
| Unrealized depreciation | | | (287,984,206 | ) |
| Net unrealized depreciation | | $ | (274,023,497 | ) |
| | | | | |
| Cost of investments | | $ | 1,270,180,014 | |
Distributions and the net change in accumulated distributions to holders of the Series A Preferred are treated as ordinary income for federal tax purposes.
Use of Estimates
The preparation of the financial statements requires management to make estimates and assumptions that affect the reported amounts of assets and liabilities and disclosure of contingent assets and liabilities at the date of the financial statements as well as the reported amounts of revenues and expenses during the reporting period. Although management believes these estimates and assumptions to be reasonable, actual results could differ from those estimates.
3. Allocations and Distributions
Net income and gains of the Partnership are distributed first to the Company until it has received an 8% annual weighted-average return on its undistributed contributed equity, and then to the General Partner of the Partnership until it has received 20% of all cumulative income and gain distributions. 80% of all remaining net income and gain distributions are allocated to the Company, with the remaining 20% allocated to the General Partner. For purposes of determining whether the 8% return to the Company has been exceeded and whether the General Partner has received the catch-up amount, the performance of the Partnership includes the performance of the Company for periods prior to the inception of the Partnership. Net investment income or loss, realized gain or loss on investments and appreciation or depreciation on investments for the period are allocated to the Company and the General Partner in a manner consistent with that used to determine distributions.
Tennenbaum Opportunities Fund V, LLC
(A Delaware Limited Liability Company)
Notes to Consolidated Financial Statements (Unaudited) (Continued)
June 30, 2009
3. Allocations and Distributions (continued)
Common distributions are generally based on the estimated taxable earnings of the Company and are recorded on the ex-dividend date. The timing of distributions to the Company is determined by the General Partner, which has provided the Investment Manager with criteria for such distributions. The timing and amount to be paid by the Company as a distribution to its shareholders is determined by its Board of Directors, which has provided the Investment Manager with certain criteria for such distributions, and are generally based on amounts received from the Partnership, less any Company expenses and dividends to Series Z Preferred Shareholders. Any net long-term capital gains are distributed at least annually. As of June 30, 2009, the Company had declared $95,563,371 in distributions to the common shareholders since inception.
The Company’s Series Z share dividend rate is fixed at 8% per annum.
4. Management Fees and Other Expenses
The Investment Manager receives an annual management and advisory fee, payable monthly in arrears, equal to 1.5% of the sum of the committed common equity (reduced after the ramp-up by returns of contributed capital), the maximum amount available under the Senior Facility, and the maximum amount of the Series A Preferred, subject to reduction by the amount of the Senior Facility commitment when the Senior Facility is no longer outstanding and the amount of the Series A Preferred when less than $1 million in liquidation preference of preferred securities remains outstanding. For purposes of computing the management fee, total committed capital during the period ended June 30, 2009 was $1.91 billion, consisting of $1.105 billion of common equity commitments, $369 million of Series A Preferred, and $436 million of debt commitments. In addition to the management fee, the General Partner of the Partnership is entitled to a performance allocation as discussed in Note 3, above. As compensation for its services, the Co-Manager receives a portion of the management fees paid to the Investment Manager. The Co-Manager also receives a portion of any allocation paid to the General Partner.
The Company and the Partnership pay all respective expenses incurred in connection with the business of the Company and the Partnership, including fees and expenses of outside contracted services, such as custodian, administrative, legal, audit and tax preparation fees, costs of valuing investments, insurance costs, brokers’ and finders’ fees relating to investments and any other transaction costs associated with the purchase and sale of investments of the Partnership.
5. Senior Secured Revolving Credit Facility
The Partnership has entered into a credit agreement with certain lenders, which provides for a senior secured revolving credit facility (the “Senior Facility”) pursuant to which amounts may be drawn up to $436 million. The Senior Facility matures December 15, 2014, subject to extension by the lenders at the request of the Partnership for one 364-day period.
Tennenbaum Opportunities Fund V, LLC
(A Delaware Limited Liability Company)
Notes to Consolidated Financial Statements (Unaudited) (Continued)
June 30, 2009
5. Senior Secured Revolving Credit Facility (continued)
Advances under the Senior Facility bear interest at LIBOR or EURIBOR plus 0.35% per annum, except in the case of loans from CP Conduits, which bear interest at the higher of (i) LIBOR or EURIBOR (as applicable) plus 0.35% or (ii) the CP Conduit’s cost of funds plus 0.35%, subject to certain limitations. Short-term advances under the swingline facility bear interest at the LIBOR Market Index Rate plus 0.35% per annum or the main refinancing rate as set by the European Central Bank for such period, plus 0.85% per annum. In addition to amounts due on outstanding debt, the Senior Facility accrues commitment fees of 0.15% per annum on the unused portion of the Senior Facility, or 0.20% per annum when less than $87,200,000 in borrowings are outstanding.
Foreign currency advances are reported in US dollars using the closing rate in effect on the date of valuation. At June 30, 2009, outstanding borrowings included €68,000,000 (US $95,424,400), and interest payable included €2,140 (US $3,003).
6. Commitments, Concentration of Credit Risk and Off-Balance Sheet Risk
The Partnership conducts business with brokers and dealers that are primarily headquartered in New York and Los Angeles and are members of the major securities exchanges. Banking activities are conducted with a firm headquartered in the New York area.
In the normal course of business, the Partnership’s investment activities involve executions, settlement and financing of various transactions resulting in receivables from, and payables to, brokers, dealers and the Partnership’s custodian. These activities may expose the Company and the Partnership to risk in the event such parties are unable to fulfill contractual obligations. Management does not anticipate any material losses from counterparties with whom it conducts business.
Consistent with standard business practice, the Company and the Partnership enter into contracts that contain a variety of indemnifications. The maximum exposure of the Company and the Partnership under these arrangements is unknown. However, the Company and the Partnership expect the risk of loss to be remote.
The Consolidated Statement of Investments includes certain revolving loan facilities held by the Partnership with aggregate unfunded balances of approximately $7.5 million at June 30, 2009. These instruments are reflected at fair value in the Statement of Investments and may be drawn up to the principal amount shown.
Tennenbaum Opportunities Fund V, LLC
(A Delaware Limited Liability Company)
Notes to Consolidated Financial Statements (Unaudited) (Continued)
June 30, 2009
7. Related Parties
From time to time the Partnership advances payments to third parties on behalf of the Company which are reimbursable through deductions from distributions to the Company. The Partnership has also recognized liabilities to third parties for equity placement costs of the Company which will be paid out of contributions by the Company.
8. Series Z Preferred Capital
In addition to the Series A Preferred of the Partnership described in Note 1, the Company has 560 Series Z preferred shares authorized, issued and outstanding as of June 30, 2009. The Series Z preferred shares have a liquidation preference of $500 per share plus accumulated but unpaid dividends and pay dividends at an annual rate equal to 8% of liquidation preference. The Series Z preferred shares are redeemable at any time at the option of the Company and may only be transferred with the consent of the Company.
9. Shareholders’ Capital
Issuances of common stock were as follows:
| | | Six Months Ended June 30, 2009 (Unaudited) | | | Year Ended December 31, 2008 | |
| Number of shares issued | | | 14,954.3637 | | | | 32,639.7439 | |
| Less: number of shares subscribed in prior year | | | - | | | | (14,462.6732 | ) |
| Net increase | | | 14,954.3637 | | | | 18,177.0707 | |
| | | | | | | | | |
| Gross proceeds from share issuance | | $ | 110,500,000 | | | $ | 442,000,000 | |
| Less: proceeds from shares subscribed in prior year | | | - | | | | (221,000,000 | ) |
| Equity placement and offering costs | | | (537,300 | ) | | | (1,074,600 | ) |
| Net proceeds | | $ | 109,962,700 | | | $ | 219,925,400 | |
Tennenbaum Opportunities Fund V, LLC
(A Delaware Limited Liability Company)
Notes to Consolidated Financial Statements (Unaudited) (Continued)
June 30, 2009
10. Financial Highlights
| | | Six Months | | | | | | | | | | |
| | | Ended | | | | | | | | | October 10, 2006 | |
| | | June 30, 2009 | | | Year Ended December 31, | | | (Inception) to | |
| | | (Unaudited) | | | 2008 | | | 2007 | | | December 31, 2006 | |
| | | | | | | | | | | | | |
Per Common Share(1) | | | | | | | | | | | | |
| Net asset value, beginning of period | | $ | 7,317.59 | | | $ | 15,376.96 | | | $ | 20,038.77 | | | $ | 20,000.00 | |
| | | | | | | | | | | | | | | | | |
| Equity placement costs charged to paid-in capital | | | (6.86 | ) | | | (18.62 | ) | | | (355.40 | ) | | | (10.34 | ) |
| | | | | | | | | | | | | | | | | |
| Investment operations: | | | | | | | | | | | | | | | | |
| Net investment income | | | 486.44 | | | | 1,095.15 | | | | (666.61 | ) | | | (111.27 | ) |
| Net realized and unrealized gain (loss) | | | 1,919.83 | | | | (8,186.72 | ) | | | (2,506.47 | ) | | | 164.16 | |
| Dividends paid on Series A preferred equity facility | | | (28.09 | ) | | | (104.90 | ) | | | (79.02 | ) | | | - | |
| Distributions to Series Z preferred shareholders | | | - | | | | (0.95 | ) | | | | | | | | |
| Net change in accumulated dividends on Series A | | | | | | | | | | | | | | | | |
| preferred equity facility | | | 11.24 | | | | 5.96 | | | | (74.10 | ) | | | (3.07 | ) |
| Net change in reserve for dividends to Series Z | | | | | | | | | | | | | | | | |
| preferred shareholders | | | (0.14 | ) | | | 0.51 | | | | (1.36 | ) | | | (0.71 | ) |
| | | | | | | | | | | | | | | | | |
| Total from investment operations | | | 2,389.28 | | | | (7,190.95 | ) | | | (3,327.56 | ) | | | 49.11 | |
| | | | | | | | | | | | | | | | | |
| Net increase from capital stock transactions | | | - | | | | - | | | | 456.74 | | | | - | |
| | | | | | | | | | | | | | | | | |
| Distributions to common shareholders from: | | | | | | | | | | | | | | | | |
| Net investment income | | | (434.30 | ) | | | (849.80 | ) | | | - | | | | - | |
| Returns of capital | | | - | | | | - | | | | (1,435.59 | ) | | | - | |
| | | | | | | | | | | | | | | | | |
| Net asset value, end of period | | $ | 9,265.71 | | | $ | 7,317.59 | | | $ | 15,376.96 | | | $ | 20,038.77 | |
| | | | | | | | | | | | | | | | | |
Return on invested assets (2), (3) | | | 24.7 | % | | | (32.0 | )% | | | (3.3 | )% | | | 3.2 | % |
| | | | | | | | | | | | | | | | | |
Total return to common shareholders (2), (4) | | | 33.6 | % | | | (51.2 | )% | | | (19.2 | )% | | | 0.2 | % |
Tennenbaum Opportunities Fund V, LLC
(A Delaware Limited Liability Company)
Notes to Consolidated Financial Statements (Unaudited) (Continued)
June 30, 2009
10. Financial Highlights (continued)
| | | Six Months | | | | | | | | | | |
| | | Ended | | | | | | | | | October 10, 2006 | |
| | | June 30, 2009 | | | Year Ended December 31, | | | (Inception) to | |
| | | (Unaudited) | | | 2008 | | | 2007 | | | December 31, 2006 | |
| | | | | | | | | | | | | |
| Ratios and Supplemental Data: | | | | | | | | | | | | |
| Ending net assets attributable to common shareholders | | $ | 725,391,796 | | | $ | 463,448,012 | | | $ | 694,367,823 | | | $ | 145,281,047 | |
| Net investment income (loss) / average common | | | | | | | | | | | | | | | | |
shareholder equity (5), (6) | | | 12.9 | % | | | 8.7 | % | | | 0.1 | % | | | (3.3 | )% |
| | | | | | | | | | | | | | | | | |
Expenses and General Partner allocation/average common shareholder equity: | | | | | | | | | | | | | | | | |
Operating expenses (5), (6) | | | 5.9 | % | | | 7.9 | % | | | 11.7 | % | | | 14.3 | % |
| General Partner interest allocation | | | 0.0 | % | | | 0.0 | % | | | 0.0 | % | | | 0.0 | % |
| Total expenses and General Partner interest allocation | | | 5.9 | % | | | 7.9 | % | | | 11.7 | % | | | 14.3 | % |
| | | | | | | | | | | | | | | | | |
Portfolio turnover rate (2) | | | 9.1 | % | | | 61.5 | % | | | 42.7 | % | | | 6.1 | % |
| Weighted-average debt outstanding | | $ | 152,879,527 | | | $ | 347,492,137 | | | $ | 125,714,977 | | | $ | 4,253,012 | |
| Weighted-average interest rate | | | 1.5 | % | | | 3.8 | % | | | 5.5 | % | | | 5.7 | % |
| Weighted-average number of shares | | | 78,205.1852 | | | | 50,800.8348 | | | | 19,776.0839 | | | | 7,250.0000 | |
Average debt per share (7) | | $ | 1,955 | | | $ | 6,840 | | | $ | 6,357 | | | $ | 587 | |
| | | | | | | | | | | | | | | | | |
| | | | | | | | | | | | | | | | | |
| Annualized Inception to Date Performance Data as of June 30, 2009: | |
Return on common equity (4) | | | (19.4 | )% | | | | | | | | | | | | |
Return on invested assets (3) | | | (5.9 | )% | | | | | | | | | | | | |
Internal rate of return (8) | | | (19.2 | )% | | | | | | | | | | | | |
| | | | | | | | | | | | | | | | | |
| (1) | Per share changes in net asset value are computed based on the actual number of shares subscribed and outstanding during the time in which such activity occurred. |
| (2) | Not annualized for periods of less than one year. |
| (3) | Return on invested assets is a time-weighted, geometrically linked rate of return and excludes cash and cash equivalents. |
| (4) | Returns (net of dividends on the preferred equity facility, allocations to the General Partner, and fund expenses, including financing costs and management fees) calculated on a monthly geometrically linked, time-weighted basis. |
| (5) | Annualized for periods of less than one year. |
| (6) | These ratios included interest expense but do not reflect the effect of dividend payments on the preferred equity facility. The ratio of expenses to average common shareholder equity is higher in earlier periods, and net investment income to average common shareholder equity is reduced, due to the Company's relatively smaller capital base while the Company is ramping up. |
| (7) | Includes subscribed shares. |
| (8) | Returns are net of dividends on the preferred equity facility, allocations to the General Partner and fund expenses, including financing costs and management fees. Internal rate of return (“IRR”) is the imputed annual return over an investment period and, mathematically, is the rate of return at which the discounted cash flows equal the initial cash outlays. The internal rate of return presented assumes liquidation of the fund at net asset value as of the balance sheet date, and is reduced in earlier periods due to the equity placement and offering costs that were charged to paid-in capital and the organizational costs that were expensed at the inception of the fund. |
Tennenbaum Opportunities Fund V, LLC
(A Delaware Limited Liability Company)
Consolidating Statement of Assets and Liabilities (Unaudited)
June 30, 2009
| | | Tennenbaum | | | Tennenbaum | | | | | | Tennenbaum | |
| | | Opportunities | | | Opportunities | | | | | | Opportunities | |
| | | Fund V, LLC | | | Partners V, LP | | | | | | Fund V, LLC | |
| | | Standalone | | | Standalone | | | Eliminations | | | Consolidated | |
| Assets | | | | | | | | | | | | |
| Investments, at fair value | | | | | | | | | | | | |
| Unaffiliated issuers | | $ | - | | | $ | 995,970,490 | | | $ | - | | | $ | 995,970,490 | |
| Affiliates | | | - | | | | 186,027 | | | | - | | | | 186,027 | |
| Total investments | | | - | | | | 996,156,517 | | | | - | | | | 996,156,517 | |
| | | | | | | | | | | | | | | | | |
| Investments in subsidiary | | | 725,465,964 | | | | - | | | | (725,465,964 | ) | | | - | |
| Cash and cash equivalents | | | - | | | | 197,699,842 | | | | - | | | | 197,699,842 | |
| Receivable for open trades | | | - | | | | 21,498,929 | | | | - | | | | 21,498,929 | |
| Accrued interest income from investments | | | - | | | | 19,749,641 | | | | - | | | | 19,749,641 | |
| Distributions receivable | | | 15,325,277 | | | | - | | | | (15,325,277 | ) | | | - | |
| Deferred debt issuance costs | | | - | | | | 5,902,984 | | | | - | | | | 5,902,984 | |
| Deferred equity placement costs | | | - | | | | - | | | | - | | | | - | |
| Receivable from subsidiary | | | 1,736,726 | | | | - | | | | (1,736,726 | ) | | | - | |
| Receivable from parent | | | - | | | | 1,311,997 | | | | (1,311,997 | ) | | | - | |
| Prepaid expenses and other assets | | | 117,326 | | | | 266,575 | | | | - | | | | 383,901 | |
| Total assets | | | 742,645,293 | | | | 1,242,586,485 | | | | (743,839,964 | ) | | | 1,241,391,814 | |
| | | | | | | | | | | | | | | | | |
| Liabilities | | | | | | | | | | | | | | | | |
| Credit facility payable | | | - | | | | 95,424,400 | | | | - | | | | 95,424,400 | |
| Payable for investments purchased | | | - | | | | 31,729,971 | | | | - | | | | 31,729,971 | |
| Distributions payable | | | 14,000,000 | | | | 15,325,277 | | | | (15,325,277 | ) | | | 14,000,000 | |
| Equity placement costs payable | | | 1,506,726 | | | | - | | | | - | | | | 1,506,726 | |
| Management and advisory fees payable | | | - | | | | 2,387,500 | | | | - | | | | 2,387,500 | |
| Interest payable | | | - | | | | 116,901 | | | | - | | | | 116,901 | |
| Payable to subsidiary | | | 1,311,997 | | | | - | | | | (1,311,997 | ) | | | - | |
| Payable to parent | | | - | | | | 1,736,726 | | | | (1,736,726 | ) | | | - | |
| Accrued expenses and other liabilities | | | 142,759 | | | | 616,541 | | | | - | | | | 759,300 | |
| Total liabilities | | | 16,961,482 | | | | 147,337,316 | | | | (18,374,000 | ) | | | 145,924,798 | |
| | | | | | | | | | | | | | | | | |
| Preferred equity | | | | | | | | | | | | | | | | |
Series A preferred limited partner interests; $20,000/interest liquidation preference; 25,000 interests authorized, 18,450 interests issued and outstanding | | | - | | | | 369,000,000 | | | | - | | | | 369,000,000 | |
Accumulated dividends on Series A preferred limited partner interests | | | - | | | | 783,205 | | | | - | | | | 783,205 | |
Series Z preferred stock; $500/share liquidation preference; 560 shares authorized, issued and outstanding | | | 280,000 | | | | - | | | | - | | | | 280,000 | |
| Accumulated dividends on Series Z preferred stock | | | 12,015 | | | | - | | | | - | | | | 12,015 | |
| Total preferred equity | | | 292,015 | | | | 369,783,205 | | | | - | | | | 370,075,220 | |
| | | | | | | | | | | | | | | | | |
| Minority interest | | | | | | | | | | | | | | | | |
| General partner interest in Tennenbaum Opportunities | | | | | | | | | | | | | | | | |
| Partners V, LP | | | - | | | | - | | | | - | | | | - | |
| | | | | | | | | | | | | | | | - | |
| Net assets applicable to common shareholders | | $ | 725,391,796 | | | $ | 725,465,964 | | | $ | (725,465,964 | ) | | $ | 725,391,796 | |
| | | | | | | | | | | | | | | | | |
| Composition of net assets applicable to common | | | | | | | | | | | | | | | | |
| shareholders | | | | | | | | | | | | | | | | |
| Common stock | | $ | 78 | | | $ | - | | | $ | - | | | $ | 78 | |
| Paid-in capital in excess of par | | | 1,079,764,365 | | | | - | | | | - | | | | 1,079,764,365 | |
| Paid-in capital | | | - | | | | 1,081,728,330 | | | | (1,081,728,330 | ) | | | - | |
| Accumulated losses | | | (354,360,632 | ) | | | (356,262,366 | ) | | | 356,262,366 | | | | (354,360,632 | ) |
| Accumulated dividends to Series Z preferred shareholders | | | (12,015 | ) | | | - | | | | - | | | | (12,015 | ) |
| Net assets applicable to common shareholders | | $ | 725,391,796 | | | $ | 725,465,964 | | | $ | (725,465,964 | ) | | $ | 725,391,796 | |
Tennenbaum Opportunities Fund V, LLC
(A Delaware Limited Liability Company)
Consolidating Statement of Operations (Unaudited)
Six Months Ended June 30, 2009
| | | Tennenbaum | | | Tennenbaum | | | | | | Tennenbaum | |
| | | Opportunities | | | Opportunities | | | | | | Opportunities | |
| | | Fund V, LLC | | | Partners V, LP | | | | | | Fund V, LLC | |
| | | Standalone | | | Standalone | | | Eliminations | | | Consolidated | |
| Investment income | | | | | | | | | | | | |
| Interest income | | $ | 12 | | | $ | 54,506,686 | | | $ | - | | | $ | 54,506,698 | |
| Dividend income | | | - | | | | 45,371 | | | | - | | | | 45,371 | |
| Other income | | | - | | | | 717,883 | | | | - | | | | 717,883 | |
| Total interest and related investment income | | | 12 | | | | 55,269,940 | | | | - | | | | 55,269,952 | |
| | | | | | | | | | | | | | | | | |
| Operating expenses | | | | | | | | | | | | | | | | |
| Management and advisory fees | | | - | | | | 14,325,000 | | | | - | | | | 14,325,000 | |
| Interest expense | | | - | | | | 1,140,230 | | | | - | | | | 1,140,230 | |
| Amortization of deferred debt issuance costs | | | - | | | | 530,634 | | | | - | | | | 530,634 | |
| Commitment fees | | | - | | | | 332,075 | | | | - | | | | 332,075 | |
| Legal fees, professional fees and due diligence expenses | | | 58,249 | | | | 156,265 | | | | - | | | | 214,514 | |
| Insurance expense | | | 53,431 | | | | 106,863 | | | | - | | | | 160,294 | |
| Custody fees | | | - | | | | 88,000 | | | | - | | | | 88,000 | |
| Director fees | | | 28,500 | | | | 57,000 | | | | - | | | | 85,500 | |
| Other operating expenses | | | 63,858 | | | | 311,184 | | | | - | | | | 375,042 | |
| Total expenses | | | 204,038 | | | | 17,047,251 | | | | - | | | | 17,251,289 | |
| | | | | | | | | | | | | | | | | |
| Net investment income (loss) | | | (204,026 | ) | | | 38,222,689 | | | | - | | | | 38,018,663 | |
| | | | | | | | | | | | | | | | | |
| Net realized and unrealized gain | | | | | | | | | | | | | | | | |
| Net realized loss on investments and foreign currency | | | - | | | | (7,869,907 | ) | | | - | | | | (7,869,907 | ) |
| Net change in net unrealized depreciation on | | | | | | | | | | | | | | | | |
| investments and foreign currency | | | 186,196,372 | | | | 157,160,908 | | | | (186,196,372 | ) | | | 157,160,908 | |
| Net realized and unrealized gain | | | 186,196,372 | | | | 149,291,001 | | | | (186,196,372 | ) | | | 149,291,001 | |
| | | | | | | | | | | | | | | | | |
| Dividends paid on Series A preferred equity facility | | | - | | | | (2,199,358 | ) | | | - | | | | (2,199,358 | ) |
| Net change in accumulated dividends on | | | | | | | | | | | | | | | | |
| Series A preferred equity facility | | | - | | | | 882,040 | | | | - | | | | 882,040 | |
| Net change in reserve for distributions to | | | | | | | | | | | | | | | | |
| Series Z preferred shareholders | | | (11,262 | ) | | | - | | | | - | | | | (11,262 | ) |
| | | | | | | | | | | | | | | | | |
| Net increase in net assets applicable to common | | | | | | | | | | | | | | | | |
| shareholders resulting from operations | | $ | 185,981,084 | | | $ | 186,196,372 | | | $ | (186,196,372 | ) | | $ | 185,981,084 | |
Tennenbaum Opportunities Fund V, LLC
(A Delaware Limited Liability Company)
Approval of Investment Management Agreements
(Unaudited)
On May 6, 2009, the Boards of Directors of the Company and the Partnership, including the “non-interested” Directors (the “Independent Directors”), voted to approve the respective Investment Management Agreement and Co-Management Agreement of the Company and the Partnership (each a “Management Agreement” and collectively, the “Management Agreements”) for an additional one-year term.
In considering whether to recommend re-approval of the Management Agreements, the Independent Directors reviewed materials provided by the Investment Manager, the Co-Manager, fund counsel and independent counsel. The Directors also met with senior personnel of the Investment Manager and discussed a number of topics affecting their determination, including the following.
(i) The nature, extent and quality of services provided by the Investment Manager and Co-Manager. The Independent Directors reviewed the services that the Investment Manager and Co-Manager provide to the Company and the Partnership. The Independent Directors noted the comprehensive range of such services and that the Investment Manager had developed reporting, valuation and other procedures that were customized to the specialized natures of the Company and the Partnership, and that the Investment Manager had expertise in administering such procedures. In addition, the Independent Directors considered the size, education, background and experience of the Investment Manager’s and Co-Manager’s staff. They also took into consideration the Investment Manager’s and Co-Manager’s quality of service and noted their longevity in the industry. Lastly, the Independent Directors reviewed the Investment Manager’s ability to attract and retain quality and experienced personnel. The Independent Directors concluded that the scope of services expected to be provided by the Investment Manager and Co-Manager to the Company and the Partnership and the experience and expertise of the personnel performing such services was consistent with the nature, extent and quality expected of an Investment Manager of investment vehicles such as the Company and the Partnership.
(ii) Investment performance of the Company, the Partnership and the Investment Manager. The Independent Directors reviewed the past investment performance of the Company and the Partnership and other funds for which the Investment Manager provides investment advisory services, both on an absolute basis and as compared to other funds that had invested in similar investments, as well as general market indices, and the Independent Directors noted that the Company and the Partnership had performed satisfactorily in light of the extremely adverse market conditions during 2008. The Independent Directors discussed the circumstances surrounding the performance of the Company and the Partnership as well as actions to be taken and prospects for improved performance in the future.
Tennenbaum Opportunities Fund V, LLC
(A Delaware Limited Liability Company)
Approval of Investment Management Agreements (Continued)
(Unaudited)
(iii) Cost of the services provided and profits realized by the Investment Manager from its relationship with the Company and the Partnership. The Independent Directors considered the cost of the services provided by the Investment Manager. As part of their analysis, the Independent Directors gave substantial consideration to the compensation payable to the Investment Manager, the terms of which are summarized in the footnotes to the financial statements included in this report. The Independent Directors also noted the types of expenses for which the Company and the Partnership on the one hand, or the Investment Manager and Co-Manager on the other, are responsible. In reviewing the management compensation, the Independent Directors considered the management fees and operating expense ratios of other registered and non-registered funds managed by the Investment Manager and by other managers that had somewhat comparable investment programs. The Independent Directors also noted that the compensation provisions had been subject to extensive discussion with several of the large institutional investors in the Company and the Partnership.
The Independent Directors also reviewed information regarding the profitability to the Investment Manager of its relationship with the Company and the Partnership and information on the financial condition of the Investment Manager. The Independent Directors noted that the Investment Manager and Co-Manager and their affiliates did not receive revenues from any other source, such as brokerage commissions or origination fees, in relation to the Company and the Partnership. The Independent Directors found that the profits realized by the Investment Manager from its relationship with the Company and the Partnership were reasonable and consistent with the Investment Manager’s fiduciary duties. The Independent Directors noted that the Co-Manager was unable to provide the Directors with the information requested on the profitability to the Co-Manager of its relationship with the Company and the Partnership. The Independent Directors also found that the Investment Manager and Co-Manager each had the financial resources necessary to continue to carry out their respective functions.
The Independent Directors concluded that the management and performance fees for the Investment Manager and Co-Manager were reasonable.
(iv) The extent to which economies of scale would be realized as the Company and the Partnership grow and whether fee levels would reflect such economies of scale. In light of the Company’s and the Partnership’s predetermined sizes and policies of distributing all realized income, the Independent Directors determined that the possibility of economies of scale was not relevant with respect to the current structures of the Company and the Partnership and accordingly did not consider whether fee levels would reflect any economies of scale.
In considering the Management Agreements, no single factor was determinative to the decision of the Directors. Rather, after weighing all of the reasons discussed above, the Independent Directors unanimously recommended re-approval of each of the Management Agreements.
Not applicable for filing of Semiannual Reports to Shareholders.
| ITEM 3. | AUDIT COMMITTEE FINANCIAL EXPERT. |
Not applicable for filing of Semiannual Reports to Shareholders.
| ITEM 4. | PRINCIPAL ACCOUNTANT FEES AND SERVICES. |
Not applicable for filing of Semiannual Reports to Shareholders.
| ITEM 5. | AUDIT COMMITTEE OF LISTED REGISTRANTS. |
Not applicable.
| ITEM 6. | SCHEDULE OF INVESTMENTS |
Included in Semiannual Shareholder Report in Item 1.
| ITEM 7. | DISCLOSURE OF PROXY VOTING POLICIES AND PROCEDURES FOR CLOSED-END MANAGEMENT INVESTMENT COMPANIES. |
Not applicable for filing of Semiannual Reports to Shareholders.
| ITEM 8. | PORTFOLIO MANAGERS OF CLOSED-END MANAGEMENT COMPANIES. |
Not applicable for filing of Semiannual Reports to Shareholders.
| ITEM 9. | PURCHASES OF EQUITY SECURITIES BY CLOSED-END MANAGEMENT INVESTMENT COMPANY AND AFFILIATED PURCHASERS. |
None.
| ITEM 10. | SUBMISSION OF MATTERS TO A VOTE OF SECURITY HOLDERS. |
None.
| ITEM 11. | CONTROLS AND PROCEDURES. |
(a) The Registrant’s Chief Executive Officer and Chief Financial Officer have evaluated the Registrant’s disclosure controls and procedures within 90 days of this filing and have concluded that the Registrant’s disclosure controls and procedures were effective, as of that date, in ensuring that information required to be disclosed by the Registrant in this Form N-CSR was recorded, processed, summarized, and reported in a timely manner.
(b) None.
(a) (1) Not applicable for filing of Semiannual Reports to Shareholders.
(a) (2) Certification pursuant to Rule 30a-2(a) under the Investment Company Act of 1940 (17 CFR 270.30a-2(a)) is filed and attached hereto as Exhibit 99.CERT.
(a) (3) Not applicable.
(b) Certification pursuant to Rule 30a-2(b) under the Investment Company Act of 1940 (17 CFR 270.30a-2(b)) is furnished and attached hereto as Exhibit 99.906CERT.
SIGNATURES
Pursuant to the requirements of the Securities Exchange Act of 1934 and the Investment Company Act of 1940, the Registrant has duly caused this report to be signed on its behalf by the undersigned, thereunto duly authorized.
Tennenbaum Opportunities Fund V, LLC
| By: | /s/ Hugh Steven Wilson |
Name: Hugh Steven Wilson
Title: Chief Executive Officer
Date: August 28, 2009
Pursuant to the requirements of the Securities Exchange Act of 1934 and the Investment Company Act of 1940, this report has been signed below by the following persons on behalf of the Registrant and in the capacities and on the dates indicated.
| By: | /s/ Hugh Steven Wilson |
Name: Hugh Steven Wilson
Title: Chief Executive Officer
Date: August 28, 2009
Name: Paul L. Davis
Title: Chief Financial Officer
Date: August 28, 2009